Presentation type:
AS – Atmospheric Sciences

EGU26-1680 | Orals | MAL33-AS | AS Division Outstanding ECS Award Lecture

Emissions in transition: Exploring air quality-climate links from cities to forests  

Eva Y. Pfannerstill

Thousands of volatile organic compounds are released into the atmosphere from both human activities and natural sources. These emissions fuel complex chemical reactions that influence air quality and climate. As societies transition to cleaner energy, as temperatures rise and ecosystems respond to climate stress, the composition and amount of these emissions are shifting. Understanding these changes is crucial to predict future air quality and climate, since emissions are the basic input of any atmospheric chemical transport model. However, measuring concentrations of volatile organic compounds is often not enough to understand emissions, as the rapid chemical transformations of these reactive compounds in the atmosphere make it hard to assess their source strength and source location.

Direct airborne emission observations are a powerful tool to address this. With such airborne flux observations, it is possible to map real-world emissions of volatile organic compounds at a landscape scale of few km².  This lecture will show how airborne flux observations helped us find that changes in urban emission composition were not reflected in current emission inventories and revealed links of anthropogenic emissions with temperature. It will also highlight our current research on how climate change-driven stress can change biogenic emissions and their impact on the atmosphere.

How to cite: Pfannerstill, E. Y.: Emissions in transition: Exploring air quality-climate links from cities to forests , EGU General Assembly 2026, Vienna, Austria, 3–8 May 2026, EGU26-1680, https://doi.org/10.5194/egusphere-egu26-1680, 2026.

EGU26-16771 | Orals | MAL33-AS | Vilhelm Bjerknes Medal Lecture

From Forest to Sky: Air Chemistry over the Amazon 

Jonathan Williams

A multitude of Volatile Organic Compounds (VOC) are present in the air we breathe. These airborne chemicals make up the familiar scents of flowers, fuels, and firesmoke. On a global scale, however, the single largest VOC source is the Amazon rainforest.

Each day, as the giant Amazonian ecosystem takes up carbon dioxide through photosynthesis, it also releases a fascinating cocktail of reactive chemicals into the air. These trace compounds play several roles within the forest, including protecting leaves from oxidative damage and mediating chemical communication between plants and insects. Above the canopy, they shape global atmospheric chemistry by influencing the atmospheric oxidation capacity, particle formation and the radiative budget, as well as regional clouds and precipitation.

Since 2012 we have been using sensitive mass spectrometers to characterize VOC from the 325m ATTO measurement tower in the pristine Brazilian rainforest. Initial work focused on isoprene (C5H8) and monoterpenes (C10H16), whose emissions vary between wet and dry seasons in response to light and temperature. Parallel measurements of total OH reactivity showed that many additional reactive compounds must be present, and the search for these species revealed new VOC sources and sinks, from soil, mosses and lichen.

In 2022-2023, the CAFÉ-BRAZIL airborne campaign extended these VOC measurements up to 14 km altitude across the entire Amazon basin. Even at these heights, the forest imprint is clear. Nocturnal deep convection transports substantial amounts of VOC to the upper troposphere, where they can accumulate overnight and prime the atmosphere for complex organic photochemistry at dawn. These natural chemical processes will be disrupted by continued deforestation.

 Climate models predict that the Amazon rainforest will suffer more, severe drought periods in future. Our recent measurements over the Amazon and within the BIOSPHERE 2 rainforest facility show that chiral VOCs can serve as sensitive indicators of how the forest responds to drought stress, including the extreme 2023/2024 El Niño event. Measurements of VOC in air hold the key to unlocking the complex chemical processes operating within and above the Amazon rainforest ecosystem.

How to cite: Williams, J.: From Forest to Sky: Air Chemistry over the Amazon, EGU General Assembly 2026, Vienna, Austria, 3–8 May 2026, EGU26-16771, https://doi.org/10.5194/egusphere-egu26-16771, 2026.

EGU26-557 | ECS | Posters virtual | VPS2

Temperature-driven shift intensifies 21st-century Amazon droughts 

Ronaldo Albuquerque, Djacinto M. dos Santos, Vitor F. V. V. Miranda, Leonardo F. Peres, Ricardo M. Trigo, Ana M. B. Nunes, Margarida L. R. Liberato, Célia M. Gouveia, and Renata Libonati

The Amazon Basin (AB) is experiencing an intensification of hydroclimatic extremes, with droughts becoming more frequent, widespread, longer, and severe in the 21st-century. While precipitation deficits have historically been the primary driver of these events, the role of rising air temperatures and the consequent increase of atmospheric evaporative demand (AED) remains poorly quantified. Understanding the relative contributions of these factors is crucial for assessing AB resilience and potential tipping points under ongoing global warming. Here, we analyzed drought evolution across the AB over 45 years (1980–2024) using the Standardized Precipitation-Evapotranspiration Index (SPEI) derived from ERA5-Land reanalysis data. To isolate the contribution of atmospheric evaporative demand (CAED) to drought severity, we compared the standard SPEI with a modified SPEI version based on constant climatological AED.

Furthermore, we applied a rarity index to systematically rank drought events by intensity and spatial extent, enabling a standardized comparison of the exceptional 2023/24 event with historical benchmarks. Our analysis reveals that the 2023/24 drought (AD-23/24) was the most extreme event on record, affecting over 88% of the basin’s area and having a magnitude four times that of the average of the previous top-5 droughts. Notably, the recurrence of high-ranking drought years since 2020 underscores a persistence of extreme conditions in the 2020s. Crucially, the CAED analysis uncovers a distinct temporal regime shift occurring after 2005. While earlier droughts were primarily precipitation-driven, the post-2005 era is characterized by a predominantly evapotranspiration-driven regime, in which climate change-induced warming significantly amplifies drought intensity through increased AED. This intensification is further linked to sea surface temperature anomalies in the Tropical Indian, Tropical Pacific, and North Atlantic oceans. These findings demonstrate that the AB has entered a new hydroclimatic phase in which temperature-driven AED is overtaking precipitation deficits as the primary driver of exceptional drought events. This shift suggests that warming is likely exacerbating drought severity, posing unprecedented challenges for ecosystem stability and water security in the region.

How to cite: Albuquerque, R., M. dos Santos, D., F. V. V. Miranda, V., F. Peres, L., M. Trigo, R., M. B. Nunes, A., L. R. Liberato, M., M. Gouveia, C., and Libonati, R.: Temperature-driven shift intensifies 21st-century Amazon droughts, EGU General Assembly 2026, Vienna, Austria, 3–8 May 2026, EGU26-557, https://doi.org/10.5194/egusphere-egu26-557, 2026.

EGU26-676 | ECS | Posters virtual | VPS2

Radar Polarimetry to Characterize Overshooting Convection in the Western Ghats of India 

Harikrishna Devisetty, Murali Krishna Uriya Veerendra, Bhishma Tyagi, Subrata Kumar Das, Kaustav Chakravarty, Chandramuni Survase, and Padma Kumari Burrala

This study provides the first high-resolution polarimetric radar observations of Overshooting Convective Storms (OCS) over the Western Ghats (WG), India using the newly installed SSPA-based X-band Radar at HACPL, Mahabaleshwar. Three post-monsoon OCS events (15, 23, and 24 October 2025) were analysed using PPI, RHI, CFAD products and ERA5 Atmospheric fields. All storms exhibited strong vertical growth, with echo-top heights of 17.6–19.8 km (15 Oct), 16.5 km (23 Oct), and 17.8 km (24 Oct), and peak reflectivity values of 59.6, 63.3, and 52.1 dBZ, respectively. Notably, significant reflectivity (>40 dBZ) persisted above 16 km, confirming deep overshooting intrusions. Polarimetric signatures showed clear mixed-phase and ice-growth processes, including KDP up to 3–4° km⁻¹, enhanced ZDR in the rainy regions, and reduced ρhv (0.92–0.96) within convective cores, indicating liquid water content, riming, and graupel/hail production. ERA5 diagnostics revealed favorable conditions for deep convection, with strong mid-tropospheric ascent (–0.6 to –0.8 Pa s⁻¹), high moisture, and pronounced convergence over the WG. These results demonstrate intense post-monsoon overshooting convection in complex terrain and highlight the capability of X-band Polarimetric radar to reveal the storm microphysics and vertical structure in an orographically challenging environment.

How to cite: Devisetty, H., Uriya Veerendra, M. K., Tyagi, B., Das, S. K., Chakravarty, K., Survase, C., and Burrala, P. K.: Radar Polarimetry to Characterize Overshooting Convection in the Western Ghats of India, EGU General Assembly 2026, Vienna, Austria, 3–8 May 2026, EGU26-676, https://doi.org/10.5194/egusphere-egu26-676, 2026.

This study is motivated by the observation of a unique intraseasonal power in the upper tropospheric equatorial meridional winds over the Western Hemisphere during boreal winter. The presence of intraseasonal power at both westward and eastward wavenumbers is unusual and intriguing, as the dominant tropical modes of intraseasonal variability typically exhibit little amplitude in equatorial meridional winds and are instead characterized by strong zonal wind perturbations. Furthermore, the intraseasonal disturbances are confined to the upper troposphere.  The spatial structure and dynamical characteristics of these disturbances are consistent with those of mixed Rossby-gravity waves (MRGWs), indicating the presence of intraseasonal MRGWs in the atmosphere. A systematic relationship between the location and amplitude of the intraseasonal MRGWs and the upper-tropospheric westerlies suggests that background circulation is fundamental to their existence. This hypothesis is investigated through a set of diagnostic analyses guided by the dispersion relation of a linear shallow water model incorporating a homogeneous background flow. The results not only explain the emergence of intraseasonal MRGWs but also the overall distribution of meridional wind power throughout the troposphere. The strength and direction of the background flow govern the observed spatial and temporal characteristics of MRGWs via Doppler shifting of intrinsic MRGWs. Consequently, the spectral power distribution of equatorial meridional wind perturbations across pressure levels represents a composite of MRGWs that have been Doppler-shifted by a range of background flow regimes.

How to cite: Mehak, M. and Ettammal, S.: Can Background Circulation Facilitate Intraseasonal Mixed Rossby-Gravity Waves over theCentral-Eastern Pacific?, EGU General Assembly 2026, Vienna, Austria, 3–8 May 2026, EGU26-691, https://doi.org/10.5194/egusphere-egu26-691, 2026.

EGU26-731 | ECS | Posters virtual | VPS2

Evolving Characteristics in Western Disturbances over the Hindu Kush Himalayas 

Spandita Mitra, Divya Sardana, and Ankit Agarwal

Western Disturbances (WD) are key atmospheric phenomena over northern India, Pakistan, and the Western Himalayas, especially during winter months (December to February). In recent years, increasing variability in these systems has been observed across all seasons, notably pre-monsoonal months (March to May), although thorough investigation remains underexplored. The study evaluates the shifting behaviour and structure in WDs across two climatologically distinct periods – 1950 to 1976 and 1977 to 2022, corresponding to the well-documented 1976-1977 climate shift. In this study, vorticity-based WD track data, coupled with the ERA5 reanalysis dataset, have been utilised to analyse the shift. Behavioural changes are quantified through frequency trends, maximum vorticity distribution and mean track, while structural evolution is examined through composite vertical profiles of key atmospheric variables.  The study unravels notable increase in WD frequency during the pre-monsoon season in recent decades, accompanied by a westward shift in WD origins and longer track durations, thereby enhancing the potential for moisture transport. Furthermore, substantial strengthening of upper-level zonal winds, intensified mid-tropospheric convection, and atmospheric moisture availability have been observed through structural analysis. Such transformations indicate a transition of WD towards hybrid systems with enhanced convective features, thereby elevating the potential for extreme precipitation events during the pre-monsoon period. This improved understanding of the evolving WD dynamics is critical for hydrological planning, climate action, strategies and disaster preparedness in the highly vulnerable Himalayan and adjoining regions.

How to cite: Mitra, S., Sardana, D., and Agarwal, A.: Evolving Characteristics in Western Disturbances over the Hindu Kush Himalayas, EGU General Assembly 2026, Vienna, Austria, 3–8 May 2026, EGU26-731, https://doi.org/10.5194/egusphere-egu26-731, 2026.

EGU26-1290 | ECS | Posters virtual | VPS2

Variation of atmospheric properties during a dust episode over central Himalayan region using Lidar observation and auxiliary data 

Shishir Kumar Singh, Narendra Singh, Vikas Rawat, Mayank Chauhan, and Subhajit Debnath

This work investigates a prominent dust event that occurred over Nainital, Uttarakhand, during 14-18 May 2025. Continuous micro pulse lidar (MPL) observations provided evidence of significant aerosol enhancement during the event. Distinct elevated aerosol layers were observed between 1 and 2.5 km above ground level, where backscatter coefficients increased to approximately 5×10⁻³ km⁻¹ sr⁻¹ and extinction values ranged between 0.8 and 1.2 km⁻¹. The persistence of these layers indicated long-range transport rather than local sources. Satellite-based aerosol optical depth (AOD) data from MODIS confirmed these enhancements, showing values doubling from 1.1-1.5 to above 2.2 during the peak dust intrusion. Meteorological observations documented elevated daytime temperatures between 20.1 ± 1.3 and 26.8 ± 1.6 °C and a marked reduction of relative humidity to below 50%, suppressing aerosol scavenging. Wind speeds intensified, with nocturnal maxima up to 5.6 ± 1.1 m/s and predominantly westerly to northwest directions (230°- 265°), favoring dust transport from western source regions. Synoptic-scale 850 mb wind analyses further corroborated persistent strong westerlies guiding mineral aerosols from the Thar Desert and Indo-Gangetic plains into the Himalayan foothills. The results highlight the importance of integrating lidar measurements with meteorological and reanalysis datasets to capture both vertical and horizontal characteristics of dust intrusions in mountainous regions. 

How to cite: Singh, S. K., Singh, N., Rawat, V., Chauhan, M., and Debnath, S.: Variation of atmospheric properties during a dust episode over central Himalayan region using Lidar observation and auxiliary data, EGU General Assembly 2026, Vienna, Austria, 3–8 May 2026, EGU26-1290, https://doi.org/10.5194/egusphere-egu26-1290, 2026.

EGU26-1839 | ECS | Posters virtual | VPS2

Observed Lifecycle of Convective Precipitation over Tibetan Plateau Based on the FY-4A Geostationary Satellite 

Chun Guo, Jianhua Yin, Zengxin Pan, Lin Zang, and Feiyue Mao

With the intensification of global warming, deep convective system(DCS) precipitation over the Tibetan Plateau(TP) has become increasingly frequent, which plays a vital role in regulating the regional hydrological cycle. Previous studies have focused on instantaneous convective activity, little elaborating on the evolutionary processes and rainfall of DCSs throughout their whole lifecycle. Here, based on the continuous observations from the FY-4A geostationary satellite, this study investigates the characteristics and evolution of DCSs over TP from 2022 to 2023 through our previous full-lifecycle tracking algorithm from initiation to dissipation. Furthermore, the effects of key meteorological factors on DCSs evolution are revealed.

Results indicate that DCSs are mostly short-lived (3–6 h lifecycle), and more than 85% of convective precipitation occurs during summer from June to August. DCSs concentrate in the central-eastern TP, with an occurrence probability exceeding 12% in summer. Additionally, the area and rainfall rate of DCSs typically reach their peaks at the middle stage of the lifecycle. After the dissipation of the convective core, the persistence time of cirrus can reach 5%–28% of the core’s lifecycle. Controlled variable analysis reveals that convective available potential energy (CAPE) and precipitable water (PW) synergistically regulate the development of convective systems: under conditions of high CAPE (500-103 J kg-1) and high PW (>50 mm), the area of cores expands to the largest extend. However, the maximum lifecycle and peak precipitation of DCSs occur under conditions of moderate wind shear (5-10 m s-1).

This study explores the full-lifecycle evolutionary patterns of DCS over the TP and the regulatory effects of meteorological conditions over TP, laying a theoretical foundation for future research on regional precipitation and climate change in the region.

How to cite: Guo, C., Yin, J., Pan, Z., Zang, L., and Mao, F.: Observed Lifecycle of Convective Precipitation over Tibetan Plateau Based on the FY-4A Geostationary Satellite, EGU General Assembly 2026, Vienna, Austria, 3–8 May 2026, EGU26-1839, https://doi.org/10.5194/egusphere-egu26-1839, 2026.

Although compound drought and heatwave extremes have recently drawn much attention globally, there exist three interesting issues (i.e., event detection, temperature diversity, and interpretable reconstruction) to explore as follows: --First, as drought events can spread over space and evolve over time, how can we perform event detection as accurately as possible? Are there differences in coastal/inland regions?  --Second, whether droughts are always concurrent with heatwaves remains unknown. Moreover, how temperature abnormalities evolve spatiotemporally during drought development and how their associated categories are distributed globally are not fully understood. --Third, it is common sense that droughts and associated near-surface temperature anomalies can be attributed to amplified vertical subsidence and anomalous anticyclonic circulations from dynamic perspectives. However, one open and interesting issues remain unknown: That is, whether hydrometeorological situations under droughts can be reproduced directly utilizing variability of atmospheric dynamics and what specific roles atmospheric dynamics play in drought reconstruction.
 
To explore the three issues mentioned above, our recent achievements are as follows:
-- First, regarding accurate event detection and type division, we identified global-scale seasonal-scale meteorological drought events following the recently proposed 3D DBSCAN-based workflow of event detection. The 3D DBSCAN (Density-Based Spatial Clustering of Applications with Noise) clustering algorithm can directly obtain arbitrarily shaped point collections over a given 3D space. Subsequently, these detected drought events are further grouped into inland and coastal types, as the observations revealed that some droughts over coastal regions originate from, extend to, or are accompanied by long-term precipitation deficits over adjacent oceans. [see algorithm cases (https://doi.org/10.1016/j.aosl.2022.100324), Glo3DHydroClimEventSet(v1.0) products (https://doi.org/10.1002/joc.8289) , and global drought detection (https://spj.science.org/doi/10.34133/olar.0016 ) ]
--Second, regarding diversity of temperature extremes compounded with droughts, we investigated this fundamental issue from the perspectives of temperature abnormality–based drought classification and statistical characteristics of process evolution. The major procedures and achievements were as follows. First, the detected global-scale 3D DBSCAN-based drought events of our study were employed and assigned to Hot, Cold, Normal, and Hybrid categories utilizing a self-designed temperature abnormality–based classification algorithm; the associated global-scale occurrences of these four event categories were approximately 40%, 10%, 30%, and 20%, respectively, and in turn, they displayed statistically significant (p value < 0.05) increasing, decreasing, decreasing, and increasing trends, respectively, during 1980–2020.   [see diversity of temperature anomalies (https://spj.science.org/doi/10.34133/olar.0017 ) ]
--Third, regarding dynamically-based reconstruction of compound droughts and heatwaves, we employs three kinds of dynamic features (i.e., vertical velocity, relative vorticity, and horizontal divergence) for hydrometeorological reconstruction (e.g., precipitation and near-surface air temperature) under drought situations through a so-called XGBoost (extreme gradient boosting) ensemble learning method. The study adopts the reconstruction scheme on the interannual variability and finds dynamically based reconstruction feasible, seemingly regardless of seasonality and drought-inducing mechanisms. More importantly, from interpretable perspectives, global-scale analysis of dynamic contributions helps discover unexpected dynamic drought-inducing roles and associated latitudinal modulation. That is, low-level cyclonic/anticyclonic anomalies contribute to drought development in the northern middle and high latitudes, while upper-level vertical subsidence contributes significantly to tropical near-surface temperature anomalies concurrent with droughts. [see paper (https://doi.org/10.1175/JHM-D-22-0006.1)]

How to cite: Liu, Z.:  Global-scale compound Droughts and heatwaves: inland/coastal type grouping, diversity of temperature extremes, and dynamically-based Interpretable reconstruction, EGU General Assembly 2026, Vienna, Austria, 3–8 May 2026, EGU26-2053, https://doi.org/10.5194/egusphere-egu26-2053, 2026.

Carbon dioxide removal (CDR) is critical to net-zero pathways achieving the Paris Agreement 1.5°C target, yet its effectiveness in reducing humid heat stress risks remain uncertain. Here we examine the hysteresis and reversibility of humid heat stress in China under CDR scenarios. Humid heat responds asymmetrically during warming and CO2 removal especially in eastern and southern China, producing a hysteretic and partially reversible trajectory. This results from unequal adjustments of temperature and relative humidity, which constrain heat-stress recovery even as global temperatures decline. Moist static energy analysis indicates suppressed vertical energy export over eastern China and enhanced transport of warm moisture from tropical oceans, sustaining humid heat during CO2 removal. Consequently, severe humid heat stress persists, with over 6.4 billion people affected, more than 66% of which is due to hysteresis. These findings highlight enduring heat-related risks and the urgent need for adaptation alongside mitigation.

How to cite: Ma, Q.: Committed and Irreversible Humid Heat Stress Risk in China Despite Carbon Dioxide Removal, EGU General Assembly 2026, Vienna, Austria, 3–8 May 2026, EGU26-2384, https://doi.org/10.5194/egusphere-egu26-2384, 2026.

EGU26-4071 | Posters virtual | VPS2

African Easterly Waves as Drivers of Saharan Dust Transport and PM2.5 Extremes in the Intra-Americas Region 

Alejandro Jaramillo-Moreno and Carla Sabrina Vázquez-Jiménez

African Easterly Waves (AEWs) are a dominant synoptic-scale feature of the tropical atmosphere, widely recognized for their role as precursors of tropical cyclones and for modulating summertime rainfall over the Atlantic basin and adjacent regions. However, their potential influence on the transport of Saharan dust across the Atlantic and its impacts on air quality has received comparatively less attention. In this study, we investigate the role of AEWs in modulating Saharan dust transport and its relationship with high PM2.5 concentration episodes over the Yucatán Peninsula. Using reanalysis data, we document a pronounced seasonal cycle in dust transport, with maximum concentrations during boreal summer (June–August), coinciding with the peak activity of AEWs. Spectral analysis reveals a significant contribution at periods of 4–9 days, consistent with the characteristic timescales of AEWs. To quantify their impact on air quality, intense dust events associated with AEWs were identified based on anomalies exceeding one standard deviation and compared with episodes of poor air quality driven by particulate matter. Our results indicate that AEWs account for approximately 26–31% of PM2.5 pollution episodes linked to dust over the Yucatán Peninsula, with event durations ranging from 1 to 8 days. These findings highlight the important role of AEWs in shaping the synoptic-scale variability of aerosol transport and surface air quality in the Yucatán Peninsula and southern Mexico, underscoring their relevance beyond tropical cyclogenesis and precipitation, particularly during the boreal summer.

How to cite: Jaramillo-Moreno, A. and Vázquez-Jiménez, C. S.: African Easterly Waves as Drivers of Saharan Dust Transport and PM2.5 Extremes in the Intra-Americas Region, EGU General Assembly 2026, Vienna, Austria, 3–8 May 2026, EGU26-4071, https://doi.org/10.5194/egusphere-egu26-4071, 2026.

EGU26-4128 | ECS | Posters virtual | VPS2

Intraseasonal Modulation of the Chocó Low-Level Jet by the Madden–Julian Oscillation 

Julian Toro-Arenas, Alejandro Jaramillo-Moreno, Luis Fernando Carvajal-Serna, and Óscar José Mesa-Sanchez

The Madden–Julian Oscillation (MJO) is the dominant mode of intraseasonal variability (30–90 days) in the tropical atmosphere, characterized by eastward-propagating convective and circulation anomalies that strongly modulate tropical and regional climate. Through its large-scale dynamical perturbations, the MJO influences moisture transport, low-level circulation, and precipitation over regions far removed from its primary convective center. However, its role in regulating low-level moisture fluxes over northwestern South America has received comparatively limited attention. In this study, we investigate the influence of the MJO on moisture transport toward Colombia, with particular emphasis on its modulation of the Chocó Low-Level Jet. Using MERRA-2 reanalysis, we characterize intraseasonal variability in low-level moisture advection and wind fields associated with different MJO phases defined by the Real-time Multivariate MJO (RMM) index. The analysis examines changes in low-level moisture transport, wind intensity, and large-scale convergence associated with the zonal displacement of the MJO convective envelope. Results show that the strength of the Chocó Jet depends strongly on the longitudinal position of the MJO convective center. Certain MJO phases enhance moisture transport from the eastern Pacific toward Colombia, favoring orographic ascent along the Andes and organized convection over the Colombian Pacific region, while other phases are associated with weaker moisture fluxes and reduced convergence. These findings highlight the role of the MJO in regulating intraseasonal moisture transport and low-level circulation over northwestern South America.

How to cite: Toro-Arenas, J., Jaramillo-Moreno, A., Carvajal-Serna, L. F., and Mesa-Sanchez, Ó. J.: Intraseasonal Modulation of the Chocó Low-Level Jet by the Madden–Julian Oscillation, EGU General Assembly 2026, Vienna, Austria, 3–8 May 2026, EGU26-4128, https://doi.org/10.5194/egusphere-egu26-4128, 2026.

EGU26-4971 | ECS | Posters virtual | VPS2

Synoptic-Scale Mechanisms And Climate Oscillation Influences On The Monsoon Breaks Of The Indian Summer Monsoon System 

Jadeera Aboobaker and Dr. Sarmistha Singh

The Indian Summer Monsoon Rainfall (ISMR), occurring from the month of June to September, is characterized by intraseasonal variability in the form of active and break spells. Monsoon breaks are periods of sparse to no rainfall, marked by positive outgoing longwave radiation anomalies, above-normal pressures, and clear-sky conditions. These monsoon breaks can have socioeconomic impacts due to their effect on crop growth stages, irrigation planning, and water management. This study aims to investigate the synoptic-scale systems responsible for the onset and sustenance of monsoon breaks over the Western Ghats and other parts of India to improve future predictability of the same. Rainfall data from 1901 to 2025 is used to identify break spells and classify them into short, moderate, and long-duration events. Subsequently, decadal rainfall composites are constructed. These composites reveal patterns of rainfall suppression and enhancement over the Indian subcontinent, equatorial Indian Ocean and West Pacific. Although the spatial structure of rainfall anomalies remains consistent, slight decadal variabilities are observed. Composite analyses of outgoing longwave radiation, and upper and lower tropospheric winds are used to diagnose the synoptic features associated with monsoon breaks. Case studies of recent drought years, 2002 and 2015, highlight the role of upper tropospheric anticyclones, northward displacement of the monsoon trough, and dry air intrusion from West Asia in sustaining and prolonging the breaks, confirming previous studies. The influence of large scale climate oscillations such as ENSO, EQUINOO, and the Boreal Summer Intraseasonal Oscillation (BSISO) on monsoon break frequency and duration is investigated using statistical and machine learning tools, with the aim of informing the development of improved predictive frameworks for monsoon breaks.

How to cite: Aboobaker, J. and Singh, Dr. S.: Synoptic-Scale Mechanisms And Climate Oscillation Influences On The Monsoon Breaks Of The Indian Summer Monsoon System, EGU General Assembly 2026, Vienna, Austria, 3–8 May 2026, EGU26-4971, https://doi.org/10.5194/egusphere-egu26-4971, 2026.

EGU26-6493 | Posters virtual | VPS2

A framework for modeling aerosol-cloud-lightning interactions: Validation of charge structure and aerosol effects 

Weishan Wang, Guoxing Chen, and Yijun Zhang

This study develops a novel framework within the Weather Research and Forecast Model for modeling aerosol-cloud-lightning interactions. The framework explicitly represents aerosol-cloud interactions by prescribing aerosols with two configurations: an idealized setup, where both cloud condensation nuclei (CCN) and ice nucleating particles (IN) are assumed to have a single chemical composition and spatially uniform distributions; and a quasi-realistic configuration, with multi-species aerosols assigned spatially varying distributions, where hygroscopic components act as CCN, dust particles act as IN, and all aerosol species influence radiative transfer. Cloud microphysics is coupled with detailed charge separation and discharge processes to enable the lightning simulation. The framework is evaluated using two thunderstorms in Guangdong, China. For an isolated storm, the model successfully reproduces the observed tripolar charge structure (positive–negative–positive), demonstrating its capability in simulating cloud electrification. For a frontal storm, it captures well the observed precipitation and lightning, and shows that increasing CCN suppresses the rainfall while enhancing the lightning. Higher CCN concentrations produce more numerous but smaller cloud droplets, which suppresses the coalescence into rain droplets, allows a greater number of droplets to loft into the upper troposphere, and forms more but smaller cloud ice particles. This boosts graupel–ice collisions, intensifies non-inductive charging, strengthens the upper positive charge and the vertical electric-field gradient, ultimately increasing the lightning frequency. In contrast, no significant aerosol-induced invigoration of updrafts is observed. These results highlight the dominant role of aerosol microphysical effects over dynamical invigoration in modulating thunderstorm electrification and lightning activity.

How to cite: Wang, W., Chen, G., and Zhang, Y.: A framework for modeling aerosol-cloud-lightning interactions: Validation of charge structure and aerosol effects, EGU General Assembly 2026, Vienna, Austria, 3–8 May 2026, EGU26-6493, https://doi.org/10.5194/egusphere-egu26-6493, 2026.

EGU26-8881 | ECS | Posters virtual | VPS2

Effect of decadal land use change on WRF model-simulated surface meteorological parameters over the Indian region 

Ipsita Putatunda, Rakesh Vasudevan, and Randhir Singh

Variations in land surface characteristics directly alter surface biophysical properties like albedo, roughness length, and canopy resistance, leading to changes in surface radiative and turbulent fluxes. These changes influence sensible and latent heat fluxes, which can further regulate surface temperature, evapotranspiration, and near-surface moisture transport. Thus, variations in surface fluxes associated with changes in land-surface properties can regulate convective instability, moisture convergence, and can modulate short-range rainfall characteristics and their predictability. Such land–atmosphere feedbacks are particularly important over the Indian region, where strong seasonal contrasts and heterogeneous land surfaces play a critical role in shaping rainfall variability. Hence, this study investigates the sensitivity of short-range precipitation forecasts over India to decadal changes in land use and vegetation during the pre-monsoon and monsoon periods. USGS 24-category land use data based on the 1994 landscape is used as the control run. Seven different simulation experiments are conducted using WRF model with various land use and vegetation data from MODIS and ISRO; ie: Experiment1 (MODIS 2001, USGS LAI and VF default), Experiment 2 (MODIS 2001, LAI and VF default), Experiment 3 (MODIS 2019, LAI and VF default), Experiment 4 (MODIS 2001, with Urban Class of 2019, LAI, and VF default), Experiment 5 (MODIS 2001, with water bodies of 2019, LAI, and VF default), Experiment 6 (MODIS 2019, LAI and VF of 2019), Experiment 7 (ISRO 2018-2019, VF and LAI default). A comprehensive assessment based on quantitative error metrics and categorical forecast skill scores demonstrates statistically significant improvements in rainfall forecast performance following the assimilation of updated land-use and vegetation datasets.  These statistically robust improvements indicate that realistic representation of land-surface conditions contributes meaningfully to enhanced short-range precipitation predictability. The computed Extreme Dependency Index (EDI) values indicate an enhanced ability of the model to capture rare extreme rainfall events following the incorporation of updated land-use information. The incorporation of realistic land-use classifications derived from MODIS and ISRO datasets led to improved simulations of surface meteorological variables, including temperature, wind speed, relative humidity, surface pressure, and surface fluxes. Corresponding improvements were also observed in the vertical atmospheric profiles for wind, temperature, and specific humidity profiles. These enhancements indicate a more realistic depiction of land–atmosphere interactions and boundary-layer processes in the model.

How to cite: Putatunda, I., Vasudevan, R., and Singh, R.: Effect of decadal land use change on WRF model-simulated surface meteorological parameters over the Indian region, EGU General Assembly 2026, Vienna, Austria, 3–8 May 2026, EGU26-8881, https://doi.org/10.5194/egusphere-egu26-8881, 2026.

EGU26-9211 | ECS | Posters virtual | VPS2

Kilometer Scale Climate Modeling of Extremes: Evaluation of the NonHydrostatic Regional Climate Model (NHRCM) over Pakistan 

Muhammad Mamoor, Akif Rahim, Muhammad Yaseen, Raheela Naz, Tasneem Kosar, Nadeem Tariq, and Amina Akif

Rising global warming is accelerating climate extremes at regional scales worldwide. Capturing these extremes at the regional level requires high resolution climate modeling capable of representing complex topography and strong land atmosphere interactions. In this study, a high-resolution Non-Hydrostatic Regional Climate Model (NHRCM) is configured at a kilometer scale resolution (5 km) through dynamic downscaling of the MRI AGCM 3.2 outputs developed by the Meteorological Research Institute of Japan (MRI). Daily precipitation and temperature (maximum and minimum) data are generated at 5 km resolution for the historical period (1980–2000) and the future period (2081–2100) under the high emission climate scenario SSP585. The performance of the downscaled climate variables is evaluated against ERA5 Land data after resampling to the same resolution as the NHRCM. Statistical metrics and extreme climate indices are used to quantify model skill and biases at regional and sub regional scales over Pakistan. The results reveal a strong correlation in high elevation regions of Pakistan compared to the plains. After evaluating model performance, precipitation and temperature extreme indices are calculated for both historical and future periods. The findings indicate an increase in precipitation in the southern regions of Pakistan, accompanied by rising temperatures. These trends are also associated with an increase in short-duration intense rainfall events during summer and prolonged dry conditions in winter. Furthermore, the frequency of heatwaves is expected to rise by the end of the century across Pakistan, along with increasing temperatures in snow fed regions. Overall, this study highlights the added value of high-resolution nonhydrostatic regional climate modeling in understanding and assessing climate extremes over Pakistan, providing a robust foundation for future climate impact assessments and adaptation planning.


How to cite: Mamoor, M., Rahim, A., Yaseen, M., Naz, R., Kosar, T., Tariq, N., and Akif, A.: Kilometer Scale Climate Modeling of Extremes: Evaluation of the NonHydrostatic Regional Climate Model (NHRCM) over Pakistan, EGU General Assembly 2026, Vienna, Austria, 3–8 May 2026, EGU26-9211, https://doi.org/10.5194/egusphere-egu26-9211, 2026.

EGU26-14298 | Posters virtual | VPS2

Characterizing cold pools in the ITCZ using soundings from the ORCESTRA campaign 

Raphaela Vogel, Lennart Mann, Nina Robbins-Blanch, and Nicolas Rochetin

In this study we analyze the occurrence of cold pools in the tropical Atlantic during the ORCESTRA field campaign (August to September 2024), using data collected from over 2000 soundings. We first tested whether the method to detect cold pools based on the mixed-layer height, developed for shallow convective cold pools in the winter trades during EUREC4A, is applicable to the deep convective regime of the ITCZ. The validation by a surface-based detection method and the investigated recovery behaviour of the mixed layer after a cold pool demonstrates its applicability to this environment. On this basis, we examine the distribution and properties of cold pools within the tropical Atlantic. A total of 26% of all ORCESTRA soundings detected cold pools, compared to only 7% during the EUREC4A campaign in the winter trades. The ITCZ region with the highest moisture content and presumably deepest convection features the largest number of cold pools. This presentation will further discuss how the cold pool strength and frequency correlate with wind, moisture and stability.

How to cite: Vogel, R., Mann, L., Robbins-Blanch, N., and Rochetin, N.: Characterizing cold pools in the ITCZ using soundings from the ORCESTRA campaign, EGU General Assembly 2026, Vienna, Austria, 3–8 May 2026, EGU26-14298, https://doi.org/10.5194/egusphere-egu26-14298, 2026.

EGU26-15029 | Posters virtual | VPS2

All-Sky Camera Upward-looking Thermal Infrared Cloud Characteristics 

Matthew Miller and Sandra Yuter

Satellite data sets are the primary source of observations of cloud characteristics, but downward-looking passive sensors cannot see lower-level clouds obscured by higher clouds nor cloud bases. Observations of low clouds with downward-looking satellite IR are hampered by the small brightness temperature differences between the low cloud top and the underlying surface. In contrast, upward-looking thermal IR can readily distinguish warm clouds against the cold sky. By sampling thermal IR cloud characteristics across the diurnal cycle, upward looking thermal IR observations have the potential to yield improved understanding of transitions in cloudiness at sunrise and sunset and differences in the relative importance of different cloud processes with and without SW fluxes.

Our thermal IR all-sky camera was assembled from commercially available, off-the-shelf parts. The key components are a FLIR Boson thermal IR camera and a FLIR PTU-5 pan-tilt mount. The IR camera has a 50° field of view and a resolution of 640x500 pixels. To obtain imagery of the entire sky, the pan-tilt mount points the camera at 14 different directions, each varying in azimuth and elevation. The volume coverage pattern is executed once per minute, and the entire sky is sampled in less than 30 seconds. The images are then stitched together in software to yield a hemispherical array of IR brightnesses from horizon to horizon.

From the imagery we can infer cloud fraction, cloud coverage characteristics relating to the size and shapes of cloud elements, and estimate the altitude of cloud bases at all times of day. Sequences of images reveal the evolution of individual cloud elements and provide information on the phase space of cloud properties across the diurnal cycle and to related to air mass changes, such as the passage of fronts. Combined with other data from lidar and visible all sky cameras, the upward-looking thermal IR data on cloud outer surface temperature details at small spatial scale (10s of meters) and few minute time scale have high potential to yield new insights on cloud initiation and dissipation.

We will detail the performance of the thermal IR all-sky camera and analyze derived cloud characteristics in the context of data from visible wavelength all-sky imagery and additional atmospheric observations.

How to cite: Miller, M. and Yuter, S.: All-Sky Camera Upward-looking Thermal Infrared Cloud Characteristics, EGU General Assembly 2026, Vienna, Austria, 3–8 May 2026, EGU26-15029, https://doi.org/10.5194/egusphere-egu26-15029, 2026.

EGU26-15265 | ECS | Posters virtual | VPS2

Is ERA5 Fit for Purpose? A Global Multi-Variable Evaluation of Reanalysis Strengths and Weaknesses 

Warren Lewis, Sandra Yuter, and Matthew Miller

Reanalysis products, which blend weather model output with observations are commonly used as substitutes for observations to assess numerical weather prediction model forecast skill, the accuracy of climate model historical realizations, and AI training. However, the quality of reanalysis output is not uniform across all variables, times of day, seasons, or geographic settings. This study evaluates the strengths and weaknesses of ERA5 reanalysis (0.25° grid) over a multi-year period by comparing them to worldwide hourly surface observations from over 1200 stations, buoys, and radiosonde vertical profiles.

Our analysis focuses on several metrics across the diurnal cycle (7 AM and 3 PM local time) and during temperature outlier events (< 10th percentile and > 90th percentiles for the 30-year climatology). Results indicate that ERA5 provides reliable 2-meter air temperatures in most regions, but shows a frequent dry bias in dewpoint of greater than 3 ℃ more than 5% of the time for many stations in the Dry and Mediterranean climate zones. ERA5 often underestimates warm events (> 90th percentile), with the largest cold biases, less than -3 ℃ occurring more than 11% of the time in the Mediterranean climate zone. Temperature and dewpoint biases are amplified in complex terrain, and dewpoint biases tend to be larger near coastal locations. To investigate whether higher spatial resolution mitigates these issues, we also examine the performance of the ERA5-Land product  (0.1° grid). These findings emphasize the importance of evaluating the adequacy of purpose when using reanalysis for specific applications, since performance can vary significantly by variable, time of day, season, and climate zone.

How to cite: Lewis, W., Yuter, S., and Miller, M.: Is ERA5 Fit for Purpose? A Global Multi-Variable Evaluation of Reanalysis Strengths and Weaknesses, EGU General Assembly 2026, Vienna, Austria, 3–8 May 2026, EGU26-15265, https://doi.org/10.5194/egusphere-egu26-15265, 2026.

EGU26-16394 | ECS | Posters virtual | VPS2

S2S Forecast Skill Assessment for Summer Monsoon Drought Warning 

Sreepriya Sukumaran and Ankit Agarwal

Persistent extreme weather anomalies lasting several weeks to months can lead to drought and compound dry–hot extremes, posing serious socio-economic risks in the Indian monsoon region. Although subseasonal-to-seasonal (S2S) prediction systems have advanced, the extent to which these models represent drought-relevant hydroclimatic variability over India has not been adequately quantified. Here, we focus on evaluating the hindcast quality of weekly accumulated precipitation and temperature from multiple S2S models with lead times up to six weeks during the JJAS season over India. These model hindcast outputs and IMD observations are regridded to a common 0.5° resolution and analyzed using deterministic forecast skill metrics at various lead times, statistical bias correction is then applied to isolate systematic model errors, followed by SPI-based drought diagnostics, and compound dry–hot extreme indices are derived and computed. The analysis reveals modest forecast skill at early lead times, followed by a systematic decline as lead time increases, with precipitation predictability deteriorating more rapidly than temperature predictability. Although the models generally capture the large-scale spatial distribution of drought-prone regions, they significantly underestimate the frequency and spatial extent of compound dry–hot conditions, exhibiting pronounced regional dependence across India. These results highlight key limitations and identify opportunities to enhance subseasonal drought early-warning systems. 

Keywords: Subseasonal-to-seasonal predictability, Indian Summer Monsoon, Drought, Climate extremes, Hindcast evaluation

How to cite: Sukumaran, S. and Agarwal, A.: S2S Forecast Skill Assessment for Summer Monsoon Drought Warning, EGU General Assembly 2026, Vienna, Austria, 3–8 May 2026, EGU26-16394, https://doi.org/10.5194/egusphere-egu26-16394, 2026.

EGU26-18616 | ECS | Posters virtual | VPS2

Investigation of phthalate emissions from incense stick, scented candle and perfume through a chamber experiment  

Fnu Anshika and Bernhard Rappenglueck

Phthalate exposure has been rampant with the growing use of these compounds in personal care  and other plastic products. Phthalates have been associated with endocrine, neurological, and reproductive disorders resulting from their continuous release from plastic surfaces throughout their lifecycle. These endocrine disruptors are used in personal care products to increase their shelf life. This paper aims to identify phthalates and their concentration in three test materials, perfume, scented candles, and incense sticks, through a chamber experiment. This experiment aids in understanding phthalate emissions into air during the use of these materials in indoor environments. Sampling was performed using Tenax TA tubes, which were placed inside the glass chambers for 30 minutes while maintaining a positive flow rate using a mass flow controller and pump. The tubes capture gas-phase phthalates efficiently. The tubes were then further analyzed using TD-30 and GC/MS. Three phthalates, which were detected in the test materials, were dimethyl phthalate (DEP), dibutyl phthalate  (DBP), and butyl benzyl phthalate (BBP). The phthalate concentration was found to be high in incense sticks, with DEP being the most prominent phthalate, followed by DBP. Scented candles had the high concentration of DBP, followed by BBP. A similar pattern was observed in perfumes. The high concentrations of these compounds detected in the test materials underscore growing concerns about the widespread use of phthalates in  manufacturing of plastic products.

How to cite: Anshika, F. and Rappenglueck, B.: Investigation of phthalate emissions from incense stick, scented candle and perfume through a chamber experiment , EGU General Assembly 2026, Vienna, Austria, 3–8 May 2026, EGU26-18616, https://doi.org/10.5194/egusphere-egu26-18616, 2026.

EGU26-18929 | ECS | Posters virtual | VPS2

Black crust as a passive sampler of urban pollution on the heritage buildings in Delhi, India: An analytical and modelling approach 

Gaurav Kumar, Bhola Ram Gurjar, Mukesh Sharma, and Chandra Shekhar Prasad Ojha

Delhi is one of the most polluted megacities in the world. Since the ancient era, Delhi has been known for its rich heritage sites like the Red Fort, Humayun’s Tomb, and Qutub Minar, which are UNESCO World Heritage Sites. In this study, we investigate urban pollution-linked alterations at the heritage buildings (HBs) of Delhi, India, through a comparative characterization of deposited black crust (BC) and the underlying red sandstone (RS) collected from the exposed surfaces of the HBs. The BC on HBs can act as an integrative passive sampler of urban pollution, recording particulate matter, reactive gases (SOx/NOx), and associated heavy metal deposition. To achieve this objective, we applied a multi-analytical workflow combining X-ray diffraction (XRD), X-ray fluorescence (XRF), scanning electron microscopy with energy-dispersive X-ray spectroscopy (SEM–EDX), Fourier transform infrared spectroscopy (FTIR), carbonaceous analysis, and inductively coupled plasma mass spectrometry (ICP-MS) resolved phase assemblages, morphology, major-elemental composition profiles, and signatures of trace elements. The outcome suggests that the urban pollution sources, including vehicular emissions, road/construction/soil dust, industrial activity, and biomass burning, were identified as fingerprints of calcium (Ca) and sulfur (S) in the formed BC at the RS substrate. In this scenario, BC was enriched with Ca and S, which may cause sulfation phenomena to occur at the RS substrate as it contains low intrinsic Ca. Therefore, gypsum was identified as a dominant deteriorating agent, along with weddellite, bassanite, while carbon and heavy metals were also embedded in BC relative to the RS substrate. Additionally, in this work, a modeling approach is also utilized to assess the pollution dispersion impacts on the built HBs and linkage with BC deposition, which was employed using coupled WRF (Weather Research and Forecasting) and AERMOD (the American Meteorological Society/Environmental Protection Agency Regulatory Model) technique. Hence, considering these analytical and modelling approaches contributes to applying the site-specific conservation and preservation interventions in similar urban polluted environments.

How to cite: Kumar, G., Gurjar, B. R., Sharma, M., and Ojha, C. S. P.: Black crust as a passive sampler of urban pollution on the heritage buildings in Delhi, India: An analytical and modelling approach, EGU General Assembly 2026, Vienna, Austria, 3–8 May 2026, EGU26-18929, https://doi.org/10.5194/egusphere-egu26-18929, 2026.

EGU26-19311 | ECS | Posters virtual | VPS2

A Phase-Plane Representation of the Convective Life Cycle: Characterizing Diabatic and Adiabatic Drivers during the Indian Summer Monsoon 

Soumili Chakraborty, Akshaya Nikumbh, Vijit Maithel, and Tukaram Zore

Tropical deep convection evolves as a cyclic process, but most observational and modeling studies diagnose convection through regional or domain-based contrasts, obscuring how key physical processes vary across different stages of the convective life cycle. The convective life cycle in the tropics is frequently conceptualized through recharge discharge processes. While valuable, this framework can be extended with more granular, phase specific diagnostics to better understand the distinct physical processes governing each stage of convection. Here, we build on existing phase-plane approaches to represent convection as a cyclic process, using column-integrated moist static energy (MSE) and its temporal tendency as the primary state variables. The phase plane is constructed with column integrated MSE along the horizontal axis and its temporal derivative along the vertical axis. While adhering to the established recharge–discharge paradigm, we extend this terminology by defining four distinct, cycle-consistent stages on the phase plane: Build-up, Cresting, Decay, and Recovery. Applying this framework to the Indian Summer Monsoon (ISM) core region, we map quasi-geostrophic (QG) omega-scaled precipitation components onto the MSE phase plane  to investigate the relative contributions of diabatic heating  and adiabatic forcing across the convective life cycle. These stage dependent signatures demonstrate the utility of the MSE phase plane for attributing and relative importance of dynamical and diabatic processes across the convective life cycle. Final results and extended analyses will be presented and discussed at the conference.

How to cite: Chakraborty, S., Nikumbh, A., Maithel, V., and Zore, T.: A Phase-Plane Representation of the Convective Life Cycle: Characterizing Diabatic and Adiabatic Drivers during the Indian Summer Monsoon, EGU General Assembly 2026, Vienna, Austria, 3–8 May 2026, EGU26-19311, https://doi.org/10.5194/egusphere-egu26-19311, 2026.

EGU26-20505 | ECS | Posters virtual | VPS2

Cost-Effective ECMWF AIFS Ensemble Inference for Subseasonal Forecasting in East Africa  

Eunice Koech, Nishadh Kalladath, Anthony Mwanthi, Alex Ogelo, Jason Kinyua, Hillary Koros, Mark Lelaono, Herbert Misiani, Tamirat Bekele, Hussen Seid, Masilin Gudoshava, and Ahmed Amdihun

In Eastern Africa, subseasonal forecasts are critical for early warning systems as climate extremes severely impact food security and livelihoods. ECMWF Artificial Intelligence Forecasting System (AIFS ENS v1.0) , an ensemble-based probabilistic data-driven forecast model developed by ECMWF offers unprecedented opportunities for regional applications through AI-driven weather prediction, but GPU compute costs and data access challenges limit deployment. As participants in the ECMWF AI Weather Quest, we developed solutions enabling cost-effective, cloud-based AIFS ensemble forecasting tailored for regional climate centers.  


We implemented a workflow (https://github.com/icpac-igad/ea-aifs) leveraging Google Cloud Platform infrastructure. Initial conditions are accessed via ECMWF's IFS data stored at AWS (Amazon Web Service) open data program at S3 Cloud storage using GRIB index-kerchunk, and VirtualiZarr methods for efficient data streaming without local storage overhead. The workflow employs experimental FP16 (half-precision) inference on AIFS ensemble models along with the standard FP32, evaluating GPU memory requirements and enabling deployment on cost-effective T4/L4 GPUs rather than expensive A100 instances.  


Verification results from the SON (September-October-November) 2025 season as part of the AI Weather Quest demonstrates that Team Fahamu's submission using AIFS ensemble forecasts for temperature and mean sea-level pressure outperforms climatology benchmarks. Regional evaluation over East Africa reveals promising subseasonal skill for temperature at lead times of 2-4 weeks—critical timescales for agricultural planning and anticipatory drought/flood action—while evaluation of precipitation forecasts is ongoing. This method provides a scalable template for regional climate centers globally to operationalize state-of-the-art AI weather models cost-effectively, advancing the democratization of advanced forecasting capabilities. 

How to cite: Koech, E., Kalladath, N., Mwanthi, A., Ogelo, A., Kinyua, J., Koros, H., Lelaono, M., Misiani, H., Bekele, T., Seid, H., Gudoshava, M., and Amdihun, A.: Cost-Effective ECMWF AIFS Ensemble Inference for Subseasonal Forecasting in East Africa , EGU General Assembly 2026, Vienna, Austria, 3–8 May 2026, EGU26-20505, https://doi.org/10.5194/egusphere-egu26-20505, 2026.

EGU26-21148 | ECS | Posters virtual | VPS2

Nocturnal boundary-layer ventilation failure governs heatwave persistence in South Asia 

Md. Aminul Haque Laskor, Salah Uddin Ahmed Dipu, Faysal Bhuiyan, and A.K.M. Saiful Islam

Persistent heatwaves across South Asia impose severe and growing impacts, yet the atmospheric processes that sustain extreme heat over multiple days remain incompletely understood. This study aims to determine whether heatwave persistence is driven by failures of nocturnal boundary-layer ventilation, rather than by daytime temperature extremes alone. We analyze pre-monsoon (March–May) heatwaves across South Asia (65°E–98°E, 5°N–35°N) from 1981 to 2024 using ERA5 hourly reanalysis, which includes near-surface air temperature, boundary-layer height, near-surface winds, and surface sensible heat flux. Heatwaves are identified using a percentile-based definition of daily maximum temperature, and nighttime conditions are diagnosed consistently using local solar time. Nocturnal ventilation is quantified through a physically interpretable ventilation potential combining nighttime boundary-layer height and near-surface wind speed, complemented by diagnostics of turbulent mixing and nocturnal cooling. We find that heatwave nights are consistently characterized by suppressed nocturnal ventilation, including shallow boundary layers, weak winds, and reduced turbulent exchange, and that reductions in nighttime ventilation are more strongly associated with heatwave duration and nighttime heat accumulation than daytime temperature anomalies. Composite analyses further indicate that ventilation and turbulent mixing weaken before heatwave onset and remain suppressed throughout the persistence phase, with particularly pronounced effects in humid regions such as Bangladesh. Our findings demonstrate that nocturnal boundary-layer ventilation failure is a central physical mechanism controlling heatwave persistence and suggest that incorporating nighttime atmospheric processes into heatwave monitoring and early-warning frameworks is essential for anticipating prolonged and high-impact heat extremes.

How to cite: Laskor, Md. A. H., Dipu, S. U. A., Bhuiyan, F., and Islam, A. K. M. S.: Nocturnal boundary-layer ventilation failure governs heatwave persistence in South Asia, EGU General Assembly 2026, Vienna, Austria, 3–8 May 2026, EGU26-21148, https://doi.org/10.5194/egusphere-egu26-21148, 2026.

EGU26-186 | ECS | Posters virtual | VPS3

3D-Printed Electrochemical Sensor for Rapid Detection of Phenolic Oxidation Products Relevant to Organic Aerosol Formation 

Abhishek Raj, Pushpendra Yadav, Ankit Sahai, and Rahul Swarup Sharma

Phenolic compounds are key precursors and intermediates in the formation and aging of secondary organic aerosols (SOA), particularly in biomass-burning plumes and urban atmospheres. However, their detection typically requires laboratory-based chromatographic or mass-spectrometric techniques, limiting rapid or on-site characterization. The current research present a fully 3D-printed electrode (3D-PE) platform produced via hybrid material extrusion additive manufacturing, providing a compact, low-cost, and field-deployable tool for electrochemical quantification of atmospheric phenolics. The device integrates PLA-based structural components with graphene and silver conductive layers deposited in a single manufacturing step. Cyclic voltammetry measurements demonstrate clear and distinct redox signatures for representative phenolic structures, with oxidation potentials of 0.48–0.68 V and well-resolved reduction peaks. These redox behaviors correspond to functional groups commonly found in lignin-derived and anthropogenically emitted aromatic species.

The 3D-PE operates with sample volumes as low as 50 µL, suitable for extracts from aerosol filters, cloud water, or fog samples. Its electroactive surface area (5.8–6.7 mm²) and high electron-transfer efficiency from the graphene electrode enable sensitive detection of trace phenolic compounds. The platform’s portability and rapid response offer new opportunities for quantifying oxidation intermediates during field campaigns, studying heterogeneous oxidation pathways, and investigating Secondary Organic Aerosol (SOA) formation dynamics.

This work demonstrates that additive manufacturing provides a promising route for developing next-generation, customizable atmospheric chemistry sensors. The 3D-printed electrochemical platform can complement established mass-spectrometric techniques by enabling low-cost, high-frequency measurements of reactive organic compounds that play central roles in SOA formation and atmospheric oxidative chemistry.

How to cite: Raj, A., Yadav, P., Sahai, A., and Sharma, R. S.: 3D-Printed Electrochemical Sensor for Rapid Detection of Phenolic Oxidation Products Relevant to Organic Aerosol Formation, EGU General Assembly 2026, Vienna, Austria, 3–8 May 2026, EGU26-186, https://doi.org/10.5194/egusphere-egu26-186, 2026.

EGU26-323 | ECS | Posters virtual | VPS3

Aerosol-cloud interactions under fine-mode and coarse-mode aerosol conditions over the monsoon region of Pakistan 

Kashif Anwar, Yangang Liu, Abdulhaleem Labban, and Özgür Zeydan

Abstract

The densely populated monsoon region of Pakistan, influenced by a diverse mix of natural and anthropogenic aerosols, provides a natural laboratory to investigate aerosol impacts on cloud properties. Using a decade-long (2015–2024) dataset from MODIS, MERRA-2, and ERA5, we examine the response of non-precipitating warm clouds to fine-mode and coarse-mode aerosols. We find positive correlations between aerosol optical depth (AOD) and cloud effective radius (CER), with stronger sensitivity to fine-mode AOD. The relationships of AOD with cloud optical thickness (COT) and liquid water path (LWP) are generally negative, but more pronounced for coarse-mode AOD. These aerosol-cloud relationships are strongly modulated by meteorological conditions: low relative humidity and low lower-tropospheric stability enhance the negative AOD–COT and AOD–LWP responses. Additionally, the sensitivity of aerosol-cloud relationships to meteorology is greater for fine-mode AOD than coarse-mode. These results highlight the importance of aerosol size and ambient meteorology in determining cloud microphysical responses, providing insight into aerosol cloud interactions in a region critical for South Asian climate.

How to cite: Anwar, K., Liu, Y., Labban, A., and Zeydan, Ö.: Aerosol-cloud interactions under fine-mode and coarse-mode aerosol conditions over the monsoon region of Pakistan, EGU General Assembly 2026, Vienna, Austria, 3–8 May 2026, EGU26-323, https://doi.org/10.5194/egusphere-egu26-323, 2026.

EGU26-1603 | ECS | Posters virtual | VPS3

BASIC: A Boosted Aerosol-Size-Integrated XCO2 Retrieval Algorithm 

Zhujun Li and Siwei Li

Accurate retrieval of the dry-air mole fraction of CO₂ (XCO₂) is essential for tracking emissions and supporting mitigation. However, aerosols significantly alter photon path lengths through scattering and absorption, making them the largest variable error source in XCO₂ retrieval. Current efforts to improve aerosol treatment in XCO₂ retrievals, such as the Atmospheric CO₂ Observations from Space (ACOS) algorithm for the Orbiting Carbon Observatory-2 (OCO-2), primarily focus on enhancing prior estimates of aerosol optical depth (AOD), vertical distribution, and optical properties. Yet, aerosol particle size distribution (PSD) parameters—a critical microphysical factor contributing to nonlinear variations in aerosol optical properties—are held fixed and excluded from the ACOS retrieval, thereby introducing additional biases into the XCO₂ results.

To address this challenge, we developed a Boosted Aerosol-Size-Integrated XCO₂ (BASIC) retrieval algorithm that concurrently retrieves XCO₂ and aerosol PSD parameters from OCO-2 observations. Validation at five Total Carbon Column Observing Network (TCCON) sites in East Asia shows that BASIC reduces the root-mean-square error (RMSE) by 30% and 13% compared to the standard and bias-corrected OCO-2 products, respectively. The improvement primarily stems from BASIC’s ability to generate forward-modeled spectra that more closely match observations than those from ACOS, particularly in the O₂ A-band, which is highly sensitive to aerosols. These results highlight the importance of incorporating variable aerosol PSD in retrievals and demonstrate that BASIC more accurately represents aerosol effects on radiative transfer. Our findings suggest that PSD-aware retrievals can significantly improve the accuracy of satellite-derived XCO₂ estimates under highly variable aerosol loading conditions, such as those in East Asia.

How to cite: Li, Z. and Li, S.: BASIC: A Boosted Aerosol-Size-Integrated XCO2 Retrieval Algorithm, EGU General Assembly 2026, Vienna, Austria, 3–8 May 2026, EGU26-1603, https://doi.org/10.5194/egusphere-egu26-1603, 2026.

EGU26-2329 | ECS | Posters virtual | VPS3

Quantifying Urban Biogenic CO2 Fluxes in Greenhouse Gas Budgets: A Scalable Framework and Case Study 

Qing Luo, Ricard Segura-Barrero, Alba Badia, Thomas Lauvaux, Junwei Li, Jia Chen, and Gara Villalba

To advance urban sustainability and achieve climate neutrality, cities are proposing various decarbonization strategies through nature-based solutions, including the implementation of green infrastructures (GI). Accurately quantifying urban biogenic CO2 exchange is essential for developing robust greenhouse gas budgets and for distinguishing biogenic from anthropogenic contributions to atmospheric CO2 in urban environments.

This study systematically reviews current approaches for estimating urban biogenic CO2 fluxes from both measurement- and model-based perspectives, evaluating their advantages, limitations, and applicability in urban contexts. Building on this review, we present an optimized framework to quantify urban biospheric CO2 fluxes using the Vegetation Photosynthesis and Respiration Model (VPRM) driven by a high-resolution land cover map and sentinel-2 satellite data. The framework is applied to the Metropolitan Area of Barcelona for April and December 2023 at a 10 m spatial resolution. Results show that evergreen needleleaf forests and croplands act as significant carbon sinks in April, with biogenic CO2 uptake offsetting approximately 10% of anthropogenic CO2 emissions in April and 4% in December. A cross-city comparison of urban vegetation cover, climatic conditions, and the biogenic offset effects indicates that increased vegetation cover does not necessarily translate into a proportionally stronger carbon sink. Nevertheless, this study proposes that a standardized framework for accounting for biogenic CO2 fluxes and uptake should be established to provide critical support for GI-based mitigation strategies in urban planning.


How to cite: Luo, Q., Segura-Barrero, R., Badia, A., Lauvaux, T., Li, J., Chen, J., and Villalba, G.: Quantifying Urban Biogenic CO2 Fluxes in Greenhouse Gas Budgets: A Scalable Framework and Case Study, EGU General Assembly 2026, Vienna, Austria, 3–8 May 2026, EGU26-2329, https://doi.org/10.5194/egusphere-egu26-2329, 2026.

EGU26-3325 | ECS | Posters virtual | VPS3

Long Term Analysis of Aerosol Properties Over the Eastern Mediterranean Using Grasp Retrieved AERONET Data 

Ahmet Semih Çetiner and S. Yeşer Aslanoğlu

This study presents a comprehensive climatological analysis of aerosol optical and microphysical properties over the Eastern Mediterranean, utilizing long-term AERONET measurements from Mersin/Erdemli (IMS-METU) site. The Generalized Retrieval of Aerosol and Surface Properties (GRASP) algorithm was used to retrieve key parameters, including Aerosol Optical Depth (AOD), Single Scattering Albedo (SSA), and Volume Size Distribution, offering robust separation of surface and aerosol properties.

Results revealed a distinct seasonal cycle in aerosol loading, with AOD peaking in summer (July-August) due to fine-mode pollution and exhibiting a secondary peak in spring (April) driven by mineral dust transport from desert regions. The annual mean SSA displays a negative spectral slope, decreasing from ~0.93 at 440 nm to ~0.90 at 1020 nm, indicating a background atmosphere dominated by fine-mode urban-industrial aerosols. Although winter months exhibit the lowest total aerosol load due to wet scavenging, they display the strongest absorption characteristics. The imaginary refractive index significantly exceeds 0.015, and SSA values drop sharply during winter, attributed to Black Carbon emissions from domestic heating. The volume size distribution maintains a bimodal structure year-round; while the coarse mode dominates during spring dust events, the fine mode contribution remains substantial across all seasons. The aerosol population over the Eastern Mediterranean is characterized as a heterogeneous mixture where the anthropogenic fine-mode background is periodically modulated by natural mineral dust intrusions and local carbonaceous emissions.

How to cite: Çetiner, A. S. and Aslanoğlu, S. Y.: Long Term Analysis of Aerosol Properties Over the Eastern Mediterranean Using Grasp Retrieved AERONET Data, EGU General Assembly 2026, Vienna, Austria, 3–8 May 2026, EGU26-3325, https://doi.org/10.5194/egusphere-egu26-3325, 2026.

EGU26-4386 | ECS | Posters virtual | VPS3

Surface energy forcing modulates ozone variability independently of air temperature over the Tibetan Plateau 

Cheng Zhao, Yaozhou Wang, Yujin Liu, Wenjie Li, Dingzhen Gongga, Deqing Quzhen, Yaokai Ao, Jinpeng Yue, Xiaoping Zhong, and Xiaohui Du

 Meteorological normalization of surface ozone typically relies on air temperature to proxy both photochemical activity and boundary-layer dynamics. However, this approach implicitly assumes that the thermal state adequately represents radiative energy input—an assumption that remains untested in high-elevation environments where strong solar forcing and a thin atmosphere may decouple temperature from the surface energy balance. Here, we examine how surface energy forcing modulates ozone variability independently of air temperature using continuous station-level measurements in Lhasa (3650 m a.s.l.), Tibetan Plateau. By stratifying days based on net radiative input while explicitly constraining thermal conditions through a counterfactual matched-pair analysis, we isolate energy-driven processes without invoking reanalysis-based boundary-layer estimates. Results demonstrate that high-energy states consistently exhibit enhanced morning ozone growth (median +4.3 ppb h-1) and elevated daytime concentrations relative to temperature-matched low-energy states. These enhancements are accompanied by coherent multi-tracer responses, including moisture drying and the dilution of primary pollutants, which provide observational constraints on energy-driven vertical coupling that are distinct from temperature-dependent photochemistry. Furthermore, a rate-based robustness analysis confirms that these signals persist across varying stratification thresholds. We conclude that surface energy forcing represents a previously under-constrained structural factor in conventional ozone attribution frameworks, particularly in complex terrain where thermal and radiative states frequently decouple. 

How to cite: Zhao, C., Wang, Y., Liu, Y., Li, W., Gongga, D., Quzhen, D., Ao, Y., Yue, J., Zhong, X., and Du, X.: Surface energy forcing modulates ozone variability independently of air temperature over the Tibetan Plateau, EGU General Assembly 2026, Vienna, Austria, 3–8 May 2026, EGU26-4386, https://doi.org/10.5194/egusphere-egu26-4386, 2026.

EGU26-5251 | ECS | Posters virtual | VPS3

AtmoSTEM: A high-resolution spatiotemporal emission model for urban air quality applications 

Anastasia Kakouri, Georgios Filippis, Marios-Bruno Korras-Carassa, Jereon Kuenen, Nikolaos Hatzianastassiou, Christos Matsoukas, and Themistoklis Kontos

As growing environmental pressures challenge urban resilience, sustainability, and human well-being, the lack of high-resolution geospatial information at the urban or intra-urban scale remains a critical limitation for effective and targeted decision-making. In the context of air quality and associated health impacts, this study addresses this gap by developing the Atmospheric SpatioTemporal Emissions Model (AtmoSTEM), a high-resolution spatiotemporal framework for representing atmospheric emissions, pollutant concentrations, and population exposure at 1 km2 resolution. The application focuses on the Ioannina basin in Greece, where residential biomass burning (BB) constitutes a dominant emission source, especially during the cold season, frequently leading to pollution levels exceeding the World Health Organization (WHO) Air Quality Guidelines (AQG) and EU thresholds and underscoring the need for targeted interventions.

For this purpose, a high spatiotemporal emission inventory for Residential Heating is developed. The Copernicus Atmosphere Monitoring Service (CAMS) regional emission inventory, structured according to the GNFR classification and provided at a spatial resolution of 0.05° × 0.1°, serves as the baseline dataset. The downscaling process is based on publicly available, open-access, GNFR-dependent high-resolution spatial proxies, including the Coordination of Information on population density data from Global Human Settlement (GHSL), land-use classifications from the Copernicus Land Monitoring Service (CLC 2018), the OpenStreetMap (OSM) road network, and, where applicable in coastal and maritime domains, marine traffic density from the European Marine Observation and Data Network (EMODNet). Particular emphasis is placed on refining pollutant fields that are more relevant to BB activities, thereby improving the spatial representativeness of BB emissions within urban and peri-urban environments.

To capture the temporal variability of the emissions, CAMS is combined with CAMS temporal Regional Profiles (CAMS-TEMPO), enabling the generation of analytically resolved, hourly emission estimates. Pollutant concentrations are then estimated using a Random Forest machine learning model that integrates AtmoSTEM’s high-resolution emissions, with meteorological, satellite-derived, and spatial data, as well as in-situ air quality measurements provided by the University of Ioannina. The resulting high-resolution concentration fields are evaluated against independent in-situ measurements. Additionally, BB-related PM2.5 fields are derived and analyzed, enabling improved source-specific characterization of residential heating contributions and providing a physically consistent basis for air-quality and exposure assessments.

How to cite: Kakouri, A., Filippis, G., Korras-Carassa, M.-B., Kuenen, J., Hatzianastassiou, N., Matsoukas, C., and Kontos, T.: AtmoSTEM: A high-resolution spatiotemporal emission model for urban air quality applications, EGU General Assembly 2026, Vienna, Austria, 3–8 May 2026, EGU26-5251, https://doi.org/10.5194/egusphere-egu26-5251, 2026.

EGU26-5443 | Posters virtual | VPS3

Automated nighttime contrail detection using spatio-temporal clustering of Raman lidar measurements  

Florian Mandija, Philippe Keckhut, Dunya Alraddawi, Abdanour Irbah, Alain Sarkissian, Sergey Khaykin, Frédéric Peyrin, and Jean-Luc Baray

We present an automated procedure that combines lidar measurements, ADS-B flight tracks and ECMWF ERA5 meteorological data to detect and characterise nighttime aircraft contrails. Measurements have been carried out at the Observatory of Haute-Provence (OHP) in France. Lidar scattering-ratio profiles were processed with a sensitivity-driven spatio-temporal discrimination algorithm to identify contrail “spots” and aggregate them into contrail signatures. A parameter score identifies an optimal discrimination threshold set that balances sensitivity and false positives. In our case, these thresholds took these values: scattering ratio SR ≈ 2.1; temporal aggregation ≈ 7.2 min; vertical separation ≈ 0.3 km. Applied to five nighttime events, the method yields mean contrail altitudes of 8.7–10.3 km, geometrical thicknesses of 0.1–1.1 km, horizontal widths 2–3 km, and optical depths (COD) of ≈0.05–0.40. Persistent contrails are associated with ice-supersaturated layers and temperatures below −41 °C. Contrail optical depth resulted well correlated with both vertical thickness and horizontal extent. We have demonstrated that combining lidar with ADS-B and ERA5 substantially improves detection and discriminates contrails from natural cirrus at night, a regime where passive satellite retrievals are limited. This approach is automatic, transferable and reproducible, offering robust validation data for satellite algorithms and improved contrail parameterizations in climate models.

How to cite: Mandija, F., Keckhut, P., Alraddawi, D., Irbah, A., Sarkissian, A., Khaykin, S., Peyrin, F., and Baray, J.-L.: Automated nighttime contrail detection using spatio-temporal clustering of Raman lidar measurements , EGU General Assembly 2026, Vienna, Austria, 3–8 May 2026, EGU26-5443, https://doi.org/10.5194/egusphere-egu26-5443, 2026.

EGU26-8607 | ECS | Posters virtual | VPS3

Long-term spatiotemporal evolution and source attribution of smoke aerosols in Northeast China 

Xuhui Gao and Natallia Miatselskaya

Smoke aerosols constitute a critical component of atmospheric pollutants and radiative forcing agents. Northeast China is frequently afflicted by smoke episodes. Driven by the combined impacts of anthropogenic emissions, residential heating, agricultural biomass burning, and other factors, this region exhibits complex aerosol characteristics with pronounced seasonal variations. This study systematically evaluates the spatiotemporal evolution of smoke aerosols from 2015 to 2023 using GEOS-Chem global simulations (2°×2.5°), along with ground-based PM2.5 measurements, sun photometer AOD measurements in Harbin, MODIS, and VIIRS fire data. We classified the region into six distinct sub-regions based on smoke concentration characteristics: four urban zones (Dalian, Shenyang, Changchun, Harbin) and two rural zones (Eastern Coastal and Western Inland). Observational and simulation data demonstrates that the model captures regional seasonal variability and annual trends. Employing the HYSPLIT model and Concentration Weighted Trajectory (CWT) analysis, we identified potential external source regions and initially assessed the relative contribution of cross-regional transport (e.g., from Siberia or North China) to smoke episodes across different seasons. This comprehensive analysis provides a scientific basis for understanding the climatic effects of aerosols and formulating refined regional air quality management strategies in Northeast China.

How to cite: Gao, X. and Miatselskaya, N.: Long-term spatiotemporal evolution and source attribution of smoke aerosols in Northeast China, EGU General Assembly 2026, Vienna, Austria, 3–8 May 2026, EGU26-8607, https://doi.org/10.5194/egusphere-egu26-8607, 2026.

EGU26-8822 | ECS | Posters virtual | VPS3

Seasonal variation of organic sources during the post-monsoon and spring seasons across multiple urban sites of the Indo-Gangetic Plain using a mobile lab platform 

Akanksha Lakra, Sachchida Nand Tripathi, Davender Sethi, Ambasht Kumar, Himadri Sekhar Bhowmik, and Ashutosh Kumar Shukla

The Indo-Gangetic Plain (IGP) experiences strong seasonal and spatial heterogeneity in aerosol composition, driven by variations in emissions, meteorology, and regional transport. Capturing these variations requires measurement approaches that extend beyond conventional fixed-site monitoring. In this study, we deployed a mobile lab platform equipped with aerosol instrumentation, including a high-resolution time-of-flight aerosol mass spectrometer (HR-ToF-AMS), to investigate seasonal variability in organic aerosol (OA) sources during the post-monsoon and spring seasons across distinct urban environments in Lucknow, located in the central Indo-Gangetic Plain.

Field campaigns were conducted during the post-monsoon and spring seasons at Babasaheb Bhimrao Ambedkar University (BBAU), a site influenced by traffic near major highways, and at the Council of Scientific & Industrial Research–Central Institute of Medicinal and Aromatic Plants (CSIR-CIMAP), located adjacent to a forested area. Additional measurements were conducted during the spring season at the Uttar Pradesh Pollution Control Board (UPPCB) site, which represents a residential–commercial environment.

At each location, the mobile laboratory was operated for approximately 10–15 days, enabling continuous, near real-time characterization of fine particulate matter and associated co-pollutants. Measurements of non-refractory PM2.5 (NR-PM2.5) chemical composition (measured using HR-ToF-AMS) were supported by simultaneous observations of trace elements, black carbon, gaseous species, total PM2.5 mass, and meteorological parameters. This integrated, multi-instrument framework allowed for a consistent comparison of aerosol chemical signatures across sites and seasons, while capturing short-term variability linked to local emissions, atmospheric processing, and regional transport.

Organic aerosol dominated the mass of NR-PM2.5 across all sites and seasons, contributing more than 50% of the total NR-PM2.5. Source apportionment using Positive Matrix Factorization (PMF) with the multilinear engine (ME-2) resolved hydrocarbon-like OA (HOA), biomass-burning OA (BBOA), oxidized biomass-burning OA (O-BBOA), and secondary oxygenated OA components (SVOOA and LVOOA). During the post-monsoon period, BBOA accounted for approximately 28–40% of total OA across the sites, indicating a strong combustion influence under shallow boundary-layer conditions. Traffic-related HOA contributed about 8–13% of OA, with enhanced fractions at the highway-influenced BBAU site, reflecting local vehicular emissions. In contrast, springtime conditions showed enhanced secondary OA contributions (70-60%), with trajectory-based analyses highlighting the role of long-range transport in shaping aerosol composition.

The use of a mobile laboratory enabled rapid deployment across diverse land-use environments while maintaining consistent instrumentation and methodology, allowing robust inter-site and inter-seasonal comparisons. This approach emphasises the significance of high-resolution mobile observations for elucidating the fine-scale spatial variability and seasonal evolution of organic aerosol sources in the complex urban regions of the IGP.

How to cite: Lakra, A., Tripathi, S. N., Sethi, D., Kumar, A., Bhowmik, H. S., and Shukla, A. K.: Seasonal variation of organic sources during the post-monsoon and spring seasons across multiple urban sites of the Indo-Gangetic Plain using a mobile lab platform, EGU General Assembly 2026, Vienna, Austria, 3–8 May 2026, EGU26-8822, https://doi.org/10.5194/egusphere-egu26-8822, 2026.

EGU26-11855 | ECS | Posters virtual | VPS3

Global Implications of a Low Soil Moisture Threshold for Microbial Hydrogen Uptake  

Linta Reji, Matteo Bertagni, Fabien Paulot, Qianhui Qin, and Xinning Zhang

The impact of increasing anthropogenic hydrogen (H2) emissions on Earth’s radiative balance depends on the soil microbial H2 sink—the largest and most uncertain term in the global H2 budget. Soil moisture is a primary but poorly quantified control regulating the soil sink. Here, we assess the sensitivity of microbial H2 oxidation to soil moisture in laboratory experiments with temperate and arid soils spanning distinct textures. H2 oxidizer activity is observed down to –70 to –100 MPa water potentials across soils, which are among the driest conditions reported for microbial activity and are much drier than assumed in global simulations of H2. Using genome-resolved meta-omics, we link H2 oxidation dynamics in temperate soils to specific desiccation-adapted microbial taxa that contribute differentially to H2 uptake along the moisture gradient. Through global simulations, we show that our observationally constrained drier moisture threshold increases the contribution of arid and semi-arid regions for soil H2 uptake by 4-7 percentage points (pp), while decreasing the contribution of temperate and continental regions (−7 pp). Our results highlight the importance of H2 uptake under extreme hydrological conditions, particularly the roles of desertification, dryland expansion, and H2-oxidizer ecophysiology in modulating long-term changes in H2 uptake.

How to cite: Reji, L., Bertagni, M., Paulot, F., Qin, Q., and Zhang, X.: Global Implications of a Low Soil Moisture Threshold for Microbial Hydrogen Uptake , EGU General Assembly 2026, Vienna, Austria, 3–8 May 2026, EGU26-11855, https://doi.org/10.5194/egusphere-egu26-11855, 2026.

EGU26-12630 | ECS | Posters virtual | VPS3

Closed to Open-Celled Mixed-Phase Cloud Transition Over the Nordic Seas Under High Aerosol Loading 

Samuel Ephraim, Paquita Zuidema, Aaron Bansemer, Lintong Cai, Owen Cruikshank, Nikolaos Evengeliou, Jeff French, Bart Geerts, Coltin Grasmick, Andreas Massling, Greg McFarquhar, Gunnar Noel, Marcus Petters, Elise Rosky, Henrik Skov, Jefferson Snider, Tyler Tatro, Zhien Wang, Sarah Woods, and Lu Zhang

A closed to open-celled transition of mixed-phase clouds within a marine cold air outbreak (MCAO), driven by an occluded cyclone over the Nordic Seas, is interrogated with data acquired during the Cold Air Outbreak Experiment in the Sub-Arctic Region (CAESAR) field campaign on 29 February 2024. The understanding of these transitions is a challenge for numerical prediction models due to their small scale but important for weather and climate prediction, as open celled conditions have stronger updrafts supporting locally high precipitation rates along with a lower cloud fraction (lower albedo) than closed celled conditions. Measurements indicate that a stratiform (closed cell convective) cloud deck with cloud top heights of ~1230 m and liquid water paths (LWP) of ~130 gm-2, within a boundary layer with aerosol number/CCN surpassing 600 cm-3, deepen to heights of ~1520 m with LWPs of ~270 gm-2 over 250 km of fetch, before transitioning into an open-celled convective structure with cloud tops reaching up to 2220 m. Cooling free tropospheric temperatures with fetch, which reduce the inversion strength thereby enhancing growth by entrainment may encourage boundary layer growth. Open-cells are  more glaciated than closed-cells with mean LWPs falling from 270 gm-2 to 80 gm-2 across the transition, however isolated peaks of LWP within updrafts of open cells occasionally surpass 500 gm-2. Minimal secondary ice production (SIP) is observed in closed cells with ice nucleating particle and ice number concentrations ~2 L-1 with cloud temperatures between -20oC and -15oC. In open cellular convection (cloud temperatures between -22oC and -15oC), ice number concentrations reach ~10 L-1 indicating SIP. High aerosol concentrations are hypothesized to support the maintenance of closed-celled convection, with 80% of drops smaller than 10 μm reducing the riming efficiency. Small droplets also limit the production of freezing drizzle, which is hypothesized to limit the potential of SIP due to freezing/fragmentation within closed cell convection. Only after aerosol concentrations are depleted through scavenging and/or entrainment are SIP processes able to become more effective and precipitation particles able to grow large and dense enough to reach the surface and form cold pools breaking up the cloud deck. Plumes of warm moist air lifting off the ocean surface, juxtaposed with cold pools and entrainment events penetrating to the surface are documented using the Multi-function Airborne Raman Lidar (MARLi) in the first observations of its kind.

How to cite: Ephraim, S., Zuidema, P., Bansemer, A., Cai, L., Cruikshank, O., Evengeliou, N., French, J., Geerts, B., Grasmick, C., Massling, A., McFarquhar, G., Noel, G., Petters, M., Rosky, E., Skov, H., Snider, J., Tatro, T., Wang, Z., Woods, S., and Zhang, L.: Closed to Open-Celled Mixed-Phase Cloud Transition Over the Nordic Seas Under High Aerosol Loading, EGU General Assembly 2026, Vienna, Austria, 3–8 May 2026, EGU26-12630, https://doi.org/10.5194/egusphere-egu26-12630, 2026.

EGU26-13522 | ECS | Posters virtual | VPS3

Influence of Vegetation Cover on Atmospheric CO2 Mixing Ratios in the São Paulo Metropolitan Area 

Jorge Piscoya, Marco Aurélio Franco, and Maria de Fatima Andrade

Urban vegetation plays a key role in modulating atmospheric carbon dioxide (CO2) in megacities. However, studies that explicitly quantify the effect of urban vegetation on CO2 remain scarce. This study investigates how vegetation cover affects CO2 mixing ratios in the Metropolitan Area of São Paulo (MASP) during 2020–2022, using four monitoring sites with contrasting vegetation fractions: Pico do Jaraguá (PJ; 59.75%), IAG (36.38%), ICESP (22.42%), and UNICID (10.42%). Vegetation cover was derived from Sentinel-2 Level-2A imagery using NDVI-based pixel classification, while CO2 observations were obtained from the METROCLIMA network and analyzed together with concurrent meteorological variables (temperature, humidity, and wind). The analysis comprised characterizing temporal variability and quantifying vegetation effects using regression models and probability distribution functions (PDFs). Clear seasonal and diurnal patterns were observed, with lower CO2 concentrations during summer and afternoon hours (420-414 ppm), and higher values during winter and nighttime periods (447-425 ppm). The greener and less urban site, PJ, exhibited the lowest and most stable CO2 levels, whereas the highly urban UNICID site showed the highest average mixing ratios. Elevated CO2 values at IAG (428.30 ppm in summer and 435.49 ppm in winter), despite substantial vegetation cover, suggest the influence of local emissions and boundary-layer dynamics, while relatively low CO2 values at ICESP (422.10 ppm in summer and 428.03 ppm in winter) likely reflect the elevated measurement height (~100 m a.g.l.), which favors regional-scale mixing and reduces sensitivity to local emission sources. NDVI revealed a bimodal phenological cycle (April–May and October–November), which was mirrored by CO2 variability at PJ. Among 132 fitted PDFs, the Normal Inverse Gaussian distribution best captured CO₂ variability, with greener sites showing flatter and more symmetric distributions and urban sites showing increased skewness and peakedness. Regression results indicate a significant vegetation signal: a 0.1 increase in NDVI was associated with CO2 reductions of ~3.92 ppm (PJ), 2.81 ppm (IAG), and 7.66 ppm (ICESP; likely conditional on site features), while no significant effect was detected at UNICID. Overall, urban vegetation influences both mean CO2 levels and their distributional characteristics, supporting the role of green infrastructure and phenology in urban carbon management.

Keywords: carbon dioxide, vegetation cover, linear regression, Metropolitan Area of São Paulo.

How to cite: Piscoya, J., Franco, M. A., and Andrade, M. D. F.: Influence of Vegetation Cover on Atmospheric CO2 Mixing Ratios in the São Paulo Metropolitan Area, EGU General Assembly 2026, Vienna, Austria, 3–8 May 2026, EGU26-13522, https://doi.org/10.5194/egusphere-egu26-13522, 2026.

EGU26-13698 | Posters virtual | VPS3

Inferring aerosol optical depth at unmeasured wavelengths from ground-based spectral photometer data: uncertainty-consistent regression, sensitivity tests, and application to real data 

Benjamin Torres, Oleg Dubovik, Carlos Toledano, David Fuertes, Masahiro Momoi, Stelios Kazadzis, Thierry Marbach, Elena Lind, Roberto Roman, Manuel Veloso Varela, and Africa Barreto

Aerosol optical depth (τ) is routinely reported at wavelengths that are not directly measured by ground-based sun photometers, in particular at 550 nm for satellite validation and at longer wavelengths for short-wave infrared applications. These values are typically obtained by spectral interpolation or extrapolation, most often using linear or quadratic regressions in logarithmic space. However, the uncertainty structure of such regressions is frequently treated incorrectly, because measurement uncertainties in τ are absolute and approximately wavelength-independent in linear space, and therefore become wavelength-dependent in logarithmic space. As a result, the measurement covariance matrix must be explicitly accounted for in log–log regression, although this is rarely done in practice. This study provides both a formal and a practical framework for estimating τ at non-measured wavelengths together with its associated uncertainty. A rigorous formulation is presented for linear and quadratic regression in logarithmic space, including the propagation of random and systematic (bias-related) errors from the original spectral measurements to the interpolated or extrapolated wavelength.

Sensitivity analyses based on synthetic aerosol optical depth spectra generated with the GRASP forward model are used to compare six different approaches for deriving τ(550) and τ(2000), including linear and quadratic regressions over different spectral ranges as well as the GRASP-AOD method. When the covariance matrix is treated correctly, quadratic log–log regression is found to be the most robust method for estimating τ(550), and its results become essentially independent of the chosen spectral range. In contrast, when the covariance matrix is neglected, the same regression becomes highly sensitive to the selected wavelengths, and artificially improved performance is obtained when restricting the fit to the central AERONET channels. These findings are confirmed using real AERONET observations. When the full covariance treatment is applied, differences between estimates obtained using different spectral ranges remain below 0.002 at all sites analysed. When it is ignored, root-mean-square differences exceeding 0.01 are observed at sites dominated by fine-mode aerosols.

Finally, the uncertainty propagation framework is applied to real data and shows that the uncertainty of interpolated τ follows the expected Beer–Lambert law governing sun-photometer measurements, scaling with optical air mass. This provides an independent validation of the formal error model. Overall, this work establishes a consistent methodology for spectral interpolation and extrapolation of τ, ensuring both accurate values and physically meaningful uncertainties for satellite validation and related applications.

How to cite: Torres, B., Dubovik, O., Toledano, C., Fuertes, D., Momoi, M., Kazadzis, S., Marbach, T., Lind, E., Roman, R., Veloso Varela, M., and Barreto, A.: Inferring aerosol optical depth at unmeasured wavelengths from ground-based spectral photometer data: uncertainty-consistent regression, sensitivity tests, and application to real data, EGU General Assembly 2026, Vienna, Austria, 3–8 May 2026, EGU26-13698, https://doi.org/10.5194/egusphere-egu26-13698, 2026.

EGU26-14127 | Posters virtual | VPS3

From Detection to Mitigation: The California Satellite Methane Project 

Daniel Phillips, Emily Yang, Jason Schroeder, Stephen Zelinka, Isis Frausto-Vicencio, Dorothy Fibiger, and Jorn Herner

Past aerial hyperspectral mapping campaigns and pilot studies have demonstrated that highly concentrated plumes are a significant portion of California’s total methane emissions, including many unintentional leaks that can be fixed quickly when operators are notified. Satellite plume imagers such as Planet’s Tanager offer the capacity for repeated observations of known methane infrastructure, with enough spatial resolution and sensitivity to address a significant fraction of these leaks by identifying source facilities and contacting operators. Here we present system design and first results from the California Satellite Methane Project (CalSMP), a comprehensive multi-sector effort to notify individual operators of plumes within days of detection and ensure prompt mitigation when possible through a mix of direct regulation and voluntary dialogue with operators.

In May 2025, CARB began retrieving low-latency Tanager plume detections purchased from Carbon Mapper. Using a cloud-based system developed in-house, CARB employees oversee a semi-automated process to assign plumes to a source and facilitate information exchange with operators. The system generates a notification email with instructions and response forms tailored to the specific facility type (e.g. landfill, oil and gas, dairy biogas). These responses allow us to categorize emissions across sectors by emission type (e.g. unintentional, temporary, process) as well as identify sector-specific components or infrastructure (landfill gas collection system, gas well stuffing box) and details of any repairs.

CARB plans to expand its spatiotemporal coverage through additional satellites, with increased automation as we scale up. While the project’s initial focus is direct repair of unintentional leaks, operator responses also effectively survey underlying causes of point-source emissions and can inform future efforts to improve industry operational practices. CARB has dedicated community outreach funds to ensure methane observations are accessible, understandable, and useful to communities, and is committed to sharing technical details, project design, and lessons learned with other jurisdictions to maximize global mitigation efforts.

How to cite: Phillips, D., Yang, E., Schroeder, J., Zelinka, S., Frausto-Vicencio, I., Fibiger, D., and Herner, J.: From Detection to Mitigation: The California Satellite Methane Project, EGU General Assembly 2026, Vienna, Austria, 3–8 May 2026, EGU26-14127, https://doi.org/10.5194/egusphere-egu26-14127, 2026.

EGU26-14645 | ECS | Posters virtual | VPS3

Climate Response to Tambora-Scale Volcanic Eruptions Under Present and Future Climate Conditions 

Margarita Tkachenko and Rozanov Eugene

We quantify climate effects of Tambora-scale eruptions under current and future warming using the SOCOL-MPIOM coupled atmosphere-chemistry-ocean model for 2020, SSP2-4.5, and SSP3-7.0 (2080) scenarios.

Global cooling amplifies counterintuitively with background warming: SSP3-7.0 shows 44% stronger cooling than present-day due to polar vortex intensification increasing from 5.5% to 44.5%. Regional responses reveal complex patterns: winter exhibits Arctic warming (+0.4-0.6°C) simultaneous with tropical cooling (up to -8°C) and continental extremes (up to +15°C). Summer brings widespread continental cooling (-2 to -4°C). Monsoon systems weaken by 20-35% while mid-latitude winter precipitation intensifies by 20-40%.

Results demonstrate that volcanic impacts under anthropogenic warming generate spatially heterogeneous extremes rather than uniform cooling, critical for agricultural and water resource risk assessment.

How to cite: Tkachenko, M. and Eugene, R.: Climate Response to Tambora-Scale Volcanic Eruptions Under Present and Future Climate Conditions, EGU General Assembly 2026, Vienna, Austria, 3–8 May 2026, EGU26-14645, https://doi.org/10.5194/egusphere-egu26-14645, 2026.

EGU26-15531 | ECS | Posters virtual | VPS3

Cloud Detection over Snow- or Ice-covered Surfaces Using Oxygen A-Band Observations 

Huangchuan Liu and Siwei Li

Cloud detection over snow- or ice-covered (S/IC) surfaces remains a critical challenge in satellite remote sensing. The cloud-like high surface albedo and ice-cloud-like brightness temperatures of these surfaces often lead to systematic misclassification in visible- and infrared-based algorithms, including the threshold-based cloud detection applied to Sentinel-5P atmospheric composition retrievals. Misclassified clear-sky scenes can introduce biases in the retrieved total columns of ozone, sulfur dioxide, and nitrogen dioxide, while misclassified cloudy scenes reduce the spatial coverage of satellite products.

To address this challenge, we develop a global cloud detection algorithm based on absorption images derived from Sentinel-5P oxygen A-band observations. The algorithm exploits the reduction of oxygen absorption in cloudy pixels, as cloud layers reflect solar radiation before it reaches the underlying surface, thereby shortening the radiative transfer path in the atmosphere and reducing absorption along the path. In addition, spatial texture information extracted from oxygen absorption images is incorporated to enhance sensitivity to optically thin and broken clouds, enabling more robust discrimination between clouds and bright underlying surfaces. This physical mechanism makes the algorithm insensitive to surface type, rendering it particularly suitable for global cloud detection, including over S/IC surfaces.

Validation against CALIPSO demonstrates a marked improvement in cloud detection performance across diverse surface and cloud conditions. The proposed algorithm achieves an overall accuracy of 91%, compared with 85% for the Suomi-NPP product and 48% for the operational Sentinel-5P product. Improvements are particularly pronounced over S/IC surfaces, where detection accuracy increases by 15% relative to Suomi-NPP. Additionally, detection accuracy for optically thin clouds improves by 20% globally, with the largest gains (up to 52%) observed over S/IC surfaces. These results demonstrate the value of oxygen absorption and spatial texture features for cloud detection, especially over S/IC surfaces, and support improved quality and consistency of satellite-based atmospheric observations over polar and other bright-surface regions.

How to cite: Liu, H. and Li, S.: Cloud Detection over Snow- or Ice-covered Surfaces Using Oxygen A-Band Observations, EGU General Assembly 2026, Vienna, Austria, 3–8 May 2026, EGU26-15531, https://doi.org/10.5194/egusphere-egu26-15531, 2026.

EGU26-15593 | ECS | Posters virtual | VPS3

Horizontal grid and meteorology resolution impacts on aviation’s air quality impacts 

Luccas Kavabata, Flávio Quadros, Vincent Meijer, Mirjam Snellen, and Irene Dedoussi

Simulations of aviation's air quality impacts near airports are critical for enhancing our understanding of how aviation impacts air quality regionally, and the potential effects of sustainable alternatives. In order to better understand such impacts, a research to investigate the effects of the resolution of the simulation grid and of the meteorology inputs on the air quality impact estimates due to aircraft emissions, specifically in the context of stretched gnomonic cubed-sphere grids for the simulation of a specific area was conducted. Such grids allow for the possibility of having a region with finer grid elements while coarsening the grid outside a specified area.

The research questions that the present research effort aims to address are: which parameter (grid resolution or meteorology resolution) impacts most the simulations, how grid and meteorology resolution impact air quality estimates, and whether stretched grids can be used for regional simulations.

To address the matter, we use the distributed-memory, high-performance version of the GEOS-Chem atmospheric chemistry-transport model to simulate the evolution of aviation attributable to Landing and Take-Off operations (LTO) emissions throughout the year of 2019. The LTO emissions were obtained from the OpenAVEM emissions inventory, whereas the remaining non-aviation emissions were taken from the default GCHP databases.

Three different grid resolutions were chosen to evaluate the impact of the horizontal grid resolution: C24, C36, and C48, with grid cell lengths ranging between 40 km, 30 km, and 20 km, respectively. All grids use the same stretch parameters, i.e., target latitude, target longitude, and stretch factor. These parameters were set so as to have a finer resolution around Europe. For the meteorology sensitivity, two resolutions were used, 2 ° ×2.25 ° and 0.5 ° ×0.625 ° from MERRA2 for the three grid resolutions aforementioned.

A comparison between the area weighted concentrations for NO2, PM2.5, and O3 showed that the resolution of the meteorology plays a more important role than the horizontal grid resolutions, for the resolutions tested. For the human health impacts, the deaths attributable to each component have also been estimated and compared for each grid resolution.

How to cite: Kavabata, L., Quadros, F., Meijer, V., Snellen, M., and Dedoussi, I.: Horizontal grid and meteorology resolution impacts on aviation’s air quality impacts, EGU General Assembly 2026, Vienna, Austria, 3–8 May 2026, EGU26-15593, https://doi.org/10.5194/egusphere-egu26-15593, 2026.

EGU26-17672 | ECS | Posters virtual | VPS3

Numerical modeling of tropospheric chemistry in an Earth System Model 

Arina Okulicheva, Margarita Tkachenko, and Sergey Smyshlyaev

Abstract. This work presents the incorporation of a tropospheric isoprene oxidation scheme into an Earth System Model to enhance the simulation of tropospheric ozone levels. Numerical experiments were performed using two distinct model setups: one accounting for isoprene oxidation and another in which this chemical pathway was not considered.

Keywords: Isoprene, tropospheric ozone, atmospheric chemistry, MIM1 mechanism

Understanding the processes of tropospheric ozone formation is of key importance both for the development of air quality control measures and for climate prediction, especially under conditions of changing anthropogenic and biogenic emissions. While on the global scale the production of tropospheric ozone is primarily governed by the oxidation of carbon monoxide and methane, in densely populated and industrial regions non-methane volatile organic compounds (NMVOCs) become the dominant contributors. Among these NMVOCs, isoprene plays a particularly important role, with the majority of its atmospheric emissions originating from vegetation.

The aim of this study is to further develop the INM RAS–RSHU chemical–climate model [1], which is a component of the Earth System Model (ESM), with an emphasis on a more accurate representation of tropospheric chemical processes. The primary focus is on the implementation of an improved chemical mechanism designed to enhance the accuracy of simulated concentrations of key atmospheric gaseous components. One of the main criteria in selecting the mechanism is achieving an optimal balance between the level of chemical detail and the computational efficiency of the model.

As part of the model development, a comparative analysis of several widely used chemical mechanisms was performed, including the Mainz Isoprene Mechanism (MIM1) [2], comprising 16 species and 44 reactions; MIM2, with 69 species and 178 reactions [3]; the Model for Ozone and Related Chemical Tracers (MOZART), including 151 species and 287 reactions [4]; and the Regional Atmospheric Chemistry Mechanism (RACM), which includes more than 100 species and 363 reactions [5]. Based on the results of this analysis, the MIM1 mechanism was considered the most appropriate for initial implementation in the ESM, as it was decided to begin with the most compact option while still providing sufficient accuracy in representing key tropospheric chemical processes.

To assess the impact of the MIM1 mechanism, two numerical experiments were conducted using identical model settings and boundary conditions. In the control simulation, a basic tropospheric chemistry scheme without isoprene was applied, whereas the MIM1 experiment implemented the full isoprene oxidation mechanism, including 44 chemical reactions.

 The study and the set of numerical experiments are aimed at optimizing the chemical component of the INM RAS–RSHU chemical–climate model in order to improve the accuracy of representing tropospheric processes while maintaining high computational efficiency. The obtained results provide a solid basis for further investigation of the interactions between chemical and dynamical processes in the atmosphere and will contribute to the development of approaches for forecasting atmospheric composition and its impact on regional and global climate change.

How to cite: Okulicheva, A., Tkachenko, M., and Smyshlyaev, S.: Numerical modeling of tropospheric chemistry in an Earth System Model, EGU General Assembly 2026, Vienna, Austria, 3–8 May 2026, EGU26-17672, https://doi.org/10.5194/egusphere-egu26-17672, 2026.

EGU26-19003 | ECS | Posters virtual | VPS3

Modelling the transport of ablated space debris particles in the atmosphere 

Saskia Hawkins, Jo Egan, John Plane, Daniel Marsh, and Wuhu Feng

The influx of anthropogenic metals into the atmosphere is expected to increase substantially due to the rapid growth of the space industry. More than 20 elements from re-entering spacecraft have been identified in sulphuric acid droplets in the Junge layer, with several estimated to surpass the background level from cosmic dust. While the atmospheric impact of these particles is uncertain, they have been widely hypothesised, including ozone destruction, increased polar stratospheric cloud formation, harmful surface deposition, a perturbed radiative balance and in turn, changes to global circulation.

The spacecraft ablation process and subsequent formation of space debris particles (SDPs) are not well defined. The dominant constituent of spacecraft is aluminium. If vaporised, aluminium is expected to undergo a series of reactions to form aluminium hydroxide (Al(OH)3). The initial form and size of the particles will strongly influence the coagulation, global transport, and atmospheric lifetime of the particles. Constraining these factors is vital to accurately assessing the impact SDPs have on the atmosphere.

This work provides an update on the work presented at EGU2025 (Egan et al., Modelling impacts of ablated space debris on atmospheric aerosols, EGU25-4460), using the Whole Atmosphere Community Climate Model with the Community Aerosol and Radiation Model for Atmospheres (WACCM-CARMA) to simulate the production and transport of SDPs. This work investigates the sensitivity of the initial particle radius to the transport, lifetime and surface deposition of particles.

How to cite: Hawkins, S., Egan, J., Plane, J., Marsh, D., and Feng, W.: Modelling the transport of ablated space debris particles in the atmosphere, EGU General Assembly 2026, Vienna, Austria, 3–8 May 2026, EGU26-19003, https://doi.org/10.5194/egusphere-egu26-19003, 2026.

Solid fuels such as fuelwood (FW), coal balls (CB), dung cake (DC), and agricultural residue (AR) are widely used for domestic heating and cooking in developing countries, particularly in rural and peri-urban regions. Combustion of these fuels is a major source of carbon-based gaseous emissions, notably carbon monoxide (CO) and carbon dioxide (CO2), contributing to indoor air pollution, adverse health effects, and climate change. The emission characteristics of these gases are strongly influenced by fuel moisture content, elemental composition, and inorganic constituents. This study presents the development of emission factors (EFs) for CO and CO2 from commonly used solid fuels and evaluates materials-based mitigation strategies using a laboratory-designed fixed-bed reactor system with a combustion chamber simulating real-world burning conditions.

Fuel samples were collected from representative domestic sources, air-dried, pulverized, and homogenized prior to analysis. Moisture content was determined gravimetrically by oven drying at 105 °C. Ultimate analysis of carbon (C), hydrogen (H), nitrogen (N), sulfur (S), and oxygen (O) was performed using a CHNS/O elemental analyzer, while anionic and cationic species were quantified using ion chromatography. Combustion experiments for emission factor development were conducted in a custom-designed fixed-bed reactor equipped with a controlled burning chamber to simulate domestic heating conditions. The reactor enabled stable combustion, controlled airflow, and downstream integration of mitigation materials for post-combustion treatment of exhaust gases. It also includes real-gas cylinders to generate the gas mixture representing smoke.

The results revealed notable variability in fuel composition and emission behavior. FW exhibited relatively efficient combustion with lower CO emissions, while DC, with higher moisture and lower carbon content, produced higher CO levels. CB showed high CO emissions despite its carbon content, whereas AR displayed intermediate emission characteristics. Elevated levels of alkali metals and anions, particularly in DC, were associated with reduced combustion efficiency and increased CO formation.

The hazards of these gases demands for removal. In this study, removal experiments were carried out by integrating advanced functional materials into the exhaust section of the fixed-bed reactor. Porous and nanostructured materials such as graphene-based materials, biochar, graphitic carbon nitride (g-C3N4), zeolites, metal–organic frameworks (MOFs), covalent organic frameworks (COFs), and silica-based materials were evaluated for CO oxidation and CO2 capture. Material characterization using Brunauer–Emmett–Teller (BET) surface area analysis, scanning electron microscopy (SEM), Fourier transform infrared spectroscopy (FTIR), and X-ray diffraction (XRD) confirmed high specific surface area, well-developed porous structures, and the presence of reactive surface functional groups, which directly enhance adsorption and catalytic conversion of carbonaceous gases.

Overall, the study demonstrates that fuel chemical composition and combustion conditions strongly influence CO and CO2 emission factors from domestic heating activities. The integration of a designed fixed-bed reactor with a burning chamber and advanced materials-based mitigation strategies provides a robust experimental framework for reducing carbon-based emissions and improving air quality in regions dependent on traditional solid fuels.


How to cite: Sahu, D. and Pervez, S.: Emission of Carbon Monoxide (CO) and Carbon Dioxide (CO2) from Household Solid Fuels Burning Practices: Development of Real World Emission Factor and Removal Methods, EGU General Assembly 2026, Vienna, Austria, 3–8 May 2026, EGU26-20738, https://doi.org/10.5194/egusphere-egu26-20738, 2026.

Field-based observations of Carbon dioxide (CO₂) exchange between soils and atmosphere are critical to accurately account for terrestrial carbon cycling in data-scarce West African savanna ecosystems. This study quantified soil CO₂ fluxes over two consecutive years (2023–2024) using a static chamber approach across four contrasting land-use systems namely forest, grassland, cropland, and rice fields. Measurements were conducted on weekly basis using replicated chambers to assess both spatial heterogeneity and interannual variability. Soil CO₂ fluxes were analysed in relation to key environmental drivers, including water-filled pore space (WFPS) and soil temperature, using mixed-effects statistical models to account for repeated chamber measurements. Across all land uses, CO₂ emissions increased markedly in 2024 compared to 2023. Median seasonal CO₂ fluxes ranged from 0.59 to 1.46 t C ha⁻¹ season⁻¹ in forest systems, 1.91 to 5.07 t C ha⁻¹ season⁻¹ in grasslands, 1.75 to 5.09 t C ha⁻¹ season⁻¹ in croplands, and 1.84 to 2.61 t C ha⁻¹ season⁻¹ in rice fields. Grasslands and croplands consistently exhibited the highest CO₂ emissions, with maximum values reaching 7.18 and 5.38 t C ha⁻¹ season⁻¹, respectively, highlighting the strong influence of land management and disturbance intensity. Forest soils showed comparatively lower CO₂ fluxes, reflecting reduced soil disturbance and more stable microclimatic conditions. Statistical analyses revealed that soil temperature was a dominant driver of CO₂ emissions across all ecosystems, while soil moisture exerted a secondary but significant control, particularly in managed systems. Higher WFPS and elevated soil temperatures during the wet season were associated with enhanced CO₂ release, indicating intensified microbial respiration and root activity. Interannual contrasts suggest that wetter and warmer conditions in 2024 amplified soil respiration across all land uses. Overall, our results demonstrate pronounced spatial and temporal variability in soil CO₂ fluxes in the Sudanian savanna and underscore the sensitivity of carbon emissions to land-use change and hydro-climatic variability. These findings provide critical baseline data for improving regional carbon budgets and for informing mitigation strategies in data-scarce tropical savanna regions.

How to cite: Oussou, F. E. and the WASCAL CONCERT Team: Assessing Spatial and temporal heterogeneity of Soil Carbon emissions across anthropized land use Gradient in the Sudanian savanna, EGU General Assembly 2026, Vienna, Austria, 3–8 May 2026, EGU26-21511, https://doi.org/10.5194/egusphere-egu26-21511, 2026.

EGU26-21709 | ECS | Posters virtual | VPS3

Greenhouse gas emissions and socio-environmental costs of anthropogenic fires in Tucumán (Argentina): A remote sensing and environmental economics approach 

Facundo Reynoso Posse, Juan Pablo Zbrun Luoni, and Mariela Aguilera Sammaritano

Anthropogenic fires linked to the burning of agricultural biomass residues represent a recurring environmental disturbance in the province of Tucumán, northwest Argentina. These events are predominantly associated with land clearing and post-harvest burning in sugarcane fields concentrated in the region’s lowland plains, where agro-industrial activity is most intense. Such practices contribute significantly to greenhouse gas (GHG) emissions, vegetation degradation, and a range of socio-economic impacts. This study integrates satellite-derived fire indices with environmental economic tools to quantify the spatial and temporal effects of fire over the past five years (2021–2025) and assess their implications for climate change mitigation and policy.

Multispectral data from Sentinel‑2 and atmospheric composition products from Sentinel‑5P were processed via Google Earth Engine to calculate vegetation and fire severity indices including NDVI, dNBR, and BAI. Additionally, tropospheric CO and CO₂ concentrations were used to evaluate atmospheric impacts. The spatial distribution of fire activity—primarily in the eastern and southern lowlands—was cross-referenced with the Global Fire Emissions Database (GFED) and IPCC Tier 1 emission factors to estimate fire-related GHG emissions. Preliminary analyses indicate an average of 45,000 ha affected annually, mainly in sugarcane-dominated landscapes, resulting in estimated emissions of approximately 382,500 t CO₂-equivalent per year.

To evaluate broader socio-environmental impacts, economic losses were estimated across multiple dimensions: reduced land productivity, costs of ecosystem restoration, loss of ecosystem services (e.g. carbon sequestration, water retention), and public health expenses related to degraded air quality. Additional indirect impacts include traffic accidents due to smoke-induced low visibility and recurring property damage reported in local media. These preliminary estimates suggest combined annual damages of approximately USD 46.5 million, underscoring the considerable burden imposed by current fire management practices.

It is important to note that this work presents ongoing research, and all results are preliminary. The estimates provided will be further refined through continued integration of field data, emission modeling, and economic valuation methods.

This integrative approach demonstrates the value of combining Earth observation technologies with environmental economics to support climate-oriented decision-making. By quantifying the environmental and economic impacts of anthropogenic fires, this study provides critical evidence for the development of cross-sectoral policies aimed at regulating biomass burning, improving land management practices, and strengthening resilience to climate risks. The case of Tucumán underscores the urgent need for sustainable alternatives to current residue management practices and for aligning agricultural production with mitigation goals.

How to cite: Reynoso Posse, F., Zbrun Luoni, J. P., and Aguilera Sammaritano, M.: Greenhouse gas emissions and socio-environmental costs of anthropogenic fires in Tucumán (Argentina): A remote sensing and environmental economics approach, EGU General Assembly 2026, Vienna, Austria, 3–8 May 2026, EGU26-21709, https://doi.org/10.5194/egusphere-egu26-21709, 2026.

EGU26-21713 | ECS | Posters virtual | VPS3

Evaluation of new polarimetric products 

Kalliopi Artemis Voudouri, Alexandra Tsekeri, Andreas Karipis, Pavel Litvinov, Anton Lopatin, Oleg Dubovik, Otto Hasekamp, and Vassilis Amiridis

The new satellite missions including active sensors (e.g. EarthCare), passive multi-angular polarimeters (e.g. PACE/SPEXone, PACE/HARP-2) and single-viewing instruments (e.g. OLCI), together with synergies among existing sensors, are foreseen to characterize aerosols and clouds with high accuracy. However, robust validation activities are essential to ensure the quality of the new satellite products.

In this study, we focus on the evaluation of the aerosol optical properties synergistically retrieved from three sensors, i.e., TROPOMI, OLCI-A, and OLCI-B, within the framework of the AIRSENSE ESA project (https://www.grasp-earth.com/portfolio/airsense/). The derived optical properties include the aerosol optical depth (AOD), Ångström exponent (AE), coarse- and fine-mode AOD, and single-scattering albedo (SSA). Validation is performed against ground-based sun-photometer observations from five ACTRIS/AERONET stations across Europe (https://aeronet.gsfc.nasa.gov/). The results show good agreement for AOD with root-mean-square errors (RMSE) ranging from 0.006 to 0.09. In contrast, AE and SSA show lower agreement, with RMSE values of 0.27 and 0.02, respectively, at the Limassol station, even when quality flags are applied.

Moreover, we evaluate the aerosol properties retrieved using PACE/SPEXone observations. PACE (Plankton, Aerosol, Cloud, and ocean Ecosystem) mission was launched in February 2024 and employs advanced passive polarimetric observations to enhance the aerosol characterization. In addition to aerosol optical properties (e.g., AOD, AE) the PACE/SPEXone products generated within the framework of AIRSENSE, include the aerosol layer height (ALH), a parameter that is critical for quantifying aerosol-cloud interactions. Since EarthCARE/ATLID provides vertically resolved aerosol profiles, it offers an independent reference for the assessment of ALH. Here, we present first comparison results of the PACE/SPEXone ALH product over the ocean, produced with two algorithms, RemoTAP and FastMAPOL, compared to EarthCARE/ATLID weighted backscatter heights. Overall, RemoTAP ALH products are systematically lower than those derived from EarthCARE/ATLID, whereas FastMAPOL retrieves a larger number of ALH estimates but exhibits lower overall agreement with the EarthCARE/ATLID reference. As a next step, we intend to expand the area of interest and increase the number of collocations.


Acknowledgements:

This research is financially supported by the PANGEA4CalVal project (Grant Agreement 101079201) funded by the European Union  and the AIRSENSE (Aerosol and aerosol cloud Interaction from Remote SENSing Enhancement) project, funded by the European Space Agency under Contract No. 4000142902/23/I-NS.

How to cite: Voudouri, K. A., Tsekeri, A., Karipis, A., Litvinov, P., Lopatin, A., Dubovik, O., Hasekamp, O., and Amiridis, V.: Evaluation of new polarimetric products, EGU General Assembly 2026, Vienna, Austria, 3–8 May 2026, EGU26-21713, https://doi.org/10.5194/egusphere-egu26-21713, 2026.

EGU26-21851 | ECS | Posters virtual | VPS3

Cloud typing and microphysics: An EarthCARE-Cloudnet Comparison 

Ioanna Tsikoudi, Eleni Marinou, Lukas Pfeitzenmaier, Shannon Mashon, Ewan O'Connor, Dimitra Karkani, Andreas Karipis, Kalliopi Artemis Voudouri, Pavlos Kollias, Bernat Puigdomenech Treserras, and Alessandro Battaglia

This work evaluates EarthCARE cloud products against ground-based Cloudnet retrievals at multiple sites in Europe. We focus on the comparison between the EarthCARE synergetic target classification product (AC-TC), with the Cloudnet target classification product, both derived from the synergy of lidar/radar measurements. As the two classifications have different aerosol/cloud types, a new common classification with the following classes is defined and used for direct comparison: Unknown, Clear, Liquid (Droplets T>0°C), Supercooled Liquid (Droplets T<0°C), Drizzle or rain, Drizzle & droplets, Ice, Ice & droplets, Melting ice possibly coexisting with droplets, Insects, Aerosol. Each AC-TC or Cloudnet target is assigned with a new class. Spatiotemporal collocation criteria are considered, along with visual inspection of the collocated scenes, to limit the dataset in homogenous scenes where the satellite and suborbital platform has detected similar clouds. Additionally, retrieved ice and liquid water cloud contents from Cloudnet and EarthCARE are compared to evaluate cloud microphysical properties. Τhe geographical diversity of the Cloudnet network, provides the advantage of investigating different atmospheric conditions in terms of clouds and aerosols, with abundant ice cloud occurrences in the northern sites and frequent liquid water clouds at the southern sites. This analysis aims to assess the consistency of cloud categorization and microphysical retrievals between the satellite and suborbital measurements, and to investigate the strengths and limitations of both approaches.

How to cite: Tsikoudi, I., Marinou, E., Pfeitzenmaier, L., Mashon, S., O'Connor, E., Karkani, D., Karipis, A., Voudouri, K. A., Kollias, P., Treserras, B. P., and Battaglia, A.: Cloud typing and microphysics: An EarthCARE-Cloudnet Comparison, EGU General Assembly 2026, Vienna, Austria, 3–8 May 2026, EGU26-21851, https://doi.org/10.5194/egusphere-egu26-21851, 2026.

EGU26-23052 | ECS | Posters virtual | VPS3

CALIPSO validation of an apparent MODIS AOD spike over the Central Himalayas (2011) 

Abidina Bello, Anshuman Bhardwaj, and Lydia Sam

Remote sensing of aerosol variability over the Central Himalayas remains challenging because of complex terrain, strong elevation gradients in surface reflectance, and frequent cloud and snow contamination, which can bias passive aerosol optical depth (AOD) retrievals. In this study, we examine an apparent MODIS-derived AOD enhancement in 2011 over the Central Himalayas that deviates from the expected seasonal pattern of reduced aerosol loading during the monsoon and post-monsoon periods. The central objective is to determine whether this apparent anomaly represents a physically meaningful aerosol enhancement or is influenced by retrieval limitations in high-relief environments. We evaluate the MODIS anomaly using collocated CALIPSO observations, including vertically resolved aerosol extinction profiles and aerosol-layer optical depths. CALIPSO measurements show no evidence of persistently elevated aerosol layers corresponding to the MODIS enhancement, and aerosol extinction remains vertically shallow, indicating that the observed AOD anomaly is not associated with strong free-tropospheric aerosol intrusion. These results suggest that the apparent MODIS “spike” likely reflects a column-integrated enhancement dominated by near-surface aerosol and/or terrain–cloud–snow-related retrieval effects rather than a sustained elevated aerosol event. This study highlights the importance of integrating active lidar profiling with passive satellite retrievals to improve the interpretation of aerosol anomalies over mountainous regions and strengthens the basis for aerosol–cloud interaction assessments in the Himalayas.

How to cite: Bello, A., Bhardwaj, A., and Sam, L.: CALIPSO validation of an apparent MODIS AOD spike over the Central Himalayas (2011), EGU General Assembly 2026, Vienna, Austria, 3–8 May 2026, EGU26-23052, https://doi.org/10.5194/egusphere-egu26-23052, 2026.

EGU26-23274 | Posters virtual | VPS3

First two years of TEMPO nitrogen dioxide and formaldehyde observations:algorithm status and highlights 

Gonzalo Gonzalez Abad, Caroline R. Nowlan, Kelly Chance, Xiong Liu, Heesung Chong, Zachary Fasnacht, David E. Flittner, Masoud Ghahremanloo, Barron Henderson, Weizhen Hou, John Houck, Laura Judd, K. Emma Knowland, Viral Shah, Pamela Wales, Wenhan Qin, Lukas Valin, and Huiqun Wang

Tropospheric Emissions: Monitoring of Pollution (TEMPO) is observing air quality and
atmospheric composition over North America from a geostationary orbit since its operations
started in August 2023. TEMPO observes the continent every 40 to 60 minutes at a spatial
resolution on the order of ~ 2 x 4.5 km 2 . Together with the Geostationary Environment
Monitoring Spectrometer (GEMS, launch 2020) monitoring Asia and the Sentinel-4/UVN
(launch 2025) monitoring Europe, TEMPO is part of the current global constellation of
geostationary sensors devoted to the observation of air quality. Like GEMS and Sentinel-4/UVN,
TEMPO uses backscattered ultraviolet and visible solar radiation to retrieve atmospheric
amounts of key trace gases and aerosols associated with air quality and atmospheric chemistry.
Among the species retrieved from TEMPO observations of nitrogen dioxide and formaldehyde
are important to understand emissions and atmospheric chemistry, including the formation and
destruction of tropospheric ozone.

After multiple version updates over the first two years of the mission, the TEMPO Level 2 NO 2
and HCHO products have undergone significant enhancements to improve the performance and
accuracy of the slant column retrievals, air mass factor calculations and post-processing
corrections including destriping for NO 2 and background for HCHO. We illustrate the
performance of both retrievals (version 3 & 4), evaluating their fitting uncertainty and showing

comparisons with independent correlative measurements and other satellite products showcasing
small noise levels and remarkable accuracy with well quantified biases. We continue by
illustrating the capacity of TEMPO products focusing on different case studies showing
TEMPO’s high temporal and spatial resolution. We finalize discussing aspects of the retrieval
subject to improvement and our plans to address them.

How to cite: Gonzalez Abad, G., Nowlan, C. R., Chance, K., Liu, X., Chong, H., Fasnacht, Z., Flittner, D. E., Ghahremanloo, M., Henderson, B., Hou, W., Houck, J., Judd, L., Knowland, K. E., Shah, V., Wales, P., Qin, W., Valin, L., and Wang, H.: First two years of TEMPO nitrogen dioxide and formaldehyde observations:algorithm status and highlights, EGU General Assembly 2026, Vienna, Austria, 3–8 May 2026, EGU26-23274, https://doi.org/10.5194/egusphere-egu26-23274, 2026.

EGU26-23276 | ECS | Posters virtual | VPS3

The Status of the TEMPO Total-Ozone and Ozone-Profile Algorithm: V04 Updates and Comprehensive Evaluations 

Junsung Park, Xiong Liu, Juseon Bak, Heesung Chong, Kelly Chance, Weizhen Hou, John Houck, Gonzalo González Abad, Caroline R. Nowlan, Huiqun Wang, Kai Yang, Lawrence E. Flynn, David P. Haffner, David E. Flittner, K. Emma Knowland, Matthew Johnson, Mary Angelique G. Demetillo, Robert Spurr, Can Li, and Xiaoyi Zhao and the TEMPO Validation Team and NASA's GMAO Team

The Tropospheric Emissions: Monitoring of Pollution (TEMPO) mission is part of a global constellation of geostationary satellites, along with GEMS and Sentinel-4, dedicated to monitoring air quality across the Northern Hemisphere. TEMPO is the first geostationary satellite instrument to monitor air pollutants over North America on an hourly basis at nearly neighborhood-scale resolution, covering an area from Mexico City to the Canadian oil sands and from the Atlantic to the Pacific Ocean.TEMPO measures backscattered ultraviolet and visible radiation to observe several trace gases important to air quality, including ozone, nitrogen dioxide, and formaldehyde, with observations every 40–60 minutes and at a high spatial resolution of approximately 2 × 4.75 km². TEMPO was successfully launched in April 2023 and began nominal operations in October 2023. Since then, it has been continuously monitoring atmospheric pollutants across its observation domain.
This presentation summarizes the Version 4 (V04) updates and improvements to the TEMPO total-ozone (O3TOT) and ozone-profile (O3PROF) retrieval algorithms. This presentation also presents the evaluation of the upcoming V04 TEMPO O3TOT product through comparisons of total ozone columns (TOCs) with measurements from other satellite instruments (e.g., OMPS and TROPOMI) and ground-based instruments, including Pandora, Brewer, and Dobson spectrometers. The V04 TEMPO O3PROF algorithm, which is UV-only, is validated through comparisons of ozone profiles, tropospheric ozone, and 0–2 km ozone columns with those from the Tropospheric Ozone Lidar Network (TOLNet) and aircraft observations, as well as through validation with MLS, EPIC, TROPOMI, and OMI observations.

How to cite: Park, J., Liu, X., Bak, J., Chong, H., Chance, K., Hou, W., Houck, J., Abad, G. G., Nowlan, C. R., Wang, H., Yang, K., Flynn, L. E., Haffner, D. P., Flittner, D. E., Knowland, K. E., Johnson, M., Demetillo, M. A. G., Spurr, R., Li, C., and Zhao, X. and the TEMPO Validation Team and NASA's GMAO Team: The Status of the TEMPO Total-Ozone and Ozone-Profile Algorithm: V04 Updates and Comprehensive Evaluations, EGU General Assembly 2026, Vienna, Austria, 3–8 May 2026, EGU26-23276, https://doi.org/10.5194/egusphere-egu26-23276, 2026.

EGU26-130 | ECS | Posters virtual | VPS4

Field-Calibrated Low-Cost Sensor Networks for PM2.5 Monitoring in West African Urban Environments: Insights from Abidjan and Accra 

Julien Bahino, Michael Giordano, Matthias Beekmann, Subramanian Ramanchandran, and Véronique Yoboué

Low-cost air quality sensors (LCS) offer opportunities for expanding air monitoring networks in regions where reference-grade instrumentation is limited. Within the framework of the Improving Air Quality in West Africa (IAQWA) project, we deployed Real-time Affordable Multi-Pollutant sensors (RAMPs) in Abidjan (Côte d'Ivoire) and Accra (Ghana), to characterize fine particulate matter (PM2.5) in contrasting urban environments. Prior to field deployment, each RAMP underwent a co-location period with reference monitors, and city-specific multilinear calibration models were developed incorporating both RAMP-reported PM2.5 and relative humidity (RH). These calibration models were applied to correct the sensor data and improve measurement reliability under varying atmospheric conditions.

From February 2020 to June 2021, five (5) measurement sites in Abidjan and four (4) sites in Accra were monitored using a 15-second temporal resolution. These sites were selected to represent the dominant pollution sources in West Africa, particularly domestic fires and road traffic. The calibrated dataset enabled comparative analysis of diurnal, daily, and seasonal PM2.5 variability. Both cities exhibited pronounced morning PM2.5 peaks associated with traffic, while evening increases were more visible in residential areas, indicating contributions from domestic combustion. Seasonal contrasts were marked, with highest concentrations occurring during the long dry season (Harmattan), when long-range Saharan dust transport significantly enhanced particulate loading. During an intense dust episode in January 2021, calibrated RAMP data underestimated PM2.5 relative to reference measurements, highlighting a known limitation of optical LCS under high mineral dust conditions.

Annual mean PM₂.₅ concentrations ranged from 17 to 26 µg m-3 across sites, exceeding both the 2005 and 2021 WHO air quality guidelines. Variability within each city, especially between traffic-influenced and urban background locations, was greater than variability between the two cities. These findings demonstrate both the value of rigorously calibrated low-cost sensors for improving air quality knowledge in data-scarce urban regions, and the need for sensor performance considerations in environments influenced by episodic dust intrusions.

How to cite: Bahino, J., Giordano, M., Beekmann, M., Ramanchandran, S., and Yoboué, V.: Field-Calibrated Low-Cost Sensor Networks for PM2.5 Monitoring in West African Urban Environments: Insights from Abidjan and Accra, EGU General Assembly 2026, Vienna, Austria, 3–8 May 2026, EGU26-130, https://doi.org/10.5194/egusphere-egu26-130, 2026.

Harmful Algal Blooms (HABs) represent a growing threat to marine ecosystems, aquaculture, and public health in the Central Eastern Arabian Sea (CEAS). This study utilized 18S rRNA metabarcoding to characterize the absolute abundance and community composition of potentially toxigenic diatoms and dinoflagellates in the coastal waters of Goa. The analysis reveals a distinct and alarming prevalence of multiple genera associated with diverse toxin syndromes.

The dataset was dominated by a massive proliferation of the dinoflagellate Karenia (linked to Neurotoxic Shellfish Poisoning and ichthyotoxicity), which reached extreme abundances exceeding 51,000 reads per sample at the most impacted sites. Co-occurring with this bloom, spatially distinct hotspots of Paralytic Shellfish Toxin (PST) producers were identified, specifically Alexandrium and Gymnodinium spp., with Alexandrium counts peaking at over 5,200 reads. Notably, the potent PST producer Alexandrium tamiyavanichii was positively identified, alongside detections of Gymnodinium catenatum.

The diatom community also exhibited significant toxicity potential; the Amnesic Shellfish Poisoning (ASP) genus Pseudo-nitzschia displayed high relative abundance (up to ~3,700 reads), including the presence of P. pungens. Furthermore, vectors for Diarrhetic Shellfish Poisoning (DSP), including Dinophysis spp. and Phalacroma rotundatum, and Yessotoxin producers (Lingulodinium polyedra, Gonyaulax spinifera) were ubiquitously present at lower background levels.

These findings highlight a complex, multi-risk scenario where ASP, PSP, NSP, and DSP vectors coexist within the same coastal system. The distinct spatial separation observed between peak Karenia, Alexandrium, and Pseudo-nitzschia events suggests that heterogeneous environmental drivers are influencing specific HAB assemblages. This data underscores the critical need for broad-spectrum toxin monitoring beyond single-species surveillance in the region.

How to cite: Zedi, S. and Khandeparker, R.: Hidden Hazards in the Central Eastern Arabian Sea: Metabarcoding Reveals Co-occurrence of ASP, PSP, and NSP Vectors in the Coastal Waters of Goa, EGU General Assembly 2026, Vienna, Austria, 3–8 May 2026, EGU26-414, https://doi.org/10.5194/egusphere-egu26-414, 2026.

EGU26-2796 | ECS | Posters virtual | VPS4

Investigating the formation mechanisms of hydroxyl dicarboxylic acids based on machine learning 

Hongyong Li and Xiaopu Lyu

Secondary organic aerosol (SOA) has been shown to significantly impact climate, air quality, and human health. Hydroxyl dicarboxylic acids (OHDCA) are generally of secondary origin and ubiquitous in the atmosphere, with high concentrations in South China. This study explored the formation of representative OHDCA species based on time-resolved measurements and explainable machine learning. Malic acid, the most commonly studied OHDCA, had higher concentrations in the noncontinental air (63.7 ± 33.3 ng m–3) than in the continental air (7.5 ± 1.4 ng m–3). Machine learning quantitatively revealed the high relative importance of aromatics and monoterpenes SOA, as well as aqueous processes, in the noncontinental air, due to either shared precursors or similar formation pathways. Isoprene SOA, particle surface area, and ozone corrected for titration loss (Ox) also elevated the concentrations of malic acid in the continental air. Aqueous photochemical formation of malic acid was confirmed given the synergy between LWC, temperature, and Ox. Moreover, the OHDCA-like SOA might have facilitated a relatively rare particle growth from early afternoon to midnight in the case with the highest malic acid concentrations. This study enhances our understanding of the formation of OHDCA and its climate impacts.

How to cite: Li, H. and Lyu, X.: Investigating the formation mechanisms of hydroxyl dicarboxylic acids based on machine learning, EGU General Assembly 2026, Vienna, Austria, 3–8 May 2026, EGU26-2796, https://doi.org/10.5194/egusphere-egu26-2796, 2026.

EGU26-5792 | ECS | Posters virtual | VPS4

Sector-segregated anthropogenic impacts on PM2.5 over western India based on regional air quality modeling 

Shashank Shekhar, Shubham Dhaka, Aditya Vaishya, Narendra Ojha, Andrea Pozzer, and Amit Sharma

Air quality over western India is impacted by both regional emissions and transport from the Indo-Gangetic Plain (IGP). Effective mitigation requires identifying the dominant emission sectors that govern regional air quality during different seasons. In this regard, the present study examines the impact of emissions from major anthropogenic sectors (power, residential, transport and industries) on ambient fine particulate matter (PM2.5)concentrations over the western Indian region. For this, high-resolution (12km x 12km) regional model (WRF-Chem v3.9.1) simulations have been conducted using the EDGAR v5.0 inventory for anthropogenic emissions. Simulations are conducted for the year 2019, for winter and post-monsoon seasons when PM2.5 concentrations are typically elevated in this region, and anthropogenic emissions effects are the highest. During winter, the residential sector is seen to dominate, contributing 20% to PM2.5 concentration over western India, followed by power (9%) and industry (∼8%). The trans-regional pollution from the IGP and central India is also dominated by residential emissions (25%), followed by the power sector (∼8%). In contrast to winter, the dominant source during post-monsoon is the power sector (∼14%), followed by the industry (∼12%) and the residential (∼9%) sectors. Trans-regional impact also shows a similar pattern and dominance of power (∼15%) and industrial (∼10%) sectors. This seasonal shift in the dominant sector is driven by the seasonal variation in emissions. The results also reveal large spatial heterogeneity in sectoral influence, highlighting that dominant emission sources vary at the local scale within western India in both seasons. The study offers model-based insights for more effective planning of regional air pollution mitigation in western India.

How to cite: Shekhar, S., Dhaka, S., Vaishya, A., Ojha, N., Pozzer, A., and Sharma, A.: Sector-segregated anthropogenic impacts on PM2.5 over western India based on regional air quality modeling, EGU General Assembly 2026, Vienna, Austria, 3–8 May 2026, EGU26-5792, https://doi.org/10.5194/egusphere-egu26-5792, 2026.

EGU26-6264 | Posters virtual | VPS4

Estimating Size-Resolved Lung Deposition Doses of Particulate Matter (PM) Using Low-Cost Sensor Data in Rural India 

Karthiga Devi Sai Ganesan, Naveen Puttaswamy, Saritha Sendhil, Durairaj Natesan, Rengaraj Ramasami, Manish Desai, Ajay Pillarisetti, Sreekanth Vakacherla, Rashmi Krishnan, Sankar Sambandam, Padmavathi Ramaswamy, and Kalpana Balakrishnan

 Background and Objective

Exposures to fine and ultrafine particles (i.e., PM2.5 and PM1) are widely accepted as a major environmental risk factor and is known to cause adverse human health outcomes. Most epidemiological research as well as regulatory frameworks rely on using PM2.5 as the ‘reference’ exposure metric to assess health risks. However, this approach does not adequately quantify size-specific PM effects that are critical for dose-based health assessments. Size-segregated particulate matter assessment of exposures and effects are limited in resource-limited settings. The objective of this study is to estimate lung deposition doses for size-fractionated PM measured using low-cost sensors.

Methods

We utilized the data obtained from an ongoing study conducted in South Indian villages. Here, the household energy use is dominated by biomass combustion and the adoption of cleaner cooking fuels like liquefied petroleum gas (LPG) is relatively low. Ambient PM measurements were carried out continuously over a period of 1 year in 80 rural households in southern India, using real-time, optical, low-cost PM sensors. In order to capture the household-level exposure characteristics, indoor PM measurements were also carried out in a subset of households. Minute averaged, PM mass concentrations in three discrete size fractions: PM₁, PM₂.₅ and PM₁₀ were provided by the low-cost sensors.  The temporal variability in PM concentrations was derived using the time-series data obtained from the sensors. Daily and monthly mean concentrations captured the short-term exposure peaks as well as day to day variability.

Results  

A mathematical model using a non-linear least squares method was developed to transform the measured PM concentrations into a continuous size distribution. Respiratory deposition doses were estimated by feeding the size distribution to a computational model of the lung designed to simulate the spatial and temporal distribution of particles within the human respiratory system, incorporating various deposition models. The estimates of deposition doses ranged from ~0.2µg/min to ~1µg/min in the total lung. The coarse particles contributed to about 20% of the total lung dose, whereas the remaining 80% of the respiratory dose was predominantly of fine and ultrafine particles.

Conclusions

This study demonstrates that physiologically relevant, size-fractioned lung deposition doses can be estimated using limited size-bin data obtained from low-cost sensors. Since low-cost air quality monitoring networks are critical in regions that lack regulatory-grade instrumentation, the proposed analytical framework provides a benchmark for translating low-cost sensor-based air pollution measurements into relevant health-based dose metrics. The proposed analytical framework can be readily modified to incorporate satellite-derived PM inputs alongside low-cost sensor data, enabling improved spatial scaling of size-resolved, dose-relevant exposure estimates.

How to cite: Sai Ganesan, K. D., Puttaswamy, N., Sendhil, S., Natesan, D., Ramasami, R., Desai, M., Pillarisetti, A., Vakacherla, S., Krishnan, R., Sambandam, S., Ramaswamy, P., and Balakrishnan, K.: Estimating Size-Resolved Lung Deposition Doses of Particulate Matter (PM) Using Low-Cost Sensor Data in Rural India, EGU General Assembly 2026, Vienna, Austria, 3–8 May 2026, EGU26-6264, https://doi.org/10.5194/egusphere-egu26-6264, 2026.

EGU26-6386 | ECS | Posters virtual | VPS4 | Highlight

Automated Analysis of City Level Climate Action Plans using Natural Language Processing Technique 

Sonam Sahu and Sudhanshu Shanker and the MU NLP team

The growing urgency of climate action at the city level has led to an exponential rise in documents that describe a city’s policy, action plan, or progress towards climate action. The increased number of documents has made it increasingly difficult for governments to track commitments and compare approaches across jurisdictions. These documents are essential for informed decision-making, but extracting useful information from unstructured PDF reports remains a largely manual, resource-intensive, and inconsistent process. Recent advances in AI and large language model (LLM) based document understanding offer strong potential, but their application in urban climate governance workflows is still limited. Integrating AI-driven document analysis into this workflow offers opportunity for building scalable, standardized, and transparent climate policy assessment.

This study presents an AI-assisted natural language processing (NLP) pipeline that automatically extracts, segments, and classifies climate actions from diverse policy documents. The workflow integrates layout-aware text extraction with an action-segmentation mechanism to identify action statements across heterogeneous formats. A fine-tuned, two-stage ClimateBERT classifier then categorizes actions: Stage 1 differentiates mitigation and adaptation measures (F1 = 93%), while Stage 2 assigns domain-specific sub-categories, achieving 92% F1 for mitigation and 91% for adaptation. An equity-detection module further identifies references to vulnerable groups, inclusivity, and justice-oriented themes.

The pipeline significantly reduces manual review effort and enhances consistency in understanding climate action. By enabling standardized comparisons, the approach directly supports mayors, policymakers, and urban practitioners in evaluating progress and designing more effective and equitable interventions.

As AI capabilities advance, such automated tools will strengthen climate governance by improving the accessibility, reliability, and strategic value of climate policy data.

How to cite: Sahu, S. and Shanker, S. and the MU NLP team: Automated Analysis of City Level Climate Action Plans using Natural Language Processing Technique, EGU General Assembly 2026, Vienna, Austria, 3–8 May 2026, EGU26-6386, https://doi.org/10.5194/egusphere-egu26-6386, 2026.

Nitrogen oxides (N₂O, NO, and NO₂) serve as critical linkages connecting climate systems, ecosystems, and atmospheric chemistry, with soils acting as a primary natural source. Adopting a multi-scale framework spanning global, regional, and field scales, we systematically examine the spatiotemporal heterogeneity of nitrogen oxide emissions from cropland soils. Spatially, emissions exhibit a latitudinal gradient, decreasing from low to high latitudes, with hotspots concentrated in agriculturally intensive regions. Temporally, emissions display multi-scale rhythmic patterns aligned with crop growth stages, seasonal cycles, and diurnal variations, tightly coupled to soil carbon-nitrogen transformation processes. From the perspective of carbon-nitrogen coupling mechanisms, we reveal how land management practices—including nitrogen fertilization, conservation tillage, and precision irrigation—regulate emissions by modulating soil organic carbon content, carbon-nitrogen ratios, and pore structure. Concurrently, climate change drivers such as rising temperatures, elevated CO₂ concentrations, and extreme precipitation alter microbial-mediated carbon-nitrogen transformation efficiency, collectively shaping the core mechanisms governing nitrogen oxide emissions. A meta-analysis further investigates light effects on soil nitrogen oxide emissions, demonstrating significant impacts: light exposure increased N₂O and NO fluxes by 57.28% and 116.19%, respectively. Notably, heightened UV-B radiation reduced N₂O emissions by 6.85%, whereas shading increased them by 77.23%, with crop-specific responses observed. Mechanistically, light regulates emissions by modifying soil physicochemical properties and restructuring nitrogen-cycling microbial communities. Current emission mitigation faces challenges, including underdeveloped monitoring systems, limited prediction accuracy due to multifactor coupling complexities, and poor regional adaptability of existing technologies. Integrating multi-source data (field observations, remote sensing inversion, laboratory experiments) with advanced modeling approaches—such as climate-soil-crop coupling models and machine learning algorithms—offers viable pathways to enhance emission prediction precision and optimize mitigation strategies. Looking ahead, priorities include establishing multi-scale automated monitoring networks, developing carbon-nitrogen coupling-driven predictive models, promoting regionally tailored carbon sequestration and nitrogen emission reduction technologies, and combining policy incentives with public engagement to reduce uncertainties in global carbon-nitrogen cycle projections. These efforts aim to strengthen scientific support for sustainable agricultural development.

How to cite: Li, D. and Shen, W.: Nitrogen oxide emissions from cropland soil: spatiotemporal heterogeneity, carbon-nitrogen coupling mechanisms, and mitigation strategies, EGU General Assembly 2026, Vienna, Austria, 3–8 May 2026, EGU26-9022, https://doi.org/10.5194/egusphere-egu26-9022, 2026.

ABSTRACT


The Taihu Lake region has experienced rapid land use intensification, characterized by conversions from natural wetlands (NW) to conventional rice-wheat rotation fields (RW) and further to greenhouse vegetable fields (GH), driven by economic interests. While such transformations are widespread, their combined effects on greenhouse gas (GHG) emissions and underlying soil microbial mechanisms remain poorly understood. This integrated study addresses these gaps through multi-faceted analyses of GHG fluxes, soil microbial communities, and nitrogen (N)-cycling functional genes across NW, RW, and GH sites. Two-year in-situ field experiments revealed significant GHG emission shifts: land use intensification reduced methane (CH₄) emissions (NW: 970.66 ± 100.09 kg C ha⁻¹; RW: 896.71 ± 300.44 kg C ha⁻¹; GH: 71.23 ± 63.62 kg C ha⁻¹) but markedly increased nitrous oxide (N₂O) emissions (NW: 3.35 ± 0.44 kg N ha⁻¹; RW: 14.38 ± 4.09 kg N ha⁻¹; GH: 81.62 ± 4.89 kg N ha⁻¹). Global warming potential followed the order RW > NW > GH, indicating intensified comprehensive greenhouse effects during NW→RW conversion and mitigation during RW→GH conversion. Microbial community analyses showed land use intensification directly altered bacterial and fungal compositions, with stronger impacts on bacteria. Bacterial communities correlated closely with soil NO₃⁻-N, pH, and electrical conductivity, exhibiting decreased deterministic processes (opposite to fungi). Arable lands (RW/GH) displayed more complex microbial networks, and seasonal variations (notably summer) influenced microbial diversity and function, though less strongly than land use effects. Integrating quantitative PCR and metagenomics uncovered microbial mechanisms driving N₂O emissions: intensification reshaped N-cycling microbial communities, depleting nitrogen fixation, dissimilatory nitrate reduction to ammonium, and anammox marker genes in GH soils. Denitrifying communities segregated similarly to total N-cycling assemblages, with increased network complexity but divergent stability. Critically, intensification amplified N₂O emission potential by elevating Pseudomonadota harboring nirK/norB genes (and associated communities) while reducing nosZ (encoding N₂O reductase) abundance—directly linking microbial functional imbalance to emission increases. Collectively, this study demonstrates that land use intensification in the Taihu Lake region drives GHG emission trade-offs (reduced CH₄ but amplified N₂O) and restructures soil microbial communities and N-cycling functions. These findings highlight the need to prioritize microbial functional balance (e.g., restoring nosZ-carrying taxa) in mitigation strategies, providing critical insights for sustainable land management in wetland-agricultural transition zones.


Acknowledgment

This study was funded by the National Key Research and Development Program of China (2023YFF0805403, 2025YFD1700403) and National Natural Science Foundation of China (42377311).

How to cite: Shen, W., Xiong, R., Qin, D., and Gao, N.: Integrated impacts of land use intensification on greenhouse gas emissions and soil microbial communities in the Taihu Lake Region: patterns, mechanisms, and implications, EGU General Assembly 2026, Vienna, Austria, 3–8 May 2026, EGU26-9373, https://doi.org/10.5194/egusphere-egu26-9373, 2026.

EGU26-9696 | Posters virtual | VPS4

Fog Risk Monitoring and Assessment for India Using Bayesian Networks and ECMWF IFS Ensemble Prediction System 

Sarath K Guttikunda, Nishadh Kalladath, Robert R Tucci, Jully Ouma, Ahmed Amdihun, and Sai Krishna Dammalapati

Dense fog events across India severely disrupt aviation, surface transportation, and daily activities during winter months, with northern districts experiencing extended periods of visibility issues. Building upon the WRF-based ensemble fog forecasting over the Indo-Gangetic Plain and BOFFIN-Melbourne's Bayesian Decision Network framework, this study proposes a continuous risk monitoring and decision support system at district-level (admin-2).

The operational system will conduct daily continuous risk assessment, leveraging satellite observations from MODIS/VIIRS/INSAT-3D and the ECMWF IFS ensemble forecasts (51 members, 0.25° resolution) including probabilistic meteorological predictions of temperature, dewpoint, wind speed, boundary layer height, relative humidity profiles, and cloud cover, to characterize antecedent fog conditions and to establish baseline occurrence patterns.

 A Bayesian Network will integrate these layers to provide real-time short-term forecasts using pre-defined conditional probability tables which encode relationships between stable boundary layer conditions, radiative cooling, and regional fog formation mechanisms. The operational output of the algorithms will be in the form of traffic light decision matrix for each district: Green (Minimal/Low risk - Monitor), Yellow (Moderate risk - Be Aware), Orange (High risk - Be Prepared), Red (Extreme risk - Take Action).

This paper will present the validation results from pilot districts and the development framework for scaling to nationwide continuous risk assessment, demonstrating the system's potential for proactive decision-making in transportation management, aviation operations, and public safety advisories.

References

  • Parde, Avinash N., et al. "Operational probabilistic fog prediction based on ensemble forecast system: A decision support system for fog." Atmosphere 13.10 (2022): 1608.
  • Boneh, Tal, et al. "Fog forecasting for Melbourne Airport using a Bayesian decision network." Weather and Forecasting 30.5 (2015): 1218-1233.

How to cite: Guttikunda, S. K., Kalladath, N., Tucci, R. R., Ouma, J., Amdihun, A., and Dammalapati, S. K.: Fog Risk Monitoring and Assessment for India Using Bayesian Networks and ECMWF IFS Ensemble Prediction System, EGU General Assembly 2026, Vienna, Austria, 3–8 May 2026, EGU26-9696, https://doi.org/10.5194/egusphere-egu26-9696, 2026.

EGU26-10657 | ECS | Posters virtual | VPS4

Machine learning analysis of global LAI trends and their relationship with climate variability (1982–2022) 

Daniel García-Diaz, Fernando Aguilar, Santiago Schauman, and Aleixandre Verger

Understanding vegetation responses to climate variability is essential for assessing long-term ecosystem dynamics. Leaf Area Index (LAI) is a widely used variable to characterise vegetation state and productivity. However, attributing observed global LAI trends to specific climatic drivers remains challenging due to non-linear interactions, strong spatial heterogeneity, and scale-dependent processes.

This study is conducted within the framework of the PROFECIA project, which aims to improve the monitoring and interpretation of vegetation responses to climate change by combining remote sensing observations and artificial intelligence techniques. We analyse global LAI trends over the period 1982–2022 using the GEOV2-AVHRR long-term satellite record and examine their relationship with trends in key climatic variables obtained from the ERA5 reanalysis, including temperature, precipitation, radiation, and several indicators of water availability and drought conditions. All trends are computed consistently over the 1982-2022 temporal record to ensure a homogeneous assessment of long-term vegetation–climate relationships at the global scale.

The vegetation–climate relationships are modelled using a suite of machine learning approaches, including tree-based methods and neural networks, designed to capture non-linear responses across diverse climatic and ecological conditions. Particular emphasis is placed on the role of the training strategy: different spatio-temporal sampling schemes are evaluated to assess their impact on model performance, robustness, and generalisation capability when analysing long-term trends at the global scale.

To move beyond purely predictive modelling, the study systematically applies explainable artificial intelligence (XAI) techniques to interpret the trained models. Methods such as SHAP-based attribution and partial dependence analyses are used to quantify the relative contribution of individual climatic drivers to observed LAI trends and to examine how these contributions vary across regions and time periods.

Overall, this work highlights the importance of combining robust machine learning training strategies with interpretability tools to improve the attribution of long-term vegetation trends to climatic drivers, providing new insights into global vegetation–climate interactions over the last four decades.

How to cite: García-Diaz, D., Aguilar, F., Schauman, S., and Verger, A.: Machine learning analysis of global LAI trends and their relationship with climate variability (1982–2022), EGU General Assembly 2026, Vienna, Austria, 3–8 May 2026, EGU26-10657, https://doi.org/10.5194/egusphere-egu26-10657, 2026.

EGU26-10823 | ECS | Posters virtual | VPS4

A Hybrid Neural Network and Cellular Automata Model for spatiotemporal Forecasting of PM10 and PM2.5 in Lima, Peru 

Brigida Maita, Priscila Condezo, Jhoreck Llanto, Shirley Huaman, and Janeet Sanabria

Particulate matter (PM) pollution represents a significant public health concern, in Lima, Peru. This issue is further compound by the lack of accurate forecasting tools due to limited monitoring networks. This study addresses this gap by developing and validating a hybrid model combining a Multilayer Perceptron (MLP) neural network and a type of rule-based Cellular Automata (CA) simulation. This model simulates and forecasts the spatiotemporal dispersion of PM10 and PM2.5. Using a decade of historical PM data (2015-2024) from seven monitoring stations and NASA's meteorological data, an optimized MLP was trained to learn the complex, non-linear transition rules from 47 engineered features. The model demonstrated remarkable performance in historical validation (R2 > 0.90), outperforming standard baseline models. When fed with weather forecast data, the model can operate as an Early Warning System (EWS), providing a reliable prediction horizon to anticipate the exceedance of Air Quality Standards. The resulting hotspot maps accurately identify high-risk areas, confirming the potential of this hybrid model as a robust, proactive, and quantitative tool for air quality management and public health protection in complex urban environments.

How to cite: Maita, B., Condezo, P., Llanto, J., Huaman, S., and Sanabria, J.: A Hybrid Neural Network and Cellular Automata Model for spatiotemporal Forecasting of PM10 and PM2.5 in Lima, Peru, EGU General Assembly 2026, Vienna, Austria, 3–8 May 2026, EGU26-10823, https://doi.org/10.5194/egusphere-egu26-10823, 2026.

EGU26-11502 | ECS | Posters virtual | VPS4

Regional Air Quality Management: A Scalable, Data-Driven Airshed Framework using Low-Cost Sensors across the Indo-Gangetic Plain, India 

Anandh P Chandrasekaran, Sachchida Nand Tripathi, Nimit Godhani, Malay Pandey, Piyush Rai, Navdeep Agrawal, Anil Kumar, and Snehadeep Ballav

In India, ensuring clean air for all is vital and should not be limited to urbanites. However, the current air quality monitoring networks and clean air strategies are limited to cities. Notably, the air quality status across regions is yet to be measured, and comprehensive regional management plans are non-existent. To address these significant research gaps, the Ambient air quality Monitoring over Rural areas using Indigenous Technology (AMRIT) project was envisioned and implemented by the Centre of Excellence Advanced Technologies for Monitoring Air-quality iNdicators (CoE – ATMAN), Indian Institute of Technology Kanpur. For the first time, over 1,400 low-cost PM2.5 sensors were installed across the states of Uttar Pradesh and Bihar at the block level. The sensor locations encompass a diverse range of land-use and land-cover categories, demographics, and communities. By leveraging a dense network of low-cost sensors, we developed a data-driven machine learning framework to delineate airsheds for regional air quality management for the first time. We utilized a recurrent neural network–based long short-term memory (LSTM) and hierarchical clustering algorithms with PM2.5 and meteorological data to delineate airsheds. The LSTM embeddings learn latent representations from PM2.5–ventilation coefficient (VC) time series, capturing spatiotemporal patterns and inter-variable relationships. These embeddings were then hierarchically clustered to delineate airsheds. Applying this framework, our results for Bihar show five distinct airsheds; three prevail in the north of the Ganges River, and two prevail in the south of the Ganges. Notably, Airshed 1, located in the northwest region, is highly polluted. However, during the post-monsoon and winter across the airsheds, PM2.5 levels were two to three times higher than the national standard (60 µg/m³), and on ~90% of days, people breathe unhealthy air. Similarly, we identified multiple distinct airsheds in Uttar Pradesh, as well as common airsheds that prevail across Bihar and Uttar Pradesh states. This emphasizes not only shared regional influences but also the need for an integrated approach to reduce PM2.5 pollution. Therefore, the identified airsheds would be instrumental in targeting the reduction of fine particulate pollution across the Bihar and Uttar Pradesh states. Furthermore, the scalable, data-driven airshed delineation framework using low cost sensors could be implemented across India and potentially globally. Thus, this will facilitate airshed-based air quality management plans and integrated policy interventions to ensure “clean air for all.”

Keuwords: Air Quality; Low-Cost Sensors; Airshed;  Indo-Gangetic Plain; Machine Learning

How to cite: P Chandrasekaran, A., Tripathi, S. N., Godhani, N., Pandey, M., Rai, P., Agrawal, N., Kumar, A., and Ballav, S.: Regional Air Quality Management: A Scalable, Data-Driven Airshed Framework using Low-Cost Sensors across the Indo-Gangetic Plain, India, EGU General Assembly 2026, Vienna, Austria, 3–8 May 2026, EGU26-11502, https://doi.org/10.5194/egusphere-egu26-11502, 2026.

EGU26-14158 | Posters virtual | VPS4

Open-Tool Frameworks for Cross-Platform Indoor Monitoring and Optimized Air Cleaning Strategie 

Federico Dallo, Lorenzo Tenti, Alessandro Palo, Thomas Parkinson, and Carlos Duarte

Indoor environments account for most human exposure to air pollution, yet indoor air quality (IAQ) monitoring and control remain fragmented across devices, platforms, and proprietary building automation systems. Commercial IAQ monitors and smart thermostats are widely available, but they typically operate in closed ecosystems with limited interoperability. In parallel, open-source communities have demonstrated the potential of low-cost sensing networks, yet these solutions rarely connect to building-level control systems capable of simultaneously reducing pollutant exposure and energy use. To address this gap, we present an open, interoperable framework that integrates open-source and commercial technologies for IAQ monitoring, data management, and automated building control[1]. The framework, developed within the EU-funded healthRiskADAPT project, is built on an open, production-ready IoT infrastructure for indoor environments. At the edge, low-cost sensor nodes collect and transmit environmental data. A web-based interface allows users to register locations, nodes, and sensors, and provides near-real-time visualization, historical analytics, and an interactive map of the sensor network. Beyond monitoring, the framework enables direct integration with commercial control devices such as smart thermostats, smart plugs, and filtration systems. This interoperability supports data-driven control strategies, including increasing ventilation during indoor pollution events, activating filtration during periods of poor outdoor air quality, and dynamically adjusting HVAC operation to balance comfort, energy use, and exposure reduction. By combining continuous mass-balance modeling[2] with real-time sensor data, the system will deliver actionable indoor-outdoor (I/O) ratios and exposure indicators. These outputs could drive automated responses but also support informed user behavior, such as choosing higher-efficiency filters during high-pollution episodes, using kitchen exhaust during cooking, or understanding the trade-offs between energy costs and health risks. In this way, the platform functions not only as a control system but also as an educational and decision-support tool for occupants and building managers. This presentation demonstrates how open-source hardware, open APIs, and modular integration pathways can create a flexible, transparent, and scalable ecosystem for IAQ management. The framework supports diverse use cases, homes, schools, workplaces, and research settings, while offering a roadmap toward energy-efficient, healthier indoor environments driven by interoperable technologies rather than isolated products.

[1] https://particularmatter.org

[2] Dallo, Federico, Thomas Parkinson, Carlos Duarte, Stefano Schiavon, Chai Yoon Um, Mark P. Modera, Paul Raftery, Carlo Barbante, and Brett C. Singer. "Using smart thermostats to reduce indoor exposure to wildfire fine particulate matter (PM2. 5)." Indoor Environments 2, no. 2 (2025): 100088.

How to cite: Dallo, F., Tenti, L., Palo, A., Parkinson, T., and Duarte, C.: Open-Tool Frameworks for Cross-Platform Indoor Monitoring and Optimized Air Cleaning Strategie, EGU General Assembly 2026, Vienna, Austria, 3–8 May 2026, EGU26-14158, https://doi.org/10.5194/egusphere-egu26-14158, 2026.

EGU26-18107 | Posters virtual | VPS4

Satellite-Based PM2.5 Estimation in Data-Sparse Urban Environments: Comparing Machine Learning and Geostatistical Approaches in Kolkata, India 

Anjali Raj, Tirthankar Dasgupta, Manjira Sinha, and Adway Mitra

Fine particulate matter (PM2.5) is among the foremost environmental determinants of human health, contributing to cardiovascular disease, respiratory illness, and premature mortality. In rapidly urbanizing regions of the Global South, accurate spatial characterization of PM2.5 exposure requires spatially continuous concentration surfaces that also provide reliable uncertainty estimates, yet ground-based monitoring networks remain severely sparse. Kolkata, India’s third-largest metropolitan area (population 14.9 million), exemplifies this challenge: only seven regulatory monitoring stations cover the entire city, leaving large areas unobserved.

This study evaluates how different PM2.5 surface generation strategies—satellite-based machine learning (ML) and spatial interpolation—differ not only in predictive accuracy but also in their ability to provide decision-relevant uncertainty under sparse monitoring conditions. Using six years of daily observations (2019–2024), we compare two complementary approaches. The first employs satellite-based ML, integrating Sentinel-5P trace gases, MODIS aerosol optical depth, ERA5 meteorological reanalysis, and static urban features (VIIRS nightlights, population density) to predict PM2.5. The second evaluates spatial interpolation methods—ordinary kriging, inverse distance weighting (IDW), and simple averaging—using station observations alone.

For satellite-based ML (Random Forest), the station-level model achieved R2 = 0.79 under leave-one-station-out (LOSO) validation, while grid-based model trained on kriging-interpolated targets reached R2 = 0.70 under temporal out-of-sample validation (train: 2019–2022, test: 2023–2024). Feature importance analysis consistently identified dewpoint temperature, air temperature, and surface albedo as dominant predictors, indicating that atmospheric conditions exert stronger control on PM2.5 variability than emission proxies or land-use variables.

For spatial interpolation evaluated under daily LOSO, all methods achieved comparable point prediction accuracy (R2 ≈ 0.85). However, uncertainty calibration diverged sharply. Ordinary kriging achieved 88% empirical coverage for nominal 95% prediction intervals (90% when including observation noise)—approaching theoretical calibration—whereas IDW and simple averaging exhibited severe under-coverage (45–52%), substantially underestimating true prediction error.

These findings yield three key insights: (1) satellite-derived predictors enable spatially complete PM2.5 estimation beyond monitoring locations, though with moderate accuracy; (2) when temporally aligned station data are available, interpolation achieves higher point accuracy than satellite-based ML; and (3) regardless of estimation strategy, only geostatistical approaches provide uncertainty estimates suitable for health-protective decision-making. We conclude that hybrid frameworks combining satellite-based spatial prediction with kriging-derived uncertainty characterization offer a principled pathway for generating spatially complete and risk-aware PM2.5 maps in data-sparse urban environments.

How to cite: Raj, A., Dasgupta, T., Sinha, M., and Mitra, A.: Satellite-Based PM2.5 Estimation in Data-Sparse Urban Environments: Comparing Machine Learning and Geostatistical Approaches in Kolkata, India, EGU General Assembly 2026, Vienna, Austria, 3–8 May 2026, EGU26-18107, https://doi.org/10.5194/egusphere-egu26-18107, 2026.

EGU26-20844 | Posters virtual | VPS4

Machine Learning-Based Prediction of Tropical Cyclone Intensification Over the North Indian Ocean Using ERA5 Reanalysis  

Dhanya Madhu, Neha Meriya Binu, and Maneesha Vinodini Ramesh

Machine Learning models are rapidly becoming popular for complementing, enhancing, and in some cases, replacing traditional numerical models. This study presents a data-driven framework for predicting 24-hour tropical cyclone intensification over the North Indian Ocean using supervised machine learning and ERA5 reanalysis data. Cyclones that formed over Bay of Bengal and the Arabian Sea during the period 1990–2024 are considered here.  We have integrated environmental parameters from ERA5 with intensity records from the IBTrACS archive, excluding early developmental stages and retaining only dynamically mature systems. Intensification is formulated as a binary classification problem based on the sign of the 24-hour change in maximum sustained wind speed. While this captures general strengthening behaviour, it does not distinguish between moderate and rapid intensification, nor does it estimate the magnitude of intensity change. Five machine learning models—Logistic Regression, Random Forest, Extra Trees, Support Vector Machine, and Multilayer Perceptron—are trained and evaluated. Results indicate that the Random Forest classifier has achieved the highest accuracy. Feature-importance analysis reveals strong physical consistency, highlighting the dominant roles of upper-level circulation, sea surface temperature, vertical wind shear, and atmospheric moisture in regulating short-term intensification. Cyclone Montha (2025) is used as a test case to illustrate the model's real-world applicability and is validated outside of historical data. The model-predicted intensification probability is estimated as 0.943, which indicates good performance. Although a single case study does not constitute statistical validation, this illustrates the applicability of data-driven models in tropical cyclone intensity estimation. The results encourage further investigations into the use of such data-driven models in tropical cyclone intensity prediction, which aids disaster management efforts.

How to cite: Madhu, D., Binu, N. M., and Ramesh, M. V.: Machine Learning-Based Prediction of Tropical Cyclone Intensification Over the North Indian Ocean Using ERA5 Reanalysis , EGU General Assembly 2026, Vienna, Austria, 3–8 May 2026, EGU26-20844, https://doi.org/10.5194/egusphere-egu26-20844, 2026.

EGU26-21338 | Posters virtual | VPS4

Hazardous gaseous pollutants (NOx, SO2, TVOCs) emission from solid fuels combustion and their mitigation using novel adsorbent materials 

Shamsh Pervez, Dharini Sahu, Yasmeen F. Pervez, Indrapal Karbhal, and Manas K. Deb

Traditional solid fuels are extensively used for domestic heating and cooking in developing countries, especially in rural and semi-urban regions. Combustion of these fuels is a major source of nitrogen oxides (NOx), sulfur dioxide (SO2), and volatile organic compounds (TVOCs), which significantly contribute to air pollution, respiratory disorders, secondary aerosol formation, and atmospheric photochemical reactions. The generation and release of these pollutants are strongly influenced by fuel moisture content, elemental composition, and inorganic constituents. This study presents a comprehensive investigation of the chemical characteristics of commonly used solid fuels and evaluates the potential of advanced functional materials for mitigating NOx, SO2, and TVOC emissions from domestic combustion sources.

Representative fuel samples, including fuel wood (FW), coal balls (CB), dung cake (DC), and crop residues (CR), were obtained from the Raipur–Durg–Bhilai region of Chhattisgarh, India, selected based on their prevalence and area-specific usage patterns. The samples were air-dried, pulverized, and homogenized prior to analysis. Moisture content was determined gravimetrically by oven drying at 105 °C. Ultimate analysis of carbon (C), hydrogen (H), nitrogen (N), sulfur (S), and oxygen (O) was performed using a CHNS/O elemental analyzer. Ionic species, including nitrate, sulfate, chloride, and major alkali and alkaline earth metals, were quantified using ion chromatography to assess their role in pollutant formation and combustion behavior. These chemical parameters were used to infer emission potential for NOx, SO2, and TVOCs.

NO emissions were generally higher for AR and DC, while FW showed the lowest NO EF. SO2 emissions followed a similar trend, with DC producing the highest levels and FW the lowest. TVOC emissions were elevated for fuels with higher moisture and inorganic content, such as AR and DC, whereas FW exhibited the lowest TVOC emission potential. CB displayed intermediate to high emissions, with particularly high TVOC formation due to its variable composition. Emission factors developed in simulated experimental chambers were validated against real-world measurements, indicating that domestic household emissions closely correspond to chamber-based estimates.

To address post-combustion emission control, advanced materials including graphene-based materials, biochar, graphitic carbon nitride (g-C3N4), metal oxides (MnO2/TiO2), zeolites, metal–organic frameworks (MOFs), covalent organic frameworks (COFs), and silica-based adsorbents were considered for NOx, SO2, and TVOC mitigation. Materials were characterized using BET surface area analysis, X-ray diffraction (XRD), Fourier transform infrared spectroscopy (FTIR), and scanning electron microscopy (SEM), confirming high surface activity and strong gas affinity. Their physicochemical properties, high specific surface area, tunable pore size distribution, and surface functional groups, enable efficient adsorption and catalytic transformation of pollutants. Graphene-based materials and biochar adsorb acidic gases through π–π interactions and surface oxygen functional groups, while g-C3N4 facilitates photocatalytic oxidation of NOx under visible light. Metal oxides such as MnO2/TiO2 catalyze the oxidation of SO2 to sulfate and TVOCs to less harmful products via surface redox cycles. Zeolites and MOFs provide selective adsorption of NOx and TVOCs through microporous confinement and acid–base interactions.

How to cite: Pervez, S., Sahu, D., Pervez, Y. F., Karbhal, I., and Deb, M. K.: Hazardous gaseous pollutants (NOx, SO2, TVOCs) emission from solid fuels combustion and their mitigation using novel adsorbent materials, EGU General Assembly 2026, Vienna, Austria, 3–8 May 2026, EGU26-21338, https://doi.org/10.5194/egusphere-egu26-21338, 2026.

EGU26-21667 | Posters virtual | VPS4

A multi-site comparison of spectral and co-spectral approaches for correction of turbulent gas fluxes with ICOS set-up 

Ariane Faurès, Dario Papale, Giacomo Nicolini, Simone Sabbatini, and Bernard Heinesch

Correction of high-frequency spectral losses is a major technical challenge of the eddy covariance (EC) technique. If not properly accounted for during post-processing, these losses can result in a systematic underestimation of the measured gas fluxes exchanged between the ecosystem and the atmosphere. To address this issue, several methods have been developed, with experimental approaches relying on the definition of a transfer function and its associated cut-off frequency to describe the EC system as a first order low-pass filter.

One still debated yet fundamental choice is whether to use power spectra or co-spectra to derive the system cut-off frequency. In this study, we present a systematic, multi-site, data-driven comparison of the these two methods. To do so, we used one year of CO2 and H2O data from all of 38 ICOS Class 1 and Class 2 stations (Integrated Carbon Observation System, www.icos-cp.eu), all equipped with a standard setup comprising the LI-7200 enclosed path analyser and the HS-50 sonic anemometer.

We showed that the corrections were limited for both approaches, especially for CO2, ranging from 1 to 1.2, generally higher for H2O, ranging from 1 to 2, and overall consistent across sites. This highlighted the good spectral performance of the enclosed path analyser as well as the effectiveness of the setup standardisation. Nonetheless, the results showed that differences in correction factors between the methods existed. They were analysed for all sites, separately for stable and unstable conditions. They increased with atmospheric stability and attenuation level, and decreased with measurement height above the canopy. In particularly, they were systematically the highest in stable conditions. However, when assessing the impact of the two corrections on cumulative u*-filtered fluxes, we found that rejections of most stable conditions through this standard post-processing filtering led to differences under 3% for CO2 in 89% of sites and under 6% for H2O in 79% of sites.

With this specific experimental setup, we suggest prioritising the co-spectral for two main reasons. First, sensor separation is a dominant part of the high-frequency attenuation and is treated experimentally in the co-spectral method, whereas the spectral approach relies on a fully theoretical formulation. Second, the spectral method requires a robust denoising procedure, which is not needed in the co-spectral approach. Finally, while recognising its crucial importance at a network level, we highlight the complexity of having a fully automatic pipeline for spectral corrections.

How to cite: Faurès, A., Papale, D., Nicolini, G., Sabbatini, S., and Heinesch, B.: A multi-site comparison of spectral and co-spectral approaches for correction of turbulent gas fluxes with ICOS set-up, EGU General Assembly 2026, Vienna, Austria, 3–8 May 2026, EGU26-21667, https://doi.org/10.5194/egusphere-egu26-21667, 2026.

AS1 – Meteorology

A nocturnal surface-based temperature inversion refers to a phenomenon where air temperature increases with height. Such inversions are of interest because they play a significant role in enhancing the risk of frost events during the autumn–spring period and in the accumulation of air pollutants near the surface, with potential adverse impacts on human health. 

The key conditions for nocturnal inversion formation are: the absence of cloud cover, which enhances radiative cooling, and weak winds or calm conditions, which minimize vertical air mixing and thus intensify near-surface cooling. Based on these criteria, we analyzed meteorological observation data for the period 2011–2025 and selected nights when the average cloud cover over Poland did not exceed 0.5 oktas and wind speed remained below 3 m/s. An additional requirement was sunset before 18 UTC (the forecast initialization time) to exclude the influence of incoming solar radiation. For the selected cases, we chose stations where cloud cover remained at 0 oktas and wind speed did not exceed 3 m/s throughout the modeling period. 

For the modeling, we used the COSMO-2k8 ensemble prediction system with perturbations applied to the surface level soil temperature (T_SO) along with a separate deterministic run.  

At the first stage, the 20 ensemble members were split into two groups: group 1 with perturbations in initial conditions only and group 2 with perturbations in both initial and boundary conditions. 

In the near-surface layer, most cases show significant deviations between the modeled and observed temperature profiles, both positive and negative. For almost all simulated events, a characteristic feature is the rapid decrease in the amplitude of surface temperature among ensemble members. As a result, the amplitude of air temperature at 2 m and higher levels also decreases. 

At the second stage, a new approach to introducing perturbations into the T_SO was implemented. A new 40-member ensemble with different methods of initialization of perturbations was generated to hold the spread level during the model forecast. The members were divided into four groups of 10: 

  • group 1: perturbations applied only to the initial conditions, with temperature deviations of ±0.5 and ±1.0 K and noise amplitude of 1–2 K during the first two time steps. 
  • group 2: perturbations applied to both the initial and boundary conditions, with gradual accumulation of shift and amplitudes from 0.05 to 1.0 K; due to the simulation time step, the maximum amplitude over 12 h reaches ±0.3 K. 
  • group 3: perturbations up to ±1.0 K, accumulated during the first ~100 minutes (240 steps). 
  • group 4: perturbations up to ±1.0 K, accumulated rapidly during the first ~17 minutes (40 steps). 

The new perturbation scheme demonstrated not only the preservation of spread among individual ensemble members, but also its propagation up to a height of about 900 hPa. 

How to cite: Mazur, A., Tabalchuk, T., and Wyszogrodzki, A.: Impact of different surface temperature perturbation schemes on the simulation of nocturnal temperature inversions in ensemble modeling , EGU General Assembly 2026, Vienna, Austria, 3–8 May 2026, EGU26-530, https://doi.org/10.5194/egusphere-egu26-530, 2026.

EGU26-1684 | Orals | AS1.1

The ACCORD consortium and its scientific strategy 

Claude Fischer

ACCORD is a consortium made up of 26 Meteorological Services (https://www.accord-nwp.org/ ). The primary objective is to provide the consortium's member services with state-of-the-art numerical weather prediction (NWP) limited-area model codes. A substantial part of the ACCORD codes are shared with IFS-ARPEGE.

During phase 1 of ACCORD (2021-2025), collaborative working methods have been drastically modernized. Code management has greatly benefited from the implementation of the ACCORD software forge (Github) as well as from the expanded use of a testing tool which enables component-wise testing of new code versions. The adaptation of the codes to new HPC architectures (CPU-GPU accelerators) has largely progressed in close collaboration with MF (ARPEGE) and ECMWF (IFS).

Research on the current (semi-implicit semi-Lagrangian spectral) dynamical kernel of ACCORD models continues, notably through an extensive reformulation of the semi-implicit operator. In addition, the alternative FVM (Finite Volume Model) code, initially developed at ECMWF, is being studied. SURFEX (https://www.umr-cnrm.fr/surfex/ ) has become the main code infrastructure for modeling surface processes and the surface-atmosphere interface. Efforts devoted to developing new options for very high-resolution modeling are increasing: dynamical kernel, 3D aspects of turbulence and radiation, refined surface characteristics, all for models at the hectometer scale. This trend is largely driven by user needs.

In data assimilation, a major advance is the near-operational status of flow-dependent algorithms (EnVar-type algorithms coded in the OOPS software framework). ACCORD has maintained first-rate expertise in preprocessing observations for assimilation. This applies both to satellite data (infrared or microwave, in polar orbit or geostationary orbit) and to ground-based networks of various types (radar, surface networks, citizen observations) or aircraft (Mode-S). In probabilistic forecasting and ensemble methods (EPS), scientific collaboration focuses (among other aspects) on ensemble perturbation methods. Several approaches for model perturbations have been studied, such as tendency perturbations (SPPT), model parameter perturbations (SPP or RP), and surface field perturbations.

A new scientific strategy was approved by the Assembly of Directors in December 2024 for the next Programme phase (2026-2030). The main objectives include:

  • Continue modernizing the collaborative working methods.

  • Continue adapting the codes for CPU-GPU architectures.

  • Continue research on the various model components with an increased focus on very high resolution and high-impact weather forecasting.

  • Develop a research infrastructure enabling process-oriented meteorological evaluation of models using specialized observations.

  • Continue to develop DA algorithms with flow dependence, leveraging observations from the coming years (MTG etc.).

  • Pursue and strengthen scientific collaboration on ensemble forecasting systems.

In connection with the rapid evolution of data driven forecast tools, ACCORD members want to be proactive in AI initiatives in Europe (within EUMETNET and with ECMWF). The scientific strategy foresees exploring hybrid "AI-physical NWP" solutions.

In the presentation, a few keynote features of the ACCORD scientific strategy will be further addressed.

How to cite: Fischer, C.: The ACCORD consortium and its scientific strategy, EGU General Assembly 2026, Vienna, Austria, 3–8 May 2026, EGU26-1684, https://doi.org/10.5194/egusphere-egu26-1684, 2026.

EGU26-1749 | Orals | AS1.1

Advancing Assimilation of Microwave and Radar Observations in the NWP Models 

Isaac Moradi, Yanqiu Zhu, Satya Kalluri, and Ricardo Todling

Accurate prediction of tropical cyclones remains a major challenge for numerical weather prediction, particularly for storm intensity, structure, and track. Progress depends on effectively assimilating both passive and active microwave observations, which together provide complementary insights into atmospheric temperature and moisture, cloud microphysics, and precipitation. Passive microwave measurements from low-Earth orbiting satellites, including those in low-inclination orbits, provide frequent sampling that is particularly valuable for tuning temperature and water vapor initial conditions. Observing system experiments with NOAA’s Hurricane Analysis and Forecast System (HAFS) and NASA’s Global Earth Observing System (GEOS) show that assimilating these data leads to more realistic storm structures and measurable improvements in forecasts of intensity and track.

Spaceborne radar observations provide vertical detail on clouds and precipitation. Instruments such as the GPM Dual-frequency Precipitation Radar and EarthCare’s Cloud Profiling Radar are now supported in the Community Radiative Transfer Model (CRTM) through a new spaceborne radar forward model and a Discrete Dipole Approximation–based scattering database. These capabilities are being implemented and tested within the Joint Effort for Data assimilation Integration (JEDI) framework, developed collaboratively by JCSDA, NASA, NOAA, and international partners. Early results from experiments assimilating GPM-DPR observations within NOAA’s GEOS system and CloudSat CPR data within NOAA’s HAFS demonstrate improvements in the analysis of cloud and precipitation structures.

How to cite: Moradi, I., Zhu, Y., Kalluri, S., and Todling, R.: Advancing Assimilation of Microwave and Radar Observations in the NWP Models, EGU General Assembly 2026, Vienna, Austria, 3–8 May 2026, EGU26-1749, https://doi.org/10.5194/egusphere-egu26-1749, 2026.

EGU26-1848 | Posters on site | AS1.1

A preliminary study of FY-4B AGRI all-sky assimilation by WRFDA for tropical cyclones  

Chun Yang, Tingting Zhong, and Jinzhong Min

A new assimilation module for AGRI (Advanced Geostationary Radiation Imager) carried on Fengyun-4B (FY-4B) is developed within the WRFDA (Weather Research and Forecasting model’s Data Assimilation) system. The impacts of assimilating FY-4B AGRI clear-sky and all-sky data are evaluated with cycling assimilation experiments for the typhoon Doksuri (2023) and Talim (2023) forecast. For typhoon Doksuri, compared with the benchmark experiment, AGRI assimilation brings a better analysis and forecast for atmospheric variables (wind, temperature and humidity). Meanwhile, clear error reductions for typhoon track and intensity forecasts are achieved with clear-sky and all-sky AGRI assimilation. The positive impact on landing precipitation prediction is also obtained by verifying with GPM (Global Precipitation Measurement) precipitation data. Moreover, AGRI all-sky assimilation yields better typhoon forecasts than clear-sky assimilation. In addition, the channel selection sensitivity for AGRI assimilation is also assessed with group experiments. It is suggested that with the assimilation of a new water vapor channel at 7.42 μm, which is newly added in FY-4B, multiple-channel assimilation shows greater benefit for forecast than single-channel assimilation. The same positive impact of AGRI assimilation is also present in typhoon Talim (2023) forecast. Overall, the all-sky assimilation of FY-4B AGRI water vapor channels data is beneficial for the typhoon forecast. 

How to cite: Yang, C., Zhong, T., and Min, J.: A preliminary study of FY-4B AGRI all-sky assimilation by WRFDA for tropical cyclones , EGU General Assembly 2026, Vienna, Austria, 3–8 May 2026, EGU26-1848, https://doi.org/10.5194/egusphere-egu26-1848, 2026.

The impact of radiance data assimilation from Advanced Technology Microwave Sounder (ATMS) into the Center for Weather Forecasting and Climate Studies of the National Institute for Space Research (CPTEC/INPE), Brazil, is investigated and discussed in this work. The recent discontinuation of the Advanced Microwave Sounding Unit (AMSU-A) in the NOAA series satellites (NOAA-15, 18, and 19) gives the ATMS sensor greater relevance in the process of assimilating microwave radiance data, and this fact is the motivation of this study. The ATMS data used in this study are from the Joint Polar Satellite System (JPSS) series and the National Polar-orbiting Partnership (NPP) satellites. Therefore, understanding and studying the impact of assimilating ATMS sensor radiance channels becomes essential for developing a more realistic numerical weather forecast, especially in extreme atmospheric conditions such as storms, cyclones, and hurricanes. Thus, this work presents results on the impact of ATMS sensor data assimilation on the numerical forecast of Melissa hurricane, which reached category five on October 27, 2025, in the Caribbean Sea, Central America. The Numerical Modeling and Data Assimilation System (SMNA) is used in this study, which is composed of a Gridpoint Statistical Interpolation (GSI) System coupled to the Brazilian Global Atmospheric Model (BAM). Other types of data, such as radiance from AMSU-A data from MetOp (Meteorological Operational satellite programme) satellites, Atmospheric Motion Vectors (AMV) data from geostationary and polar orbit satellites, radio occultation GNSS (Global navigation Satellite System) data, dropsondes, radiosondes, and pilot balloons, were also used in the assimilation process. Different experiments were conducted to explore the radiance channels available in the ATMS sensor and assess their contribution to the improvement of the predictability of the Melissa hurricane. The results reported here are the first using the ATMS data in this center, and they are essential for establishing a consistent radiance database for the assimilation process in the new Brazilian climate prediction model being developed by CPTEC/INPE and partners, the Model for Ocean-laNd-Atmosphere PredictioN (MONAN), in phase of imprementation and test.

Keywords: Radiance, ATMS, Data assimilation, Numerical weather prediction, Melissa hurricane.

Acknowledgment: This work was supported by the National Council for Scientific and Technological Development - CNPq (Process No. 304388/2022-0).

How to cite: Viezel, C., Sapucci, L., and Ranieri, V.: Accessing the contribution of Advanced Technology Microwave Sounder (ATMS) in the Brazilian Numerical Modeling and Data Assimilation System, EGU General Assembly 2026, Vienna, Austria, 3–8 May 2026, EGU26-2151, https://doi.org/10.5194/egusphere-egu26-2151, 2026.

Can we control the butterfly effect? This study addresses the fundamental question of whether we can control chaotic weather systems by taking advantage of their sensitivity to initial conditions. Specifically, we explore a theoretical framework to control the system beyond the predictability limit, where infinitesimal perturbations grow to alter the macroscopic trajectory. Based on the Control Simulation Experiment (CSE) framework, we focus on the Duality Principle, which posits that the control problem is mathematically dual to data assimilation (DA). In this view, adding interventions to nature for control is equivalent to adding analysis increments to correct the model forecast for DA. Therefore, controllability can be understood as the synchronization of the nature trajectory with a target model trajectory, analogous to filter convergence in DA. Using the Lorenz 63 model, we present a compelling case study that highlights an apparent paradox within this duality. Our previous paper showed that intervening only in the z-variable was effective for controlling the full system ("z-only intervention"). However, in the dual problem of DA, observing only the z-variable leads to filter divergence ("z-only observation"). Why does intervention succeed where observation fails, despite their theoretical duality? In this presentation, we address this asymmetry and discuss the underlying dynamics of the target trajectory. Based on the Duality Principle, we establish a theory for controlling chaotic systems beyond the predictability limit, opening new pathways for mitigating extreme weather events.

How to cite: Miyoshi, T.: Harnessing the Butterfly Effect: A Duality-Based Framework for the Efficient Control of Extreme Weather, EGU General Assembly 2026, Vienna, Austria, 3–8 May 2026, EGU26-2914, https://doi.org/10.5194/egusphere-egu26-2914, 2026.

The rapid development of AI weather foundation models, such as ECMWF’s AIFS-ENS, promises to revolutionize operational forecasting by delivering competitive skill at a fraction of the computational cost of traditional numerical weather prediction (NWP). However, a critical gap remains: these models currently lack native, robust mechanisms for assimilating real-time, novel observation types, particularly in data-sparse regions. We present a preliminary framework for the first integration of ensemble data assimilation with AIFS-ENS.

This study uses a unique observational capability from Sorcerer long-duration stratospheric balloons, the only platform currently capable of providing simultaneous, high-frequency vertical soundings and multi-day Lagrangian float trajectories from the upper troposphere (12–14 km). To quantify the unique value of this multi-modal data, we conduct a series of Observing System Experiments (OSEs) assimilating: (1) vertical "yo-yo" profiles only, (2) Lagrangian drift velocities only, and (3) a combined hybrid dataset.

We investigate the hypothesis that while vertical soundings constrain thermodynamic profiles, the assimilation of continuous Lagrangian drift data provides a superior constraint on the upper-level wind field and jet stream positioning. We present an assessment of the technical feasibility of assimilating these diverse geometries into an AI-based background and offer a preliminary evaluation of their relative impact on forecast spread and error reduction. This work represents a novel step toward "observation-adaptive" AI prediction, exploring how next-generation hardware and machine learning models can be coupled to close global observing gaps.

How to cite: Tian, X. and Tindle, A.: Assimilation of Long Duration Stratospheric Balloon Drift and Soundings in AI Weather Foundation Models, EGU General Assembly 2026, Vienna, Austria, 3–8 May 2026, EGU26-3090, https://doi.org/10.5194/egusphere-egu26-3090, 2026.

EGU26-3622 | Orals | AS1.1

Impact of observation network non-uniformity on precipitation forecast verification and skill scores 

Sang Myeong Oh, Jeong Eun Kim, and Hyun-Suk Kang

Evaluation of short-range precipitation forecasts is sensitive to the spatial non-uniformity of surface observing networks. Gridded NWP precipitation forecasts are commonly verified against AWS/ASOS rain-gauge observations using point-based binary verification. However, this method is affected by a grid-to-point representativeness mismatch and an uneven station distribution, which can bias domain-aggregated verification scores. Consequently, domain-aggregated verification scores can be disproportionately influenced by observations from densely monitored areas.
Beyond sampling biases arising from network non-uniformity, point-based binary verification is also prone to the double-penalty effect. Displacement of precipitation features can be counted simultaneously as a miss at observation sites and a false alarm nearby. Collectively, these limitations motivate verification frameworks that better reflect the spatial nature of precipitation.
Here we assess how observation-network non-uniformity and verification configuration influence reported precipitation forecast skill over the Korean Peninsula. As a practical step to reduce network-density effects, we interpolated point-based precipitation into a gridded observation field and performed area-based verification in parallel with conventional point-based verification for an annual set of short-range forecasts. The results show that reported skill is highly sensitive to the verification framework; for some precipitation thresholds, the area-based approach yields Critical Success Index (CSI) values that are approximately 50% higher than those from point-based verification. The findings highlight that verification design can materially affect the interpretation of precipitation forecast performance in non-uniform observing networks and underscore the need for spatially representative verification frameworks.

How to cite: Oh, S. M., Kim, J. E., and Kang, H.-S.: Impact of observation network non-uniformity on precipitation forecast verification and skill scores, EGU General Assembly 2026, Vienna, Austria, 3–8 May 2026, EGU26-3622, https://doi.org/10.5194/egusphere-egu26-3622, 2026.

EGU26-4651 | ECS | Posters on site | AS1.1

High-fidelity tropical cyclone prediction improves public risk communication and disaster mitigation 

Xinyue Zhang, Xi Chen, Yuan Liang, Shian-Jiann Lin, Zhi Liang, and Qian Song

Tropical cyclone (TC) ensemble forecasting faces a fundamental dilemma. Parameter-based approaches provide accurate track and intensity estimates but lack the continuous spatial fields needed for impact assessment, whereas ensemble-mean approaches offer complete meteorological patterns yet generate unphysical artifacts such as multiple eyes and weakened intensity due to spatial misalignment. Here we present TC-SuperEns, a two-stage framework that resolves this issue through machine learning optimization and physics-based reconstruction. The first stage learns adaptive weights for key TC parameters from historical forecast errors across seven models, while the second stage uses these parameters as dynamical constraints to align ensemble members and reconstruct physically consistent fields. Validation for 2023-2024 Northwest Pacific TCs shows 15-25% improvement in 72-hour track accuracy compared with operational models, along with notable gains in intensity relative to ECMWF's IFS. By unifying discrete parameters and continuous fields into one coherent product, the framework enhances forecast realism and interpretability for effective warning and response.

How to cite: Zhang, X., Chen, X., Liang, Y., Lin, S.-J., Liang, Z., and Song, Q.: High-fidelity tropical cyclone prediction improves public risk communication and disaster mitigation, EGU General Assembly 2026, Vienna, Austria, 3–8 May 2026, EGU26-4651, https://doi.org/10.5194/egusphere-egu26-4651, 2026.

Low Earth Orbit (LEO) observations are fundamental to global Numerical Weather Prediction (NWP), with the Joint Polar Satellite System (JPSS) serving as a critical pillar for monitoring extreme weather events such as wildfires, hurricanes, and floods. To ensure data continuity into the 2030s, NOAA is transitioning from the current JPSS era—supported by Suomi-NPP, NOAA-20, and NOAA-21—toward future missions, including JPSS-3, JPSS-4, and the innovative Near Earth Orbit Network (NEON) program.

Scientific experiments and formulation studies are critical to developing requirements for future sensor capabilities within the NEON architecture. The primary objective is to demonstrate how next-generation initiatives—such as the QuickSounder and the Series-1 microwave sounder missions—will mitigate data gaps and reduce systemic risks to NWP while enhancing Earth system prediction through technical innovation and commercial data integration. Series-1 will host the Sounder for Microwave-Based Applications (SMBA), a successor to the current Advanced Technology Microwave Sounder sensor on JPSS and QuickSounder missions. It features enhanced capabilities, such as hyperspectral measurements, to mitigate the potential influence of Radio Frequency Interference (RFI) while improving vertical resolution.

To develop a credible mission architecture responsive to program constraints, the LEO program sponsored several Observing System Experiments (OSEs) and Observing System Simulation Experiments (OSSEs). Data from various spaceborne platforms were assimilated alongside conventional observations to evaluate performance across diverse metrics, including root mean square errors and ensemble spread differences in atmospheric profiles for key forecast variables—such as temperature, water vapor, geopotential height, and wind fields—and Forecast Sensitivity-based Observation Impacts. Results from the OSSEs provide quantitative evidence of how various observations influence the accuracy of atmospheric profiling and NWP. Experiments also assessed the impact of microwave and infrared observations on tropical cyclone track and intensity prediction. Furthermore, OSSEs explored the complementarity of current satellite assets with a proposed "geostationary ring" of infrared sounders.

This presentation outlines NOAA’s strategic roadmap for evolving LEO capabilities. This roadmap emphasizes international collaboration, commercial satellite data, and the strategic deployment of advanced sensors to ensure a robust, high-fidelity Earth observation network for the coming decades. Finally, the presentation highlights the high impact of microwave and infrared soundings on NWP models.

How to cite: Kalluri, S.:  Advancing Global Numerical Weather Prediction: Strategic Roadmaps and Experimental Evaluations of NOAA’s Next-Generation LEO Constellations, EGU General Assembly 2026, Vienna, Austria, 3–8 May 2026, EGU26-5876, https://doi.org/10.5194/egusphere-egu26-5876, 2026.

Background and Objectives

As typhoons intensify due to climate change, typhoon modification technology has gained renewed attention. Japan's Moonshot Goal 8 program, launched in 2022, has accelerated technological development in this area. However, social implementation requires addressing not only technical feasibility but also ethical, legal, and social implications (ELSI). While previous studies have qualitatively organized the expectations and concerns held by people regarding typhoons and typhoon modification technologies through dialogue sessions, large-scale investigations of public cognitive structures remain limited. This study aimed to elucidate people’s perceptions regarding expected benefits, ELSI concerns, and relevant stakeholders through a nationwide questionnaire survey.

Methods

1,000 participants comprised across Japan, recruited through a web-based survey with quota sampling by gender, age, and residential region. The questionnaire assessed expected benefits (9 items), ELSI concerns (15 items), stakeholders (14 items), all rated on five-point scales. Cluster analysis was conducted for each domain, followed by two-way ANOVA with residential region (four prefectures most affected by typhoons vs. others) and cluster.

Results

Cluster analysis of expected benefits revealed three clusters: disaster risk reduction, social and broader benefits, and economic applications of technological development. Two-way ANOVA revealed a significant main effect of cluster (F = 270.87, p < .01, η² = .21), with disaster risk reduction rated highest. Neither regional main effect nor interaction was significant.

Cluster analysis of ELSI revealed six clusters: environmental and ecological risks, technological uncertainty and governance, economic costs, decreased disaster preparedness awareness, transformation of social structures and views of nature, and risks of misuse and international conflict. Both cluster (F = 120.13, p < .01, η² = .11) and regional main effects (F = 5.52, p < .05, η² = .01) were significant, with four prefectures showing heightened ELSI concerns. In addition, concerns regarding the cluster of economic costs were the highest.

Cluster analysis of stakeholders revealed five clusters: policy and technical experts, local practitioners and economic actors, general citizens and disaster victims, education and ethics professionals and foreign governments. The cluster main effect was significant (F = 363.12, p < .01, η² = .27), with policy and technical experts deemed most essential. A significant interaction (F = 2.97, p < .05) indicated that four prefectures prioritized consultation with foreign governments over input from education and ethics professionals.

Conclusions

The results of this study indicate that public recognizes both multifaceted expected benefits and ELSI regarding typhoon modification technology. Prefectures of typhoon-affected regions exhibit higher concern of ELSI. In addition, public emphasizes the involvement of stakeholders and recognizes the need for inclusive consensus-building that includes citizens and disaster victims, rather than leaving technological decision-making solely to experts. These findings highlight the importance of communication and consensus-building frameworks that take public awareness structures into account in societal decision-making related to typhoon modification technologies.

How to cite: Su, Y. and Matsuyama, M.: Public Perception of Typhoon Modification Technology: Examining Expected Benefits, ELSI, and Stakeholders, EGU General Assembly 2026, Vienna, Austria, 3–8 May 2026, EGU26-6219, https://doi.org/10.5194/egusphere-egu26-6219, 2026.

Accurate medium-range weather guidance is essential, yet end-users lack clear, location-specific evidence on where forecasts are predictable and which freely available global systems perform best. We present a global evaluation of three conventional numerical weather prediction (NWP) models (ICON, IFS, GEFS) and an AI forecast model (AIFS) for 1-10-day lead times, focusing on four near-surface variables (2-m air temperature, precipitation, 10-m wind speed, and 2-m relative humidity). Using 00 UTC cycles over 1 September 2024 to 30 November 2025, we resampled forecasts to a 1° grid and assessed day-to-day variability (correlation and root mean square error), mean bias, variance bias, and lead-time dependence (drift) against multiple references (primarily JRA-3Q, with additional evaluation against ERA5, station data, and additionally IMERG-Late for precipitation). AIFS achieves the highest skill for temperature, precipitation, and wind at all lead times (relative humidity is unavailable from AIFS); at 3-day lead it explains, on average, 53\% more variance in daily precipitation globally than the next-best model (ICON), and 232\% more variance than GEFS in the tropics. Among the conventional systems, ICON is generally most skillful, while GEFS ranks lowest overall. Mean-bias drift is negligible across models, but variance drift is evident for several variables, most notably increasingly attenuated AIFS precipitation variability with lead time. Model correlation rankings are robust across reference datasets, although precipitation and humidity show greater reference sensitivity than temperature. We also map global predictability using 3-day lead daily temporal correlation of the locally best-performing model, showing highest predictability for temperature and wind in mid-to-high latitudes and markedly lower predictability for precipitation in the tropics. Our study provides actionable guidance on where global forecasts can be trusted and establishes a baseline for future AI and NWP model assessments. 

How to cite: Puthiyaveettil, M., Beck, H., and Ma, J.: Where Is Weather Predictable and Which Models Get It Right? Global Assessment of Conventional and AI-Based ForecastModels, EGU General Assembly 2026, Vienna, Austria, 3–8 May 2026, EGU26-7617, https://doi.org/10.5194/egusphere-egu26-7617, 2026.

Aviation emissions contribute to climate change, one of the key contributors being contrail cirrus clouds. The importance of the impact is strongly influenced by the conditions in which they form and evolve. 

A condensation trail - or contrail - is composed of ice crystals which form behind the aircraft engine exhaust at high altitudes when local weather conditions are favorable. The formation is also influenced by the engine technology and operating conditions, and by the fuel type. The contrail persists and evolves as long as it remains in an ice supersaturated region - or ISSR-, a local atmospheric air mass characterized by a low temperature and a humidity level that is saturated versus ice. Only persistent contrails are considered as having a potential climate effect.

As part of the SESAR CICONIA project and in order to help the forecasting of ISSRs and hence persistent contrail regions, Météo France has implemented a modification to the cloud scheme of the ARPEGE (Action de Recherche Petite Echelle Grande Echelle) operational numerical weather prediction (NWP) model to enable the representation of ISSRs at cruise altitude. As part of the CICONIA project, Météo France provided Airbus with access to this modified version of ARPEGE to use operationally in forecasting areas where persistent contrails could be formed in flight tests.

During October and November 2025 the temperature and humidity from the modified ARPEGE model was used to forecast areas of potential persistent contrail formation and the test flights were performed in these identified areas. In previous test flights the Global Forecast System (GFS) had been used and was again used for these flight tests as a comparison. 

In-flight humidity and temperature measurements are compared to the ARPEGE forecast by interpolating the weather data along the flight trajectories.  The observation of persistent contrails is compared to their simulation along the trajectories using the Airbus in house model. These results support the verification and validation of the data from the modified ARPEGE model. 

In addition, for a particular day, time and area where persistent contrail coverage was forecast, the in-flight measurements from IAGOS aircraft have also been analysed to confirm where the flights were in ISSRs and if persistent contrails were formed. These results and the associated meteorological parameters were compared to the ARPEGE and GFS forecasts and the ERA5 reanalysis datasets.

The stability of the forecast, which was provided as an hourly forecast for the first 48 hours and then 3 hourly up to 72 hours will be discussed. 

The changes to the ARPEGE model to improve the ISSR forecasts, a short description of the studies and analyses of the results for the selected flights will be presented.

How to cite: Mackay, C., Crispel, P., and Arriolabengoa Zazo, S.: The prediction of Ice SuperSaturated Regions and persistent contrail formation using the modified ARPEGE weather forecast and comparison with in-flight measurements and observations., EGU General Assembly 2026, Vienna, Austria, 3–8 May 2026, EGU26-7933, https://doi.org/10.5194/egusphere-egu26-7933, 2026.

Flood inundation damage to the socioeconomic landscape caused by short-term extreme rainfall has been a primary concern for years, particularly regarding shifts in precipitation patterns driven by climate change. To mitigate these impacts, many studies have prioritized the enhancement of flood prevention infrastructure in high-risk areas. However, the construction of permanent facilities requires rigorous scientific assessment and significant investments of time and capital. As an alternative to traditional infrastructure, weather modification strategies are being explored to reduce societal impacts. These strategies include suppressing the formation of cloud systems by altering air currents through the construction of physical obstacles, as well as removing water vapor via proactive cloud seeding. To evaluate the efficacy of seeding in reducing flood risk, we utilized simulated rainfall data from the Weather Research and Forecasting (WRF) model, which incorporates a seeding core module to test rainfall control effectiveness within the Kurokawa River basin, Kyushu, Japan. The results demonstrate that a 10% reduction in 24-hour basin-averaged rainfall led to a 20% decrease in peak discharge (excluding overflow). Correspondingly, the inundation extent was reduced by 20% across different scenarios, with the most significant improvements observed in high-depth areas. To quantify the benefits for stakeholders and the government, this study evaluated potential economic losses. The reduction in inundation successfully mitigated agricultural and property economy losses by approximately 10%. Furthermore, we assessed threats to human life by proposing critical water depth thresholds specific to elderly populations (aged over 65 years old) and younger residents based on housing types and government data. These metrics confirm that rainfall control strategies effectively safeguard the community and the broader economy against climate-driven flood disasters.

How to cite: Chang, J. and Yorozu, K.: Impact of Rainfall Control on Socio-economic Flood Risk Assessment in the Kurokawa River Basin, Japan, EGU General Assembly 2026, Vienna, Austria, 3–8 May 2026, EGU26-8827, https://doi.org/10.5194/egusphere-egu26-8827, 2026.

EGU26-8864 | ECS | Posters on site | AS1.1

A Two-step Time-dependent Enhanced Informer method for numerical weather prediction post-processing 

Xiaole Xu, Hui Qin, Licheng Yang, and Chenghong Li

Reliable precipitation forecasts are crucial for water resource management and flood disaster early warning. However, numerical weather prediction (NWP) products often suffer from systematic biases, limiting their applicability across different regions. To address this issue, this study proposes a Two-step Time-dependent Enhanced Informer (TTEInformer) method for precipitation post-processing. This method employs a two-step classification and regression correction framework. It classifies precipitation into wet and dry days, then performs regression correction on samples identified as wet days, while dry day samples are maintained as zero values. To better capture temporal dependencies, TTEInformer augments the Informer model with a feature extraction module and a bidirectional gated recurrent unit (BiGRU) module. The study evaluates the proposed method over the Yalongjiang River basin upstream of the Yajiang hydrological station and compare it with multiple deep learning baselines. The results indicate that all corrected products substantially reduce forecast errors relative to the raw NWP precipitation. The proposed model demonstrates outstanding performance, achieving an R value of over 0.9 and significantly reducing forecast errors compared to other models. Moreover, the two-step correction framework effectively enhances model correction accuracy compared to traditional direct correction strategies, with notable improvements in correcting light precipitation events. The work provides a reliable post-processing method for hydrometeorological applications in precipitation forecasting.

How to cite: Xu, X., Qin, H., Yang, L., and Li, C.: A Two-step Time-dependent Enhanced Informer method for numerical weather prediction post-processing, EGU General Assembly 2026, Vienna, Austria, 3–8 May 2026, EGU26-8864, https://doi.org/10.5194/egusphere-egu26-8864, 2026.

EGU26-9248 | Posters on site | AS1.1

The Portable Model for multi-scale Atmospheric Prediction (PMAP): Capabilities and development workflows  

Lukas Papritz, Nicolai Krieger, Christian Kühnlein, Sara Faghih-Naini, Till Ehrengruber, Stefano Ubbiali, Gabriel Vollenweider, and Heini Wernli

The Portable Model for multi-scale Atmospheric Prediction (PMAP) is a numerical model currently under development at ECMWF and ETH aimed at large-eddy simulation (LES) of atmospheric flows at the weather-system scale. It builds on a non-hydrostatic, locally conserving, finite-volume, 3D semi-implicit dynamical core coupled to state-of-the-art physics parametrizations. Written entirely in Python, it leverages the GT4Py domain-specific language to achieve high performance and portability – running straightforwardly on laptops and GPU-accelerated HPC systems alike. The systematic separation of concerns between domain science (physics, numerics) and performance engineering (parallelisation, hardware optimisation) provides new avenues for model development, setup, and refinement, which we present in two related contributions.

In this first contribution, we highlight PMAPs strengths as a numerical model framework to flexibly develop and refine numerical algorithms, as well as to implement and extend diagnostics to address research questions in atmospheric sciences. This is illustrated here with an LES tracer transport experiment over complex terrain. We first demonstrate PMAPs capability to perform decametre-scale LES using a height-based terrain-following vertical coordinate in steep terrain with slopes exceeding 80°. This is possible thanks to the locally conservative advection and the 3D semi-implicit integration scheme, which ensures stability of the integration and regularization of the flow. Moreover, we exemplarily show how the Python-based model formulation facilitates evaluating and improving various aspects of flux-form semi-Lagrangian tracer transport schemes in terms of directional splitting approaches and monotonic limiters, and how these impact simulated power spectra of the tracer fields. Lastly, we present how available model diagnostics can easily be extended to perform targeted analyses of sensitivities to implementation details. 

How to cite: Papritz, L., Krieger, N., Kühnlein, C., Faghih-Naini, S., Ehrengruber, T., Ubbiali, S., Vollenweider, G., and Wernli, H.: The Portable Model for multi-scale Atmospheric Prediction (PMAP): Capabilities and development workflows , EGU General Assembly 2026, Vienna, Austria, 3–8 May 2026, EGU26-9248, https://doi.org/10.5194/egusphere-egu26-9248, 2026.

EGU26-9320 | ECS | Posters on site | AS1.1

The Portable Model for multi-scale Atmospheric Prediction (PMAP): Sub-kilometre simulations of recent extreme weather 

Nicolai Krieger, Lukas Papritz, Christian Kühnlein, Seraphine Hauser, Stefano Ubbiali, Gabriel Vollenweider, and Heini Wernli

The Portable Model for multi-scale Atmospheric Prediction (PMAP) is a numerical model currently under development at ECMWF and ETH aimed at large-eddy simulation (LES) of atmospheric flows at the weather-system scale. It builds on a non-hydrostatic, locally conserving, finite-volume, 3D semi-implicit dynamical core coupled to state-of-the-art physics parametrizations. Written entirely in Python, it leverages the GT4Py domain-specific language to achieve high performance and portability – running straightforwardly on laptops and GPU accelerated HPC systems alike. The systematic separation of concerns between domain science (physics, numerics) and performance engineering (parallelisation, hardware optimisation) provides new avenues for model development, setup, and refinement, which we present in two related contributions.

In this second contribution, we present two examples that demonstrate the benefits of resolving small-scale processes for simulating real weather and showcase how PMAP can flexibly be used as a research tool for atmospheric dynamics. (i) First, we demonstrate the benefits of sub-kilometer spatial resolution for accurately simulating the intensification of Hurricane Melissa in late October 2025 as compared to an operational km-scale model. (ii) Second, we present results from a process study of storm Éowyn, which brought record-strong winds to the British Isles in January 2025. LES of the low-level jet along the storm’s bent-back front not only accurately predicts peak wind speeds, but also resolves individual wind gusts in close agreement with observations. We highlight a range of diagnostic tools implemented in PMAP that make such analyses straightforward. Moreover, we demonstrate how the model can be employed to shed light on the atmospheric dynamical processes leading to the storm’s rapid intensification. Specifically, we show the importance of latent heat release by performing modified latent heating experiments, which in the PMAP framework are straightforward to set up, and quantitatively corroborate the crucial impact of cloud microphysical processes for the rapid intensification of Éowyn.

How to cite: Krieger, N., Papritz, L., Kühnlein, C., Hauser, S., Ubbiali, S., Vollenweider, G., and Wernli, H.: The Portable Model for multi-scale Atmospheric Prediction (PMAP): Sub-kilometre simulations of recent extreme weather, EGU General Assembly 2026, Vienna, Austria, 3–8 May 2026, EGU26-9320, https://doi.org/10.5194/egusphere-egu26-9320, 2026.

EGU26-9569 | ECS | Posters on site | AS1.1

Improving precipitation ensemble forecasts over India using a convolutional distributional regression framework 

Chandni Thakur, Martin Widmann, Raghavendra Ashrit, Andrew Orr, Gregor C. Leckebusch, and Ruth Geen

Extreme precipitation events in India are becoming more frequent and intense, increasing the need for reliable ensemble precipitation forecasts to support early warning systems and disaster preparedness. However, current Numerical Weather Prediction models often underestimate extreme precipitation, and their forecast skill is constrained by errors in initial conditions, numerical approximations, inadequate representation of sub-grid convective processes, and coarse spatial resolution. Additionally, systematic biases in ensemble forecast distributions, such as deviations in central tendency and under- or over-dispersion, further limit the accuracy of probabilistic forecasts. Ensemble Model Output Statistics (EMOS) can reduce some of these limitations by correcting systematic biases in the ensemble mean and spread, and by partly adjusting the predicted overall distribution. Classical EMOS relies on linear transformations, limiting the ability to capture non-linear relationships between the original forecast and the corrected ensemble, and to correct asymmetric distribution errors. Moreover, it derives the corrected distribution at a given location only from the original forecast ensemble for this location. Deep learning-based distributional regression methods, such as U-Net architectures, can generalise classical EMOS by linking the original full spatial field of ensemble forecasts in a complex way to the corrected ensemble forecasts.

This study presents a U-Net based distributional regression (DRU) for daily rainfall forecasts over India, that predicts parametric marginal distributions at each forecast grid cell from the statistics of the original ensemble forecast at all grid cells. It minimises the area mean Continuous Ranked Probability Score (CRPS), while classical EMOS minimises the CRPS individually for each location. DRU is applied to postprocess forecasts with one day lead time for daily precipitation at 12-km resolution from 11 members of the National Centre for Medium Range Weather Forecasting (NCMRWF) global ensemble prediction system for the period 2018-2024. The observations for U-Net training are gridded precipitation data at 0.25° resolution from the Indian Meteorological Department and the NCMRWF forecasts were regridded to this resolution prior to DRU training. Over most of India, DRU improves local precipitation distributions, including for higher quantiles, and corrects under- or overdispersion. The forecast skill in terms of Continuous Ranked Probability Skill Score increases over large areas, particularly northern and western India, while in central and northeastern regions, there are locations where the skill decreases. For some of these, the marginal distributions are also not improved. Additionally, DRU improves the reliability for predicting the exceedance probability of various precipitation thresholds. Future endeavours will focus on optimizing DRUs for postprocessing heavy precipitation events and evaluating the forecast skill using the Brier Score.


How to cite: Thakur, C., Widmann, M., Ashrit, R., Orr, A., C. Leckebusch, G., and Geen, R.: Improving precipitation ensemble forecasts over India using a convolutional distributional regression framework, EGU General Assembly 2026, Vienna, Austria, 3–8 May 2026, EGU26-9569, https://doi.org/10.5194/egusphere-egu26-9569, 2026.

EGU26-9670 | Posters on site | AS1.1

Revisiting error models for the assimilation of infrared satellite radiances 

bingying shi, Philipp Griewank, Florian Meier, Jinzhong Min, and Martin Weissmann

Cloud-affected infrared satellites constitute a promising data source for numerical weather prediction models as they contain crucial information on atmospheric clouds and convective activity. Their sensitivity to both hydrometeor content and cloud top height, however, leads to a very non-Gaussian distribution of first-guess (FG) departures, which violates a fundamental assumption of current data assimilation schemes. To mitigate this issue, various cloud-dependent error models for normalizing the departures have been proposed (Geer and Bauer, 2011; Harnisch et al., 2016; Okamoto et al., 2014). In the current presentation, we revisit these error models and propose a refined approach that leads to a more Gaussian distribution.

We quantify the performance of these error methods in detail when applied to one-month infrared observations from the Spinning Enhanced Visible and Infrared Imager (SEVIRI) onboard the Meteosat Second Generation and simulations from the weather forecast model AROME (Application of Research to Operations at Mesoscale) over Austria. While all methods can successfully yield approximately Gaussian FG departure distributions when normalized by the observation error, an additional quality control and a minimum error threshold is necessary for some of them.

While previously published methods estimate the observation error using the average cloud effects from the model and observation spaces, we also introduce a new method that uses the maximum values from these two spaces for observation error calculation. Results show that the new method systematically outperforms the previous methods at no additional cost. Lastly, we analyze the performance of different practical implementation choices, such as using a linear or polynomial fit.

Reference:

Geer, A. J. and Bauer, P.: Observation errors in all-sky data assimilation, Quarterly Journal of the Royal Meteorological Society, 137, 2024–2037, https://doi.org/10.1002/qj.830, 2011.

Harnisch, F., Weissmann, M., and Periáñez, Á.: Error model for the assimilation of cloud-affected infrared satellite observations in an ensemble data assimilation system, Quarterly Journal of the Royal Meteorological Society, 142, 1797–1808, https://doi.org/10.1002/qj.2776, 2016.

Okamoto, K., McNally, A., and Bell, W.: Progress towards the assimilation of all-sky infrared radiances: An evaluation of cloud effects, Quarterly Journal of the Royal Meteorological Society, 140, 1603–1614, https://doi.org/10.1002/qj.2242, 2014.

How to cite: shi, B., Griewank, P., Meier, F., Min, J., and Weissmann, M.: Revisiting error models for the assimilation of infrared satellite radiances, EGU General Assembly 2026, Vienna, Austria, 3–8 May 2026, EGU26-9670, https://doi.org/10.5194/egusphere-egu26-9670, 2026.

EGU26-9826 | Orals | AS1.1

Towards operational monitoring and assimilation of visible reflectances at ECMWF 

Cristina Lupu, Tobias Necker, Samuel Quesada Ruiz, Volkan Firat, and Angela Benedetti

Satellite observations are critical for numerical weather prediction (NWP), yet the full potential of visible and near-infrared spectral data remains to be exploited. In recent years, ECMWF has been advancing efforts to incorporate visible satellite observations into the analysis and forecasting of clouds and aerosols within the Integrated Forecasting System (IFS). These developments are now reaching operational maturity. We present visible reflectance monitoring and assimilation experiments using observations from various satellite instruments: Spinning Enhanced Visible and Infrared Imager (SEVIRI), Flexible Combined Imager (FCI), Advanced Himawari Imager (AHI), Advanced Baseline Imager (ABI), and Ocean and Land Colour Instrument (OLCI). Our study assesses the first-ever successful experimental assimilation of visible (655 nm) all-sky satellite observations in the IFS. A comprehensive evaluation of these experiments demonstrates that visible reflectance assimilation can improve the model analysis of clouds by better fitting the model trajectory to observations in visible reflectance space. We will also discuss the remaining challenges related to the future operational assimilation of visible observations, including error modelling and biases. Our findings underscore the vast potential of visible spectral observations for operational numerical weather prediction and future re-analysis products.

How to cite: Lupu, C., Necker, T., Quesada Ruiz, S., Firat, V., and Benedetti, A.: Towards operational monitoring and assimilation of visible reflectances at ECMWF, EGU General Assembly 2026, Vienna, Austria, 3–8 May 2026, EGU26-9826, https://doi.org/10.5194/egusphere-egu26-9826, 2026.

EGU26-10950 | Posters on site | AS1.1

Performance of the MONAN Model in Forecasting Cyclone Akará and Associated Precipitation Using Object-Oriented Evaluation 

Victor Antunes Ranieri, Luiz Fernando Sapucci, Danilo Couto de Souza, Pedro Leite da Silva Dias, Eduardo Khamis, Caroline Viezel, and Saulo Freitas

Cyclones are frequent meteorological phenomena in Brazil, commonly associated with intense rainfall and strong winds. Most of them are extratropical systems, although subtropical and, more rarely, tropical cyclones also occur. Due to the impacts they cause, understanding the intensity and dynamics of these systems is essential for the scientific community, particularly regarding the ability of numerical models to predict their formation, associated precipitation, and wind fields. In February 2024, Cyclone Akará developed near the southeastern coast of Brazil and, as the third system classified as a tropical cyclone in the South Atlantic, represented a unique opportunity for study. With the development of the MONAN model (Model for Ocean-laNd-Atmosphere predictioN), built through a multi-institutional effort, the need arose to evaluate its performance in forecasting extreme events, especially those associated with cyclones that directly affect the country. This study aimed to analyze MONAN’s ability to represent precipitation fields and mean sea level pressure (MSLP) associated with Cyclone Akará, comparing different versions of the model from the implementation/development process. To achieve this, an object-based approach was adopted using the MODE tool (Method for Object-Based Diagnostic Evaluation). ERA5 reanalysis data (ECMWF) were used as reference to compare the cyclone’s position and intensity, while precipitation was assessed using the MERGE product (CPTEC/INPE), a high-resolution, blended rainfall dataset that combines satellite information with in situ gauge measurements to create a homogeneous daily record for South America. The evaluation focused on the intensification phase of the cyclone (February 16), considering attributes such as centroid distance, area, and total interest of the objects, in addition to traditional metrics such as RMSE, BIAS, and CSI. The results showed that the updated version performed better in forecasting intense precipitation. The detailed assessment of this event offered valuable insights for the continuous improvement of the model, contributing to the strengthening of the Brazilian numerical weather prediction system.

Keywords: Cyclone Akará, MONAN model, Precipitation, Model Evaluation, MODE.

Acknowledgment: This study was supported by the São Paulo Research Foundation - FAPESP (Process No. 2025/06119-7) and National Council for Scientific and Technological Development - CNPq (Process No. 304388/2022-0).

How to cite: Antunes Ranieri, V., Fernando Sapucci, L., Couto de Souza, D., Leite da Silva Dias, P., Khamis, E., Viezel, C., and Freitas, S.: Performance of the MONAN Model in Forecasting Cyclone Akará and Associated Precipitation Using Object-Oriented Evaluation, EGU General Assembly 2026, Vienna, Austria, 3–8 May 2026, EGU26-10950, https://doi.org/10.5194/egusphere-egu26-10950, 2026.

From 17 to 22 July 2021, Henan Province in China experienced an exceptionally severe rainfall event (hereafter referred to as the “7·21” rainstorm). In particular, record-breaking local hourly precipitation occurred in Zhengzhou on 20 July, posing an unprecedented challenge to mesoscale numerical weather prediction (NWP) systems. Uncertainty is inherent in NWP, and ensemble forecasting has increasingly become the consensus approach for quantifying such uncertainty. The use of growing initial perturbations is essential for achieving high ensemble forecast skill. To investigate the influence of initial perturbations on forecast errors during this extreme rainfall event, this study applies the orthogonal conditional nonlinear optimal perturbation method (O-CNOP-Is) to construct an ensemble perturbation strategy tailored to the Henan rainstorm. The aim is to improve the representation of extreme precipitation and its associated forecast uncertainty, thereby providing new technical support for the prediction and early warning of similar high-impact events in the future.

The O-CNOP-Is represent a set of mutually orthogonal growing initial perturbations that satisfy prescribed physical constraints and exhibit the maximum nonlinear evolution at the forecast time. In this study, an O-CNOP-Is computation framework is established using the regional mesoscale Weather Research and Forecasting (WRF) model. The Global Ensemble Forecast System (GEFS) provided by the National Centers for Environmental Prediction is used as the source ensemble of initial perturbation samples. An ensemble projection algorithm is employed to derive a set of O-CNOP-Is perturbation fields specifically targeted at the “7·21” rainfall event, fully accounting for the nonlinear evolution of the model. These O-CNOP-Is are then superimposed onto the background field to generate an ensemble whose members embody the strongest features of uncertainty growth. The resulting ensemble forecasts are compared with those from the GEFS to assess the effectiveness of CNOP-type perturbations in ensemble forecasting of extreme precipitation.

The numerical results indicate that the initial perturbations provided by O-CNOP-Is are physically reasonable for regional ensemble prediction. The perturbation amplitudes increase with time, and their spatial structures effectively reflect the baroclinic instability characteristics of the evolving atmosphere. Compared with GEFS perturbations, O-CNOP-Is contain more uncertainty information at the initial time and exhibit stronger perturbation growth at the forecast time. Throughout the forecast period, the O-CNOP-Is ensemble displays larger ensemble spread that better matches the forecast errors. Moreover, the ensemble mean forecast shows notable improvements in reproducing both the location and peak intensity of extreme precipitation centers.

Overall, the results demonstrate that the conditional nonlinear optimal perturbation approach is a highly promising method for capturing the dominant error growth modes in the Henan rainstorm. It effectively enhances ensemble forecast skill for high-impact, strongly nonlinear extreme weather events such as the “7·21” Henan rainfall, and provides a solid scientific basis and practical foundation for the development of regional mesoscale ensemble forecasting systems.

How to cite: liu, Y. and liu, J.: The Role of Orthogonal Conditional Nonlinear Optimal Perturbations (O-CNOPs) in Ensemble Forecasting of Extreme Rainfall: Improvement and Physical Perturbation Mechanisms, EGU General Assembly 2026, Vienna, Austria, 3–8 May 2026, EGU26-12835, https://doi.org/10.5194/egusphere-egu26-12835, 2026.

EGU26-12842 | ECS | Posters on site | AS1.1

Multi-Sphere Covariance Analysis for Coupled Assimilation 

Jinrong Fu and Juanjuan Liu

Coupled data assimilation (CDA) is a core method for achieving seamless forecasting with Earth system models (ESMs). It provides high-quality initial conditions for coupled models, minimizes inter-component imbalances to the greatest extent, and better utilizes observational networks. Based on whether cross-component information transfer is achieved, CDA can be classified into weakly coupled data assimilation (WCDA) and strongly coupled data assimilation (SCDA). SCDA, which incorporates cross-component information transfer, can produce more balanced and consistent analysis fields, thereby improving forecast skill. According to ECMWF (refer to the literature Coupled data assimilation at ECMWF: current status, challenges and future developments), strongly coupled data assimilation enables the transfer of observational information across different Earth system components during the assimilation phase.

This study employs the high-resolution version of the global sea-land-air-ice system model FGOALS-g3, developed by the State Key Laboratory of Numerical Modeling for Atmospheric Sciences and Geophysical Fluid Dynamics (LASG) at the Institute of Atmospheric Physics, Chinese Academy of Sciences, along with the Dimension-Reduced Projection Four-Dimensional Variational (DRP-4DVar) system, to conduct single-point coupled assimilation experiments. The aim is to investigate how cross-component covariance specifically regulates the transfer of observational information between Earth system components. The experimental results show that within the coupled framework, assimilating only a single-point surface pressure observation in the atmosphere not only generates analysis increments for atmospheric wind and temperature but also influences the state of the ocean surface layer. Similarly, assimilating only a single-point sea surface temperature observation not only produces analysis increments for sea surface height but also induces responses in the lower atmospheric state.

How to cite: Fu, J. and Liu, J.: Multi-Sphere Covariance Analysis for Coupled Assimilation, EGU General Assembly 2026, Vienna, Austria, 3–8 May 2026, EGU26-12842, https://doi.org/10.5194/egusphere-egu26-12842, 2026.

EGU26-13006 | ECS | Posters on site | AS1.1

Quantification of 6-hour precipitation field smoothing in deterministic Machine Learning-based Weather Forecasts 

Csontos András, Leelőssy Ádám, and Varga Ákos

Starting in the early 2020s, artificial intelligence-based models (Machine Learning Weather
Prediction, MLWP) play an increasingly important role in weather forecasting. Their widely known
advantages make the use of MLWP models desirable in the future; however, it is important to have
a thorough understanding of the nature of their prediction fields and their strengths and weaknesses.
Most deterministic MLWP models have been trained using a Mean Squared Error (MSE)-
based cost function. The effective resolution of these models decreases as the forecast time
increases to avoid the double penalty occurring in the evaluation of sharp precipitation fields. It has
been shown that the effective resolution of a MLWP model forecast field is equivalent to the
ensemble average for forecast time period which had been explicitly included in the model cost
function. Since this similarity to the ensemble mean provides a strong basis for the operational
interpretation of the MLWP forecasts, it is important to verify it using model data for different
atmospheric variables.
In our work, we examined the effective resolution of a particularly important variable in
forecasting practice, the 6-hour precipitation field, by comparing the ECMWF-AIFS MLWP model,
the ECMWF HRES ensemble average, and the ERA5 reanalysis data. Effective resolution is usually
determined by examining the spectrum of model fields. However, since precipitation is a highly
localized and non-continuous atmospheric variable, we considered it appropriate to quantitatively
examine the smoothing of the fields in addition to spectral analyses. The aim of our calculations
was to determine how long the smoothing of ECMWF-AIFS precipitation forecasts follows the
ensemble average and how much they deviate from reality as represented by ERA5. We defined
smoothing as the extent to which the ERA5 precipitation field, which most accurately represents the
real field, needs to be smoothed using Gaussian filters in order for its sharpness indicators to match
those of the given forecast. Since smoothing in the precipitation field of MLWP models occurs not
only in the spatial structure but also in the reduction of extremes, we have developed a separate
method for examining sharpness that focuses exclusively on extreme values, based on the
examination of the exponential approximation of the global distribution of 6-hour precipitation
intensity.
Our results show that the agreement between the MLWP model and the ensemble mean
smoothing over the training period is only achieved in the case of extratropical precipitation
dominated by synoptic-scale processes. We did not observe such an agreement at all in tropical
areas with predominantly convective precipitation. We obtained similar results using a sharpness
metric developed for extreme values, i.e., the MLWP model's smoothing of extreme values only
matched the ensemble mean in the extratropics These results indicate that MLWP models can only
successfully predict processes on a sufficiently large scale and smooth small-scale processes such as
convection.

How to cite: András, C., Ádám, L., and Ákos, V.: Quantification of 6-hour precipitation field smoothing in deterministic Machine Learning-based Weather Forecasts, EGU General Assembly 2026, Vienna, Austria, 3–8 May 2026, EGU26-13006, https://doi.org/10.5194/egusphere-egu26-13006, 2026.

EGU26-14986 | Posters on site | AS1.1

On the Multiscale contributors to quantitative precipitation forecast uncertainty in the US West Coast 

Sara Michelson, Evelyn Grell, and Jian-Wen Bao

Wintertime heavy precipitation and flooding events along the US West Coast are associated with intense onshore water vapor transport by atmospheric rivers (ARs).  Although it has been widely recognized that the uncertainty in AR forecasts is a major contributor to the uncertainty in quantitative precipitation forecast (QPF) along the US West Coast, from the perspective of the atmospheric general circulation, there are multiscale contributors to the QPF uncertainty, depending on the forecast lead time and the forecast model domain size.  It remains a major forecasting and risk-management challenge to understand and quantify the multiscale interactions between uncertainties in forecasts of the upper-level jet in the North Pacific and the genesis and evolution of extratropical cyclones, whose AR-induced moisture transport directly contributes to heavy precipitation events. 

In this presentation, we leverage an ongoing effort to evaluate NOAA's newly developed AR forecast system to untangle the interactions among the multiscale controllers that contribute to the QPF uncertainty along the US West Coast.  We will show using precipitation and atmospheric analysis datasets that the QPF uncertainty along the US West Coast, dependent on the forecast lead time and the model's forecast domain size, can be linked to the uncertainties in the forecasts of convective activities in the tropical Pacific, the interaction between tropical convection and upper-level jet in the North Pacific, and the genesis and evolution of extratropical cyclones associated with the upper-level jet.

How to cite: Michelson, S., Grell, E., and Bao, J.-W.: On the Multiscale contributors to quantitative precipitation forecast uncertainty in the US West Coast, EGU General Assembly 2026, Vienna, Austria, 3–8 May 2026, EGU26-14986, https://doi.org/10.5194/egusphere-egu26-14986, 2026.

EGU26-14992 | Posters on site | AS1.1

Testing and Evaluation of an Atmospheric River Prediction Model 

Evelyn Grell, Jian-Wen Bao, Sara Michelson, Lisa Bengtsson, and Lief Swenson

An atmospheric river analysis and forecast system (AR-AFS) is being developed by NOAA’s Environmental Modeling Center to better understand and predict the extreme precipitation events induced by atmospheric rivers (ARs).  This system is a limited-area version of NOAA’s Unified Forecast System, with 3-km horizontal resolution.  As part of a community effort to optimize the system’s performance, we are currently evaluating the impact of different physics parameterizations on the system’s quantitative precipitation forecast (QPF) along the US West Coast. 

To a large degree, the accuracy of the precipitation forecast for a landfalling AR is determined by synoptic-scale, dynamical forcing; however, the parameterized physical processes in the model also play an important role.  The factors contributing to errors in QPF are multiscale in nature, and vary in their sensitivity to the model representation of both dynamical and physical processes.  Using precipitation observations as well as meteorological analyses, we present an evaluation of the impact of different physics parameterizations on the model performance.

How to cite: Grell, E., Bao, J.-W., Michelson, S., Bengtsson, L., and Swenson, L.: Testing and Evaluation of an Atmospheric River Prediction Model, EGU General Assembly 2026, Vienna, Austria, 3–8 May 2026, EGU26-14992, https://doi.org/10.5194/egusphere-egu26-14992, 2026.

EGU26-15380 | Posters on site | AS1.1

Control simulation experiments using a differentiable global climate model: A case study of Typhoon Jebi (2018) 

Masuo Nakano, Tomoe Nasuno, and Chihiro Kodama

Control simulation experiments (CSEs) aim to steer model predictions toward a desired target by intervening in the model inputs. This concept is mathematically analogous to data assimilation, in which model states are adjusted to align with observations. In recent machine-learning models, automatic differentiation is used to compute gradients of a loss function and to optimize model parameters to minimize the difference between predictions and targets (e.g., reanalysis data). By optimizing input variables (initial conditions) instead of model parameters, CSEs can be formulated for differentiable models. In this study, we conduct CSEs for Typhoon Jebi (2018) using NeuralGCM, a fully differentiable global climate model. Tropospheric temperature perturbations are optimized to minimize the mismatch of 500-hPa geopotential height (Z500) over 130°E–160°E and 10°N–40°N. The results demonstrate that the predicted fields converge toward the target, indicating that CSEs can be successfully implemented and executed in a differentiable GCM framework.

How to cite: Nakano, M., Nasuno, T., and Kodama, C.: Control simulation experiments using a differentiable global climate model: A case study of Typhoon Jebi (2018), EGU General Assembly 2026, Vienna, Austria, 3–8 May 2026, EGU26-15380, https://doi.org/10.5194/egusphere-egu26-15380, 2026.

EGU26-15584 | Orals | AS1.1

Automated Selection of Meteorological Ensemble Members for Inversions 

Sasha Ayvazov, Tom Veness, Marcus Russi, Nicholas LoFaso, Marvin Knapp, Ethan Kyzivat, Joshua Benmergui, and Steven Wofsy

Atmospheric inversions rely on accurately modeled atmospheric conditions, especially wind speeds, often for days in the past. Most atmospheric model products - ECMWF, GFS, and HRRR in our case - report on a scale of 0.1 - 0.5 degrees, or ~10 - 50km. These products can work quite well for inversions at coarse mesoscale resolutions, that model winds for ~100 - 1000km and beyond. However, inversions working at finer scales face significant problems in trying to model winds over a single or even a few meteorological model grid cells.


The MethaneSAT mission attempts to run an atmospheric inversion at a scale of 4km x 4km through the CORE algorithm (Described by Knapp et al at EGU2026), and in trying to extract emissions from instrument observations, we sometimes see plumes that run 30 degrees or more off of model wind directions. Wind speed and especially direction errors at this scale often lead to failed inversions, accounting for a roughly 10% - 20% loss of scenes collected by MethaneSAT, second only to cloudiness.


Luckily, many atmospheric model products are distributed as both a single estimate and as an ensemble product, containing dozens of perturbed forecasts for every time step. To minimize the CORE inference error induced by error in wind estimates, we present a technique for quickly and efficiently analyzing the wind fields in comparison to the concentration Level3 maps in order to select the most likely ensemble member. We utilize a novel Total Variation approach to quantify the expected alignment of wind fields with measured methane gradients, and select the ensemble product whose winds are most likely to produce the observed concentration map.


We demonstrate this technique on both simulated and real MethaneSAT data, and discuss the effects this has on both success rate of the inversion and on residual errors from the inversion, though the approach is not specific to methane, and is broadly applicable in any case where winds are the primary drivers of transit. Special care is taken to identify pathological cases of wind error, and how these could be addressed in the future.

How to cite: Ayvazov, S., Veness, T., Russi, M., LoFaso, N., Knapp, M., Kyzivat, E., Benmergui, J., and Wofsy, S.: Automated Selection of Meteorological Ensemble Members for Inversions, EGU General Assembly 2026, Vienna, Austria, 3–8 May 2026, EGU26-15584, https://doi.org/10.5194/egusphere-egu26-15584, 2026.

Since 1972, the US Weather Modification Reporting Act has required federal reporting of any cloud seeding activities taking place in the United States to NOAA. Leveraging these historical records, we used OpenAI’s o3 large language model to extract information about the project name, year, season, state, operator, seeding agent, apparatus used for deployment, stated purpose, target area, control area, start date and end data of all publicly reported cloud seeding activities (Donohue and Lamb, 2025). This method was validated through the performance of the data extraction pipeline on a manually labeled subset of 200 records, achieving an average accuracy of 98.38% across all fields. This structured data set, encompassing 832 distinct operational periods from 2000 – 2025, represents the first large-scale, publicly available data set of cloud seeding activities for the US that can facilitate large-scale historical analysis.

Using this data set, we use synthetic control, a statistical method to estimate the effect of an intervention, to understand whether cloud seeding is an effective strategy for augmenting snowpack and precipitation from a climatological perspective. Using the reported locations and times of historical cloud seeding operations, along with historical datasets of precipitation and snowpack, we analyze whether cloud seeding can have a climatologically significant impact in augmenting precipitation and snowpack regionally. Our approach makes it possible to rigorously evaluate cloud seeding effectiveness on a climatological scale across the US for the first time.

How to cite: Lamb, K. and Donohue, J.: Using Synthetic Control to Assess the Climatological Significance of Cloud Seeding in the Western US with a Structured Data Set of Reported Activities from 2000 – 2025, EGU General Assembly 2026, Vienna, Austria, 3–8 May 2026, EGU26-15743, https://doi.org/10.5194/egusphere-egu26-15743, 2026.

EGU26-15763 | ECS | Orals | AS1.1

Enhancing subseasonal forecasting skill with land observations and physics-informed deep learning 

Melissa Ruiz-Vásquez, Sungmin Oh, Peter Düben, and René Orth

Subseasonal forecasts, which predict weather patterns from weekly up to seasonal timescales, are crucial to minimize the adverse impacts of extreme weather events, such as heatwaves and droughts, on ecosystems and society. However, forecast skill at subseasonal lead times remains limited, as the chaotic nature of the atmosphere reduces the usefulness of the information contained in atmospheric initial conditions for increasing lead times. In contrast, land surface states, including soil moisture and vegetation anomalies, evolve more slowly and retain memory over weeks, allowing them to persist across subseasonal timescales and making them a potentially important source of predictability. Despite this, most operational weather forecast models represent only the mean seasonal cycle of land conditions, because accurately incorporating land surface anomalies remains challenging and can degrade model performance.

In order to address this situation, we develop a prototype of a hybrid weather prediction model to forecast near-surface temperature and surface soil moisture and related extremes. The model leverages the flexibility of deep learning to build on (i) satellite-based land surface observations, (ii) short-range forecasts from the Integrated Forecasting System to inform the model with physically consistent atmospheric evolution, and (iii) previous meteorological conditions sourced from reanalysis data. First results suggest that land surface anomalies exert a stronger influence during extreme conditions, when land memory persists, whereas under average conditions their influence is more evenly shared with atmospheric anomalies. Our study provides a benchmark for integrating land surface information into hybrid forecasting systems and highlights pathways to improve subseasonal prediction and early warning systems.

How to cite: Ruiz-Vásquez, M., Oh, S., Düben, P., and Orth, R.: Enhancing subseasonal forecasting skill with land observations and physics-informed deep learning, EGU General Assembly 2026, Vienna, Austria, 3–8 May 2026, EGU26-15763, https://doi.org/10.5194/egusphere-egu26-15763, 2026.

EGU26-15804 | ECS | Posters on site | AS1.1

Improving ICON-DREAM Cloud Information through AI-driven Data Assimilation 

Nastaran Najari, Roland Potthast, Jan Keller, Stefanie Hollborn, and Thomas Deppisch
Accurate cloud information is essential for short-range weather prediction, yet remains a major source of uncertainty in limited-area ensemble systems such as ICON-DREAM. In particular, cloud cover forecasts are affected by model resolution constraints and simplified cloud representations, limiting their skill at nowcasting time scales.


Geostationary satellite observations provide frequent and spatially detailed information on cloud evolution, offering valuable constraints for improving cloud-related model fields. However, the direct integration of such observations into numerical weather prediction systems is computationally demanding and often not feasible for high-frequency updates.


In this contribution, we present an AI-driven data assimilation approach that improves cloud cover information in ICON-DREAM through a variational post-processing framework. The method combines concepts from variational data assimilation with graph neural networks to explicitly account for spatial dependencies in cloud fields. Background forecasts from ICON-DREAM are represented on a spatial graph, while satellite-derived cloud information from SEVIRI is incorporated via a loss function that balances consistency with observations, consistency with the model background, and spatial regularisation.
The framework is trained on historical forecast–observation pairs and evaluated for very short-range lead times of up to several hours. The results demonstrate a systematic improvement in cloud cover forecasts compared to the raw ICON-DREAM output for short-range lead times.


These findings highlight the potential of AI-driven data assimilation concepts to enhance cloud information in ensemble prediction systems without modifying the underlying numerical model, and illustrate a flexible pathway for exploiting satellite observations in very short-range forecasting applications.

How to cite: Najari, N., Potthast, R., Keller, J., Hollborn, S., and Deppisch, T.: Improving ICON-DREAM Cloud Information through AI-driven Data Assimilation, EGU General Assembly 2026, Vienna, Austria, 3–8 May 2026, EGU26-15804, https://doi.org/10.5194/egusphere-egu26-15804, 2026.

EGU26-15881 | Posters on site | AS1.1

Impact of GNSS Radio Occultation and Reflectometry Data Assimilation on Tropical Cyclogenesis Prediction 

Shu-Ya Chen, Quan Pham Xuan, Ching-Yuang Huang, Ying-Hwa Kuo, and Shu-Chih Yang

Accurate prediction of tropical cyclogenesis is fundamental to enhancing typhoon forecasting and disaster mitigation. This study investigates the impacts of Global Navigation Satellite System (GNSS) observations on cyclogenesis predictions by integrating a multi-case statistical evaluation with a targeted case study. Initially, the impact of GNSS Radio Occultation (RO) data assimilation (DA) was assessed by assimilating both conventional observations and RO data in ten tropical cyclone cases in the Northwestern Pacific from 2020 to 2022. Utilizing the WRF hybrid-3DEnVar system, the results demonstrate that incorporating RO data with a nonlocal excess phase operator improves the accuracy of cyclogenesis localization and timing, a finding further corroborated by ensemble forecasts.

Beyond RO, this research explores the potential of integrating GNSS Reflectometry (GNSS-R) data, which provides sea surface wind speed information to better capture the near-surface dynamical environment during the early stages of cyclogenesis. In a case study of Typhoon Gaemi (2024), RO data assimilation successfully captured the cyclogenesis signal that was missed in experiments without RO. Furthermore, jointly assimilating RO and GNSS-R observations (RO+R) refined the predicted genesis timing compared with RO-based experiments. These findings suggest the potential to use multi-source GNSS observations to improve the precision of tropical cyclogenesis forecasting.

How to cite: Chen, S.-Y., Pham Xuan, Q., Huang, C.-Y., Kuo, Y.-H., and Yang, S.-C.: Impact of GNSS Radio Occultation and Reflectometry Data Assimilation on Tropical Cyclogenesis Prediction, EGU General Assembly 2026, Vienna, Austria, 3–8 May 2026, EGU26-15881, https://doi.org/10.5194/egusphere-egu26-15881, 2026.

EGU26-15894 | ECS | Posters on site | AS1.1

Evaluation of KIM-Regional/Local Forecast Model Performance Based on the Korea Physics Parameterization Package 

Soyeon Jeong, Jeongsoon Lee, Eunhee Lee, and Yong-Hee Lee

  As the demand for high-resolution weather forecasts continues to increase, operational numerical weather prediction centers face challenges in maintaining model consistency across horizontal scales while accurately representing region-specific physical processes. This study evaluates the KIM-Regional/Local system, a unified modeling framework employing the Korea Physics Parameterization Package (KPPP) optimized for the Korean Peninsula. The system operates on two nested scales: a 3-km regional domain covering East Asia (5-day forecasts) and a 1-km local domain covering the Korean Peninsula (2-day forecasts). A key distinction in their configuration is the treatment of convection: cumulus parameterization is applied in the 3-km regional model, whereas the 1-km local model is configured as convection-permitting, explicitly resolving deep convection without a cumulus scheme. Both domains share identical dynamical cores and other KPPP components.
  KPPP introduces several key advancements optimized to regional environmental conditions. These developments include refinements to microphysical processes, along with enhanced radiative parameterizations that account for all-sky radiation and topographic slope and shading effects. The land surface scheme includes observation-based refinements to tree and canopy height, which are expected to improve the representation of surface fluxes. To enhance initial and boundary conditions, an oceanic mixed-layer model is activated, and spatially and temporally varying Charnock coefficients are introduced for sea surface roughness calculations, replacing the previously used constant values. Together, these developments are introduced to better represent key physical processes in the model, while accounting for computational efficiency required for operational application.
  Forecast performance was evaluated for representative summer and winter periods through comprehensive verification of surface and upper-air variables against observations, alongside quantitative precipitation forecasts assessment. The most pronounced improvements are found in surface verification results, particularly in surface wind speed, where the Root Mean Square Error (RMSE) is substantially reduced compared to the current operational system. Overall enhancements are also evident in precipitation performance, with reduced biases across forecast ranges in both the 3-km and 1-km domains. These results indicate that region-specific physics development provides a robust pathway toward operationally reliable high-resolution prediction systems over regions with complex terrain.

How to cite: Jeong, S., Lee, J., Lee, E., and Lee, Y.-H.: Evaluation of KIM-Regional/Local Forecast Model Performance Based on the Korea Physics Parameterization Package, EGU General Assembly 2026, Vienna, Austria, 3–8 May 2026, EGU26-15894, https://doi.org/10.5194/egusphere-egu26-15894, 2026.

EGU26-15923 | Posters on site | AS1.1

Impact of Aircraft Temperature Bias Correction in the Korean Integrated Model (KIM)  

YeJin Lee, Ji-Hyun Ha, and YougHee Lee

The forecast performance of numerical weather prediction models strongly depends on the accuracy of the initial conditions, which is largely determined by the quality of observations used in data assimilation. Aircraft observations provide three-dimensional atmospheric information over data-sparse regions, such as the upper level and oceans, thereby complementing the spatial inhomogeneity of the global observations and contributing to improvements in initial conditions. However, aircraft temperature observations are known to exhibit positive biases compared to radiosonde observations, and correcting these biases is an important challenge for improving forecast performance.
The Korea Meteorological Administration (KMA) has been operating the latest version of the Korean Integrated Model (KIM) v4.0 operationally since May 2025, but aircraft temperature bias correction has not yet been applied. In this study, two experiments were conducted in July 2025 to quantitatively evaluate the impact of aircraft temperature bias correction on forecast performance using KIM v4.0 at an approximately 25 km horizontal resolution: one experiment applied bias correction globally, while the other applied it selectively over regions north of 30°N. This latitude threshold was determined based on the spatial distribution characteristics of temperature biases identified in the KIM v4.0. Aircraft observations were stratified into three vertical layers (lower: 1050–700 hPa, middle: 700–300 hPa, upper: 300–150 hPa), and aircraft ID temperature bias correction coefficients were derived and applied during the observation preprocessing step. 
The experiment applying bias correction north of 30°N showed overall improved forecast performance of temperature and geopotential height over the Northern Hemisphere and North America compared to the globally applied experiment. Additionally, performance improvements were observed in East Asia during the later forecast periods (days 4–5), with lower-level specific humidity and temperature showing improvements of 1.18% and 1.55%, respectively. These results demonstrate that selective temperature bias correction considering the spatial characteristics of aircraft observations can contribute to improving forecast performance in numerical weather prediction models.

How to cite: Lee, Y., Ha, J.-H., and Lee, Y.: Impact of Aircraft Temperature Bias Correction in the Korean Integrated Model (KIM) , EGU General Assembly 2026, Vienna, Austria, 3–8 May 2026, EGU26-15923, https://doi.org/10.5194/egusphere-egu26-15923, 2026.

This study explores how different integration strategies for infrared (IR) and microwave (MW) brightness temperatures (TBs) impact precipitation forecasting within a 3D-Var all-sky radiance data assimilation (DA) framework. To improve heavy rainfall forecasts over the Korean Peninsula, we propose an asynchronous assimilation strategy. In this approach, when IR and MW observations overlap, we prioritize MW TBs and intentionally exclude IR TBs to minimize potential redundancies and physical inconsistencies in cloud representation. We compared this proposed method against two common synchronous strategies: one assimilating clear-sky IR with all-sky MW, and another integrating both IR and MW under all-sky conditions. Using a heavy precipitation case over Korea as a testbed, we assimilated AHI (Himawari-8), GMI (GPM), and AMSR2 (GCOM-W) data to evaluate their impacts on hydrometeor analysis and subsequent forecast accuracy. Our results indicate that the asynchronous strategy leads to a more balanced vertical distribution of solid and liquid hydrometeors, resulting in the most reliable precipitation forecasts. In contrast, the all-sky IR+MW strategy tended to overemphasize upper-level clouds while reducing low-level moisture, leading to biased localized rainfall. Meanwhile, the clear-sky IR+MW approach failed to adequately capture upper-level stratiform structures. These findings suggest that an optimized, sensor-specific integration strategy is essential for maximizing the benefits of multi-platform satellite data assimilation.

How to cite: Hwang, J. and Cha, D.-H.: Optimizing Synergistic Strategies of IR and MW Radiance in All-sky Data Assimilation for Heavy Precipitation Forecasting, EGU General Assembly 2026, Vienna, Austria, 3–8 May 2026, EGU26-16528, https://doi.org/10.5194/egusphere-egu26-16528, 2026.

EGU26-16609 | Orals | AS1.1

The coupled ICON Ocean-Atmosphere System and its Use for Weather-Scale Forecasts 

Daniel Krueger, Alija Bevrnja, Avetik Hayrapetyan, Yunchang He, Thomas Hüther, Nora Schenk, Martin Sprengel, Roland Potthast, Jan Keller, Stefanie Hollborn, Linda Schlemmer, and Günther Zängl

The Earth System Modelling at the Weather Scale (ESM-W) project, a collaboration between the German Weather Service (DWD) and GeoInfoDienst BW, aims to develop a coupled ocean-atmosphere forecasting system. This system utilizes the ICON-O ocean model and the ICON-NWP atmospheric model.

In this presentation, we will showcase the advancements made in the ICON-based coupled global forecasting system. Notably, a near-real-time (NRT) system has been established, comprising a time-critical weakly coupled data assimilation cycle and coupled forecasts with lead times of up to ten days. The ocean component uses a 20km resolution while the atmospheric component uses the operational 13km resolution system. The ocean component assimilates ARGO buoy data and satellite-derived sea surface observations using 3D-VAR(-FGAT) methods, while the atmosphere employs an EnVAR method leveraging ensemble information from DWD’s operational routine. This system has been generating daily analyses and forecasts since May 2025 and is improved continuously.

We will present the coupled system’s developments and performance, including evaluations for both the data assimilation system and the model components. Additionally, we show verification against non-assimilated ocean datasets, such as fixed buoys.

How to cite: Krueger, D., Bevrnja, A., Hayrapetyan, A., He, Y., Hüther, T., Schenk, N., Sprengel, M., Potthast, R., Keller, J., Hollborn, S., Schlemmer, L., and Zängl, G.: The coupled ICON Ocean-Atmosphere System and its Use for Weather-Scale Forecasts, EGU General Assembly 2026, Vienna, Austria, 3–8 May 2026, EGU26-16609, https://doi.org/10.5194/egusphere-egu26-16609, 2026.

EGU26-18633 | Orals | AS1.1

Physics-informed AI systems - how the constraints from NWP can support development of better AI models 

Olafur Rognvaldsson and Karolina Stanislawska

AI-based methods have already proven their skill in weather prediction. The availability of high quality training data and ever more advanced model architectures opened the door for a new range of models providing predictions fast and at a low operational cost. Further development of such models, apart from seeking advancements in the architectural design and increased quality of the training datasets, might require a new approach. One still under-explored dimension is to tighten the link between the data-driven (often weather-system-agnostic) methods and the well established knowledge of atmospheric physics represented by NWP. 

Physics-awareness in AI model development may guide training, reduce compute requirements and improve the consistency of the predicted variables. In this talk we discuss the possible approaches to physics-informed AI model design, ranging from physics-based terms in the cost function to hybrid physical-neural architectures. We show the impact these methods have on the training process and discuss possible improvements in the forecast skill and physical consistency.

How to cite: Rognvaldsson, O. and Stanislawska, K.: Physics-informed AI systems - how the constraints from NWP can support development of better AI models, EGU General Assembly 2026, Vienna, Austria, 3–8 May 2026, EGU26-18633, https://doi.org/10.5194/egusphere-egu26-18633, 2026.

EGU26-18836 | ECS | Orals | AS1.1

Cooling the air: assessing the evaporative cooling potential of sea water spraying as an extreme heat intervention 

Annelot Broerze, Stephan de Roode, and Herman Russchenberg

Extreme heat is emerging as one of the deadliest weather-related hazards under global warming. In response, a growing range of weather and climate interventions has been proposed to locally mitigate extreme thermal stress. The spraying of water into the air is a well-established technique for direct evaporative cooling at small scales, such as in urban or industrial environments. In this study, we assess the potential for larger-scale sea water spraying as a localized extreme heat intervention.

We first quantify the maximum evaporative cooling potential of liquid water spraying and its dependence on air temperature and relative humidity. Under hot and dry conditions, theoretical cooling exceeding 20 °C can be achieved, providing an upper bound for realistic applications. We then employ Large Eddy Simulations (LES) to investigate kilometer-scale cooling of the lower atmosphere in coastal regions experiencing sea-breeze conditions in hot and dry climates. A key innovation of this study is the introduction of sea water spraying from wind turbines, which we compare with spraying from lower infrastructures such as platforms or boats.

The resulting impacts on near-surface temperature and human thermal comfort indices are evaluated, highlighting potential cooling benefits during extreme heat events. Finally, we examine how such cooling influences plume rise, a key process for Marine Cloud Brightening. Our results demonstrate that physically bounded, localized atmospheric interventions may offer a useful tool to mitigate extreme heat in vulnerable regions, while providing insight into the effectiveness and limitations of weather- and climate interventions.

How to cite: Broerze, A., de Roode, S., and Russchenberg, H.: Cooling the air: assessing the evaporative cooling potential of sea water spraying as an extreme heat intervention, EGU General Assembly 2026, Vienna, Austria, 3–8 May 2026, EGU26-18836, https://doi.org/10.5194/egusphere-egu26-18836, 2026.

EGU26-19084 | ECS | Orals | AS1.1

Evaluating Polarimetric Radio Occultations for constraining precipitation microphysics in NWP 

Antía Paz, Ramon Padullés, Estel Cardellach, Katrin Lonitz, and Verònica Vidal

Accuretaly representing the microphysical structure of precipitating systems remains a major challenge in Numerical Weather Prediction (NWP). Cloud and precipitation processes occur at spatial and temporal scales that are not explicitly resolved by current models and must therefore be described through simplified microphysical parameterizations. These parameterizations have a strong impact on key model outputs, such as precipitation intensity, and their improvement requires observations that are sensitive to the vertical structure and microphysical properties of hydrometeors.

Polarimetric Radio Occultations (PRO) provide a complementary observational capability to address this gap. As with standard GNSS Radio Occultations, PRO delivers high vertical resolution thermodynamic profiles under all-weather conditions. In addition, PRO is sensitive to the presence and vertical distribution of hydrometeors through the differential phase shift (ΔΦ), defined as the phase difference between horizontally and vertically polarized GNSS signals. When these signals propagate through non-spherical and/or oriented hydrometeors, differential propagation effects arise, leading to a positive differential phase shift. As a result, PRO measurements offer direct sensitivity to the microphysical structure of precipitating systems.

The accuracy of simulated PRO observables depends on the formulation of the forward operator, particularly on how the relationship between differential phase shift and hydrometeor water content is represented. Recent work has proposed a new forward operator based on a linear relationship that enables the inclusion of scattering-related information as a function of hydrometeor type. In this study, we evaluate the performance of this updated PRO forward operator under Atmospheric River (AR) conditions, which are characterized by intense moisture transport and strong precipitation. Simulations are compared with those produced using the offline forward operator currently implemented at ECMWF to assess whether the new formulation could serve as a viable replacement for operational applications.

Beyond this potential operational impact, the new forward operator enables the use of PRO as a constraint on cloud and precipitation microphysics. By exploiting the Atmospheric Radiative Transfer Simulator (ARTS) scattering database, we analyze the sensitivity of PRO observables to the scattering properties of different particle habits, providing insight into the extent to whether PRO measurements can discriminate between microphysical assumptions and improve the representation of precipitating systems in NWP models.

How to cite: Paz, A., Padullés, R., Cardellach, E., Lonitz, K., and Vidal, V.: Evaluating Polarimetric Radio Occultations for constraining precipitation microphysics in NWP, EGU General Assembly 2026, Vienna, Austria, 3–8 May 2026, EGU26-19084, https://doi.org/10.5194/egusphere-egu26-19084, 2026.

EGU26-19833 | Orals | AS1.1

Global Observing System and Tropical-Extratropical Coupling 

Nedjeljka Žagar, Giovanna De Chiara, Sean Healy, Frank Sielmann, and Chen Wang
It is well established that tropical circulation influences extratropical processes on timescales from days to weeks and beyond, but the underlying mechanisms and their sensitivity to tropical observations and data assimilation remain poorly understood. Recent studies highlight the initialization of synoptic-scale disturbances in the tropics as a key factor for improving medium-range extratropical forecasts. Poleward-propagating signals interact both with the background flow and with large-scale Rossby waves propagating equatorward. Our work highlights  the role of global wind observations in disentangling tropical-extratropical coupling.  
 

The significant impact of Aeolus wind profiles on analyses and forecasts in the tropics underscores the importance of dynamical processes in shaping tropical-extratropical coupling and highlights the need for global wind profile observations. To better understand these processes, we conducted two observing system experiments using the ECMWF data assimilation system: one assimilating observations only within the 15°S-15°N belt, and another assimilating observations only outside this latitude range. Differences between these experiments and a reference experiment using global observational coverage reveal the extent to which the current observing system (GOS) constrains the analyses in the deep tropics and extratropics against influences from unobserved regions.

In the analyses produced by the experiment without tropical observations, only minor signals emerge from the tropics into the extratropics, consistent with a well-observed and well-analysed extratropical circulation in the current GOS. In contrast, we find that assimilating existing tropical observations within the GOS does not sufficiently constrain planetary- and synoptic-scale waves penetrating into the tropics from the extratropics. This echoes previously identified impacts of the Aeolus mission on large-scale tropical circulation. These uncertainties limit the reliability of large-scale tropical circulation in (re)analyses and our ability to predict tropical–extratropical coupling. In particular, uncertainty growth at large scales in medium-range forecasts is likely to dominate over the inverse cascade of effects associated with resolved small-scale processes in numerical models.

How to cite: Žagar, N., De Chiara, G., Healy, S., Sielmann, F., and Wang, C.: Global Observing System and Tropical-Extratropical Coupling, EGU General Assembly 2026, Vienna, Austria, 3–8 May 2026, EGU26-19833, https://doi.org/10.5194/egusphere-egu26-19833, 2026.

EGU26-21470 | Orals | AS1.1 | Highlight

Recent progress and outlook for the ECMWF Integrated Forecasting System 

Johannes Flemming, Stephen English, and Florian Pappenberger

This presentation will provide an overview of recent scientific developments at ECMWF, with focus on the upgrade of the Integrated Forecasting System (IFS) for cycle 50r1.

An upgrade to ECMWF's Integrated Forecasting System (IFS) is scheduled for operational implementation in early 2026.  IFS Cycle 50r1 brings major advances in both the forecast model and the data assimilation system, marking a significant step forward in coupled Earth system prediction. The model upgrade includes the introduction of the NEMO4-SI3 ocean and sea ice model, improved wave-ice interactions, revised vertical diffusion and gravity wave drag in the stratosphere, changes to the convection scheme, a new glacier scheme, and a revisionof the SPP scheme introduced in 2023 that reduces excessive near-surface wind spread in the ensemble. On the data assimilation side, outer-loop coupling has been introduced between the  atmosphere and ocean to provide balanced initial conditions for the coupled forecast model, while further enhancements of weak-constraint 4D-Var introduce time-varying model errors and has been extended to the boundary layer. Cost-efficiency improvements have been made through the use of single-precision trajectories, single-precision ocean model and from reducing the resolution of the first minimisation in the EDA. The system now allows humidity increments in the stratosphere, addressing longstanding issues in moisture analysis at these levels.

A major development of data-driven weather prediction models is the operational implementation (July 2025) of the Artificial Intelligence Forecasting System ensemble (AIFS-ENS). AIFS ENS is trained using a CRPS-based approach, which optimises the probabilistic scores of the ensemble forecasts. It delivers skilful weather forecasts with significantly improved speed and energy efficiency.

The 50r1 update of the ECMWF atmospheric composition forecast led to improved forecast of surface ozone and sulphur dioxide.  A further addition is the routine assimilation of aerosol optical depth retrievals from VIIRS and Sentinel 3. 

Besides the developments for the operational updates, the preparation of the production of 6th generation atmosphere and ocean reanalyses (ERA6/OCEAN6), the new version of the atmospheric composition reanalysis (EAC5), and the next seasonal prediction system (SEAS6) have progressed well.   

How to cite: Flemming, J., English, S., and Pappenberger, F.: Recent progress and outlook for the ECMWF Integrated Forecasting System, EGU General Assembly 2026, Vienna, Austria, 3–8 May 2026, EGU26-21470, https://doi.org/10.5194/egusphere-egu26-21470, 2026.

EGU26-22120 | ECS | Orals | AS1.1

Instability-Aware Perturbations of Extreme Events in an AI Weather Foundation Model 

Moyan Liu, Qin Huang, and Upmanu Lall

Extreme weather events are intensifying under climate change, yet recent advances in weather prediction operate within a forecast-only paradigm that does not directly mitigate impacts once an extreme event is anticipated. Motivated by chaos control theory, we explore whether small, instability-aware perturbations can leverage intrinsic atmospheric sensitivity to influence extreme weather evolution within an AI-based forecasting framework. We use the Aurora foundation model and identify dynamically sensitive perturbation locations using Finite-Time Lyapunov Exponent (FTLE) diagnostics. To implement a physically interpretable intervention compatible with foundation models, we introduce an idealized cloud seeding based perturbation operator that mimics condensation-driven latent heat release applied in the lower–mid troposphere. In a case study, these upstream perturbations induce coherent downstream changes in integrated vapor transport, leading to reduced peak landfall intensity and slower precipitation accumulation. These results demonstrate that instability-aware perturbations within an AI foundation model can induce dynamically meaningful downstream impacts, providing a first step toward bridging chaos control concepts and data-driven weather prediction.

How to cite: Liu, M., Huang, Q., and Lall, U.: Instability-Aware Perturbations of Extreme Events in an AI Weather Foundation Model, EGU General Assembly 2026, Vienna, Austria, 3–8 May 2026, EGU26-22120, https://doi.org/10.5194/egusphere-egu26-22120, 2026.

EGU26-22129 | ECS | Posters on site | AS1.1

Weather Jiu-Jitsu: Prospects for Atmospheric Nudging to Defuse the Impact of Catastrophic Weather Extremes 

Qin Huang, Moyan Liu, and Upmanu Lall

Extreme weather events, e.g., droughts, floods, heatwaves, freezes, increasingly challenge physical, financial, and social infrastructure as population and economic growth increase exposure and vulnerability. We propose supplementing conventional disaster risk management strategies with Weather Jiu-Jitsu, an approach that leverages the chaotic dynamics of weather systems to redirect or dissipate destructive trajectories through targeted, low-energy perturbations. Coupled with deep learning models, this framework could serve as a form of nature-assisted global infrastructure to reduce catastrophic climate-extreme impacts in the 21st century. We demonstrate the potential of this strategy through successful perturbation experiments applied to tropical cyclones, atmospheric rivers, freezes, and other high-impact events.

How to cite: Huang, Q., Liu, M., and Lall, U.: Weather Jiu-Jitsu: Prospects for Atmospheric Nudging to Defuse the Impact of Catastrophic Weather Extremes, EGU General Assembly 2026, Vienna, Austria, 3–8 May 2026, EGU26-22129, https://doi.org/10.5194/egusphere-egu26-22129, 2026.

EGU26-22255 | ECS | Posters on site | AS1.1

Reaching far and wide: accounting for spatially correlated observational errors in an ensemble of 4D-Vars system 

Ivo Pasmans, Elias Holm, Massimo Bonavita, Sarah Dance, and Rishabh Bhatt

Data assimilation (DA) seeks to provide the most likely estimate of the true state of the atmosphere or ocean by combining a background estimate from a numerical model with observations, each weighted by their respective error covariances. For computational reasons, diagonal covariances together with variance inflation have traditionally been favoured for the observational error covariance. However, recent studies have shown that variance inflation can degrade DA performance when the correlation length scales of observational errors are comparable to, or exceed, those of the background errors—a situation frequently encountered when assimilating wind vectors derived from Atmospheric Motion Vectors. These observations are assimilated, alongside many others, in the ensemble DA system at the European Centre for Medium-Range Weather Forecasts (ECMWF). In this system, each ensemble member undergoes an independent 4D-Var minimisation after perturbing its observations and model parameters to represent observational and model uncertainties. This work presents results from efforts to explicitly account for spatial correlations in observational errors within the ensemble DA framework. In particular, it demonstrates the positive impact of introducing spatially correlated perturbations to assimilated observations on ensemble spread, offering a pathway to improved representation of uncertainty in operational forecasting.

How to cite: Pasmans, I., Holm, E., Bonavita, M., Dance, S., and Bhatt, R.: Reaching far and wide: accounting for spatially correlated observational errors in an ensemble of 4D-Vars system, EGU General Assembly 2026, Vienna, Austria, 3–8 May 2026, EGU26-22255, https://doi.org/10.5194/egusphere-egu26-22255, 2026.

EGU26-22510 | Posters on site | AS1.1

What does the complexity of physics parameterization mean, since no parameterization can be exact? 

Jian-Wen Bao, Sara Michelson, and Evelyn Grell

A numerical weather prediction (NWP) model is a computer program that follows a numerical recipe to discretize the governing equations of atmospheric dynamics for numerical solutions.  The center of these governing equations is the Navier-Stokes (NS) equations of fluid motion.  The closure paradox theorem (Guermond et al., 2004, J. Math. Fluid Mech.) for the numerically discretized (i.e., filtered) NS equations states that discretization (i.e., filtering) and exact subgrid closure are mutually exclusive in practice.  To feasibly solve the discretized NS equations, the subgrid closure must be inexact.  All physics parameterization schemes in an NWP model serve as a closure for the discretized governing equations of atmospheric dynamics.  Even though these schemes vary in complexity, the closure paradox theorem implies that none of them can be exact if the objective is to efficiently produce useful forecasts at the NWP model's grid resolution.  Therefore, empirical adjustment, i.e., constraining its behavior using available observations, is inevitable for any physics parameterization scheme to be feasibly used in an NWP model.

In this presentation, we will use the land-surface parameterization scheme as an example to discuss what the complexity of a physics parameterization scheme actually means, since it cannot be exact.  We will argue that the choice of complexity in a scheme is a trade-off between realism and simplicity.  We will show that a simple land-surface scheme may meet performance constraints with modest observational requirements and is computationally inexpensive enough to be practically useful.  In contrast, a more complex land-surface scheme with sounder physical foundations will yield forecasts that are acceptably more accurate only if enough observations are available to constrain its behavior.  When there are insufficient observations to constrain the complex scheme, the simple scheme should be used so that the scheme's behavior can be effectively constrained using available observations.

How to cite: Bao, J.-W., Michelson, S., and Grell, E.: What does the complexity of physics parameterization mean, since no parameterization can be exact?, EGU General Assembly 2026, Vienna, Austria, 3–8 May 2026, EGU26-22510, https://doi.org/10.5194/egusphere-egu26-22510, 2026.

EGU26-526 | ECS | Posters on site | AS1.2

Hima-Net: Deep Learning Enhancement of ECMWF S2S Winter Precipitation Forecasts over Northern India 

Junaid Dar and Subimal Ghosh

Seasonal climate forecasts are critical for disaster management across the fragile Himalayan ecosystem, particularly during winter. However, these forecasts often exhibit strong spatial and temporal biases that reduce their reliability for predicting extremes at longer lead times. Traditional postprocessing methods such as quantile mapping and linear scaling assume stationarity and have limited ability to capture complex spatiotemporal error structures. To address these limitations, this study introduces Hima-Net (Himalayan-Net), a hybrid deep learning model that combines U-Net and Conv-LSTM architectures. Hima-Net is designed to improve the skill of sub-seasonal-to-seasonal (S2S) daily precipitation forecasts from the ECMWF S2S system by learning season-specific spatial and temporal patterns in forecast errors. The model is trained with a loss function that jointly emphasizes magnitude and correlation, enhancing its ability to represent the distribution and evolution of precipitation across lead times. Evaluation using metrics such as root mean square error (RMSE) and anomaly correlation coefficient (ACC) shows that Hima-Net consistently outperforms the raw forecasts across lead times over the Himalayan region. These findings demonstrate the potential of deep learning–based postprocessing to better capture and enhance spatial and temporal forecast patterns, offering a promising pathway for more accurate wintertime precipitation forecasts over the complex terrain of the Himalayas.

How to cite: Dar, J. and Ghosh, S.: Hima-Net: Deep Learning Enhancement of ECMWF S2S Winter Precipitation Forecasts over Northern India, EGU General Assembly 2026, Vienna, Austria, 3–8 May 2026, EGU26-526, https://doi.org/10.5194/egusphere-egu26-526, 2026.

Global Navigation Satellite System Radio Occultation (GNSS RO) observations are increasingly important for improving atmospheric profiling and numerical weather prediction (NWP), especially in cloudy, moisture-rich tropical environments where other satellite observations are often degraded. This study presents two complementary advances: (1) an improved regional quality-control strategy for preserving COSMIC-2 bending-angle data in cloudy regions, and (2) an assessment of the impact of assimilating Tianmu-1 RO observations from a newly deployed 23-satellite commercial constellation on the prediction of Typhoon Gaemi (2024).

First, we show that the widely used latitude-based quality control of COSMIC-2 bending-angle data leads to excessive removal of observations between 6–8 km near the Solomon Islands, where persistent summertime altostratus frequently reach above 6 km. Despite the long-wavelength nature of RO measurements—which makes them less sensitive to clouds—these regions were incorrectly flagged as outliers. By implementing a 2.5° × 2.5° local quality-control approach, the number of discarded observations in cloudy areas is substantially reduced, yielding a more spatially uniform deviation structure relative to the local mean. This regionally adaptive method better preserves high-quality RO data in both mid-tropospheric altostratus and lower-tropospheric Intertropical Convergence Zone environments.

Second, we evaluate the impact of assimilating over 30,000 daily RO profiles from the Tianmu-1 constellation using the GSI–WRF system. Assimilating Tianmu-1 data alone—without other satellite observations—reduces 120-hour track errors of Typhoon Gaemi by 20–40%, with the largest improvements beyond 48 hours. Diagnostics show that enhanced prediction skill arises mainly from improved inner-core temperature structure and better representation of the large-scale steering flow. Remarkably, the track forecasts with Tianmu-1 assimilation are even slightly better than the operational forecasts from the NCEP Global Forecast System (GFS).

Overall, these results highlight the increasing importance of high-density GNSS RO constellations in forecasting tropical cyclone intensity and track, and emphasize the value of cloud-aware, adaptive regional quality-control techniques in preserving cloud-affected observations. Future work will extend these adaptive quality-control strategies globally and examine synergistic assimilation of COSMIC-2, Tianmu-1, and other commercial RO datasets.

How to cite: Yang, S. and Zou, X.: Positive Impacts of Tianmu-1 RO Data Assimilation on Tropical Cyclone Forecasts and the Non-negligible Influence of Altostratus Clouds on RO Data Quality, EGU General Assembly 2026, Vienna, Austria, 3–8 May 2026, EGU26-1396, https://doi.org/10.5194/egusphere-egu26-1396, 2026.

Satellite brightness temperature (BT) observations contain rich information about the horizontal distributions of cloud and rainfall structures; while radiosonde observations provide high-vertical-resolution measurements of temperature, moisture, and wind in the atmosphere. Beyond their traditional use in assimilation and retrieval, this study demonstrates innovative quantitative uses of BT and radiosonde observations for evaluating high-resolution numerical weather prediction (NWP) simulations of tropical cyclones (TCs) and Southwest Vortices (SWVs).

First, we apply BT observations to document  the structural evolution of TCs and SWVs and to directly compare simulated hydrometeor distributions with satellite-observed cloud and precipitation features. These BT-based diagnostics provide objective constraints on model representation of convective initiation and development as well as the impact of diurnal variability.

Second, a BT-based threat-score (BT-TS) framework is introduced to assess the skill of rainfall forecasts with respect to satellite BT observations instead of rainfall observations traditionally used in TS evaluation. Using microwave humidity-sounder channels, the BT-TS metric performs well for assessing rainfall forecast in regions where precipitation observations are sparse or unavailable. The BT-TS forecast results highlight model deficiencies in timing, extent, and intensity of SWV-induced convective rainfall.

Third, radiosonde profiles are used to investigate lower-tropospheric processes critical for vortex evolution, focusing on planetary boundary layer (PBL) height and vertical variability under different vertical-resolution configurations. Verification with high-vertical-resolution (~5–6 m) profiles from 119 Chinese radiosonde stations during the summers of 2021–23 shows that accurately representing PBL height and lower-tropospheric thermodynamic variability requires approximately doubling  the number of ERA5 vertical levels.

Together, these BT- and radiosonde-based diagnostics provide a comprehensive observational framework for evaluating the structural evolution of TCs and mesoscale SWVs. Future work will leverage these insights to refine cloud microphysics schemes, optimize model vertical-resolution design, and enhance the predictability of convection-permitting NWP systems.

How to cite: Zou, X.: Besides Assimilation and Retrieval: Innovative Quantitative Uses of Satellite Brightness Temperatures and Radiosonde Observations, EGU General Assembly 2026, Vienna, Austria, 3–8 May 2026, EGU26-1397, https://doi.org/10.5194/egusphere-egu26-1397, 2026.

EGU26-2677 | ECS | Posters on site | AS1.2

Bias-correction of wind speeds to improve PM2.5 predictability in chemical transport model 

Jaehee Kim, Jinhyeok Yu, Hyun S. Kim, Soon-young Park, Jung-Hun Woo, and Chul H. Song

Wind speed is a critical factor influencing the transport and dispersion of atmospheric pollutants in air quality models. However, numerical weather prediction (NWP) models, such as the weather research and forecasting (WRF) model, typically overestimate surface wind speeds, leading to inaccuracies in air quality predictions. To address this limitation, we developed an Artificial Intelligence (AI)-based Wind Field Correction (WFC) model aimed at improving PM2.5 forecasts over East Asia. The WFC model was constructed using the eXtreme Gradient Boosting (XGBoost) algorithm and trained on eight years of data, incorporating WRF-simulated meteorological variables as input features and in situ, ship-based, buoy, and radiosonde observations as targets. The WFC model effectively reduced the positive bias in WRF-simulated wind speeds, achieving a 90.15% reduction at the surface level and a 94.6% reduction from the surface to 850 hPa. The bias-corrected wind fields, when incorporated into the GIST Multiscale Air Quality model (GMAQ v1.0) developed by the Gwangju Institute of Science and Technology (GIST), resulted in substantial improvements in PM2.5 predictablity. In Central Eastern China (CEC), the wind field correction mitigated the underestimation of PM2.5 by suppressing excessive plume dilution in the model. In South Korea (SK), the correction slowed down accelerated plume advection, leading to a closer agreement between the simulated and observed PM­2.5 plume locations. In addition, the correction enhanced the representation of daily PM­2.5 variability and improved statistical metrics over the capital cities of Seoul and Beijing.

How to cite: Kim, J., Yu, J., Kim, H. S., Park, S., Woo, J.-H., and Song, C. H.: Bias-correction of wind speeds to improve PM2.5 predictability in chemical transport model, EGU General Assembly 2026, Vienna, Austria, 3–8 May 2026, EGU26-2677, https://doi.org/10.5194/egusphere-egu26-2677, 2026.

Minimizing pixel-wise errors in precipitation nowcasting inherently biases models toward smooth predictions, causing failures in resolving extreme convective events. To address this, we propose IMPA-Net, a meteorology-aware framework centered on spectral consistency. The architecture integrates three innovations: a parameter-free Spatial Mixer to encode multi-variate physical interactions (e.g., terrain-wind coupling); an Integrated Multi-scale Predictive Attention (IMPA) module to capture dynamics from Meso-β to Meso-γ scales; and a Meteorology-Aware Dynamic Loss (MAD-Loss) that employs asymmetric penalties to counteract regression-to-the-mean. Experiments demonstrate a 37.3% relative improvement in HSS for severe convection (45 dBZ). Crucially, RAPSD analysis confirms that IMPA-Net maintains spectral energy consistency across high-frequency bands, enabling it to successfully simulate the complex "dissipation-initiation" lifecycle that existing baselines fail to capture. These findings validate that integrating domain knowledge advances the physical plausibility of data-driven forecasting.

How to cite: He, G. and Cui, H.: IMPA-Net: Meteorology-Aware Multi-Scale Fusion and Dynamic Loss for Extreme Radar-Based Precipitation Nowcasting, EGU General Assembly 2026, Vienna, Austria, 3–8 May 2026, EGU26-3224, https://doi.org/10.5194/egusphere-egu26-3224, 2026.

EGU26-8109 | ECS | Posters on site | AS1.2

Deep Learning-Based Precipitation Nowcasting for Operational and Flash-Flood Applications 

Rodrigo Almeida, Jamil Göttlich, Noelia Otero, Marian Jurasek, Ladislav Méri, Zinaw Dingetu Shenga, Aitor Atencia, and Jackie Ma

Accurate short-term precipitation nowcasting is crucial for disaster risk reduction, flash-flood early warning, and water resource management. Conventional nowcasting approaches, such as extrapolation-based radar methods or numerical weather prediction models, often struggle to capture the nonlinear evolution of convective systems and are computationally demanding for rapid updates at high spatial and temporal resolution. The ability to provide reliable high-resolution forecasts at lead times of minutes to hours is particularly important for mitigating the societal and economic impacts of intense rainfall events. Recent developments in deep learning (DL), in combination with high-resolution radar observations, represent a compelling alternative for improving short-term precipitation forecasting. Radar-based precipitation data are particularly well suited for nowcasting applications due to their fine spatio-temporal resolution and ability to capture the dynamic structure and movement of precipitation systems. In this study, we develop and evaluate an operationally oriented DL framework for precipitation nowcasting that integrates multi-source data including high-resolution radar and satellite observations and automatic weather station measurements via the qPrec system over Slovakia. By incorporating satellite-derived forcing, the framework accounts for convection initiation and cloud development stage, providing a physical advantage over both classical extrapolation and radar-only deep learning methods. The framework leverages modern DL architectures, including convolutional encoder-decoder models such as U-Net and spatio-temporal transformer-based models (e.g., Earthformer), to learn the temporal evolution of precipitation fields inputs. The use of transformer-based models allows the network to capture long-range spatial dependencies and complex motion patterns that traditional CNNs may miss.

The proposed models generate precipitation forecasts at a spatial resolution of 1 km and a temporal resolution of 5 minutes, with lead times of up to 60 minutes. In addition to instantaneous precipitation estimates, the framework produces 15-minute accumulated precipitation for horizons up to 120 minutes. Unlike traditional methods where predictability skill remains static across resolutions, our DL approach leverages varied spatial representations to enhance predictability at these coarser temporal scales, optimizing the forecast for different hydrological requirements. These accumulated fields can be directly applied to flash-flood hazard assessment, enabling estimation of flood likelihood as a function of rainfall intensity and duration. Model performance is evaluated using standard verification metrics such as the Fractions Skill Score, and continuous ranked probability score (reducing to MAE on deterministic outputs), showing improvement over conventional radar extrapolation methods. This study demonstrates that modern DL approaches, particularly when combined with high-resolution radar observations, offer a promising path toward next-generation operational nowcasting.

How to cite: Almeida, R., Göttlich, J., Otero, N., Jurasek, M., Méri, L., Shenga, Z. D., Atencia, A., and Ma, J.: Deep Learning-Based Precipitation Nowcasting for Operational and Flash-Flood Applications, EGU General Assembly 2026, Vienna, Austria, 3–8 May 2026, EGU26-8109, https://doi.org/10.5194/egusphere-egu26-8109, 2026.

EGU26-9075 | ECS | Orals | AS1.2

SR-Weather: Super-Resolution Machine Learning Weather Forecast for 1-km Air Temperature Prediction 

Hyebin Park, Seonyoung Park, Daehyun Kang, and Jeong-Hwan Kim

Machine learning-based global weather forecasts often suffer from coarse spatial resolution, limiting their ability to capture fine-scale temperature variability in regions with complex terrain or strong urban–rural gradients. We present SR-Weather, a two-stage deep learning framework that downscales coarse 0.25° forecasts into 1 km air temperature fields. Our model is trained using ERA5 and MODIS-derived temperature data, and leverages high-resolution auxiliary inputs, including elevation, impervious surface fraction, and spatial information–normalized air temperature to enhance spatial fidelity. Applied to 7-day lead forecasts from the FuXi model, SR-Weather consistently outperforms FuXi’s own 1-day lead predictions, indicating strong capabilities in both resolution enhancement and bias correction. The model also exhibits robustness under cloud-contaminated MODIS observations by reconstructing missing temperature values using auxiliary data. While developed and validated over South Korea, SR-Weather is region-agnostic and applicable globally due to the availability of MODIS inputs and minimal reliance on localized data. These results position SR-Weather as a scalable solution for high-resolution, ML-based weather forecasting.

How to cite: Park, H., Park, S., Kang, D., and Kim, J.-H.: SR-Weather: Super-Resolution Machine Learning Weather Forecast for 1-km Air Temperature Prediction, EGU General Assembly 2026, Vienna, Austria, 3–8 May 2026, EGU26-9075, https://doi.org/10.5194/egusphere-egu26-9075, 2026.

EGU26-10225 | ECS | Orals | AS1.2

Bridging AI Large Meteorological Models and Solar Irradiance Forecasting Through Machine Learning Approaches 

Mingyu Yan, Ming Zhang, Kun Yang, Zhifeng Shu, and Changkun Shao

Renewable energy sources have an increasingly pivotal role in global electricity generation, which poses challenges to the accurate and efficient meteorological forecasting (such as solar irradiance and hub-height wind speed). The development of AI large models has significantly shortened the time required for medium-range global weather forecast. However, their outputs typically lack high-temporal-resolution solar irradiance (e.g., provided only at 6-hour intervals or not at all), which cannot be directly applied to renewable energy forecasting.

In this work, we propose a machine learning framework to integrate the output variables from AI large models with high-resolution solar irradiance forecasting. Specifically, we train XGBoost models at 15 sites in eastern China using ERA5 reanalysis variables (2020–2023) as inputs and hourly surface solar irradiance derived from Himawari-8/9 satellite as targets. The trained models are evaluated on a 2024 test set driven by ERA5, achieving an annual mean hourly RMSE of 88.5 W m-2.

To assess the performance of this approach in medium range forecasting, we use hourly forecasts from the GDAS-driven Pangu Weather Model during January and July 2024 as inputs. Over 20 medium-range forecast tests, our approach (Pangu-ML) yields a day-ahead (24-h lead) RMSE of 62.5 (January) /95.4 (July) W m-2 and a 10-day lead RMSE of 92.3 (January) /110.1 (July) W m-2. For comparison, we conduct parallel simulations using the GFS-driven WRF v4.6 model at 9-km resolution over eastern China. The WRF-based irradiance forecasts produce day-ahead and 10-day RMSEs of 78.4 (January) /107.6 (July) W m-2 and 109.8 (January) /130.3 (July) W m-2 across the 15 sites, demonstrating that Pangu-ML achieves comparable or even superior accuracy.

In summary, our approach takes advantage of the computational efficiency of AI large meteorological models. It enables rapid generation of solar irradiance forecasts with minimal computational cost, thereby offering a practical pathway for subsequent operational ensemble irradiance forecasting.

How to cite: Yan, M., Zhang, M., Yang, K., Shu, Z., and Shao, C.: Bridging AI Large Meteorological Models and Solar Irradiance Forecasting Through Machine Learning Approaches, EGU General Assembly 2026, Vienna, Austria, 3–8 May 2026, EGU26-10225, https://doi.org/10.5194/egusphere-egu26-10225, 2026.

EGU26-10396 | ECS | Posters on site | AS1.2

Ensemble Experiments in an AI-NWP Coupled Framework: A Typhoon Case 

Yangjinxi Ge

Artificial intelligence (AI) models have demonstrated advancements in computational efficiency and forecast accuracy relative to the Numerical Weather Prediction (NWP), but they are unable to fully represent high-dimensional atmospheric dynamics. Thus, some AI-NWP coupled frameworks have been proposed, such as integrating AI-driven boundary conditions with numerical models to leverage the strengths of both approaches. However, in this coupled framework, ensemble forecasts and associated error propagation and energy dynamics remain under-explored. In this study, an AI-NWP coupled system that also uses the stochastic kinetic energy backscatter scheme (SKEBS) to generate ensemble forecasts is established. Ensemble simulations of Typhoon Yutu (2018) are carried out with the Weather Research and Forecasting (WRF) model employing Pangu-Weather and FuXi forecast data as boundary forcing. The results show that the ensemble WRF_Pangu (WRF_FuXi) improved Yutu’s track forecast by 67% (50%) compared to the traditional physics-based WRF_GFS (Global Forecast System), and reduced its intensity underestimation by about 67% relative to their AI global counterparts. Nonetheless, WRF_FuXi and WRF_Pangu exhibited limited ensemble spread and linear error growth, reflecting deterministic tendencies. Comparison of global and regional experiments show that Pangu-Weather is more physically constrained and thus better aligned with the WRF model for regional applications, while the adaptation of FuXi to the regional model is less robust. Spectral analysis revealed that AI-derived boundaries introduced excessive small-scale energy and underestimated larger-scale energy. The regional model WRF acted as a “conveyor belt”, propagating additive small-scale energy upscale, ultimately overwhelming the stochastic perturbations for ensemble generation. These findings underscore the need to incorporate more physical features into the AI-derived boundary conditions for ensemble forecasting.

How to cite: Ge, Y.: Ensemble Experiments in an AI-NWP Coupled Framework: A Typhoon Case, EGU General Assembly 2026, Vienna, Austria, 3–8 May 2026, EGU26-10396, https://doi.org/10.5194/egusphere-egu26-10396, 2026.

EGU26-11158 | ECS | Orals | AS1.2

ML-based time interpolation of AIFS Ensemble for renewable energy forecasting 

Hans Brenna Schjønberg, Riccardo Parviero, Marius Koch, and Alberto Carpentieri

Recent advancements in machine learning based weather prediction (MLWP) present novel opportunities for downstream applications like forecasting of renewable energy production from intermittent sources, like wind and solar. MLWP models guarantee shorter simulation run times and lower computational costs, allowing faster updates of downstream models and greater flexibility in the generation of weather scenarios.

Forecasting renewable energy generation critically depends on available weather forecast data at adequate temporal and spatial resolution. Using MLWP weather data in energy system modelling and forecasting has been limited by the coarse temporal resolution of the current generation of models (e.g. ECMWF’s AIFS Ensemble model runs at 6-hour time steps).

In Europe, power market participants are increasingly exposed to weather forecast inaccuracies. This is due to the combined effect of how the power price is calculated for each price area, and the recent increase in intermittent renewable installed capacities. In detail, power prices are set each day for the following day by balancing supply and demand for each Market Time Unit (MTU), which are now 15 minutes long. It is then massively important to benchmark weather forecasts on a time resolution closer to the power market MTU, to properly assess which period will potentially be oversupplied, or undersupplied from intermittent renewable sources. In this context, the 6-hour time resolution of current MLWP models becomes a significant limiting factor for their usefulness.

Using NVIDIA’s Earth2Studio framework, we demonstrate an efficient, integrated MLWP pipeline combining the [open source] AIFS model with the ModAFNO time interpolation model to provide 1-hourly time-resolution MLWP data. This interpolated data is applied to our intermittent renewable energy production models to assess the interpolation quality compared the uninterpolated AIFS data and the best-in-class numerical weather prediction data provided by ECMWF’s IFS Ensemble forecast.

How to cite: Brenna Schjønberg, H., Parviero, R., Koch, M., and Carpentieri, A.: ML-based time interpolation of AIFS Ensemble for renewable energy forecasting, EGU General Assembly 2026, Vienna, Austria, 3–8 May 2026, EGU26-11158, https://doi.org/10.5194/egusphere-egu26-11158, 2026.

EGU26-11583 | ECS | Posters on site | AS1.2

Impacts of subgrid-scale orographic drag on landfalling typhoon precipitation 

Ming Zhang, Mingyu Yan, Yulong Ma, Kun Yang, and Zhifeng Shu

While the effects of subgrid orographic drag on large-scale circulation have been extensively studied, its influence on typhoon precipitation remains less understood. Using the Weather and Research Forecasting model, this study investigates impacts of subgrid orographic drag components (gravity wave drag (GWD), flow-blocking drag (FBD), and turbulent orographic form drag (TOFD)) on landfalling typhoon precipitation and explores their resolution sensitivity through two representative cases: Super Typhoon Lekima (2019) and Severe Typhoon In-Fa (2021). Results reveal distinct distributions of GWD and TOFD over southeastern coastal China, which significantly modulate precipitation during strong landfalls like Lekima: GWD enhances precipitation in southern land areas affected by the typhoon while suppressing it in northern regions, whereas TOFD exerts precisely opposing effects. This is mainly due to enhanced (weakened) lower-tropospheric wind speed and water vapor transport caused by GWD (TOFD). GWD is highly sensitive to horizontal resolution, exhibiting more pronounced effects on the wind, moisture, and precipitation at coarser resolutions, while TOFD remains relatively invariant to horizontal resolution changes. Resolution of subgrid orography dataset driving these parameterizations is essential for accurately simulating drag distributions and impacts. Finally, typhoon intensity modulates these effects: stronger background circulation exacerbates the precipitation impacts of both GWD and TOFD.

How to cite: Zhang, M., Yan, M., Ma, Y., Yang, K., and Shu, Z.: Impacts of subgrid-scale orographic drag on landfalling typhoon precipitation, EGU General Assembly 2026, Vienna, Austria, 3–8 May 2026, EGU26-11583, https://doi.org/10.5194/egusphere-egu26-11583, 2026.

Extreme precipitation poses significant risks to society and infrastructure, highlighting the urgent need for accurate short-term nowcasting. While deep learning models have shown promise in precipitation forecasting, they often lack integration with physical principles, leading to inconsistencies and limited skill in predicting convective evolution. In this study, we introduce RainCast—a novel generative nowcasting framework that synergistically combines deterministic physical modeling with stochastic generative networks to improve the accuracy and physical consistency of extreme rainfall forecasts.

RainCast integrates a deterministic branch based on Neural Ordinary Differential Equations (Neural ODE) to simulate large-scale advective processes and a generative branch built upon a conditional diffusion model to capture fine-scale stochastic variability. The model is guided by key physical features such as flow fields, vorticity, and divergence derived from dual-polarization radar observations, which provide essential dynamical information about convective systems. We train and evaluate the framework using vertically integrated liquid water (VIL) data from dual-polarization radars in China (GD-SPOL) and North America (SEVIR).

Quantitative assessments demonstrate that RainCast significantly outperforms existing nowcasting methods such as SimVP, SwinLSTM, and NowcastNet. On the GD-SPOL dataset, RainCast improves the Critical Success Index (CSI) for intense convection (VIL ≥ 160) by up to 14.1% at 90-minute lead times. Structural similarity metrics also show substantial gains, with reductions in Fréchet Video Distance (FVD) by 25.4% and Learned Perceptual Image Patch Similarity (LPIPS) by 44.6%. Case studies further illustrate RainCast’s ability to realistically simulate the evolution of organized convective systems, including squall lines and multicell storms, while maintaining physical coherence in wind field retrievals.

Our results underscore the value of embedding physical guidance into generative deep learning architectures for convective nowcasting. The RainCast framework represents a meaningful step toward more reliable, interpretable, and physically consistent nowcasting of extreme precipitation, with potential applications in operational meteorology and disaster preparedness.

How to cite: Pan, X. and Zhao, K.: Physics-Guided Generative Nowcasting of Extreme Precipitation with Dual-Polarization Radar and Neural ODE-Diffusion Framework, EGU General Assembly 2026, Vienna, Austria, 3–8 May 2026, EGU26-11714, https://doi.org/10.5194/egusphere-egu26-11714, 2026.

EGU26-13981 | ECS | Orals | AS1.2

SALAMA 1D: Deep-learning-based identification of thunderstorm occurrence in NWP forecasts without relying on convective indices 

Kianusch Vahid Yousefnia, Christoph Metzl, and Tobias Bölle

Thunderstorms pose significant risks to society and the economy due to hazards such as heavy precipitation, hail, and strong winds, which is why accurate forecasts are required to mitigate their impacts. Convection-permitting numerical weather prediction (NWP) models can explicitly resolve convective processes, but predicting thunderstorms from their output remains challenging since there is no obvious state variable that directly indicates thunderstorm occurrence. Instead, many approaches rely on combining multiple convective indices, such as convective available potential energy (CAPE), which are derived from state variables like temperature, pressure, and specific humidity, and act as surrogates for thunderstorms.

In this study, we present a deep neural network model that bypasses surrogate variables and instead directly processes the vertical profiles of state variables provided by convection-permitting forecasts. Our model, SALAMA 1D, analyzes ten different NWP output fields, such as wind velocity, temperature, and ice particle mixing ratios, across the vertical dimension, to produce the corresponding probability of thunderstorm occurrence. The model’s architecture is motivated by physics-based considerations and symmetry principles, combining sparse and dense layers to produce well-calibrated, pointwise probabilities of thunderstorm occurrence, while remaining lightweight.

We trained our model on two summers of forecast data from ICON-D2-EPS, a convection-permitting ensemble weather model for Central Europe operationally run by the German Meteorological Service (DWD), using the lightning detection network LINET as the ground truth for thunderstorm occurrences. Our results demonstrate that, up to lead times of (at least) 11 hours, SALAMA 1D outperforms a comparable machine learning model that relies solely on thunderstorm surrogate variables. Additionally, a sensitivity analysis using saliency maps indicates that the patterns learnt by our model are to a considerable extent physically interpretable. Finally, we show that spatial coverage can be extended to all of Europe by retraining on ICON-EU reanalysis data. Our work advances NWP-based thunderstorm forecasting by demonstrating the potential of deep learning to extract predictive information from high-dimensional NWP data—without sacrificing model interpretability.

How to cite: Vahid Yousefnia, K., Metzl, C., and Bölle, T.: SALAMA 1D: Deep-learning-based identification of thunderstorm occurrence in NWP forecasts without relying on convective indices, EGU General Assembly 2026, Vienna, Austria, 3–8 May 2026, EGU26-13981, https://doi.org/10.5194/egusphere-egu26-13981, 2026.

EGU26-15508 | Orals | AS1.2

AI nowcasting of localized heavy precipitation from fast-scanning radar with probabilistic and 3D motion guided prediction 

Philippe Baron, Shigenori Otsuka, Adrià Amell, Seiji Kawamura, Shinsuke Satoh, and Tomoo Ushio

Accurate real-time prediction of heavy precipitation is essential for disaster prevention. It remains a challenge for operational meteorology, especially for sudden localized convective storms for which traditional radar and observation extrapolation methods struggle to capture their rapid vertical development, which typically originate at altitudes of 4--8 km before descending to the surface in about 10 minutes.  

In Japan, three Multi-Parameter Phased Array Weather Radars (MP-PAWR) generating 3D data every 30 seconds with high vertical resolution have been deployed. Leveraging these dense 4D observations, an AI-based model produces real-time nowcasts (very short-term forecasts) with high-resolution of 500 m and 10-minute lead time. Updated every 30 seconds, our nowcasts outperform traditional methods for predicting the onset and the dissipation of localized convective precipitation. However, performance is degraded during the mature phase of the storm when its structure becomes more complex (e.g., overlapping  convective cells in different lifecycle states, domination of horizontal motion in radar pattern changes) (Baron et al., 2025a).

Two major improvements are currently being investigated: 1) a Quantile Regression Neural Network (QRNN) technique has been integrated to assess the probability distribution of possible nowcasts and thus provide credible intervals (Baron et al., 2025b), and 2) a better representation of 3D motion is being implemented, as it plays a critical role during the mature phase of storms. The new version of the model will integrate two separate modules: one specialized for capturing 3D-motion vectors, while the second predicts rainfall intensity with motion guidance. Both modules use the current nowcast model architecture which has demonstrated solid performance. The motion module is trained using 3D motion vectors derived directly from the radar observations through a 3D Tracking Radar Echoes by Correlation (TREC) method originally designed for PAWR extrapolation (Otsuka et al., 2016).

This study will present these developments with a special focus on the motion guidance module that is being implemented. The limitations of our approach will also be discussed (e.g., QRNN vs diffusion model, TREC limitation for weak gradient cases, no information on rain precursors and mesoscale scales).

Baron et al., 2025a: “Real-time nowcasting of sudden heavy rainfall using artificial neural network and multi-parameter phased array radar”, SOLA, https://doi.org/10.2151/sola.2025-039

Baron et al., 2025b: “3D Precipitation Nowcasting from Phased Array Radar with Uncertainty Estimation Using a Quantile Regression Neural Network”, IEEE RadarConf25,  10.1109/RadarConf2559087.2025.11204931

Otsuka et al., 2016: Precipitation nowcasting with three-dimensional space–time extrapolation of dense and frequent phased-array weather radar observations. Wea. Forecasting, 31, 329–340.

How to cite: Baron, P., Otsuka, S., Amell, A., Kawamura, S., Satoh, S., and Ushio, T.: AI nowcasting of localized heavy precipitation from fast-scanning radar with probabilistic and 3D motion guided prediction, EGU General Assembly 2026, Vienna, Austria, 3–8 May 2026, EGU26-15508, https://doi.org/10.5194/egusphere-egu26-15508, 2026.

The development of various AI models in recent years has been very promising; the models’ ability to train from reanalysis datasets and evaluate on various metrics opened the door for a variety of new applications. However, the real stress test of any new model is its operational performance - applying predictions to data that weren't available during the model development and assessing the model’s capabilities for predicting real-world scenarios previously unseen. 

In August 2025, we deployed our first high-resolution AI-based model for Iceland and it has been providing us with continuous predictions since then. Here we evaluate forecast skill against surface observations and benchmark against NWP models from the United Weather Centres (UWC) in Denmark and Iceland and our local operational NWP model for Iceland. We analyze the model’s strengths and weaknesses in predicting various weather events and discuss how these characteristics may influence the future model design.

How to cite: Stanisławska, K. and Rögnvaldsson, Ó.: AI model in the real world - analysis of the operational performance of a high-resolution AI weather model for Iceland, EGU General Assembly 2026, Vienna, Austria, 3–8 May 2026, EGU26-18305, https://doi.org/10.5194/egusphere-egu26-18305, 2026.

EGU26-18585 | ECS | Posters on site | AS1.2

Real-Time Solar Irradiance Nowcasting for Renewable Energy Forecasting over Western India 

Sheetal Garg, Subimal Ghosh, Raghu Murtugudde, and Biplab Banerjee

The global transition toward low-carbon energy systems has increased the reliance on renewable energy sources and driven solar power to become a key component of sustainable electricity generation, thereby increasing the importance of accurate irradiance forecasting. As solar penetration grows, power system operations increasingly depend on reliable short-term forecasts to support grid balancing, reserve allocation, and real-time decision-making. Global Horizontal Irradiance (GHI) represents the integrated influence of atmospheric conditions and cloud processes on surface solar radiation and governs short-term variability in photovoltaic power output. However, rapid cloud evolution introduces strong spatiotemporal variability in GHI, making accurate prediction at sub-hourly lead times a persistent challenge for short-term solar forecasting. In this study, we develop a real-time nowcasting system to predict GHI over the western region of India at 15-minute resolution with effective lead times of up to 2 hours. The system is based on a convolutional long short-term memory (ConvLSTM) model that learns spatiotemporal cloud–radiation relationships from high-frequency geostationary satellite observations. We utilize INSAT-3DR and INSAT-3DS products obtained from the MOSDAC archive, which provide continuous monitoring of cloud evolution over the region. The nowcasting framework is implemented using routinely available satellite observations and is evaluated over a large spatial domain covering western India, a region characterized by strong seasonal variability and diverse cloud regimes associated with pre-monsoon, monsoon, and post-monsoon periods. The results demonstrate consistent performance across seasons and show that the system captures the mean diurnal evolution of GHI with stable skill during daytime solar-active periods. Evaluation results indicate mean absolute errors of approximately 60 W m-2 for 1–2 hour lead times and 72 W m-2 for 2–3 hour lead times, corresponding to about 7–12 % of typical daytime GHI under moderate to high irradiance conditions. Overall, this work demonstrates the feasibility of satellite-driven deep learning systems for real-time GHI nowcasting and highlights the potential of integrating geostationary satellite observations and spatiotemporal learning models to support renewable energy forecasting and real-time grid decision-making in regions with high and growing solar power penetration.

How to cite: Garg, S., Ghosh, S., Murtugudde, R., and Banerjee, B.: Real-Time Solar Irradiance Nowcasting for Renewable Energy Forecasting over Western India, EGU General Assembly 2026, Vienna, Austria, 3–8 May 2026, EGU26-18585, https://doi.org/10.5194/egusphere-egu26-18585, 2026.

EGU26-18808 | ECS | Posters on site | AS1.2

Random forest based precipitation nowcasting for Dakar  

Mai-Britt Berghoefer, Jan O. Haerter, and Diana L. Monroy

Approximately 90% of the total precipitation in Senegal is produced by convective storms. The most intense rainfall events are associated with mesoscale convective systems (MCSs), frequently producing high-intensity rainfall that triggers pluvial flooding. Flood vulnerability is particularly high in the Greater Dakar area due to surface sealing and high population exposure. Timely and reliable short-term precipitation forecasts are therefore essential for effective early warning systems and flood risk reduction.

Precipitation nowcasting aims to describe the current atmospheric state and predict weather evolution at short lead times using real-time observations. The quality and availability of input data are key factors determining the nowcasting performance. In this study, three main data sources are employed: (i) in-situ observations from the High-resolution weather observations East of Dakar (DakE) station network, (ii) satellite-based products such as cloud-top temperature (CTT) from EUMETSAT and precipitation estimates from the Integrated Multi-satellitE Retrievals for GPM (IMERG) algorithm provided by NASA, and (iii) modeled data from the Weather Research and Forecasting (WRF) model.

The objective of this project is to identify a suitable nowcasting approach while weighing the strengths and limitations of the available data sources. Extrapolation-based methods, such as optical-flow techniques implemented in the pySTEPS library, estimate future precipitation by extrapolating observed patterns under the assumption of steady system evolution. These approaches perform well for large, long-lived convective systems, but they are unable to predict convective initiation, decay, and growth. Their applicability is further limited by the temporal resolution and detection uncertainties of the available satellite-based precipitation products identified in comparisons with station observations.

To address these limitations, a machine-learning-based nowcasting framework is developed, primarily relying on the high-temporal-resolution DakE station data to accurately capture atmospheric boundary conditions. Given the limited time span of data collection and the high predictor dimensionality, a Random Forest model was chosen as a robust approach. To mitigate challenges like zero inflation and the underestimation of extreme events, a two-step model architecture is developed: in a first step, a classification forest (I) is used to determine precipitation occurrence and the duration of the predicted event in the lead time horizon. If precipitation is expected, the model is coupled to a regression forest (II) that returns the rainfall intensity of the detected event. Future work will assess potential performance improvements from incorporating CTT-satellite and WRF-modeled data using feature importance analysis, which can also inform the placement of hypothetical new automatic weather stations.


How to cite: Berghoefer, M.-B., Haerter, J. O., and Monroy, D. L.: Random forest based precipitation nowcasting for Dakar , EGU General Assembly 2026, Vienna, Austria, 3–8 May 2026, EGU26-18808, https://doi.org/10.5194/egusphere-egu26-18808, 2026.

EGU26-20013 | Orals | AS1.2

Forecast-in-a-Box: AI weather forecasting, easy to run and simple to deploy 

Corentin Carton de Wiart, Harrison Cook, Vojtech Tuma, Jenny Wong, Håvard Alsaker Futsæter, Lene Østvand, Vegard Bønes, Børge Moe, Jørn Kristiansen, James Hawkes, Irina Sandu, and Tiago Quintino

Traditional weather forecasting relies on large scale numerical simulations that run on high-performance computing systems. These methods require substantial computational resources, involve complex workflows, and generate large volumes of data that often exceed individual user needs. Forecast-in-a-Box leverages advances in data-driven modelling to greatly reduce computational and energy costs while delivering tailored forecast products directly to users. Partly funded from the European Commission’s Destination Earth initiative, it packages the entire forecasting chain into a simple and user-friendly application. Built on the open-source Anemoi1 and Earthkit2 projects, it offers a reproducible and modular environment that integrates data access, model execution, and visualisation. This enables accurate forecasts that can be run locally on user desktops, on premise computing infrastructure, or in the cloud.

The approach is being evaluated through a World Meteorological Organization (WMO) Integrated Processing and Prediction System (WIPPS) pilot project led by the Norwegian Meteorological Institute (MET Norway). In this project, a fully packaged forecasting system based on affordable hardware is provided to the Malawi Department of Climate Change and Meteorological Services (DCCMS). The forecasting system is driven by Forecast-in-a-Box and leverages MET Norway’s Bris3 model (Norwegian word for “light wind), a high-resolution data driven weather forecasting model built using the Anemoi framework. The solution is designed to be largely self-contained, with the only external dependency being the retrieval of ECMWF analysis dataset for forecast initialisation.

1https://anemoi.readthedocs.io/en/latest/

2https://earthkit.ecmwf.int

3https://lumi-supercomputer.eu/data-driven-weather-forecasting-model/

How to cite: Carton de Wiart, C., Cook, H., Tuma, V., Wong, J., Futsæter, H. A., Østvand, L., Bønes, V., Moe, B., Kristiansen, J., Hawkes, J., Sandu, I., and Quintino, T.: Forecast-in-a-Box: AI weather forecasting, easy to run and simple to deploy, EGU General Assembly 2026, Vienna, Austria, 3–8 May 2026, EGU26-20013, https://doi.org/10.5194/egusphere-egu26-20013, 2026.

EGU26-287 | Posters on site | AS1.3

Quantifying Coupling Errors in Atmosphere-Ice-Ocean Coupling 

Valentina Schüller, Florian Lemarié, Philipp Birken, and Eric Blayo

The atmosphere, ocean, and sea ice components in Earth system models are coupled via boundary conditions at the sea surface. Standard coupling algorithms correspond to the first step of an iteration, so-called Schwarz waveform relaxation. Not iterating is computationally cheap but introduces a numerical coupling error, which we aim to quantify for the case of a coupled single column model: the EC-Earth AOSCM, which uses the same coupling setup and model physics as its host model, EC-Earth. To this end, we iterate until a reference solution is obtained and compare this with standard, non-iterative algorithms. Understanding the convergence behavior of the iteration, as well as the size of the coupling error, can inform model and algorithm development. Past studies demonstrated that the SWR solution eliminates phase errors, reduces ensemble spread, and can indicate whether current coupling setups are mathematically consistent. Our implementation is based on the OASIS3-MCT coupler and allows to estimate the coupling error of multi-day simulations.

In the absence of sea ice, SWR convergence is robust. Coupling errors for atmospheric variables can be substantial. When sea ice is present, results strongly depend on the model version. In the latest model version, coupling errors in sea ice surface and atmospheric boundary layer temperature are often large. Generally, we find that abrupt transitions between distinct physical regimes in certain parameterizations can lead to substantial coupling errors and even non-convergence of the iteration. We attribute discontinuities in the computation of atmospheric vertical turbulence and sea ice albedo as sources for these problems. We conclude the talk with some new theoretical results on analytically describing atmosphere-ocean-sea ice coupling.

How to cite: Schüller, V., Lemarié, F., Birken, P., and Blayo, E.: Quantifying Coupling Errors in Atmosphere-Ice-Ocean Coupling, EGU General Assembly 2026, Vienna, Austria, 3–8 May 2026, EGU26-287, https://doi.org/10.5194/egusphere-egu26-287, 2026.

EGU26-1213 | ECS | Posters on site | AS1.3

Two-Dimensional Locally Adaptive Non-Hydrostatic Model for Moving Bottom-Generated Waves 

Kemal Firdaus and Jörn Behrens

In some geophysical flow phenomena, such as landslide-generated tsunamis and slow earthquake-generated waves, non-hydrostatic pressure has been shown to be crucial, resulting in an effect known as the dispersive effect. One practical approach to include such an effect is by extending the Shallow Water Equations (SWE), which can be achieved by splitting the pressure terms into hydrostatic and non-hydrostatic pressure while deriving a depth-averaged form. In the end, this model requires us to solve an elliptic system of equations to make a correction to the hydrostatic SWE approximation. However, solving the elliptic problem burdens computing time significantly. Therefore, we introduce a locally adaptive non-hydrostatic model that allows us to solve the extension locally. To achieve reliable results, the corrections need to be adapted in the area where the non-hydrostatic pressure might hold a significant role. We define these areas with a simple criterion based on the hydrostatic solution. To validate our model, we apply our model to a test case that involves moving bottom-generated waves. Our result shows that we can achieve a good agreement between the local and global models, where the former approach clearly reduces the computational time.

How to cite: Firdaus, K. and Behrens, J.: Two-Dimensional Locally Adaptive Non-Hydrostatic Model for Moving Bottom-Generated Waves, EGU General Assembly 2026, Vienna, Austria, 3–8 May 2026, EGU26-1213, https://doi.org/10.5194/egusphere-egu26-1213, 2026.

EGU26-2009 | ECS | Posters on site | AS1.3

New mountain-generated mesoscale flow test cases from DCMIP2025 

Timothy Andrews, Christiane Jablonowski, Owen Hughes, and Thomas Bendall

The Dynamical Core Intercomparison Project (DCMIP) is an endeavour to evaluate and compare dynamical cores through the application of idealised test cases. Previous editions of DCMIP, in 2008, 2012, and 2016, introduced many widely used cases, including baroclinic wave, tracer transport, supercell, and tropical cyclone tests. We present a new test case developed for the most recent edition of DCMIP, held in June 2025 (DCMIP2025). This case uses an easily implementable initial condition, with the addition of mountain orography, to generate nonlinear mesoscale flow phenomena. Two different orographies are considered, which lead to dynamics of a gap flow and vortex shedding. The gap flow case exhibits accelerated flow and the creation of a pair of symmetric lee vortices, whilst the vortex shedding case instigates a flow reminiscent of a von Kármán vortex street. These tests are compared in four dynamical cores: three from the United States, along with GungHo, the compatible finite element dynamical core from the UK Met Office’s new LFRic model. Contrasting simulations with each dynamical core highlights differences in the numerical designs, including the grid choice and sources of numerical diffusion.

How to cite: Andrews, T., Jablonowski, C., Hughes, O., and Bendall, T.: New mountain-generated mesoscale flow test cases from DCMIP2025, EGU General Assembly 2026, Vienna, Austria, 3–8 May 2026, EGU26-2009, https://doi.org/10.5194/egusphere-egu26-2009, 2026.

EGU26-3094 | Posters on site | AS1.3

Improved parallel scaling of 3D Rayleigh-Benard convection simulations by parallelization in time 

Daniel Ruprecht, Thomas Saupe, Thibaut Lunet, Sebastian Götschel, and Robert Speck

Rayleigh-Bénard convection (RBC) — the buoyancy-driven instability that arises when a fluid is heated from below and cooled from above, leading to the formation of convective plumes — serves as a fundamental and challenging benchmark problem in geophysical fluid dynamics. Simulating RBC at high Rayleigh numbers demands extremely fine spatial resolution, which in turn requires high-performance computing (HPC) resources to achieve results within feasible runtimes. However, strong parallel scaling based on spatial domain decomposition eventually saturates due to communication overheads, and simulations involving very large numbers of time steps can still be prohibitively time-consuming, with limited scope for further speedup through additional spatial parallelism.

To overcome these limitations, time-parallel algorithms — which introduce concurrency along the temporal dimension — offer a promising approach to extend strong scaling beyond the saturation of space-only parallelization. Despite their potential, constraints imposed by causality often make these methods challenging to design, and some classes of parallel-in-time algorithms can suffer from poor parallel efficiency. In contrast, parallel-across-the-method techniques, while providing only small-scale parallelism, tend to be easier to implement and can achieve competitive efficiency. Previous efforts to develop parallel Runge-Kutta methods were only moderately successful, primarily because the associated stability restrictions were more stringent than those of their serial counterparts.

Parallel Spectral Deferred Corrections (pSDC), however, enable parallel computation of stages without significantly reducing the maximum stable time step. In this talk, we introduce pSDC and present a bespoke solver that combines pSDC with parallel Fast Fourier Transforms (FFTs) on GPUs to facilitate efficient, large-scale simulations of RBC. We show performance results obtained on the JUWELS Booster and JUPITER HPC systems at the Jülich Supercomputing Centre, showcasing how pSDC can achieve runtime reductions beyond the limits of spatial parallelization alone.

How to cite: Ruprecht, D., Saupe, T., Lunet, T., Götschel, S., and Speck, R.: Improved parallel scaling of 3D Rayleigh-Benard convection simulations by parallelization in time, EGU General Assembly 2026, Vienna, Austria, 3–8 May 2026, EGU26-3094, https://doi.org/10.5194/egusphere-egu26-3094, 2026.

EGU26-3274 | ECS | Posters on site | AS1.3

Development of a Three-dimensional Spectral Atmospheric Dynamical Core using Scaled Laguerre Functions 

Shun Fujita and Keiichi ishioka

We propose a new formulation of a three-dimensional spectral model for the primitive equations, in which the spectral method is applied not only in the horizontal but also in the vertical direction. In this model, we utilize scaled Laguerre functions as the vertical basis and spherical harmonics as the horizontal basis. This formulation introduces a tunable scaling parameter, enabling the model top to be placed at high altitudes while maintaining adequate vertical resolution in the upper atmosphere. This formulation is implemented as a numerical model, and its performance is validated through a series of benchmark experiments. The results demonstrate that the numerical error of the present model decreases much faster than that of a corresponding vertical finite-difference model as the vertical degrees of freedom are increased. Furthermore, using linearized two-dimensional primitive equations, the properties of gravity waves under the proposed discretization are examined and compared with those of conventional vertical finite-difference discretizations. The results confirm that the proposed method can accurately represent upward-propagating waves. 

How to cite: Fujita, S. and ishioka, K.: Development of a Three-dimensional Spectral Atmospheric Dynamical Core using Scaled Laguerre Functions, EGU General Assembly 2026, Vienna, Austria, 3–8 May 2026, EGU26-3274, https://doi.org/10.5194/egusphere-egu26-3274, 2026.

EGU26-3905 | ECS | Orals | AS1.3

AdHImEx: Adaptively High-order Implicit-Explicit Time Stepping for Atmospheric Transport with Long Time Steps 

Amber te Winkel, Hilary Weller, Christian Kühnlein, and James Kent

Weather and climate models require atmospheric transport to be numerically stable, accurate, efficient, and mass-conserving. Adaptively Implicit-Explicit (AdImEx) time stepping can provide mass conservation and stability while taking long time steps for efficiency. However, challenges persist: (1) strongly reduced accuracy for large Courant numbers, and (2) a lack of preservation of uniform fields with substage time step sizes varying in space. We introduce AdHImEx, a novel AdImEx approach that resolves these issues, delivering an unconditionally stable, conservative, efficient advection scheme that preserves unity and increases temporal accuracy for large Courant numbers from first- to second-order. Remarkably, it requires only a single implicit solve per time step, performed with an iterative matrix solver, while retaining the full efficiency and third-order accuracy of the explicit time stepping in regions with small Courant numbers. Two-dimensional results will be shown.

How to cite: te Winkel, A., Weller, H., Kühnlein, C., and Kent, J.: AdHImEx: Adaptively High-order Implicit-Explicit Time Stepping for Atmospheric Transport with Long Time Steps, EGU General Assembly 2026, Vienna, Austria, 3–8 May 2026, EGU26-3905, https://doi.org/10.5194/egusphere-egu26-3905, 2026.

The choice of grid staggering has been a fundamental design decision in atmospheric dynamical core development for decades. Conventional wisdom, largely derived from low-order Von Neumann analysis, holds that the unstaggered A-Grid exhibits poor dispersion properties near the grid scale, making it unsuitable for geophysical fluid dynamics. This perception has steered the community toward staggered grid formulations (B-, C-, or D-Grid) despite the algorithmic complexity they introduce.


We present a numerical approach to Von Neumann analysis that enables rigorous evaluation of high-order schemes with complex time-stepping methods, including implicit and semi-implicit formulations such as the forward-backward scheme. By numerically solving the Fourier-transformed equations across the two-dimensional space of Courant numbers and numerical phase, this method circumvents the algebraic intractability that has limited traditional analysis to simplified low-order cases.


Our analysis reveals a critical finding: the dispersion and dissipation differences attributable to grid staggering choices diminish substantially with high-order spatial discretization. When combined with the Low Mach number Approximate Riemann Solver (LMARS), which provides implicit scale-selective diffusion matched to the dispersion characteristics, the A-Grid formulation effectively controls numerical noise while maintaining accuracy for well-resolved modes. Idealized tests with discontinuous wave packets validate these theoretical predictions and demonstrate that high-order LMARS produces significantly less numerical noise than inviscid schemes on both staggered and unstaggered grids.


These findings carry significant implications for next-generation dynamical core design. The A-Grid formulation offers compelling advantages: algorithmic simplicity facilitating GPU implementation, straightforward conservation properties, collocated variables simplifying physics-dynamics coupling, and natural compatibility with data-driven approaches in hybrid modeling. Continued adherence to conventional wisdom rooted in low-order analysis risks misguiding the development of dynamical cores optimized for modern computing architectures and emerging AI-integrated Earth system models.

How to cite: Chen, X.: Rethinking A-Grid for next-generation dynamical cores: High-order numerical analysis challenges conventional wisdom, EGU General Assembly 2026, Vienna, Austria, 3–8 May 2026, EGU26-4623, https://doi.org/10.5194/egusphere-egu26-4623, 2026.

The pursuit of global kilometer-scale modeling in atmosphere science presents a dual challenge: comprehensive models become computationally prohibitive and analytically intractable, while idealized models lack essential physical forcing, creating a critical gap in atmospheric research. To bridge this divide, this work develops and validates the innovative ACC-LMARS-SW model, a novel theoretical framework designed for efficient, high-resolution global atmospheric dynamics studies. The model features three synergistic innovations. First, its physics kernel introduces real-world topography and a real-world-equivalent season-aware radiative forcing scheme into the shallow-water equations, significantly enhancing physical realism while retaining conceptual clarity. Second, it employs a variable-resolution stretched cubed-sphere grid that concentrates computational resources on regions of interest , achieving sub-kilometer local resolution without prohibitive global cost. Third, the dynamical core is fully redesigned for massive parallelism using the OpenACC standard, leveraging the efficiency of the Low-Mach Approximate Riemann Solver (LMARS) to harness GPU acceleration.

A suite of numerical experiments demonstrates the model's capabilities. 1) Mesh efficacy: Stretched-grid simulations show reduce error in target areas compared to uniform-resolution runs in classic tests, better resolving nonlinear eddy interactions. 2) Physical fidelity: A global simulation at ~1.5 km average resolution (with ~500 m over the South China Sea) forced by real topography and idealized radiation spontaneously generates a horizontal kinetic energy spectrum featuring distinct  k-3 and k-5/3 power-law segments , which is a hallmark of real atmospheric scale interactions. 3) Computational performance: GPU implementation achieves up to a 70x speedup versus estimated serial CPU execution, making global kilometer-scale theoretical experiments feasible on a single workstation.

In conclusion, ACC-LMARS-SW successfully integrates algorithmic design, mesh technology, and high-performance computing to create an efficient and physically insightful "numerical laboratory." This approach provides the high resolution and computational efficiency needed to study fundamental multi-scale dynamics, such as cross-scale energy transfer, dynamical responses to orography, and mesoscale eddy dynamics.

How to cite: Li, Z. and Chen, X.: Accelerated LMARS Shallow Water Model with a Stretched Cubed Sphere Grid at Sub-km Scales, EGU General Assembly 2026, Vienna, Austria, 3–8 May 2026, EGU26-4665, https://doi.org/10.5194/egusphere-egu26-4665, 2026.

EGU26-4907 | Posters on site | AS1.3

Multiscale finite element method in a shallow water model 

Jörn Behrens and Mouhanned Gabsi

The multiscale finite element method (MsFEM) was originally proposed for stationary (elliptic) or quasi-stationary (parabolic) problems. It was extended to linear transport-dominated problems, utilizing a semi-Lagrangian subgrid reconstruction (SLMsR) approach. In this presentation we introduce the extension of the method to coupling non-linear systems of hyperbolic equations. To demonstrate the accuracy and applicability of SLMrS we use a shallow water model, where we discretize the momentum equation on a fine mesh and inform the coarse-mesh continuity equation of subgrid-scale features by using a multiscale basis. We show accuracy and convergence of the new method for smooth and non-smooth test cases.

How to cite: Behrens, J. and Gabsi, M.: Multiscale finite element method in a shallow water model, EGU General Assembly 2026, Vienna, Austria, 3–8 May 2026, EGU26-4907, https://doi.org/10.5194/egusphere-egu26-4907, 2026.

EGU26-8455 | Orals | AS1.3

DCMIP-2025: Introducing an Idealized Squall Line Test Case for Nonhydrostatic Dynamical Cores 

Christiane Jablonowski, Nicholas Androski, Timothy Andrews, and Owen Hughes

We introduce a new suite of idealized test cases for the dynamical cores of atmospheric General Circulation Models. The tests were developed for the 2025 Dynamical Core Model Intercomparison Project (DCMIP-2025) which took place at the National Center for Atmospheric Research (NCAR) in June 2025 alongside a summer school (https://dcmip.org). The test suite was designed to probe (a) the impact of topography on atmospheric flows at various scales (see also the EGU 2026 companion paper led by Timothy Andrews); (b) a convection (squall line) test case; and (c) idealized experiments for atmospheric machine learning emulators.

This presentation focuses on the squall line test case, which challenges nonhydrostatic dynamical cores to accurately simulate moist convection and squall line dynamics at kilometer-scale resolutions. The scenario incorporates simplified moisture feedbacks using a warm-rain Kessler parameterization and is implemented across a range of horizontal (0.25–4.0 km) and vertical (250–500 m) grid spacings on a reduced-radius sphere. We assess three leading nonhydrostatic dynamical cores: the nonhydrostatic version of the Department of Energy/NCAR ‘Spectral Element’ model (called HOMME or SE), the ‘Model for Prediction Across Scales’ (MPAS), and NOAA’s Finite-Volume cubed-sphere dynamical core FV3. These are all available within NCAR’s Community Atmosphere Model (CAM) which is the atmospheric component of the Community Earth System Model (CESM).

Our analysis examines the numerical convergence characteristics, model-to-model variability, and the influence of core-specific dissipation mechanisms on the simulated convective storms. The results demonstrate the test case’s potential as a rigorous benchmark for future core development and model intercomparison efforts. This work contributes to advancing robust evaluation frameworks for atmospheric models in the kilometer-scale, nonhydrostatic regime.

How to cite: Jablonowski, C., Androski, N., Andrews, T., and Hughes, O.: DCMIP-2025: Introducing an Idealized Squall Line Test Case for Nonhydrostatic Dynamical Cores, EGU General Assembly 2026, Vienna, Austria, 3–8 May 2026, EGU26-8455, https://doi.org/10.5194/egusphere-egu26-8455, 2026.

We investigate the coupling of nonlinear water-wave motion to heaving buoy wave-energy dynamics [1] in the presence of an inequality constraint. Building on augmented Lagrangian variational principles (VPs) developed by Burman [2] and others, we impose constraints of the form G(q)≥0, where q involves system variables, through a Lagrange multiplier λ. The strict Kuhn–Karush–Tucker (KKT) conditions {λ G=0,G(q)≥0, λ≤0} are replaced by those smooth approximations of the involved function F(c G(q)−λ)=max(c G(q)−λ,0), with smoothing parament c>0, allowing explicit computation of the multiplier λ as (part of) a force. Our approach combines: (a) an Average Vector Field (AVF) energy-conserving time-stepping method, extended to water-wave systems with an auxiliary field, enforcing energy conservation in the discrete system; (b) a (novel) smooth relation λ(G) that regularises the KKT conditions by approximating the solution G=0 with λ≤0 and G>0 with λ=0 in the (λ,G)-plane, but leading to an implicit definition of the function F(c G(q)−λ). This framework has been implemented and tested in the finite-element environment Firedrake, leading to improved and surviving benchmarks for the problems: (i) a point particle under gravity bouncing off a rigid table, (ii) a particle moving in a rectangular (“billiard”) domain, and (iii) forced (Variational “Boussinesq” Model-type) nonlinear water waves in a horizontal channel causing buoy motion in a wave-enhancing contraction. The latter, finite-element, model supports design of a prototype wave-energy device for enhanced energy capture. More generally, this work aims to develop analytical and computational tools for finite-element coupling of nonlinear wave dynamics in fluid-structure interactions, here exemplified by the vertical (heave) motion of the buoy.

[1] O. Bokhove, A. Kalogirou and W. Zweers (2019) From Bore–Soliton–Splash to a new wave-to-wire wave-energy model. Water Waves 1, 217-258.
[2] E. Burman, P. Hansbo and M.G. Larson (2023) The augmented Lagrangian method as a framework for stabilised methods in computational mechanics. Archives of Computational Methods in Eng. 30, 2579–2604.

How to cite: Bokhove, O.: Fluid-structure interactions with numerics for a smoothed augmented Lagrangian variational principle applied to a wave-energy device, EGU General Assembly 2026, Vienna, Austria, 3–8 May 2026, EGU26-10650, https://doi.org/10.5194/egusphere-egu26-10650, 2026.

EGU26-10749 | Posters on site | AS1.3

Staggered finite element methods on polytopal meshes 

Oswald Knoth

We present a novel staggered discontinuous Galerkin method on general polytopal meshes for solving the shallow water equation on the sphere. Every polygon is decomposed into so called kite quads by joining the vertices with the midpoints of the adjacent edges and the midpoint of the polygon. The shallow water equation is solved in vector-invariant form whereby vorticity is determined diagnostically. Height and momentum are discretized on the primal respectively dual cells whereby the composed finite elements are continuous over internal edges and discontinuous over boundary edges. This results in block-diagonal mass matrices. Mass lumping can reduce the fill in of these matrices further. 
The method is implemented in Julia in the package CGDycore.jl which unifies different numerical dycores under one umbrella. Numerical results are presented for standard test cases on different spherical grids.

How to cite: Knoth, O.: Staggered finite element methods on polytopal meshes, EGU General Assembly 2026, Vienna, Austria, 3–8 May 2026, EGU26-10749, https://doi.org/10.5194/egusphere-egu26-10749, 2026.

EGU26-13095 | Posters on site | AS1.3

Structure preserving, transport stabilized finite element methods for two-fluid magnetohydrodynamics 

Werner Bauer, Golo A. Wimmer, and Xian-Zhu Tang

Two-fluid magnetohydrodynamics (MHD) extends single-fluid MHD by retaining separate ion and electron thermodynamics together with an extended Ohm’s law. This enables the capture of Hall physics, dispersive waves, and fast magnetic reconnection – phenomena that are inaccessible to single-fluid MHD and are central to applications such as magnetic confinement fusion, the heliosphere, and the Earth’s magnetosphere.

In this presentation, we discuss a novel spatial discretization for the two-fluid MHD equations based on compatible finite element methods. The approach preserves important structural properties including the divergence-free constraint on the magnetic field, energy conservation, and a consistent treatment of both fluid and magnetic helicity. In particular, the ion velocity and magnetic field spaces are chosen to admit a natural discrete definition of the diagnostically determined electron velocity.

The resulting scheme is designed for low-dissipation regimes in which fluid transport dominates, a setting relevant to many scenarios of interest in the aforementioned applications. To ensure a stable field evolution, we incorporate transport stabilization for all fields while preserving the underlying structural properties of the two-fluid MHD system. The stabilization is based on interior penalty methods, extending our previous work on magnetic field transport in single-fluid resistive MHD (Wimmer, Tang, 2024). Numerical experiments demonstrate the structure preserving and stabilization properties of the method through test cases focusing on fluid helicity, magnetic helicity, and the relative decay rates of helicity and energy in the presence of dissipation.


References

Golo A. Wimmer and Xian-Zhu Tang (2024), Structure preserving transport stabilized compatible finite element methods for magnetohydrodynamics, Journal of Computational Physics, Volume 501, 112777.

How to cite: Bauer, W., Wimmer, G. A., and Tang, X.-Z.: Structure preserving, transport stabilized finite element methods for two-fluid magnetohydrodynamics, EGU General Assembly 2026, Vienna, Austria, 3–8 May 2026, EGU26-13095, https://doi.org/10.5194/egusphere-egu26-13095, 2026.

EGU26-13120 | ECS | Orals | AS1.3

Toward three-dimensional radiative transfer computations via adaptive mesh refinement in both space and angle 

Yassine Tissaoui, Samuel Stechmann, Hang Wang, and Simone Marras

Radiative transfer plays a key role in the atmosphere’s thermodynamics as photons from the Sun interact with the atmosphere and with other photons being emitted by the earth itself. In climate modeling and numerical weather prediction, it is very common to simplify radiative transfer into a one-dimensional, purely vertical, phenomenon for the sake of saving computational resources. This is because solving the radiative transfer equation requires building and solving what is essentially a five-dimensional problem (three spatial dimensions and two angular dimensions). Improvements in computational resources have resulted in higher-resolution simulations for both climate and weather modeling, and this increase in resolution makes the assumption of purely vertical radiative transfer more and more difficult to justify. However, these improvements to computing power make it possible to attempt to solve a three-dimensional radiative transfer equation as part of a larger atmospheric model and in doing so take into account the three-dimensional effects that are commonly neglected. Doing this efficiently requires the use of adaptive mesh refinement, which while commonly used in the CFD community, is not a technique that is widely used in simulations of the atmosphere. In this work, Jexpresso.jl, an open source flexible general conservation law solver, is extended to solve the full equations of Radiative transfer. Adaptive mesh refinement in both space and angle is then used
to make it possible to speed up solving the three-dimensional radiative transfer equation and couple the solution to an atmospheric model which uses adaptive mesh refinement around clouds. The objective is to allow for improvements in the prediction of atmospheric flow behaviors around clouds and the resulting radiative heat fluxes, which are highly sensitive to cloud cover.

How to cite: Tissaoui, Y., Stechmann, S., Wang, H., and Marras, S.: Toward three-dimensional radiative transfer computations via adaptive mesh refinement in both space and angle, EGU General Assembly 2026, Vienna, Austria, 3–8 May 2026, EGU26-13120, https://doi.org/10.5194/egusphere-egu26-13120, 2026.

EGU26-14161 | Orals | AS1.3

A discontinuous Galerkin weather dycore for triangular and quadrangular grids 

Oswald Knoth and Marco Artiano

Spectral methods have a well-established history in numerical weather prediction. However, stable formulations for high-order discontinuous Galerkin (DG) methods in both horizontal and vertical directions have only recently been developed using split-form DG (cf. Waruszewski et al. and Souza et al.).

This presentation provides an overview of the implementation of split-form DG methods for the compressible Euler equations, utilizing various formulations on both triangular and quadrangular spherical grids. Key focus areas include split-form versions on triangular grids and the linear algebra associated with HEVI-like (Horizontally Explicit, Vertically Implicit) temporal integration schemes. To manage vertically propagating sound waves implicitly, temporal integration is performed using W-Rosenbrock methods with an approximate Jacobian in the radial direction.

The framework is implemented in the Julia package CGDycore.jl, leveraging KernelAbstractions.jl and MPI for parallel execution across diverse architectures. We present numerical comparisons using the Held-Suarez test case, alongside comprehensive weak and strong scaling results for different computing environments.

How to cite: Knoth, O. and Artiano, M.: A discontinuous Galerkin weather dycore for triangular and quadrangular grids, EGU General Assembly 2026, Vienna, Austria, 3–8 May 2026, EGU26-14161, https://doi.org/10.5194/egusphere-egu26-14161, 2026.

EGU26-15163 | ECS | Orals | AS1.3

Variants of HEALPix grids for global climate modelling 

Milan Klöwer, Maximilian Gelbrecht, Jack Leland, Brian Groenke, and Daisuke Hotta

Various grids are being used to discretize the sphere for general circulation models of ocean and atmosphere, coupled to sea ice and land models. Depending on the numerics (or the network architecture for machine learning-based models) some grids are better suited and more widely used but no single grid meets all requirements. The HEALPix grid was originally invented for applications in cosmology and designed for spectral transform efficiency, hierarchical nested ordering and equal-area grid cells. Here, we present several variants: The OctaHEALPix grid, and the octaminimal Gaussian and Clenshaw-Curtis grids. The OctaHEALPix grid inherits all the properties of the original HEALPix grid but based on a single square matrix instead of 12 used for the base pixels (faces) of the HEALPix grid. This eliminates singularities for the 8 corner cells with 7 instead of 8 neighbouring cells. The nested hierarchy of the OctaHEALPix grid is therefore a quadtree from the coarsest to the finest zoom level. Data on the OctaHEALPix grid can be arranged as a single square matrix, representing an equal-area map projection of the sphere, allowing for interpolation-free visualisation and data storage. However, the HEALPix grids do not provide an exact quadrature in the Legendre transform, such that transform errors are higher than with Gaussian, or equi-angle latitude-based grids using the Clenshaw-Curtis quadrature. The inexact transform with the HEALPix grids does not pose any problems in simulations where other sources of error dominate. We present the grid-flexible spectral transform implemented in the atmospheric circulation model SpeedyWeather.jl that simultaneously supports all ring-based, equi-longitude grids both on CPU (including multithreading) and GPU. The OctaHEALPix grid is also favourable for machine learning-based models like diffusion models based on the UNet architecture which only require custom boundary conditions. The other HEALPix variant we present is the octaminimal Gaussian grid, which imposes Gaussian latitudes on the OctaHEALPix grid which reduces transform errors while preserving more of the HEALPix’s equal-area and hierarchy properties. Similarly, the octaminimal Clenshaw-Curtis grid uses regular latitudes with the Clenshaw-Curtis quadrature. Simulations based on these grids are presented for coupled climate simulations and implications for hybrid numerical and machine learning-based models are discussed.

How to cite: Klöwer, M., Gelbrecht, M., Leland, J., Groenke, B., and Hotta, D.: Variants of HEALPix grids for global climate modelling, EGU General Assembly 2026, Vienna, Austria, 3–8 May 2026, EGU26-15163, https://doi.org/10.5194/egusphere-egu26-15163, 2026.

EGU26-15174 | Orals | AS1.3

New nonlinear normal modes flow decomposition based on instantaneous phase speeds in the normal modes framework 

Sergiy Vasylkevych, Juntian Chen, Katharina Holube, Nedjeljka Zagar, and Frank Lunkeit

Normal modes of hydrostatic primitive equations on the sphere decompose the linearized flow into the slow propagating Rossby, fast propagating inertio-gravity (IG), and equatorial Kelvin and MRG waves, characterized by intermediate speeds. However, this simple characterization is no longer valid in the nonlinear system, where wave-wave, wave-mean flow interactions, and adiabatic forcing can significantly alter the wave speeds.

A number of methods aimed at determining the slowly evolving component of the nonlinear flow (so called slow manifold) were proposed under the umbrella terms ”nonlinear normal mode decomposition” (NNMD) or "nonlinear normal mode initialization" (NNMI). In the classical NNMD, Rossby waves are considered slow a priory, while the slow IG part consists of the the unbalanced component of the flow slaved to the Rossby modes. More precisely, in classical NNMD, slow IG waves are those that would be stationary in a nonlinear flow consisting of the slow modes only. While this approach is very successful in suppressing high-speed gravity waves, it also suppresses slowly propagating linearly unbalanced flow and large scale tropical circulation.

We propose a new method of flow decomposition into the slow and fast components based on computing instantaneous phase speeds of normal modes in the nonlinear system. The method does not make assumptions on the composition of the slow manifold. Instead, the decomposition is obtained from a constraint optimization problem that minimizes the norm of the fast component, while requiring that the slow manifold does not contain modes propagating faster than the selected cutoff speed. We apply the method to reanalysis data, demonstrate its efficiency, and analyze the composition of the slow manifold as function of the cutoff speed. In particular, when the cutoff is chosen to be approximately equal to the fastest linear Rossby wave speed, most of the tropical circulation and significant part of unbalanced modes are retained in the slow manifold.  

How to cite: Vasylkevych, S., Chen, J., Holube, K., Zagar, N., and Lunkeit, F.: New nonlinear normal modes flow decomposition based on instantaneous phase speeds in the normal modes framework, EGU General Assembly 2026, Vienna, Austria, 3–8 May 2026, EGU26-15174, https://doi.org/10.5194/egusphere-egu26-15174, 2026.

EGU26-15662 | ECS | Orals | AS1.3

Examining the Contribution of Deep-Atmosphere Dynamical Cores to Mitigating Double ITCZ Bias in Aquaplanets 

Owen Hughes, Hing Ong, Adam Herrington, Peter Lauritzen, Oksana Guba, Mark Taylor, and Christiane Jablonowski

Atmospheric dynamical cores solve the equations of motion that describe the fluid flow at the resolved scales. Commonly used dynamical cores, including the Department of Energy's (DOE) ‘Higher Order Methods Modeling Environment’ (HOMME) dynamical core, also known as a ‘Spectral Element’ (SE) dynamical core, and the National Center for Atmospheric Research's (NCAR’s) ‘Model for Prediction Across Scales’ (MPAS), contained two approximations of the fluid dynamics equations. They are called the Shallow-atmosphere and Traditional (SA+T) approximations. These approximations discard the so-called Nontraditional Coriolis terms. Omitting these terms significantly biases the dynamical response to diabatic heating, inducing up to 10% relative error in the wind field as linear model results suggested. The biases induced by these approximations are expected to be most severe in tropical regions, and to become more severe at finer grid spacings. We present preliminary evidence that removing these approximations may help mitigate the double Intertropical Convergence Zone (ITCZ) bias that is present in many climate models.


We present dynamical core intercomparisons between the shallow-atmosphere version of the HOMME and MPAS dynamical cores and their deep-atmosphere variants which remove the SA+T approximations. We present an overview of the modifications made to the HOMME and MPAS dynamical cores. Aquaplanet simulations made using NCAR’s Community Earth System Model (CESM) show that for sea surface temperature distributions that produce a double ITCZ, removing the SA+T approximations induces equatorward shifts in precipitation. We will examine sensitivities to physics-dynamics coupling strategies and parametric sensitivity to the deep convection scheme. We also examine the performance of MPAS, which collocates physics columns with dynamics columns, with HOMME, which simulates physics on a sparser finite-volume grid. Our simulations are done at a nominal 1º grid spacing, providing conclusive evidence that the SA+T approximations induce climatologically significant biases at the coarser grid spacings used in workhorse climate model configurations.

How to cite: Hughes, O., Ong, H., Herrington, A., Lauritzen, P., Guba, O., Taylor, M., and Jablonowski, C.: Examining the Contribution of Deep-Atmosphere Dynamical Cores to Mitigating Double ITCZ Bias in Aquaplanets, EGU General Assembly 2026, Vienna, Austria, 3–8 May 2026, EGU26-15662, https://doi.org/10.5194/egusphere-egu26-15662, 2026.

EGU26-18731 | ECS | Orals | AS1.3

Structure-Preserving Methods for the Euler Equations 

Marco Artiano, Oswald Knoth, Peter Spichtinger, and Hendrik Ranocha

In the last decade, there has been growing interest in developing new dynamical cores for climate and weather simulations based on the Discontinuous Galerkin (DG) approach. To achieve accuracy, efficiency, and stability, various numerical formulations of the Euler equations are currently being explored.

In this talk, we present novel structure-preserving methods for different formulations of the Euler equations. These include models based on different thermodynamic variables, such as potential temperature, internal energy, or total energy, as well as the Exner pressure formulation and the vector-invariant form. These methods are developed within the flux-differencing DG framework, with a specific focus on the efficient implementation of split forms for both conservative and non-conservative terms.

The implementation is carried out entirely in Julia and is integrated within the Trixi.jl and CGDycore.jl ecosystems. We will discuss the different architectural approaches used in these packages and showcase numerical results, specifically focusing on the baroclinic instability test case to compare the different formulations.

How to cite: Artiano, M., Knoth, O., Spichtinger, P., and Ranocha, H.: Structure-Preserving Methods for the Euler Equations, EGU General Assembly 2026, Vienna, Austria, 3–8 May 2026, EGU26-18731, https://doi.org/10.5194/egusphere-egu26-18731, 2026.

Accurate and efficient time integration is a critical component of Numerical Weather Prediction (NWP) and climate modelling. Current approaches in the Met Office’s next‑generation dynamical core, GungHo, rely on a serial-in-time, low-order, iterative semi‑implicit timestepping scheme coupled with Flux‑Form Semi‑Lagrangian (FFSL) transport scheme. As model resolutions and computational scales increase, exploiting parallelism in the time dimension is becoming increasingly important.

This work evaluates the potential of time‑parallel Deferred Correction (DC) methods as a viable alternative to these traditional schemes. I examine two strategies for introducing temporal parallelism:

  • Revisionist Integral Deferred Correction (RIDC), which parallelises across correction sweeps, and
  • Spectral Deferred Correction (SDC) with time‑parallel (diagonal) preconditioners, which parallelises across collocation nodes.

Results are presented for a suite of standard dynamical core test cases for the compressible Euler equations. These experiments demonstrate how time‑parallel DC algorithms can improve temporal accuracy and offer meaningful opportunities for reducing wall‑clock time.

Together, these developments highlight the promise of DC-based integrators as a pathway toward more scalable and efficient time-stepping in next‑generation atmospheric models.

How to cite: Brown, A.: A comparison of time-parallel deferred correction methods for atmospheric modelling, EGU General Assembly 2026, Vienna, Austria, 3–8 May 2026, EGU26-19200, https://doi.org/10.5194/egusphere-egu26-19200, 2026.

Data-driven algorithms provide an exciting opportunity to represent unresolved, and therefore parameterised, processes in a way that matches available data without the need to `hand-tune' the parameterisation. However, on their own they suffer from issues with accurate prediction of extreme events and long-term trends, at least in part due to their lack of any representation of physical constraints. Hybrid weather and climate prediction models address this issue by combining data-driven algorithms with more traditional algorithms based on solving the partial differential equations (PDEs) that govern atmospheric flow. However, training the data-driven component separately from the PDE solver can introduce issues with stability and still does not ensure that the combined model will not drift over long times. Online training addresses this issue by more tightly coupling the two model components during training. This requires that the PDE model is differentiable so that during training backpropagation can be performed on multiple timesteps of both the PDE solver and the data-driven component. In this work we introduce a compatible finite element dynamical core that is automatically differentiable since it is built using the Firedrake finite element library. Here we will show how this can be coupled to PyTorch to perform end-to-end training on idealised test cases.

How to cite: Shipton, J. and Hartney, N.: Investigating the impact of model formulation on the accuracy andefficiency of a hybrid dynamical core with online training., EGU General Assembly 2026, Vienna, Austria, 3–8 May 2026, EGU26-20183, https://doi.org/10.5194/egusphere-egu26-20183, 2026.

Intraseasonal variation of winter climate in China has been remarkable in recent years, such as: reversed or alternating extreme cold and extreme warm events in different months or in different stages of the winter. There are many challenges in climate prediction in winter because the intraseasonal climate variation is often within the seasonal mean variation. It is therefore urgent to understand the intraseasonal variation of winter climate in China, to identify its predictability and predictive sources, and to propose effective prediction methods and prediction models for it. The author reviews progress in research during the last five years on the main characteristics, physical processes, mechanisms, predictability, and prediction of intraseasonal variation of winter climate in China, considering several related systems including the winter monsoon, Siberian high, and stratospheric polar vortex. 

How to cite: Fan, K.: Intraseasonal variation of winter climate in China and climate prediction, EGU General Assembly 2026, Vienna, Austria, 3–8 May 2026, EGU26-1041, https://doi.org/10.5194/egusphere-egu26-1041, 2026.

EGU26-1176 | ECS | Posters on site | AS1.4

Capturing Long-Range Dependencies for Improved MISO Prediction via Deep Learning  

Anirudh Keloth Methal, Prasang Raj, Sandeep Sukumaran, and Hariprasad Kodamana

The subseasonal-to-seasonal (S2S) prediction gap is a major challenge in operational forecasting, especially for the Indian Summer Monsoon. Prediction skill of the dynamical models for its dominant mode of variability, the Monsoon Intraseasonal Oscillation (MISO), drops sharply beyond one week. This 30–60-day northward-propagating mode governs active and break spells, with major implications for agriculture, water resources, and disaster preparedness across South Asia. In this study, we developed a deep learning forecasting framework built on a Transformer architecture to capture the long-range dependencies inherent to intraseasonal variability. We used 25 years of high-resolution (0.25° × 0.25°) daily TRMM/GPM precipitation data to derive MISO indices (MISO1 and MISO2) via extended empirical orthogonal function (EEOF) analysis for the boreal summer months (June–September). These indices formed the basis for training and evaluating the Transformer model. When evaluated for the 2018–2022 period, the Transformer substantially outperformed traditional numerical weather prediction models, accurately forecasting the phase and amplitude of MISO with lead times of up to 18 days. It also produced better phase alignment and reduced phase-lag errors compared to NWP systems at extended leads.  The approach was further extended to predict NLSA-based MISO indices. In addition, a Vision Transformer (ViT) was used to make preliminary forecasts of spatial rainfall patterns associated with MISO propagation. These results highlight the potential of advanced deep learning architectures to enhance S2S prediction of monsoon intraseasonal variability, supporting improved early warning systems and decision-making in monsoon-affected regions. 

How to cite: Keloth Methal, A., Raj, P., Sukumaran, S., and Kodamana, H.: Capturing Long-Range Dependencies for Improved MISO Prediction via Deep Learning , EGU General Assembly 2026, Vienna, Austria, 3–8 May 2026, EGU26-1176, https://doi.org/10.5194/egusphere-egu26-1176, 2026.

Improving subseasonal predictions of heatwave (HW) onset is crucial for early warning systems. While soil moisture (SM) is recognized as a key initial land surface condition, the impact of its three-dimensional (3D) error structure on HW onset prediction uncertainty, and strategies to mitigate this uncertainty, remain insufficiently explored.

This two-part study addresses these gaps, focusing on predictions with a three-week lead time for eight HW onsets over the Middle and Lower Reaches of the Yangtze River (MLYR) region. First, the Conditional Nonlinear Optimal Perturbation (CNOP) method was employed to identify the 3D-structured initial SM errors that maximize uncertainty in subseasonal HW onset predictions. Results show that these structured CNOP-type errors, characterized primarily by negative anomalies with coherent vertical patterns, intensify HW magnitude and advance onset timing. They exert greater impact than spatial random errors by altering surface energy partitioning: reducing latent heat and enhancing sensible heat primarily through vegetation-related processes, while also modulating net longwave radiation via the Stefan-Boltzmann law. Further experiments revealed the importance of deep-layer SM errors and nonlinear synergistic effects across soil layers.

Building on this, the second part evaluates whether targeted observations of initial SM in CNOP-identified sensitive areas (SAs) can enhance prediction skill. Observing System Simulation Experiments (OSSEs) for eight HW events demonstrate that initializing with more realistic SM over SAs consistently outperforms improvements over non-sensitive areas. This targeted approach improves predictions for an average of 86% of ensemble members per case and reduces the mean error in area-averaged maximum temperature during HW onset by 43%. The improvement is attributed to more accurate initial SM conditions, leading to a better representation of surface heat fluxes.

Collectively, these studies systematically highlight the error structure of initial SM field as a key source of subseasonal HW prediction uncertainty and demonstrate the practical potential of CNOP-based targeted observation strategies to improve HW onset predictions.

How to cite: Liu, H., Sun, G., Mu, M., Zhang, Q., and Chen, B.: From Error Identification to Targeted Observations: The Role of 3D Soil Moisture Errors in Improving Subseasonal Heatwave Onset Predictions, EGU General Assembly 2026, Vienna, Austria, 3–8 May 2026, EGU26-2229, https://doi.org/10.5194/egusphere-egu26-2229, 2026.

EGU26-3518 | Posters on site | AS1.4

Towards Sub-Seasonal Flash Drought Prediction Using a Vision Transformer Approach 

Noelia Otero, Miguel Ángel Fernández-Torres, Atahan Özer, and Jackie Ma

Unlike traditional droughts that evolve gradually, flash droughts (FD) are characterized by rapid intensification, leading to sustained dry conditions with disproportionately high impacts on ecosystems. Despite substantial progress in short- to medium-range weather forecasting, predicting these events remains a significant hurdle for both early warning systems and physically-based subseasonal-to-seasonal (S2S) prediction frameworks.

To address this challenge, we present a deep learning framework leveraging a Vision Transformer with explicit temporal attention for the prediction of soil moisture anomalies (SMA) over Europe. The model employs a dual-stream attention mechanism that disentangles temporal dynamics from spatial dependencies: temporal self-attention with rotary positional embeddings captures lead-time-dependent evolution at each location, while spatial attention encodes cross-regional relationships. This architecture enables to learn multi-scale representations, ranging from synoptic variability to persistent anomaly patterns. Furthermore, the model supports probabilistic forecasting, estimating the full conditional distribution of soil moisture anomalies to provide principled uncertainty quantification, a critical requirement for operational early warning systems. 

Additionally, the framework employs a multitask learning approach that exploits the relationship between continuous soil moisture anomalies and discrete flash drought characteristics derived from the Flash Drought Intensity Index (FDII). This index integrates both the rate of soil moisture decline and drought severity into a unified indicator.  A shared encoder learns representations that capture the coupled dynamics of soil moisture evolution and flash drought emergence, while task-specific prediction heads accommodate the distinct statistical properties of each target variable.

The results indicate that our approach achieves predictive skill competitive with more complex spatio-temporal models while maintaining computational efficiency suitable for operational deployment. Evaluation against standard baselines, including climatology and persistence, as well as state-of-the-art deep learning models, demonstrates the framework’s ability to resolve the rapid intensification dynamics typical of flash drought onset. This work lays the foundation for interpretable, scalable, and probabilistic prediction of rapid-onset drought events at S2S timescales.

How to cite: Otero, N., Fernández-Torres, M. Á., Özer, A., and Ma, J.: Towards Sub-Seasonal Flash Drought Prediction Using a Vision Transformer Approach, EGU General Assembly 2026, Vienna, Austria, 3–8 May 2026, EGU26-3518, https://doi.org/10.5194/egusphere-egu26-3518, 2026.

EGU26-3570 | ECS | Orals | AS1.4

Insights from the AI Weather Quest: An international machine-learning competition for sub-seasonal prediction 

Joshua Talib, Olga Loegel, Frederic Vitart, Jörn Hoffmann, and Matthew Chantry

Recent advances in machine learning (ML) illustrate the potential for significant improvements in weather predictive skill. At the same time, ML-based technologies have broadened the range of organisations capable of delivering skilful atmospheric forecasts. Given these developments, the ECMWF AI Weather Quest was designed as an open and transparent international competition, enabling a range of organisations to submit ML-based subseasonal forecasts. With participation from more than 40 competing teams spanning academia, public institutions and private companies, the Quest provides a unique framework for systematically evaluating and comparing multiple ML-based subseasonal forecasting systems.    

Participants of the AI Weather Quest submit global probabilistic quintile forecasts of near-surface temperature, mean sea level pressure, and precipitation at either a 3- or 4-week lead time in an operational-style forecasting environment. This set-up has encouraged model development whilst challenging participants to develop forecasting systems that operate in realistic settings and deliver actionable forecast parameters.

In this presentation we will provide an overview of the AI Weather Quest design and compare subseasonal forecast skill of both ML-based and dynamical prediction systems. Additionally, we will highlight emerging approaches in ML-based post-processing and fully data-driven forecasting. During the first three-month competitive season, ML-based post-processing of dynamical forecasts achieved the highest skill, highlighting contrasting performance across approaches and underscoring the need for further development in both dynamical and ML-based forecasting. We will also share opportunities for wider engagement and discuss future developments planned for the ECMWF AI Weather Quest.

How to cite: Talib, J., Loegel, O., Vitart, F., Hoffmann, J., and Chantry, M.: Insights from the AI Weather Quest: An international machine-learning competition for sub-seasonal prediction, EGU General Assembly 2026, Vienna, Austria, 3–8 May 2026, EGU26-3570, https://doi.org/10.5194/egusphere-egu26-3570, 2026.

EGU26-4190 | ECS | Orals | AS1.4

Impact of Systematic Relaxation Experiments on Subseasonal Forecast Skill in Machine Learning Weather Models 

Siyu Li, Prabhakar Namdev, and Julian Quinting

Forecasting extratropical weather on subseasonal timescales continues to be a challenge. One possible source of atmospheric predictability on these timescales are slowly evolving components of the climate system, most notably tropical modes of variability such as the Madden–Julian Oscillation (MJO) and tropical waves. These sources of predictability are not fully exploited because of systematic errors in numerical weather prediction (NWP) models. In particular, forecast errors that develop in the tropics at lead times of several days grow up-scale, propagate and degrade forecast skill in the extratropics on subseasonal timescales. Regions of forecast errors that exert the strongest influence on extratropical forecast skill remain poorly identified. Relaxation experiments using NWP models provide a means to isolate these regions, but such experiments are computationally demanding. In this study, we employ machine learning–based weather prediction models to perform relaxation experiments across multiple tropical regions. Probabilistic forecasts are generated using perturbed initial conditions from the Ensemble of Data Assimilations (EDA) of the European Centre for Medium-Range Weather Forecasts (ECMWF). Reforecasts covering a five-year period (2020--2024) are used to systematically assess the impact of relaxation strategies and the role of tropical variability, with a particular focus on the MJO, on extratropical subseasonal forecast skill. A key-finding is that predictions of the negative phase of the North Atlantic Oscillation improve when relaxation is applied following MJO phases 6 and 7 at initial time. Rossby wave source diagnostics are examined to investigate the dynamical processes leading to improvements in extratropical forecasts. The results demonstrate the value of relaxation experiment as a diagnostic tool when integrated with emerging machine learning–based prediction systems.

How to cite: Li, S., Namdev, P., and Quinting, J.: Impact of Systematic Relaxation Experiments on Subseasonal Forecast Skill in Machine Learning Weather Models, EGU General Assembly 2026, Vienna, Austria, 3–8 May 2026, EGU26-4190, https://doi.org/10.5194/egusphere-egu26-4190, 2026.

EGU26-4276 | Posters on site | AS1.4

MJO Prediction in the CWA GEPSv3: Model Performance and Physical Processes Underlying Simulation Errors 

Yu-heng Tseng, Chung-Wei Lee, Yun-Chuan Shao, Pang-Yen Liu, Hsi-Hisen Tseng, and Jen-He Chen

A multi-scale coupled framework has been implemented in the Central Weather Administration’s Global Ensemble Prediction System Version 3 (CWA GEPSv3) to improve extended-range forecasts over Taiwan. Reforecasts for January from 2001 to 2020 show skillful Madden–Julian Oscillation (MJO) predictions, with an average lead time of 17 days and a maximum of 33 days. The model realistically captures the eastward propagation of the MJO from the Indian Ocean to the Maritime Continent (MC) but fails to sustain its intensity beyond the MC due to a boundary-layer dry bias emerging 5–10 days before the convection center’s arrival.

Event-based analysis reveals that accurate MJO forecasts are more common during La Niña years, whereas poor forecasts occur more often during El Niño years. The low-frequency moisture field mitigates the dry bias over the MC during La Niñas, but amplifies it during El Niños. Ocean–atmosphere coupling enhances forecast skill at 20–30 lead days, and it is only pronounced for the good-prediction cases.

The boundary-layer dry bias over the MC primarily results from weak upward motion linked to insufficient meridional convergence. A modified dynamical core enhances the simulation of horizontal convergence, yielding clearer eastward propagation of MJO signals. These results elucidate the physical processes underlying model biases in GEPSv3 and provide practical guidance for improving subseasonal-to-seasonal forecasting.

How to cite: Tseng, Y., Lee, C.-W., Shao, Y.-C., Liu, P.-Y., Tseng, H.-H., and Chen, J.-H.: MJO Prediction in the CWA GEPSv3: Model Performance and Physical Processes Underlying Simulation Errors, EGU General Assembly 2026, Vienna, Austria, 3–8 May 2026, EGU26-4276, https://doi.org/10.5194/egusphere-egu26-4276, 2026.

Data-driven models have achieved significant progress in sub-seasonal prediction, but predicting the initiation of the Madden-Julian Oscillation (MJO) remains a critical challenge, largely due to initial uncertainties from sparse observations over tropical oceans and complex multiscale interactions. Therefore, identifying sensitive areas in initial conditions is crucial to both reveal the underlying error growth mechanisms and provide guidance for target observations. Here, the FuXi-S2S model is applied to explore the initial sensitivity and instability modes of MJO initiation. First, the evaluation of prediction skill identifies the initiation of primary MJO events at a 3-pentad lead time as a critical bottleneck. Simulations initialized with optimized initial conditions within analysis uncertainty closely reproduce the observed MJO evolution, thereby validating the high initial sensitivity during the first 4 pentads. Subsequently, the conditional nonlinear optimal perturbation (CNOP) method is utilized to identify the optimally growing initial errors (OGIEs) and optimal precursors (OPRs). Analysis of OGIEs reveals three dominant types of error modes causing the largest forecast errors, indicating that the rapid growth of OGIEs is driven by the coupling of local low-level thermodynamic instability (temperature and moisture) and upstream upper-level dynamic forcing (wind). Moreover, the spatial structure and perturbation evolution of OPRs exhibit high consistency with OGIEs. The identification of these shared instability modes provides a theoretical foundation for target observations, suggesting that additional observations in sensitive areas can simultaneously reduce initial errors and capture precursors.

How to cite: Peng, Z., Mu, M., and Li, H.: Predictability of MJO Initiation in Data-Driven Models: Shared Instability Modes of Optimally Growing Initial Errors and Optimal Precursors, EGU General Assembly 2026, Vienna, Austria, 3–8 May 2026, EGU26-4347, https://doi.org/10.5194/egusphere-egu26-4347, 2026.

Sudden stratospheric warming (SSW) is identified as key sources of skill in winter subseasonal-to-seasonal (S2S) forecasts because of their surface impacts lasting up to 30–60 days through stratosphere troposphere coupling, despite their typical prediction being limited about 10 days. A better understanding of the predictability of the SSW itself, thus, is fundamental. Most of the previous studies investigate the predictability of SSW events using linear approaches, which are insufficient given the inherently chaotic and nonlinear nature of SSWs. In the study, we apply a nonlinear method—Backward Searching for the Initial Condition (BaSIC)—to quantify the local predictability limit the 2021 SSW event, which caused cold extremes across East Asia and North America. Using ERA5 reanalysis and the S2S reforecasts data, BaSIC estimates the maximum prediction lead time of this 2021 SSW event to be 17 days. To explore sensitive region of forecast uncertainty, we identify regions of fastest error growth via error tracking in S2S systems using BaSIC method. Forecast errors during the SSW event are small across the polar stratosphere after initiation but grow gradually over two weeks, accelerating rapidly over central Eurasia (30◦-60◦E) and spreading across the continent. This points to central Eurasia at high altitudes as a critical region for SSW forecast error development.

How to cite: li, X.: Quantifying the practical local predictability of the 2021 sudden stratospheric warming event using a nonlinear method, EGU General Assembly 2026, Vienna, Austria, 3–8 May 2026, EGU26-5219, https://doi.org/10.5194/egusphere-egu26-5219, 2026.

EGU26-5602 | Orals | AS1.4

Development of Forecast and Alert Logic for Extended-Range Heatwave Early Warning 

Natalia Korhonen and Hilppa Gregow

Heatwaves are among the most impactful climate-related hazards in Europe, with increasing frequency, duration, and severity under climate change. Currently, heatwave warnings across Europe are typically issued 2–7 days in advance. Extending these lead times could substantially enhance preparedness by enabling earlier adaptive actions and more effective resource allocation.

On sub-seasonal time scales, extended-range weather forecasts (approximately 2 weeks to 1 month) have been shown to exhibit higher skill for warm extremes than for average temperature conditions over Europe. In particular, the persistence of prolonged heat waves seems to have a higher-than-average level of predictability even at a 3-week lead time. Recent verification studies have demonstrated statistically significant probabilistic skill of ECMWF extended-range ensemble reforecasts for European heatwaves defined using 5-day mean temperatures. Together, these findings indicate that extended-range ensemble forecasts can provide early warning information not only on the likelihood of heatwave occurrence, but also on the potential persistence and severity of extreme heat events.

Building on this demonstrated predictability, we take the next step towards practical early warning applications by developing a forecast and alert logic for extended-range heatwave prediction. We post-process ECMWF extended-range ensemble forecasts to produce probabilistic heatwave forecasts using a previously developed and verified methodology based on 5-day mean temperature thresholds. Building on this framework, we develop a rule-based alert logic that translates probabilistic forecasts into actionable early warning information. The alert logic combines forecasted heatwave probabilities with indicators of forecast reliability and flow-dependent predictability, including ensemble spread, the heatwave life cycle state at forecast initialization, and North Atlantic sea surface temperature anomalies at the time of forecast initialization. These components are used to define multiple alert levels, ranging from no-action conditions to high-impact heatwave risk.

The proposed framework provides a practical pathway from extended-range probabilistic forecasts to impact-oriented early warning.

How to cite: Korhonen, N. and Gregow, H.: Development of Forecast and Alert Logic for Extended-Range Heatwave Early Warning, EGU General Assembly 2026, Vienna, Austria, 3–8 May 2026, EGU26-5602, https://doi.org/10.5194/egusphere-egu26-5602, 2026.

EGU26-6412 | ECS | Orals | AS1.4

Weather Emulators Push the Frontier of Heat Extremes Forecasting 

Cas Decancq, Thomas Mortier, Jessica Keune, and Diego Miralles

For more than half a century, meteorology has accepted a fundamental limit: weather cannot be predicted beyond two weeks. This boundary, rooted in the chaotic nature of the atmosphere, has shaped generations of forecasting science, defining the boundary between weather and climate forecasting and constraining our ability to anticipate high-impact extremes. At the same time, extreme heat has emerged as the deadliest climate-related hazard worldwide, underscoring the urgent need for reliable early warnings at lead times relevant for public health, energy systems, and disaster risk reduction. Recent advances in deep learning have produced a new class of global weather models accelerating progress in forecasting, raising the question of whether the traditional two-week limit is beginning to shift.

Here we evaluate six state-of-the-art deep learning weather emulators — Pangu-Weather, FuXi, ArchesWeather, AIFS, GraphCast and Aurora — alongside leading dynamical approaches and statistical baselines in forecasting global surface temperature and extreme heat events at a 14-day lead time. Models are evaluated using a suite of metrics, considering global temperature and extreme heat forecasting in both regression and classification settings. Several emulators rival or even surpass physics-based forecasts for temperature, but struggle to balance deterministic skill with realistic spectral properties. While all models display predictive skill for extreme heat, their predictions are deterministic and often inaccurate, offering little insight into uncertainty and limiting their reliability. Overall, results demonstrate that deep learning is starting to extend the frontiers of deterministic predictability. However, key limitations remain that constrain their applicability for operational early-warning systems, highlighting the need for reliable probabilistic approaches in a rapidly warming climate.

How to cite: Decancq, C., Mortier, T., Keune, J., and Miralles, D.: Weather Emulators Push the Frontier of Heat Extremes Forecasting, EGU General Assembly 2026, Vienna, Austria, 3–8 May 2026, EGU26-6412, https://doi.org/10.5194/egusphere-egu26-6412, 2026.

EGU26-6531 | ECS | Posters on site | AS1.4

Intraseasonal SST variations in the South China Sea during the borealwinter and the impacts of Madden-Julian Oscillation 

Qin Mingyue, Xingyuan Ren, Xinrong Wu, and Guosong Wang

Intraseasonal variations of sea surface temperature (SST) in the South China Sea (SCS) during winter are investigated by using atmospheric and oceanic reanalysis in this study. The dominant pattern of SST variations within the 10–90-day timescale is derived by empirical orthogonal function analysis, which features a basin-wide warming or cooling spatial pattern, with a cycle period of 30–35 days. Composite analysis and mixed-layer heat budget analysis are conducted to investigate the physical process controlling SST variability. The formation of intraseasonal SST variations is primarily attributable to the forcing of wind-related latent heat flux and shortwave radiation flux changes. During the warming (cooling) period, anomalous southerly (northerly) winds tend to weaken (enhance) climatological northerly winds. This, in turn, results in a weakening (enhancement) of wind speed, favoring a reduction (increase) in latent heat flux from the ocean into atmosphere, accompanied by an increase (decrease) in shortwave radiation flux. In addition to surface heat flux forcings, ocean zonal advection is the second most significant contributing factor, exerting a negative effect. Finally, the effect of the Madden–Julian Oscillation (MJO) on the SST is studied. The variations in wind anomalies and surface heat flux changes associated with SST intraseasonal variability are significantly related to the MJO activities. The anomalous anticyclone (cyclone) in the northwest Pacific Ocean is induced by MJO, with enhanced (depressed) convection occurring in the Indian Ocean and depressed (enhanced) convection over the Maritime Continent and western Pacific Ocean, which accounts for the anomalous southerly (northerly) winds and enhanced (depressed) shortwave radiation observed. 

How to cite: Mingyue, Q., Ren, X., Wu, X., and Wang, G.: Intraseasonal SST variations in the South China Sea during the borealwinter and the impacts of Madden-Julian Oscillation, EGU General Assembly 2026, Vienna, Austria, 3–8 May 2026, EGU26-6531, https://doi.org/10.5194/egusphere-egu26-6531, 2026.

Based on the hindcasts from five subseasonal-to-seasonal (S2S) models participating in the S2S Prediction Project,
this study evaluates the performance of the multimodel ensemble (MME) approach in predicting the subseasonal
precipitation anomalies during summer in China and reveals the contributions of possible driving factors. The results
suggest that while single-model ensembles (SMEs) exhibit constrained predictive skills within a limited forecast lead time
of three pentads, the MME illustrates an enhanced predictive skill at a lead time of up to four pentads, and even six pentads,
in southern China. Based on both deterministic and probabilistic verification metrics, the MME consistently outperforms
SMEs, with a more evident advantage observed in probabilistic forecasting. The superior performance of the MME is
primarily attributable to the increase in ensemble size, and the enhanced model diversity is also a contributing factor. The
reliability of probabilistic skill is largely improved due to the increase in ensemble members, while the resolution term does
not exhibit consistent improvement. Furthermore, the Madden–Julian Oscillation (MJO) is revealed as the primary driving
factor for the successful prediction of summer precipitation in China using the MME. The improvement by the MME is not
solely attributable to the enhancement in the inherent predictive capacity of the MJO itself, but derives from its capability in
capturing the more realistic relationship between the MJO and subseasonal precipitation anomalies in China. This study
establishes a scientific foundation for acknowledging the advantageous predictive capability of the MME approach in
subseasonal predictions of summer precipitation in China, and sheds light on further improving S2S predictions.

How to cite: Guo, L.: Advantages of the Multimodel Ensemble Approach forSubseasonal Precipitation Prediction in Chinaand the Driving Factor of the MJO, EGU General Assembly 2026, Vienna, Austria, 3–8 May 2026, EGU26-9223, https://doi.org/10.5194/egusphere-egu26-9223, 2026.

The Madden-Julian Oscillation (MJO) is the dominant and most influential intraseasonal oscillation in the tropics, as well as a prominent source of subseasonal-to-seasonal predictability. Its maintenance and propagation, particularly across the Maritime Continent, remain a challenge for theory, simulation and forecasting. In modern MJO theories, moisture plays a central role. As the primary source of moisture, sea surface latent heat flux has received significant attention. The sea surface latent heat flux can be induced by both base-state winds and wind bursts, but the different effects of these two types of latent heat flux are not well understood.

This study addresses this issue by analyzing CESM hindcasts of a strong MJO event in April 2009 that crossed the Maritime Continent with little decay. The control simulation reproduces the observed propagation characteristics and intensity of this event. We then impose an upper limit on wind speed in the bulk formula used by the model to calculate sea surface latent heat flux. By lowering this limit in different simulations, we reduce the latent heat flux from strong winds first, followed by the flux from base-state winds. Based on frequency distributions over the Indian Ocean and the Maritime Continent, the peaks for base-state winds and wind bursts occur at 3 m/s and 10 m/s respectively.

Results indicate that wind-burst-induced latent heat flux is essential to maintaining MJO amplitude over the Maritime Continent, due to the region’s lower sea fraction. As convection over land tends to disrupt the coherent organization of the MJO convection envelope, lower sea fraction increases the sensitive of MJO amplitude to sea surface latent heat flux. On the other hand, the base-state surface latent heat flux modulates MJO propagation speed due to its effectiveness in moistening the atmosphere. As the base-state latent heat flux is reduced, the atmosphere dries, moisture advection decreases, and the MJO slows down. Additional simulations confirm these findings in other MJO cases. This study underscores the importance of accurately simulating strong winds for maintaining MJO amplitude over the Maritime Continent and overcoming the barrier effect.

How to cite: Weng, L. and Lin, Y.: Distinct Roles of Base-State and Wind-Burst-Induced Sea Surface Latent Heat Flux in MJO Maintenance and Propagation, EGU General Assembly 2026, Vienna, Austria, 3–8 May 2026, EGU26-9451, https://doi.org/10.5194/egusphere-egu26-9451, 2026.

A set of relaxation experiments with the European Centre for Medium-range Weather Forecasts (ECMWF) model is used to explore the influence of tropical and stratospheric teleconnections on forecast skill, variability of forecast ensemble mean (EM) and ensemble spread (ES) in the wintertime Northern Hemisphere at sub-seasonal timescales. The influence is diagnosed by comparing the relaxation experiments, which relax the temperature and wind fields in specific regions to observed values, with the free running (control) experiment. During weeks 3–6 the tropical relaxation increases the forecast skill for sea level pressure (SLP) mostly south of 50°N but also over the North Atlantic, Northern Europe and eastern Canada. Skill improvements occur via both stratospheric and tropospheric pathways. The stratospheric relaxation improves the skill mostly in high latitudes, over Europe, and North Atlantic. Skill improvements are smaller for surface temperature and total precipitation, suggesting a smaller role of the teleconnections in their predictability.

The increases in skill are generally associated with increased variability of EM, considered to represent the predictable signal, and reduced ES representing noise. However, this does not happen in all areas where the skill is increased. In high latitudes, where the stratospheric impacts are strongest, the EM variability does not increase in the stratospheric relaxation experiments consistently with increases in skill, implying that EM does not reflect well the predictable signal. We suggest that the ensemble size available in the experiments (11 members) is not always enough to make it possible to fully extract signal from noise, and that larger ensembles (20–50 members or even more depending on area and variable) would be beneficial for studies of sub-seasonal predictability associated with the teleconnections in mid- and high latitudes, including windows for forecast opportunities.

How to cite: Karpechko, A., Butler, A., and Vitart, F.: Signal, noise and skill in sub-seasonal forecasts: the role of tropical teleconnections and stratosphere-troposphere coupling, EGU General Assembly 2026, Vienna, Austria, 3–8 May 2026, EGU26-11008, https://doi.org/10.5194/egusphere-egu26-11008, 2026.

EGU26-11985 | ECS | Posters on site | AS1.4

Using machine learning to enhance skill of subseasonal-to-seasonal (S2S) temperature forecasts 

Aheli Das, David Brayshaw, John Methven, Thomas Frame, Christopher O'Reilly, Shivkumar Sharma, Jake Mammatt, and Shane Fox

Energy demand, especially for residential heating, is largely driven by temperature.  High-quality subseasonal-to-seasonsl (S2S) forecasts of temperature are therefore valuable for risk management and energy trading, yet the use of these forecasts is often limited by their complexity, by difficulties in combining different forecast types, and by the relatively weak probabilistic skill they produce. Sequential learning algorithms (SLA), offer a means to overcome many of these difficulties.  SLAs optimally combine information from multiple ‘experts’ or predictors using weights and reduce forecast bias by continuously learning over time from each forecast verification.  The information from these ‘experts’, which can both be statistical or numerical forecasts, are used as SLA inputs and blend into a single information stream through dynamical updating of the weights. Here, ‘experts’ are defined as quantiles of raw ECMWF S2S 2 m temperatures (T2m) forecasts without bias adjustment and ERA5 T2m climatology. The SLA produces probabilistic forecasts of Great Britain-averaged T2m at lead times of 1-4 weeks for the period 2004-2023.  Results show positive anomaly correlation co-efficient and rank probability skill scores for SLA T2m forecasts across all weeks compared to both the raw S2S and climatological forecast.  Analysis of the weight evolution shows that SLA relies heavily on the raw forecast experts at weeks 1-2 but shifts towards climatological experts in the later weeks, with a clear seasonal evolution to the weight profile. It is also confirmed that this online-learning approach with adaptive weights outperforms the most optimal static weight combination even though the latter is permitted the benefit of perfect foresight.

How to cite: Das, A., Brayshaw, D., Methven, J., Frame, T., O'Reilly, C., Sharma, S., Mammatt, J., and Fox, S.: Using machine learning to enhance skill of subseasonal-to-seasonal (S2S) temperature forecasts, EGU General Assembly 2026, Vienna, Austria, 3–8 May 2026, EGU26-11985, https://doi.org/10.5194/egusphere-egu26-11985, 2026.

EGU26-14077 | ECS | Orals | AS1.4

Bridging the "Predictability Desert": A Probabilistic Bias Correction Framework for AI and Dynamical Subseasonal Forecasts 

Soukayna Mouatadid, Jonathan Weyn, Hannah Guan, Paulo Orenstein, Judah Cohen, Lester Mackey, Alex Lu, Genevieve Flaspohler, Zekun Ni, and Haiyu Dong

Subseasonal weather prediction (2–6 weeks lead time) represents a critical "predictability desert" where the influence of atmospheric initial conditions diminishes and boundary forcings have not yet become dominant. Despite its inherent difficulty, skillful subseasonal forecasting is vital for decision-making in agriculture, water resource management, public health and disaster preparedness. While recent breakthroughs in artificial intelligence (AI) and machine learning (ML) have revolutionized synoptic-scale weather forecasting, these gains have not yet fully translated to the subseasonal regime, where systematic biases in both dynamical and data-driven models remain a primary bottleneck.

In this work, we present a novel Probabilistic Bias Correction (PBC) framework that leverages ML to systematically identify and correct errors in global model forecasts. Our approach is model-agnostic, as we demonstrate by showing it can enhance both traditional physics-based dynamical ensembles and emerging AI-based forecasting systems. By training on historical reanalysis and model forecast datasets, the PBC framework significantly reduces systematic errors that typically degrade raw model skill at subseasonal lead times.

We evaluate the performance of our PBC algorithms against several high-standard benchmarks, including climatology, multi-model super-ensembles from major operational centers, and state-of-the-art AI models. Notably, our framework was benchmarked within the context of the AI Weather Quest (sponsored by ECMWF). Results demonstrate that our PBC forecasts outperform all participating dynamical and ML models, including the ECMWF Integrated Forecasting System (IFS) and Artificial Intelligence Integrated Forecasting System (AIFS), in predicting 2-meter temperature, precipitation and mean sea level pressure.

To demonstrate the real-world utility of this system for early warning capabilities, we present case studies of extreme winter weather events in the Eastern United States and Europe. Our model successfully predicted these high-impact events several weeks in advance, with forecasts disseminated in real-time to stakeholders via social media. Our findings suggest that while AI-based models like FuXi-S2S offer a strong alternative to dynamical systems, the integration of probabilistic post-processing is critical to maximize predictive skill and provide reliable, sector-specific decision support in a changing climate.

How to cite: Mouatadid, S., Weyn, J., Guan, H., Orenstein, P., Cohen, J., Mackey, L., Lu, A., Flaspohler, G., Ni, Z., and Dong, H.: Bridging the "Predictability Desert": A Probabilistic Bias Correction Framework for AI and Dynamical Subseasonal Forecasts, EGU General Assembly 2026, Vienna, Austria, 3–8 May 2026, EGU26-14077, https://doi.org/10.5194/egusphere-egu26-14077, 2026.

EGU26-14647 | Posters on site | AS1.4

Developing tracking capability for mesoscale convective systems in the Arabian Peninsula through observations and model-based subseasonal reforecasts 

Hsin-I Chang, Christoforus Bayu Risanto, Christopher L. Castro, Thang Luong, and Ibrahim Hoteit

Organized mesoscale convective systems (MCSs) over the Arabian Peninsula (AP) are a major driver of extreme precipitation and flash flooding in the cool season (October - April). Existing criteria for MCS tracking methods do not capture this phenomenon over the AP, including several record-breaking MCS-driven extreme precipitation events that caused significant socioeconomic losses in the Kingdom of Saudi Arabia (KSA). In this study, we evaluate the MCS tracking capability and calibrate regional tracking criteria for the AP.

Based on several MCS-driven precipitation events over the past 20 years, AP MCS criteria are updated as follows: size over 20,000 km2, cloud-top temperature less than 230 K, and merging/splitting duration over 3 hours. The AP MCS tracking criteria are also updated specifically for application to convective-permitting Weather Research and Forecasting model (WRF) output. WRF MCS size and durations are similar to observed MCSs, but the core cloud temperature threshold is lowered to 218 K.

The MCS tracking algorithm is then applied to a 20-year MERGIR brightness temperature (Tb) dataset and a corresponding 20-year subseasonal WRF (4-km grid spacing) ensemble reforecast product. The WRF subseasonal ensemble reforecasts are available at 1-week to 4-week lead times. Forecast skill is assessed using categorical statistics such as the Critical Success Index, combined with a neighborhood verification method to reduce double-penalty effects.

The AP MCS tracking results based on WRF subseasonal ensembles exhibit robust tracking capability in both early and late cool season, with respect to seasonal climatology and extreme convective case studies. The convective-permitting reforecast demonstrates subseasonal forecast skill and the potential to enhance early warning capabilities for public safety and disaster risk mitigation.

How to cite: Chang, H.-I., Risanto, C. B., Castro, C. L., Luong, T., and Hoteit, I.: Developing tracking capability for mesoscale convective systems in the Arabian Peninsula through observations and model-based subseasonal reforecasts, EGU General Assembly 2026, Vienna, Austria, 3–8 May 2026, EGU26-14647, https://doi.org/10.5194/egusphere-egu26-14647, 2026.

EGU26-17228 | ECS | Posters on site | AS1.4

Operational benchmarking of AI and NWP models for false monsoon onset prediction in India 

Mayank Gupta, Colin Aitken, Rajat Masiwal, Adam Marchakitus, William Boos, Katherine Kowal, Amir Jina, and Pedram Hassanzadeh

False monsoon onsets involve an early-season wet spell followed by a prolonged dry spell, often resulting in agricultural losses when sowing is initiated during premature rains and farmers are unprepared for the dry conditions. Despite its importance for risk reduction for hundreds of millions of farmers in the tropics, the predictability of these pre-monsoonal wet–to–dry events remains largely unexplored. Here, we benchmark six state-of-the-art artificial intelligence weather prediction (AIWP) models (AIFS, FuXi, FuXi-S2S, GraphCast, GenCast, NeuralGCM) and a numerical weather prediction (NWP) model (IFS) against novel, decision-relevant historical reference forecasts to assess the ability to predict the false monsoon onset at lead times up to 30 days. We find that both AIWP and NWP models exhibit positive predictive skill in the core monsoon zone of India, with ensemble-based probabilistic models retaining positive predictive value relative to these reference forecasts across all lead times. Deterministic skills vary strongly with regions, with good short-lead predictability (0-10 days) and a decrease in skills at longer lead times (11-30 days). We further evaluated the models using well-documented canonical false onset events from the literature and found that skillful forecasts are associated with the ability to reproduce the large-scale circulation evolution characteristic of false onsets, in particular the progression from a transient monsoon-like state to a subsequent circulation collapse that produces a dry spell.

We use agriculturally relevant thresholds to define monsoon onset, wet spells, and dry spells. To enable a meaningful assessment of model skill, the reference forecast is constructed from 124 years of gridded rain-gauge observations and quantifies the baseline probability of false monsoon onsets within a decision-relevant framework. We first calibrate model-specific event-definition wet- and dry-spell thresholds using quantile mapping within a leave-one-year-out cross-validation framework, rather than applying bias correction directly to rainfall fields. Forecast performance is evaluated using deterministic and probabilistic metrics, including probability of detection, false alarm ratio, critical success index, and Brier score. Reliability diagrams show systematic overconfidence at higher forecast probabilities, indicating the need for additional calibration and post-processing. Together, this framework establishes a decision-relevant benchmark and evaluates current AI-based and physics-based forecast systems for the sub-seasonal early warning of false onsets involving dry spells. 

How to cite: Gupta, M., Aitken, C., Masiwal, R., Marchakitus, A., Boos, W., Kowal, K., Jina, A., and Hassanzadeh, P.: Operational benchmarking of AI and NWP models for false monsoon onset prediction in India, EGU General Assembly 2026, Vienna, Austria, 3–8 May 2026, EGU26-17228, https://doi.org/10.5194/egusphere-egu26-17228, 2026.

EGU26-17748 | Orals | AS1.4

Linking storm track activity and subseasonal forecast uncertainty in the North Pacific and North Atlantic 

Hilla Gerstman, Philip Rupp, Rachel W.-Y. Wu, Jonas Spaeth, Frederic Vitart, and Olivia Romppainen-Martius

Midlatitude synoptic storms are a major source of forecast uncertainty, yet the mechanisms linking storm track variability, ensemble spread and extreme event predictability remain insufficiently understood. Differences in storm track intensity between the Pacific and the Atlantic sectors span multiple timescales, from daily to seasonal and decadal, and have been linked to basin characteristics, strength of the subtropical jet, the latitudinal position of the jet stream, and to the changes in the cyclone life-cycles. Yet, the relevance of these dynamical processes for forecast uncertainty remains unclear.

This study investigates how the occurrence and intensity of synoptic storms modulate ensemble forecast spread related to the storm track in the North Pacific and North Atlantic, with the goal of identifying sources of forecast uncertainty for midlatitude weather at subseasonal lead times (2–6 weeks lead time). We use ECMWF reforecasts from the Subseasonal to Seasonal (S2S) Prediction Project database, verified against EAR5 reanalysis,  to investigate ensemble forecast distributions of the upper-troposphere westerly jet and various storm activity metrics based on eddy kinetic energy (EKE). Our analysis involves a systematic assessment of spread-mean relationships for EKE and other dynamical variables for different midlatitude regions and lead times. 

A key result is a robust linear, positive relationship between ensemble mean and spread of EKE in the Atlantic sector, suggesting the contribution of synoptic-scale storms for reliable forecasts. Furthermore, this spread-mean coupling implies that periods of enhanced storm activity, such as wintertime storminess over the North Atlantic, are associated with systematically larger EKE ensemble spread. In contrast, in the Pacific the relationship seems inherently different, indicating a non-trivial role of synoptic storms in forming forecast uncertainty. Large-scale variation of the storm track - such as those associated with teleconnections - are expected to modulate ensemble spread and thereby induce flow-dependent variations in predictability.

The findings highlight the relevance of storm track diagnostics and EKE-based spread metrics as promising tools to improve forecast accuracy and enhance early warning capabilities for high-impact midlatitude storms.

How to cite: Gerstman, H., Rupp, P., Wu, R. W.-Y., Spaeth, J., Vitart, F., and Romppainen-Martius, O.: Linking storm track activity and subseasonal forecast uncertainty in the North Pacific and North Atlantic, EGU General Assembly 2026, Vienna, Austria, 3–8 May 2026, EGU26-17748, https://doi.org/10.5194/egusphere-egu26-17748, 2026.

EGU26-18144 | ECS | Posters on site | AS1.4

Toward a Seamless Sub-Seasonal to Seasonal Prediction System for the Blue Nile Basin 

Rebecca Wiegels, Christian Chwala, Julius Polz, Luca Glawion, Christof Lorenz, Jan N. Weber, Yasir Hageltom, Windmanagda Sawadogo, Tanja C. Schober, Selina Janner, Morteza Zargar, Axel Bronstert, and Harald Kunstmann

The Blue Nile Basin, located in the Greater Horn of Africa, is highly vulnerable to climate variability, where hydrometeorological extremes have severe socio-economic consequences. Reliable prediction on sub-seasonal to seasonal (S2S) timescales is therefore critical for preparedness in sectors such as agriculture, water and dam management. However, S2S prediction in the region remains particularly challenging due to complex orography, the influence of large water bodies, various climate zones, and the interaction of multiple large-scale circulation modes, including ENSO, the Indian Ocean Dipole, and the Madden–Julian Oscillation.

While global forecasting systems provide valuable large-scale climate information, their direct application at regional scale is limited. In heterogeneous regions such as the Blue Nile Basin, global products are often insufficient in spatial resolution and show systematic biases that reduce their usability for regional and sector-specific applications. This requires targeted post-processing to correct errors and regionally enhance the forecasts.

In this study, we evaluate state-of-the-art seasonal and sub-seasonal forecasting products from the ECMWF, focusing on the SEAS5 seasonal forecasting system (lead times up to 215 days) and the ECMWF sub-seasonal range forecasts (lead times up to 46 days). Forecast skill is assessed against ERA5 and ERA5-Land reanalyses, as well as a composite observational dataset combining satellite and station measurements (CHIRPS). To enhance the raw forecasts, we apply an established statistical post-processing technique, namely bias correction and spatial disaggregation (BCSD), alongside advanced deep learning approaches. The latter include Seasonal AFNO-based models and ProS2St, which has previously been developed and tested at global scale within the ECMWF AI Weather Quest Challenge.

Our results demonstrate that post-processing methods significantly improve raw forecast performance over the Blue Nile Basin. Despite these improvements, outperforming climatology remains challenging for meteorological variables alone. However, we show that when the enhanced forecasts are used as input for subsequent impact models, such as hydrological models, they provide added value compared to climatological forcing.

This work highlights the potential of regionally enhanced meteorological forecasts as a foundation for sub-seasonal to seasonal prediction systems. By coupling post-processed meteorological forecasts with hydrological and crop models, we enable S2S forecasts that support improved decision-making in specific sectors. The focused evaluation of S2S forecasting products and post-processing methods for the Blue Nile Basin, together with their integration into downstream impact models, represents a novel contribution toward operational and application-oriented prediction systems in the region.

How to cite: Wiegels, R., Chwala, C., Polz, J., Glawion, L., Lorenz, C., Weber, J. N., Hageltom, Y., Sawadogo, W., Schober, T. C., Janner, S., Zargar, M., Bronstert, A., and Kunstmann, H.: Toward a Seamless Sub-Seasonal to Seasonal Prediction System for the Blue Nile Basin, EGU General Assembly 2026, Vienna, Austria, 3–8 May 2026, EGU26-18144, https://doi.org/10.5194/egusphere-egu26-18144, 2026.

EGU26-21897 | Orals | AS1.4

On the state-dependent predictability horizon in dynamical and AI forecasts 

Judith Berner, Abby Jaye, Jadwiga Richter, Kirsten Mayer, and Meghan Fowler

Forecast skill on subseasonal-to-seasonal timescales varies strongly with the large-scale atmospheric state, creating intermittent “windows of opportunity” for skillful prediction. Here we evaluate state-dependent predictability of 2m temperature in subseasonal hindcasts with CESM and in a perfect modelling framework. Skill is quantified as a function of the Pacific-North American pattern, the phase of the El Nino Southern Oscillation, the Madden-Julian Oscillation, the North Atlantic Oscillation and the soil state. Both models exhibit regionally significantly enhanced subseasonal skill during dynamically organized flow regimes like the PNA, El Niño or La Nina, and certain MJO phases, when tropical forcing projects onto an amplified winter jet and supports coherent Rossby wave propagation. The resulting predictability is modulated by the seasonality of the background flow. Our findings demonstrate that regional S2S forecast skill may be higher than suggested by spatial averages. It is investigated if AI generated forecasts can capture this state-dependent predictability.

How to cite: Berner, J., Jaye, A., Richter, J., Mayer, K., and Fowler, M.: On the state-dependent predictability horizon in dynamical and AI forecasts, EGU General Assembly 2026, Vienna, Austria, 3–8 May 2026, EGU26-21897, https://doi.org/10.5194/egusphere-egu26-21897, 2026.

EGU26-1685 | ECS | Posters on site | AS1.5

Machine Learning-Driven Background Error Covariances for High-Resolution Data Assimilation 

Ravi Shankar Nemani, Ross N Bannister, Amos S Lawless, Hong Wei, and Christopher Thomas
In high-resolution Numerical Weather Prediction (NWP) and data assimilation, producing an efficient analysis relies heavily on background error covariances. Because these errors are highly flow-dependent, capturing them traditionally requires, e.g., generating large ensembles, which is computationally challenging for urban-scale models—particularly regarding vertical error covariances. To address this, we are developing a machine learning surrogate method to approximate flow-dependent covariances in the vertical direction. Preliminary results using fully connected neural networks indicate that the model can successfully learn error structures and reproduce them using the vertical profiles of a single forecast, potentially reducing the reliance on computationally expensive ensembles.

How to cite: Nemani, R. S., Bannister, R. N., Lawless, A. S., Wei, H., and Thomas, C.: Machine Learning-Driven Background Error Covariances for High-Resolution Data Assimilation, EGU General Assembly 2026, Vienna, Austria, 3–8 May 2026, EGU26-1685, https://doi.org/10.5194/egusphere-egu26-1685, 2026.

A multiradar mosaic is a key solution to the insufficient detection range of a single weather radar. In the traditional grid-preprocessed mosaicking method (GPM), radar polar coordinate data are interpolated into Cartesian grids to compensate for vertically undersampled regions in radar volume scans. However, such interpolation fails to accurately reconstruct the polarization parameters in these regions. Therefore, this study presentss a polar coordinate direct-mosaicking method (PDM) for the high-density radar network in South China, which directly operates on polar coordinate data and avoids initial interpolation. Based on typical precipitation cases from May to August 2021, three key issues in the PDM are addressed: First, horizontal reflectivity (ZH) biases and differential reflectivity (ZDR) offsets are corrected; second, the number of radars in the mosaicking process is evaluated, with five radars determined to be optimal; and third, the weights of different radar data are optimized by considering vertical and horizontal distances, along with the melting layer position. Compared with the GPM, the PDM yields a more accurate representation of the melting layer, with a smaller mean height error (192 m compared with 470 m) and a more realistic estimation of thickness (661 m compared with 1507 m). It also improves the continuity of polarimetric parameters within convective core regions. The case studies indicate that the PDM enables earlier identification of ZDR columns and more accurate estimation of their heights. These advancements provide high-quality observational constraints for cloud microphysical research and offer potential for improving convective-scale data assimilation.

How to cite: Li, Z., Wu, C., Liu, L., and Zhang, Y.: Enhancing Convective-scale Polarimetric Signatures through a Polar Coordinate Direct-Mosaicking Method for High-density Radar Networks, EGU General Assembly 2026, Vienna, Austria, 3–8 May 2026, EGU26-2320, https://doi.org/10.5194/egusphere-egu26-2320, 2026.

EGU26-2699 | ECS | Posters on site | AS1.5

Investigating the Application of Generalized Gaspari-Cohn Correlation Function in Vertical Localization 

Christoforus Bayu Risanto, Shay Gilpin, and Avelino Arellano

Assimilation of column-integrated observations such as precipitable water vapor (PWV) remains challenging when vertical moisture profile constraints (e.g., radiosondes) are unavailable. Ensemble data assimilation systems typically employ Gaspari–Cohn (GC) localization (e.g., in DART) to limit the spatial influence of observations and reduce spurious correlations arising from finite ensemble size. However, GC assumes homogeneous and isotropic correlations and does not represent physically driven vertical inhomogeneity, such as transient moisture structures associated with convection or moisture transport. Consequently, vertically displaced but dynamically sensitive layers may be underrepresented during PWV assimilation. The generalized Gaspari–Cohn (GenGC) localization function introduced by Gilpin et al. (2023) relaxes these assumptions by allowing localization parameters to vary spatially, enabling inhomogeneous and anisotropic correlation structures. This flexibility is particularly relevant for PWV assimilation, where the vertical distribution of moisture sensitivity can vary substantially with atmospheric state.

Sensitivity of water vapor mixing ratio (qvapor) to PWV was analyzed for Tucson, Flagstaff, Albuquerque, and Santa Teresa at 12 UTC during July–September 2021. These sensitivities were used to estimate the appropriate vertical influence of PWV assimilation and to construct a vertically varying GenGC localization. The performance of GenGC was evaluated relative to a standard GC localization with a fixed vertical radius of 3.5 km. These four locations in the Southwest US are chosen since they are impacted by the North American monsoon. To date, forecasting the monsoon precipitation is still challenging even with convective-permitting models coupled with data assimilation (Risanto et al. 2026 – in review).

Global Positioning System PWV (GPS-PWV) observations from Tucson and Flagstaff for three summer days in 2021 were assimilated into a convective-permitting (1.8 km) WRF ensemble with 40 members. HRRRv4 provided initial and boundary conditions. PWV was assimilated at 12 UTC using both GC and GenGC vertical localization, and radiosonde observations are used for independent verification.

Initial results indicate that qvapor exhibits strongest sensitivity to PWV from the surface up to approximately 6 km MSL, motivating a GenGC localization that extends vertical influence on this level. PWV analyses produced using GenGC were generally closer to observations than those using GC, reflecting the inclusion of moisture adjustments above 3.5 km MSL. In some cases, GenGC also improved near-surface qvapor relative to GC; however, larger positive qvapor biases were found above ~5 km MSL. Further investigation is required to assess the robustness of these results.

Future work will expand the number of cases and implement GenGC directly within the DART framework to evaluate its broader applicability for assimilating PWV and related datasets.

How to cite: Risanto, C. B., Gilpin, S., and Arellano, A.: Investigating the Application of Generalized Gaspari-Cohn Correlation Function in Vertical Localization, EGU General Assembly 2026, Vienna, Austria, 3–8 May 2026, EGU26-2699, https://doi.org/10.5194/egusphere-egu26-2699, 2026.

EGU26-5447 | Orals | AS1.5

Improving Afternoon Thunderstorm Prediction in Taiwan: Insights from Dense Ground-based GNSS Assimilation 

Shu-Chih Yang, Yi-Pin Chang, Ta-Kang Yeh, Florian Zus, Rohith Thundathil, and Jens Wickert

A convective-scale ensemble data assimilation (EDA) system has been developed in Taiwan to improve very short-term heavy rainfall prediction. The ground-based GNSS Zenith Total Delay (ZTD) data provides fast moisture information, which captures the precursor of convection initialization over complex terrain. Focusing on thunderstorm prediction in the Taipei Basin, previous studies have shown that assimilating ZTD data from the Central Weather Administration (CWA) operated stations provides effective moisture adjustment. Incorporating the surface 10-meter wind further exploits the benefit of ZTD assimilation in very short-term precipitation prediction. Including non-CWA-operated stations, there are more than 400 GNSS stations in Taiwan, forming a uniquely dense GNSS observation network. In addition to ZTD observation, the tropospheric gradient (TG) measurement provides spatial moisture variations in the low troposphere. Based on a severe afternoon thunderstorm on 24 June 2022 in the Taipei Basin, we conducted rapid-update data assimilation experiments to investigate the impact of the ground-based GNSS data. Data assimilation was performed over a three-hour period at 30-minute interval to predict a heavy rainfall event lasting two hours.

Compared to standard ZTD assimilation using CWA-operated stations, the assimilation of dense ZTD observations improves the moisture representation near the Taipei Basin, which is critical for the timing of convection initialization. For this case, TG observation reveals a strong moisture gradient into an inland river valley upstream of the Basin. Additional TG assimilation enhances moisture, facilitating the rapid convection development and the merging of the convection cells. Consequently, assimilating both dense ZTD and TG leads to significant improvements in the forecasted intensity and location of heavy rain, as well as the forecast performance at a longer lead time. Notably, the impact of TG assimilation is more pronounced when combined with dense ZTD data.

How to cite: Yang, S.-C., Chang, Y.-P., Yeh, T.-K., Zus, F., Thundathil, R., and Wickert, J.: Improving Afternoon Thunderstorm Prediction in Taiwan: Insights from Dense Ground-based GNSS Assimilation, EGU General Assembly 2026, Vienna, Austria, 3–8 May 2026, EGU26-5447, https://doi.org/10.5194/egusphere-egu26-5447, 2026.

EGU26-5510 | ECS | Orals | AS1.5

A Proof of Concept for Boundary-Layer Moisture Data Assimilation Using Scanning Microwave Radiometer Observations 

Alexander Pschera, Maria Toporov, Ulrich Löhnert, and Annika Schomburg

Ground-based profilers provide continuous information on atmospheric boundary-layer (ABL) temperature and humidity, but zenith-only observations suffer from large representation errors in heterogeneous environments. This contribution explores the potential of scanning Microwave Radiometer (MWR) brightness temperatures (TBs) to better constrain ABL water vapor and to reduce representation error relevant for convection-permitting data assimilation. It especially aims to eventually evaluate the synergy of scanning MWR humidity observations with the already planned Differential Absorption Lidar (DIAL) network LIDIA by DWD.

As a proof of concept, radiosonde profiles are combined with co-located ground-based HATPRO MWR observations from recent field campaigns in Germany, including FESSTVaL (2021), Socles (2021–2022), and Vital I (2024). For each radiosonde launch, temporally matched MWR measurements are extracted for several viewing geometries. The evaluation by TB forward modeled from radiosondes gives first promising results.

The presentation highlights how low elevation azimuth scan TB information, especially combined with the upcoming LIDIA network can provide additional constraints on horizontal gradients and boundary layer humidity. The next steps are: assimilation experiments with data from the upcoming Vital II campaign (summer 2026), where combined zenith-pointing DIAL and scanning MWR observations will be assimilated into ICON-D2 to quantify their impact on short-range forecasts of humidity and convective initiation on convection-permitting resolution.

How to cite: Pschera, A., Toporov, M., Löhnert, U., and Schomburg, A.: A Proof of Concept for Boundary-Layer Moisture Data Assimilation Using Scanning Microwave Radiometer Observations, EGU General Assembly 2026, Vienna, Austria, 3–8 May 2026, EGU26-5510, https://doi.org/10.5194/egusphere-egu26-5510, 2026.

EGU26-5745 | ECS | Posters on site | AS1.5

Bayesian Calibration of a Large-Eddy Resolving Model towards Campaign Measurements with an Ensemble Kalman Smoother 

Dana Grund, Siddhartha Mishra, and Sebastian Schemm

Bayesian model calibration with data assimilation methods receives continued interest for climate models, where turbulence-resolving large eddy simulations (LES) often serve as the ground truth for cloud processes. This study extends the calibration hierarchy towards the LES themselves, which are in turn validated against measurement data. Ensemble data assimilation for turbulent simulations is approached from a smoother perspective by calibrating a semi-idealistic LES simulation against averaged measurements with an ensemble Kalman smoother (EnKS).

This work re-visits the well-known test case simulating marine stratocumulus clouds (DYCOMS-II), which has been used extensively for forward model validation. Sub-grid scale (SGS) turbulence parameters are calibrated alongside the parameterized initial condition and forcing, aiming at a wholistic uncertainty representation. For the PyCLES model (dx=35 m), the calibrated setup achieves an improvement over the default model configuration used in previous studies. Experiments with different advection schemes reveal how the calibration result varies for implicit and explicit SGS modeling. For some of the tested schemes, consistent model errors on some observations require manual specification of larger data uncertainties in order to stabilize the calibration.

Through the analysis of partial increments, the EnKS methodology provides insights to parametric model sensitivities, and a means to explore a large parameter space. However, the performance is hindered by weak nonlinearities in the parameter-to-data map, which includes a nonlinear normalizing parameter transform. The practical application of EnKS-based calibration for LES models is facilitated by relying directly on a perturbed physics ensemble, which is commonly used for sensitivity studies. The results also invite to re-interpret biases found in previous model intercomparison studies on the DYCOMS-II case, as well as to consider the influence of uncertainties in initial condition and forcing when assessing parametric sensitivities in LES simulations.

How to cite: Grund, D., Mishra, S., and Schemm, S.: Bayesian Calibration of a Large-Eddy Resolving Model towards Campaign Measurements with an Ensemble Kalman Smoother, EGU General Assembly 2026, Vienna, Austria, 3–8 May 2026, EGU26-5745, https://doi.org/10.5194/egusphere-egu26-5745, 2026.

EGU26-5970 | ECS | Orals | AS1.5

High-resolution Numerical Simulations of Tropical and Subtropical Convection for the NASA INCUS Mission 

Itinderjot Singh, Jennie Bukowski, Peter Marinescu, Brenda Dolan, Derek Posselt, Rick Schulte, Leah Grant, Gabrielle Leung, Jonathan Lewis, Sai Prasanth, Kristen Rasmussen, Courtney Schumacher, Rachel Storer, and Susan C. van den Heever

The INvestigation of Convective UpdraftS (INCUS), a NASA Earth Ventures Mission scheduled for launch in early 2027, will use three small satellites to deliver the first estimates of convective mass flux and its evolution within tropical and subtropical clouds. To assist the retrieval algorithm development, the INCUS team is producing a database of updrafts and their environments using high-resolution simulations of convective clouds conducted with the Weather Research and Forecasting Model (WRF) and the Regional Atmospheric Modeling System (RAMS). Specifically, case studies are selected in 15+ regions across the (sub)tropics. Each case study is simulated three times: once with RAMS (2-moment, bin-emulating microphysics) and twice with WRF (Morrison and Thompson aerosol-aware microphysics). Simulations utilize 3 nested grids, with the outermost grids having 1.6 km grid spacing and typically spanning well over 1,000 km in zonal and meridional directions. The innermost grids also have large areas (~230 km by ~230 km), with 100 m horizontal grid spacing, ~100 m vertical grid spacing, and 30 second output. 

Using this output, the Tracking and Object-Based Analysis of Clouds (tobac) algorithm is run offline to quantify the 3D evolution of storm updrafts and link them to their associated anvils and environments. The tracked updrafts and their properties are directly used in INCUS algorithm development. The model output is also run through the Community Radiative Transfer Model (CRTM) and INCUS Passive Active Microwave Simulator (PAMS) to forward model geostationary IR brightness temperatures and INCUS-observed radar reflectivity, respectively. The simulations are systematically evaluated with available observations to ensure that the output is realistic and to identify gaps in the model database in terms of observed convective environments, updraft profiles, storm morphologies, and reflectivity profiles. 

The goals of this talk are to: (1) give an overview of the INCUS LES database and its role in the INCUS mission; (2) provide statistics about the global nature of tropical and subtropical convection obtained using high-resolution models; and (3) showcase results from evaluation of the database against different observational datasets. The multi-model, high-resolution INCUS simulation database continues to grow as more simulations are completed and will be a useful resource for the community for understanding tropical and subtropical convective clouds. 

How to cite: Singh, I., Bukowski, J., Marinescu, P., Dolan, B., Posselt, D., Schulte, R., Grant, L., Leung, G., Lewis, J., Prasanth, S., Rasmussen, K., Schumacher, C., Storer, R., and van den Heever, S. C.: High-resolution Numerical Simulations of Tropical and Subtropical Convection for the NASA INCUS Mission, EGU General Assembly 2026, Vienna, Austria, 3–8 May 2026, EGU26-5970, https://doi.org/10.5194/egusphere-egu26-5970, 2026.

EGU26-7077 | ECS | Orals | AS1.5

Observational impact of ground-based water vapor profiling networks on convection-permitting numerical weather prediction – an ensemble sensitivity analysis case study 

Nina Raabe, Maria Toporov, Philipp Griewank, Martin Weissmann, Takumi Matsunobu, and Ulrich Löhnert

The demand for accurate weather forecasts is increasing because of, for example, high-impact events becoming more frequent and more extreme. However, convection-permitting numerical weather prediction systems still lack precise initial conditions due to observational gaps. In order to improve the predictions, filling those gaps is of great importance.

Ground-based water vapor profiling networks could contribute to that using broadband differential absorption light detection and ranging systems (DIALs). In this work, the impact of different hypothetical configurations of such networks on the convection-permitting Icosahedral Non-hydrostatic (ICON) D2 model operationally used by the German Weather Service is assessed. For that, an ensemble sensitivity analysis (ESA) is employed. Using an ensemble-based sensitivity, the ESA method quantifies the change of variance in a forecast metric ensemble due to the assimilation of additional data. Compared to other observational impact assessment (OIA) methods, it benefits from not requiring forecast validation, actual measurements, or additional model runs.

First results indicate that for the default network configuration and two summer afternoon cases, the additional observations decrease the spread of an ensemble of the model on average by 5.5 to 7 percent (%) depending on the specific water vapor forecast metric used. The forecast metrics respond as expected to changes in the network parameters, that is, the spread decreases further for smaller instrumental errors and larger vertical ranges of the DIALs. Assimilating point measurements leads to a 70% smaller spread reduction relative to the one obtained for water vapor profiles up to a height of 1200 meters.

On the one hand, the results of these case studies confirm the expected benefit of a DIAL network, while also indicating what to focus on for further improvements. On the other hand, they demonstrate the applicability of the flexible and computationally cheap ESA method to this kind of evaluation. With the results being comparable to those obtained by other OIA methods, an assessment of how realistic the ESA results here are could be conducted. That could help to judge whether the method could and should be applied in OIA more broadly.

How to cite: Raabe, N., Toporov, M., Griewank, P., Weissmann, M., Matsunobu, T., and Löhnert, U.: Observational impact of ground-based water vapor profiling networks on convection-permitting numerical weather prediction – an ensemble sensitivity analysis case study, EGU General Assembly 2026, Vienna, Austria, 3–8 May 2026, EGU26-7077, https://doi.org/10.5194/egusphere-egu26-7077, 2026.

EGU26-7371 | ECS | Posters on site | AS1.5

Uncertainty quantification via conformal prediction in data assimilation 

Catherine George, Tijana Janjic, Alireza Javanmardi, and Eyke Hüllermeier

Quantifying the evolution of uncertainty is critical to both probabilistic forecasting and data assimilation (DA) in numerical weather prediction (NWP). In this study, we investigate the applicability of conformal prediction (CP), a recent machine learning (ML) method, to quantify uncertainty in a controlled, idealized setting. We use a toy model, designed to mimic convective process. The CP provides a set of possible outcomes with a chosen confidence level. Here, we compare and evaluate the average empirical coverage, the average interval length and average interval score loss (AISL) for the three variants of CP i.e., a) Standard CP, b) Normalized CP and c) Conformalized Quantile Regression. We also combine DA with the CP estimates of uncertainty and quantify the significance of improvement. Our results highlight the strengths and limitations of each approach, providing insights into the effectiveness of CP to complement ensemble-based uncertainty quantification in simplified atmospheric models.

How to cite: George, C., Janjic, T., Javanmardi, A., and Hüllermeier, E.: Uncertainty quantification via conformal prediction in data assimilation, EGU General Assembly 2026, Vienna, Austria, 3–8 May 2026, EGU26-7371, https://doi.org/10.5194/egusphere-egu26-7371, 2026.

EGU26-9329 | ECS | Orals | AS1.5

From MSG SEVIRI to MTG FCI: Extending All-Sky IR radiance assimilation in the regional high-resolution ensemble prediction system of GeoSphere Austria  

Adhithiyan Neduncheran, Florian Meier, Phillip Scheffknecht, Christoph Wittmann, Martin Weissmann, and Philipp Griewank

The transition from Meteosat Second Generation (MSG) to Meteosat Third Generation (MTG) represents a major step forward in European geostationary satellite observing capability. This work presents preparatory and preliminary results from extending the established all-sky radiance assimilation framework, originally developed for MSG SEVIRI to MTG FCI. The study emphasizes methodological continuity to ensure a seamless evolution of satellite data assimilation practices within convective-scale numerical weather prediction. 

Earlier all-sky assimilation experiments with SEVIRI water vapour channels established a robust framework for handling cloud-affected radiances through dynamically adaptive, cloud-dependent observation error modelling. Here, the same principles are applied to FCI water vapour channels, enabling a consistent assessment of how these observations interact with existing assimilation systems. FCI’s enhanced spatial resolution, improved radiometric accuracy, and expanded spectral sampling promise greater information content, but also introduce increased representativeness and cloud-related uncertainties, reinforcing the value of adaptive error characterisation. 

Preliminary 3D-EnVar experiments within the pre-operational regional high resolution ensemble prediction system of GeoSphere Austria compare the all-sky assimilation approaches for both SEVIRI and FCI radiances. Results show that the cloud-dependent observation error model previously validated with SEVIRI yields a neutral to positive impact on the short-range forecast. This demonstrates a structured pathway toward the operational exploitation of FCI observations, supporting improved short-range forecasts of high-impact weather. Progress on assimilation of visible channels from SEVIRI and FCI are also foreseen.  

How to cite: Neduncheran, A., Meier, F., Scheffknecht, P., Wittmann, C., Weissmann, M., and Griewank, P.: From MSG SEVIRI to MTG FCI: Extending All-Sky IR radiance assimilation in the regional high-resolution ensemble prediction system of GeoSphere Austria , EGU General Assembly 2026, Vienna, Austria, 3–8 May 2026, EGU26-9329, https://doi.org/10.5194/egusphere-egu26-9329, 2026.

EGU26-9782 | ECS | Posters on site | AS1.5

Can AROME-Austria Hybrid-3DEnVar improve the forecast of 2-meter temperature (T2m) in complex Alpine terrain? 

Kaushambi Jyoti, Philipp Griewank, Florian Meier, and Martin Weissmann

An accurate forecast of T2m in complex terrain is essential for a wide range of economic and societal applications. However, improper assimilation of T2m observations can degrade forecast quality. 
The 3DVar scheme relies on a climatological error covariance matrix, which can produce unrealistic analysis increments and consequently inaccurate forecasts, particularly over sloped terrain. For example, an observation from a valley station may still generate increments at the mountaintop, even though the valley observation does not adequately represent the atmospheric conditions at the mountaintop. In contrast, 3DEnVar utilizes flow-dependent error covariances that are representative of the recent atmospheric flow regime. Hybrid-3DEnVar, on the other hand, employs an error covariance with 50\% weight assigned to the climatological covariance matrix and 50\% to the flow-dependent covariance matrix. Hybrid-3DEnVar has been tested in AROME-Austria and improved the initial conditions of AROME-Austria compared to 3DVar.  
Our study compares the T2m forecast of  Hybrid-3DEnVar against the operational 3DVar scheme of AROME-Austria in complex terrain.
For this purpose, we utilize the convective-scale limited-area ensemble forecast system (C-LAEF) Alpe Adria based on the numerical weather prediction model AROME, which operates at a horizontal grid space of 1 km. The 32-member ensemble of C-LAEF Alpe Adria (with a 1 km horizontal resolution) provides the flow-dependent error covariances. 
We conduct three sets of data denial experiments in which we run a 3-hourly assimilation cycle over 10 days, once with all observations and once with the T2m measurements removed. The first set of experiments uses 3DVar, the second 3DEnVar, and the third Hybrid-3DEnVar. We present first-guess departure statistics and forecast verification for T2m over the Alpine terrain.

How to cite: Jyoti, K., Griewank, P., Meier, F., and Weissmann, M.: Can AROME-Austria Hybrid-3DEnVar improve the forecast of 2-meter temperature (T2m) in complex Alpine terrain?, EGU General Assembly 2026, Vienna, Austria, 3–8 May 2026, EGU26-9782, https://doi.org/10.5194/egusphere-egu26-9782, 2026.

EGU26-10136 | ECS | Orals | AS1.5

Prediction of Convective Boundary Layer in the Gray Zone Using Fourier Neural Operator 

Tengfei Luo, Xiaoming Shi, Zhijie Li, Jianchun Wang, Pak Wai Chan, and Naigeng Wu

In recent years, with the development of computing power, kilometer-scale resolution has become possible in regional numerical weather prediction (NWP) and climate simulation. While the refined numerical mesh allows for a more detailed representation of weather and climate, it also moves atmospheric modeling into gray zones, where the parameterization of turbulence and convection becomes a challenge in NWP. The newly developed machine learning (ML) methods would be a better choice to address this challenge. Previous ML weather prediction models primarily focus on global mesoscale forecasting. This study develops a purely data-driven three-dimensional Fourier neural operator (FNO) model for simulating the idealized convective boundary layer (CBL) at 800-m grid spacing, which is a resolution in the gray zone. The filtered large-eddy simulation (LES) data of the CBL are used for training the FNO models. The FNO models can accurately predict the instantaneous spatial structures and flow statistics of the boundary layer. The structures of vertical velocity near the surface predicted by the FNO models are consistent with those of the filtered LES, overcoming the issue of overly large cell structures predicted by traditional numerical simulations. The FNO models perform better than the gray-zone CM1 simulations in predicting profiles of flow statistics. Furthermore, the temperature and velocity spectra predicted by the FNO models are close to the results of filtered LES. The FNO models, trained using data for a few surface heat flux values Qs from 0.14 to 0.26 K m s-1, demonstrate certain generalization capabilities for other Qs within and out of this range. Overall, the FNO model is a promising ML method for fast and accurate weather prediction in the gray zone.

How to cite: Luo, T., Shi, X., Li, Z., Wang, J., Chan, P. W., and Wu, N.: Prediction of Convective Boundary Layer in the Gray Zone Using Fourier Neural Operator, EGU General Assembly 2026, Vienna, Austria, 3–8 May 2026, EGU26-10136, https://doi.org/10.5194/egusphere-egu26-10136, 2026.

EGU26-10222 | Posters on site | AS1.5

Direct assimilation of differential reflectivity in an idealised setup  

Tatsiana Bardachova, Tijana Janjic, Alberto Carrassi, Alberto de Lozar, and Jana Mendrok

Radar data assimilation (DA) is critical for convective-scale forecasting, as it provides real-time, high-resolution information on precipitation, wind, and convective system dynamics that is not captured by surface observations or satellite data. Polarimetric radar observations complement conventional reflectivity (Zh) and radial velocity (Vr) measurements by enabling the determination of hydrometeor types and particle size characteristics. Differential reflectivity (ZDR) is one of the key polarimetric radar variables, defined as the ratio between horizontal and vertical reflectivity, that provides direct information on hydrometeor shape and size. Despite its strong potential to better constrain storm microphysics and improve convective-scale forecasts, the assimilation of ZDR remains challenging. Challenges associated with observation operators, error characterisation, and data quality underscore the need for further research in this area.

The current study investigates the direct assimilation of ZDR in an observing system simulation experiment (OSSE) of a long-lived supercell. The OSSE is conducted using the ICOsahedral Nonhydrostatic (ICON) model with a two-moment microphysics scheme and the Local Ensemble Transform Kalman Filter (LETKF), employing both hydrometeor mixing ratios and number concentrations as analysis variables. Synthetic observations are generated using the polarimetric radar forward operator EMVORADO developed at the Deutscher Wetterdienst. The synthetic ZDR observations are assimilated in addition to the non-polarimetric variables, namely Zh and Vr, while a reference experiment assimilating only non-polarimetric synthetic observations was conducted for comparison. A series of sensitivity experiments are performed to assess the impact of DA settings on assimilation performance, for varying observation error, localisation radius, and ensemble size. In addition, appropriate thresholds and no-reflectivity (clear air) equivalents for ZDR observations are examined.

How to cite: Bardachova, T., Janjic, T., Carrassi, A., de Lozar, A., and Mendrok, J.: Direct assimilation of differential reflectivity in an idealised setup , EGU General Assembly 2026, Vienna, Austria, 3–8 May 2026, EGU26-10222, https://doi.org/10.5194/egusphere-egu26-10222, 2026.

EGU26-11124 | Orals | AS1.5

First Steps Towards Data Assimilation of Differential Absorption Lidar and Cloud Radar Data 

Jens Pruschke, Annika Schomburg, Jana Mendrok, Klaus Stephan, Ulrich Görsdorf, Moritz Löffler, Christine Knist, and Christoph Schraff

To improve the forecast quality of numerical weather prediction (NWP), the German Meteorological Service (Deutscher Wetterdienst, DWD) has initiated a project aimed at assessing data quality and assimilation of observations from ground-based remote sensing instruments that have not yet been exploited operationally.

The objective of this initiative is to fill the observational gap in the atmospheric boundary layer, especially with respect to short time scales, by providing continuous, high-temporal-resolution profiles of thermodynamic variables, wind, and cloud properties. These observations are expected to be especially beneficial for weather forecasting applications. The DWD is evaluating various remote sensing systems with regard to the continuous data supply, their operational use, and their impact on NWP.  

In this contribution, we present first results of the assimilation of two ground-based remote sensing instruments into the kilometer-scale ensemble data assimilation system (KENDA): water vapour mixing ratio from a Differential Absorption Lidar (DIAL) and radar reflectivity from a cloud radar. For the integration of the DIAL observations into the data assimilation code environment, only small adjustments were necessary. In contrast, the cloud radar data required an adaptation of the complex forward operator EMVORADO (Efficient Modular Volume scan Radar Operator), which was originally developed and previously used only for precipitation radars.

In an initial step, single observation data assimilation experiments and their observation minus first guess statistics have been shown to produce promising results. To assess the impact in an operational setting, dedicated data assimilation experiments were conducted and compared to reference experiments without these additional observations. Based on the successful data assimilation cycling experiments, first forecast experiments including the DIAL have been performed. Current results indicate a neutral to positive impact on humidity, temperature, and wind forecasts. The impact of cloud radar data in such experiments is currently under investigation by testing different settings.

Our findings suggest that ground-based remote sensing data can provide valuable additional information for convective-scale data assimilation, and justify more extensive impact studies in the context of NWP.

How to cite: Pruschke, J., Schomburg, A., Mendrok, J., Stephan, K., Görsdorf, U., Löffler, M., Knist, C., and Schraff, C.: First Steps Towards Data Assimilation of Differential Absorption Lidar and Cloud Radar Data, EGU General Assembly 2026, Vienna, Austria, 3–8 May 2026, EGU26-11124, https://doi.org/10.5194/egusphere-egu26-11124, 2026.

The NASA TROPICS (Time-Resolved Observations of Precipitation structure and storm Intensity with a Constellation of Smallsats) Earth Venture (EVI-3) mission, was successfully launched into orbit on May 8 and May 25, 2023 (two CubeSats in each of the two launches into 550-km orbits with approximately 33-degree inclination). Over the course of the mission, TROPICS provided more spaceborne microwave soundings than any operational program, and the combined forecast impact was larger and more spatially coherent than that of any individual passive microwave platform, illustrating the benefit of constellation-based temporal sampling for constraining rapidly evolving tropical convection. Prior to the deorbit of the last TROPICS spacecraft in December 2025, observations of 3-D temperature and humidity, as well as cloud ice and precipitation horizontal structure, at high temporal resolution were used to conduct high-value science investigations of tropical cyclones. TROPICS has provided rapid-refresh microwave measurements (median refresh rate of better than 60 minutes early in the mission with four functional CubeSats) in twelve channels spanning 92 to 205 GHz over the tropics that can be used to observe the thermodynamics of the troposphere and precipitation structure for storm systems at the mesoscale and synoptic scale over the entire storm lifecycle. Thousands of high-resolution images of tropical cyclones have been captured by the TROPICS mission, revealing detailed structure of the eyewall and surrounding rain bands. The new 205-GHz channel in particular (together with a traditional channel near 92 GHz) has provided new information on the inner storm structure, and, coupled with the relatively frequent revisit and low downlink latency, has informed tropical cyclone analysis at operational centers. The suite of TROPICS products is publicly available with much improved median revisit rates and were provided with data latencies that are sufficient to enable their use in operational tropical cyclone forecasting applications. In this presentation, we highlight the use of these high-revisit thermodynamic data from TROPICS to better characterize storm structure and environmental conditions over a variety of cases over the 30-month mission lifetime.

How to cite: Blackwell, W. and the TROPICS Science Team: A Summary of the New Capabilities for Observing Tropical Cyclone Thermodynamic Structure Provided by the NASA TROPICS Mission, EGU General Assembly 2026, Vienna, Austria, 3–8 May 2026, EGU26-12774, https://doi.org/10.5194/egusphere-egu26-12774, 2026.

EGU26-13080 | Posters on site | AS1.5

Optimizing localization for ensemble data assimilation using partial analysis increments 

Philipp Griewank, Theresa Diefenback, Tobais Necker, Martin Parker, Annika Schomburg, and Martin Weissmann

Partial analysis increments (PAI) are an efficient diagnostic to determine the influence individual observations or groups of observations on the analysis (Diefenbach et al.). Addittionally, the diagnostic can be used to approximate the influence that observations would have had for different assimilation settings. We use PAI to investigate whether observations could be more beneficial if they were assimilated using different localization settings. Localization is an essential component of any ensemble-based data-assimilation system, necessary to mitigate the effects of a limited ensemble size and to reduce the computational cost. Localization for satellite observations, which lack a constant or well-defined observation location, is particularly challenging, and numerous approaches have been proposed. Using PAI, we can estimate the performance of many different localization approaches without needing to rerun experiments and determine settings that lead to an optimal analsis using independent observations for verification. In this poster, we present results from a one-month-long cycled forecast of the regional modelling system of Deutscher Wetterdienst, in which the PAIs are compared against non-assimilated radiosondes. PAI is used to optimise and understand localisation by (1) considering a range of localisation functions over a normalised metric; (2) studying different combinations of parameters for a Gaspari-Cohn localization function and (3) optimising localization over a set of idealised functions. The current settings of DWD for vertical localisation of satellite radiances in the visible 0.6µm and infrared 6.2µm 7.3µm channels - which were originally designed to improve estimates of cloud-related variables - perform well against our metrics but could be improved upon by using a multi-peaked localisation function.

How to cite: Griewank, P., Diefenback, T., Necker, T., Parker, M., Schomburg, A., and Weissmann, M.: Optimizing localization for ensemble data assimilation using partial analysis increments, EGU General Assembly 2026, Vienna, Austria, 3–8 May 2026, EGU26-13080, https://doi.org/10.5194/egusphere-egu26-13080, 2026.

EGU26-14526 | Orals | AS1.5

 TIME-SLICE: Developing observation techniques for estimating convective mass flux through rapid, adaptive sampling  

Brenda Dolan, Sean Freeman, Pavlos Kollias, Kristen Rasmussen, Patrick Gatlin, Edward Luke, Venkatachalam Chandrasekar, Corey Amiot, Ethan Ebbert, Kevin Knupp, Chris Kwinta, Preston Pangle, Walter Petersen, Courtney Schumacher, Simone Tanelli, Bernat Treserras, Susan van den Heever, Christopher Williams, and David Wolff

While understanding convective processes is critical for prediction of severe weather and cloud properties, observing convective mass flux at convective-scales is difficult using traditional techniques. The NASA INvestigation of Convective UpdraftS (INCUS) mission will quantify convective mass flux from a convoy of three Ka-band radars using a unique time-differencing approach. In order to develop the necessary observational approaches to calibrate and validate the INCUS products, preliminary testing was performed using data collected under the umbrella of the Testing of INCUS Measurements Experiment - Suborbital preLaunch Investigation of Convective Evolution (TIME-SLICE) campaigns. The focus of TIME-SLICE is to leverage existing and low-cost instruments to experiment with rapid sampling of ground assets to derive vertical motions and reflectivity time differences.


TIME-SLICE Colorado (TIME-SLICE-CO) was conducted in the northern Front Range of Colorado during the summer of 2024. During the two months of intensive operations, the Colorado State University CHIVO C-band radar scanned convection using the Multisensor Agile Adaptive Sampling (MAAS) framework, which uses ancillary information to select and follow targets of interest and then scan with RHIs with 30 s frequency. Additionally, a site with multiple frequencies of vertically pointing radars and ground instruments collected continuous data. Lessons learned from this preliminary testing highlighted the need for both priority sampling over the ground site by MAAS as well as larger coverage of convection by multiple scanning radars to broaden the coverage of vertical velocity retrievals and account for horizontal advection.


Building on the lessons from TIME-SLICE-CO, a follow-on campaign was held in North Alabama during summer 2025. TIME-SLICE Alabama (TIME-SLICE-AL) extends the objectives of TIME-SLICE to the variety of convection in the Alabama region while employing novel phased-array radar (PAR) sampling in concert with a high concentration of pre-existing instruments. In TIME-SLICE-AL, two X-band PARs, the Stony Brook University (SBU) SKYLER-2 radar and the SBU ROARS radar, were positioned alongside The University of Alabama in Huntsville (UAH) C-band ARMOR radar, operating in a rapid (30-second) RHI mode, all coordinated within the MAAS to autonomously sample a large number of convective clouds. Additionally, novel 3D observations of updrafts were collected by tilting the SKYLER PAR vertically. These innovative new sampling techniques and combined observations allow for rapid quantification of radar reflectivity time differences coincident with Doppler-derived vertical motion estimates, and the development of a large, rich case database. Further, existing assets deployed at the UAH Severe Weather Institute and Radar & Lightning Laboratories site, including  a disdrometer and the new Ka Profiling Radar (KaPR), and at the nearby US Department of Energy ARM Mobile Facility 3 in the Bankhead National Forest, provide additional context to the primary radar observations. In this presentation, we will provide an overview of the TIME-SLICE-CO and -AL campaigns, present several of the cases captured, highlight some of the early novel science results, and apply the knowledge gained to the validation efforts for the INCUS mission.

How to cite: Dolan, B., Freeman, S., Kollias, P., Rasmussen, K., Gatlin, P., Luke, E., Chandrasekar, V., Amiot, C., Ebbert, E., Knupp, K., Kwinta, C., Pangle, P., Petersen, W., Schumacher, C., Tanelli, S., Treserras, B., van den Heever, S., Williams, C., and Wolff, D.:  TIME-SLICE: Developing observation techniques for estimating convective mass flux through rapid, adaptive sampling , EGU General Assembly 2026, Vienna, Austria, 3–8 May 2026, EGU26-14526, https://doi.org/10.5194/egusphere-egu26-14526, 2026.

EGU26-15811 * | ECS | Orals | AS1.5 | Highlight

Using machine learning to unearth the aspects of deep convection that are robustly predictable from the local environmental state 

Sai Prasanth, Ziad Haddad, Jouni Susiluoto, Peter Marinescu, Jennie Bukowski, Itinderjot Singh, Leah Grant, and Sue van den Heever

NASA's upcoming INCUS mission will observe tropical deep convection at unprecedented spatiotemporal resolution (∼3 km horizontal sampling at intervals of 30 s, 90 s, and 120 s). INCUS will observe a wide variety of deep convective environments and tropical storms at different stages of their life cycle, producing many distinct convective outcomes. How do we distinguish these outcomes? Which differences are associated with genuinely different local environmental states, and which aspects vary even when the local environment is effectively the same?

We use Kernel Flows, a nonlinear machine learning estimator, to separate aspects of local deep convection that are constrained by their environmental state from those that are not. We first define the environmental state as a vector X formed from variables always present in the troposphere describing background thermodynamic and kinematic conditions, independent of whether convection is active (temperature, pressure, water vapor, horizontal wind fields). We define convective variables as vertical velocity, condensed water mass, and convective mass flux, which arise only where convection is present and correspond to quantities INCUS algorithms are designed to retrieve.

The analysis uses a database of high-resolution simulations (100 m horizontal grid spacing) across tropical and subtropical regions in anticipation of INCUS. From these simulations, we extract 25 km × 25 km neighborhoods containing a mixture of deep moist convective updrafts and surrounding non-updrafts. Within each neighborhood, we coarsen the environmental and convective variables to approximately 3 km resolution to match anticipated INCUS radar resolution. We represent the environmental state using principal components and define 19 scalar descriptors (Yi) to characterize various aspects of convection.

Using Kernel Flows with no assumptions on Gaussian conditional distributions, we learn the functional relationship between each convective descriptor (Yi) and environmental state (X) independently. We quantify how much variability in each descriptor is associated with environmental state differences by comparing the estimator's error variance to the prior variance of Yi.

We find that aggregate convective descriptors exhibit variability almost entirely associated with environmental state differences. Total vertical velocity and total convective mass flux over the neighborhood, along with neighborhood-mean column maxima of these quantities, achieve R² ≥ 0.97 with at least 84% of standard deviation explained by the environmental state. These convective descriptors act as invariants of the local environment: differences in these metrics reflect environmental state (X) differences, rather than natural variability within an equivalent environmental state. Conversely, convective descriptors emphasizing horizontal and vertical organization of updrafts, such as how total updraft area is divided among horizontally contiguous clusters and maximum heights of vertical velocity and convective mass flux, have R² values typically below 0.5–0.55 and retain substantial variability even when X does not vary significantly. For these descriptors, only a modest fraction of variance is associated with environmental state differences, indicating that most observed differences reflect variability not captured by the local environmental state, potentially from smaller-scale dynamics or stochastic processes.

Our findings identify which aspects of deep convection are almost entirely tied to their local environmental state at spatiotemporal scales commensurate with INCUS observations.

How to cite: Prasanth, S., Haddad, Z., Susiluoto, J., Marinescu, P., Bukowski, J., Singh, I., Grant, L., and van den Heever, S.: Using machine learning to unearth the aspects of deep convection that are robustly predictable from the local environmental state, EGU General Assembly 2026, Vienna, Austria, 3–8 May 2026, EGU26-15811, https://doi.org/10.5194/egusphere-egu26-15811, 2026.

EGU26-16922 | Posters on site | AS1.5

Inversion of Atmospheric Coherence Length Using Optical Flow-based Convolutional Neural Networks 

Yingjian Wang, Peihe Wang, Yinbo Huang, and Haiping Mei

The atmospheric coherence length is a key parameter for quantitatively describing the strength of optical turbulence and is crucial for laser propagation, astronomical observation, and turbulence-degraded image restoration. Although existing studies have widely used convolutional neural networks (CNNs) to retrieve this parameter from single-frame distorted images, they fail to fully utilize the dynamic characteristics of turbulence. To address this, this study proposes a CNN-based inversion model incorporating dynamic optical flow features. By integrating the optical flow method with CNNs, the model captures and utilizes the turbulent motion information between consecutive image frames. The input to the model is the optical flow displacement field calculated from two successive image frames, and the angle-of-arrival fluctuation variance derived from the optical flow is incorporated into the loss function as a physical constraint. This design significantly enhances sensitivity to subtle image distortions induced by weak turbulence, effectively overcoming the performance bottleneck of traditional static single-frame input models under weak turbulence conditions.

The model was trained on a simulated dataset and validated using measured data obtained on June 13-14, 2022, at Science Island in Hefei, Anhui Province, China. The measured data were collected synchronously by an atmospheric coherence length monitor and an imaging device over a 500-meter horizontal near-ground propagation path. The study systematically compared the performance of four classic CNN architectures (AlexNet, VGGNet, EfficientNet, CVTStegoNet) with and without the incorporation of TV-L1 optical flow features. The results show that the introduction of optical flow features universally and significantly improves the inversion accuracy and robustness of the models under different turbulence strengths. Specifically, the method achieved faster training convergence and superior generalization performance across all tested models. On a test set comprising 4,500 training samples and 500 independent validation samples, the model with integrated optical flow features reduced the root mean square error (RMSE) and mean relative error (MRE) by an average of approximately 40%, while the coefficient of determination (R²) was generally above 0.99. Among the four models, the fused model based on AlexNet achieved the best overall performance.

This work demonstrates the critical role of utilizing turbulent dynamic features in enhancing the accuracy of inversion models, offering a novel and practical deep learning solution for high-precision, real-time detection of the atmospheric coherence length.

How to cite: Wang, Y., Wang, P., Huang, Y., and Mei, H.: Inversion of Atmospheric Coherence Length Using Optical Flow-based Convolutional Neural Networks, EGU General Assembly 2026, Vienna, Austria, 3–8 May 2026, EGU26-16922, https://doi.org/10.5194/egusphere-egu26-16922, 2026.

The indirect radar reflectivity assimilation method, which assimilates retrieved hydrometeors from radar reflectivity data, is simple and efficient in severe weather forecasting applications. However, it suffers from retrieval errors due to the uncertainties in discerning multiple hydrometeor types based solely on reflectivity observations. To mitigate these inaccuracies, dual‐polarization radar data are incorporated into the background‐dependent indirect reflectivity assimilation method in this study. First, the contribution of multiple hydrometeor species to the whole reflectivity is estimated using the observed reflectivity and background microphysical information; then, the hydrometeor classification algorithm (HCA) product from dual‐ polarization radar observations is introduced to correct the dominant hydrometeor type if in error; and finally, the contribution factors are adjusted and used to retrieve multiple hydrometeor species from reflectivity data. Through a single squall line case, it is demonstrated that the incorporation of the HCA product from dual‐ polarization radar data leads to more reasonable hydrometeor identification, with more supercooled rainwater above the melting layer and more graupel at low levels, thereby refining the hydrometeor analysis. With the 15‐ min rapid update cycling configuration, the changes in the analysis field enable more cold rain processes, resulting in more intense latent heat release at higher levels and stronger cooling near the surface in the forecast. This in turn strengthens updraft motion and cold pools in the convective regions, thereby improving the reflectivity and precipitation forecasts. Four cases' quantitative evaluations of the 0–3‐hr reflectivity and precipitation forecasts further validate the effectiveness of incorporating dual‐polarization radar data in the assimilation process.

How to cite: Chen, H. and Zhao, K.: Assimilation of Dual-Polarization Radar Data Based on Hydrometeor Classification for Improving the Short-Term Prediction of Convective Storms, EGU General Assembly 2026, Vienna, Austria, 3–8 May 2026, EGU26-17383, https://doi.org/10.5194/egusphere-egu26-17383, 2026.

EGU26-1893 | ECS | Posters on site | AS1.6

Convective Environments over the Arabian Peninsula in Current and Future Climate 

Ahmed Homoudi, Henning W. Rust, Klemens Barfus, Christian Bernhofer, and Matthias Mauder

Convective precipitation is the primary source of freshwater and groundwater recharge in the Arabian Peninsula (AP), occurring as sporadic, localised events. Understanding the Lagrangian properties of these convective systems and how they are influenced by land surface characteristics, topography, and climate change requires convection-permitting modelling, which can be computationally inefficient in such an arid region. However, we trained three machine learning (ML) models -Random Forest (RF), Extreme Gradient Boosting (XGB), and Deep Learning (DL)- to establish relationships between convective environments and precipitation. These models can be applied to any numerical model output (e.g., CMIP6) to infer the probability of convective precipitation, thereby identifying when convection-permitting simulations should be performed. Constrained by CMIP6 temporal (6h) and spatial (~1°) resolutions, we aggregated IMERG V07 precipitation to 6h and averaged over 1 °. We derived 102 features from ERA5 describing moisture, lift, instability, and location to characterise the atmospheric profile. A profile is labelled convective if the accumulated precipitation exceeds the local climatological median, thereby reducing the problem to a binary classification task. The ML classifiers show high skill in identifying convective environments over the northern AP during cold months (Oct-Apr), with a Heidke Skill Score (HSS) of approximately 0.65. However, over the southern AP during warm months (May-Sep), the HSS values drop to around 0.35. These results support the established finding that convective systems over the AP in cold months are linked to large-scale atmospheric patterns. In contrast, in warm months they are localised and/or orographically influenced. Findings also demonstrate that the ML models learned convective environment patterns across the AP. Furthermore, the dirnual performance of ML models remains comparable (HSS: ~ 0.55), except at 12 UTC (HSS: ~ 0.48), when the convection is relatively localised. The SHapley Additive exPlanations (SHAP) method enables the interpretation of each feature’s contribution to the ML models’ prediction. The top three features identified by SHAP differ across ML models. Equivalent potential temperature at 850 hPa, humidity index, and lightning potential index are most important for RF. XGB emphasizes precipitable water vapour, relative humidity at 1000 hPa, and most unstable CAPE. In DL, precipitable water vapour, relative humidity at 700 hPa, and 2m dew-point temperature are the key contributors. The current warming over the AP is +1.22 °C relative to pre-industrial levels. We aim to analyse periods with comparable warming across 10 CMIP6 historical simulations to evaluate the models' ability to reproduce the spatiotemporal distribution and characteristics of convective environments. To assess the effect of climate change, we will analyse two future periods with changes of +2.22 and +3.22 °C from the SSP5-8.5 scenario. SHAP can help evaluate whether the model‑inferred importance ranking of mechanisms controlling convective precipitation changes between present and future simulations. In-depth analysis is undergoing.

How to cite: Homoudi, A., Rust, H. W., Barfus, K., Bernhofer, C., and Mauder, M.: Convective Environments over the Arabian Peninsula in Current and Future Climate, EGU General Assembly 2026, Vienna, Austria, 3–8 May 2026, EGU26-1893, https://doi.org/10.5194/egusphere-egu26-1893, 2026.

This study investigates the morphological structure, propagation, and evolution of Mesoscale Convective Systems (MCSs) associated with four historical extreme rainstorm events in Ningxia (August 21, 2016; July 22, 2018; August 9, 2022; and August 24, 2024). The analysis utilizes high-resolution observational data, including the China Severe Weather Automatic Nowcasting(SWAN) radar mosaic, three local C-band radars, and 1020 regional automatic weather stations. The results classify these extreme precipitation MCSs into two distinct categories: (1) Topography-dominated Back-Building/Quasi-Stationary (BB/QS) systems characterized by a single rainstorm center (e.g., the "8·21" and "7·22" events); and (2) Composite Multi-MCS types (Training Line/Adjoining Stratiform, TL/AS and Embedded Lines, EL) characterized by dual rainstorm centers (e.g., the "8·9" and "8·24" events). The BB/QS MCS concentrates heavy rainfall along the eastern foothills of the Helan Mountains. Driven by orographic lifting and cold pool dynamics, new convective cells initiate on the southern flank and propagate northward (back-building), resulting in a quasi-stationary system. These systems exhibit deep convection with 40 dBZ echoes reaching 12 km and the 60 dBZ centroid located around 9 km (above the 0°C level). This "high-centroid, strong ice-phase" structure yields high precipitation efficiency, producing accumulated rainfall exceeding 240 mm. In contrast, the TL/AS MCS affects the eastern banks of the Yellow River. Here, convective cell motion is highly parallel to the orientation of the convective line, leading to a significant "training effect" where cells continuously regenerate upstream and propagate downstream. This mode features a lower convective centroid, with the 60 dBZ center located approximately at 4 km (below the 0°C level), indicating a typical "low-centroid, warm-rain" process that results in accumulations exceeding 200 mm. Furthermore, the EL MCS in the arid northwest region is notably modulated by the dry low-level environment, causing a marked contraction of the stratiform cloud region. Strong echoes (>40 dBZ) are generally confined below 6 km. Due to weaker updrafts, the EL phase itself produces limited rainfall (about 20 mm); its primary disaster risk stems from Nonlinear (NL) convective systems triggered during the system's evolution. Based on these findings, a conceptual evolution model for extreme rainstorm MCSs in Ningxia is established, providing a theoretical basis for monitoring and early warning of extreme precipitation in the arid regions of Northwest China.

How to cite: Li, A. and Chen, Y.: Evolution Laws and Conceptual Models of MCS for Different Types of Extreme Rainstorms in the Arid Region of Northwest China, EGU General Assembly 2026, Vienna, Austria, 3–8 May 2026, EGU26-2165, https://doi.org/10.5194/egusphere-egu26-2165, 2026.

EGU26-3016 | ECS | Posters on site | AS1.6

Response of convectively coupled Kelvin waves under warming scenarios in a global storm-resolving model 

Xianpu Ji, Hans Mikhail Segura Cajachagua, Sebastián Ortega Arango, and Tao Feng

This study investigates the response of convectively coupled Kelvin waves (CCKWs) under two warming scenarios using the ICOsahedral Non‐hydrostatic model (ICON) in its global storm-resolving configuration.  A control simulation (CTRL) is conducted using prescribed historical (1979–1997) sea surface temperatures (SSTs). Taking CTRL as reference, a simulation with a homogenously SST increase of 4 K (+4K) and another with a 4-fold increase in atmospheric CO2 concentration (4×CO2) are conducted.  Results show that CCKWs are substantially strengthened in the +4K experiment, exhibiting enhanced spectral power, faster phase speeds, and more active spatial activity, whereas nearly no change is found in the 4×CO2 experiment. Under uniform SST warming, enhanced surface energy input-dominated by increased latent heat flux-supports stronger and deeper tropical convection, increasing the strength and coherence of convection-circulation coupling. We hypothesize that this enhanced coherence may shorten the adjustment timescale between convective heating and wave-related circulation, resulting in faster eastward propagation and enhanced wave variability. These results highlight the critical role of surface-driven flux enhancement in modulating convectively coupled tropical wave activity under warming.

How to cite: Ji, X., Segura Cajachagua, H. M., Ortega Arango, S., and Feng, T.: Response of convectively coupled Kelvin waves under warming scenarios in a global storm-resolving model, EGU General Assembly 2026, Vienna, Austria, 3–8 May 2026, EGU26-3016, https://doi.org/10.5194/egusphere-egu26-3016, 2026.

EGU26-5727 | ECS | Orals | AS1.6

Observations of vertical motion inside precipitating trade cumuli 

Florian Poydenot, Nina Robbins-Blanch, Zeen Zhu, and Raphaela Vogel

Rain processes are often underrepresented in our understanding of the trade-wind layer, despite trade cumuli precipitating ~30% of the time. The vertical structure of the main building blocks of precipitating convection, namely in-cloud updrafts and downdrafts, is poorly characterized due to a lack of suitable observations. Lidars cannot penetrate deeply into clouds, and hydrometeor fall speeds dominate the mean Doppler velocity from cloud-profiling radars. Here, we retrieve the vertical air motion inside precipitating clouds by making use of the Doppler velocity spectrum from the ground-based Ka-band radars at the Barbados Cloud Observatory (BCO), using methods previously developed for stratocumuli. The resulting dataset spans more than five years (2019-2025) at high (2s) resolution and is validated against available lidar measurements. We resolve circulations at the cloud scale. Shallow precipitating cumuli feature a narrow updraft at the cloud front that develops up to cloud top. The wider precipitation downdraft is triggered slightly below cloud top, where the rain content is large enough, and extends down to the surface. We show that deeper clouds are associated with stronger updrafts and downdrafts. Faster downdrafts are also associated with higher cloud reflectivity, suggesting that microphysical processes play a large role in determining their strength. The long record also lets us ascertain seasonal variability. Shallow precipitating cumuli feature faster updrafts in the summer trades, leading to larger and faster downdrafts than in winter. We show that the total mass flux of shallow precipitating cumuli is highly variable. Both the updraft and the downdraft mass fluxes mainly depend on the cloud fraction, but their balance hinges on the downdraft intensity. These observations can improve our understanding of tropical convection and shed light on the assumptions behind convective parametrizations and constrain cloud-resolving simulations.

How to cite: Poydenot, F., Robbins-Blanch, N., Zhu, Z., and Vogel, R.: Observations of vertical motion inside precipitating trade cumuli, EGU General Assembly 2026, Vienna, Austria, 3–8 May 2026, EGU26-5727, https://doi.org/10.5194/egusphere-egu26-5727, 2026.

EGU26-5758 | ECS | Posters on site | AS1.6

Organization of deep convection into squall lines 

Malek Segueni, Camille Risi, and Nicolas Rochetin

The organization of deep convection into squall lines is not represented in global climate models, despite being among the biggest storms on Earth and having a huge impact on precipitation and extremes in tropical regions such as the Sahel or the Amazon [1, 2]. The overarching goal of this project is to parameterize the occurrence of squall lines in the general circulation model LMDZ, and their impact on their environment. Since the interaction between wind shear and cold pools is essential in squall line formation and maintenance [3], we plan to take advantage of the cold pool scheme [4] already implemented in LMDZ.

Regarding the occurrence of squall lines, we hypothesize that it can be predicted based on the domain-mean wind profile and the cold pool properties, diagnosed from the cold pool scheme.

Regarding the impact of squall line in their environment, we hypothesize that squall lines impact the vertical profile of diabatic heating [5], either through entrainment in convective updrafts [6] or through the rate of rain evaporation [7]. We also hypothesize that the larger rate of rain evaporation strengthens cold pools favoring more likely and more intense convection [8]. Entrainment and rate of rain evaporation can be varied in the convective scheme of LMDZ [9] through tunable parameters.

To test these hypotheses, we analyse simulations from the cloud-resolving model SAM in radiative-convective equilibrium configuration with various wind shear and large-scale ascent conditions.

Ultimately, the representation of squall lines should improve the simulation of precipitation distribution, variability and extremes in tropical regions such as the Sahel or the Amazon.


[1] R. Roca, J. Aublanc, P. Chambon, T. Fiolleau, N. Viltard, J. Clim. 27, 4952–4958 (2014).

[2] R. Roca, T. Fiolleau, Com. Earth & Env. 1, 18 (2020).

[3] R. Rotunno, J.B. Klemp, M.L. Weisman, J. Atmos. Sci., 45(3), 463-485 (1988).

[4] J.-Y. Grandpeix, J.-P. Lafore, J. Atmos. Sci., 67, 881–897 (2010).

[5] U. Anber, S. Wang, A. Sobel, J. Atmos. Sci., 71, 2976–2993 (2014).

[6] T. Becker, C. S. Bretherton, C. Hoehenegger, B. Stevens, Geophys. Research Lett. 45, 455–462 (2018).

[7] J. P. Lafore, J. L. Redelsperger, G. J. Jaubert, Atmos. Sci., 45(22), 3483-3500 (1988).

[8] G. G. Rooney, A. J. Stirling, R. A. Stratton, M. Whitall, Quart. J. Royal. Meteoro. Soc. 148, 962–980 (2021).

[9] K. A. Emanuel, J. Atmos. Sci. 48, 2313–2329 (1991).

How to cite: Segueni, M., Risi, C., and Rochetin, N.: Organization of deep convection into squall lines, EGU General Assembly 2026, Vienna, Austria, 3–8 May 2026, EGU26-5758, https://doi.org/10.5194/egusphere-egu26-5758, 2026.

EGU26-5873 | Posters on site | AS1.6

Wind shear enhances soil moisture influence on rapid thunderstorm growth 

Cornelia Klein, Christopher Taylor, Emma Barton, Sebastian Hahn, and Wolfgang Wagner

Convective storms can develop rapidly, creating hazards to local populations via intense precipitation, strong winds and lightning. The large-scale environment in which thunderstorms develop is often well-captured in forecast systems yet predicting where individual storms will initiate remains a fundamental challenge. It is known that differential heating driven by soil moisture patterns creates atmospheric circulations which favour convective initiation over drier soils, whilst wind shear between low and mid-levels can enhance upscale storm growth.

Here we show that the most explosive initiations are especially favoured over soil moisture contrasts via an interaction with wind shear. Analysing 2.2 million afternoon convective initiations across Sub-Saharan Africa identified from Meteosat Second Generation imagery for the period 2004-2023, we find that stronger low-level directional wind shear systematically enhances the sensitivity of convective initiations to underlying soil moisture gradients (as identified by combining ERA5 wind fields, MSG land surface temperature and Advanced Scatterometer soil moisture). We detect 68% more initiations classed as extreme given favourable (versus unfavourable) soil conditions, with the most rapidly deepening clouds occurring where soil moisture-induced circulations oppose the direction of mid-level cloud displacement. We propose this configuration promotes wider, more resilient updraughts capable of overcoming shear-enhanced entrainment. Furthermore, where mid-level wind opposes the low-level flow, we find subsequent rainfall to be strongly correlated with locally drier soils as developing rainy clouds follow the mid-level wind direction. Whilst such shear conditions are particularly common over Tropical North Africa, the effect favours negative soil moisture-precipitation feedbacks globally. The combination of soil moisture heterogeneity and wind shear provides a potentially important source of predictability for where deep convection develops, particularly for the most rapidly-developing thunderstorms.

How to cite: Klein, C., Taylor, C., Barton, E., Hahn, S., and Wagner, W.: Wind shear enhances soil moisture influence on rapid thunderstorm growth, EGU General Assembly 2026, Vienna, Austria, 3–8 May 2026, EGU26-5873, https://doi.org/10.5194/egusphere-egu26-5873, 2026.

EGU26-6472 | ECS | Orals | AS1.6

Cloud-Cloud Interactions and Their Roles in the Development of Convective Cloud Systems 

Jingyi Chen, Chuang Xu, Chunsong Lu, Samson Hagos, Heng Xiao, Zhe Feng, and Jerome Fast

Understanding the life cycle of cumulus clouds remains challenging due to limited knowledge of the factors governing initiation and growth processes. Cloud-cloud interactions—specifically how neighboring clouds influence each other—are a critical but underexplored aspect of evolution of cloud populations. Our key innovation lies in, using both realistic and idealized large-eddy simulations (LES), to identify and quantify competitive relationships among neighbouring  clouds as a fundamental driver of cloud population dynamics.

Realistic LES over land reveals a statistically significant pattern: growing clouds suppress the development of their immediate neighbors, suggesting competition for moisture among neighbouring cloudy updrafts. Idealized LES further uncovers that this competition is strongest during the decaying stage of clouds. During this stage, cloud-cloud  interactions reduce cloud depths but expand their horizontal extent through environmental moistening—a feedback that effectively reduces cloud spacing and intensifies competition. We also systematically establish the controlling factors of competitive strength by conducting multiple idealized LES simulations by varying: aerosol loading, inter-cloud distance, and surface forcing heterogeneity.

This work establishes cloud-cloud competition as a previously missing process in cumulus evolution theory. By mechanistically resolving how interactions redistribute moisture and energy, we provide a framework to understand population-scale organization. Our findings offer direct pathways to improve cumulus parameterizations in Earth system models, particularly in representing convective clustering and cloud lifetime effects. 

How to cite: Chen, J., Xu, C., Lu, C., Hagos, S., Xiao, H., Feng, Z., and Fast, J.: Cloud-Cloud Interactions and Their Roles in the Development of Convective Cloud Systems, EGU General Assembly 2026, Vienna, Austria, 3–8 May 2026, EGU26-6472, https://doi.org/10.5194/egusphere-egu26-6472, 2026.

Observations show a bimodal frequency distribution in total column vapour (TCV) over tropical oceans, with convective rainfall predominantly produced on the moist side of the frequency minimum between two modal peaks. Here we show a km-scale model of the tropics with explicit convection produces a bimodal TCV distribution, whereas the same model with parameterized convection does not. The parameterized model also fails to realistically confine rainfall to a moist mode. Using concepts from statistical mechanics we relate TCV frequency and tendency, and isolate process contributions to tendency in TCV phase-space. Where bimodality is lacking, we find an incorrect relationship between moisture flux convergence and TCV in environments with little or no rainfall. The resulting lack of a strong gradient in TCV tendency with respect to TCV is inconsistent with that expected to maintain a TCV frequency minimum.  Our results demonstrate value in the TCV probability distribution as a process diagnostic for the upscale impacts of convection, and as a test for realism in model moisture-dynamics coupling.

How to cite: Bassford, J., Maybee, B., Marsham, J., and Parker, D. J.: Tropical TCV as a process diagnostic: connecting probability to convective processes in km-scale models via moisture budget statistics , EGU General Assembly 2026, Vienna, Austria, 3–8 May 2026, EGU26-6857, https://doi.org/10.5194/egusphere-egu26-6857, 2026.

EGU26-6908 | Posters on site | AS1.6

Humidity-Dependent Sensitivity of Tropical Island Deep Convection to Aerosols 

Frank Robinson, Trude Storelvmo, Steve Sherwood, and Daniel Kirshbaum

Using the aerosol--aware Weather Research and Forecasting (WRF) model in an idealized tropical island framework, we examine how boundary layer  moisture modulates the convective response to cloud condensation nuclei (CCN). Simulations across CCN concentrations of 30--2400 per cubic cm and varying relative humidity,  CAPE and surface–flux regimes, show that convection consistently weakens with increasing CCN, but only when the boundary layer is sufficiently moist. In such a setting, fewer CCN yield larger droplets that rapidly convert to rain and reduce evaporation at mid-levels (between 2 and 4km), both of which  warm and dry the layer and thereby weakening shallow convection. This limits vertical transport of moist static energy (MSE), allowing near-surface MSE and Convective Available Potential Energy (CAPE) to build up. As a result, subsequent deep convection in clean cases exhibits stronger updrafts, greater graupel production, and enhanced convective and mass fluxes. In contrast, humid but polluted environments yield numerous small drops which remain lofted and suppress warm rain, enhancing the evaporative source of vapor at mid-levels, strengthening  shallow convection, limiting CAPE growth, and ultimately producing weaker convection.However, when the boundary layer is dry, both CAPE and convection show little sensitivity to CCN concentration, highlighting the role of moisture preconditioning. Satellite composites of TRMM  convective intensity (measured by 40 dBZ echo top height) and MODIS droplet number (Nd) over tropical islands tentatively appear to support this mechanism. Higher Nd values are associated with lower CAPE and weaker convective vigor, with the strength of the trend being proportional to the near-surface relative humidity - consistent with simulations. Together, these results suggest that in a tropical island-setting, aerosols impact convection primarily when the boudary layer  is preconditioned with sufficient moisture, and that under these conditions increased aerosol loading tends to suppress rather than invigorate deep convection.

How to cite: Robinson, F., Storelvmo, T., Sherwood, S., and Kirshbaum, D.: Humidity-Dependent Sensitivity of Tropical Island Deep Convection to Aerosols, EGU General Assembly 2026, Vienna, Austria, 3–8 May 2026, EGU26-6908, https://doi.org/10.5194/egusphere-egu26-6908, 2026.

EGU26-6921 | ECS | Posters on site | AS1.6

A prognostic cumulus parameterization with cloud-updraft interaction 

Cristian Vraciu and Robert Plant

Convective parameterizations used in atmospheric models to represent the effects of unresolved shallow and deep convection on the large-scale flow are traditionally formulated in a diagnostic manner that assumes an instantaneous adjustment of convection to the resolved-scale environment. Prognostic parameterizations, on the other hand, can represent the time evolution and memory of moist atmospheric convection, leading to more realistic interactions between convection and large-scale atmospheric circulation, especially if far from convective quasi-equilibrium. Several such prognostic formulations for the mass flux have been proposed by relaxing the quasi-equilibrium assumption introduced by Arakawa and Schubert [1], based on assumed relations between the convective mass flux and the convective kinetic energy [2,3]. In this work, we develop a new prognostic formulation for shallow and deep convection with cloud cover and convective velocity both being treated as prognostic variables. Interactions between shallow and deep convection are represented in our formulation due to their differing effects on the large-scale environment, but also due to direct cloud-updraft interactions. In radiative-convective equilibrium (RCE), our model predicts that the cumulus cloud cover is proportional to the radiative cooling rate and that the convective velocity depends only on the relative humidity and the tropospheric depth, in agreement with numerical experiments. In addition, our model predicts that convective available potential energy decreases in RCE with the increase of the radiative cooling rate due to the cloud-updraft interaction. Moreover, we show that the inclusion of the cloud-updraft interaction and the cold pools feedback is required for a realistic representation of the diurnal cycle of shallow and deep convection.


[1] Arakawa, A., & Schubert, W. H. (1974). Interaction of a cumulus cloud ensemble with the large-scale environment, Part I. Journal of Atmospheric Sciences, 31(3), 674-701.

[2] Pan, D. M., & Randall, D. D. (1998). A cumulus parameterization with a prognostic closure. Quarterly Journal of the Royal Meteorological Society, 124(547), 949-981.

[3] Yano, J. I., & Plant, R. (2012). Finite departure from convective quasi‐equilibrium: Periodic cycle and discharge–recharge mechanism. Quarterly Journal of the Royal Meteorological Society, 138(664), 626-637.

How to cite: Vraciu, C. and Plant, R.: A prognostic cumulus parameterization with cloud-updraft interaction, EGU General Assembly 2026, Vienna, Austria, 3–8 May 2026, EGU26-6921, https://doi.org/10.5194/egusphere-egu26-6921, 2026.

EGU26-6979 | ECS | Posters on site | AS1.6

Detailed classification of marine shallow clouds with large cloud fraction using artificial intelligence 

Hadar Roth, Tom Dror, Ron Sarafian, Gali Dekel, Orit Altaratz, and Ilan Koren

Marine shallow clouds are highly abundant over subtropical oceans and play a key role in regulating Earth’s radiative balance, exerting a significant net cooling effect. However, their representation in current climate models remains incomplete, contributing substantially to uncertainties in climate projections and cloud feedback mechanisms. Marine shallow clouds have conventionally been classified into closed cells, open cells, and shallow cumulus clouds. Recent advances in deep learning have expanded this classification by enabling the automatic detection of additional pattern types. Yet, even within these pattern classes lies a spectrum of finer patterns that have not been systematically identified, leaving their underlying dynamics and radiative impacts underexplored.
We present an AI architecture for the classification of marine shallow cloud satellite images into newly defined fine pattern classes. We focus specifically on marine shallow cloud regimes with large cloud fraction values (above 0.9), which we partition into four classes: closed cells, closed cloud streets (rolls), stratiform clouds and unorganized convection. This finer partitioning enables the extraction of richer information from large cloud fraction conditions and a more detailed investigation of physical processes governing their organization. The training dataset was labeled by the Weizmann Cloud Physics Group members. Explainable AI tools are used to analyze the model’s internal representations and learn how it differentiates between the new classes. Applying the trained model to a large number of satellite images enables us to construct a novel, comprehensive and systematically classified database of cloud patterns. The availability of this extensive dataset allows the use of remote sensing cloud properties to characterize the unique features of each regime, and radiative flux data to assess their distinct radiative behaviors, despite their similarly high cloud fraction values. This work provides a clearer understanding of marine shallow cloud patterns and offers insight into the relationships between cloud morphology, underlying dynamics, and radiative effects.

How to cite: Roth, H., Dror, T., Sarafian, R., Dekel, G., Altaratz, O., and Koren, I.: Detailed classification of marine shallow clouds with large cloud fraction using artificial intelligence, EGU General Assembly 2026, Vienna, Austria, 3–8 May 2026, EGU26-6979, https://doi.org/10.5194/egusphere-egu26-6979, 2026.

Convective aggregation, which often leads to organized convective systems, is ubiquitous over tropical oceans and contributes substantially to both total and extreme precipitation in these regions. Cold pools, crucial processes linked to convection, are known to exert both suppressing and triggering effects on convective initiation, but their role in convective aggregation remains debated. As inspired by the previous study of Biagioli and Tompkins (2023), herea simple two-layer stochastic dynamic model for convective aggregation (see the figure below) is developed by coupling boundary-layer cold pool dynamics with free-troposphere moisture dynamics. The novelty of this model lies in two key aspects: the incorporation of compensating subsidence as a dynamic mechanism to maintain the total number of individual convective cells, and the coupling of the boundary-layer moist static energy (MSE) budget to represent both suppressing and triggering effects of cold pools. The results show that the suppressing effect of cold pools is essential for keeping individual convective cells separated, consistent with observations, while their triggering effect promotes larger cluster sizes and shorter aggregation timescales. The model is then applied to investigate how convective aggregation responds to changes in mean convection lifetime and mean boundary-layer MSE under warming. The parameter sensitivity experiments confirm the robustness of the results and provide insight into phase transitions across different parameter regimes. The model is expected to serve as a theoretical tool for investigating the impact of various physical processes on convective aggregation and may potentially serve as a prototype for convection parameterization that incorporates cold pools and convective organization.

How to cite: Yang, Q. and Li, Y.: The Role of Cold Pools in Convective Aggregation over Tropical Oceans: A Two-Layer Stochastic Dynamic Model, EGU General Assembly 2026, Vienna, Austria, 3–8 May 2026, EGU26-7045, https://doi.org/10.5194/egusphere-egu26-7045, 2026.

EGU26-7300 | ECS | Orals | AS1.6

Data-driven equation discovery of the maximum vertical velocity in idealized deep convection 

Alzbeta Pechacova, Alejandro Casallas, Lokahith Agasthya, Tom Beucler, and Caroline Muller

The maximum vertical velocity within deep convective updrafts (wmax) is a key control on precipitation intensity and lightning, yet the physical processes that set its magnitude remain unclear. Here we use data-driven equation discovery to identify the dominant controls on wmax in idealized deep convection. We analyze a set of radiative-convective equilibrium simulations spanning a wide range of sea surface temperatures (290-310 K) and imposed radiative cooling rates (0.75-3 K/day), tracking individual clouds and diagnosing their pre-storm environment and in-cloud properties. Treating the pre-storm environment and in-cloud processes separately, for each we identify  a small number of predictors from a broad set of physically motivated variables that robustly explain variations in wmax across simulation regimes. Interpretable equations derived via symbolic regression from the in-cloud variables indicate that latent heating provides the primary acceleration of updrafts, while pressure perturbations act as a leading-order decelerating mechanism that limits peak velocities. Pre-storm predictors such as CAPE and triggering strength constrain the range of possible wmax values, whereas in-cloud condensate loading and pressure effects determine the realized extremes. This work provides a physically interpretable framework for understanding convective updraft intensity, using data-driven analysis informed by existing physical knowledge.

How to cite: Pechacova, A., Casallas, A., Agasthya, L., Beucler, T., and Muller, C.: Data-driven equation discovery of the maximum vertical velocity in idealized deep convection, EGU General Assembly 2026, Vienna, Austria, 3–8 May 2026, EGU26-7300, https://doi.org/10.5194/egusphere-egu26-7300, 2026.

EGU26-7943 | Posters on site | AS1.6

Invariance in convective storms with warming: A Lagrangian view 

Noé Clavier, Jiawei Bao, and Caroline Muller

Changes in tropical precipitation, particularly extremes, are closely linked to mesoscale deep convective systems (DCSs). While previous work has largely focused on precipitation characteristics, much less is known about how the DCSs which produce extreme rainfall respond to warming. Recent studies showed that the Lagrangian perspective offered by storm tracking in satellite imaging was promising. Here, we exploit two models (SAM and MesoNH) of idealised tropical convection from the RCEMIP project, on which the TOOCAN DCS tracking algorithm has been applied, to study DCSs life cycles in an idealised setup. Focusing on their onset rate, lifetime, area and precipitation intensity, we show that despite the relatively small increase in domain-mean precipitation (+2.5 %/K), the characteristics of DCSs change much more with warming, but their respective responses mostly compensate. Mean DCS precipitation intensity increases in both SAM (+10 %/K) and MesoNH (+2.3 %/K). However, the two models predict strong but opposite responses in DCS area and onset rate—increased area (+8.0 %/K) and lower onset rate (–13 %/K) in SAM, the opposite in MesoNH (–4.2 %/K and +7.4 %/K, respectively). This may be related to their different organisation response to warming. Yet, we find that the probability density functions (PDFs) of DCS lifetime, area and precipitation intensity normalised by their respective ensemble average over all DCSs, are climate and model invariant: the PDF of each of these variables is identical in both the colder and the warmer simulation, in both SAM and MesoNH. If confirmed, such a climate invariance could fuel further research about the physical mechanisms of extreme storms response to warming.

How to cite: Clavier, N., Bao, J., and Muller, C.: Invariance in convective storms with warming: A Lagrangian view, EGU General Assembly 2026, Vienna, Austria, 3–8 May 2026, EGU26-7943, https://doi.org/10.5194/egusphere-egu26-7943, 2026.

The impacts of the anthropogenic heat (AH) effect on the evolution of a merger-formation bow echo over the Guangdong-Hong Kong-Macao Greater Bay Area are documented. The utilization of radar data assimilation greatly improves the simulated results comparing against observations, strengthening the robustness of analyses in this work. The simulation with AH effect produces the most accurate results compared to observations, exhibiting approximately 62% larger spatial extent of heavy rainfall (> 30 mm) and twice the area of strong winds (> 10.8 m s-1) compared to the non-AH simulation. Additionally, the top 1% rain rates and surface winds from the AH-included simulation are about 25% stronger and 23% greater, respectively, relative to the non-AH counterpart. On the one hand, higher AH flux tends to enhance the values of CAPE and vertical wind shear within urban areas on average, providing favorable thermodynamic environmental conditions for convective development. On the other hand, greater AH effect triggers stronger convective cell, leading to more intense merged system. This cell plays a crucial role in the merger process and the formation of bow echo, but it does not persist sufficiently in the non-AH simulation. A third sensitivity simulation, excluding the urban land cover, produces results comparable to those of the non-AH simulation. This study quantifies the relative contribution of the AH effect to the evolution of convective systems and the associated weather-related hazards over the Greater Bay Area, underscoring the significant impacts of AH forcing on the regional flow patterns and the corresponding convection dynamics.

How to cite: Zhou, A. and Zhao, K.: The Impact of Anthropogenic Heat Effect on the Evolution of a Merge - Formation Bow Echo in the Greater Bay Area of China , EGU General Assembly 2026, Vienna, Austria, 3–8 May 2026, EGU26-8801, https://doi.org/10.5194/egusphere-egu26-8801, 2026.

EGU26-9423 | Orals | AS1.6

Controls of Zonal Convective Self-Aggregation in an Idealized Tropical Rain Belt 

Tomoro Yanase and Cathy Hohenegger

Self-aggregation of deep moist convection has been widely studied in idealized radiative-convective equilibrium. While its relevance to the real tropical climate remains debated, one potential link is zonal convective aggregation within tropical rain belt. However, the mechanisms controlling zonal aggregation are still not well understood. Here, to investigate how convection interacts with the large-scale environment in a zonally symmetric setting, we conduct a series of idealized cloud-resolving simulations in which a meridionally varying, sinusoidal sea surface temperature (SST) distribution is systematically controlled. In particular, we vary the SST amplitude and SST maximum value.

We find that the system selects either a zonally uniform or a zonally aggregated state depending on the following SST parameters: zonal aggregation occurs when both the SST amplitude and the SST maximum are large. We explain this behavior as follows.

For large SST amplitude but low SST maximum, a narrow convergence zone can be maintained by the strong meridional pressure gradient and the associated circulation. In contrast, for large SST amplitude and high SST maximum, the narrow convergence zone cannot be sustained because the circulation weakens as free-tropospheric static stability increases, consistent with convection sitting on a warmer (and more stable) moist adiabat by warmer SST. As a result, convection over the high-SST region cannot maintain surface convergence solely via the meridional overturning circulation driven by subsidence over the low-SST region. Instead, it selects a zonally aggregated state that also extends the circulation in the zonal direction.

How to cite: Yanase, T. and Hohenegger, C.: Controls of Zonal Convective Self-Aggregation in an Idealized Tropical Rain Belt, EGU General Assembly 2026, Vienna, Austria, 3–8 May 2026, EGU26-9423, https://doi.org/10.5194/egusphere-egu26-9423, 2026.

In the tropics, heavy daily accumulated precipitation has been shown to be associated with the most organized convective systems. Over the oceans, a simple scaling of the extreme precipitation explains the changes of the high percentiles with SST at a rate close to that predicted from thermodynamics and Clausius Clapeyron. This study aims at clarifying the sensitivity of the deep convective systems relevant to extreme precipitation with respect to SST and to reconcile the object-oriented and the grid box perspectives. For that purpose, two satellite-based precipitation products (IMERG, and GIRAFE) are used together with SST from OSTIA and the deep convective cloud properties from CACATOES. The CACATOES database, a Level-3 product derived from TOOCAN, is available for the 9-year period (2012–2020) over the entire tropical belt (30°S–30°N) on a 1° daily grid.

Our results show that the increase in extreme precipitation fraction is associated with longer lived, larger and slower propagating DCS as the SST warms from 300K to 302.5K. As a consequence, the residence time of the mean system over extreme precipitation grid boxes increases with SST. While it may qualitatively explain the increased accumulated precipitation extreme, akin to the slowdown trend of landing hurricanes, it remains to be shown whether this hypothesis is up to quantitative analysis.

Preliminary investigations of the scaling of the precipitation fraction with SST nevertheless reveals a product-dependence that needs to be explored further using a larger ensemble of satellite precipitation products. The physical robustness of the hypothesis is also further analysed by looking at the thermodynamical and dynamical environment, using ERA-5, of the Deep Convective System relevant to the extreme precipitation grid boxes. A moistening of the environment, consistent with the precipitation increase is found. The changes in the dynamical environment will be further discussed at the conference.

How to cite: Rajasekharan Sujatha, A. and Roca, R.: Are increases in extreme accumulated precipitation over tropical oceans with SST warming due to the slowing of deep convective systems?, EGU General Assembly 2026, Vienna, Austria, 3–8 May 2026, EGU26-10223, https://doi.org/10.5194/egusphere-egu26-10223, 2026.

EGU26-11105 | ECS | Orals | AS1.6

Diversity of Convective Updrafts during 5 Airborne Campaigns: Insights from a Large Dataset of km-Scale Simulations 

Florian Mequignon, Jean-Pierre Chaboureau, and Jérémy Richard

Understanding the structural and dynamical properties of convective cores is essential to advancing our knowledge of deep convection. Convective cores are the primary engines for the vertical transport of heat and moisture, yet their small spatial scales and the scarcity of vertical velocity measurements make them difficult to observe and represent in numerical weather prediction and climate models.

This study aims to characterize the morphology and intensity of updrafts using a comprehensive dataset of more than 50 Meso-NH km-scale simulations of deep convection events that occurred during five airborne campaigns during which the RASTA (RAdar SysTem Airborne) radar was deployed: CADDIWA, EXAEDRE, HAIC Cayenne, HAIC Darwin, and MAESTRO. These high-resolution simulations encompass a wide spectrum of meteorological environments. We employ an advanced three-dimensional object detection algorithm to isolate convective cores. This volumetric approach allows us to capture the complex geometry of updrafts and the internal variability in vertical velocity.

We specifically investigate the dependence of updraft size and intensity on key environmental parameters using an object-oriented approach. We statistically analyze the distribution of updraft morphological and dynamical properties. Our results show that vertical extension is a driver of updraft intensity, with taller convective cores exhibiting higher vertical velocities. In contrast, the horizontal width of the cores has a significantly smaller impact on their peak intensity. The consequences of these findings for the development of convective parameterizations and for future satellite missions, such as C2OMODO (Convective Core Observations through MicrOwave Derivatives in the trOpics), will be discussed.

How to cite: Mequignon, F., Chaboureau, J.-P., and Richard, J.: Diversity of Convective Updrafts during 5 Airborne Campaigns: Insights from a Large Dataset of km-Scale Simulations, EGU General Assembly 2026, Vienna, Austria, 3–8 May 2026, EGU26-11105, https://doi.org/10.5194/egusphere-egu26-11105, 2026.

Measuring vertical velocity is crucial for advancing our understanding of deep convection. The Convective Core Observations through MicrOwave Derivatives in the trOpics (C2OMODO) mission aims to retrieve vertical velocity using ice-sensitive microwave measurements taken at two closely spaced time intervals. In preparation for the mission, it is essential to investigate the relationship between vertical velocity and satellite measurements. However, vertical velocity within convective cores is rarely measured, and no comprehensive dataset currently exists. To address this, it is necessary to create datasets that combine vertical velocity with corresponding synthetic satellite observations. The recent porting of the Meso-NH non-hydrostatic mesoscale model to GPU architectures enables the efficient generation of such high-resolution datasets. We present the RASTA (RAdar SysTem Airborne) collection, a dataset of Meso-NH kilometer-scale simulations developed for the C2OMODO project. It is based on five airborne field campaigns during which the RASTA radar was deployed: CADDIWA, EXAEDRE, HAIC Cayenne, HAIC Darwin and MAESTRO. The dataset comprises 13 billion atmospheric columns from 53 simulations, validated against RASTA radar data and satellite observations. The exploration of the convective cores variability in the dataset is carried out using formal concept analysis (FCA), a mathematical framework that links objects and attributes through a Galois connection. FCA is used to classify convective cores according to the environmental factors that most influence them. The resulting concept lattices reveal which combinations of conditions favor convection. They also highlight common patterns and specific characteristics in different meteorological environments.

How to cite: Richard, J. and Chaboureau, J.-P.: Variability of Convective and Ice Cloud Structures in the RASTA Collection of Kilometer-Scale Meso-NH Simulations for C2OMODO, EGU General Assembly 2026, Vienna, Austria, 3–8 May 2026, EGU26-11838, https://doi.org/10.5194/egusphere-egu26-11838, 2026.

EGU26-11929 | Posters on site | AS1.6

C3IEL, the Cluster for Cloud evolution ClImatE and Lightning Mission to Study Convective Clouds at High Spatial and Temporal Resolutions 

Céline Cornet, Daniel Rosenfeld, Shmaryahu Aviad, Cécile Cheymol, Eric Defer, Adrien Deschamps, Alex Frid, Laurène Gillot, Vadim Holodovsky, Avner Kaidar, Juan-Baustista Navas, Guillaume Penide, Colin Price, Didier Ricard, Antoine Rimboud, Yoav Schechner, Amaury Truffier, Yoav Yair, and Alexis Zemb

The space-borne C3IEL (Cluster for Cloud evolution, ClImatE and Lightning) mission,  developed jointly by the French and the Israeli space agencies, aims at providing new insights on convective clouds, at high spatial and temporal resolutions, close to the scales of the individual convective eddies. The mission will simultaneously characterize the convective cloud dynamics, the interactions of clouds with the surrounding water vapor, and the lightning activity.

The C3IEL mission consists in a short-baseline (~150 km) train of 2 synchronized small satellites. Each satellite carries a visible camera (670 nm) for cloud imagery at a spatial resolution of ~20 meters, near-infrared water vapor imagers (1.04, 1.13 et 1.37 µm ; ~125 m at nadir) measuring in and near the water vapor absorption bands, a lightning imager (777.4 nm ; ~140 m at nadir; 10 ms time resolution) and three photometers (337, 391 and 777.4 nm; 50 μs time resolution).

The scientific objectives of the C3IEL mission will be first reminded. They consist in documenting the convective cloud development through their 3D evolution and their environment with the retrieval of water vapor surroundings the clouds. In addition, the lightning activitiy created by such clouds will be observed. The presentation will first remind the satellite train configuration, the different sensors of the mission and the innovative and different observational strategies that will be applied during daytime and nighttime. We will then provide an update on the expected observations and products.

Figure : Artist view of the C3IEL, Cluster for Cloud evolution, ClImatE and Lightning, mission. © CNES - Olivier Satteler.

How to cite: Cornet, C., Rosenfeld, D., Aviad, S., Cheymol, C., Defer, E., Deschamps, A., Frid, A., Gillot, L., Holodovsky, V., Kaidar, A., Navas, J.-B., Penide, G., Price, C., Ricard, D., Rimboud, A., Schechner, Y., Truffier, A., Yair, Y., and Zemb, A.: C3IEL, the Cluster for Cloud evolution ClImatE and Lightning Mission to Study Convective Clouds at High Spatial and Temporal Resolutions, EGU General Assembly 2026, Vienna, Austria, 3–8 May 2026, EGU26-11929, https://doi.org/10.5194/egusphere-egu26-11929, 2026.

Entrainment and detrainment processes remain one of the biggest challenges in convective cloud dynamics and need to be parameterized in mass-flux-based convection schemes. A common assumption in convection parameterizations is that the fate of a mixture between cloud and environmental air is determined by the "buoyancy sorting" hypothesis, and further that the net effect of entrainment and detrainment is to reduce the vertical momentum in the cloud. In this study, Lagrangian trajectories are investigated to understand the entrainment and detrainment processes in maritime shallow cumulus clouds and to examine hypotheses in convection parameterization schemes. Analysis of vertical momentum in cumulus clouds using Lagrangian trajectories and using a bulk budget approach both indicate that the overall impact of entrainment and detrainment on momentum is to accelerate the cloud updraft, rather than acting as a drag force. Following the trajectories, it is found that the entrained air has larger mean vertical velocity than the detrained air, in contradiction with the typical assumption in the mass-flux based plume models. This finding indicates the necessity for a careful treatment of the dynamical properties in the near cloud environment. Investigating the buoyancy of entraining and detraining trajectories, we find that the widely accepted "buoyancy sorting" hypothesis is not able to correctly describe both entrainment and detrainment processes, regardless of how the cloud objects are defined. Instead, whether a mixed parcel is likely to be entrained into or detrained out of the cloud depends on its vertical acceleration. More specifically, vertically accelerated parcels near cloud edge are more likely to be entrained and vertically decelerated parcels are more likely to be detrained. Thus, the "acceleration sorting" hypothesis is proposed. Decomposition of the vertical momentum budget for the entrained and detrained trajectories shows that it is the pressure gradient acceleration, especially the dynamical pressure gradient acceleration associated with the flow structure and the effective buoyancy, rather than the buoyancy alone, that dominate the "acceleration sorting". Our results suggest that the flow structure of cloud thermals might be a potential candidate responsible for "acceleration sorting" processes during the entrainment and detrainment. These findings provide new insights to the understanding of the physical processes during both entrainment and detrainment.

How to cite: Gu, J.-F., Plant, R., Holloway, C., Clark, P., and Stirling, A.: Understanding the Entrainment and Detrainment Processes in Maritime Shallow Cumulus Clouds using Lagrangian Trajectories: Buoyancy Sorting or Acceleration Sorting?, EGU General Assembly 2026, Vienna, Austria, 3–8 May 2026, EGU26-11967, https://doi.org/10.5194/egusphere-egu26-11967, 2026.

EGU26-12752 | Posters on site | AS1.6

Tracking aggregates of deep convective systems in the tropics 

Benjamin Fildier and Obed Saba

In the tropics, the spatio-temporal aggregation of deep convective systems (DCS) has strong implications for the regional and global energy balance, for cloud-circulation interactions, and for the production of heavy precipitation on various scales. Yet, no ubiquitous definition or tracking algorithm exists for identifying cloud "aggregates", or cloud "clusters" in an objective way. Current cloud tracking tools are either developed for detecting individual cloud entities, or for identifying cloud clusters faithful to the original definition of mesoscale convective systems. They thus exclude a wide variety of DCS ensembles that organize in space and time without always merging into contiguous structures.

This work introduces a methodology to define and track coherent aggregates of deep convective systems using infrared brightness temperature (Tb) retrievals from geostationary satellites intercalibrated across the tropical band. The novelty lies in the combination between a spatiotemporal clustering and a region-growing method: starting with the coldest and largest cloud cores, we gradually attribute to preexisting aggregates the new neighboring systems that appear when the Tb threshold is increased to warmer values, until reaching the warmer outer edge of anvil clouds. Using a few criteria to measure organizational properties of the segmentation, we tune the algorithm parameters to maximize the realism of final cloud aggregates, minimize split-and-merge issues, and ensure that each aggregate is not intertwined with its neighbors whenever possible.

We demonstrate the good performance of this algorithm through a variety of realistic modes for deep convective organisation. The example case studies chosen include mesoscale convective complexes and cyclones over tropical oceans, cloud clusters embedded in African Easterly Waves, and the upscale merging of DCS in the course of the diurnal cycle of convection over tropical continents. A few composite properties of aggregates are shown for the entire tropics, to illustrate the potential of this dataset in providing new insights on the variety of organized convective patterns and on their associated multiscale interactions. The dynamics of individual systems can now be explored as an integral component of larger convective aggregates, across the diversity of cluster morphologies that populate the current tropics.

How to cite: Fildier, B. and Saba, O.: Tracking aggregates of deep convective systems in the tropics, EGU General Assembly 2026, Vienna, Austria, 3–8 May 2026, EGU26-12752, https://doi.org/10.5194/egusphere-egu26-12752, 2026.

EGU26-13288 | ECS | Orals | AS1.6

Modeling convective methane clouds on Titan with a kilometer-scale regional model 

Enora Moisan, Aymeric Spiga, and Audrey Chatain

    Titan, the largest moon of Saturn, is four times smaller than Earth but has a slightly higher surface pressure (1.5 bar), due to its very extended atmosphere. Titan's atmosphere is mainly composed of nitrogen, with a few percents of methane. The pressure and temperature (~94 K at the surface) conditions there enable a full "hydrological" cycle of methane, with lakes stable on the surface, evaporation, clouds, rain, and rivers.
    In this work, we focus on the methane clouds in Titan's troposphere, and in particular on the convective ones.
    Titan's methane clouds are monitored from Earth-based telescopes since the end on the 1990's, and have been observed from close by the Cassini spacecraft during half a Titan year (2004 - 2017). Some of the methane clouds in Titan's troposphere are thought to exhibit convective dynamics (e.g. Griffith 2005, 2009, Schaller 2009, Lemmon 2019, Rannou 2021). To understand the processes driving the clouds formation and evolution, modeling is also used, from global scale to regional scale models.

    Here we use a regional scale model (160x160 km), with kilometric horizontal resolution. The model is a coupling between the physics of the Titan Planetary Climate Model (Titan PCM, de Batz de Trenquelléon et al. 2025 a,b) and the dynamics of the Weather Research and Forecast model (WRFv4, Skamarock et al. 2019).
    We perform idealized simulations with several initial perturbations, at several seasons and locations, in order to constrain in which conditions methane convection appears on Titan.

    We obtain condensation for a diversity of setups, with in some cases the triggering of deep convection. We discuss the environments where we find deep convection in our model, and compare them to what has been observed on Titan. We also study convective ascents and the convective available potential energy (CAPE) obtained in our simulations, and compare it to Earth's storms.

References

de Batz de Trenquelléon et al. a, 2025. The New Titan Planetary Climate Model. I. Seasonal Variations of the Thermal Structure and Circulation in the Stratosphere. Planet. Sci. J. 6, 78. https://doi.org/10.3847/PSJ/adbbe7

de Batz de Trenquelléon et al. b, 2025. The New Titan Planetary Climate Model. II. Titan’s Haze and Cloud Cycles. Planet. Sci. J. 6, 79. https://doi.org/10.3847/PSJ/adbb6c

Griffith et al. 2005. The Evolution of Titan’s Mid-Latitude Clouds. Science 310, 474–477. https://doi.org/10.1126/science.1117702

Griffith et al. 2009. CHARACTERIZATION OF CLOUDS IN TITAN’S TROPICAL ATMOSPHERE. ApJ 702, L105. https://doi.org/10.1088/0004-637X/702/2/L105

Lemmon et al. 2019. Large-scale, sub-tropical cloud activity near Titan’s 1995 equinox. Icarus 331, 1–14. https://doi.org/10.1016/j.icarus.2019.03.042

Rannou et al. 2021. Convection behind the Humidification of Titan’s Stratosphere. ApJ 922, 239. https://doi.org/10.3847/1538-4357/ac2904

Schaller, E.L., Roe, H.G., Schneider, T., Brown, M.E., 2009. Storms in the tropics of Titan. Nature 460, 873–875. https://doi.org/10.1038/nature08193

Skamarock et al., 2019. A description of the advanced research WRF version 4. NCAR tech. note ncar/tn-556+ str 145.

How to cite: Moisan, E., Spiga, A., and Chatain, A.: Modeling convective methane clouds on Titan with a kilometer-scale regional model, EGU General Assembly 2026, Vienna, Austria, 3–8 May 2026, EGU26-13288, https://doi.org/10.5194/egusphere-egu26-13288, 2026.

EGU26-14071 | Posters on site | AS1.6

On the birth rate of thermals in convective layers 

Roel Neggers and Irene Bartolomé García

Rising thermals are a fundamental component of atmospheric convection. Representing small parcels of air with relatively low density compared to their environment, thermals are known to carry a significant part of the vertical mixing in convective layers. Coherent structures in various modes of convection have been observed to consist of sets of thermals, in the form of vertical chains but also exhibiting more complex spatial structures. The recent focus on the spatial organization of convection has renewed interest in this topic, with meteorological field experiments providing new insights into thermal behavior. However, key aspects of thermal life cycle and population statistics remain unknown. To fill this data gap, this study tracks thermals in large-eddy simulations of a diurnal cycle of convection over land. Based on measurements on 30 August 2016 during the Hi-SCALE field campaign at the ARM SGP site, the case features a shallow convective boundary layer transitioning into deep convection during the late afternoon. Adopting previously proposed tracking algorithms, hundreds of thousands of thermals are thus identified and analyzed. Apart from investigating thermal life-cycle statistics and their diurnal evolution, a key research objective is to gain insight into what controls the birth rate of such thermals. Good scaling of thermal birth rates with various integrated buoyancy scales is reported, distinguishing between various layers and various thermal classes. The birth rate of dry thermals in the sub-cloud layer scales well with the surface-driven Deardorff convective velocity scale. Thermal presence in the cloud layer is found to be partially driven by local buoyancy scales, but is significantly boosted by thermals rising into the cloud layer during the shallow convective phase. This surface coupling disappears during the transition to deeper convection in the late afternoon, after which thermal birth rates are generally lower but scale well with the cloud layer buoyancy flux. The implications and potential use of these results for the conceptual modeling of convective organization and its representation in larger-scale circulation models are briefly discussed.

How to cite: Neggers, R. and Bartolomé García, I.: On the birth rate of thermals in convective layers, EGU General Assembly 2026, Vienna, Austria, 3–8 May 2026, EGU26-14071, https://doi.org/10.5194/egusphere-egu26-14071, 2026.

EGU26-14512 | ECS | Orals | AS1.6

Hierarchies of dynamical and microphysical control on tropical convective instability 

Todd Emmenegger, Christina McCluskey, John Truesdale, J. David Neelin, and Yi-Hung Kuo

Convection in the tropics is driven by large-scale instability and the buoyancy of convective plumes, but has a variety of representations in Earth system models (ESM). In model convective schemes, subgrid parameterizations approximate the processes that regulate plume buoyancy, leading to substantial spread in simulated tropical thermodynamic structure. While entrainment is known to strongly influence plume buoyancy, recent work highlights an important role for cloud microphysical processes—particularly mixed-phase water physics and precipitation efficiency—in shaping buoyancy during ascent (Emmenegger et al. 2024). The influence of these microphysical processes on tropical buoyancy, and how they should be constrained in convective schemes, is explored here.

Using a perturbed-parameter ensemble (PPE) of the Community Atmosphere Model version 6 (Eidhammer et al. 2024), together with numerical single-column simulations, we construct process-oriented diagnostics to identify controls on convective sensitivity over the tropical western Pacific. Across the ensemble, variability in the convection sensitivity metric is dominated by deep convective parameters, while shallow convective and microphysical parameters exert weaker but systematic influence, revealing a clear hierarchy of physical controls. This hierarchy provides a useful way to organize the role of cloud processes, but does not explain how these parameter sensitivities arise or interact across scales.

To interpret the ensemble behavior, we use a simple bulk plume framework that isolates the effects of entrainment and key microphysical processes on plume buoyancy. Observations from the US Department of Energy’s Atmospheric Radiation Measurement field campaigns together with theoretical considerations of plume buoyancy are used to derive constraints for model representation of these processes. Together, the PPE diagnostics, observational constraints, and bulk plume framework clarify how microphysical and dynamical processes interact to shape simulated tropical convective instability. This approach provides a physics-informed basis for interpreting parameter sensitivity and improving the representation of convection in coarse resolution ESMs.

How to cite: Emmenegger, T., McCluskey, C., Truesdale, J., Neelin, J. D., and Kuo, Y.-H.: Hierarchies of dynamical and microphysical control on tropical convective instability, EGU General Assembly 2026, Vienna, Austria, 3–8 May 2026, EGU26-14512, https://doi.org/10.5194/egusphere-egu26-14512, 2026.

EGU26-14944 | ECS | Orals | AS1.6

Morphological cellular analysis of Pockets of Open Cells on Marine Stratocumulus fields  

Diana Laura Monroy Merida and Jan Haerter


More of Earth’s surface is covered by stratocumulus clouds (Sc) than by any other cloud type, making Sc particularly important for Earth’s energy balance, primarily through the reflection of incoming solar radiation. However, representing Sc and their radiative impacts remains one of the greatest challenges for global climate modeling as models cannot resolve the length scale of the processes involved in its formation and evolution. For this reason, Sc represent a major source of uncertainty in climate projections (Wood 2012).

The challenge becomes more complicated due to the organizational complexity exhibited by Sc across a broad range of spatial scales. In particular, marine Sc fields display characteristic mesoscale patterns that can exhibit both organized and disorganized structures. Among these morphological regimes, cellular convection has received particular attention as cloud decks can self-organize into semi-regular tessellations composed of closed and open convective cellular fields.

Here we analyze satellite imagery of Sc organizing into low-reflectivity regions of open cells embedded within closed cellular cloud fields, known as "pockets of open cells" (POCs) (Stevens et al. 2005). We first track POCs from the time they emerge to when they dissipate. Second, a cell-scale analysis is performed for convective fields both inside and outside the POC boundaries to characterize the interface between POC and non-POC regions.

We propose a segmentation, tracking, and morphological analysis of cell geometry and dynamics in both closed and open cellular fields, with particular emphasis on the interactions between these cell types during POC development. A statistical analysis of multiple POCs is conducted to characterize the temporal and spatial contributions of cellular structural and kinetic changes to POC evolution, incorporating the local dynamics between individual cells (Farrell et al. 2017).

Using this framework, key differences between open and closed cellular regimes are identified based on velocity dynamics and morphological evolution. 
Whereas closed cells exhibit relatively slow dynamics, open cells continuously rearrange, changing both size and shape, and display significant cellular mobility, revealing motion flows within the POC region.

Finally, shallow cold pools within POCs are identified based on their lifetime, area expansion, and interactions between neighboring cells. These cold pools, which result from stratiform precipitation from open cells, play a dominant role in the dynamics of open cell fields.

The primary result of this analysis reveals a previously unreported regime of collective cellular dynamics, in which the emergence and evolution of convective organization is strongly influenced by cold pools, exhibiting structural and dynamical behaviors not observed in other known cellular systems.

How to cite: Monroy Merida, D. L. and Haerter, J.: Morphological cellular analysis of Pockets of Open Cells on Marine Stratocumulus fields , EGU General Assembly 2026, Vienna, Austria, 3–8 May 2026, EGU26-14944, https://doi.org/10.5194/egusphere-egu26-14944, 2026.

Operational forecasts of monsoon heavy rainfall suffer from the inadequate representation of convective lifecycle and three-dimensional organization of moisture. This study introduces a novel trajectory-based lifecycle framework that synchronizes atmospheric profiles with precipitation stages for dynamic tracking of convective. Using 16 years (2005–2020) of ERA5 reanalysis and rain-gauge data over the subtropical monsoon region, Hong Kong, we diagnose the coevolution of Integrated Relative Humidity (IRH), Moist Static Energy (MSE), and dynamical fields across rainfall intensities.  Results show that rainfall intensity correlates with the moist layer depth: organized deep convection (e.g., heavy rain) is coupled with full-tropospheric saturation (IRH ≥0.88 and ≥0.85 at the lower- and mid-upper tropospheric layers) and robust ascent, whereas disorganized shallow convection (e.g., light rain) is confined to the lower troposphere. Critically, the framework reveals an IRH trajectory of an upward-expanding moistening pattern synchronized with peaking MSE gradients (>10 kJ kg⁻¹) and strengthening low-level convergence, underscoring a coupled energy-dynamic sequence fundamental to the lifecycle of organized convective systems. Moreover, IRH anomalies from seasonal baselines are more consistent predictors of intense events than absolute thresholds, highlighting the importance of environmental preconditioning. This trajectory-based approach provides physical insights into convective organization in subtropical monsoons and a process-oriented tool for evaluating and improving the representation of convection in models.

How to cite: Wan, M., Su, H., and Chan, P. W.: A Trajectory-Based Framework for Diagnosing Convective Lifecycle and Organization in Monsoon Rainfall: Coupled Evolution of Moisture, Energy, and Dynamics , EGU General Assembly 2026, Vienna, Austria, 3–8 May 2026, EGU26-15571, https://doi.org/10.5194/egusphere-egu26-15571, 2026.

The representation of deep moist convection and organized convective systems in numerical modeling of the atmosphere is pivotal to model fidelity. Although kilometer-scale global models better capture large-scale oscillations and convection features that traditional general circulation models struggle to represent, past studies have reported notable differences in their simulations of convective organization, especially over the tropics. However, untangling the controlling factors of convective organization remains challenging, since physical processes associated with deep moist convection are intrinsically multiscale and deeply intertwined. To address this challenge, this study develops a cumulus parameterization tailored for kilometer-scale models, aiming to enable the modulation and systematic testing of multiscale interactions associated with deep moist convection.

The cumulus parameterization developed in this study employs Arakawa's unified parameterization to represent the interactions of unresolved deep moist convection with its environmental flow, including the explicitly simulated convection. The underlying parameterizability of unresolved deep moist convection follows the notion of convective quasi-equilibrium, while a complementary closure is employed to predict the fractional area covered by cumulus updrafts and adjust the local vertical eddy transports accordingly. A representation of stochasticity and convection memory is introduced by coupling our parameterization with a cellular automaton. Empirical values and physical assumptions are used to establish our parameterization as a prototype subject to designing systematic experiments of specific process representation in the future.

Idealized experiments of tropical maritime deep convection at a horizontal grid spacing of 3 km demonstrate that employing our parameterization in convection-permitting simulations modulates deep convective system features while generally retaining the profile of total vertical energy transport associated with deep convection. Unresolved deep convection dominates the vertical energy transport in the early stages of deep convective systems, and its contribution gradually weakens as systems develop. Meanwhile, detrainment from unresolved deep convection leads to the early occurrence of cumulus congestus and cumulonimbus. In comparison with the ordinary convection-permitting simulation, our parameterization exhibits a pronounced congestus mode in the vertical velocity profile of mature convective systems, partially due to the enhanced dry static stability. Overall, simulations with our parameterization exhibit fewer and larger short-lived convective systems. Further investigation into the source of the uncertainty in convective organization is warranted.

How to cite: Su, C.-Y. and Peters, J.: Enabling Systematic Modulation of Deep Convective Systems in Kilometer-scale Models using a Unified Cumulus Parameterization, EGU General Assembly 2026, Vienna, Austria, 3–8 May 2026, EGU26-15604, https://doi.org/10.5194/egusphere-egu26-15604, 2026.

EGU26-15723 | ECS | Orals | AS1.6

The RAM-CINC Field Campaign: Drone Measurements of Thermodynamics and Ice Nucleating Particles in the Tropical Atlantic’s Cold Pools 

Sean Freeman, Leah Grant, Nicholas Falk, Christine Neumaier, Kyra Britton, Marina Nieto-Caballero, Russell Perkins, Sue van den Heever, Leonie Jaeger, Samuel Ayim, Carsten Rauch, Oliver Wurl, Claudia Thölen, Lotta Bergfeld, Mai-Britt Berghöfer, Ludovica Gatti, Diana Monroy, Jan Haerter, and Jochen Horstmann

Tropical convective clouds are a critical component of the Earth system. As these As rain falls from these clouds, it evaporates below cloud base and produces convective cold pools. Cold pools are an important component of the atmospheric system, as they influence surface fluxes, impact the spatial distribution of aerosol, including ice nucleating particles (INP), and can initiate new convection. During summer 2025, as part of the Freshwater Fluxes over the Ocean I – Evaporative Fluxes (FreshOcean) deployment, the RAM-CINC (Relating Atlantic Marine Convection, Ice Nuclei and Cold pools) campaign deployed uncrewed aerial systems (UAS; also known as small drones) aboard the R/V Meteor in the tropical eastern Atlantic Ocean. In RAM-CINC, we characterized properties around convective cold pools, including INPs, bioaerosols, and the thermodynamic environment under quiescent and cold-pool-modified conditions. RAM-CINC’s observations are unique and able to elucidate the complex relationship between the near-surface and marine boundary layer in the small convective cold pool features. 


In this presentation, we will give an overview of our field measurements, including novel above-the-surface in situ measurements of several tropical convective cold pools that vary in strength and lifecycle stage. Because our drone measurements were targeted observations before and after cold pool passage, we will demonstrate the impacts of convective cold pool passage both at ship level and above the surface layer. Initial findings indicate maximum changes in temperature of the cold pools from near zero to -1.2 K. Further, we will show aerosol measurements, including characterization of DNA for bioaerosol particles, aerosol concentrations and size distributions, and INPs, from both the drone flights, the surface of the ship, the ocean surface layer, and rainwater, elucidating the link between the near-surface and broader marine boundary layer.

How to cite: Freeman, S., Grant, L., Falk, N., Neumaier, C., Britton, K., Nieto-Caballero, M., Perkins, R., van den Heever, S., Jaeger, L., Ayim, S., Rauch, C., Wurl, O., Thölen, C., Bergfeld, L., Berghöfer, M.-B., Gatti, L., Monroy, D., Haerter, J., and Horstmann, J.: The RAM-CINC Field Campaign: Drone Measurements of Thermodynamics and Ice Nucleating Particles in the Tropical Atlantic’s Cold Pools, EGU General Assembly 2026, Vienna, Austria, 3–8 May 2026, EGU26-15723, https://doi.org/10.5194/egusphere-egu26-15723, 2026.

EGU26-15814 | ECS | Posters on site | AS1.6

Moist convective memory in terms of thermodynamic joint probability distributions  

Walter Shen and Zhiming Kuang

Convective memory describes the extent to which current convective state is dependent on prior states. A linear state space model can predict the evolution of horizontal mean profiles and attempts to capture convective memory in its latent space. These state space models rely on black-box model structures to produce responses, which necessitate additional approaches to interpret causes of convective behavior.

To this end, for a more physically-interpretable approach to the latent state and its dynamics, we use probability distribution function (PDF) or histograms of idealized cloud-resolving model simulations. These PDFs, which contain joint distributions of thermodynamic variables, including temperature and moisture, provide more information than horizontal averages. This representation allows for a more physical picture of the latent state, while still avoiding the complexity of the three-dimensional spatial domain. We can further reduce the data volume by applying dimensional reduction techniques. 

By observing the PDF correspondence to temperature and moisture tendencies and other convective effects, we will attempt to use these physical insights to predict time series of horizontal mean profiles, including the nonlinear response of atmospheric perturbations.


How to cite: Shen, W. and Kuang, Z.: Moist convective memory in terms of thermodynamic joint probability distributions , EGU General Assembly 2026, Vienna, Austria, 3–8 May 2026, EGU26-15814, https://doi.org/10.5194/egusphere-egu26-15814, 2026.

EGU26-15871 | Posters on site | AS1.6

The INCUS Mission: Measuring Convective Mass Flux from Space 

Kristen Rasmussen, Susan van den Heever, Derek Posselt, Simone Tanelli, Pavlos Kollias, Philip Partain, and Graeme Stephens and the INCUS Science Team

NASA’s Investigation of Convective Updrafts (INCUS) aims to improve understanding of how, when, and why tropical convective storms form and why only some lead to extreme weather. Much of the vertical transport of water and air between Earth’s surface and the upper troposphere is facilitated by convective storms. This vertical transport of water and air, often referred to as convective mass flux (CMF), plays a critical role in Earth’s weather and climate system through its impacts on precipitation rates, detrainment and upper tropospheric moistening, high cloud feedbacks, and the large-scale circulation. Recent studies have also suggested that CMF may change with changing climates with subsequent implications for flood-producing rainfall, severe weather, and lightning. In spite of the critical role of this vertical transport of water and air within the weather and climate system, much is still not understood about the impacts of CMF on high cloud properties, precipitation rates, and the associated microphysical-dynamical feedbacks. Representation of CMF is also a major source of error in weather and climate models, thereby limiting our ability to predict the microphysical and dynamical properties of convective storms on weather through climate timescales.

INCUS seeks to: (1) identify environmental factors controlling CMF in tropical storms; (2) explore the connection between CMF and high anvil clouds; (3) link CMF to storm type and intensity; and (4) evaluate these relationships in models. The INCUS observations will enhance our understanding and prediction of convective storm processes.

The INCUS mission is the first to systematically measure rapidly changing CMF in tropical convection. It features three SmallSats in low Earth orbit, spaced 30 and 90 seconds apart, each with a Ka-band scanning radar (RainCube heritage). The middle satellite also carries a TEMPEST-D–based passive microwave radiometer. This setup captures radar observations at 30-, 90-, and 120-second intervals, enabling the use of time-differenced radar profiles to retrieve CMF. These observations will help quantify CMF intensity, vertical transport duration, and storm evolution. The radiometer provides insights into high anvil cloud properties and storm context. Together, these instruments will provide unprecedented 3D views of tropical convection.

Extensive research is being conducted in support of the INCUS mission. This includes high-resolution storm simulations, storm tracking, forward modeling, adaptive ground radar scanning, and analysis of storm environments and anvil clouds. This talk will provide an overview of the INCUS mission architecture, time-differencing retrieval approach, and early research results supporting the INCUS science goals related to this session on atmospheric convection.

How to cite: Rasmussen, K., van den Heever, S., Posselt, D., Tanelli, S., Kollias, P., Partain, P., and Stephens, G. and the INCUS Science Team: The INCUS Mission: Measuring Convective Mass Flux from Space, EGU General Assembly 2026, Vienna, Austria, 3–8 May 2026, EGU26-15871, https://doi.org/10.5194/egusphere-egu26-15871, 2026.

EGU26-15963 | ECS | Posters on site | AS1.6

Sensitivity of Deep Convective Updraft Magnitudes to Horizontal Grid Spacing: From Kilometer Scales to LES Scales 

Peter Marinescu, Gabrielle Leung, Itinderjot Singh, Jennie Bukowski, Leah Grant, Rachel Storer, Kristen Rasmussen, and Susan van den Heever

Convective cloud updrafts flux mass vertically throughout the atmosphere and have significant impacts on many atmospheric phenomena, including precipitation production, tropospheric and stratospheric composition, and regional and global circulations. As such, it is important to understand the processes that govern convective cloud updrafts and the scales at which they operate. As part of the NASA Investigation of Convective Updrafts (INCUS) mission, over 60 large-domain, high-resolution simulations have been conducted for convective cloud cases using the Regional Atmospheric Modeling System (2-moment RAMS microphysics) and Weather Research and Forecasting model (2-moment Morrison and Thompson microphysics) in support of the development of the INCUS algorithm and scientific approach. The cases span a wide range of convective storm morphologies from isolated deep convective clouds to mesoscale convective systems and tropical cyclones. The simulations utilize three one-way nested domains with horizontal grid spacings of 1.6 km, 400 m, and 100 m, respectively.  

Using the INCUS simulation database, we address the following questions: how much do updraft magnitudes vary as a function of horizontal grid spacing and why? To address these questions, we quantify the differences in vertical velocity between our simulations with 1.6 km, 400 m, and 100 m grid spacing. Initial results show that vertical velocities tend to be stronger below ~ 5 km AGL and weaker above ~5 km AGL, as grid spacing decreases, and that these results are consistent for all three modeling frameworks. We further decompose updrafts into the components of the vertical velocity tendency equation to understand the processes driving vertical velocity differences as a function of grid spacing. With the breadth of the INCUS simulation database, we further quantify how the vertical velocity grid spacing dependency varies as a function of convective system type (e.g. updrafts within scattered convective clouds versus more organized convective systems). This research provides important insights into systematic biases in the representation of deep convective clouds that arise from model horizontal grid spacing and implications for global kilometer-scale modeling. 

How to cite: Marinescu, P., Leung, G., Singh, I., Bukowski, J., Grant, L., Storer, R., Rasmussen, K., and van den Heever, S.: Sensitivity of Deep Convective Updraft Magnitudes to Horizontal Grid Spacing: From Kilometer Scales to LES Scales, EGU General Assembly 2026, Vienna, Austria, 3–8 May 2026, EGU26-15963, https://doi.org/10.5194/egusphere-egu26-15963, 2026.

EGU26-16107 | ECS | Posters on site | AS1.6

Representing the oscillatory changes in cloud field properties as a function of cloud size distribution 

Gunho Loren Oh and Philip H. Austin

Marine boundary-layer clouds have been observed to evolve periodically; the cloud field can go through a phase where large, precipitating clouds dominate, followed by a phase where the cloud formation is suppressed by evaporative cooling. We examine the organization and evolution of the marine boundary-layer cloud field, modelled by a high-resolution, large-eddy simulation of a turbulent atmosphere.

Individual cloud regions are isolated and probability distributions of individual cloud properties are used to examine the efficacy of cloud size distribution to represent the strength of convective activities across the observed cloud field. Probabilistic statistical methods based on Bayesian inference are employed to study how the time-series of cloud field properties, such as the cloud size distribution, are correlated to a number of cloud properties, such as individual cloud mass flux. We show that these properties, especially individual cloud mass flux and precipitation, are strongly correlated with the oscillatory changes in the cloud size distribution. The correlations between the distribution of cloud sizes and the strength of turbulent mixing, expressed in terms of direct entrainment and dilution rates, are also examined. These findings have implications for a better representation of convective dynamics in numerical modelling of the atmosphere and a better interpretation of observational data from satellite and in-situ measurements.

How to cite: Oh, G. L. and Austin, P. H.: Representing the oscillatory changes in cloud field properties as a function of cloud size distribution, EGU General Assembly 2026, Vienna, Austria, 3–8 May 2026, EGU26-16107, https://doi.org/10.5194/egusphere-egu26-16107, 2026.

EGU26-16301 | ECS | Posters on site | AS1.6

How Well Do Current Global KM-Scale Models Simulate Storms in East Asia’s 2020 Record-breaking Wet Summer 

Puxi Li, Haoming Chen, Jian Li, Andreas Prein, and Yuanchun Zhang

High-performance computing now enables a new generation of global kilometer-scale models. As part of the World Climate Research Programme (WCRP) Global Hackathon 2025 initiative, for the first time, multiple cutting-edge global kilometer-scale models have been run for an entire year. All of them have covered the summer of 2020, when East Asia experienced record-breaking precipitation and catastrophic floods, mainly driven by mesoscale convective systems (MCSs). Using an updated storm-tracking algorithm, this study investigated the performance of six global kilometer-scale models in simulating MCS characteristics during the record-breaking wet summer of 2020 in East Asia. Results revealed that all models generally reproduced MCS characteristics, including MCS size, duration, and key features of convection and precipitation. Models also generally captured finer characteristics such as diurnal variations and the frequency-intensity distribution of hourly precipitation. Among the models, Integrated Forecast System (IFS) performs best in capturing MCS rainfall spatial distribution, Nonhydrostatic ICosahedral Atmospheric Model (NICAM) excels in simulating MCS size, and Simple Cloud-Resolving E3SM Atmosphere Model (SCREAM) most accurately represents the land-sea contrast in MCS precipitation intensity. A common bias across models is the underestimation of rainfall area and overestimation of heavy precipitation intensity, indicating simulated convective cores are stronger than observed. Our results demonstrate that global kilometer‑scale modeling has reached a significant benchmark, yet persistent biases remain in MCS simulation. Continued improvements in these models will not only enhance the reliability of modeling but also to improve disaster risk reduction and climate change adaptation.

How to cite: Li, P., Chen, H., Li, J., Prein, A., and Zhang, Y.: How Well Do Current Global KM-Scale Models Simulate Storms in East Asia’s 2020 Record-breaking Wet Summer, EGU General Assembly 2026, Vienna, Austria, 3–8 May 2026, EGU26-16301, https://doi.org/10.5194/egusphere-egu26-16301, 2026.

EGU26-17091 | Orals | AS1.6

Physical mechanisms of deep convective system maximum area in a hierarchy of datasets 

Andrea Polesello, Alejandro Casallas, Caroline Muller, Remy Roca, and Francesco Locatello

Deep convective systems (DCSs) play a crucial role in the tropical hydrological cycle and radiative budget [1,2]. In particular, the largest and longest-lived of those cloud systems contribute to a high fraction of the extreme precipitation in the Tropics [3] Therefore understanding what drives these types of systems is crucial.
To that end, Abramian et al. 2025 [4]  developed a new method to predict the maximum area of DCSs using the DYAMOND-Summer simulation with the cloud-resolving global model SAM, and the TOOCAN algorithm to track cloud systems [5]. The method uses simple machine learning models, trained on information on the early stage of the systems and their surrounding environment, including dynamical and thermodynamical variables, morphological features of the systems and the characteristics of their neighbors.
We investigated whether this method would work in observations too, using DCS tracks identified by TOOCAN in satellite data [6], combined with ERA5 data for the physical variables. For both observations and DYAMOND we used both a Lasso linear regression and two different deep neural networks.
Furthermore we aimed at understanding which physical variables constrain the most the maximum area of the systems, and to that end we used an explainable AI method, the integrated gradients ([7]) to assess which physical variables contributed the most to the model prediction.
Firstly, we managed to achieve good predictivity scores for both the non-linear models and both the datasets and we obtained quite robust results in terms of feature importance, with the pre-storm environmental CAPE and deep shear playing a pivotal positive role to achieve a large maximum area, while the presence of neighboring systems was one of the main negative contributors.
Finally, we tested the ML results by looking at composites of the most important variables in the observational dataset: for example pre-storm CAPE composite showed significantly higher than average values for the largest systems. 


[1] Nesbitt, S. W., R. Cifelli, and S. A. Rutledge, 2006: Storm Morphology and Rainfall Characteristics of TRMM Precipitation Features. 
[2] Bony, S., Semie, A., Kramer, R. J., Soden, B., Tompkins, A. M., & Emanuel, K. A. (2020). Observed modulation of the tropical radiation budget by deep convective organization and lower-tropospheric stability. 
[3] Remy Roca and Thomas Fiolleau. Extreme precipitation in the tropics is closely associated with
long-lived convective systems.
[4] S. Abramian, C. Muller, C. Risi, et al. How key features of early development shape deep
convective systems.
[5] Thomas Fiolleau and Remy Roca. An algorithm for the detection and tracking of tropical
mesoscale convective systems using infrared images from geostationary satellite. 
[6] T. Fiolleau and R. Roca. A database of deep convective systems derived from the intercalibrated
meteorological geostationary satellite fleet and the toocan algorithm (2012–2020). 
[7] Mukund Sundararajan, Ankur Taly, and Qiqi Yan. 2017. Axiomatic attribution for deep networks. 


How to cite: Polesello, A., Casallas, A., Muller, C., Roca, R., and Locatello, F.: Physical mechanisms of deep convective system maximum area in a hierarchy of datasets, EGU General Assembly 2026, Vienna, Austria, 3–8 May 2026, EGU26-17091, https://doi.org/10.5194/egusphere-egu26-17091, 2026.

EGU26-17407 | Orals | AS1.6

Convectively Coupled Equatorial Waves in ICON 

Sebastián Ortega, Hans Segura, Victor Mayta, Romain Fiévet, Angel Peinado, Junhong Lee, Marco Giorgetta, and Bjorn Stevens

We show how in the Sapphire configuration of the Icosahedral Non-hydrostatic Model (ICON) the representation of Convectively Coupled Equatorial Waves (CCEWs) is sensitive to the fall speeds of rain and ice, and how reducing these fall speeds can lead to a better representation of CCEWs in ICON. In particular, reductions in the fall speeds of rain and ice lead to more active convectively coupled Kelvin, Inertio-Gravity, and Mixed Rossby-gravity waves and, at the same time, less active convectively coupled Equatorial Rossby waves and Tropical Depressions.

We then explore how changes in these fall speeds upscale from the kilometer scales to the synoptic and planetary scales of CCEW, finding that this up-scaling is mediated by the frequency of occurrence of shallow, stratiform, and deep convection. Reducing the fall speed of rain and ice leads to increases in the frequency of occurrence of, respectively, shallow and stratiform convection profiles and, at the same time, leads to decreases in the frequency of occurrence of deep convection profiles. We argue that changes in these profiles are reflected in the ability of the model to develop the tilt and top-heaviness of CCEWs, which ultimately leads to their better representation.

Our findings suggest a physical representation of CCEWs within ICON and provide further support for the classification of CCEWs into two distinct categories, a gravity wave group and a moisture mode group, each associated with distinct convective profiles and with distinct propagation mechanisms.

How to cite: Ortega, S., Segura, H., Mayta, V., Fiévet, R., Peinado, A., Lee, J., Giorgetta, M., and Stevens, B.: Convectively Coupled Equatorial Waves in ICON, EGU General Assembly 2026, Vienna, Austria, 3–8 May 2026, EGU26-17407, https://doi.org/10.5194/egusphere-egu26-17407, 2026.

EGU26-17828 | ECS | Orals | AS1.6

Testing the clear-sky convergence mechanism for congestus cloud formation using ORCESTRA data 

Helene M. Gloeckner, Hauke Schmidt, and Bjorn Stevens

Elevated moist layers and mid-level clouds around the triple point temperature lead to enhanced radiative cooling at their upper boundaries. This cooling propagates to surrounding areas and creates stable layers that act as buoyancy barriers for neighboring convection and thereby promote the accumulation of water vapor and clouds. Different theories for congestus cloud formation imply different entry points into this feedback loop. 

Here, we test the clear-sky convergence (CSC) mechanism -- which predicts a natural maximum horizontal CSC near the triple point caused by the structure of radiative cooling that is determined by the optical properties of water vapor -- using dropsonde measurements from the ORCESTRA field campaign in the Tropical Atlantic. We find that the vertical profile of CSC aligns well with the height of mid-level clouds in the ORCESTRA-East domain, but not in the West. The good agreement in the East is mostly caused by contributions from the stability structure and not from gradients in the radiative cooling. 

Additionally, we show using idealized experiments that for a moist adiabatic temperature structure a W-shaped relative humidity is necessary to achieve a positive CSC above the freezing level. This effect is caused by longwave radiative cooling and partly counteracted by shortwave radiative heating. Overall, we conclude that the cooling rate contribution to the CSC mechanism is not enough to trigger a congestus circulation, but can contribute to its maintenance in clear-sky regions with elevated moist layers.

How to cite: Gloeckner, H. M., Schmidt, H., and Stevens, B.: Testing the clear-sky convergence mechanism for congestus cloud formation using ORCESTRA data, EGU General Assembly 2026, Vienna, Austria, 3–8 May 2026, EGU26-17828, https://doi.org/10.5194/egusphere-egu26-17828, 2026.

EGU26-19821 | Posters on site | AS1.6

A mechanical energy perspective on the lifecycle of heavy rain-producing storm systems 

Maximilien Bolot, Benjamin Fildier, Rémy Roca, Olivier Pauluis, Thomas Fiolleau, and Caroline Muller

Extreme precipitations from convective storms produce significant harm to society and are expected to become more intense under global warming. Here we examine which storms are conducive to extreme precipitations from the perspective of the mechanical energy expended to build up such storms. Indeed, studies have indicated that about 70% of the mechanical energy of convection is used to lift water, leaving only 30% available for kinetic energy production and the maintenance of convective motions. Here we show that this partitioning holds at the scale of individual storm systems, meaning that the weight of water must have a dramatic impact on storm energy. In particular, storms must build up significant mass by performing significant work against gravity before they can produce the most extreme precipitations. The situation is complicated by the strong diversity across storm systems, characterized by varying durations and varying stages within the lifecycle of those storms. We use kilometer-scale simulations in radiative-convective equilibrium and a convective tracking algorithm to study the mechanical energy budget of storms associated to extreme percentiles of the precipitation distribution. We find that a dominant driver of the storm's ability to produce extreme precipitation is the time span during which the work done to lift water exceeds the dissipation of potential energy through precipitation, thus leading to mass build up inside the storm. Systems generating exceedances of the 99.999th precipitation percentile can accumulate mass during 4-6 hours while more typical precipitating systems only do so over 1-2 hours. Irrespective of storm duration, we find that the fraction of mechanical energy dissipated against gravity stays roughly constant at ~70% throughout the storm lifecycle, creating a drag that must be overcome to produce precipitation extremes. These results improve prospects for more accurate predictions of precipitation extremes from observations.

How to cite: Bolot, M., Fildier, B., Roca, R., Pauluis, O., Fiolleau, T., and Muller, C.: A mechanical energy perspective on the lifecycle of heavy rain-producing storm systems, EGU General Assembly 2026, Vienna, Austria, 3–8 May 2026, EGU26-19821, https://doi.org/10.5194/egusphere-egu26-19821, 2026.

EGU26-20068 | ECS | Posters on site | AS1.6

Exploring the hysteresis of tropical diurnal self-aggregation under realistic wind shear conditions 

Lotta Bergfeld and Jan O. Haerter

Convective self-aggregation (CSA) is when tropical deep convection self-organizes in radiative-convective equilibrium (RCE) simulations whereby the moisture field spontaneously separates into strongly convecting and dry, subsiding, subregions.   Departing from the classical, constant sea surface temperature, RCE setup, a recent study found that including a diurnal cycle to mimic surface temperature variations between night and day over tropical land, e.g. the Sahel region, enables the onset of CSA. In contrast, corresponding simulations with constant surface temperature, which might emulate the atmosphere over the ocean, showed no strong aggregation (Kruse et al., 2025, Jensen et al., 2022, Haerter et al., 2020). Furthermore, once formed, the “diurnal self-aggregation” remained in place, when surface temperature was then set constant, suggesting a hysteresis effect. 

We here explore how this diurnal effect is modified by wind shear - a crucial ingredient for realistic Sahelian conditions. We conduct idealized cloud resolving simulations of the tropical atmosphere using the System for Atmospheric Modeling (SAM), version 6.11 (Khairoutdinov and Randall, 2003). The simplified boundary conditions include an irrotational RCE atmosphere with doubly periodic lateral boundaries. We mimic conditions over (i) land by prescribing diurnal sinusoidal surface temperature oscillations and (ii) over the ocean by prescribing a constant sea surface temperature. To mimic wind shear we nudge towards  a  prescribed wind profile which is based on ERA5 data from tropical northern Africa. 

In simulation runs (Kruse, 2024), we observe that the level of aggregation and other variables oscillate over time. With our simulations we investigate how these frequencies relate to the chosen domain. Additionally, we explore whether not only the simulations with a diurnal cycle but also simulations with realistic wind shear and a constant sea surface temperature show CSA after multiple weeks. Our analysis has relevance for the understanding of convective clustering over tropical land and the persistence of such clusters when advected over the tropical ocean - thus harboring conclusions for tropical cyclogenesis. 

Haerter, Jan O., Bettina Meyer, and Silas Boye Nissen. "Diurnal self-aggregation." NPJ Climate and Atmospheric Science 3.1 (2020): 30.

Jensen, Gorm G., Romain Fiévet, and Jan O. Haerter. "The diurnal path to persistent convective self‐aggregation." Journal of Advances in Modeling Earth Systems 14.5 (2022): e2021MS002923.

Khairoutdinov, Marat F., and David A. Randall. “Cloud Resolving Modeling of the ARM Summer 1997 IOP: Model Formulation, Results, Uncertainties, and Sensitivities.” Journal of the Atmospheric Sciences 60, no. 4 (2003): 607–25. 

Kruse, Irene L. “Chasing the Storms. A Simulation and Observation-Based Exploration of  Mesoscale Convective Systems and Cold Pools, from the Midlatitudes to the Tropics.” PhD Thesis, University of Copenhagen, 2024.

Kruse, Irene L., Romain Fiévet, and Jan O. Haerter. "Tipping to an aggregated state by mesoscale convective systems." Journal of Advances in Modeling Earth Systems 17.3 (2025): e2024MS004369.

How to cite: Bergfeld, L. and Haerter, J. O.: Exploring the hysteresis of tropical diurnal self-aggregation under realistic wind shear conditions, EGU General Assembly 2026, Vienna, Austria, 3–8 May 2026, EGU26-20068, https://doi.org/10.5194/egusphere-egu26-20068, 2026.

Global storm-resolving simulations at kilometer scales (1–5 km) provide new opportunities to represent convective processes, yet they remain in the gray zone of deep convection, where cumulus parameterization choices can strongly affect model performance. Using global kilometer-scale simulations from the Digital Earth Global Hackathon 2025, this study applies a new vortex–mesoscale convective system (MCS) tracking and matching algorithm to examine how two convection parameterization configurations—turning off deep convection (IFS-deepoff) and deep convection with reduced cloud-base mass flux (IFS-rcbmf)—influence the simulation of MCSs, vortices, and precipitation during the 2020 Meiyu season over East Asia. Results show that IFS-deepoff outperforms IFS-rcbmf in reproducing the total amount and spatial distribution of precipitation, although both schemes overestimate MCS frequency and their contribution to rainfall over the Sichuan Basin and the middle–lower Yangtze River. Importantly, precipitation biases are not governed by MCS frequency alone, but depend strongly on the coupling between MCSs and vortices. Precipitation in both schemes is highly sensitive to vortex simulation, with IFS-deepoff producing stronger extremes due to enhanced moisture convergence associated with boundary-layer vortices and increased convective available potential energy (CAPE). These findings highlight vortex–MCS coupling as a critical control on precipitation in the kilometer-scale gray zone, demonstrating that convection parameterization influences rainfall primarily through its modulation of multiscale dynamical interactions. This study provides new insight for improving convection treatment in next-generation global storm-resolving models.

How to cite: Xi, X., Zhang, Y., and Sun, J.: Vortex–MCS–Precipitation Linkages: Sensitivity to Cumulus Convection Parameterization in Global Kilometer-Scale Models during China’s Meiyu Season, EGU General Assembly 2026, Vienna, Austria, 3–8 May 2026, EGU26-20742, https://doi.org/10.5194/egusphere-egu26-20742, 2026.

EGU26-20769 | Orals | AS1.6

The Congo basin as an outlier in the tropical upward mass transport 

Georges-Noel Longandjo

The Congo Basin is one of the world’s three major tropical convective hotspots, yet it receives substantially less rainfall than the Amazon and the Maritime Continent, despite exhibiting the highest lightning activity globally. This paradox points to fundamental differences in convective structure and rainfall efficiency. Here, we investigate the vertical structure of convection over Central Africa using upward mass transport as a proxy, and examine its relationship with precipitable water and moist static energy (MSE). We show that during the rainy season, convection over the Congo Basin is characterized by a bottom-heavy vertical mass flux profile, accompanied by strong moisture advection in the lower to mid-troposphere. This structure contrasts sharply with the deeper, more top-heavy convective profiles observed over the Amazon and the Maritime Continent, indicating a predominance of relatively shallow convective systems.

Analysis of the MSE distribution reveals high values near the surface, reflecting substantial energy available for convective initiation, while lower MSE aloft is consistent with latent heat release and buoyancy generation within ascending parcels. Together, these results suggest that although the thermodynamic environment over the Congo Basin is highly favorable for triggering convection, the vertical redistribution of mass and energy acts to constrain convective depth and suppress rainfall efficiency. These processes are poorly represented, or entirely missing, in historical CMIP6 Earth system models. Our findings therefore highlight a distinct convective regime over the Congo Basin, with important implications for understanding tropical precipitation and for improving its representation in climate models.

How to cite: Longandjo, G.-N.: The Congo basin as an outlier in the tropical upward mass transport, EGU General Assembly 2026, Vienna, Austria, 3–8 May 2026, EGU26-20769, https://doi.org/10.5194/egusphere-egu26-20769, 2026.

Convective systems exhibit a wide range of cloud and precipitation structures spanning spatial scales from a few kilometres to thousands of kilometres. While the organization of convection at the meso-alpha scale (200–2000 km) is relatively well-researched through observations and numerical modelling, much less is known about how convection organizes at smaller scales, down to a few kilometres, that are now accessible to kilometre-scale, storm-resolving models.

To address this, we investigate the spatial organization of extreme precipitation in simulations of the storm-resolving model, ICON, coupled to the prognostic aerosol module, HAM-lite. Using month- long, kilometre-scale limited-area simulations over the Atlantic Intertropical Convergence Zone, conducted for the ORCESTRA measurement campaign period [1], we find that 99th-percentile precipitation extremes over the ocean exhibit robust scale-invariant organization across spatial scales from approximately 10 to 150 km, characterised by a fractal dimension of approximately 4/3.

While individual convective updrafts are associated with strong surface convergence, their organisation at these scales is significantly influenced by cold pools which generate intense surface wind divergence. Consistent with this mechanism, grid points with large absolute values of surface wind divergence form spatial clusters that statistically resemble those of extreme precipitation. They tend to predominantly affect the intermittency of surface wind fluctuations, in a manner analogous to shocks in compressible turbulence. Building upon this analogy, we demonstrate that the surface wind fluctuations indeed exhibit a nearly-bifractal scaling — consistent with certain models of compressible turbulence [2] — and the scaling exponents of higher-order surface wind velocity structure functions appear to approach the co-dimension of the fractal set defined by the extreme precipitation events.

This establishes a direct quantitative link between the spatial organization of precipitation extremes and surface wind fluctuations at sub–meso-alpha scales, highlighting implications for the development of simple yet physically grounded stochastic parameterizations of the latter in coarse- resolution GCMs. Furthermore, we assess the robustness of such organization to various climate- change and air pollution scenarios via perturbations to the prescribed sea-surface temperatures and aerosol emissions, respectively.


References:

[1] https://orcestra-campaign.org/intro.html

[2] Mitra et al, Physical Review Letters 94, 194501 (2005).

How to cite: De, S. and Stier, P.: Linking the organization of precipitation extremes at sub-meso-alpha scales to surface wind fluctuations in a storm-resolving GCM , EGU General Assembly 2026, Vienna, Austria, 3–8 May 2026, EGU26-21026, https://doi.org/10.5194/egusphere-egu26-21026, 2026.

EGU26-21234 | ECS | Orals | AS1.6

Convective controls on anvil area and thickness in analytical and km-scale models 

Mathilde Ritman, William Jones, Philip Stier, Fabian Senf, and Susan van den Heever

The top-of-atmosphere radiative effect of tropical anvil clouds varies with cloud opacity, and can range from substantially negative to largely positive. Recent climate model assessments have found a decrease in the proportion of thick, or opaque, anvil cloud with warming, resulting in a positive climate feedback. However, the mechanism for this change remains obscure.

Lifecycle analysis of deep convective clouds tracked using tobac in the convection-permitting global ICOsahedral Non-hydrostatic model (ICON) shows how anvil area and opacity respond to convection. We find that both properties increase in response to increased convective intensity and convective area, but that their sensitivity to each is not equal. To interpret these results, we independently develop a simple analytical model that links anvil expansion and opacity to convective mass flux (CMF). The model predicts that higher CMF leads to greater anvil expansion, increasing the area of thick anvil cloud. But when anvil opacity also depends on convective intensity, we find a strong, non-linear increase in thick anvil amount in response to increasing CMF, consistent with the response observed in ICON. This implies a strong sensitivity of thick anvil amount to changes in the upper tail of the distribution of CMF and illustrates a possible mechanism by which changes in the distribution of cloud CMF could drive anvil thinning in a warming climate.

How to cite: Ritman, M., Jones, W., Stier, P., Senf, F., and van den Heever, S.: Convective controls on anvil area and thickness in analytical and km-scale models, EGU General Assembly 2026, Vienna, Austria, 3–8 May 2026, EGU26-21234, https://doi.org/10.5194/egusphere-egu26-21234, 2026.

EGU26-21637 | ECS | Orals | AS1.6

Convective Organization through Gravity Waves from a Conceptual Model 

Ashly Wilson and Jan Haerter

Convective Organization through Gravity Waves from a Conceptual Model

Ashly Wilson and Jan O. Haerter

Department of Physics and Astronomy, University of Potsdam, Karl-Liebknecht Str. 24/25,

14476 Potsdam, Germany

Correspondence: Ashly Wilson (ashly.wilson@uni-potsdam.de)

Organized convection plays a crucial role in driving extreme weather events, such as

Thunderstorm clusters and tropical cyclones have far-reaching implications for human lives and

infrastructure. It is known that the global tropical circulation is mainly thermally driven (Lau

& Lim, 1982) and that diabatic heating over Earth’s continents plays a key role in

causing Walker and Hadley type circulations. It has long been postulated that tropical deep convection

might couple to different geophysical flows. In a 2D conceptual model, we here propose a two-way interaction where gravity waves can trigger new convection, whereas convection also releases gravity waves.

In our model, a convective ”kick” (in the form of momentum ) (Bretherton and Piotr Smolarkiewicz

1988) initiates gravity waves, which subsequently interact with one another by linear superposition. When a critical amplitude is exceeded, a new convective “kick” results. The physical motivation of the aforementioned convective “kick” is localized heating from convergence in the planetary boundary layer resulting from the interaction between gravity waves, which can act as a source of convection. This enhanced convection, in turn, generates new oscillations within the otherwise stratified troposphere, perpetuating the feedback cycle. The interplay of these processes is proposed as a mechanism of self-organization of convection. Boussinesq equations in the absence of the Earth’s rotation are used. Convection is modeled as a triggered function (Dirac Delta) (Da Yang, 2021).

By extending these concepts, our model provides a simplified yet insightful framework

to explore the dynamics of convective aggregation. Preliminary results suggest that the nonlinear feedback proposed can give rise to a fully-clustered convective system, similar to that seen in convective self-aggregation. Our approach opens avenues for future investigations into the role of gravity waves in

modulating large-scale atmospheric patterns and extreme weather phenomena.

​Keywords: Convective Organization, Convectively Coupled Gravity Waves, Triggered

Convection

​Abstract for oral session

How to cite: Wilson, A. and Haerter, J.: Convective Organization through Gravity Waves from a Conceptual Model, EGU General Assembly 2026, Vienna, Austria, 3–8 May 2026, EGU26-21637, https://doi.org/10.5194/egusphere-egu26-21637, 2026.

EGU26-21927 | ECS | Orals | AS1.6

Does the aggregation of tropical deep convection cause a negative cloud feedback in global storm resolving models?  

Emilie Fons, Cathy Hohenegger, and Sandrine Bony

Global circulation models (GCMs) are too coarse to resolve tropical deep convection and convective aggregation, i.e., the clustering of deep convective cells that leads to the formation of mesoscale convective systems. The need for convective parameterizations leads to high inter-model variability in how convective aggregation responds to surface warming, participating in the uncertainty surrounding cloud feedbacks. Realistic kilometer-scale simulations with Global Storm Resolving Models (GSRMs) have recently been run without the need for convective parameterizations under climate change scenarios. We analyze such simulations from the ICON and IFS models and compare them to observations to evaluate whether tropical convective aggregation changes in a warming world. Using the Iorg aggregation metric, we show that simulated tropical convective aggregation becomes increasingly realistic with enhanced horizontal resolution, and that tropical deep convection becomes more aggregated with surface temperatures under uniform warming and under interannual temperature increases. Because convective aggregation helps to cool down the atmosphere through enhanced clear-sky longwave cooling, this could imply that convective aggregation causes a negative climate feedback.  However, long-term climate trends of Iorg are less unequivocal, in both observations and models, and results are very sensitive to the method for Iorg computation. This suggests that process-level studies are needed to better understand what drives convective aggregation in the Tropics.

How to cite: Fons, E., Hohenegger, C., and Bony, S.: Does the aggregation of tropical deep convection cause a negative cloud feedback in global storm resolving models? , EGU General Assembly 2026, Vienna, Austria, 3–8 May 2026, EGU26-21927, https://doi.org/10.5194/egusphere-egu26-21927, 2026.

EGU26-22123 | ECS | Posters on site | AS1.6

A Model for Cumulus Cloud Tilt and the Effect of Vertical Shear 

Dario Falcone, Matthew Igel, and Joseph Biello

Developing a tractable understanding of the interaction between cumulus cloud tilt and vertical shear, both due to synoptic background winds and neighboring cumulus clouds in a cloud field, is crucial to expanding the theory associated with squall line development and tradewind cumuli climatological feedbacks.  Although these interactions are multifaceted, we focus on the dynamic interplay between vertical shear and the cloud-scale flow. To perform this investigation, we implement the Kinematic Representation of Neutrally-buoyant Updraft Tori (KRoNUT) model to represent cloud-scale motions. Unlike previous formulations of the KRoNUT model, we introduce a new tilting parameters into the functional form of the flow. Using a moment closure technique, we then solve for the Dynamics of Neutrally-buoyant Updraft Tori (DoNUT) equations, a coupled non-linear system of ordinary differential equations which govern the temporal evolution of the parameters describing the intensity and geometry of a cloud-scale flow. Using this technique, we analytically and numerically compare the DoNUT equations with and without tilt to determine how the tilting associated with various forms of vertical shear influences the life cycle of a cumulus cloud. When considering the processes of turbulent diffusion and self-advection, we find that tilting alters the nature of a cloud’s steady state circulation. In turn, clouds have the potential to evolve to larger horizontal extents. However, we also find that tilting contributes strongly to enervation and thus the weakening of a cloud’s maximum vertical velocity and a shortening of its life cycle. These impacts are maximized at tilting angles of plus or minus 45 degrees from the vertical axis. 

How to cite: Falcone, D., Igel, M., and Biello, J.: A Model for Cumulus Cloud Tilt and the Effect of Vertical Shear, EGU General Assembly 2026, Vienna, Austria, 3–8 May 2026, EGU26-22123, https://doi.org/10.5194/egusphere-egu26-22123, 2026.

EGU26-234 | Orals | AS1.7

Impact of Desert Wind Farms on Convection Initiation  

Zhiyong Meng, Quxin Cui, Chenggang Wang, Hongjun Liu, Zimeng Zheng, and Xuelei Wang

The global expansion of green renewable energy in recent decades has led to a substantial increase in the number of wind farms. While the long-term impacts of wind farms on the atmosphere have been the subject of some research, their short-term effects on weather phenomena, such as convection initiation (CI), remain insufficiently understood. This study addresses this gap by exploring the influence of wind farms on CI, contributing to a broader understanding of anthropogenic impacts on natural atmospheric processes. We explored the general features of CI events from June−August during 2021–2023 associated with desert wind farms in Inner Mongolia, China. A total of 72 CI events were identified with 24% associated with the boundary layer convergence line (BLCL) generated due to desert-oasis vegetation contrast. The impact of the wind farms on the CI process embedded in stratiform cloud on 12 July 2022 from DEsert-oasis COnvergence line and Deep convection Experiment was examined through simulations using Weather Research and Forecasting (WRF) model. Results showed that wind farms can accelerate CI by intensifying the BLCL and shift it southward. It was found that wind farms generated upward-propagating gravity waves, which modulated water vapor transport and led to a reduction in moisture content within the stratiform cloud layer, thereby decreasing cloud coverage and thus increasing solar radiation and surface temperature. The modified surface temperature distribution then shifted the BLCL southward and intensifying it, which eventually accelerated CI.

How to cite: Meng, Z., Cui, Q., Wang, C., Liu, H., Zheng, Z., and Wang, X.: Impact of Desert Wind Farms on Convection Initiation , EGU General Assembly 2026, Vienna, Austria, 3–8 May 2026, EGU26-234, https://doi.org/10.5194/egusphere-egu26-234, 2026.

An EF1 tornado was documented using photographs, a high-resolution video, and a mobile radar as it entered Selden, Kansas, on 24 May 2021. The kinematic structure of the tornadic wind field was presented by tracking lofted debris and analyzing single-Doppler velocities. Tracking of debris on the side of the tornado farthest from the observer was possible due to the transparent nature of the debris cloud. The analysis suggests that the circulation was axisymmetric with the maximum horizontal velocities located at low levels. The positive vertical velocities were strongest on the forward side of the tornado. The maximum vertical velocities were associated with a secondary vortex. For the first time, the dataset provided an opportunity to assess the orientation of a large, lofted debris based on the images recorded by a movie and compare these observations with the differential radar reflectivity (ZDR) recorded by a mobile polarimetric radar. The T-matrix calculations of wood boards yielded a mean ZDR that was negative and was also observed in the ZDR analysis suggesting a preference for lofted debris to be vertically oriented.

How to cite: Wakimoto, R.: Structure of a Tornado Based on an Analysis of Lofted Debris Speeds, Debris Orientation, and Mobile Radar Data, EGU General Assembly 2026, Vienna, Austria, 3–8 May 2026, EGU26-1599, https://doi.org/10.5194/egusphere-egu26-1599, 2026.

EGU26-2119 | Posters on site | AS1.7

The connection between the long-lived initial vortex aloft and the tornado near the surface. 

Ephim Golbraikh and Alexander Elikashvili

One of the important problems in atmospheric physics that has remained unresolved to the present time is the problem of the formation and evolution of tornado-like vortices near the surface.
In the present work, the process of formation and evolution of tornado-like vortices near the surface is investigated as a result of the evolution of a long-lived vortex formed at some altitude under thunderstorm cloud conditions.

A two-dimensional axisymmetric model is considered, in which the initial vorticity is maintained by an external force. The influence of the temperature field on the evolution of vorticity near the surface is examined. It is found that at relatively short times, the behavior of the forming tornado-like vortices near the surface is universal and only weakly dependent on the external force and the temperature field. Nevertheless, with time, their influence becomes significant. It is shown that an anomaly in the vertical temperature distribution leads to the result that a tornado-like vortex formed near the surface can exist for a long time.

How to cite: Golbraikh, E. and Elikashvili, A.: The connection between the long-lived initial vortex aloft and the tornado near the surface., EGU General Assembly 2026, Vienna, Austria, 3–8 May 2026, EGU26-2119, https://doi.org/10.5194/egusphere-egu26-2119, 2026.

Subtropical highs are large-scale dominant weather systems with significant impacts on regional climate and weather patterns. However, their cross-scale influence on mesoscale convective systems (MCSs) remains insufficiently understood. This study investigates how satellite-observed MCS characteristics vary with the western Pacific subtropical high (WPSH) over southeastern mainland China (SEMC), where the WPSH exerts a most frequent influence within the Asian continent. In 7-yr warm seasons, 725 WPSH days were identified and objectively classified into distinct weather types categorized as either WPSH-periphery or WPSH-center patterns, based on SEMC’s location relative to the WPSH. Although MCSs are generally less frequent in the WPSH-center patterns than in the WPSH-periphery ones, their occurrence remains noteworthy near regional hotspots. Across all patterns, MCS occurrence consistently exhibits a diurnal peak in late afternoon and early evening. The WPSH-center patterns show a larger diurnal amplitude with more intensive MCS activity around this peak period. MCSs in the WPSH-center patterns tend to have shorter lifetimes, fewer merging/splitting processes, and a greater tendency to form locally over SEMC in the afternoon. Despite varying movement directions and orientations, MCSs across different patterns generally move along their orientation to facilitate the MCS “training” effect, especially in the WPSH-center patterns due to slower moving speeds and stronger intensities. The analysis on atmospheric conditions suggests that MCS occurrence in the WPSH-periphery patterns is more closely linked to synoptic disturbances, including enhanced moisture transport via low-level jet streams and midlevel upward motion. The convective parameters including convective available potential energy (CAPE), total column water, and K index effectively differentiate MCS-active days from MCS-inactive days for each WPSH pattern.

How to cite: Huang, Y. and Zhang, M.: Satellite-Based Characterization of Warm-Season Mesoscale Convective Systems over Southeastern Mainland China in Response to the Western Pacific Subtropical High, EGU General Assembly 2026, Vienna, Austria, 3–8 May 2026, EGU26-2408, https://doi.org/10.5194/egusphere-egu26-2408, 2026.

EGU26-2415 | Posters on site | AS1.7

Mechanisms and Impacts of South Asian Thunderstorm-Driven Transport on the Atmospheric Composition over the Tibetan Plateau and Stratosphere 

Xueke Wu, Xiaotong Li, Xiushu Qie, Yuhang Hu, and Zihao Zhang

The Qinghai-Tibet Plateau (TP), the world's highest and most complex plateau, serves as a critical gateway for tropospheric substances entering the stratosphere. Northwestern South Asia, particularly the region encompassing the steep terrain of the westernmost indentation between the TP and the Iranian Plateau, is a global hotspot for frequent and energetic convective storms. Therefore, it is vital to investigate how these thunderstorms impact the atmospheric composition over the pristine TP, especially for short-lived species. Using TRMM satellite observations (1998-2013), ERA-5 reanalysis data, and the HYSPLIT trajectory model, this study comprehensively examines the transport mechanisms associated with these storms. Our findings reveal that thunderstorms predominantly occur during the SASM and are concentrated along the southern Himalayan front. By employing the HYSPLIT model to trace transport pathways associated with the thunderstorm, the study demonstrates a clear convergence of pollutants from the South Asia boundary layer into thunderclouds. Furthermore, we identify three principal transport pathways for substances from thunderstorm tops into the TP atmosphere, closely linked to larger-scale circulations: (1) the tropospheric westerlies (~58% of cases), (2) the anticyclonic circulation of the South Asian High (~33%), and (3) tropopause-penetrating processes (~9%). These results clarify the mechanisms—primarily associated with westerlies and the South Asian High—through which intense South Asian thunderstorms influence the TP. The impact of this thunderstorm-driven transport on the TP and the lower stratosphere is projected to intensify with increasing thunderstorm frequency and pollution levels in South Asia under global warming and continued local development.

How to cite: Wu, X., Li, X., Qie, X., Hu, Y., and Zhang, Z.: Mechanisms and Impacts of South Asian Thunderstorm-Driven Transport on the Atmospheric Composition over the Tibetan Plateau and Stratosphere, EGU General Assembly 2026, Vienna, Austria, 3–8 May 2026, EGU26-2415, https://doi.org/10.5194/egusphere-egu26-2415, 2026.

Hail is a leading source of insured losses globally, but the occurrence of damaging hail in tropical regions is subject to large uncertainty. In the tropics globally, satellite-based hail detection often detects the presence of ice aloft, and hail proxies frequently show hail-prone conditions driven by high convective instability. However, high melting rates in these warm regions may modulate the amount of hail reaching the surface, and it is therefore often assumed that satellite-based methods overestimate hail occurrence in the tropics. The extent to which damaging (> 2 cm) hail reaches the surface in these warm regions is not well quantified, owing to a sparsity of observational records in many tropical regions. Here, we used high-resolution numerical weather simulations in an ensemble setup with varying microphysics schemes to examine the plausibility of damaging surface hail occurrence, for satellite-detected hailstorms in Australia's tropics. The simulations explicitly estimated hailstone size at the surface using a column model for hail growth and melt. The results show that a significant subset of the cases could plausibly have produced damaging hail at the surface, with cases with simulated surface hail exhibiting greater mid-to-upper level moisture and higher instability than cases without hail. These results may help improve process understanding for hail in the tropics worldwide.

How to cite: Raupach, T., Bang, S., and Allen, J.: Simulations of satellite-detected hailstorms to examine damaging hail occurrence in Australia's tropics, EGU General Assembly 2026, Vienna, Austria, 3–8 May 2026, EGU26-5998, https://doi.org/10.5194/egusphere-egu26-5998, 2026.

EGU26-10202 | ECS | Orals | AS1.7

Improving the Simulations of Indian Extreme Precipitation Events through a Rotational Mixing Framework in the WRF Model 

Debjit Paul, Sarvesh Dubey, Parthasarathi Mukhopadhyay, and Samson Hagos

Accurate simulation of extreme precipitation remains a major challenge for weather prediction. Even in convection-permitting simulations at kilometer-scale resolution, biases such as underestimation of light rainfall frequency, overestimation of heavy rainfall events, and poor representation of localized convective extremes persist. These deficiencies are partly attributed to under-resolved lateral mixing between intense convective updrafts and their surrounding environment. Recently developed rotational mixing framework [1], which apply rotation to the convective-scale flow to enhance sub-grid-scale lateral mixing without artificially strengthening updrafts or downdrafts showed promising improvement for a month-long simulation. However, its applicability to moisture-rich convective environment of the tropics, particularly for short-duration, high-impact extreme rainfall events, has not yet been assessed. This study evaluates this rotational framework over India during monsoon in convection-permitting 4 km Weather Research and Forecasting (WRF) model simulations for five high-impact extreme rainfall events: Mumbai (July 2019), Kerala (August 2019), Delhi (July 2023), Gujarat (August 2024), and Andhra Pradesh (September 2024). We apply a 10° rotation (ROTMIX10) to the convective-scale flow to enhance sub-grid-scale lateral mixing while preserving the dynamical integrity of convective updrafts and downdrafts. We evaluate the model performance using the GPM precipitation and brightness temperature estimates. For each case, we compare the simulations using the ROTMIX10 framework against a standard CONTROL (no rotation) configuration. Across all cases, ROTMIX10 consistently improves the simulation of extreme precipitation, more accurately capturing rainfall intensities (RMSE reduced from 25.83 to 25.18) and enhancing spatial coherence of convective cores (correlation coefficient increasing from 0.42 to 0.51). Forecast skill also improves substantially, with the probability of detection rising from 0.20 to 0.37. We also find that these extreme events are primarily associated with mesoscale convective systems (MCSs), whose lifetimes, spatial extents, convective intensities, and accumulated rainfalls are more realistically represented in the ROTMIX10 simulations. Analysis of the underlying physical processes reveals that rotational mixing broadens the vertical velocity spectrum and enhances detrainment of moisture and condensate from strong updrafts between 4 and 12 km, moistening the mid-troposphere and increasing condensate loading in downdraft regions. This preconditions the atmosphere for subsequent convection, allowing rainfall to initiate under relatively drier conditions. Additionally, ROTMIX10 mitigates the typical bias of excessively cold cloud tops, yielding brightness temperature and reflectivity distributions closer to satellite observations. Overall, this work provides the first investigation of the performance of the rotational mixing framework for simulating high-impact convective extremes in the tropics. This approach demonstrates that rotational mixing framework enhances the physical realism of convective processes and improves extreme precipitation statistics in convection-permitting models.


[1] Hagos, S., Feng, Z., Varble, A. C., Tai, S. L., & Chen, J. (2025). The impacts of rotational mixing on the precipitation simulated by a convection permitting model. Journal of Advances in Modeling Earth Systems, 17(5), e2024MS004524.

How to cite: Paul, D., Dubey, S., Mukhopadhyay, P., and Hagos, S.: Improving the Simulations of Indian Extreme Precipitation Events through a Rotational Mixing Framework in the WRF Model, EGU General Assembly 2026, Vienna, Austria, 3–8 May 2026, EGU26-10202, https://doi.org/10.5194/egusphere-egu26-10202, 2026.

EGU26-10770 | Orals | AS1.7

Causal Drivers of Continental Mesoscale Convective System Biases in Kilometer-Scale Simulations 

Dié Wang, Andreas Prein, Christian Zeman, and Praveen Pothapakula

Mesoscale convective systems (MCSs) play a central role in regulating the global energy and water cycles through their extensive cloud coverage and the associated redistribution of latent heat. Global convection-permitting models at kilometer scale have made substantial progress in representing several MCS characteristics, including bulk precipitation statistics and anvil extent. However, persistent deficiencies remain in simulating MCS populations in key tropical hotspots. Using four years of global ICON simulations at 2.5 km horizontal resolution, we identify systematic regional biases in MCS occurrence, with overestimated MCS initiation over the Amazon and Congo forest regions. In addition, simulated MCSs generally have less spatial extent than those identified in satellite-based observations.

In this talk, we investigate the physical drivers underlying these biases using causal machine learning approaches to identify environmental factors that control MCS initiation, size, and intensity. Preliminary observational analyses indicate that, over the Amazon basin, mid-level wind shear and column-integrated water vapor exert strong controls on MCS size and total precipitation. We compare these observed causal relationships with those inferred from the ICON simulations to assess whether the same controlling factors operate in the model. Discrepancies in the identified drivers provide insight into the mechanisms responsible for model biases, their impacts on simulated MCS structure and rainfall characteristics, and potential pathways on how to improve the modeling system.

How to cite: Wang, D., Prein, A., Zeman, C., and Pothapakula, P.: Causal Drivers of Continental Mesoscale Convective System Biases in Kilometer-Scale Simulations, EGU General Assembly 2026, Vienna, Austria, 3–8 May 2026, EGU26-10770, https://doi.org/10.5194/egusphere-egu26-10770, 2026.

EGU26-15148 | Posters on site | AS1.7

Mesoscale Convective System Development, Synoptic Drivers, and Forecast Challenges of a Catastrophic Coastal Rainfall Event in West Africa 

Marlon Maranan, Ibrahim Salifou Touré, Andreas H. Fink, Kouakou Kouadio, Fidèle Yoroba, Evelyne Touré, Arsène Kobea, and Arona Diedhiou

On 18–19 June 2018, the metropolitan area of Abidjan in Côte d’Ivoire experienced one of the most extreme daily rainfall events in its observational history with 302 mm within 24 hours. With severe urban flooding, at least 20 fatalities, and substantial economic losses, this event underscore serious knowledge gaps about extreme rainfall processes along the West African coast. In particular, the mechanisms leading to highly localized, sub-daily rainfall extremes in the humid environment of the Guinea Coast region remain insufficiently understood. At the same time, such events are difficult to anticipate with current numerical weather prediction systems which limits the effectiveness of early warning. These challenges motivated a focused process-oriented case study of the extreme June 2018 Abidjan rainfall event.

Leveraging multi-source observational datasets combining unique, largely non-public, sub-daily to daily rain gauge measurements over the District of Abidjan, satellite-based IMERG precipitation and METEOSAT cloud observations, the extremeness of the event and the temporal evolution of the responsible mesoscale convective system (MCS) was investigated. Large-scale and mesoscale environmental conditions, including moisture, flow patterns, and vorticity tendencies, were characterized with the ECMWF’s reanalysis product ERA5. Finally, with the aim of assessing how well a state-of-the-art global prediction system captures the likelihood and timing of an extreme rainfall event over West Africa, forecast performance and practical predictability were evaluated using ensemble predictions from the ECMWF Integrated Forecasting System.

The present analysis reveals several aspects that characterize the June 2018 Abidjan extreme rainfall event.

  • First, rain gauge observations show that the locally recorded total of 302 mm within 24 hours ranks among the most extreme daily rainfall amounts documented along the Ivorian coast while surrounding stations simultaneously experienced widespread totals above 100 mm. This highlights the combined localized and regional nature of the event.
  • Second, satellite-based cloud tracking indicates that the extreme rainfall was associated with a long-lived, westward-propagating MCS, whose convective signatures weakened as it approached Abidjan, but yet continued to produce exceptional rainfall accumulations within a moisture-rich coastal environment.
  • Third, the event was marked by the development of a pronounced moist low-tropospheric vortex over the Abidjan area, accompanied by unusually strong moisture flux convergence and extreme column-integrated water vapor. A vorticity budget analysis suggests that vortex intensification was supported by tilting and the divergence term which underlines the hypothesis of an active MCS-vortex interaction during the extreme event.
  • Finally, evaluating the Extreme Forecast Index, enhanced likelihood of extreme rainfall over Abidjan was only indicated at short lead times where ensemble-based extreme precipitation signals emerging not before 12 hours before onset. This showcases substantial limitations in the current predictability of such events over West Africa.

This study suggests that future work should explore the climatology of such moist vortices, their representation in convection-permitting and global models, and their potential as predictors for extreme West African rainfall in ensemble-based and data-driven forecasting approaches. Advancing these directions holds promise for enhancing early warning capabilities at operational prediction centers and reducing flood risk in rapidly growing coastal cities of West Africa.

How to cite: Maranan, M., Touré, I. S., Fink, A. H., Kouadio, K., Yoroba, F., Touré, E., Kobea, A., and Diedhiou, A.: Mesoscale Convective System Development, Synoptic Drivers, and Forecast Challenges of a Catastrophic Coastal Rainfall Event in West Africa, EGU General Assembly 2026, Vienna, Austria, 3–8 May 2026, EGU26-15148, https://doi.org/10.5194/egusphere-egu26-15148, 2026.

EGU26-15275 | Orals | AS1.7

Convection Initiation over Mountain Slopes in North China: Roles of Upslope Winds and Orographic Waves 

Yu Du, Hongpei Yang, Zijian Chen, and Xiaoyu Gao

Using high-resolution observations, mesoscale simulations, and idealized experiments, this study investigates the mechanisms governing an episode of orographic convection initiation (CI) during the North China Heavy Rainfall Experiment. On 4 August 2024, repeated CI occurred over the eastern slopes of Taihang Mountains in the late afternoon, subsequently enhancing an upstream downhill convective storm. Wind profiler radar data and dense automatic weather stations reveal that CI was supported by strengthening southeasterly upslope winds. These winds primarily resulted from the migration of the mountain-plain solenoid and the mountainward-propagating outflow from a convective cold pool over the plain, with sensitivity experiments showing the latter contributed roughly 22% of the wind strength. The upslope flows gradually transported unstable air from the plain to the slope, fostering CI. Mesoscale simulations further highlight the key role of orographic waves near the mountain ridge, which generated strong downslope winds. The near-surface convergence between downslope and upslope flows, combined with wave-induced divergence aloft, produced deep ascent over the slope. Removing mountain ridges weakened wave strength and reduced downslope wind speeds by ~8 m s⁻¹.Without orographic heating in the idealized simulation (i.e., no mountain-plain solenoid), only strong wave descent occurred below 2 km, inhibiting CI. These findings underscore the critical interplay among plain convection, orographic waves, and the mountain-plain solenoid, offering new insight into the processes controlling orographic CI in North China.

How to cite: Du, Y., Yang, H., Chen, Z., and Gao, X.: Convection Initiation over Mountain Slopes in North China: Roles of Upslope Winds and Orographic Waves, EGU General Assembly 2026, Vienna, Austria, 3–8 May 2026, EGU26-15275, https://doi.org/10.5194/egusphere-egu26-15275, 2026.

EGU26-15603 | Posters on site | AS1.7

A Study on Heavy Rainfall Environments and Radar Echoes in Macau 

Donghai Wang and Qingshen Zeng

Macau, owing to its unique geographical location, experiences complex and highly variable weather conditions and is frequently affected by heavy rainfall during the flood season. To comprehensively investigate the environmental conditions and characteristics of heavy rainfall events in Macau, this study identifies heavy rainfall events occurring from 2014 to 2023 using multi-source observational and reanalysis data and classifies them according to weather patterns, for subsequent environment and radar-echo analysis. The annual, monthly and categorical distributions indicate that heavy rainfall events predominantly occur between May and October. Among the classified types, tropical-cyclone (TC) and warm-sector (WS) events are the most frequent overall. WS, frontal (FT), and low-vortex shear (LS) events occur more frequently during the pre-flood season (May ~ July), whereas TC and southeast wind (SW) events dominate in the post-flood season (August ~ October). Analyses of key environmental parameters reveal that LS and WS events are characterized by stronger thermodynamic instability, whereas SW and TC events generally exhibit more favorable moisture conditions throughout the atmospheric column and in the lower troposphere. Despite similar moisture-rich environments, SW and TC events differ in terms of moisture replenishment capability and near-surface moisture conditions. Radar echoes of each associated with different heavy rainfall types exhibit distinct characteristics in terms of mobility, initiation, centroid height and echo intensity. Statistical results indicate that WS and LS events tend to have lower centroid heights and relatively stronger echo intensities, whereas FT and SW echoes generally exhibit higher centroid heights, with SW echoes being weaker in intensity. In contrast, TC echoes are associated with relatively lower centroid heights, with echo intensity spanning a wide range from strong to weak. Furthermore, dual-polarization parameter analysis further reveals that WS and LS events frequently exhibit a  column on the upstream side and a  column on the downstream side, indicating relatively larger raindrop sizes and higher particle concentrations over Macau. In contrast, TC and SW echoes over Macau are generally characterized by lower  values but higher  values, implying smaller raindrop sizes accompanied by higher particle concentrations.

How to cite: Wang, D. and Zeng, Q.: A Study on Heavy Rainfall Environments and Radar Echoes in Macau, EGU General Assembly 2026, Vienna, Austria, 3–8 May 2026, EGU26-15603, https://doi.org/10.5194/egusphere-egu26-15603, 2026.

 During summer over the Korean Peninsula, a nocturnal low-level jet (LLJ) frequently develops and induces strong low-level convergence, which can initiate elevated convection above the planetary boundary layer and result in localized heavy rainfall. Because near-surface divergence/convergence signals are often weak, such events are difficult to anticipate and may produce intense precipitation over short time scales, leading to substantial societal impacts. In this study, we analyze an LLJ-related heavy rainfall event on 3 August 2022 using the Weather Research and Forecasting (WRF) model, with emphasis on the development mechanisms and simulation characteristics. The thermodynamic environment was evaluated using equivalent potential temperature, the level of free convection (LFC), and the presence of a moist absolutely unstable layer (MAUL). We further examined the roles of topography and model resolution by conducting terrain-sensitivity experiments and by comparing a convection-permitting simulation with a large-eddy simulation (LES). The simulations indicate that, under synoptic conditions characterized by a remnant tropical-depression circulation and inflow along the periphery of a high-pressure system, the LLJ enhanced moisture transport and focused low-level convergence into the central inland region. Diagnostics of the relative configuration between the maximum equivalent potential temperature height and the LFC, together with MAUL identification, support that the event occurred in a standard elevated-convection environment. The sensitivity experiment with reduced terrain height indicates that terrain enhances LLJ-related convergence and associated heavy precipitation, suggesting that the complex topography of the Korean Peninsula plays a critical role in triggering elevated convection. In addition, the high-resolution LES simulation exhibits stronger spatiotemporal variability in buoyancy, convergence, and updrafts, along with clearer organization of precipitation cores, suggesting that high-resolution modeling more effectively represents the rapid evolution and pronounced variability of nocturnal LLJ-induced elevated convection.

How to cite: Kwon, S. and Shin, .: WRF simulations of an elevated convection case caused by low-level jets over the Korean Peninsula in summer, EGU General Assembly 2026, Vienna, Austria, 3–8 May 2026, EGU26-17255, https://doi.org/10.5194/egusphere-egu26-17255, 2026.

EGU26-17462 | ECS | Posters on site | AS1.7

A climatology of intense wind gusts and their atmospheric environments in the Brazilian Amazon 

Vanessa Ferreira, Letı́cia Oliveira dos Santos, Mauricio Ilha de Oliveira, Ernani de Lima Nascimento, and Anja Rammig

The documentation and understanding of storms reaching severe thresholds remain limited in the Amazon. Investigating intense wind gusts and their environments is therefore essential to better understand the drivers and impacts of severe convection that can reshape forest structure, increase tree mortality, and pose risks to ecosystems and communities. This study presents the first multi-decadal (2000-2024) assessment of intense convective wind gusts (≥15 m/s) across the entire Brazilian Amazon, using hourly observations from surface weather stations from the Brazilian National Meteorological Institute (INMET). Intense wind gusts are widespread across the region and are more frequent during the dry-to-wet transition months of September and October, with a peak in the mid- to late afternoon. Wind gusts were accompanied by temperature drops, which were sharper in the dry and transition seasons (reaching −12.6°C), and pressure rises that were similar in magnitude across seasons. The atmospheric environments associated with the intense wind gusts are analyzed using the fifth-generation atmospheric reanalysis (ERA5) from the European Centre for Medium-Range Weather Forecasts (ECMWF). Wind gust environments in the Brazilian Amazon are characterized by low wind shear compared to midlatitude regions. Extreme values of deep-layer shear rarely exceed 10 m/s, with median values near 5 m/s, and show little seasonal variability, remaining weak and similar across all seasons. The results indicate that thermodynamic factors prevail in conditioning the environments that are more favorable for intense gusts observed during the dry and transition seasons, being characterized by higher downdraft convective available potential energy, steeper lapse rates, and higher lifting condensation levels, particularly in the southern Amazon.

How to cite: Ferreira, V., Santos, L. O. D., Oliveira, M. I. D., Nascimento, E. D. L., and Rammig, A.: A climatology of intense wind gusts and their atmospheric environments in the Brazilian Amazon, EGU General Assembly 2026, Vienna, Austria, 3–8 May 2026, EGU26-17462, https://doi.org/10.5194/egusphere-egu26-17462, 2026.

A number of recent catastrophic floods (e.g., Valencia, Spain) were driven by heavy, persistent rainfall from mesoscale convective systems (MCSs), which are major contributors to extreme precipitation in Europe. Understanding how MCS rainfall responds to warming is therefore critical for assessing future flood risk.  Extreme rainfall depends not only on instantaneous intensity but also on the persistence and spatial organization of precipitation. MCSs are typically a blend of intense, localized regions of “convective” precipitation alongside broader, less intense areas of “stratiform” precipitation. While extremes of both components are expected to intensify according to the Clausius-Clapeyron (CC) relationship (Da Silva & Haerter, 2025), flood-relevant rainfall additionally depends on changes in convective cluster size, number, spatial distribution, and system-scale organization.
Here, we use observational data to quantify how MCS properties scale with surface temperature in the present climate over Germany. MCSs are identified and tracked using radar precipitation and lightning observations, and convective rainfall is separated from stratiform rainfall using two independent detection methods. We examine the changes in convective cluster number, size, spatial aggregation, and system-scale characteristics with near-surface temperature.
We find that, with increasing temperature, convective clusters within MCSs become more numerous and larger, while also more spatially dispersed. Convective rainfall, typically concentrated on the southern flank of MCSs, increasingly extends northward under warmer conditions, consistent with enhanced convective instability on the northern side and slightly reduced vertical wind shear. In contrast, total MCS area, propagation speed, and convective persistence show no systematic temperature dependence.
A statistical model reproducing these temperature-dependent changes indicates that CC-driven increases in pointwise convective intensity dominate the scaling of area-averaged rainfall, explaining ~80% of the increase at mesoscale (10–100 km) scales. Increases in convective cluster size and number contribute ~20% each, while enhanced spatial dispersion partially offsets these effects (~20%).
These results constrain current-day temperature-dependent rainfall scaling and may aid the interpretation of projected extreme precipitation changes.

Da Silva, Nicolas A., and Jan O. Haerter. "Super-Clausius–Clapeyron scaling of extreme precipitation explained by shift from stratiform to convective rain type." Nature Geoscience (2025).

How to cite: Da Silva, N. and Haerter, J.: More intense and more dispersed convective cell clusters in European MCSs under higher temperatures, EGU General Assembly 2026, Vienna, Austria, 3–8 May 2026, EGU26-19950, https://doi.org/10.5194/egusphere-egu26-19950, 2026.

EGU26-20771 | ECS | Orals | AS1.7 | Highlight

Supercell thunderstorms in Europe - climatology, morphology and climate change  

Monika Feldmann, Sandro Beer, Michael Blanc, Aaron Zeeb, Killian Brennan, Iris Thurnherr, Lena Wilhelm, Christoph Schär, and Olivia Martius

Supercell thunderstorms are among the most hazardous convective storms in Europe, yet their climatology and environmental conditions are poorly constrained. Using km-scale climate simulations, we present a pan-European supercell climatology for the current climate and assess changes in a +3 °C global warming scenario. Supercells preferentially occur near mountain ranges, with a pronounced maximum over northern Italy and the southern Alps. In the warmer climate, supercell frequency increases by 11% and shifts northeastward and toward higher elevations, while decreases over southwestern Europe are linked to regional drying.

Supercells occur in environments with enhanced instability and deep-layer shear. The storm population splits into 87% right-moving (RM) supercells and 13% left-moving (LM). RMs exhibit more coherent structures and larger high-intensity areas than LMs, while LMs occur in a narrower range of warmer, drier and less stable environments. In the warmer climate, greater instability and increased shear lead to stronger hazards, including hail, lightning and intense precipitation, with hazard and frequency increases being particularly pronounced for LMs.

These results highlight robust changes in European supercell occurrence and associated hazards in a changing climate.

How to cite: Feldmann, M., Beer, S., Blanc, M., Zeeb, A., Brennan, K., Thurnherr, I., Wilhelm, L., Schär, C., and Martius, O.: Supercell thunderstorms in Europe - climatology, morphology and climate change , EGU General Assembly 2026, Vienna, Austria, 3–8 May 2026, EGU26-20771, https://doi.org/10.5194/egusphere-egu26-20771, 2026.

Extending on the complete radiation patterns of the bremsstrahlung process involving bremsstrahlung asymmetry and Doppler shift. The mathematical model is simplified, preserving the forward-backward peaking radiation properties and involved asymmetries to help model the tendency of rotation in the wavefront of the emitted wave. Results show that the curl of the gradient of the radiation intensity is non-zero, and the wavefront of the bremsstrahlung radiation follows a tapered spiral wavefront in 2D and a tapered helical wavefront in 3D. The radius of the backward rotational wavefront was found to decrease as the wave propagates. Spiral geometry has different magnitudes of radius as the wavefront rotates as a result of the involved bremsstrahlung and Doppler asymmetries. This is further supported diagrammatically by applying Huygen's principle on a relativistic radiation pattern. Outcomes describe why the lightning discharges display a partial temporal and spatial coherence, hence why lightning sferics are not known to produce structured wavefronts. Bremsstrahlung emissions start with a backward rotating and irregularly shrinking radius wavefront. Therefore, spatial coherency degrades as their tapered helical structure breaks down due to the irregular shrinkage of radius, leaving the bremsstrahlung radiation with partial temporal coherency. Rotation always starts from the shorter, bremsstrahlung symmetric lobe.

Momentum transfer from particle to rotating wavefront photon, quantized via conservation of momentum,  pf - pi = - ΔPfield , and ΔPfield = (n' - n) k = Δn ℏ k, hence pf = pi - Δn ℏ k  where pi, and pf are initial and final particle momentum. Hence, the relationship between bremsstrahlung asymmetry, R, as a function of the whole-number multiple of the quantum of action "n", R(n), is found. A whole multiple of the quantum of action "n" is tuned, until the correct scale of the graph, for the bremsstrahlung asymmetry quantity, R, matches the classical prediction describing the asymmetry in radiation lobes due to the particle's curved trajectory. This allowed predicting the whole number multiple of the quantum of action "n", which is n ≅ 6.3 × 10¹⁰, following the Bohr correspondence principle. Since tuning is performed with the parameter whole multiple of the quantum of action "n", which only comes with the photon orbital angular momentum, this gives the traits of a rotating wavefront.

Position vector, r, is a function of bremsstrahlung asymmetry, R, which does not include the Doppler shift in its formulation. The results demonstrate the discovery of the Doppler asymmetry within the equation that relates the bremsstrahlung asymmetry, R, to the multiples of the quantum of action, n. This indicates that the two asymmetries are related to each other, which is explained using the idea that once there is an asymmetry about one axis of symmetry of an object, automatically, there are asymmetries about the other remaining axes of symmetry of the same object. Unless the center of what is causing asymmetry does not lie exactly on the symmetry axes (Otherwise, everything would be symmetric again), which is not the case with Bremsstrahlung radiation patterns.  

How to cite: Yucemoz, M.: How and Why Do Lightning Sferics have Unstructured Wavefronts, EGU General Assembly 2026, Vienna, Austria, 3–8 May 2026, EGU26-38, https://doi.org/10.5194/egusphere-egu26-38, 2026.

EGU26-1907 | Posters on site | NH1.11

A 15-year climatology of Potential Gradient at a rural site in Southern Balkans 

Konstantinos Kourtidis, Athanasios Karagioras, and Ioannis Kosmadakis

Potential gradient (PG) is measured continuously at Xanthi, NE Greece, since 2011, along meteorological variables and, in the last years, also particulate matter (PM). We present here a 15-yr climatology of PG at the measurement site. 1-min values up to +/- 34 kV/m were measured. 1-hr and mean daily maximum (minimum) values were 10 kV/m (-12 kV/m) and 6 kV/m (-2 kV/m), respectively. The highest mean values were encountered during the winter months. PG was influenced by the local meteorology, specific humidity having the largest impact on PG values. Additionally, PG was influenced by lightning activity within 50-km from the site, as well as aerosol levels. PG was exhibiting some anticorrelation with PMK2.5, especially during the cloud-free summer months. This probably means that one or more of the following apply for Xanthi: PM has low hygroscopicity, the size of PM is small, the presence of PM is correlated with high ion concentrations, as there is a relatively high radon flux at the site. An increase of 20 μg/m³ in PM2.5 leads to a decrease of 100 V/m in PG. Regarding global events, it was observed that during two Sudden Stratospheric Warming (SSW) events, mean daily values of PG were consistently higher by what would be expected by the influence of local meteorology alone.

How to cite: Kourtidis, K., Karagioras, A., and Kosmadakis, I.: A 15-year climatology of Potential Gradient at a rural site in Southern Balkans, EGU General Assembly 2026, Vienna, Austria, 3–8 May 2026, EGU26-1907, https://doi.org/10.5194/egusphere-egu26-1907, 2026.

EGU26-3745 | ECS | Posters on site | NH1.11

Regime-dependent Impacts of CCN and Cloud Glaciation on Global Lightning Activity  

Deepak Waman, Abdullah Nassar, and Corinna Hoose

Lightning activity is influenced by both aerosols and cloud microphysics, particularly ice formation and charge separation. While aerosols can greatly modify microphysical processes via cloud condensation nuclei (CCN), the global relationship between CCN loading and lightning remains unclear. In this study, we used global lightning stroke density, aerosol, and microphysics data to investigate how CCN can alter lightning through microphysical pathways across different regions. Our preliminary analysis reveals a robust CCN-lightning relationship, with lightning peaks at moderate CCN (400-600 cm-3) and decreases at both lower and higher concentrations. A metric used to quantify the microphysical impact is called ‘glaciation ratio (GR)’, which is defined as the ratio between cloud-ice water path and the total water path. We identify distinct continental (high CCN, high GR) and marine (moderate CCN, moderate GR) regimes. Analysis of glaciation ratio shows synergistic effects: optimal lightning requires both appropriate CCN loading and efficient cloud glaciation. Our findings show that more aerosols do not always mean more lightning. However, the hypothesis proposed is that excess CCN diminishes convection through reduced droplet growth, while low CCN suppresses electrification due to the efficient warm-rain process. Our analysis shows that CCN impacts on the observed lightning activity are regime-dependent, with cloud glaciation playing a central role in determining whether CCN enhances or suppresses electrification.

How to cite: Waman, D., Nassar, A., and Hoose, C.: Regime-dependent Impacts of CCN and Cloud Glaciation on Global Lightning Activity , EGU General Assembly 2026, Vienna, Austria, 3–8 May 2026, EGU26-3745, https://doi.org/10.5194/egusphere-egu26-3745, 2026.

EGU26-3818 | ECS | Posters on site | NH1.11

Investigating the Influence of Blue Corona Discharges on Lower-Stratospheric Ozone Variability 

Kristof Rose, Donghsuai Li, Olivier Chanrion, Torsten Neubert, Martino Marisaldi, Francisco J. Gordillo-Vazquez, and Emmanuel Dekemper

Observations over recent decades show weak, and in some regions non-positive, indications of ozone recovery in the lower stratosphere, in contrast with the clearer recovery observed at higher altitudes. The processes contributing to this behaviour remain insufficiently constrained, particularly where variability is driven by episodic and spatially confined phenomena. Better constraining such processes is essential for a more complete understanding of the ongoing evolution of the ozone layer.

In this context, we investigate the potential influence of thunderstorm-related electrical discharges in the blue spectral range, also known as blue corona discharges, as a source of localized perturbations to lower-stratospheric ozone. These blue events with strong 337 nm emissions, detected by the Atmosphere Space Interactions Monitor (ASIM), are typically associated with vigorous convection and may generate reactive nitrogen and hydrogen species capable of modifying the local chemical environment.

We apply a co-location framework that combines ASIM detections with coincident limb-sounding ozone observations in the vicinity of convective systems exhibiting blue corona discharges. Initial case studies demonstrate the feasibility of this approach and reveal signatures consistent with localized ozone variability in the lower stratosphere.

Although the current number of events coincident with limb-sounding measurements does not yet permit statistically robust attribution, the results motivate the expansion of the event catalogue and the inclusion of additional observational constraints. Taken together, these findings highlight blue corona discharges as a potentially under-characterized process that may contribute to small-scale variability and regionally limited weaknesses in lower-stratospheric ozone recovery.

How to cite: Rose, K., Li, D., Chanrion, O., Neubert, T., Marisaldi, M., Gordillo-Vazquez, F. J., and Dekemper, E.: Investigating the Influence of Blue Corona Discharges on Lower-Stratospheric Ozone Variability, EGU General Assembly 2026, Vienna, Austria, 3–8 May 2026, EGU26-3818, https://doi.org/10.5194/egusphere-egu26-3818, 2026.

EGU26-5136 | ECS | Posters on site | NH1.11

Measuring spontaneous discharges of individual aerosol particles with optical tweezers 

Andrea Stoellner, Isaac Lenton, Caroline Muller, and Scott Waitukaitis

How is lightning triggered on the microscale? Despite decades of research, this question remains unanswered [1]. In our experiment, we use optical tweezers to gain a better understanding of the microscale physics of electric charging and discharging by levitating individual SiO2 particles in the micrometer size range and observing their charging and discharging dynamics over days-to-weeks time periods and with elementary-charge resolution. Our approach allows us to study these processes without losing information to ensemble averages or external interference from other particles or substrates [2]. Using two-photon absorption from the trapping laser [3] we can charge the trapped particle at different rates and to different values, observing every charging and discharging event along the way. This new approach lets us watch, in real time, how a micron-scale airborne particle gains and loses charge, observing its electric evolution all the way from the neutral state to the point where it undergoes electric discharge. By studying the charging behavior of the particle and the spontaneous discharges it experiences, we hope to contribute to a better understanding of the microphysical processes involved in lightning initiation and adjacent electrical phenomena in the atmosphere.

Figure 1: Time vs. electric charge curve of a single SiO2 sphere (d = 0.69 µm) showing spontaneous discharges.


This project has received funding from the European Research Council (ERC) under the European Union’s Starting Grant (A. Stoellner, I.C.D. Lenton & S.R. Waitukaitis received funding from ERC No. 949120, C. Muller received funding from ERC No. 805041).


[1] Dwyer, J. R., & Uman, M. A. (2014), Physics Reports, 534(4), 147–241.
[2] Ricci, F. et al. (2019), Nano Letters 19, 6711.
[3] Stoellner, A. et al. (2025), Phys. Rev. Lett. 135(21), 218202.

How to cite: Stoellner, A., Lenton, I., Muller, C., and Waitukaitis, S.: Measuring spontaneous discharges of individual aerosol particles with optical tweezers, EGU General Assembly 2026, Vienna, Austria, 3–8 May 2026, EGU26-5136, https://doi.org/10.5194/egusphere-egu26-5136, 2026.

EGU26-5138 | ECS | Orals | NH1.11

Surface density of lightning discharges on Jupiter as a function of their energy 

Katerina Rosicka, Ondřej Santolík, Ivana Kolmašová, and Masafumi Imai

Detection of lightning discharges on Jupiter and the estimation of their energy have been the subject of numerous studies using data from variety of spacecraft and probe instruments, operating mostly in the optical range. Individual datasets, however, report markedly different numbers of detected events and characteristic energies, largely due to differences in sensitivity, accumulation time and spatial coverage of individual instruments.

To provide a more unified view of optical lightning observations made by Voyager 1&2, Galileo, Cassini, New Horizons and Juno SRU, we use lightning density evaluated on the visible surface as a common metric. By dividing the energy range into logarithmically spaced bins, we compute the lightning density within each interval. This approach enables a direct comparison between instruments with different sensitivities and reveals a consistent log-normal distribution of lightning energies across multiple datasets.

Detections of lightning-generated whistlers on Jupiter by the Juno mission are substantially more prevalent than all previous optical detections. Unlike optical observations, the sensitivity of radio measurements is not constant. It varies by several orders of magnitude depending on the spacecraft’s position and local plasma conditions, complicating detection statistics.

We introduce also a method to estimate the minimum detectable whistler energy in individual Juno Waves LFR-Lo snapshots. The method is based on modeling the background incoherent noise, including both instrumental and natural contributions. Artificial whistler waveforms with known properties are injected into the modeled noise to test detectability and to evaluate the performance of the Poynting vector measurement.

By this approach, we are able to compare lightning density as a function of energy for both optical and radio wavelengths.

How to cite: Rosicka, K., Santolík, O., Kolmašová, I., and Imai, M.: Surface density of lightning discharges on Jupiter as a function of their energy, EGU General Assembly 2026, Vienna, Austria, 3–8 May 2026, EGU26-5138, https://doi.org/10.5194/egusphere-egu26-5138, 2026.

EGU26-5328 | ECS | Orals | NH1.11

FLASHMAP: A new global gridded lightning dataset with high spatial and temporal resolution 

Yuquan Qu, Esther Brambleby, Thomas Janssen, Jose Moris, Hugh Hunt, Manoj Joshi, Guilherme Mataveli, Francisco Pérez-Invernón, Ryan Said, Marta Yebra, Li Zhao, Matthew Jones, and Sander Veraverbeke

Lightning plays a critical role in the Earth system by shaping biogeochemical cycles, while also posing significant natural hazards and serving as a key geophysical indicator for storm monitoring and wildfire early warning. However, existing publicly available global lightning datasets are often limited in either spatial or temporal resolution and do not distinguish between intra-cloud (IC) and cloud-to-ground (CG) lightning, restricting their applicability for many scientific studies. Here, we present a newly developed global gridded lightning dataset, the Flash Location Aggregation from Strokes into a High-resolution Multi-scale Analysis Product (FLASHMAP). FLASHMAP is derived from lightning observations provided by Vaisala’s Global Lightning Detection Network (GLD360) and currently covers the period from 2019 to 2024. A gridding framework is applied to convert point-based lightning stroke detections into multi-scale products at 0.1° hourly, 0.25° daily, and 0.5° monthly resolutions. FLASHMAP provides comprehensive lightning characteristics, including counts of IC and CG strokes and flashes, stroke location uncertainty and peak current, and flash multiplicity. FLASHMAP can report more total lightning strokes than existing global lightning products in most of the land regions. Comparisons with regional lightning detection networks in Alaska (USA), Spain, and New South Wales and the Australian Capital Territory (Australia) indicate that FLASHMAP reports comparable CG stroke counts while detecting fewer IC strokes. FLASHMAP is expected to advance interdisciplinary research on global and regional lightning climatology, lightning-ignited wildfires, thunderstorm identification, and ecosystem impacts.

How to cite: Qu, Y., Brambleby, E., Janssen, T., Moris, J., Hunt, H., Joshi, M., Mataveli, G., Pérez-Invernón, F., Said, R., Yebra, M., Zhao, L., Jones, M., and Veraverbeke, S.: FLASHMAP: A new global gridded lightning dataset with high spatial and temporal resolution, EGU General Assembly 2026, Vienna, Austria, 3–8 May 2026, EGU26-5328, https://doi.org/10.5194/egusphere-egu26-5328, 2026.

EGU26-6296 | ECS | Orals | NH1.11

Meteorological and Lightning Characteristics of Thunderstorms Producing Transient Luminous Events 

Kateřina Barotová, Ivana Kolmašová, Petr Pišoft, and Martin Popek

After more than three decades of research on transient luminous events (TLEs), typical electrical and dynamical properties of the thunderstorms responsible for their production are still not completely understood. The reliability of prediction when and where TLEs occur is very limited, as numerous case studies focus only on individual TLE-producing storms.

To contribute to these efforts, we analyze 34 TLE-producing storms observed between 2018 and 2020 in Central Europe, each generating at least ten TLEs, specifically sprites and halos. Using products from the Nowcasting and Very Short Range Forecasting Satellite Application Facility (NWC SAF), we follow the full life cycle of each storm, from initiation to dissipation, defining storm boundaries by the presence of very high opaque clouds. Lightning activity and its temporal evolution are derived from LINET lightning detections within the identified storm boundaries. Cloud-top temperature and cloud-top height products are used to relate TLE occurrences to the convective structure of the storm. Statistical distributions of these parameters are compiled at TLE locations.

We show that TLEs statistically appear after the peak of cloud-to-ground lightning activity and at preferred locations relative to storm evolution. Rather than being distributed uniformly over the storm, TLEs are spatially confined to relatively small regions, forming clusters with typical horizontal dimensions of approximately 0.5° × 0.5° in geographic lat–lon coordinates. These regions exhibit persistence in time, as repeated TLE occurrences are frequently observed within the same localized areas of the storm, separated by up to several tens of minutes. Such preferred regions are most commonly located near the convective core, within the stratiform region, and above areas of former convective activity. Additionally, we classify the analyzed storms by area and morphological characteristics, providing insight into the storm structures most favorable for TLE production.

How to cite: Barotová, K., Kolmašová, I., Pišoft, P., and Popek, M.: Meteorological and Lightning Characteristics of Thunderstorms Producing Transient Luminous Events, EGU General Assembly 2026, Vienna, Austria, 3–8 May 2026, EGU26-6296, https://doi.org/10.5194/egusphere-egu26-6296, 2026.

EGU26-6448 | Orals | NH1.11

A Comprehensive analysis of lightning Initiation with LOFAR 

Olaf Scholten, Steve Cummer, Joe Dwyer, Brian Hare, Ningyu Liu, Marten Lourens, Anna Nelles, Chris Sterpka, Paulina Turekova, and Bin Wu

Although strong electric fields have been observed in lightning clouds, these fields are well below the limit to spontaneously initiate a spark that could be the beginning of a lightning flash. Understanding the lightning initiation process is thus one of (if not The) main topics in lightning research.

In this work we present very high frequency (VHF) radio observations using the LOFAR radio telescope [1].  Because of the high resolution and high sensitivity of LOFAR we could observe the faint initiating event for multiple lightning flashes.  The new imaging procedure (called ATRI-D) was shown to be able to distinguish different emission sites of VHF pulses on an airplane flying at an altitude of 8 km [2].

The propagating tip of this apparent initiating event carries positive charge, as is generally expected. Our observations show that the propagation speeds of this positive initiating event (PIE) are very similar at about 5 x 10^6 m/s. Very surprisingly, both the e-folding rates in VHF-intensity and peak intensities differ significantly for the investigated flashes and show no correlation with altitude. Additionally, these structures are extremely narrow, with diameters under 0.8 meters, and maintain this confinement over propagation distances exceeding 100 meters. Even more surprising is that subsequent dart leaders do not follow the path of the PIE, implying that the PIE has not formed a well-conducting structure and does not transform into a positive leader.

Lightning initiation is shown to be a very subtle process, in spite of the vigor of a lightning flash, and the high resolution and sensitivity of LOFAR shows, for multiple lightning flashes, that the initiating event is a very weakly radiating, positively charged propagating structure.

1) Olaf Scholten, Steven A. Cummer, Joseph R Dwyer, et al.; A Comprehensive analysis of High Resolution VHF Observations with LOFAR of the Positive Initiating Event for Several Lightning Flashes. ESS Open Archive . December 12, 2025. https://doi.org/10.22541/essoar.176556304.42772793/v1

2) O. Scholten, M. Lourens, et al. (2025) ; Measuring location and properties of very high frequency sources emitted from an aircraft flying through high clouds. Nature Communications, 16 (1), 10572. https://doi.org/10.1038/s41467-025-65667-2

How to cite: Scholten, O., Cummer, S., Dwyer, J., Hare, B., Liu, N., Lourens, M., Nelles, A., Sterpka, C., Turekova, P., and Wu, B.: A Comprehensive analysis of lightning Initiation with LOFAR, EGU General Assembly 2026, Vienna, Austria, 3–8 May 2026, EGU26-6448, https://doi.org/10.5194/egusphere-egu26-6448, 2026.

The UHU experiment (uhu.epss.hu) was conducted on the International Space Station (ISS) from 26 June to 14 July, 2025 to observe lightning activity and transient luminous events (TLEs) from space using a commercial color video camera. Several months before the mission, a call was issued seeking contribution to this experiment in the form of ground-based optical observations. One aim of the supporting ground campaign was to increase the chance of capturing one or more TLE from space and from the ground simultaneously, and use the respective images to quantify the effect of different propagation through the atmosphere on the recorded color and brightness distribution of the events. Although simultaneous observation of TLEs was not achieved eventually during the campaign, the attempt showed the currently already significant potential of the community of observers in supporting scientific missions targeting optical observations on a global scope. The result that TLEs were observed by contributors above thunderstorms which were also marked for the astronauts on the ISS as possible targets, validates the concept of the open call. The campaign has also provided useful experience that can be utilized in similar calls in the future to further increase the effectiveness of such activities and the scientific value of the collected observations. In this contribution, the preliminary results of the UHU ground-based optical observation campaign are summarised and the gained experiences are presented.

How to cite: Bór, J. and Yair, Y.: The contribution of citizen observers to the UHU lightning and TLE observation campaign on the International Space Station in 2025, EGU General Assembly 2026, Vienna, Austria, 3–8 May 2026, EGU26-6579, https://doi.org/10.5194/egusphere-egu26-6579, 2026.

EGU26-6764 | ECS | Posters on site | NH1.11

Towards quantifying the suitability of ELF-band radio observations for Schumann-resonance research 

András Barna Reichardt, Junaid Atta, and József Bór

Schumann resonances (SR) correspond to the around-the-globe eigenmodes of the thin spherical shell bounded by the Earth’s surface and the lower ionosphere. This system forms a waveguide for extremely low frequency (ELF, 3 Hz - 5 kHz) electromagnetic waves. The SR modes are primarily excited by the quasi continuous lightning activity worldwide. The lowest SR modes are at ~7.8 Hz, ~14.1 Hz, ~20 Hz. The actual peak frequencies and amplitudes of the spectrum depend on both the distribution and intensity of the global thunderstorm activity. SR parameters also carry information on the electrical state of the boundary layers of the waveguide and so they are capable of indicating significant and extensive changes in the vertical profile of the atmospheric electric conductivity. ELF-band spectra of the horizontal magnetic and vertical electric field components are the most suitable for studying these dependencies, but only if the ambient noise does not mask the otherwise rather weak SR signal. In this contribution, a methodology is introduced to determine the signal to noise ratio (SNR) near the low end of the ELF-band that includes the most often detectable lowest SR modes. The concept is based on fitting a model SR spectrum to the measured one and so separating the SR signal from the other components considered further as noise. This approach is demonstrated on the time series recorded at the ELF-band monitoring sites of the HUN-REN Institute of Earth Science and Space Research in the Széchenyi István Geophysical Observatory near Nagycenk Hungary (NCK, 16.72 E, 47.63 N) and in the Jeli Arboretum near Kám, Hungary (JAR, 16.89 E, 47.08 N). The same analysis can be made on any similar record. Practical aspects of setting up an empirical threshold in the SNR to exclude or include data in SR-based studies are discussed in the light of the presented experiences.

How to cite: Reichardt, A. B., Atta, J., and Bór, J.: Towards quantifying the suitability of ELF-band radio observations for Schumann-resonance research, EGU General Assembly 2026, Vienna, Austria, 3–8 May 2026, EGU26-6764, https://doi.org/10.5194/egusphere-egu26-6764, 2026.

EGU26-7355 | ECS | Orals | NH1.11

Gamma-Ray Glows: A Common Signature of Thunderstorms ? 

Yanis Hazem, Sebastien Celestin, Francois Trompier, Yasuhide Hobara, and Eric Defer

Predicted by Wilson in the 1920s, thunderstorms act as natural particle accelerators. Charged particles, mainly electrons, can be energized by the strong electric fields inside thunderclouds, becoming runaway electrons that reach relativistic energies. During this acceleration, these relativistic electrons produce secondary electrons through atmospheric ionization, leading to a Relativistic Runaway Electron Avalanche (RREA) while emitting X-rays through bremsstrahlung. This mechanism underlies the high-energy atmospheric phenomena generated by thunderstorms, such as terrestrial gamma-ray flashes (TGFs), flickering gamma-ray flashes (FGFs), and gamma-ray glows (GRGs).

GRGs are long-lasting X-ray emissions produced by sustained RREAs, typically lasting from seconds to tens of minutes. They are usually observed close to their sources either by aircraft, high-altitude sites located on mountain, or from the western coast of Japan where thunderclouds frequently develop near sea level.

Since 2023, we are conducting a ground-based observational campaign by equipping several strategic sites to detect these high-energy events and study their occurrence and characteristics. Three sites were instrumented with scintillators: Chofu (Tokyo, Japan), Pic du Midi de Bigorre (French Pyrenees), and Normandy (France).

In this presentation, we introduce a new statistical method designed to detect GRGs and potentially TGFs and FGFs. The method combines Gaussian filtering, continuous wavelet transforms, and Bayesian inference. It enabled the detection of more than ten GRGs at Pic du Midi between April and November 2025, as well as two GRGs at sea level in Chofu and Normandy demonstrating the method’s efficiency and showing that GRGs are common and associated with all thunderstorms.


How to cite: Hazem, Y., Celestin, S., Trompier, F., Hobara, Y., and Defer, E.: Gamma-Ray Glows: A Common Signature of Thunderstorms ?, EGU General Assembly 2026, Vienna, Austria, 3–8 May 2026, EGU26-7355, https://doi.org/10.5194/egusphere-egu26-7355, 2026.

EGU26-7491 | ECS | Orals | NH1.11

Study of electric fields and turbulence in thunderstorm clouds 

Joydeep Sarkar, Marta Wacławczyk, and Szymon Malinowski

In recent years, our knowledge of turbulence statistics inside cumulus, stratiform, and stratocumulus clouds is more complete thanks to a number of measurement campaigns and subsequent detailed analyses of collected data. However, similar cannot be stated for cumulonimbus clouds. This is primarily because very few measurements have been performed, majorly owing to safety issues amidst harsh atmospheric conditions. At the same time, even though the extent of electrification is present in all kinds of clouds, cumulonimbus clouds are particularly significant because of the final result of electrification, in the form of lightning. Thus the necessity to understand the evolution of electric field in such conditions is highly crucial. In this study, we use data from the campaign, Severe Thunderstorm Electrification and Precipitation Study (STEPS), performed in the May of 2000 in Kansas, USA. The campaign consisted of aircraft penetrations into the mature thunderstorm cloud and several balloon soundings. This involved in-situ measurements of electric field, vertical velocity, liquid water content, etc. 

Charges inside the clouds are under constant motion, owing to convective motions such as updraft and downdraft. This causes them to be scattered around in various regions of the clouds and form clusters depending on how turbulent these regions are. In our study, we  compared the evolution of turbulence and electric field inside the clouds. Our results show negative correlation between the turbulent kinetic energy dissipation rates and modules of the electric field vector, which suggests the growth of electric field in regions of weak turbulence and vice versa. This could mean that larger charges exists in those regions where turbulence is on the verge of decay or it is in the process of development. Vice versa, the presence of strong turbulence destroys the charges clusters. We also investigate the intermittency, which is a notable indicator for turbulent fields.  Specifically, we calculated the probability density functions of electric field differences at two points. For small differences those functions are clearly non-Gaussian, with long stretched tails and conical tip, which is a very typical picture for intermittency. For larger lags, the distributions are closer to gaussian, thereby signifying a homogenous arrangement of charges. 

How to cite: Sarkar, J., Wacławczyk, M., and Malinowski, S.: Study of electric fields and turbulence in thunderstorm clouds, EGU General Assembly 2026, Vienna, Austria, 3–8 May 2026, EGU26-7491, https://doi.org/10.5194/egusphere-egu26-7491, 2026.

EGU26-8984 | Posters on site | NH1.11

Predicting Eastern Mediterranean lightning: evaluating microphysical and thermodynamic indices using a machine learning approach 

Yoav Yair, Karin Pitlik, Colin Price, Menahem Korzets, Chaim Lerman, Jean Alisse, Barry Lynn, and Ben Galili

Lightning serves as a fundamental indicator of convective intensity and an important mediator of atmospheric dynamics. Accurately modeling the potential for lightning occurrence is essential for understanding storm electrification and improving short-range forecasting. The Lightning Potential Index (LPI) is a physically based diagnostic parameter that quantifies the potential for charge generation within convective clouds. It combines model-resolved updraft velocity and precipitating ice content, thereby directly representing the mechanisms responsible for non-inductive charging (Yair et al., 2010). In contrast, thermodynamic indices such as the K-Index (KI) and Convective Available Potential Energy (CAPE) reflect the environmental instability and likelihood of convection, but lack an explicit representation of microphysical electrification processes (Peppler, 1988). Additionally, accumulated precipitation serves as a proxy for the integrated intensity of the storm systems. In this study, we evaluate the skill of this suite of atmospheric predictors - meaning LPI, KI, CAPE, and precipitation – all computed from WRF ensemble simulations, in reproducing observed lightning activity over the Eastern Mediterranean. Five case studies were selected, representing different synoptic conditions in winter. A comprehensive processing pipeline was developed to co-register model outputs and ground-based lightning detections from the ENTLN network onto a uniform 4 × 4 km grid and 3-hour temporal intervals. Spatially, all parameters were averaged per grid cell. Temporally, precipitation was summed, while other variables (LPI, KI, CAPE) were averaged over each period. All datasets were smoothed with a Gaussian kernel to reduce spatial noise and enable direct comparison across domains. Preliminary analyses indicate that thermodynamic indices and accumulated precipitation exhibit broad spatial footprints, significantly overestimating the areal extent of lightning activity. While LPI also displays a tendency towards broader coverage than observed, it demonstrates the highest degree of spatial localization among the examined parameters. To further quantify predictive skill, we employ a machine learning approach based on Random Forest algorithm. The spatial model matrices are decomposed into discrete single-cell vectors, utilizing the full suite of parameters. These features are used to classify the binary occurrence of lightning (presence/absence), independent of flash multiplicity, establishing a robust data-driven mapping between storm microphysics and lightning probability.


References

  • Y, B. Lynn, C. Price, V. Kotroni, K. Lagouvardos, E. Morin, A. Mugnai, and M. d. C. Llasat (2010), Predicting the potential for lightning activity in Mediterranean storms based on the Weather Research and Forecasting (WRF) model dynamic and microphysical fields, J. Geophys. Res., 115, D04205, doi:10.1029/2008JD010868.
  • Peppler, R. A. (1988). A review of static stability indices and related thermodynamic parameters. ISWS Miscellaneous Publication MP-104.‏

How to cite: Yair, Y., Pitlik, K., Price, C., Korzets, M., Lerman, C., Alisse, J., Lynn, B., and Galili, B.: Predicting Eastern Mediterranean lightning: evaluating microphysical and thermodynamic indices using a machine learning approach, EGU General Assembly 2026, Vienna, Austria, 3–8 May 2026, EGU26-8984, https://doi.org/10.5194/egusphere-egu26-8984, 2026.

EGU26-9083 | Orals | NH1.11

Diagnosing stroke, flash, and storm scale lightning variability using Lightning Differential Space 

Orit Altaratz, Yuval Ben Ami, Yoav Yair, and Ilan Koren

We introduce the Lightning Differential Space (LDS) framework for multiscale, data-driven characterization of cloud-to-ground (CG) lightning, in which consecutive stroke intervals are mapped into a two-dimensional space spanned by their spatial and temporal derivatives. Using Earth Networks Total Lightning Network (ENTLN) observations, we analyze CG strokes during peak lightning seasons (2020–2021) across three climatically distinct regions: the Amazon (tropics), the Eastern Mediterranean Sea (subtropics), and the northern U.S. Great Plains (mid-latitudes).

The LDS topography reveals a robust and regionally consistent “allowed” and “forbidden” zones, with dominant clusters separating intra-flash successive strokes from inter-flash intervals at thundercloud and cloud-system scales. While the overall structure is stable across regions, systematic shifts in cluster location and separability reflect contrasting convective environments, including differences in characteristic inter-event times and system-scale distances.

We further introduce a Current Ratio LDS, which projects the ratio of absolute peak currents between successive strokes onto the same stroke interval coordinates. This diagnostic acts as a statistical partitioning tool that sharply distinguishes intervals likely to contain flash-initiating strokes (where the succeeding stroke tends to be stronger) from intervals dominated by subsequent strokes within multi-stroke flashes. Across all regions, a distinct short time interval feature (< ~0.02 s) spans distances from sub-kilometer to hundreds of kilometers, suggesting rare near-simultaneous remote CG events and motivating renewed investigation of long-range thunderstorm coupling (teleconnection).

Overall, the LDS framework (combining number distribution and current ratio information) provides a scalable pathway for extracting coherent multiscale lightning behavior from large network datasets, with direct relevance for evaluating model representations of stroke and flash processes and for developing diagnostics supporting probabilistic monitoring and nowcasting.

How to cite: Altaratz, O., Ben Ami, Y., Yair, Y., and Koren, I.: Diagnosing stroke, flash, and storm scale lightning variability using Lightning Differential Space, EGU General Assembly 2026, Vienna, Austria, 3–8 May 2026, EGU26-9083, https://doi.org/10.5194/egusphere-egu26-9083, 2026.

EGU26-9296 | Posters on site | NH1.11

Using the new LOFAR2.0 upgrade for lightning imaging 

Brian Hare, Steve Cummer, Joseph Dwyer, Ningyu Liu, Marten Lourens, Olaf Scholten, Chris Sterpka, Paulina Turekova, Bin Wu, and Astron Nl

LOFAR has been used to image lightning initiation, leader stepping, dart leaders, needles, and more
with sub-meter resolution and high sensitivity. Over the last few years LOFAR has been almost
completely rebuilt from the ground-up into LOFAR2.0. Apart from the physical antennas, nearly all of
the analog and digital processing chains have been completely replaced and upgraded. In addition to
greater bit-depth and better amplifiers, a new automatic white-rabbit based time calibration will allow
for easier and faster data processing. Combined with a faster network that allows for less down-time,
more lightning flashes per thunderstorm can be observed and mapped with high precision. LOFAR2.0
will also have triple the number of processing pipelines, thus allowing for observing simultaneously
with both the low-band antennas (10-90 MHz) and the high-band antennas (110-240 MHz). The higher
frequencies will allow for significantly higher resolution, perhaps even allowing for the resolving of the
sub-meter widths of streamer bursts during lightning initiation. This poster will discuss some of the
new and still-planned upgrades to LOFAR system, as well as our various imaging techniques such as
our impulsive imager and near-field beamforming (TRI-D and ATRI-D).

How to cite: Hare, B., Cummer, S., Dwyer, J., Liu, N., Lourens, M., Scholten, O., Sterpka, C., Turekova, P., Wu, B., and Nl, A.: Using the new LOFAR2.0 upgrade for lightning imaging, EGU General Assembly 2026, Vienna, Austria, 3–8 May 2026, EGU26-9296, https://doi.org/10.5194/egusphere-egu26-9296, 2026.

EGU26-9545 | ECS | Orals | NH1.11

How Accurately Does LOFAR Reconstruct Lightning? Point and Extended Source Analysis 

Paulina Turekova, Brian Hare, Olaf Scholten, Marten Lourens, Chris Sterpka, Steven Cummer, Joseph Dwyer, and Ningyu Liu

The polarization of VHF radio emissions from lightning offers valuable insight into the complex physics of lightning propagation by revealing the orientation of streamer-driven VHF radiation. Measuring and interpreting this polarization, however, remains challenging. In this work, we use the LOFAR radio telescope in combination with the latest near-field beamforming technique (A-TRID) that coherently combines antenna voltages while incorporating the full antenna response. This approach enables three-dimensional reconstruction of both the location and polarization of VHF lightning sources. In this presentation, we assess the accuracy of these results by means of a Monte Carlo error analysis. We simulate antenna voltage signals produced by a point-like dipole and an extended source, a cluster of indentical dipole emitters. Subsequently, we reconstruct them using the imaging algorithm. By comparing the reconstructed source parameters with the known inputs, we obtain an estimate of the location and polarization uncertainties. For point sources, we observe a sub-meter reconstruction accuracy in three-dimensional location; and an average one-degree reconstruction accuracy in three-dimensional polarization. These values vary with the source location and with the angle between the polarization vector and the radial vector. For extended sources, we see the reconstructed location (the source size) is smaller than the input; by up to a factor of two. The polarization reconstruction accuracy is different along the two axes; a sub-degree reconstruction accuracy along the azimuthal direction and an average 7.5-degree reconstruction accuracy along the zenithal direction. This report offers a comprehensive evaluation of the results, alongside a breakdown of our technical approach and algorithmic framework.

How to cite: Turekova, P., Hare, B., Scholten, O., Lourens, M., Sterpka, C., Cummer, S., Dwyer, J., and Liu, N.: How Accurately Does LOFAR Reconstruct Lightning? Point and Extended Source Analysis, EGU General Assembly 2026, Vienna, Austria, 3–8 May 2026, EGU26-9545, https://doi.org/10.5194/egusphere-egu26-9545, 2026.

EGU26-9916 | ECS | Orals | NH1.11

A relativistic fluid model for reproducing thundercloud hard radiation including ALOFT’s flickering gamma-ray flashes 

Øystein Håvard Færder, Nikolai Lehtinen, David Sarria, Martino Marisaldi, and Nikolai Østgaard

Thunderclouds are the largest natural gamma-ray laboratories on Earth, producing a large variety of gamma-ray phenomena of different shape, duration, and intensity. In our previous parametric study of a 0.5D fluid model of relativistic runaway electrons (RRE) in a thundercloud high-field region [1] – based on relativistic feedback discharge (RFD) theory [2] – we systematically reproduced the entire zoo of thundercloud gamma-ray signals, including the flickering gamma-ray flashes (FGFs) as detected by ALOFT [3], indicating that RFD may potentially play a significant role in these phenomena.


Here we present a new relativistic fluid model based on the same principles but expanded to include the non-uniformity along the vertical axis, allowing us to explore the effects of more realistic space charge distributions as well as simulating and comparing hard radiation signals from high-field regions with both negative and positive polarities. In addition to solving continuity equations for RRE and ions (as the 0.5D model did), this model also includes equations for positrons as well as upward- and downward-propagating photons, making it possible to estimate the flux of positrons compared to electrons as well as mimicking gamma-ray light-curves directly from the simulated photon density. While the 0.5D model provides excellent qualitative results regarding hard-radiation produced with (or without) the help of RFD, we expect this new model to give better quantitative results, for instance a better idea regarding the minimum charge layer separation distance needed to reproduce ALOFT’s FGFs. With this model, we should also be capable of forward-modelling radio and optical signals, which will make it easier to distinguish (multi-pulse) terrestrial gamma-ray flashes (TGFs) from FGFs. That could ultimately also give us a better insight into whether TGFs could be produced solely by RFD.


--------------------------

[1] Ø. H. Færder, N. Lehtinen, D. Sarria, M. Marisaldi, N. Østgaard, I. Bjørge-Engeland, and A. Mezentsev. Numerical parameter-space studies of various types of thundercloud gamma-ray emissions. ESS Open Archive eprints, 776:essoar.175578737, Aug. 2025. doi:10.22541/essoar.175578737.77602064/v2.

[2] Dwyer, J. R., “Relativistic breakdown in planetary atmospheres,” Physics of Plasmas, vol. 14, no. 4, p. 042901 (2007).

[3] Østgaard, N., Mezentsev, A., Marisaldi, M., Grove, J. E., Quick, M., Christian, H., Cummer, S., Pazos, M., Pu, Y., Stanley, M., et al., “Flickering gamma-ray flashes, the missing link between gamma glows and TGFs”, Nature (2023). 

How to cite: Færder, Ø. H., Lehtinen, N., Sarria, D., Marisaldi, M., and Østgaard, N.: A relativistic fluid model for reproducing thundercloud hard radiation including ALOFT’s flickering gamma-ray flashes, EGU General Assembly 2026, Vienna, Austria, 3–8 May 2026, EGU26-9916, https://doi.org/10.5194/egusphere-egu26-9916, 2026.

EGU26-10184 | Posters on site | NH1.11

Imaging gamma-ray glows 

Martino Marisaldi, David Sarria, Eric Grove, Daniel Shy, Andrey Mezentsev, Nikolai Lehtinen, Nikolai Østgaard, and Timothy Lang

Gamma-ray glows are persistent (seconds to minutes) gamma-ray emissions from thunderclouds associated to intense large-scale electric fields. Results from the ALOFT flight campaign in 2023 over Florida and the Gulf of Mexico [1,2] have shown that tropical thunderclouds can glow in gamma-rays for hours and over thousands of square kilometres, pointing at particle acceleration as a fundamental and ubiquitous phenomenon in thundercloud electrodynamics, likewise cloud electrification and lightning discharge. Moreover, ALOFT measurements evidence a significant intrinsic time variability of gamma-ray glows, likely matching the dynamics of large scale thundercloud electric fields. Despite earlier attempts, there is no direct measurement of gamma-ray glow spatial extent. With the ENLIGHTEN project we have the ambition to measure directly the spatial extent of glows in gamma-rays and their spatio-temporal evolution. We will use diverse gamma-ray imaging systems hosted onboard a high-altitude aircraft from NASA flying over active thunderclouds. The ENLIGHTEN flight campaign is currently scheduled for July 2028. Here we present the preliminary design of the gamma-ray imagers and their expected performance based on Monte Carlo simulations informed by the ALOFT gamma-ray glow measurements.

[1] Lang, T. J., et al., 2025: Hunting for Gamma Rays above Thunderstorms: The ALOFT Campaign. Bull. Amer. Meteorol. Soc., https://doi.org/10.1175/BAMS-D-24-0060.1.

[2] Marisaldi, M., et al., 2024: Highly dynamic gamma-ray emissions are common in tropical thunderclouds. Nature 634, https://doi.org:10.1038/s41586-024-07936-6

How to cite: Marisaldi, M., Sarria, D., Grove, E., Shy, D., Mezentsev, A., Lehtinen, N., Østgaard, N., and Lang, T.: Imaging gamma-ray glows, EGU General Assembly 2026, Vienna, Austria, 3–8 May 2026, EGU26-10184, https://doi.org/10.5194/egusphere-egu26-10184, 2026.

EGU26-10290 | ECS | Posters on site | NH1.11

Combining VHF and optical observations to reconstruct an upward flash 

Toma Oregel-Chaumont, Jérôme Kasparian, Mark Stanley, William Rison, Antonio Šunjerga, Marcos Rubinstein, and Farhad Rachidi

In this study we present, to the best of our knowledge, the first three-dimensional (3D) reconstruction of an upward lightning flash using combined very high frequency (VHF) interferometric and high-speed camera (HSC) observations. Based on this reconstruction, we estimate the 3D velocities of different pulse fronts along the channel branches. Comparable 3D reconstructions have previously been reported for downward lightning flashes [1].

The Mt. Säntis Lightning Research Facility [2], located in the Appenzell region of Eastern Switzerland, features an electric field and current measurement system, as well as a Phantom HSC situated at a distance of 5 km from the namesake mountaintop tower. Additionally, during the summer 2021 experimental campaign, a VHF interferometer (IFM) belonging to New Mexico Tech was installed at the base of Mt. Säntis, 2 km away from the tower. The HSC operated at 24,000 fps and the IFM at 200 MS/s, corresponding to respective time resolutions of 42 μs and 5 ns. The spatial resolutions of the HSC and IFM were 512 x 512 pixels and 0.1°, respectively, both corresponding to ~3 m at the location of the tower tip. These two instruments were used in combination to reconstruct in three dimensions the bottom ~600 m of an upward negative flash that initiated from the Säntis Tower on July 30, 2021, at 15:38:10 UTC. This particular flash featured numerous “mixed-mode” pulses superimposed on the initial continuous current (ICC), in addition to the standard dart leader–return stroke sequences, identified as such from their current and E-field waveforms. The ICC pulses propagated downward along 4+ different visible branches; altitude change rates averaged -5.6 ± 2.0 x 10⁶ m/s and were observed to decrease slightly as the pulse fronts approached the strike point. 3D speeds of ~2 x 10⁷  m/s were observed, punctuated by spikes (spaced on the order of 10 μs apart) at times exceeding 1e8 m/s, indicative of step-like behaviour. Such an analysis of ICC pulse velocities is heretofore absent in the literature and lends itself to an improved understanding of leader dynamics and charge transfer mechanisms in upward lightning.


References:

[1] Li, Y., Qiu, S., Shi, L., Huang, Z., Wang, T., Duan, Y., 2017. Three‐Dimensional Reconstruction of Cloud‐to‐Ground Lightning Using High‐Speed Video and VHF Broadband Interferometer. JGR Atmospheres 122. https://doi.org/10.1002/2017JD027214

[2] Rachidi, F., Rubinstein, M., 2022. Säntis lightning research facility: a summary of the first ten years and future outlook. Elektrotech. Inftech. 139, 379–394. https://doi.org/10.1007/s00502-022-01031-2


How to cite: Oregel-Chaumont, T., Kasparian, J., Stanley, M., Rison, W., Šunjerga, A., Rubinstein, M., and Rachidi, F.: Combining VHF and optical observations to reconstruct an upward flash, EGU General Assembly 2026, Vienna, Austria, 3–8 May 2026, EGU26-10290, https://doi.org/10.5194/egusphere-egu26-10290, 2026.

EGU26-10336 | ECS | Orals | NH1.11

BOLT: Imaging Lightning and Terrestrial Gamma-ray Flashes at the Pierre Auger Observatory 

Melanie Joan Weitz and the Pierre Auger Collaboration

The Pierre Auger Observatory has detected downward terrestrial gamma-ray flashes (TGFs) with its water-Cherenkov detectors. Understanding this high-energy radiation occurring during thunderstorms requires combining such measurements with observations of lightning processes in their earliest stages. To meet this challenge, the Broadband Observatory of Lightning and TGFs (BOLT) is currently under construction to image lightning propagation in three dimensions with high time resolution using radio interferometry, extending the unique multi-detector capabilities of the Pierre Auger Observatory. 

BOLT is based on eleven modified Auger Engineering Radio Array (AERA) stations operating in the 30–80 MHz bandwidth and deployed at strategic locations within the Auger array. While the AERA stations by themselves already provide the necessary spatial and timing resolution, a key modification for BOLT is the implementation of a long buffer readout. This capability enables the reconstruction of lightning development and the correlation of radio emissions with TGF-related signals observed by the Observatory’s water-Cherenkov detectors.

This contribution presents recent hardware developments, including the long buffer readout, progress toward selective triggering and precision timing, and first field data analyzed using insights from previous AERA measurements, illustrating the growing capability of BOLT for combined lightning and TGF studies. Together with the existing detector systems of the Pierre Auger Observatory, BOLT establishes a powerful experimental framework for advancing our understanding of lightning physics and associated high-energy atmospheric phenomena.

How to cite: Weitz, M. J. and the Pierre Auger Collaboration: BOLT: Imaging Lightning and Terrestrial Gamma-ray Flashes at the Pierre Auger Observatory, EGU General Assembly 2026, Vienna, Austria, 3–8 May 2026, EGU26-10336, https://doi.org/10.5194/egusphere-egu26-10336, 2026.

EGU26-11132 | ECS | Orals | NH1.11

Fine-Scale Structure of High-Altitude Negative Leader Steps 

Marten Lourens, Brian Hare, Olaf Scholten, Chris Sterpka, Paulina Turekova, Bin Wu, Steven Cummer, Joseph Dwyer, and Ningyu Liu

In this work, we use lightning observations obtained by the LOFAR radio telescope to investigate the propagation dynamics of High Altitude Negative Leaders (HANLs), which have altitudes above 7 km. Operating in the very high frequency (VHF) range, LOFAR can probe lightning processes
occurring deep within the cloud at high altitudes with sub-meter precision and 100 ns integration times [2].

HANLs exhibit step lengths exceeding 100 m, an order of magnitude larger than those of negative leaders observed at lower altitudes [1]. The plasma processes underlying these HANL steps remain unknown, and it is unclear whether HANLs propagate through the same mechanism as lower altitude negative leaders. To study these structures with enhanced precision and sensitivity, we apply ATRI-D, a near-field interferometric beamforming algorithm, to LOFAR data.

Our observations reveal that the dynamics of HANL steps is increasingly complex at smaller scales. At large scales (kilometers and tens of milliseconds), HANL propagation appears as a sequence of discrete corona flashes. In contrast, on smaller scales (tens of meters and milliseconds), these “corona flashes” resolve into several branched networks of filaments that initiate at different times and locations. In addition, we find that each branched network begins with an intense VHF pulse occurring within 10 m of a previously formed filament. We will discuss some of the potential physics implications of these results.

[1] O. Scholten et al.; Distinguishing features of high altitude negative leaders as observed with LOFAR. Atmospheric Research, 260:105688, October 2021. ISSN 0169-8095. doi: 10.1016/j.atmosres.2021.105688.
[2] O. Scholten, M. Lourens et al.; Measuring location and properties of very high frequency sources emitted from an aircraft flying through high clouds. Nature Communications, 16(1), November 2025. ISSN 2041-1723. doi: 10.1038/s41467-025-65667-2.

How to cite: Lourens, M., Hare, B., Scholten, O., Sterpka, C., Turekova, P., Wu, B., Cummer, S., Dwyer, J., and Liu, N.: Fine-Scale Structure of High-Altitude Negative Leader Steps, EGU General Assembly 2026, Vienna, Austria, 3–8 May 2026, EGU26-11132, https://doi.org/10.5194/egusphere-egu26-11132, 2026.

EGU26-11696 | Orals | NH1.11

Lightning impacts on forests: direct and indirect (wildfire) tree mortality under present and future lightning activity 

Andreas Krause, Konstantin Gregor, Benjamin Meyer, and Anja Rammig

Lightning is an important disturbance process in forest ecosystems, affecting trees both directly—when a strike kills a tree—and indirectly by igniting wildfires. While lightning–fire interactions are widely studied, direct lightning-induced tree mortality is not represented in global Earth System Models, limiting our ability to assess the full impact of lightning on forests under a changing climate.

To address this gap, we implement lightning-induced tree mortality in the dynamic global vegetation model LPJ-GUESS, using field-derived relationships from a Panamanian forest where lightning mortality has been systematically quantified. The model successfully reproduces observed lightning-induced tree mortality at several sites but simulates lower mortality than estimated at other locations. Running the model globally, we quantify the number of trees and associated biomass directly lost to lightning and compare these losses to biomass losses from lightning-ignited wildfires, highlighting key uncertainties in both pathways.

To place these present-day impacts in a future context, we synthesize existing lightning parameterizations used in global chemistry-climate models and assess their skill and projected changes in lightning activity. Applying projections from several well-performing parameterizations, we explore how future changes in lightning may alter both direct and indirect lightning-induced tree mortality. Together, our results demonstrate that lightning is a multifaceted and potentially growing driver of forest change, and that accurately representing lightning mortality is essential for robust projections of future forest dynamics.

How to cite: Krause, A., Gregor, K., Meyer, B., and Rammig, A.: Lightning impacts on forests: direct and indirect (wildfire) tree mortality under present and future lightning activity, EGU General Assembly 2026, Vienna, Austria, 3–8 May 2026, EGU26-11696, https://doi.org/10.5194/egusphere-egu26-11696, 2026.

EGU26-12136 | Orals | NH1.11

Prospects for Lightning Detection on Jupiter using JANUS on the JUICE mission: Insights from JANUS Earth observations  

Ricardo Hueso, Pasquale Palumbo, Cecilia Tubiana, Ganna Portyankina, Luisa María Lara, Yoav Yair, Junichi Haruyama, Mitsuteru Sato, Takahashi Yukihiro, Amy Simon, Athena Coustenis, Livio Agostini, Alice Luchetti, Luca Penasa, Alessio Aboudan, Arrate Antuñano, Thomas Roatsch, Elke Kersten, Klaus-Dieter Matz, and Manish Patel and the JANUS Earth flyby team:

The JUpiter ICy moons Explorer (JUICE) is an ESA-led mission that will investigate Jupiter’s atmosphere and the potential habitability of the Galilean satellites in 2031-2035 (Grasset et al., 2013). One of the goals of the investigation of Jupiter’s atmosphere is to determine the spatial distribution, frequency and intensity of lightning, providing a global picture of convective phenomena in Jupiter (Fletcher et al. 2024).

JUICE is in a long cruise to Jupiter that includes three close flybys of the Earth. The first of these flybys occurred on August 20, 2024 with two more flybys planned for Sept. 2026 and January 2029. JANUS is a high-resolution camera that operates in the 340-1080 nm spectral range and will obtain the highest spatial resolution images of the mission (Palumbo et al. 2025). During the 2024 flyby, JANUS obtained a sequence of 20 nightside images over a narrow strip from Madagascar to Vietnam at a spatial resolution of 146-257 m, and from a distance of 9,807-17,476 km with typical exposure times of 25 to 36 ms. While these images did not result in detection of lightning, the images show distinct compact lights from city lights, intense and mild fires and lights from maritime traffic that demonstrate the potential for lightning investigations on Jupiter (Hueso et al., 2026).

Lightning in Jupiter is considered to be much more intense and powerful than on Earth, and has been imaged by every spacecraft that has approached the planet (e.g., Becker et al., 2020). JANUS will obtain images of Jupiter over 3.5 yrs including multiple surveys of lightning in the planet’s nightside at different spatial resolutions and with different time cadences. Jovian lightning originates at pressures higher than 3 atm and can be observed in regions where no apparent storms are visible in the upper clouds at around 500 mbar. The spatial distribution, energy released and overall lightning activity connects observations of the upper atmosphere, where clouds of ammonia ice make most of the observable clouds, with intense phenomena at the base of the weather layer at pressure levels of 4-7 bar, where water condenses and lightning most likely originates.

We show JANUS observations of Earth’s nightside and review similarities and differences between lightning on Earth and Jupiter. We summarize our planned investigation of lightning activity in Jupiter and show how these Earth observations help us determine the sensitivity of the instrument towards the characterization of lightning at Jupiter.


References

  • Becker et al., Small lightning flashes from shallow clouds on Jupiter. Nature (2020).
  • Fletcher et al. Jupiter Science Enabled by ESA’s Jupiter Icy Moons Explorer. Space Science Reviews (2023).
  • Grasset et al. JUpiter ICy moons Explorer (JUICE): An ESA mission to orbit Ganymede and to characterise the Jupiter system. Planetary and Space Science (2013).
  • Hueso et al., JANUS observations of Earth in preparation for its investigation of Jupiter’s atmosphere. Annales Geophysicae, in preparation (2026).
  • Palumbo et al. The JANUS (Jovis Amorum ac Natorum Undique Scrutator) VIS-NIR Multi-Band Imager for the JUICE Mission, Space Science Reviews (2025).

How to cite: Hueso, R., Palumbo, P., Tubiana, C., Portyankina, G., Lara, L. M., Yair, Y., Haruyama, J., Sato, M., Yukihiro, T., Simon, A., Coustenis, A., Agostini, L., Luchetti, A., Penasa, L., Aboudan, A., Antuñano, A., Roatsch, T., Kersten, E., Matz, K.-D., and Patel, M. and the JANUS Earth flyby team:: Prospects for Lightning Detection on Jupiter using JANUS on the JUICE mission: Insights from JANUS Earth observations , EGU General Assembly 2026, Vienna, Austria, 3–8 May 2026, EGU26-12136, https://doi.org/10.5194/egusphere-egu26-12136, 2026.

EGU26-12611 | ECS | Posters on site | NH1.11

An exceptionally strong gamma-ray glow at Lomnický štít observed by an unprecedented number of ionizing radiation sensors 

Jakub Šlegl, Martin Kákona, Ronald Langer, Igor Strhárský, Jaroslav Chum, Martina Lužová, Helena Velyčková, Marek Sommer, Iva Ambrožová, and Ondřej Ploc

The summer season of 2023 brought to Lomnický štít (Slovakia) one of the strongest gamma-ray glows (GrGs) ever recorded. As Lomnický štít is a unique observation point for GrGs, we equipped the observatory with multiple detectors in the frame of the CRREAT project. In addition to the existing Neutron monitor, SEVAN detector, and Boltek electric field mill, we also installed an RT-56 large NaI(Tl) gamma-ray spectrometer, a small Geodos gamma-ray spectrometer, silicon mosaic detectors, Timepix detectors, PIN diode detectors, a camera, and additional Boltek electric field mills. On 14 June 2023, a thunderstorm cell formed in the vicinity of the observatory and exhibited a strong electric field. This field caused a strong GrG detected by all of the above-mentioned ionizing radiation detectors, standing out as our finest recorded event to date, enriched by the deployment of an unprecedented set of advanced instruments. The duration of the GrG was at least five minutes and was ended by a discharge very close to the count rate's peak of a typical Gaussian curve. The thunderstorm cell remained active and produced two more detected GrGs. One of them also ended with a discharge.

How to cite: Šlegl, J., Kákona, M., Langer, R., Strhárský, I., Chum, J., Lužová, M., Velyčková, H., Sommer, M., Ambrožová, I., and Ploc, O.: An exceptionally strong gamma-ray glow at Lomnický štít observed by an unprecedented number of ionizing radiation sensors, EGU General Assembly 2026, Vienna, Austria, 3–8 May 2026, EGU26-12611, https://doi.org/10.5194/egusphere-egu26-12611, 2026.

EGU26-12870 | Posters on site | NH1.11

Characteristics of Long Continuing Currents Observed in Broadband ELF Measurements 

Tamas Bozoki, Janusz Mlynarczyk, and Andras Horvath

Continuing current (CC) is a slowly varying lightning current that can follow a return stroke (RS) in cloud‐to‐ground lightning flashes and typically lasts from a few milliseconds to several hundred milliseconds. The necessary conditions and generation mechanism of CC formation have been studied for decades, motivated by the increased risk of physical lightning damage due to the long‐lasting current and large charge transfers. Nowadays, there is a growing interest in the study of CC, mainly because of the important role it plays in the natural ignition of forest fires. The Krakow ELF group operates a pair of broadband magnetic antenna (sampling frequency: 3004.81 Hz, antenna bandwidth: 0.02 Hz – 1.1 kHz) in an electromagnetically very quiet environment in Hylaty, south-eastern Poland, which is very suitable for the recording of CCs. In this contribution, we introduce our semi-automated procedure for detecting and characterizing CCs in this measurement data and describe some characteristics of the long CCs (>40 ms) identified by our method on three selected days (3-5 July, 2025). Our algorithm first searches for peaks in the magnetic data that represent the ELF manifestation of RSs, then estimates the beginning and end of the waveform based on classic signal processing techniques. The time passed between the RS peak and the end of the waveform is considered to be the CC duration. In order to increase the reliability of the data system, we manually discard ambiguous cases and correct the estimated CC durations. Over the three selected days, a total of 7,052 RSs have been detected, of which 349 (~5%) were followed by a clear and long lasting CC signature. 90% of the CCs were observed in the daytime, 36.1% of them lasted longer than 100 ms, but only 6.6%/0.6% lasted longer than 200/300 ms. Part of the CCs can be well described as an exponential decay, but there are also a number of more complicated waveforms with M-component signatures and prolonged, slightly fluctuating parts. Interestingly, in approximately 5% of the cases, the RS is preceded by some initial activity (current flow) lasting longer than 10 ms. Next, we plan to use WWLLN/ENTLN and MTG data to automatically identify the source lightning discharge of the detected events, as well as to employ machine learning techniques to make the CC detection more effective. We expect that our method will enable us to study lightning CCs in a much larger data set than ever before.

How to cite: Bozoki, T., Mlynarczyk, J., and Horvath, A.: Characteristics of Long Continuing Currents Observed in Broadband ELF Measurements, EGU General Assembly 2026, Vienna, Austria, 3–8 May 2026, EGU26-12870, https://doi.org/10.5194/egusphere-egu26-12870, 2026.

EGU26-13571 | ECS | Orals | NH1.11

Small-Scale Discharges in the Thunderstorm Prior to Lightning Initiation 

Christopher Sterpka, Brian Hare, Olaf Scholten, Paulina Turekova, Marten Lourens, Bin Wu, Joseph Dwyer, Ningyu Liu, and Steven Cummer

We present observations of small-scale discharges, or sparks, within thunderstorms before the initiation of a lightning leader. Using LOFAR A-TRID, which provides exceptional precision and accuracy through near-field beamforming with hundreds of antennas [1], we detected multiple spark-like discharges with varying characteristics. Some show a collective propagation direction, with some speeds as low as 1 x 10⁶ m/s (similar to ultra-slow propagation), and some as fast as 1 x 10⁷ m/s [2, 3]. As these sparks occur in a kilometer sized region adjacent to the initiation region, they could be used to map the extent of high-field regions within thunderstorms. These results suggest that failed initiation events may be infrequent and difficult to detect as they occur in sparse clusters on short spatiotemporal scales. This work will provide an overview of the physical properties of the spark discharges and implications for lightning initiation.

1: Olaf Scholten, Steven A. Cummer, Joseph R Dwyer, et al. A Comprehensive analysis of High Resolution VHF Observations with LOFAR of the Positive Initiating Event for Several Lightning Flashes. ESS Open Archive . December 12, 2025.

2: Sterpka, C., Dwyer, J., Liu, N., Demers, N., Hare, B. M., Scholten, O., & ter Veen, S. (2022). Ultra-slow discharges that precede lightning initiation. Geophysical Research Letters, 49, e2022GL101597. https://doi.org/10.1029/2022GL101597

3: terpka, C., Dwyer, J., Liu, N., Hare, B. M., Scholten, O., Buitink, S., et al. (2021). The spontaneous nature of lightning initiation revealed. Geophysical Research Letters, 48, e2021GL095511. https://doi.org/10.1029/2021GL095511


How to cite: Sterpka, C., Hare, B., Scholten, O., Turekova, P., Lourens, M., Wu, B., Dwyer, J., Liu, N., and Cummer, S.: Small-Scale Discharges in the Thunderstorm Prior to Lightning Initiation, EGU General Assembly 2026, Vienna, Austria, 3–8 May 2026, EGU26-13571, https://doi.org/10.5194/egusphere-egu26-13571, 2026.

EGU26-14016 | ECS | Posters on site | NH1.11

Numerical simulations of TLE generation in the Jovian atmosphere 

Jonathan Bar-Zeev, Yoav Yair, Carynelisa Haspel, and Assaf Hochman

Since the 1953 Urey–Miller experiments, which produced organic precursors through electrical discharges in a simulated primordial Earth, electrical activity has been recognized as crucial for atmospheric evolution. Understanding planetary lightning, therefore, becomes essential when searching for life indicators across planets. Lightning activity has been confirmed through optical observations on Jupiter and Saturn, inferred electromagnetically on Uranus and Neptune, and theoretically predicted for Venus, Mars, and Titan. However, direct lightning detection faces significant challenges. Lightning typically originates in deep convective clouds, often below visible cloud layers where photons are heavily absorbed. This obscuration complicates direct optical detection from space. An alternative approach is to infer lighting by detecting transient luminous events (TLEs; sprites, jets, and Elves) which manifest in the upper atmosphere and produce distinctive optical and chemical signatures potentially more accessible to remote observation. Theoretical considerations based on a simple 1D quasi-electrostatic model (Yair et al., 2009; https://doi.org/10.1029/2008JE003311) predicted the possible occurrence of sprites on Jupiter, presuming that lightning discharges behave as on Earth (Kolamšová et al., 2023; https://doi.org/10.1038/s41467-023-38351-6). Recently, Giles et al. (2020; https://doi.org/10.1029/2020JE006659) reported the detection of unusual optical emissions in Juno images of Jupiter. Eleven bright transient flashes were observed by the spacecraft's UV instrument, with an average duration of 1.4 ms. They were located 260 km above the 1-bar level of Jupiter's atmosphere and were dominated by H2 emission. These observations are consistent with TLEs (possibly Elves). We present results from a three-dimensional quasi-electrostatic model of TLE generation developed by Haspel et al. (2022; https://doi.org/10.1016/j.jastp.2022.105853), which has been adapted to the Jovian atmospheric conditions for this study. The simulations investigate TLE inception volumes across different cloud configurations (parameters include the magnitude and spatial distribution of charge moments in deep H2O clouds at 5 bars, and shallow NH3 clouds at ~1 bar). Results demonstrate that sprites can form in Jupiter's mesosphere when lightning-induced quasi-electrostatic fields exceed the breakdown threshold appropriate for H₂-He mixtures at mesospheric pressures. The simulations reveal the altitude ranges and conditions where electric field-to-neutral density ratios reach critical values for electron avalanche inception and streamer development. Results from simulations of thunderstorms and TLE generation on Saturn will also be presented.

How to cite: Bar-Zeev, J., Yair, Y., Haspel, C., and Hochman, A.: Numerical simulations of TLE generation in the Jovian atmosphere, EGU General Assembly 2026, Vienna, Austria, 3–8 May 2026, EGU26-14016, https://doi.org/10.5194/egusphere-egu26-14016, 2026.

Previous studies have demonstrated that electrodynamic effects can sometimes be important in simulations of elves, sprite halos, and sprite initiation. To examine the extent to which such effects contribute to the evolution of regions of possible sprite inception, we extend our fully three-dimensional quasi-electrostatic (QES) model of the electric field above thunderstorms to include dynamic effects. The original QES model employed the method of images for every charge in the domain at every time step, eliminating the need for spatial finite differencing of the electric potential or electric field and yielding a numerically stable and accurate solution of the QES equations (see, e.g., Haspel and Yair, 2025; doi:10.1016/j.asr.2025.01.013). In the present implementation, we add the electric induction (“velocity”) term to the Coulomb term in the expression for the electric field produced by each charge in the domain. In addition, we replace instantaneous time with retarded time, such that the model is also fully causal; a change in charge density at point A does not manifest in a change in the electric field at point B until that “signal” has time to propagate from A to B. The resulting Coulomb and induction contributions are structurally equivalent to the corresponding terms in Jefimenko’s formulation. This approach lies between traditional QES models and full-wave electromagnetic models and may be described as quasi-electrodynamic rather than quasi-electrostatic. It allows induction and causality effects to be included throughout the entire domain without spatial finite differencing and without an explicit representation of the lightning channel as used in transmission-line or EMP models. We find that the inclusion of causality delays the formation of regions of possible sprite inception and, together with the induction term, produces regions that persist longer than in traditional QES simulations with otherwise identical simulation parameters. Initial results from this extended model will be presented and discussed.

How to cite: Haspel, C.: A quasi-electrodynamic model for examining the effects of induction and causality in simulating regions of possible sprite inception in the mesosphere, EGU General Assembly 2026, Vienna, Austria, 3–8 May 2026, EGU26-14177, https://doi.org/10.5194/egusphere-egu26-14177, 2026.

EGU26-14486 | Posters on site | NH1.11

Electric Field Responses to Airborne Dust in FAAM Aircraft Measurements 

Sakina Alblooshi, Keri Nicoll, Giles Harrison, and Claire Ryder

Mineral dust influences radiation, clouds, and air quality, and can acquire electric charge through particle interactions and turbulent mixing. Observations of dust electrification at aircraft altitudes remain limited. Aircraft measurements provide a valuable opportunity to investigate how atmospheric electric fields respond to airborne dust under varying thermodynamic and aerosol conditions.

We analyse observations from the FAAM aircraft during flights sampling Saharan dust layers, to investigate electric field mill records associated with airborne dust regions. The electric field mill employed senses the ambient vertical electric field indirectly, but does not directly sample particles. It responds to electric fields induced by charged aerosols, the aircraft, and the surrounding atmosphere. Electric field measurements are analysed alongside co-located thermodynamic, wind, aerosol, and cloud observations, including ascent and descent profiles through dust plumes of varying intensity. In an intense dust case, the electric field signal strengthens as the aircraft approaches and enters the main dust layer at mid-tropospheric altitudes, coincident with decreasing relative humidity and enhanced aerosol loading. These results indicate that the electric field measurements are sensitive to electrically active dust layers aloft, providing new constraints on how dust charging evolves with altitude, humidity, and particle loading.


How to cite: Alblooshi, S., Nicoll, K., Harrison, G., and Ryder, C.: Electric Field Responses to Airborne Dust in FAAM Aircraft Measurements, EGU General Assembly 2026, Vienna, Austria, 3–8 May 2026, EGU26-14486, https://doi.org/10.5194/egusphere-egu26-14486, 2026.

EGU26-15056 | ECS | Posters on site | NH1.11

Filling the Gap: Lightning Climatology of Southwest Asia, Northeast Africa, and the Eastern Mediterranean 

Gayane Karapetyan, Reik V. Donner, Hripsime Mkrtchyan, and Davit Aslanyan

Lightning is a fundamental part of the Earth's climate system, occurring worldwide at a rate of about 45 flashes per second on average. It has recently been recognized as an Essential Climate Variable and serves as an indicator of thermodynamic instability.

In the past years, lighting climatologies have been derived for various regions worldwide. However, this does not yet include vast parts of Southwest Asia, i.e., the broader region encompassing the Eastern Mediterranean, Black Sea, Caspian Sea, Red Sea, and Persian Gulf, as well as the Middle East (Anatolia, Levant, and Arabian Peninsula) and the Caucasus regions. Unlike the tropical lightning hotspots (e.g., the Congo Basin or Venezuela), this area is often overlooked in global lightning studies due to its lower overall flash density. Despite its low average flash rates, the region displays complex and rather unique interactions between distinct atmospheric circulation patterns and local thermodynamic processes in the atmosphere.

This study aims to unravel the complex factors that control lightning activity in a transitional zone where these different physical processes intersect. Specifically, a reliable lightning climatology for Southwest Asia and the neighboring regions is developed that combines data from available space missions and different ground-based detection networks for the period 2017-2023. The resulting spatial patterns of lightning flash density, along with their seasonal and inter-annual variability, contribute to a better understanding of the effects of orography, land-sea configuration, land cover, and prevailing regional weather patterns on lightning. In order to attribute the obtained activity patterns to specific thermodynamic conditions and aerosol-cloud interactions that sustain electrification even in areas with limited moisture availability, atmospheric reanalysis data are employed with a focus on cloud properties.

How to cite: Karapetyan, G., Donner, R. V., Mkrtchyan, H., and Aslanyan, D.: Filling the Gap: Lightning Climatology of Southwest Asia, Northeast Africa, and the Eastern Mediterranean, EGU General Assembly 2026, Vienna, Austria, 3–8 May 2026, EGU26-15056, https://doi.org/10.5194/egusphere-egu26-15056, 2026.

EGU26-15307 | ECS | Orals | NH1.11

Thermal Instability as a Critical Precursor to Transmission Line Lightning Trips: A 12-Hour Pre-Event Analysis in North China 

Muzi Li, Jianguo Wang, Yadong Fan, Yijun Huang, Quanxin Li, and Yifan Li

Lightning continues to challenge high-voltage transmission reliability, accounting for approximately 40-60% of recorded line trips. However, the lightning nowcasting and short-term warning products currently used in power grid operations often provide insufficient lead time for actionable transmission-line protection and dispatch.

Here we integrate a 10-year utility dataset of lightning-induced 500 kV transmission line trips in North China with cloud-to-ground (CG) lightning observations and ERA5 reanalysis to quantify the 12 h pre-event evolution of the atmospheric environment. We define three 12-h pre-event samples using different reference points: (i) Line trips (LT) cases centred on the trip location; (ii) Thunderstorms without line trips (WLT) cases centred on the tower closest to where a thunderstorm intersects the line corridor; and (iii) Non-thunderstorm (NT) controls centred on the same tripping location, sampled at the same local time within ±7 days of each LT event under lightning-free conditions in the preceding 12 h.

Compared with NT controls, both LT and WLT events occur in a more convectively favourable environment, with higher total column water vapour (TCWV), convective available potential energy (CAPE), and lower lifting condensation level (LCL). They also show stronger lifting—more negative 700 and 850 hPa vertical velocity and enhanced low-level convergence. Within thunderstorms, however, LT events tend to occur in an instability-dominated regime, with higher CAPE and steeper 700-500 hPa temperature lapse rates than WLT events. By contrast, WLT events are more “water-loaded,” showing higher TCWV and stronger integrated water vapour transport (IVT), together with stronger lifting—yet weaker CAPE and lapse rates.

These results suggest that instability-focused precursors can help discriminate tripping risk and motivate environment-based indicators to extend operational lead time for transmission line lightning protection.

How to cite: Li, M., Wang, J., Fan, Y., Huang, Y., Li, Q., and Li, Y.: Thermal Instability as a Critical Precursor to Transmission Line Lightning Trips: A 12-Hour Pre-Event Analysis in North China, EGU General Assembly 2026, Vienna, Austria, 3–8 May 2026, EGU26-15307, https://doi.org/10.5194/egusphere-egu26-15307, 2026.

EGU26-15467 | ECS | Orals | NH1.11

Characterising Uranus’ Ionisation and Conductivity Profile 

Ola Al-Khuraybi, Karen Aplin, and Alberto Gambaruto

Uranus is an Ice Giant planet, a class of large, cold planets characterized by thick atmospheres and the absence of a well-defined solid surface. Hence, atmospheric processes are fundamental to understanding the planet’s physical and chemical environment. Atmospheric ionisation on Earth is driven by solar radiation and energetic particles, radioactive gases and Galactic Cosmic Rays (GCRs) [1].  GCR-induced ionisation is believed to be dominant on Uranus due to its distance from the Sun. In this work, we model the GCR air showers using CORSIKA8 Monte Carlo simulations [2] and calculate the vertical ionisation rate. We capture the variation of ionisation rates with geomagnetic latitude in a novel global map and, for the first time, present a quantitative comparison with ionospheric ionisation rates derived from parameters adopted from the literature. The results show GCR-induced ionisation in the lower stratosphere (peaking at ~104 Pa) to be around two orders of magnitude larger than ionospheric ionisation (<10-1 Pa), highlighting the significance of GCRs in Uranus’s atmosphere and raising questions about potential seasonal variability associated with solar-driven ionospheric processes.

The conditions in the lower stratosphere were carefully constrained, and with appropriate assumptions regarding steady-state conditions and dominant recombination mechanisms, the ion balance equation was solved to estimate the positive ion and electron number densities. Ion and electron densities peak at approximately the same altitude as the peak of GCR-induced ionisation with an upper limit of ~2×10⁹ ions m-3 in the absence of aerosols, while the inclusion of aerosols leads to a difference between positive ion (~109 ions m-3) and electron densities (~108 electrons m-3). The electrical characteristics as well as cloud microphysics assumptions allow investigation of the possibility and nature of lightning activity expected on Uranus.

[1] Hillas, A. M. (1972). Cosmic rays (1st ed.). New York: Oxford ; New York : Pergamon Press.

[2] Gottowik, M. (2025). Corsika 8: A modern and universal framework for particle cascade simulations. arXiv preprint arXiv:2508.08755.

How to cite: Al-Khuraybi, O., Aplin, K., and Gambaruto, A.: Characterising Uranus’ Ionisation and Conductivity Profile, EGU General Assembly 2026, Vienna, Austria, 3–8 May 2026, EGU26-15467, https://doi.org/10.5194/egusphere-egu26-15467, 2026.

EGU26-16186 | Orals | NH1.11

Characteristics of atmospheric electricity of thunderclouds accompanied by severe hailfall 

Masashi Kamogawa, Hironobu Fujiwara, and Tomoyuki Suzuki

In recent years, it has been pointed out that there has been an increase in the number of localised heavy rain and hailstorms in urban areas, which are thought to be caused by climate change and extreme weather. It is said to be difficult to distinguish whether a thundercloud (cell) that causes localised hailstorms or heavy rain is a cell that will produce hailstorms or heavy rain, based on observations of the reflection intensity of the weather radar alone. In this study, we consider extreme weather events that cause hailstorms and heavy rain from the perspective of lightning discharges, distinguishing between cells that lead to hailstorms and cells that do not lead to hailstorms but only to heavy rain. We compared two cells in the same meteorological field in three cases that occurred in the Tokyo metropolitan area. We compared the cells that led to hailstorms with the control cells that only led to heavy rain. As a result, we found the following common characteristics.

1) The number of ±CG strokes in cells with heavy rain but no hail is larger than in cells with hail.

2) The volume of ice calculated from polarimetric radar in cells with hail is larger than in cells with heavy rain but no hail.

As a result, the possibility of discriminating between cells with and without hail has increased. This study is a re-evaluation of the results obtained by Fujiwara et al, (J. Atmos. Electriciy, 2021; 2023).

How to cite: Kamogawa, M., Fujiwara, H., and Suzuki, T.: Characteristics of atmospheric electricity of thunderclouds accompanied by severe hailfall, EGU General Assembly 2026, Vienna, Austria, 3–8 May 2026, EGU26-16186, https://doi.org/10.5194/egusphere-egu26-16186, 2026.

EGU26-16950 | ECS | Posters on site | NH1.11

Gamma-ray Stacking Analysis of Streamer Dominated Discharges detected by ASIM 

Anders Fuglestad, Martino Marisaldi, Andrey Mezentsev, David Sarria, Nikolai Østgaard, Torsten Neubert, and Francisco Gordillo-Vázquez

In 2023, the Airborne Lightning Observatory for FEGS and TGFs (ALOFT) flight campaign discovered a weaker population of TGFs previously undetected by satellite instruments. These weak TGFs were estimated to have source photons in the range of 10^12 to 10^16 (>100keV) at 15km reference altitude. [Bjørge-Engeland 2024; Fuglestad 2025] 

By studying the population of weaker TGFs, it was found that a significant fraction of TGFs are associated with fast streamer discharges occurring in the gamma-ray-glowing portions of the thundercloud. These TGF distinguish themselves from the classical satellite-detected TGFs due to not having a prominent optical pulse in 777.4 nm associated with a lightning leader, having a short (about 1μs) rise time and being accompanied by a strong 337.1 nm optical pulse associated with streamers. Based on these observations, we hypothesize that these TGFs have a different initiation process than the “classical” leader-associated TGFs, and we therefore considered them a new type of TGF. [Mezentsev 2025] 

Motivated by these findings, we search for gamma-ray signals associated to blue discharges detected by the Atmosphere-Space Interactions Monitor (ASIM) mission. ASIM offers global coverage and a much larger dataset of lightning discharges than ALOFT, at the price of a lower sensitivity to gamma-ray events. We hypothesize therefore that any gamma-ray signal associated to blue discharges in ASIM can be detected only by stacking gamma-ray data associated to a large number of blue discharges.  

In this presentation, we show the results of a stacking analysis of gamma-ray data associated to blue dominated optical discharges detected by ASIM.

References: 

I. Bjørge-Engeland et al. Evidence of a New Population of Weak Terrestrial Gamma—Ray Flashes Observed from Aircraft Altitude. 

https://doi.org/10.1029/2024GL110395 

A. Fuglestad et al. The source brightness distribution of Terrestrial Gamma-ray Flashes from the ALOFT flight campaign.   

A. Mezentsev et al. New Class of Gamma-Ray Flashes Indicate Gamma Glow Rest through Fast Streamer Discharge. 

https://doi.org/10.5194/egusphere-egu25-15838 

How to cite: Fuglestad, A., Marisaldi, M., Mezentsev, A., Sarria, D., Østgaard, N., Neubert, T., and Gordillo-Vázquez, F.: Gamma-ray Stacking Analysis of Streamer Dominated Discharges detected by ASIM, EGU General Assembly 2026, Vienna, Austria, 3–8 May 2026, EGU26-16950, https://doi.org/10.5194/egusphere-egu26-16950, 2026.

EGU26-17409 | Posters on site | NH1.11

Investigating Cosmic-Ray Extensive Air Showers as a Source of Weak TGFs Using GEANT4 and CORSIKA 

David Sarria, Martino Marisaldi, Nikolai Østgaard, Andrew Mezentsev, Nikolai Lehtinen, Øystein Færder, Ingrid Bjørge-Engeland, and Anders Fuglestad

During the ALOFT flight campaign in July 2023, we discovered a population of weak TGFs in the range of 10^12 to 10^15 source photons in brightness (at a reference altitude of 15 km), not detectable by space-based instruments (such as ASIM on the ISS or Fermi) [Bjørge-Engeland 2024; Fuglestad 2025]. While extensive air showers (EAS) were previously discarded as a seeding source for space-observed TGFs (i.e., with source brightness above 10^16 photons) [Dwyer 2008; Carlson 2008], in principle, this does not exclude the possibility that the same mechanism could generate TGFs that are orders of magnitude weaker, like ALOFT’s weak TGFs. This hypothesis consists of EAS generating a large number of seed particles in a very short time, which are then multiplied by the RREA process by a few orders of magnitude. It could also involve some level of relativistic feedback. Furthermore, ALOFT observations suggest that weak TGFs may be due to an abrupt increase in the seed population rather than an increase in the electric field, given the fast rise time (too fast for relativistic feedback) and the fact that the TGF precedes the radio signal.

EAS originate from highly energetic cosmic-ray protons and nuclei showering in the atmosphere. Because Geant4 cannot simulate initial proton energies above 100 TeV, and such energies may be required, we will also use the CORSIKA code (high-energy part) with the FLUKA model (low-energy part), both of which are well-established reference models. A key here to evaluate this hypothesis, is the trade-off between initial cosmic proton fluxes (e.g., per hour per square kilometer) and their energies, as higher energies generate more seed electrons but are less frequent.

In this presentation, we will show a comprehensive evaluation of the possibility of generating weak TGFs via EAS energetic electron seeding in a realistic large-scale thunderstorm electric field close to the RREA threshold.


References:

I. Bjørge-Engeland et al. Evidence of a New Population of Weak Terrestrial Gamma-Ray Flashes Observed From Aircraft Altitude. https://agupubs.onlinelibrary.wiley.com/doi/10.1029/2024GL110395

A. Fuglestad et al. The source brightness distribution of Terrestrial Gamma-ray Flashes from the ALOFT flight campaign.

J. R. Dwyer. Source mechanisms of terrestrial gamma-ray flashes. https://doi.org/10.1029/2007JD009248

Carlson, B. E., N. Lehtinen et al. (2008). Runaway relativistic electron avalanche seeding in the Earth’s atmosphere. https://agupubs.onlinelibrary.wiley.com/doi/pdf/10.1029/2008JA013210

How to cite: Sarria, D., Marisaldi, M., Østgaard, N., Mezentsev, A., Lehtinen, N., Færder, Ø., Bjørge-Engeland, I., and Fuglestad, A.: Investigating Cosmic-Ray Extensive Air Showers as a Source of Weak TGFs Using GEANT4 and CORSIKA, EGU General Assembly 2026, Vienna, Austria, 3–8 May 2026, EGU26-17409, https://doi.org/10.5194/egusphere-egu26-17409, 2026.

EGU26-17570 | Posters on site | NH1.11

Comparison study on the MTG LI and WWLLN lightning data sets 

Péter Steinbach, Tamás Bozóki, Kolos Németh, and János Lichtenberger

Tropospheric lightnings are fundamental sources of natural ultra-wide band (UWB) electromagnetic waves, utilised in various fields of exploration of the upper atmosphere and the plasma environment. Lightnings are observed by numerous detection systems, deployed as ground networks or operated on satellites/cubesats, all exhibiting specific limitations in detection efficiency (DE), sensibility, spatial coverage, and overall performance.

We have compared the flash database of the LI optical experiment onboard the Meteosat Third Generation (MTG) geostationary satellite (0° longitude, operational since July 2024) with the ground-based WWLLN VLF stroke data set in the period of July 2024 – May 2025, within the FoV of the MTG sensors. For that purpose the necessary correction of the location and time coordinates was first performed in the MTG data set. This step sets the spacecraft observation time backwards with the propagation time (approx. 120-140 ms), and also decreases the latitude and longitude coordinates towards the sub-satellite line due to the finite altitude of the observed optical phenomenon at cloud top. 

The ratio of the detected events, binned in a 1° by 1° raster in the African continental region, varying somewhat geographically, falls in the remarkable range of several hundreds. This difference can be explained partly by the known poor DE of the WWLLN over Africa, and by the fact that MTG LI detects total lightning (cloud-to-ground and intracloud/cloud-to-cloud), while WWLLN primarily detects strong CGs. A one-by-one matching of MTG flashes with detected WWLLN strokes, applying temporal and spatial windowing (±330 ms, and <25 km, respectively) was also completed. This analysis exhibited clear asymmetry in the distribution of the time offsets between matching events (time stamps of MTG flashes seem to precede the corresponding WWLLN time values by tens of ms). The distribution of spatial separation of matching pairs has a maximum at 8 km. Due to the reasonably strict conditions used in matching pair selection, the overwhelming number of detected lightnings in the MTG LI data set is not seen in the one-by-one comparison: 97.3 % of WWLLN to MTG LI matchings are single event pairs, a multiplicity factor of 2 is represented only by 2.5 % of matched events.

How to cite: Steinbach, P., Bozóki, T., Németh, K., and Lichtenberger, J.: Comparison study on the MTG LI and WWLLN lightning data sets, EGU General Assembly 2026, Vienna, Austria, 3–8 May 2026, EGU26-17570, https://doi.org/10.5194/egusphere-egu26-17570, 2026.

EGU26-18193 | Posters on site | NH1.11

Towards the Remote Sensing of Electric Fields in the Atmosphere 

Alison Waterfall, Caroline Cox, and Elin McCormack

In this presentation we describe a proof-of-concept study on the possibility of detecting high electric fields in the atmosphere  e.g. around thunderstorms, using remote sensing techniques.  Current methods to measure electric field profiles through the atmosphere rely on radiosondes or aircraft operating in conditions where the instrument is prone to damage or give unreliable results.   We are investigating the feasibility of an alternative approach, which exploits the sensitivity of certain molecules to their electrical environment through the so-called Stark effect, whereby certain spectral lines are shifted in response to an external electric field.   This has the potential for the measurement of high electric fields above thunderstorms, although it does present a number of challenges .   In our study, we have been using radiative transfer models to simulate the effect of electric fields (such as are typically found around thunderstorm clouds)  on atmospheric spectra, looking in particular at THz wavelengths and focusing on selected candidate spectral lines of HDO.    Here, we will present our latest results.

How to cite: Waterfall, A., Cox, C., and McCormack, E.: Towards the Remote Sensing of Electric Fields in the Atmosphere, EGU General Assembly 2026, Vienna, Austria, 3–8 May 2026, EGU26-18193, https://doi.org/10.5194/egusphere-egu26-18193, 2026.

Intense lightnings and hailfall are both hallmarks of severe convective storms, but they are rarely associated with long-term climate studies. The main reason is the lack of long-term observations. But recently, the term “extreme weather” is often cited in media as a possible dire consequence of worsening global warming in the foreseeable future, however, it is often ambiguous of what type of extreme weather they are referring to. Most recent future predictions are done by performing climate model simulations under certain global warming scenarios. However, the resolution of the current generation climate models is not good enough to resolve individual storm system let alone pinning down the physical mechanisms. This ambiguity in physical mechanism impedes the better understanding of the nature of these extreme weather/climate events. In this paper, we present a unique study to show that severe storms with intense lightnings and hailfall are indeed connected with long-term climate change.

 In this study, we utilize the meteorological series derived from the REACHES climate database compiled from Chinese historical documents (Wang et al., 2018; 2024, Nature: Scientific Data) and extract temperature, lightning and hailfall times series for the period of 1368-1911 (a 543-year period) and performed correlation analysis among them. Our results show that there exists strong negative correlation between either temperature-lightning or temperature-hailfall pair. This means that severe convective storms as manifested by intense lightning and heavy hailfall occurred in colder climate periods. The correlation coefficients for both pairs are close to -0.9 for the 30-year moving average series. Such a stable correlation over such a long period indicates that this cannot be a random coincidence but there must be persistent physical mechanisms involved. The temperature-lightning correlation is stronger, indicating that the climate physical state must be closely connected with atmospheric electricity.

We have made further analyses by looking into different seasons to understand the seasonal variations of the above negative correlation. We will also investigate the regional variations of the above relation. These results will shed more lights to the physical mechanisms responsible for this phenomenon. We will also utilize physics-based storm model simulation results to understand the possible dynamical processes involved.  

How to cite: Wang, P. K.: A long-term atmospheric electricity-climate connection study using a 543-year long historical data set, EGU General Assembly 2026, Vienna, Austria, 3–8 May 2026, EGU26-18253, https://doi.org/10.5194/egusphere-egu26-18253, 2026.

EGU26-18708 | Posters on site | NH1.11

New class of TGF discovered during ALOFT 2023 campaign 

Andrey Mezentsev, Nikolai Østgaard, Martino Marisaldi, David Sarria, Nikolai Lehtinen, Øystein Færder, Ingrid Bjørge-Engeland, Steve Cummer, Yunjiao Pu, Mason Quick, Timothy Lang, Marni Pazos, and Mark Stanley
Terrestrial gamma-ray flashes (TGFs) were known to be produced in close association with upward +IC leaders, which was confirmed by years of observations of ASIM. Whenever there was a simultaneous observation of a TGF and optical signatures from the parent storm clouds, the red 777.4 nm optical pulse was present, indicative of a lightning leader chanel. 
 
During the ALOFT 2023 flight campaign, a new type of TGF was discovered: the TGFs that do not involve any lightning leader during their production, and always associated with fast streamer discharge. This is confirmed by both optical data (337 nm blue emission characteristic for streamer discharge) and radio recordings, both on-board the ER-2 aircraft and ground based low frequency radio receivers. 
 
These TGFs occur during active gamma-glowing episodes, and the TGF precedes the streamer discharge by 5-10 microseconds, which means that the TGF was produced by a sudden increase in the seed population of relativistic electrons in the already-existing high-field region. This circumstance brings in the idea of an Extensive Atmospheric Shower (EAS) to be the trigger mechanism that initiates fast streamer discharges in the upper parts of the tropical thunderclouds.

How to cite: Mezentsev, A., Østgaard, N., Marisaldi, M., Sarria, D., Lehtinen, N., Færder, Ø., Bjørge-Engeland, I., Cummer, S., Pu, Y., Quick, M., Lang, T., Pazos, M., and Stanley, M.: New class of TGF discovered during ALOFT 2023 campaign, EGU General Assembly 2026, Vienna, Austria, 3–8 May 2026, EGU26-18708, https://doi.org/10.5194/egusphere-egu26-18708, 2026.

EGU26-19365 | ECS | Posters on site | NH1.11

Discharge processes associated with fast decaying gamma-ray glows observed during the ALOFT aircraft campaign 

Ingrid Bjørge-Engeland, Martino Marisaldi, Nikolai Østgaard, Andrey Mezentsev, Anders Fuglestad, Steven Cummer, Yunjiao Pu, Mason Quick, and Hugh Christian

From the discoveries by the Airborne Lightning Observatory for FEGS and TGFs (ALOFT), we know that thunderclouds can emit gamma-rays for hours over very large distances. Marisaldi et al. (2024) reported observations of numerous glowing regions, each containing several individual glows, as the aircraft passed over active thunderclouds. Overall, ALOFT detected more than 500 glows, showing a wide variety of time profiles, including glows with a gradual decay and those with a very sharp decrease in gamma-ray flux after reaching the peak intensity. Making use of the combination of instruments onboard ALOFT, as well as ground-based sensors, we explore the termination of gamma-ray glows detected by ALOFT. In this study, we focus on glows with a very fast decrease in flux (reduction by >50% in <20 ms) and explore which types of electric discharges are associated with this fast termination.


References:

Marisaldi, M. et al. (2024), Highly dynamic gamma-ray emissions are common in tropical thunderclouds, Nature, 634, 57, doi.org/10.1038/s41586-024-07936-6

How to cite: Bjørge-Engeland, I., Marisaldi, M., Østgaard, N., Mezentsev, A., Fuglestad, A., Cummer, S., Pu, Y., Quick, M., and Christian, H.: Discharge processes associated with fast decaying gamma-ray glows observed during the ALOFT aircraft campaign, EGU General Assembly 2026, Vienna, Austria, 3–8 May 2026, EGU26-19365, https://doi.org/10.5194/egusphere-egu26-19365, 2026.

Mini-EUSO is a space-based ultraviolet telescope operating aboard the International Space Station since 2019 as part of the JEM-EUSO Programme. The instrument monitors the Earth’s night-time atmosphere in the 290–430 nm wavelength range with a temporal resolution of 2.5 μs and a ground spatial resolution of approximately 5–6 km. In addition to its high time resolution, Mini-EUSO combines imaging capabilities with high sensitivity, enabled by a 25 cm diameter optical system, allowing the detection of fast and faint UV emissions associated with atmospheric electrical activity.

In this contribution, we present the analysis of a population of fast, short-duration UV transients, referred to as Short Light Transients (SLTs), with typical timescales between 100 μs and 200 μs detected by Mini-EUSO. These events are stationary within the spatial resolution of the detector and are frequently followed, at the same geographical location, by additional atmospheric emissions occurring within 1–200 ms. The observed temporal correlations and spatial localization suggest a connection with rapid atmospheric electrical processes, potentially related to lightning activity or to early-stage or precursor phenomena associated with transient luminous events.

The combination of microsecond-scale temporal resolution, imaging capability, and high optical sensitivity makes Mini-EUSO particularly well suited for the investigation of fast, localized UV emissions that are challenging to observe with conventional lightning and atmospheric monitoring instruments.
In addition to the SLTs discussed here, Mini-EUSO has recorded a wide range of lightning-related and transient luminous phenomena, highlighting the potential of space-based UV observations for the study of fast electrical processes in the atmosphere.

How to cite: Battisti, M.: Short Light Transients and millisecond-scale follow-up emissions observed by Mini-EUSO, EGU General Assembly 2026, Vienna, Austria, 3–8 May 2026, EGU26-19685, https://doi.org/10.5194/egusphere-egu26-19685, 2026.

EGU26-20179 | Orals | NH1.11

Atmospheric adsorbates break symmetry in oxide electrification 

Scott Waitukaitis and Galien Grosjean

From sandstorms and volcanic plumes, electrical charging of small particles is of critical importance in many geophysical settings. How do the particles in these systems become charged in the first place? In this talk, I will discuss our experimental work on the transfer of electrical charge that occurs when two solid objects are contacted and separated. We focus on oxides (e.g., SiO₂) as they are the most abundant and relevant class of materials on the earth, which presents a number of challenges. First, they are extremely hard, which means their contact areas—and hence charge exchange—are extremely small. Second, direct handling introduces spurious charge that can overwhelm the signal we wish to measure. We overcome these challenges using acoustic levitation, which enables thousands of automated, hands-free contacts and charge measurements with few-hundred-electron resolution on macroscopic samples. Our experiments reveal that oxide contact electrification is not due to any bulk material property, but instead arises from surface adsorbates—specifically adventitious hydrocarbons—acquired by objects from the air that surrounds them. These findings, now in press at Nature, are the long sought source of particulate charging in settings ranging from desert sands to volcanoes and beyond.

How to cite: Waitukaitis, S. and Grosjean, G.: Atmospheric adsorbates break symmetry in oxide electrification, EGU General Assembly 2026, Vienna, Austria, 3–8 May 2026, EGU26-20179, https://doi.org/10.5194/egusphere-egu26-20179, 2026.

EGU26-20216 | ECS | Orals | NH1.11

Measuring NOx and O3 emissions from laboratory generated lightning  

Connor McGurk, Daniel Peters, Elin McCormack, David Clark, Meirion Hills, Christopher Stone, and Daniel Mitchard

Lightning flashes are a major source of tropospheric NOx, which leads to the production of tropospheric O3 (Elshorbany et al., 2024). Tropospheric O3 is an important greenhouse gas (Skeie et al., 2020), and lightning rates are predicted to increase with global warming (e.g., Pinto & Pinto, 2020; Romps et al., 2014), creating a positive feedback loop. Laboratory-based measurements are a means to improve the parameterisation of this source to improve the accuracy of climate models. 

We sampled concentrations of NO, NO2 and O3 produced following lightning generated at Cardiff University’s Lightning Laboratory, the only university-based research laboratory of its type in Europe. The laboratory generated D waveforms (peak currents ranging from 10 to 100 kA over 100 µs) and C waveforms (~250 A for 0.5 s) conforming to the EUROCAE ED-84 and its SAE equivalent standards. The D waveform represents the initial impulse and any subsequent restrikes, whereas the C represents the long-duration continuing current seen in ~10% of lightning waveforms (Pérez-Invernón et al., 2023). An array of low-cost sensors recorded gas concentrations following strikes. Despite some disruption due to the lightning Electro-Magnetic Pulse (EMP), and instances where high concentrations have saturated the sensors, initial results demonstrate the feasibility of measuring lightning NOX and O3 generation in the laboratory. This provides a foundation for future developments with a view to better quantifying the impact of lightning strikes on tropospheric chemistry and investigating how this varies with the waveform and power dissipated by the strike. 


References 

Elshorbany, Yasin, et al. “Tropospheric Ozone Precursors: Global and Regional Distributions, Trends, and Variability.” Atmospheric Chemistry and Physics, vol. 24, no. 21, 5 Nov. 2024, pp. 12225–12257, acp.copernicus.org/articles/24/12225/2024/?form=MG0AV3, https://doi.org/10.5194/acp-24-12225-2024. 

J., Osmar Pinto, and Iara R. C. A. Pinto. “Lightning Changes in Response to Global Warming in Rio de Janeiro, Brazil.” American Journal of Climate Change, vol. 09, no. 03, 2020, pp. 266–273, https://doi.org/10.4236/ajcc.2020.93017. 

Pérez-Invernón, Francisco J., et al. “Variation of Lightning-Ignited Wildfire Patterns under Climate Change.” Nature Communications, vol. 14, no. 1, 10 Feb. 2023, https://doi.org/10.1038/s41467-023-36500-5. 

Romps, D. M., et al. “Projected Increase in Lightning Strikes in the United States due to Global Warming.” Science, vol. 346, no. 6211, 13 Nov. 2014, pp. 851–854, science.sciencemag.org/content/346/6211/851, https://doi.org/10.1126/science.1259100. 

Skeie, Ragnhild Bieltvedt, et al. “Historical Total Ozone Radiative Forcing Derived from CMIP6 Simulations.” Npj Climate and Atmospheric Science, vol. 3, no. 1, 17 Aug. 2020, https://doi.org/10.1038/s41612-020-00131-0. 

How to cite: McGurk, C., Peters, D., McCormack, E., Clark, D., Hills, M., Stone, C., and Mitchard, D.: Measuring NOx and O3 emissions from laboratory generated lightning , EGU General Assembly 2026, Vienna, Austria, 3–8 May 2026, EGU26-20216, https://doi.org/10.5194/egusphere-egu26-20216, 2026.

Mini-EUSO (Multiwavelength Imaging New Instrument for the Extreme Universe Space Observatory) is a compact ultraviolet telescope operating aboard the International Space Station since 2019, observing the Earth’s atmosphere in the 290-430 nm band from nadir. It is a part of the JEM-EUSO programme, aimed at developing technologies for the observation of ultra-high-energy cosmic rays (UHECRs) from space. The instrument comprises two 25 cm Fresnel lenses and a focal surface of 36 multi-anode photomultiplier tubes (2304 pixels), providing a 44° field of view and a time resolution of 2.5 μs. With an angular pixel size of ∼0.86°, Mini-EUSO has a spatial resolution of ∼6 km at ground level and ∼5 km at ionospheric altitudes, allowing for detailed imaging of fast transient luminous events.

Since the beginning of operations, Mini-EUSO has recorded approximately 50 ELVES. A large fraction of the observed events exhibit complex morphologies, most notably multi-ring structures. Understanding the diversity of ELVES morphologies requires quantitative measurements of their dynamics (ring radius and expansion speed), energetics, and internal ring morphology.

We present results from a dedicated analysis pipeline that reconstructs the spatio-temporal development of ELVES UV emission at microsecond time scales. Mini-EUSO’s fast imaging allows us to measure ring properties such as thickness and brightness variations along the ring, and to follow how these features evolve in time. These measurements help constrain ELVES production mechanisms and the relative role of different EMP propagation paths. In several cases, the reconstructed timing and ring morphology are compatible with, and suggest, a “ground reflection” contribution, where additional ELVES rings may be associated with an EMP component reflected from the Earth’s surface. These observations highlight the capability of compact space-based UV instruments to advance ELVES physics and to probe EMP-ionosphere coupling with unprecedented detail.

How to cite: Plebaniak, Z.: Probing lightning-ionosphere coupling with Mini-EUSO: timing and morphology of multi-ring ELVES, EGU General Assembly 2026, Vienna, Austria, 3–8 May 2026, EGU26-20296, https://doi.org/10.5194/egusphere-egu26-20296, 2026.

EGU26-20775 | ECS | Posters on site | NH1.11

Multi-scale causal analysis of processes causing lightning and implications to Energy infrastructure 

Xiaoyu Wang, Xinyuan He, Aisha Ali, Martin Fullekrug, and Chenghong Gu

Lightning is a key manifestation of severe convective weather and poses a significant natural hazard to power infrastructure, particularly overhead transmission lines and towers. However, lightning occurrence is governed by the combination of multiple atmospheric and cloud-scale processes. Existing studies largely rely on correlation-based analyses, which provide limited insight into the temporal roles of different precursors prior to lightning.

In this study, we develop an event-driven, multi-scale causal analysis framework based on a large set of real-world lightning events over the UK. Each lightning event is temporally aligned with its preceding atmospheric evolution, combining hourly ERA5 reanalysis variables, including temperature, moisture, and precipitation, with high-temporal-resolution satellite-derived cloud-top height observations. Causal discovery methods are applied to identify lagged relationships at the hourly scale, while robust lag analysis is used to characterise short-timescale cloud-top evolution. The analysis reveals that lightning events are commonly preceded by physically consistent, ordered triggering processes. As a case study, we discuss the implications for power infrastructure risks. The proposed framework provides a data-driven and physically interpretable basis for assessing lightning-related risks to transmission networks and other assets.

How to cite: Wang, X., He, X., Ali, A., Fullekrug, M., and Gu, C.: Multi-scale causal analysis of processes causing lightning and implications to Energy infrastructure, EGU General Assembly 2026, Vienna, Austria, 3–8 May 2026, EGU26-20775, https://doi.org/10.5194/egusphere-egu26-20775, 2026.

EGU26-21097 | ECS | Posters on site | NH1.11

Gamma-ray production associated with blue dominated lightning discharges in glowing thunderclouds observed by ALOFT 

Rabeah Khan, Martino Marisaldi, Ingrid Bjørge-Engeland, Nikolai Østgaard, and Mason Quick

Recent data from the ALOFT flight campaign have confirmed the lightning activity and high energy particle acceleration interconnection. The results comprised the discovery of a large fraction of low-brightness Terrestrial Gamma-ray Flashes (TGFs), signifying that the bright flashes observed from space account for only a small fraction of these events. Many of these weak TGFs, undetectable from space, are associated with a prominent 337.1 nm optical pulse and differ from those detected from space by the lack of 777.4 nm dominated lightning discharges [Mezentsev et al. 2025]. Brightness down to 1012 photons at a source reference altitude of 15 km have been observed and there is no theoretical reason that opposes the existence of dimmer TGFs [Bjørge-Engeland et al. 2024; Fuglestad et al. 2025].

Although detection of individual events would be prevented due to instrument sensitivity, this project aims to tackle this obstacle by stacking the gamma-ray signals in timeframes prior to the emergence of blue dominated lightning discharges. If a substantial population of dim TGFs below the sensitivity threshold for ALOFT exists, it should appear as an enhancement in the cumulated gamma-ray signal.

This presentation focus on the stacking analysis of the gamma-ray data detected by ALOFT in association with the blue dominated lightning discharges. We will present the methodology, the data selection strategy and the preliminary results.


References:

A. Mezentsev et al. (2025). New Class of Gamma-Ray Flashes Indicate Gamma Glow Rest through Fast Streamer Discharge. https://doi.org/10.5194/egusphere-egu25-15838

I. Bjørge-Engeland et al. (2024). Evidence of a New Population of Weak Terrestrial Gamma—Ray Flashes Observed from Aircraft Altitude. Geophysical Research Letters, 51, https://doi.org/10.1029/2024GL110395

A. Fuglestad et al. (2025). The source brightness distribution of Terrestrial Gamma-ray Flashes from the ALOFT flight campaign. Submitted to JGR: Atmospheres

How to cite: Khan, R., Marisaldi, M., Bjørge-Engeland, I., Østgaard, N., and Quick, M.: Gamma-ray production associated with blue dominated lightning discharges in glowing thunderclouds observed by ALOFT, EGU General Assembly 2026, Vienna, Austria, 3–8 May 2026, EGU26-21097, https://doi.org/10.5194/egusphere-egu26-21097, 2026.

EGU26-21100 | Posters on site | NH1.11

Lightning detection on planets using spacecraft and grond-based telescope 

Yukihiro Takahashi, Tatsuharu Ono, Ralph Lorenz, Mitsuteru Sato, Masataka Imai, Yoav Yair, and Georg Fischer

It is essential to clearly separate pulse noise from lightning emissions to detect lightning on planets. Therefore, LAC (lightning and airglow camera) onboard Akatsuki spacecraft sacrificed high spatial resolution by using 32 pixels, instead opting for a high photometric sampling frequency of 20 kHz. This design allows smooth capture of brightness fluctuations, even for short-duration phenomena like terrestrial lightning. Furthermore, based on discharge experiments using CO2, the primary component of Venus's atmosphere, a narrow-band filter for the most prominent oxygen atomic emission line (777 nm) was installed. Sensitivity was set, referencing results from satellite observations on Earth, to detect emissions on Venus even when it is in close approach, down to levels less than one-tenth of those seen in terrestrial lightning. Although the extended elliptical orbit of Akatsuki and its longer period reduced the LAC observation time—which activates only during Venus's shadow—to about one-twentieth of the original planned rate, observations commenced successfully in 2016. However, for the first four years after the start of observations, only cosmic ray pulses were recorded; not a single light curve resembling lightning was obtained. Finally, in March 2020, a single event was triggered and recorded. Its duration was approximately 200 milliseconds, far longer than the typical few milliseconds of Earth lightning. This duration cannot rule out the possibility of a meteor (fireball). However, calculating the probability of a meteor of that brightness being observed by LAC based on the observed luminosity yielded a probability between 0.1% and 8.3%. Furthermore, considering that 200 milliseconds is short for a meteor, the probability of it being a meteor becomes even smaller. On the other hand, some Earth lightning events observed in Earth orbit also have durations exceeding several hundred milliseconds, similar to this LAC event. Based on these facts, while we cannot completely rule out the possibility of it being a meteor or meteorite fall, we believe it is highly likely to be lightning discharge luminescence. Moving forward, we intend to explore the significance of the lightning information obtained on Venus by using the light curve obtained by Akatsuki as a clue to investigate the meteorological conditions under which similar terrestrial lightning occurs. Simultaneously, using the LAC waveform as a reference, we are developing ground-based telescope measurements of lightning emissions utilizing the latest high-speed imaging observation equipment.  

How to cite: Takahashi, Y., Ono, T., Lorenz, R., Sato, M., Imai, M., Yair, Y., and Fischer, G.: Lightning detection on planets using spacecraft and grond-based telescope, EGU General Assembly 2026, Vienna, Austria, 3–8 May 2026, EGU26-21100, https://doi.org/10.5194/egusphere-egu26-21100, 2026.

EGU26-21267 | Posters on site | NH1.11

Comparison of lightning detection from satellite and ground-based measurements during selected cases of convection with hail  

Maja Telisman Prtenjak, Dora Simunec, and Natasa Strelec Mahovic

The development of satellite-based lightning detection has enabled continuous monitoring of total lightning activity over a widespread area. However, in order to properly interpret satellite-derived lightning data, it is important to compare them with existing ground-based lightning detection networks. This study uses satellite observations from Meteosat Third Generation Lightning Imager (MTG LI) and ground-based measurements from the Low-frequency International Lightning Detection Network (LINET). A total of ten hail-producing convective cases over Croatia and neighbouring countries were selected for the period from July 2024 to July 2025.  

The main goal of this research is to compare lightning detection from MTG LI and LINET during different phases of convective storms with hail. Therefore, both spatial and temporal differences in lightning detection before, during and after hail occurrence were analysed. In addition, temporal changes in lightning properties were observed, including flash duration, area and radiance, as well as lightning type, height and current amplitude. To assess the role of storm intensity in the observed differences, the convective mode was determined for selected storms.  

The results show a good spatial agreement between the two measurement systems and a similar temporal evolution of observed lightning activity. However, the number of detected lightning flashes strongly depends on individual storm characteristics, which influence the detection efficiency of both systems. A decrease in flash area, duration and radiance was observed shortly before and during hailfall. 

How to cite: Telisman Prtenjak, M., Simunec, D., and Strelec Mahovic, N.: Comparison of lightning detection from satellite and ground-based measurements during selected cases of convection with hail , EGU General Assembly 2026, Vienna, Austria, 3–8 May 2026, EGU26-21267, https://doi.org/10.5194/egusphere-egu26-21267, 2026.

EGU26-21302 | Orals | NH1.11

One possible mechanism for the formation of recoil leaders and "needles" 

Alexander Kostinskiy and Ondřej Ploc

A phenomenon known as a "recoil leader" has now been reliably established experimentally. Ricoil leaders manifest themselves as waves of luminosity that move toward the channel of a pre-existing bright leader [Mazur, 1989]. On the other hand, radio interferometers have detected the movement of radio emission sources within thunderclouds toward a possibly existing positive leader channel. This phenomenon is known as "needles" [Hare et al., 2019].

We propose a hypothesis that explains recoil leaders and "needles" based on the phenomena of return corona and return leaders, which were observed during experiments with long sparks (30-60 m) [Lupeiko et al., 1984; Baikov et al., 1988, Mrázek, 1996, 1998].

Qualitatively, the process can be explained as follows. As leaders propagate, a streamer corona in front of the leader tip injects charge into the volume around the leader channel (leader sheath) [Bazelyn & Raizer, 1998]. The leader channel is analogous to a high-voltage wire. As the potential on the "wire" increases, the streamer zone expands, and the charge in the sheath increases. This process continues until the electric field in the "wire" (the leader channel) is balanced by the electric field of the sheath charge. If the potential inside the leader channel drops, the sheath's electric field exceeds the channel's electric field. The electric field reverses, resulting in a return corona and/or return leaders.

This mechanism was confirmed experimentally in [Baikov et al., 1988]. The Marx generator generated a positive voltage of 3.4 MV (rise time 300 μs, pulse duration – 10 ms). The leader moved for 2.2 ms and reached a length of 45 meters. The discharge was incomplete, since the leader did not reach the grounded plane, and the leader plasma decay in the air. Despite the nearly constant voltage (after reaching 3.4 MV), each branching or rotation of the leader resulted in pulsations in the current and leader glow (the sheath exchanged charge with the leader channel). After the leader stopped, the current and glow in the gap ceased, and a dark period began, lasting at least 2 ms. The dark period ended with a series of flashes ("recoil leaders"), the glow zone of which coincided in size with the charge sheath. Each individual flash was accompanied by a current pulse of reverse polarity and a voltage surge across the Marx generator's divider capacitance. The charge neutralized in these flashes was approximately 50 μC.

Similar results at positive voltages of 3-4 MV were obtained on a Marx generator in Prague [Mrázek, 1996; 1998].


Baikov A.P. et al. (1988). Electricity, 9, 60 (in Russian)

Bazelyan, E. M., &   Raizer, Y. P. (1998). Spark discharge. Boca Raton, FL: CRC Press

Hare B.M. et al. (2019). Nature, 568, 360

Lupeiko A. V. et al. (1984) Proc. of the All-Union Conf. on Gas Discharge. Tartu: TSU, 1984, v. 2. (in Russian)

Mazur V. (1989) JGR-A, 94, 3326

Mrázek J. (1996). Acta Techn. CSAV, 41, 577

Mrázek J. (1998). Acta Techn. CSAV, 43, 571

How to cite: Kostinskiy, A. and Ploc, O.: One possible mechanism for the formation of recoil leaders and "needles", EGU General Assembly 2026, Vienna, Austria, 3–8 May 2026, EGU26-21302, https://doi.org/10.5194/egusphere-egu26-21302, 2026.

EGU26-21746 | Orals | NH1.11 | Highlight

 Bolt from the blue caught on video 

Martin Fullekrug and Michael Kosch

A bolt from the blue [1,2] was observed simultaneously by ground-based video observations, space-based video with the Lightning Imager on the Meteosat Third Generation geostationary satellite (MTG-LI)  [3,4], and a low-frequency lightning interferometer during field work at Sutherland, South Africa, January 28th, 2025.

The bolt from the blue was initiated by an intra-cloud discharge that connects two charged layers at the edge of a thundercloud. The stepped leader subsequently propagates horizontally away from the cloud. During the development, the lightning leader channel splits into two parts, one which propagates further away horizontally and one which returns towards the cloud but then curves down to Earth where it splits again into two separate strike points on the ground.

The ground-based video observations are paralleled by simultaneous space-based video observations with the Lightning Imager on the Meteosat Third Generation geostationary satellite (MTG-LI) with a temporal resolution of 1 ms. The illuminations of individual pixels (events) are summarised into clusters (groups) which measure the spatial extent of the bolt from the blue after correction for the parallax error using cloud top height measurements inferred from the Flexible Combined Imager (FCI) payload on MTG.

The electromagnetic emissions of the bolt from the blue are recorded with a low-frequency interferometer on the ground that consists of three radio receivers which are deployed in a triangular array, ~15 km away from the thundercloud. The radio receivers use horizontal electric field sensors (horizontal dipoles) [5] to measure the electromagnetic emissions of the bolt from the blue with 1 us resolution. These waveforms show a sequence of pulses with different shapes which indicate the occurrence of various physical processes during the development of the bolt of the blue.

The video observations from the ground and from space are compared to the recordings with the lightning interferometer and the benefits arising from these joint analyses are discussed in detail.


References:

[1] Krehbiel, P., Riousset, J., Pasko, V. et al. Upward electrical discharges from thunderstorms. Nature Geoscience 1, doi:10.1038/ngeo162, 233–237, 2008.

[2] J. Harley, L. Zimmerman, H. Edens, H. Stenbaek-Nielsen, R. Haaland, R. Sonnenfeld, and M. McHarg. High-speed spectra of a bolt from the blue lightning stepped leader. Journal of Geophysical Research, 26(3), doi:10.1029/2020JD033884, 1-10, 2021.

[3] A.M. Holzer, et al.: EUMETSAT-ESSL Application Guide on the Use of MTG LI in Severe Convective Storms Nowcasting, ESSL Report 2025-01, https://www.essl.org/cms/essl-testbed, 2025.

[4] M. Füllekrug, E. Williams, C. Price, S. Goodman, R. Holzworth, S.-E. Enno, and B. Viticchie, Novel lightning flash densities from space [in “State of the Climate in 2024”, Bulletin of the American Meteorological Society, 106 (8), doi:10.1175/2025BAMSStateoftheClimate.1, S85–S86, 2025.

[5] M. Füllekrug, M. Kosch, G. Dingley, X. Bai, and L. Macotela. Six-component electromagnetic wave measurements of sprite-associated lightning. ESS Open Archive, doi:10.22541/essoar.176296584.41929367/v1, 2025.


Acknowledgments:

The authors wish to thank Sven-Erik Enno from EUMETSAT for assistance with the MTG-LI data retrieval. The MTG-LI data used for this study were kindly provided by EUMETSAT  from https://user.eumetsat.int/resources/user-guides/mtg-data-access-guide

How to cite: Fullekrug, M. and Kosch, M.:  Bolt from the blue caught on video, EGU General Assembly 2026, Vienna, Austria, 3–8 May 2026, EGU26-21746, https://doi.org/10.5194/egusphere-egu26-21746, 2026.

Thunderstorms produce high-energy radiation events such as Terrestrial gamma ray flashes (TGFs) and Gamma ray Glows (GRGs) via bremsstrahlung during the acceleration of runaway electrons to relativistic energies. Although TGFs and GRGs are believed to originate from the same physical process (relativistic runaway electron avalanche (RREA)), TGFs are intense sub-millisecond bursts of X-rays, while GRGs are less intense, long-lasting X-rays emissions. 

Several balloon flight campaigns are being prepared to observe and better understand these energetic phenomena such as Strateole-2 and OREO funded by the French Space Agency (CNES). Strateole-2 is a stratospheric balloon campaign using superpressure balloons flying for several months between 18 and 20 km in the intertropical region (planned for the end of 2026). OREO is a lightweight balloon project aiming to launch several radiosondes directly into thunderstorms to probe in-situ high-energy emissions associated with the electrical activity.

In order to participate in these projects a dedicated instrument named XStorm has been developed [Pallu, et al., JGR, 128, e2023JD039180, 2023, https://doi.org/10.1029/2023JD039180] with a view to perform in-situ and remote measurements. XStorm is a lightweight gamma-ray spectrometer its conception allow us to detect gamma ray glows and TGFs near the sources.

In addition, XStorm contributes to a new ground-based measurement campaign that involves installing it at key positions to detect and analyze TGFs as well as GRGs. 

In this contribution, we present the XStorm detector, detailing its electronic architecture, operational principles, and performances, as well as the campaigns in which it will be used.

How to cite: Aziz, C.: XStorm: a Lightweight Gamma-ray Spectrometer Designed to Detect Terrestrial Gamma ray Flashes and Glows, EGU General Assembly 2026, Vienna, Austria, 3–8 May 2026, EGU26-21751, https://doi.org/10.5194/egusphere-egu26-21751, 2026.

EGU26-22081 | Orals | NH1.11

Threshold electric fields for streamer ignition from colliding charged hydrometeors in thunderstorms 

Jaroslav Jánský, Reza Janalizadeh, and Victor Pasko

How lightning initiates in thunderstorm fields well below the conventional breakdown electric field Ek, which is defined by the equality of the ionization and dissociative attachment coefficients in air [Raizer, 81 1991, p. 135], remains an outstanding question. We investigate a robust pathway for streamer ignition through the collision of charged hydrometeors. By extending a two-particle image-charge model [Cai et al., 2018, https://doi.org/10.1029/2018JD028407] to include an initial charge Q, we quantify how polarization, particle dimensions, and background fields control ignition thresholds. We identify a "diagonal valley" of optimal radius ratios where the required charge is minimized, and is significantly below the corona discharge limit of a single isolated hydrometeor. In ambient fields near 0.3Ek, where photoelectric feedback [Pasko et al., 2025, https://doi.org/10.1029/2025JD043897] can provide a sustained supply of seed electrons, this collision-mediated mechanism provides a pathway to overcome the charge-limiting constraints of isolated particles. These findings offer a consistent physical basis for the birth of lightning leaders in typical thundercloud environments.

How to cite: Jánský, J., Janalizadeh, R., and Pasko, V.: Threshold electric fields for streamer ignition from colliding charged hydrometeors in thunderstorms, EGU General Assembly 2026, Vienna, Austria, 3–8 May 2026, EGU26-22081, https://doi.org/10.5194/egusphere-egu26-22081, 2026.

EGU26-22197 | Orals | NH1.11

Statistical Relationships between Negative Intracloud Flash Fraction and Environmental Parameters Controlling Cloud Electrification 

Elizabeth DiGangi, Jackie Ringhausen, Jeff Lapierre, and Yanan Zhu

Separation of charge via noninductive ice-ice collisions in clouds is widely accepted as the primary mechanism behind cloud electrification. However, not all clouds end up with the same charge distributions, as observed in various field campaigns and laboratory experiments over the last several decades. The distribution of charge in a given thunderstorm controls the polarity, frequency, and other characteristics of lightning produced by that storm, but charge distribution is very difficult to measure directly, especially at statistically significant scales. Of particular interest to the lightning community is the relationship between thunderstorm environments and lightning characteristics, where the charge distribution of storms bridges the gap between the two. This study will use intracloud (IC) lightning data from the Earth Networks Total Lightning Network (ENTLN) to investigate the statistical relationships between the proportion of negative IC flash frequency to environmental parameters such as charge reversal temperature altitudes, cloud base height, cloud depth, and warm vs cold cloud depth fraction derived from global reanalysis data for multiple regions around the world

How to cite: DiGangi, E., Ringhausen, J., Lapierre, J., and Zhu, Y.: Statistical Relationships between Negative Intracloud Flash Fraction and Environmental Parameters Controlling Cloud Electrification, EGU General Assembly 2026, Vienna, Austria, 3–8 May 2026, EGU26-22197, https://doi.org/10.5194/egusphere-egu26-22197, 2026.

EGU26-22205 | Orals | NH1.11 | Highlight

Is Lightning a driver of the Sargassum blooms in the Atlantic? 

Colin Price, Aviv Shay, and Alex Golberg

It has been known for many decades that nitrogen oxide compounds (NOx) are formed by lightning flashes due to the high temperatures in the lightning channel, which allows the otherwise tightly bounded N2 and O2 to react with each other. Lightning NOx is then oxidized in cloud and rain drops to form nitric acid and deposited at the surface as nitrate (NO-3) in precipitation. This nitrate is a form of fixed nitrogen that can be taken up by ecosystems, especially where biological N fixation is limited.

Since 2011, researchers have repeatedly observed the so-called Great Atlantic Sargassum Belt, a gigantic carpet of seaweed that drifts from the equator towards the Caribbean when easterly winds prevail. Until now, the sources of nutrients fueling their rapid growth are unclear. It was hypothesized that nutrient runoff from overfertilization and rainforest deforestation might be responsible or upwelling of phosphorus-rich deep waters. However, these processes cannot completely explain the increase in Sargassum biomass observed during the past years. Nitrogen is a key element governing the dynamics and function of many ecosystems as many of them are limited in biologically available nitrogen supply. The lack of N is an important inhibitor on primary production in the tropics. Owing to this limitation, an increase in available N from lightning could increase the primary production and biomass accumulation.

Our analysis of the spatial distribution of lightning and Sargassum blooms over the tropical Atlantic show remarkable agreement during specific months of the year, as well as the annual cycle of the blooms that peak in the northern hemisphere summer.  While global lightning activity is expected to increase with rising global temperature, it is not clear that there has been a significant increase in lightning over the Atlantic in recent decades.  Nevertheless, lightning has not yet been considered as a possible source of nitrogen impacting the Sargassum blooms. 


How to cite: Price, C., Shay, A., and Golberg, A.: Is Lightning a driver of the Sargassum blooms in the Atlantic?, EGU General Assembly 2026, Vienna, Austria, 3–8 May 2026, EGU26-22205, https://doi.org/10.5194/egusphere-egu26-22205, 2026.

Title: Moisture and stability controls on raindrop size distribution including breakup signature within convective clouds

The intensity of organised convective systems has been linked to environmental conditions; however, variability across cases suggests non-linear relationships, raising the question of whether diversity or other factors contribute to this variability. Especially, an understanding of cloud microphysical processes in these systems is necessary to bridge gaps between them from both observational and modelling perspectives.
At first, the relationships between raindrop size distributions within convective clouds and their environments were investigated using available observations near Kumagaya, the eastern part of Japan. Collisional coalescence of cloud droplets and raindrops, and conversion from cloud droplets to raindrops, were likely to coincide within convective clouds. Stronger vertical wind shear and higher instability are more likely to be sensitive to more vigorous rainfall intensity, as a proxy for increasing median volume diameter in the drop-size distribution. Weaker vertical wind shear and higher moisture content in the lower layer are likely to be more sensitive to larger rainfall amounts, serving as a proxy for increased liquid water content.
In addition, numerical experiments were conducted using the Weather Research and Forecasting model under idealised conditions based on the observed relationships. This study focused on spatial and temporal features of cloud microphysics with a 250 m horizontal and ~125 m vertical grid spacing across an 80 km x 80 km domain extending 20 km vertically. Initial conditions, obtained from the mesoscale model of the Japan Meteorological Agency for 06 UTC July 12, 2022, were used as input for the sounding and included variations in humidity, temperature lapse rates, and vertical wind shear. A spectral-bin microphysics scheme was primarily used to represent cloud microphysical properties in this study. Results showed that a more moist case in the lower levels led to increased rainfall intensity due to greater drop concentration of relatively smaller raindrops and higher liquid water content within convective clouds compared to the control simulation. Larger temperature lapse rates lead to larger raindrop sizes in convective clouds, which in turn contribute to stronger rainfall intensity. Stronger shear conditions generally lead to stronger rainfall intensity, whilst weaker shear conditions, with smaller temperature lapse rates or in humid environments, lead to larger rainfall amounts. These results may reflect midlatitude-type convection and tropical-type convection, including microphysical interpretations, and were consistent with the observational relationships.
These findings suggest that the established relationships between raindrop size distributions within convective clouds and environments could be extended as a baseline for operational quantitative precipitation estimation and to improve the microphysical scheme.

How to cite: Unuma, T.: Moisture and stability controls on raindrop size distribution including breakup signature within convective clouds, EGU General Assembly 2026, Vienna, Austria, 3–8 May 2026, EGU26-376, https://doi.org/10.5194/egusphere-egu26-376, 2026.

EGU26-920 | ECS | Orals | AS1.9

Do Charged Cloud Droplets Collide Faster? 

Arabdha Bhattacharya, Srikumar Warrier, Pijush Patra, and Anubhab Roy

Warm rain formation in clouds requires rapid coalescence of tiny droplets, a process that pure condensation-driven processes struggle to explain within the short time available in rising cloud parcels. One potential accelerator of droplet growth is electrical charging: it has long been hypothesised that charged cloud droplets might collide and coalesce more efficiently than neutral ones, especially in a turbulent airflow. To investigate this question, we developed a stochastic model tracing droplet pair trajectories at sub-Kolmogorov scales in a turbulent flow field. The model incorporates electrostatic forces, gravitational settling, and shear-induced collisions to simulate realistic encounter rates. Our simulations reveal that even moderate droplet charges can substantially increase collision frequencies under typical cloud turbulence conditions, resulting in the faster growth of droplets into raindrop sizes. These results shed new light on the microphysical mechanisms of precipitation initiation: electric charges on droplets can enhance coalescence efficiency, suggesting that natural background charging in clouds may help bridge the gap between cloud droplet populations and the onset of rain. 

How to cite: Bhattacharya, A., Warrier, S., Patra, P., and Roy, A.: Do Charged Cloud Droplets Collide Faster?, EGU General Assembly 2026, Vienna, Austria, 3–8 May 2026, EGU26-920, https://doi.org/10.5194/egusphere-egu26-920, 2026.

EGU26-955 | ECS | Posters on site | AS1.9

Light scattering by ice crystals in homogeneous isotropic turbulence 

Himanshu Mishra, Meraj Khan, and Anubhab Roy

Cirrus cloud optical properties strongly depend on the orientation of nonspherical ice crystals, which are influenced by the interplay between turbulence and gravitational settling. In this study, we introduce a stochastic modelling framework that predicts ensemble-averaged light scattering from ice crystals with turbulence-driven orientation distributions. The orientation statistics are derived from a stochastic representation of turbulent velocity gradients, and single-particle scattering properties are computed using a Lattice Boltzmann Method–based electromagnetic solver. Integrating over the derived orientation probability density function yields bulk optical quantities such as phase functions and scattering intensities. Results show that turbulence modulates scattering anisotropy and phase function features, revealing measurable optical impacts even in weakly turbulent regimes. The framework offers a physically consistent and computationally efficient approach for incorporating orientation effects into radiative transfer and remote sensing models of ice clouds.

How to cite: Mishra, H., Khan, M., and Roy, A.: Light scattering by ice crystals in homogeneous isotropic turbulence, EGU General Assembly 2026, Vienna, Austria, 3–8 May 2026, EGU26-955, https://doi.org/10.5194/egusphere-egu26-955, 2026.

EGU26-1063 | ECS | Posters on site | AS1.9

Evaluating Droplet Size Distribution Evolution with Physically Based Collision Kernels in Warm Cumulus Clouds 

Aniket Halder, Pijush Patra, Kamal Kant Chandrakar, and Anubhab Roy

Understanding how cloud droplets transition across the “size gap” between condensational growth and efficient gravitational collection remains central to predicting warm-rain formation in turbulent clouds. We examine this transition by solving the Smoluchowski Coagulation Equation with a high-order, mass-conserving flux scheme and by comparing a suite of physically grounded hydrodynamic collision kernels. These kernels combine differential settling with turbulence-driven relative motion and explicitly account for near-field interactions—non-continuum lubrication forces and van der Waals attraction—that strongly influence coalescence at small separations. By diagnosing the evolution and convergence of mass flux across droplet sizes, we assess how different kernel formulations accelerate or delay growth through the bottleneck regime and whether the resulting distributions exhibit quasi-steady or self-similar structure. The study provides quantitative insight into how turbulence-modified microphysical interactions shape droplet size distributions and ultimately regulate warm-rain initiation in atmospheric clouds.

How to cite: Halder, A., Patra, P., Chandrakar, K. K., and Roy, A.: Evaluating Droplet Size Distribution Evolution with Physically Based Collision Kernels in Warm Cumulus Clouds, EGU General Assembly 2026, Vienna, Austria, 3–8 May 2026, EGU26-1063, https://doi.org/10.5194/egusphere-egu26-1063, 2026.

EGU26-3167 | Posters on site | AS1.9

From five metres to one kilometre: How does the W-Layer shape the stratocumulus-topped boundary layer? 

Kenneth Chan, Juan Pedro Mellado, Stefan A. Buehler, and Manfred Brath

The recently discovered “W-Layer” reveals an unexplored perspective in the modelling of the stratocumulus-topped boundary layer (STBL). The clear-sky radiative heating in the capping inversion, which constitutes the W-Layer, was previously unresolved in numerical models, either because of insufficient vertical resolution or the lack of an appropriate radiation model which represents the clear-sky effects.

To study the impact of the W-Layer on the STBL, we introduce a “band” radiation model to direct numerical simulations (DNSs) which resolve metre-scale features. The band model partly retains the spectral dependence of the clear-sky absorption by partitioning the longwave spectrum into two water vapour absorption bands, one CO2 absorption band and a window region. The band model is computationally efficient and can reproduce the warming characteristics in the W-Layer.

We run a set of DNSs at Reynolds number Re = 5000, which corresponds to a vertical resolution of 2.2 m at the cloud top. We find that the W-Layer causes a direct effect of warming, which is most prominent in the cloudy region, leading to a slight drop in liquid water content. Meanwhile, an indirect effect of the W-Layer suppresses entrainment and the STBL growth rate by enhancing the buoyancy jump across the capping inversion. Correspondingly, the turbulence and convection intensity is reduced.

How to cite: Chan, K., Mellado, J. P., Buehler, S. A., and Brath, M.: From five metres to one kilometre: How does the W-Layer shape the stratocumulus-topped boundary layer?, EGU General Assembly 2026, Vienna, Austria, 3–8 May 2026, EGU26-3167, https://doi.org/10.5194/egusphere-egu26-3167, 2026.

EGU26-4932 | ECS | Orals | AS1.9

The role of supersaturation fluctuations in stratocumulus clouds 

Robert Hartmann and Juan Pedro Mellado

Most simulations of atmospheric phenomena – including both large-eddy simulations (LES) and direct numerical simulations (DNS) – assume phase equilibrium between the liquid and the vapor phases of water. This assumption, however, implies that the relaxation processes for supersaturation fluctuations act on by far shorter time scales than the fastest convective scales, which is debatable for realistic atmospheric conditions. Stratocumulus clouds play an important two-fold role in the Earth's climate as they can have a cooling effect by reflecting large portions of solar radiation to space on the one hand, but insulating the Earth's surface at night on the other hand. An accurate representation of their formation and lifetime in climate projections, calls for a better understanding of the role of supersaturation fluctuations. Here, we investigate the influence of "slow" saturation adjustment on cloud entrainment and desiccation for stratocumulus clouds.

The relative importance of supersaturation fluctuations can be quantified in terms of a Damköhler number Da=τflph defined as the ratio of the flow's mixing time scale τfl over the phase relaxation time scale of supersaturation τph. While the assumption of phase equilibrium corresponds to Da→∞, estimates of realistic atmospheric conditions rather suggest an effective Daη=O(10-2–10-1) with respect to the smallest flow scales, i.e., the Kolmogorov time scale. This indicates that supersaturation fluctuations begin to play a more prominent role.

We perform 3D DNSs of a (stratocumulus) cloud-topped convective boundary layer at Re=5000 and analyze the influence of "slow" supersaturation relaxation for 10-2≤Daη≤101 compared to the case with phase equilibrium assumption Daη=∞. The supersaturation in our simulations is limited to the cloud layer and therein mostly correlating with ascending flow. The largest values of supersaturation up to 4% are found at the cloud base, while within and at the top of the cloud layer, supersaturation is mostly limited to a few tenths of percent. In contrast to these local extreme values, we find that, spatially, cloud bulk and top are (super)saturated to a greater extent than the cloud base. Most crucially, we find that the clouds liquid water content is decreasing for Daη>1, while it is stable for Daη≈1 and even increasing for Daη<1. This implies that clouds tend to dry out and desiccate under phase equilibrium assumption, while they might be rather accumulating in realistic conditions.

How to cite: Hartmann, R. and Mellado, J. P.: The role of supersaturation fluctuations in stratocumulus clouds, EGU General Assembly 2026, Vienna, Austria, 3–8 May 2026, EGU26-4932, https://doi.org/10.5194/egusphere-egu26-4932, 2026.

EGU26-6899 | ECS | Orals | AS1.9

Minimalistic particle-based model of scalar variability in a cloud chamber 

Igor Kumela, Robert Grosz, and Gustavo Abade

Cloud chamber measurements at the laboratory scale can provide valuable information on turbulence-microphysics interactions occurring at small scales in real clouds. We use a minimalistic, stochastic, particle-based model to represent scalar fluctuations at length scales in the inertial range of Rayleigh-Bénard (RB) turbulence in a cloud chamber. The scalars of interest are temperature, vapor mixing ratio of moist air, and the resulting supersaturation affecting droplet growth by condensation. The turbulent flow in the chamber is represented by an ensemble of notional particles that carry a set of Lagrangian attributes such as position, velocity and the scalars of interest. Notional particles represent either fluid particles (in dry and moist RB turbulence) or tracer liquid droplets (in cloudy RB turbulence). The model maintains scalar fluctuations through stationary exchange of temperature and vapor mixing ratio on the chamber walls. No external random scalar forcing, which is usually based on the assumption of equilibrium scalar fluctuation spectrum, is imposed. The statistical analysis of results for moist and cloudy conditions enables direct comparison with experimental data for the Eulerian scalar fields. The results show both qualitative and quantitative agreement with measurements by fitting a single model parameter, the velocity‐to‐scalar time-scale ratio. Despite its intentional simplicity, the model captures essential features previously accessible only through direct numerical simulations (DNS) and provides a practical framework for particle-based  modeling of subgrid-scale scalar variance in large-eddy simulations (LES) of clouds.


How to cite: Kumela, I., Grosz, R., and Abade, G.: Minimalistic particle-based model of scalar variability in a cloud chamber, EGU General Assembly 2026, Vienna, Austria, 3–8 May 2026, EGU26-6899, https://doi.org/10.5194/egusphere-egu26-6899, 2026.

EGU26-7908 | ECS | Posters on site | AS1.9

Dual-frequency radar retrievals of rain evaporation at the Barbados Cloud Observatory during the ORCESTRA-SCORE campaign 

Nina Robbins-Blanch, Florian Poydenot, Frédéric Tridon, Sabrina Schnitt, Claudia Acquistapace, and Raphaela Vogel

Rain evaporation drives mesoscale organization through downdrafts and cold pools, influencing cloud cover and the radiative budget, yet its magnitude and variability remain poorly constrained by observations and models. To address this gap, we develop a rain evaporation dataset at the Barbados Cloud Observatory (BCO) using observations from the SCORE (Sub-Cloud Observations of Rain Evaporation) sub-campaign of ORCESTRA. Because rain evaporation cannot be measured directly, it must be inferred from changes in the drop size distribution (DSD) as rain falls. DSDs can be derived from cloud radar Doppler spectra, but these are affected by vertical air motion, turbulence broadening, and attenuation.

By using Doppler spectra from BCO cloud radars at two frequencies (Ka- and W-band), we can overcome the limitations of single-frequency approaches and retrieve the full shape and concentration of the DSDs. The application of an optimal estimation method to this data also allows us to retrieve total differential attenuation, vertical velocities, and turbulence. We derive rain evaporation rates from DSDs during stationary periods. These retrievals can be used to evaluate evaporation estimates from one-dimensional rain shaft models, including the super-droplet model CLEO. If robust, the retrieved cloud-base DSDs provide a basis for fast and reliable long-term rain evaporation estimates at the BCO. Here we present first results from the SCORE evaporation and environmental conditions dataset, including analyses of individual rain events and statistics from the full sub-campaign.

How to cite: Robbins-Blanch, N., Poydenot, F., Tridon, F., Schnitt, S., Acquistapace, C., and Vogel, R.: Dual-frequency radar retrievals of rain evaporation at the Barbados Cloud Observatory during the ORCESTRA-SCORE campaign, EGU General Assembly 2026, Vienna, Austria, 3–8 May 2026, EGU26-7908, https://doi.org/10.5194/egusphere-egu26-7908, 2026.

EGU26-8054 | ECS | Orals | AS1.9

Evaluating secondary ice production by raindrop fragmentation upon freezing in mixed-phase clouds using modeling and observations 

Julian Meusel, Deepak Waman, Gabriella Wallentin, Corinna Hoose, Nils Pfeifer, and Maximilian Maahn

Field observations of mixed-phase clouds frequently reveal ice particle number concentrations that exceed what can be explained by primary ice nucleation alone. This discrepancy is commonly attributed to secondary ice production (SIP) processes. Despite their recognized importance, the efficiency and representation of SIP mechanisms in numerical weather prediction models remain highly uncertain. One such mechanism is raindrop fragmentation upon freezing: when a supercooled drop freezes, excess internal pressure can cause it to shatter, releasing ice splinters that may subsequently grow to secondary ice particles. A comprehensive understanding and representation of both primary and secondary ice formation processes in mixed-phase clouds is crucial, as these processes strongly influence cloud properties such as precipitation formation and cloud lifetime, and thus affect numerical weather and climate predictions.

In this study, we examine the impact of secondary ice production by raindrop fragmentation upon freezing on cloud glaciation and precipitation within the ICON model framework. We focus on a warm front observed during the Evaluating Microphysical Pathways Of Midlatitude Snow Formation (EMPOS) field campaign in Hyytiälä, Finland, in February 2024, where raindrop fragmentation was directly observed by the Video In Situ Snowfall Sensor (VISSS). This case is ideal for studying raindrop fragmentation upon freezing: frozen hydrometeors fall through a warm layer, melt partially or completely, and refreeze as they enter the sub-zero layer below, creating conditions favorable to raindrop fragmentation upon freezing. We specifically assess potential limitations of the model representation of raindrop fragmentation upon freezing, including the production of sufficient raindrops of relevant size ranges, their refreezing under suitable thermodynamic conditions, and the resulting efficiency of ice splinter generation. We compare the performance of parameterizations for raindrop fragmentation upon freezing in the two-moment microphysics scheme by Seifert and Beheng (2006) – specifically Sullivan et al. (2018) and a newly implemented parametrization based on Phillips et al. (2018) - against observations at the study site. In-situ measurements from the VISSS allow us to constrain and evaluate both model parameterizations of SIP. To complement the bulk microphysics simulations and to gain deeper physical insight into the underlying SIP process, we additionally present first results from the Monte-Carlo super-particle cloud microphysics scheme by Seifert (2018), which better represents mixed-phase states of hydrometeors that bulk-microphysical schemes cannot capture.

How to cite: Meusel, J., Waman, D., Wallentin, G., Hoose, C., Pfeifer, N., and Maahn, M.: Evaluating secondary ice production by raindrop fragmentation upon freezing in mixed-phase clouds using modeling and observations, EGU General Assembly 2026, Vienna, Austria, 3–8 May 2026, EGU26-8054, https://doi.org/10.5194/egusphere-egu26-8054, 2026.

EGU26-8175 | Posters on site | AS1.9

Assessing the effect of electrocollection by ice and liquid hydrometeors on the scavenging of submicron-sized aerosol particles 

Vladan Vučković, Dragana Vujović, Darko Savić, and Lazar Filipović

As hydrometeors in the upper troposphere are usually solid, especially in winter, ice crystals, snow, and graupel serve as important aerosol scavengers in the atmosphere. Electrostatic forces are highly relevant to the removal of submicron aerosol particles (APs), as they provide an additional mechanism for capturing particles that might otherwise be difficult to remove from the atmosphere. However, this type of scavenging is less well understood than scavenging by liquid hydrometeors, both theoretically and experimentally. Motivated by gaps in knowledge regarding the scavenging of APs by ice crystals, we investigated the impact of electrostatic collection of APs by solid hydrometeors on the scavenging of APs from the air. Collection kernels were calculated for discrete values of the diameters of cloud ice, snow, and graupel. These kernels were then implemented in a cloud-resolving numerical model, using a three-moment microphysical scheme with six separate hydrometeor categories, along with a two-moment aerosol scheme introduced by Vučković et al. (2022). We also considered electroscavenging processes for liquid hydrometeors, where, in addition to the point Coulomb force interaction, image charge induction was included, following previous work (Vučković et al., 2025a). This effect was not considered for solid hydrometeors. All other known collection mechanisms were also included. The aerosol particles were treated as ice-nucleating (with AgI properties) and non-nucleating in separate experiments. Our results suggest that the reduction in the total mass of aerosol particles in the air caused by electrostatic scavenging by liquid hydrometeors was greater than that caused by electrostatic scavenging by cloud ice by a factor of six after one hour of model integration. Electrostatic scavenging by solid hydrometeors increased the relative aerosol precipitation mass by less than 0.1%, while the inclusion of liquid hydrometeor electrostatic scavenging increased the aerosol precipitation mass by 24% (Vučković et al.,2025b).

Acknowledgements: This research was supported by the Science Fund of the Republic of Serbia, No. 7389, Project “Extreme weather events in Serbia – analysis, modelling and impacts” – EXTREMES.


References:

Vučković, V., D. Vujović, and A. Jovanović, 2022: Aerosol parameterisation in a three-moment microphysical scheme: Numerical simulation of submicron-sized aerosol scavenging. Atmos Res, 273, 106148, https://doi.org/10.1016/j.atmosres.2022.106148.

Vučković, V., D. Vujović, D. Savić, and L. Filipović, 2025a: Impact of electro-collection and ice nucleation on aerosol scavenging. Aerosol Science and Technology, 59, 1006–1026, https://doi.org/10.1080/02786826.2024.2441289.

Vučković, V., D. Vujović, D. Savić, and L. Filipović, 2025b: The Effect of Electrocollection by Ice Hydrometeors on the Scavenging of Submicron-Sized Aerosol Particles. Atmosphere (Basel), 16, 1265, https://doi.org/10.3390/atmos16111265.

How to cite: Vučković, V., Vujović, D., Savić, D., and Filipović, L.: Assessing the effect of electrocollection by ice and liquid hydrometeors on the scavenging of submicron-sized aerosol particles, EGU General Assembly 2026, Vienna, Austria, 3–8 May 2026, EGU26-8175, https://doi.org/10.5194/egusphere-egu26-8175, 2026.

EGU26-9033 | Orals | AS1.9

Laboratory studies on the influence of turbulence on heterogeneous ice formation  

Dennis Niedermeier, Kokab Goharian, Silvio Schmalfuß, Peter Lloyd, Raymond Shaw, Juan Pedro Mellado, and Frank Stratmann

Mixed-phase clouds are ubiquitous in the troposphere during all seasons, from polar to tropical regions, and have a significant impact on weather and climate (e.g., Korolev et al., 2017). Although the knowledge about mixed-phase clouds has increased significantly in recent decades, the relevant microphysical processes and interactions are still poorly understood and insufficiently quantified. For example, how turbulent fluctuations in temperature affect the immersion freezing of supercooled cloud droplets in these clouds remains a key question. To investigate the immersion freezing behavior of supercooled droplets in a turbulent environment, laboratory studies are carried out in the turbulent moist-air wind tunnel LACIS-T (Turbulent Leipzig Aerosol Cloud Interaction Simulator, Niedermeier et al. (2020)). The experiments use size-selected, monodisperse Snomax particles as ice-nucleating particles. These particles are injected into the measurement section of LACIS-T where the formation of supercooled droplets, their growth, and the potential freezing occur. The study includes several experiments varying the mean temperature and the magnitude of temperature fluctuations. Droplet freezing is quantified for the different conditions by determining the fraction of frozen droplets as a function of mean temperature and temperature fluctuations. One main result is the observation of immersion freezing at higher mean temperatures compared to conditions without temperature fluctuations. In other words, turbulence affects the number of frozen droplets. The obtained results will be presented in detail and its atmospheric implications will be discussed.

References:
Korolev et al. (2017), Meteorol. Monogr., 58, 5.1-5.50, https://doi.org/10.1175/AMSMONOGRAPHS-D-17-0001.1.
Niedermeier et al. (2020), Atmos. Meas. Tech., 13, 2015-2033, https://doi.org/10.5194/amt-13-2015-2020.

Acknowledgement:
We gratefully acknowledge the funding by the Deutsche Forschungsgemeinschaft (DFG, German Research Foundation) - Project Number NI 2231/1-1 (Project name: TINIA).

How to cite: Niedermeier, D., Goharian, K., Schmalfuß, S., Lloyd, P., Shaw, R., Mellado, J. P., and Stratmann, F.: Laboratory studies on the influence of turbulence on heterogeneous ice formation , EGU General Assembly 2026, Vienna, Austria, 3–8 May 2026, EGU26-9033, https://doi.org/10.5194/egusphere-egu26-9033, 2026.

EGU26-9376 | ECS | Posters on site | AS1.9

Explicit numerical simulations of convective cloud seeding for hail mitigation using two operational methodologies 

Darko Savić, Vladan Vučković, and Dragana Vujović

Damages associated with severe convective storms are increasing worldwide, motivating the continued use of weather modification techniques such as cloud seeding for hail mitigation. Despite decades of operational application in many countries, including Serbia, the physical effectiveness of convective cloud seeding remains insufficiently quantified due to the complexity and a wide range of physical processes in clouds.

Numerical models provide a valuable tool for examining cloud processes in depth and help us understand aerosol-cloud interactions. We use a cloud-resolving numerical model with three-moment microphysics to simulate a supercell storm. This model is modified by introducing aerosols with all known scavenging mechanisms (by 5 hydrometeor categories) included (Vučković et al. 2025b). This is achieved by implementing a two-moment aerosol scheme, where aerosols are described by the gamma distribution (Vučković et al. 2022, 2023, 2025a). Furthermore, DeMott silver-iodide freezing parameterisation is implemented. This method provides a way to track number concentration and mixing ratios of aerosols explicitly in the air and in all 6 hydrometeor categories for every grid box. Simulations are performed at 500 m horizontal and 250 m vertical resolution over a 3-hour integration period.

On the other hand, two complex operational convective cloud seeding methodologies have been implemented into the model. First developed by the Republic Hydrometeorological Service of Serbia (RHSS 2023) and the other proposed by Abshaev et al. (2023). Both methodologies consider the radar reflectivity and supercooled water parameters as well as the storm's movement and life-cycle stage to determine seeding timing and location.

This framework enables a direct numerical comparison of the microphysical and dynamical impacts of operational hail suppression strategies under controlled conditions.


Acknowledgement: This research was supported by the Science Fund of the Republic of Serbia, No. 7389, Project Extreme weather events in Serbia - analysis, modelling and impacts” – EXTREMES


References:

Abshaev, M. T., Abshaev, A. M., & Malkarova, A. M. (2022, May). Results of 65-Years Project of Hail Suppression in Russian Federation. In International Scientific Conference" Problems of Atmospheric Physics, Climatology and Environmental Monitoring" (pp. 1-28). Cham: Springer International Publishing.

Republic Hydrometeorological Service of Serbia, Hail Suppression Center (2023). Instruction 5/2023: Methods for radar identification and seeding of single-cell, multicell, and supercell hail-producing storms using the OGIS automated system. Belgrade, Serbia. (in Serbian, Cyrillic)

Vučković, V., D. Vujović, and A. Jovanović, 2022: Aerosol parameterisation in a three-moment microphysical scheme: Numerical simulation of submicron-sized aerosol scavenging. Atmos Res273, 106148, https://doi.org/10.1016/j.atmosres.2022.106148.

Vučković, V., D. Vujović, and D. Savić, 2023: Influence of electrostatic collection on scavenging of submicron-sized aerosols by cloud droplets and raindrops. Aerosol Science and Technology57, https://doi.org/10.1080/02786826.2023.2251551.

Vučković, V., Vujović, D., Savić, D., & Filipović, L. (2025a). Impact of electro-collection and ice nucleation on aerosol scavenging. Aerosol Science and Technology59(8), 1006–1026. https://doi.org/10.1080/02786826.2024.2441289

Vučković, V., Vujović, D., Savić, D., & Filipović, L. (2025b). The Effect of Electrocollection by Ice Hydrometeors on the Scavenging of Submicron-Sized Aerosol Particles. Atmosphere16(11), 1265. https://doi.org/10.3390/atmos16111265

How to cite: Savić, D., Vučković, V., and Vujović, D.: Explicit numerical simulations of convective cloud seeding for hail mitigation using two operational methodologies, EGU General Assembly 2026, Vienna, Austria, 3–8 May 2026, EGU26-9376, https://doi.org/10.5194/egusphere-egu26-9376, 2026.

EGU26-9886 | ECS | Posters on site | AS1.9

Solutions to the population balance equation for cloud hydrometeors 

Antonio Torregrosa Abellan

Clouds constitute an ensemble of a huge number of particles. A general approach for representing the system is the use of size or mass distributions, leading to a population balancing equation (PBE). Since solving this equation is quite challenging and computationally expensive, numerical weather prediction models often use so-called bulk schemes, based on general moments of the underlying distribution, and assuming a fixed functional form for the particle size distribution, from which evolution equations for the moments are derived. These schemes are much simpler and computationally cheaper, though they overly constrain the evolution of the size distribution.

In this work, we directly address the problem of solving the PBE for the mass distribution of atmospheric hydrometeors. We present analytical solutions for idealized cases and reduce more complex scenarios to systems of ordinary differential equations, which can be numerically integrated. These analytical solutions can be compared to the standard bulk schemes, testing the accuracy of the latter. Future work will involve extending these solutions to more complicated regimes and validating the results against empirical field measurements of the hydrometeor size distributions.

How to cite: Torregrosa Abellan, A.: Solutions to the population balance equation for cloud hydrometeors, EGU General Assembly 2026, Vienna, Austria, 3–8 May 2026, EGU26-9886, https://doi.org/10.5194/egusphere-egu26-9886, 2026.

EGU26-11752 | ECS | Posters on site | AS1.9

Opposing entrainment effects of cloud droplet sedimentation during the pre-breakup stage of the stratocumulus to cumulus transition 

Moritz Schnelke, Maike Ahlgrimm, and Anna Possner

It is known that cloud droplet sedimentation affects the development of stratocumulus-topped boundary layers by reducing entrainment. However, previous studies mainly focused on timescales below 6h covering the early stratocumulus stages, while later timescales remain largely unexplored. This study targets the impact of sedimentation on subtropical stratocumulus evolution in the context of the stratocumulus to cumulus transition (SCT) in the Northeast Pacific. To this end, we perform 48h long large-eddy simulations of 10 transects from the Marine ARM GPCI Investigation of Clouds ship campaign, capturing the full deepening phase prior to cloud breakup. 
In all cases of active droplet sedimentation, the previously reported reduction in entrainment is confirmed in the initial hours. However, the effects observed in the later stages differ depending on the cloud's liquid water path (LWP). The expected result of weaker boundary layer growth only continues to occur in the more frequent precipitating, high-LWP cases, whereas the opposite occurs in non-precipitating, low-LWP cases. Here, the initial effect is reversed and the cloud exhibits stronger entrainment, that can result in deeper boundary layers. The underlying reason is that low-LWP clouds are radiatively unsaturated, allowing the LWP increase associated with the initial reduction in entrainment to trigger a feedback chain, which amplifies LWP, longwave cooling and turbulence in the boundary layer. This counteracts the impact of the sedimenting droplets and ultimately yields increased entrainment. Previous process studies on droplet sedimentation have studied the low-LWP regime, where we actually find an opposite response over long time periods. Nonetheless, our results confirm the interpretation of the droplet sedimentation feedback in numerous aerosol-cloud interaction studies as these are applicable to the high-LWP regime where we show that also over long time scales droplet sedimentation decreases boundary layer deepening. Despite the substantial influence on boundary layer growth, the timing of cloud breakup remains largely unchanged across the transition.

How to cite: Schnelke, M., Ahlgrimm, M., and Possner, A.: Opposing entrainment effects of cloud droplet sedimentation during the pre-breakup stage of the stratocumulus to cumulus transition, EGU General Assembly 2026, Vienna, Austria, 3–8 May 2026, EGU26-11752, https://doi.org/10.5194/egusphere-egu26-11752, 2026.

EGU26-11910 | ECS | Posters on site | AS1.9

Efficient ice multiplication from freezingraindrop fragmentation 

Nils Pfeifer, Bernd Mom, Moisseev Dmitri, Susan Hartmann, Julian Meusel, Corinna Hoose, and Maahn Maximilian

The number of ice particles in mixed-phase clouds often exceeds the concentration of ice-nucleating
particles by several orders of magnitude. This discrepancy can be explained by secondary ice
production, which is a set of physical processes that can multiply the number of ice particles in the
atmosphere. Due to their transient and microscopic nature, observations and quantifications of these
processes are scarce. One such process is the fragmentation of drops upon freezing, whereby ice
splinters are produced when a drop undergoes a phase transition from liquid to ice. Recent
laboratory studies suggest that this process could significantly contribute to ice crystal number
concentrations. However, the number of ice fragments that can be produced under realistic
atmospheric conditions remains highly uncertain.
In this talk, we present cases of droplet fragmentation occurring during refreezing rain episodes in
Hyytiälä, Finland. These cases were identified using a combination of ground-based in situ
observations and cloud radar. Based on the classification of in situ image data, we evaluate the
effectiveness of the process from an event-based perspective. Additionally, we identify the different
modes of deformation that occur during refreezing and demonstrate how their frequencies change
over time.
These results provide novel insights into the effectiveness of drop fragmentation upon freezing,
addressing a long-standing knowledge gap in cloud microphysics.

How to cite: Pfeifer, N., Mom, B., Dmitri, M., Hartmann, S., Meusel, J., Hoose, C., and Maximilian, M.: Efficient ice multiplication from freezingraindrop fragmentation, EGU General Assembly 2026, Vienna, Austria, 3–8 May 2026, EGU26-11910, https://doi.org/10.5194/egusphere-egu26-11910, 2026.

EGU26-12291 | ECS | Orals | AS1.9

How spatial resolution of in situ observations affects the glaciation and evolution of mixed-phase clouds 

Christopher Fuchs, Nadja Omanovic, Huiying Zhang, Ulrike Lohmann, and Jan Henneberger

Mixed-phase clouds (MPCs) are the major source for precipitation over continental mid- and high latitudes. The co-existence of cloud droplets and ice crystals makes MPCs thermodynamically unstable, allowing rapid glaciation through the Wegener–Bergeron–Findeisen (WBF) process and the efficient formation of precipitation-sized hydrometeors. Yet this simultaneous presence of both phases also enables pronounced cloud-phase heterogeneity and intermittency, such that glaciation often does not occur uniformly. Consequently, the apparent efficiency and timescale of glaciation, and its role in MPC evolution, depend on the spatial scale at which phase heterogeneity is represented and resolved.

In this study, we investigate the spatial scales at which phase heterogeneity occurs in MPCs and further assess how unresolved fine-scale variability in cloud phase affects the efficiency and timescale of glaciation. We use in situ observations from 19 targeted glaciogenic cloud seeding experiments conducted during the CLOUDLAB project and compare them with a generalized theory for MPC glaciation times based on the WBF process (Pinsky et al., 2024).

We show that the glaciation time is strongly linked to the spatial resolution at which cloud properties are sampled. Comparing observations averaged on 5, 50, and 250 m spatial scales shows that coarser resolution blurs phase intermittency. Our inferred glaciation times are systematically longer than theoretical predictions, with deviations increasing at coarser resolution. Additionally, our high-resolution in situ measurements show that phase heterogeneity in MPCs extends down to scales of at least one meter and that sub-meter resolution may be required to fully capture the intrinsic microphysical processes.

These results demonstrate that unresolved small-scale phase heterogeneity can systematically bias inferred glaciation times. This bias has direct implications for the evolution and lifetime of mixed-phase clouds and ultimately for the efficiency and timing of precipitation formation.


Pinsky, M., Khain A., and Korolev A., 2014: Analytical investigation of glaciation time in mixed-phase adiabatic cloud volumes. J. Atmos. Sci., 71, 4143–4157, https://doi.org/10.1175/JAS-D-13-0359.1

How to cite: Fuchs, C., Omanovic, N., Zhang, H., Lohmann, U., and Henneberger, J.: How spatial resolution of in situ observations affects the glaciation and evolution of mixed-phase clouds, EGU General Assembly 2026, Vienna, Austria, 3–8 May 2026, EGU26-12291, https://doi.org/10.5194/egusphere-egu26-12291, 2026.

EGU26-12317 | Orals | AS1.9

DNS of a mixed‐phase cloud with a Lagrangian microphysics scheme, and temperature and supersaturation fluctuations 

Kokab Goharian, Dennis Niedermeier, Silvio Schmalfuß, Juan Pedro Mellado, Raymond Shaw, and Frank Stratmamm

Mixed-phase clouds are widespread throughout the troposphere across all seasons, extending from polar to tropical regions (Korolev & Milbrandt, 2022). These clouds play a critical role in the Earth’s climate system; however, their representation in numerical weather prediction and global climate models remains highly uncertain (e.g., McCoy et al. 2016), largely due to their inherently complex physical nature. Clouds constitute dispersed multiphase flows in which supercooled liquid droplets and ice crystals coexist and interact in and with a turbulent environment over a wide range of spatial and temporal scales (Bodenschatz, et al. 2010). As a consequence of this intrinsic complexity, key uncertainties persist concerning mixed-phase clouds’ microphysical behavior despite extensive observational and laboratory studies. In particular, Lagrangian investigations that resolve the coupled evolution of supercooled droplets and ice crystals remain scarce, especially in turbulent cloud-top regions.


To address these limitations, we employ a Direct Numerical Simulation (DNS) approach to quantify the impact of turbulent temperature and saturation fluctuations on the glaciation of mixed-phase clouds. Within this framework, we investigate the condensational growth of supercooled liquid droplets, heterogeneous droplet freezing, and the subsequent diffusional growth of ice crystals. The simulations are performed using the Eulerian–Lagrangian turbulence solver Tlab (https://github.com/turbulencia/tlab), extended with the TINIA module, which has been developed as an add-on to Tlab to represent ice nucleation and growth processes. We will present first results concerning the influence of turbulence-induced thermodynamic fluctuations on droplet growth, freezing, and ice crystal evolution in mixed-phase clouds.

Korolev & Milbrandt (2022), Geophysical Research Letters, 49(18), e2022GL099578,

https://doi.org/10.1029/2022GL099578

McCoy, et al. (2016), J. Adv. Model. Earth Syst., 8, 650–668,

https://doi.org/10.1002/2015MS000589

Bodenschatz, et al. (2010), Science, 327.5968 : 970-971,

https://www.science.org/doi/10.1126/science.1185138


Acknowledgement:
We gratefully acknowledge the funding by the Deutsche Forschungsgemeinschaft (DFG, German Research Foundation) - Project Number STR 453/14-1 (Project name: TINIA).

How to cite: Goharian, K., Niedermeier, D., Schmalfuß, S., Mellado, J. P., Shaw, R., and Stratmamm, F.: DNS of a mixed‐phase cloud with a Lagrangian microphysics scheme, and temperature and supersaturation fluctuations, EGU General Assembly 2026, Vienna, Austria, 3–8 May 2026, EGU26-12317, https://doi.org/10.5194/egusphere-egu26-12317, 2026.

EGU26-13299 | Posters on site | AS1.9

Rethinking how to characterize cloud biases in coarse resolution models:  a regime-based approach 

Ryan Patnaude, Justin Richling, John Truesdale, Isla Simpson, Jon Petch, and Christina McCluskey

Large-scale models struggle to accurately represent maritime low-level boundary layer clouds, leading to uncertainties in projecting a future climate. This study uses a regime-based approach to assess global climate model representation of warm-phase microphysical processes over the Southern Ocean (SO) and northeast Pacific, regions frequently characterized by the stratocumulus-to-cumulus transition (SCT) regime. In situ aircraft observations collected during the Southern Ocean Clouds, Radiation and Aerosol Transport Experimental Study (SOCRATES) and the Cloud Systems Evolution in the Trades (CSET) campaigns were used to evaluate simulated low-level cloud microphysical properties. Using environmental variables and airborne remote sensing, we investigate methods for compositing aircraft observations into stratocumulus, open-cell, and undetermined cloud sampling regimes. This approach aims to mitigate issues with scaling aircraft observations to model grid resolutions and discrepancies with collocating aircraft observations with simulated clouds. We assessed simulated warm-phase cloud processes in the Community Earth System Model (CESM) using new model diagnostics tools to improve our representation of the SCT regime, and results from both CESM2 and CESM3 will be presented.

How to cite: Patnaude, R., Richling, J., Truesdale, J., Simpson, I., Petch, J., and McCluskey, C.: Rethinking how to characterize cloud biases in coarse resolution models:  a regime-based approach, EGU General Assembly 2026, Vienna, Austria, 3–8 May 2026, EGU26-13299, https://doi.org/10.5194/egusphere-egu26-13299, 2026.

EGU26-14691 | Posters on site | AS1.9

T-28 Aircraft Image Probe Data Processing: Hail Storm Uncertainty and Radar Coupling 

David Delene, James Klinman, Andrew Detwiler, Summer Coleman, Andrea Skow, Ivan Hernandez, Patrick Kennedy, and Venkatachalam Chandrasekar

The armored T-28 aircraft obtained in-situ imaging probe observations in hailstorms over multiple field projects. The T-28 is unique in its ability to sample hailstorms containing particles up to 3 inches in diameter. Particle size distributions derived from the imaging probe observations are invaluable for comparison with the CSU-CHILL S-band polarimetric radar. Images from the T-28 Hail Spectrometer are typically processed using one-dimensional (1D) size information; however, an instrument upgrade enabled two-dimensional (2D) sizing capabilities for multiple field projects. Particle size distributions from 14 flights that include both 1D and 2D Hail Spectrometer processing are analyzed. Consistently, 1D processing results in larger maximum particle sizes and lower concentrations of small particles. Review of 2D images shows that the typical 1D processing method overestimates particle sizes due to noise and coincidence effects; therefore, the 2D processing methodology should be used for creating particle size distributions. Reflectivity calculated using the 2D particle size distribution is substantially lower than reflectivity calculated using the 1D particle size distribution. Hence, more water inclusion is necessary to match the CSU-CHILL radar observations.

How to cite: Delene, D., Klinman, J., Detwiler, A., Coleman, S., Skow, A., Hernandez, I., Kennedy, P., and Chandrasekar, V.: T-28 Aircraft Image Probe Data Processing: Hail Storm Uncertainty and Radar Coupling, EGU General Assembly 2026, Vienna, Austria, 3–8 May 2026, EGU26-14691, https://doi.org/10.5194/egusphere-egu26-14691, 2026.

EGU26-15701 | ECS | Posters on site | AS1.9

Investigation of supercooled cloud droplet evaporation through very high-resolution numerical modeling, with implications for ice nucleation 

Puja Roy, Sisi Chen, Lulin Xue, Sarah Tessendorf, Robert M. Rauber, and Larry Di Girolamo

Cloud droplet temperature plays a key role in fundamental cloud microphysical and radiative processes. The supercooled droplet temperature and lifetime can impact cloud ice and precipitation formation via homogeneous freezing and activation of ice-nucleating particles through contact and immersion freezing. While most observational and modeling studies often assume droplet temperature to be spatially uniform and equal to the ambient temperature (Ta), this assumption may not always be valid, particularly when droplets experience strong relative humidity (RH) gradients at cloud boundaries.

For a wide range of ambient conditions, we model the coupled heat and mass transfer between the droplet and its environment and quantify the decrease in droplet temperature (ΔT) from that of the far-away ambient temperature (Ta), and the increase in droplet lifetime due to reduced droplet surface temperatures, compared to Maxwellian diffusion-limited evaporation estimates. ΔT is found to increase with Ta, and decrease with increase in ambient relative humidity (RH), and pressure (P). For a prescribed environment and assuming the droplet has infinite thermal heat conductivity, ΔT was typically 1-5°C lower than Ta, with highest values (~10.3°C) for very low RH, low P, and Ta closer to 0ºC. For higher RH and larger droplets, droplet lifetimes can increase by more than 100s compared to the diffusion-limited evaporation approach, which ignores droplet cooling. The steady state temperature of evaporating droplets can be approximated by environmental thermodynamic wet-bulb temperature. Radiation was found to play a minor role in influencing droplet temperatures, except for larger droplets in environments close to saturation. If we resolve the spatiotemporally varying thermal and vapor density gradients near the evaporating droplet, results demonstrate a higher subsaturation-dependent decrease in the droplet temperature as well as the envelope of air in the vicinity of the droplet surface. For an ambient environment specified far away, with Ta = -5°C, RH  = 10%, 40%, and 70%, the decrease in droplet temperatures due to evaporative cooling is ~ 24, 11, and 5°C, respectively and the evaporatively cooled droplets survive longer compared to previous estimates. 

The implications of evaporative cooling and increased lifetimes of supercooled cloud droplets on potential enhancement of ice nucleation near evaporating cloud edges, such as cloud-top generating cells, and especially for moderately supercooled ambient temperatures, are discussed. The importance of using accurate droplet temperatures to improve activated ice nuclei number concentrations from existing primary ice nucleation parameterization schemes, especially in sub-saturated environments, is highlighted. Finally, using high-resolution direct numerical simulations of moderately supercooled cloud boundaries, we discuss the impacts of droplet evaporative cooling on the evolution of supercooled droplet size distributions, which critically impacts ice nucleation.

How to cite: Roy, P., Chen, S., Xue, L., Tessendorf, S., M. Rauber, R., and Di Girolamo, L.: Investigation of supercooled cloud droplet evaporation through very high-resolution numerical modeling, with implications for ice nucleation, EGU General Assembly 2026, Vienna, Austria, 3–8 May 2026, EGU26-15701, https://doi.org/10.5194/egusphere-egu26-15701, 2026.

EGU26-16303 | ECS | Posters on site | AS1.9

From super-droplets to synthetic radar observations: applying a radar simulator to SDM using bin-type data 

Yutaro Nirasawa, Manhal Alhilali, Shin-ichiro Shima, Shuhei Matsugishi, Woosub Roh, Tempei Hashino, and Tomoki Miyakawa

Radar simulators enable quantitative evaluation of cloud resolving models by translating predicted hydrometeor populations into synthetic radar observations (e.g., reflectivity) comparable to measurements. Most existing simulators are designed for Eulerian bulk or bin microphysics schemes and require gridded size-distribution information that is not directly available from Lagrangian particle-based approarches such as the Super-Droplet Method (SDM). Here we assess the feasibility and current limitations of driving an existing radar simulator using SDM output through a bin-type conversion. Within each model grid cell, super-droplets are categiorized based on phase and size to construct particle size distributions on fixed diameter bins. The resulting simulations capture liquid-phase (rain) signatures reasonably well, indicating that the binning approarch preserves key information needed for warm-rain radar signals. In contrast, simulated radar signatures associated with ice particles remain more uncertain, largely because additional assumptions are required during conversion and scattering calculations (e.g., ice particle habit and density), and because some super-droplet information is not yet fully utilized in the simulator interface. We discuss how the rich attributes carried by super-droplets can be leveraged to better constrain ice particle properties and to develop a more direct, standardized pathway from SDM to radar-simulator-ready inputs, enabling more robust radar-based evaluation of small-scale cloud microphysical processes.

How to cite: Nirasawa, Y., Alhilali, M., Shima, S., Matsugishi, S., Roh, W., Hashino, T., and Miyakawa, T.: From super-droplets to synthetic radar observations: applying a radar simulator to SDM using bin-type data, EGU General Assembly 2026, Vienna, Austria, 3–8 May 2026, EGU26-16303, https://doi.org/10.5194/egusphere-egu26-16303, 2026.

EGU26-18422 | ECS | Orals | AS1.9

Imaging the Orientation Dynamics of Snow in Freefall from a Hovering Microscopy Platform 

Vikram Damani, Koen Muller, Léon Mamie, Bernhard Roth, and Filippo Coletti

From single crystal formation high in the atmosphere down to precipitating snowfalls at ground level, no snowflake takes the same path through the air column. During descent, snow crystals grow, aggregate, break, and rime into graupel while interacting with the surrounding air. Among the well-studied effects of temperature and humidity super-saturation, the specific role of the various turbulence activities throughout the atmosphere remains elusive. In this work, we utilize a novel, flexibly deployable, airborne microscopy platform mounted on an uncrewed aerial vehicle for in-situ imaging of snowflakes up to 120 Meters above ground level during their most ‘turbulent end-of-lifetime’ as they descend through the atmospheric surface layer. Our platform mounts an Infinity K2 DistaMax long-range microscope combined with powerful pulsed LED illumination and a LI-550 TriSonica Mini sonic anemometer for wind characterization on a DJI Matrice 600 Pro hexacopter capable of carrying a 5.5 Kilogram payload. The resolving power of the optical systems allows us to collect 38-Micrometer diffraction-limited high-resolution imagery of snowflakes in freefall at 3 Meters distance, well outside of the drone’s aerodynamic envelope in hovering flight. We will present the first data captured at the start of the 2025 snow season, performed at a professional meteorological field site for cross-validation. Running our system at a 10 Hertz acquisition frequency, we collect a large data sample of 1’500 snowflakes using an online image acceptance and rejection over a relatively small observation volume of approximately 30 cubic Centimeters. Further refining our data sample to 200 best in focus snowflakes, initial data analyses reveal a large variety in snowflake morphology, including dendrite crystals, aggregates, and apparent riming. Extracting morphological metrics of size, aspect ratio, orientation angle, and complexity, we then sort the data and plot statistical distributions. In particular, our data reveals a predominance in horizontal fall orientation, which we discuss in relation to the wind vector.

How to cite: Damani, V., Muller, K., Mamie, L., Roth, B., and Coletti, F.: Imaging the Orientation Dynamics of Snow in Freefall from a Hovering Microscopy Platform, EGU General Assembly 2026, Vienna, Austria, 3–8 May 2026, EGU26-18422, https://doi.org/10.5194/egusphere-egu26-18422, 2026.

EGU26-19702 | ECS | Orals | AS1.9

What spatial resolution do we need to resolve shallow cumulus cloud microphysics? 

Birte Thiede, Michael L. Larsen, Freja Nordsiek, Oliver Schlenczek, Eberhard Bodenschatz, and Gholamhossein Bagheri

Cloud microphysical processes on sub-centimeter scales strongly affect precipitation formation, cloud radiative properties, and ultimately large-scale climate. However, both in situ observations and numerical models typically rely on spatial averaging at scales far larger than those at which these processes occur. We present airborne, high-resolution holographic measurements of marine shallow cumulus clouds over the North Atlantic collected during EUREC4A, that provide new insight into the spatial variability of cloud droplet populations.
The Max Planck CloudKite holography system on a tethered balloon samples large localized samples (~10 cm³) of cloud only separated by 10 cm along horizontal cloud transects.

Previous analyses of this dataset have revealed that droplet clustering is a highly localized phenomenon occurring in hotspots on meter and sub-meter scales, with important implications for collision–coalescence rates. Here, we extend the perspective to droplet size distributions. We quantify the scales at which and how often averaged size distributions are representative of local distributions. We find that representativeness is rare: spatial averaging often obscures substantial local variability in droplet size distributions.

This variability indicates distinct locally different growth histories and implies correspondingly different local microphysical process rates. Our results demonstrate that commonly resolved scales in both in situ measurements and model representations are insufficient to capture key aspects of warm-cloud microphysics, highlighting the need to account for small-scale variability when interpreting observations and developing parameterizations.

How to cite: Thiede, B., Larsen, M. L., Nordsiek, F., Schlenczek, O., Bodenschatz, E., and Bagheri, G.: What spatial resolution do we need to resolve shallow cumulus cloud microphysics?, EGU General Assembly 2026, Vienna, Austria, 3–8 May 2026, EGU26-19702, https://doi.org/10.5194/egusphere-egu26-19702, 2026.

EGU26-20222 | ECS | Posters on site | AS1.9

Constraining Small-Scale Cloud Microphysics with High-Resolution Scattering: The Novel Hyper-Angular Cloud Polarimeter and Synergistic Applications 

Andrew DeLaFrance, Harry Ballington, Emma Järvinen, and Martin Schnaiter

Microscale properties of cloud particles govern processes that influence weather and climate from local to global scales, yet accurate detection and quantification of these properties remains a fundamental challenge. Addressing this, recently launched and planned satellite missions have prioritized instrument development based on multi-angle polarimetric imaging of particle light scattering. However, obtaining quantitative microscale properties from these measurements relies on retrieval algorithms that require robust validation against high-fidelity, in-situ data.

To address this critical need, we introduce the Hyper-Angular Cloud Polarimeter - Prototype Version (HACP-PV), a novel in-situ instrument designed and manufactured by schnaiTEC. The instrument's design foundation is shared with the optical principles of satellite-platform multi-angle polarimetry. Independent modulation of the instrument’s emitted and received light polarization states enables direct measurements of the unique elements needed to fully constrain the scattering matrix of the sample volume. We resolve angular scattering functions from approximately 101.5° to 168.5° at a resolution finer than 0.1°, tightly constraining measurements of the Particle Size Distribution (PSD). Crucially, the HACP-PV features an open-path sampling design, eliminating inlet-based sampling artifacts that typically introduce measurement uncertainty. We leverage these complete, artifact-free, scattering signatures to quantify key cloud microphysical quantities, including liquid water content and effective droplet diameter. In addition, the polarimetric measurements offer high sensitivity for discriminating ice from liquid particles, which is crucial for understanding phase-partitioning in mixed-phase clouds.

We report on the progress in bringing this prototype version of the HACP from concept to reality. Our presentation overviews its novel design and summarizes calibration metrics and performance benchmarks from laboratory characterization. We highlight results from an initial deployment in a controlled, cloud-simulating wind tunnel environment, demonstrating the first retrievals of high-fidelity, complete scattering matrix measurements for liquid droplet clouds. Subsequent evaluation of these measurements against scattering calculations based on Mie theory validates the instrument's measurement principle and demonstrates its readiness for synergistic cloud physics research across laboratory and field domains.

This prototype establishes a pathway towards a new benchmark for satellite validation or even serving as a reference standard at operational monitoring networks. Its direct, high-resolution measurements enable rigorous validation of remote sensing algorithms and assumptions. Ultimately, this work contributes to more accurate polarimetric scattering measurements of clouds, facilitating improved constraints on quantitative microphysical estimates, and an advanced understanding of small-scale cloud physics.

How to cite: DeLaFrance, A., Ballington, H., Järvinen, E., and Schnaiter, M.: Constraining Small-Scale Cloud Microphysics with High-Resolution Scattering: The Novel Hyper-Angular Cloud Polarimeter and Synergistic Applications, EGU General Assembly 2026, Vienna, Austria, 3–8 May 2026, EGU26-20222, https://doi.org/10.5194/egusphere-egu26-20222, 2026.

EGU26-20615 | ECS | Posters on site | AS1.9

A hidden treasure: ice nucleating particles preserved inside formvar replicas of ice crystals can be identified using scanning electron microscopy  

Laura Arnold, Florian Zanger, Martin Schnaiter, Adrian Hamel, Carl Schmitt, Andrew Heymsfield, Heike Wex, Christopher Fuchs, Jan Henneberger, and Alexei A. Kiselev

The method of ice crystal replication in Formvar (polyvinyl formal resin) was introduced by Vincent Schaefer in 1941 [1]. At that time no aircraft based optical instrumentation was available to study the morphology of ice crystals. In spite of the rapid advance of the sophisticated optical particle probes, the formvar replication technique, applied in its very original form, turns out to be a valuable complimentary method for the ice crystal habit characterization [4].

In addition to habit and surface morphology, some formvar replicas preserve residual particles that may have acted as ice nucleating particles (INPs). Early attempts to identify these nuclei (e.g. Kumai, 1951 [2] and Koenig, 1960 [3]) were limited by poor instrumental resolution and lack of accurate elemental analysis. Modern scanning electron microscopy and X-Ray spectroscopic techniques allows us to revisit this approach. The ice nucleating particles preserved within the replicas can be characterized and attributed to the ice crystal habits and sampling environmental conditions. Based on several case studies, including ice nucleation experiments conducted in AIDA chamber and analysis of formvar replicas of ice crystals collected from free atmosphere and by airborne probes, we evaluate the potential of the ice replication method combined with SEM analysis for INP identification.

References:

[1] Schaefer, V. J.: A method for making snowflake replicas. Science, 93 (1941) pp. 239-240.

[2] Kumai, M.: Electron-microscope study of snow-crystal nuclei. J. Atmos. Sci., 8 (1951) pp. 151-156.

[3] Koenig, L. R.: The chemical identification of silver-iodide ice nuclei: a laboratory and preliminary field study. J. Atmos. Sci., 17 (1960) pp. 426-434.

[4] Miloshevich, L. M. and Heymsfield, A. J.: A Balloon-Borne Continuous Cloud Particle Replicator for Measuring Vertical Profiles of Cloud Microphysical Properties: Instrument Design, Performance, and Collection Efficiency Analysis, J. Atmos. and Oceanic Tech., 14 (1997), pp. 753-768.

How to cite: Arnold, L., Zanger, F., Schnaiter, M., Hamel, A., Schmitt, C., Heymsfield, A., Wex, H., Fuchs, C., Henneberger, J., and Kiselev, A. A.: A hidden treasure: ice nucleating particles preserved inside formvar replicas of ice crystals can be identified using scanning electron microscopy , EGU General Assembly 2026, Vienna, Austria, 3–8 May 2026, EGU26-20615, https://doi.org/10.5194/egusphere-egu26-20615, 2026.

EGU26-20778 | ECS | Orals | AS1.9

In-Situ Measurements of Turbulence Fluctuations and Droplet Clustering in Shallow Cumulus  

Yewon Kim, Birte Thiede, Eberhard Bodenschatz, and Gholamhossein Bagheri

Shallow cumulus clouds over tropical oceans play a fundamental role in the Earth’s energy budget. Their microphysical properties strongly influence cloud albedo and climate feedbacks in the tropics. However, the mechanism behind rapid raindrop formation and the role of turbulence in this process remain uncertain, particularly the role of small-scale turbulence in rapid droplet growth. To address this challenge, we analyze in-situ measurements collected during the EUREC⁴A field campaign over the tropical Atlantic near Barbados between January and February 2020. The campaign deployed Max Planck CloudKite, a tethered balloon system, from research vessels, yielding approximately 200 hours of airborne observations within shallow cumulus clouds. A subset of this dataset includes simultaneous planar Particle Image Velocimetry (PIV) and holographic measurements, providing the ability to resolve both turbulent flow properties and cloud microphysics.

The localized measurement of turbulence and droplet size distribution allows, for the first time, the simultaneous investigation of cloud microphysics and turbulence at small scales. Spatial organization of droplets shows a strong correlation with turbulence in the examined clouds. Increased turbulence strengthens voids and clustering regions, particularly in precipitating clouds. We further examine the relationship between droplet size and spatial distribution to comparatively assess the influence of turbulence and entrainment on droplet clustering. This study provides a hint of the crucial role of turbulence in precipitation within the examined shallow cumulus clouds.

How to cite: Kim, Y., Thiede, B., Bodenschatz, E., and Bagheri, G.: In-Situ Measurements of Turbulence Fluctuations and Droplet Clustering in Shallow Cumulus , EGU General Assembly 2026, Vienna, Austria, 3–8 May 2026, EGU26-20778, https://doi.org/10.5194/egusphere-egu26-20778, 2026.

EGU26-20869 | ECS | Posters on site | AS1.9

Characterising Surface Roughness in Ice Clouds Using In-Situ Measurements of Frozen Droplets and Bayesian-Optimised Physical Optics Simulations 

Harry Ballington, Andrew DeLaFrance, Emma Järvinen, and Martin Schnaiter

Ice crystal surface roughness influences the global shortwave cloud radiative effect by an estimated 1-2 Wm-2 and affects backscattering properties required for lidar retrievals, yet the microscale structure of atmospheric ice particles remains poorly constrained. In-situ observations indicate that rough and irregular surfaces are common, but insufficient measurements linking particle imagery to angular scattering data limit the development of representative shape models.

During a flight of the CIRRUS-HL campaign in summer 2021, an unusually large proportion of quasi-spherical ice particles resembling frozen droplets were observed by the Particle Habit Imaging and Polar Scattering probe (PHIPS). We use this dataset as a case study to constrain surface roughness in ice clouds. PHIPS provides particle imagery from two viewing angles alongside simultaneous scattering measurements from 18 to 170°. Several thousand single, chain, and aggregated frozen droplets were identified, with mean radius ~14 μm (size parameter X ≈ 200).

We model these particles using the droxtal geometry, and compute scattering properties using a beam tracing physical optics method. Preliminary results indicate pristine droxtals are insufficient to reproduce observed scattering, suggesting that surface roughness cannot be ignored.

The surface roughness implementation is characterised by a mesh edge length and vertex displacement amplitude. Ensembles of roughened droxtals with radii sampled from the measured size distribution are compared against PHIPS measurements using a novel Bayesian optimisation implementation to efficiently explore the 2D roughness parameter space. We present results and discuss implications for constraining ice crystal roughness from in-situ measurements.

How to cite: Ballington, H., DeLaFrance, A., Järvinen, E., and Schnaiter, M.: Characterising Surface Roughness in Ice Clouds Using In-Situ Measurements of Frozen Droplets and Bayesian-Optimised Physical Optics Simulations, EGU General Assembly 2026, Vienna, Austria, 3–8 May 2026, EGU26-20869, https://doi.org/10.5194/egusphere-egu26-20869, 2026.

EGU26-21115 | ECS | Posters on site | AS1.9

Cloud-top entrainment during polar day: first results from in situ observations in Pallas, Finland 

Venecia Chávez-Medina, Hossein Khodamoradi, Eberhard Bodenschatz, and Gholamhossein Bagheri

Turbulent entrainment at cloud top regulates exchange across the cloud–clear-air interface and shapes cloud microphysical structure, variability, and evolution. Yet the governing gradients and mixing events remain difficult to represent in models and to observe with sufficient vertical context, largely due to limited observational capabilities at small scales. Furthermore, quantifying turbulent transport requires high-frequency measurements of vertical velocity and scalar quantities.

Here, we present first results on cloud-top entrainment from the IMPACT field campaign (”In-situ Measurement of Particles, Atmosphere, Cloud and Turbulence”, May-June 2024) in Pallas, Finland, under polar-day conditions. During IMPACT, we deployed the Max Planck WinDarts, lightweight airborne in situ probes designed for vertically distributed measurements on the Max Planck CloudKite (a tethered kite-balloon system). Each WinDart provides high-resolution measurements of 3-D wind, temperature, relative humidity, and pressure, enabling the derivation of turbulent statistics and fluxes across a vertical column. By deploying four WinDarts spaced 50 m apart along the tether, we estimate vertical turbulent fluxes of heat and moisture in the cloud-top region. The vertically resolved measurements provide insights into entrainment processes, turbulence statistics and scalar variability near the cloud top. The findings also demonstrate the potential of tethered, vertically distributed in situ sampling to advance our understanding of entrainment processes.

How to cite: Chávez-Medina, V., Khodamoradi, H., Bodenschatz, E., and Bagheri, G.: Cloud-top entrainment during polar day: first results from in situ observations in Pallas, Finland, EGU General Assembly 2026, Vienna, Austria, 3–8 May 2026, EGU26-21115, https://doi.org/10.5194/egusphere-egu26-21115, 2026.

EGU26-669 | Orals | AS1.10

Constraining the Diurnal Cycle of Tropical Ice Clouds Using Satellite Observations and Reanalysis 

Yidi Wang, Ashok Gupta, Husile Bai, and Ralf Bennartz

Tropical ice clouds influence Earth’s radiation budget and hydrological cycle by reflecting incoming solar radiation and trapping outgoing longwave radiation. However, their diurnal variability remains poorly quantified across observational and reanalysis products. This study evaluates the diurnal and seasonal behavior of tropical Ice Water Path (IWP) using three complementary datasets: European Centre for Medium-Range Weather Forecasts Reanalysis v5 (ERA5) reanalysis, NOAA Climate Prediction Center Infrared (IR) (CPCIR)–based Ice Water Path, and Cloud Profiling Radar and Cloud–Aerosol Lidar and Infrared Pathfinder Satellite Observations (CloudSat–CALIPSO radar-lidar retrievals for 2007-2010).

ERA5 provides hourly global estimates of total column ice (TCIW) and snow water (TCSW), CPCIR offers hourly total ice water path (TIWP) derived from combined infrared and microwave observations, and CloudSat-CALIPSO provides vertically resolved measurements at fixed local times (01:30 AM/PM) that serve as an observational reference for day and night contrasts. Spatially, all datasets exhibit consistent latitudinal IWP distributions within 30° S-30° N, with maxima along the Intertropical Convergence Zone (ITCZ) and minima in the subtropical dry zones. We find IWP peaks between 6-8° N with values of 0.350 kg m⁻² (CALIPSO), 0.269 kg m⁻² (CPCIR), and 0.115 kg m⁻² (ERA5), indicating that ERA5 underestimates IWP magnitude despite capturing the correct spatial structure. Seasonal variability reflects the meridional migration of the ITCZ, with maxima shifting northward during boreal summer (JJA) and southward during boreal winter (DJF). Both longitudinal and latitudinal analyses confirm that the three datasets reproduce similar large-scale IWP patterns across tropical regions. 

The diurnal cycle derived from ERA5 and CPCIR reveals comparable phase behavior, with IWP local peaks both occurring at 4 LST, and global peaks on 15 and 16 LST. This alignment shows consistent timing of convective development across datasets, although CPCIR shows a larger diurnal amplitude and a peak that occurs approximately one hour later in the afternoon. Comparison with CALIPSO day-night retrievals supports that tropical IWP peaks in the afternoon. Comparison between land and sea diurnal cycle reveals that land areas dominate the diurnal signal, supporting that the structure of the diurnal cycle is associated with continental convection, whereas oceanic regions display weaker and flatter cycles. Overall, the results demonstrate that while reanalysis and satellite datasets differ in IWP magnitude, they exhibit consistent spatial, seasonal, and diurnal patterns. The strong land-ocean contrast highlights the key role of continental convection. These findings provide a benchmark for ice cloud diurnal cycle analysis in climate models. 

How to cite: Wang, Y., Gupta, A., Bai, H., and Bennartz, R.: Constraining the Diurnal Cycle of Tropical Ice Clouds Using Satellite Observations and Reanalysis, EGU General Assembly 2026, Vienna, Austria, 3–8 May 2026, EGU26-669, https://doi.org/10.5194/egusphere-egu26-669, 2026.

EGU26-997 | ECS | Posters on site | AS1.10

Interaction and orientation dynamics of charged columnar ice crystals settling in clouds 

Arnab Choudhury and Anubhab Roy

The interaction and settling of ice crystals and other hydrometeors inside turbulent cloud environment plays a crucial role in modelling the Earth’s radiation budget as well as it gives rise to certain distinctive optical phenomena such as sundogs and light pillars. Understanding the orientation distribution of ice crystals inside clouds also plays a crucial role in accurately designing certain remote-sensing equipment. In this study, we investigate the interaction dynamics of two columnar ice crystal settling under the action of gravity in a background turbulent flow resembling the cloud environment. The ice crystals are considered to be like-charged as can be observed in the upper parts of deep convective as well as mixed-phase clouds. The columnar ice crystals are modelled using the slender body theory, to capture the hydrodynamic interaction between them in a turbulent background flow. The effect of background turbulence is incorporated using a stochastic model which can predict the statistical behaviour of the turbulent velocity gradients. Based on this, we have predicted the probability density function of the orientations of the settling ice crystals. Furthermore, we also study how the electrostatic forces modify the settling trajectories and orientation distribution of the ice crystals. Our results indicates that the electrostatic forces and background turbulence significantly affects the orientation distribution of the columnar ice crystals, providing key insights into the microphysical behaviour of ice crystals inside clouds.

How to cite: Choudhury, A. and Roy, A.: Interaction and orientation dynamics of charged columnar ice crystals settling in clouds, EGU General Assembly 2026, Vienna, Austria, 3–8 May 2026, EGU26-997, https://doi.org/10.5194/egusphere-egu26-997, 2026.

EGU26-1636 | ECS | Posters on site | AS1.10

Observation of In-Cirrus Contrail Properties Using Airborne Lidar-Radar Remote Sensing 

Mahshad Soleimanpour, Torsten Seelig, Silke Groß, and Matthias Tesche

Persistent contrails have a significant influence on Earth's energy balance, yet their effects within existing cirrus clouds remain underexplored. This study investigates embedded contrails using observations from the HALO aircraft during the ML-CIRRUS, CIRRUS-HL, and NAWDEX campaigns, alongside lidar-radar retrieval data from the VarCloud framework. We developed an automated detection method leveraging WALES lidar parameters, focusing on particle backscatter coefficients (β(λ) > 4 Mm⁻¹ sr⁻¹) and linear depolarization ratios (δ(λ) < 30% or 43%, based on background pollution) to identify contrail regions accurately. Our results reveal that embedded contrails have a smaller ice effective radius and increased ice water content in affected cirrus clouds by aviation, indicating that they can significantly modify the microphysical properties of cirrus clouds. This understanding is essential for evaluating the climate impact of aviation and for enhancing detection techniques in spaceborne observations, such as those from the EarthCare satellite.

How to cite: Soleimanpour, M., Seelig, T., Groß, S., and Tesche, M.: Observation of In-Cirrus Contrail Properties Using Airborne Lidar-Radar Remote Sensing, EGU General Assembly 2026, Vienna, Austria, 3–8 May 2026, EGU26-1636, https://doi.org/10.5194/egusphere-egu26-1636, 2026.

EGU26-2045 | ECS | Posters on site | AS1.10

Secondary ice production in tropical deep convection: Insights from high-resolution simulations with the Unified Model 

Mengyu Sun, Paul J. Connolly, Paul R. Field, Declan L. Finney, and Alan M. Blyth

Secondary ice production (SIP) plays an important role in tropical deep convection. This study implements multiple SIP mechanisms, including droplet fragmentation and ice–ice collisional breakup, into the CASIM microphysics scheme of the UK Met Office Unified Model, and evaluates their impacts through a real-case simulation of a Hector thunderstorm. SIP enhances ice number concentration in upper cloud layers, with values up to 3 orders of magnitude higher than the no-SIP case, particularly above 10 °C. Ice water content (IWC) increases by a factor of 3–5 in the anvil region, contributing to more extensive upper-level cloud coverage. These microphysical changes reduce outgoing longwave radiation (OLR) by  3.2 W m−2 (1.3 %) and increase outgoing shortwave radiation (OSR) by  4.5 W m−2 (1.8 %) over a 6 h analysis period and a 110 km× 110 km domain. SIP modifies precipitation spatially, yielding a more localized, compact rainfall pattern near the convective core, while reducing domain-averaged precipitation by  8 %. Peak rainfall rates remain only slightly affected, consistent with the minor changes (< 1 m s−1) in maximum updraft velocity. Among the tested mechanisms, ice–ice collisional breakup shows negligible impact on simulated ice concentration, consistent with limited graupel-involved collision energetics under warm profiles. Ensemble experiments confirm that these effects are robust and exceed the influence of meteorological variability. These results highlight the importance of representing SIP processes in cloud-resolving models of tropical convection and accounting for their environmental dependence.

How to cite: Sun, M., Connolly, P. J., Field, P. R., Finney, D. L., and Blyth, A. M.: Secondary ice production in tropical deep convection: Insights from high-resolution simulations with the Unified Model, EGU General Assembly 2026, Vienna, Austria, 3–8 May 2026, EGU26-2045, https://doi.org/10.5194/egusphere-egu26-2045, 2026.

EGU26-3188 | Orals | AS1.10

On Lower-Tropospheric Arctic Ice Particle Properties Retrieved Using Machine Learning Applications to Remote Sensing Data, and their representation in Global Model Simulations 

Israel Silber, Jennifer M. Comstock, Yang Shi, Ann M. Fridlind, Andrew S. Ackerman, Xiaohong Liu, Jacqueline M. Nugent, and Daniel T. McCoy

Ice particles and their properties (shape, size, etc.) have great potential for influencing cloud lifecycles, from their formation through their growth, and precipitation. Coupled with liquid-phase hydrometeors and associated processes in mixed-phase clouds, ice processes can be critical for understanding the extent of aerosol-cloud interactions and their causal links, which require model simulations across scales.  Robust estimates of observed ice properties, therefore, can support the evaluation and rectification of model physics, which could ultimately increase model fidelity. However, the entanglement of various parameterized processes that affect modeled cloud characteristics poses challenges for direct comparisons of model state variables with cloud observations. The use of consistent cloud process metrics can help address some of these difficulties and enable direct comparisons between observations and models. In the case of Arctic mixed-phase clouds, the representation of ice precipitation rates at and below cloud base, which serve as a key cloud water sink, could impact simulated cloud lifecycles and alter cloud feedbacks. These metrics can be robustly retrieved from ground-based measurements, which are considerably less susceptible to uncertainties associated with accurately locating cloud base, tropospheric profiling limitations, and spatial footprint size.

Here, we describe the main approaches of ice property retrievals. We then focus on cloud-base ice particle property retrievals using a Markov Chain Monte Carlo (MCMC) algorithm applied to radar and high-spectral-resolution lidar observations from the U.S. Department of Energy Atmospheric Radiation Measurement (ARM) User Facility site at the North Slope of Alaska (NSA). We describe the analysis results, including a qualitative distinction between ice-number- and size-dominated reflectivity regimes, number-concentration enhancements in certain temperature ranges, and a weak, typical Arctic cloud-base vertical motion. After examining insights derived from those retrievals, they are used in a brief bulk evaluation of mixed-phase cloud ice representation in three different global models: the NASA Goddard Institute for Space Studies ModelE3, the NCAR Community Earth System Model Version 2 (CESM2), and the DOE Energy Exascale Earth System Model Version 1 (E3SMv1). To perform a robust evaluation of Arctic cloud precipitation rates against observations, we process regional model output using the Earth Model Column Collaboratory (EMC²) instrument simulator and subcolumn generator, and compare them with corresponding cloud-base precipitation statistics calculated from the long-term ground-based remote-sensing dataset collected at the ARM NSA site. This brief analysis demonstrates key differences between the models and examines the agreement between model output and observations. Finally, we describe our current effort to generate sub-mixed-phase cloud ice precipitation profiles using a deep neural network emulator of the computationally intensive MCMC algorithm and discuss future plans.

How to cite: Silber, I., Comstock, J. M., Shi, Y., Fridlind, A. M., Ackerman, A. S., Liu, X., Nugent, J. M., and McCoy, D. T.: On Lower-Tropospheric Arctic Ice Particle Properties Retrieved Using Machine Learning Applications to Remote Sensing Data, and their representation in Global Model Simulations, EGU General Assembly 2026, Vienna, Austria, 3–8 May 2026, EGU26-3188, https://doi.org/10.5194/egusphere-egu26-3188, 2026.

EGU26-3357 | Orals | AS1.10 | Highlight

Long-lived contrails in cirrus clouds underestimated with uncertain climate impact 

Andreas Petzold, Neelam F. Khan, Yun Li, Peter Spichtinger, Susanne Rohs, Susanne Crewell, Andreas Wahner, and Martina Krämer

Contrail-cirrus is considered the most important component of aviation-induced climate impact. However, a reliable assessment requires a better understanding of the environment in which they are formed, and the resulting radiative effects. One study has been recently published on the quantification of the radiative forcing of contrails embedded in cirrus clouds (Seelig et al., 2025) and found a contribution of around 10% of the current estimate of the climate impact of line-shaped contrails.

Our study (Petzold et al., 2025) focuses on the occurrence of long-lived contrail-cirrus with natural cirrus clouds. To this end, we investigated the distribution of relative humidity with respect to ice (RHice) – the key parameter controlling the lifetime of contrails - in clear sky as well as inside optically thin and thick cirrus clouds for the North Atlantic region and over subtropical Southeast Asia, with the focus on the occurrence of ice-supersaturated air masses and the potential of contrail formation.

The underlying data base builds on more than 7 years of continuous in-situ observations by the European research infrastructure IAGOS (www.iagos.org) which measures, among others, temperature, RHice and ice cloud particles, on instrumented passenger aircraft, and covers the period from June 2014 to December 2021. Information on cloud coverage and cloud thickness were taken from ERA5 global reanalysis by means of the cloud ice water content (CIWC). The separation of clear-sky and in-cloud flight sequences was achieved by applying a novel ERA5 CIWC based cloud index validated by IAGOS and research aircraft in-situ RHice observations as well as by process simulations.

The analysis shows that conditions promoting long-lived contrails are fulfilled most often in regions already covered by subvisible or visible cirrus: ~90% over the Northern midlatitudes and almost 100% in the Southeast Asian subtropics, approximately equally distributed among visible and subvisible cirrus clouds. A conceptual analysis shows that subvisible cirrus and clear-sky cover ~10% of the cruise altitude over Northern midlatitudes (< 2% in the subtropics) and contrails within these regions are expected to cause additional warming. However, most contrails in the thicker, visible cirrus, only slightly enhance the cirrus warming effect or possibly reverse it to cooling. Our results suggest that potential flight rerouting concepts for contrail avoidance need to consider cirrus cloud coverage in addition to ice- supersaturation, which is currently the primary criterion for rerouting.

References:

Petzold, A., Khan, N. F., Li, Y., Spichtinger, P., Rohs, S., Crewell, S., Wahner, A., and Krämer, M.: Most long-lived contrails form within cirrus clouds with uncertain climate impact, Nat Commun, 16, 9695, doi: 10.1038/s41467-025-65532-2, 2025.

Seelig, T., Wolf, K., Bellouin, N., and Tesche, M.: Quantification of the radiative forcing of contrails embedded in cirrus clouds, Nat Commun, 16, 10703, doi: 10.1038/s41467-025-66231-8, 2025.

How to cite: Petzold, A., Khan, N. F., Li, Y., Spichtinger, P., Rohs, S., Crewell, S., Wahner, A., and Krämer, M.: Long-lived contrails in cirrus clouds underestimated with uncertain climate impact, EGU General Assembly 2026, Vienna, Austria, 3–8 May 2026, EGU26-3357, https://doi.org/10.5194/egusphere-egu26-3357, 2026.

EGU26-4848 | ECS | Orals | AS1.10

Investigating Secondary Ice Production in Springtime Arctic Mixed-phase Clouds  

Nina Maherndl, Maximilian Maahn, Manuel Moser, and Johannes Lucke

In the current climate, Arctic mixed-phase clouds (MPCs) have a warming effect on average. While the radiative impact of MPCs is driven by their liquid phase, the formation and growth of ice particles can alter their radiative properties. Ice crystal formation and growth processes in MPCs are still poorly understood, leading to large uncertainties in their representation in weather and climate models, and thus in their role in a rapidly warming Arctic. Contributions from secondary ice production (SIP)---ice formation without ice nucleating particles (INP)---are still poorly constrained.

In this study, we investigate the occurrence of SIP, riming, and aggregation in springtime Arctic MPCs. We use airborne data collected during the (AC)³ field campaigns AFLUX and HALO-(AC)³, conducted near Svalbard in 2019 and 2022, respectively. During both campaigns, in situ cloud probes covered a particle size range from 2.8 µm to 6.4 mm. We derive estimates of rime mass based on particle shape observations. A clustering approach is used to distinguish particle populations dominated by pristine crystals, aggregates, and rimed particles based on their particle size, number concentration, and rime mass.  We investigate the relative occurrence of each class and its dependence on meteorological conditions. SIP events are identified through multimodal particle size distributions with high concentrations of small ice particles (50 µm < diameter < 100 µm). We analyze the occurrence of SIP in terms of meteorological conditions, cloud properties, and particle class (although direct causal links cannot be made based on airborne data alone). This will lead to a better understanding of ice formation and growth in Arctic MPCs and thus helps to improve future modeling efforts.

How to cite: Maherndl, N., Maahn, M., Moser, M., and Lucke, J.: Investigating Secondary Ice Production in Springtime Arctic Mixed-phase Clouds , EGU General Assembly 2026, Vienna, Austria, 3–8 May 2026, EGU26-4848, https://doi.org/10.5194/egusphere-egu26-4848, 2026.

Mesoscale convective systems (MCSs) are vital to Earth's climate system, fundamentally influencing water and energy cycles and by driving a large fraction of extreme weather events, including intense precipitation, flooding, and severe winds. A defining characteristic of these systems is their extensive ice anvils, whose shortwave and longwave radiative interactions generate cloud-radiative heating that strongly controls anvil lifetime, organization, and storm evolution. Despite their importance, the representation of deep convective systems remains a major source of uncertainty in weather and climate models, largely due to the complex and tightly coupled interactions between aerosols, cloud microphysics, and radiation. In particular, the role of ice crystal number, size, and habit in modulating radiative heating profiles and feedbacks on convective dynamics is still poorly constrained.

The High Altitude Ice Crystals (HAIC) field campaign provides a unique observational framework to investigate these processes. HAIC combined in situ airborne microphysical measurements with satellite observations to document the properties of ice crystals in deep convective structure, with a specific focus on high ice water content conditions relevant for both climate processes and aviation safety. During the campaign, detailed observations of ice crystal concentrations, size distributions, and thermodynamic conditions were collected in tropical deep convective systems, offering an exceptional opportunity to evaluate and constrain model representations of ice microphysics and their radiative impacts.

In this study, we focus on a well-documented deep convective system that formed over the Atlantic Ocean and was advected toward French Guiana on 16 May 2015. We combine HAIC airborne and satellite observations with high-resolution numerical simulations performed with the Meso-NH model. The simulations employ the two-moment LIMA microphysical scheme, explicitly coupled to the ecRad radiative transfer code. The radiative properties of ice crystals are prescribed using habit-dependent optical parameterizations derived from the Yang et al. (2013) ice optics lookup tables. Aerosol sources, transport, activation, and scavenging are explicitly represented, allowing an assessment of how aerosol variability propagates through cloud microphysical processes and radiative feedbacks. This configuration allows a physically consistent representation of aerosol–microphysics–radiation interactions. Sensitivity experiments are performed to investigate both aerosol life-cycle effects and ice crystal habit variability, while keeping the large-scale dynamical forcing unchanged. Dedicated sensitivity simulations are conducted by systematically testing distinct ice crystal habits in order to isolate their respective impacts on cloud-radiative heating profiles, anvil structure, precipitation efficiency, and convective lifecycle. This combined observational–modeling framework provides quantitative insight into how aerosol processes and ice microphysical properties jointly modulate radiative feedbacks in deep convection.

How to cite: El Gdachi, S. and Barthe, C.: Aerosol–Ice Crystal–Radiation Interactions in Deep Convection: Insights from High-Resolution Meso-NH Simulations and HAIC Observations, EGU General Assembly 2026, Vienna, Austria, 3–8 May 2026, EGU26-4868, https://doi.org/10.5194/egusphere-egu26-4868, 2026.

EGU26-5282 | ECS | Orals | AS1.10

Stochastic homogeneous freezing of supercooled droplets in particle-based microphysics 

Tim Lüttmer, Sylwester Arabas, and Peter Spichtinger

Homogeneous freezing of supercooled cloud droplets controls the transition from mixed- to ice-phase regime in the upper troposphere. We discuss a stochastic representation of the process, for use in particle-based aerosol-cloud microphysics models. The embraced Poissonian formulation is governed by droplet volume, model time step, and the homogeneous nucleation rate.

Using an implementation of the model in the PySDM particle-based modelling package, we evaluate two nucleation-rate formulations: a temperature-dependent and a water-activity-based parameterisations, the latter applicable also to aqueous solution droplets.

Using an air-parcel framework, we investigate freezing-temperature distributions and resulting ice number concentrations across ensembles of simulations with varying updraft speeds, CCN concentrations, droplet size distributions, and number of super-particles. The two nucleation-rate parameterisations diverge under super- or subsaturated conditions with respect to water, yielding differences in freezing temperatures and ice number concentrations.

To asses the impact of Wegener-Bergeron-Findeisen process on ice concentrations, we consider simulations with and without vapour deposition on ice. With deposition enabled, early stochastic freezing events dominate the evolution of the frozen droplet fraction and substantially reduce the number of droplets that ultimately freeze.

The developed model allows to validate the common assumption that homogeneous freezing is a threshold phenomenon occurring at ca. 235 K. We find that homogeneous freezing spans a broad temperature range controlled by cooling rate and droplet size, highlight the importance of stochastic freezing formulations and nucleation-rate choice for representing cloud glaciation.

How to cite: Lüttmer, T., Arabas, S., and Spichtinger, P.: Stochastic homogeneous freezing of supercooled droplets in particle-based microphysics, EGU General Assembly 2026, Vienna, Austria, 3–8 May 2026, EGU26-5282, https://doi.org/10.5194/egusphere-egu26-5282, 2026.

Secondary ice production (SIP) is the process through which the number concentration of ice crystals increases to greatly exceed the number concentration of ice nuclei. Though recent field campaigns investigating SIP within deep convection have revealed important insights, the importance of different pathways (rime splintering, droplet fragmentation, ice-ice collisional breakup, sublimation fragmentation, droplet jet freezing) to total SIP is still uncertain. To investigate these unknowns, we simulated a subtropical deep convective cloud using Lagrangian cloud microphysics. 

Our results indicate that SIP produces stronger updrafts but reduces overall precipitation, reflecting a shift from condensational to vapor depositional growth. We find that droplet fragmentation dominates SIP early in the cloud’s development, while ice-ice collisional breakup becomes increasingly important later as large graupel forms. SIP also greatly increases ice water content and produces a more optically-thick anvil. Colder-temperature ice nuclei delay the onset of SIP and lead to higher overall precipitation despite lower total condensate. Increasing background cloud condensation nuclei (CCN) concentration reduces total precipitation, with a stronger relative reduction when SIP is present. Increasing CCN concentration increases ice water content, though this increase is non-monotonic with CCN concentration when SIP is present.

Our work supports the feasibility of modeling SIP within a Lagrangian microphysical framework, and highlights the complex interactions between SIP, background CCN concentration, and ice nuclei type.

How to cite: Ascher, B. and Hoffmann, F.: Secondary Ice Production Invigorates Updrafts but Suppresses Precipitation in Simulated Subtropical Convection, EGU General Assembly 2026, Vienna, Austria, 3–8 May 2026, EGU26-5284, https://doi.org/10.5194/egusphere-egu26-5284, 2026.

EGU26-5467 | Orals | AS1.10

Significance of an urban river as a local source of ice nucleating particles 

Ana A. Piedehierro, Veera Vasenkari, André Welti, and Ari Laaksonen

The concentration of ice nucleation particles (INP) in river waters surpasses the levels found in oceans and in the sea by orders of magnitude. Therefore, despite covering a small surface area, lakes and rivers could be a significant local source of INPs along river systems and also beyond when the INPs contained in river waters flow into the sea. Most aerosolisation mechanisms that occur in the sea (e.g., wave breaking and bubble bursting) also occur in flowing systems such as rivers or lakes. However, how efficiently INPs are aerosolized from rivers remains an open question, limiting the estimation of the impact of rivers as a source of INPs.

In this work, we present INP measurements from the urban section of the Vantaa river in Helsinki, Finland. We characterise the INP concentrations both in the water and in the adjacent air at an artificial weir next to the mouth of the river. Additionally, we study the aerosolisation mechanisms and examine how INP concentrations in the water change at the river mouth, where the river water mixes into the Baltic Sea.

This work was supported by the Research Council of Finland Flagship ACCC (grant 337552) and MEDICEN project (grants no. 336557 and 345125)

How to cite: Piedehierro, A. A., Vasenkari, V., Welti, A., and Laaksonen, A.: Significance of an urban river as a local source of ice nucleating particles, EGU General Assembly 2026, Vienna, Austria, 3–8 May 2026, EGU26-5467, https://doi.org/10.5194/egusphere-egu26-5467, 2026.

EGU26-6196 | Orals | AS1.10

New ways of mixed-phase cloud and cirrus research by means of field studies with combined fluorescence, dual-FOV polarization lidar and cloud radar: CCNC-CDNC and INPC-ICNC closure studies 

Albert Ansmann, Benedikt Gast, Cristofer Jimenez, Julian Hofer, Ronny Engelmann, Holger Baars, Patric Seifert, Martin Radenz, Ulla Wandinger, and Yun He

Vertical profiling with ground-based lidars and radars offers excellent opportunities to monitor life cycles of mixed-phase clouds (MPCs) and cirrus fields in a coherent way over hours to days. In this presentation, we will discuss the new potential of modern lidar techniques in combination with cloud radar methods (a) to explore the evolution of MPCs, separately in terms of liquid- and ice-phase properties and (b) to study in detail the contribution of heterogenous ice nucleation to cirrus formation processes. The discussion is based on measurements performed in the framework of the MOSAiC expedition (life cycles of long-lasting Arctic MPCs), and intensive field studies at Dushanbe, Tajikistan (water and mixed-phase cloud evolution in aged dust and  dust-haze mixtures in central Asia), at Leipzig, Germany  (cirrus evolution in aged Canadian wildfire smoke), and in Cyprus and Punta Arenas, Chile (MPC evolution in the polluted Eastern Mediterranean vs the MPC evolution  over the pristine Southern Ocean). Of central importance are closure studies in which retrieved cloud condensation nucleus concentrations (CCNC) and cloud droplet number concentrations (CDNC) as well as ice-nucleating particle concentrations (INPC) and ice crystal number concentrations (ICNC) are compared.

In the case of mixed-phase clouds, the CCNC and INPC information is derived from extinction and backscatter lidar observations in combination with the POLIPHON (Polarization Lidar Photometer Networking) method. Relevant INP types in the free troposphere are wildfire smoke particles and mineral dust. By means of the fluorescence and the polarization lidar techniques a clear identification of fluorescing smoke and non-fluorescing, but polarizing dust particles is possible. The recently introduced dual-field-of-view (dual-FOV) polarization lidar method allows continuous monitoring of CDNC at about 75 to 100 m above the base of liquid-dominated cloud layers, occurring for example at the top of stratiform MPC systems. ICNC information is provided in the ice virga region using the synergy of cloud radar reflectivity and lidar extinction measurements. As will be shown, we observed long lasting Arctic mixed-phase cloud decks with permanently occurring liquid-dominated cloud top layers with CDNC typically ranging from 50-300 cm-3 and the continuous production of ice crystals with ICNC of typically 0.1-1 per liter.

In the case of cirrus field studies, an important step forward was the integration of fluorescence lidar measurements into the combined lidar-radar observations.  Now, we were able to clearly identify and quantify fluorescing wildfire smoke particles serving as INPs in the upper troposphere. Strong smoke plumes in the tropopause region fruwently occurred in 2023 and 2025. The smoke INPC can now be determined within the cirrus top layers in which ice nucleation takes place.  We are able to answer the question whether a smoke INP reservoir in ice clouds can be depleted quickly during a cirrus life cycle or not and how important the smoke impact on heterogenous ice nucleation for cirrus formation is. The synergy of cloud radar and lidar observations again delivers ICNC information. The INPC-ICNC closure studies provided clear indications for a significant impact of smoke on cirrus formation over Leipzig, Germany.

How to cite: Ansmann, A., Gast, B., Jimenez, C., Hofer, J., Engelmann, R., Baars, H., Seifert, P., Radenz, M., Wandinger, U., and He, Y.: New ways of mixed-phase cloud and cirrus research by means of field studies with combined fluorescence, dual-FOV polarization lidar and cloud radar: CCNC-CDNC and INPC-ICNC closure studies, EGU General Assembly 2026, Vienna, Austria, 3–8 May 2026, EGU26-6196, https://doi.org/10.5194/egusphere-egu26-6196, 2026.

EGU26-7428 | ECS | Orals | AS1.10

Observed and Simulated Dynamic Responses to Glaciogenic Seeding in Wintertime Mixed-Phase Clouds 

Christopher Hohman, Jeffrey French, Lulin Xue, Sarah Tessendorf, Katja Friedrich, Sisi Chen, Bart Geerts, Zhixing Xie, Robert Rauber, Coltin Grasmic, and Jan Hennenberger

Observations from recent field campaigns investigating glaciogenic cloud seeding demonstrate the process of silver iodide (AgI) dispersion through ice nucleation, crystal growth, then enhanced snowfall at the surface. These observations, combined with numerical simulations, were used to quantify seeding’s impact on enhancing precipitation in targeted regions. With the microphysical chain of events established, fundamental knowledge gaps remain on the mechanisms by which seeding modifies the cloud dynamics, structure, and precipitation enhancement. This study presents the first direct observational evidence that glaciogenic seeding generates buoyant forces in wintertime orographic clouds that elevate cloud tops and secondary circulations that alter the cloud structure. 


In this study, we analyze dynamic responses induced from seeding in the Seeded and Natural Orographic Wintertime Clouds: The Idaho Experiment (SNOWIE) and CLOUDLAB field campaigns. The SNOWIE cases occurred in the Payette mountains in presence of widespread supercooled liquid conditions and low natural ice number concentrations. Ground-based X-band radars tracked the development and evolution of cloud and precipitation from five seeding legs. Distinct cells, directly attributable to airborne seeding, developed from smaller weaker echoes (10 dBZ) at the natural cloud top and rapidly intensified to produce precipitation with echoes >30 dBZ. The key observed processes were dynamic responses induced by the latent heat released from seeding that led to enhancing cloud top by 350 m compared to the natural cloud. An airborne W-band Dual-Doppler cross-section illustrates the detailed dynamic structure for one cell consisting of a central updraft, divergence near cloud top, and toroidal circulations along its periphery in an observed moist-neutral environment. In situ measurements show distinct microphysical regimes in the elevated cloud top, with seeding generated ice number concentrations up to 580 L-1. A WRF-WxMod ensemble shows the evolution of dynamic responses, the microphysical characteristics, and precipitation enhancement up to 200 km downwind of release.


We combine these results with preliminary observations from the 2025-2026 CLOUDLAB field campaign that further investigate the roles each step in a dynamic response has on seeded cloud microphysical properties. We show the evolution of seeded cloud from Ka-band cloud radars, combined with in-situ measurements from a holographic imager, to show dynamic response impact on microphysical structure and cloud properties.


How to cite: Hohman, C., French, J., Xue, L., Tessendorf, S., Friedrich, K., Chen, S., Geerts, B., Xie, Z., Rauber, R., Grasmic, C., and Hennenberger, J.: Observed and Simulated Dynamic Responses to Glaciogenic Seeding in Wintertime Mixed-Phase Clouds, EGU General Assembly 2026, Vienna, Austria, 3–8 May 2026, EGU26-7428, https://doi.org/10.5194/egusphere-egu26-7428, 2026.

EGU26-7445 | ECS | Orals | AS1.10

Exploring Formation Conditions of Dusty Cirrus Using a Large-Eddy Simulator 

Kasper Juurikkala, Tomi Raatikainen, Martina Krämer, and Ari Laaksonen

Dusty cirrus clouds are optically thick cirrus that form under the influence of elevated concentrations of ice nucleation active mineral dust. These clouds are associated with dust plume events in which freshly emitted mineral dust particles are lifted to near-tropopause levels by baroclinic storms. At present, dusty cirrus clouds are not well represented in global climate models, primarily because aerosol-cloud interactions are inadequately parameterized and model resolutions are insufficient to resolve the convective motions within these clouds (Seifert et al., 2023, ACP).

We used large-eddy simulatior (LES) UCLALES-SALSA to investigate the formation conditions of dusty cirrus clouds, supported by a sensitivity analysis based on observations from the ML-CIRRUS (2014) campaign. The results indicate that mineral dust concentrations must be approximately 10-100 times higher than climatological values to sustain convective overturning motions. Furthermore, the sensitivity analysis shows that both sub-500 nm and super-500 nm dust particles play a significant role in producing ice crystal number concentrations consistent with in situ observations.

We further find that the choice of deposition ice nucleation parameterization has a strong influence on the simulated properties of dusty cirrus clouds and on the temperature range over which they can form. The sensitivity analysis was conducted using the Ullrich et al. (2017, JAS) scheme, which exhibits strong sensitivity to temperature and relative humidity with respect to ice within the temperature range characteristic of dusty cirrus clouds, and produces a relatively large fraction of ice concentration near the top of the cirrus layer. In contrast, simulations using the Phillips et al. (2013, JAS) scheme yield markedly different cloud structures, with more vertically uniform ice crystal number concentrations, reflecting its weaker temperature dependence compared to the Ullrich et al. (2017) parameterization.

How to cite: Juurikkala, K., Raatikainen, T., Krämer, M., and Laaksonen, A.: Exploring Formation Conditions of Dusty Cirrus Using a Large-Eddy Simulator, EGU General Assembly 2026, Vienna, Austria, 3–8 May 2026, EGU26-7445, https://doi.org/10.5194/egusphere-egu26-7445, 2026.

EGU26-7738 | ECS | Orals | AS1.10

Impact of cloud overlap on cloud formation and lifetime through radiative coupling 

Wouter Mol, Blaž Gasparini, and Aiko Voigt

Clouds influence the atmosphere's radiation balance, but cloud formation and lifetime itself is also influenced by radiation. Overlapping cloud layers, a common occurrence globally, are thus indirectly coupled through the individual layer's influence on radiative fluxes. In this work, we study the impacts of overlap between mid level (altocumulus and congestus) and high clouds (cirrus).

First, we identify tropical to subtropical West Africa as a hotspot of mid and high cloud overlap, based on CloudSat-CALIPSO observations. During the wet season, altocumulus and cirrus clouds overlap during at least 20% of all-sky conditions. Second, we design an idealized numerical setup that resolves two radiatively coupled cloud layers, allowing one cloud layer to evolve based on the influence of the other. We run experiments by varying the initial optical thickness of each cloud layer according to observed climatology. These experiment allows us to quantify how cloud overlap affects overall cloud lifetime, atmospheric radiative heating, and local radiative balance. 

Since both altocumulus and cirrus in this region find their origin in deep convection, we expect that cloud overlap, via radiative heating, affects subsequent deep convection. Given the difficulty of representing mid level clouds in models, our results have implications for cloud climatology and regional radiation balance in climate simulations as well.

How to cite: Mol, W., Gasparini, B., and Voigt, A.: Impact of cloud overlap on cloud formation and lifetime through radiative coupling, EGU General Assembly 2026, Vienna, Austria, 3–8 May 2026, EGU26-7738, https://doi.org/10.5194/egusphere-egu26-7738, 2026.

EGU26-8217 | Posters on site | AS1.10

A Shape-Aware Mass–Diameter Parameterization for Ice Crystals Constrained by Glaciogenic Seeding Experiments 

Henneberger Jan, Huiying Zhang, Christopher Fuchs, Anna J. Miller, Nadja Omanovic, Robert Spirig, and Ulrike Lohmann

Accurate estimates of ice crystal mass are essential for reducing uncertainties in cloud radiative forcing and precipitation forecasts. Ice crystal mass can be derived from imaging cloud probes using power-law mass–diameter (m-D) relationships. However, these often do not account for variability in crystal habit, leading to significant biases in ice water content (IWC) retrievals and complicating the comparison between in-situ observations and numerical models.

To address this, we developed a shape-aware m-D parameterization by explicitly incorporating the aspect ratio (AR) into a power-law framework. The parametrization is fitted using data from the CLOUDLAB campaigns, which use glaciogenic seeding to induce ice formation in supercooled stratus clouds. This experimental setup allows for two total water content (TWC) conservation assumptions: (i) the temporal stability of the stratus clouds allows to use the TWC of the unseeded cloud as a reliable baseline for the seeded section., and (ii) the introduction of ice crystals via seeding does not alter the TWC, even as the Wegener–Bergeron–Findeisen process redistributes mass from the liquid to the ice phase. Using data from 20 seeding experiments, we optimized the m-D parameters by minimizing the difference between seeded and the baseline TWC using a loss function based on the Wasserstein distance to ensure that the probability distribution of the derived TWC match the observed variability of the background cloud.

The resulting parameterization m = 0.0487 D2.045 / AR2 aligns well with existing m-D relationships but predicts lower ice crystal masses for high aspect ratios. When applied to the CLOUDLAB data, the formula successfully removes systematic overestimations in ice mass across various temperatures and growth stages. While riming and aggregation were only weakly present in our dataset, they did not lead to significant deviations. This study provides a shape-aware m-D formulation suitable for bulk microphysics schemes and demonstrates a robust, data-driven framework for constraining cloud parameters using field measurement from cloud seeding experiments.

How to cite: Jan, H., Zhang, H., Fuchs, C., Miller, A. J., Omanovic, N., Spirig, R., and Lohmann, U.: A Shape-Aware Mass–Diameter Parameterization for Ice Crystals Constrained by Glaciogenic Seeding Experiments, EGU General Assembly 2026, Vienna, Austria, 3–8 May 2026, EGU26-8217, https://doi.org/10.5194/egusphere-egu26-8217, 2026.

EGU26-8252 | Orals | AS1.10

A hierarchy of ice cloud models 

Peter Spichtinger

Ice clouds, as all clouds, are important components of the Earth-Atmosphere system, influencing Earth’s energy budget and the hydrological cycle. For the representation of ice clouds in models on different scales, we have to design meaningful cloud schemes based on the relevant process (as, e.g., nucleation, growth/evaporation, or sedimentation). Since most of these processes are quite complex, we have to derive simple (or even much simpler) schemes, adapted adequately to the scales as resolved in the respective model. The derivation of bulk schemes from the underlying population balance equation is a typical example for such model reduction; this procedure typically results into a set of ordinary differential equations for averaged quantities. Even for such bulk models, simplification of these complex schemes is often necessary for the use in weather models. However, further reduction of the dynamical systems might alter their qualitative properties, i.e. the quality of solutions.

In this contribution, a consistent hierarchy of models for ice clouds at low temperatures is developed. Using several consistent approximations and simplifications, complex (bulk) schemes can be reduced to simpler models, allowing a better understanding of the represented processes. These models are analyzed in terms of qualitative behavior of solutions. It can be shown, that certain reduction steps, as, e.g., the change to a constant sedimentation velocity of cloud particles suppresses oscillatory solutions, as recently determined. During the reduction process, the ability of the resulting simpler models to represent measurements at least qualitatively is addressed.

How to cite: Spichtinger, P.: A hierarchy of ice cloud models, EGU General Assembly 2026, Vienna, Austria, 3–8 May 2026, EGU26-8252, https://doi.org/10.5194/egusphere-egu26-8252, 2026.

EGU26-8328 | ECS | Orals | AS1.10

Sensitivity of Tropical Anvils to Ice Aggregation  

Jennie Bukowski, Stephen Saleeby, Randy Chase, Derek Posselt, Brenda Dolan, Leah Grant, Gabrielle Leung, Peter Marinescu, Kristen Rasmussen, Itinderjot Singh, Rachel Storer, and Susan van den Heever

In tropical convection, the microphysical properties of ice in anvils are a major factor in determining cloud-radiative forcing and cloud-climate feedbacks. One large source of uncertainty in predicting the ice number, size, shape, and sedimentation in storm anvils is establishing the efficiency of ice self-aggregation processes. Ice crystal adhesion decreases as temperature decreases, but aggregation process rates are difficult to measure and depend on complex environmental factors. The overarching goal of this study is to identify how uncertainty related to ice aggregation efficiencies affects anvil properties and cloud radiative feedbacks, and how we may constrain this uncertainty in the future.  

We exploit a high-resolution database of simulated convective systems being produced for the NASA INvestigation of Convective UpdraftS (INCUS) mission with the Regional Atmospheric Modeling System (RAMS), which features a bin-emulating microphysics scheme. The INCUS LES dataset represents an expanding collection of diverse storm morphologies in a variety of maritime and continental (sub)tropical environments, including scattered congestus, multicell convective clouds, squall lines, and tropical cyclones. To address our science goals, ice aggregation efficiencies for temperatures -20 to -50 ◦C are perturbed in the INCUS simulation ensemble. The perturbed aggregation efficiencies all fall within the spread of uncertainty of those obtained from previous laboratory and modeling studies. The simulations are then run through the Community Radiative Transfer Model (CRTM), and storm anvils are tracked and separated into their optically thick and thin components.  

Overall, small changes to ice aggregation efficiencies below -20 °C can significantly reduce or expand anvil extent, lifetime, depth, and their associated cloud radiative effects. Thick anvils are more sensitive to changes in aggregation than thin anvils, with a 25% reduction in thin anvil area and a near complete dissipation of thick anvils. As such, anvil cooling feedbacks are more sensitive to ice aggregation than cloud warming effects, with changes in outgoing longwave radiation on the order of 100 W/m^2. This analysis demonstrates how poorly constrained ice self-aggregation efficiencies are within observations and numerical models, proving a critical need for more observations and physical understanding of ice aggregation processes. 

How to cite: Bukowski, J., Saleeby, S., Chase, R., Posselt, D., Dolan, B., Grant, L., Leung, G., Marinescu, P., Rasmussen, K., Singh, I., Storer, R., and van den Heever, S.: Sensitivity of Tropical Anvils to Ice Aggregation , EGU General Assembly 2026, Vienna, Austria, 3–8 May 2026, EGU26-8328, https://doi.org/10.5194/egusphere-egu26-8328, 2026.

Aircraft icing associated with supercooled large droplets (SLD) remains a critical hazard to flight safety, yet direct in situ observations over China are scarce. This study presents the cloud microphysical characteristics observed during two flight missions of the Aircraft Icing Research Flight Experiment (AIRFEx) conducted in March 2025 over eastern Sichuan Province, southwestern China. A Cloud, Aerosol and Precipitation Spectrometer (CAPS), a Nevzorov total water content probe, and an icing detector were deployed to obtain particle size distributions from 0.6–1550 μm, liquid and ice water contents. The 17 March case featured a mixed-phase, ice-dominated cloud with enhanced large irregular particles near an elevated inversion, suggesting active secondary ice production. In contrast, the 29 March case exhibited a liquid-dominated cloud with persistent supercooled droplets and episodic SLD, accompanied by pronounced ice accretion on the airframe. Icing periods Among icing environmente extracted to compare microphysical conditions between icing and non-icing periods at subfreezing temperatures and to evaluate consistency with the FAR Part 25 Appendix O freezing-drizzle envelopes. Icing periods were characterized by systematically higher liquid water content and slightly larger droplet sizes than non-icing periods, while most observed conditions fell within the Appendix O envelopes, with one out-of-envelope event indicating locally enhanced severity. These first in situ observations of SLD-related icing over southwestern China provide a process-based reference for validating icing hazard assessments and support future development of region-specific SLD climatologies and icing certification criteria.

How to cite: shi, Y.: Aircraft In Situ Observations of Cloud Microphysics During Icing Events over Southwestern China in Spring 2025, EGU General Assembly 2026, Vienna, Austria, 3–8 May 2026, EGU26-8528, https://doi.org/10.5194/egusphere-egu26-8528, 2026.

EGU26-9021 | ECS | Orals | AS1.10

The implications of unresolved cloud phase heterogeneities on precipitation formation 

Nadja Omanovic, Christopher Fuchs, Jan Henneberger, Huiying Zhang, and Ulrike Lohmann

Mixed-phase clouds, consisting of both liquid and ice phases, are crucial for precipitation formation over continents. The presence of the ice phase acts as a catalyst for forming precipitable particles through depositional growth, aggregation, and riming. The efficiency of these growth processes is strongly governed by the spatial distribution of the liquid and ice phases and the interfaces between them. A homogeneous mixture of liquid and ice particles maximizes the growth of the ice particles, and with that expedites precipitation formation. In contrast, a strong separation into a liquid and ice clusters may limit the growth by reducing phase interactions. Observations indicate that these heterogeneous clusters exist down to a spatial extent of 100 m [1] potentially creating a limiting factor for the efficiency of a mixed-phase cloud to precipitate.

Here, we show that these cloud phase heterogeneities even exist down to the meter-scale based on in-situ observations. A total of 19 glaciogenic seeding experiments conducted in supercooled low-stratus clouds in Switzerland within the CLOUDLAB project [2], were sampled with an in-house developed holographic imager, capable of distinguishing cloud droplets from ice crystals. Applying thresholds to separate liquid, mixed, and ice clusters, we demonstrate the highly variable nature of mixed-phase cloud phase structures. We furthermore contextualize these findings with high-resolution model simulations with the weather model ICON [3] at 50 m and 250 m. These simulations highlight the importance of resolving cloud phase heterogeneities for efficiently forming precipitation. By combining novel cloud in situ observations with high-resolution modeling, this study emphasizes the need to capture the heterogeneity in mixed-phase clouds and its importance for numerical weather models.


[1] A. Korolev and J. Milbrandt, “How are mixed-phase clouds mixed?,” Geophysical Research Letters, 49, e2022GL099578, DOI: 10.1029/2022GL099578

[2] J. Henneberger, F. Ramelli, R. Spirig, N. Omanovic, A. J. Miller, C. Fuchs, H. Zhang, J. Bühl, M. Hervo, Z. A. Kanji, K. Ohneiser, M. Radenz, M. Rösch, P. Seifert, and U. Lohmann, “Seeding of Supercooled Low Stratus Clouds with a UAV to Study Microphysical Ice Processes: An Introduction to the CLOUDLAB Project,” Bulletin of the American Meteorological Society, vol. 104, no. 11, E1962–E1979, 2023, ISSN: 0003-0007, 1520-0477. DOI: 10.1175/BAMS-D-22-0178.1

[3] G. Zängl, D. Reinert, P. Ripodas, and M. Baldauf, “The ICON (ICOsahedral Non-hydrostatic) modelling framework of DWD and MPI-M: Description of the non-hydrostatic dynamical core,” Quarterly Journal of the Royal Meteorological Society, vol. 141, no. 687, pp. 563–579, 2015, ISSN: 1477-870X. DOI: 10.1002/qj.2378

How to cite: Omanovic, N., Fuchs, C., Henneberger, J., Zhang, H., and Lohmann, U.: The implications of unresolved cloud phase heterogeneities on precipitation formation, EGU General Assembly 2026, Vienna, Austria, 3–8 May 2026, EGU26-9021, https://doi.org/10.5194/egusphere-egu26-9021, 2026.

EGU26-9572 | ECS | Posters on site | AS1.10

Homogeneous nucleation on Mars. An unexpected process that deciphers mysterious elongated clouds 

Jorge Hernandez Bernal, Anni Määttänen, Aymeric Spiga, and François Forget

Homogeneous nucleation is generally not considered a possibility in cloud formation processes in the atmosphere of Mars (Määttänen et al. 2005; Clancy et al., 2017), or Earth (Pruppacher & Klett, 1996), as it requires high levels of supersaturation that are considered unlikely to occur under real atmospheric conditions, in which heterogeneous nucleation on widespread aerosols depletes water in excess of saturation.

The Arsia Mons Elongated Cloud (AMEC) is an eye-catching and mysterious cloud occurring recurrently every morning during the dusty season over the Arsia Mons volcano on Mars (Hernández-Bernal et al., 2021). It shows a peculiar elongated shape that in only 3 hours expands up to 1800 km from its origin point. Hernández-Bernal et al. (2022) investigated this cloud based on the LMD Mars Mesoscale model (Spiga and Forget, 2009). The tail of the cloud was not reproduced in the model, but a cold pocket with temperatures down to 30K below the environment and supersaturation up to 105 appeared next to Arsia Mons, in a position, altitude, and local time and season coincident with the origin point of the AMEC in observations.

In this work we show that these are conditions conductive to homogeneous nucleation, and when we introduce this process as a new cloud formation process in the LMD Mars Mesoscale model, we obtain a good representation of the AMEC, and its long tail. This provides an excellent explanation for this mysterious cloud and shows that homogeneous nucleation is possible and can have significant effects in the atmosphere of Mars. We intend to explore these and other clouds on Mars and Earth possibly involving homogeneous nucleation.


References:

  • Clancy, R., Montmessin, F., Benson, J., Daerden, F., Colaprete, A., & Wolff, M. (2017). Mars Clouds. In R. Haberle, R. Clancy, F. Forget, M. Smith, & R. Zurek (Eds.), The Atmosphere and Climate of Mars (Cambridge planetary science (pp. 76–105). Cambridge: Cambridge University Press. https://doi.org/10.1017/9781139060172.005 
  • Määttänen, A., Vehkamäki, H., Lauri, A., Merikallio, S., Kauhanen, J., Savijärvi, H., & Kulmala, M. (2005). Nucleation studies in the Martian atmosphere. Journal of Geophysical Research: Planets, 110(E2). https://doi.org/10.1029/2004JE002308 
  • Hernández‐Bernal, J., Sánchez‐Lavega, A., del Río‐Gaztelurrutia, T., Ravanis, E., Cardesín‐Moinelo, A., Connour, K., ... & Hauber, E. (2021). An extremely elongated cloud over Arsia Mons volcano on Mars: I. Life cycle. Journal of Geophysical Research: Planets, 126(3), e2020JE006517. https://doi.org/10.1029/2020JE006517 
  • Hernández‐Bernal, J., Spiga, A., Sánchez‐Lavega, A., del Río‐Gaztelurrutia, T., Forget, F., & Millour, E. (2022). An extremely elongated cloud over Arsia Mons volcano on Mars: 2. Mesoscale modeling. Journal of Geophysical Research: Planets, 127(10), e2022JE007352. https://doi.org/10.1029/2022JE007352 
  • Pruppacher, H. R., Klett, J. D., & Wang, P. K. (1996). Microphysics of clouds and precipitation. Springer Science. https://doi.org/10.1007/978-0-306-48100-0 
  • Spiga, A., & Forget, F. (2009). A new model to simulate the Martian mesoscale and microscale atmospheric circulation: Validation and first results. Journal of Geophysical Research: Planets, 114(E2). https://doi.org/10.1029/2008JE003242 

How to cite: Hernandez Bernal, J., Määttänen, A., Spiga, A., and Forget, F.: Homogeneous nucleation on Mars. An unexpected process that deciphers mysterious elongated clouds, EGU General Assembly 2026, Vienna, Austria, 3–8 May 2026, EGU26-9572, https://doi.org/10.5194/egusphere-egu26-9572, 2026.

EGU26-9659 | Orals | AS1.10

Quantification of the radiative forcing of contrails embedded in cirrus clouds 

Torsten Seelig, Kevin Wolf, Nicolas Bellouin, and Matthias Tesche

Aviation leads to the emission of CO2 but also exerts non-CO2 effects on climate (Lee et al., 2021). The latter include line-shaped condensation trails (contrails) and contrail cirrus that are known to cause warming. However, contrails can also form in already existing cirrus clouds. So far, such embedded contrails have received little attention and their climate impact is unknown. Here, we combine aircraft position data with height-resolved cloud observations from spaceborne lidar to obtain about 40,000 cases, in which aircraft are confirmed to have passed through cirrus less than 30 min before the observation. The data set is used to contrast the properties of perturbed from unperturbed cloud regions, and to infer the local net radiative forcing (RF) of embedded contrails. We find that cirrus with embedded contrails has an overwhelmingly warming effect (83% of cases) even though the majority (62%) of cases occurs during daytime when the addition of a contrail could potentially lead to cooling. The annual mean local net RF of individual embedded contrails ranges between -320 mW m−2 (2020, COVID lockdown) and 160 mW m−2. Considering the period from 2015 to 2021, we find an annual mean local warming effect of 60 mW m−2. Expanding these findings to the global scale suggests an annual global mean net RF of embedded contrails on the order of 5 mW m−2. This corresponds to around 10% of the current estimate of the climate impact of line-shaped contrails and, together with recent findings that conditions for contrail formation are found most often in already-existing cirrus (Petzold et al, 2025), suggests that embedded contrails are a non-negligible contributor to aviation’s impact on climate.

References:

Lee, D. S. et al. The contribution of global aviation to anthropogenic climate forcing from 2000 to 2018. Atmos. Environ. 244, 117834 (2021), https://doi.org/10.1016/j.atmosenv.2020.117834

Petzold, A. et al. Most long-lived contrails form within cirrus clouds with uncertain climate impact. Nat. Commun. 16, 9695 (2025), https://doi.org/10.1038/s41467-025-65532-2

How to cite: Seelig, T., Wolf, K., Bellouin, N., and Tesche, M.: Quantification of the radiative forcing of contrails embedded in cirrus clouds, EGU General Assembly 2026, Vienna, Austria, 3–8 May 2026, EGU26-9659, https://doi.org/10.5194/egusphere-egu26-9659, 2026.

EGU26-10437 | ECS | Orals | AS1.10

What can satellites tell us about cloud glaciation? A time-resolved view. 

Dragomir Nikolov, Ryan Vella, Ulrike Lohmann, and Diego Villanueva

Below 0 °C, cloud droplets can freeze, altering a cloud’s optical and radiative properties and thereby affecting Earth’s energy balance. The microphysical mechanisms that govern this process, known as glaciation, are expected to act on minute timescales. Nevertheless, stratiform clouds can persist in the mixed-phase temperature range (0 °C to -38 °C) for hours, thus glaciation events remain poorly characterised.

We analysed satellite observations of individual cloud tops to track their temporal phase evolution and to quantify the extent of glaciation. We find that most glaciation events do not result in complete freezing. Rather, they induce a sustained shift in cloud properties while the clouds remain in the mixed‐phase regime. While the precise glaciation initiation mechanism remains unknown, higher hemispheric and seasonal ice-nucleating particle concentrations are shown to correlate with glaciation occurrence rate.

A cloud that retains supercooled liquid water after glaciation will have higher shortwave reflectance than a fully glaciated cloud. Inaccurate representations of glaciation can therefore bias radiative fluxes and, ultimately, climate projections. We are currently using our dataset to evaluate how accurately ICON represents mixed-phased cloud evolution. Simulations with progressively higher resolution are expected to yield higher phase heterogeneity in the cloud tops, thereby improving the representation of glaciation. This should help provide insights into the physical mechanisms that limit the extent of glaciation.

How to cite: Nikolov, D., Vella, R., Lohmann, U., and Villanueva, D.: What can satellites tell us about cloud glaciation? A time-resolved view., EGU General Assembly 2026, Vienna, Austria, 3–8 May 2026, EGU26-10437, https://doi.org/10.5194/egusphere-egu26-10437, 2026.

EGU26-10924 | ECS | Posters on site | AS1.10

Sensitivity of Regional Cold-Air Outbreak Simulations to Ice-Nucleating Particle Concentrations  

Samantha Clarke, Xinyi Huang, Erin Raif, Mark Tarn, David Ashmore, Ken Carslaw, Paul Field, and Benjamin Murray

Cloud phase feedbacks remain a major source of uncertainty in climate projections, with shallow mixed phase clouds at mid- and high-latitudes contributing substantially to this uncertainty. Poor understanding of the microphysical processes governing these clouds, particularly their ice content, and limitations in model representations of ice formation, including the frequent neglect of ice nucleating particles (INPs), are key drivers of this problem.  

 In this presentation we show an extensive model analysis of many aircraft flight days during the M-Phase and ACAO projects. The two projects addressed key uncertainties related to mixed-phase clouds through extensive observations of present-day shallow mixed-phase cloud environments collected during two aircraft campaigns, one over the Labrador Sea and one over the Norwegian-Barents Sea. These campaigns sampled cold air outbreak (CAO) clouds in environments characterised by differing sea surface temperatures and INP concentrations (Clarke et al., submitted to GDJ). 

 High resolution (1.5 km) regional simulations are performed for each case using the UK Met Office Unified Model, enabling explicit representation of convection and aerosol cloud interactions over approximately 1000 km domains with 36 hour forecasts. Model output is evaluated against aircraft and satellite observations to assess how well CAO cloud properties are represented. To investigate the role of primary ice production, model INP concentrations are varied, including using an average representation of the INP observed for each flight campaign. 

 The CAO cloud properties show a clear sensitivity to the prescribed INP concentrations, with consistent responses in liquid and ice water path, albedo and cloud fraction across most cases. The magnitude of this sensitivity is larger in colder Norwegian-Barents Sea CAO cases than in the warmer Labrador Sea cases. INP variability explains a larger proportion of liquid water path bias variability in Norwegian-Barents Sea CAOs than in the Labrador Sea cases, suggesting that other processes dominate liquid water path variability in the latter. The warmer Labrador Sea environment indicates a potentially greater role for secondary ice production mechanisms. Variations in the slope of the INP temperature relationship, particularly at colder temperatures, strongly influence ice production in the colder Norwegian-Barents Sea cases. 

 INP parameterisations that are more representative of observed conditions generally reduce the model biases compared to satellite data, although INP sensitivity alone does not account for the full range of biases, which also vary substantially from day to day due to environmental and large-scale meteorological factors along with inherent biases in satellite observations. 

 These results demonstrate that including more-realistic INP concentrations in simulations can improve the representation of cloud properties within CAOs, offering a potential pathway to reducing cloud phase related uncertainty in climate projections. 


How to cite: Clarke, S., Huang, X., Raif, E., Tarn, M., Ashmore, D., Carslaw, K., Field, P., and Murray, B.: Sensitivity of Regional Cold-Air Outbreak Simulations to Ice-Nucleating Particle Concentrations , EGU General Assembly 2026, Vienna, Austria, 3–8 May 2026, EGU26-10924, https://doi.org/10.5194/egusphere-egu26-10924, 2026.

Cloud phase is often described as a function of temperature, yet whether a single phase–temperature relationship applies across cloud vertical structure and seasons remains poorly constrained by observations. Using 15 years (2008–2022) of CALIPSO lidar observations, we investigate the partitioning of ice and liquid cloud phase as a function of temperature throughout the cloud column. Cloud phase and temperature are collocated at CALIOP’s native vertical resolution, allowing us to distinguish cloud-top and cloud-bulk phase characteristics.

We show that cloud phase–temperature relationships differ systematically between cloud tops and cloud interiors, and that these differences are strongly modulated by season and latitude. At low temperatures (below −10 °C), cloud interiors generally exhibit lower liquid fractions than cloud tops, whereas vertical phase differences become small at warmer temperatures. For a given temperature, extratropical clouds in the Northern Hemisphere generally contain more ice than those in the Southern Hemisphere. Seasonal modulation is most pronounced at high latitudes, where clouds during local winter exhibit higher liquid fractions than summer clouds at the same temperature. In contrast, seasonal variations in cloud phase partitioning are relatively weak in the tropics.

Vertical phase differences also depend on cloud geometric depth. Shallow clouds tend to be vertically homogeneous in phase, while clouds of intermediate depth exhibit more pronounced vertical phase contrasts, particularly at high latitudes and for colder cloud-top temperatures. These results demonstrate that cloud phase–temperature relationships are not universal, but depend on cloud vertical structure, season, and latitude, with implications for satellite-based cloud phase climatologies and the representation of mixed-phase clouds in climate models.

How to cite: Che, H. and Storelvmo, T.: Seasonal and vertical controls on cloud phase partitioning from long-term CALIPSO observations, EGU General Assembly 2026, Vienna, Austria, 3–8 May 2026, EGU26-11104, https://doi.org/10.5194/egusphere-egu26-11104, 2026.

EGU26-11443 | Posters on site | AS1.10

Towards consistent coupling of cirrus cloud scheme with gravity wave parameterization in coarse resolution models 

Stamen Dolaptchiev, Alena Kosareva, Peter Spichtinger, and Ulrich Achatz

Gravity waves (GWs) have significant effect on TTL cirrus clouds by influencing their formation and life-cycle. However, modelling such clouds in coarse resolution atmospheric models still remains a challenge since large part of the GW spectrum is not resolved and has to be parameterized. By utilizing idealized simulations of cirrus cloud formation driven by either resolved or parameterized GW dynamics, we investigate the ability of a two-moment ice scheme coupled with a GW parameterization to simulate cirrus properties. The results show that transient GW parameterizations based on ray-tracing techniques are capable of reproducing cloud structure, provided that additional phase information is incorporated in the parameterization. In coarse resolution models the statistical properties of the individual clouds populating a grid box often are represented by assuming some shape of the probability density function (PDF) for the subgrid-scale fluctuations in saturation ratio or ice water content. We estimate the parameters of the PDFs from the wave-resolving simulations and relate those to parameters from the GW parameterization. Applications of the present approach in the global ICON model are discussed. 

How to cite: Dolaptchiev, S., Kosareva, A., Spichtinger, P., and Achatz, U.: Towards consistent coupling of cirrus cloud scheme with gravity wave parameterization in coarse resolution models, EGU General Assembly 2026, Vienna, Austria, 3–8 May 2026, EGU26-11443, https://doi.org/10.5194/egusphere-egu26-11443, 2026.

EGU26-11520 | Posters on site | AS1.10

Ice nucleation active potassium salt from biomass-burning smoke 

André Welti, Ana Alvarez Piedehierro, and Ari Laaksonen

The highest concentrations of ice nucleating particles (INPs) in biomass-burning smoke are observed during intense, flaming fires (Schaefer, 1952; Prenni, 2012). While evidence that INPs can be generated by the combustion process itself is sparse, their presence is commonly attributed to lofting of dust and soil from the ground by strong fire induced convection. Potassium containing particles are abundant in smoke plumes and serve as a marker for biomass burning. Inorganic potassium compounds include KCl, KNO3, and K2SO4.  Fresh smoke from flaming fires contains crystalline KCl, which is converted to KNO3 and K2SO4 through reactions with HNO3 and H2SO4 during plume aging (Freney, 2009).

We present ice nucleation experiments on monodisperse potassium salt particles conducted using a modified version of the SPectrometer for Ice Nucleation (SPIN) chamber (Welti, 2020), in which the test particles are exposed to temperatures down to 208 K and well-defined humidity. Ice nucleation occurred at temperatures below 235 K, relevant for cirrus cloud formation. While KCl particles deliquesce at approx. 85% relative humidity and their solution droplets freeze homogeneously, the experiments demonstrate that crystalline K2SO4 can serve as INP below its deliquescence point. The absence of ice formation at higher temperatures suggests ice nucleation proceeds via homogeneous freezing within a thin layer of adsorbed water on the salt particle surface.

However, atmospheric observations show that most biomass-burning aerosol occur as mixed particles, with the potassium salt either coated by organics or attached to an organic particle (Freney, 2009). In mixed particles, ice formation could be inhibited by the uptake of water into the organic material, preventing the formation of a surface water layer. Together, these findings indicate that the ice nucleation potential of pyrogenic potassium compounds should be represented in atmospheric models in conjunction with their emission, chemical aging, and mixing state to improve the simulation of biomass-burning INPs.

This work was supported by the Academy of Finland, project MEDICEN (grant no. 345125), and the ACCC Flagship programme (grant no. 337552).

References:

Freney, E. J., et al.: Deliquescence and efflorescence of potassium salts relevant to biomass-burning aerosol particles, Aerosol Sci. Technol., 43, 799–807, 2009.

Prenni, A. J., et al.: Biomass burning as a potential source for atmospheric ice nuclei: Western wildfires and prescribed burns, Geophys. Res. Lett., 39, L11805, 2012.

Schaefer, V. J.: Relation of ice nuclei to forest fire smoke, Occasional Report, Project Cirrus, 35, 7–11, 1952.

Welti, A., et al.: SPIN modification for low-temperature experiments, Atmos. Meas. Tech., 13, 7059–7067, 2020.

How to cite: Welti, A., Alvarez Piedehierro, A., and Laaksonen, A.: Ice nucleation active potassium salt from biomass-burning smoke, EGU General Assembly 2026, Vienna, Austria, 3–8 May 2026, EGU26-11520, https://doi.org/10.5194/egusphere-egu26-11520, 2026.

We revised and simplified the microphysics of mixed-phase clouds in CESM2, assuming sedimentation and immersion freezing by mineral dust as the only sources of ice crystals. We find that these assumptions produce variability in cloud-top phase that agrees with long-term global satellite observations (Villanueva et al., 2025; Toll et al., 2024, Science). These simulations confirm that the interannual variability of cloud phase is controlled by dust loading.

Furthermore, by probing instantaneous cloud states daily over a 10-year simulation, we propose a simplified theoretical framework that maps the log-normal variability of ice-forming processes onto the observed variability of cloud-top phase. For cold mixed-phase clouds (cloud-top temperatures below −21 °C), we find the cloud climatology is dominated by a reduced set of processes:
        1.        Aerosol-driven droplet freezing,
        2.        Ice depositional growth (WBF),
        3.        Droplet–snow riming in thick clouds, and
        4.        Cloud-top radiative cooling in thin clouds.

As a result, ice-nucleating particles (INPs) can impose a logarithmic control on cloud mass. At sufficiently high INP concentrations, this control becomes reversible (the WBF process is skipped), leading to a log-parabolic cloud response.

How to cite: Villanueva, D.: A log-parabolic sensitivity of mixed-phase clouds to ice-nucleating aerosols, EGU General Assembly 2026, Vienna, Austria, 3–8 May 2026, EGU26-12224, https://doi.org/10.5194/egusphere-egu26-12224, 2026.

EGU26-12284 | Orals | AS1.10

On the convective origin of tropical upper-tropospheric cirrus using 17 years of CALIOP observations and Lagrangian trajectories 

Aurélien Podglajen, Erik Johansson, Ajil Kottayil, and Legras Bernard

Tropical cirrus clouds are commonly divided into those detrained from convection and those formed in situ. However, the relative contribution of these two categories to tropical high-cloud cover—particularly for thin cirrus in the tropical tropopause layer (TTL)—remains poorly constrained. Here, we take advantage of the 17-year CALIOP spaceborne lidar record to revisit the convective origin of tropical cirrus.


We perform systematic diabatic backward Lagrangian calculations starting from CALIOP curtain observations of both cloudy and clear-sky air, using ERA5 reanalysis winds and heating rates. Air parcels are followed for up to three months or until they intersect a convective cloud, defined when parcel temperature drops below the local brightness temperature inferred from geostationary satellite observations. Using a convective-origin criterion based on the evolution of relative humidity along trajectories, we classify cirrus into convective and in situ categories and characterize their climatology across the tropical band. We further investigate their space-time variability, as well as the geographic origin and transport lifetime of convective cirrus.

How to cite: Podglajen, A., Johansson, E., Kottayil, A., and Bernard, L.: On the convective origin of tropical upper-tropospheric cirrus using 17 years of CALIOP observations and Lagrangian trajectories, EGU General Assembly 2026, Vienna, Austria, 3–8 May 2026, EGU26-12284, https://doi.org/10.5194/egusphere-egu26-12284, 2026.

EGU26-12426 | ECS | Posters on site | AS1.10

The spatial heterogeneity and inhomogeneity of cirrus microphysical properties evaluated globally using in situ measurements 

John Dalessandro, Odran Sourdeval, and Martina Krämer

Cirrus clouds having a high degree of spatially heterogeneous/inhomogeneous cloud properties have been shown to correspond with increased wave activity (e.g., Podglajen et al., 2018) and increased uncertainty in remote sensing retrievals (Fauchez et al., 2015, 2018); and incorporating cirrus cloud spatial heterogeneity/inhomogeneity into climate models has been shown to improve simulated output (e.g., Gu and Liou, 2006). These findings highlight the importance of evaluating spatial heterogeneity/inhomogeneity globally, which may provide information of common evolutionary pathways of cirrus clouds. However, relatively few studies have evaluated the spatial heterogeneity and inhomogeneity (often used interchangeably) of cirrus properties, which have primarily been case studies derived from relatively small datasets. Further, such studies often evaluate macro-scale properties such as optical thickness or cloud fraction rather than leveraging high resolution, airborne in situ measurements. 


We evaluate the spatial heterogeneity and inhomogeneity of cirrus bulk microphysical properties using ~65 hours of in situ measurements from eight field campaigns taking place in different regions globally. The spatial heterogeneity of ice concentration (ice water content) increases with decreasing ice concentration (ice water content), revealing more tenuous cirrus are more spatially heterogenous. This is suspected to be due to a greater competition amongst ice crystals for available water vapor within thin, in-situ formed cirrus (i.e., cirrus formed directly at temperatures below ~-38°C) compared with thicker, liquid-origin cirrus (i.e., cirrus formed via freezing of rising liquid or mixed phase clouds) which have an abundant amount of available water vapor. This is also a positive finding, since previous modeling work has shown that retrieval uncertainties associated with cirrus heterogeneity are greatest for optically thick cirrus (Fauchez et al., 2015).


Cirrus clouds often contain sets of ice concentration samples whose distributions are heavily skewed. These “heavily skewed” (i.e., more inhomogeneous) clouds also tend to possess higher spatial heterogeneity than “weakly/non-skewed” (i.e., less inhomogeneous) clouds. This skewness results from the absence of small ice crystals (diameter<~50 µm) within localized regions of the cirrus clouds. Clouds having heavily skewed distributions are observed ~20%–40% of the time in each flight campaign, suggesting the ubiquity of temperature perturbations preferentially removing small ice and/or the kelvin effect within cirrus clouds globally. 


Bibliography:

Fauchez, T., Dubuisson, P., Cornet, C., Szczap, F., Garnier, A., Pelon, J., and Meyer, K.: Impacts of cloud heterogeneities on cirrus optical properties retrieved from space-based thermal infrared radiometry, Atmospheric Measurement Techniques, 8, 633–647, https://doi.org/10.5194/amt-8-633-2015, 2015.
Fauchez, T., Platnick, S., Sourdeval, O., Wang, C., Meyer, K., Cornet, C., and Szczap, F.: Cirrus Horizontal Heterogeneity and 3-D Radiative Effects on Cloud Optical Property Retrievals From MODIS Near to Thermal Infrared Channels as a Function of Spatial Resolution, Journal of Geophysical Research: Atmospheres, 123, 11,141-11,153, https://doi.org/10.1029/2018JD028726, 2018.
Gu, Y. and Liou, K. N.: Cirrus cloud horizontal and vertical inhomogeneity effects in a GCM, Meteorol. Atmos. Phys., 91, 223–235, https://doi.org/10.1007/s00703-004-0099-2, 2006.
Podglajen, A., Plougonven, R., Hertzog, A., and Jensen, E.: Impact of gravity waves on the motion and distribution of atmospheric ice particles, Atmospheric Chemistry and Physics, 18, 10799–10823, https://doi.org/10.5194/acp-18-10799-2018, 2018

How to cite: Dalessandro, J., Sourdeval, O., and Krämer, M.: The spatial heterogeneity and inhomogeneity of cirrus microphysical properties evaluated globally using in situ measurements, EGU General Assembly 2026, Vienna, Austria, 3–8 May 2026, EGU26-12426, https://doi.org/10.5194/egusphere-egu26-12426, 2026.

EGU26-12534 | ECS | Posters on site | AS1.10

Towards New Measurements of Ice-Nucleating Particles in Cirrus Conditions 

Nina L. H. Kinney, Alexandre Baron, Benjamin J. Murray, Joshua P. Schwarz, and Thomas F. Whale

Measuring the ice-nucleating particles (INPs) that populate the upper troposphere is critical to understanding the climate impact of cirrus clouds. INPs facilitate in-situ cirrus formation and influence the size and number of ice crystals composing these clouds, as heterogeneous nucleation outcompetes homogeneous nucleation at lower supersaturation with respect to ice. The significant logistical challenges and costs associated with upper troposphere measurements render observational data for this region especially scarce. Analysis of cirrus ice crystal residues by Cziczo et al. (2013) point to heterogeneous nucleation by inorganic INPs as their dominant formation mechanism. Despite their postulated importance, very little is known about the nature and global distribution of INPs in the upper troposphere. Developing capability for routine analysis of upper troposphere INPs is therefore crucial for reducing cirrus-driven uncertainties in climate projections. Here we present our plans and progress towards a new lab-based instrument for offline analysis of INPs in cirrus cloud conditions, aimed at improving understanding of the drivers of heterogeneous ice nucleation in the upper troposphere. This custom-built isothermal diffusion chamber, based on the FRIDGE chamber design (Bundke et al., 2008; Schrod et al., 2016), is adapted to allow cirrus conditions to be accessed. Visual detection of ice growth on a substrate in the chamber will enable quantification of INPs retrieved from the upper troposphere via a balloon-borne collector. The electrostatic precipitator (ESP) for INP collection will be deployed alongside the In-situ Balloon-borne Ice Spectrometer (IBIS) which will measure cirrus ice crystal size distributions during balloon flight. Quantification and subsequent analyses of INPs made possible by the isothermal diffusion chamber development will provide new insights into the formation and evolution of cirrus clouds and their climate impacts.


References

Bundke, U., Nillius, B., Jaenicke, R., Wetter, T., Klein, H., and Bingemer, H.: The fast Ice Nucleus chamber FINCH, Atmospheric Research, 90, 180-186, 10.1016/j.atmosres.2008.02.008, 2008.

Cziczo, D. J., Froyd, K. D., Hoose, C., Jensen, E. J., Diao, M. H., Zondlo, M. A., Smith, J. B., Twohy, C. H., and Murphy, D. M.: Clarifying the Dominant Sources and Mechanisms of Cirrus Cloud Formation, Science, 340, 1320-1324, 10.1126/science.1234145, 2013.

Schrod, J., Danielczok, A., Weber, D., Ebert, M., Thomson, E. S., and Bingemer, H. G.: Re-evaluating the Frankfurt isothermal static diffusion chamber for ice nucleation, Atmospheric Measurement Techniques, 9, 1313-1324, 10.5194/amt-9-1313-2016, 2016.

How to cite: Kinney, N. L. H., Baron, A., Murray, B. J., Schwarz, J. P., and Whale, T. F.: Towards New Measurements of Ice-Nucleating Particles in Cirrus Conditions, EGU General Assembly 2026, Vienna, Austria, 3–8 May 2026, EGU26-12534, https://doi.org/10.5194/egusphere-egu26-12534, 2026.

EGU26-12544 | ECS | Orals | AS1.10

Cirrus cloud origin classification for seven years of IAGOS flights including a new origin category 

Neelam Firdous Khan, Andreas Petzold, Susanne Rohs, Irene Bartolome Garcia, Susanne Crewell, and Martina Kraemer

Cirrus clouds exhibit varying radiative impacts depending on their origin of formation. For example, in situ origin cirrus clouds tend to have a warming effect, whereas liquid-origin cirrus clouds exhibit a rather cooling effect, though with large uncertainty. Understanding the global distribution of cirrus clouds, particularly with respect to their origin types is therefore essential for accurately assessing their radiative impacts. Consequently, analyzing their vertical and seasonal distributions is of key importance.

In this study, we use the refined cirrus origin index from the large-scale, Lagrangian model for the microphysical properties of cirrus clouds  (CLaMS-Ice: Krämer et al., 2026; Gasparini et al., 2025), which extends the existing classification of in-situ and liquid origin cirrus by introducing a third origin type termed dual-origin cirrus. Dual-origin cirrus are initially of liquid origin,  in which later in-situ ice nucleation occurs. They therefore bear the signature of both pure cirrus types. So far, this type is assigned to the liquid-origin cirrus. CLaMS-Ice was applied to seven years of passenger aircraft flight data from the European research infrastructure IAGOS.  The relative variability of the three types of cirrus cloud is then investigated along the IAGOS flight routes using the new origin index of CLaMS-Ice.

The variability of the cirrus types is examined with respect to 30 hPa layers around and below the tropopause in the northern mid-latitudinal regions of North America, the North Atlantic, and Western Europe, including a seasonal analysis. The total frequency of cirrus clouds is found to be highest over the North Atlantic, with a high fractional density across the upper troposphere, particularly in layers closest to the tropopause. In situ origin cirrus clouds show the highest fractional occurrence near the tropopause across all seasons and represent the dominant category among all cirrus types, with their fraction gradually decreasing at higher pressure levels (lower altitudes). In addition to the two cirrus categories of in-situ and liquid origin, a substantial fraction of the data falls into the dual-origin category. The fraction of dual-origin cirrus clouds is observed to be higher than that of liquid-origin cirrus clouds.  Our analysis reveals a significant contribution from this dual-origin cirrus class, highlighting the importance of distinguishing it when assessing cirrus cloud variability and their associated radiative impacts.


Gasparini, B., Atlas, R., Voigt, A., Krämer, M., and Blossey, P. N.: Tropical cirrus evolution in a kilometer-scale model with improved ice microphysics, Atmos. Chem. Phys., 25, 9957–9979, https://doi.org/10.5194/acp-25-9957-2025, 2025.

Krämer, M, J.-U. Grooß, P. Spichtinger, I. Bartolomé Garçia, and C. Rolf:  Large-scale Lagrangian 3D cirrus modeling with ClaMS-Ice; in preparation for ACP.

How to cite: Khan, N. F., Petzold, A., Rohs, S., Garcia, I. B., Crewell, S., and Kraemer, M.: Cirrus cloud origin classification for seven years of IAGOS flights including a new origin category, EGU General Assembly 2026, Vienna, Austria, 3–8 May 2026, EGU26-12544, https://doi.org/10.5194/egusphere-egu26-12544, 2026.

EGU26-12598 | Posters on site | AS1.10

A modification of the Smith cloud scheme to allow supersaturation with respect to ice in the ARPEGE NWP global model 

pierre crispel, sara arriolabengoa, yves bouteloup, and matthieu plu

This work presents a modification of the Smith (1990) cloud scheme used in the ARPEGE (Action de Recherche Petite Echelle Grande Echelle) NWP global model in order to improve the forecast of relative humidity with respect to ice, with particular attention paid to supersaturation, a necessary condition for the persistence of aviation contrails. The modeling extends the Smith cloud scheme used in the operational ARPEGE by reworking the statistical concepts of Sommeria and Deardorff (1977) while including a temperature-based parametrization for the representation of homogenous nucleation. A notable point is that this modification can be implemented without major changes and does not require additional computational effort. Furthermore, it allows for extensions to other atmospheric models using a similar framework. The new forecasts are verified using in situ humidity observations made by IAGOS program aircraft and compared to ARPEGE operational forecasts, resulting in a better description of supersaturated regions. Further impacts on other general parameters (wind, temperature) are also presented in this study.

How to cite: crispel, P., arriolabengoa, S., bouteloup, Y., and plu, M.: A modification of the Smith cloud scheme to allow supersaturation with respect to ice in the ARPEGE NWP global model, EGU General Assembly 2026, Vienna, Austria, 3–8 May 2026, EGU26-12598, https://doi.org/10.5194/egusphere-egu26-12598, 2026.

EGU26-13333 | ECS | Orals | AS1.10

Linking Arctic ice cloud properties to atmospheric stability and vertical motion using lidar observations  

Georgios Dekoutsidis, Silke Groß, and Martin Wirth

Ice clouds play a crucial role in the Earth’s atmosphere system. They interact with both the incoming shortwave and outgoing longwave radiation and thus have a strong influence on the atmospheric radiation budget. Their net radiative effect is still not well-quantified and is highly sensitive to their macrophysical and microphysical characteristics. However, determining these properties remains a challenging task. As a consequence, ice clouds are frequently under- or misrepresented in weather and climate models, contributing substantially to uncertainties in climate research.

The Arctic climate system is undergoing rapid and complex changes, in connection to global warming. While various properties and processes are affected, most notably the Arctic troposphere is warming at an accelerated rate, compared to the global average. The term Arctic Amplification, has been introduced to describe the unique changes occurring in the Arctic. Ice clouds are expected to play an important role in Arctic Amplification, either directly by interacting with radiation or as part of new or altered feedback loops. Despite their potential significance, there is a scarcity of observations of their macro- and microphysical properties in the Arctic and a missing link between hose crucial properties and the ambient dynamical conditions.

The Arctic Study of Cloud, Circulation and Climate (ASCCI) campaign took place in the Arctic during the Spring of 2025. For this campaign the German research aircraft HALO was used. With its high flight ceiling and long range, HALO is perfectly suited for the study of remote ice clouds in the Arctic. On-board HALO was, among others, the WALES (Water Vapour Lidar Experiment in Space) lidar system. WALES is an airborne water vapor differential absorption (DIAL) and high spectral resolution (HSRL) lidar system. It provides 2D vertically resolved measurements along the flight track, of water vapor concentration, aerosol backscatter and linear depolarization ratio, as well as the two-way atmospheric transmission. These capabilities allow for a detailed characterization of ice clouds including their vertical structure.

In this study we use observations from WALES during ASCCI. In the generated dataset, first we identify and extract the ice clouds and then derive properties, including the Relative Humidity over ice (RHi) and optical depth. In addition, we use reanalysis data from ERA5, and more precisely the large-scale vertical velocity and static stability in order to characterize the dynamical environment in which the ice clouds were detected. The ice clouds are then grouped according to these environmental regimes, allowing us to investigate how their macro-, microphysical and optical properties vary with large-scale ascent or subsidence and atmospheric stability. Our aim is to improve our understanding of Arctic ice cloud characteristics and their sensitivity to state of the atmosphere. The results provide observational constraints important for the representation of ice clouds in weather and climate models and for reducing uncertainties regarding the role of ice clouds in the rapidly changing Arctic climate system.

How to cite: Dekoutsidis, G., Groß, S., and Wirth, M.: Linking Arctic ice cloud properties to atmospheric stability and vertical motion using lidar observations , EGU General Assembly 2026, Vienna, Austria, 3–8 May 2026, EGU26-13333, https://doi.org/10.5194/egusphere-egu26-13333, 2026.

EGU26-14711 | ECS | Posters on site | AS1.10

Spaceborne Insights into Wildfire-Induced Cirrus Cloud Formation 

Paraskevi Georgakaki, Christina-Anna Papanikolaou, Odran Sourdeval, and Johannes Quaas

The dominant ice nucleation regime, whether homogeneous or heterogeneous, governs the microphysical structure and radiative properties of cirrus clouds. While ground-based observations demonstrate that the long-range transport of wildfire smoke can effectively trigger heterogeneous nucleation in the upper troposphere and lower stratosphere, these studies remain spatially limited. A systematic, global-scale approach is required to identify the broader impacts of smoke on cirrus occurrence and properties.

In this study, we perform a closure analysis by linking potential ice-nucleating particles (INPs) with in-cloud ice crystal number concentrations (ICNC) using spaceborne remote sensing. We retrieve potential smoke INPs from the CALIOP (Cloud-Aerosol Lidar with Orthogonal Polarization) level 2 V4.51 data products and compare them with in-cloud ICNC derived from the DARDAR-Nice (liDAR–raDAR-Number concentration of ICE particles) product. By examining the consistency between these two independent datasets across a decade of observations, we can evaluate the extent to which wildfire smoke triggers heterogeneous ice nucleation across different latitudes and seasons. This research provides a global dataset offering the large-scale observational constraints necessary to bridge the gap between local process studies and the representation of smoke-cirrus interactions in global climate models.

How to cite: Georgakaki, P., Papanikolaou, C.-A., Sourdeval, O., and Quaas, J.: Spaceborne Insights into Wildfire-Induced Cirrus Cloud Formation, EGU General Assembly 2026, Vienna, Austria, 3–8 May 2026, EGU26-14711, https://doi.org/10.5194/egusphere-egu26-14711, 2026.

EGU26-14778 | ECS | Posters on site | AS1.10

Quantifying aerosol-cirrus cloud interactions using reanalyses and satellite lidar-radar observations  

Mathilde Leroux and Odran Sourdeval

Cirrus clouds play a key role in the Earth’s radiation budget due to their high-altitude location, ice-only composition, and interactions with both longwave and shortwave radiation. Their radiative impact is highly sensitive to variations in ice crystal number concentration, size, and morphology, which are controlled by ice nucleation pathways and aerosol properties. Aerosol–cloud interactions (ACIs) remain one of the largest sources of uncertainty in the climate forcing, particularly through their contribution to the effective radiative forcing (ERFaci). While progress has been made over the past decades in understanding aerosol impacts on liquid clouds using satellite observations, the impact of aerosols on ice cloud formation and evolution is still poorly understood, leading to large uncertainties in the radiative forcing associated with aerosol–ice cloud interactions.

This study provides insights into aerosol-cirrus interactions by combining cirrus properties such as ice crystal number concentration (Ni) and ice water content (IWC) retrieved from the synergistic lidar-radar (DARDAR) remote sensing technique, notably the DARDAR-Nice product, with aerosol reanalysis products from the Copernicus Atmospheric Monitoring Service (CAMS). We quantified the sensitivity of cirrus parameters to aerosol concentration and subsequently infer the associated global aerosol-ice cloud radiative forcing. A variety of cloud regimes is considered to disentangle meteorological effects from the aerosol–cirrus interaction signal, including cirrus classifications based on their formation mechanisms as well as seasonal and regional bins.

How to cite: Leroux, M. and Sourdeval, O.: Quantifying aerosol-cirrus cloud interactions using reanalyses and satellite lidar-radar observations , EGU General Assembly 2026, Vienna, Austria, 3–8 May 2026, EGU26-14778, https://doi.org/10.5194/egusphere-egu26-14778, 2026.

EGU26-15065 | ECS | Orals | AS1.10

Success and failure of contrail models: a flight-by-flight investigation using satellite observations 

Jin Maruhashi, Sajedeh Marjani, Oliver Driver, Jonathan Itcovitz, Edward Gryspeerdt, and Marc Stettler

A realistic quantification of aviation’s net global climate impact depends on how well models represent aviation-induced aerosols (e.g., soot and sulfate) and their dual role: contributing to net warming through the formation of persistent ice clouds (contrails) and contributing to cooling by altering the microphysical properties of existing liquid clouds. Here, we focus on the warming pathway. Persistent contrails are estimated to produce warming over a year comparable to the warming from aviation CO₂ accumulated over several decades [1] and may account for ~2% of the total anthropogenic surface temperature increase since pre-industrial times [2]. Given their importance, contrails must be modelled both accurately and efficiently to support operational mitigation and to track aviation’s climate impact.

The Contrail Cirrus Prediction (CoCiP) tool is a widely used Lagrangian model that predicts contrail formation and evolution on a flight-by-flight basis. CoCiP is integrated into the Non-CO₂ Aviation Effects Tracking System (NEATS), which supports compliance with recent European reporting requirements for non-CO₂ aviation effects. Despite its broad adoption, CoCiP has been shown to underestimate lifetime-integrated optical depth relative to higher-fidelity models [3], motivating further evaluation against observations.

We analyze ~500 flights from 2025 that flew through the UK and surrounding region (approximately 48°N-63°N, 20°W-4°E) that have been contrail-matched using detections from the Earth Cloud Aerosol and Radiation Explorer (EarthCARE) mission. For each flight, we run CoCiP and compare its output at the advected waypoint closest to the satellite-detected contrail at the detection time. We find that CoCiP fails to predict a contrail for roughly half of the cases. For ~20% of flights, contrail formation is not expected based on the Schmidt–Appleman criterion, which depends on both atmospheric and aircraft characteristics. In other cases, flights satisfy this criterion but occur in ice-subsaturated regions according to the ERA5 reanalysis dataset, again leading CoCiP to predict no persistent contrail. These false negatives are therefore not solely model-driven, but also reflect uncertainties in the meteorological inputs, highlighting the need to disentangle error sources to robustly diagnose and address failures in a modeling chain.

References

[1] Lee, D.S. et al.: The contribution of global aviation to anthropogenic climate forcing for 2000 to 2018, Atmospheric Environment, Volume 244, 117834, ISSN 1352-2310, 2021, https://doi.org/10.1016/j.atmosenv.2020.117834.

[2] IPCC, 2021: Summary for Policymakers. In: Climate Change 2021: The Physical Science Basis. Contribution of Working Group I to the Sixth Assessment Report of the Intergovernmental Panel on Climate Change. Cambridge University Press, Cambridge, United Kingdom and New York, NY, USA, pp. 3−32, doi:10.1017/9781009157896.001.

[3] Akhtar Martínez, C. et al.: Zero-dimensional contrail models could underpredict lifetime optical depth, Atmos. Chem. Phys., 25, 12875–12891, 2025, https://doi.org/10.5194/acp-25-12875-2025.

How to cite: Maruhashi, J., Marjani, S., Driver, O., Itcovitz, J., Gryspeerdt, E., and Stettler, M.: Success and failure of contrail models: a flight-by-flight investigation using satellite observations, EGU General Assembly 2026, Vienna, Austria, 3–8 May 2026, EGU26-15065, https://doi.org/10.5194/egusphere-egu26-15065, 2026.

EGU26-15117 | Orals | AS1.10

Ice, Ice, Maybe? A Process System Assessment of Southern Ocean Aerosol-Cloud Interactions 

Christina McCluskey, Qing Niu, Kate Thayer-Calder, Ryan Patnaude, Kanishk Gohil, Jesse Nusbaumer, Cecile Hannay, Brian Medeiros, and Gerald Mace

Clouds over the Southern Ocean are critical to accurately representing Earth’s radiative properties, yet continue to challenge Earth System Models due to complex micro-scale processes that influence regional-scale radiation. Subgrid-scale processes, including turbulence, cloud droplet activation, droplet collision-coalescence, ice nucleation, secondary ice production, and ice growth, are represented in coarse resolution models with parameterizations. It is well-documented that coupled Earth System model simulation results are highly sensitive to changes in these subgrid processes and that both structural and parameter uncertainties remain large. 

In this talk, we will discuss a process system approach for interrogating the representation of model microphysical processes in the Community Atmosphere Model version 6 (CAM6). Instrument simulators that translate model output into “observable” quantities were developed based on the sampling and measurement capabilities of the field instruments and “deployed” during several SO field campaigns using a specified dynamics configuration of the CAM6. Assessments revealed a low bias in cloud droplet number concentrations (CDNC), consistent with a low bias in cloud condensation nuclei (CCN) from missing sulfate aerosol. Model predictions of SO ice nucleating particles (INPs) are skillful in the boundary layer, but are much more variable aloft. In a series of simulations aimed at determining the needed INP predictive skill for accurately representing SO clouds, we find little to no sensitivity in CAM6 clouds to changes in ice nucleation. Analysis of these simulations reveal that ice formation in CAM6 SO clouds is unrealistically dominated by heterogeneous freezing of supercooled rain and is linked to the CDNC-CCN bias chain. Efforts to address these biases will also be discussed. 

How to cite: McCluskey, C., Niu, Q., Thayer-Calder, K., Patnaude, R., Gohil, K., Nusbaumer, J., Hannay, C., Medeiros, B., and Mace, G.: Ice, Ice, Maybe? A Process System Assessment of Southern Ocean Aerosol-Cloud Interactions, EGU General Assembly 2026, Vienna, Austria, 3–8 May 2026, EGU26-15117, https://doi.org/10.5194/egusphere-egu26-15117, 2026.

EGU26-16210 | ECS | Orals | AS1.10

Tracking ice growth pathways in mixed-phase Arctic clouds using stable water isotopes: Airborne in-situ measurements from CAESAR 2024. 

Elise Rosky, Adriana Bailey, Mampi Sarkar, Aaron Bansemer, Sarah Woods, Harald Sodemann, Andrew Seidl, Bart Geerts, Greg McFarquhar, and Paquita Zuidema

In-situ cloud measurement techniques, particularly those collected by airborne platforms, capture microphysical characteristics of mixed-phase clouds but are unable to directly measure ice formation mechanisms and particle growth histories. Addressing this observational gap, we demonstrate that in-situ measurement of stable water isotopes can be used to quantify ice growth processes more directly. By analyzing the isotopic composition of ice hydrometeors, we can identify their dominant growth pathway: direct vapor deposition, riming, or through Wegener-Bergeron (WBF) conditions.

Stable water isotopologues are water molecules which contain deuterium (D) or oxygen-18 (O18). They are present within water everywhere, and are termed “heavy” due to their larger molecular mass. The concentration of heavy water isotopes found in atmospheric ice particles is dependent on the thermodynamic conditions experienced during growth. Specifically, the in-situ temperature, relative humidity, and thermodynamic phase (liquid or ice) dictate the amount of heavy isotopes that enter the cloud condensate.

Water isotopes within mixed-phase clouds were measured in-situ during the CAESAR 2024 (Cold Air Outbreak Experiment in the Sub-Arctic Region) airborne field campaign. We first provide an overview of stable water isotopes and their dependence on environmental conditions. Then, we present the use of isotopic measurements to identify vapor deposition, riming, and WBF growth conditions inside mixed-phase clouds from CAESAR. A suite of in-situ cloud probes (PHIPS, HOLODEC, and Optical Array Probes) is used to validate the results of the isotopic analysis. This observational technique can be leveraged to study each ice growth mechanism’s influence on cloud properties.

How to cite: Rosky, E., Bailey, A., Sarkar, M., Bansemer, A., Woods, S., Sodemann, H., Seidl, A., Geerts, B., McFarquhar, G., and Zuidema, P.: Tracking ice growth pathways in mixed-phase Arctic clouds using stable water isotopes: Airborne in-situ measurements from CAESAR 2024., EGU General Assembly 2026, Vienna, Austria, 3–8 May 2026, EGU26-16210, https://doi.org/10.5194/egusphere-egu26-16210, 2026.

EGU26-16826 | ECS | Orals | AS1.10

A 40-year Climatology and New Sub-Millimeter Retrievals: Two Novel Datasets for Observational Constraints on Ice Cloud Mass 

Peter McEvoy, Eleanor May, Adrià Amell Tosas, and Patrick Eriksson

Constraining frozen cloud particles remains a key challenge for improving global climate models. Current estimates of atmospheric ice mass have significant limitations. The spaceborne radar-lidar missions CloudSat-CALIPSO and EarthCARE offer high-quality data but with sparse sampling and limited mission duration. Passive satellite products provide better spatiotemporal coverage but have traditionally exhibited strong biases compared to CloudSat-based measurements. These observational gaps limit our ability to evaluate and validate simulations of ice clouds.

We present two complementary datasets to address this challenge: the Chalmers Cloud Ice Climatology (CCIC) and the Chalmers Hydrometeor Inversion Product from the Arctic Weather Satellite (CHIP-AWS). Both datasets provide a number of quantities; here we focus on vertically integrated atmospheric ice mass: frozen water path (FWP). They provide estimates with regular global coverage between ±60° latitude and are accompanied by per-retrieval uncertainty. Though both use neural networks, they have contrasting training approaches: CCIC employs empirical training on CloudSat-retrieved data, while CHIP-AWS uses physics-based radiative transfer simulations. For average values, both datasets agree with CloudSat-based retrievals.

CCIC provides quasi-global coverage of FWP estimates at high temporal resolution. The inputs are geostationary infrared images to a neural network model trained on 3.5 years of CloudSat-CALIPSO data. Once trained, the model can be applied to archived and future imagery. Two variants are available: a 0.07°/3-hour product spanning 1980-present and a higher resolution 0.036°/30-minute product spanning 2000-present. These 40+/20+ year climatologies enable analysis of both long-term trends and diurnal variations in ice cloud properties and have been applied to evaluate global storm-resolving models and identify regional trends.

CHIP-AWS uses novel sub-mm passive microwave radiances from the polar-orbiting Arctic Weather Satellite (launched 2024), providing more direct sensitivity to ice mass compared to previous passive instruments. The retrieval model is trained on a database of radiative transfer simulations that use defined particle models and scattering data. This approach allows assessment of the underlying microphysical assumptions. The dataset covers 2025 and onward with an 800 km swath and ~10 km nadir resolution. This provides high spatial coverage compared to a satellite cloud radar but low compared to CCIC. On the other hand, CHIP-AWS offers higher spatial resolution and much higher accuracy at local scales.

Together, the different strengths of these datasets provide observational constraints for evaluating and improving ice cloud processes in climate models across scales from individual cloud systems to multi-decadal trends.

How to cite: McEvoy, P., May, E., Amell Tosas, A., and Eriksson, P.: A 40-year Climatology and New Sub-Millimeter Retrievals: Two Novel Datasets for Observational Constraints on Ice Cloud Mass, EGU General Assembly 2026, Vienna, Austria, 3–8 May 2026, EGU26-16826, https://doi.org/10.5194/egusphere-egu26-16826, 2026.

EGU26-17594 | ECS | Posters on site | AS1.10

Convection over Southern Scandinavia: a Modeling Perspective 

Irene Bartolome Garcia, Annette Miltenberger, Christian Rolf, Martina Krämer, and Patrick Konjari

Understanding ice microphysics processes within storms is key to developing parameterizations that accurately represent them in models. In this study, we analyze the ice formation pathways of a convective system observed over southern Scandinavia during the airborne TPEx campaign (Konjari et al., 2025). Using the ICOsahedral Nonhydrostatic (ICON) modeling framework (version 2024.7), we performed a high-resolution simulation (400 m horizontal, 150 m vertical) with the ice-mode implementation that differentiates between five formation mechanisms (Lüttmer et al., 2025). We identified and tracked convective cells using tobac (Tracking and Object Based Analysis of Clouds, Heikenfeld et al., 2019), analyzing only those whose complete life cycles were captured. For each stage of the life cycle (developing, mature, and dissipating) we examined the importance of each formation pathway by altitude, further distinguishing between the convective core and the anvil and analyzing overshoots as a sub-case. Our results suggest, for example, that homogeneous drop freezing was the most important source of the ice crystals in the overshooting anvil of the convection. Additionally, we compare our conclusions to the ones made by Konjari et al. (2025) based on observations of the same study case.


Heikenfeld, M., Marinescu, P. J., Christensen, M., Watson-Parris, D., Senf, F., van den Heever, S. C., and Stier, P.: tobac 1.2: towards a flexible framework for tracking and analysis of clouds in diverse datasets, Geoscientific Model Development, 12, 4551–4570, https://doi.org/10.5194/gmd-12-4551-2019, 2019.

ICON partnership (MPI-M; DWD; DKRZ; KIT; C2SM): ICON, https://www.icon-model.org/, accessed: 2026-01-15.

Konjari, P., Rolf, C., Krämer, M., Afchine, A., Spelten, N., Bartolome Garcia, I., Miltenberger, A., Emig, N., Joppe, P., Schneider, J., Li, Y., Petzold, A., Bozem, H., and Hoor, P.: Stratospheric Hydration and Ice Microphysics of a Convective Overshoot Observed during the TPEx Campaign over Sweden, EGUsphere, 2025, 1–27, https://doi.org/10.5194/egusphere-2025-2847, 2025.

Lüttmer, T., Spichtinger, P., and Seifert, A.: Investigating ice formation pathways using a novel two-moment multi-class cloud microphysics scheme, Atmospheric Chemistry and Physics, 25, 4505–4529, https://doi.org/10.5194/acp-25-4505-2025, 2025.

How to cite: Bartolome Garcia, I., Miltenberger, A., Rolf, C., Krämer, M., and Konjari, P.: Convection over Southern Scandinavia: a Modeling Perspective, EGU General Assembly 2026, Vienna, Austria, 3–8 May 2026, EGU26-17594, https://doi.org/10.5194/egusphere-egu26-17594, 2026.

EGU26-17837 | ECS | Posters on site | AS1.10

Demonstrating the capability of instrumental synergy to characterize contrails at the SIRTA observatory in Paris 

Cheikh Dione, Jean-Charles Dupont, Karine Caillault, Martial Haeffelin, Florian Lapouge, and Patricia Delville

As part of the Climaviation project, which is funded by the French Direction Générale de l’Aviation Civile (DGAC) aiming to quantify the non-CO2 effect of civil aviation in the warming climate, this study aims to characterise the optical, macro and microphysical properties of contrails at the SIRTA observatory in Palaiseau, France. To detect contrail occurrence over the site, a co-localised instrumental synergy comprising the IPRAL Lidar (a multi-longwave lidar), a total sky camera, Sentinel-2 satellite data, and aircraft flight altitudes is used. The particular integration method is applied to the lidar backscatter coefficient to estimate the optical depth of contrails after their geometrical characteristics (base height and thickness) have been defined. The optical depth estimated with this method is validated using a CIMEL sun-photometer. The Trappes radiosoundings are used to characterise the atmospheric conditions in with the contrails form. The colour ratio and the volume and particle depolarisation ratios from the analog and photo counting signals are used to qualitatively estimate the crystal size distributions within the contrails. An analysis of ten identified contrails observed on 5 July 2019, will be presented.

How to cite: Dione, C., Dupont, J.-C., Caillault, K., Haeffelin, M., Lapouge, F., and Delville, P.: Demonstrating the capability of instrumental synergy to characterize contrails at the SIRTA observatory in Paris, EGU General Assembly 2026, Vienna, Austria, 3–8 May 2026, EGU26-17837, https://doi.org/10.5194/egusphere-egu26-17837, 2026.

EGU26-17973 | Posters on site | AS1.10

Cloud-phase sensitivity of a stable Arctic mixed-phase cloud during ARTofMELT to microphysical factors 

Luisa Ickes, Hannah Frostenberg, Jessie Creamean, Erik S. Thomson, Roman Pohorsky, Julia Schmale, Heather Guy, Ian Brooks, Camille Mavis, Sonja Murto, Nicolas Faure, Julia Kojoj, Lea Haberstock, and Paul Zieger

Arctic low-level clouds are highly sensitive to microphysical processes, which can either sustain or break down the cloud-phase state and thereby determine the longevity of the clouds and their radiative impacts. They are influenced by aerosol particles, which can act as ice nuclei or cloud condensation nuclei, and simulating these clouds is additionally influenced by the parameterization schemes used for the aerosol-cloud interactions and the microphysical processes in the cloud.
In the presented study, we simulate a stable mixed-phase stratocumulus cloud case observed during the ship-based ARTofMELT campaign (Atmospheric rivers and the onset of Arctic melt) on 7 June 2023 with the large-eddy simulation model MIMICA-LES. The simulation is initialized by radiosoundings and constrained by ground-based remote sensing (liquid water path (LWP) and ice water path (IWP)) and aerosol measurements (aerosol size distributions, hygroscopicity, and aerosol type). We perturb the total aerosol number concentration, aerosol type, initial liquid water content (LWC), prescribed ice crystal number concentration, and ice habit to estimate the relative importance of these aerosol and microphysical parameters with respect to the modeled LWP/IWP using a factorial analysis as a statistical approach. Through factorial analysis, we can quantify the variance contribution of all parameters to LWP/IWP and quantify the interaction between different parameters. We find that ice crystal number concentration has the greatest impact on LWP and IWP, followed by the ice crystal habit, which can determine whether a cloud glaciates or not, given a fixed ice crystal number concentration. The ice habit is relatively less important, but it can determine whether a cloud glaciates or not, given fixed aerosol type and ice crystal number concentration. The results from our study can help to constrain and improve future closure studies between observations and small-scale modeling.

How to cite: Ickes, L., Frostenberg, H., Creamean, J., Thomson, E. S., Pohorsky, R., Schmale, J., Guy, H., Brooks, I., Mavis, C., Murto, S., Faure, N., Kojoj, J., Haberstock, L., and Zieger, P.: Cloud-phase sensitivity of a stable Arctic mixed-phase cloud during ARTofMELT to microphysical factors, EGU General Assembly 2026, Vienna, Austria, 3–8 May 2026, EGU26-17973, https://doi.org/10.5194/egusphere-egu26-17973, 2026.

EGU26-18136 | ECS | Posters on site | AS1.10

Sensitivity of ice multiplication mechanisms among natural clouds 

Akash Deshmukh, Deepak Waman, Sachin Patade, Ashok kumar Gupta, and Vaughan Phillips

Secondary ice production explains why clouds often contain ice particle concentrations that are orders of magnitude higher than the number of ice-nucleating particles available to initiate freezing. Accurate prediction of concentrations of ice in atmospheric clouds necessitates an understanding of SIP mechanisms. A fundamental challenge is determining how modeled SIP mechanisms depend on cloud properties and environmental conditions.

In this study, we used the Aerosol–Cloud (AC) model, which incorporates four secondary ice production mechanisms: ice–ice collisional breakup, fragmentation during raindrop freezing, the Hallett–Mossop process, and sublimational breakup. The various numerical simulations for sensitivity studies are conducted with the AC model and evaluated using a control simulation. 

Ice multiplication is driven by positive feedback mechanisms formed by interconnected microphysical processes. Investigating the potential for ice enhancement in natural clouds therefore requires consideration of the full range of microphysical interactions that may either suppress or amplify its influence under varying environmental conditions. The objective is to assess and determine the synergy among the secondary ice mechanisms.

In tropical deep convective clouds with very warm cloud bases, lower environmental CCN concentrations led to higher simulated ice concentrations in the lower mixed-phase region. In contrast, plausible variations in environmental IN concentrations had little effect on total simulated ice at any altitude. Overall, ice multiplication acted to dampen the simulated sensitivity to changes in both IN and CCN aerosol loadings.

How to cite: Deshmukh, A., Waman, D., Patade, S., Gupta, A. K., and Phillips, V.: Sensitivity of ice multiplication mechanisms among natural clouds, EGU General Assembly 2026, Vienna, Austria, 3–8 May 2026, EGU26-18136, https://doi.org/10.5194/egusphere-egu26-18136, 2026.

EGU26-19359 | ECS | Posters on site | AS1.10

Optimizing Ice Cloud Representations with a Mixed Super-ellipsoidal Scheme using Polarized Radiance Observations 

Yizhen Meng, Lei Bi, and Lanhui Sun

Accurate representation of ice crystal shapes is critical for simulating polarized radiance and improving radiative transfer in climate and weather models. In this study, we systematically developed a database of 1071 super-ellipsoidal ice crystals covering a broad range of aspect ratios, roundness, and surface roughness, and used POLDER-3/PARASOL polarized radiance observations from 2009 to identify optimal shapes and roughness parameters and obtain a mixed super-ellipsoidal scheme across latitude bands. Based on these results, we evaluated a mixed super-ellipsoidal scheme against traditional single-habit particles from the TAMUice2016 database (e.g., Plate, 5-Plate, 8-Column) using 2012 observations. Conventional single-habit models exhibit varying performance across latitude bands, often underestimating or overestimating polarized radiance in specific regions. In contrast, the mixed super-ellipsoidal models demonstrate consistently higher correlations and lower RMSE, with robust performance across wavelengths and latitudes. These results indicate that observationally constrained mixed super-ellipsoidal scheme provides a flexible framework for ice cloud representation in radiative transfer simulations, paving the way for improved studies in microphysics and polarization-based retrievals.

How to cite: Meng, Y., Bi, L., and Sun, L.: Optimizing Ice Cloud Representations with a Mixed Super-ellipsoidal Scheme using Polarized Radiance Observations, EGU General Assembly 2026, Vienna, Austria, 3–8 May 2026, EGU26-19359, https://doi.org/10.5194/egusphere-egu26-19359, 2026.

EGU26-19583 | ECS | Posters on site | AS1.10

Tracing cirrus cloud formation history using satellite observations and Lagrangian trajectories 

Athulya Saiprakash, Martina Krämer, Christian Rolf, Jérôme Riedi, and Odran Sourdeval

Cirrus clouds, composed of pure ice crystals and forming in the upper troposphere, are particularly challenging to characterize because of their complex microphysics and diverse growth processes. Satellite observations capture only snapshots of cirrus cloud properties, offering limited insight into cloud history. Here, we present DC-Ice, which combines satellite observations and Lagrangian microphysical modelling to trace the history of air parcels contributing to cirrus cloud formation. The Chemical Lagrangian Model of the Stratosphere (CLaMS) is employed to trace air-parcel trajectories along the DARDAR-Nice track, along which cirrus cloud formation and evolution are simulated using the CLaMS-Ice microphysical model. Satellite observations are complemented with origin-based metrics describing ice formation pathways (homogeneous vs heterogeneous), ice crystal origin (liquid-phase or in-situ), and the time since ice formation.

DC-Ice is applied to three representative midlatitude cirrus cases spanning fast updrafts, slow updrafts, and orographically driven conditions. Air parcel histories and reconstructed vertical profiles along the satellite track are used to identify distinct phases of the cirrus life cycle and the distribution of origin-based metrics across cloud layers. Modelled microphysical properties are statistically evaluated against satellite retrievals. In addition, a series of sensitivity experiments assesses the influence of key CLaMS-Ice input parameters, including small-scale temperature fluctuations, environmental ice-nucleating particle (INP) concentrations, and sedimentation parameterizations. Taken together, this framework adds a process-based context to satellite observations and supports a more comprehensive understanding of cirrus cloud origins and their role in the climate system.


How to cite: Saiprakash, A., Krämer, M., Rolf, C., Riedi, J., and Sourdeval, O.: Tracing cirrus cloud formation history using satellite observations and Lagrangian trajectories, EGU General Assembly 2026, Vienna, Austria, 3–8 May 2026, EGU26-19583, https://doi.org/10.5194/egusphere-egu26-19583, 2026.

EGU26-20046 | Orals | AS1.10

Observational constraints on the ice cloud asymmetry parameter and a new optical parameterisation for cirrus clouds 

Emma Järvinen, Franz M. Schnaiter, and Harry Ballington

Cirrus clouds exert a strong control on Earth’s radiation budget, yet their shortwave radiative impact remains one of the largest sources of uncertainty in climate projections. A key quantity governing this impact is the asymmetry parameter (g), which describes the angular redistribution of scattered solar radiation and is highly sensitive to ice crystal morphology and surface structure. However, direct observational constraints on g in natural cirrus clouds remain scarce.

Here, we present simultaneous in situ measurements of ice particle morphology and angular light scattering obtained with the Particle Habit Imaging and Polar Scattering (PHIPS) probe during the CIRRUS-HL aircraft campaign in summer 2021. The dataset spans both mid-latitude and Arctic cirrus clouds over a wide range of cloud types and temperatures down to -63°C. Across all conditions, we find consistently low median asymmetry parameters, with a campaign-wide median of g = 0.738. The observed values show little sensitivity to temperature, relative humidity over ice, crystal habit, or aspect ratio, but exhibit a systematic decrease with increasing particle size. These values are substantially lower than those commonly assumed in current radiative transfer schemes, implying that the shortwave warming effect of cirrus clouds may be overestimated in many climate models.

Motivated by this discrepancy, we introduce an observationally constrained optical parameterisation for ice crystals aimed at improving their representation in climate models. The parameterisation is based on a new physical-optics hybrid approach that explicitly accounts for surface roughness using a physically motivated description, avoiding ad hoc treatments employed in earlier schemes. By fitting this model to the measured scattering properties, we derive an updated parameterisation of ice crystal optical properties suitable for climate applications. Together, these results provide both new observational constraints and a pathway toward more physically realistic representations of cirrus cloud optical properties, helping to reduce uncertainties in cloud radiative forcing.

How to cite: Järvinen, E., Schnaiter, F. M., and Ballington, H.: Observational constraints on the ice cloud asymmetry parameter and a new optical parameterisation for cirrus clouds, EGU General Assembly 2026, Vienna, Austria, 3–8 May 2026, EGU26-20046, https://doi.org/10.5194/egusphere-egu26-20046, 2026.

EGU26-20223 | Orals | AS1.10 | Highlight

Climate models overestimate the radiative effect of thin Arctic ice clouds 

Felix Pithan, Carsten Abraham, Marylou Athanase, Yiling Huo, Nicolas Michalezyk, Tuomas Naakka, Romain Roehrig, Jan Streffing, and Antonio Sanchez-Benitez

Liquid-containing clouds have an important impact on Arctic winter climate because they suppress radiative cooling of the surface. Pure ice clouds have a much weaker effect on longwave radiation, and often permit substantial surface radiative cooling. Here, we show that climate models typically underestimate the difference in surface radiation under low-level liquid and ice clouds in the Arctic. The analysed models consistently overestimate the longwave radiative effect of thin ice clouds compared to ground-based observations from the MOSAiC expedition. This mismatch occurs despite realistic ice cloud effective radii in models, and thus cannot be due to errors in cloud properties. The model behaviour reflects the relationship between ice water path and cloud optical thickness that is at the core of commonly used ice optics parametrizations, but this relationship is inconsistent with MOSAiC observations. Ice optics parametrizations have been developed for cirrus clouds, and low-level Arctic ice clouds may be more heterogeneous, or have different ice habits, reducing their radiative impact compared to a cirrus cloud of the same ice water path and effective radius. Our results suggest that climate models understimate the surface warming effect of an increasing liquid fraction of cloud condensate in a warming Arctic.

How to cite: Pithan, F., Abraham, C., Athanase, M., Huo, Y., Michalezyk, N., Naakka, T., Roehrig, R., Streffing, J., and Sanchez-Benitez, A.: Climate models overestimate the radiative effect of thin Arctic ice clouds, EGU General Assembly 2026, Vienna, Austria, 3–8 May 2026, EGU26-20223, https://doi.org/10.5194/egusphere-egu26-20223, 2026.

EGU26-20455 | Posters on site | AS1.10

Exploring signatures of ice nucleation events in satellite observations 

Odran Sourdeval, Irene Bartolome Garcia, Athulya Saiprakash, and Silvia Bucci

Satellite observations provide instantaneous snapshots of cloud properties, such as ice water content and ice crystal number concentration, which may retain information on the prior history of cloud parcels. However, inferring cloud microphysical processes from satellite data alone remains challenging, as these processes are not directly observable.

Lagrangian models, either purely transport-based or coupled to microphysics, are commonly used to reconstruct the history of cirrus clouds and to infer their origin (in situ vs. liquid-origin) and ice formation pathways (e.g. homogeneous vs. heterogeneous nucleation). These approaches, however, strongly depend on meteorological reanalyses and microphysical assumptions, which remain particularly uncertain for cirrus clouds. While very useful, they would ideally be further constrained by observation-based information.

Here, we explore whether satellite observations can provide additional indications of ice nucleation events. For this purpose, we analyse global lidar-radar observations from the DARDAR-Nice product, focusing on spatial patterns in vertical profiles of ice cloud properties. In particular, we investigate whether strong local absolute or relative increases in ice crystal number concentration can be interpreted as signatures of nucleation events. This methodology is applied globally over one year of observations to estimate the occurrence of homogeneous and heterogeneous ice nucleation, and the statistical occurrence of different ice nucleation pathways is presented. The approach is further evaluated using high-resolution ICON simulations of ice cloud structures to assess its limitations. Finally, global results from this observation-only method are compared with nucleation diagnostics derived from back-trajectory approaches using CLaMS-Ice and FLEXPART.

How to cite: Sourdeval, O., Bartolome Garcia, I., Saiprakash, A., and Bucci, S.: Exploring signatures of ice nucleation events in satellite observations, EGU General Assembly 2026, Vienna, Austria, 3–8 May 2026, EGU26-20455, https://doi.org/10.5194/egusphere-egu26-20455, 2026.

EGU26-20695 | ECS | Posters on site | AS1.10

Transient contrails as an opportunity for upper tropospheric humidity estimation 

Oliver Driver, Joel Ponsonby, Nicolas Gourgue, Olivier Boucher, Marc Stettler, and Edward Gryspeerdt

When aircraft exhaust mixes with cold air, it forms an ice cloud: a contrail. If the ambient conditions are dry the contrail is transient, meaning that the ice crystals sublimate during mixing, in the first minutes after emission. Conversely, in humid air the contrail can persist and contribute a significant warming radiative forcing. Errors that are present in weather data therefore make contrails (and aviation's climate impact) hard to model. More humidity observations are needed to reduce model errors in this part of the atmosphere. The observation of persistent contrails implies the presence of ice-supersaturated regions. In this study, we establish the potential to extend these opportunistic observations using measurements of transient contrails, enabling direct measurement of relative humidity with respect to ice. 

A refined contrail jet phase bulk microphysics model is compared to ground camera detection and measurement of contrails immediately behind aircraft. Contrails are detected over an all-sky camera in Palaiseau, France using a cross-track peak detection methodcombining ADS-B aircraft positions and winds derived from aircraft-reported data. Around 5% of daytime overhead aircraft lead to a contrail detection (either transient or persistent). However, many contrails go unobserved. This observability limitation is evident when focusing on those aircraft that fly in air satisfying the Schmidt–Appleman temperature threshold condition, for contrail formation. The condition is satisfied in more than 99% of the observations where a contrail is detected, but fewer than 10% of observations behind aircraft where this condition is satisfied yield a detection. Invariably, this is due to natural cloud or the artefact being too faint or small to be detected using the current instrument and method. 

We demonstrate that temperature and relative humidity with respect to ice are the main controls on observed transient contrail lifetime. The model reproduces this dependence, though the introduction of a mixing model hybridising the core and bulk plume is critical to constrain this process. This result provides a foundation to infer the relative humidity directly, without requiring new sensors. Some limitations of the observing system remain to be overcome: higher resolution cameras, detection algorithms robust to advection error and understanding the conditions for observability would improve the method accuracy. On top of this, the clear-sky conditions required to detect transient contrails are relatively infrequent, which is an external limitation that must be understood. Nonetheless, these resultshighlight a new pathway to infer the humidity in a part of the atmosphere where accuracy is valuable, but models are insufficiently constrained. 

How to cite: Driver, O., Ponsonby, J., Gourgue, N., Boucher, O., Stettler, M., and Gryspeerdt, E.: Transient contrails as an opportunity for upper tropospheric humidity estimation, EGU General Assembly 2026, Vienna, Austria, 3–8 May 2026, EGU26-20695, https://doi.org/10.5194/egusphere-egu26-20695, 2026.

EGU26-20862 | ECS | Posters on site | AS1.10

Resolving the Arctic winter radiative multimodality: a large eddy simulation study at the north slope of Alaska 

Yunpei Chu, Stephan R. de Roode, and Isabelle Steinke

The Arctic winter climate is characterised by multimodal radiative regimes. Two major regimes are well-documented in observational datasets across diverse Arctic regions. One is a radiatively clear regime with optically thin clouds with strong surface cooling, and another is a radiatively opaque regime characterized by optically thick, mixed-phase clouds and deep ice clouds that maintain a warm surface. The radiative opaque regime is largely driven by the presence of supercooled liquid water in mixed-phase clouds and optically thick ice in ice clouds.

Accurately capturing these regimes is essential for understanding Arctic climate and its future change; however, current reanalysis datasets, struggle to reproduce the multimodality. Analyses reveal that reanalysis often exhibits unimodal or skewed distributions of surface downward longwave radiation, failing to distinguish between the distinct clear and opaque regimes. These biases are from a systematic underestimation of the cloud liquid water path and warm temperature biases in the boundary layer, which obscure the radiative frequency peaks observed in nature.

Recent long-term analyses of in-situ data from the Atmospheric Radiation Management (ARM) North Slope of Alaska (NSA) have identified a rapid deterioration of the transmissive atmospheric radiative regime in the Western Arctic. This decline is particularly pronounced in autumn, where the frequency of clear regimes has dropped significantly over the past 25 years. It is unclear whether reanalysis dataset can capture such regime shift.

To address these discrepancies, we employ Dutch Atmospheric Large Eddy Simulation (DALES) capable of explicitly resolving small-scale turbulence and parameterising cloud with a 2-moment bulk mixed-phase microphysics. In this study, the LES is forced by large-scale reanalysis datasets and compared against long-term in-situ observations from the ARM NSA site.

How to cite: Chu, Y., de Roode, S. R., and Steinke, I.: Resolving the Arctic winter radiative multimodality: a large eddy simulation study at the north slope of Alaska, EGU General Assembly 2026, Vienna, Austria, 3–8 May 2026, EGU26-20862, https://doi.org/10.5194/egusphere-egu26-20862, 2026.

EGU26-21074 | Orals | AS1.10

Aircraft as a natural experiment on ice clouds 

Edward Gryspeerdt, Oliver G. A. Driver, Sajedeh Marjani, Jin Maruhashi, Ryan R. Neely III, Lindsay Rhodes, Marc E. J. Stettler, Anna Tippett, Christopher J. Walden, and Daniel Walker

Aerosol impacts on ice clouds remain a highly uncertain component of the effective radiative forcing from aerosol-cloud interactions, with models simulating a wide range of responses. Developing observational constraints for these aerosol-cloud effects is challenging. The low aerosol concentrations involved hinder their direct observation and the meteorological conditions that affect cloud properties (such as temperature and updraught speed) also impact ice crystal number, limiting its use for inferring information about aerosol. Variations in meteorological conditions can also impact cloud and aerosol properties together, obscuring the causal impact of aerosol on cloud.

Similar to the use of ship emitted aerosol and the resulting 'shiptrack' cloud perturbation to understand aerosol-cloud interactions in liquid clouds, here we use aircraft to understand the response of ice clouds to aerosol perturbations.  Aircraft release water, aerosol and heat into the atmosphere as they fly, creating contrails in clear sky if conditions are suitable and perturbing existing clouds they fly through. The perturbation sizes vary with aircraft type, allowing a more detailed assessment of cloud responses.

Using a range of satellite data and ground-based radar observations, we composite contrails and aircraft impacts on existing clouds under a variety of conditions from a range of different aircraft types. We see that contrails formed from different aircraft types have varying lifetimes, consistent with an aerosol effect that increases cloud lifetime. Impacts on existing clouds vary significantly with time since the perturbation and meteorological conditions, highlighting the importance of the background cloud conditions. We also demonstrate how non-aerosol effects can be isolated and removed, to better constrain the impact of aerosols and aircraft on ice clouds and climate.


How to cite: Gryspeerdt, E., Driver, O. G. A., Marjani, S., Maruhashi, J., Neely III, R. R., Rhodes, L., Stettler, M. E. J., Tippett, A., Walden, C. J., and Walker, D.: Aircraft as a natural experiment on ice clouds, EGU General Assembly 2026, Vienna, Austria, 3–8 May 2026, EGU26-21074, https://doi.org/10.5194/egusphere-egu26-21074, 2026.

EGU26-21090 | Posters on site | AS1.10

A Theory for Why Some Clouds Produce Snow  

Vaughan Phillips

Mixed-phase clouds consist of both supercooled cloud-liquid and ice particles.  They are influential for the Earth’s radiation budget.  Snow reaches the ground typically from mixed-phase nimbostratus cloud.  For humanity, deep snowfalls are influential as they cause much disruption (e.g. to transportation), with a cost of billions of euros annually .   

Both the warm rain (coalescence) and ice crystal (vapour growth of crystals, perhaps followed by aggregation) processes of precipitation can co-exist in mixed-phase clouds.  A cloud base that is not too warm, depending on aerosol conditions, is typically needed for the ice crystal process to prevail in precipitation production, because otherwise an abundance of cloud-liquid mass can promote coalescence before parcels become supercooled, as with deep tropical convective clouds.   

Our theory published in 2024 explained why any competition between both cold and warm processes of precipitation in mixed-phase clouds tends to be won by the ice crystal process.  Since the fall-out of snow is slow, boosting its mass aloft, and its low bulk density creates a wide cross-sectional area for riming, the supercooled cloud-liquid mass is kept weak by the ice crystal process.  This then reinforces the ice crystal process by minimizing the liquid water content, favouring snow production. 

The question of why snow reaches the ground, whether intact or as a melted drop, is partly related also to the issue of why graupel or hail is not produced instead.  Snow may rime to produce graupel or hail.  Precipitation particles tend to be defined by the intensity of the ascent.  Snow particles are balanced against stratiform ascent (< 1 m/s) as it is comparable to their fall-speeds.  This is partly why nimbostratus produces deep snowfalls. Graupel/hail tends to fall much faster. But also wintertime deep convection can produce snow at the ground, as sometimes seen in thunderstorms near the Sea of Japan. 

On this topic, Steiner and Smith in 1998 theorized that there is a phase-space of in-cloud vertical velocity and temperature in which a region of predominant riming and supercooled cloud-liquid exists in a ‘wedge’ within the convective ascent.  Steiner and Smith argued that predominant aggregation for snow is restricted to weak stratiform ascent since at faster convective ascent there is predominant riming.

In this presentation we analyse with a single-crystal growth model the conditions of ascent and temperature determining whether snow or graupel fall out from the mixed-phase region.  The model predicts the evolution of a crystal growing first by diffusional growth in various habits and then by aggregation of crystals and riming, with the chance of becoming either graupel or hail.   We reproduce the wedge in the phase-space by Steiner and Smith, and analyse contributions from aggregation, sticking efficiency and riming.  It is predicted that repeated recirculation cycles and aggregation of crystals by snow is needed to explain the wedge.   

In summary, snow reaches the ground partly because the ice crystal process tends to prevail in mixed-phase clouds, while aggregation of ice crystals and related processes (e.g. habit-dependent sticking efficiency) in weak ascent combine to prevent snow from becoming graupel/hail.

How to cite: Phillips, V.: A Theory for Why Some Clouds Produce Snow , EGU General Assembly 2026, Vienna, Austria, 3–8 May 2026, EGU26-21090, https://doi.org/10.5194/egusphere-egu26-21090, 2026.

Retrievals of ice precipitation from remote sensing measurements rely on a priori assumptions about particle mass and size within the sampling volume. Such a priori information typically includes a particle size distribution (PSD) and a mass-dimensional relation, m-D, where m is mass and D is the maximum dimension (or diameter). In situ measurements of ice particles from either airborne or ground-based imaging probes inform these assumptions. Owing to limited information about a particle‘s three-dimensional structure from probes with few independent view angles, estimates of the particle’s mass and size (D) based on these instruments are highly uncertain and systematically biased in D. Quantification of the uncertainty in the derived m-D relations is also challenging due to the lack of direct mass and D measurements, making it difficult to quantify the uncertainty of remote-sensing precipitation retrievals.

Using a database of physically plausible three-dimensional ice particle structures, we develop a framework to estimate particle size, mass, and other physical properties from a variety of different imaging probe configurations. The simulated probe configurations we use include those containing a single projection, two orthogonal projections, three orthogonal projections, and up to 13 projections at the nodes of a Lebedev spherical quadrature scheme. We simulate two-dimensional binary images of the particles at each projection and train machine-learning models to estimate the particle size and mass. To provide direct estimates of the uncertainty for each probe configuration, the machine learning models are trained to predict distributions of the size and mass.

The predictions of mean mass and size from the machine learning models increase in accuracy as the number of view angles increases, with greater improvements between the single-view and two-view configurations then between that and the three-orthogonal-view configuration. The uncertainty in mass decreases between the single and three-view models but remains relatively constant for the configurations using more than three views. Calculations of the spherical effective density based on the model predictions show favorable correspondence with the true spherical effective density of the particles, suggesting that the models largely capture the covariance between mass and size of the true particle shapes.

These probabilistic estimates of mass and size are then used to retrieve samples of m-D relation coefficients for a subset of particles corresponding to a known m-D relation. To estimate the impact of the uncertainty in the retrieved m-D relation has on precipitation retrievals, we compare the ice water content (IWC) for the known m-D relation using a variety of PSDs and the retrieved m-D relation samples from each probe configuration. The errors in IWC decrease with increasing numbers of view angles, with smaller reductions in error for configurations with more than three view angles. Future areas of improvement in the machine-learning models, as well as how the errors in m-D retrievals from imaging probes impact the downstream uncertainty in remote sensing retrievals will also be discussed.

How to cite: Schrom, R. and Kuo, K.-S.: Machine-learning based estimates of mass-dimensional relations from simulated in situ imaging probes, EGU General Assembly 2026, Vienna, Austria, 3–8 May 2026, EGU26-22103, https://doi.org/10.5194/egusphere-egu26-22103, 2026.

EGU26-23098 | ECS | Posters on site | AS1.10

Tropical altocumulus cloud observations during the ORCESTRA/MAESTRO field campaign 

Giovanni Biagioli and Sandrine Bony

During the ORCESTRA/MAESTRO field campaign, the recurrent, and somewhat unexpected, presence of mid-level clouds was documented in both in-situ and remote sensing observations. These clouds, most predominantly of the altocumulus type, are still poorly understood in terms of their formation mechanisms, and constitute a major challenge for numerical weather prediction and general circulation models, which often struggle against the representation of their mixed-phase composition. In addition, mid-level clouds can perturb the individual shortwave and longwave components of the radiation budget. However,  their role in the mesoscale organization of convection, and more generally in climate, is not established yet.

The data from the campaign, including airborne measurements from the ATR-42 research aircraft and radiosoundings conducted at Sal, Cape Verde, represent an excellent framework to help address the questions related to tropical mid-level clouds. We analyze case studies of altocumulus cloud occurrence in order to characterize the conditions of the environment in which they formed as well as their microphysical properties. Relatively deep conditionally unstable layers are found at and below the cloud level, and the cloud is often capped by a strong inversion likely driven by cloud top radiative cooling. Furthermore, there is evidence that the cloud layer is organized into sub-kilometer-scale cells composed of alternating updrafts and downdrafts. The mixed-phase nature of the cloud is confirmed, with a thin supercooled liquid layer at the top, and solid and liquid hydrometeors falling underneath. Based on preliminary results, possible mechanisms responsible for altocumulus formation and maintenance are discussed.    

How to cite: Biagioli, G. and Bony, S.: Tropical altocumulus cloud observations during the ORCESTRA/MAESTRO field campaign, EGU General Assembly 2026, Vienna, Austria, 3–8 May 2026, EGU26-23098, https://doi.org/10.5194/egusphere-egu26-23098, 2026.

Seasonal snowpack is one of the primary sources of freshwater for rivers in the Indian Himalaya. It plays a vital role in regional hydrology, climate variability, and water resource management. To understand these processes and their impact on the community, spatial and temporal monitoring of snow is essential. Snow depth is a key parameter for monitoring snow. However, in the Himalayas, due to accessibility challenges and logistical constraints,  limited snow depth observations are available. To address this gap and estimate snow depth at high spatial and temporal resolution, we develop a model using polarimetric parameters derived from Sentinel-1 SAR data, topographic and auxiliary data, integrated with field-based observations in the European Alps and Grand Mesa, USA. Field observations are filtered to match the Sentinel-1 pass, ensuring consistency between field-based observations and satellite acquisition. Our model employs topographic data (e.g., elevation, slope, and aspect) from the Copernicus 30 m digital elevation model, auxiliary parameters (such as day of the season (DoS)), Forest cover fraction from MODIS, and Sentinel-1 SAR-based polarimetric parameters (cross-ratio, entropy, Stokes parameters, alpha), ensuring a topographically dependent snow depth distribution. Sensitivity analysis is performed using SHAP (SHapley Additive Explanations) to identify the most critical parameters for estimating snow depth. The model shows a Mean Absolute Error (MAE) of 0.04m, a root mean square error (RMSE) of 0.15m, with a test R-squared (R2) of 0.95 and a cross-validation correlation coefficient (R) of 0.98 in the European Alps. We transfer the model to the mountains in the Chandra Bagha basin (33°01′N°, 76°40′E) of the Indian Himalayas. Our transferred model highlights the potential of estimating snow depth in data-scarce regions while resolving the spatial and temporal details. 

How to cite: Sharma, P. and Vijay, S.: Snow depth estimation model calibration and validation for high-altitude glacier valleys in the Indian Himalaya., EGU General Assembly 2026, Vienna, Austria, 3–8 May 2026, EGU26-738, https://doi.org/10.5194/egusphere-egu26-738, 2026.

EGU26-951 | ECS | PICO | CR5.1

Two decades of snow pit measurements in Sodankylä, Finland 

Leena Leppänen, Anna Kontu, Henna-Reetta Hannula, Aleksi Rimali, and Heidi Rytkönen

We present a 20-year timeseries of key snow properties measured in Sodankylä, northern Finland. Systematic snow pit observations began in 2006, and the range of measured variables and instruments has expanded substantially over time. Initially, observations included snow depth, stratigraphy, grain size, and temperature, recorded twice per week at a forest opening site. Snow water equivalent (SWE) measurements were added in 2007, density profiles and liquid water content in 2009, and specific surface area (SSA) measurements in 2012. Since 2010, snow pit observations have been conducted once per week.

The monitored locations have varied over the years. A forest opening site was observed from 2006 to 2018, a wetland site from 2009 to 2015 and again from 2019 onward, and a forest site has been included since 2018. Additional snow pits were dug at Lake Orajärvi between 2009 and 2014. Currently, routine observations are carried out at two sites: a wetland and a forest.

The present snow pit protocol includes definition of stratigraphy, a temperature profile measured every 10 cm, and estimation of grain size and grain type, complemented by macrophotography of grain samples from each layer. Density measurements are performed at the surface and at 5 cm vertical intervals using a rectangular cutter. When snow is wet, liquid water content is measured with a WISe instrument at the same heights as the density samples. SSA is measured using InfraSnow for the surface and ice layers, while other layers are measured with IceCube. For thicker layers, IceCube samples are taken every 5 cm. Penetration resistance is measured with SnowScope. Finally, bulk SWE is measured using a snow tube, and snow depth is measured at three points around each pit.

This 20-year dataset provides a unique opportunity to examine long-term changes in snowpack structure and properties, and it illustrates the impacts of a changing climate in snow conditions in northern Finland.

How to cite: Leppänen, L., Kontu, A., Hannula, H.-R., Rimali, A., and Rytkönen, H.: Two decades of snow pit measurements in Sodankylä, Finland, EGU General Assembly 2026, Vienna, Austria, 3–8 May 2026, EGU26-951, https://doi.org/10.5194/egusphere-egu26-951, 2026.

EGU26-2816 | PICO | CR5.1

Snow Modelling Locked Pastures from Rain-on-Snow Events in the Arctic 

Érika Boisvert-Vigneault, Melody Sandells, Vincent Vionnet, Nicolas Leroux, Nick Rutter, Alexandre Langlois, and Hannah Bloomfield

Rain-on-snow (ROS) events are an increasingly prevalent Arctic extreme weather phenomenon, driven by accelerated atmospheric warming. These events create ice layers within the snowpack, which can prevent foraging for ungulates like reindeers, caribou and muskoxen and have been linked to catastrophic herd die-offs. Accurately simulating physical consequences of ROS, specifically development of these ice crusts, is therefore critical for assessing wildlife habitat suitability. However, the performance of detailed snow models in high-latitude environments remains inadequately evaluated, particularly their ability to replicate the snowpack stratigraphy following complex meteorological events.

This study investigates the capacity of the snow model Crocus-SVS2 to simulate the impacts of known, major ROS events on the snowpack of Banks Island, Nunavut. We focus on a case study where a documented ROS event was followed by a severe muskoxen mortality event in the winter of 2003-2004. Our methodology forces Crocus-SVS2 with three meteorological reanalysis datasets: the Canadian Surface Reanalysis version 2.1 (CaSR2.1) and 3.1 (CaSR3.1), and ERA5 reanalysis. This multi-forcing approach allows to assess not only the model's physical fidelity but also the sensitivity of the simulations to different weather inputs, thereby evaluating the ability of reanalysis products to represent ROS in the Arctic accurately.

Model outputs are analysed to determine if Crocus-SVS2 can successfully replicate the formation, thickness, and vertical position of observed ice lenses within the snow profile. The primary outcome is a robust evaluation of whether an operational snow model, when driven by the best available meteorological data, can serve as a reliable tool for retrospectively analysing ROS impacts in data-sparse Arctic regions. This research also provides a framework to identify key meteorological conditions that separate minor ROS events from those causing catastrophic ungulate die-offs.

How to cite: Boisvert-Vigneault, É., Sandells, M., Vionnet, V., Leroux, N., Rutter, N., Langlois, A., and Bloomfield, H.: Snow Modelling Locked Pastures from Rain-on-Snow Events in the Arctic, EGU General Assembly 2026, Vienna, Austria, 3–8 May 2026, EGU26-2816, https://doi.org/10.5194/egusphere-egu26-2816, 2026.

EGU26-4478 | ECS | PICO | CR5.1

Development of Percolation Features After a Rain-on-Snow Event in the Southern Taiga  

Anton Komarov and Julienne Stroeve

In this study, we investigate the development of percolation columns in fine-grained snow triggered by the accumulation of liquid precipitation on a cold, dry snowpack during a rain-on-snow (ROS) event in the Southern Taiga. We analyze snow physical properties, stratigraphy, and meteorological conditions before and after the percolation event, documenting changes in snow layering and the formation of percolation columns. Furthermore, we examine how local-scale factors, such as ground surface microtopography and vegetation cover, influence the spatial distribution of these features by comparing snow properties at three adjacent sites with distinctly different surface and vegetation characteristics.

Our results demonstrate that, under certain conditions, percolation columns can form even within fine-grained, low-density snow. Their spatial distribution appears strongly influenced by ground microtopography, with preferential formation between tussocks, while the presence of deciduous vegetation may inhibit their development. Additionally, we discuss the development of preferential flow paths on the adjacent slope that formed simultaneously to the development of percolation columns on flat surfaces and describe the major morphological features we observed. These findings contribute to a deeper understanding of preferential flow in snow and highlight the need to consider localized environmental conditions and evolving climate patterns in future snow hydrology research and hazard forecasting models.

Our observations also provide valuable information for improving the representation of preferential flow processes, which remain a major source of uncertainty in snow models. The distinct vertical icy features associated with percolation columns are also likely to affect radar signal penetration and backscatter, with potential implications for the interpretation of remote sensing observations. Moreover, the fact that such features can be identified from above, for example using drone imagery, offers opportunities for model evaluation and spatial validation under natural conditions.

How to cite: Komarov, A. and Stroeve, J.: Development of Percolation Features After a Rain-on-Snow Event in the Southern Taiga , EGU General Assembly 2026, Vienna, Austria, 3–8 May 2026, EGU26-4478, https://doi.org/10.5194/egusphere-egu26-4478, 2026.

EGU26-5591 | ECS | PICO | CR5.1

Deriving the evolution of snow specific surface area from water vapor physics at the microstructure scale 

Kevin Fourteau, Anna Braun, Michael Lehning, and Henning Löwe

The specific surface area (SSA) is a crucial parameter to characterize the microstructure of snow. It is one of the main properties controlling the optical and mechanical behavior of snow. Thus, being able to describe the evolution of SSA under the effects of metamorphism is key for detailed numerical snowpack models. This then allows simulating for example the albedo of snow-covered surfaces and its evolution over time. To this end, we propose to derive the law governing the evolution of SSA of snow directly from the physics of water vapor transport at the microstructure scale. We identify the crucial physical parameters for the evolution of the SSA. We show that the evolution of SSA is generally composed of two additive terms: an isothermal contribution and a temperature gradient contribution, each characterized by scalar macroscopic properties relating the evolution of the SSA to the temperature and temperature gradient imposed to the snow. On-going work includes parameterizing these scalar properties in order to obtain a fully-closed and operational law for the evolution of SSA.

How to cite: Fourteau, K., Braun, A., Lehning, M., and Löwe, H.: Deriving the evolution of snow specific surface area from water vapor physics at the microstructure scale, EGU General Assembly 2026, Vienna, Austria, 3–8 May 2026, EGU26-5591, https://doi.org/10.5194/egusphere-egu26-5591, 2026.

EGU26-5841 | ECS | PICO | CR5.1

Emerging contaminants during Arctic Rain-On-Snow events: insights from the 2023-24 Ny-Ålesund campaign 

Azzurra Spagnesi, Stefania Gilardoni, Roberto Salzano, Matteo Feltracco, Beatrice Ulgelmo, Riccardo Maetzke, Francisco Ardini, Marco Grotti, Veronica Coppolaro, Tessa Viglezio, Simonetta Montaguti, Federico Scoto, Andrea Spolaor, Andrea Gambaro, Carlo Barbante, and Elena Barbaro

The Svalbard Archipelago has experienced rapid warming in recent decades, leading to an increased frequency and intensity of Rain-on-Snow (ROS) events. While the physical and ecological impacts of ROS in the Arctic are well documented, their potential role in influencing the atmospheric fate of emerging contaminants remains largely unexplored. This study examines the chemical signature of four ROS events observed during the 2023–24 field campaign in Ny-Ålesund (Kongsfjorden, Svalbard, Norway), with particular attention to the behaviour of emerging pollutants before, during, and after each event. By integrating aerosol and wet deposition measurements with meteorological parameters and air-mass back-trajectory analyses, we assess the capacity of ROS events to act as removal processes for benzothiazole derivatives, tris(2-carboxyethyl)phosphine (TCEP) used as a flame retardant, pesticides, and haloacetic acids. Our results reveal marked variability in contaminant patterns across events, indicating a strong influence of synoptic-scale air mass origins and local meteorological conditions. Diagnostic ratios and inorganic ion tracers further provide insights into potential atmospheric transformation pathways and transport mechanisms. This study presents the first detailed chemical characterisation of aerosols and depositions associated with Rain-on-Snow events, offering a preliminary framework to better understand the interactions between ROS processes and contaminant cycling in a rapidly warming Arctic. This work contributes to ongoing efforts to elucidate atmospheric scavenging mechanisms under changing climate conditions.

How to cite: Spagnesi, A., Gilardoni, S., Salzano, R., Feltracco, M., Ulgelmo, B., Maetzke, R., Ardini, F., Grotti, M., Coppolaro, V., Viglezio, T., Montaguti, S., Scoto, F., Spolaor, A., Gambaro, A., Barbante, C., and Barbaro, E.: Emerging contaminants during Arctic Rain-On-Snow events: insights from the 2023-24 Ny-Ålesund campaign, EGU General Assembly 2026, Vienna, Austria, 3–8 May 2026, EGU26-5841, https://doi.org/10.5194/egusphere-egu26-5841, 2026.

EGU26-6561 | ECS | PICO | CR5.1

Improvements of a subcanopy snow model conveyed by observations from a mid-altitude alpine site 

Thomas Pauze, Axel Bouchet, Aaron Boone, Matthieu Lafaysse, Mathieu Fructus, Agnès Rivière, Lejeune Yves, and Gouttevin Isabelle

In the Alpine region, forests cover about 2/3 of the ground, yet surface and/or snow models designed for hydrological applications, often represent them in a very coarse way.

In the current study, we present and evaluate new developments in the physics-based ISBA/MEB-Crocus model that enables a detailed representation of snow cover and processes in interaction with an above-lying 1-layer canopy and atmosphere, and with a litter layer on top of the ground. While the canopy representation within this model demonstrated an added value for climate modeling, due to a better representation of snowpack in subarctic regions characterised by boreal forests, ISBA/MEB-Crocus failed to reproduce the observed snowpack at a mid-altitude alpine forest site, systematically overestimating the snowpack in terms of depth and duration.

With a view of correcting for these biases, we use detailed snowpack and meteorological measurements available at the Col de Porte research site in the Chartreuse massif, France, at both open and forested sites. In addition to conventional measures, indirect interception measurements and tree and soil temperatures are recorded.

The use of this dataset enables the improvement of the MEB-Crocus model for alpine forests. This enhancement is achieved through an adaptation of the interception scheme, a revision of the melt parametrization for intercepted snow, and of the unloading scheme. The meteorological forcing is also adapted to align with the top-of-canopy conditions. We demonstrate that these adjustements enable the snowpack model to replicate the observations for the Col de Porte forest site without degrading the results for Artic regions. Furthermore, we characterize the influence of the various parameters employed for the representation of the forest and their physical consistency.

This detailed, point-scale evaluation paves the way for the use of this model for distributed simulations enabling an insight into the role of snow and snow-forest interactions in the hydrological regime of mid-altitude alpine catchments.

How to cite: Pauze, T., Bouchet, A., Boone, A., Lafaysse, M., Fructus, M., Rivière, A., Yves, L., and Isabelle, G.: Improvements of a subcanopy snow model conveyed by observations from a mid-altitude alpine site, EGU General Assembly 2026, Vienna, Austria, 3–8 May 2026, EGU26-6561, https://doi.org/10.5194/egusphere-egu26-6561, 2026.

EGU26-6663 | ECS | PICO | CR5.1

Changes in Snowmelt Timing and Peak Flow Generation in Non-Regulated Finnish Catchments 

Maedeh Edraki and Ali Torabi Haghighi

Climate change alters precipitation patterns and extends the warm season in Arctic and sub-Arctic regions, with direct consequences for river flow dynamics. Snow Water Equivalent (SWE) provides a critical link between climate forcing and streamflow response, as it represents the portion of the snowpack that is released as runoff. However, temporal analysis of SWE is challenged by the discontinuous nature of observations provided by the Finnish Environment Institute (SYKE). In this study, a degree-day model was used to generate daily SWE time series, which were subsequently corrected using observed data, for four non-regulated Finnish catchments. River flow timing was analyzed relative to snowmelt onset over the period 1982–2024. While no clear trend was identified in the calendar-day occurrence of spring peak discharge, analysis relative to snowmelt onset revealed a consistent shift toward later peak flow, indicating an increasing delay between melt initiation and maximum discharge. Temperature analysis during the snowmelt period showed a significant increasing trend, suggesting warmer melt-season conditions that promote intensified melt but also modify the timing of runoff generation. In addition, precipitation analysis indicated an increasing tendency toward rain-on-snow events, as well as a rising frequency of rainfall occurring between maximum SWE and peak discharge. These results indicate a potential shift from predominantly snowmelt-driven to increasingly rain-driven peak flow.

How to cite: Edraki, M. and Torabi Haghighi, A.: Changes in Snowmelt Timing and Peak Flow Generation in Non-Regulated Finnish Catchments, EGU General Assembly 2026, Vienna, Austria, 3–8 May 2026, EGU26-6663, https://doi.org/10.5194/egusphere-egu26-6663, 2026.

Dry snow microstructure refers to the complex three-dimensional arrangement of ice and air at the sub-millimeter scale. This microstructure undergoes constant shape transformations known as snow metamorphism. These transformations are driven by variations in equilibrium vapor pressure at the ice-air interface, which depend on the local curvature and temperature gradient. A key descriptor of snow microstructure is the specific surface area (SSA), which is the surface area of the ice and air interfaces normalized per ice volume or mass. This metric is commonly used to quantify the average grain size in snowpack models. Moreover, SSA affects important physical properties of the snowpack, including the spectral albedo of the surface and fluid permeability. Consequently, accurately representing SSA evolution in snowpack models is crucial. Overall, snow SSA decays over time, except in specific conditions where SSA increases, such as high temperature gradients. Current descriptions of SSA in snowpack models, such as CROCUS or SNOWPACK, are not fully satisfying, especially they fail to reproduce SSA increase. It restricts the model’s ability to represent processes under high temperature gradients, as typically occurring in Arctic regions. Recent efforts have been made to derive theoretical relations between SSA and microstructural and growth parameters, but have been applied to a limited number of snow evolution experiments.

In this work, we build upon these previous studies and investigate the physical mechanisms driving SSA evolution for numerous dry snow metamorphism scenarios. We re-derive a relationship between the SSA temporal evolution, the local interface growth velocity, and the local mean curvature. To examine the implications of this relation on different snow microstructures, we acquired 20 time series of 3D X-ray tomographic images of dry snow metamorphism at high temporal and spatial resolution during cold-lab experiments. These experiments span a wide range of thermal boundary conditions and initial snow types. Using this data set, we compute local properties on the grain surface, including interface growth velocity, mean curvature, and temperature gradients. Focusing on a subset of experiments, we present SSA evolution for temperature gradients ranging from 10 to 100 K/m. In particular, we investigate the mechanisms responsible for SSA increase at high temperature gradients. We aim to disentangle the respective contributions of local microstructural shape and local temperature gradients to the overall SSA evolution. A more comprehensive understanding of the mechanisms at stake in the SSA evolution will help develop a robust representation of SSA in snowpack models.

How to cite: Dick, O., Calonne, N., and Hagenmuller, P.: Specific surface area evolution during dry snow metamorphism: insights from interface growth velocity computed on 4D tomographic data, EGU General Assembly 2026, Vienna, Austria, 3–8 May 2026, EGU26-7829, https://doi.org/10.5194/egusphere-egu26-7829, 2026.

EGU26-8497 | PICO | CR5.1

Modeling depth hoar snow and its impact on permafrost and greenhouse gas fluxes 

Hotaek Park, Kazuyoshi Suzuki, and Steven Fassnacht

Recent permafrost temperature observations show warming, likely due to the combined impacts of more snow insulation and increased air temperatures. Depth hoar refers to coarse, faceted snow crystals that form near the bottom of the snowpack due to a strong temperature gradient that induces a vapor gradient. The thin and sparse connection between depth hoar crystals results in lower snow density. The depth hoar formed in a snowpack likely enhances permafrost warming during the winter season, and the impact could be sequentially fed back to CO2 fluxes from the permafrost soil during the next growing season. However, little quantitative assessments have been made on the impact of depth hoar on permafrost temperature and the associated feedback to CO2 fluxes. To address this deficiency, we coupled the depth hoar process to the land surface model CHANGE. The model assessed the impact of the depth hoar on permafrost and the associated greenhouse gases, based on two experiments that included or excluded the depth hoar process, over the pan-Arctic scale for the period 1979–2019. The differences between the two experiments illustrated that the depth hoar induced lower snow density and the resultant warmer permafrost temperature was linked to both larger vegetation photosynthesis and decomposition of soil organic carbon. These results strongly suggest that these snow processes improvement should be included in land surface models for better simulations and future projections on the Arctic environmental changes.

How to cite: Park, H., Suzuki, K., and Fassnacht, S.: Modeling depth hoar snow and its impact on permafrost and greenhouse gas fluxes, EGU General Assembly 2026, Vienna, Austria, 3–8 May 2026, EGU26-8497, https://doi.org/10.5194/egusphere-egu26-8497, 2026.

Accurate observation of seasonal snow depth (SD) across spatial scales remains a major challenge in mid-latitude regions, particularly over complex terrain where sub-footprint heterogeneity and scale mismatch strongly affect satellite-based retrievals. Although ICESat-2 has demonstrated high potential for SD estimation in high-latitude regions, its performance in mid-latitude areas is constrained by the limited availability of snow-free digital elevation models (DEMs) with centimeter-level vertical accuracy and by the scarcity of reliable ground-based validation due to ground-track shifting.

To address these challenges, we established a multi-scale “ground-airborne-satellite” synergistic observation framework within a controlled study area in northern Xinjiang, China. To reconcile spatial scale mismatches among the different observational platforms, UAV-LiDAR data were employed as a validated intermediate-scale bridge (RMSE = 6.03 cm against in-situ measurements). Based on this framework, we conducted an error propagation analysis to quantify ICESat-2 SD uncertainty under varying terrain conditions.

Results indicate that ICESat-2 achieves excellent accuracy over flat, open terrain (slope < 5°), with an RMSE of 6.69 cm. In contrast, over complex sub-footprint terrain combining steep slopes and artificial structures, SD deviations increased substantially, ranging from -30 to +60 cm, reflecting the strong influence of sub-footprint terrain heterogeneity on SD retrieval. Across the entire study area, ICESat-2 maintains robust overall performance, yielding a total RMSE of 15.61 cm.

This study demonstrates the feasibility of accurate ICESat-2 SD retrieval in mid-latitude regions and emphasizes the critical influence of sub-footprint terrain complexity on SD uncertainty. The proposed multi-scale observational framework provides a transferable approach for interpreting satellite-derived snow products and for improving the representation of snow processes across scales.

How to cite: zhu, L. and Zheng, L.: Monitoring Snow Depth with ICESat-2 at mid-latitudes: A Synergistic Multi-Scale Framework Integrating Ground-Airborne-Satellite Observations in Northern Xinjiang, China, EGU General Assembly 2026, Vienna, Austria, 3–8 May 2026, EGU26-10265, https://doi.org/10.5194/egusphere-egu26-10265, 2026.

EGU26-11937 | PICO | CR5.1 | Highlight

Field Studies of Feldspar-Assisted Snowmaking: Effects on Snow Volume, Density, and Reflectivity 

Albert Verdaguer, Júlia Canet, and Laura Rodríguez

Under most atmospheric conditions, snowfall is triggered by the freezing of supercooled water droplets in clouds through heterogeneous nucleation on airborne particles. Among the most efficient atmospheric ice-nucleating particles, capable of inducing freezing at temperatures only a few degrees below 0 °C, are feldspar minerals. Certain feldspars are known to initiate ice nucleation very efficiently at relatively warm subzero temperatures [1], which has led to their application in snowmaking [2] and controlled freezing processes [3].

In our group, we study the properties of snow produced with the aid of feldspar ice-nucleating particles under real environmental conditions at a Snow Laboratory located in the La Molina ski resort (Spain). In this work, we present results from field studies conducted during the 2022–2023 and 2023–2024 snow seasons. The Snow Lab consists of two technically identical and independent snow guns installed 25 m apart (see Figure a). Snow was produced under varying environmental conditions. In one snow gun, only reservoir water was used, while in the second gun a feldspar powder with high ice-nucleating efficiency [4] was added to the water supply.

The volume and physical properties of the produced snow, including density and reflectivity, were systematically compared between snow generated with and without feldspar additives. Three-dimensional maps of snow volume and physical properties were constructed from a grid of field measurements. The results show that, for the same amount of water, a larger volume of snow is produced when feldspar particles are introduced. In addition, feldspar-assisted snow exhibits lower surface density and higher reflectivity, indicating a modified crystallographic evolution of ice crystals as water exits the snow gun (see an example in Figure b).

These findings not only demonstrate the potential of feldspar additives to improve the efficiency and sustainability of artificial snowmaking, but also provide valuable insight into the crystallization pathways of supercooled water droplets in the presence of mineral ice-nucleating particles in natural and engineered environments.

Figure: (a) Images of the Snow Laboratory at La Molina. (b) Example snow density maps obtained with and without the use of feldspar additives.

[1] Kanji, Z. A., Ladino, L. A., Wex, H., Boose, Y., Burkert-Kohn, M., Cziczo, D. J., and Krämer, M.: Overview of Ice Nucleating Particles, Am. Meteorol. Soc., 58, 1.1-1.33, https://doi.org/10.1175/amsmonographs-d-16-0006.1, 2017.

[2] ]. Patent: “Artificial Snow Making Method And Product For Implementing The Method “ A. Verdaguer and M. Galvin https://uspto.report/patent/app/20190323753

[3] Daily, M. I., Whale, T. F., Kilbride, P., Lamb, S., John Morris, G., Picton, H. M., and Murray, B. J.: A highly active mineral-based ice nucleating agent supports in situ cell cryopreservation in a high throughput format, J. R. Soc. Interface, 20, 20220682, https://doi.org/10.1098/rsif.2022.0682, 2023

[4] Canet, J., Rodríguez, L., Renzer, G., Alfonso, P., Bonn, M., Meister, K., Garcia-Valles, M., Verdaguer, A.: Measurement report: Ice nucleation ability of perthite feldspar powder, EGU [preprint], https://doi.org/10.5194/egusphere-2025-5014, December 2025.

How to cite: Verdaguer, A., Canet, J., and Rodríguez, L.: Field Studies of Feldspar-Assisted Snowmaking: Effects on Snow Volume, Density, and Reflectivity, EGU General Assembly 2026, Vienna, Austria, 3–8 May 2026, EGU26-11937, https://doi.org/10.5194/egusphere-egu26-11937, 2026.

EGU26-12118 | ECS | PICO | CR5.1

Daily high-resolution SnowMicroPen Snow Stratigraphy measurements at a Swiss mountain site 

Leah Gaillard Festa, Bettina Richter, Lars Mewes, Benjamin Walter, and Matthias Jaggi

Snow density and specific surface area (SSA) are key parameters controlling snowpack stability, hydrological processes, and surface energy balance. Their accurate simulation is therefore essential for applications ranging from avalanche forecasting to climate modeling. However, these parameters are often time consuming to measure and are available at coarse vertical resolution. The SnowMicroPen (SMP) allows for high-resolution measurements of penetration force from which key microstructural parameters for instance snow density and SSA can be derived using parameterizations such as the one from  [Proksch et al., 2016] or [Calonne et al., 2020]. At the Weissfluhjoch research site located in the eastern Swiss Alps at 2536 m a.s.l, daily SMP measurements have been conducted by the SLF PhD students continuously since winter 2015–2016, resulting in a unique, long-term dataset documenting the seasonal evolution of alpine snowpack at high temporal (daily) and spatial (vertical) resolution.

Here, we present and analyze ten winters (2015–2025) of daily SMP measurements, combined with complementary manual observations, i.e. bi-weekly snow profile measurements, density cutter data, snow water equivalent (SWE) profiles, IceCube SSA measurements, and automated snow and meteorological observations. Post-processing steps, including the identification and correction of sensor offset effects, were applied to ensure comparability of the derived snow properties across the full multi-year dataset. This was crucial, as the data exhibited a clear offset that showed season-dependent behavior and strongly affected derived snow properties, particularly in low density snow ranges. SMP derived snow density and SSA were then evaluated against independent reference measurements across multiple winters.

Snow density showed good agreement with cutter and SWE-derived densities, with the strongest agreement observed for SWE from the full profile and calibration-period cutter data derived by [Calonne et al., 2020]. The SMP is limited to dry-snow conditions. Larger deviations were observed for fresh snow and under warm conditions. For SSA, SMP-derived values showed systematic deviations relative to IceCube measurements, particularly at higher temperatures.
This multi year, high temporal and vertical resolution dataset provides insight into the seasonal evolution of snow stratigraphy, densification, and microstructural changes in an alpine snow. The data allows for analyzing snow layer evolution across multiple winters, and how density and SSA respond to factors such as temperature gradients and densification processes. These findings highlight the potential of the SMP to improve understanding of snow microstructure which helps to improve representations of snow in climate and snowpack models.


References
Neige Calonne, Bettina Richter, H. L¨owe, C. Cetti, J. ter Schure, A. Van Herwijnen, C. Fierz, M. Jaggi, and M. Schneebeli. The rhossa campaign: multi-resolution monitoring of the seasonal evolution of the structure and mechanical stability of an alpine snowpack. The Cryosphere, 14(6):1829–1848, 2020. doi: 10.5194/tc-14-1829-2020.

M. Proksch, N. Rutter, C. Fierz, and M. Schneebeli. Intercomparison of snow density measurements: bias, precision, and vertical resolution. The Cryosphere, 10(1):371–384, 2016. doi: 10.5194/tc-10-371-2016.

How to cite: Gaillard Festa, L., Richter, B., Mewes, L., Walter, B., and Jaggi, M.: Daily high-resolution SnowMicroPen Snow Stratigraphy measurements at a Swiss mountain site, EGU General Assembly 2026, Vienna, Austria, 3–8 May 2026, EGU26-12118, https://doi.org/10.5194/egusphere-egu26-12118, 2026.

EGU26-12232 | ECS | PICO | CR5.1

Development of a 2D high-resolution field method to measure liquid water content in snow 

Valentin Philippe, Michael Lombardo, Lars Mewes, and Benjamin Walter

The liquid water content (LWC) of snow is a key parameter controlling snowpack stability, runoff generation, and the timing of meltwater release (Vorkauf et al., 2021). With climate warming, rain-on-snow events and earlier snowmelt are becoming more frequent (Beniston et al., 2016), raising challenges for water management, hydropower production, flood warning, and avalanche forecasting. Despite its importance, accurate measurement of LWC in the field remains difficult. Existing methods, such as calorimetry, centrifugal separation, and dielectric sensors (Denoth et al., 1984), provide useful estimates but are limited by relatively high uncertainties (1-2% LWC) and low spatial resolution (> 3 cm). Hyperspectral imaging can resolve LWC variability at millimetre scale but is costly and impractical for routine fieldwork.

In recent years, the Snow Physics group at WSL/SLF has developed the SnowImager, a near-infrared (NIR) imaging instrument capable of capturing snow properties at high spatial resolution (Macfarlane et al., 2023). Using this instrument, we investigated the influence of liquid water on reflectance images by comparing the relative difference between a wet snow surface and its (re)frozen dry reference state. The obtained trend as a function of LWC is consistent with theoretical predictions based on a modified single scattering equation that accounts for both LWC and SSA. Building on this result, we developed a straightforward method to estimate LWC from reflectance images acquired with the SnowImager. Preliminary cold-lab and field tests confirmed the feasibility of this approach and demonstrated its potential to produce quantitative, high-resolution 2D maps of LWC.

We anticipate that the resulting 2D LWC field method will provide cryospheric researchers with a long-needed, practical, and precise tool to characterize the spatiotemporal dynamics of wet snow. This advancement will support improving wet snow avalanche forecasting, melt water runoff modelling, and climate impact assessments, while enhancing the SnowImager’s role as a versatile instrument for the international snow science community.


REFERENCES

Beniston, M., & Stoffel, M. (2016). Rain-on-snow events, floods and climate change in the Alps: Events may increase with warming up to 4 °C and decrease thereafter. Science of the Total Environment, 571, 228–236. https://doi.org/10.1016/j.scitotenv.2016.07.146

Denoth, A., Foglar, A., Weiland, P., Mätzler, C., Aebischer, H., Tiuri, M., & Sihvola, A. (1984). A comparative study of instruments for measuring the liquid water content of snow. Journal of Applied Physics, 56(7), 2154–2160. https://doi.org/10.1063/1.334215

Macfarlane, A. R., Dadic, R., Smith, M. M., Light, B., Nicolaus, M., Henna-Reetta, H., Webster, M., Linhardt, F., Hämmerle, S., & Schneebeli, M. (2023). Evolution of the microstructure and reflectance of the surface scattering layer on melting, level Arctic sea ice. Elementa: Science of the Anthropocene, 11(1), Article 00103. https://doi.org/10.1525/elementa.2022.00103

Vorkauf, M., Marty, C., Kahmen, A., et al. (2021). Past and future snowmelt trends in the Swiss Alps: The role of temperature and snowpack. Climatic Change, 165, Article 44. https://doi.org/10.1007/s10584-021-03027-x

How to cite: Philippe, V., Lombardo, M., Mewes, L., and Walter, B.: Development of a 2D high-resolution field method to measure liquid water content in snow, EGU General Assembly 2026, Vienna, Austria, 3–8 May 2026, EGU26-12232, https://doi.org/10.5194/egusphere-egu26-12232, 2026.

EGU26-12655 | ECS | PICO | CR5.1

Identifying key physical processes in snow compaction at different strain rates 

Mathilde Bonnetier, Lars Blatny, Guillaume Chambon, Johan Gaume, and Maurine Montagnat

The mechanical behavior of snow is complex, as it depends on a variety of physical processes occurring at different scales, from the microstructure (sintering, bond breakage, etc.) to the scale of the snowpack and entire slopes. In particular, snow mechanical behavior is highly dependent on strain rate, with a ductile-to-brittle transition occurring at strain rates of about 10-4-10-3 s-1. It is important to develop comprehensive snow mechanical models accounting for this complexity for applications such as avalanche hazard evaluation, snowpack compaction or hydrological studies.

In this work, our objective is to build a continuous numerical model in a finite strain framework, that captures the key mechanical behavior of snow in a large range of strain rates. In particular, this model should be capable of properly retrieving the various deformation patterns observed in experiments, from quasi-homogeneous deformation in the ductile regime to the emergence of unstable localization patterns, such as compaction bands or cracks, typically observed in the brittle regime.

The model is based on an elasto-viscoplastic constitutive law, inspired by the Modified Cam Clay model, which is characterized by an elliptical yield surface. Two specific effects are included in the evolution of this yield surface throughout the deformation process: a hardening effect due to the compaction of the snow, and a viscous effect due to the competition between bond breakage and sintering of the microstructure. This law has been implemented in the software Matter [1] based on the Material Point Method (MPM). This method combines Lagrangian integration points and a fixed background mesh, which allows for computations of large deformations.

We performed 2D simulations of centimeter-scale samples (15mm x 15mm), undergoing uniaxial displacement-controlled compaction, at different strain rates between 1.8x10⁻⁶ and 7.5x10⁻³ s-1. These simulations are meant to reproduce the laboratory experiments of Bernard et al. [2], which were carried out in an X-ray microtomograph, providing reconstructions of the snow microstructure and deformation throughout the compression. Detailed comparisons between numerical and experimental results will be presented to evaluate the robustness of the numerical model.

In addition, a systematic sensitivity analysis was conducted to investigate the impact of the various physical processes considered in the constitutive law on the observed compaction patterns. Of particular interest is the role of sintering on the emergence and propagation speeds of localization bands. Finally, future adaptations of the model to investigate the propagation of instabilities in heterogeneous snowpacks will be discussed.


[1] Blatny, L. and Gaume, J.: Matter (v1): An open-source MPM solver for  granular matter, Geosci. Model Dev., 18, 9149–9166, https://doi.org/10.5194/gmd-18-9149-2025, 2025.

[2] Antoine Bernard. Etude multiéchelle de la transition ductile-fragile dans la neige. Science des matériaux [cond-mat.mtrl-sci]. Université Grenoble Alpes, 2023. Français. ⟨NNT : 2023GRALI027⟩. ⟨tel-04145610⟩

How to cite: Bonnetier, M., Blatny, L., Chambon, G., Gaume, J., and Montagnat, M.: Identifying key physical processes in snow compaction at different strain rates, EGU General Assembly 2026, Vienna, Austria, 3–8 May 2026, EGU26-12655, https://doi.org/10.5194/egusphere-egu26-12655, 2026.

EGU26-12973 | ECS | PICO | CR5.1

Modeling with SCHNAPS: the Snow Cover and High-resolutioN Atmospheric Processes System  

Dylan Reynolds, Samuele Viaro, Nander Wever, and Michael Lehning

Mass and energy exchanges between the cryosphere and the atmosphere affect the state of both systems, motivating the development of two-way coupled cryosphere-atmosphere models. For snow-atmosphere models, traditional atmospheric models are coupled to multilayer physics-based snow models and run in a large-eddy mode when simulating horizontal resolutions approaching 100m. For the CRYOWRF model in particular, the atmospheric model WRF was coupled to the snow model SNOWPACK. This approach has enabled detailed studies of snow-atmosphere feedbacks such as sublimation of drifting and blowing snow. However, the high computational cost of CRYOWRF limits its application to short spatio-temporal domains at scales relevant to drifting and blowing snow (<100m). This excludes research questions such as the role that blowing snow may play as an ice nucleation particle. A prior attempt to circumvent this experimental constraint by coupling the intermediate complexity atmospheric model HICAR and the snowpack model FSM2Trans yielded promising results but showed clear shortcomings when simulating drifting and blowing snow, as well as radiation-driven spatial melt patterns. This echoes work highlighting the importance of prognostic, physics-based models of surface albedo and blowing snow schemes which include vertical advection.

These considerations lead to the development of a two-way coupling between the physics-based SNOWPACK snow model and the intermediate-complexity atmospheric model HICAR. To capture mass exchange between the snow and atmosphere, blowing and drifting snow schemes similar to those in the CRYOWRF model are implemented. The resultant 2-way coupling of SNOWPACK to HICAR yields the Snow-Cover and High-resolutioN Atmospheric Processes System (SCHNAPS). Here we detail the coupling strategy, including a revised interface for SNOWPACK. Benchmarking runs at a 50m resolution are performed, showing the fractional increase in runtime attributed to using a snow model of higher physical complexity. A preliminary validation of SCHNAPS using distributed snow height measurements is presented. The improved representation of ice physics in SNOWPACK relative to NoahMP is also shown to improve the surface energy balance over a mountain glacier. Additionally, we present a comparison of blowing and drifting snow totals between SCHNAPS and CRYOWRF, as well as HICAR coupled to the intermediate complexity snow model FSM2Trans. SCHNAPS demonstrates how different representations of snowpack processes in a coupled snow-atmosphere model impacts snowpack evolution over the course of a season. This work sets the foundation for future studies of snow-atmosphere interactions in High Mountain Asia and the Antarctic via the SnowShifts Project.

How to cite: Reynolds, D., Viaro, S., Wever, N., and Lehning, M.: Modeling with SCHNAPS: the Snow Cover and High-resolutioN Atmospheric Processes System , EGU General Assembly 2026, Vienna, Austria, 3–8 May 2026, EGU26-12973, https://doi.org/10.5194/egusphere-egu26-12973, 2026.

EGU26-13371 | ECS | PICO | CR5.1

Optical Determination of Snow Microstructure Parameters with the SnowImager instrument 

Adrian Zölly, Benjamin Walter, Lars-Hendrik Mewes, Martin Schneebeli, Henning Löwe, and Tobias Thomi

Extensive and reliable ground-truth measurements of snow properties play a crucial role in environmental science to validate models and remote-sensing products. Among the available methods, optics-based approaches offer a good compromise between measurement accuracy and sufficiently large coverage.

We present the technical details of the SnowImager as well as its data products. The SnowImager is a novel, rugged yet portable field instrument that uses near-infrared (NIR) imaging to determine physical snow properties. It enables fast, accurate, and standardized retrieval of two-dimensional specific surface area (SSA) images as well as vertically resolved density profiles, both with millimetre-scale resolution. The SnowImager can be used on vertical snow profiles as well as on the surface scattering layer of sea ice. It was jointly developed by the Swiss federal institute for snow- and avalanche research SLF and Davos Instruments AG.

Providing enhanced snow microstructure characterization, the SnowImager allows better understanding of the processes influenced by the physical properties of snow as well as of their spatial variability. Examples of such fields of use include snow physics, avalanche science and forecasting, meltwater runoff modelling and water storage management, energy balance analysis in climatic models and permafrost studies and albedo observations in systems including snow or a surface scattering layer on sea ice.

How to cite: Zölly, A., Walter, B., Mewes, L.-H., Schneebeli, M., Löwe, H., and Thomi, T.: Optical Determination of Snow Microstructure Parameters with the SnowImager instrument, EGU General Assembly 2026, Vienna, Austria, 3–8 May 2026, EGU26-13371, https://doi.org/10.5194/egusphere-egu26-13371, 2026.

EGU26-15731 | PICO | CR5.1

Assessing the effects of uncertainty in windspeed and precipitation forcings on lateral snow redistribution in mountainous basins 

Rachel Corrigan, Adrienne Marshall, Christopher B. Marsh, and Andrew W. Wood

Snow-dominated montane watersheds provide critical ecological function, water storage, and water supply for downstream population centers across the globe. Recent literature suggests that hydrologic model uncertainty in these watersheds is largely driven by meteorological forcing uncertainty. Additionally, few models simulate lateral snow transport processes such as blowing snow and avalanche, meaning that the impact of forcing uncertainty on snowpack redistribution is unknown. This pair of limitations presents a distinct challenge for modelers in both identifying accurate model structures and identifying the drivers of simulated results. In this study, we ask how uncertainty in windspeed and precipitation forcing affects modeled lateral redistribution of snow in mountain basins. We hypothesize that windspeeds and precipitation from downscaled meteorological datasets require numerical correction for effective snow redistribution, and that the magnitude of these corrections will vary across geographic regions. Analyzing the impacts of these uncertainties allows us to determine how influential windspeed and precipitation forcings are on snow transport processes and on the spatial patterns of snow accumulation and melt dynamics.

We use the Canadian Hydrologic Model (CHM), to simulate snow accumulation and melt over five water years within a set of basins in the Sierra Nevada and Rocky Mountains in the United States that have extensive airborne lidar observations from the Airborne Snow Observatory (ASO). CHM runs over a triangular mesh with a six-layer snowpack energy balance model and lateral transport through blowing snow and avalanche. We use two climate forcing datasets with different underlying resolutions to evaluate the effects of windspeed and precipitation on modeled snowpack in mountainous terrain. ERA5-Land, a 9-km resolution dataset, is selected because its global coverage is advantageous for geographic generalizability. The CONUS404 product, a 4-km resolution dynamically downscaled dataset from ERA5 over the contiguous US, is selected to test a higher resolution product over the areas of interest. In each basin, windspeed and precipitation are perturbed to assess sensitivity and the resulting snowpack distribution.

We use observed SWE, snow cover, and derived snow disappearance date from SNOTEL, snow courses, and MODSCAG to evaluate model results using a standardized benchmarking process. This enables us to decipher whether corrections to windspeed and precipitation yield similar metrics despite different underlying redistribution processes. By evaluating models across two climatically distinct regions, we can assess whether numerical precipitation and windspeed adjustments improve snow simulations, and whether they are transferable or region-specific. We present an overview of the study and results demonstrating how uncertainty in meteorologic forcing propagates into lateral snow transport processes, which can provide guidance for improving snowpack simulations across complex mountainous terrain.

How to cite: Corrigan, R., Marshall, A., Marsh, C. B., and Wood, A. W.: Assessing the effects of uncertainty in windspeed and precipitation forcings on lateral snow redistribution in mountainous basins, EGU General Assembly 2026, Vienna, Austria, 3–8 May 2026, EGU26-15731, https://doi.org/10.5194/egusphere-egu26-15731, 2026.

EGU26-16310 | ECS | PICO | CR5.1

 Long-term changes in snow cover dynamics across Germany (1950–present) 

Markus Drüke, Fabiana Castino, Grit Machui-Schwanitz, Bodo Wichura, Alice Künzel, Anett Fiedler, and Monika Rauthe

Snow cover is a highly sensitive indicator of climate change and plays a crucial role in hydrological processes, including groundwater recharge, runoff generation, and flood dynamics. Reliable long-term information on snow cover depth, extent, duration, and variability is therefore essential for climate monitoring, hydrological modeling, and impact assessments.

This study presents a comprehensive climatology of snow cover dynamics in Germany from 1950 to the present. The analysis is based on daily snow depth observations from the dense monitoring network of the Deutscher Wetterdienst (DWD) complemented by partner networks in Germany and neighbouring countries. All station data underwent rigorous quality control and homogeneity testing. The cleaned observational dataset was then interpolated onto a regular 1 × 1 km² grid using an optimal interpolation scheme that forms an important part of the operational DWD snow-melt forecast model SNOW4.

A suite of snow-related parameters was derived, including mean and maximum snow depth, snow cover duration, onset and disappearance dates, length of the main continuous winter snowpack, timing of peak snow depth, snow cover persistence, and winter snowpack stability.

The results reveal a widespread, statistically significant decline in almost all snow-related parameters across Germany over the last seven decades. The magnitude of the negative trends is strongly elevation-dependent: while lowlands and mid-elevation regions show pronounced reductions in snow cover duration and depth, high-altitude ridge and summit areas exhibit substantially weaker or – in the highest zones – partly insignificant trends.

This new high-resolution snow climatology provides a robust, consistent dataset for hydrological applications, climate change impact studies, water resource management, and the development of future climate services in the field of snow and water resources in Central Europe.

How to cite: Drüke, M., Castino, F., Machui-Schwanitz, G., Wichura, B., Künzel, A., Fiedler, A., and Rauthe, M.:  Long-term changes in snow cover dynamics across Germany (1950–present), EGU General Assembly 2026, Vienna, Austria, 3–8 May 2026, EGU26-16310, https://doi.org/10.5194/egusphere-egu26-16310, 2026.

EGU26-16509 | ECS | PICO | CR5.1

Towards a Thermodynamically Consistent Phase-Field Model for Snow Metamorphism 

Henrik Jentgens, Thomas Kaempfer, and Mathis Plapp

The microstructure of snow undergoes continuous transformation in a process known as snow metamorphism. This evolving microstructure determines meso- and macroscopic optical, mechanical and thermal properties of the snowpack. Therefore, understanding the microstructural evolution on the pore scale is essential to forecast large-scale behavior.
By modeling phase transitions between ice and water vapor, we can treat fully coupled heat and mass transport on an arbitrary microstructure, allowing us to model dry snow metamorphism under temperature gradients and isothermal conditions alike. For this, a multi-phase-field model is used, by which we implicitly track the evolving microscopic ice-air interface. Compared to previous phase field models for dry snow metamorphism, a grand potential formulation is used to simplify the simulation of ice-vapor interfaces, as well as increasing the thermodynamic consistency. Thereby, we can treat various cross couplings between heat and mass transport like the Soret effect as well as surface diffusion and crystal growth dynamics. In this new model, near isothermal snow metamorphism is interpreted as sintering of ice grains. The thermodynamic properties of ice are modeled using CALPHAD data and humid air is modeled as a mixture of ideal gases.
We present our novel phase field model and validate it against semi-analytical solutions of the Stefan-problem and recently published experiments on simple geometries.

How to cite: Jentgens, H., Kaempfer, T., and Plapp, M.: Towards a Thermodynamically Consistent Phase-Field Model for Snow Metamorphism, EGU General Assembly 2026, Vienna, Austria, 3–8 May 2026, EGU26-16509, https://doi.org/10.5194/egusphere-egu26-16509, 2026.

EGU26-17234 | PICO | CR5.1

A new cold ring wind tunnel facility for studying airborne snow metamorphism 

Benjamin Walter, Valentin Philippe, and Sonja Wahl

Recent studies suggests that drifting snow particles undergo snow metamorphism while being transported by wind, involving concurrent sublimation and vapor deposition, affecting particle size, shape, specific surface area, and isotopic composition [Walter et al., 2024; Wahl et al., 2024]. This newly identified process of airborne snow metamorphism (ASM) is particularly relevant in polar regions, where snow particles in saltation layers may be transported over long distances and durations before final deposition. As a result, this process strongly influences the microstructure of surface snow, with large scale implications for albedo and climate signals. Experimental investigations of ASM under laboratory conditions has so far been constrained by the lack of facilities providing well controlled boundary conditions.

Based on our experience with an exisiting but limitied ring wind tunnel (RWT), we developed a new wind tunnel in a cold laboratory designed to study airborne snow metamorphism under controlled flow and thermal conditions. The obround closed-circuit wind tunnel enables particle transport over long durations while maintaining stable boundary conditions. The facility is installed in a cold laboratory at the WSL Institute for Snow and Avalanche Research SLF, about 2m x 3m x 0.5m (W x L x H) in dimensions, and includes enhanced thermal control, a revised wind turbine integration reducing heating of the air, and snow surface temperature control, allowing independent regulation of air and surface temperatures.

We present a first comprehensive characterization of the flow field, including velocity distributions, spatial flow homogeneity, and turbulence properties across a range of wind speeds relevant for snow saltation and suspension. We further present a characterization of the thermal performance of the RWT, demonstrating improved temperature stability of the air and snow surface. The new ring wind tunnel provides a unique experimental facility for studying aerodynamic and thermodynamic impacts on snow particle evolution during snow transport. Generally, the new RWT facility additionally allows for studying a wide range of particle-flow and flow-surface (ice, snow, or water) interaction processes in turbulent cryospheric environments.


Walter B, Weigel H, Wahl S, Löwe H (2024) Wind tunnel experiments to quantify the effect of aeolian snow transport on the surface snow microstructure, The Cryosphere, 18, 3633-3652, https://doi.org/10.5194/tc-18-3633-2024

Wahl, S., Walter, B., Aemisegger, F., Bianchi, L., & Lehning, M. (2024). Identifying airborne snow metamorphism with stable water isotopes. Cryosphere, 18(9), 4493-4515. https://doi.org/10.5194/tc-18-4493-2024


How to cite: Walter, B., Philippe, V., and Wahl, S.: A new cold ring wind tunnel facility for studying airborne snow metamorphism, EGU General Assembly 2026, Vienna, Austria, 3–8 May 2026, EGU26-17234, https://doi.org/10.5194/egusphere-egu26-17234, 2026.

EGU26-18027 | PICO | CR5.1

Multi-scale snowpack modeling in the Pyrenees using the Canadian Hydrological Model 

María Courard, Christopher Marsh, Isabelle Gouttevin, Hugo Merzisen, J. Ignacio López Moreno, César Deschamps-Berger, Eñaut Izaguirre, and Jesús Revuelto

In mountain ecosystems, snow is a critical resource that regulates hydrological processes, ecosystem dynamics, economical activities and downstream water availability. Accurately estimating snow at these highly heterogeneus environments remains a challenge, due to the strong spatial and temporal variability. The combination of snowdrift-permitting models and snowpack remote sensing observations can improve the accuracy of snowpack estimations across scales. The Canadian Hydrological Model (CHM) is a novel snow modeling framework that explicitly represents lateral snow transport processes over an irregular mesh. This study analyzes the impact of modelling spatial scales over three domains in the Pyrenees between 2019 and 2025 using CHM: the Izas Experimental Cathment (~10 km²), a portion of the Tena Valley (~100 km²), and a larger section of the mountain range (~1200 km²) using a snowdrift permitting model. Each domain is modelled using a different horizontal resolution, relative to the domain area, and driven by downscaled meteorological forcings. We analyze several snowpack properties, including snow covered area and snow depth, across the spatial scales, using point-scale snow survey stations, UAV-derived snow depth distribution maps at the catchment scale, Pléiades-derived snow depth maps at the valley scale and Sentinel 2 imagery at the mountain range scale. Error statistics, spatial efficiency metrics and scale breaks derived from semi variograms are used to evaluate the model performance. Preliminary results show that higher resolution simulations have a better representation of snow depth variograms and their scale breaks, and lower mean snow depth biases over the Izas catchment. However, snow depth is overestimated during the accumulation period and underestimated during the ablation season, and differences between the observed and simulated spatial snow distribution can be seen. This study improves our understanding of snowpack dynamics across spatial scales and of the horizontal resolution required for accurate snow simulations. Finally, this study enables the development of a remote sensing–based monitoring framework for the Pyrenees to improve snowpack simulation, which open new insights and allow more reliable forecasts.

How to cite: Courard, M., Marsh, C., Gouttevin, I., Merzisen, H., López Moreno, J. I., Deschamps-Berger, C., Izaguirre, E., and Revuelto, J.: Multi-scale snowpack modeling in the Pyrenees using the Canadian Hydrological Model, EGU General Assembly 2026, Vienna, Austria, 3–8 May 2026, EGU26-18027, https://doi.org/10.5194/egusphere-egu26-18027, 2026.

EGU26-18196 | PICO | CR5.1

Interannual variability of the arctic snowpack: Results from long-term observations at Ny-Ålesund, Svalbard 

Hans-Werner Jacobi, Catherine Larose, and Jean-Pierre Dedieu

The Arctic is undergoing rapid environmental changes, with profound implications for snowpack dynamics, hydrology, and regional climate feedbacks. Ny-Ålesund, Svalbard (79°N), serves as an important site for documenting these changes due to its unique geographic location in the Arctic and its year-round research infrastructure. Here, we present the results of a comprehensive snowpack monitoring at Ny-Ålesund during five consecutive winter seasons (2018–2023).

Manual in-situ measurements of snow stratigraphy—including layer thickness, density, temperature, and hardness—were performed in weekly snow pits. While the region is traditionally considered as dominated by cold, shallow, and wind-affected "tundra” snow, recent winters exhibit increasing occurrences of snow characteristics not attributed to tundra snow, such as melt-freeze layers, internal ice accumulation, or wet snow. These anomalies are linked to rising temperatures, increased precipitation, and episodic winter rainfall events, which contrast sharply with the historical tundra snow regime. While the winter of 2019–2020 displayed classic tundra snow conditions, others winter seasons showed dominant maritime snow features. The statistical analysis of the observed physical snow parameters reveals a high variability of the snowpack characteristics. Such variability underscores the sensitivity of Arctic snowpack to local changes and highlights the challenges in predicting seasonal snowpack evolution. Simulating this enhanced variability will likely require snow models with enhanced capabilities.

This research emphasizes the importance of long-term, high-resolution observations in the remote Arctic. As the Arctic continues to warm, understanding these dynamics is essential for assessing broader environmental impacts, from permafrost degradation to shifts in regional water and biogeochemical cycles. The results call for sustained monitoring efforts and adaptive research strategies to address the evolving challenges posed by climate change in the Arctic.

How to cite: Jacobi, H.-W., Larose, C., and Dedieu, J.-P.: Interannual variability of the arctic snowpack: Results from long-term observations at Ny-Ålesund, Svalbard, EGU General Assembly 2026, Vienna, Austria, 3–8 May 2026, EGU26-18196, https://doi.org/10.5194/egusphere-egu26-18196, 2026.

EGU26-18218 | PICO | CR5.1

Spatial and Temporal Variabilities of Solar and Longwave Radiation Fluxes below a Coniferous Forest in the French Alps 

Jean-Emmanuel Sicart, Clare webster, Yves Lejeune, Richard Essery, and Nick Rutter

At high altitudes and latitudes, snow has a large influence on hydrological processes. Large fractions of these regions are covered by forests, which have a strong influence on snow accumulation and melting processes. Trees absorb a large part of the incoming shortwave radiation and this heat load is mostly dissipated as longwave radiation. Trees shelter the snow surface from wind, so sub-canopy snowmelt depends mainly on the radiative fluxes: vegetation attenuates the transmission of shortwave radiation but enhances longwave irradiance to the surface. 13 pyranometers and 11 pyrgeometers were deployed on the snow surface below a coniferous forest at the CEN-MeteoFrance Col de Porte station in the French Alps (1325m asl) during the winters 2016-17 and 2017-18 in order to investigate spatial and temporal variabilities of solar and infrared irradiances in different meteorological conditions. Sky view factors measured with hemispherical photographs at each radiometer location ranged from 1.5 to 3.5. In clear sky conditions, the attenuation of solar radiation by the canopy reached 96% and its spatial variability exceeded 100 W.m-2. Longwave irradiance varied by 30 W.m-2 from dense canopy to gap areas. In overcast conditions, the spatial variabilities of solar and infrared irradiances were reduced and remained closely related to the sky view factor. Comparing the measurements at different radiometer locations, we investigated the dependence of surface net radiation on the overlying canopy density. Of particular interest were the atmospheric conditions that favor an offset between shortwave energy attenuation and longwave irradiance enhancement by the canopy, such that net radiation does not decrease with increasing forest density (situations of “radiation paradox”). It was found that cloud effects on the shortwave transmissivity and longwave emissivity factors of the canopy have a strong impact on the subcanopy radiation fluxes: canopy largely counteracts the effects of clouds on the incoming radiation fluxes. As a result, variations in net surface radiation due to forest cover appear to depend largely on meteorological conditions: “radiative paradox” conditions were more frequent during the winter of 2017 than in 2018, which was cloudier and colder. As a result, variations in surface net surface radiation by canopy cover appear to be largely dependent on weather conditions: “radiative paradox” conditions were more prevalent during the winter of 2017 than in 2018, which was cloudier and colder.

How to cite: Sicart, J.-E., webster, C., Lejeune, Y., Essery, R., and Rutter, N.: Spatial and Temporal Variabilities of Solar and Longwave Radiation Fluxes below a Coniferous Forest in the French Alps, EGU General Assembly 2026, Vienna, Austria, 3–8 May 2026, EGU26-18218, https://doi.org/10.5194/egusphere-egu26-18218, 2026.

Snow is a major component of the hydrological cycle in cold environments. Snowpacks not only directly contribute to the local water cycle through snowmelt in late winter, but also constantly interact with local atmospheric water vapor through sublimation and vapor exchange throughout the winter. However, the widely used ‘traditional’ snow water isotope sampling method is destructive and temporally discrete, which limits the ability to capture the highly dynamic snow-liquid-vapor process within snowpacks. Therefore, at the Julinia site in Finland, we conducted the first winter field deployment of an innovative in-situ water isotope probe (WIP) system to sample cold and dry water vapor from snowpack layers and ambient air, where WIP was originally designed for use in trees and soils to study tree water uptake during the growing season. Water vapor sampled in-situ based on the direct vapor equilibrium method was continuously measured by a laser spectroscopy isotope analyzer (Picarro). Combined with ‘traditionally’ sampled water isotopes from event-based snowfall and snowpack layers, the temporal variation of δ18O and δ2H in different snowpack layers formed by different snowfall events illustrate the isotopic process of snowpack compaction, vapor exchange within the snowpack, and snowmelt. This approach provides an opportunity to better understand the long-overlooked isotopic difference between snowfall, snowpack, and snowmelt water, which can lead to non-negligible bias in partitioning ‘blue water’ and ‘green water’ in snow-dominated regions when using the stable water isotope techniques.

How to cite: Chen, Z., Marttila, H., and Ala-Aho, P.: In-situ high-resolution stable water isotope measurements of snowpacks in cold environments: opportunities for better understanding dynamic snowpack processes, EGU General Assembly 2026, Vienna, Austria, 3–8 May 2026, EGU26-18697, https://doi.org/10.5194/egusphere-egu26-18697, 2026.

EGU26-20575 | ECS | PICO | CR5.1

Climatic controls on global snow surface sublimation based on ERA5-Land 

Adrià Fontrodona-Bach, Harsh Beria, Denis Groshev, Thomas E Shaw, Catriona Fyffe, Isabella Anglin, Michael Lehning, and Francesca Pellicciotti

Sublimation of snow represents an often important but poorly constrained component of the hydrological cycle, especially at the global scale. Studies that estimate snow sublimation at point or catchment scales demonstrate a range of uncertainties in the contribution of sublimation to total winter snowfall, ranging from 5% to 90%. Although it is well established that dry, windy and clear-sky conditions favor snow sublimation, a modern, global-scale assessment of the climatic controls and regions where sublimation occurs and is relevant for snowpack evolution, glacier mass balance and water resources is lacking. Existing global efforts are limited by coarse resolution (~250 km) reanalysis data, leaving a critical gap in our understanding of sublimation’s contribution to the water balance across climates and regions. Here we present a global analysis of snow surface sublimation hotspots, using ERA5-Land reanalysis at 0.1° (~10 km) resolution from 1980 to the present. Comparisons with sublimation observations from eddy-covariance flux towers demonstrate that ERA5-Land underestimates sublimation rates, but performs favorably compared to estimates from other reanalysis (GLDAS, GLEAM, MERRA-2) products. Comparisons with station observations also demonstrate that ERA5-Land correctly reproduces global patterns of seasonal snow variability. 

Preliminary results show clear latitudinal, elevation and climatic controls on global surface sublimation. Hotspots of snow sublimation (>80 mm/year) are identified in the higher elevations of South America, North America and Asia, with contributions to total snow ablation ranging mostly from 10 to 20%. Hotspots of lower total annual surface sublimation (30 to 60 mm/year) lie in latitudes between 40 and 60 °N in dry climates, where the contributions to total snow ablation mostly range from 20% to 60%. The strongest surface sublimation hotspots in absolute and relative terms are identified in parts of Greenland and coastal Antarctica, where uncertainty is high as no sublimation observations from flux towers are available to compare with. We also investigate historical (1980-2025) changes in sublimation fluxes in response to warming and changing snow cover patterns. 

Our results highlight regions where surface sublimation may be a significant component of the hydrological cycle, with implications for water resources, glacier mass balance and snow–atmosphere interactions. Important uncertainties remain, particularly in complex mountain regions where the resolution of ERA5-Land data may not fully capture sublimation processes such as boundary layer warming and drying. Furthermore, drifting and blowing snow sublimation are not resolved in ERA5-Land. Future efforts should refine these global estimates by using higher-resolution simulations and improved representations of snow–atmosphere interactions to identify sublimation hotspots over complex terrain.

How to cite: Fontrodona-Bach, A., Beria, H., Groshev, D., Shaw, T. E., Fyffe, C., Anglin, I., Lehning, M., and Pellicciotti, F.: Climatic controls on global snow surface sublimation based on ERA5-Land, EGU General Assembly 2026, Vienna, Austria, 3–8 May 2026, EGU26-20575, https://doi.org/10.5194/egusphere-egu26-20575, 2026.

EGU26-22324 | ECS | PICO | CR5.1

How snow, vegetation and soil properties influence soil temperatures in a permafrost environment (Trail Valley Creek, Western Canadian Arctic) 

Ephraim Erkens, Inge Gruenberg, Heidrun Matthes, Nick Rutter, and Julia Boike

Warming ground temperatures in the Arctic raise the need to forecast permafrost thaw. Seasonal snow cover is a crucial factor for ground temperatures as it can have a warming or cooling effect on the underlying soil, depending on snow cover timing and its physical properties. Vegetation and topography modulate snow distribution and affect the snow thermal insulation. However, the formation processes and resulting properties of Arctic snowpacks are difficult to represent in snow models and in-situ data is sparse. Further understanding of the interactions between snow, vegetation and permafrost and the deduction of empirical relationships could support the parametrization of snow in permafrost modeling.

We study how the ground thermal regime is influenced by the interplay of snow, vegetation, topography and climatic conditions. In particular, we evaluate the effect of snow density variation on the ground thermal regime. We present a novel dataset that combines air, surface and soil temperature, as well as soil moisture time series recorded from September 2024 to August 2025 with end-of-season snow depth distribution and high-resolution vertical snow density profiles. Temperatures and soil moisture were monitored using 60 TOMST TMS-4 loggers, distributed across different vegetation types and topographic features in the taiga-tundra ecotone (Trail Valley Creek, Northwest Territories, Canada). Snow density profiles were measured in March 2025 next to the TOMST loggers using a SnowMicroPen.

Our data shows several characteristic snowpack types which do not only differ in depth but also have a different layering structure. Low density snowpacks with high depth hoar fractions are most prominent in forested areas that are shielded from the wind, whereas leeward slopes can accumulate thick, high-density wind slab, regardless of vegetation. While snow depth is clearly one of the major drivers of soil temperature, the role of snow density is more complex.

Categorization of different tundra vegetation types with characteristic snow conditions and specific impact on permafrost vulnerability helps to refine permafrost models and constrain predictions of permafrost thaw.

How to cite: Erkens, E., Gruenberg, I., Matthes, H., Rutter, N., and Boike, J.: How snow, vegetation and soil properties influence soil temperatures in a permafrost environment (Trail Valley Creek, Western Canadian Arctic), EGU General Assembly 2026, Vienna, Austria, 3–8 May 2026, EGU26-22324, https://doi.org/10.5194/egusphere-egu26-22324, 2026.

In an era characterized by urban densification and increasing pressures on urban space, along with the costs and availability of construction materials, the optimal design of infrastructure has become a critical focus. Furthermore, cold climate regions are experiencing the impacts of climate change, which manifest in altered precipitation patterns, resulting in more extreme storm events, including rain-on-snow events and increased freeze-thaw cycles. According to Maurin et al. (2024), rain-on-snow events have been identified as the leading cause of the highest observed runoff from green roofs, presenting significant challenges for urban areas in preventing flooding.

The present study aims to enhance understanding of the effects of climate variability and change on the hydrological performance of nature-based infrastructure, with a particular emphasis on green roofs during winter, especially in relation to snow and rain-on-snow events in cold climate regions. The goal is to develop guidelines that assist stakeholders in optimizing the design of nature-based solutions (NBS) infrastructure, ensuring they are resilient over time and effectively manage stormwater in a changing climate. This initiative addresses the current gap in research, particularly the lack of location-specific regulations that incorporate future climate projections for stormwater infrastructure design, giving decision-makers accurate information regarding the requirements for long-term and robust infrastructure design.

The study uses models of six different green and grey roof configurations developed in the SFI Klima 2050 project, calibrated for the winter season. These models utilize precipitation and temperature time series originated from high-resolution, convection-permitting climate models with hourly resolution and a 3x3 km gridded projection. Simulations for winter event separation (Melt, Rain and Rain-on-snow) are conducted following the methodology outlined in Maurin et al. (2024).

Results indicate that the changing climate will influence stormwater management strategies during winter, including higher runoffs of urban infrastructure due to rain-on-snow event with effects unevenly distributed across Norway (9 different cities studied). This pinpoints the need to combine the local future climate with hydrological models able to capture rain-on-snow events when planning and designing stormwater managements solutions that must remain effective under future climate scenarios. The findings have laid the groundwork for local guidelines aimed at ensuring climate-resilient design of nature-based infrastructure.

Maurin, N., Abdalla, E.H.M., Muthanna, T.M., Sivertsen, E., 2024. Understanding the hydrological performance of green and grey roofs during winter in cold climate regions. Science of The Total Environment 945, 174132. https://doi.org/10.1016/j.scitotenv.2024.174132

How to cite: Maurin, N., Abdalla, E. M. H., Landgren, O., and Sivertsen, E.: Assessing green roof hydrological performance during winter and rain-on-snow events under climate variability and change using high-resolution convection-permitting climate models, EGU General Assembly 2026, Vienna, Austria, 3–8 May 2026, EGU26-22740, https://doi.org/10.5194/egusphere-egu26-22740, 2026.

EGU26-24 | Orals | AS1.12

Comparison of AQPI and NEXRAD Radar-Estimated Rain Rates during Two Extreme Atmospheric River Events over the Northern San Francisco Bay Area 

Jonathan Rutz, Ricardo Vilela, Matthew Steen, Venkatachalam Chandrasekar, and Sounak Biswas

The Advanced Quantitative Precipitation Information (AQPI) project has installed a network of strategically located X-band radars across the Greater San Francisco Bay Area. These radars complement the existing NEXRAD S-band network by filling horizontal and vertical gaps in coverage, and by operating at a very high spatial and temporal resolution, providing more detailed rainfall information across the region (Cifelli et al. 2024). 


This presentation will focus on AQPI performance in terms of X-band radar-estimated rain rates compared to those of the NEXRAD S-band network and local rain gauges during two cases of heavy precipitation. The first case, 24-25 Oct 2021, was driven by a historically strong early-season atmospheric river, which produced several periods of very high precipitation rates and storm-total precipitation records across the North Bay region. The second case, 21-24 Nov 2024, featured a long-duration atmospheric river event across the same area, which produced a 1000-year rain event in some isolated locales.


In both cases, AQPI X-band rain estimates (both hourly rates and storm totals) matched rain gauge observations much more closely than those of the NEXRAD S-band network at most locations. This X-band advantage is greatest near the X-band location and decreases with distance from the radar, owing to radar beam attenuation. The X-band advantage is also greater during more intense rain rates. Hence, these additional radars greatly complement the existing network by providing higher-quality rain estimates in the densely-populated areas where they are located, with benefits towards any number of meteorological and hydrological applications. Future work includes a larger-scale statistical analysis of AQPI system performance across the Bay Area during subsequent winter seasons. More information is available at: https://cw3e.ucsd.edu/aqpi/. 

How to cite: Rutz, J., Vilela, R., Steen, M., Chandrasekar, V., and Biswas, S.: Comparison of AQPI and NEXRAD Radar-Estimated Rain Rates during Two Extreme Atmospheric River Events over the Northern San Francisco Bay Area, EGU General Assembly 2026, Vienna, Austria, 3–8 May 2026, EGU26-24, https://doi.org/10.5194/egusphere-egu26-24, 2026.

EGU26-910 | ECS | Orals | AS1.12

Impact of Tibetan plateau warming amplification on the interannual variations in East Asia Summer precipitation 

Xinhai Chen, Xiaojing Jia, Wei Dong, Hao Ma, Jingwen Ge, and Qifeng Qian

The amplified warming on the Tibetan Plateau (TA) is a distinctive characteristic of global climate change, leading to various climate responses with far-reaching implications. This study investigates the influence of interannual variation of TA on summer precipitation over East Asia (Pre_EA) using observational data and a Linear Baroclinic Model (LBM). When TA exceeds the Northern Hemisphere average, summer precipitation in the Yangtze River Valley significantly decreases, while it increases in North China and South China, resulting in a tripole Pre_EA pattern. Notably, the relationship between TA and Pre_EA is independent of the El Niño-Southern Oscillation (ENSO) and explains more variance in Pre_EA than ENSO. Our analysis reveals that TA enhances the tripole Pre_EA pattern by modulating moisture transport and vertical motion in the East Asia-North Pacific regions. Specifically, positive TA is linked to significant local tropospheric warming, which intensifies and eastward expands the South Asian High, creating a double-gyre meridional circulation over East Asia. Additionally, positive TA induces an eastward-propagating wave, reinforcing a midlatitude anomalous high-pressure belt over East Asia and the western North Pacific regions. These circulation changes weaken the East Asian subtropical jet, form a notable double jet configuration, and promote subsidence over mid-latitude East Asia. Moreover, anomalously warm sea surface temperatures in the Northwestern Pacific reinforce the TA-Pre_EA relationship by contributing to the mid-latitude East Asia-North Pacific high-pressure belt. Our LBM model experiments support these findings. Our study provides an in-depth understanding of the physical processes influencing summer precipitation variability in East Asia.

How to cite: Chen, X., Jia, X., Dong, W., Ma, H., Ge, J., and Qian, Q.: Impact of Tibetan plateau warming amplification on the interannual variations in East Asia Summer precipitation, EGU General Assembly 2026, Vienna, Austria, 3–8 May 2026, EGU26-910, https://doi.org/10.5194/egusphere-egu26-910, 2026.

EGU26-1715 | ECS | Posters on site | AS1.12

Experimental identification of receiver-side thermal effects on RSL baseline fluctuations in CML-based precipitation measurements 

Xin Zheng, Junwei Zhou, Dianguang Ma, Youwei Qin, and Jianyu Fu

Commercial microwave links (CMLs) are increasingly used as opportunistic sensors for precipitation monitoring, providing high spatiotemporal coverage in urban and regional environments. However, the accuracy of attenuation-based rainfall retrieval from CMLs is strongly affected by systematic fluctuations in the received signal level (RSL) baseline, which often exhibits a pronounced 24-hour periodicity even under dry conditions. The physical origin of this periodic baseline variation remains unclear and represents an important source of uncertainty in precipitation measurements.

In this study, we conduct a controlled outdoor experiment to identify the dominant driver of RSL baseline fluctuations. Targeted thermal perturbations were applied to the outdoor units (ODUs) of operational CMLs, while RSL, receiver-side ODU internal temperature, and ambient air temperature were synchronously recorded. By actively modifying the thermal behavior of the receiver ODUs, we demonstrate that the periodic variation of receiver ODU internal temperature is the primary cause of the RSL baseline fluctuation. When the internal temperature periodicity was disrupted, the corresponding RSL periodicity was significantly weakened, and the apparent correlation between RSL and air temperature disappeared. In contrast, heating applied only to transmitter-side ODUs or insufficient thermal perturbation produced no observable effect.

These findings provide the first experimental evidence that receiver-side instrumental thermal dynamics, rather than atmospheric variability along the propagation path, govern the periodic RSL baseline fluctuation in CML observations. The results identify a key source of bias in CML-based precipitation retrieval and offer a physical basis for improving baseline correction and uncertainty characterization in opportunistic rainfall measurements.

How to cite: Zheng, X., Zhou, J., Ma, D., Qin, Y., and Fu, J.: Experimental identification of receiver-side thermal effects on RSL baseline fluctuations in CML-based precipitation measurements, EGU General Assembly 2026, Vienna, Austria, 3–8 May 2026, EGU26-1715, https://doi.org/10.5194/egusphere-egu26-1715, 2026.

EGU26-1818 | ECS | Posters on site | AS1.12

High-resolution observation-based precipitation life cycle analysis of heavy rainfall events in the southeastern Alpine forelands 

Stephanie Haas, Andreas Kvas, and Jürgen Fuchsberger

The summer months in southeastern Austria are often characterized by severe rainfall from heavy thunderstorms. These events typically unfold rather quickly, with only a few minutes to hours between the formation of the first clouds and the end of the event. Though the intense precipitation during these thunderstorms often results in severe damage, it is still difficult to predict. Deepening our knowledge about the life cycle of such events, from formation to dissipation, is therefore crucial to increasing natural hazard resilience and improving forecasting skills.

Here, we use high-resolution observational data provided by the WegenerNet 3D Open-Air Laboratory for Climate Change Research (WEGN3D Open-Air Lab) located around Feldbach, Austria, to investigate the life cycle of 94 heavy rainfall events. With its 156 ground stations, one X-band radar, two radiometers, and six Global Navigation Satellite System (GNSS) stations, the WEGN3D Open-Air Lab provides high-resolution observations of key atmospheric parameters. In the study, we track 10 atmospheric parameters that are closely linked to heavy precipitation. This gives us insights into characteristic features of the different stages of the precipitation life cycle of small-scale rainfall events.

Starting with the 8 h before the event (i.e., formation stage), we identify distinct features and patterns in air temperature, integrated water vapor, liquid water path, and wind speed that are directly linked to the arrival of the first storm clouds. In the hours of the actual rainfall event (i.e., precipitation stage), the highly localized character of these events is clearly visible in the spatial variability of temperature, liquid water path, and cloud cover. The precipitation triggers a localized cooling effect, which is reflected in a strong correlation between precipitation amount and 2 m air temperature during the event. Subsequently, the integrated water vapor development during the event is also driven by the localized rainfall. In the 16 h after the event (i.e., dissipation stage), we observe the slow return of the atmospheric parameters to pre-event conditions.

The findings of our study are well in-line with the expected physical processes connected to small-scale rainfall extremes. Furthermore, we also demonstrate the WEGN3D Open-Air Lab’s skill to monitor heavy rainfall events and their characteristics in high spatial and temporal resolution. This illustrates the dataset’s high potential for applications in the improvement and verification of weather and climate models.

How to cite: Haas, S., Kvas, A., and Fuchsberger, J.: High-resolution observation-based precipitation life cycle analysis of heavy rainfall events in the southeastern Alpine forelands, EGU General Assembly 2026, Vienna, Austria, 3–8 May 2026, EGU26-1818, https://doi.org/10.5194/egusphere-egu26-1818, 2026.

Satellite precipitation retrieval accuracy assessment requires reliable ground validation, yet conventional approaches using rain gauges as "truth" neglect representativeness errors inherent in point-to-area approximations. This study quantifies these errors using 7,253 rain  gauges from the China Meteorological Administration's high-density gauge network during 2020-2024 in Jianghuai monsoon region, enabling a fundamental reassessment of the Integrated Multi-satellite Retrievals for GPM (IMERG) precipitation data performance. We established that ≥16 gauges per 0.2° grid (~4/100 km²) are required for reliable area-averaged precipitation estimates, with optimal sampling protocols minimizing random errors. Analysis reveals dual dependence of gauge errors on density (n) and intensity (RR): standard deviation decays exponentially with increasing n (Root Mean Square Error, RMSE ∝ ae⁻bn), while rising with RR for fixed n. Parameterized relationships enable error quantification across density gradients. Direct IMERG-gauge comparisons show seasonal mean differences of 1.65, 3.35, 1.84, and 1.26 mm h⁻¹ (spring–winter), exhibiting significant negative spatial correlation with gauge density (r = -0.33, p = 3.88×10⁻44), confirming network scarcity as primary discrepancy driver—not inherent retrieval deficiencies. Error decomposition using gauge uncertainties yielded bounded IMERG retrieval errors (RMSEᴮ_min/max). Applying the same framework to Kling-Gupta efficiency (KGE) revealed similarly improved skill after removing gauge-induced uncertainties, reinforcing the internal consistency of our analysis. Summer RMSEᴮ_min was substantially lower than RMSEᴮ_max and conventional RMSE, demonstrating that opposing signs of representativeness and retrieval errors cause severe IMERG performance underestimation—particularly in Shandong/Dabie mountains. Crucially, incorporating gauge errors reduced significant discrepancy frequency by 16%/6%/16%/17% across seasons, proving that traditional methods overestimate IMERG-gauge deviation occurrence by 6-17%. This establishes gauge density as critical accuracy determinant, provides robust error-quantification framework, and reveals that terrain-complexity misinterpretations arise when disregarding representativeness errors, with implications for global satellite precipitation validation.

How to cite: Li, Y. and Li, R.: Refine the Uncertainty of GPM IMERG Precipitation Product Accounting for the Inherent Error from Rain Gauges Estimations, EGU General Assembly 2026, Vienna, Austria, 3–8 May 2026, EGU26-1979, https://doi.org/10.5194/egusphere-egu26-1979, 2026.

Under global climate change, extreme precipitation events are becoming more frequent and intense, posing increasing risks to hydrological and drought-related disasters. Hunan Province in southern China is particularly vulnerable, yet the long-term spatiotemporal evolution of extreme precipitation remains insufficiently understood. This study investigates the characteristics and driving features of extreme precipitation in Hunan Province to support disaster prevention and water resource management. Daily precipitation records from 97 national meteorological stations spanning 1961–2024 were analyzed using a suite of extreme precipitation indices defined by the WMO Expert Team on Climate Change Detection and Indices (ETCCDI). Heavy rainfall was characterized using the R50 threshold based on regional precipitation classification standards. Empirical Orthogonal Function (EOF) analysis, the Mann–Kendall trend and abrupt change tests, and Morlet wavelet analysis were applied to examine spatial patterns, temporal variability, abrupt shifts, and periodic signals. The results indicate an overall drying tendency in extreme precipitation across Hunan Province. Consecutive dry days (CDD) show a significant increasing trend, while consecutive wet days (CWD) decrease significantly. Although 75.3% of stations exhibit declining annual total precipitation (PRCPTOT), 66% show increasing extreme heavy precipitation (R99P), suggesting reduced mean precipitation but intensified extremes. Spatially, extreme precipitation exhibits a hierarchical structure consisting of large-scale regional coherence, topography-modulated counter-phase patterns, and localized fragmented distributions. Abrupt changes are concentrated mainly before the 1980s, particularly during the 1960s, with fewer change points detected after 1990, primarily in central Hunan. Significant periodicities are identified at 2.07–2.25 years, ~31 years, and ~60.3 years, corresponding to ENSO-related short-term variability, medium-to-long-term oscillations, and AMO-related ultra-long-term signals, respectively. Overall, extreme precipitation in Hunan Province is characterized by increasing aridity, heightened local extreme rainfall risks, and multi-scale climate modulation. These findings advance scientific understanding of extreme precipitation evolution in complex terrain and provide critical insights for improving regional forecasting and early warning systems. The contrasting trends—increasing drought risk alongside intensified extreme rainfall—highlight the urgent need for integrated adaptation strategies that enhance water resource management resilience and infrastructure preparedness under climate change.

How to cite: Li, Q. and Liu, L.: Spatiotemporal distribution and variation characteristics of extreme precipitation of Hunan Province, EGU General Assembly 2026, Vienna, Austria, 3–8 May 2026, EGU26-2390, https://doi.org/10.5194/egusphere-egu26-2390, 2026.

EGU26-2633 | Orals | AS1.12

PUnet-CDR: A Global High-Resolution Precipitation Climate Data Record for Hydroclimate and Drought Applications 

Phu Nguyen, Vu Dao, Tu Ung, Amir AghaKouchak, Kuolin Hsu, and Soroosh Sorooshian

Reliable long-term precipitation records are essential for hydrologic forecasting, climate analysis, and drought monitoring, yet existing satellite-based products face trade-offs among resolution, temporal frequency, and historical coverage. High-resolution datasets such as IMERG, CMORPH, and PERSIANN provide detailed precipitation estimates but are limited to recent decades, while long-term climate products such as GPCP and CMAP span multiple decades at coarse resolution. These constraints limit the characterization of sub-daily variability, extremes, and long-term hydroclimatic trends, particularly in data-sparse regions.

We present the PERSIANN-UNet Climate Data Record (PUnet-CDR), a global deep learning–based system that reconstructs high-resolution precipitation Climate Data Records (CDRs) from 1980 to 2025. Built upon the PUnet algorithm, PUnet-CDR integrates geostationary infrared (IR) satellite observations with monthly precipitation climatology to produce 3-hourly global precipitation estimates at 0.04° (~4 km) resolution. The system leverages GridSat-B1 (1980–February 2000) and CPC-4km (March 2000–2025) IR datasets standardized to a common grid.

Long-term consistency is achieved using a monthly GPCP-based bias correction, in which coarse-scale correction factors are transferred to high-resolution outputs. In addition, GPCP-corrected NASA MERRA-2 precipitation is used to fill gaps in the IR record, yielding a spatially and temporally complete precipitation CDR. Unlike regional mosaicking approaches, PUnet-CDR employs a globally trained framework, eliminating boundary artifacts and enabling consistent representation of large-scale precipitation patterns.

A key application of PUnet-CDR is global drought monitoring and prediction. The dataset supports multi-timescale drought indicators and machine-learning models for drought onset and severity, demonstrated through UCI’s global drought monitoring platform. PUnet-CDR thus provides a scalable, high-resolution foundation for hydroclimate research and operational decision support at global scale.

How to cite: Nguyen, P., Dao, V., Ung, T., AghaKouchak, A., Hsu, K., and Sorooshian, S.: PUnet-CDR: A Global High-Resolution Precipitation Climate Data Record for Hydroclimate and Drought Applications, EGU General Assembly 2026, Vienna, Austria, 3–8 May 2026, EGU26-2633, https://doi.org/10.5194/egusphere-egu26-2633, 2026.

EGU26-3208 | ECS | Orals | AS1.12

Attribution of changes in precipitation 

Miao Zhang

In this paper, the causes and mechanism processes of precipitation changes are thoroughly studied by synthesizing Climate hydrological model and water isotope tracking model in north of the Tianshan Mountains. The main conclusions show that: (1) the annual average convective precipitation north of the Tianshan Mountains increases by 0.014 mm/d, the annual average large-scale precipitation decreases by -0.017 mm/d, and the annual average total precipitation is about -0.003 mm/d. The contributions of the regional human activities to the annual average convective precipitation, large-scale precipitation, and total precipitation are 31.21%, 52.63%, and 50.38%, respectively. (2) Based on the water vapor tracking model, near-source water vapor accounts for as much as 52.29% of the precipitation in the mountainous regions north of the Tianshan Mountains, and that the near-source water vapor consists mainly of recirculated water vapor. (3) The study implies that near-source water vapor is very important to local precipitation and both regional human activities and global climate change affect the local precipitation by increasing evapotranspiration (ET), which provides favorable conditions for convective precipitation. In addition, the increase in atmospheric water vapor further contributes to warming due to the greenhouse effect. However, as a result of intense evaporative cooling and increased humidity, regional human activities dominate the reduction of near-surface temperatures and a more stable atmospheric boundary layer, which significantly reduces large-scale precipitation.  The contribution of irrigation is very small, with overall regional vegetation greening being the key driver.

How to cite: Zhang, M.: Attribution of changes in precipitation, EGU General Assembly 2026, Vienna, Austria, 3–8 May 2026, EGU26-3208, https://doi.org/10.5194/egusphere-egu26-3208, 2026.

Using high‐resolution hourly precipitation observations over China from 2010 to 2024, this study investigates extreme precipitation from a multi‐time‐scale synergistic perspective, with emphasis on its temporal structure and concentration characteristics. Extreme precipitation series at 1-, 3-, 6-, 12- and 24-hour accumulation scales were constructed to reveal regional differences in persistence and explosiveness. Results show that extreme precipitation in North China is dominated by short‐duration intense rainfall, while in the northern Sichuan Basin it is mainly characterized by long‐lasting events, and South China and the Yangtze–Huaihe region exhibit mixed features. Sub‐daily contribution analysis indicates that, in most parts of central and eastern China, the major portion of 24‐hour extreme precipitation is concentrated within the first three hours, highlighting the dominant role of short‐lived mesoscale convective systems. An Extreme Concentration Index (ECI) is further proposed by integrating actual precipitation contributions with climatic background thresholds, enabling quantitative classification of temporal concentration. The spatial pattern of ECI reveals pronounced geographical differences in the temporal structure of extreme precipitation and shows strong relevance to different disaster risk types. Based on ECI classification, region‐specific conceptual forecasting models and refined prediction strategies are developed, providing an effective scientific framework for improving extreme precipitation forecasting and risk prevention.

How to cite: He, L. and Fu, J.: Multi-Scale Synergistic Characteristics and Temporal Structure of Extreme Precipitation over China, EGU General Assembly 2026, Vienna, Austria, 3–8 May 2026, EGU26-3422, https://doi.org/10.5194/egusphere-egu26-3422, 2026.

EGU26-3427 | Posters on site | AS1.12

ERA5 Analysis (1940-2024) of Vertical Thermodynamic and Moisture Variability over Prague (1940-2024) 

Zbyněk Sokol and Daniela Řeyáčová

This contribution analyses temporal changes in thermodynamic variables, namely temperature, geopotential heights of pressure levels, specific cloud ice water content, specific cloud liquid water content, specific humidity, specific rain water content, and specific snow water content, as a function of ground temperature. The analysis is based on ERA5 reanalysis data extracted at the geographic coordinates 50.0° N, 15.0° E for the period 1940–2024, covering pressure levels from 1000 to 300 hPa and synoptic times at 00, 06, 12, and 18 UTC. The selected location corresponds to the city of Prague, Czech Republic. The objective of the study is to investigate whether the vertical profiles of the listed variables exhibit temporal changes and how these changes relate to increasing ground temperature. Particular attention is given to variations in gaseous humidity, liquid water, and solid-phase water within the vertical atmospheric column, and to their dependence on season and time of day.

How to cite: Sokol, Z. and Řeyáčová, D.: ERA5 Analysis (1940-2024) of Vertical Thermodynamic and Moisture Variability over Prague (1940-2024), EGU General Assembly 2026, Vienna, Austria, 3–8 May 2026, EGU26-3427, https://doi.org/10.5194/egusphere-egu26-3427, 2026.

EGU26-4653 | ECS | Posters on site | AS1.12

Increased Precipitation Variability at Multi-timescales in China since the 1960s 

Xuyang Mo, Wenxia Zhang, and Tianjun Zhou

The frequency and intensity of precipitation have changed significantly in China as previously reported. A relevant behavior is the variability of precipitation, which describes temporal fluctuations of precipitation events. Yet it remains unclear how precipitation variability has changed at different timescales over China. In this study, we show that precipitation variability has increased significantly since the 1960s, averaging 2.3 % per decade across China. The increase exists across the synoptic to intraseasonal timescales. The increase in precipitation variability is evident in all seasons with the greatest rate in winter in percentage, which is approximately three times as much as that in summer. Regionally, precipitation variability has risen significantly in northwestern, northeastern, and southeastern China, but has decreased insignificantly along the wet-dry transition belt extending from the north to southwestern China. Compared to trends in mean and extreme precipitation, the increase of precipitation variability is more widespread and with greater magnitudes. The changes in the top 10 % extreme precipitation events contribute ∼75 % of the amplification of precipitation variability nationwide. In addition to long-term trend, summer precipitation variability over eastern China is modulated by the Pacific Decadal Oscillation. This study revealed robust increases in precipitation variability over China since the 1960s across different timescales, seasons, and regions, which have far-reaching impacts on droughts, floods, and water resource management.

How to cite: Mo, X., Zhang, W., and Zhou, T.: Increased Precipitation Variability at Multi-timescales in China since the 1960s, EGU General Assembly 2026, Vienna, Austria, 3–8 May 2026, EGU26-4653, https://doi.org/10.5194/egusphere-egu26-4653, 2026.

EGU26-4763 | Posters on site | AS1.12

Quantitative precipitation estimation in the Nam Co Basin with X-band dual-polarization weather radar 

Yingying Chen, Run Han, Haocheng Wang, and Ming Chen

The Tibetan Plateau (TP) is home to the largest number of high-altitude lakes on Earth. Nam Co is the third largest lake on TP. Obtaining accurate precipitation data at the Nam Co basin scale is crucial for a deeper understanding of the water cycle and related atmospheric processes in cold high-altitude lake basins, and it also provides solid data support for the innovation of precipitation remote sensing inversion algorithms and the improvement of regional climate models. The Institute of Tibetan Plateau Research, Chinese Academy of Sciences, has established a multi-scale precipitation observation platform in the Nam Co basin, with the goal of accurately obtain precipitation data with high spatial and temporal resolution at the basin scale. The platform is equipped with an X-band dual-polarization weather radar, a micro-rain radar, a Double Fence Intercomparison Reference (DFIR) gauge, two raindrop spectrometers, and 24 rain gauges (including 5 T-200B weighing-type rain gauges and 19 Hobo tipping-bucket rain gauges) distributed around the lake area. The X-band dual-polarization weather radar is capable of monitoring the reflectivity and polarization characteristics of precipitation particles within the basin, while other instruments assist the radar in accurately estimating the amount of precipitation at the basin scale.

Uncertainty and bias in precipitation measurement significantly impact the accurate estimation of precipitation in cold high-altitude regions, making the correction of precipitation measurements from different rain gauges essential. The DFIR system, due to its high-precision observation capabilities, is used as the benchmark for precipitation measurement to correct the observations from T-200B and Hobo gauges. Quality control of radar data is crucial for achieving accurate quantitative precipitation estimation (QPE). Therefore, it is necessary to improve the quality of radar data through steps such as denoising, elimination of non-meteorological echoes, systematic error correction, bright band correction, and attenuation correction. Based on quality-controlled radar data, corrected rain gauge data, and raindrop spectrometer data, we have developed QPE methods to achieve accurate estimation of precipitation for the Nam Co basin.

How to cite: Chen, Y., Han, R., Wang, H., and Chen, M.: Quantitative precipitation estimation in the Nam Co Basin with X-band dual-polarization weather radar, EGU General Assembly 2026, Vienna, Austria, 3–8 May 2026, EGU26-4763, https://doi.org/10.5194/egusphere-egu26-4763, 2026.

Daily precipitation observations support a wide range of hydrological and meteorological applications, including flood risk monitoring and numerical weather prediction. In Ireland, the quality control (QC) of rain-gauge data typically takes several weeks  with a combination of automatic and manual analysis performed. As a result, near–real-time applications rely on provisional datasets whose quality has not yet been fully assessed.

We present a near–real-time QC workflow for daily rainfall observations based on approximately 150 stations reporting 09:00–09:00 UTC accumulations. The network comprises five manned airport stations, around 95 automatic stations, and approximately 60 volunteer stations operated by Met Éireann.

The QC framework adopts a two-stage methodology. First, a bootstrapping method is applied to manned stations and a subset of high-quality automatic stations to establish confidence intervals, which are then used to identify outliers in observations from other stations. Flagged outliers are subsequently cross-validated against neighbouring stations to assess their validity. Second, suspicious observations are evaluated using a radar-assisted consistency check based on cleaned 1 km × 1 km radar rainfall accumulations.

Applied to the 2024–2025 daily rainfall data stream, the workflow automatically detects anomalies, including isolated dry and wet stations, on a near–real-time basis; these anomalies were verified as erroneous observations. The proposed approach improves the accuracy and timeliness of provisional national rainfall grids and supports operational applications such as flood forecasting and weather modelling, with scope for extension to other observational datasets.

How to cite: Liu, C. and Coonan, B.: A Radar-Assisted and Enhanced Near-Real-Time Quality Control System for Daily Rainfall in Ireland, EGU General Assembly 2026, Vienna, Austria, 3–8 May 2026, EGU26-5018, https://doi.org/10.5194/egusphere-egu26-5018, 2026.

EGU26-5164 | ECS | Posters on site | AS1.12

Augmentation of X-Band Radar Precipitation Estimates with Micro Rain Radar Observations using Machine Learning 

Anik Naha Biswas and Hossein Hashemi

Precise rainfall estimation is highly essential for investigating water availability, evaluating weather hazards, and understanding rapid climate variations in urban ecosystems. Accurate runoff response is crucial for land use planning, which requires high spatiotemporal precipitation observations, particularly in urban hydrology for groundwater management and the design of efficient drainage systems. Although a rain gauge provides accurate rainfall measurements at a particular location on the surface, it often lacks the spatial extent of rainfall distribution, depending on the gauge network and the complexity of the terrain. Moreover, the rain gauge accumulates the rainwater and records an observation until the minimum threshold of 0.2 mm for rainfall detection is reached, which might miss the precise starting time of the rain event. 

The Weather radar provides a higher spatiotemporal resolution compared to rain gauge monitoring, which tracks precipitation over a larger region at regular spatial and temporal intervals, with an estimate of instantaneous rainfall intensity. X-band weather radar satisfies the need for higher spatiotemporal observation with more accurate rainfall estimates for precise runoff modelling in comparison to S and C-band radars, but at the cost of greater signal attenuation due to its larger operating frequency. X-band radar suffers from the limitation of overshooting for low-lying clouds relative to its sampling volume, which worsens with the increasing range in proportion to the radar elevation angle. X-band radars are also prone to errors resulting from non-meteorological echoes, reflections from ground clutter, and the cone of silence above the maximum elevation angle that causes the rain cells looming above the radar antenna in the zenith direction to remain undetected by the weather radar. Micro rain radar (MRR) is a vertically pointed, specialised, low-cost radar that can continuously measure the drop size distribution and, hence, rainfall rates at different vertical ranges with high resolution. MRR provides fine-scale vertical rainfall characteristics, which can effectively adjust the X-band radar estimates for vertical layers at various elevation angles.

In this research, we have developed a model to perform the bias correction in the rainfall rates of X-band weather radars using the MRR rainfall observation as ground truth. A feed-forward neural network is implemented to improve precipitation estimates from X-band weather radars, utilising rainfall rate, horizontal reflectivity, and specific differential phase as input features. The MRR observations from multiple range gates are averaged over the vertical extent of the X-band radar beam in order to align with the mean rainfall rates from X-band weather radar. The MRR rainfall estimate is pre-processed to mitigate bias by removing outliers caused by evaporation/wind effects, melting particles, or non-meteorological objects, and further verified against collocated rain gauge observations to identify days with actual rainfall events. Thereafter, the rainfall rates at different altitudes from the X-band weather radar nearest to the MRR location are fed to the neural network model as inputs, while the averaged MRR observations from the corresponding range gates are used as the ground truth for training the model. This approach enables bias correction and improves precipitation estimates, particularly across vertical atmospheric layers.

How to cite: Naha Biswas, A. and Hashemi, H.: Augmentation of X-Band Radar Precipitation Estimates with Micro Rain Radar Observations using Machine Learning, EGU General Assembly 2026, Vienna, Austria, 3–8 May 2026, EGU26-5164, https://doi.org/10.5194/egusphere-egu26-5164, 2026.

EGU26-5519 | ECS | Orals | AS1.12

Machine Learning vs. Conventional Methods for X-Band Radar Rainfall Estimation in Cyprus 

Eleni Loulli, Silas Michaelides, and Diofantos Hadjimitsis

Polarimetric X-band radars offer high-resolution precipitation observations that are often challenged by attenuation, calibration errors, and absence of routine correction procedures, which limit reliable quantitative precipitation estimation (QPE). This study proposes a dual-stage machine learning framework for estimating near-surface rainfall from the Cyprus national X-band radar network. In the first stage (Stage 1), feedforward neural networks correct raw ground radar reflectivity using volume-matched Ku-band measurements from the Global Precipitation Measurement (GPM) Mission dual-frequency precipitation radar (DPR). In the second stage (Stage 2), the corrected reflectivity is used as input to regression models, including support vector regression (SVR) and neural networks, to estimate rainfall rates using tipping-bucket rain gauge data. Results show that the Stage 1 networks substantially improve ground radar reflectivity, while Stage 2 SVR models outperform traditional ZR relationships in predicting rainfall, despite residual underestimation and moderate accuracy. The study highlights the potential of machine learning methods for X-band radar QPE in environments with limited calibration and emphasizes the benefit of combining multiple radar datasets to improve spatial consistency. These findings provide practical insights for enhancing rainfall estimation in Cyprus and other regions with similar radar network constraints.

How to cite: Loulli, E., Michaelides, S., and Hadjimitsis, D.: Machine Learning vs. Conventional Methods for X-Band Radar Rainfall Estimation in Cyprus, EGU General Assembly 2026, Vienna, Austria, 3–8 May 2026, EGU26-5519, https://doi.org/10.5194/egusphere-egu26-5519, 2026.

EGU26-5885 | Orals | AS1.12

The Newly Released Global Precipitation Climatology Project (GPCP) V3.3 Daily and Monthly Products and the Future Plans 

Ali Behrangi, George Huffman, Robert F. Adler, Yang Song, K. Kingsley Kumah, David T. Bolvin, Eric J. Nelkin, and Guojun Gu

The Global Precipitation Climatology Project (GPCP) provides a widely used satellite–gauge merged precipitation dataset designed to meet Climate Data Record (CDR) standards for long-term consistency and homogeneity. The latest release, Version 3.3 of the GPCP Daily (1998–2024) and Monthly (1983–2024) products, issued in February 2025, represents the final generation before the transition to GPCP Version 4. This presentation summarizes the V3.3 products and their satellite–gauge inputs, compares them with Version 3.2, and highlights major updates. It also includes evaluations over the global oceans using Passive Aquatic Listeners (PALs), buoys, and atolls, assessments over sea ice using snow-depth data from ICESat-2, CryoSat-2, and ERA5, and analyses over Antarctica using CloudSat, together with insights from GPM Version 07. Key upgrades in GPCP V3.3 include adoption of GPROF 2021 for passive microwave retrievals, a revised ocean climatology based on updated GPM and TRMM radar and microwave data, sensor-specific adjustments to GPROF-calibrated PERSIANN-CDR, and the introduction of a new absolute bias error variable. Relative to V3.2, V3.3 shows an approximately 11% increase in global ocean precipitation and a 9% global increase, driven mainly by ocean changes, while land precipitation changes are small (about 1%). Initial ocean evaluations using limited in situ data indicate a slight overestimation in V3.3, although energy-budget closure supports the overall increase. Interannual variability is also slightly larger, while regional and global precipitation trends remain largely unchanged. Enhancements in the GPCP V3.3 Daily product stem from updates to the Monthly analysis and incorporation of IMERG V07B Final Run, which uses GridSat to extend daily coverage back to January 1998 through May 2000. The presentation concludes with plans for GPCP V4, focusing on higher resolution, lower latency, and more advanced retrieval and gauge-analysis techniques.

How to cite: Behrangi, A., Huffman, G., Adler, R. F., Song, Y., Kumah, K. K., Bolvin, D. T., Nelkin, E. J., and Gu, G.: The Newly Released Global Precipitation Climatology Project (GPCP) V3.3 Daily and Monthly Products and the Future Plans, EGU General Assembly 2026, Vienna, Austria, 3–8 May 2026, EGU26-5885, https://doi.org/10.5194/egusphere-egu26-5885, 2026.

Based on hourly precipitation data from Chinese automatic weather stations (2000-2020), this study employs the REOF method to classify plateau precipitation into three regions: Central and Eastern Tibet, Central Qinghai, and Northwestern Yunnan (Region I); Western Tibet, Western Qinghai, and Northern Gansu (Region II); and Southeastern Qinghai and the Western Sichuan Plateau (Region III). Plateau precipitation generally decreases from east to west, with Region I exhibiting the earliest peak and Region III the latest. Hourly extreme precipitation amounts and frequencies both show an "east-high, west-low" pattern, and frequencies of heavy rainfall is higher at the southeastern plateau, the rain intensity is stronger at the northeastern plateau. The peak time of hourly heavy precipitation in Region III is the earliest. Under the Bay of Bengal (BOB) storm influence, heavy precipitation concentrates in the northeastern and southern plateau, and the high-frequency zone is located in the southeastern plateau. The precipitation peaks occur from afternoon to night, and the peak time in Region III is the earliest, showing a distinct east-to-west delay. The peak time of the average rain intensity is earlier than the peak time of the number of the stations exceeding four precipitation thresholds, which means that extreme heavy rainfall occurs more frequently in the afternoon, while widespread heavy precipitation favors night. In Region III, the frequency peaks exceeding four precipitation thresholds occurs around 2100-2200 LST, indicating heavy rainfall induced by the BOB storm favors night in this area. The maximum contribution rates of the BOB storm-related hourly heavy precipitation are distributed over the eastern and southern plateau, with the 90th percentile precipitation contribution rate exceeding 60%, highlighting the prominence of short-duration heavy rainfall. Complex topography in the eastern and southern plateau characterized by valleys and intersecting terrain enhances convergence and uplift of warm, moist airflows from northward-moving BOB storms, further facilitating heavy precipitation generation.

How to cite: Luo, Q. and Chen, Y.: Analysis of Multi-Scale Characteristics of Plateau Precipitation under the Influence of Bay of Bengal Storms, EGU General Assembly 2026, Vienna, Austria, 3–8 May 2026, EGU26-7031, https://doi.org/10.5194/egusphere-egu26-7031, 2026.

The continuous development of modern Doppler weather radars has substantially augmented our capacity to monitor severe convective storms and gain insights into their dynamic and microphysical structures. Although conventional parabolic antenna-based S-band operational radars are valuable, they exhibit limitations such as low scanning speed and reduced information acquisition in the low atmosphere region, particularly at far ranges from the radar, leading to suboptimal observations of fast-evolving storms. To address these limitations, a dense X-band polarimetric phased array radar (PAR) network, consisting of more than 50 radars, has been strategically constructed and deployed in the Greater Bay Area in South China, which is currently the largest PAR network worldwide. The PARs exhibit satisfactory performance in hydrometeor classification, hail identification, and quantitative precipitation estimation, demonstrating reliable polarimetric data quality. The paper also presents compelling evidence demonstrating the effectiveness of the PAR network in detecting the tornado vortex and capturing fine horizontal and vertical structures of convective storms when compared to nearby S-band operational radars. In addition, the assimilation of supplemental PAR data using the ensemble Kalman filter has yielded discernible vortex circulation fields for tornadic storms, enabling effective prediction of tornadogenesis, which is unattainable solely by assimilating S-band operational radar data. As the PAR network is put into operational use, significant advancements are anticipated in understanding and monitoring severe weather systems in South China.

How to cite: Zhao, K. and Huang, H.: Operational Phased Array Radar Network for Natural Hazard Monitoring and Warnings in Urban Environments over the Greater Bay Area, China, EGU General Assembly 2026, Vienna, Austria, 3–8 May 2026, EGU26-8855, https://doi.org/10.5194/egusphere-egu26-8855, 2026.

EGU26-9714 | Posters on site | AS1.12

MSWEP V3: Machine Learning-Powered Global Precipitation Estimates at 0.1° Hourly Resolution (1979–Present) 

Hylke Beck, Xuetong Wang, Raied Alharbi, Oscar Baez-Villanueva, Diego Miralles, Jun Ma, Shiqin Xu, Matthew McCabe, Florian Pappenberger, Albert van Dijk, Tim McVicar, Lanka Karthikeyan, Hayley Fowler, Ming Pan, and Solomon Gebrechorkos

We introduce Version 3 (V3) of the gridded near real-time Multi-Source Weighted-Ensemble Precipitation (MSWEP) product—the first fully global, machine learning-powered precipitation (P) dataset, developed to meet the growing demand for timely and accurate P estimates amid escalating climate challenges. MSWEP V3 provides hourly data at 0.1° resolution from 1979 to the present, continuously updated with a latency of approximately two hours. Development follows a two-stage process. First, baseline P fields are generated using machine learning model stacks that integrate satellite- and (re)analysis-based P and air-temperature products, along with static variables. The models are trained using hourly and daily observations from 15,959 P gauges worldwide. Second, these baseline P fields are corrected using daily and monthly gauge observations from 57,666 and 86,000 stations globally, using a method that accounts for gauge proximity, reporting times, inter-gauge dependencies, and correlation lengths. To assess MSWEP V3's baseline performance, we evaluated 19 (quasi-) global gridded P products—including both uncorrected and gauge-based products—using observations from an independent set of 15,958 gauges excluded from the first training stage. The MSWEP V3 baseline achieved a median daily Kling-Gupta Efficiency (KGE) of 0.69, outperforming all evaluated products. Other uncorrected products achieved median KGE values of 0.61 (ERA5), 0.46 (IMERG-L V7), 0.38 (GSMaP V8), and 0.31 (CHIRP). Notably, the MSWEP V3 baseline also outperformed several gauge-based products, including IMERG-F V7 (0.62), CPC Unified (0.54), and CHIRPS (0.36). Using leave-one-out cross-validation, the daily gauge correction was found to improve the median daily correlation by 0.09, constrained by the already strong baseline performance. We anticipate that MSWEP V3 will substantially advance data-driven decision-making in hydrology and climate science, by enabling more reliable monitoring, forecasting, and management of water-related risks in a variable and changing climate.

How to cite: Beck, H., Wang, X., Alharbi, R., Baez-Villanueva, O., Miralles, D., Ma, J., Xu, S., McCabe, M., Pappenberger, F., van Dijk, A., McVicar, T., Karthikeyan, L., Fowler, H., Pan, M., and Gebrechorkos, S.: MSWEP V3: Machine Learning-Powered Global Precipitation Estimates at 0.1° Hourly Resolution (1979–Present), EGU General Assembly 2026, Vienna, Austria, 3–8 May 2026, EGU26-9714, https://doi.org/10.5194/egusphere-egu26-9714, 2026.

EGU26-9968 | ECS | Posters on site | AS1.12

Quantifying spatial rainfall variability using a country-wide high-density rain gauge network 

Nathalie Rombeek, Claudia Brauer, Markus Hrachowitz, and Remko Uijlenhoet

Accurate rainfall observations are important for hydrological applications. However, rainfall exhibits strong spatial and temporal variability, resulting in significant uncertainties in areal rainfall products. Estimates of this spatial and temporal variability are needed for spatial interpolation and merging of rainfall products. Traditional rain gauge networks are often too sparse to resolve this variability. In this study, we make use of a unique high-density rain gauge network with a high temporal resolution (i.e. 5-min) over a three-year period (2022-2024) to quantify the spatial variability of rainfall over the whole of the Netherlands (about 1 gauge per 10km2). We investigated the spatial variability of rainfall at different temporal aggregation intervals by fitting climatological spherical semi-variograms, revealing a strong seasonal pattern. In addition, we examined the spatial dependency of rainfall in different directions to characterize anisotropy. Furthermore, this high-density network enables us to assess uncertainties in rainfall estimates across different spatial scales, ranging from weather radar pixels (~1 km2), satellite footprints (~10-100 km2) to catchments scales.

How to cite: Rombeek, N., Brauer, C., Hrachowitz, M., and Uijlenhoet, R.: Quantifying spatial rainfall variability using a country-wide high-density rain gauge network, EGU General Assembly 2026, Vienna, Austria, 3–8 May 2026, EGU26-9968, https://doi.org/10.5194/egusphere-egu26-9968, 2026.

EGU26-10353 | ECS | Posters on site | AS1.12

Scale- and Seasonal-dependent Precipitation Structure from Estonian Radar Composites Using a Poisson-Gamma Model 

Yee Chun Tsoi, Aarne Männik, and Sander Rikka

Precipitation estimates over the Estonian radar composite domain change with accumulation length, season, and spatial location, yet these dependencies are rarely summarized in a compact way. This matters for comparing products across temporal resolutions and designing downstream applications such as precipitation modelling and nowcasting. Here we characterize precipitation structure using a Poisson-Gamma framework, focusing on the Tweedie variance-mean scaling exponent p as a descriptor of how wet-dry transitions and event-to-event fluctuations vary with aggregation.

Using 4-year radar composites aggregated from sub-hour to daily windows, we estimate p across accumulation lengths and derive seasonal maps that highlight where and when precipitation structure differs. In year-average, p increases with accumulation length across the domain, indicating that longer windows increasingly reflect the combined effect of multiple precipitation episodes within a window, while spatial gradients remain weak compared to the domain-wide shift with aggregation. Seasonal estimates show a consistent ordering, with p highest in summer and lowest in winter, and winter showing a stronger positive dependence on accumulation length. Seasonal maps at 6-24 h reveal clearer organization, including land-sea contrasts and enhanced spatial heterogeneity in warm and autumn seasons, whereas winter fields are smoother with localized marine features. We also compare radar-based behaviour with rain-gauge series at 10-min and 1-h temporal resolutions. Across common accumulation periods, p follows a consistent ordering, with higher values from the higher-temporal-resolution radar composite and lower values from the coarser gauge series, suggesting that temporal scaling influences inferred precipitation structure.

Overall, the study provides a set of figures and maps that summarize how precipitation structure varies with season and accumulation length over the Estonian radar domain. These results offer a baseline for multi-source comparison and for applications where aggregation scale and observing system matter, such as precipitation modelling, verification, and nowcasting-related target design.

How to cite: Tsoi, Y. C., Männik, A., and Rikka, S.: Scale- and Seasonal-dependent Precipitation Structure from Estonian Radar Composites Using a Poisson-Gamma Model, EGU General Assembly 2026, Vienna, Austria, 3–8 May 2026, EGU26-10353, https://doi.org/10.5194/egusphere-egu26-10353, 2026.

EGU26-10384 | Posters on site | AS1.12

Rainfall Trend Analysis and Its Relationship with the North Atlantic Oscillation on São Miguel Island (Azores, Portugal) 

Rui Fagundes Silva, Rui Marques, José Luís Zêzere, and Marcelo Fragoso

São Miguel Island (Azores archipelago - Portugal), is located in the North Atlantic and exhibits high spatial and temporal variability in rainfall, strongly controlled by its volcanic morphology and the influence of large-scale atmospheric circulation.The analysis of rainfall trends on São Miguel Island was conducted at annual and seasonal scales using 17 rainfall series (1978/79–2019/20), applying non-parametric statistical methods, namely the Mann–Kendall test to assess trend significance and Sen’s slope estimator to quantify trend magnitude. The analysis reveals a clear predominance of negative trends in both annual and seasonal rainfall, with marked spatial heterogeneity. Statistically significant trends are mainly concentrated in autumn and winter, the seasons accounting for the largest fraction of annual rainfall. Autumn emerges as the season with the highest number and magnitude of negative trends, indicating a consistent transition toward progressively drier conditions. At several rainfall stations, annual trends exceed −20 mm/year, reaching maximum values of −31.6 mm/year at high-altitude sites. These rainfall stations also exhibit significant decreases across multiple seasons, indicating a persistent weakening of the rainfall regime throughout the study period.The relationship between rainfall and the NAO shows a negative annual correlation, with a stronger seasonal signal during autumn. Several stations present statistically significant correlations, indicating that positive NAO phases are associated with reduced rainfall on São Miguel Island. This relationship is particularly consistent in autumn, suggesting that the intensification and persistence of atmospheric patterns associated with positive NAO phases have contributed substantially to the observed negative trends. In contrast, winter correlations are weaker and spatially less coherent, while in spring and summer the influence of the NAO is residual.Overall, the results confirm the dominant role of the NAO as the primary driver of interannual variability and recent rainfall trends on São Miguel Island, highlighting a drying signal in an insular environment that is highly sensitive to changes in North Atlantic atmospheric circulation.

How to cite: Silva, R. F., Marques, R., Zêzere, J. L., and Fragoso, M.: Rainfall Trend Analysis and Its Relationship with the North Atlantic Oscillation on São Miguel Island (Azores, Portugal), EGU General Assembly 2026, Vienna, Austria, 3–8 May 2026, EGU26-10384, https://doi.org/10.5194/egusphere-egu26-10384, 2026.

EGU26-10599 | Posters on site | AS1.12

Changes in convective precipitation characteristics during the warm season in the Czech Republic 

Romana Beranova and Zuzana Rulfova

Convective precipitation is a key component of the hydrological cycle and a major driver of extreme rainfall, flash floods, and other high-impact weather events. Under climate warming, changes in the thermodynamic environment are expected to affect the intensity, spatial structure, duration, and frequency of convective storms. This study investigates long-term changes in convective precipitation over the Czech Republic using time series from 19 observation stations covering the period 1982–2021.

Precipitation totals were classified into convective and stratiform components using an algorithm based on SYNOP reports. The analysis focuses on the warm half of the year (April–September), when convective precipitation dominates. We examine six precipitation characteristics: total precipitation, number of rainy days, rain intensity index, 98th percentile of daily precipitation (P98), seasonal maximum, and the convective fraction. Trends are estimated using Sen’s slope, and their statistical significance is assessed with the Mann–Kendall test. Positive trends are found for all characteristics except the rain intensity index.

In addition, we analyse days with heavy convective precipitation and their relationship to atmospheric circulation. Heavy convective precipitation is defined as a convective precipitation amount exceeding the mean P98 threshold over the study period. Atmospheric circulation types are classified using the Jenkinson and Collins (1977) method. This approach identifies circulation types based on three indices: flow direction, strength, and vorticity. Our results show that heavy convective precipitation most frequently occurs under cyclonic, northwesterly, northerly, and westerly circulation types.

How to cite: Beranova, R. and Rulfova, Z.: Changes in convective precipitation characteristics during the warm season in the Czech Republic, EGU General Assembly 2026, Vienna, Austria, 3–8 May 2026, EGU26-10599, https://doi.org/10.5194/egusphere-egu26-10599, 2026.

Extreme rainfall events are strongly influenced by aerosol-cloud interactions (Lin et al., 2018); however, the representation of aerosols in convection-permitting numerical weather prediction models remains highly uncertain due to computational constraints. This study examines the influence of cloud condensation nuclei (CCN) representation on the December 2015 extreme rainfall event over Chennai (India), using a high-resolution Weather Research and Forecasting (WRF) model. 

CCN concentrations for the event are derived from long-term MERRA2 reanalysis data. A high-resolution CCN map was generated within the innermost 1-km domain to capture the urban-scale aerosol characteristics over the Chennai metropolitan region. Three sensitivity experiments are conducted: a baseline simulation using long-term CCN data (BASE-Exp), and two additional experiments in which CCN levels are reduced by factors of 10 (BASEby10-Exp) and 100 (BASEby100-Exp), respectively. These reductions are implemented to represent below-cloud aerosol scavenging processes prior to the event (Laakso et al., 2003). The results demonstrate a strong sensitivity of simulated rainfall to CCN loading in the region, with reduced CCN simulations exhibiting improved agreement with GPM-IMERG rainfall observations. Relative to the BASE-Exp, the mean rainfall bias over the region is reduced by approximately 21% in BASEby10-Exp and 26% in BASEby100-Exp. 

With the growing rise of extreme rainfall events in the future, these findings highlight the importance of CCN representation in operational weather forecasting models for improved simulation of extreme rainfall.

How to cite: Paul, O. and Sarangi, C.: Role of CCN representation in simulating an Extreme Rainfall event over Chennai (India) in WRF, EGU General Assembly 2026, Vienna, Austria, 3–8 May 2026, EGU26-11474, https://doi.org/10.5194/egusphere-egu26-11474, 2026.

Southern Africa is among the world’s most water-insecure regions, underscored by the 2023/2024 drought that affected an about 60 million people (OCHA 2024). As a result, mitigation and adaptation efforts are critical. One such effort is ongoing under the Co-design of a Hydro-Meteorological Information System for Sustainable Water Resources Management in Southern Africa (Co-HYDIM-SA) project, which leverages new technologies to enhance early warning and optimize water resources management through user-friendly monitoring and forecasting tools. However, interventions such as Co-HYDIM-SA heavily rely on the availability of high-quality in-situ (or surface) data, which remains scarce across sub-Saharan Africa. As a result, alternative rainfall data sets such as satellite rainfall estimates (SREs) or atmospheric reanalysis are commonly used as surrogates, though their suitability for regional hydrometeorological applications must be verified before informing critical decisions.

This study evaluates the performance of satellite rainfall estimates (SREs), including the Integrated Multi-satellitE Retrievals for Global Precipitation Measurement version 7 (IMERGv7), Climate Hazards Group InfraRed Precipitation with Station data (CHIRPS; versions 2 and 3), Multi-Source Weighted-Ensemble Precipitation (MSWEP; versions 2.8 and 3), and the Precipitation Estimation from Remotely Sensed Information using Artificial Neural Networks-Climate Data Record (PERSIANN-CSS-CDR). In addition, a reanalysis product (ERA5-Land) and a gauge-only gridded product (the Global Precipitation Climatology Centre, GPCC, dataset) are evaluated. These datasets are assessed against daily observations from a network of 243 rain gauges spanning 2000-2024 across Southern Africa, with a focus on the transboundary Cuvelai-Cunene Basin (Angola-Namibia) and the Notwane Basin in the Upper Limpopo (Botswana-South Africa). Skill is evaluated based on the ability to detect rainy days and accurately reproduce rainfall amounts (including extremes) across daily to annual timescales and multiple spatial scales, thereby determining the suitability of the gridded rainfall products for hydrometeorological applications, including drought and flood monitoring and forecasting. The influence of rain gauge density used (a) to calibrate SRE products and (b) for the validation on SRE performance is also examined. Furthermore, improvements resulting from algorithm refinement are demonstrated by comparing the latest and predecessor versions of CHIRPS and MSWEP, with preliminary results indicating approximately a 25% improvement for CHIRPS.

How to cite: Ageet, S. and H. Fink, A.: Validation of satellite rainfall estimates over transboundary river catchments in Southern Africa, EGU General Assembly 2026, Vienna, Austria, 3–8 May 2026, EGU26-11597, https://doi.org/10.5194/egusphere-egu26-11597, 2026.

Multiple research efforts have highlighted the critical role of snowfall regime classification in accurately retrieving snowfall rates from Passive Microwave (PMW) observations. Regardless of whether precipitation algorithms rely on a-priori information or training datasets, developing comprehensive and representative datasets is essential for proper snowfall detection and quantification using satellite-based sensors. This study examines snowfall retrievals within the Goddard PROFiling (GPROF) algorithm, the PMW precipitation product of the Global Precipitation Measurement (GPM) mission.

The research employs a merged CloudSat-GPM dataset to create training data for an eXtreme Gradient Boost (XGB) model. This model correlates GPM Microwave Imager (GMI) brightness temperatures with Cloud Profiling Radar (CPR)-derived snowfall regimes, categorizing observed scenes into four classes: 'not snowing', 'shallow convective', 'deep stratiform', or 'other' snowfall types.

The Machine Learning (ML) methodology is essential for deciphering the strong yet intricate relationships between atmospheric PMW signals and surface snowfall patterns. The ML classifier undergoes training using CloudSat's classification methodology, which incorporates snow profiles and cloud categorization principles, then applies this knowledge to GPROF operations. The presentation will feature a comprehensive global comparison of snowfall regime classification results, contrasting those obtained using CloudSat data against classifications based solely on PMW observations.

How to cite: Milani, L. and Petkovic, V.: Machine Learning for Passive Microwave Snowfall Regime Classification: a Global Analysis, EGU General Assembly 2026, Vienna, Austria, 3–8 May 2026, EGU26-11989, https://doi.org/10.5194/egusphere-egu26-11989, 2026.

EGU26-12777 | ECS | Orals | AS1.12

Global Precipitation Climatology Centre: Release of new Versions of global gridded Daily and Monthly Precipitation Analyses 

Zora Leoni Schirmeister, Markus Ziese, Elke Rustemeier, Peter Finger, Astrid Heller, Raphaele Schulze, Magdalena Zepperitz, Siegfried Fränkling, Michael Jahn, and Jan Nicolas Breidenbach

Founded in 1989, the Global Precipitation Climatology Centre (GPCC) provides globally gridded precipitation analyses based on in situ rain gauge measurements. The underlying precipitation database is the largest worldwide regarding number and length of the timeseries. The GPCC continuously expands the database with new stations and historical data as well as near real-time data. The contributions are mainly provided by the national meteorological and hydrological services of around 190 countries worldwide, but also from data collections of international projects. All incoming data (metadata and observations) undergo a semi-automatic quality control to ensure a high quality of GPCC’s data sets.

Over the last months, new versions of three particular valuable data sets have been developed. In 2025, the GPCC released a new version of its Climatology called “GPCC Precipitation Analysis Climatology Version 2025”, which includes 89’000 world wide stations (of which 3’000 have been added over the last 3 years). Further, the monthly dataset, starting in 1891, was updated. The new version of the former “Full Data Monthly” Product underwent two major changes. The first one is its name, now: “GPCC Precipitation Analysis Monthly Version 2025”. Secondly, it is merged with the former “Monitoring Product”. That means, that the “GPCC Precipitation Analysis Monthly Version 2025” was recalculated for 1891 - October 2025 and will be extended each month by another month, thus being near real-time from now on. In March 2026, GPCC will release also a new version of the former “Full Data Daily” Product, now “GPCC Precipitation Analysis Daily Version 2025”. It will cover 1982 – 2025 and will include many new stations in different regions, which improve the quality of the analysis, e.g., in Columbia and Italy.

The new products, changes and improvements in comparison to the previous version will be presented.

All gridded data sets presented are freely available in netcdf format on the GPCC website https://gpcc.dwd.de and referenced by a digital object identifier (DOI). The site also provides an overview of all data sets, as well as a detailed description and further references for each data set.

How to cite: Schirmeister, Z. L., Ziese, M., Rustemeier, E., Finger, P., Heller, A., Schulze, R., Zepperitz, M., Fränkling, S., Jahn, M., and Breidenbach, J. N.: Global Precipitation Climatology Centre: Release of new Versions of global gridded Daily and Monthly Precipitation Analyses, EGU General Assembly 2026, Vienna, Austria, 3–8 May 2026, EGU26-12777, https://doi.org/10.5194/egusphere-egu26-12777, 2026.

Quantitative precipitation estimates (QPE) derived from weather radars provide spatially continuous rainfall information but are affected by systematic and random uncertainties, e.g. calibration errors, beam blockage, vertical profile effects, and range-dependent biases. A well-established approach to mitigate these limitations is the adjustment of radar-based precipitation using ground-based reference observations. While rain gauges remain the most common reference, commercial microwave links (CMLs) from cellular communication networks offer a promising complementary source of near-surface rainfall information with high spatial coverage and temporal resolution.

Here, we present the development of the flexible Python-based framework pyRADMAN designed to support operational and research-oriented radar adjustment using multiple types of ground sensors at the Deutscher Wetterdienst. The framework enables preprocessing, configurable selection, and combination of different observations, including both rain gauges and CML attenuation-derived rainfall estimates, with radar data. The system ingests radar data from 17 radar sites, approximately 1500 rain gauges available at DWD, and attenuation data from about 4500 CMLs. A continuous CML data transfer from Ericsson to DWD has been established with a latency of less than 2 minutes, enabling the generation and assessment of near-real-time CML-adjusted radar products. pyRADMAN can be operated in routine mode to provide adjusted QPE products, or in recalculation mode for systematic evaluation and method development.

The applied adjustment approach follows the established principles of the operational RADOLAN adjustment scheme. Additional experiments with radar preprocessing, CML processing strategies and adjustment methods were conducted. We demonstrate the feasibility and performance of radar adjustment that goes beyond the recent operational system by using different sensor configurations including CMLs and a fine temporal resolution. Results are presented for an evaluation period covering July 2023 to December 2024, highlighting the potential benefits and challenges of incorporating CML data for near-real-time radar QPE adjustment in an quasi-operational environment.

How to cite: Wenzel, M., Chwala, C., Maximilian, G., and Winterrath, T.: A Continuously Operating Python Framework for Country-Wide Near-Real-Time Weather Radar Adjustment in Germany Using Rain Gauges and Commercial Microwave Links, EGU General Assembly 2026, Vienna, Austria, 3–8 May 2026, EGU26-14108, https://doi.org/10.5194/egusphere-egu26-14108, 2026.

EGU26-14263 | ECS | Posters on site | AS1.12

Linking Spectral Power to Path-averaged Rainfall Rate in Microwave Link Data 

Peiyuan Wang, Arjan Droste, Marc Schleiss, and Remko Uijlenhoet

Raindrop motion can induce measurable high-frequency fluctuations (“scintillations”) in the variance and power spectral density (PSD) of received power from microwave links. This phenomenon was observed in earlier research along with turbulence-induced scintillations. The rain-induced scintillation signature may provide insight into rainfall dynamics at fine spatiotemporal scales (sub-second; meters). Here, we analyze a 26 GHz, 2.2 km microwave-link dataset collected in Wageningen. Using a 20 Hz sampling rate, we compute variance-normalized PSDs over 30 s windows and stratify them by crosswind, using measurements from a weather station located 3 km from the link. We find a roughly monotonic relationship between the integrated spectral power in the 9–10 Hz band and the path-averaged rainfall rate measured by disdrometers. However, substantial unexplained variability remains. Our findings indicate that crosswind effects alone may be insufficient to fully account for the observed variability in the signal. Future work will focus on improved characterization of the local crosswind field and analyzing other rainfall characteristics (e.g. parameters of the raindrop size distribution).

How to cite: Wang, P., Droste, A., Schleiss, M., and Uijlenhoet, R.: Linking Spectral Power to Path-averaged Rainfall Rate in Microwave Link Data, EGU General Assembly 2026, Vienna, Austria, 3–8 May 2026, EGU26-14263, https://doi.org/10.5194/egusphere-egu26-14263, 2026.

EGU26-14297 | Posters on site | AS1.12

Status and Development of Version 08 in the NASA GPM Activities 

George Huffman, Christian Kummerow, William Olson, and Erich Stocker

The joint U.S.-Japan Global Precipitation Measurement (GPM) mission has passed a decade of operations, and continues to pursue research, dataset production, and outreach related to precipitation.  One key activity currently in development is the release of an improved “Version 08” of all GPM precipitation and latent heating products.

This presentation summarizes key improvements to the GPM products for which NASA has lead responsibility as we approach the release of Version 08.  For example, the Goddard Profiling (GPROF) algorithm has implemented a Machine Learning-based algorithm that shows solid improvements in computing retrievals from the constellation of partner satellite passive microwave sensors when compared to the GPM Microwave Imager (GMI) retrievals.  And all of the PMW retrievals, including from GMI, show improved validation scores.  The Combined Radar Radiometer Algorithm (CORRA) now incorporates additional emphasis on GMI (and Tropical Rainfall Measuring Mission [TRMM] Microwave Imager [TMI]) data in regions where the radar lacks skill.  This is principally the light precipitation and snow at high latitudes and over Central Asia in the winter.  Each algorithm is being adjusted to ensure continuity for each product across the boundary in 2014 between the TRMM and the GPM eras, as well as across the TRMM and GPM Core Observatory orbit boosts.  The U.S. Science Team’s Integrated Multi-satellitE Retrievals for GPM (IMERG) was upgraded to give more flexibility in using different-quality PMW sensors, and a new ML-based retrieval has been

The presentation also considers major issues that require continued attention, including the operational challenge of swarms of “small”, perhaps short-lived satellites, and planning for the next-generation multi-satellite product.

How to cite: Huffman, G., Kummerow, C., Olson, W., and Stocker, E.: Status and Development of Version 08 in the NASA GPM Activities, EGU General Assembly 2026, Vienna, Austria, 3–8 May 2026, EGU26-14297, https://doi.org/10.5194/egusphere-egu26-14297, 2026.

EGU26-14694 | Orals | AS1.12

Improved and Consistent Calibration Methodologies for IMERG V08  

Robert Joyce, George Huffman, Dave Bolvin, Jackson Tan, and Eric Nelkin

NASA’s Integrated Multi-satellitE Retrievals for GPM (IMERG) is a widely used high resolution global precipitation product.  IMERG relies on retrievals from passive microwave (PMW) sensors as the primary input precipitation estimates, so it is vital that they are first homogenously calibrated to the core observatory GMI radiometer and finally to the GPM Combined Radar–Radiometer Analysis (CORRA-G/T) for the GPM/TRMM eras respectively.  Inspections of IMERG V07 illustrate a very close calibration of the PMW estimates to V07 CORRA-G/T as result of several improvements in V07 IMERG calibrations, however the final CORRA-G/T calibration of all V07 GPROF PMW precipitation did not account for surface-type dependencies, and the GMI/TMI-to-other-satellite calibration did not fine tune regional dependencies.  Also, both calibrations did not take advantage of limiting the spatial comparison domain for regions of high precipitation detection by both sensors.     


Despite the improved calibration procedure, systematic biases and inhomogeneities remain in the satellite precipitation products used as input for V07 IMERG.  Evaluations of V07 IMERG indicate discontinuities in certain regions near coastlines relative to CORRA-G/T.  Specifically, for these regions the differential character of the respective  CORRA-G/T land/ocean algorithms are not always captured correctly in the final calibration of the GPROF land/ocean  algorithms.  In V08 IMERG the final CORRA-G/T calibration of all PMW differentiates a land/ocean calibration by only using matchup retrievals from each surface type.  Also in certain regions, noticeable disparities of spatiotemporal matches of GMI to other satellite GMI-calibrated GPROF precipitation is certainly a result of latitude band calibrations used in V07 [and previous versions] that do not necessarily capture the regional relationships.  In V08 IMERG the regional/seasonal GMI-to-other-satellite calibrations markedly improve the regional/seasonal relationships between GMI and other sensors by regionally restricting matchups.       


Unlike previous versions, in V08 IMERG a spatial search restriction of precipitation frequency detection is used for both calibrations.  By using minimum thresholds of precipitation detection, regional dependencies are preserved by terminating the outward spatial search of precipitation occurrences from both the calibrating source and precipitation set for calibration, once the criteria are met by both for stable calibrations.  We plan to work with the GPROF and CORRA teams to finalize these corrections as part of V08.

How to cite: Joyce, R., Huffman, G., Bolvin, D., Tan, J., and Nelkin, E.: Improved and Consistent Calibration Methodologies for IMERG V08 , EGU General Assembly 2026, Vienna, Austria, 3–8 May 2026, EGU26-14694, https://doi.org/10.5194/egusphere-egu26-14694, 2026.

Development of a new observing system, such as the proposed Airborne Phased Array Radar (APAR) by the US National Science Foundation (NSF) National Center for Atmospheric Research (NCAR), is critical for the advancement of scientific understanding of weather phenomena. The APAR Observing Simulation, Processing, and Research Environment (AOSPRE) was developed to simulate APAR's measurement and science capabilities before the APAR is constructed. AOSPRE uses Cloud Model 1 (CM1) and Weather Research and Forecasting (WRF) model simulated storms with a hypothetical C-130 operated within the model space. Radar moments and dual-pol variables are deduced from the model microphysical parameters using the Cloud Resolving Model Radar Simulator (CR-SIM). Three-dimensional dual-Doppler radar winds can be retrieved from the Spline Analysis at Mesoscale Utilizing Radar and Aircraft Instrumentation (SAMURAI). The output can be examined directly or passed through additional tools to analyze various aspects of the data collected during each flight.


AOSPRE is linked to a NSF NCAR-wide INtegrating Field Observations and Research Models (INFORM) to (1) establish and support best practices and methods for comparisons between models and observations, (2) exploit, assess and quantify the impacts of integrating observations and models to improve understanding of the prediction and predictability of the Earth system, and (3) improve the design, planning, deployment strategy of field programs and instrument development. The AOSPRE will be expanded into a field program planning tools as wells as a post campaign re-analysis tool with DA capability.


AOSPRE is developed as an open-source software. The first version of AOSPRE software has been released to the research and operational community in the last quarter of 2024. Even though the APAR construction program was suspended by NSF in April 2025, AOSPRE capability has been expanded to be a general purposed radar simulating environment for the community that can be applied to other airborne and ground-based radars. This paper will provide recent development/accomplishment of AOSPRE and the applications of AOSPRE in the INFORM project to validate and improve model microphysics using radar observations.

How to cite: Lee, W., Joseph, E., Klotz, B., and Vivekanandan, J.: Application of Airborne Phased Array Radar (APAR) Observing Simulation, Processing, and Research Environment (AOSPRE) In The NSF NCAR INtegrating Field Observations and Research Models (INFORM) Program, EGU General Assembly 2026, Vienna, Austria, 3–8 May 2026, EGU26-15502, https://doi.org/10.5194/egusphere-egu26-15502, 2026.

EGU26-16345 | Posters on site | AS1.12

Validation of the Precipitation Nowcasting for selected cases in Greece, using weather radar data assimilation 

Dimitrios Katsanos, John Kalogiros, Panagiotis Portalakis, Nikolaos Roukounakis, and Adrianos Retalis

Abstract

Floods driven by short-duration intense rainfall, remain among the most damaging natural hazards in the Mediterranean and set major challenges for early warning systems. Accurate nowcasting (short-term forecasting) of convective rainfall is essential for hydrological response modelling and risk management. However, numerical weather prediction often struggles to capture storm initiation and localization in complex terrain.

This study investigates the assimilation of XPOL polarimetric radar data into the Weather Research and Forecasting (WRF) model using a 4DVAR data assimilation approach, to improve rainfall prediction for flood-relevant time scales. Selected high-impact precipitation events from 2024–2025 over Greece are simulated, including cases associated with flash flooding. Radar reflectivity and radial wind observations are assimilated through 4DVAR cycling, and simulations were performed at 2-km resolution with a 3-hour forecast horizon, representative of nowcasting. In addition, humidity, vertical velocity and horizontal wind divergence profiles estimated from lightning data, are also assimilated with a three-dimensional variation (3D-Var) method. Verification, using primarily the estimated rainfall from the weather radar, supplemented by satellite products where needed, shows that radar assimilation significantly enhances convective initiation, storm structure, and peak rainfall placement during the first forecast hours. These results demonstrate that radar-based 4DVAR assimilation can strengthen operational flood early-warning capabilities by providing more reliable rainfall forcing for hydrological and decision-support models. Ongoing work explores integration within multi-sensor workflows, coupling with meteorological forecasting chains, toward operational implementation in Greece.


Key Words: extreme rainfall, WRF, data assimilation, weather radar

How to cite: Katsanos, D., Kalogiros, J., Portalakis, P., Roukounakis, N., and Retalis, A.: Validation of the Precipitation Nowcasting for selected cases in Greece, using weather radar data assimilation, EGU General Assembly 2026, Vienna, Austria, 3–8 May 2026, EGU26-16345, https://doi.org/10.5194/egusphere-egu26-16345, 2026.

As climate change intensifies the frequency and magnitude of extreme precipitation, the demand for observation systems capable of accurately capturing short-duration, high-intensity events is increasing, while the limitations of existing frameworks are becoming more apparent. Geostationary (GEO) satellites play a pivotal role in precipitation monitoring due to their high temporal continuity, with the Korean Geo-Kompsat-2A (GK-2A), launched in 2018, providing continuous observations via its Advanced Meteorological Imager (AMI). However, most GEO-based precipitation products rely primarily on infrared (IR) observations, which estimate surface rainfall indirectly from cloud-top radiative properties. Because GEO-based IR precipitation retrievals infer rainfall indirectly from cloud-top signals, a structural limitation arises when cloud-top properties become decoupled from near-surface precipitation processes. This motivates a systematic evaluation of the performance and applicability of GEO IR-based precipitation products under diverse environmental conditions.

In this study, the performance characteristics of the GK-2A precipitation product were evaluated using five years of data (2020–2024) over South Korea, compared against observations from 98 Automated Surface Observing System (ASOS) stations. Quantitative evaluation was conducted for hourly and daily accumulated precipitation using the correlation coefficient (R), Kling–Gupta efficiency (KGE), and unbiased RMSE (ubRMSE), while categorical detection performance was assessed using Accuracy, probability of detection (POD), and false alarm ratio (FAR). Analyses were performed separately for rainy and non-rainy seasons and further stratified by environmental conditions, including air temperature, humidity, cloud fraction, coastal proximity, and terrain ruggedness index (TRI). The microwave-based GPM IMERG product was used as a reference to contextualize the behavior of the IR-based GK-2A estimates.

Results indicate that GK-2A generally exhibits lower correlation and higher error than GPM IMERG, with performance differences becoming more pronounced under specific environmental conditions. Notably, under low temperature and humidity conditions and in coastal regions, GK-2A shows statistically significant performance degradation (p<0.01), characterized by reduced correlation and increased estimation error. In contrast, GPM IMERG maintains relatively stable performance across the same environmental regimes, suggesting that the observed degradation in GK-2A is closely linked to conditions under which cloud-top radiative signals inadequately represent surface precipitation.

By identifying environmental regimes associated with systematic performance degradation, this study clarifies the limitations of GEO IR-based precipitation estimation. The GK-2A case study provides insights applicable to other GEO IR precipitation products and highlights the need for algorithm refinement and multi-sensor integration strategies, particularly incorporating microwave observations, to improve the robustness of high-frequency satellite-based precipitation monitoring under changing climate conditions.


Key Words : Climate change; rainfall intensity; extreme precipitation; ground-based observation; ASOS; GEO-KOMPSAT-2A (GK-2A) satellite


This work was supported by the National Research Foundation of Korea(NRF) grant funded by the Korea government(MSIT) (RS-2025-23523230).


How to cite: Park, S. and Kim, S.: Reliability Assessment and Applicability Analysis of Geostationary Satellite-Based Precipitation Observations for Climate Change Response , EGU General Assembly 2026, Vienna, Austria, 3–8 May 2026, EGU26-16885, https://doi.org/10.5194/egusphere-egu26-16885, 2026.

EGU26-17336 | ECS | Posters on site | AS1.12

Quantitative Precipitation Estimation from SEVIRI IR Data Using Generative AI 

Selina Janner, Luca Glawion, Julius Polz, and Christian Chwala

Accurate near-real-time precipitation estimates are essential for hydrometeorological applications, but are largely limited to regions equipped with ground-based observation networks or rely on infrequent overpasses of low-Earth-orbiting satellites. Geostationary satellites (GEOs) provide continuous, large-scale observations of the atmosphere and surface, offering valuable but indirect information on precipitation. Near-real-time products derived from GEOs face challenges in capturing the occurrence and spatiotemporal variability of rainfall.

We present a conditional Generative Adversarial Network (cGAN) designed to derive quantitative precipitation estimates (QPE) from MSG SEVIRI data. The deep learning model learns the complex, nonlinear relationships between multi-spectral satellite data and surface precipitation. Via the cGAN architecture, with its discriminator, the model is able to predict realistic precipitation fields which also include high and extreme rainfall rates. The model is also able to produce an ensemble of QPE realizations. Model training is done with the high-resolution (1km and 5-minute, aggregated to SEVIRI-resolution) weather radar data RADKLIM-YW in Germany where model performance is also validated. Compared to PDIR-now, from the PERSIANN-family of GEO rainfall products, it shows significant improvement, e.g. PCC increased from 0.32 to 0.47, FARatio decreased from 0.66 to 0.50, POD increased from 0.39 to 0.62. In this contribution we explain the model architecture and show a validation spanning multiple months of data, as well as selected case studies. Furthermore, we discuss planned extensions to additional datasets and the application to the full SEVIRI disc.

How to cite: Janner, S., Glawion, L., Polz, J., and Chwala, C.: Quantitative Precipitation Estimation from SEVIRI IR Data Using Generative AI, EGU General Assembly 2026, Vienna, Austria, 3–8 May 2026, EGU26-17336, https://doi.org/10.5194/egusphere-egu26-17336, 2026.

EGU26-17573 | ECS | Posters on site | AS1.12

Quality Control Algorithms for Precipitation Data - An Intercomparison using Personal Weather Stations 

Damaris Zulkarnaen, Tom Keel, Azharuddin Mohammed, Amy Green, Christian Chwala, and Jochen Seidel

Official rain gauge networks are usually too sparse to capture the spatio-temporal variability of precipitation. To increase network density and thus improve quantitative precipitation estimates, data from crowdsourced personal weather stations (PWS) can be deployed. As these gauges are not professionally placed and maintained, a thorough quality control (QC) prior to the application of PWS data is essential. Although there are currently no standards and guidelines on the QC of rainfall data, two open-source QC frameworks have been developed in recent years. Those are: first, the pypwsqc package (Chwala et al., 2026), which was developed in particular as QC for PWS networks and includes algorithms developed by de Vos et al. (2019) and Bárdossy et al. (2021); and second, RainfallQC, which covers the GSDR-QC framework developed by Lewis et al. (2021). Those QC frameworks are published as Python packages and include several modular methods, filters or checks that can be applied either individually or as a whole framework. 

In this case study, we will explore whether a merged QC approach that combines checks from both frameworks yields better results than the single application of any framework. For this intercomparison, we exploit high-temporal resolution data from a dense network of 12 reliable rain gauges, and around 300 PWS from Reutlingen, Germany. The PWS output of the best QC approach will then be benchmarked against data from nearby professional gauges using precipitation sums and maxima for single events as well as the whole investigation period.

Our results suggest best practices for carrying out QC on rainfall data from PWS, and for different types of rainfall events. We suggest that developing, maintaining and continuously improving open-source QC algorithms supports the use of PWS data in hydrological research.


References

de Vos, L. W., Leijnse, H., Overeem, A., and Uijlenhoet, R.: Quality control for crowdsourced personal weather stations to enable operational rainfall monitoring, Geophysical Research Letters, 46, 8820–8829, 2019. DOI:10.1029/2019GL083731

Bardossy, A., Seidel, J., El Hachem, A.:The use of personal weather station observations to improve precipitation estimation and interpolation, Hydrology and Earth System Sciences, 25, 583-601, 2021. https://doi.org/10.5194/hess-25-583-2021

Chwala, C. et al.: Open-source tools for processing opportunistic rainfall sensor data: An overview of existing tools and the new opensense software packages poligrain, pypwsqc and mergeplg. Submitted to  Hydrology and Earth System Sciences, 2026. 

Lewis, E., Pritchard, D., Villalobos-Herrera, R., Blenkinsop, S., McClean, F., Guerreiro, S., Schneider, U., Becker, A., Finger, P., Meyer-Christoffer, A., Rustemeier, E., Fowler, H. J.: Quality control of a global hourly rainfall dataset, Environmental Modelling & Software, 144, 2021. https://doi.org/10.1016/j.envsoft.2021.105169

How to cite: Zulkarnaen, D., Keel, T., Mohammed, A., Green, A., Chwala, C., and Seidel, J.: Quality Control Algorithms for Precipitation Data - An Intercomparison using Personal Weather Stations, EGU General Assembly 2026, Vienna, Austria, 3–8 May 2026, EGU26-17573, https://doi.org/10.5194/egusphere-egu26-17573, 2026.

EGU26-18166 | ECS | Orals | AS1.12

 Refining Diurnal Cycle Patterns in GSMaP Satellite Precipitation Data Through Satellite Data Fusion 

Rakesh Teja Konduru, Moeka Yamaji, Masafumi Hirose, Munehisa K Yamamoto, Takuji Kubota, Hitoshi Hirose, and Tomoo Ushio

With the advent of the satellite era, numerous sensors have been deployed to measure precipitation from space, utilizing different regions of the electromagnetic spectrum from high-frequency visible wavelengths to low-frequency microwaves. Each sensor type provides global precipitation estimates based on its sampling characteristics, but these estimates vary in accuracy and temporal resolution. To overcome individual limitations, several efforts have focused on integrating data from multiple sensors. Global Satellite Mapping of Precipitation (GSMaP), developed by JAXA, is one such initiative that combines infrared (IR) and microwave observations to produce hourly global precipitation estimates. However, IR-based estimates, which rely on cloud-top brightness temperatures, often misrepresent the timing of precipitation peaks. Conversely, microwave-based estimates, though physically more accurate, suffer from sparse temporal sampling because satellites observe a location only at specific times, making full diurnal coverage challenging. These limitations introduce temporal biases in IR-derived diurnal cycles, evident in GSMaP, particularly along coastlines, mountainous regions, and oceans.

To address these issues, we implemented a satellite data fusion approach aimed at refining the diurnal cycle of precipitation in the GSMaP. We leveraged extensive TRMM Precipitation Radar (PR) and GPM Ku-band Precipitation Radar (KuPR) observations collected across various diurnal periods to construct a blended PR–KuPR dataset, offering the most reliable global diurnal sampling of precipitation. Building on this dataset, we developed a data assimilation framework using a Kalman Filter to incorporate the climatological diurnal cycle from PR–KuPR into the GSMaP methodology. This process produced a GSMaP version with the diurnal cycle corrected (DCC), which significantly improves the representation of precipitation’s diurnal cycle over oceans, coastlines, and complex terrains.

This integration of PR and KuPR blended observations with data assimilation techniques marks a critical step toward reducing biases in satellite-based diurnal cycle of precipitation products and enhancing their utility for scientific and operational applications. This advancement enables robust global climatological analyses of precipitation’s diurnal variability, providing a more accurate foundation for hydrological studies, climate modeling, and extreme weather assessments.

How to cite: Konduru, R. T., Yamaji, M., Hirose, M., Yamamoto, M. K., Kubota, T., Hirose, H., and Ushio, T.:  Refining Diurnal Cycle Patterns in GSMaP Satellite Precipitation Data Through Satellite Data Fusion, EGU General Assembly 2026, Vienna, Austria, 3–8 May 2026, EGU26-18166, https://doi.org/10.5194/egusphere-egu26-18166, 2026.

EGU26-18192 | ECS | Posters on site | AS1.12

A 1-km Daily Gridded Climate Dataset for the Po River District (1991–2020): Regionalized Kriging within the GEOframe-NewAGE Framework 

Hossein Salehi, Daniele Andreis, Gaia Roati, John Mohd Wani, Marco Brian, Francesco Tornatore, Giuseppe Formetta, and Riccardo Rigon

High-resolution, temporally consistent climate datasets are essential for hydrological modeling, water resource management, and climate impact assessments. The Po River District is the largest in Italy, spanning from the Alps to the plains, and exhibits substantial spatial heterogeneity in precipitation and temperature. However, existing datasets lack the spatial resolution necessary to capture the basin's diverse microclimates and complex orographic patterns, limiting their utility for process-based hydrological modeling and local-scale climate impact studies.

In this study, we generated a high-resolution (1 km x 1 km) daily gridded precipitation and temperature dataset over the Po River District. Following WMO standards, this 30-year (1991–2020) dataset provides a robust baseline for a region identified as one of Europe's most vulnerable climate change hotspots. The datasets were generated using the Kriging module available within the GEOframe-NewAGE modeling system, applied to quality-controlled ground station data. To address the vast area and topographic complexity, we implemented a spatial regionalization framework using Gaussian Mixture Models (GMM) to identify homogeneous climate zones. Zone-specific variogram models were derived and applied within the optimized Kriging framework. 

The model performance was rigorously evaluated using Leave-One-Out Cross-Validation (LOOCV) method. The validation results show exceptional accuracy for both variables. For temperature, the Kling-Gupta Efficiency (KGE) exceeded 0.75 at 99.7% of the stations, with strong correlations (>0.95). Notably for precipitation, over 80% of stations achieved KGE and correlation values above 0.75. The KGE decomposition revealed that errors primarily stemmed from variability estimation rather than bias, with 93% of stations showing optimal variance ratios (α = 0.75–1.25) and 99% maintaining near-unity bias (β ≈ 1).

This high-resolution dataset represents a significant advancement in regional climate data for the Po River District. The GMM-based regionalization successfully captured the basin's complex climatic regimes, enabling accurate spatial interpolation across diverse topographies. Beyond providing a WMO-compliant climatological baseline, these datasets are specifically designed to serve as high-resolution meteorological forcing input for distributed hydrological models, enabling process-based watershed simulations at unprecedented spatial detail. Future work will focus on coupling these datasets with the GEOframe-NewAGE hydrological modeling framework to assess the added value of 1-km climate forcing in capturing sub-basin scale hydrological responses, extreme event dynamics, and water balance components across the heterogeneous Po River landscape.

Acknowledgement

HS, JMW and RR would like to thank and acknowledge the funding support from Project “SPACE IT UP! ASI Contract n.2024-5-E.0 CUP Master n. I53D24000060005” SAP fund n: 000040104905.

How to cite: Salehi, H., Andreis, D., Roati, G., Wani, J. M., Brian, M., Tornatore, F., Formetta, G., and Rigon, R.: A 1-km Daily Gridded Climate Dataset for the Po River District (1991–2020): Regionalized Kriging within the GEOframe-NewAGE Framework, EGU General Assembly 2026, Vienna, Austria, 3–8 May 2026, EGU26-18192, https://doi.org/10.5194/egusphere-egu26-18192, 2026.

EGU26-18885 | ECS | Orals | AS1.12

Global Attribution of Precipitation to Weather Features – Present and Future Climate and the Role of Fronts for Extreme Precipitation 

Kjersti Konstali, Clemens Spensberger, Asgeir Sorteberg, and Thomas Spengler

Weather features, such as extratropical cyclones (ETCs), atmospheric rivers (ARs), and fronts, contribute to substantial amounts of precipitation globally. We introduce a robust attribution method applicable at all latitudes present the first global climatology of the contributions from extratropical cyclones (ETCs), fronts, moisture transport axes (MTAs; AR-like features), and cold air outbreaks, as well as their combinations, to summer and winter precipitation as well as extreme precipitation using ERA5 and 10 ensemble members of the CESM2‐ LE. For the present climate, most of the precipitation in the midlatitudes relates to the combination of ETC, fronts, and MTAs (28%), while in polar regions most precipitation occurs within the ETC-only category (27%). Extreme precipitation events in all extratropical regions are predominantly associated with the combination of ETCs, fronts, and MTAs (46%). In the midlatitudes, the combination of ETCs, fronts, and MTAs occurs almost 4 times as often during extreme events compared to regular events.

For the period 1960-2100 under the SSP3‐7.0 scenario, we find that CESM2‐LE adeptly represents the precipitation characteristics associated with the different combinations of weather features. The combinations of weather features that contribute most to precipitation in the present climate also contribute the most to future changes, both due to changes in intensity as well as frequency. While the increase in precipitation intensity dominates the overall response for total precipitation in the storm track regions, the precipitation intensity for the individual weather features does not necessarily change significantly. Instead, approximately half of the increase in precipitation intensity in the storm track regions can be attributed to a higher occurrence of the more intensely precipitating combinations of weather features, such as the co‐occurrence of extratropical cyclones, fronts, and moisture transport axes.

Given that most of the extreme precipitation in the extratropics is associated with cyclones, fronts, and moisture transport axes, we also analyse the changes in precipitation characteristics associated with these weather features, as well as their combinations. We find that extreme precipitation associated with fronts increases substantially in the extratropics. Extreme precipitation associated with non‐frontal conditions, on the other hand, does not increase and even decreases in some regions. Hence, atmospheric fronts are the main driver of future extreme precipitation changes in the extratropics.

How to cite: Konstali, K., Spensberger, C., Sorteberg, A., and Spengler, T.: Global Attribution of Precipitation to Weather Features – Present and Future Climate and the Role of Fronts for Extreme Precipitation, EGU General Assembly 2026, Vienna, Austria, 3–8 May 2026, EGU26-18885, https://doi.org/10.5194/egusphere-egu26-18885, 2026.

EGU26-20360 | ECS | Posters on site | AS1.12

Assessing the Contribution of the Arctic Weather Satellite to Improved Observation of Extreme Cyclonic Events: the hurricane Melissa Case Study 

Andrea Camplani, Paolo Sanò, Daniele Casella, Leo Pio D'Adderio, Stefano Sebastianelli, Daniele D'Armiento, Laura Soncin, and Giulia Panegrossi

The launch of the ESA Arctic Weather Satellite Path Finder Mission (AWS-PFM), forerunner of the EUMETSAT EPS-Sterna mission, equipped with a cross-track scanning radiometer (Microwave Radiometer, MWR) which covers frequency between 50 and 325 GHz, represents an important improvement in satellite meteorology. The MWR represents a significant innovation in microwave radiometry, due to its four channels in the 325.15 GHz band offering enhanced sensitivity to cloud ice, thus enabling precise cloud observation.Exploiting coincident overpasses over precipitation events between the AWS and spaceborne radars, such as the Dual-frequency Precipitation Radar (DPR) onboard the NASA/JAXA GPM-CO mission and the Cloud Profiling Radar (CPR) onboard the ESA/JAXA EarthCare mission, can improve our understanding on the relationship between the cloud structure and the signal observed by the radiometer.    

This work presents  a case study concerning a nearly coincident overpass of GPM-CO and AWS-PFM over Hurricane Melissa, a tropical cyclone that developed into a Category 5 during the 2025 Atlantic season. The observations took place on October 30, 2025, when Melissa had weakened to Category 2. The possibility to observe this type of event combining dual-polarization microwave (PMW) channels — available from the GPM Microwave Imager — with the sub-mm channels — available from the AWS-PFM MWR — as well as the measurements and precipitation profiles available from the DPR provides unprecedented potential for improving our understanding of the dynamics and microphysics processes in tropical cyclones. An analysis combining DPR observations and GMI brightness temperature (TB) is carried out based on our previous work regarding the analysis of Mediterranean tropical-like cyclonic events, such as Medicane Ianos, classified as category 1 hurricane at its peak of intensity. In addition, the combination of multi-channel measurements from AWS-PFM MWR reveal the added value of the sub-mm channels at 325.15 GHz to relate the cloud top structure with precipitation features. The comparison between Medicane Ianos and hurricane Melissa shows remarkable similarities at the time of the GPM-CO/AWS-PFM overpass. In both cases, very high Ku-band radar reflectivity values (around 50 dBZ) are associated with very intense precipitation (around 100 mm/h), which does not correspond to extreme TB features usually observed in the presence of strong updrafts sustaining large frozen hydrometeors at the upper levels. This indicates that, even during extremely intense cyclonic phenomena, the development of intense convective cores is limited. 

This analysis is ancillary to the future launch of the EPS Sterna mission, a constellation of AWS-like small satellites, designed to improve weather forecasts by providing global measurements of atmospheric temperature, humidity profiles as well as cloud and precipitation features with frequent revisit times.

How to cite: Camplani, A., Sanò, P., Casella, D., D'Adderio, L. P., Sebastianelli, S., D'Armiento, D., Soncin, L., and Panegrossi, G.: Assessing the Contribution of the Arctic Weather Satellite to Improved Observation of Extreme Cyclonic Events: the hurricane Melissa Case Study, EGU General Assembly 2026, Vienna, Austria, 3–8 May 2026, EGU26-20360, https://doi.org/10.5194/egusphere-egu26-20360, 2026.

EGU26-20663 | Orals | AS1.12

First results and future directions of the Global Microwave Data Collection Initiative (GMDI) to scale up the usage of commercial microwave link data for rainfall observation 

Christian Chwala, Martin Fencl, Vojtěch Bareš, Aart Overeem, Remko Uijlenhoet, Roberto Nebuloni, Tanja Winterrath, Jonatan Ostrometzky, Hagit Messer, Remco van de Beek, Erlend Øydvin, Kwinten Van Weverberg, and Marielle Gosset

Accurate quantitative precipitation estimation (QPE) remains a critical challenge in many data-scarce regions, particularly across low- and middle-income countries. Recent research in Sri Lanka, Burkina Faso, Zambia, Nigeria, Ghana and Cameroon has demonstrated that Commercial Microwave Links (CMLs) can bridge this gap, providing rainfall data with high temporal resolutions (1–15 minutes) that can outperform satellite products like IMERG in both accuracy and spatial detail, especially in densely populated urban areas where CML density is high.

While the technical feasibility of CML-based rainfall observation is well-established, its widespread implementation is often hindered by legal, business, and organizational barriers. To address these issues, the SetGMDI project, a strategic outcome of the COST Action OpenSense, is working on setting up the Global Microwave Data Collection Initiative (GMDI). The SetGMDI consortium, comprising mobile network operators (MNOs), hardware vendors, national meteorological and hydrological services (NMHSs), and academia, is building a sustainable, scalable solution for global collection of CML data for rainfall monitoring. 

In this contribution, we present results from the first pilot studies utilizing a prototype of the technological core system of GMDI: The Data Collection, Archiving, and Processing (CAP) system. The CAP system enables real-time data flows and interactively explores large data archives of CML data combined with meteorological datasets.  Furthermore, we discuss the legal and organizational framework necessary to formalize long-term data-sharing agreements with MNOs, balancing commercial sensitivity with the public good resulting from improved precipitation observations.

The CAP system creates vital synergies by providing NMHSs with access to high-resolution data for hydrometeorological applications, while MNOs and vendors benefit from meteorological insights to optimize network management. By addressing both organizational and technical barriers, GMDI will significantly increase the global availability of CML data, improving rainfall observations in particular in the Global South. This will also pave the way for integrating satellite and CML rainfall estimates, ultimately strengthening flood early warning systems, water management, and climate adaptation strategies worldwide.

How to cite: Chwala, C., Fencl, M., Bareš, V., Overeem, A., Uijlenhoet, R., Nebuloni, R., Winterrath, T., Ostrometzky, J., Messer, H., van de Beek, R., Øydvin, E., Van Weverberg, K., and Gosset, M.: First results and future directions of the Global Microwave Data Collection Initiative (GMDI) to scale up the usage of commercial microwave link data for rainfall observation, EGU General Assembly 2026, Vienna, Austria, 3–8 May 2026, EGU26-20663, https://doi.org/10.5194/egusphere-egu26-20663, 2026.

EGU26-21151 | Posters on site | AS1.12

Evaluation of Satellite-based and Re-analysis Precipitation Products over Canada 

Koray K. Yilmaz, Jose Salinas, Akhila Bharathi, and Kedar Otta

Flood risk is influenced by a complex interplay between many climatic and non-climatic factors. Among these, heavy precipitation events stand out as one of the primary drivers of flooding. Therefore, the availability and accuracy of precipitation datasets are essential for reliable assessment of flood risk. This study undertakes a comparative analysis of several precipitation products for selected historical large flood events across Canada. The products under investigation include the satellite-based GPM IMERG product, the ERA5-Land reanalysis product, and the Daymet product, which is used as a reference. Since snowfall is frequent and snowmelt is a main driver of flood events in many parts of Canada, our analysis is extended to compare the precipitation products considering surface conditions; i.e. surfaces with and without snow and ice. The evaluation employs a combination of categorical and statistical metrics to assess the accuracy and reliability of the precipitation products. Categorical metrics include the probability of detection, false alarm ratio, and Heidke skill score. Statistical measures such as the correlation coefficient and volume bias are also analysed. These metrics are analysed as functions of precipitation rate, precipitation phase, and surface type. The outcomes of this analysis are anticipated to offer valuable insights for flood modelling studies focused on Canada. Furthermore, the results are expected to provide constructive feedback to algorithm developers, supporting the enhancement of precipitation products, particularly in regions dominated by snow.

How to cite: Yilmaz, K. K., Salinas, J., Bharathi, A., and Otta, K.: Evaluation of Satellite-based and Re-analysis Precipitation Products over Canada, EGU General Assembly 2026, Vienna, Austria, 3–8 May 2026, EGU26-21151, https://doi.org/10.5194/egusphere-egu26-21151, 2026.

EGU26-21391 | Posters on site | AS1.12

Quality control of weighing precipitation gauge measurements 

Niko Filipovic

Weighing precipitation gauges are increasingly being used for ground-based precipitation monitoring because of their greater accuracy compared to tipping bucket gauges, especially in cases of high precipitation intensity and when measuring solid precipitation. Another advantage highlighted by manufacturers of weighing gauges is their lower maintenance requirements. For automatic precipitation measurement GeoSphere Austria currently uses tipping bucket gauges and weighing gauges, the latter with two orifice sizes of 400 cm² and 500 cm². Each of the gauges is equipped with a precipitation detection instrument.

Despite their good performance characteristics, weighing precipitation gauges are sometimes subject to errors, which can be divided into two groups. The first group includes, for example, data outside the measurement range or other errors related to high- or low-amplitude noise, such as incorrect precipitation measurements caused by decanting and/or refilling of the bucket, as well as temperature- or wind-induced errors due to inappropriate noise filtering by the gauge software (spurious precipitation). The other group of errors is related to missing precipitation recordings, mainly caused by internal problems with the gauge-software – this is the opposite case to spurious precipitation measurements, where the internal filter is too restrictive and thus discards the weight gain during a precipitation event.

During quality control process, the data should be corrected for both types of errors wherever possible. The quality control and correction of high-amplitude noise or spurious precipitation values can be performed using appropriate algorithms that are part of the standard check routines (out-of-range tests, internal consistency checks, etc.). Correcting the second type of error (missing precipitation data) is more difficult because the algorithms underlying the data generation by the gauge are unknown (black-box) and there is no way to recover the lost data.

In cases where the internal software filtering is too aggressive, raw bucket-level data could be used to provide an estimate of the missing precipitation amount. In an attempt to account for this source of error at the gauge level, we have developed an automated procedure that combines the change in bucket weight recorded by weighing gauge with measurements from an independent instrument (precipitation monitor) based on 1-min data to filter out mechanical noise and estimate the amount of precipitation that is not recorded by the gauge software. The idea behind this algorithm is that it should be an additional decision-making support for quality control of daily precipitation data in order to obtain precipitation information lost due to software-related issues with the precipitation gauge.

How to cite: Filipovic, N.: Quality control of weighing precipitation gauge measurements, EGU General Assembly 2026, Vienna, Austria, 3–8 May 2026, EGU26-21391, https://doi.org/10.5194/egusphere-egu26-21391, 2026.

EGU26-22069 | Orals | AS1.12

The Airborne Phased Array Radar (APAR): Implementation, Lessons Learned, and Path Forward 

Everette Joseph, Wen-Chau Lee, and Allison McComiskey

The Airborne Phased Array Radar (APAR) Mid-Scale Research Infrastructure-2 (MSRI-2) award was made by the National Science Foundation (NSF) to NSF National Center for Atmospheric Research (NCAR) for construction, installation, and flight testing of the four C-band Active Electronically Scanned Array (AESA) panels on the NSF NCAR C-130 ready for deployment by 2028. APAR’s dual-Doppler and dual-polarization capabilities would provide unprecedented observations of the dynamics and microphysics characteristics of hurricanes, atmospheric rivers, explosive cyclones, and other weather phenomena with impacts from mesoscale to global scale. The APAR MSRI-2 project included partnerships among NSF NCAR, NOAA, multiple universities, and private industry. The APAR design can be adapted for operation in the future.


While work proceeded on schedule and within budget during 2023 and early 2024, cost and schedule delays began to materialize in the second half of 2024 due to unexpected technical challenges from contractors. Before NSF made the decision to cancel the APAR MSRI-2 project in April 2025, significant progress had been made including software for radar backend and scientific analysis, thermal control of the AESA panel, and aircraft mounting structure design. Additionally, lessons learned by NSF NCAR and the efforts to address the technical challenges encountered have lowered the research and development risks for future APAR-like development efforts. The demand for APAR capability from the research and weather forecasting communities remains high and NSF NCAR is committed to taking the knowledge gained from the APAR MSRI-2 project and finding a new path for developing and delivering an airborne phased array radar capability.

How to cite: Joseph, E., Lee, W.-C., and McComiskey, A.: The Airborne Phased Array Radar (APAR): Implementation, Lessons Learned, and Path Forward, EGU General Assembly 2026, Vienna, Austria, 3–8 May 2026, EGU26-22069, https://doi.org/10.5194/egusphere-egu26-22069, 2026.

EGU26-22112 | Orals | AS1.12

OpenSSP Portal Grand Reopening: A Milestone Towards NASA PaSS 

Kwo-Sen Kuo, Bruce Altner, That-Dai-Hai Ton, Robert Schrom, Ian Adams, George Huffman, and Scott Braun

OpenSSP, standing for Open Single-Scattering Properties, is first a database of numerically grown or constructed, realistic solid hydrometeors and their (scalar) single scattering properties (SSPs), and secondly a web interface (portal) to the database for interested researchers to obtain particle structure(s) and their corresponding SSPs. 
We started the OpenSSP web interface around 2016. It was programmed in JavaScript (JS) and hosted by the Precipitation Processing System (PPS) of NASA. However, the original developer left in 2018, and the JS-based web interface started falling out of date. By 2023, some most useful functions of the portal became unreliable, for example, getting SSPs for an ensemble of particles specified by a particle size distribution (PSD) and/or a mass-dimensional (m-D) relation.
NASA's Global Precipitation Mission (GPM) and the Atmospheric Observing System (AOS) projects provided in 2023 support for the renewal of OpenSSP as the first step toward a much richer NASA Particle and Single-Scattering Database, PaSS DB, which will feature an augmented non-liquid hydrometeor collection, including melting hydrometeors and additional solid hydrometeors, with polarimetric SSPs for multiple particle orientations. We also envision a mechanism for NASA PaSS to accept community contributions to the database and to include other non-spherical particle species, such as aerosol, dust, or salt particles.
OpenSSP is now back in operation at a different URL, https://ParticleScattering.org. (The original URL, https://storm.pps.eosdis.nasa.gov/storm/OpenSSP.jsp, is now defunct.) The following are some notable changes. OpenSSP used to use an HDF file as a convenient substitute for a database management system (DBMS); it now employs a bona fide relational DBMS, PostgresQL, to offer better performance in anticipation for the vastly increased data volume of NASA PaSS DB. We have also tweaked the graphical interface to make OpenSSP more intuitive and useable.

How to cite: Kuo, K.-S., Altner, B., Ton, T.-D.-H., Schrom, R., Adams, I., Huffman, G., and Braun, S.: OpenSSP Portal Grand Reopening: A Milestone Towards NASA PaSS, EGU General Assembly 2026, Vienna, Austria, 3–8 May 2026, EGU26-22112, https://doi.org/10.5194/egusphere-egu26-22112, 2026.

To investigate the microphysical characteristics of summer precipitation in the Northern Yellow River Irrigation Area, the Central Arid Zone, and the Southern Mountainous Area of Ningxia, this study analyzed disdrometer data collected from Yinchuan, Yanchi, and Liupanshan stations from 2022 to 2024. A comparative analysis of Raindrop Size Distribution (RSD) was conducted from the perspectives of the overall dataset, different rainfall rates, and precipitation types. The results indicate that the average RSD at Liupanshan station is broader with a higher number concentration of small raindrops, whereas the average RSD at Yinchuan station is narrower with a higher concentration of mid-size raindrops. Under different rainfall rates and precipitation types, the number concentrations of both small and large raindrops increase with rising altitude. Specifically, when the rainfall rate is less than 2mm·h-1, the mass-weighted mean diameter (Dm) gradually decreases while the normalized intercept parameter (log10NW) increases with altitude. When the rainfall rate exceeds , the log10NW at Yanchi and Liupanshan stations surpasses that of Yinchuan station, whereas the Dm is smaller than that of Yinchuan. Furthermore, for a given shape parameter (µ), the slope parameter (⋀) increases with altitude. In convective precipitation events, the empirical relationships tend to overestimate the rainfall intensity at all three stations when the rainfall rate exceeds 20mm·h-1.

How to cite: Xue, Z.: Characteristics of Raindrop Spectrum in different areas of Ningxia during Summer, EGU General Assembly 2026, Vienna, Austria, 3–8 May 2026, EGU26-2128, https://doi.org/10.5194/egusphere-egu26-2128, 2026.

EGU26-5139 | ECS | PICO | HS7.1

Adaptive K–R relationships based on cloud phase classification using SEVIRI observations 

Taoufiq Shit, Martin Fencl, and Vojtěch Bareš

Errors in the representation of the drop size distribution are a major source of uncertainty in rainfall estimation, since both radar reflectivity and microwave attenuation depend nonlinearly on precipitation microphysics. These uncertainties propagate directly into the specific attenuation–rain rate (k–R) relationship through the interaction between electromagnetic waves and hydrometeors, leading to systematic biases when globally fixed coefficients are used. In standard practice, the k–R relationship is expressed as a power law of the form k=aRb, where the coefficients a and b are typically taken from the International Telecommunication Union (ITU) recommendations and assumed to be globally applicable. The use of the ITU coefficients implicitly assumes stationary rainfall microphysics, which is physically inconsistent under varying cloud and rain regimes. This highlights the need for stratified parameterizations in which the coefficients are optimized for different microphysical conditions. In this context, cloud phase information from geostationary satellites provides a physically meaningful basis for clustering the k–R relationship, as different cloud phases are associated with distinct precipitation formation processes and drop size distributions.

The objective of this study is to derive cloud phase dependent k–R parameterizations and to assess their performance across a large disdrometer network. A global disdrometer dataset (Ghiggi et al., 2021, DISDRODB) covering multiple climatic regions is used to simulate k–R relationships across a wide frequency range from 5 to 100 GHz using the T-matrix scattering method. SEVIRI MSG observations are used as input to the Cloud Physical Properties (CPP) product provided by the EUMETSAT Climate Monitoring Satellite Application Facility (CM SAF), from which cloud phase is classified into water, supercooled water, mixed phase, deep convective, cirrus, and opaque ice categories. Frequency dependent k–R coefficients are derived separately for each cloud type. The framework is evaluated across more than 100 independent disdrometer sites, primarily concentrated in Europe.

Relative to the ITU recommended model (ITU-R P.838-3), the cloud phase adaptive parameterization substantially reduces root mean square error (RMSE), with the strongest improvements observed at 5 to 8 GHz. At these frequencies, more than 90 percent of sites show lower RMSE, with average reductions reaching up to 1.5 mm.h-1. More moderate improvements are found at higher frequencies from 60 to 100 GHz, where around 60 percent of sites show RMSE reductions, with average improvements below 0.5 mm.h-1.

These results show that cloud phase informed k–R parameterizations can significantly improve rainfall estimation from commercial microwave links and indicate potential applicability to radar systems.

Reference:

Ghiggi, G., Billault-Roux, A. C., Candolfi, K., Pillac-Mage, L., Unal, C., Schleiss, M., Uijlenhoet, R., Raupach, T., and Berne, A.: DISDRODB – A global disdrometer archive of raindrop size distribution observations, PrePEP 2025, Karlsruhe, Germany, 10–12 March 2025, https://indico.kit.edu/event/4015/contributions/18545/, 2025.


This work was supported by the Czech Science Foundation (GACR), Czech Republic, under Grant No. 24-13677L (MERGOSAT).

How to cite: Shit, T., Fencl, M., and Bareš, V.: Adaptive K–R relationships based on cloud phase classification using SEVIRI observations, EGU General Assembly 2026, Vienna, Austria, 3–8 May 2026, EGU26-5139, https://doi.org/10.5194/egusphere-egu26-5139, 2026.

EGU26-6612 | ECS | PICO | HS7.1

Do Satellite-Based Precipitation Datasets Capture Flash Flood-Producing Cloudburst Events? 

Nandana Dilip K and Vimal Mishra

Cloudbursts and mini-cloudbursts are on the rise over India, frequently triggering flash floods. According to the India Meteorological Department (IMD), a cloudburst is defined as rainfall exceeding 100 mm in an hour over a spatial extent of 20-30 km², while mini-cloudbursts are characterized by rainfall of about 50 mm in an hour. Although IMD issues cloudburst reports within 24 hours of occurrence, accurate identification and categorization of these events remain challenging in several regions due to the sparse distribution of meteorological stations, particularly in complex terrain. Satellite-based observations provide high spatial coverage and can detect intense clouding or heavy rainfall events. However, satellites often infer rainfall or cloud properties from radiance, which can introduce uncertainties compared to direct ground measurements. Here, we assess how effectively satellite-based precipitation datasets capture cloudburst events over India by comparing satellite-based rainfall estimates with station-based hourly observations. We evaluate the performance of IMERG and ERA5-Land datasets to identify regions where satellites successfully detect cloudburst events and regions where their performance is limited across India. The results aim to improve understanding of the regional strengths and limitations of satellite datasets for monitoring extreme rainfall and enhancing flash flood preparedness in data-sparse regions of India.

How to cite: Dilip K, N. and Mishra, V.: Do Satellite-Based Precipitation Datasets Capture Flash Flood-Producing Cloudburst Events?, EGU General Assembly 2026, Vienna, Austria, 3–8 May 2026, EGU26-6612, https://doi.org/10.5194/egusphere-egu26-6612, 2026.

Precipitation falling onto vegetation is partly intercepted by the canopy and subsequently evaporates, while the remainder reaches the ground as throughfall or stemflow. Throughfall refers to precipitation that reaches the ground after crossing the canopy. It comprises free throughfall (raindrops not intercepted), drips, and splash droplets. Different rainfalls and foliage yield different number, size and velocity of each throughfall droplet type [1]. The resulting drop size distribution significantly affects infiltration and surface runoff processes [2]. Moreover, drips may induce the erosion and compaction of bare soil [3] while splash droplets may transport pathogenic spores [4]. Finally, the part of leaves that remains wet may experience significant leaching or water/nutrient uptake [5].

Predicting throughfall drop size distribution with physical models is complex because the physically relevant scale is that of a raindrop impacting a leaf, while the scale of interest is at least that of a tree. Previous studies (e.g., [6-8]) provided measurements at either scale but never at both. A few numerical models [4, 9-10] were proposed to estimate throughfall statistics and rain-induced transport by modelling interception at raindrop scale, but these models relied on strong and unverified assumptions on drop-scale dynamics.

In this original study, we first provide a detailed experimental characterization of interception at leaf scale. Hundreds of raindrop surrogates impacted single birch leaves. The leaf was weighed and imaged over time, and water storage variations were resolved at the scale of individual impacts. The storage capacity, the wetting-up time, the drip diameter and the splash fraction were measured as functions of the leaf area, the leaf inclination and the raindrop size. The results are extensively compared to previous studies at leaf scale.

Then rain interception is quantified at tree scale, with the same birch species and leaves in the same phenophase. Rain amount, intensity and drop size distribution in both open rainfall and throughfall were measured using two disdrometers positioned respectively above and below the canopy of a birch tree. Free throughfall, splash droplets and drips were separated for selected rainfall events with different intensities. The storage capacity and the wetting-up time were also estimated for each event. We relate these tree-scale measurements to the mechanisms observed at the leaf scale.

[1] D. F. Levia et al., Hydrol. Process. 33, 1698-1708 (2019)

[2] K. Nanko et al., Hydrol. Process. 24, 567-575 (2010)

[3] M. Beczek et al., Geoderma 347, 40-48 (2019)

[4] T. Vidal et al., Ann. Bot. 121, 1299-1308 (2018)

[5] T. E. Dawson and G. R. Goldsmith, New Phytol. 219, 1156-1169 (2018)

[6] C. Bassette and F. Bussière, Agric. For. Meteorol. 148, 991-1004 (2008)

[7] X. Li et al., Agric. For. Meteorol. 218, 65-73 (2016)

[8] C. D. Holder, Ecohydrol. 6(3), 483-490 (2012)

[9] Q. Xiao et al., J. Geophys. Res. 105 (D23), 29173-29188 (2000)

[10] R. P. de Moraes Frasson and W. F. Krajewski, J. Hydrol. 489, 246-255 (2013)

How to cite: Gilet, T. and Zabret, K.: Bridging the scales of rainfall interception, from raindrop impacts on leaves to throughfall under a tree., EGU General Assembly 2026, Vienna, Austria, 3–8 May 2026, EGU26-6681, https://doi.org/10.5194/egusphere-egu26-6681, 2026.

Accurate rainfall measurement remains challenging, even for in-situ point observations commonly considered the “ground truth”, owing to precipitation undercatch primarily caused by wind effects and instrument design. These biases limit reliable rainfall estimation, especially at very high and low intensities, and hinder the robust characterisation of precipitation variability. This study first used disdrometer data from multiple sites across the UK to develop a new rainfall classification system based on observed drop size distributions rather than intensity thresholds alone. The proposed classification distinguished periods of rainfall with similar bulk intensities but different microphysical structures, providing a more physically meaningful framework for precipitation characterisation and supporting the development of more targeted undercatch correction strategies. Second, a custom-built rainfall simulator was developed to replicate the identified rainfall types under controlled laboratory conditions. The simulator enables independent control of rainfall rate and drop size distribution, allowing the reproduction of a wide range of precipitation regimes representative of natural UK rainfall. Controlled experiments were used to systematically quantify the response of rain gauges to different drop populations and intensities, providing new insights into the mechanisms driving undercatch and its dependence on rainfall microstructure. By explicitly linking drop-scale processes, controlled experimentation, and population-level rainfall classification, this work contributes to the improved accuracy of precipitation measurements and the representation of rainfall at hydrologically relevant scales, with direct implications for rainfall monitoring, model input uncertainty, and flood risk assessment.

How to cite: Dunn, R., Fowler, H., Green, A., and Lewis, E.:  Understanding Rain Gauge Undercatch Through Drop Size Distribution–Based Rainfall Classification and Artificial Rainfall Generation, EGU General Assembly 2026, Vienna, Austria, 3–8 May 2026, EGU26-7894, https://doi.org/10.5194/egusphere-egu26-7894, 2026.

EGU26-10315 | PICO | HS7.1

Leveraging opportunistic rainfall sensors to improve hydrological flood modelling in a peri-urban catchment 

Andrijana Todorović, Nebuloni Roberto, De Michele Carlo, Cazzaniga Greta, Deidda Cristina, Kovačević Ranka, and Ceppi Alessandro

Accurate flood simulations necessitate rainfall inputs with fine spatiotemporal resolution, especially if semi- or fully-distributed hydrological models are used. Rainfall data are commonly obtained from rain gauges and/or weather radars, each with their associated uncertainties and challenges, especially with capturing heavy, localised events, and with high implementation- and maintenance costs [1]. This further translates into high costs of hydrological modelling of flood events [2].

An interesting alternative to rain gauges and radars are the rainfall data gathered from opportunistic sensors, such as Commercial Microwave Links (CMLs). CML data come at no infrastructure cost as they are generated by the network management system of mobile networks to monitor link performance. Furthermore, CMLs cover a large part of the world. Their strong potential to providing near-surface, fine-resolution rainfall fields has been demonstrated in many studies [3]. However, their usage for hydrological modelling has been little investigated so far. CML data have been mostly used for fully-distributed models in small catchments with an area of few square kilometres [1], with isolated examples of application in large catchments and/or with semi-distributed models [1],[4].

In this study, we analyse the impact of various modelling decisions about application of CML rainfall data on simulated flood hydrographs. Specifically, selection of (i) the approach to pre-processing CML signals to obtain hyetographs [3], (ii) CML data usage as a standalone input or in a combination with conventional datasets, and (iii) the way to calculate sub-catchment-averaged rainfall, are analysed. Different rainfall inputs are created accordingly, and used to force a semi-distributed model of the pre-alpine, peri-urban Lambro catchment in northern Italy notorious for intensive, tightly-localised events that trigger floods [4]. The simulated hydrographs of twelve flood events are compared to the observed ones in terms of the Nash-Sutcliffe coefficient, relative errors in peak magnitudes and runoff volumes, and timing of peak occurrence. Based on our analyses, specific recommendations are provided, with the ultimate goal to promote a wider application of CML data for hydrological modelling.


Acknowledgments

The authors would like to thank the “OpenSense” COST Action (CA20136) for supporting their collaboration through the STSM program.

References

[1]           J. Olsson et al., ‘How close are opportunistic rainfall observations to providing societal benefit?’, Journal of Hydrometeorology, Aug. 2025, doi: 10.1175/JHM-D-25-0043.1.

[2]           J. Seibert, F. M. Clerc‐Schwarzenbach, and H. J. (Ilja) Van Meerveld, ‘Getting your money’s worth: Testing the value of data for hydrological model calibration’, Hydrological Processes, vol. 38, no. 2, p. e15094, Feb. 2024, doi: 10.1002/hyp.15094.

[3]           S. C. Doshi, C. De Michele, G. Cazzaniga, and R. Nebuloni, ‘A Framework for Minimizing the Impact of Wet Antenna Attenuation on Rainfall Estimates Provided by Commercial Microwave Links’, IEEE J. Sel. Top. Appl. Earth Observations Remote Sensing, vol. 19, pp. 421–437, 2026, doi: 10.1109/JSTARS.2025.3632933.

[4]           G. Cazzaniga, C. De Michele, M. D’Amico, C. Deidda, A. Ghezzi, and R. Nebuloni, ‘Hydrological response of a peri-urban catchment exploiting conventional and unconventional rainfall observations: the case study of Lambro Catchment’, Hydrol. Earth Syst. Sci., vol. 26, no. 8, pp. 2093–2111, Apr. 2022, doi: 10.5194/hess-26-2093-2022.

How to cite: Todorović, A., Roberto, N., Carlo, D. M., Greta, C., Cristina, D., Ranka, K., and Alessandro, C.: Leveraging opportunistic rainfall sensors to improve hydrological flood modelling in a peri-urban catchment, EGU General Assembly 2026, Vienna, Austria, 3–8 May 2026, EGU26-10315, https://doi.org/10.5194/egusphere-egu26-10315, 2026.

Rainfall retrieval algorithms for weather radars are linked to assumptions about drop size distributions (DSDs), but DSD properties vary strongly across rainfall regimes. To reduce regime-dependent biases in radar-based quantitative rainfall estimation, we use high-temporal-resolution disdrometer observations to quantify microphysical differences between strong convection, embedded convection, and stratiform rainfall with a bright-band, and to test how well these regimes can be separated in the (Dm, log10Nw) phase space, where Dm is the mass-weighted mean diameter and Nw the normalized intercept parameter.

Our analysis shows a systematic convective–stratiform contrast. Strong convection has larger characteristic drop sizes and higher normalized concentrations (mean Dm ≈ 1.07 mm; mean Nw ≈ 2.93 × 10⁴ m−3 mm−1). Embedded convection has slightly smaller Dm but Nw remains comparably high (mean Dm ≈ 1.02 mm; mean Nw ≈ 2.00 × 10⁴ m−3 mm−1). Stratiform rainfall with a bright-band has smaller Dm and markedly lower Nw (mean Dm ≈ 0.92 mm; mean Nw ≈ 6.38 × 10³ m−3 mm−1).

Cumulative DSD curves indicate that regime separation is driven primarily by the large-drop tail: strong convection shows the highest contribution of drops above ~2–3 mm, embedded convection is intermediate, and stratiform rainfall declines steeply at large diameters. To translate these findings into an objective regime indicator, we train a linear SVM (Support Vector Machine) on canonical samples (strong convection vs stratiform rainfall with a bright-band) and apply it to all events. Convective and stratiform rainfall are largely separable, while embedded convection occurs on both sides of the boundary, supporting a probabilistic classification with a transition band. These results provide microphysical insights that can be used to refine regime-dependent radar retrieval parameterizations and improve radar-based rainfall estimates at hydrologically relevant scales.

How to cite: Rulfova, Z. and Potuznikova, K.: Disdrometer-based microphysical contrasts between convective and stratiform rainfall to improve radar rainfall retrievals, EGU General Assembly 2026, Vienna, Austria, 3–8 May 2026, EGU26-10645, https://doi.org/10.5194/egusphere-egu26-10645, 2026.

Analyzing the transition probability of disdrometer data revealed a sigmoid relation between precipitation intensity of the current and next minute. The sigmoid changes in it's parameters slope, location and asymmetry based on the intensity of the current value. In particular the evolution of the parameters shows some distinct bends that mark transition points. Replicating how the sigmoid morphs with intensity we build a Markov chain model that generates realistic precipitation data. In particular it can generate the power law relation in the high intensity range of the distribution and also correctly includes a transition to exponential distribution at low intensities. To complete the algorithm we included a threshold based transition to dry periods. This introduces realistic intermittency into the data. What makes our findings compelling is that we strictly replicated the micro structures we found in the data and ended up with a random walk that generates the large scale structure of the data set. No optimizing was involved. We still have to fully validate the performance of our algorithm and understand the essential components that generate key characteristics as for example the transition between exponential and power law. With that we hope to find a universal mechanism that is able to generate very different precipitation distributions based on how we shape the morphing of the sigmoid function.

How to cite: Frechen, T. N. and Hinz, C.: Replicating the micro structure of disdrometer data leads to a rainfall generator that correctly reproduces the large scale structure of the data set, EGU General Assembly 2026, Vienna, Austria, 3–8 May 2026, EGU26-11452, https://doi.org/10.5194/egusphere-egu26-11452, 2026.

EGU26-11781 | ECS | PICO | HS7.1

Multifractal analysis of Drop Size Distribution parameters vertical and temporal variability 

Emna Chikhaoui and Auguste Gires

Rainfall exhibits extreme spatial and temporal variability observable across wide range of scales. This variability is not limited to precipitation totals but also concerns the microphysical structure of the rain characterized with the help of the drop size distribution (DSD). It is defined as the number of raindrops per unit volume of air with a given equivolumic diameter. The  DSD can be described through its statistical parameters (basically its moments) such as the rain rate (RR), the liquid water content (LWC), the mass-weighted mean diameter (Dm) and the total number concentration (Nt). The vertical variability of DSD remains an active field of research, particularly due to the challenges associated with observing and generalizing microphysical profiles which are used to improve rainfall ground estimates from radar measurements.

Vertically-oriented radar measurements are a valuable tool for studying the vertical variability of DSD along the precipitation column with small spatial and short temporal observation scales. In this study, nine months of a Micro Rain Radar PRO (MRR-PRO) measurements were gathered in Ecole nationale des ponts et chaussées (ENPC), Institut Polytechnique de Paris (IPP), which is located in the eastern part of the Paris region, France. The MRR-PRO is a K-band weather radar that provides high-resolution vertical profiles of precipitation features that reach more than 4 kilometers of altitude above its position with a 35 meters spatial resolution and a 10 seconds time step. Based on the collected data and simple assumptions, several parameters related to the raindrop size distribution can be estimated empirically, such as RR, LWC, Dm and Nt. The spatial and temporal variability of the DSD was studied using the Universal Multifractal (UM) framework, a physically based framework designed to characterize geophysical fields across wide  range of scales through a limited set of physically interpretable parameters.

Two types of UM analysis were conducted in this study. First, the time series of DSD statistical moments is explored at each altitude. Then, vertical profiles of these moments are examined to extract UM parameters that characterize the variability along the vertical column. The results and their interpretation within a spatiotemporal framework will be presented.

Authors acknowledge the France-Taiwan Ra2DW project for financial support (grant number by the French National Research Agency – ANR-23-CE01-0019-01).

How to cite: Chikhaoui, E. and Gires, A.: Multifractal analysis of Drop Size Distribution parameters vertical and temporal variability, EGU General Assembly 2026, Vienna, Austria, 3–8 May 2026, EGU26-11781, https://doi.org/10.5194/egusphere-egu26-11781, 2026.

EGU26-12024 | ECS | PICO | HS7.1

Determination of Z-R Relationships for Rainfall Estimation from Weather Radar, Rain Gauges, and Disdrometers 

Nicolás Andrés Chaves González, Alessandro Ceppi, Carlo De Michele, Giovanni Ravazzani, and Orietta Cazzuli

Z-R relationships are a fundamental component of rainfall estimation and are widely applied in radar meteorology and hydrology supporting operational applications such as flood forecasting. Despite their extensive use, the procedures adopted to derive Z-R coefficients are often not described in sufficient detail, and key methodological choices, such as the selection of the dependent variable in the regression analyses, are frequently left implicit.

In this study, we analyze the determination of Z-R relationships using rain gauge, disdrometer, and X-band radar observations with solid-state transmitters collected over the Seveso-Olona-Lambro river basin and the Milan metropolitan area (northern Italy). A set of rainfall events recorded in 2023 is examined, including both stratiform and convective events. Z-R coefficients are determined using a regression-based approach following a leave-one-out methodology across events and multiple instrument pairings, to account for differences in sampling volumes and measurement characteristics.

The resulting relationships are evaluated by comparing radar-based rainfall estimates against rain gauge observations and estimates obtained using standard Z-R formulations. The analysis focuses on the performance of rainfall estimates for different methodological choices in the regression process and for stratiform and convective events, and includes an assessment of mean areal accumulated rainfall to emphasize the hydrological relevance of properly defining Z-R relationships. The study highlights the sensitivity of rainfall estimation to methodological choices in Z-R coefficient determination and underscores the importance of clearly documenting regression setups.

How to cite: Chaves González, N. A., Ceppi, A., De Michele, C., Ravazzani, G., and Cazzuli, O.: Determination of Z-R Relationships for Rainfall Estimation from Weather Radar, Rain Gauges, and Disdrometers, EGU General Assembly 2026, Vienna, Austria, 3–8 May 2026, EGU26-12024, https://doi.org/10.5194/egusphere-egu26-12024, 2026.

EGU26-12669 | ECS | PICO | HS7.1

Numerical evaluation of the wind-induced bias for the 2D Video Disdrometer 

Enrico Chinchella, Arianna Cauteruccio, Pak-Wai Chan, and Luca G. Lanza

Reconciling rainfall records from different sources, even from co-located instruments, is often difficult unless proper adjustment for instrumental and environmental sources of bias is applied. Comparisons between disdrometer and rain gauge measurements may show deviations that are usually attributed to their very different measurement principles. In this work, we show that rainfall intensity measurements from the 2D Video Disdrometer (2DVD) and a co-located tipping-bucket rain gauge can be largely reconciled once the relevant sources of bias are quantified and raw measurements are consequently adjusted.

The instrumental bias of the co-located tipping-bucket rain gauge is obtained from laboratory calibration performed at the Hong Kong Observatory (HKO). Meanwhile we rely on factory calibration for the instrumental bias of the 2DVD. Wind is assumed as the primary source of environmental bias for both instruments. Adjustment curves for the wind-induced bias of cylindrical rain gauges are here derived from existing literature (see Cauteruccio et al. 2024).

For the 2DVD, the wind-induced bias is obtained by means of numerical simulation. Using the OpenFOAM software, Computational Fluid Dynamics (CFD) and Lagrangian particle tracking simulations have been performed. CFD simulations provide the wind velocity field around the instrument body for different combinations of wind speed and direction. A k-ω SST turbulence model and a local time-stepping approach are used. Hydrometeor trajectories are modelled by numerically releasing drops ranging from 0.25 mm to 8 mm in diameter into the computational domain. The wind-induced bias is then expressed in terms of the Catch Ratio (CR), representing the ratio between the number of drops crossing both the 2DVD’s light beams in the presence of wind and their number considering undisturbed conditions.

The simulations shows that wind direction is a relevant factor since the instrument is not radially symmetric. A significant geometric shielding effect is also present and CRs may reach zero for medium to high wind speeds and small raindrop size, meaning that no drops are sensed by the 2DVD in certain conditions.

After adjustment, measurements from the 2DVD installed at the HKO’s field test site at the Hong Kong International Airport are compared against co-located rain gauge measurements. Results show an average reduction of the deviation between measurements to less than about 1 mm/h. Adjusted measurements from both instruments also report about 10% higher RI values, indicating that the raw data significantly underestimate precipitation. The adjustment procedure presented in this work is quite general and can be applied to raw measurements obtained from any 2DVD sensor if measurements from a co-located anemometer are available at the site.

Measurements obtained from the 2DVD in windy conditions should be therefore treated with caution, especially when the measured DSD is used to inform research studies on the microphysical properties of the rain process or for any comparison with other disdrometers or precipitation gauges.

References:

Cauteruccio, A., Chinchella, E., & Lanza, L. G. (2024). The overall collection efficiency of catching‐type precipitation gauges in windy conditions. Water Resources Research, 60(1), e2023WR035098. https://doi.org/10.1029/2023WR035098

How to cite: Chinchella, E., Cauteruccio, A., Chan, P.-W., and Lanza, L. G.: Numerical evaluation of the wind-induced bias for the 2D Video Disdrometer, EGU General Assembly 2026, Vienna, Austria, 3–8 May 2026, EGU26-12669, https://doi.org/10.5194/egusphere-egu26-12669, 2026.

EGU26-13237 | PICO | HS7.1

Enhancing Rainfall Spatial Representation through Quality-Controlled Personal Weather Stations 

Jochen Seidel, Damaris Zulkarnaen, Benedetta Moccia, Elena Ridolfi, Francesco Napolitano, Fabio Russo, and András Bárdossy

The high spatial and temporal variability of precipitation, especially during short, high-intensity events, is typically not captured by rain gauge networks. Furthermore, the actual precipitation maxima do not necessarily occur at the locations of the rain gauges. This consequently leads to a systematic underestimation of interpolated precipitation amounts (Bárdossy and Anwar, 2023). Since this phenomenon depends on the sample size, i.e., the number of rain gauges, a way to increase the sample size is to use additional data of so-called opportunistic precipitation sensors. A suitable data source is provided by personal weather stations (PWS) equipped with rain gauges, which have exceeded the number of stations operated by national weather services and other authorities. They therefore offer the potential to improve quantitative precipitation estimates (Bárdossy et al. 2021, Graf et al. 2021). 

In this study, we investigate the behaviour of precipitation extremes from interpolations  in the Lazio region in Italy using different rainfall data sets. The Lazio region is characterized by a dense network of approximately 230 professionally maintained rain gauges and more than 300 Netatmo Personal Weather Stations, both providing data in  high temporal resolution Although these stations offer a valuable opportunity to enhance the spatial coverage of rainfall observations, they do not generally comply with professional standards in terms of installation, maintenance, and data reliability, and therefore require a rigorous quality control (QC) procedure. In this study, the most recent QC filters and bias correction methodologies are applied to the PWS dataset. Following the QC process, the performance of the corrected PWS observations is assessed through comparison with co-located professional rain gauges. Furthermore, the potential added value of incorporating PWS data is investigated by analyzing their contribution to the representation of rainfall spatial variability, with particular emphasis on extreme precipitation events, as well as their impact on precipitation interpolation results. The outcomes of this study aim to provide insights into the effective integration of crowdsourced weather observations into operational and research-oriented hydrometeorological applications.

References:

Bárdossy, A., Seidel, J., El Hachem, A.: The use of personal weather station observations to improve precipitation estimation and interpolation, Hydrology and Earth System Sciences, 25, 583-601, 2021. https://doi.org/10.5194/hess-25-583-2021

Bárdossy, A., Anwar, F.: Why do our rainfall–runoff models keep underestimating the peak flows? Hydrology and Earth System Sciences, 27, 1987–2000, 2023. https://doi.org/10.5194/hess-27-1987-2023

Graf, M.,  El Hachem, A., Eisele, M., Seidel, J., Chwala, C., Kunstmann, H., Bárdossy, A.: Rainfall estimates from opportunistic sensors in Germany across spatio-temporal scales. Journal of Hydrology: Regional Studies, 37. https://doi.org/10.1016/j.ejrh.2021.100883

How to cite: Seidel, J., Zulkarnaen, D., Moccia, B., Ridolfi, E., Napolitano, F., Russo, F., and Bárdossy, A.: Enhancing Rainfall Spatial Representation through Quality-Controlled Personal Weather Stations, EGU General Assembly 2026, Vienna, Austria, 3–8 May 2026, EGU26-13237, https://doi.org/10.5194/egusphere-egu26-13237, 2026.

EGU26-15175 | ECS | PICO | HS7.1

Developing a Gauge–Radar Merged Precipitation Dataset (1 hour and 1 km) for Great Britain: GRaD-GB (1H1K) 

Xiaobin Qiu, Amy C. Green, Stephen Blenkinsop, and Hayley J. Fowler

High-quality gridded precipitation datasets are essential for climate analysis and flood-risk assessment in Great Britain (GB); however, such datasets remain limited, and existing products suffer from important limitations. Rain gauge measurements provide highly accurate point-scale observations, but sparse gauge networks limit their applicability. Radar quantitative precipitation estimates (QPEs) offer useful spatial information on rainfall fields at national scale, but suffer from multiple artefacts and errors. Blended rainfall datasets therefore represent a promising approach, as they capitalise on the complementary strengths of radar and gauge observations. Accordingly, this study aims to develop a high-resolution blended precipitation dataset for GB, focusing on two key components: quality control (QC) of radar QPEs and the merging of radar and gauge rainfall.

First, radar QPEs are shown to contain substantial and spatially variable errors even after standard reflectivity-based QC. We assess the Met Office composite radar QPE for GB (hourly, 1 km resolution; 2006–2018) against approximately 1300 hourly rain gauges, demonstrating that errors increase with elevation, distance from radar, and rainfall intensity. Radar QPEs frequently underestimate high-intensity hourly rainfall and fail to detect many extreme events (≥40 mm h⁻¹), with underestimation occurring approximately 1.7 times more often than overestimation (for rainfall ≥0.2 mm h⁻¹). To address these issues, we develop a holistic, rule-based QC framework that exploits spatial–temporal continuity and rainfall-field uniqueness to further quality-control radar QPEs already processed by the Met Office. The framework (i) detects and recovers beam-blocked regions, (ii) classifies normal versus suspect rainfall fields, and (iii) identifies and replaces bad rainfall pixels associated with radar malfunction, ground clutter, and electronic noise. Application of this framework reduces the Root Mean Squared Error (RMSE) relative to gauges from 0.546 to 0.386 (−29%) and increases the correlation coefficient from 0.552 to 0.725 (+31%), while preserving genuine extreme rainfall.

Second, building on the quality-controlled radar product, we introduce a Gauss Blending Method (GBM), adapting the Gauss–Seidel method to merge radar rainfall with gauge constraints (970 gauges) and generate a spatially complete, structure-preserving hourly precipitation field at 1-km resolution. Independent evaluation using 194 gauges (2006–2018) shows that the blended product improves RMSE and mean absolute error by ~14.5% and reduces mean relative error by ~22% compared with radar-only data. The GBM also enhances rainfall detectability and outperforms commonly used adjustment approaches, including the Additive Adjustment, Multiplicative Adjustment, Mixed Adjustment, and Mean Field Bias Adjustment methods. Its overall performance is comparable to Kriging with External Drift; however, GBM shows superior performance for higher rainfall intensities (≥10 mm h⁻¹), provides substantially greater spatial data coverage, better preserves local rainfall variability, and is easier to implement in practice.

Together, the proposed QC framework and GBM enable the production of GRaD-GB (1H1K), an hourly 1-km gauge–radar merged precipitation dataset for Great Britain covering the period 2006–2023. The dataset combines hourly quality-controlled radar QPEs with hourly rainfall observations from approximately 1500 quality-controlled rain gauges. GRaD-GB (1H1K) is well suited for analysing precipitation variability, storm life cycles, and extreme rainfall, thereby providing a robust basis for hydrological applications, flood risk estimation, and extreme rainfall analysis.

How to cite: Qiu, X., C. Green, A., Blenkinsop, S., and J. Fowler, H.: Developing a Gauge–Radar Merged Precipitation Dataset (1 hour and 1 km) for Great Britain: GRaD-GB (1H1K), EGU General Assembly 2026, Vienna, Austria, 3–8 May 2026, EGU26-15175, https://doi.org/10.5194/egusphere-egu26-15175, 2026.

EGU26-18043 | PICO | HS7.1

Urbanization and Air Pollution Effects on Precipitation Microphysics: Evidence from Disdrometer Observations in Belgium 

Armani Passtoors, Kwinten Van Weverberg, Ricardo Reinoso-Rondinel, Maarten Reyniers, Dieter Poelman, and Nicolas Ghilain

Urbanization and air pollution are increasingly recognized as important modifiers of precipitation microphysics, yet their combined influence on raindrop size distributions (DSDs) remains uncertain. This study investigates how urban land cover and particulate air pollution affect rainfall microphysical properties using multi-year disdrometer observations at three urban-edge sites near Brussels, Liège, and Ghent. Measurements from two optical laser disdrometers and one forward-scattering disdrometer are combined with ERA5 reanalysis data, Local Climate Zone (LCZ) classifications, and gridded air-quality datasets. Disdrometer data are subjected to quality control, including filtering for liquid precipitation, internal consistency checks based on rainfall rate, and comparison with nearby rain-gauge measurements. Raindrop size distributions are characterised using integral microphysical parameters, including volume mean diameter (VMD), area mean diameter (AMD), rainfall rate, reflectivity, and kinetic energy. Convective and stratiform precipitation are distinguished using reflectivity-based thresholds and variability in rainfall rate. Urban effects are quantified by relating wind-direction-dependent urban fraction to disdrometer-derived DSD parameters. Preliminary results indicate a site-dependent response of raindrop diameter to upwind urban fraction, with statistically significant positive relationships at two locations and a negative relationship at one location, highlighting the complexity and heterogeneity of urban–precipitation interactions. Seasonal stratification and wind-speed filtering do not reveal a consistent pattern across all instruments. The influence of air pollution is assessed using daily mean PM2.5 and PM10 concentrations, with initial analyses suggesting that elevated pollution levels are associated with more extreme DSD behaviour, characterised by an increased occurrence of significantly smaller and larger drop sizes compared to more narrowly distributed DSDs under cleaner conditions. Ongoing analyses further examine how these effects depend on precipitation type and how they translate into changes in rainfall kinetic energy. This work provides new observational insight into the nonlinear interactions between urban environments, aerosols, and precipitation microphysics with implications for urban hydrology, radar-based rainfall estimation, and the representation of aerosol-cloud-interactions in climate models.

How to cite: Passtoors, A., Van Weverberg, K., Reinoso-Rondinel, R., Reyniers, M., Poelman, D., and Ghilain, N.: Urbanization and Air Pollution Effects on Precipitation Microphysics: Evidence from Disdrometer Observations in Belgium, EGU General Assembly 2026, Vienna, Austria, 3–8 May 2026, EGU26-18043, https://doi.org/10.5194/egusphere-egu26-18043, 2026.

EGU26-18161 | PICO | HS7.1

Flood forecasting based on personal weather station rainfall data 

Claudia Brauer, Jisca Schoonhoven, and Linda Bogerd

An increasing number of personal weather stations (PWSs) is installed by citizens, resulting in a large amount of real-time available precipitation data. This study assesses the applicability of these data for flood forecasting. We focussed on 30 catchments (total area 2474 km2) located in the management area of Water Board Rijn and IJssel, a water authority in the Netherlands which uses PWS data as input for their operational flood forecasting system. We compared rainfall from a network of 869 Netatmo PWSs (after applying a quality filter) and the real-time radar product from the KNMI (Royal Netherlands Meteorological Institute). Next, we used both products as input for the rainfall-runoff model WALRUS and compared the simulated discharges. These two datasets with almost no latency were validated with the final reanalysis KNMI radar product and discharge observations, for a full year (2023).

For precipitation, the real-time radar was closer to the final reanalysis radar than the PWSs in terms of Kling-Gupta Efficiency, Pearson correlation coefficient and coefficient of variation, but had a stronger negative bias. However, discharge simulations based on PWSs were closer to observations and simulations with the final reanalysis radar than simulations based on the real-time radar. This contrasting result can be explained by the bias, which was stronger for the real-time radar than for the PWSs, and is amplified in the discharge simulations due to the memory in the hydrological system. We found no clear relation between catchment size, PWS density and PWS distribution and the performance of PWS rainfall product. Reducing the density of the PWS network only led to a small deterioration in performance. The results indicate the potential of these devices to be used in hydrological applications, especially when initial hydrological model conditions are improved with data assimilation in operational flood forecasting systems.


How to cite: Brauer, C., Schoonhoven, J., and Bogerd, L.: Flood forecasting based on personal weather station rainfall data, EGU General Assembly 2026, Vienna, Austria, 3–8 May 2026, EGU26-18161, https://doi.org/10.5194/egusphere-egu26-18161, 2026.

EGU26-18992 | ECS | PICO | HS7.1

Wind effects on disdrometer measurements at different elevations along a meteorological mast 

Arianna Cauteruccio, Auguste Gires, Enrico Chinchella, and Luca G. Lanza

Disdrometers positioned at different elevations above the ground experience different wind conditions, with increasing wind velocity as the elevation increases and possibly changing wind direction. On the contrary, bulk properties of the rainfall process, such as the rainfall intensity, are not expected to change along the vertical within a limited elevation gain.

In this work, high resolution data collected over 2.5 years on a meteorological mast located at Pays d'Othe wind farm, 110 km South-East of Paris France is used. More precisely, data from an OTT Parsivel2 disdrometer, with 30 s observation time step, and a Thies Clima 3D sonic anemometer at 100 Hz, located at roughly 40 m, are used. The same setting is replicated at 80 m.

In previous research (Chinchella et al., 2025), the expected wind-induced bias of the OTT Parsivel2 disdrometer was numerically quantified using computational fluid dynamics simulation. Adjustments are here applied to raw disdrometer data depending on the measured wind speed and direction. Not only updated rain rate is provided but also the whole DSD enabling to study a few key features such as mean diameter or total concentration.

The disdrometer measurements (rain rate and DSD) at the two heights are compared before and after the correction. In a first step standard scores such as RMSE, normalized bias or Nash-Sutcliffe efficiency are used. In a second step, Universal Multifractal (UM) features are compared to get results valid, not only at a few selected scales, but across a wide range of scales. UM is a parsimonious mathematically robust framework, relying on the physically based notion of scale invariance inherited from the governing Navier-Stokes equations. It has been widely used to characterize and simulate geophysical fields extremely variable over wide range of scales such as rainfall, with the help of only 3 parameters.

This study enables to discuss the effect of the wind correction with increasing wind on the same location. It also enables to quantify the influence of wind on disdrometers measurements and retrieved UM features, an effect that has been neglected in previous investigations.

Authors acknowledge the ANR PRCI Ra2DW project supported by the French National Research Agency – ANR-23-CE01-0019-01 for partial financial support.

References

Chinchella, E.; Cauteruccio, A.; Lanza, L.G. Impact of Wind on Rainfall Measurements Obtained from the OTT Parsivel2 Disdrometer. Sensors 2025, 25, 6440. https://doi.org/10.3390/s25206440.

How to cite: Cauteruccio, A., Gires, A., Chinchella, E., and Lanza, L. G.: Wind effects on disdrometer measurements at different elevations along a meteorological mast, EGU General Assembly 2026, Vienna, Austria, 3–8 May 2026, EGU26-18992, https://doi.org/10.5194/egusphere-egu26-18992, 2026.

EGU26-19729 | ECS | PICO | HS7.1

Large-scale Clustering of Natural Snowfall: Collective Precipitation Dynamics in Three Dimensions 

Koen Muller, Rafael Bölsterli, Sergi Gonzàlez-Herrero, Michael Lehning, and Filippo Coletti

The interactions between large collections of settling snowflakes and various turbulence intensity levels within the air column make snow precipitation difficult to forecast. Characterizing the multi-scale spatial distribution and transport of snowflakes is crucial for understanding the spatial modulations in the snow deposition process and for interpreting remote sensing signals. In this work, we perform large-scale three-dimensional tracking of snowflakes falling through the atmospheric surface layer in the Swiss Alps. We utilize a novel super-resolution field imaging system that combines 16 high-resolution cameras mounted on arrays and is flexibly deployed in ice-fishing tents at different instrumented field sites with collocated snow and wind characterization. Each camera array is fitted with shifted lenses to stitch an equivalent 100 Megapixel imaging over a 20x20 square Meter field of view at a 2-Millimeter diffraction-limited tracking resolution. Snowflakes are illuminated using white light of 5500 Kelvin at 250′000 Lumens from multiple powerful 1575 Watt stadium floodlight panels mounted on snowboards and retrofitted with lenticular lenses. Shooting data at a 150 Hertz, the system is capable of tracking millions of snowflakes over 10x10x10 cubic Meters simultaneously. We first present collective snow tracking data obtained in a mild wind vector of approximately 3 Kilometers per hour. Analyzing the fall velocity, our data suggests a multimodality for fast and slow falling snow particles, which we discuss in relation to recorded snow particle variability. Subsequently, analyzing the point-cloud data using a Voronoi tessellation, we find a predominance of clusters and voids compared to the clustering diagram for a random Poisson process. Secondly, we present field experiments being caught in a blizzard with windspeeds exceeding 30 Kilometers per hour. We first conduct a qualitative assessment of the observed patterning of snowfall in the atmosphere at high wind speeds, as well as the appearance of saltation and blowing snow layers during the field measurements. We then identify signatures of these field observations in the acquired tracking data and compare events of extreme clustering dynamics against those of the cluster diagram for the mild wind vector.

How to cite: Muller, K., Bölsterli, R., Gonzàlez-Herrero, S., Lehning, M., and Coletti, F.: Large-scale Clustering of Natural Snowfall: Collective Precipitation Dynamics in Three Dimensions, EGU General Assembly 2026, Vienna, Austria, 3–8 May 2026, EGU26-19729, https://doi.org/10.5194/egusphere-egu26-19729, 2026.

EGU26-246 | ECS | Posters on site | HS7.2

Rainfall Erosivity Estimation Accuracy and Its Impact on Soil Loss Assessments: A Case Study in Southern Italy  

Athanasios Serafeim, Andreas Langousis, Francesco Viola, Dario Pumo, Nunzio Romano, Paolo Nasta, and Roberto Deidda

Accurate and robust estimation of soil loss is essential in Mediterranean basins, where sediment transfer rates exhibit pronounced seasonal aspects driven by high-intensity storm events. While the Revised Universal Soil Loss Equation (RUSLE) is the most widely used tool for assessing soil loss, its accuracy is highly dependent on the rainfall erosivity (R-factor). This study evaluates the effect of different R-factor quantification approaches on soil loss estimates within the Tirso River basin, Sardinia’s largest basin (> 3000 km²), which provides water resources for agriculture, hydropower, and domestic supply.

We applied the RUSLE method within a geographic information system (GIS) framework. The key factors for soil erodibility (K), topography (LS), land cover-management (C), and conservation practices (P) were derived from established sources, including the European Soil Data Center, a high-resolution Copernicus DEM, the Copernicus Global Land Service, and local authorities. To estimate the R-factor, we used high-resolution (10-minute resolution) precipitation data from more than 40 rainfall gauges, applying two distinct storm identification approaches: Renard et al. (1997) and the recently developed Serafeim et al. (2025). The soil loss estimates obtained from these high-resolution methods were then compared against results derived from a suite of widely applied empirical erosivity models calibrated in Mediterranean regions. This comparative analysis reveals how relying on generalized erosivity equations can distort soil erosion assessments at the basin level.

Keywords
Soil erosion; RUSLE; rainfall erosivity uncertainty; high-resolution precipitation; sediment yield; watershed management

References

Renard, K.G., Foster, G.R., Weesies, G.A., McCool, D.K., Yoder, D.C., 1997. Predicting Soil Erosion by Water: A Guide to Conservation Planning With the Revised Universal Soil Loss Equation (RUSLE). USA, U.S, Department of Agriculture, Washington, DC.

Serafeim, A.V., R. Deidda, A. Langousis, et al., (2025) A Critical Review of Rainfall Erosivity Estimation Approaches: Comparative Analysis and Temporal Resolution Effects (To be submitted).

How to cite: Serafeim, A., Langousis, A., Viola, F., Pumo, D., Romano, N., Nasta, P., and Deidda, R.: Rainfall Erosivity Estimation Accuracy and Its Impact on Soil Loss Assessments: A Case Study in Southern Italy , EGU General Assembly 2026, Vienna, Austria, 3–8 May 2026, EGU26-246, https://doi.org/10.5194/egusphere-egu26-246, 2026.

Accurate precipitation estimates depend critically on the calibration fidelity of ground-based Doppler Weather Radar (DWR) systems. While these radars provide high-resolution observations essential for hydrological modelling and forecasting, their measurements often suffer from bias due to radar constant drift. Conventional calibration approaches, such as using metallic spheres, are operationally demanding and poorly maintained. As a result, biases in reflectivity can propagate, thereby degrading quantitative precipitation estimation (QPE) and introducing uncertainty into downstream applications.

This study develops a correction strategy that utilizes the well-calibrated reflectivity measurements from satellite radar (SR) to account for the systematic underestimation in ground radar (GR) measurements. A machine-learning approach based on the XGBoost algorithm is used to model the bias between GR and SR reflectivity along with key radar-geometric parameters, including range, elevation angle, and azimuth, to capture the spatial heterogeneity. The proposed framework is evaluated using eight years (2017-2024) of collocated observations from the C-band DWR at the Thumba Equatorial Rocket Launching Station (TERLS), Thiruvananthapuram, India. The proposed correction framework significantly enhances consistency between GR and SR observations. The correlation coefficient increases from 0.23 to 0.88 with a marked reduction in mean bias, mean absolute error and root mean squared error. The results demonstrate the potential of space-ground radar synergy to mitigate calibration-driven uncertainties and strengthen the reliability of near-real-time precipitation products. This framework offers a scalable pathway for enhancing operational QPE and for supporting climate-scale radar reflectivity reanalysis where long-term consistency is essential.

How to cite: Tyagi, V. and Das, S.: Correction of Systematic Calibration Drift in Weather Radar Observations to Improve Precipitation Uncertainty Modelling, EGU General Assembly 2026, Vienna, Austria, 3–8 May 2026, EGU26-504, https://doi.org/10.5194/egusphere-egu26-504, 2026.

Increasing anthropogenic activities in the post-industrial era, coupled with variability in natural forcings (e.g., solar radiation, volcanic eruption) and changes in geomorphological characteristics make the climate highly non-stationary in nature. This hinders effective climate projections, adaptation and mitigation strategies for extreme weather events, hydraulic structure planning, and irrigation activity. Regionalization, which is the process of demarcating regions of similar hydroclimatic characteristics, is therefore essential for water resources planning and management. However, there are no existing approaches which take into account the non-stationarity inherent in the hydroclimatic variables (e.g., precipitation, temperature, humidity, water level) during the process of regionalization. The most widely used feature based clustering techniques involve identifying key static attributes of the hydroclimatic time series to identify dominant patterns. However, these methods often fail to capture the temporal dynamics and evolving non-stationary characteristics of the climate variables, which is a major concern in the era of climate change. To address this research gap, this study integrates two major objectives - (a) develop a novel model based regionalization procedure that accounts for non-stationarity in the hydroclimatic time series, and (b) evaluate the performance of the proposed methodology against the existing regionalization approaches using a real world case study for the Indian subcontinent. 

By coupling the Latent Gaussian State Space Models (LGSSM) with advanced fuzzy ensemble clustering techniques, the proposed methodology aims to capture this inherent non-stationarity of the hydroclimatic data, yielding better domain informed homogeneous regions. Largely used in the field of data science for future data predictions and grouping; the LGSSM model is a parametric model with sufficient flexibility which can effectively describe the non-stationary climate variables in the Euclidean Space. Further, fuzzy ensemble clustering techniques aggregate results from multiple clustering realizations, mitigating the biases inherent in any single clustering approach and incorporate fuzzy set theory by assigning membership degrees to each study area grid. Cluster validity indices such as the Dunn Index and Davies-Bouldin Index are used to find the optimal number of clusters based on intra cluster compactness and inter cluster separation. 

Hydroclimatic datasets (eg., IMD data, ERA5 reanalysis data) are obtained at 0.25x0.25 degrees spatial and daily temporal frequency for the Indian subcontinent. The methodology identified K=10 and K=6 optimum number of clusters for precipitation and temperature respectively. Final homogeneous regions are delineated by integrating topographical features such as distance from sea, elevation etc. The identified major climate regions are - (a) Northern Cold Himalayan Zone, (b) Thar Desert Area, (c) Indo-Gangetic Plain, (d) Southern Peninsular Region, (e) Western Ghats Area and (f) Dry Semi-Arid Zone. These regions are validated using regional homogeneity tests such as HoskinWallish Test. This study is the first to integrate the advanced state space modeling with fuzzy ensemble clustering for climatic regionalization, making a paradigm shift in hydrology research, from solely relying on basin-scale boundaries to an integrated approach that considers both atmospheric and physiographic boundaries. This proposed methodology provides a ready to use powerful tool for homogeneous regionalization and future projections of complex non-stationary hydroclimatic variables.

How to cite: Sengupta, D. and Vijay, S.: A Novel Framework for Homogeneous Climate Regionalisation using Advanced State Space Modeling and Ensemble Fuzzy Clustering  , EGU General Assembly 2026, Vienna, Austria, 3–8 May 2026, EGU26-561, https://doi.org/10.5194/egusphere-egu26-561, 2026.

Mountainous areas and the hill stations, which were traditionally considered cooler and with stable climatic conditions, are proving to mirror certain warming and changes in rainfall patterns. Considering the broader context of global climate change, this study investigates the presence of statistically quantifiable climatic shifts in the hill stations of South India by integrating observed IMD datasets with CMIP6 model simulations. An extensive bias-correction framework was employed to analyse and address the substantial systematic errors commonly associated with applying global climate models to complex terrain. The study combines established bias-correction techniques, including Quantile Mapping (QM) and Quantile Delta Mapping (QDM), with advanced machine learning algorithms such as CART, XGBoost, and a stacked ensemble model, enabling a more robust and comprehensive correction of model biases. XGBoost and the stacked model were the only approaches that demonstrated substantial improvements, showing reduced RMSE (0.55–0.76 for temperature and approximately 83–85 mm for precipitation), near-zero bias, and strong predictive skill (R² = 0.96 for temperature and NSE = 0.71 for precipitation). These models also achieved the lowest prediction uncertainty (RMSE) and the highest overall predictive performance (R²). The bias-corrected projections reveal pronounced warming across all the hill stations examined, aligning with recent evidence that traditionally cool regions are experiencing increased heat exposure. Rainfall forecasts indicate greater variability, suggesting a potential rise in both heavy rainfall events and prolonged dry spells. These findings strongly support the emerging understanding that the hill stations of South India are transitioning toward warmer and more climate-sensitive conditions. The study provides high-resolution, bias-adjusted datasets essential for climate impact assessments, tourism planning, ecosystem management, and the development of targeted adaptation policies to safeguard these vulnerable high-elevation environments.

How to cite: Devaraj, S. and Shanmugam, P. S.: Machine Learning–Enhanced Bias Correction of CMIP6 Data for Detecting Warming and Rainfall Shifts in Indian Hill Stations, EGU General Assembly 2026, Vienna, Austria, 3–8 May 2026, EGU26-755, https://doi.org/10.5194/egusphere-egu26-755, 2026.

Precipitation drives the hydrologic cycle and directly impacts sectors from agriculture to electricity generation. However, modeling its statistical distribution is challenging. Precipitation data typically consists of frequent dry days with zero values mixed with rare, extreme events. Both ends of this spectrum can cause disasters, such as flash floods or severe droughts. In the Eastern Mediterranean, this challenge is complicated by complex topography and changing climate patterns. While machine learning (ML) models are widely used for classification or regression of the precipitation, they often treat large areas as uniform regions. However, this generalization misses important local features, such as orographic lifting along mountains or rain shadows in interior basins. Furthermore, most operational models focus only on minimizing error metrics through exact point predictions. Similar to the spatial generalization, this approach yields another problem by ignoring the forecast uncertainty, which is essential for risk-based decision-making.

This study addresses these issues by developing a spatially explicit deep learning framework based on the Probability Integral Transform (PIT). Training models on raw precipitation amounts often leads to underestimating extremes and assigning trace amounts to dry days because machine learning models tend to regress to the mean or the overrepresented classes. To solve this, the target variable (i.e., precipitation based on EOBS data) is transformed into a probability space. Each 0.1-degree pixel is normalized using its own cumulative distribution function (CDF) calculated from the 1985–2015 climatology. Here, instead of a fixed baseline assumption, the Pettitt test is applied to each pixel to detect structural breaks in the historical time series. Yet, this is applied with a condition that at least the last 10 years (2005–2015) are preserved for the CDF analysis, to ensure the approach has enough data. This ensures that the reference climatology reflects the current hydro-climatic conditions.

The deep learning model utilized in this study uses downscaled Global Forecasting System (GFS) forecasts with a 24-hour horizon. To capture the vertical structure of the atmosphere, inputs include wind components (u, v), geopotential height, and specific humidity at 500, 700, and 850 hPa pressure levels. This multi-level approach allows the model to learn the interactions between large-scale circulation, mid-tropospheric moisture transport, and low-level topographical effects. This offers a significant physical advantage over surface-only models. The study covers the period from 2015 to 2025, divided into training (2015–2020), hyperparameter tuning and validation (2020–2022), and testing (2022–2025) sets.

Finally, the deep learning model is extended with conformal prediction to bridge the aforementioned gap between statistical accuracy and yielding exact values. Unlike traditional approaches with a specific error distribution (e.g., Gaussian) assumption, conformal prediction yields distribution-free prediction intervals with a coverage guarantee. This results in adaptive confidence bounds, which can be interpreted with a widened confidence interval during unstable weather patterns and a narrowed one during stable atmospheric conditions. Consequently, the proposed approach ensures that the output is not just a forecast, but a reliable measure of its certainty across the diverse climates and topography of the Eastern Mediterranean.

How to cite: Senocak, A. U. G.: Probabilistic Precipitation Forecasting over the Eastern Mediterranean via PIT-Normalized Conformal Quantile-MOS, EGU General Assembly 2026, Vienna, Austria, 3–8 May 2026, EGU26-1043, https://doi.org/10.5194/egusphere-egu26-1043, 2026.

Accurate precipitation estimation is of vital importance for hydrological simulation and water resources management. However, large uncertainties existed in  precipitation datasets in high-alpine regions due to the scare gauged observations and complex terrains. Data fusion technologies are widely applied to integrate advantages of multi-source precipitation datasets, but the spatial information of precipitation is usually negelected. To overcome this limitation, this study developed a two-step machine learning framework for merging multi-source precipitation datasets based on the 2D convolutional neural network (CNN) incorporating Neighboring spatial information, hereafter referred to as nCNN. The framework employs a hybrid classification-regression model to merge three gridded precipitation products (i.e., ERA5-Land, TPReanalysis and GPM) and gauged observations over a high alpine watershed in China during the period 2001-2019. Two merged precipitation datasets were generated by CNN and the proposed nCNN framework, respectively. The results show that the proposed framework effectively integrates the advantages of multiple datasets. The CNN and nCNN merged precipitation datasets have similar spatial distribution with the original products but differ in precipitation amounts. Precipitation amounts of merged data are much closer to gauged observations than original precipitation products. Both merged datasets outperform original products in terms of statistical and categorical indices evaluated based on 25 independently meteorological stations with complete time period (covering 2001-2019). However, the nCNN merged dataset exhibits superior performance over the CNN merged dataset in capturing precipitation amounts and detecting precipitation event, especially for moderate (5~10 mm/d) and heavy precipitation (>10 mm/d). Compared with the CNN merged result, the nCNN framework reduces the station-averaged root mean square error (RMSE) from 4.25 mm/d to 3.74 mm/d for moderate precipitation and from 9.43 mm/d to 8.57 mm/d for heavy precipitation, while increasing the station-averaged critical success index (CSI) by 0.03 and 0.04, respectively. Overall, this study highlights the importance of incorporating spatial information in precipitation merging, especially for high-alpine regions. 

How to cite: Li, H. and Chen, J.: A two-step machine learning framework for incorporating spatial information into multi-source precipitation merging over high-alpine regions, EGU General Assembly 2026, Vienna, Austria, 3–8 May 2026, EGU26-1833, https://doi.org/10.5194/egusphere-egu26-1833, 2026.

EGU26-1995 | Posters on site | HS7.2

Investigation of the Spatial and Temporal Variability of the Precipitation and Temperature Lapse Rates in Greece and its Application in Evaluation and Calibration of Metanalysis Meteorological Data 

Xenofon Soulis, Karampetsa Evaggelia, Konstantinos Soulis, Stergia Palli Gravani, Evaggelos Nikitakis, and Dionissios Kalivas

Accurate meteorological forcing is a prerequisite for reliable hydrological modelling, particularly in regions with complex topography like Greece. Global reanalysis datasets offer continuous coverage but often fail to capture local orographic effects when downscaled using standard, constant lapse rates. This study investigates the spatial and temporal variability of precipitation and temperature gradients across Greece and evaluates their application in calibrating reanalysis data.

We utilized a hybrid dataset comprising long-term records from 140 meteorological stations and a dense network of 777 stations for the year 2023. To process this data, we developed a specialized Python-based algorithm to estimate lapse rates and the Coefficient of Determination ($R^2$) dynamically across the domain. The methodology utilizes a "moving-window" approach, where the window dimensions and moving step were first optimized by maximizing the determination coefficient ($R^2$) to ensure statistical robustness. Using these optimized parameters, we estimated the lapse rate and $R^2$ at each grid point of the study area. Subsequently, spatial interpolations were generated to create continuous maps of vertical gradients and their statistical reliability.

The resulting spatial patterns were analyzed in relation to the country’s distinct geomorphology, including the complex coastline, the orientation of major mountain ranges (Pindos), and the insular environments. The analysis revealed that while temperature lapse rates exhibit high spatial coherence and predictability, precipitation gradients are highly sensitive to local topographic features and continentality.

These empirically derived, spatially explicit lapse rates were applied to downscale and bias-correct AgERA5 temperature and precipitation fields for the DT-Agro Digital Twin. The proposed methodology significantly reduced biases in mountainous and coastal zones compared to standard interpolation methods, demonstrating that geomorphologically informed, dynamic gradient estimation is critical for effective model calibration in data-scarce, complex terrains.

How to cite: Soulis, X., Evaggelia, K., Soulis, K., Palli Gravani, S., Nikitakis, E., and Kalivas, D.: Investigation of the Spatial and Temporal Variability of the Precipitation and Temperature Lapse Rates in Greece and its Application in Evaluation and Calibration of Metanalysis Meteorological Data, EGU General Assembly 2026, Vienna, Austria, 3–8 May 2026, EGU26-1995, https://doi.org/10.5194/egusphere-egu26-1995, 2026.

EGU26-2553 | ECS | Orals | HS7.2

Change Factor Based Downscaling of Precipitation Through Neyman-Scott Rectangular Pulse based Rainfall Field Generators 

Mohammed Azharuddin, David Pritchard, and Hayley Fowler

We present a multi-site weather generator with a stochastic rainfall field generator (RFG) at its core. The weather generator is developed with the motive to produce downscaled projections for the future by utilizing the UKCP18 projections and a suite of climate models from the CMIP5/6 archive. The rainfall fields are sampled from the spatio-temporal Neyman-Scott Rectangular Pulse (NSRP) process. When considering a single site, the NSRP model parameterizes storm arrivals as a poisson process and storm separation time as exponential distribution. Each storm is assigned a certain number of raincells (a poisson random number) with each raincell having a duration and intensity which are exponentially distributed. For a multi-site model, additional considerations are made which include the radius of raincell parameterised by exponential distribution and the raincell density as a uniform poisson process (which is a replacement to the raincell generation process of single site model). The RFG has shown its efficacy in capturing the statistics of the observed rainfall across point and catchment scales which include mean monthly rainfall totals, daily variance, skewness, lag-1 autocorrelation, dry-day proportion and daily annual maximum in addition to capturing intergauge correlations. . Following the calibration and testing of the NSRP-based RFG, the other weather variables such as temperature and wind speed are ascertained through regression relationships by considering wet and dry transition states of rainfall. With the RFG established, climate model downscaling is performed by computing multiplicative and additive change factors for rainfall and temperature respectively. The RFG paramaters are perturbed by the computed change factor(s) to derive downscaled projections of precipitation thereby offering multiple plausible future scenarios in addition to a band of uncertainty associated with the projections. These projections can be further translated to hydrological responses by leveraging hydrological models thereby aiding in climate change impact assessment and adaptation.

How to cite: Azharuddin, M., Pritchard, D., and Fowler, H.: Change Factor Based Downscaling of Precipitation Through Neyman-Scott Rectangular Pulse based Rainfall Field Generators, EGU General Assembly 2026, Vienna, Austria, 3–8 May 2026, EGU26-2553, https://doi.org/10.5194/egusphere-egu26-2553, 2026.

EGU26-2939 | Orals | HS7.2

Generation of high-resolution design rainfall using duration adjustment factors  

Hannes Müller-Thomy, Gioia Groth, Sinuhé Alejandro Sánchez Martínez, Maritza Liliana Arganis Juárez, and Kai Schröter

Temporal high-resolution design rainfall is frequently required for the dimensioning of critical infrastructure. While daily precipitation time series are generally of sufficient length to derive design rainfall for high return periods (e.g. T=100 years), the limited length of high-resolution time series often only allows for the reliable derivation of lower return periods.

Using the proposed duration adjustment factors (DAFs), design rainfall can be scaled from coarser duration levels to finer duration levels as D={5 min, 1 h}. The DAFs were derived and evaluated nationwide for Germany based on the national rainfall extreme value catalogue KOSTRA-DWD-2020 data for various durations D and return periods T (D={5 min, …, 24 h}, T={1 year, …, 100 years}). In addition, the influence of physiographic characteristics (climate zone, land use, elevation, slope, and distance to the sea) was investigated using Spearman’s rank correlation coefficient ρ for continuous variables and the effect size η² for categorical characteristics.

The DAFs depend strongly on the basis duration level (D=24 h or D=1 h) from which the scaling is applied, but show only a weak dependence on the considered return period. Elevation exhibits a weak to moderate influence, which is greater than the influence of slope and distance to the sea. Climate zone has a moderate effect on the DAFs, whereas land use exerts only a weak influence.

For 1,414 selected KOSTRA-DWD-2020 grid cells design rainfall values with D={5 min, 60 min} were generated from daily design rainfall values (D=1 day), and validated with the original high-resolution design rainfall values from the KOSTRA-DWD-2020. The impact of taking elevation into account when deriving the DAFs was examined as well. Three elevation clusters were defined, and the DAFs were derived (i) separately within each cluster and (ii) without considering clustering. Without clustering, the generation of design rainfall from an initial duration of D=1 day with T=100 years results in a relative RMSE (rRMSE) of 10 % for D=1 h, which is below the data-based uncertainty of 25 % reported by KOSTRA-DWD-2020. For D=5 min, a rRMSE of 15 % is obtained, which is slightly lower than the KOSTRA-DWD-2020 uncertainty of 18 %. Clustering leads to only a minor improvement in the median performance (considering all 1,414 grid cells), but results in a substantial reduction in the spread, i.e. the resulting uncertainties. Notably, the quality of the generated design rainfall does not deteriorate when DAFs for T=2 years are used instead of those for T=100 years, although the former can already be estimated on the basis of relatively short time series.

Consequently, the DAF approach provides a solution for deriving design rainfall for short durations and high return periods in regions where long observed daily precipitation time series are available, but only short high-resolution precipitation records exist, which is the case in most regions worldwide.

How to cite: Müller-Thomy, H., Groth, G., Sánchez Martínez, S. A., Arganis Juárez, M. L., and Schröter, K.: Generation of high-resolution design rainfall using duration adjustment factors , EGU General Assembly 2026, Vienna, Austria, 3–8 May 2026, EGU26-2939, https://doi.org/10.5194/egusphere-egu26-2939, 2026.

EGU26-3612 | ECS | Posters on site | HS7.2

A stochastic approach for the continuous simulation of ordinary and extreme precipitation in Alpine environments 

Beatrice Carlini, Simon Michael Papalexiou, Gianluca Botter, and Francesco Marra

Predicting the impacts of climate change on hydroclimatic processes in small mountainous catchments requires long and realistic high-temporal-resolution simulations of key environmental variables, particularly precipitation, under future scenarios. Stochastic models provide an effective way to generate multi-decadal projections, but existing approaches struggle to reproduce the alternation of weather systems and sub-hourly extremes. We propose a stochastic framework that accurately describes both ordinary and extreme precipitation events, explicitly links intermittency with event inter-arrival characteristics, and represents different storm types (e.g., convective and stratiform). Our approach combines CoSMoS, which generates stochastic time series preserving probability distributions and correlation structures, with concepts from TENAX, which relates the occurrence frequency and the probability distribution of extreme precipitation to near-surface temperature. Climate change impacts are incorporated through projected changes in temperature distributions and large-scale weather patterns from regional climate models. The method is tested on the Rio Valfredda, a small Alpine catchment in the eastern Italian Alps. The sub-hourly resolution of the framework allows explicit representation of convective precipitation, a key driver of extreme events in Alpine environments.

How to cite: Carlini, B., Papalexiou, S. M., Botter, G., and Marra, F.: A stochastic approach for the continuous simulation of ordinary and extreme precipitation in Alpine environments, EGU General Assembly 2026, Vienna, Austria, 3–8 May 2026, EGU26-3612, https://doi.org/10.5194/egusphere-egu26-3612, 2026.

EGU26-4929 | Posters on site | HS7.2

How Reliable are Rainfall Observations? Assessing Credible Intervals with Bilinear Surface Smoothing 

Nikolaos Malamos, Theano Iliopoulou, Panagiotis D. Oikonomou, and Demetris Koutsoyiannis

Rainfall regionalization refers to a broader spatial modeling process that transforms point measurements into reliable continuous fields, incorporating additional information.  Yet the fidelity of the resulting continuous surface is strongly influenced by the quality of the underlying data, as well as by the density and spatial configuration of the observational network. This contribution addresses the question of how reliable rainfall data are when evaluated against a regionalized rainfall surface, by extending the Bilinear Surface Smoothing with Explanatory variable (BSSE) framework to explicitly incorporate Bayesian credible intervals.

The proposed formulation exploits the linear smoother representation of BSSE to derive the posterior covariance of the fitted bilinear surface as a function of residual variance and effective degrees of freedom. Credible intervals are obtained analytically, allowing uncertainty in variance estimation to be accounted for without resampling. Beyond quantifying uncertainty in the spatial estimates, the credible intervals provide a diagnostic measure of data reliability relative to the regionalized signal.

The extended framework is demonstrated through the regionalization of average and extreme rainfall characteristics across Greece, using ground-based observations together with elevation as explanatory variable. Stations falling outside the 95% credible interval are identified and examined, revealing that such cases frequently occur in areas with sparse gauge coverage or complex rainfall regimes. These locations highlight regions where the observational network provides limited support to the regionalized surface, leading to increased uncertainty and reduced confidence in the available data.

The analysis further reveals a strong dependence of uncertainty on temporal aggregation scale, with markedly wider credible intervals at sub-daily extremes, where station density is lowest. The BSSE methodology is implemented in a fully reproducible workflow, facilitating straightforward application of the proposed uncertainty-aware regionalization framework to other hydro-climatic datasets.

How to cite: Malamos, N., Iliopoulou, T., Oikonomou, P. D., and Koutsoyiannis, D.: How Reliable are Rainfall Observations? Assessing Credible Intervals with Bilinear Surface Smoothing, EGU General Assembly 2026, Vienna, Austria, 3–8 May 2026, EGU26-4929, https://doi.org/10.5194/egusphere-egu26-4929, 2026.

EGU26-5978 | ECS | Orals | HS7.2

Understanding the Role of Adversarial Learning in Precipitation Super-Resolution Through Explainable AI 

Shivam Singh, Simon M. Papalexiou, Hebatallah M. Abdelmoaty, Tom Hartvigsen, and Antonios Mamalakis

High-resolution precipitation information is essential for hydrological impact assessment, flood risk analysis, and the characterization of extreme events, yet climate and weather model outputs are typically available at spatial resolutions too coarse to resolve fine-scale variability. Deep-learning-based statistical downscaling has emerged as an effective approach for bridging this resolution gap; however, models trained with pixel-wise objectives often suppress spatial variability and underestimate extremes. Adversarial learning has been shown to improve the realism of downscaled precipitation fields, particularly for extreme events, but the mechanisms through which adversarial objectives influence model behavior remain insufficiently understood. In this study, we investigate how adversarial training modifies the internal representation of precipitation extremes within a super-resolution downscaling framework, using explainable artificial intelligence (XAI) as a diagnostic tool. We employ a unified U-Net architecture trained under two optimization strategies: (i) a deterministic formulation using a pixel-wise mean-squared-error loss, and (ii) an adversarial formulation in which the same U-Net generator is trained jointly with a critic through an adversarial loss. This controlled design isolates the effects of adversarial learning while holding architecture and input information constant. XAI techniques are applied to analyze differences in spatial sensitivity and attribution patterns between the two training regimes, with particular emphasis on extreme precipitation events. Rather than serving as a performance metric, XAI is used to interrogate how adversarial training reshapes the model’s reliance on spatial structure and localized variability. This work highlights the potential of XAI to provide mechanistic insight into generative downscaling models and to support more transparent evaluation of adversarial approaches for extreme precipitation.

How to cite: Singh, S., Papalexiou, S. M., Abdelmoaty, H. M., Hartvigsen, T., and Mamalakis, A.: Understanding the Role of Adversarial Learning in Precipitation Super-Resolution Through Explainable AI, EGU General Assembly 2026, Vienna, Austria, 3–8 May 2026, EGU26-5978, https://doi.org/10.5194/egusphere-egu26-5978, 2026.

EGU26-6160 | Posters on site | HS7.2

Temporal Downscaling Using Deep Learning for Sub-hourly Time Series 

Soobin Cho, Sangbeom Jang, Jiyeon Park, and Ju-young Shin

Recent climate change has been linked to more frequent and more intense short-timescale rainfall extremes, increasing exposure to urban pluvial flooding. Because many urban catchments respond within minutes, rainfall information at sub-hourly resolution is often needed for hydrologic analyses. An AI-driven temporal downscaling approach is introduced here to derive 10-minute rainfall series from hourly observations using a conditional diffusion generative model. Rain-gauge observations at Seoul Gwanaksan (#1917), operated by the Korea Forest Service, were used. The record covers the years 2015 through 2024. Paired hourly totals and observed 10-minute series were prepared to examine whether sub-hourly rainfall sequences can be reconstructed from hourly totals while preserving realistic within-hour variability. The feasibility of loss function variation was investigated. The experiments indicate that incorporating distributional and temporal statistics into the objective function can enhance the realism of sub-hourly rainfall structure under hourly constraints. The proposed framework is expected to provide more reliable 10-minute rainfall inputs for urban hydrologic analyses and pluvial-flood–relevant applications in rapid-response catchments.

How to cite: Cho, S., Jang, S., Park, J., and Shin, J.: Temporal Downscaling Using Deep Learning for Sub-hourly Time Series, EGU General Assembly 2026, Vienna, Austria, 3–8 May 2026, EGU26-6160, https://doi.org/10.5194/egusphere-egu26-6160, 2026.

EGU26-6400 | Posters on site | HS7.2

SEEPS4ALL: all you need to compute SEEPS (and more) when evaluating daily precipitation forecasts over Europe  

Zied Ben Bouallègue, Ana Prieto-Nemesio, Angela Iza Wong, Florian Pinault, Marlies van der Schee, and Umberto Modigliani

SEEPS4ALL [1] combines a precipitation dataset in a Zarr format and a set of verification Jupyter Notebooks for the evaluation of daily precipitation forecasts over Europe. The dataset is primarily based on daily in-situ observations from the European Climate Assessment & Dataset project (www.ecad.eu). Climate statistics are derived from long time series at each station location to enable the computation of meaningful verification metrics. For example, the Stable and Equitable Error in Probability Space (SEEPS [2]) is a score specifically designed to assess the performance of precipitation forecasts, and it requires climate statistics.

The verification notebooks showcase the computation not only of SEEPS but also of the diagonal score (the equivalent of SEEPS for probabilistic forecasts) and of the brier score as a function of climate percentiles. Finally, when comparing a gridded forecast and a point observation, one can account for observation representativeness uncertainty by dressing the forecast with pre-defined scale-dependent parametric distributions [3]. In a nutshell, SEEPS4ALL helps promote the benchmarking of daily precipitation forecasts against in-situ observations over Europe.


[1] Ben Bouallègue Z, A. Prieto-Nemesio, A.I. Wong, F. Pinault, M. van der Schee, and U. Modigliani (2025), SEEPS4ALL: an open dataset for the verification of daily precipitation forecasts using station climate statistics. Earth System Science Data, https://doi.org/10.5194/essd-2025-553

[2] Rodwell, M.J., D.S. Richardson, T.D. Hewson and T. Haiden (2010), A new equitable score suitable for verifying precipitation in numerical weather prediction. Q.J.R. Meteorol. Soc., https://doi.org/10.1002/qj.656

[3] Ben Bouallègue, Z., T. Haiden, N. J. Weber, T. M. Hamill, and D. S. Richardson (2020), Accounting for Representativeness in the Verification of Ensemble Precipitation Forecasts. Mon. Wea. Rev., https://doi.org/10.1175/MWR-D-19-0323.1

How to cite: Ben Bouallègue, Z., Prieto-Nemesio, A., Wong, A. I., Pinault, F., van der Schee, M., and Modigliani, U.: SEEPS4ALL: all you need to compute SEEPS (and more) when evaluating daily precipitation forecasts over Europe , EGU General Assembly 2026, Vienna, Austria, 3–8 May 2026, EGU26-6400, https://doi.org/10.5194/egusphere-egu26-6400, 2026.

EGU26-7614 | ECS | Orals | HS7.2

Optical Flow with Recurrent All-Pairs Field Transform (RAFT) for weather radar nowcasting 

Janni Mosekær Nielsen, Michael Robdrup Rasmussen, Søren Thorndahl, Ida Kemppinen Vester, Malte Kristian Skovby Ahm, and Jesper Ellerbæk Nielsen

Weather radar nowcasting is a crucial technique in real-time urban hydrological applications, as weather radars provide spatially distributed rainfall measurements. Uncertainties in weather radar nowcasting stemming from errors in rainfall observations, motion field estimates, and rainfall evolution predictions are, however, inevitable. In this study, we implement a well-established deep learning model within computer science and image processing to estimate weather radar motion fields for nowcasting.

The deep learning model, Recurrent All-Pairs Field Transform (RAFT), developed by Teed and Deng (2020), is demonstrated to outperform several existing deep learning models for optical flow estimation. The RAFT model consists of a feature encoder that extracts features from consecutive images, a correlation layer that computes visual similarities, and a recurrent unit that iteratively updates the estimated flow field. The method is computationally efficient and highly accurate, making it relevant in real-time applications. Due to the similarities between image processing and weather radar rainfall nowcasting, the method has the potential to produce accurate motion fields for extrapolating weather radar rainfall.

In this study, three years of observation data from a Danish C-band weather radar are used to nowcast 51 rainfall events. The rainfall events consist of both linear and non-linear rainfall pattern motions. We systematically compare weather radar rainfall forecasted with Lagrangian persistence using six different motion field approaches: Global vector, COTREC (Li et al., 1995), VET (Variational Echo Tracking; Germann and Zawadski, 2002), Lucas-Kanade (Lucas and Kanade, 1981), DARTS (Dynamic and Adaptive Radar Tracking of Storms; Ruzanski et al., 2011), and RAFT.

The optical flow with RAFT is shown to statistically perform as well as the well-established methods VET and Lucas-Kanade and to outperform the global vector, COTREC, and DARTS. It is demonstrated that RAFT produces accurate and robust motion fields for both linear and non-linear rainfall motion. Thus, the RAFT model for optical flow estimation is shown to be highly relevant for weather radar nowcasting in urban hydrological applications.

References:

Germann, U., Zawadzki, I., 2002. Scale-Dependence of the Predictability of Precipitation from Continental Radar Images. Part I: Description of the Methodology. Mon Weather Rev 130, 2859–2873. https://doi.org/10.1175/1520-0493(2002)130<2859:SDOTPO>2.0.CO;2

Li, L., Schmid, W., Joss, J., 1995. Nowcasting of Motion and Growth of Precipitation with Radar over a Complex Orography. J Appl Meteorol Climatol 34, 1286–1300. https://doi.org/10.1175/1520-0450(1995)034<1286:NOMAGO>2.0.CO;2

Lucas, B.D., Kanade, T., 1981. An iterative image registration technique with an application to stereo vision, in: IJCAI’81: 7th International Joint Conference on Artificial Intelligence. pp. 674–679

Ruzanski, E., Chandrasekar, V., Wang, Y., 2011. The CASA nowcasting system. J Atmos Ocean Technol 28, 640–655. https://doi.org/10.1175/2011JTECHA1496.1

Teed, Z., Deng, J., 2020. Raft: Recurrent all-pairs field transforms for optical flow, in: European Conference on Computer Vision. pp. 402–419

How to cite: Nielsen, J. M., Rasmussen, M. R., Thorndahl, S., Vester, I. K., Ahm, M. K. S., and Nielsen, J. E.: Optical Flow with Recurrent All-Pairs Field Transform (RAFT) for weather radar nowcasting, EGU General Assembly 2026, Vienna, Austria, 3–8 May 2026, EGU26-7614, https://doi.org/10.5194/egusphere-egu26-7614, 2026.

EGU26-7647 | ECS | Posters on site | HS7.2

Temporal Downscaling of ICON Precipitation from Hourly to 10‑Minute Resolution Using a Physically Constrained U-NET 

Midhuna Thayyil Mandodi, Caroline Arnold, Keil Paul, David Greenberg, Beate Geyer, and Stefan Hagemann

 The availability of high temporal resolution precipitation data is essential for understanding sub‑hourly hydrometeorological processes, extreme rainfall, and their impacts on hydrology and urban flooding. Especially with respect to climate change where precipitation extremes are expected to enlarge a profound data base is needed as an ensemble of downscaled climate scenarios. To store meteorological fields with high resolution in time and space is very resource demanding. The standard EURO-CORDEX dataset includes hourly precipitation data. For impact modellers however it is important to get data for the extreme events with higher resolution in time. In this study, we present a deep‑learning‑based framework to temporally downscale hourly ICON precipitation to 10‑minute resolution using a convolutional U‑Net architecture.

The source data consist of two input images corresponding to 1-hour accumulated precipitation fields. The target data are 10-minute precipitation fields derived from ICON simulations. The model is trained and evaluated over the following periods: 1980–1994 for training, 1995–1997 for validation, and 1998–1999 for testing. The model learns a mapping from the source data to the corresponding sequences of 10-minute precipitation. The U‑Net is trained to reconstruct the temporal distribution of rainfall within each hour while conserving the total hourly precipitation amount. We test the enforcement of conservation of total hourly precipitation with different techniques: a penalty term in the loss function, a constraint layer embedded into the architecture and conservation through a post-processing routine.

Model performance is evaluated using multiple statistical metrics to assess both the distribution and magnitude of precipitation. The histograms of predicted and target 10‑minute precipitation indicate that the model reproduces the marginal distribution well, while the scatter plot of total predicted versus total target precipitation summed over all grid cells and time steps shows that the model closely preserves the overall accumulated rainfall. Results also demonstrate that the U‑Net with the conservation enforcing constraint layer successfully reproduces sub‑hourly precipitation variability and captures the timing and intensity of short‑duration rainfall events more accurately than simple temporal disaggregation approaches.

This work highlights the potential of machine learning for efficient temporal downscaling of regional climate model outputs. The ultimate goal is to provide a tool for impact modelers to produce high-resolution precipitation data on their own demand . This framework has the potential to support applications in future warming scenarios. Since interested researchers can run the temporal downscaling model for their period of interest, there is no need for large memory resources to store precipitation datasets with a very high temporal resolution.


How to cite: Thayyil Mandodi, M., Arnold, C., Paul, K., Greenberg, D., Geyer, B., and Hagemann, S.: Temporal Downscaling of ICON Precipitation from Hourly to 10‑Minute Resolution Using a Physically Constrained U-NET, EGU General Assembly 2026, Vienna, Austria, 3–8 May 2026, EGU26-7647, https://doi.org/10.5194/egusphere-egu26-7647, 2026.

EGU26-7985 | ECS | Orals | HS7.2

Sensitivity of Microphysical Parameters in the Thompson Scheme Using Idealized WRF Simulations 

Eulàlia Busquets, Stefano Serafin, Mireia Udina, and Joan Bech

In numerical weather prediction models, microphysics schemes represent water vapor, cloud, and precipitation processes. These schemes rely on fixed parameters that are inherently uncertain or known to vary in space and time, such as the densities of snow and graupel. Inaccurate specification of these parameters leads to errors in the partitioning of surface precipitation into liquid and ice phases. To assess the sensitivity of model results to these parameters, in this study the Weather Research and Forecast (WRF) model version 4.5 was used to perform a set of idealized two-dimensional simulations of wintertime stable orographic precipitation. The design of the experiment was inspired by observations made on 25 and 26 October 2024 on the southern slope of the Pyrenees. The model configuration includes a mountain centered in the domain with a height of 1500 m and a half-width of 10 km, a horizontal grid spacing of 1 km, and 200 vertical levels. Microphysical processes are parameterized with the Thompson scheme, which is characterized by a special snow treatment that includes snow-size distribution dependence on ice water content and temperature, and a nonspherical shape of snow particles.

Model sensitivity was assessed by running-ensemble simulations, which were created by varying 6 empirical parameters of the microphysical scheme: the exponent a in the snow mass–size relation (aₘₛ), graupel density (ρg), the shape parameter of the gamma particle size distribution for rain (μr), snow (μs), and graupel (μg), and the coefficient controlling the conversion of rimed snow to graupel (rsg). Two sets of experiments were conducted. First, 6 single-parameter perturbation experiments were run, each one with 64 members. Second, a multi-parameter perturbation experiment with 1024 members in which all parameters were perturbed simultaneously. Preliminary results indicate that cloud and snow species exhibit the strongest response to single-parameter perturbations, with particularly high sensitivity to aₘₛ and μs. Specifically, increasing aₘₛ leads to snow at higher altitudes (5000–6000 m), while increasing μs lowers the melting layer to approximately 3000 m.

This research has been funded by projects ARTEMIS (PID2021-124253OB-I00), LIFE22-IPC-ES-LIFE PYRENEES4CLIMA and the Institute for Water Research (IdRA) of the University of Barcelona.

How to cite: Busquets, E., Serafin, S., Udina, M., and Bech, J.: Sensitivity of Microphysical Parameters in the Thompson Scheme Using Idealized WRF Simulations, EGU General Assembly 2026, Vienna, Austria, 3–8 May 2026, EGU26-7985, https://doi.org/10.5194/egusphere-egu26-7985, 2026.

Downscaling of rainfall time series is the process of transforming rainfall data from a coarse temporal resolution (e.g., daily or hourly totals) into finer time scales (e.g., minutes) while preserving key statistical and physical characteristics of the original data. Downscaling techniques are widely used in hydrology, urban drainage design, flood modeling, and climate impact studies where fine-resolution rainfall data are essential for simulating hydrological response and studying the impact of extreme rainfall events.

Numerous stochastic downscaling approaches have been proposed in the literature, including point process models, random cascades, Markov chains, and weather generators, each designed to reproduce specific rainfall characteristics such as intermittency, intensity distributions, and temporal dependence. However, these methods are typically developed and evaluated independently, often using different datasets and climates, which makes it hard to assess their relative strengths and limitations.

This study presents the first joint and systematic comparison of two independently developed, state-of-the-art stochastic rainfall downscaling methods based on random cascades. Specifically, the Standard and Blunt extension cascades derived from the Universal Multifractal (UM) theory are compared with the Equal-Depth Area (EDA) approach. The methods are applied to 300 high-resolution (1-minute) rainfall events in the Netherlands and France, using increasingly challenging downscaling ratios of 4, 16, and 64. The raw data was collected with the help of optical disdrometers (OTT Parsivel2) located at three different sites.

We analyze (i) the estimation and selection of cascade generator models and their impact on performance going from event based to climatic average key parameters, (ii) the statistical properties of the downscaled rainfall time series across scales, events and cascade types, using both standard scores, quantile comparison and Universal Multifractal analysis and (iii) the relative strengths and limitations of each method in terms of ensemble spread, temporal dependence structure and extreme rainfall reproduction. By jointly evaluating multiple methods on identical datasets, we aim to advance the science behind stochastic rainfall disaggregation and lay the foundation for further model refinements and application-driven method selection.

How to cite: Schleiss, M. and Gires, A.: One Dataset, Multiple Cascades: Insights from a Joint Evaluation of Stochastic Rainfall Downscaling Methods in France and the Netherlands, EGU General Assembly 2026, Vienna, Austria, 3–8 May 2026, EGU26-9128, https://doi.org/10.5194/egusphere-egu26-9128, 2026.

EGU26-9227 | ECS | Posters on site | HS7.2

Characterizing Global Flood Extremeness Through Physically Informed Neural Networks 

Hsiang Hsu and Hsing-Jui Wang

The tails of flood distributions provide key insights into the occurrence probability of extreme floods, which is commonly quantified by the shape parameter of an empirical Generalized Extreme Value (GEV) distribution fitted to annual maximum flood series. Despite the usefulness of fitting empirical GEV distributions to observations, considerable uncertainty remains in the estimated shape parameter across different parameter estimation approaches. In addition, most existing studies focus on regional scales, and a global-scale analysis is required to investigate the roles of varying climatic conditions and data quality in shaping extreme flood occurrence.

In this study, we first apply the L-moment method—an approach known for its robustness in extreme value statistics— to conduct a global analysis of extreme flood occurrence based on optimized GEV distributions. The Anderson–Darling test is used to evaluate the goodness-of-fit. We then integrate additional hydrological information, represented by up to 20 descriptors, into a supervised neural network (NN) model to construct a physically informed, data-driven framework for improving the estimation of GEV distribution parameters. A global-scale dataset comprising more than 6,600 river gauges, with record lengths ranging from 20 to 200 years, is used in this analysis.

Preliminary results indicate that the proposed framework can achieve flood distribution tail estimates comparable to those obtained from purely statistical methods (i.e., L-moment estimates), while providing additional physical insights into the estimation process. Overall, this study highlights the potential of integrating multi-dimensional common hydrological descriptors within a data-driven framework to support large-scale and consistent characterization of global flood extremeness.

How to cite: Hsu, H. and Wang, H.-J.: Characterizing Global Flood Extremeness Through Physically Informed Neural Networks, EGU General Assembly 2026, Vienna, Austria, 3–8 May 2026, EGU26-9227, https://doi.org/10.5194/egusphere-egu26-9227, 2026.

EGU26-9981 | ECS | Posters on site | HS7.2

Mitigating Checkerboard Artifacts for Enhanced Precipitation Nowcasting: A Comparison of Upsampling Techniques 

Jiseong Lim, Yong Oh Lee, and Dongkyun Kim

In the field of precipitation nowcasting, the application and advancement of deep learning techniques have enabled resource-efficient predictions. In particular, U-Net variants and attention-based architectures achieve computational reduction by extracting features with wide receptive fields through downsampling and upsampling processes. However, upsampling methods can induce checkerboard artifacts when spatially adjacent pixels in high-resolution feature maps are computed from different low-resolution pixels, resulting in overlooked dependencies compared to those derived from identical pixels. This leads to discrepancies with the ground truth patterns, ultimately degrading the performance of prediction models. This paper introduces upsampling techniques known to prevent checkerboard artifacts in the super-resolution domain into precipitation prediction models, aiming to improve performance while minimizing increases in model complexity. At the upsampling stage, we incorporate sub-pixel convolution or decouple the upsampling and channel reduction processes, comparing performance against models using transposed convolution, the standard upsampling approach in U-Net. Additionally, the Checkerboard Artifacts Score (CAS) is proposed to quantify the degree of checkerboard artifacts in images, which is applied to each model for analysis. CAS is defined as the ratio of errors between pixels forming artifact boundaries to errors between all adjacent pixels. In experiments, sub-pixel convolution and the combination of nearest neighbor or bilinear interpolation with subsequent convolution record lower CAS values than transposed convolution, while also demonstrating improved performance across metrics including NSE, CSI, and RMSE. Notably, sub-pixel convolution exhibits pronounced performance with balanced POD and FAR, while the bilinear approach generates spatially natural patterns with competitive performance. Analysis of the experimental results suggests that the reduction of checkerboard artifacts contributes to performance improvement. Furthermore, this work highlights the importance of upsampling method selection in video prediction tasks and provides practical guidance for model design.

How to cite: Lim, J., Lee, Y. O., and Kim, D.: Mitigating Checkerboard Artifacts for Enhanced Precipitation Nowcasting: A Comparison of Upsampling Techniques, EGU General Assembly 2026, Vienna, Austria, 3–8 May 2026, EGU26-9981, https://doi.org/10.5194/egusphere-egu26-9981, 2026.

EGU26-10004 | ECS | Posters on site | HS7.2

A Hybrid Bias-Correction Framework for Extreme Precipitation in Convection-Permitting Models 

Petr Vohnicky, Eleonora Dallan, Francesco Marra, and Marco Borga

Convection-permitting models (CPMs) better represent sub-daily precipitation than coarser models, but they still exhibit substantial biases in low probability occurrence extremes, with elevation-dependent patterns. In addition, the relatively short simulation periods, typically around 10 years, limit the robust estimation of rare events. This constrains the direct use of raw CPM output for applications that depend on extreme-value statistics. To address these limitations, this study introduces a hybrid bias-correction framework for CPM precipitation that targets hourly resolution.

The proposed method combines non-parametric and parametric components within an elevation-based pooling strategy. Stations and co-located CPM grid cells are grouped into elevation bands, and a common, monthly varying correction is estimated for each band to represent both spatial and seasonal variability. Low-to-moderate precipitation intensities are corrected using robust empirical quantile mapping. The upper tail is adjusted using an optimized Weibull tail model with left censoring, inspired by the Simplified Metastatistical Extreme Value approach. The optimal threshold is searched within the 0.8 to 0.97 quantile range using an adjusted Weibull tail test.

Model performance is evaluated using both extreme-value and distributional metrics derived from observations, raw CPM output, and bias-corrected series. Extreme behavior is assessed through 20-year return levels of 1-hour and 24-hour precipitation. Distributional performance is quantified using mean absolute bias computed over empirical quantiles, allowing improvements to be tracked across the full range of precipitation intensities.
Robustness is examined through a structured validation framework. Spatial robustness is tested by evaluating the elevation-based pooling approach using k-fold schemes in which subsets of stations are withheld from calibration. Temporal robustness is assessed through repeated cross-validation on the 10-year CPM slices, with six years randomly assigned to calibration and four years to validation.

Preliminary results show a reduction in mean absolute bias after correction, largely driven by an improved representation of the wet-hour ratio. When a minimum rainfall threshold is applied to the raw CPM data, the bias becomes comparable to that of the bias-corrected output, indicating that drizzle remains a key issue. For extremes, biases in 1-hour 20-year return levels generally decrease but are not fully eliminated, reflecting the large uncertainty in the distribution upper tail. For 24-hour 20-year return levels, results are mixed: biases are reduced for some CPMs but introduced or amplified for others, highlighting model-specific differences in the spatial characteristics of storm structure and organization. The validation indicates that the elevation-based pooling yields spatially robust corrections for sufficiently small, climatically homogeneous domains, while the assessment of temporal robustness remains inconclusive due to the limited length of the available 10-year CPM simulations.

How to cite: Vohnicky, P., Dallan, E., Marra, F., and Borga, M.: A Hybrid Bias-Correction Framework for Extreme Precipitation in Convection-Permitting Models, EGU General Assembly 2026, Vienna, Austria, 3–8 May 2026, EGU26-10004, https://doi.org/10.5194/egusphere-egu26-10004, 2026.

EGU26-12352 | Posters on site | HS7.2

On the limitations of interchangeability between canonical and microcanonical multiplicative cascade models 

Alin Andrei Carsteanu, Stergios Emmanouil, Roberto Deidda, Anastasios Perdios, César Aguilar-Flores, and Andreas Langousis

Being the most widely used generators of multifractal measures, multiplicative cascade models have been extensively applied in the field of geophysics, and particularly in hydrometeorology. As in any modeling effort, solving the "inverse problem" is essential, and in this case, it can be described as finding the appropriate cascade model that generates a given multifractal measure. Direct measurement of a generated field (e.g., a rainfall field, or a time series thereof) results in an immediate decomposition into breakdown coefficients,  producing a microcanonical (strictly normalized) multiplicative cascade over a limited range of scales. Yet, the canonical (expectation-normalized) phenomenology at underlying scales may generate statistical properties that are non-trivial to reproduce. The present work analyzes such properties for the simplified case of a one-dimensional, beta-lognormal discrete multiplicative cascade.

How to cite: Carsteanu, A. A., Emmanouil, S., Deidda, R., Perdios, A., Aguilar-Flores, C., and Langousis, A.: On the limitations of interchangeability between canonical and microcanonical multiplicative cascade models, EGU General Assembly 2026, Vienna, Austria, 3–8 May 2026, EGU26-12352, https://doi.org/10.5194/egusphere-egu26-12352, 2026.

EGU26-13895 | Posters on site | HS7.2

A new daily gridded precipitation dataset for the island of Ireland 

Mojolaoluwa Daramola, Conor Murphy, and Peter Thorne

Reliable high-resolution precipitation datasets are essential for climate analysis, hydrological modelling, and the assessment of climate extremes. Many existing gridded rainfall products are limited by national boundaries, making it difficult to carry out consistent regional-scale climate and hydrological assessments across the island of Ireland. Here, we present a new daily gridded rainfall product developed using a homogenous methodology across the entire island of Ireland. The dataset covers the period 1980-2020 and is based on rain gauge observations from Met Éireann and UK Met Office. The gridded product is generated using a high-resolution climatological interpolation framework based on inverse distance weighting (IDW) regression, with elevation included as a covariate. This approach allows the dataset to capture fine-scale spatial variability associated with orography, while preserving daily variability and extreme rainfall events. The daily grids are first produced at 1km x 1km resolution and then resampled to a common 0.1deg x 0.1deg resolution for comparison with other gridded datasets. To assess the quality of the product, we first validate the gridded rainfall estimates using observations from a crowd-sourced citizens rain gauges from the weather observation website, providing independent evaluation of the dataset. We then evaluate the dataset through grid-to-grid comparisons with Met Éireann daily grids and other widely used regional products such as E-OBS and Multi-Source Weighted-Ensemble Precipitation (MSWEP), focusing on annual and seasonal rainfall patterns, spatial biases, and selected storm events. The new datasets provides a spatially consistent representation of daily rainfall across the island of Ireland and offers a valuable resource for climate variability studies, extreme event analysis, and hydrological applications.  

How to cite: Daramola, M., Murphy, C., and Thorne, P.: A new daily gridded precipitation dataset for the island of Ireland, EGU General Assembly 2026, Vienna, Austria, 3–8 May 2026, EGU26-13895, https://doi.org/10.5194/egusphere-egu26-13895, 2026.

EGU26-15328 | Orals | HS7.2

A framework for benchmarking precipitation type classifiers used in weather and climate models  

Ali Nazemi, Ramin Ahmadi, and Amin Hammad

Diagnosing precipitation type (ptype) is a major source of uncertainty in hydroclimatological applications. We propose a systematic framework for benchmarking the algorithms used for identifying ptype in numerical weather predictors and climate models. Six widely-used ptype algorithms, proposed by Derouin (1973), Cantin & Bachand (1993), Baldwin & Contorno (1993), Ramer (1993), Bourgouin (2000), and the European Centre for Medium-Range Weather Forecasts (ECMWF, 2024), are considered over a box region in north eastern North America with Montreal at its center. The benchmarking is made using hourly data collected at 25 Automated Surface Observing Systems during the period of 2007 to 2024. All ptype algorithms are fed by ERA5 single- and pressure-level climate reanalysis fields at 0.25° resolution. We consider four skills for benchmarking: (1) efficiency at the local scale, (2) temperature conditioning at the regional scale, as well as (3) spatial, and (4) spatiotemporal coherences. For assessing the efficiency at the local scale, we use three measures of precision, recall and F1-score that reveal how modeled ptypes are compared with observed ones at each station. For regional temperature conditioning, we extract probabilities of ptypes conditioned to near-surface temperature and compare the observed and modeled conditional density function using Kolmogorov–Smirnov test and the Wasserstein-1 (W1) distance. For both spatial and spatiotemporal coherences, we consider probabilities of co-occurrence and the Jaccard similarity index at the 0-hour time lag (spatial) and 1–48-hour lags (spatiotemporal) and quantify agreements between modeled and observed ptypes using F1-score. Our results show the excessive weakness of current ptypes algorithms in distinguishing rare and high impacts ptypes, such as freezing rain and ice pellets. Temperature conditioning show that rain, freezing rain, and ice pellets are frequently shifted toward colder regimes with W1 reaching up to 8.3 °C.  While rain classification shows moderate spatial realism, the skills in snow and freezing rain are substantially weaker. When temporal structure is added, the coherence is declined even further, with Bourgouin (2000) standing out among other algorithms with F1-score reaching to 0.5 for freezing rain and 0.61 for other/mixed types.  Our findings are a call for improving ptype algorithms in weather and climate models, particularly for predicting rare but high impact ptypes.

How to cite: Nazemi, A., Ahmadi, R., and Hammad, A.: A framework for benchmarking precipitation type classifiers used in weather and climate models , EGU General Assembly 2026, Vienna, Austria, 3–8 May 2026, EGU26-15328, https://doi.org/10.5194/egusphere-egu26-15328, 2026.

Remote sensing technology is essential for real-time monitoring of spatiotemporal precipitation patterns. However, inherent limitations in indirect observation lead to significant errors in satellite-based precipitation products. Most existing correction methods depend on real-time ground observations, which limits their applicability for high-precision, operational use. To address this, we propose a two-stage synergistic correction framework specifically for the Global Satellite Mapping of Precipitation Near Real-Time product (GSMaP-NRT), with the goal of systematically enhancing the accuracy of its daily-scale estimates worldwide. Central to this framework is the Terrain-aware Two-stage Correction Framework (TTCF-NRT). In the first stage (historical modeling and real-time correction), we jointly utilize historical GSMaP-NRT and CPC merged precipitation data to train an improved Cumulative Distribution Function (CDF) matching model. Once trained, the model operates independently, requiring only real-time GSMaP-NRT data to perform rapid correction without needing concurrent CPC or ground-based inputs. In the second stage (near-real-time spatial refinement), we integrate the contemporaneous CPC product as a spatial reference into the first-stage corrected output. An improved Convolutional Neural Network (CNN) model, trained and validated through rigorous cross-validation, is then applied for spatial enhancement. This step significantly improves the characterization of precipitation spatial distribution, especially over complex terrain. Using the TTCF-NRT framework, we produced a daily corrected precipitation dataset for global land areas from 2020 to 2024 at a 0.5° spatial resolution. Comprehensive evaluation shows that: (1) globally, the TTCF-RT product significantly outperforms both the original GSMaP-NRT and its gauge-adjusted version (GSMaP-Gauge-NRT) in terms of Root Mean Square Error (RMSE) and Relative Bias (BIAS); (2) regionally, TTCF-NRT excels over the Continental United States (CONUS) and Western Europe. It also demonstrates consistent improvement at independent validation sites across China, though performance can still be enhanced, partly due to the limited spatial representativeness of the training data. In summary, the TTCF-NRT framework effectively combines historically calibrated real-time CDF correction with CNN-driven near-real-time spatial fusion. It offers an efficient, robust, and operationally viable correction solution for GSMaP-NNRT that does not rely on real-time external data. This approach substantially improves the accuracy and practical utility of satellite-derived precipitation estimates on a global scale, particularly in regions with complex topography.

How to cite: Wu, H.: A Terrain-Aware Two-Stage Correction Framework for Near-Real-Time Improvement of GSMaP-NRT Precipitation Estimates, EGU General Assembly 2026, Vienna, Austria, 3–8 May 2026, EGU26-15630, https://doi.org/10.5194/egusphere-egu26-15630, 2026.

EGU26-15956 | Orals | HS7.2

Spatial-temporal modelling of convective storms with temperature-conditioned convective cell lifecycles 

Li-Pen Wang, Chien-Yu Tseng, and Christian Onof

Stochastic convective storm generators are widely used for hydrological and climate-impact applications; however, most existing methods suffer from two fundamental limitations. First, once a convective cell is sampled, its properties are typically assumed to remain constant throughout its lifetime, neglecting the intrinsic evolution of cell intensity, size, and structure during growth and decay. Second, storm events are commonly generated by repeatedly sampling cell properties from fixed distributions, which limits inter-event variability and prevents systematic modulation of storm characteristics by large-scale weather or climate conditions, despite growing evidence that convective cell properties depend on variables such as near-surface temperature.

To address these limitations, this study develops a spatial–temporal convective storm generator that explicitly represents the lifecycle evolution of individual convective cells and its dependence on temperature. Storm arrivals are described using a point-process formulation, while individual storms are modelled as clusters of rainfall cells whose intensity and geometric properties evolve dynamically through time. The temporal evolution of cell properties is governed by a copula-based lifecycle model, within which key statistical parameters are conditioned on near-surface temperature using a regression-based model. Although the temperature dependence is introduced at the level of individual cell evolution, it propagates through the generator to influence storm-scale structure and inter-event variability.

The model is calibrated using 167 convective storm events observed over the Birmingham region (UK) between 2005 and 2017, identified and tracked with a state-of-the-art storm-tracking algorithm that provides detailed information on cell tracks and physical properties, including rainfall intensity, spatial extent, lifetime, storm duration, and motion. Results show that the proposed generator more realistically reproduces observed intra-event evolution, storm-to-storm variability, and extreme rainfall behaviour than conventional generators based on stationary cell assumptions. The resulting temperature-dependent storm generator offers a computationally efficient and physically consistent alternative to convection-permitting models for applications requiring large ensembles of convective rainfall realisations.

How to cite: Wang, L.-P., Tseng, C.-Y., and Onof, C.: Spatial-temporal modelling of convective storms with temperature-conditioned convective cell lifecycles, EGU General Assembly 2026, Vienna, Austria, 3–8 May 2026, EGU26-15956, https://doi.org/10.5194/egusphere-egu26-15956, 2026.

EGU26-16177 | ECS | Posters on site | HS7.2

Downscaling and bias-correcting satellite precipitation using a hybrid machine learning framework for flood modelling in ungauged basins. 

Hari Prakash, Pramod Soni, and Kamlesh Kumar Pandey

Hari Prakasha,  Pramod Soni b K .K Pandeyc

aResearch Scholar, Department of Civil Engineering IIT (BHU), Varanasi (U.P),221005,India,Email:hariprakash.rs.civ23@iitbhu.ac.in

bAssistant Professor,Department of Civil Engineering IIT (BHU), Varanasi(U.P),221005, India. Email: pramod.civ@iitbhu.ac.in

cAssociate Professor,Department of Civil Engineering,IIT(BHU),Varanasi(U.P),221005,India

Email: kkp.civ@iitbhu.ac.in

* Corresponding author: hariprakash.rs.civ23@iitbhu.ac.in

Accurate estimation of flood peaks in ungauged and data-scarce basins critically depends on the accuracy of rainfall inputs, still remains challenging due to the limited availability of ground observations and inherent uncertainties in satellite precipitation datas. Although datasets such as CHIRPS and GPM IMERG provide high-resolution rainfall information, their direct application in hydrological modelling is often constrained by regional bias, spatial scale mismatch, and temporal inconsistencies. Moreover, physically consistent representation of large-scale atmospheric variables is rarely incorporated in conventional bias-correction approaches.To address these limitations, this study proposes an integrated and scalable framework that combines satellite precipitation, ERA5 reanalysis variables, machine learning, and process-based hydrological modelling for flood peak estimation in ungauged basins. The framework is demonstrated over the Varuna River Basin (Varanasi, India). To resolve spatial scale mismatch, ERA5 atmospheric variables are spatially aggregated within an approximately 30 km buffer around each CHIRPS grid point prior to their use as predictors. A time-aware artificial neural network (ANN) is then developed to integrate multi-pixel GPM IMERG rainfall and aggregated ERA5 predictors, using CHIRPS as a reference dataset to generate physically informed, bias-corrected daily rainfall fields. Model robustness is ensured by systematically testing different network architectures with varying numbers of hidden neurons. The framework is implemented over more than one thousand grid cells, ensuring spatial consistency while maintaining computational efficiency.The corrected rainfall products are subsequently used to drive the SWAT hydrological model, and streamflow simulations are calibrated and validated using SWAT-CUP, with particular emphasis on reproducing peak discharge and high-flow extremes. At the daily scale, the proposed framework achieves coefficient of determination (R²) values of up to 0.76 for rainfall estimation, and leads to substantial improvements in streamflow simulation compared to uncorrected satellite rainfall, including reduced bias, improved temporal variability, and markedly enhanced simulation of flood peaks.

How to cite: Prakash, H., Soni, P., and Pandey, K. K.: Downscaling and bias-correcting satellite precipitation using a hybrid machine learning framework for flood modelling in ungauged basins., EGU General Assembly 2026, Vienna, Austria, 3–8 May 2026, EGU26-16177, https://doi.org/10.5194/egusphere-egu26-16177, 2026.

EGU26-16535 | Orals | HS7.2

Estimates of Point Rainfall Extremes from Satellite Precipitation Products: Application and bias correction in Italy 

Cesar Arturo Sanchez Peña, Francesco Marra, and Marco Marani

Reliable estimates of extreme precipitation are essential for understanding, predicting, and mitigating natural disasters. However, global-scale assessments are limited by the sparse and uneven distribution of ground-based observations. Satellite-based rainfall products provide valuable support for extreme value analysis, but their applicability is constrained by high uncertainty and coarse spatial resolution. The coarse resolution of global datasets (100–600 km² grids) prevents direct comparison with point-scale extreme value estimates, as point and area-averaged statistics differ inherently.

This study addresses this limitation by applying a downscaling approach for extreme-value statistics based on random field theory and the Metastatistical Extreme Value Distribution (MEVD). The method exploits the autocorrelation structure of precipitation fields and is applied to each product at grid cells corresponding to rain gauge locations. Six remote sensing and reanalysis (RSR) products, along with their ensemble, are evaluated using a rain gauge network in Italy.

Downscaled estimates of daily 50-year return period precipitation are compared with corresponding estimates derived from rain gauge time series, considering both individual products and their ensemble median. To further improve the accuracy of satellite maps, two bias correction techniques are applied: quantile mapping and linear regression. The final results show that the ensemble obtained from the median of the RSR products provides the best overall performance.

This research was supported by the "raINfall exTremEs and their impacts: from the local to the National ScalE" (INTENSE) project, funded by the European Union - Next Generation EU in the framework of PRIN (Progetti di ricerca di Rilevante Interesse Nazionale) programme (grant 2022ZC2522). Marco Marani was also supported by the RETURN Extended Partnership and received funding from the European Union Next-GenerationEU (National Recovery and Resilience Plan – NRRP, Mission 4, Component 2, Investment 1.3 – D.D. 1243 2/8/2022, PE0000005).

How to cite: Sanchez Peña, C. A., Marra, F., and Marani, M.: Estimates of Point Rainfall Extremes from Satellite Precipitation Products: Application and bias correction in Italy, EGU General Assembly 2026, Vienna, Austria, 3–8 May 2026, EGU26-16535, https://doi.org/10.5194/egusphere-egu26-16535, 2026.

EGU26-16977 | ECS | Posters on site | HS7.2

Scale-Aware Machine Learning for Precipitation Downscaling: Impact on Regional Applications in Europe 

Hyeonjin Choi, Quyet The Nguyen, Oldřich Rakovec, Hyungon Ryu, and Seong Jin Noh

Accurate high-resolution precipitation is critical for hydrological modelling, climate impact assessment, and flood risk analysis, yet reanalysis products like ERA5 often lack the necessary spatial detail required at regional scales. This study investigates machine learning-based super-resolution techniques for precipitation downscaling, specifically examining scale-dependency and uncertainty.

We test several downscaling strategies, including convolutional neural networks with channel‑attention mechanisms and generative diffusion models. Precipitation fields are downscaled from coarse-resolution ERA5 inputs (0.25° resolution) to finer spatial resolutions using gridded observational datasets as reference: E‑OBS (0.125°) for pan‑European evaluation and, for selected regions, higher‑resolution products such as EMO‑1 (~1 km). By considering multiple scale factors, we adopt a scale‑aware framework that quantifies how downscaling skill and the associated uncertainty in super-resolution machine learning methods vary with spatial resolution and with the choice of reference dataset.

Model evaluation combines conventional accuracy metrics with diagnostics of field structure, focusing on spatial heterogeneity, intensity‑dependent behaviour (including extremes), and robustness across seasons and climatic regimes. We also discuss how scale‑dependent changes in precipitation variability and spatial structure can inform uncertainty characterisation for machine‑learning downscaling and guide its use in regional hydrological modelling and flood‑risk assessments across Europe.

How to cite: Choi, H., Nguyen, Q. T., Rakovec, O., Ryu, H., and Noh, S. J.: Scale-Aware Machine Learning for Precipitation Downscaling: Impact on Regional Applications in Europe, EGU General Assembly 2026, Vienna, Austria, 3–8 May 2026, EGU26-16977, https://doi.org/10.5194/egusphere-egu26-16977, 2026.

EGU26-18143 | Orals | HS7.2

The sensitivity of convective precipitation in South Africa to horizontal turbulent exchange in the km-scale regional climate model REMO-NH 

Thomas Frisius, Torsten Weber, Sophie Biskop, Muhammad Fraz Ismail, and Francois Engelbrecht

This study addresses the challenges of simulating precipitation in South Africa using the convection-permitting climate model REMO-NH. In the WaRisCo project, which focuses on hydroclimatic extremes under a changing climate, a realistic representation of precipitation is essential for providing suitable forcing data for hydrological modelling. Traditional regional climate models (RCMs) with resolutions of about 11km have the limitation of not accurately reproducing extreme precipitation events such as thunderstorms. Convection-permitting RCMs (CP-RCMs) represent an alternative that offers a higher resolution and explicit simulation of convection.

For the study, the non-hydrostatic climate model REMO-NH is adopted with a resolution of about 3 km and driven by ERA5 using the double nesting technique. It enables explicit simulation of deep cumulus clouds with high vertical velocities. As entrainment of ambient air strongly influences precipitation, its representation depends critically on horizontal turbulent transfer in the model. In the standard model setup, second-order horizontal diffusion (DIFF2) takes care of this transfer. However, excessively high precipitation occurs in the autumn and winter seasons in comparison to the CHIRPS precipitation data.

A simulation with fourth order horizontal diffusion (DIFF4) reveals an even stronger precipitation bias. As an alternative to artificial diffusion, a 3D turbulence scheme has been implemented. A simulation with this scheme (TURB3D) removes this bias. Further evaluation of the results shows that the bias appears mainly for intermediate values in the frequency distribution and that the boundary layer moisture and, therefore, CAPE (convective available potential energy), are higher in the simulations with artificial horizontal diffusion. These results demonstrate that accurate treatment of 3D turbulent exchange is essential for improving convection-permitting simulations, and it will, therefore, be used for the km-scale climate projections within the WaRisCo project, which is part of the “Water Security in Africa – WASA” program.

How to cite: Frisius, T., Weber, T., Biskop, S., Ismail, M. F., and Engelbrecht, F.: The sensitivity of convective precipitation in South Africa to horizontal turbulent exchange in the km-scale regional climate model REMO-NH, EGU General Assembly 2026, Vienna, Austria, 3–8 May 2026, EGU26-18143, https://doi.org/10.5194/egusphere-egu26-18143, 2026.

EGU26-18828 | Posters on site | HS7.2

A Novel Conditional Two-Phase Framework for High-Resolution Long-Term Precipitation Reconstruction: The Case of Sicily (1951–2025) 

Antonio Francipane, Niloufar Beikahmadi, Dario Treppiedi, and Leonardo Valerio Noto

Reliable, high-resolution gridded precipitation data are nowadays indispensable for modern climate science, hydrological modeling, and engineering applications, particularly in the Mediterranean region, where sharp topographic gradients and convective dynamics drive significant spatial variability. This study presents the development of a new daily gridded precipitation dataset for Sicily at a 2-km resolution, spanning the period 1951–2025. To address the challenges of reconstructing physically plausible fields from sparse historical records, we propose a "Conditional Two-Phase Reconstruction" framework that explicitly separates rainfall occurrence from conditional magnitude.

The methodology integrates heterogeneous in-situ observational sources, merging long-term historical archives with a modern, high-density automated rain gauge network. A core innovation of this work lies in the transfer of spatial model structures and precipitation regime definitions learned from the short-term dense network to the data-scarce historical period.

The framework first models spatial intermittency (Phase I) using regime-specific Indicator Kriging to distinguish between widespread precipitation and localized convective events. Subsequently, for magnitude estimation (Phase II), the study evaluates and implements three competing approaches: Geostatistical interpolation, hybrid Regression-Kriging utilizing Generalized Additive Models (GAMs), and Machine Learning via Extreme Gradient Boosting (XGBoost). To capture non-linear atmospheric interactions, the reconstruction leverages static physiographic predictors alongside dynamic atmospheric covariates derived from ERA5 reanalysis data, including Convective Available Potential Energy (CAPE) and Vertical Integrated Moisture Flux Divergence (VIMFD). By stratifying events into hydrometeorological regimes based on spatial coverage and intensity, the proposed framework provides a transferable blueprint for climate reconstruction in complex orographic domains. Models’ performance is evaluated through comprehensive Leave-One-Out cross validation using uncertainty and prediction error metrics.

How to cite: Francipane, A., Beikahmadi, N., Treppiedi, D., and Noto, L. V.: A Novel Conditional Two-Phase Framework for High-Resolution Long-Term Precipitation Reconstruction: The Case of Sicily (1951–2025), EGU General Assembly 2026, Vienna, Austria, 3–8 May 2026, EGU26-18828, https://doi.org/10.5194/egusphere-egu26-18828, 2026.

EGU26-19062 | ECS | Posters on site | HS7.2

Diffusion model based downscaling of extreme precipitation in southern Europe 

Joshua Miller, Peter Watson, Kate Halladay, and Rachel James

Climate models produce enormous amounts of atmospheric data. However, these models often have very large spatial resolution, making hazard-scale, e.g. an individual city or catchment, forecasts based on future climate data impossible. Diffusion models (DMs) are a class of deep-learning generative models that can rapidly produce ensemble-like realisations of high-resolution weather states, allowing for uncertainty quantification. Numerous studies have demonstrated the efficacy of these models in faithfully downscaling weather variables from both observational datasets and from global climate models to regional climate models. However, little is known about how well DMs can perform when trained and evaluated on heterogeneous and multi-source datasets, and even less regarding their ability to faithfully emulate high-resolution extreme rainfall events. To evaluate this, we train a DM to emulate 0.1° by 0.1° hourly precipitation data from IMERG (satellite-based), using hourly 1° by 1° atmospheric fields from ERA5 (reanalysis) as the model’s input. We are also performing an out-of-distribution experiment in which extreme events are excluded from the DM’s training data in order to investigate to what extent it can accurately extrapolate to severe weather. Our domain is centred in southern Europe and was chosen to cover many diverse regions, including the Alps, Mediterranean Ocean, and northern Africa. According to continuous rank probability score, power spectral density, histograms and many other metrics, after training on balanced data our DM accurately downscales precipitation across all rainfall intensity levels, preserves fine-scale spatial structures, learns regional precipitation dynamics, and captures extreme events in the tails of the distribution. Our DM also outperforms a strong climatological baseline, and it is superior to other commonly used models such as a deterministic deep convolutional network, which tends to over-smooth and underestimate extreme events. Our results affirm the ability of diffusion models to generate robust, hazard-relevant rainfall realisations using coarse atmospheric data.

How to cite: Miller, J., Watson, P., Halladay, K., and James, R.: Diffusion model based downscaling of extreme precipitation in southern Europe, EGU General Assembly 2026, Vienna, Austria, 3–8 May 2026, EGU26-19062, https://doi.org/10.5194/egusphere-egu26-19062, 2026.

EGU26-20546 | ECS | Orals | HS7.2

Downscaling Precipitation Projections using Generative AI: Benchmarking against the WRF Dynamical Climate Model  

Jorge Sebastián Moraga, Nans Addor, Natalie Lord, and Chris Lucas

High-resolution climate projections are essential for hydrological and meteorological impact assessments, yet dynamical numerical simulations remain computationally prohibitive for large ensembles and domains. Generative AI, specifically Probabilistic Diffusion Models (DMs), offer a promising, computationally efficient alternative. Recently, these models have demonstrated skill in reproducing historical data and serving as efficient emulators of dynamical models. The question is, therefore, whether models trained on historical observations can infer the non-stationary statistics of future climate projections.

In this work, we downscale CESM2-LENS simulations over large domains using a DM trained on reanalysis data. We investigate the model's capability to bridge the scale gap between GCM outputs (~100 km resolution) and data requirements for local hydrological impact modelling (~10 km resolution) under both historical and end-of-century scenarios. Furthermore, we compare the diffusion-based approach with the outputs of the state-of-the-art WRF dynamical model, with a focus on the changes to key hydrometeorological indices. By benchmarking DM-downscaled data against both dynamically-downscaled data and GCM baselines, we aim to assess the trade-offs between computational efficiency and physical consistency, offering insights into the generalization limits of generative AI for climate change impact studies.

How to cite: Moraga, J. S., Addor, N., Lord, N., and Lucas, C.: Downscaling Precipitation Projections using Generative AI: Benchmarking against the WRF Dynamical Climate Model , EGU General Assembly 2026, Vienna, Austria, 3–8 May 2026, EGU26-20546, https://doi.org/10.5194/egusphere-egu26-20546, 2026.

EGU26-20641 | ECS | Orals | HS7.2

SLRainGrid-D05: High-Resolution Daily Precipitation Dataset for Sri Lanka Derived from Machine Learning and Satellite-Gauge Fusion 

Chamal Perera, Nadee Peiris, Lalith Rajapakse, Nimal Wijayaratna, and Ajith Wijemannage

Long-term, accurate fine-scale precipitation estimates are essential for hydrological and climate-related analyses, particularly in regions characterized by strong spatial rainfall variability. This study introduces SLRainGrid-D05, the first high-resolution gridded daily precipitation dataset for Sri Lanka, developed at a spatial resolution of 0.05°×0.05° and covering the entire country, including the wet, intermediate, and dry climatic zones. Sri Lanka’s tropical climate exhibits pronounced spatial variability in annual rainfall, ranging from approximately 900 mm to 5,500 mm, which cannot be adequately captured by the sparsely distributed rain-gauge network alone. In addition, satellite-based precipitation products (SPPs) are known to exhibit considerable biases over the region.

To address these limitations, a spatially consistent gridded precipitation dataset was developed by merging ground-based observations with SPPs. An initial evaluation of two widely used SPPs, IMERG and CHIRPS, demonstrated that IMERG performs better at the daily time scale, while CHIRPS shows superior performance at monthly scale. Based on these findings, daily IMERG precipitation was downscaled from its native 0.1°×0.1° resolution to 0.05°×0.05° using CHIRPS rainfall as spatial reference information. The downscaled IMERG product was subsequently merged with rain-gauge observations using machine-learning-based approaches.

The study introduces a novel hybrid merging framework that integrates graph neural networks (GNN) with inverse distance weighting (IDW) to explicitly account for the spatial autocorrelation of rainfall. The proposed method was benchmarked against conventional machine-learning models, including random forest, extreme gradient boosting, support vector machines, and artificial neural networks. Results indicate that the hybrid GNN-IDW framework consistently outperforms these benchmark methods in both rainfall detection and magnitude estimation. Specifically, it achieved the highest probability of detection (0.97) and reduced root mean square error (RMSE) and mean absolute error (MAE) by 13-41% and 9-36%, respectively, relative to the original SPPs. The SLRainGrid-D05 dataset offers a reliable, high-resolution precipitation product and represents a valuable resource for hydrological modeling, climate analysis, and improved preparedness for hydrological extremes, supporting water resources assessment and management across Sri Lanka, with the proposed methodology also being transferable to other tropical regions.

How to cite: Perera, C., Peiris, N., Rajapakse, L., Wijayaratna, N., and Wijemannage, A.: SLRainGrid-D05: High-Resolution Daily Precipitation Dataset for Sri Lanka Derived from Machine Learning and Satellite-Gauge Fusion, EGU General Assembly 2026, Vienna, Austria, 3–8 May 2026, EGU26-20641, https://doi.org/10.5194/egusphere-egu26-20641, 2026.

EGU26-21546 | ECS | Orals | HS7.2

Benchmarking High-Resolution Quasi–Real-Time Satellite Precipitation Products over Northern Tunisia 

Abir Naceur, Hamouda Dakhlaoui, Giovanni Battista Chirico, and Anna Pelosi

Using a two-stage evaluation framework, this study evaluates five near-real-time (NRT) satellite precipitation products (GPM-IMERG V07, GSMAP V06, GSMAP V07, GSMAP V08, PERSSIAN PDIR NOW) over northern Tunisia. The evaluation is conducted at hourly temporal resolution using complementary point-to-pixel statistical analyses and hydrological modelling experiments.

The first stage consists of a comprehensive statistical assessment based on continuous, categorical, and event-based verification metrics. While continuous and categorical approaches have been widely used in previous studies, event-based evaluation methods have been applied far less frequently; their joint use in this study therefore provides a more comprehensive and complementary assessment of NRT precipitation products. 

The second stage involves a rainfall–runoff model to investigate how errors in satellite-derived precipitation propagate through the hydrological system and affect simulated streamflow.

Continuous metrics highlight considerable differences in performance among the five products. GSMaP-V8 and GPM-IMERG demonstrate the most consistent with gauge observations, followed by GSMaP-V6, with Pearson correlation coefficients (PCC) ranging from 0.32 to 0.35 and RMSE values below 0.20 mm. By contrast, GSMaP-V7 shows lower performance. PERSIANN-PDIR-NOW systematically exhibits the weakest accuracy, characterized by low correlation and large error magnitudes.

Categorical verification validates that GPM-IMERG presents the highest rainfall detection capability, achieving probability of detection (POD) values exceeding 0.45 and critical success index (CSI) values above 0.23 for light and moderate rainfall thresholds. Conversely, PERSIANN-PDIR-NOW suffers from frequent false alarms, contributing to decreased categorical skill.

Event-based analyses reveal a general tendency of satellite products to overestimate rainfall event frequency and peak characteristics. GSMaP-V8 exhibits the most balanced and consistent overall performance. GPM-IMERG and GSMaP-V6 better reproduce mean event intensity. GSMaP-V7, however, systematically overestimates event depth, intensity, and peak timing. Moreover, PERSIANN-PDIR-NOW underestimates the mean event precipitation rate, accompanied by a peak rainfall timing shifted earlier relative to observations.

The hydrological evaluation shows that rainfall–runoff modeling propagates precipitation uncertainties non-linearly into simulated streamflow. GPM-IMERG, GSMAP-V7 and GSMAP-V6 yield the most realistic flow simulations (KGE up to 0.68), Other products with comparable rainfall-level statistics nonetheless generate biased streamflow responses

Overall, the findings provide relevant information for improving NRT satellite precipitation algorithms and offer practical guidance for Community stakeholders and practitioners in selecting suitable alternative precipitation datasets in hydrological applications across specific basins, regions, or climatic zones.


Keywords: Hourly rainfall, Near-real-time satellite precipitation products, GPM-IMERG V07, GSMAP V06, GSMAP V07, GSMAP V08, PERSSIAN PDIR NOW, Northern Tunisia

How to cite: Naceur, A., Dakhlaoui, H., Chirico, G. B., and Pelosi, A.: Benchmarking High-Resolution Quasi–Real-Time Satellite Precipitation Products over Northern Tunisia, EGU General Assembly 2026, Vienna, Austria, 3–8 May 2026, EGU26-21546, https://doi.org/10.5194/egusphere-egu26-21546, 2026.

EGU26-21742 | ECS | Orals | HS7.2

Process-Informed Regional Climate Modeling for South Asia: The SARCI Framework 

Debi Prasad Bhuyan, Pankaj Upadhyaya, and Saroj Kanta Mishra

South Asia—home to more than a quarter of the global population—faces escalating climate risks that require scientifically credible and actionable climate information. Yet current global climate models exhibit persistent temperature and precipitation biases, reaching up to 25% and 100% of their mean values, respectively, which limits their utility for regional assessments and policy planning. To address these limitations, we develop the South Asia Regional Climate Information (SARCI) framework: a regionally optimized, process-informed system designed to improve simulations of the South Asian Summer Monsoon (SASM) and generate high-fidelity climate information.

SARCI features a customized atmospheric model based on NCAR CESM/CAM5, incorporating targeted enhancements to key physical parameterizations—stochastic entrainment for deep convection (STOCH), a dynamic convective adjustment timescale (DTAU), supplementary gravity-wave sources (GW), and region-specific similarity functions for land–air turbulent fluxes (LTF)—alongside structured parameter tuning and a statistical bias-correction and downscaling module. A systematic component-wise attribution quantifies the incremental influence of each enhancement. DTAU reduces precipitation biases and improves the annual cycle through better moisture convergence, cloud cover, and equatorial waves. STOCH and GW improve precipitation, circulation, and moisture distribution, with STOCH providing additional skill in equatorial waves. LTF primarily improves near-surface temperature with marginal precipitation benefits. Parameter tuning consolidates these gains and resolves residual inconsistencies, while the downscaling module corrects remaining magnitude errors and delivers quarter-degree, policy-relevant fields.

Together, these sequential improvements reduce longstanding SASM-related biases, yield more realistic regional circulation, and preserve acceptable global model performance. By clarifying the physical origins of model improvements and integrating co-production and regional optimization, the SARCI framework provides credible, actionable climate information for South Asia and offers a scalable pathway for other climate-vulnerable regions of the Global South.

How to cite: Bhuyan, D. P., Upadhyaya, P., and Mishra, S. K.: Process-Informed Regional Climate Modeling for South Asia: The SARCI Framework, EGU General Assembly 2026, Vienna, Austria, 3–8 May 2026, EGU26-21742, https://doi.org/10.5194/egusphere-egu26-21742, 2026.

EGU26-1939 | ECS | Posters on site | AS1.15

Rossby modes leading stratocumulus and lower-tropospheric stability 

Hairu Ding, Bjorn Stevens, Frank Lunkeit, and Nedjeljka Žagar

Stratocumulus decks (Sc) are semi-persistent over the eastern subtropical oceans. They are hypothesized to stay there because of cooler ocean and subsidence warming, which together create strong lower-tropospheric stability. It is therefore naturally assumed that the variability of Sc is controlled by subsidence and local SST as well. However, our study finds this assumption is not supported by observations. In this study, we decompose the circulation coupled with lower-tropospheric stability (represented by estimated inversion strength, EIS) and Sc (represented by low-cloud cover, LCC), respectively, from synoptic to interannual timescales. The signals show that local subsidence doesn't dominate EIS variability. Instead, EIS variability is controlled by extratropical Rossby waves. SST only influences EIS on long timescales. More interestingly, LCC is associated with circulation patterns similar to those of EIS but shifted about 10 degrees upstream. Local SST cooling appears to be no more important than upstream warming for Sc. Since Klein et al. (1995), studies have observed that the conditions on the Lagrangian trajectory of Sc are important for its growth. Our results are consistent with them and further emphasize the importance of the upstream Rossby ridge across timescales. It suggests that an upstream warming with a relatively unchanged local Sc condition can also cause an Sc increase.

How to cite: Ding, H., Stevens, B., Lunkeit, F., and Žagar, N.: Rossby modes leading stratocumulus and lower-tropospheric stability, EGU General Assembly 2026, Vienna, Austria, 3–8 May 2026, EGU26-1939, https://doi.org/10.5194/egusphere-egu26-1939, 2026.

Stratocumulus (Sc) clouds have high impact on the climate system because of their strong cooling effect (albedo).
In the subtropical oceans they naturally break up into cumulus (Cu) as environmental conditions change, a phenomenon called Stratocumulus--Cumulus Transition (SCT). This results in significant loss cloudiness and thereby cooling.
To better understand the physical processes and environmental conditions influencing most this transition we develop a conceptual mixed layer model with dynamic cloudiness and sea surface temperature (SST).
In this model Sc and Cu states are two alternative attractors of the dynamics.
We tested various different parameterizations, and in most configurations the model broadly reproduces observed variability in cloud fraction, SST, heat fluxes, and moisture.
In this isolated system we robustly show that transitions between Sc and Cu are most sensitive to changes in circulation.
In climate change scenarios we show that SCT is enhanced due to direct radiative effects of increasing CO2 and due to weakening subtropical subsidence deepening the boundary layer. An accelerated SCT via weakening subisdence is a high strength positive feedback in the climate system based at its core on cloud-circulation coupling.
We close the talk by (1) highlighting the differences between linear and nonlinear response of clouds to weakening subsidence and (2) motivating the community to embrance high magnitude but low likely hood events as part of standard analyses of models.

How to cite: Datseris, G.: Interplay between decreasing subsidence and stratocumulus-cumulus transitions, EGU General Assembly 2026, Vienna, Austria, 3–8 May 2026, EGU26-2528, https://doi.org/10.5194/egusphere-egu26-2528, 2026.

EGU26-2585 | ECS | Orals | AS1.15

Heterogeneous initial conditions affect the pathway of moisture growth and the radiative effects of trade cumuli 

Marloes van Driel, Chiel van Heerwaarden, and Martin Janssens

The role of patterning of clouds in climate sensitivity is unknown. Smaller clouds grow due to the coupling with a shallow circulation, where the cloud resides on the ascending branch of the circulation. However, there seems to be a certain maximum size in large-eddy simulations (LESs) to this scale growth, which is smaller compared to observations. Therefore, we have conducted two 500 km-domain LESs: One (Control) with homogeneous initial conditions and one (“Fish”) with a 250 km initial moisture perturbation, created such that the domain-mean moisture is kept constant. The Fish simulation emulates the advection of large-scale moisture structures into the trades, and thus reminds us of “Fish-clouds”, which appear to form this way. This simulation indeed leads to a larger cloud, which has an elongated shape and develops a bimodal Total Water Path (TWP) distribution. Moreover, the moisture growth behaves differently as compared to previous research and the Control simulation. The upward motion of the circulation does not lead to moisture growth, but balances the moisture sink (rain). The moisture growth is caused by horizontal growth in the cloud top. Eventually, the Fish has a larger cloud fraction (26%) and a larger albedo (11%) than the Control simulation, leading to a larger daily short-wave cloud radiative effect (SW CRE) of 40%. In absolute numbers, this SW CRE is up to 40 W/m^2 larger in the Fish simulation compared to the Control simulation. Thus, the initial conditions seem to trigger a different pathway for moisture growth, which affects the cloud radiative effect. This study is a first step in unravelling this process, which might affect the climate sensitivity of patterning of clouds.

How to cite: van Driel, M., van Heerwaarden, C., and Janssens, M.: Heterogeneous initial conditions affect the pathway of moisture growth and the radiative effects of trade cumuli, EGU General Assembly 2026, Vienna, Austria, 3–8 May 2026, EGU26-2585, https://doi.org/10.5194/egusphere-egu26-2585, 2026.

EGU26-3115 | Orals | AS1.15

Effects of Saharan air layers on clouds over the tropical Atlantic during BOWTIE 

Anna Trosits, Andreas Foth, Moritz Haarig, Jonas Witthuhn, Anton Kötsche, Johanna Roschke, and Heike Kalesse-Los

The radiative effect of clouds is determined by their development, lifetime and microphysical characteristics. The processes influencing cloud properties are diverse and require further investigation to gain a more profound understanding. However, process studies cannot be conducted by modelling alone, as observations are rarely available, particularly over the oceans. This leads to uncertainties in global weather modelling and climate forecasts. In order to disentangle the effects of various influencing factors on clouds in the intertropical convergence zone (ITCZ), recent observations from the BOWTIE campaign are being analysed with regard to the effects of Saharan dust. During the BOWTIE (Beobachtung von Ozean und Wolken – das Trans-ITCZ Experiment) campaign, which was part of the ORCESTRA (Organized Convection and EarthCARE Studies over the Tropical Atlantic) campaign, the research vessel (RV) Meteor crossed the tropical Atlantic from Cape Verde to Barbados in August and September 2024. The proximity to the African continent and the Sahara led to some trajectories of the Saharan air layers (SAL) traversing the atmosphere above the RV Meteor. Three episodes of SAL lasting between two and three days were observed at altitudes spanning from one to five km. The dry and dust-loaden character of the SAL is determined by their origin in the Saharan desert. Analysis of the Raman lidar observations provides information about the time and altitude of the SAL. In synergy with other instruments, such as radiosondes and a motion-stabilised 94GHz cloud radar, the effect on clouds can be investigated. The stabilisation of the cloud radar, which was monitored by STARPAS (STAbilized Radar Platform Alignment Sensor), ensures reliable vertically pointing cloud observations. The findings indicate that SAL reduces cloud vertical development and suppresses weak convection. This behaviour is due to the thermodynamic structure of the SAL with low relative humidity, nearly dry adiabatic temperature gradients and inversions at the top and bottom. Particle-specific properties of acting as cloud condensation nuclei or ice nucleating particles are of secondary order.

How to cite: Trosits, A., Foth, A., Haarig, M., Witthuhn, J., Kötsche, A., Roschke, J., and Kalesse-Los, H.: Effects of Saharan air layers on clouds over the tropical Atlantic during BOWTIE, EGU General Assembly 2026, Vienna, Austria, 3–8 May 2026, EGU26-3115, https://doi.org/10.5194/egusphere-egu26-3115, 2026.

EGU26-6271 | Posters on site | AS1.15

The EUREC4A Model Intercomparison Project: A first look at our ability to simulate trade cumuli at hectometre- and storm-resolving resolutions 

Martin Janssens, Pier Siebesma, Florent Beucher, Florent Brient, Jingyi Chen, Fleur Couvreux, Thijs Heus, Fredrik Jansson, Frans Liqui-Lung, Adrian Lock, Girish Raghunathan, Wim De Rooy, Hauke Schulz, Bart Van Stratum, Abraham Torres, and Bert Van Ulft

We report the first results of an intercomparison of nine atmospheric models with horizontal resolutions between 150 m and 2.5 km: ICON, DALES, MesoNH, MicroHH, MetOffice UM, HARMONIE-AROME, AROME, WRF, and COSMO. These models all simulated shallow cumulus convection over the subtropical Atlantic Ocean during the period of the EUREC4A field campaign (Jan-Feb 2020), most of them with open boundary conditions and on large (>500 km) domains. Our "EUREC4A-MIP" seeks to answer how consistently such models reproduce i) statistics of the observed atmospheric state, clouds and energy/water budgets over large (200 km) areas, ii) the horizontal cloud organization that set the regions' contribution to the planetary albedo and iii) the coupling between clouds and circulations at mesoscales. We extend an open invitation for further exploration of the simulation data, which we publish through the EUREC4A intake catalog.

How to cite: Janssens, M., Siebesma, P., Beucher, F., Brient, F., Chen, J., Couvreux, F., Heus, T., Jansson, F., Liqui-Lung, F., Lock, A., Raghunathan, G., De Rooy, W., Schulz, H., Van Stratum, B., Torres, A., and Van Ulft, B.: The EUREC4A Model Intercomparison Project: A first look at our ability to simulate trade cumuli at hectometre- and storm-resolving resolutions, EGU General Assembly 2026, Vienna, Austria, 3–8 May 2026, EGU26-6271, https://doi.org/10.5194/egusphere-egu26-6271, 2026.

EGU26-6529 | ECS | Orals | AS1.15

CP-MIP: One cold pool in five models, ten runs, and one campaign 

Nils Antary, Jan Kazil, Maike Ahlgrimm, Martin Janssens, Girish Nigamanth Raghunathan, Tomoro Yanase, and Raphaela Vogel
Cold pools play an important role in determining the structure and properties of the marine boundary layer in the subtropics. Cold pools are precipitation-driven downdrafts that reach the surface and spread concentrically, leading to cloud suppression inside the cold pool and an active gust front at the perimeter, where converging winds often trigger new convection. Although their importance has long been recognised, the net effect on cloud amount, organisation and radiative effects is still not fully clear. Before we can trust large-eddy simulations to study these aspects, we need to better understand the dependency of simulated cold pools on the chosen model and set-up. Here we analyse outputs from ten runs from five models simulating a cold pool observed during the EUREC4A campaign. All runs were performed as part of the Cold Pool Model Intercomparison Project (CP-MIP). Our goal is to assess the trustworthiness of LES and understand the origin of model differences. We focus on differences related to the following research questions: What conditions lead to the formation of the cold pool? How does the cold pool expand and eventually recover? What is the internal moisture and temperature structure?
Our first results show that most runs produce a single strong cold pool.While large differences in the onset time are caused by forcing differences, the speed of moisture aggregation, and the microphysical model, the growth rate is primarily controlled by the mean buoyancy anomaly inside the cold pool. Furthermore, we show that the internal structure can differ greatly between runs that differ only in their microphysical schemes. While some runs produce a single cold pool that eventually spreads to a size exceeding 100 km, other runs initially create more than ten individual cold pools that all collide and form a super cold pool of comparable size. The EUREC4A observations show a growth rate and timing that fall within the inter-model spread. Measurements of the early stage of the cold pool reveal an almost homogeneous internal structure rather than multiple events. As demonstrated, this unique setup allows not only for a comparison of the runs but also for validation of relevant processes with observations.

How to cite: Antary, N., Kazil, J., Ahlgrimm, M., Janssens, M., Raghunathan, G. N., Yanase, T., and Vogel, R.: CP-MIP: One cold pool in five models, ten runs, and one campaign, EGU General Assembly 2026, Vienna, Austria, 3–8 May 2026, EGU26-6529, https://doi.org/10.5194/egusphere-egu26-6529, 2026.

EGU26-9723 | Posters on site | AS1.15

Meteorological conditions associated with the shallow mesoscale clouds in the southern Atlantic 

Manu Anna Thomas, Pouria Khalaj, and Abhay Devasthale

Shallow oceanic clouds strongly influence the global energy balance by cooling the planet and mediating exchanges of heat and moisture between the ocean and the atmosphere. A key challenge arises from the fact that these shallow clouds frequently organize into a range of spatial structures that are unresolved in global climate models and are heavily parameterized based on the meteorological conditions. Understanding the coupling of these clouds to meteorology is therefore essential to improve their representation in the models and for reducing uncertainties in future climate projections related to their feedbacks.

Using one year of SEVIRI/MSG data at 15-min temporal resolution, this study first explores the potential of deep machine learning (ML) to detect and classify mesoscale low-level cloud patterns. Using a supervised convolutional neural network, the shallow clouds are then classified into the dominant spatial patterns. The associated cloud properties and underlying meteorological conditions are further analysed using joint histograms based on the CM SAF CLAAS3 cloud climate data record and ERA5 reanalysis datasets to investigate if such information can be useful to evaluate and to better represent these clouds in global climate models.         

How to cite: Thomas, M. A., Khalaj, P., and Devasthale, A.: Meteorological conditions associated with the shallow mesoscale clouds in the southern Atlantic, EGU General Assembly 2026, Vienna, Austria, 3–8 May 2026, EGU26-9723, https://doi.org/10.5194/egusphere-egu26-9723, 2026.

EGU26-10993 | ECS | Posters on site | AS1.15

Online Cloud Tracking with ICON-TARGO 

Matthias Faust, Roxana Cremer, and Fabian Senf

Object-based studies provide valuable insights into cloud life cycles in atmospheric circulation models. Cloud tracking tools are therefore widely applied but are often limited by data availability and temporal resolution, ranging from minutes to several hours depending on the model application. To address these limitations, we developed TARGO (Targeted Output), an approach that enables cloud detection during the atmospheric model runtime.
TARGO is implemented as a plugin for the ICON model and coupled via the ComIn interface. It employs the TOBAC tracking algorithm for cloud detection and temporal linking at every model time step and allows the targeted output of arbitrary model variables at cloud positions. Alongside cloud number, lifetime, and location, the targeted output enables the analysis of cloud-centred variables such as vertical profiles of mixing ratios, temperature, and wind velocity.
The capabilities of TARGO are illustrated using s set of realistic limited-area simulations of deep convective development, highlighting the benefits of cloud and object tracking on the model time-step level for analysing cloud evolution and sensitivities in ICON.

How to cite: Faust, M., Cremer, R., and Senf, F.: Online Cloud Tracking with ICON-TARGO, EGU General Assembly 2026, Vienna, Austria, 3–8 May 2026, EGU26-10993, https://doi.org/10.5194/egusphere-egu26-10993, 2026.

EGU26-11331 | ECS | Orals | AS1.15

Impacts of mesoscale atmospheric subsidence on cloud glaciation and decoupling in Arctic marine cold air outbreaks 

Fiona Paulus, Joshua Müller, Benjamin Kirbus, Mario Mech, Harald Sodemann, Lars van Gelder, Andreas Walbröl, Manfred Wendisch, and Roel Neggers

When cold, dry air from the high Arctic is advected southward over the open ocean, strong sensible and latent heat fluxes can cause rapid boundary-layer growth and clouds that are predominantly mixed-phase. These clouds in marine cold air outbreaks (MCAOs) are strongly controlled by ice nucleation processes and interactions between cloud ice and supercooled liquid droplets. The role of large-scale vertical motion in shaping the thermodynamic, microphysical, and convective evolution of MCAOs remains poorly constrained. This uncertainty largely reflects the scarcity of high-resolution observations in Arctic source regions. To address this gap, we investigate how mesoscale subsidence influences atmospheric boundary-layer (ABL) development, cloud phase transitions, and mixed-phase precipitation characteristics during a shallow MCAO observed over the Fram Strait in March 2022 as part of the HALO–(AC)³ campaign. During the campaign, mesoscale flight circles with regularly spaced dropsonde releases were conducted, allowing the estimation of subsidence following a method previously applied in the sub-tropics during the NARVAL2 and EUREC⁴A campaigns. Our analysis is based on quasi-Lagrangian large-eddy simulations (LES) that are initialised and forced exclusively with airborne in-situ and remote-sensing observations. The control LES realistically reproduces both the thermodynamic structure of the ABL and the temporal evolution of the air mass as it is advected from Arctic sea ice toward the open ocean. In particular, the simulated ABL depth, integrated water vapour, and cloud liquid and ice water paths agree well with observations. A set of sensitivity simulations with prescribed subsidence rates demonstrates that reduced mesoscale subsidence substantially alters cloud-phase evolution, resulting in a deeper boundary layer and a more rapid transition toward fully glaciated clouds. This response is closely linked to earlier development of internal ABL decoupling under weaker subsidence conditions. The earlier onset of decoupling promotes convective graupel production, thereby accelerating the conversion of liquid cloud droplets. The strong link between boundary-layer decoupling and cloud glaciation provides a plausible explanation for the frequently observed evolution of cloud liquid water path in MCAOs, and establishes a mechanistic understanding of how mesoscale subsidence governs Arctic air-mass transformation.

How to cite: Paulus, F., Müller, J., Kirbus, B., Mech, M., Sodemann, H., van Gelder, L., Walbröl, A., Wendisch, M., and Neggers, R.: Impacts of mesoscale atmospheric subsidence on cloud glaciation and decoupling in Arctic marine cold air outbreaks, EGU General Assembly 2026, Vienna, Austria, 3–8 May 2026, EGU26-11331, https://doi.org/10.5194/egusphere-egu26-11331, 2026.

EGU26-11463 | Posters on site | AS1.15

Revisiting the definition of mixed-phase clouds in satellite remote sensing 

Matthias Tesche, Fani Alexandri, Felix Müller, and Torsten Seelig

Satellite observations with passive sensors generally classify cloud phase – liquid water, mixed-phase, or ice – based on snap-shots of polar-orbiting observations or individual time steps of geostationary observations. In that context, mixed-phase clouds are defined as cloud objects that contain both pixels that are classified as liquid water and as ice.

In contrast to polar-orbiting satellites, observations with geostationary satellites provide the data needed for tracking clouds over their lifetime. This Lagrangian perspective allows for quantifying the evolution of cloud physical properties, including cloud phase. The temporally-resolved view of a cloud as a sequence of subsequent observations provides a refined perspective of mixed-phase clouds as objects that evolve over time. There are three straightforward options. First, a cloud starts as all-liquid pixels, contains at least one time step that feature both liquid and ice pixels, and ends as ice-only pixels. Second, the cloud features only time steps that are all liquid or all ice pixels (the former option without the mixed-phase state as defined in snap-shots). Third, the cloud contains both liquid and ice pixels at any time step throughout its lifetime. This revised perspective of mixed-phase clouds challenges the static snap-shot view which would identify a cloud as mixed-phase only if it was at the mid-phase of option one or an option-three cloud.

The purpose of this poster is to stimulate a discussion on the need for a time-resolved definition of mixed-phase clouds, on how to reconcile such a definition with snap-shot-based observations, and on what can be learned from the time-resolved definition of mixed-phase clouds.

How to cite: Tesche, M., Alexandri, F., Müller, F., and Seelig, T.: Revisiting the definition of mixed-phase clouds in satellite remote sensing, EGU General Assembly 2026, Vienna, Austria, 3–8 May 2026, EGU26-11463, https://doi.org/10.5194/egusphere-egu26-11463, 2026.

EGU26-13559 | ECS | Posters on site | AS1.15

Lifecycle of anvil clouds in a warmer climate as seen by passive tracers in km-scale ICON simulations 

Shirin Hamzeh Marand, Blaž Gasparini, and Aiko Voigt

Tropical anvil clouds exert a twofold impact on Earth’s radiation budget. The thickness of anvil clouds, and with it their radiative effects, change significantly throughout the cloud’s lifetime. Fresh anvils are initially thick, as the cloud ages and spreads out, the cloud loses mass. This leads to a rapid decrease in its cooling effect due to reflection of shortwave radiation until eventually the longwave warming effect dominates, resulting in a near neutral net radiative effect over the whole anvil lifecycle. However, our knowledge of anvil cloud lifetime and evolution in a warmer climate remains insufficient. A recent hypothesis suggests a thinning of anvil clouds in a warmer climate. However, it is currently not known whether this applies to all stages of the anvil lifecycle or only parts of it.

In this study, we aim to quantify changes in the cloud radiative effect of anvil cirrus across their lifecycle in a warmer climate. To this end, we use passive tracers implemented in the ICON model coupled to the one-moment aerosol module HAM-lite at 5 km resolution. This allows us to track the origin and evolution of individual anvils and to determine a time after detrainment. We run global 40-day simulations, a control present climate, and a warming simulation in which we increase the sea surface temperature by +4 K. We aim to detect changes in anvil lifecycle and thickness that modulate radiative effects. We hypothesize a disproportionate reduction in the thick, cooling phase of anvils relative to their thin warming phase, ultimately resulting in a net positive anvil radiative effect.

How to cite: Hamzeh Marand, S., Gasparini, B., and Voigt, A.: Lifecycle of anvil clouds in a warmer climate as seen by passive tracers in km-scale ICON simulations, EGU General Assembly 2026, Vienna, Austria, 3–8 May 2026, EGU26-13559, https://doi.org/10.5194/egusphere-egu26-13559, 2026.

EGU26-15356 | ECS | Orals | AS1.15

When do the mesoscales matter for trade cumulus clouds? A EUREC4A Perspective 

Chitvan Singh, Theresa Mieslinger, Geet George, and Bjorn Stevens

Shallow cumulus clouds in trades present a unique challenge because they are both difficult to observe and describe. Recent studies have shown that mesoscale dynamics and synoptic scale cloud-controlling factors are important to describe them, but the interplay between these two scales is not well understood. Therefore, we attempt to disentangle their interplay to determine when mesoscale dynamics become important for the clouds. We have utilized data from the EUREC4A campaign aided with satellite and reanalysis data to extensively describe the cloudiness observed during the same period. 

We find a bimodal distribution of cloud top height from WALES LIDAR, with peaks at 1 km and 2 km for low and high clouds, respectively. A multiple linear regression analysis of six cloud-controlling factors (CCF) explains 80% of the variance in projected cloud cover. Further analysis reveals that the wind shear in the cloud layer is the leading CCF for low cloud fraction and mesoscale vertical motion is not a strong control for such low clouds not under high clouds. For higher clouds, mesoscale vertical motion at 1900m is the leading factor with a 0.68 correlation to high cloud cover. Furthermore, rain co-varies with high cloud cover substantially, on many days, thus we conclude that mesoscale dynamics are more important for high clouds. 

Alongside, ERA5 shows that variability in vertical motion is associated with high cloud variability only during the periods around rain. Thus, it becomes important to study high clouds in a cloud-circulation-rain framework. We propose a life cycle hypothesis to study various aspects of the coupling between mesoscale dynamics and trade wind clouds. We hypothesize that different stages of the life cycle of mesoscale cloud fraction of high clouds are related to growth by cloud-circulation coupling and decay by rain/cold pools driven circulations. 

How to cite: Singh, C., Mieslinger, T., George, G., and Stevens, B.: When do the mesoscales matter for trade cumulus clouds? A EUREC4A Perspective, EGU General Assembly 2026, Vienna, Austria, 3–8 May 2026, EGU26-15356, https://doi.org/10.5194/egusphere-egu26-15356, 2026.

EGU26-16131 | ECS | Posters on site | AS1.15

The characteristics of cloud fractal dimension in shallow cumulus clouds and their implications to cloud processes 

Qiqi Song, Jingyi Chen, Martin Janssens, and Chunsong Lu

Shallow cumulus clouds critically influence Earth's climate and hydrological cycles. Yet, their simulation remains uncertain in climate models, partly due to idealized geometric assumptions that neglect turbulent boundary irregularities.

To overcome this limitation, this study explores irregularity of cloud lateral ‑boundary using fractal dimension. The fractal dimensions were calculated using the Area‑Perimeter method (characterizing statistical self‑similarity of the cloud field) and the Box‑Counting method (capturing the irregularity of individual clouds). The results show that the fractal dimension derived from the Box‑Counting method is consistently higher than that from the Area‑Perimeter method, indicating that most clouds are not strictly self‑similar structures. A significant positive correlation is found between fractal dimension and precipitation intensity suggesting relationships between cloud morphology and cloud processes. Furthermore, the adiabaticity of cloud was quantified by computing the distribution differences of conserved quantities between the cloud interior and its surroundings. 

These findings highlight that incorporating realistic cloud‑boundary geometry into parameterizations can better represent turbulent mixing and cloud‑environment interactions, ultimately contributing to more accurate simulations of shallow cumulus evolution.

How to cite: Song, Q., Chen, J., Janssens, M., and Lu, C.: The characteristics of cloud fractal dimension in shallow cumulus clouds and their implications to cloud processes, EGU General Assembly 2026, Vienna, Austria, 3–8 May 2026, EGU26-16131, https://doi.org/10.5194/egusphere-egu26-16131, 2026.

EGU26-17004 | ECS | Posters on site | AS1.15

Temporal evolution of the vertical structure of tropical deep convective systems in IceCloudNet 

Johannes Hobiger, Wouter Mol, Blaž Gasparini, and Aiko Voigt

Understanding the vertical structure of deep convective systems is essential for assessing their
impacts on the atmospheric energy budget and hydrological cycle and for evaluating their repre-
sentation in models. However, because of limitations of current satellite observations, the vertical
structure of these systems remains poorly constrained. We use a novel ice cloud dataset called
IceCloudNet to study the temporal evolution of the vertical structure of tropical deep convective
systems on the basis of ice water content as a marker for convective intensity and anvil devel-
opment. IceCloudNet is the first 4D-consistent semi-observational ice cloud dataset covering the
tropical belt between 30°S–30°N and 30°W–30°E, developed by Jeggle et al. (2025). The spatial
resolution is 3 km in the horizontal and 240 m in the vertical. The temporal resolution is 15 min.
The dataset is constructed by filling observational gaps using machine learning. By applying the
Tobac cloud tracking algorithm to the vertically integrated ice water content over the course of the
year 2010, we identify and track deep convective systems to diagnose systematic changes in the
vertical distribution of ice water content during their lifecycle. We also assess the suitability of
IceCloudNet for a robust and physically coherent tracking and analysis of vertically resolved cloud
properties. This allows us to highlight both its limitations and its potential to enable, for the first
time, a comprehensive four-dimensional analysis of the evolution of tropical ice clouds.

How to cite: Hobiger, J., Mol, W., Gasparini, B., and Voigt, A.: Temporal evolution of the vertical structure of tropical deep convective systems in IceCloudNet, EGU General Assembly 2026, Vienna, Austria, 3–8 May 2026, EGU26-17004, https://doi.org/10.5194/egusphere-egu26-17004, 2026.

EGU26-19016 | ECS | Orals | AS1.15

The path to simplification of cloud microphysics. 

Pierre-Olivier Downey, Hauke Schmidt, and Bjorn Stevens

    One of the main sources of uncertainty in climate modeling is microphysics. While Lagrangian approaches are promising, their computational cost is not yet suited to global climate simulations, leaving global simulations to bulk schemes. Starting from simple one-moment microphysics formulations that prognose only the specific mass of each hydrometeor 𝑞x, physically richer approaches like double- and higher-moment bulk schemes were introduced to narrow model–observation gaps, but they deliver mixed, metric-dependent gains over simpler one-moment schemes [1,2]. This mixed record suggests that the link between microphysical processes and other atmospheric processes remains poorly understood.

    Few studies have probed this link directly [3], and the intricacy of bulk schemes has hindered clear attribution of changes in climate statistics to specific microphysical processes. Here we aim to make microphysics more transparent by simplifying it to a Kessler-like three-category scheme. We thus collapse Lin’s six-category scheme [4] to three prognosed variables: vapor 𝑞v, condensates 𝑞ci (cloud water 𝑞c  + ice 𝑞i ), and precipitates 𝑞rgs  (rain 𝑞r + graupel 𝑞g + snow 𝑞s), where their precise category is defined by local thermodynamics (temperature 𝑇 and relative humidity RH) and updraft velocity 𝑤 (Fig. 1). Using a global 5-km atmosphere-only ICON simulation with a Lin-like microphysics scheme, we ask whether accurate mappings 𝑓x , 𝑓y exist such that

    Condensates: 𝑞x ≈ 𝑞x* = 𝑓x (𝑞ci , 𝑇, RH, 𝑤),  for x ∈ {c, i} ,

    Precipitates:   𝑞y ≈ 𝑞y* = 𝑓y (𝑞rgs , 𝑇, RH, 𝑤), for y ∈ {r, g, s} ,

where 𝑞x,y are the specific masses from our ICON simulation, and 𝑞*x,y  are the predicted specific masses from the partitioning functions 𝑓x,y , given 𝑞ci and 𝑞rgs (see Fig. 1). We construct histograms in the (𝑇, 𝑤, RH)-space and fit simple partition functions, like sigmoids, to build our partitioning functions.

    We present here results from this mapping, as well as an evaluation of its performance. We measure the R², and we compare global instantaneous outputs from our ICON simulation to the predictions provided by our partitioning functions, such as LWP and IWP comparisons.


Fig.1: Collapse state of microphysics and its link to the predicted partitioning.


[1] Seiki, Kodama, Noda, Satoh, J. Climate, 28, 2405–2419 (2015).

[2] Song, Sunny Lim, Weather and Climate Extremes, 37, 2212-0947 (2022).

[3] Proske, Ferrachat, Neubauer, Staab, Lohmann, Atmos. Chem. Phys., 22, 4737–4762 (2022).

[4] Lin, Farley, Orville, J. Appl. Meteorol. Climatol., 22, 1065–1092 (1983).

How to cite: Downey, P.-O., Schmidt, H., and Stevens, B.: The path to simplification of cloud microphysics., EGU General Assembly 2026, Vienna, Austria, 3–8 May 2026, EGU26-19016, https://doi.org/10.5194/egusphere-egu26-19016, 2026.

EGU26-19193 | ECS | Orals | AS1.15

Identifying large-scale drivers of the daily cycle of trade-wind cloudiness from geostationary satellite 

Robert Meier, Pouriya Alinaghi, Ryan Eastman, Geet George, and Franziska Glassmeier

Shallow cumulus clouds in the trade-wind region are a major source of uncertainty in the global cloud feedback on climate. Although previous studies have investigated cloud feedback based on daily mean or even monthly data, the time of the day when clouds occur currently and in the future matters for their radiative effect. On top of that, with the availability of high-frequency data comes the opportunity to study time series data of cloud fields rather than relying on snapshots. To quantify the role of the diurnal cycle for the cloud feedback, we study the relationship between the daily cycle in cloudiness and in the large-scale environment. We compile a dataset of Lagrangian satellite observations together with cloud controlling factors (CCFs) along ~30000 ERA5 trajectories, obtained from 925hPa wind fields. The 6-day-long trajectories are centered at the tropical North Atlantic in the winter months (DJF), which is representative of the trade-cumulus regime. We utilize the high temporal resolution of GOES-16 (10-15 min), ERA5, and CERES (both hourly) to fully resolve sub-daily timescales. With this dataset, we explore correlations between the amplitudes and phases of cloudiness and CCFs. We examine which CCFs control the daily cycle of clouds and quantify response times between the drivers and their effects. Our goal is to develop a model that describes the daily cycle in cloudiness based on the most important CCFs and use time series data to constrain the trade cumulus cloud feedback. 

How to cite: Meier, R., Alinaghi, P., Eastman, R., George, G., and Glassmeier, F.: Identifying large-scale drivers of the daily cycle of trade-wind cloudiness from geostationary satellite, EGU General Assembly 2026, Vienna, Austria, 3–8 May 2026, EGU26-19193, https://doi.org/10.5194/egusphere-egu26-19193, 2026.

EGU26-19268 | ECS | Orals | AS1.15

CRAAS-3: A 20-year cloud regime dataset over Europe linking cloud structure and circulation 

Johannes Happich and Hartwig Deneke

Cloud regimes provide a useful observational framework to link cloud properties, organisation, and variability to large-scale circulation across spatial and temporal scales. We present CRAAS-3, a cloud regime dataset over Europe derived from 20 years of daytime MSG-SEVIRI observations from the CLAAS-3 cloud property dataset. Cloud regimes are defined from joint histograms of cloud optical thickness, cloud top pressure, and thermodynamic phase, clustered with a refined k-means method into eight prototypical regimes. The high temporal resolution of SEVIRI enables analyses of regime persistence, transitions, and regional variability, which can be related to large-scale circulation and synoptic conditions. We further combine CRAAS-3 with high-resolution cloud properties from polar-orbiting satellites to investigate how cloud structural characteristics vary across regimes, and with vertical profiles from ACTRIS stations to characterise typical regime-specific cloud profiles. This integrated approach exploits the high temporal resolution of geostationary observations together with detailed cloud structural information to enable process-oriented analyses of cloud evolution across regimes and circulation contexts.

How to cite: Happich, J. and Deneke, H.: CRAAS-3: A 20-year cloud regime dataset over Europe linking cloud structure and circulation, EGU General Assembly 2026, Vienna, Austria, 3–8 May 2026, EGU26-19268, https://doi.org/10.5194/egusphere-egu26-19268, 2026.

Known mechanisms causing Arctic amplification of global warming are lapse-rate and albedo feedbacks, as well as increased latent heat release due to enhanced moisture transport into the Arctic [1]. This classical understanding is based on the assumption of quasi-steady mean temperature and humidity states, described as a balance between advective transport from lower latitudes, surface fluxes, radiative exchange at the upper atmosphere, and related feedbacks [2]. While this integral, steady-state box-model framework has been instrumental in developing our current understanding, its inherent limitations hinder further progress in explaining Arctic amplification. For example, the box model cannot distinguish whether changes in heat or moisture transport are of fluid-dynamical or thermodynamical origin, nor can it describe how air masses entering the Arctic are transformed as they cool, mix, and exchange energy and moisture with surfaces and clouds. Yet Arctic air-mass transformations must be understood at the fundamental process level, as they are key to explaining, for instance, the necessary thermal conditions underlying the lapse-rate feedback.

Here we adopt an air-mass-centred framework that enables a physically consistent link between large-scale Arctic amplification of temperature and precipitation changes and the small-scale turbulent and microphysical processes governing the Arctic atmospheric boundary layer and its clouds. We combine air-mass-following balloon observations with large-eddy simulations (LES) to investigate the Lagrangian evolution of boundary-layer clouds during Arctic air-mass transformation events. Four such events have been tracked using CMET balloons [3] launched from Ny-Ålesund, Svalbard, providing unprecedented in situ measurements of thermodynamic quantities at controlled heights along air-mass trajectories. An additional campaign is planned for March 2026, during which up to twelve balloons will be launched from Station Nord, Greenland. The observational data are integrated into the LES code DALES [4] via time-dependent forcings and boundary conditions, yielding spatio-temporally resolved information on local thermo-fluid-dynamical processes and mixed-phase cloud microphysics along the air-mass pathways.

At the conference, we will present our collected field data and first LES results for one representative case. The focus of the current contribution is on establishing a robust Lagrangian LES framework, including domain-size sensitivity, grid-convergence behaviour, and basic physical plausibility checks against observations.

In perspective, this approach will allow us to compute vertical fluxes of energy and moisture during different transformation events and to analyse how the mean and final states of air masses, as well as their energy and moisture budgets, respond to varying climate conditions. Ultimately, we expect that this hybrid field–model study will enable us to test the following hypotheses: (i) liquid water path controls cloud persistence through cloud-top radiative cooling; and (ii) radiative cooling at cloud top (or in clear sky) drives air-mass transformation during both cloudy and clear states.

[1] M. Previdi, K.L. Smith, L.M. Polvani. Environ. Res. Lett., 2021, doi:10.1088/1748-9326/ac1c29.
[2] M. Cai. Geo. Res. Lett., 2005, doi:10.1029/2005gl024481.
[3] P. B. Voss. AIAA Balloon Systems Conference, 2009, doi:10.2514/6.2009-2810.
[4] T. Heus et al. Geosci. Model Dev., 2010, doi:10.5194/gmd-3-415-2010.

How to cite: Feldmann, D., Graßmel, L., and Pithan, F.: Combining air-mass-following balloon observations and large-eddy simulations to build process-level understanding of arctic amplification, EGU General Assembly 2026, Vienna, Austria, 3–8 May 2026, EGU26-20220, https://doi.org/10.5194/egusphere-egu26-20220, 2026.

EGU26-20617 | ECS | Posters on site | AS1.15

Development of a Cloud Mask from High-Resolution Polarized Aircraft Observations 

Zekican Demiralay, Lea Volkmer, Tobias Zinner, and Bernhard Mayer

Accurate cloud detection is fundamental for atmospheric remote sensing, particularly for airborne observations where high spatial resolution enables detailed characterization of cloud fields. We present a cloud mask algorithm for the spectrometer of the Munich Aerosol Cloud Scanner (specMACS), a hyperspectral polarimetric imaging system operated aboard the German research aircraft HALO.


specMACS features four special RGB cameras that simultaneously provide polarization measurements at high spatial resolution. This enables novel cloud detection approaches by exploiting the difference in polarization signatures between clouds and cloudless-sky ocean surfaces. Specular reflection from the ocean surface produces polarized signals, while cloud droplets depolarize incoming radiation through multiple scattering, creating a clear physical contrast for cloud identification.


Our algorithm uses radiative transfer simulations with the libRadtran package to generate reference radiances for cloudless sky atmospheric conditions. We systematically vary solar geometry, aerosol properties, and surface conditions in the simulations to establish classification criteria for cloud detection. Expected surface values from radiative transfer simulations are interpolated across the full high-resolution field-of-view and compared against specMACS observations to identify cloud presence.


The algorithm was developed and tested using data from the Persistent EarthCARE Underflight Studies of the ITCZ and Organized Convection (PERCUSION) campaign over the tropical Atlantic in 2024. Initial results demonstrate reliable cloud detection across a range of optical thicknesses, providing robust cloud masks for subsequent retrieval applications. This work establishes a foundation for improved quality in ocean and atmospheric retrievals from high-resolution polarimetric aircraft observations.

How to cite: Demiralay, Z., Volkmer, L., Zinner, T., and Mayer, B.: Development of a Cloud Mask from High-Resolution Polarized Aircraft Observations, EGU General Assembly 2026, Vienna, Austria, 3–8 May 2026, EGU26-20617, https://doi.org/10.5194/egusphere-egu26-20617, 2026.

EGU26-22680 | Posters on site | AS1.15

ORCESTRAting IPFS STAC and FDO: An approach to enhance the FAIRness and global availability of campaign data 

Carsten Ehbrecht, Kameswar Rao Modali, Marco Kulüke, Tobias Kölling, Lukas Kluft, and Karsten Peters-von Gehlen

During field campaigns, unique and often irreplaceable datasets essential for advancing Earth system science are collected. Experience from previous campaigns has shown that the long-term scientific value of such data critically depends on proper data management, because data that are difficult to find or access are often underused, despite their high scientific value.


For the ORCESTRA campaign, these experiences informed the design of a data infrastructure that prioritizes global visibility, standardized metadata, and resilient access from the beginning. ORCESTRA datasets are stored and made available using the InterPlanetary File System (IPFS), with the central data node hosted at the Deutsches Klimarechenzentrum (DKRZ), which ensures 24/7 operational stability. The approach using IPFS improves data redundancy and resilience, addressing common risks identified in earlier campaigns where data availability depended on single hosting locations.

To increase and ensure findability and reuse of ORCESTRA campaign data, we implemented a dynamic catalog following the SpatioTemporal Asset Catalog (STAC) specification. The catalog feeds a public browser (https://orcestra.cloud.dkrz.de/), enabling intuitive exploration and direct access to datasets. Currently, data from the PERCUSION, MAESTRO, BOW-TIE sub-campaigns and the Barbados Cloud Observatory (BCO) are available. Further datasets are planned to complement this collection in the near future. Further, we configure the ORCESTRA STAC catalog according to the FAIR Digital Object
(FDO) specifications to enable real interdisciplinary findabiliy and reusability.

In our contribution, we will dive into the technical details of our implementation as well as emphasise that providing heterogenous field campaign data via dynamic STAC catalogs configure as FDOs enables interoperability with existing and emerging data spaces, e.g. the Destination Earth Data Lake or upcoming federated data infrastructure focused on climate science, e.g. FUTURA. In summary this approach reflects lessons learned from earlier campaigns and supports sustainable, federated data sharing to maximize scientific reuse.

How to cite: Ehbrecht, C., Modali, K. R., Kulüke, M., Kölling, T., Kluft, L., and Peters-von Gehlen, K.: ORCESTRAting IPFS STAC and FDO: An approach to enhance the FAIRness and global availability of campaign data, EGU General Assembly 2026, Vienna, Austria, 3–8 May 2026, EGU26-22680, https://doi.org/10.5194/egusphere-egu26-22680, 2026.

EGU26-1468 | ECS | Orals | CL4.11

Universality in Cloud Condensate Vertical Profiles and Implications for Cloud Feedbacks 

Brett McKim, Sandrine Bony, Andrew Williams, Adam Sokol, Martin Janssens, and Clara Baley

The vertical distribution of cloud condensates helps set precipitation efficiency, cloud fraction and cloud optical depth. Here, we examine profiles of liquid condensate in shallow convection and ice condensate in deep convection collected from in-situ and satellite observations. These observed profiles exhibit a striking similarity, which suggests they might be controlled by the same basic physical processes. We develop a simple analytical theory for these profiles based on condensation, entrainment, and conversion to precipitation. When given a few input parameters, the theory is able to quantitatively reproduce observed and simulated profiles of liquid and ice condensate. We outline how the theory could be used to interpret the anvil cloud optical depth feedback, as well as the intermodel spread in condensate seen in cloud-resolving simulations.

How to cite: McKim, B., Bony, S., Williams, A., Sokol, A., Janssens, M., and Baley, C.: Universality in Cloud Condensate Vertical Profiles and Implications for Cloud Feedbacks, EGU General Assembly 2026, Vienna, Austria, 3–8 May 2026, EGU26-1468, https://doi.org/10.5194/egusphere-egu26-1468, 2026.

EGU26-1534 | ECS | Posters on site | CL4.11

A surface energy balance perspective on the pattern effect 

Koh Kawaguchi and Paulo Ceppi

Over the past decade, it has become well-established that the spatial pattern of sea surface temperature (SST) warming exerts a strong control on Earth’s radiative feedbacks at the top of atmosphere (TOA). However, the role of the spatial pattern on other parts of the climate system are less well studied. We aim to understand the role that the SST pattern, and in particular preferential warming of deep convective regions, has on the surface energy budget, noting that the surface energy budget affects the future evolution of the warming pattern.

Our primary method of investigation is through a CMIP6 multi-model analysis of the amip-piForcing experiment. Preliminary analysis with a subset of models shows large differences between the TOA and surface perspectives. e.g., in the TOA, warm pool warming drives negative TOA anomalies due to increased low cloud cover, but has positive surface anomalies from the latent heat flux.  

How to cite: Kawaguchi, K. and Ceppi, P.: A surface energy balance perspective on the pattern effect, EGU General Assembly 2026, Vienna, Austria, 3–8 May 2026, EGU26-1534, https://doi.org/10.5194/egusphere-egu26-1534, 2026.

EGU26-4063 | ECS | Posters on site | CL4.11

Mechanisms for high cloud reductions with climate warming in HadGEM3-GC3.1-LL 

Harry Mutton, Mark Webb, Timothy Andrews, and Mark Ringer

High cloud feedbacks are a large contributor to uncertainty in estimates of equilibrium climate sensitivity.  Across the CMIP6 ensemble, estimates in global longwave cloud radiative effect (LWcre) feedback (a feedback strongly tied to changes in high cloud) range from approximately -0.45 to +0.5 W m-2 K-1. HadGEM3-GC31-LL sits close to the bottom of this range and therefore we explore mechanisms for high cloud reduction with warming in HadGEM3-GC31-LL. We find that high cloud reduction in HadGEM3-GC31-LL is closely tied to the parameterized convection scheme as well as a contribution linked to a response consistent with the stability iris mechanism. To estimate the relative importance of the parameterized convection and other processes, conv-off experiments are used to capture the high cloud response in the absence of convection parameterization. In these conv-off experiments a much reduced cloud reduction is seen.

How to cite: Mutton, H., Webb, M., Andrews, T., and Ringer, M.: Mechanisms for high cloud reductions with climate warming in HadGEM3-GC3.1-LL, EGU General Assembly 2026, Vienna, Austria, 3–8 May 2026, EGU26-4063, https://doi.org/10.5194/egusphere-egu26-4063, 2026.

EGU26-4585 | ECS | Orals | CL4.11

Linear and non-linear energy balance model calibration across consecutive abrupt CO2 doubling experiments 

Anna Zehrung, Malte Meinshausen, Andrew King, and Zebedee Nicholls

In climate sensitivity literature, simple energy balance models provide insight into how energy moves throughout the climate system. The first-order approximation of these models assumes a linear relationship between the forcing, ocean heat uptake, and radiative response, including a constant feedback parameter. However, these linear assumptions have been shown to inaccurately estimate the effective (or equilibrium) global mean temperature response across consecutive CO2 doubling experiments, with second-order approximations required to capture climate system non-linearities such as CO2-temperature (state) dependence or the pattern effect. It is common to express these non-linearities in an energy balance model using an inconstant feedback, ocean heat uptake efficacy, or forcing efficacy factor. While these climate system non-linearities are well studied, no research has systematically assessed whether individual parameterisations differ in their ability to capture the temperature response across multiple CO2-doubling experiments – that is, whether non-linearities acting on specific components of the climate system are more effective at reproducing responses across successive forcing scenarios. Using 12 CMIP6 models for which abrupt CO2 doubling and quadrupling experiments are available (nine of which also include abrupt halving), we calibrate a two-layer energy balance model simultaneously to the surface air temperature time series from each experiment for each model. We perform multiple calibrations under both linear and non-linear assumptions. Preliminary results indicate that, for most models, a first-order approximation with a constant feedback parameter is sufficient to capture the surface air temperature response across multiple CO2 doublings. Where a constant feedback parameter is not sufficient, initial findings suggest that a state-dependent forcing is the most effective correction. Future work will consider how this work can be reconciled with the temporal evolution of the feedback parameter seen in many observation-based historical CMIP6 simulations and the implications of our findings for projections of future climate.

How to cite: Zehrung, A., Meinshausen, M., King, A., and Nicholls, Z.: Linear and non-linear energy balance model calibration across consecutive abrupt CO2 doubling experiments, EGU General Assembly 2026, Vienna, Austria, 3–8 May 2026, EGU26-4585, https://doi.org/10.5194/egusphere-egu26-4585, 2026.

EGU26-5029 | ECS | Posters on site | CL4.11

Energy balance climate models as a tool for investigating the linkage between the energy imbalance and the hydrological cycle  

Nedim Sladić, Tim Trent, Adam Povey, Richard P. Allan, and Kate Willett

The planetary energy imbalance depends on the amount of solar energy entering and leaving the system, as well as changes in greenhouse gas concentrations. Since the start of the 21st century, the Earth’s energy imbalance (EEI) is assumed to have doubled, linked to the reduction of solar radiation reflected back to space, due to atmospheric dimming. Rapid and responsive feedback mechanisms have contributed to the accumulation of excess heat within the global oceans. The ocean warming drives the positive change in EEI and impacts the hydrological cycle, becoming more intense. Such linkage disturbs well-established weather patterns and cause their alternation. To understand these phenomena, traditionally complex state-of-the-art coupled climate models would be used. However, the strength of simpler, energy balance climate models capturing large-scale features has shown to be an alternative approach in understanding the general state of climate.

In this study, we utilise the ocean component of the newly developed novel energy balance climate model (nEBM) to examine the relationship between EEI and ocean warming. Our approach perturbs key hydrological cycle elements (e.g., precipitation, runoff, evaporation, etc) in addition to other forcing components (e.g., CO2) to show the resulting ocean response and the subsequent impacts on EEI. These results are compared to observational datasets to demonstrate the performance of the nEBM ocean model. The obtained results are compared to CMIP6, observations, and relevant literature. Finally, we discuss the ability of simpler climate models (e.g., nEBM) to quantify sensitivity in climate studies.

How to cite: Sladić, N., Trent, T., Povey, A., P. Allan, R., and Willett, K.: Energy balance climate models as a tool for investigating the linkage between the energy imbalance and the hydrological cycle , EGU General Assembly 2026, Vienna, Austria, 3–8 May 2026, EGU26-5029, https://doi.org/10.5194/egusphere-egu26-5029, 2026.

EGU26-6680 | ECS | Posters on site | CL4.11

How the hydrological cycle affects the global cloud feedback 

Geethma Werapitiya, Travis Aerenson, Daniel McCoy, Florent Brient, Gregory Elsaesser, Ci Song, and Mark Zelinka

Cloud feedback remains the largest source of uncertainty in projections of Earth’s climate sensitivity and future warming. Recent generations of Earth System Models (ESMs) show a trend toward more positive cloud feedback, contributing to higher estimates of effective climate sensitivity (ECS). This raises an important question: can observational constraints help rule out or support these higher values? Our work focuses on the hydrological processes that drive cloud feedback, particularly the role of large-scale moisture transport and precipitation efficiency. Both observations and models show a consistent global moisture flux pattern: moisture convergence in the tropics and extratropics, and divergence in the subtropics, maintaining a near-zero global moisture balance. As the climate warms, this pattern strengthens due to the Clausius-Clapeyron relationship, enhancing the moisture flux and driving cloud responses. These cloud responses are further shaped by how efficiently atmospheric moisture is converted into precipitation, linking hydrological and radiative processes in a warming world. Using a framework that relates cloud feedback to features of the hydrological cycle, precipitation efficiency and radiative efficiency, we constrain cloud feedback globally using satellite observations. Observations of precipitation efficiency and radiative efficiency narrow the spread of cloud feedback across the Community Atmosphere Model version 6 (CAM6) perturbed parameter.

How to cite: Werapitiya, G., Aerenson, T., McCoy, D., Brient, F., Elsaesser, G., Song, C., and Zelinka, M.: How the hydrological cycle affects the global cloud feedback, EGU General Assembly 2026, Vienna, Austria, 3–8 May 2026, EGU26-6680, https://doi.org/10.5194/egusphere-egu26-6680, 2026.

EGU26-8388 | ECS | Posters on site | CL4.11

Surface Warming Patterns, Cloud Feedbacks, and Inter-basin Energy Redistribution During ENSO 

Qinlan Yang and Stephan Fueglistaler

Internal variability, particularly ENSO, plays a critical role in modulating global warming on interannual to decadal timescales. Its canonical surface temperature signature is well characterized, but the complex and non-linear relation between surface temperature and top-of-atmosphere (TOA) radiative response requires attention. Here, we use coupled atmosphere-ocean simulations to diagnose the energy redistribution and radiative feedbacks across ENSO phases. During the growth phase of El Niño, boundary-layer destabilization enhances ocean-atmosphere heat exchange in the tropical Pacific, while a positive net TOA flux anomaly amplifies surface warming, contrary to the canonical feedback perspective. This excess energy is transported poleward and zonally, with remote ocean basins exhibiting shallow heat uptake. At the El Niño peak, rapid atmospheric stabilization increases low-level cloudiness and shortwave reflection, while the subsequent decay phase is marked by net radiative cooling to space. In parallel, we find that high cloud fraction and upper-tropospheric humidity evolve in an anticorrelated manner across the tropics and extratropics. These changes are not directly tied to boundary-layer stability, and their opposing regional signatures largely cancel in the global mean. Notably, tropical drying and cloud loss co-occur with increased precipitation. Our findings clarify the role of ENSO in Earth's radiative variability and highlight key differences from CO2-forced warming.

How to cite: Yang, Q. and Fueglistaler, S.: Surface Warming Patterns, Cloud Feedbacks, and Inter-basin Energy Redistribution During ENSO, EGU General Assembly 2026, Vienna, Austria, 3–8 May 2026, EGU26-8388, https://doi.org/10.5194/egusphere-egu26-8388, 2026.

Hydrological sensitivity, defined as the change in latent heat release per degree of global mean surface temperature increase, is a key metric for understanding future precipitation changes and the global hydrological cycle. Based on the global energy budget, hydrological sensitivity can be decomposed into three components: longwave cooling, shortwave absorption, and sensible heat flux. In this study, we analyzed hydrological sensitivity from 1980 to 2025 using ERA5 reanalysis data. A decomposition of hydrological sensitivity into three energy budget terms reveals a non-negligible residual that cannot be explained by these conventional components alone. Diagnostics of the spatiotemporal characteristics of this residual and its relationship with internal variability show a significant correlation with the Pacific Decadal Oscillation(PDO)/Interdecadal Pacific Oscillation(IPO). At the global scale, variations in precipitation dominate the hydrological sensitivity residual. These findings suggest that hydrological sensitivity is modulated by atmosphere–ocean interactions in the Pacific represented by PDO/IPO. We further examine the physical mechanisms linking internal variability to these residuals.

How to cite: Han, Y.-R. and Yeh, S.-W.: Interdecadal Pacific Oscillation Modulates Hydrological Sensitivity Residuals Derived from Energy Budget Decomposition, EGU General Assembly 2026, Vienna, Austria, 3–8 May 2026, EGU26-9233, https://doi.org/10.5194/egusphere-egu26-9233, 2026.

EGU26-9983 | ECS | Orals | CL4.11

Unravelling the mechanism of the Pattern Effect with a Two-box Model of the Tropical Atmospheric Circulation 

Jo Lecuyer, Benoit Meyssignac, and Gilles Bellon

The pattern effect describes how the spatial structure of surface warming modulates Earth’s top-of-atmosphere (TOA) radiative imbalance, such that identical increases in global-mean surface temperature can produce distinct global radiative responses and distinct effective climate sensitivities. GCM studies consistently point to the tropical Pacific through changes in deep convection and low-cloud feedbacks as a dominant contributor to this sensitivity. Yet isolating the causal chain from regional SST perturbations to the global radiative response remains challenging in comprehensive GCMs.

To address this, we develop a minimal two-box model of the tropical Pacific atmosphere, partitioning it into a warm, convective box and a cooler, inversion-capped subsident box, representative of an idealized Hadley–Walker circulation. The framework retains a strict Weak Temperature Gradient (WTG) constraint in the free troposphere, quasi-equilibrium structure functions for temperature and humidity, and low-cloud radiative effects in the subsident region scale with lower-tropospheric stability (EIS), on top of a clear-sky radiative code. For a given SST and greenhouse-gas forcing, the model state is described by only six scalar variables and closed by six coupled sensible-heat and moisture conservation equations, with fixed convective/subsident fractional areas and no explicit dynamical closure.

This formulation which is purely thermodynamic (no representation of the dynamics beyond the WTG) aims to include only the processes thought to be essential for the tropical pattern effect.

This minimal set of processes is sufficient to reproduce the sign asymmetry of the pattern effect, via WTG-mediated tropospheric temperature adjustment and low-cloud sensitivity to EIS in subsident regions, but it underestimates the amplitude of local radiative sensitivities, suggesting a missing mechanism linked to the fixed-area, no-dynamics assumption.

We therefore introduce a dynamical formulation based on a linear, stationary 2D momentum balance without Coriolis and with Rayleigh damping, yielding a momentum-budget closure that links the overturning circulation strength to the boundary-layer temperature contrast. This additional constraint allows us to relax the fixed fractional-area assumption and introduces a fractional area feedback: surface warming in convective regions tends to expand the subsident fraction, whereas subsident warming contracts it weaklier. Because subsident regions radiate more effectively to space due to their dryness and high low-cloud cover, these area shifts amplify radiative sensitivities and move the model closer to GCM-inferred sensitivities.

We confirm the relevance of this mechanism in idealized atmospheric GCM experiments forced by SST fields with identical tropical-mean SST but different spatial patterns. We show that changes in convective/subsident fractional areas, account for a surprising substantial share (order 20–40%) of the resulting TOA radiative imbalance in these configurations and this contribution is asymmetric with the SST pattern.  These results show that changes in the dynamics should be accounted for to explain the pattern effect.

How to cite: Lecuyer, J., Meyssignac, B., and Bellon, G.: Unravelling the mechanism of the Pattern Effect with a Two-box Model of the Tropical Atmospheric Circulation, EGU General Assembly 2026, Vienna, Austria, 3–8 May 2026, EGU26-9983, https://doi.org/10.5194/egusphere-egu26-9983, 2026.

Climate sensitivity and aerosol forcing are two of the most central, but uncertain, quantities in climate science - crucial for understanding past climate changes and future projections. In addition, both historical and future climate evolution has been and will be influenced by natural variability. In this study, we estimate inferred climate sensitivity (ECSinf) and aerosol forcing using observations of surface temperature and ocean heat content (OHC) combined with prior knowledge of effective radiative forcing over the industrial period, within a Bayesian framework. The global mean surface temperature set new records in 2023 and 2024. Including these years had little influence on the estimated ECSinf - due to the steadily increasing OHC - compared to previous estimates using shorter observational records. In earlier studies, where observations up to the year 2010, 2014, 2019 and 2022 were included, the ECSinf remained stable with best estimates from 1.9 to 2.2 K and the transient climate response best estimates from 1.4 to 1.6 K. A limitation in observational based estimates of climate sensitivity is the large uncertainty in the forcing of the Earth system, primarily due to the uncertain cooling effect from aerosols. The aerosol precursor emissions have declined over the past decade, but the evolution of aerosol forcing throughout the industrial period remains poorly constrained. Allowing aerosol forcing to vary more freely tends to stretch the upper tail of the ECSinf distribution toward larger values. Another limitation of observational-based estimates of climate sensitivity is that it only captures the feedbacks that have occurred over the historical period - and the historical climate is only a single realization of the Earth’s climate. To assess this limitation, the method is tested using climate model results. We use the transient ocean heat content and temperature response from fully coupled historical simulations of four CMIP6 models – with substantial differences among ensemble members – and ERF time series calculated from the individual models to estimate ECSinf. As expected, most ensemble members give posterior mean ECSinf lower than the models ECS as only feedbacks over the historical period are captured. For the individual climate models, the posterior mean ECSinf varies by 0.6 K, 1.2 K, 2.1 K and as much as 4.1 K across ensemble members. Although there are limitations within Earth System models, particularly in reproducing observed temperature patterns, this highlights the importance of natural variability in observational-based estimates of climate sensitivity.

How to cite: Skeie, R. B.: Observational-based estimates of climate sensitivity: impacts of aerosol evolution, natural variability and the recent temperature records, EGU General Assembly 2026, Vienna, Austria, 3–8 May 2026, EGU26-10347, https://doi.org/10.5194/egusphere-egu26-10347, 2026.

EGU26-10667 | ECS | Posters on site | CL4.11

Climate models with moderate climate sensitivity best simulate the magnitude of Earth’s energy imbalance 

Kyriaki Bimpiri, Thomas Hocking, and Thorsten Mauritsen

Recent studies have highlighted that state-of-the-art climate models are not able to simulate the large observed trend in Earth’s energy imbalance. Here we evaluate climate models’ ability to represent both the trend and the magnitude of the imbalance, while accounting for model energy leakage and remnant drift. As reference we use satellite observations and we find that every observed annual mean energy imbalance is within the range simulated by models, including the record year 2023, and when averaged over the 2001-2024 period, 15 out of 30 models simulate magnitudes of the imbalance that are statistically consistent with the observations. Models, however, generally underestimate the positive trend in the energy imbalance, albeit barely within the range of uncertainty. We suspected that a discontinuity in volcanic forcing between the historical and future scenario in 2014-2015 could have caused the underestimated trend, but only found evidence of such artifacts for a few models. Finally, we find a weak correlation between short-term decadal warming and energy imbalance, but a surprisingly close relationship between energy imbalance and equilibrium climate sensitivity. Based on observational constraints, the relationship suggests that models with moderate climate sensitivity are most realistic.

How to cite: Bimpiri, K., Hocking, T., and Mauritsen, T.: Climate models with moderate climate sensitivity best simulate the magnitude of Earth’s energy imbalance, EGU General Assembly 2026, Vienna, Austria, 3–8 May 2026, EGU26-10667, https://doi.org/10.5194/egusphere-egu26-10667, 2026.

In this study, we revisit the widely accepted interpretation of predominantly negative lapse-rate feedback, particularly in the tropics, by applying a physics-based climate feedback framework. We perform a side-by-side comparison of TOA-based PRP (partial radiative perturbation) and EGK-centered (energy gain kernel) climate feedback analysis frameworks. The only difference between them lies in their approach to accounting for temperature feedback. Under the EGK framework, all input energy perturbations are intimately related to temperature feedback through energy amplification following a multiplication role. The vertically integrated amplified input energy perturbation by temperature feedback is always substantially greater than the vertically integrated input energy itself. Such great amplification arises from the continuous back-and-forth relay of warming-induced thermal emissions from individual layers to absorption by other layers throughout the atmosphere-surface column until the system reaches a new equilibrium state. This is the positive aspect of temperature feedback. Temperature changes predicted from EGK automatically ensures energy is balance at all layers, including the TOA, through their thermal emissions. Thermal emissions reflect the negative aspect of temperature feedback.

The perturbation energy balance equation at the TOA only involves a simple addition of vertically integrated (partial) energy perturbations associated with external forcing and non-temperature feedbacks, plus OLR perturbations due to temperature feedback. The lapse-rate feedback mainly reflects the level where input energy is placed, rather than the physical nature of air temperature feedback. Its sign changes from positive for input energy at lower levels to negative for input energy at upper levels. Because energy perturbations due to radiative processes tend to have vertically decreasing profiles, their lapse-rate feedback tends to be predominantly positive. When also considering non-radiative feedbacks, such as enhanced vertical convection, the net effect of non-temperature feedbacks tends to be weak or even negative at the surface but strongly positive in the upper atmosphere in the tropics. This explains why the lapse-rate feedback is predominantly negative in the tropics.

How to cite: Sun, J. and Cai, M.: Revisiting the Apparent Negativity of Lapse-Rate Feedback Through a Physics-Based Climate Feedback Framework, EGU General Assembly 2026, Vienna, Austria, 3–8 May 2026, EGU26-11982, https://doi.org/10.5194/egusphere-egu26-11982, 2026.

EGU26-12772 | ECS | Orals | CL4.11

Cloud radiative effects due to deep convective clouds in the tropics: Insights from Himawari-8 observations 

Deepak Gopalakrishnan, Christopher Holloway, Mark Muetzelfeldt, Peter Hill, Elisa Carboni, and Gareth Thomas

Understanding Earth’s equilibrium sensitivity remains one of the key challenges of climate science, with cloud feedbacks representing a major source of uncertainty. High clouds associated with deep convective systems in the tropics have been shown to make a large contribution to this uncertainty. With a goal of improving our understanding of radiative properties of tropical high clouds, we investigate cloud radiative effects (CREs) of high clouds within mesoscale convective systems (MCSs) in the tropical western Pacific. The study uses a novel high-resolution (3-km), hourly dataset derived from the advanced Himawari imager onboard the Himawari-8 satellite. Cloud properties are retrieved with Optimal Retrieval of Aerosol and Cloud (ORAC) and the top-of-the-atmosphere CREs are calculated using the Broadband and Narrowband Radiative Transfer Model (BUGSrad). We identify and track MCSs during 2018–2022 using 11.2 μm brightness‑temperature data with a 233 K threshold and a minimum cloud‑top area of 1000 km², employing the ‘simple-track’ cloud-tracking algorithm. The analysis shows that, on an average, larger storms have more negative net CRE than smaller storms. Moreover, shorter-lived storms have a net CRE close to zero. Results based on all tracked MCSs across the 3-year period indicate that MCSs have a net CRE of -12.80 W m-2, though there exists a negative bias in Himawari-derived net CRE (that stems from bias in shortwave CRE) when compared to CERES-EBAF dataset. Further analysis separates clouds into low-brightness-temperature and high-brightness-temperature regimes, and show how these two cloud regimes evolve throughout the 3-year period.

How to cite: Gopalakrishnan, D., Holloway, C., Muetzelfeldt, M., Hill, P., Carboni, E., and Thomas, G.: Cloud radiative effects due to deep convective clouds in the tropics: Insights from Himawari-8 observations, EGU General Assembly 2026, Vienna, Austria, 3–8 May 2026, EGU26-12772, https://doi.org/10.5194/egusphere-egu26-12772, 2026.

EGU26-13152 | Posters on site | CL4.11

More positive climate feedback with higher resolution: A multi-resolution GSRM study with ICON in comparison to conventional models and other GSRMs 

Hauke Schmidt, Masaki Toda, Angel Peinado, Sarah M. Kang, and Bjorn Stevens

Global storm-resolving models (GSRMs) represent a frontier in climate change research, but their application remains limited due to high computational cost, and inter-GSRM comparisons are almost nonexistent. Moreover, a potential sensitivity of climate feedback in GSRMs of the Earth’s atmosphere to model resolution hasn’t been studied, yet.

In this study, we conducted AMIP and AMIP+4K experiments using the GSRM ICON, where the AMIP+4K experiment imposes a globally uniform sea surface temperature increase of 4 K. Each experiment was performed at three different horizontal resolutions: 20 km, 10 km, and 5 km.

Results show that for the AMIP+4K experiment, the net climate feedback parameter as well as its shortwave and longwave components all become more positive with increasing resolution. The difference in net climate feedback parameter between 20 km and 5 km resolution is comparable in magnitude to the model spread of climate feedback parameter in CMIP6 AMIP+4K experiments. The resolution dependence of the shortwave feedback in AMIP+4K experiment originates in the extratropics while the dependence of the longwave feedback is a result of tropical processes.

Regarding comparison with conventional models, the climate feedback parameter of ICON at 10km and 5km resolution falls within the model spread of CMIP6 AMIP+4K. However, over the extratropical oceans, ICON at all resolutions exhibits clearly stronger negative feedback than any of the CMIP6 models. Furthermore, the climate feedback from ICON at 5 km resolution is very close to that of another GSRM, X-SHiELD, at 3.4 km resolution. Nevertheless, the shortwave and longwave components differ significantly between the two models, indicating that even without convection parameterization—a key source of uncertainty—there is still notable inter-model variability in the representation of climate feedbacks.

How to cite: Schmidt, H., Toda, M., Peinado, A., Kang, S. M., and Stevens, B.: More positive climate feedback with higher resolution: A multi-resolution GSRM study with ICON in comparison to conventional models and other GSRMs, EGU General Assembly 2026, Vienna, Austria, 3–8 May 2026, EGU26-13152, https://doi.org/10.5194/egusphere-egu26-13152, 2026.

Determining the modern climate’s sensitivity to greenhouse-gas forcing has been a central challenge for over 40 years. To constrain the notoriously uncertain upper bound of climate sensitivity, we must look to the natural experiments in Earth’s past. Recent advances in climate reconstruction now provide new constraints on the spatial patterns of paleoclimate and historical temperature change. These temperature patterns play a leading role in climate sensitivity due to pattern effects.

We first investigate the cold Last Glacial Maximum and the warm Pliocene. By combining recent reconstructions with atmospheric general circulation models, we show why cloud feedbacks strongly amplify temperature changes in past climates and how this finding helps constrain the upper bound of modern climate sensitivity.

We then turn to the recent past (1850–2023) to examine the outstanding uncertainty in radiative feedbacks over the historical record. We introduce a new coupled reconstruction, which uses data assimilation to combine observational and dynamical constraints across the atmosphere and ocean. Using the reconstruction’s ensemble members in several atmospheric general circulation models, we quantify how uncertainty in SST, sea ice, and model physics leads to time-evolving uncertainty in feedbacks over the historical record. Finally, we combine results from the paleoclimate and historical records to show that accounting for pattern effects leads to stronger constraints on modern climate sensitivity and projections of 21st-century warming.

How to cite: Cooper, V.: Constraining Modern Climate Sensitivity and Pattern Effects with New Paleoclimate and Historical Reconstructions, EGU General Assembly 2026, Vienna, Austria, 3–8 May 2026, EGU26-13274, https://doi.org/10.5194/egusphere-egu26-13274, 2026.

EGU26-13300 | ECS | Orals | CL4.11

The magnitude of land–ocean warming contrast depends on the pattern of SST warming 

Masaki Toda and Moritz Günther

The land–ocean warming contrast—where global land mean warms more than the global ocean mean —is one of the most prominent features of global warming. In idealized CO₂-increase experiments, although there is inter-model spread, it is known that land warming is typically about 1.6 times larger than ocean warming. However, it remains unclear what determines the magnitude of this land–ocean warming contrast. For the 1980–2014 trend, observed land warming exceeds ocean warming by more than a factor of 2.3, and such a large observed land–ocean warming contrast cannot be reproduced by CMIP6 historical simulations. It is also well known that during this period there is a mismatch in the SST trend pattern between observations and historical simulations. In this study, we investigated how differences in sea surface temperature (SST) patterns affect the magnitude of land–ocean warming contrast. Using the climate model MPI-ESM, we conducted AGCM experiments forced by (i) a globally uniform SST warming (+2 K, +4 K, and +6 K), (ii) the same global-mean SST warming superimposed with the observed 1980–2014 SST trend pattern, and (iii) the same global-mean SST warming with the sign of the 1980–2014 SST trend pattern reversed. The results show that, despite having the same global-mean SST warming, land warming differs significantly among the SST patterns, and that the observed SST trend pattern tends to enhance the global-mean land warming. Under the observed SST pattern experiments, warming tends to be amplified across the entire Eurasian continent, which is a major contributor to the enhanced global-mean land warming. The strong warming over the mid-to-high-latitude Eurasian continent is explained primarily by pronounced Atlantic warming and warming in the northwestern Pacific, whereas the cooling tendency in the eastern equatorial Pacific affects the land-warming pattern over the North America through teleconnections. This study demonstrates that SST patterns exert a substantial influence on the factors controlling the magnitude of the land–ocean warming contrast, and suggests that the coupling between ocean and land temperature changes varies markedly depending on the future SST pattern change.

How to cite: Toda, M. and Günther, M.: The magnitude of land–ocean warming contrast depends on the pattern of SST warming, EGU General Assembly 2026, Vienna, Austria, 3–8 May 2026, EGU26-13300, https://doi.org/10.5194/egusphere-egu26-13300, 2026.

EGU26-13799 | Orals | CL4.11

Relationships between feedback components alter estimates of total radiative feedback and climate sensitivity 

Hugo Lambert, Paulo Ceppi, Li-Wei Chao, Samantha Ferrett, Mark Webb, and Mark Zelinka

The Sherwood et al. assessment [1] of Earth's climate sensitivity to a doubling of atmospheric carbon dioxide concentration broke new ground in providing estimates of radiative feedback and its components through the use of multiple lines of evidence. The assessment combined evidence from Global Climate Models (GCMs) with evidence from observations and process models that are able to produce more defensible estimates of small-scale and poorly-understood processes. However, by treating estimates of the different components of feedbacks as independent of one another, Sherwood ignored correlations between different feedbacks, which could impact the uncertainty affecting the estimate of overall feedback. The exception to this was the well-known water vapour-lapse rate anti-correlation, which they did consider.

In this study, we first undertake a perfect model experiment with the CMIP5 and CMIP6 ensembles that demonstrates the effects of considering correlations between components of feedbacks on estimates of net radiative feedback in a Sherwood-type analysis. Second, we explore correlations between contemporary estimates of feedback components from observed climate variability and cloud controlling factor analysis. Correlations between components have a similar structure for both perfect model and contemporary estimates. It is found that introducing feedback correlations into the Sherwood framework increases the standard deviation of the net feedback uncertainty by about 30 %. Impacts on estimates of climate sensitivity are smaller, because the process-based estimate of radiative feedback is only one part of the sensitivity estimate.

Prospects for future feedback and sensitivity estimates are discussed. The caveat to our results is that Sherwood's estimates of feedback components come from different sources. Although our results suggest that at least some of these show similar correlation structures, there is a need for future work that aims to understand the physical and statistical relationships between estimates of different components of feedback.

Reference

[1] Sherwood et al., 2020, Rev. Geophys., https://doi.org/10.1029/2019RG000678.

How to cite: Lambert, H., Ceppi, P., Chao, L.-W., Ferrett, S., Webb, M., and Zelinka, M.: Relationships between feedback components alter estimates of total radiative feedback and climate sensitivity, EGU General Assembly 2026, Vienna, Austria, 3–8 May 2026, EGU26-13799, https://doi.org/10.5194/egusphere-egu26-13799, 2026.

EGU26-14533 | ECS | Posters on site | CL4.11

Role of entrainment in shaping the pattern effect 

Khushi Dani, Anna Mackie, and Michael Byrne

Recent work has established how the sensitivity of tropical low clouds to patterns of SST warming influences  radiative feedbacks and estimates of equilibrium climate sensitivity. This is known as the pattern effect. Central to the pattern effect is the response of low clouds in subsidence regions, which has been linked to the efficiency through which surface warming influences free-tropospheric temperature and thus changes in lower-tropospheric inversion strength.  

Mechanistic understanding of this effect is underpinned by two conceptual models of the tropical atmosphere: (i) convective quasi-equilibrium (CQE) and (ii) weak free-tropospheric temperature gradients (WTG). Together, CQE and WTG imply that a quasi-uniform change in free-tropospheric temperature is set by warming in regions which are convectively coupled. The extent to which these convectively coupled regions can influence the free troposphere is partially controlled by the rate at which dry air is entrained into convective plumes, a process which is parameterized in global climate models and highly uncertain. 

Here, we explore how dry-air entrainment impacts the pattern effect through idealised simulations with CESM2. Using a control entrainment parameter, we perturb an atmosphere-only model with prescribed  warming and cooling SST patches at 4 locations between 100E and 220E along the equator. The simulations are then repeated for a range of entrainment parameter rates. We observe a nonlinear sensitivity of pattern effect to entrainment rate. Specifically, we find evidence that modifying the entrainment parameter influences which regions are most influential in setting free-tropospheric temperatures and affects the sensitivity of top-of-atmosphere fluxes to SST perturbations. Finally, we note contrasting responses over land and ocean when modifying the entrainment parameter, for which we describe a hypothesised mechanism. 

How to cite: Dani, K., Mackie, A., and Byrne, M.: Role of entrainment in shaping the pattern effect, EGU General Assembly 2026, Vienna, Austria, 3–8 May 2026, EGU26-14533, https://doi.org/10.5194/egusphere-egu26-14533, 2026.

EGU26-17261 | ECS | Posters on site | CL4.11

Robust Warming Hole in the Southeast Pacific 

Xiao Pan and Sarah Kang

Understanding CO₂-induced surface warming patterns is essential for regional climate projections. Abrupt 4×CO2 experiments reveal well-documented warming holes in the subpolar North Atlantic (NA) and Southern Ocean (SO), yet a similarly robust but less recognized warming hole emerges in the Southeast Pacific (SEP). Unlike the warming holes over NA and SO, which disappear in slab ocean models without active ocean circulation, the SEP warming hole persists and intensifies, indicating the dominant role of air–sea interactions. Latitudinally constrained CO₂ forcing experiments demonstrate that off-equatorial Northern Hemisphere (NH) forcing drives the SEP warming hole by inducing an interhemispheric energy imbalance, shifting the Hadley circulation (HC) northward, and strengthening the Southern Hemisphere subtropical descent. This enhances the South Pacific Subtropical High and the associated southeasterly trade winds. Combined with a stronger cross-equatorial flow associated with the northward-shifted HC, the enhanced winds contribute to the SEP warming hole through increased latent heat flux. Inter-model spread of SEP warming hole across CMIP6 models is well explained by variations in wind-driven latent heat flux, primarily controlled by cloud-mediated interhemispheric energy asymmetry. These results identify atmospheric teleconnections as the key driver of the SEP warming hole, distinguishing it from the ocean-driven mechanisms in the NA and SO. 

How to cite: Pan, X. and Kang, S.: Robust Warming Hole in the Southeast Pacific, EGU General Assembly 2026, Vienna, Austria, 3–8 May 2026, EGU26-17261, https://doi.org/10.5194/egusphere-egu26-17261, 2026.

EGU26-21179 | ECS | Posters on site | CL4.11

Modulation of El Niño Decay by Negative High Cloud Feedback 

Yanjia Wang, Chengxing Zhai, and Hui Su

Understanding the physical mechanisms governing the El Niño decay phase is fundamental for simulating accurately the duration of El Niño events. This study investigates the role of negative high cloud feedback in modulating El Niño’s decay during boreal winter and spring. Utilizing ERA5 reanalysis data from 1950 to 2024, we find that peak El Niño SST anomalies in the central-eastern Pacific during boreal winter trigger a simultaneous local increase in high cloud. These high cloud anomalies exert a cooling effect on the ocean surface by reflecting incoming shortwave radiation. There is a significant correlation between wintertime surface net cloud radiative effect (CRE) and the SST tendency from winter to the subsequent spring. Heat budget diagnostics further confirm that this intense shortwave cooling effect of high cloud accounts for a substantial proportion of the net surface heat flux anomalies, acting as a critical thermodynamic factor for the decay phase. Most Coupled Model Intercomparison Project Phase 6 (CMIP6) models capture this relationship between wintertime CRE and SST tendency, validating this mechanism. However, there is a systematic bias between simulated and observed feedback sensitivity. This discrepancy likely hinders the models' ability to accurately represent the rapid decay and realistic duration of El Niño events. Our findings suggest that improving cloud-radiation parameterizations is essential for improving the simulation and prediction of ENSO lifecycles in climate models.

How to cite: Wang, Y., Zhai, C., and Su, H.: Modulation of El Niño Decay by Negative High Cloud Feedback, EGU General Assembly 2026, Vienna, Austria, 3–8 May 2026, EGU26-21179, https://doi.org/10.5194/egusphere-egu26-21179, 2026.

EGU26-21810 | Orals | CL4.11

How Clear-Sky Spectral Overlap Shapes Radiation in Cloudy Atmospheres 

Robert Pincus and Paulina Czarnecki

Optically-thick clouds largely emit thermal radiation at their cloud top temperature across the longwave spectrum. However, the degree to which cloud top temperature dominates outgoing longwave radiation depends on how the clouds share spectral space with Earth's major greenhouse gases. In this work we leverage analytical models of spectral emission by CO2 and  H2O  to understand how spectral overlap between gases and clouds impacts the longwave cloud radiative effect (CRE) and all-sky feedbacks. We demonstrate that CRE is linear in the difference between surface and cloud top temperature because of water vapor's greenhouse effect and that low clouds exert a small CRE not exclusively because their temperature is close to surface temperature but primarily because they are masked by H2O and CO2. Spectral decomposition of feedbacks  reveals that the changing emission temperature of greenhouse gases stabilizes the climate even in fully cloudy columns, and clouds that warm with the surface provide additional stabilization in the water vapor window. We find good agreement between our analytical expressions and both full-physics line-by-line calculations as well as output from a global storm resolving model. By understanding spectral overlap of greenhouse gases and clouds, we disentangle the effects of surface temperature, cloud top temperature, and relative humidity on Earth's longwave energy balance in cloudy columns.

How to cite: Pincus, R. and Czarnecki, P.: How Clear-Sky Spectral Overlap Shapes Radiation in Cloudy Atmospheres, EGU General Assembly 2026, Vienna, Austria, 3–8 May 2026, EGU26-21810, https://doi.org/10.5194/egusphere-egu26-21810, 2026.

Mid-latitude weather systems play a significant role in causing floods, wind damage, and related societal impacts. Advances in numerical modeling and observational methods have led to the development of numerous conceptual models in mid-latitude synoptic and dynamical research. As these models proliferate, integrating new insights into a cohesive understanding can be challenging. This study uses a kinematic perspective to interpret mid-latitude research in a way that synthesises various concepts and create a schematic diagram of an atmospheric river lifecycle. Our analysis demonstrates that, despite varying methods, definitions, and terminology used to describe extratropical cyclones, warm conveyor belt airflows, and atmospheric rivers, the underlying mechanisms driving their formation and development are consistent. Thus, while studying these features independently is valuable, it is important to recognise that they are all part of a larger atmospheric flow pattern. We hope this kinematic approach will serve as a bridge to link research on these phenomena.

How to cite: Dacre, H. and Clark, P.: A kinematic analysis of extratropical cyclones, warm conveyor belts and atmospheric rivers, EGU General Assembly 2026, Vienna, Austria, 3–8 May 2026, EGU26-1858, https://doi.org/10.5194/egusphere-egu26-1858, 2026.

EGU26-2011 | ECS | Posters on site | AS1.17

Understanding the Driving Mechanisms of two Extreme Precipitation and Drought Events in Australia from a Moisture Source Perspective 

Yinglin Mu, Jason Evans, Andrea Taschetto, and Chiara Holgate

Moisture availability is a fundamental prerequisite for precipitation. Within the water cycle, moisture contributing to precipitation originates from evapotranspiration (ET) in both local and remote regions. This moisture is transported through the atmosphere and may be progressively depleted during transit through precipitation. Consequently, the moisture supply to a region can vary in response to changes in evapotranspiration, atmospheric circulation, and environmental conditions that influence moisture transport and precipitation efficiency. Here we use a Lagrangian moisture source identification model BTrIMS1.1, in combination with analysis of weather systems, ET, and convective environment to understand the mechanisms of precipitation variability during two extreme events that lead to drought and floods in Australia.

The Tinderbox Drought (January 2017–December 2019) in Australia severely threatened urban water supplies including Sydney, caused substantial agricultural losses and contributed to the devastating Black Summer bushfires. This drought was associated with a ~50% reduction in precipitation compared with climatology. In stark contrast, the following triple La Niña period (September 2020– August 2023) brought persistent heavy precipitation to eastern Australia, resulting in widespread flooding and storm-related damage. Despite their opposite hydrological impacts, both events were characterized by pronounced precipitation anomalies.

We focus on the Murray-Darling Basin, Australia, because of its critical importance to agricultural production. Our analysis indicates that oceanic moisture contributions were substantially reduced during the Tinderbox Drought, driven primarily by changes in atmospheric circulation. Altered weather systems diverted climatological moisture sources away from the Basin, shifting dominant moisture sources towards regions with lower ET. This shift resulted in a pronounced moisture deficit, which was further exacerbated by reduced local ET.

In contrast, during the triple La Niña period, there was an increased occurrence of slow-moving cyclone and anticyclone pairs, enhancing easterly flow and oceanic moisture transport towards eastern Australia. In addition, moisture contribution from inland Australia increased, driven by a substantially higher land ET during this period. By the third year, precipitation was further amplified by enhanced local moisture recycling due to wetter land surfaces. The persistence of slow-moving low-pressure systems also provided a more favourable environment for precipitation over extended periods, consistent with the higher mean convective available potential energy observed during triple La Niña period. Together, circulation anomalies and enhanced convective conditions combined to produce anomalously high precipitation and widespread flooding during this period.


Key words: precipitation, moisture sources, Lagrangian, weather systems, evapotranspiration, ENSO, extreme events

How to cite: Mu, Y., Evans, J., Taschetto, A., and Holgate, C.: Understanding the Driving Mechanisms of two Extreme Precipitation and Drought Events in Australia from a Moisture Source Perspective, EGU General Assembly 2026, Vienna, Austria, 3–8 May 2026, EGU26-2011, https://doi.org/10.5194/egusphere-egu26-2011, 2026.

EGU26-3379 | ECS | Orals | AS1.17

Arctic Sea Ice Loss Amplifies Local Evaporation Influence on Water Vapor Isotopes: Insights from Cruise Observations 

Yuankun Zhang, Zhongfang Liu, Dongsheng Li, Zhiqing Li, and Hebin Shao

Rapid Arctic warming and sea ice retreat have increased atmospheric humidity, yet the relative contributions of local evaporation and advected lower-latitude moisture remain poorly quantified. Here, we present high-resolution, ship-based in-situ measurements of near-surface water vapor isotopes across diverse Arctic sea ice regimes. By integrating isotope fractionation models with multi-source meteorological data, we show that sea ice changes act as a key modulator of Arctic water vapor isotopic variations. Under ice-covered conditions, water vapor isotopes are controlled by Rayleigh distillation, producing depleted δ18O with a strong temperature dependence and elevated d-excess from ice-phase processes. As sea ice retreats, kinetic fractionation from local evaporation becomes increasingly important, particularly at temperatures above ~ 5  °C, generating enriched δ18O, elevated d-excess, and a characteristic "anti-temperature" effect. A Bayesian isotope mixing model quantifies the resulting moisture source shift, showing local evaporation contributions rise from 9.3 % in ice-covered regions to 22.7 % in melt regions, despite advected moisture remaining predominant. These findings establish a process-based isotope framework for the Arctic hydrological cycle, complementing conventional meteorological diagnostics and offering a robust benchmark for interpreting paleo-isotope archives.

How to cite: Zhang, Y., Liu, Z., Li, D., Li, Z., and Shao, H.: Arctic Sea Ice Loss Amplifies Local Evaporation Influence on Water Vapor Isotopes: Insights from Cruise Observations, EGU General Assembly 2026, Vienna, Austria, 3–8 May 2026, EGU26-3379, https://doi.org/10.5194/egusphere-egu26-3379, 2026.

EGU26-6722 | ECS | Posters on site | AS1.17

Future changes in moisture sources in Central American region using high-resolution numerical simulations. 

Gleisis Alvarez Socorro, José Carlos Fernández Alvarez, Raquel Nieto, Luis Gimeno, and Rogert Sorí

Global warming is causing changes in atmospheric dynamics that directly influence the hydrological cycle and its components. Moisture sources in the Central American region are not exempt from these changes. The research objective is to study future changes, by the middle and end of the 21st century, in moisture sources in three regions: Central America, Northwest South America, and the Orinoco region. For this purpose, a computational framework based on the regional models WRF-ARW and FLEXPART-WRF is used, and the outputs of the global model CESM2 are used as initial and boundary conditions (forcers). The periods used were: historical (1985 to 2014), mid-(2036 to 2065) and end-century (2071 to 2100), under the climate scenario SSP5-8.5. A Lagrangian methodology was used for the calculation of moisture sources and the analysis was carried out by seasons and annually. The moisture sources from Central America will increase, by the end-century, over that region and in the Caribbean Sea, with a greater increase in autumn, with a slight decrease to the west, over the Pacific coasts. In the North South American region, the greatest changes are also observed at the end-century, with a predominant increase in moisture sources over the region in winter and spring, which extends over the western Atlantic in summer and autumn. In the Orinoco region, the increase is observed, over the region itself in winter, while in the remaining seasons, extending towards the Central Atlantic.

How to cite: Alvarez Socorro, G., Fernández Alvarez, J. C., Nieto, R., Gimeno, L., and Sorí, R.: Future changes in moisture sources in Central American region using high-resolution numerical simulations., EGU General Assembly 2026, Vienna, Austria, 3–8 May 2026, EGU26-6722, https://doi.org/10.5194/egusphere-egu26-6722, 2026.

EGU26-7162 | Orals | AS1.17

Retrieval of global in-cloud conversion efficiency estimates based on satellite-measured H2O–HDO pairs 

Killian P. Brennan, Nina Fieldhouse, and Franziska Aemisegger

In-cloud conversion efficiency, defined as the fraction of water vapor converted into precipitation during ascent, is a key but weakly constrained variable of the atmospheric water cycle. It summarizes the combination of microphysical and dynamical processes that control precipitation formation. We present a methodology to retrieve observation-derived estimates of the conversion efficiency globally using paired H2O–HDO measurements from the Infrared Atmospheric Sounding Interferometer (IASI) aboard the MetOp satellites for the period 2014–2020.
IASI δD retrievals from mid-tropospheric clear-sky regions are combined with 15-day backward Lagrangian trajectories calculated using three-dimensional wind data from the ERA5 reanalysis to identify last saturation events along air-parcel histories. These events are diagnosed using specific hydrometeor content thresholds, while precipitation-contaminated and humidity-non-conserving cases are excluded. To link isotope signals to conversion efficiency, a simple Rayleigh condensation box model is applied along the diagnosed ascent pathways. For convective ascent, the model follows pseudo-adiabatic vertical motion from cloud base to the diagnosed last saturation locations associated with the IASI observations; for slantwise ascent, the box model is applied along 48-hour Lagrangian trajectories. Modeled δD profiles are then combined with IASI observations to derive in-cloud conversion efficiencies constrained by the observed water isotope signals, within the uncertainty range of the remote sensing observations and the trajectory calculation.
The resulting dataset will provide the first global satellite-derived estimates of in-cloud conversion efficiency for both convective and slantwise ascents. Case studies ranging from mesoscale convective systems in the tropics to warm conveyor belts in the midlatitudes demonstrate the methodology and illustrate distinct efficiency regimes, offering a new observational constraint on moist process representations in the atmosphere.

How to cite: Brennan, K. P., Fieldhouse, N., and Aemisegger, F.: Retrieval of global in-cloud conversion efficiency estimates based on satellite-measured H2O–HDO pairs, EGU General Assembly 2026, Vienna, Austria, 3–8 May 2026, EGU26-7162, https://doi.org/10.5194/egusphere-egu26-7162, 2026.

Atmospheric rivers (ARs) are thought to be the main driver of extreme precipitation events in the North Atlantic and Pacific, and are responsible for most of the total extratropical poleward moisture transport. They are associated with violent weather and high precipitation that can lead to floods in populous coastal areas. Moreover, the frequency and intensity of ARs is expected to increase with climate change, driven by the rise in atmospheric moisture and precipitation. An important question about ARs is whether they are being supplied primarily from remote subtropical regions, or whether they are recycling water vapor by evaporating and precipitating as they travel northward.

In a previous paper, we implemented water vapor (WV) age tracers in a global circulation model to resolve the WV age spectrum and the age of precipitation in both space and time, which allowed us to study the dynamics of WV age. In this study, we use our novel tracers to test how the mean WV age and the mean age of precipitation can be used to identify and investigate the dynamics behind ARs. We use column integrated water vapor (CWV) wave activity and precipitation (Lu et al., 2017) to track AR features, and show that the mean WV age at the surface and the mean age of precipitation is well correlated to CWV wave activity in wintertime extreme precipitation events over the North Atlantic and Pacific.

From composite images of our WV age tracers and climatological diagnostics, we show how during winter, surface WV age and the age of precipitation are higher than the seasonal average, supporting long range moisture transport by ARs, while in summer, they are lower than average, meaning local sources of water vapor is feeding into convective storms. During winter, tropical WV lifts up and travels poleward via extra tropical cyclones, with convective precipitation removing WV from the lower levels along the way. In the midlatitudes, large scale condensation precipitates most of the subtropical WV. As a result, the age of precipitation and surface WV age are about 2 days over seasonal average at the end of the storm track, matching our estimated advective time scale from the subtropics. Also, the large amount of precipitation reduces the WV age in the upper levels of the atmosphere.  

During summer on the other hand, there are high values of CWV wave activity which could be interpreted to also indicate long range transport. But, lower surface WV age and age of precipitation than average, among other results, indicates that it is due to local evaporation and convective storms recycling the locally available WV along the storm tracks. 

In summary, our results show how our tracers of WV age, which could be implemented relatively simply into more complex climate models, give us a new straightforward tool to analyse the lengthscale WV travels in the atmosphere, helping us understand the dynamics behind WV transport, and its impact on the water cycle with climate change.

How to cite: Boulanger, P. and Fajber, R.: Atmospheric River Dynamics: What Can Water Vapor Age Tell Us About the Moisture Transport Leading to Extreme Precipitation?, EGU General Assembly 2026, Vienna, Austria, 3–8 May 2026, EGU26-8447, https://doi.org/10.5194/egusphere-egu26-8447, 2026.

EGU26-11973 | ECS | Orals | AS1.17

Water Vapour Isotope Signals during an Atmospheric River Event: Model Simulations and Observations from TROPOMI and TCCON 

Angel Ignatious, Hartmut Bösch, Harald Sodemann, and Matthias Buschmann

The Arctic is warming at more than twice the global average, a phenomenon known as Arctic amplification. In consistency with this rapid warming, a pronounced moistening trend is observed over the past 30-40 years. While the region's atmospheric humidity is increasing, it remains unclear whether this increased moisture originates primarily from local sources such as enhanced evaporation from ice-free ocean surfaces or is transported from lower latitudes. Atmospheric rivers (ARs) play a central role in the poleward moisture transport and play a critical role in Arctic climate processes.

During phase change processes, such as evaporation and condensation, the heavy stable isotopes of water accumulate in the condensed phase. As a result, the isotopic composition of water vapour act as an integrated tracer of an air parcel’s condensation (or phase change) history, providing information on moisture sources and transport pathway that can help to improve our understanding of moisture processes during transport into and within the Arctic.

In this study, we investigate the isotopic composition of water vapour during an event that occurred in March 2021 where an AR made landfall in Northern Scandinavia. We analyse data from the isotope-enabled COSMO model (COSMO-iso) and evaluate them against observations from the TROPOMI satellite instrument and TCCON ground based stations to diagnose the isotopic signals associated with the AR. The comparison indicates that TROPOMI observations capture more detailed spatial structures and more distinct features than COSMO-Iso model output. Histogram analyses further show systematic differences in isotope abundances in the model compared to TROPOMI. Ground-based TCCON observations provide an independent reference to assess the consistency of both the model simulations and satellite retrievals during the event.

How to cite: Ignatious, A., Bösch, H., Sodemann, H., and Buschmann, M.: Water Vapour Isotope Signals during an Atmospheric River Event: Model Simulations and Observations from TROPOMI and TCCON, EGU General Assembly 2026, Vienna, Austria, 3–8 May 2026, EGU26-11973, https://doi.org/10.5194/egusphere-egu26-11973, 2026.

EGU26-12139 | ECS | Posters on site | AS1.17

Imprint of atmospheric rivers on stable-oxygen isotopes ratio in Greenland ice cores: an assessment 

Alessandro Gagliardi, Christophe Leroy-Dos Santos, Norel Rimbu, Mathieu Casado, Alexandre Cauquoin, Amaelle Landais, Martin Werner, Gerrit Lohmann, and Monica Ionita

The stable oxygen isotope ratio (δ18O) measured in ice cores is widely used to reconstruct past climate variability on short and long timescales. Among synoptic processes, atmospheric rivers (ARs) play a key role in the poleward transport of moisture. ARs are long, narrow corridors of intense horizontal water vapour transport, typically associated with extratropical cyclones. They convey large amounts of moisture from distant, often low-latitude source regions together with warm air advection, thereby introducing a distinct isotopic signature into precipitation. Through snowfall, the isotopic composition of atmospheric water vapour is recorded in snow and ultimately preserved in ice cores. 

While several studies have examined the influence of ARs on δ18O variability in Antarctic ice cores, a comparable assessment for Greenland remains more limited until now.

Here, we investigate the imprint of ARs on δ18O variability in Greenland ice cores using virtual firn cores (VFCs) derived from a new high-resolution (0.5°) simulation performed with the isotope-enabled atmospheric general circulation model ECHAM6-wiso nudged to ERA5 reanalyses. VFCs are generated for the Renland Ice Cap (RECAP) and Southeastern Dome (SED) sites and evaluated against their corresponding very high-resolution measured δ18O records.

Our results show that ARs do not fundamentally change the δ18O variability. However, they exert a pronounced influence on seasonal and subseasonal δ18O variations during periods when AR-related snowfall contributes a substantial fraction of total precipitation. On the subseasonal timescale, individual AR events are found to increase δ18O values by approximately 3‰ on average, with extreme cases reaching up to 5‰.

How to cite: Gagliardi, A., Leroy-Dos Santos, C., Rimbu, N., Casado, M., Cauquoin, A., Landais, A., Werner, M., Lohmann, G., and Ionita, M.: Imprint of atmospheric rivers on stable-oxygen isotopes ratio in Greenland ice cores: an assessment, EGU General Assembly 2026, Vienna, Austria, 3–8 May 2026, EGU26-12139, https://doi.org/10.5194/egusphere-egu26-12139, 2026.

EGU26-12654 | ECS | Posters on site | AS1.17

A prototype WISO-enabled version of NorESM 

Laura Dietrich, Harald Sodemann, Hans-Christian Steen-Larsen, and Thomas Toniazzo

We have implemented fractionation, tracing and dispersion processes for water stable isotopes in a protoptype version of the Norwegian Earth-System Model (NorESM) based on the numerical schemes of iCESM (Nussbaumer et al., 2017).                                        
Current capabilities include land-atmosphere-ice coupled integrations following the AMIP protocol, and 3-D nudging to observed reanalysis data.
Work on the ocean component (BLOM) is on-going.
We discuss preliminary results from a comparison with iCESM integrations, and from simulations intended to contribute to the WisoMIP effort (Bong et al. 2025).

How to cite: Dietrich, L., Sodemann, H., Steen-Larsen, H.-C., and Toniazzo, T.: A prototype WISO-enabled version of NorESM, EGU General Assembly 2026, Vienna, Austria, 3–8 May 2026, EGU26-12654, https://doi.org/10.5194/egusphere-egu26-12654, 2026.

EGU26-13555 | ECS | Orals | AS1.17

 Drivers of marine cold air outbreak intensity along the Gulf Stream and Kuroshio Current in a warmer climate 

Nina Fieldhouse, Franziska Schnyder, and Jacopo Riboldi

Marine Cold Air Outbreaks (MCAOs) along the western boundary currents trigger strong air-sea interactions in the entrance region of the storm tracks and act as an important moisture source for cyclones developing within the northern hemispheric storm tracks. Changes in MCAO intensity with climate change, however, are complex to evaluate because of the competing effects of the expected increase in air temperature (which would reduce MCAO intensity) and in sea surface temperatures (which would increase MCAO intensity). This study aims to achieve a detailed understanding of MCAO intensity changes in relation to these opposing effects, by comparing present and future MCAOs along the northern hemispheric western boundary currents as simulated by the Community Earth System Model 2 (CESM2) forced by the SSP3-7.0 radiative forcing scenario. Lagrangian, three-dimensional air parceltrajectories initialized from within the MCAOs are computed directly from the 6-hourly climate model output, allowing to gain insights into the processes responsible for changes in MCAO intensity.

We find that in the considered scenario the increase in air temperature outweighs the increase in SSTs, leading to weakening of future MCAOs along western boundary currents. Backward trajectories initiated from the MCAOs show that the increase in air temperature in the MCAOs results from substantially higher initial potential temperature and slightly weaker diabatic cooling experienced by the air parcels on their way towards the MCAOs. For future MCAOs along the Gulf Stream specifically, the permanently sea ice-free Hudson Bay additionally acts as a new warming source on the trajectories, prior to reaching the Gulf Stream region. Despite the decrease in intensity, future MCAOs are associated with increased net evaporation, suggesting that MCAOs are expected to remain an important contributor to the water cycle of the northern hemispheric storm tracks.

How to cite: Fieldhouse, N., Schnyder, F., and Riboldi, J.:  Drivers of marine cold air outbreak intensity along the Gulf Stream and Kuroshio Current in a warmer climate, EGU General Assembly 2026, Vienna, Austria, 3–8 May 2026, EGU26-13555, https://doi.org/10.5194/egusphere-egu26-13555, 2026.

EGU26-14048 | Posters on site | AS1.17

Following the Isotopic Fingerprints of Atmospheric Water Vapor with Balloon-Borne Sampling 

Rigel Kivi, Daniele Zannoni, Pauli Heikkinen, Veikko Räty, Hans Christian Steen-Larsen, Tor Olav Kristensen, Thomas Röckmann, Markus Leuenberger, Peter Nyfeler, and Franziska Aemisegger

Understanding the phase-change history of atmospheric water is essential for constraining the physical parameterizations of the hydrological cycle in general circulation and regional climate models, ultimately improving the accuracy of their predictions. Stable water isotopes are natural tracers of these processes, as they record the integrated effects of phase changes along atmospheric transport pathways and therefore provide constraints for atmospheric models. However, obtaining observations of the stable isotopic composition of water vapor throughout the troposphere remains challenging because of the high costs associated with aircraft-based measurements. In this study, we present the latest results from the Water Vapor Isotopologue Flask sampling for the Validation Of Satellite data (WIFVOS) project, including both recent field observations and the technical developments of the balloon-borne flask sampling system achieved over the past three years, aimed at providing a cost-effective platform for retrieving water vapor mixing ratio (w, ppm) and isotopic composition (δ¹⁸O and δD, ‰ VSMOW). During the 2024 WIFVOS field campaign in Sodankylä (northern Finland), four successful balloon launches were conducted using a newly designed flask sampler. During the descent phase of each flight, four flasks were filled at different altitudes, providing water vapor concentration and isotopic composition at predefined pressure levels up to 3000 m ASL. A Vaisala RS92-SGP radiosonde was attached to the sampler to independently assess the quality of the humidity measurements obtained from the flask samples. Flask analyses were performed offline using a Picarro L2120-i analyzer within a few hours after balloon recovery. The retrieved humidity showed excellent agreement with radiosonde measurements (mean absolute error = 484 ppm), and clear isotopic gradients were observed within the boundary layer and the lower troposphere. To extend the vertical coverage of the profiles, AirCore samples were collected within a few hours of the flask sampling. The flask sample reproducibility was evaluated through two additional low-altitude flights conducted with a hexacopter drone equipped with a modified, lightweight version of the sampler: one flight at a fixed altitude and one sampling the lowest few hundred meters of the atmospheric column. These flights yielded standard deviations fully comparable with uncertainties estimated from dedicated laboratory tests performed prior to field deployment (±0.2 ‰ for δ¹⁸O and ±1.0 ‰ for δD). During the campaign, simulations were performed with the isotope-enabled regional weather prediction model COSMOiso, providing a highly resolved representation of the vertical distribution of atmospheric water vapor isotopic composition. We demonstrate the applicability of WIFVOS data for satellite validation by comparing the flask-based measurements with observations from the nearby Total Carbon Column Observing Network (TCCON) spectrometer in Sodankylä. Finally, we discuss the potential of the lightweight sampler for measuring additional trace gases, such as CH4, in the lower atmosphere using conventional drones. The vertically resolved isotopic observations obtained with the complementary techniques presented here provide key constraints for Earth System Models in the Arctic, supporting improved representation of atmospheric moisture processes.

How to cite: Kivi, R., Zannoni, D., Heikkinen, P., Räty, V., Steen-Larsen, H. C., Kristensen, T. O., Röckmann, T., Leuenberger, M., Nyfeler, P., and Aemisegger, F.: Following the Isotopic Fingerprints of Atmospheric Water Vapor with Balloon-Borne Sampling, EGU General Assembly 2026, Vienna, Austria, 3–8 May 2026, EGU26-14048, https://doi.org/10.5194/egusphere-egu26-14048, 2026.

EGU26-14175 | ECS | Orals | AS1.17

Intercomparison of moisture tracking methods simulating sources of extreme precipitation events 

Imme Benedict, Jessica Keune, Chris Weijenborg, Ruud van der Ent, Peter Kalverla, and Gerbrand Koren and the Moisture tracking intercomparison team

To better understand the mechanisms behind precipitation extremes, one can determine the origin of the precipitation, i.e. its moisture sources. The time and spatial distribution of these sources provide insights into the importance of land-ocean–atmosphere interactions and moisture recycling and the synoptic situation of an extreme event. This allows for better prediction and improved disaster preparedness.

However, the moisture sources of extreme precipitation cannot be measured directly. Therefore, a variety of moisture tracking methods have been developed over recent decades, but the uncertainties associated with these methods remain poorly quantified. Here, we present the IdentificatioN of Sources of Precipitation through an International Research Effort (INSPIRE), a coordinated intercomparison of moisture tracking methods. Within this initiative, the moisture tracking community gathered to compare moisture sources of three extreme precipitation events across 14 different methods. The events occurred under different meteorological conditions: monsoon precipitation in Pakistan, convective precipitation in Australia, and atmospheric river-associated precipitation over Scotland. Our findings show that, in all cases, the different moisture tracking methods qualitatively agree on moisture source patterns, although there are regional and quantitative differences. For example, for the Pakistan case, the recycling ratio shows a multi-method spread of 2–20%.  We also find that groups of methods behaved similarly across events. This study provides a first quantitative benchmark of inter-method uncertainty and establishes a reference framework for future moisture tracking studies.

How to cite: Benedict, I., Keune, J., Weijenborg, C., van der Ent, R., Kalverla, P., and Koren, G. and the Moisture tracking intercomparison team: Intercomparison of moisture tracking methods simulating sources of extreme precipitation events, EGU General Assembly 2026, Vienna, Austria, 3–8 May 2026, EGU26-14175, https://doi.org/10.5194/egusphere-egu26-14175, 2026.

EGU26-14557 | ECS | Posters on site | AS1.17

Moisture Transport by Extratropical Cyclones and Fronts in High-Resolution Climate Change Simulations 

Dalila Mäder Arrabali, Yonatan Givon, Robin Noyelle, and Robert C. Jnglin Wills

Extratropical cyclones (ETCs) play a pivotal role in hydrological processes of the atmosphere, such as evaporation, moisture transport and precipitation. Long-term changes in the hydrological contribution of ETCs will therefore have important impacts on shifts in precipitation patterns, droughts, and extreme events. ETCs are projected to decrease in frequency and increase in intensity under global warming—maintaining a near balance in their net contribution to moisture fluxes. However, hydrological cycle changes associated with cyclonic fronts may exhibit stronger signals and are more uncertain, because these frontal systems are often under-resolved in coarse grid simulations.

In this study, we investigate how higher resolution modeling affects the impacts that ETCs will have on atmospheric moisture fluxes under global warming, while also accounting for the contribution of cyclonic fronts. We analyze long-term MESACLIP historical and future simulations at varying resolutions (up to ~25 km). Using cyclone and front tracking algorithms, we quantify long-term changes in ETC-induced freshwater fluxes and compare results across model resolutions. Because small-scale processes are crucial for cyclogenesis and associated fluxes, we expect stronger air–sea coupling and enhanced vertical motions along cyclonic fronts in higher-resolution models, potentially amplifying the overall imprint of ETCs on important hydrological processes of the atmosphere. Our work highlights the need to adequately account for frontal processes when assessing future changes in atmospheric moisture fluxes.

How to cite: Mäder Arrabali, D., Givon, Y., Noyelle, R., and Jnglin Wills, R. C.: Moisture Transport by Extratropical Cyclones and Fronts in High-Resolution Climate Change Simulations, EGU General Assembly 2026, Vienna, Austria, 3–8 May 2026, EGU26-14557, https://doi.org/10.5194/egusphere-egu26-14557, 2026.

For several decades, the comparison of climate data with results from water isotope-enabled Atmosphere General Circulation Models (AGCMs) significantly helped to a better understanding of the processes ruling the water cycle, which is one of the main drivers of the climate variability. For the modern period, the use of AGCMs nudged with weather forecasts reanalyses is a powerful way to obtain model outputs under the same weather conditions than at the sampling time of the observations.

In this regard, Cauquoin and Werner (2021) [1] produced a simulation at T127 horizontal resolution (~0.9°) with the ECHAM6-wiso model nudged to the ERA5 reanalyses [2, 3] for the period from 1979 to present time. The simulation results have been used extensively in many studies focusing on, for example, snow-vapor interactions in polar regions, processes controlling isotopic content of water vapor and precipitation in the Asian monsoon area, or the use of isotope information to reconstruct past cyclone frequency.

To go further and considering that one limitation for isotope model-data comparisons is the spatial resolution, we present here new ECHAM6-wiso nudged simulation at 0.5° horizontal resolution for the extended period 1940-2024. This higher resolution will be very useful to improve the interpretation of various water isotope records. Also, the extended data period from 1950 to present time is an opportunity to enhance statistical analyses related to interannual changes in isotopes and climate under global warming. An example of application (EGU26-12139) is presented in the same session as the present abstract.


[1] Cauquoin and Werner (2021). Journal of Advances in Modeling Earth Systems, https://doi.org/10.1029/2021MS002532.

[2] Hersbach al. (2020). Quarterly Journal of the Royal Meteorological Society, https://doi.org/10.1002/qj.3803.

[3] Soci et al. (2024). Quarterly Journal of the Royal Meteorological Society, https://doi.org/10.1002/qj.4803.

How to cite: Cauquoin, A. and Werner, M.: Very high-resolution simulation with ECHAM6-wiso nudged to ERA5 reanalyses for the period 1940-2024, EGU General Assembly 2026, Vienna, Austria, 3–8 May 2026, EGU26-15201, https://doi.org/10.5194/egusphere-egu26-15201, 2026.

EGU26-18510 | ECS | Posters on site | AS1.17

Insights into Northwest Himalayan water cycle from continuous atmospheric water vapor and event-based rainwater isotopes   

Anubhav Singh, Gaurav Kumar, Shyam Ranjan, Markus Leuenberger, and Yama Dixit

The Himalayan region, a major source of freshwater for downstream river basins, exhibits strong sensitivity to climate variability due to its complex terrain and the interplay of multiple moisture sources, primarily the Indian Summer Monsoon and western disturbances. This complexity limits the interpretations of rainfall variability and underscores the need for direct constraints on moisture sources and precipitation processes. Continuous monitoring of atmospheric water vapor isotopes (δ²H, δ¹⁸O, and δ¹⁷O), together with meteorological observations, has been instrumental in investigating the moisture transport, condensation processes, and evaporative source characteristics over the region. In this study, we analyze high-resolution atmospheric water vapor isotope measurements obtained using a Picarro L2140-i along with event-based precipitation isotope measurements during the JJAS 2024 season from Manali to assess below cloud rain-vapor interaction, and associated fractionation processes. Distinct intraseasonal variability is evident in the vapor isotope signals. Variations in local and regional meteorology, moisture recycling and the relative contributions of distinct moisture sources are investigated to account for the pronounced isotopic depletion observed during extreme rainfall and cloudburst events. A Lagrangian back-trajectory analysis is used to trace moisture sources associated with precipitation over Manali. We used the specific humidity–δ18O diagnostic diagrams, constrained by theoretical Rayleigh distillation curves and two-component mixing hyperbolas, to interpret the drivers of intraseasonal isotopic variability. Overall, this contribution highlights the utility of stable isotope analyses for improving process-based understanding of moisture sources, hydrological dynamics, and climate variability across the Himalayan region.

How to cite: Singh, A., Kumar, G., Ranjan, S., Leuenberger, M., and Dixit, Y.: Insights into Northwest Himalayan water cycle from continuous atmospheric water vapor and event-based rainwater isotopes  , EGU General Assembly 2026, Vienna, Austria, 3–8 May 2026, EGU26-18510, https://doi.org/10.5194/egusphere-egu26-18510, 2026.

While first estimates of the importance of below-cloud evaporation for reducing precipitation exist, the impact of this process on the atmospheric water vapour budget and on the downstream dynamics is largely unknown. Previous modeling work has indicated that below-cloud rain evaporation can account for about one-third of the moisture uptakes when a dry intrusion penetrates the subtropical boundary layer, emphasizing the importance of this process for re-moistening the atmosphere. Such internal moisture recycling plays a key role in feeding subsequent storm systems with moisture, particularly in dry regions.

We present an extension to an existing trajectory-based moisture source diagnostic (MSD), incorporating the moisture sources of precipitation and cloud evaporation. The extended MSD identifies increases in specific humidity along Lagrangian trajectories, categorizing the uptakes occurring in the presence of rain or snow as precipitation evaporation and the uptakes occurring in the presence of cloud liquid or ice water as cloud evaporation. In total, the methodology defines six uptake categories based on these hydrometeor types, mixing and the surface evaporation flux.
The extended MSD is evaluated for a 13-day test case in January/February 2018 over the North Atlantic, including three types of airstreams: a dry intrusion, a warm conveyor belt, and an adiabatic flow segment along the jet stream in the mid-latitudes. Physical consistency is then analysed from the model perspective using moisture tendency outputs from the microphysical, convective, and turbulent parameterisations of the Integrated Forecasting System (IFS) of the European Centre for Medium-Range Weather Forecasts (ECMWF). Since the moisture tendencies indicate which physical processes influenced the moisture budget, comparing them with moisture uptakes from the extended MSD allows verification of whether the MSD identifies these processes in a consistent way within the modeling framework. Potential discrepancies are addressed by defining physically meaningful thresholds for moisture uptake and rainout, constrained by multi-platform observations from the North Atlantic Waveguide, Dry Intrusion, and Downstream Impact Campaign (NAWDIC). Furthermore, different approaches for attributing moisture uptake to the newly introduced source categories are tested. These include methods based on the relative rain, snow, cloud liquid, and cloud ice water contents along the trajectories, as well as approaches that additionally account for Lagrangian changes in hydrometeor contents.

This analysis enables an assessment of the diagnostic’s ability to attribute moisture uptakes to specific processes, even when several act simultaneously. Ultimately, this development provides a necessary framework for quantifying the role of internal recycling processes in the atmosphere and assessing its role for downstream intensification of strongly precipitating airmasses such as in extratropical cyclones or mesoscale convective systems.

How to cite: Fasnacht, L., Brennan, K. P., and Aemisegger, F.: Quantifying precipitation and cloud re-evaporation: a novel Lagrangian diagnostic evaluated with field observations and moisture tendency outputs from numerical simulations, EGU General Assembly 2026, Vienna, Austria, 3–8 May 2026, EGU26-18920, https://doi.org/10.5194/egusphere-egu26-18920, 2026.

EGU26-19779 | ECS | Orals | AS1.17

Water isotopic composition above the North American and Asian Summer Monsoons provides a tracer of strong convective activity 

Benjamin Clouser, Carly KleinStern, Clare Singer, Adrien Desmoulin, Sergey Khaykin, Alexey Lykov, Silvia Viciani, Giovanni Bianchini, Francesco D'Amato, Silvia Bucci, Bernard Legras, Cameron Homeyer, Troy Thornberry, and Elisabeth Moyer

Moisture transport of Earth’s monsoon systems into the upper troposphere and lower stratosphere is poorly constrained, with implications for stratospheric chemistry and radiative budget. Water isotopes provide information on moisture transport pathways in Earth’s atmosphere, and both satellite and in situ measurements of D show enhancements of up to 50 per mille in the 15-19 km range above the North American monsoon relative to the Asian monsoon. This is indicative of differences in the life cycle and fate of convectively lofted ice in the monsoon system. Here we use data from the Chicago Water Isotope Spectrometer (ChiWIS), which flew aboard high-altitude aircraft in the Asian Monsoon center during the StratoClim (2017) campaign out of Nepal, in monsoon outflow during ACCLIP (2022) out of South Korea, and in the North American Monsoon in 2021 and 2022 out of Houston, to show that in situ measurements of the HDO/H2O isotopic ratio in these systems trace strong convective activity, which is processed differently between the monsoon systems after detrainment. Both campaigns sampled a broad range of convective and post-convective conditions, letting us trace how convective ice sublimates, reforms, and leaves behind characteristic isotopic signatures. We additionally use other tracers, isotopic models, along with TRACZILLA backtrajectories and convective interactions derived from radar and cloud-top products, to follow the evolving isotopic composition along flight paths in both campaigns and to asses the origins of the difference in isotopic signature.

How to cite: Clouser, B., KleinStern, C., Singer, C., Desmoulin, A., Khaykin, S., Lykov, A., Viciani, S., Bianchini, G., D'Amato, F., Bucci, S., Legras, B., Homeyer, C., Thornberry, T., and Moyer, E.: Water isotopic composition above the North American and Asian Summer Monsoons provides a tracer of strong convective activity, EGU General Assembly 2026, Vienna, Austria, 3–8 May 2026, EGU26-19779, https://doi.org/10.5194/egusphere-egu26-19779, 2026.

As Earth System Models (ESMs) move toward kilometer-scale grid spacing, resolving small-scale atmospheric processes substantially improves the representation of convection and precipitation. However, the land component remains a major source of uncertainty in the atmospheric water cycle. Inadequate soil moisture and groundwater representations affect evaporation, land–atmosphere coupling, and ultimately the atmospheric supply of water as precipitation. These hydrological biases therefore influence not only local surface conditions but also remote moisture transport and recycling. In this work, we improve the representation of subsurface hydrology in the JSBACH land surface model, coupled to the ICON atmospheric model. We introduce additional soil layers, implement lateral groundwater flow between grid cells, and connect shallow groundwater to the river network. We evaluate the new developments using standalone kilometer-scale JSBACH simulations against flux tower measurements of latent and sensible heat fluxes and soil moisture observations in the Pyrenees (Spain and France). We then assess their impact on atmospheric variables, specifically 2 m temperature and precipitation, within ICON simulations at 3-km grid spacing over Europe.

How to cite: Lalonde, M. and Prein, A. F.: Atmospheric Feedbacks to Improved Subsurface Hydrology in a km-Scale Earth System Model (ICON–JSBACH), EGU General Assembly 2026, Vienna, Austria, 3–8 May 2026, EGU26-2115, https://doi.org/10.5194/egusphere-egu26-2115, 2026.

Large-scale agricultural activities can intensify atmospheric–terrestrial interactions, of which precipitation recycling plays a critical role. During 1982–2018, irrigated area has dramatically expanded in Northwest China (NWC). In this study, a regional precipitation recycling model—the Brubaker model was used to investigate the precipitation recycling ratio (PRR) and recycled precipitation (RP). Evapotranspiration (ET) estimated by the atmospheric–terrestrial water balance method (A–T) was employed to investigate precipitation recycling. Statistically, there was a turning point in 2002 for the rate in irrigated area increase, from 0.07 × 10⁶ ha/year before 2002 to 0.217 × 10⁶ ha/year after 2002. There were significant shifts in ET, PRR, and RP in NWC, using the turning point of irrigated area expansion as the line of demarcation. The contribution of the change in irrigated area to PRR increased from 18.3% (1982–2002) to 22.9% (2003–2018) in NWC. Prior to 2002, enhanced RP offset the increased ET by 72.9%. After 2002, the positive effect of irrigated area expansion on precipitation recycling disappeared in NWC. Due to the different climate and irrigation practices at the province level, the variations in irrigated area and their contributions to PRR were examined in three provinces, Xinjiang, Gansu, and Shaanxi. Results based on the Brubaker model and Budyko framework indicate that in Xinjiang and Gansu, the contribution of the irrigated area change after the turning point to PRR were 24.5% and -95.6%, respectively, and there is no potential for continued expansion of irrigated area. In Shaanxi, however, there is potential for continued expansion of irrigated area. The methodology for quantifying the impact of irrigated area change on PRR provides reliable references for the sustainable use of cultivated land and the protection of agricultural water resources.

How to cite: Wang, X.: Improved understanding of how irrigated area expansion enhances precipitation recycling by land–atmosphere coupling, EGU General Assembly 2026, Vienna, Austria, 3–8 May 2026, EGU26-2498, https://doi.org/10.5194/egusphere-egu26-2498, 2026.

The Tibetan Plateau (TP), often termed the “Asian Water Tower”, is a critical reservoir and regulator of the Asian hydrological cycle. In recent decades, summer precipitation over the TP has exhibited a pronounced South Drying-North Wetting dipole pattern, with profound implications for regional water security and ecosystem stability. Both externally advected and internally recycled precipitation may contribute to this pattern. However, their respective roles and the extent to which anthropogenic forcing has shaped their contributions remain unclear. Here, we use the WAM2layers moisture-tracking model to partition TP summer precipitation into externally sourced and internally recycled components, and to quantify how changes in precipitation frequency and intensity shape the dipole. We find that the dipolar pattern is primarily driven by changes in externally sourced precipitation, which strengthens precipitation in the north while inducing drying in the south, with internally recycled precipitation further amplifying southern aridification. Specifically, increases in the frequency of externally sourced precipitation events lead to a plateau-wide precipitation increase. However, this effect is offset over the southern TP by a concurrent decline in event intensity, thereby shaping northward moistening associated with the externally sourced component. Meanwhile, the reduction of internally recycled precipitation in the southern TP is primarily attributable to a decrease in event frequency, while increases in the north result from simultaneous enhancements in both frequency and intensity. Mechanistically, a weakened subtropical westerly jet, due to spatially uneven emissions of anthropogenic aerosols, strengthens the dipole by enhancing externally sourced precipitation intensity over the northern plateau while suppressing it in the south. By contrast, negative phases of the Interdecadal Pacific Oscillation mainly reduce the frequency of internally recycled precipitation in the south. These findings reveal that anthropogenic forcing and natural variability jointly shape the TP summer precipitation dipole trend.

How to cite: Du, F., Li, C., He, X., and He, Y.: Moisture source partitioning reveals how human influence shapes the Tibetan Plateau summer precipitation dipole pattern, EGU General Assembly 2026, Vienna, Austria, 3–8 May 2026, EGU26-4622, https://doi.org/10.5194/egusphere-egu26-4622, 2026.

In the tropics, the land-ocean precipitation partitioning χ is skewed toward land. We analyze how CO2- and uniform sea surface temperature increase affect this partitioning. To do so, we use 15 years of global simulations conducted with the ICON model at 10 km horizontal grid spacing and explicitly resolved convection, unlike previous studies that parameterized convection. ICON produces a precipitation partitioning that is more consistent with observations compared to the AMIP6 ensemble. Under 4xCO2, precipitation partitioning toward land increases, whereas it decreases in +4K. We develop a framework based on energy and moisture budgets to decompose the response of the precipitation partitioning into contributions from the land column-integrated atmospheric heating, circulation efficiency, moisture cycling, and tropical radiative cooling. In ICON and the AMIP6 ensemble, the land's column-integrated atmospheric heating is identified as the primary driver of changes in precipitation partitioning. This is a result of the change in land moisture convergence and land precipitation in response to circulation adjustments driven by land-sea asymmetries in atmospheric heating. The response of the controlling factors are similar in ICON and in the AMIP6 ensemble, apart from two qualitative differences. First, the land's circulation efficiency is more stable in ICON than in AMIP6, which we interpret to be due to a stronger coupling of precipitation to surface heat fluxes in AMIP6. Secondly, the opposing response in χ  upon 4xCO2 and +4K are virtually equal in magnitude in ICON, whereas in AMIP6 χ decreases more in +4K than it increases in 4xCO2. These findings suggest that coarse-resolution GCMs may overestimate the predicted decrease in land precipitation under global warming.

How to cite: Schulz, M.: The Response of Tropical Land-Ocean Precipitation Partitioning to SST and CO2 increase in Global Storm Resolving Simulations, EGU General Assembly 2026, Vienna, Austria, 3–8 May 2026, EGU26-6701, https://doi.org/10.5194/egusphere-egu26-6701, 2026.

EGU26-6959 | PICO | HS7.9

Global trends in atmospheric dryness dominated by Clausius-Clapeyron scaling 

Tejasvi Ashish Chauhan, Sarosh Alam Ghausi, and Axel Kleidon

Atmospheric dryness, often quantified by Vapor Pressure Deficit (VPD) or Relative Humidity (RH), is a prominent variable for terrestrial water and carbon cycles. While global warming is widely expected to amplify atmospheric dryness, the physical drivers governing this intensification and its regional variations remain poorly understood. Here we analytically decompose trends in daily maximum VPD and minimum RH into contributions from three key factors: the Clausius-Clapeyron temperature sensitivity of saturation vapor pressure, the diurnal temperature range (reflecting daily heat storage changes in lower atmosphere), and the proximity to saturation of the atmosphere at night (defined as the difference between minimum temperature and the dew point). Applying this framework to long-term observations from FLUXNET and ERA5 reanalysis reveals that Clausius-Clapeyron scaling is the dominant driver of global atmospheric drying trends. In addition, we find that regional variations in drying trends between arid and humid regions primarily come from contrasting trends in nighttime atmospheric dryness. This regionally asymmetric response amplifies dryness trends in arid regions while dampens it in humid regions, aligning with the "dry-gets-drier, wet-gets-wetter" paradigm under future climate change. Our analytical framework helps explain observed spatial heterogeneity in atmospheric drying trends and also offers a new pathway for evaluating its representations in climate models.

How to cite: Chauhan, T. A., Ghausi, S. A., and Kleidon, A.: Global trends in atmospheric dryness dominated by Clausius-Clapeyron scaling, EGU General Assembly 2026, Vienna, Austria, 3–8 May 2026, EGU26-6959, https://doi.org/10.5194/egusphere-egu26-6959, 2026.

Atmospheric rivers (ARs) efficiently transport moisture from tropical and/or subtropical regions to middle and high latitudes, serving not only as the most important global poleward moisture transport belts but also as one of the primary causes of extreme precipitation and flooding in many parts of the world. Research on ARs in East Asia started relatively late; however, due to the region’s unique climatic characteristics, the manifestations of ARs differ from those in regions such as North America. In recent years, studying the lifecycle characteristics of consecutive AR events has become increasingly important. Nevertheless, on a climatic timescale, the moisture origins and transport processes during consecutive AR events in East Asia remain poorly understood, which is critical for understanding the genesis and sustenance of such events. In this study, the ERA5 reanalysis data from 1980 to 2024 were used to extract a dataset of consecutive AR events that made landfall in East Asia during this period, based on which the basic climatic characteristics of AR lifecycles were analyzed. Furthermore, this research focuses on the moisture sources and transport processes of ARs, employing an extended dynamic moisture recycling model specifically designed for tracking moisture in consecutive ARs to conduct a detailed quantitative analysis of the moisture budget during the lifecycle of ARs affecting East Asia. The findings reveal that ARs impacting East Asia typically originate from the Bay of Bengal to southwestern China and dissipate over the Yangtze–Huai River region, the Korean Peninsula, and Japan. The moisture contributing to ARs in East Asia mainly originates from the Indian Ocean, the Western Pacific, and high-latitude Eurasian regions, with the most significant contributions coming from the Arabian Sea, the Bay of Bengal, the Western Pacific, and terrestrial areas in eastern China. Notably, the moisture contribution from land areas in East Asia, particularly South China, is crucial for sustaining and transporting moisture during the AR lifecycle, highlighting the reliance of consecutive AR events on moisture transport from mid- and even high-latitude regions.

How to cite: Hua, L. and Zhong, L.: Quantitative Analysis of Moisture Budget in the Lifecycle of Consecutive Atmospheric River Events Affecting East Asia, EGU General Assembly 2026, Vienna, Austria, 3–8 May 2026, EGU26-8606, https://doi.org/10.5194/egusphere-egu26-8606, 2026.

EGU26-9037 | PICO | HS7.9 | Highlight

Future trajectories of terrestrial moisture recycling 

Arie Staal, Chiel Lokkart, Xi Cai, Merwin Slagter, and Nico Wunderling

Roughly half of continental precipitation originates from terrestrial evaporation in upwind regions, yet how these land–atmosphere moisture connections will evolve under climate and land-cover change remains poorly constrained. Earth System Models (ESMs) simulate future precipitation, evaporation, and atmospheric circulation, but they do not explicitly resolve the pathways linking evaporation to downwind precipitation. These pathways can, however, be reconstructed from ESM outputs using moisture tracking.

Here we present different forward- and backward-tracking experiments with the Lagrangian atmospheric moisture tracking model UTrack, forced by multiple CMIP6 ESMs, that quantify future changes in terrestrial moisture recycling across Shared Socioeconomic Pathways (SSP1-2.6, SSP2-4.5, SSP3-7.0 and SSP5-8.5) throughout the 21st century. Across models and scenarios, we find an average weakening of terrestrial moisture recycling with warming, with the strongest declines occurring in drying hotspots. In the Amazon rainforest specifically, we find that combined climate change and deforestation may trigger cascading forest transitions mediated by moisture recycling.

We further present results from experiments that investigate whether large-scale ecosystem restoration globally and regionally can counteract specific drying trends through targeted precipitation enhancement.

Our results show that climate change will not only modify precipitation patterns, but will reorganize the continental origins of that precipitation, indicating both future risks for water-stressed ecosystems as well as the potential of ecosystem restoration to mitigate those risks.

How to cite: Staal, A., Lokkart, C., Cai, X., Slagter, M., and Wunderling, N.: Future trajectories of terrestrial moisture recycling, EGU General Assembly 2026, Vienna, Austria, 3–8 May 2026, EGU26-9037, https://doi.org/10.5194/egusphere-egu26-9037, 2026.

The Northern Sandy Belt, a key ecological barrier and fragile zone in China, has its regional sustainable development determined by the coordination status of its water and soil resources system. This study takes the Horqin-Hunshandake Sandy Area as the research object. Based on data from 2006 to 2022, we established an adaptive evaluation system consisting of 18 indicators, and combined the coupling coordination degree model with Tobit regression to reveal the evolutionary characteristics and influencing mechanisms of the system’s coupling coordination. The results show that:(1) During the study period, the coupling coordination degree showed a fluctuating upward trend, rising from 0.367 in 2009 to 0.602 in 2021. The coordination status shifted from mild imbalance to basic coordination, but its stability was insufficient, with significant declines in 2017, 2019, and 2022;(2) There was significant spatial differentiation: Tongliao City had the highest and most stable coordination level, while Hinggan League had the lowest, and Xilingol League experienced the most drastic fluctuations. Regional differences are closely linked to the natural background and socio-economic patterns;(3) The system development exhibited phased transitions: the water resources system dominated from 2006 to 2014, while the contribution of the land resources system increased from 2015 to 2022;(4) Annual precipitation had a significant positive promoting effect on the coupling coordination degree, while annual water consumption had a significant negative inhibiting effect; population pressure indirectly affected the system balance through resource demand.

This study indicates that water resources are the core constraint for the development of the Northern Sandy Belt, and exceeding the carrying capacity will lead to system imbalance. For future development, it is necessary to adhere to the principle of "determining land use and production based on water availability", strengthen rigid constraints on water resources, implement differentiated management, and build a monitoring and early warning system to achieve sustainable development. This study provides a scientific basis for the optimal allocation of regional water and soil resources and ecological management.

How to cite: Wang, K.: Research on the Coupling Coordination Degree andInfluencing Mechanisms of the Water and Soil ResourcesSystem in the Northern Sandy Belt, EGU General Assembly 2026, Vienna, Austria, 3–8 May 2026, EGU26-9803, https://doi.org/10.5194/egusphere-egu26-9803, 2026.

EGU26-10910 | ECS | PICO | HS7.9

Climatological Drivers of Pan Evaporation in the Riau Islands, Indonesia 

Miranda Anjelina Parhusip, Miranda Putri Permatasari, and Shien-Tsung Chen

Pan evaporation (Epan) is widely used as an indicator of atmospheric evaporative demand and plays an important role in understanding land-atmosphere interactions under climate variability. However, observed changes in Epan do not always follow the expected increase with rising temperature, a phenomenon known as the pan-evaporation paradox. The relative influence of climatological drivers on Epan remains particularly uncertain in humid equatorial regions, where high moisture availability may alter the controls on evaporation. This study examines pan evaporation and associated climatological variables in Riau Island, Indonesia. Temporal trends are assessed using the Trend-Free Pre-Whitening Mann–Kendall test, while Spearman correlation analysis is applied to evaluate the relationships between Epan and key climatic factors, including solar radiation duration, relative humidity, precipitation, wind speed, and air temperature. The results show that correlation analysis indicates that Epan is strongly and positively associated with solar radiation duration and negatively associated with relative humidity and precipitation. Wind speed shows a moderate positive relationship with Epan, while temperature variables exhibit weaker associations. Trend analysis further shows that minimum temperature exhibits a statistically significant increasing trend, whereas wind speed displays a statistically significant declining trend. In contrast, pan evaporation does not exhibit a statistically significant long-term trend. Overall, the findings suggest that pan evaporation variability in humid equatorial climates is primarily governed by radiative and moisture-related controls rather than temperature alone. The opposing effects of increasing temperature and declining wind speed likely contribute to the statistically insignificant long-term trend in pan evaporation observed, providing observational insight into evaporation dynamics under humid tropical conditions.

How to cite: Parhusip, M. A., Permatasari, M. P., and Chen, S.-T.: Climatological Drivers of Pan Evaporation in the Riau Islands, Indonesia, EGU General Assembly 2026, Vienna, Austria, 3–8 May 2026, EGU26-10910, https://doi.org/10.5194/egusphere-egu26-10910, 2026.

Extreme precipitation associated with landfalling tropical cyclones poses major forecasting challenges, particularly over complex terrain. This study investigates the sensitivity of simulated hurricane rainfall to microphysics parameterization and horizontal resolution using the Weather Research and Forecasting (WRF) model for Hurricane Melissa, a Category 5 storm that made historic landfall over Jamaica in October 2025 and produced rainfall exceeding 1,000 mm in mountainous regions. Four WRF simulations were conducted using two commonly applied microphysics schemes, WSM6 (single-moment) and Morrison (double-moment), across two domain configurations: a single 9 km grid covering the Caribbean basin and a nested configuration with a 3 km convection-permitting inner domain centered over Jamaica. Model outputs were evaluated against satellite-based precipitation estimates from IMERG and CHIRPS. Results suggest that horizontal resolution strongly controls the spatial pattern of simulated precipitation. The 3 km nested simulations capture sharper gradients, localized maxima, and more physically consistent rainfall structures compared to the smoother and more diffuse patterns produced at 9 km resolution. Differences between microphysics schemes are secondary to resolution but remain evident, with the Morrison scheme producing more coherent and structured precipitation fields, while WSM6 generates more fragmented and spatially patchy rainfall. All simulations accurately reproduce the timing of peak precipitation during landfall, indicating weak sensitivity of storm evolution to microphysics choice. However, total rainfall amounts vary substantially across configurations, with convection-permitting simulations producing significantly higher accumulations. These totals exceed CHIRPS estimates, likely due to the underestimation tendency of extreme precipitation in complex terrain by CHIRPS, while agreement with IMERG varies by location and intensity. These findings highlight that accurate representation of extreme tropical cyclone precipitation requires convection-permitting resolution, while rainfall intensity remains sensitive to both microphysics selection and observational reference datasets.

How to cite: Muna, T. S., Miller, P. W., and Bushra, N.: Sensitivity of Extreme Hurricane Precipitation to WRF Microphysics and Grid Spacing: Hurricane Melissa (2025) Landfall over Jamaica, EGU General Assembly 2026, Vienna, Austria, 3–8 May 2026, EGU26-15243, https://doi.org/10.5194/egusphere-egu26-15243, 2026.

EGU26-18321 | ECS | PICO | HS7.9

Deep root vegetation adaptations to drought and their modulation of evapotranspiration (ET) in Africa 

Dana Romera-Otero and Gonzalo Míguez-Macho
Soil moisture exerts a strong influence on the surface energy balance, boundary layer development, convection, and precipitation, particularly in climates with seasonal drought where ET is water-limited. Lacking precipitation and surficial water sources, vegetation develops deep roots to access subsurface moisture stores from past precipitation or groundwater, effectively coupling the atmosphere to these slowly varying water reservoirs. Here we focus on Africa and ask how vegetation deep rooting systems over seasonally dry climates like those in the savannas modulate land surface fluxes, particularly during the transition from dry to wet seasons. We use the Noah-MP model with a newly implemented deep rooting scheme coupled to the MMF groundwater scheme and perform off-line simulations over Africa, comparing results with the default version with 2m soil columns and fixed roots depending on vegetation class- an approach still used by most land surface models. Atmospheric forcing is from ERA5.
Our results reveal that vegetation has a greater influence on ET fluxes across much of the African continent than most models assume, which can have implications for our current understanding of soil moisture-precipitation interaction in this well known hot-spot for land-atmosphere coupling.

How to cite: Romera-Otero, D. and Míguez-Macho, G.: Deep root vegetation adaptations to drought and their modulation of evapotranspiration (ET) in Africa, EGU General Assembly 2026, Vienna, Austria, 3–8 May 2026, EGU26-18321, https://doi.org/10.5194/egusphere-egu26-18321, 2026.

EGU26-18978 | ECS | PICO | HS7.9

Irrigation boosts precipitation on cropland for international trade through atmospheric moisture transport 

Elena De Petrillo, Marta Tuninetti, Luca Ridolfi, and Francesco Laio

Agriculture accounts for approximately 70% of global freshwater withdrawals, while around 20% of global cropland is irrigated and supports nearly 40% of total crop production. In an increasingly globalized food system, up to one-third of this production is traded internationally, redistributing the water embedded in crop production, i.e., virtual water, from producing to importing countries. Previous studies have extensively assessed the hydrological and socio-economic impacts of freshwater withdrawals embedded in food trade, focusing on both surface and groundwater resources. However, how irrigation contributes to agricultural production and consequent virtual water exports when returns on land as precipitation through atmospheric transport, is currently unexplored.

This study addresses this gap by quantitatively assessing to what extent irrigation for primary crop production in one country contributes to precipitation in other countries and how this precipitation subsequently supports crop production and trade. The methodology integrates agro-hydrological modelling of the crop evapotranspiration attributable to irrigation with harmonized bilateral datasets on atmospheric moisture transport and virtual water trade.

Specifically, we use the agro-hydrological model waterCROP to estimate the blue water demand associated with 167 primary crops, scaling total virtual water volumes from the CWASI database to blue virtual water flows. These estimates are coupled with atmospheric moisture tracking data from the RECON dataset, a processed version of the Lagrangian output of the UTrack model reconciled with ERA5 reanalysis data for the period 2008–2017. The analysis is conducted at the global scale for the representative year 2013, ensuring consistency between atmospheric moisture flows and virtual water trade datasets.

By coupling these bilateral networks, we construct a new set of water teleconnections that explicitly links agricultural water use to atmospheric moisture transport, precipitation, crop production, and trade. Within this framework, we assess how irrigation in one country contributes to precipitation in other countries, and if this contribution alleviates, compensates, or worsens the need for freshwater withdrawals. This allows us to identify synergies and trade-offs in the geographic redistribution of precipitation originating from irrigation and the associated water use embedded in the international trade of crops.

By revealing how the precipitation originated from the evapotranspiration of irrigated crops contributes to agricultural production beyond national borders, the analysis highlights previously overlooked feedbacks between water use, atmospheric moisture transport, and food trade.


How to cite: De Petrillo, E., Tuninetti, M., Ridolfi, L., and Laio, F.: Irrigation boosts precipitation on cropland for international trade through atmospheric moisture transport, EGU General Assembly 2026, Vienna, Austria, 3–8 May 2026, EGU26-18978, https://doi.org/10.5194/egusphere-egu26-18978, 2026.

EGU26-2818 | ECS | Posters on site | AS1.19

How Cyclone Dynamics Shape Hydroclimate Trends in the Mediterranean 

Yonatan Givon, Douglas Keller, Philippe Drobinski, and Shira Raveh-Rubin

Mediterranean cyclones (MCs) are major drivers of the Mediterranean hydrological cycle (MHC), contributing up to ~70 % of regional precipitation and a substantial fraction of evaporation. Their role in regional water and energy budgets is disproportionately large relative to their spatiotemporal frequency. Despite this importance, the diversity of cyclogenesis mechanisms and their contrasting influences on key components of the hydrological and oceanic systems remain poorly understood, limiting our ability to interpret past variability and anticipate future changes in a warming climate.

In this study, we leverage a process-based classification of Mediterranean cyclones applied to 1-hourly ERA5 reanalysis tracks (1979–2020) to systematically quantify the contribution of different cyclone types to the hydrological cycle and to Mediterranean Sea heat content. The classification separates cyclones by their dominant dynamical drivers — including double-jet, daughter cyclones, thermal lows, and other mechanisms — and enables the decomposition of their individual precipitation (P) and surface evaporation (E) contributions along each cyclone track.

Our results reveal that while MCs produce a net positive annual P − E contribution over the Mediterranean, this residual has declined over recent decades. Importantly, distinct cyclone drivers exert opposing effects on hydrological and heat budgets: precipitation associated with dynamic-driven cyclones (e.g., double-jet systems) has decreased, whereas thermally driven cyclones (e.g., heat lows) have become more frequent and have enhanced evaporation. These divergent trends shift the basin-scale balance toward greater evaporative influence, with implications for regional moisture recycling and drought risk.

We further examine how the different cyclone drivers affect the ocean heat content — a key component of Mediterranean climate feedbacks — demonstrating that while most cyclones act to cool the surface by drawing heat from the ocean, some cyclone types tend to add heat to the upper ocean, generating substantial variability in the direction and magnitude of cyclone-induced air–sea exchanges.

By linking cyclone dynamics, hydrological impacts, and ocean heat content responses in a unified framework, this study advances the understanding of how different cyclogenetic processes modulate regional water and energy cycles. It underscores the importance of explicitly accounting for cyclone diversity when diagnosing Mediterranean hydroclimate variability and projecting future changes — a critical step toward improving risk assessments and adaptation strategies in this climate-sensitive region.

How to cite: Givon, Y., Keller, D., Drobinski, P., and Raveh-Rubin, S.: How Cyclone Dynamics Shape Hydroclimate Trends in the Mediterranean, EGU General Assembly 2026, Vienna, Austria, 3–8 May 2026, EGU26-2818, https://doi.org/10.5194/egusphere-egu26-2818, 2026.

Classically, for extratropical weather systems the importance of diabatic effects such as surface fluxes, phase changes of water in clouds, and radiation, has been regarded as secondary compared to the dry dynamical processes. Research during recent decades has modified this view of the role of diabatic processes. A combination of complementary research approaches has revealed that the nonlinear dynamics of extratropical cyclones and upper-tropospheric Rossby waves is affected – in some cases strongly – by diabatic processes. Despite the violation of material potential vorticity (PV) conservation in the presence of diabatic processes, the concept of PV has been of utmost importance to identify and quantify the role of diabatic processes and to integrate their effects into the classical understanding based on dry dynamics.

This presentation will outline the rapid recent progress that has demonstrated how diabatic effects, in particular those related to cloud microphysics, can affect the structure, dynamics, and predictability of extratropical cyclones and Rossby waves. The development of sophisticated diagnostics, growing applications of the Lagrangian perspective, real-case and idealised numerical experiments, and dedicated field experiments have been fundamental to this progress. The presentation will conclude by highlighting important implications of this new understanding of the role of diabatic processes for the broader field of weather and climate dynamics, gaps and the prospects of future progress.

How to cite: Gray, S. L. and Wernli, H.: The importance of diabatic processes for the dynamics of synoptic-scale extratropical weather systems, EGU General Assembly 2026, Vienna, Austria, 3–8 May 2026, EGU26-2977, https://doi.org/10.5194/egusphere-egu26-2977, 2026.

EGU26-3086 | ECS | Posters on site | AS1.19

Modeling storm damage risk in Germany 

Rike Lorenz, Andreas Trojand, Uwe Ulbrich, and Henning Rust

Extratropical cyclones generate high societal costs across Europe, prompting numerous studies that aim to model their economic impacts. The majority of existing building damage models are limited to the maximum wind gust as their sole predictor, applied either directly or through a derived metric (e.g., the cubic exceedance of the 98th percentile). When these models are applied to insurance loss data on the district level for Germany, the resulting spatial patterns are counter‑intuitive: the highest modeled vulnerability appears in coastal regions that are typically best adapted to wind risk, while the lowest vulnerability is found in areas with the weakest adaptation pressure. This discrepancy raises doubts about the adequacy of the current modelling approach.

In our study we employ a Generalized Additive Model (GAM) based on logistic regression to estimate storm damage risk for Germany. The model is trained with ERA5 meteorological variables and daily monetary damage data ranging from 1997 to 2023 supplied by the German Insurance Association (GDV) for the 400 German districts. Beyond the daily maximum gust speed, we test additional predictors, including daily maximum instantaneous wind speed, gust factor (the ratio of maximum gust speed to maximum wind speed), storm duration and precipitation amount.

Wind speed improves model skill relative to gust speed and produces vulnerability maps that better align with expectations based on societal adaptation patterns. A model that combines wind speed, gust factor, and storm duration yields the highest predictive performance, while precipitation adds no value. Although ERA5 wind speed and gust speed are highly correlated under normal conditions, this correlation weakens significantly during storm events. Consequently, we argue that both wind speed and gust speed variables should be retained in storm damage models. Using the extended model, we identify the districts in central Germany as the most vulnerable to storm damage, overturning the earlier, coastal‑biased results. Our findings demonstrate that relying solely on maximum gust speed overlooks important aspects of storm impacts. Incorporating multiple storm characteristics, particularly wind speed, gust factor, and duration, significantly enhances the explanatory skill of damage models.

In the future we plan to apply this damage model to climate model output data to assess projected storm damage risks under future climate scenarios.

How to cite: Lorenz, R., Trojand, A., Ulbrich, U., and Rust, H.: Modeling storm damage risk in Germany, EGU General Assembly 2026, Vienna, Austria, 3–8 May 2026, EGU26-3086, https://doi.org/10.5194/egusphere-egu26-3086, 2026.

EGU26-3416 | ECS | Orals | AS1.19

Extreme cyclones in the western Mediterranean under future climate change 

Onno Doensen, Martina Messmer, Edgar Dolores-Tesillos, and Christoph Raible

The Mediterranean storm track is characterized by small but intense cyclones that can cause extreme weather events across the western Mediterranean (WMED). Thus, the aim of this study is to investigate the impact of future climate change on extreme wind, precipitation and compounding cyclones. We use a regional climate model simulation that simulates pre-industrial conditions (1821-1880) and future conditions under the representative concentration pathway RCP8.5 (2039-2098). We show that mean cyclone frequency is reduced by roughly a third in the WMED by the end of the 21st century in our simulation. For precipitation-type extreme cyclones (EXCs), future projections show increased precipitation during and after their most intense phase. During the mature phase of future precipitation EXCs, increased diabatic potential vorticity production contributes to cyclone intensity. Precipitation EXCs also appear to become more baroclinic. Wind speed EXCs are also set to become more extreme under future RCP8.5 conditions. The reason for this intensification is that wind speed EXCs are located in the left exit of a jet streak, which strengthens in the future. This provides more lift for future wind speed EXCs. For both future wind speed and precipitation EXCs, these processes also lead to a lower core pressure. Thus, we find that despite a general reduction of cyclones, precipitation and wind speed EXCs intensify in the future, implying strong socio-economic consequences for the WMED.

How to cite: Doensen, O., Messmer, M., Dolores-Tesillos, E., and Raible, C.: Extreme cyclones in the western Mediterranean under future climate change, EGU General Assembly 2026, Vienna, Austria, 3–8 May 2026, EGU26-3416, https://doi.org/10.5194/egusphere-egu26-3416, 2026.

EGU26-4918 | Posters on site | AS1.19

Trends in Severe Convective Storm Activity over Europe (1983–2024) 

Andrzej Kotarba

Severe convective storms are among the most damaging natural hazards worldwide, with insured losses reaching tens of billions of US dollars annually. All severe convective storms originate from deep convective clouds (DCCs), making DCC occurrence a suitable proxy for assessing long-term changes in severe storm activity. However, robust observational evidence of DCC trends over Europe remains limited.

This study investigates long-term trends in DCC frequency over Europe during 1983–2024. We use observations from the Meteosat satellite series, combining data from the first-generation Meteosat Visible and Infrared Imager (MVIRI) and the second-generation Spinning Enhanced Visible and Infrared Imager (SEVIRI). The analysis is based on two spectral channels: the water vapour absorption channel centered near 6.5 µm and the infrared window channel centered near 11 µm. Satellite observations are complemented with atmospheric fields from the ERA5 reanalysis.

To ensure temporal homogeneity between sensors, spectral band adjustments were applied using correction functions derived from Infrared Atmospheric Sounding Interferometer observations. Parallax correction was performed using a cloud-top height estimation method based on infrared brightness temperatures combined with ERA5 temperature data. A Meteosat pixel was classified as a DCC when the brightness temperature difference between the water vapour and infrared window channels exceeded 2.5 K, a threshold established through validation with CloudSat–CALIPSO and Moderate Resolution Imaging Spectroradiometer observations. Additionally, convective available potential energy (CAPE) from ERA5 was required to exceed 500 J/kg.

The results reveal two distinct regional patterns of DCC frequency trends across Europe. Central and Western Europe exhibit positive trends, reaching up to 0.001 per decade in the annual mean, with the strongest increases observed over northern Italy and eastern Austria. The increase is most pronounced during boreal summer (June–August), with trends up to 0.004 per decade, while no significant trends are detected during other months. In contrast, negative trends occur over western France, the Iberian Peninsula, and the Mediterranean Sea, with annual mean decreases reaching −0.004 per decade. In these regions, the sign of the trend varies substantially between individual months.

Due to the relatively short time series and the low frequency of DCC occurrence, only the strongest trends are statistically significant (p < 0.05). Nevertheless, although the absolute trend magnitudes appear small, DCCs are rare phenomena, and the observed changes correspond to relative increases of approximately 10–25% in DCC frequency in parts of Europe. These findings indicate a potentially meaningful increase in severe convective storm risk under ongoing climate change.

This research was funded by the National Science Centre of Poland, grant no. UMO-2020/39/B/ST10/00850.  We gratefully acknowledge Polish high-performance computing infrastructure PLGrid (HPC Centers: ACK Cyfronet AGH) for providing computer facilities and support within computational grant no. PLG/2025/018115

How to cite: Kotarba, A.: Trends in Severe Convective Storm Activity over Europe (1983–2024), EGU General Assembly 2026, Vienna, Austria, 3–8 May 2026, EGU26-4918, https://doi.org/10.5194/egusphere-egu26-4918, 2026.

EGU26-5499 | ECS | Orals | AS1.19

Diabatic processes in very long summer Arctic cyclones 

Myriam Besson, Gwendal Rivière, and Sébastien Fromang

Arctic cyclones are synoptic-scale atmospheric low pressure systems that spend the largest part of their lifetime in the Arctic region. As they are associated with strong surface winds and precipitation, their impacts can be important on local populations or ecosystems. In summer, Arctic cyclones can be quite long and are typically cold-core cyclones associated to a tropopause polar vortex above them. Some of these cyclones last more than a month during which their interaction with sea ice might be damaging by enhancing its melting, that is why a focus was made in the recent years on these extremes. The reasons for the longevity of such cyclones are not clear yet and motivate the present study. Our approach consists in studying a single Arctic cyclone of August 2022 as an example and then tracking all summer Arctic cyclones in ERA5 reanalysis. The tracks are separated into different categories (cold-core vs. warm-core or long vs. short) using a newly developed cyclone phase space. Processes maintaining or destroying the structure of the different categories of cyclones are investigated by performing an energetic budget and a potential vorticity (PV) budget. A particular attention is paid on diabatic and frictional processes maintaining or destroying PV at different levels. 

How to cite: Besson, M., Rivière, G., and Fromang, S.: Diabatic processes in very long summer Arctic cyclones, EGU General Assembly 2026, Vienna, Austria, 3–8 May 2026, EGU26-5499, https://doi.org/10.5194/egusphere-egu26-5499, 2026.

EGU26-5565 | ECS | Orals | AS1.19

Extratropical cyclone energetics modulated by ocean meanders 

Félix Vivant and Guillaume Lapeyre

Extratropical cyclones primarily develop over the western parts of ocean basins, where strong sea surface temperature (SST) contrasts form along western boundary currents such as the Gulf Stream in the Atlantic. These ocean currents are known to intensify extratropical cyclones by supplying moisture to the atmosphere through surface evaporation, which contributes to the diabatic heating associated with cloud formation and precipitation. While previous studies have highlighted the influence of the mean SST and SST gradient on cyclones developing over these currents, they have generally disregarded their meandering nature. Using idealized simulations, we examine the sensitivity of cyclone development to SST meanders of varying size through an analysis of the energy budget. In particular, we show that the moisture supply provided by warm SST anomalies associated with ocean meanders triggers diabatic heating a few hours later within storms. Both the size and phase of meanders relative to the cyclone modulate this energetic response. Such results reveal that not only the SST gradient but also the SST front geometry affect the life cycle of extratropical cyclones. Overall, our analysis provides insights into mechanisms of ocean-atmosphere interaction at the synoptic scale that, integrated over time, may have a noticeable impact on storm tracks at the climatological scale.


Reference: Vivant, F., Lapeyre, G. Meandering ocean currents modulate mid-latitude storm energetics (under review). https://doi.org/10.22541/essoar.175696970.05317808/v1.

How to cite: Vivant, F. and Lapeyre, G.: Extratropical cyclone energetics modulated by ocean meanders, EGU General Assembly 2026, Vienna, Austria, 3–8 May 2026, EGU26-5565, https://doi.org/10.5194/egusphere-egu26-5565, 2026.

EGU26-6779 | ECS | Posters on site | AS1.19

Spatial clustering of severe European winter windstorms on intra-seasonal timescales 

Sophie Feltz, Elena Bianco, Christopher Allen, Tim Kruschke, Michael Angus, Andrew Quinn, and Gregor Leckebusch

European winter windstorms are one of the most damaging natural hazards in Europe, and when these severe windstorms cluster in time, economic losses and environmental damages are amplified. Our previous analysis on the behaviour of European winter (DJF) windstorms clustering on shorter intra-seasonal timescales revealed distinct intra-seasonal temporal behaviour, where, depending on location, two clear periods of enhanced clustering are identified, one at the middle and one at the end of the season. Here, we investigate the spatial development characteristics of these cyclones (associated with the windstorms) and examine their intra-seasonal variation. To cluster cyclones with similar spatial development characteristics, we first applied dimension reduction via PCA to ERA5 1000 hPa 3-day development fields, then performed k-means cluster analysis as in Leckebusch et al. (2008b).

K-means ‘primary storm clusters’ that contain the highest relative frequency of European windstorms are identified. Further investigation of these primary storm clusters reveals 5 primary storm clusters that show distinct spatially varying windstorm footprint occurrences, which have resulted from a similar grouping of 3-day development fields. For example, among these 5 primary storm clusters, we can make distinctions between the 3-day development fields more likely to give rise to windstorms over Western Central Europe vs Scandinavia. We also reveal depending on the time within the winter season, certain k-clusters contribute more than others, specifically during the 2 periods of enhanced temporal clustering.

How to cite: Feltz, S., Bianco, E., Allen, C., Kruschke, T., Angus, M., Quinn, A., and Leckebusch, G.: Spatial clustering of severe European winter windstorms on intra-seasonal timescales, EGU General Assembly 2026, Vienna, Austria, 3–8 May 2026, EGU26-6779, https://doi.org/10.5194/egusphere-egu26-6779, 2026.

EGU26-7050 | ECS | Posters on site | AS1.19

What favours the midlatitude survival of cyclones of tropical origin (CTOs)?  

Elena Bianco, Kelvin Ng, and Gregor Leckebusch

Cyclones of tropical origin (CTO) occasionally propagate to the midlatitudes, posing a significant hazard to regions that are unaccustomed to hurricane-force winds and extreme precipitationNotable examples of CTOs that have significantly impacted Europe are Ophelia (2017), Lili (1996), and Leslie (2018). Given the rarity of these types of CTOs, the physical mechanisms that influence their formation, motion, and extra-tropical transition are poorly understood, complicating predictability and disaster risk response. In particular, the processes that enable the survival of CTOs in the midlatitudes are highly uncertain. Previous studies have suggested that the steering and intensification of CTOs is strongly modulated by the interaction with the background atmospheric circulation, but evidence is limited to few remarkable historical examples. In this study, we leverage ensemble hindcasts to construct a large, physically consistent set of plausible CTO events originating in the Atlantic Ocean that recurve eastward and reach the midlatitudesSecondly, we apply a trough detection algorithm (Schemm et al. 2020) to investigatwhether the interaction between cyclones and troughs plays any role in favouring or inhibiting CTO survival in the midlatitudes. The large volume of data provided by ensemble hindcasts is crucial for reducing uncertainty and advancing our understanding of the processes that may lead to CTO impacts in Europe, including how these processes may evolve under anthropogenic forcing. 

How to cite: Bianco, E., Ng, K., and Leckebusch, G.: What favours the midlatitude survival of cyclones of tropical origin (CTOs)? , EGU General Assembly 2026, Vienna, Austria, 3–8 May 2026, EGU26-7050, https://doi.org/10.5194/egusphere-egu26-7050, 2026.

EGU26-7271 | ECS | Posters on site | AS1.19

Thermodynamic drivers intensify future European frontal precipitation extremes, while frontal dynamics remain largely unchanged 

Armin Schaffer, Albert Ossó, and Douglas Maraun

Atmospheric fronts are a key driver of intense and extreme precipitation across the mid-latitudes, which is projected to increase under global warming. Understanding the physical drivers of these changes is essential to improve confidence in climate projections.

Here, we analyze projected seasonal changes in heavy and extreme frontal precipitation events over Europe using the CMIP6 and EURO-CORDEX ensembles, combining event frequency analysis with frontal composite cross-sections to assess underlying thermodynamic and dynamic processes.

First, we evaluate the representation of fronts in the CMIP6 and EURO-CORDEX ensembles, using ERA5 as a reference. While synoptic-scale conditions are well represented across models, mesoscale gradients and circulation patterns exhibit a pronounced sensitivity to grid spacing, especially impacting the representation of cold fronts and their associated precipitation.

Future projections show an increase in the number of heavy frontal precipitation events by up to 50 % per degree of global warming, while extreme events more than double per degree. Large-scale circulation changes account for most regional reductions in frontal extremes, but contribute only weakly to the widespread increases. Thermodynamic changes, however, dominate the intensification of extremes. Increases in specific humidity are the primary driver of more intense events, while changes in the frontal circulation are minimal, likely because a more stable atmosphere counteracts potential strengthening from enhanced latent heat release.

These results highlight the dominant role of thermodynamic processes in future frontal precipitation extremes and underscore the importance of adequately resolving mesoscale frontal features in climate models.

How to cite: Schaffer, A., Ossó, A., and Maraun, D.: Thermodynamic drivers intensify future European frontal precipitation extremes, while frontal dynamics remain largely unchanged, EGU General Assembly 2026, Vienna, Austria, 3–8 May 2026, EGU26-7271, https://doi.org/10.5194/egusphere-egu26-7271, 2026.

EGU26-7768 | ECS | Posters on site | AS1.19

The impact of secondary ice production on the dynamics of extratropical cyclones 

Behrooz Keshtgar, Deepak Waman, and Corinna Hoose

Clouds strongly affect the dynamics of extratropical cyclones and large-scale predictability through their microphysical and radiative effects. However, the representation of cloud microphysical and radiative processes remains uncertain in current weather and climate models, with key processes such as Secondary Ice Production (SIP) being simplified or neglected. SIP processes, such as rime splintering, ice-ice collisional breakup, and raindrop fragmentation, can increase ice number concentrations by several orders of magnitude. The enhanced ice production can modify the latent and radiative heating of clouds, thereby affecting the dynamics of extratropical cyclones. However, the impact of SIP processes on the dynamics of extratropical cyclones has not yet been quantitatively assessed.

Here we investigate the impact of SIP processes on the cloud microphysics and dynamics of extratropical cyclones by performing hindcast simulations with and without SIP processes using the ICOsahedral Nonhydrostatic (ICON) model. We focus on cyclones observed during the North Atlantic Waveguide and Downstream impact EXperiment (NAWDEX) field campaign. This enables us to evaluate the modeled microphysical and radiative properties of clouds within cyclones against observations. In addition, we apply the potential vorticity error growth framework to investigate how SIP-induced changes in cloud latent and radiative heating influence the dynamics of cyclones and the circulation near the tropopause. Our results can highlight the implications of improved cloud-ice microphysics for model prediction of extratropical cyclones.

How to cite: Keshtgar, B., Waman, D., and Hoose, C.: The impact of secondary ice production on the dynamics of extratropical cyclones, EGU General Assembly 2026, Vienna, Austria, 3–8 May 2026, EGU26-7768, https://doi.org/10.5194/egusphere-egu26-7768, 2026.

EGU26-8260 | ECS | Orals | AS1.19

On the dissipation of negative potential vorticity in the upper troposphere 

Ming Hon Franco Lee, Michael Sprenger, Hanna Joos, and Heini Wernli

Potential vorticity (PV) in mid-latitudes of the Northern Hemisphere is predominantly positive. Nevertheless, recent studies have shown that coherent and elongated negative PV (NPV) features can be generated in the upper troposphere by diabatic heating in a vertically sheared environment. These NPV features may persist for a few hours and interact with the jet, affecting the large-scale flow evolution. However, in contrast to its formation, the dissipation of NPV features is not well-understood, and the involved processes have not been investigated yet.

In this study, we carry out case studies on the dissipation of NPV near jet streams using numerical simulations from the Integrated Forecasting System by the European Centre for Medium-Range Weather Forecasts (ECMWF). Temperature and momentum tendencies from each parametrisation scheme are output, allowing a quantification of PV tendencies due to individual processes along air parcel trajectories. By launching forward trajectories in coherent NPV features, the contribution to the increase in PV, i.e., to the dissipation of NPV, by different diabatic processes are traced and compared. Turbulence appears to stand out as the dominant process that dissipates NPV. Detailed analysis on selected trajectories further demonstrates that the PV increase is usually associated with the tripole pattern of PV tendencies created by turbulence, which can be understood with a two-dimensional framework of the upper-level jet-front system. A special case that is consistent with the framework, but with a reversed tripole pattern is also found in a region of NPV. The study therefore provides further insight and understanding of the process by which NPV is dissipated in the upper troposphere.

How to cite: Lee, M. H. F., Sprenger, M., Joos, H., and Wernli, H.: On the dissipation of negative potential vorticity in the upper troposphere, EGU General Assembly 2026, Vienna, Austria, 3–8 May 2026, EGU26-8260, https://doi.org/10.5194/egusphere-egu26-8260, 2026.

EGU26-8442 | ECS | Posters on site | AS1.19

Observing mesoscale frontal convection and dry intrusions during NAWDIC using multi-dropsonde measurements 

Kam Lam Yeung, Bastian Kirsch, Corinna Hoose, Annette Miltenberger, and Annika Oertel

Mesoscale (~10–100 km) deep convection embedded within the cold-frontal region of extratropical cyclones (ETCs) can lead to high-impact weather. However, such convection remains poorly represented in operational weather prediction models. One key reason is the incomplete understanding of the mesoscale variability of thermodynamic and dynamic variables that leads to localized heavy precipitation associated with embedded deep convection. In particular, the dry intrusion (DI) airstream (characterized by descending cold, dry air from the upper troposphere) can either enhance or suppress embedded convection, highlighting the need for better constraints on its role in frontal dynamics.

The international field campaign North Atlantic Waveguide, Dry Intrusion, and Downstream Impact Campaign (NAWDIC), conducted during winter 2025/26, provides a unique observational perspective on these processes. In this contribution, we present airborne observations of mesoscale variability in frontal structures, with a particular focus on embedded convection and dry intrusions. Vertical thermodynamic and dynamic profiles are derived from a multi-dropsonde system, the “KITsonde” system, which captures mesoscale variability by simultaneously releasing up to four dropsondes with different fall velocity. These profiles are complemented by radiosonde soundings as well as wind and water vapour lidar measurements from a ground-based observation site at the Western Coast of France. The observed profiles are compared with corresponding profiles from weather prediction models using the KITsonde simulator, which predicts KITsonde trajectories and associated atmospheric properties from model data. Through the joint use of observations and simulations, we assess the ability of weather models to capture mesoscale variability associated with frontal convection in NWP models.

How to cite: Yeung, K. L., Kirsch, B., Hoose, C., Miltenberger, A., and Oertel, A.: Observing mesoscale frontal convection and dry intrusions during NAWDIC using multi-dropsonde measurements, EGU General Assembly 2026, Vienna, Austria, 3–8 May 2026, EGU26-8442, https://doi.org/10.5194/egusphere-egu26-8442, 2026.

EGU26-12653 | ECS | Posters on site | AS1.19

Explosive cyclogenesis and high-impact winds in storm Éowyn in January 2025: sensitivities to simulation setup and latent heating 

Seraphine Hauser, Lukas Papritz, and Heini Wernli

In January 2025, storm Éowyn underwent one of the fastest deepening rates ever observed for an extratropical cyclone, producing wind gusts exceeding 184 km h⁻¹ along Ireland’s west coast and ranking among the five most intense storms to affect the UK in terms of central pressure. The representation of such extreme extratropical cyclones in numerical weather prediction (NWP) models remains challenging, as their structure, deepening, and associated surface weather impacts are sensitive to the choice of NWP model, initial conditions, simulation resolution and lead time, and the representation of diabatic processes. In this study, we investigate how some of these factors influence the simulated intensification of storm Éowyn, using two state-of-the-art high-resolution models in their limited-area mode: the ICOsahedral Nonhydrostatic (ICON) model and the Portable Model for multi-scale Atmospheric Prediction (PMAP). The latter model is currently under development at the European Centre for Medium-Range Weather Forecasts (ECMWF) and ETH Zürich to enable simulation of weather across scales. We also revisit the classical approach of “dry (latent heating suppressed) vs. moist” simulations to quantify the contribution of latent heating to the intensification of Éowyn. Moreover, we perform pseudo-global warming experiments to explore the sensitivity of Éowyn’s evolution with respect to thermodynamic climate perturbations, revealing possible storylines for how the severity of such extreme storms may change in a future warmer climate. We quantify the effect of horizontal resolution and lead time on the storm evolution with quantitative insights into the contributions of thermodynamic and dynamical processes that lead to the rapid intensification of extratropical cyclones and the associated formation of extreme winds.

How to cite: Hauser, S., Papritz, L., and Wernli, H.: Explosive cyclogenesis and high-impact winds in storm Éowyn in January 2025: sensitivities to simulation setup and latent heating, EGU General Assembly 2026, Vienna, Austria, 3–8 May 2026, EGU26-12653, https://doi.org/10.5194/egusphere-egu26-12653, 2026.

EGU26-12757 | ECS | Posters on site | AS1.19

A June 2023 case study on the effect of cold-frontal convective cells on frontal synoptic flow 

Dillon Sherlock, Mona Bukenberger, Stephan Pfahl, and Ingo Kirchner
Diabatic processes play a large role in shaping dynamics at both the convective cell scale and synoptic scale, as well as their interactions. One problem in forecasting deep moist convection is our poor understanding of the complex interactions among processes that can act on vastly different spatial and temporal scales. We investigate one type of these scale interactions, specifically between synoptic-scale fronts and convection at the individual cell and mesoscale levels. While flow around convective cells and their influence on upper-level flow (e.g. linked to warm conveyor belts) has been examined, their impact on lower-level synoptic-scale features is not well understood.

Using convection-permitting ICON model simulations with high-temporal (2.5 minutes) and high-spatial (1.25km) resolution, we analyse a June 2023 case study of a cold front passing through Western Europe which led to extreme convection and precipitation over parts of Germany. Using a potential vorticity based framework, we investigate flow anomalies attributed to convective cells to assess their impact on the larger-scale flow features as well as examine the frontal environments that influence convection. Through diagnosing feedbacks and relationships between synoptic cold fronts and warm-season convective cells we aim to hopefully develop a better understanding of not only how frontal environments can shape convective cells, but also how in-turn the convection affects the evolution of the synoptic scale front simultaneously.

How to cite: Sherlock, D., Bukenberger, M., Pfahl, S., and Kirchner, I.: A June 2023 case study on the effect of cold-frontal convective cells on frontal synoptic flow, EGU General Assembly 2026, Vienna, Austria, 3–8 May 2026, EGU26-12757, https://doi.org/10.5194/egusphere-egu26-12757, 2026.

EGU26-13117 | ECS | Posters on site | AS1.19

Sensitivity of Extratropical Cyclone Poleward Motion to Low-Level Potential Vorticity 

Marcelo Souza, Helen Dacre, Tyler Leicht, Jennifer Catto, Duncan Ackerley, and Julian Quinting

Extratropical cyclones frequently exhibit pronounced poleward propagation during their life cycle. This behavior is typically associated with the poleward advection of a low-level PV anomaly by an upper-level PV anomaly located to its west, which can be enhanced by diabatic production of positive low- to mid-level PV (LPV) through latent heat release. In CMIP6 models, the storm tracks tend to be too zonal, particularly in the North Atlantic, and the frequency and intensity of rapidly deepening cyclones are often underestimated. Such biases may partly arise from misrepresentation of the magnitude of diabatic processes and/or from the dynamical response of cyclone propagation to those processes.

The aim of this study is to assess the contribution of latent heating to the poleward propagation of extratropical cyclones and to evaluate how both the magnitude of LPV and the associated dynamical response contribute to the storm track biases in CMIP6 models. Using ERA5 reanalysis and CMIP6 model data for the period 1979–2014, this study applies ensemble sensitivity analysis and cyclone composite methods to quantify the sensitivity of cyclone poleward propagation, measured by the cyclone meridional velocity at the time of maximum intensity, to LPV associated with latent heating. The analysis is conducted over the North Atlantic and North Pacific basins, considering both western and eastern sectors.

In ERA5, preliminary results show that North Atlantic cyclones have larger LPV than North Pacific cyclones throughout the entire development phase. Within the North Atlantic, although latent heating is stronger in western cyclones than in eastern ones, the sensitivity of poleward propagation to LPV is largest for eastern cyclones. In contrast, in the North Pacific, cyclones in the eastern sector show slightly stronger latent heating than those in the western sector. However, the sensitivity of poleward propagation to LPV is largest for western cyclones.

The CMIP6 models evaluated so far are able to capture the overall structure of LPV and the sensitivity of poleward motion to latent heating in extratropical cyclones across both oceans and sectors, as well as the differences between them. However, model resolution appears to impact the accuracy in representing the magnitude of these sensitivities, particularly for eastern North Atlantic cyclones. This may help explain the reduced storm track biases found in higher resolution CMIP6 models.

These results suggest that the poleward motion of western North Pacific and eastern North Atlantic cyclones is more strongly responsive to diabatic forcing via latent heat release, even though the magnitude of latent heating is smaller in those sectors. In contrast, western North Atlantic and eastern North Pacific cyclones appear to be more directly controlled by dry baroclinic processes. Finally, improving the representation of moist processes and LPV generation in climate models is essential for reducing biases in storm track orientation, cyclone intensity, and associated uncertainties in future climate projections.

How to cite: Souza, M., Dacre, H., Leicht, T., Catto, J., Ackerley, D., and Quinting, J.: Sensitivity of Extratropical Cyclone Poleward Motion to Low-Level Potential Vorticity, EGU General Assembly 2026, Vienna, Austria, 3–8 May 2026, EGU26-13117, https://doi.org/10.5194/egusphere-egu26-13117, 2026.

EGU26-13145 | ECS | Posters on site | AS1.19

Tracing Moist Diabatic Processes with Water Isotopes: Overview of NAWDICiso’s Multi-Platform Observations 

Iris Thurnherr, Franziska Aemisegger, Harald Sodemann, Killian Brennan, Jesse Connolly, Lena Fasnacht, Nina Fieldhouse, Eva Glock, Patricia Gribi, Christoffer Hovas, Robbert Kouwenhoven, and Andrew Seidl and the NAWDICiso team

Moist diabatic processes – such as air-sea fluxes, turbulent mixing, cloud microphysics – are key drivers of midlatitude high-impact weather. These processes affect the atmospheric temperature distribution and stability, thereby directly modifying mesoscale circulation patterns. Mesoscale structures, in turn, tend to be the most hazardous features within midlatitude weather systems and are closely linked to forecast uncertainties. We refer to these features as mesoscale moisture-cycling structures (MOCs): anomalies in moisture and wind fields on scales of approximately 1-50 km, embedded within midlatitude weather systems such as extratropical cyclones, their fronts and airstreams. It remains a major challenge to correctly represent moist diabatic processes and their impact on MOCs in numerical weather models.

Recent airborne field campaigns in tropical and polar regions have demonstrated the power of water isotope observations to quantify and disentangle the role of different diabatic processes. Building on this approach, NAWDICiso, i.e. the isotopic component of the North Atlantic Waveguide, Dry Intrusion, and Downstream Impact Campaign (NAWDIC, January – March 2026) aimed at conducting multi-platform observations of water vapour isotopes on two aircrafts (French ATR-42 operated by Safire and German Cessna F406 D-ILAB operated by TU Braunschweig) and at ground-based stations in Brittany (operated at the KITcube together with KIT), Ireland as well as within a European-wide precipitation sampling network to survey the downstream impact of North Atlantic cyclones. This intensive measurement period enables us to capture the imprint of diabatic processes on MOCs through simultaneous observations of stable water isotopes in water vapour and precipitation. Here, we present a first overview of the collected data and selected case studies from the NAWDICiso observation network. These measurements, combined with km-scale resolution isotope and tagging-enabled numerical model simulations, provide the basis for identifying and characterising moist diabatic processes within MOCs. Ultimately, these observations deliver unprecedented three-dimensional insights into MOCs in midlatitude weather systems, which are essential for improving forecasts of the development, intensification, and surface impacts of these weather systems.

How to cite: Thurnherr, I., Aemisegger, F., Sodemann, H., Brennan, K., Connolly, J., Fasnacht, L., Fieldhouse, N., Glock, E., Gribi, P., Hovas, C., Kouwenhoven, R., and Seidl, A. and the NAWDICiso team: Tracing Moist Diabatic Processes with Water Isotopes: Overview of NAWDICiso’s Multi-Platform Observations, EGU General Assembly 2026, Vienna, Austria, 3–8 May 2026, EGU26-13145, https://doi.org/10.5194/egusphere-egu26-13145, 2026.

This study focuses on the co-evolution of synoptic extratropical cyclones (ETC) and mesoscale convective systems (MCS) by comparing databases of Lagrangian tracks for both storm types and locating points which are co-located to identify "coupled" systems. We find that these coupled tracks occur at the southward edge of the regions with the most ETC points, and on the northward edge of the MCS points. Since both of these regions have strong seasonal cycles, the coupled points also show a strong seasonal cycle. During all seasons however the coupled points tend to be concentrated over warm ocean waters in the Kuroshio, Gulf Stream, and over central North America. We also show that ETC systems that contain MCS deepen approximately 50% faster than systems without MCS. Most of the coupled points occur at the initial coupling time for both systems, indicating that for the coupled systems the ETC and MCS are forming at very similar times, for all regions and seasons. To investigate the dynamics behind this, we used ERA5 data around the time of initial coupling and find that the coupled systems are occurring in regions of particularly strong initial frontal conditions, which is followed by a strong intensification of the ETC. The MCS are typically located to the north east of the cyclone center, in a region of uplift surrounding the frontal zone. These results suggest that understanding the distribution of strong fronts is key to understanding the coupling between the different storm types.

How to cite: Fajber, R. and Lach, G.: A Lagrangian climatology of coupled extratropical cyclones and mesoscale convective systems, EGU General Assembly 2026, Vienna, Austria, 3–8 May 2026, EGU26-13935, https://doi.org/10.5194/egusphere-egu26-13935, 2026.

EGU26-14354 | Orals | AS1.19

Assessing diabatic influences on extratropical cyclone development using complementary diagnostics 

Julian Quinting, Svenja Christ, Tyler Leicht, Jennifer Catto, and Joaquim G. Pinto

Extratropical cyclones are a key driver of midlatitude weather variability, including high-impact winter storms with heavy precipitation and severe wind gusts. Cyclone intensification results from the interplay of baroclinic dynamics and diabatic heating, the latter being closely linked to cloud-related processes within warm conveyor belts (WCBs). Focusing on European winter storms, this study investigates structural differences relevant for cyclone intensification between cyclones dominated by diabatic processes and those intensifying primarily through baroclinic mechanisms.

In a first part, we perform a systematic analysis of 247 winter storms affecting western and central Europe between 1979 and 2023, using a combination of a WCB diagnostic and the pressure tendency equation to quantify the diabatic contribution to cyclone deepening. Diabatic processes contribute on average 26.1% to cyclone intensification (median 25.3%), with cyclones exhibiting a relatively large diabatic influence (> 30.7%) showing steeper deepening rates, stronger northward displacement, enhanced precipitation, stronger wind gusts, and increased WCB activity compared to cyclones with a small diabatic influence (< 20.1%), despite similar minimum sea-level pressure. These cyclones are further characterised by warmer and moister WCB inflow conditions, favouring enhanced diabatic heating.

In a second part, we apply piecewise potential vorticity inversion to a limited number of representative cases as a complementary diagnostic to assess the methodological uncertainty in quantifying the role of diabatic processes. Together, these results demonstrate the benefit of combining complementary diagnostic approaches to better constrain the contribution of diabatic processes to extratropical cyclone intensification and highlight their potential for systematic evaluations of weather and climate models.

How to cite: Quinting, J., Christ, S., Leicht, T., Catto, J., and Pinto, J. G.: Assessing diabatic influences on extratropical cyclone development using complementary diagnostics, EGU General Assembly 2026, Vienna, Austria, 3–8 May 2026, EGU26-14354, https://doi.org/10.5194/egusphere-egu26-14354, 2026.

EGU26-15786 | ECS | Orals | AS1.19

Seasonal Cycle of Explosive Growth of Extratropical Storms 

Stacey Osbrough and Jorgen Frederiksen

Extratropical cyclones are responsible for severe and hazardous weather in the midlatitudes. They transport heat, momentum and moisture between latitudes and play important roles in the general circulation. Here, we present a new methodology for studying 6 hourly reanalysis data, based on spectral analysis is space and time, and determine the climatological properties of growing and decaying weather systems in six growth rate bins and two frequency bands. We focus on the seasonal variability of Northern and Southern hemisphere storm track modes for 20-year periods over the last 70 years. Leading Empirical Orthogonal Functions (EOFs) and storm tracks based on 850 hPa meridional winds and streamfunctions are determined for each frequency band and growth rate bin and compared with conventional EOFs and storm tracks that are based on all (growing and decaying) disturbances.

In the Northern hemisphere, results show slow‑growing weather systems exhibit familiar EOF patterns with peak amplitudes across the North Pacific and North America–Atlantic storm track regions near 45–50°N in both frequency bands. In the Southern hemisphere, EOF structures of slow growing modes are similarly focused near 45oS across the Southern Ocean. In contrast, in both hemispheres moderate and rapidly intensifying systems show a systematic equatorward shift in their dominant structures, highlighting the sensitivity of storm‑track latitude to cyclone growth characteristics.

The observed equatorward displacement of explosive storms in both hemispheres is related to diabatic effects such as convection, latent heating and surface moisture fluxes. These are more prevalent in the subtropical regions and include effects such as the transition of tropical cyclones into explosive extratropical cyclones. During extratropical transition, tropical cyclones inject large amounts of diabatic heating in the midlatitude flow triggering downstream Rossby wave trains, and the rapid deepening of new storms that are strongly linked to intensified rainfall.

Our findings reveal how changes in the life‑cycle characteristics of mid‑latitude cyclones influence storm track structure and rainfall distribution. By linking changes in explosive storm development to long‑term shifts in rainfall, this study strengthens our understanding of the mechanisms driving extreme events, including intense precipitation and prolonged drought. The approach provides a valuable framework for diagnosing mid‑latitude storm behaviour and how associated rainfall may evolve under climate change, with important implications for future climate risk. 

How to cite: Osbrough, S. and Frederiksen, J.: Seasonal Cycle of Explosive Growth of Extratropical Storms, EGU General Assembly 2026, Vienna, Austria, 3–8 May 2026, EGU26-15786, https://doi.org/10.5194/egusphere-egu26-15786, 2026.

EGU26-16684 | ECS | Posters on site | AS1.19

The sensitivity analysis of Arctic cyclone structure and characteristics in ensemble forecast  

Xueqing Ling, Suzanne Gray, John Methven, and Ambrogio Volonte

Sea ice cover in the Arctic has declined significantly during summer over the past few decades, leading to the opening up of Arctic shipping routes. However, the prediction of Arctic cyclones, which plays an important role in shipping safety, still has room for improvement. Cyclones interact with the underlying sea ice leading to potential modification of the cyclone through changes in the fluxes of heat, moisture and momentum into the atmospheric boundary layer from the sea surface. At the same time, Arctic cyclones can have different structures from extratropical cyclones, such as tropopause polar vortices  (TPVs), which may enhance the predictability of Arctic cyclones. Therefore, further understanding of the structure and lifecycle of cyclones in the Arctic region is crucial to improving forecasts.

In this presentation, a case study, the third cyclone observed time Arctic cyclones field campaign in 2022 (cyclone3), is discussed, to find out the relationship between the structure and characteristics of the cyclone and precursor fields. Cyclone3 lasted 13 days and travelled from the Greenland Sea across the North Pole to the Laptev Sea before returning to the Greenland sector. Because of its long lifetime and moving track, we can find out how its property changes over different surface types. Ensemble sensitivity analysis (ESA) is used to learn how the spread of cyclone outcomes in the ensemble forecast are related to early state variables, such as surface fluxes and TPVs, to understand how the prediction of cyclone evolution, including the structure and intensity, changes in different cyclone stages, and what that tells us about how upper- and lower-level dynamics interact in the Arctic region.

How to cite: Ling, X., Gray, S., Methven, J., and Volonte, A.: The sensitivity analysis of Arctic cyclone structure and characteristics in ensemble forecast , EGU General Assembly 2026, Vienna, Austria, 3–8 May 2026, EGU26-16684, https://doi.org/10.5194/egusphere-egu26-16684, 2026.

EGU26-17992 | Posters on site | AS1.19

Impact of the distribution of sea surface temperature on the maintenance of storm tracks 

Fumiaki Ogawa, Andrea Marcheggiani, Hisashi Nakamura, and Thomas Spengler

Moist diabatic processes significantly impact storm track variability, position, and intensity. The distribution of atmospheric moisture is closely linked to sea surface temperatures (SSTs) through the Clausius-Clapeyron relation. Therefore, midlatitude atmospheric circulation is affected by the spatial distribution of SSTs, especially midlatitude SST fronts associated with oceanic western boundary currents.

We quantify the storm track’s response to moisture availability by performing idealised aqua-planet simulations where we modify the distribution of SST by changing the position, intensity, and width of midlatitude SST fronts. We assess the sensitivity of atmospheric circulation by comparing the water cycle and climatological mean energy cycle resulting from each simulation. Specifically, we find that storm tracks tend to align with SST fronts when these are located in midlatitudes, and that stronger SST gradients enhance storm track activity by increasing baroclinicity and moisture fluxes. The storm track’s latitudinal variability is strongly dependent on the latitude of the SST front, while its amplitude and maximum gradient primarily affect storm track intensity. Two additional experiments where we uniformly increase and decrease absolute temperature highlight the response of storm tracks to climate change: the water cycle intensifies in a warmer climate, but storm track activity appears more sensitive to the total meridional temperature contrast than to absolute temperature. 

Finally, we present preliminary results from ongoing work exploring the synoptic drivers of storm track response, including changes in cyclone distribution, baroclinicity, and the role of moist diabatic processes, which significantly impact storm track variability, position, and intensity.

How to cite: Ogawa, F., Marcheggiani, A., Nakamura, H., and Spengler, T.: Impact of the distribution of sea surface temperature on the maintenance of storm tracks, EGU General Assembly 2026, Vienna, Austria, 3–8 May 2026, EGU26-17992, https://doi.org/10.5194/egusphere-egu26-17992, 2026.

EGU26-18028 | ECS | Posters on site | AS1.19

Forecast errors attributed to synoptic features and the role of diabatic heating for extratropical cyclones 

Qidi Yu, Clemens Spensberger, Linus Magnusson, and Thomas Spengler

It is often argued that numerical weather prediction models remain deficient in forecasting specific weather features and that such deficiencies contribute significantly to overall forecast errors. To clarify these claims, we quantify how extratropical cyclones (ETCs), fronts, upper tropospheric jets, moisture transport axes (MTAs), and cold-air outbreaks (CAOs) contribute to short-term (12-h) forecast errors and biases in the ERA5 reanalysis dataset from 1979 to 2022. Employing a feature-based attribution method, we evaluate errors globally, focusing particularly on temperature, moisture, and wind fields, and examine regional and seasonal variations during winter (DJF) and summer (JJA). The presence of weather features is generally associated with increased forecast errors (RMSEs) compared to feature-free conditions. RMSEs are especially pronounced for moisture fields in conjunction with fronts and MTAs, where errors in total column water vapor can be twice as large. ETC-related errors are more pronounced in the low-level wind field. During CAOs, on the other hand, errors are reduced. In terms of systematic biases, wind speeds and moisture are underestimated along western boundary currents, together with insufficient moisture transport along MTAs.

Given that ETCs are the most notable example, where forecasts provide less added value in most cases we also employ a cyclone-centred composite framework for North Atlantic wintertime (DJF) ETCs using the ERA5 reanalysis for the period 1979 to 2022. ETCs are categorised into strong and weak diabatic heating at the time of their maximum intensification. While both groups exhibit a systematic underestimation of cyclone intensity, the error structures are markedly distinct. The weak heating group is characterised by an intensity underestimation near the cyclone core, whereas the strong heating group features a pronounced southwestward displacement bias together with a domain-wide intensity underestimation. After removing the displacement bias, the strong heating group reveals an overestimation of low-level winds within the cold conveyor belt, sting jet, and dry intrusion regions, but a clear underestimation of moisture transport in the warm sector. These biases are accompanied by a pronounced overestimation of 850 hPa kinematic frontogenesis near the centre, likely associated with the wind field errors, and a substantial overestimation of total column liquid water along the bent-back warm front. This overestimated liquid water is likely related to the stronger frontogenesis, which induces an over-intensified secondary circulation. In contrast, cyclones in the weak heating group exhibit an underestimation of wind speed and moisture near the centre, consistent with the near centre intensity underestimation. Our findings highlight the impact of diabatic heating on structural cyclone forecast biases that can guide future model improvements.

How to cite: Yu, Q., Spensberger, C., Magnusson, L., and Spengler, T.: Forecast errors attributed to synoptic features and the role of diabatic heating for extratropical cyclones, EGU General Assembly 2026, Vienna, Austria, 3–8 May 2026, EGU26-18028, https://doi.org/10.5194/egusphere-egu26-18028, 2026.

EGU26-18360 | Orals | AS1.19

The influence of climate change on analogues of contrasting mid-latitude cyclones over the UK 

Ben Harvey, Farrell Morgan, and Oscar Martínez-Alvarado

Extreme extratropical storms present major socio-economic risks and are sensitive to anthropogenic climate change. Whilst robust projections of the aggregate properties of extreme storms have emerged from climate models in recent years, these average together storms with a range of contrasting dynamical structures and the influence of climate change on specific storm structures is much less well understood. Here, we adopt the storm track analogue approach to examine the influence of climate change on four contrasting historical storms impacting the UK: Martin in December 1999, the Great Storm in October 1987, Arwen in November 2021, and Ophelia in October 2017. Analogues are identified in the recently-produced CANARI large ensemble for both the present climate (1980–2010) and a high-emission future scenario (SSP3–7.0, 2070–2100).

Across each region of the UK, the overall number of storms decreases in future while the intensity of the most extreme storms increase, both in terms of precipitation and lower-tropospheric wind speed, aligning well with consensus storm projections. However, the analogues of specific storms exhibit contrasting future responses, indicating that storm-specific changes under anthropogenic warming can diverge from the aggregate signal. For example, whilst there is a reduction in the total number of storms in the region impacted by the Great Storm, there is a marked future increase in the number of storms with a trajectory similar to the Great Storm. Such changes are likely driven by regional variations in the conditions for baroclinic growth, or an increased influence of diabatic effects in future. Since individual storms are typically associated with distinct meteorological hazards, accounting for storm-specific responses is critical for assessing regional impacts and developing adaptation strategies.

How to cite: Harvey, B., Morgan, F., and Martínez-Alvarado, O.: The influence of climate change on analogues of contrasting mid-latitude cyclones over the UK, EGU General Assembly 2026, Vienna, Austria, 3–8 May 2026, EGU26-18360, https://doi.org/10.5194/egusphere-egu26-18360, 2026.

EGU26-20660 | ECS | Posters on site | AS1.19

Latent heating contribution to storm intensification across seasons and climates - A potential vorticity approach 

Abel Shibu, Henrik Auestad, Paulo Ceppi, and Tim Woollings

Extratropical cyclones are expected to be more diabatically driven in a warmer world, in line with the 6-7% increase in precipitable water per degree of global-mean surface temperature increase. This leads to a preferential strengthening of the most intense cyclones in a warmer climate as a result of increased latent heating (LH), accompanied by a decrease in the strength of weaker cyclones.


In this study, using data from new CESM model experiments, and employing a storm-centric potential vorticity (PV) budget, we estimate the contribution of LH to storm intensification across height and storm lifecycle. We use an objective algorithm to track the cyclones, and a suitable storm-compositing method to compute the spatial and temporal patterns of PV generated from diabatic and adiabatic processes. To isolate the intensification of storms due to PV generation from other processes like storm propagation, we develop a novel storm-averaging methodology. 


Using this methodology, we investigate how the magnitude and pattern of PV produced from LH are modified when the sea surface temperature is uniformly increased by 4K. Focusing on the strongest cyclones in the southern hemisphere, we show that the increase in low-level PV generated in cyclones in the warmer model run can be almost entirely attributed to changes in the strength and pattern of LH. By also comparing winter and summer cyclones in our model runs, we obtain a consistent pattern of how the LH contribution to cyclone intensification changes from a cooler to a warmer environment. Finally, we show that our methodology also works well for cyclones in reanalysis data (MERRA2).


Given the socio-economic impacts of severe storms, this study provides valuable insights into the processes that govern cyclone intensification, and how they are expected to change in a warmer world. We also quantify the increase in cyclone strength with warming, which can support policymakers in anticipating and mitigating the effects of these events.

How to cite: Shibu, A., Auestad, H., Ceppi, P., and Woollings, T.: Latent heating contribution to storm intensification across seasons and climates - A potential vorticity approach, EGU General Assembly 2026, Vienna, Austria, 3–8 May 2026, EGU26-20660, https://doi.org/10.5194/egusphere-egu26-20660, 2026.

EGU26-20835 | ECS | Posters on site | AS1.19

A climatology of North Atlantic extratropical cyclones using piecewise potential vorticity inversion 

Tyler Leicht, Jennifer Catto, Jacob Maddison, Marcelo Suoza, Helen Dacre, and Julian Quinting

There are still considerable uncertainties surrounding the frequency and characteristics of extratropical cyclones within climate model projections. Some of the uncertainty may originate from considering all cyclones together rather than examining dynamically distinct groups of cyclones. Here we present a preliminary climatology of wintertime cyclones across the North Atlantic created using piecewise potential vorticity inversion. Cyclones are identified using the Hodges (1999) TRACK methodology on ERA5 reanalysis data from December–February and from 1979–2024 across the North Atlantic basin. We apply the piecewise potential vorticity inversion method to these cyclone tracks to determine whether an individual cyclone strengthens most from upper-, middle-, or lower-troposphere potential vorticity anomalies. Cyclones are analyzed to assess how their structure, development, and large-scale flow characteristics differ between the three classes of cyclones. We aim to perform similar analysis for cyclones in climate model runs of both current and future climate states to assess the biases and projected changes to the different groups of extratropical cyclones.

How to cite: Leicht, T., Catto, J., Maddison, J., Suoza, M., Dacre, H., and Quinting, J.: A climatology of North Atlantic extratropical cyclones using piecewise potential vorticity inversion, EGU General Assembly 2026, Vienna, Austria, 3–8 May 2026, EGU26-20835, https://doi.org/10.5194/egusphere-egu26-20835, 2026.

The physical processes affecting cyclogenesis and intensfication of midlatitude storms often occur at scales smaller than those resolved by the global climate models, which has previously restricted their use for present and future storm climatology assessments. The Process-based Climate simulation: Advances in high resolution modelling and European climate risk assessment (PRIMAVERA) and the associated CMIP6 High Resolution Model Intercomparison Project (HighResMIP; Haarsma et al. 2016) has highlighted the need for global storm-resolving climate models, with significant improvements seen in the frequency, intensity and structure of mid-latitude storms by increasing resolutions from 100 km to 25 km. The European Eddy-Rich Earth-System Models (EERIE) offer the highest available resolutions (~10 km) that explicitly resolve ocean mesoscale features, furthering our understanding of their impacts on the large-scale circulation, including storm-tracks and jet streams. In this study, we evaluate the historical (1950-2014) simulations from the four coupled EERIE models in their representation of mid-latitude storms and their effects on the eddy-driven circulation. We also present results from the sensitivity experiments (atmosphere-only), which are designed to isolate the impact of ocean-mesoscale eddies on the large-scale circulation. We find that the impact of ocean mesoscale eddies on the climatological storm track remain small, which is expected as the flux-enhancing effect of eddies is largely overwhelmed by the the strong meridional temperature gradients associated with fronts.  

How to cite: Dey, I.: Impact of eddy-rich ocean resolutions in the representation of midlatitude storm in global climate models, EGU General Assembly 2026, Vienna, Austria, 3–8 May 2026, EGU26-21033, https://doi.org/10.5194/egusphere-egu26-21033, 2026.

EGU26-23197 | Posters on site | AS1.19

Diabatics processes across scales in the extratropics: Workshop summary and research priorities 

Thando Ndarana, Michael Barnes, and Thomas Spengler

Most of our fundamental theories for the large-scale atmospheric circulation in the extratropics are based on “dry” atmospheric dynamics. However, our fundamental understanding of the impact of diabatic processes on a range of spatial and temporal scales has significantly improved over the recent decades. This includes the impact of diabatic processes on blocking, Rossby wave propagation and breaking, extratropical and subtropical cyclones, polar lows, jets, and tropical-extratropical interactions among many others. Despite these recent efforts, large uncertainties in representing diabatic processes and their impact remain, leading to upscale error growth and enhanced ensemble spread, highlighting the continued need to further our understanding and to develop new and revise existing paradigms.

Addressing these important research questions requires a large community effort of weather and climate dynamicists, modellers, and observationalists, who can profit from an invigorated mutual exchange. Providing opportunities for these sometimes-disparate research communities to come together is critical for enhancing collaboration and our understanding of how diabatic processes impact various scales and change in a warmer, moister atmosphere. 

Hence, the Diabatics 2026 Workshop was organised 28 April until 1 May 2026, focusing on the impact and implications of different diabatic processes on the dynamic evolution of meso- to planetary-scale weather systems, including cross-scale interactions and geographic linkages.  Contributions from theory, observations, and modelling (including AI) were featured, including implications of resolving and understanding diabatic processes on predictability on all timescales. This presentation summarises key findings from the workshop as well as recommentions of the community on research priorities.

How to cite: Ndarana, T., Barnes, M., and Spengler, T.: Diabatics processes across scales in the extratropics: Workshop summary and research priorities, EGU General Assembly 2026, Vienna, Austria, 3–8 May 2026, EGU26-23197, https://doi.org/10.5194/egusphere-egu26-23197, 2026.

EGU26-2241 | Orals | AS1.20

Seasonal Rossby Wave Dynamics Driving Winter and Summer Temperature Extremes in the Arabian Peninsula 

Jiya Albert, Mariam Fathima Navaz, Abdul Azeez Saleem, Venkata Sai Chaitanya Akurathi, Salim Lateef, Muhammad Shafeeque, and Luai Alhems

Atmospheric Rossby waves exert a strong control on the emerging pattern of summer heat and winter cold over the Arabian Peninsula, yet their regional impacts remain poorly quantified. This study uses 25 years (2000–2024) of reanalysis and observational data to assess how upper-tropospheric Rossby wave activity modulates seasonal 2 m temperature extremes over Saudi Arabia and how these responses are embedded in large-scale teleconnections linked to ENSO and Indo-Pacific variability. The analysis focuses on the evolution of warm-core structures in summer, the spatial spread of winter cold anomalies, and two recent extreme years, 2017 and 2023, that reveal the sensitivity of the Peninsula to Rossby wave regime shifts.

Results show a progressive amplification and spatial expansion of August near-surface temperatures across Saudi Arabia, with the 37–38 °C isotherms migrating northward and westward after 2010 to form a quasi-continuous warm core spanning the eastern lowlands, Rub al Khali, and central plateau. The fraction of land exceeding 39 °C in August increased from isolated spots in the early 2000s to over 20% after 2015, signifying a step-like intensification of summertime heat. Composite analyses indicate that these hot cores coincide with upper-level anticyclonic ridges and subsidence maxima, consistent with Rossby wave–induced adiabatic warming and suppressed convection.

Within this long-term warming context, 2017 stands out as a dynamical outlier. Amplified and breaking Rossby waves over the Middle East generated a quasi-stationary ridge over the Peninsula, producing exceptionally broad August heat with mean temperatures above 38 °C across central and northeastern regions. In winter 2017, enhanced wave activity drove deep trough intrusions and widespread sub‑16 °C anomalies, yielding an unusual combination of extreme summer heat and pronounced winter cooling within one year. A renewed Rossby forcing episode in 2023 accompanied one of the hottest summers on record, when the southeastern warm core intensified and spread northwestward while winter again featured strong meridional temperature gradients and broad cold coverage.

Wave activity flux diagnostics and teleconnection analyses reveal that both 2017 and 2023 extremes arose from Indo-Pacific–Eurasian Rossby wave trains. In 2017, La Niña–like conditions and a positive Indian Ocean Dipole excited a Eurasian wave train that channelled energy along the subtropical jet, reinforcing anticyclonic ridging in summer and deep winter troughs. In 2023, an ENSO phase transition under neutral IOD conditions triggered renewed Rossby dispersion from the tropical western Pacific into the Asian jet, again focusing anomalous ridging and subsidence over the Peninsula.

These results suggest that modest upstream anomalies now yield amplified regional thermal responses, implying increased dynamical gain due to background warming and altered land–atmosphere coupling. The findings point to a Rossby wave–dominated regime shift since 2017, wherein upper-level wave geometry and teleconnections increasingly control the extent of summer heat and winter cold. Saudi Arabia thus emerges as a dynamically sensitive node in the global Rossby waveguide system.

How to cite: Albert, J., Navaz, M. F., Saleem, A. A., Chaitanya Akurathi, V. S., Lateef, S., Shafeeque, M., and Alhems, L.: Seasonal Rossby Wave Dynamics Driving Winter and Summer Temperature Extremes in the Arabian Peninsula, EGU General Assembly 2026, Vienna, Austria, 3–8 May 2026, EGU26-2241, https://doi.org/10.5194/egusphere-egu26-2241, 2026.

Atmospheric blocking, conventionally studied as a quasi-stationary phenomenon, often exhibits zonal movement under the influence of factors like the background flow and retrograding Rossby waves. However, the impact of this mobility on cold extremes remains under-investigated. This study classifies atmospheric blocking events during the winters of 1979/80–2020/21 into westward-moving, eastward-moving, and quasi-stationary types to analyze their distinct impacts on surface air temperature by region.

Our results show that westward-moving blocks occurred most frequently over the western North Pacific, whereas quasi-stationary blocks were dominant in most other regions. In terms of duration, westward-moving blocks consistently persisted longer than the other types across all regions. Notably, these long-lasting, westward-moving events were closely associated with inducing strong cold waves in downstream areas during their dissipation phase. This is attributed to the enhanced advection of cold Arctic air by blocking-induced low-level wind anomalies. These characteristics were successfully reproduced in CESM1-LENS simulations, suggesting that a better understanding of blocking mobility can contribute to improving extreme cold surge prediction.

How to cite: Kim, S.-H. and Kim, B.-M.: Characterizing Blocking Mobility and Its Role in Northern Hemisphere Cold Extremes, EGU General Assembly 2026, Vienna, Austria, 3–8 May 2026, EGU26-2300, https://doi.org/10.5194/egusphere-egu26-2300, 2026.

EGU26-2413 | ECS | Posters on site | AS1.20

On the interpretation of the pressure vertical velocity 

Juntian Chen, Sergiy Vasylkevych, Nedjeljka Žagar, and Cathy Hohenegger

Pressure vertical velocity (ω = Dp/Dt) is commonly approximated from the geometric vertical velocity (w = Dz/Dt) as ω ≈ -ρgw, which invokes the hydrostatic relation ∂p/∂z ≈ -ρg together with the additional assumption that local pressure tendency and horizontal pressure advection term are negligible at planetary and synoptic scales. Using global nonhydrostatic simulations with the ICON model, we show that the horizontal pressure advection term can be relatively large compared with the vertical pressure advection term at planetary-to-synoptic scales in regions of strong jets such as in the winter stratosphere, contradicting the conventional assumption ω ≈ -ρgw. We further show that the horizontal and vertical pressure advection terms exhibit a predominantly out-of-phase structure and that their comparable amplitudes lead to substantial cancellation. As a consequence, ω can be suppressed or amplified at large scales relative to the -ρgw diagnostic, despite the validity of the hydrostatic balance. Scale diagnostics indicate that the large-scale enhancement of the horizontal pressure advection arises from interactions between the mean flow and eddies. From an energetic perspective, these advection terms correspond to compensating contributions of pressure-gradient work in different directions. Consequently, ω behaves more like the net pressure gradient work, rather than a direct measure of vertical motion.

How to cite: Chen, J., Vasylkevych, S., Žagar, N., and Hohenegger, C.: On the interpretation of the pressure vertical velocity, EGU General Assembly 2026, Vienna, Austria, 3–8 May 2026, EGU26-2413, https://doi.org/10.5194/egusphere-egu26-2413, 2026.

EGU26-2487 | Orals | AS1.20

The evolution of cyclonic and anticyclonic Rossby wave breaking morphologies and their importance in extremes 

Michael A. Barnes, Michael J. Reeder, and Thando Ndarana
Rossby waves are fundamental meteorological phenomena in the extratropics. When these waves amplify and break, they often lead to extreme weather events, including heatwaves, heavy rainfall, and strong winds. Here we apply an objective classification method to identify equatorward anticyclonic and cyclonic Rossby wave breaking morphologies, analogous to the LC1 and LC2 types identified in previous research. Anticyclonic Rossby wave breaking zones are shown to evolve as expected, representing the barotropic decay of baroclinic Rossby wave packet. Composite analysis of the evolution of cyclonic Rossby wave breaking morphologies however shows that these morphologies develop from the debris of preceding anticyclonic Rossby wave breaking. Cyclonic morphologies are further linked to Rossby wave packet generation and downstream development. The role of Rossby wave breaking in extreme weather is illustrated through the example of heavy rainfall along Australia’s east coast, emphasizing its importance in the generation of such extremes.

How to cite: Barnes, M. A., Reeder, M. J., and Ndarana, T.: The evolution of cyclonic and anticyclonic Rossby wave breaking morphologies and their importance in extremes, EGU General Assembly 2026, Vienna, Austria, 3–8 May 2026, EGU26-2487, https://doi.org/10.5194/egusphere-egu26-2487, 2026.

EGU26-2492 | ECS | Posters on site | AS1.20

The Influence of Tropopause Potential Vorticity Circulation Forcing on the Development of the East Asian Cold Wave in December 2023 

Yanxi Li, Guoxiong Wu, Yimin Liu, Bian He, Jiangyu Mao, and Chen Sheng

In December 14 to 16, 2023, East Asia experienced a severe cold wave, with record-breaking low temperatures and consequently severe natural disasters over broad areas. Results suggest that anomalous downward potential vorticity circulation (PVC) forcing across the tropopause played a critical role in triggering and amplifying this event. The results indicated that in early December, a strong positive potential vorticity substance (PVS) reservoir accompanied by an anomalous downward PVC persisted in the lower stratosphere over Siberia, whereas two distinct upper tropospheric fronts (UTFs) were located over East Asia. By December 12, as the downward PVC penetrated the tropopause into the troposphere, enhancing the northern UTF and triggering a perturbation trough at its western end. This northern trough propagated faster eastward along the UTF than its southern counterpart, and its PVS was intensified by the descending northerly flow. As the two UTFs merged on the eastern Tibetan Plateau, the northern trough was phase-locked with the southern trough, forming a deep East Asian trough with a well-developed PVS. The prominent cold descending northerly flow dominated the troposphere behind the trough, generating extremely high surface pressure and abnormal cold temperature advection below. Consequently, a severe cold wave swept over East Asia. This study improves upon previous work by directly linking tropopause PVC forcing to trough phase-locking, a previously overlooked pathway for cold wave amplification.

How to cite: Li, Y., Wu, G., Liu, Y., He, B., Mao, J., and Sheng, C.: The Influence of Tropopause Potential Vorticity Circulation Forcing on the Development of the East Asian Cold Wave in December 2023, EGU General Assembly 2026, Vienna, Austria, 3–8 May 2026, EGU26-2492, https://doi.org/10.5194/egusphere-egu26-2492, 2026.

EGU26-2689 | ECS | Orals | AS1.20

Resolution Sensitivity of Rossby Wave Breaking and Warm Conveyor Belts in Global ICON Simulations 

Marius Rixen, Andreas Prein, Praveen Pothapakula, Michael Sprenger, and Christian Zeman

Forecast busts over Europe—periods of abnormally low predictive skill—are often associated with extreme weather events and linked to misrepresented upper-level dynamics, including latent heating from mesoscale convective systems (MCSs), Rossby wave breaking, and warm conveyor belt (WCB) outflow. This study investigates how explicitly resolving mesoscale processes affects the simulation of these key mechanisms in global ICON ensemble forecasts at grid spacings ranging from 40 km down to 2.5 km. As a test case, we analyze a forecast bust from ECMWF’s Integrated Forecasting System (IFS) related to the development of Storm Dennis (February 2020), the second-most intense North Atlantic winter storm of the past 150 years, and compare ICON with IFS.

We find a systematic improvement in forecast skill with finer grid spacing. Coarse-resolution simulations reproduce the forecast bust and fail to capture the correct trough–ridge pattern, while convection-permitting simulations more accurately represent upper-level potential vorticity anomalies, WCB structure, and cyclone development.

Our analysis reveals a multi-stage chain of error growth arising from several interacting factors. Large initial-condition uncertainties over the North Pacific provide a background sensitivity, but the strongest early error growth occurs over the central United States, coinciding with a period of deep convection from MCSs. Convection-permitting simulations produce stronger and more coherent MCSs, leading to enhanced negative PV injection near 250 hPa and substantially reduced Rossby wave activity errors. In contrast, coarser-resolution simulations exhibit weaker or misplaced MCSs, resulting in larger errors in the upper-tropospheric flow. These midlatitude convective differences subsequently modulate the intensity and orientation of downstream WCBs over the North Atlantic. The WCB then amplifies the pre-existing errors, linking the central-U.S. convective phase to the eventual European forecast bust.

Overall, our results demonstrate that mesoscale processes over North America—especially MCS-driven PV perturbations—play a key role in setting the predictability of the North Atlantic flow regime during Storm Dennis. Convection-permitting global simulations improve the representation of these processes and offer a physically consistent pathway toward reducing forecast busts in high-impact weather situations. To assess the robustness and generality of these findings, additional case studies are currently being analyzed.

How to cite: Rixen, M., Prein, A., Pothapakula, P., Sprenger, M., and Zeman, C.: Resolution Sensitivity of Rossby Wave Breaking and Warm Conveyor Belts in Global ICON Simulations, EGU General Assembly 2026, Vienna, Austria, 3–8 May 2026, EGU26-2689, https://doi.org/10.5194/egusphere-egu26-2689, 2026.

EGU26-2944 | Orals | AS1.20

The maintenance of a zonally asymmetric subtropical jet 

Orli Lachmy and Ian White

The subtropical jet dominates over specific longitudinal sectors during both winters. The major source of this zonal asymmetry is localized tropical convection. In particular, during austral winter, the wide and powerful convection over the Asian monsoon region and Maritime Continent drives a subtropical jet over the Indian Ocean, Australia and the west and central Pacific. Further downstream in the east Pacific the jet tilts poleward, gradually shifting towards eddy-driven jet characteristics, while in the Atlantic sector only an eddy-driven jet prevails.

In this study, we show that the upper tropospheric circulation pattern over the whole Southern Hemisphere during winter is similar to that in an idealized model simulation, where the only zonal asymmetry source is localized tropical convection in the summer hemisphere. A similar momentum budget is found for the observations and model simulation. The first-order momentum balance is the geostrophic balance associated with a stationary Rossby wave driven by tropical convection. The upstream part of the subtropical jet (the Indian Ocean jet) is associated with a high equatorward of it, and the downstream part (the Pacific jet) is associated with a low poleward of it. This demonstrates that the subtropical jet zonally asymmetric component is a manifestation of a stationary Rossby wave in the upper troposphere. The second-order momentum balance is associated with approximate absolute angular momentum conservation in the localized Hadley cell, as is the dominant balance in zonally symmetric models. The third-order momentum balance is between meridional advection of absolute angular momentum and zonal momentum advection. Transient eddy momentum fluxes are negligible in the maintenance of the subtropical jet zonal structure.

How to cite: Lachmy, O. and White, I.: The maintenance of a zonally asymmetric subtropical jet, EGU General Assembly 2026, Vienna, Austria, 3–8 May 2026, EGU26-2944, https://doi.org/10.5194/egusphere-egu26-2944, 2026.

EGU26-3038 | ECS | Posters on site | AS1.20

Quantifying the influence of Barents-Kara sea ice loss on Ural blocking 

Ernest Agyemang-Oko and Marlene Kretschmer

Arctic amplification has been linked to significant changes in mid-latitude weather patterns, including the increasing frequency and persistence of extreme weather events. This study investigates the influence of Barents-Kara (BK) sea-ice variability on wintertime Ural blocking and its role in Eurasian cold temperature anomalies. Using ERA5 reanalysis data, we analyse Ural blocking frequency and persistence based on two commonly used blocking indices (an absolute geopotential height reversal index and an anomaly-based index method). The relationships between BK sea ice, Ural blocking, and Eurasian surface temperature are examined within a causal network framework, accounting for ENSO as a potential common driver by including it as a covariate and by stratifying the analysis by ENSO phase. We find that Ural blocking events occur more frequently and persist longer during winters with reduced BK sea ice. Although, results are sensitive to blocking index but remain qualitatively consistent and robust across indices. Composite analyses show a characteristic warm-Arctic/cold-Eurasia temperature pattern during Ural blocking events, which is amplified during winters with low BK sea ice and La Niña conditions. To assess whether Ural blocking is influenced by specific Arctic background conditions, we further classify winters into Deep and Shallow Arctic warming regimes over the Barents-Kara region. We find that Ural blocking occurs more frequently and is more persistent under Deep Arctic warming states, leading to a stronger cold-Eurasia temperature response compared to Shallow warming regimes. By statistically quantifying the relationships between Arctic sea ice, Ural blocking, and Eurasian temperature variability, this work advances the understanding of Arctic-midlatitude interactions.

Keywords: Arctic Amplification, Ural blocking, Barents-Kara sea ice, ENSO, Blocking indices, Blocking frequency and persistence, Eurasian cold winters.

How to cite: Agyemang-Oko, E. and Kretschmer, M.: Quantifying the influence of Barents-Kara sea ice loss on Ural blocking, EGU General Assembly 2026, Vienna, Austria, 3–8 May 2026, EGU26-3038, https://doi.org/10.5194/egusphere-egu26-3038, 2026.

EGU26-3695 | ECS | Posters on site | AS1.20

The importance of polar and singular waveguides for the occurrence of Rossby wave resonance 

Tobias Hempel and Volkmar Wirth

The occurrence of extreme weather has recently been associated with the mechanism of Rossby wave resonance along a circumglobal jet. Resonance is possible to the extent that the jet acts as a zonal waveguide. Recently, a method was introduced to diagnose this mechanism in the framework of the linear barotropic model through numerically solving a judiciously designed model configuration. In that method, any wave activity leaving the jet region is dissipated in sponges and, hence, discarded from further consideration.

The present work goes a step further by explicitly accounting for polar and singular waveguides, which occur through wave reflection off the pole or off a critical level. In the absence of damping, these reflective boundaries generate additional resonant cavities and allow higher meridional modes to participate in the resonance. These higher meridional modes imply resonance at multiple zonal wavenumbers, in stark contrast with the earlier results. However, when a small amount of damping is included, any wave activity is strongly dissipated before these reflecting surfaces are encountered. Consequently, the impact of the polar and the singular waveguides vanishes, and the resonant behavior reduces to that from the original diagnostic. It is concluded that the impact of reflecting surfaces beyond the jet region proper is unlikely to be of practical importance for diagnosing the Rossby wave resonance along a circumglobal midlatitude jet.

How to cite: Hempel, T. and Wirth, V.: The importance of polar and singular waveguides for the occurrence of Rossby wave resonance, EGU General Assembly 2026, Vienna, Austria, 3–8 May 2026, EGU26-3695, https://doi.org/10.5194/egusphere-egu26-3695, 2026.

EGU26-4663 | Posters on site | AS1.20

Interdecadal changes and the role of Philippine Sea convection in the intensification of Indian spring heatwaves 

Jung Ok, Eun-Ji Song, Sinil Yang, Baek-Min Kim, and Ki-Young Kim

Severe heatwaves have become increasingly frequent over the Indian subcontinent in recent decades. This study found that the increase in extreme heatwaves is related to a significant decadal change in surface temperatures over the Indian subcontinent, and revealed that the increase in convective activity in the Philippine Sea plays a crucial role in this decadal change in surface temperature. Specifically, the surface temperature over the Indian subcontinent in spring has increased significantly by approximately 0.64 ◦C in recent years (1998–2022: post-1998) compared to the past (1959–1997: pre-1998), leading to more intense and frequent heatwaves, particularly in March and April. The difference in atmospheric changes between these two periods shows that the enhancement of convective activity over the Philippine Sea drives an anomalous elongated anticyclonic circulation over the Indian subcontinent. This circulation pattern, marked by clearer skies and increased incident solar radiation, significantly contributes to the heat extremes in the Indian subcontinent. Additionally, stationary wave model experiments demonstrate that local diabatic heating over the Philippine Sea is significantly linked to robust spring Indian heatwaves through the Matsuno–Gill response.

How to cite: Ok, J., Song, E.-J., Yang, S., Kim, B.-M., and Kim, K.-Y.: Interdecadal changes and the role of Philippine Sea convection in the intensification of Indian spring heatwaves, EGU General Assembly 2026, Vienna, Austria, 3–8 May 2026, EGU26-4663, https://doi.org/10.5194/egusphere-egu26-4663, 2026.

Atmospheric Rossby waves are a fundamental component of large-scale circulation and low-frequency atmospheric variability. In classical theory, quasi-stationary planetary waves are characterized by infinite periods and are typically regarded as slowly varying background disturbances, which limits their ability to explain the widespread intraseasonal oscillations (ISOs) observed in the atmosphere. Given that ISOs share comparable spatial and temporal scales with planetary waves, a nonstationary Rossby waves framework provides a promising theoretical basis for interpreting their propagation characteristics.

In this study, we develop a theoretical framework for nonstationary horizontally propagating Rossby waves embedded in a prescribed background flow. We systematically derive the necessary conditions for the existence of three propagating solution branches, expressed equivalently in terms of the supremum and infimum of phase speed and wave period. Both the phase-speed and period supremum and infimum are determined by the background wind field, while the supremum and infimum of the period additionally depend on the zonal wavenumber. Two distinct regimes of admissible phase-speed and period ranges emerge, reflecting different background-flow configurations.

By combining these theoretical constraints with atmospheric reanalysis data, we diagnose the climatological supremum and infimum of nonstationary Rossby wave speriods in both the upper and lower troposphere over key tropical regions. The results reveal pronounced seasonal and regional variations in the theoretical period ranges due to differences in background circulation between tropospheric layers. In the upper troposphere, the equatorial Indian–western Pacific region does not support eastward-propagating solutions, whereas in the lower troposphere, eastward-propagating nonstationary waves with intraseasonal periods become possible under monsoonal flow conditions, consistent with monsoon ISO characteristics. During boreal winter and spring, the theoretical period supremum and infimum of lower-tropospheric nonstationary waves over the equatorial Indian–western Pacific exhibit Madden–Julian Oscillation (MJO)-like features. Over the equatorial Atlantic, vertically asymmetric background flows lead to distinct propagation characteristics between the upper and lower troposphere, consistent with observed ISO structures.

This work extends the classical theory of Rossby waves propagation by incorporating nonstationary waves and provides a unified theoretical interpretation linking nonstationary planetary waves to tropical intraseasonal variability.

How to cite: Liu, Y. and Li, J.: The theory and climatological characteristics of nonstationary horizontally Rossby waves, EGU General Assembly 2026, Vienna, Austria, 3–8 May 2026, EGU26-4697, https://doi.org/10.5194/egusphere-egu26-4697, 2026.

EGU26-5587 | ECS | Posters on site | AS1.20

The role of diabatic heating in Rossby wave breaking 

Marc Federer, Mona Bukenberger, and Talia Tamarin-Brodsky

Rossby wave breaking (RWB) is a key process through which synoptic-scale eddies reorganize the extratropical circulation, interacting with jet shifts, storm track variability, and the persistence of weather regimes. Despite extensive evidence that diabatic heating strongly influences synoptic eddies and supports blocking, its influence on when and how Rossby waves break remains largely unexplored. This gap limits our physical understanding of how moist processes reshape the potential vorticity structure that governs RWB and, in turn, the large-scale circulation.

We investigate the influence of diabatic processes on RWB using aquaplanet simulations at 100, 20, and 2.5 km horizontal resolution, which systematically alter the representation of diabatic heating. By comparing RWB frequency, geometry, and life cycles across resolutions, we isolate how the resolution-dependent representation of diabatic heating shapes RWB and the RWB-mediated circulation response, including jet latitude and storm track position. These idealized results are complemented by an observational analysis of RWB events and associated warm conveyor belts in ERA5 reanalyses.

Together, these analyses provide new physical insight into how diabatic processes modulate RWB and thereby shape the extratropical circulation, with implications for the interpretation of resolution-dependent circulation biases and the representation of moist processes in weather and climate models.


How to cite: Federer, M., Bukenberger, M., and Tamarin-Brodsky, T.: The role of diabatic heating in Rossby wave breaking, EGU General Assembly 2026, Vienna, Austria, 3–8 May 2026, EGU26-5587, https://doi.org/10.5194/egusphere-egu26-5587, 2026.

EGU26-6203 | ECS | Posters on site | AS1.20

MJO modulation on the cold extreme over the North America in a recent decade 

Minju Kim, Hyemi Kim, and Mi-kyung Sung

Over the last decade, North American cold extreme events have exhibited a notable shift in timing, occurring more frequently in February rather than earlier in winter. This delayed-season tendency suggests a strong influence from intraseasonal climate variability. In addition we identify a pronounced warming trend in sea surface temperature (SST) over the equatorial Pacific warm pool region, with the warming signal becoming particularly distinct during the most recent decade. We examine a dynamical linkage between the Madden-Julian Oscillation (MJO) and cold extremes over the North America in late-winter. As the equatorial Pacific warm pool region shows a warming trend, the eastward propagation speed of the MJO tends to slow, resulting in increased residence time and a higher occurrence frequency of MJO phase 7 during February for a recent decade. Under these conditions, persistent convection over the equatorial western Pacific enhances diabatic heating and strengthens tropical thermal forcing. This sustained forcing excites Rossby wave responses, facilitating downstream wave propagation into the central North America region. The resulting MJO teleconnections favor the development of large-scale flow patterns conducive to cold extremes over North America, thereby increasing the likelihood of February cold waves.

How to cite: Kim, M., Kim, H., and Sung, M.: MJO modulation on the cold extreme over the North America in a recent decade, EGU General Assembly 2026, Vienna, Austria, 3–8 May 2026, EGU26-6203, https://doi.org/10.5194/egusphere-egu26-6203, 2026.

EGU26-6324 | Orals | AS1.20

Uncovering Missing Eurasian Blocking Events and Their Robust Role in East Asian Winter Extremes 

Baek-Min Kim, Hayeon Noh, Ho-Young Ku, and Mi-Kyung Sung

Despite the profound influence of Eurasian blocking on the East Asian winter monsoon, its objective detection remains a challenge due to a systematic under-detection in standard algorithms. The widely adopted Hybrid method (HYB) applies a hemispheric constant threshold for anomaly detection prior to the flow reversal criterion. This constrained design neglects the lower geopotential height variability characteristic of the Eurasian continent, resulting in the premature filtering of meteorologically significant events. Here, we propose the Regional Hybrid method (RHYB), a refined framework that incorporates anomaly thresholds tailored to local geopotential height variance. By reconciling detection criteria with regional physical characteristics, RHYB explicitly captures "reversal-dominated" systems—events with clear flow disruption but modest amplitude—that were previously obscured. Using ERA5 reanalysis, we demonstrate that these newly identified events are robust drivers of severe wintertime cold surges over East Asia, indicating that their prior omission has led to a significant underestimation of regional climate risks. These results underscore that RHYB is an essential tool for accurately diagnosing midlatitude extremes and their evolving dynamics in a warming world.

How to cite: Kim, B.-M., Noh, H., Ku, H.-Y., and Sung, M.-K.: Uncovering Missing Eurasian Blocking Events and Their Robust Role in East Asian Winter Extremes, EGU General Assembly 2026, Vienna, Austria, 3–8 May 2026, EGU26-6324, https://doi.org/10.5194/egusphere-egu26-6324, 2026.

During April-May 2024, South China experienced an unprecedented extreme precipitation event, leading to substantial socioeconomic losses and human casualties. The primary driver of this event was an exceptionally strong moisture convergence linked to a local low-level horizontal trough. This trough was passively induced by two meridionally-oriented anomalous anticyclones located over the tropical western North Pacific and Northeast Asia. The tropical anticyclone facilitated the advection of abundant moisture towards southern China, while the Northeast Asian anticyclone impeded northward moisture export, jointly resulting in the observed extreme precipitation. The tropical anticyclone represents a typical Kelvin wave response to convection anomalies over the tropical Indian Ocean, which were forced by localized positive sea surface temperature (SST) anomalies. In contrast, the Northeast Asian anticyclone was a node of a mid-to-high latitude barotropic Rossby wave train. This Rossby wave train, initiated by the tropical Atlantic convection, was guided towards Northeast Asia by a transient eddy-driven polar front jet. Although the European Centre for Medium-Range Weather Forecasts showed high skill in predicting tropical Atlantic and Indian Ocean SST and associated convection anomalies, its ability to predict the April-May 2024 South China precipitation extreme was limited, primarily owing to difficulties in accurately predicting the strength of polar front jet. Overall, this study highlights the critical role of extratropical mean flow in modulating climate extremes that are responsive to tropical forcing.

How to cite: Liu, X. and Zhu, Z.: A manipulator of the extreme precipitation in South China behind the tropical sea surface temperature: the polar front jet, EGU General Assembly 2026, Vienna, Austria, 3–8 May 2026, EGU26-6369, https://doi.org/10.5194/egusphere-egu26-6369, 2026.

The mid-latitude jet streams play a defining role in shaping regional weather and climate, making it crucial to understand their current state as well as future changes under anthropogenic forcing. While model uncertainties have reduced over time, significant spread in projections still exists. The problem is exacerbated by a multitude of different jet stream drivers whose influence varies with season and region. This talk will discuss some work in trying to constrain future jet projections and give an overview of regional and seasonal characteristics of jet streams and their drivers. It will further discuss potential new avenues for establishing meaningful physical relationships within the high-dimensional frameworks of jet streams and drivers to better understand regional impacts.

How to cite: Breul, P.: Seasonal and regional jet stream changes, their drivers, and how to connect them., EGU General Assembly 2026, Vienna, Austria, 3–8 May 2026, EGU26-6800, https://doi.org/10.5194/egusphere-egu26-6800, 2026.

EGU26-7081 | ECS | Orals | AS1.20

Idealized shallow-water simulations of potential vorticity perturbations in zonal jet-waveguides and links to observed dynamical processes 

Vishnupriya Selvakumar, Michael Sprenger, Hanna Joos, and Heini Wernli

This study investigates the propagation of negative potential vorticity (PV) anomalies in idealized shallow-water simulations, with particular emphasis on how their evolution is governed by the structure and latitude of the jet. The initial conditions of the experiments constitute a zonally symmetric midlatitude jet representing a Rossby waveguide, and an isolated, axisymmetric negative PV vortex representing upper-level ridges and diabatically generated outflows associated with warm conveyor belts (WCBs).

The experiments provide a first systematic demonstration that vortex propagation is governed by the combined effects of intrinsic Rossby-wave propagation and advection by the jet, with the relative importance of these processes determined by the latitude of vortex initialization relative to the jet. Importantly, the resulting propagation behavior is not symmetric about the position of the vortex relative to the jet axis. 

These results also provide a direct dynamical analogue for the behavior of WCB outflows across different interaction types with the Rossby waveguide in the real atmosphere. In particular, vortices initiated close to the jet core or slightly equatorward correspond to no-interaction WCB outflows, which exhibit rapid advection and equatorward displacement. The ridge-interaction outflows, characterized by relatively weaker advection, are represented by vortices initialized on the poleward flank of the jet. In contrast, anomalies initialized farther poleward of the jet, with minimal direct influence from the westerlies and quasi-stationary behavior, correspond to blocking and cutoff interactions of WCB outflows.

The structure of the jet is equally important: variations in jet strength in the idealized simulations modulate the degree of eastward advection of the vortices, while changes in jet width and latitude primarily shift the spatial extent of the jet’s influence; in all cases, vortex behavior is governed by its relative position with respect to the Rossby waveguide.

How to cite: Selvakumar, V., Sprenger, M., Joos, H., and Wernli, H.: Idealized shallow-water simulations of potential vorticity perturbations in zonal jet-waveguides and links to observed dynamical processes, EGU General Assembly 2026, Vienna, Austria, 3–8 May 2026, EGU26-7081, https://doi.org/10.5194/egusphere-egu26-7081, 2026.

Building upon the established Rossby wave ray tracing framework, we introduce a phase tracing approach, derived from two-dimensional spherical Rossby wave theory on a horizontally non-uniform basic flow, to explicitly diagnose the evolution of wave crests and troughs along stationary Rossby wave rays.

The method is first applied to a series of idealized basic flows and validated against forced solutions from a barotropic model, with a particular emphasis on contrasting flows with and without a mean meridional wind. The theoretical phase tracing accurately reproduces both the ray pathways and the spatial structure of the simulated responses, in agreement with the theoretical prediction that local zonal and meridional wave scales are primarily controlled by the background flow rather than by the forcing scale. Importantly, the inclusion of a mean meridional flow emerges as a key dynamical ingredient: it not only permits one-way propagation of stationary Rossby waves across tropical easterlies, but also substantially enlarges both zonal and meridional wave scales, with the zonal scale becoming dominant, thereby shaping zonally elongated wave-train structures.

The framework is further applied to climatological summertime flows to investigate the structure of the Pacific–Japan (PJ) teleconnection. In the lower troposphere, northward-propagating Rossby waves embedded in the monsoonal southwesterly exhibit a characteristic ‘− / + / −’ phase pattern, while in the upper troposphere the phase evolution of southeastward- and southwestward-propagating Rossby waves displays a complementary ‘+ / − / +’ structure. The phase transition points along the rays are found to coincide closely with the centers of positive and negative vorticity anomalies, providing a clear dynamical explanation for the formation of the zonally elongated tripolar structure of the PJ teleconnection.

In addition, the Li–Yang wave ray flux (WRF) is employed to quantify the intensity of wave propagation along the diagnosed ray pathways, offering a complementary measure of wave activity during propagation.

Together, the phase tracing framework and wave ray flux diagnostics enable a precise and physically constrained diagnosis of atmospheric teleconnection patterns, and hold broad applicability for understanding the structure and variability of Rossby wave–mediated teleconnections in a realistic, non-uniform background flow.

How to cite: Zhao, S., Yang, Y., and Li, J.: Rossby wave phase tracing and its application to the structure of the Pacific–Japan teleconnection, EGU General Assembly 2026, Vienna, Austria, 3–8 May 2026, EGU26-8490, https://doi.org/10.5194/egusphere-egu26-8490, 2026.

EGU26-8842 | ECS | Posters on site | AS1.20

U-Net-based Objective Detection of Atmospheric Blocking  

Hayeon Noh, Hee-Jeong Park, Jeong-Hwan Kim, Baek-Min Kim, Daehyun Kang, and Mi-Kyung Sung

Atmospheric blocking is a quasi-stationary high-pressure circulation pattern that disrupts the midlatitude westerlies and is closely linked to high-impact weather extremes. Blocking detection, however, is highly method-dependent, often producing divergent blocking climatologies. This uncertainty also affects future projections, because climate-models frequently underestimate blocking relative to observations, limiting reliable assessments of blocking-related extremes. To address these challenges, we propose an objective deep learning–based framework for blocking detection that can be applied consistently across reanalysis datasets and climate model simulations.

We frame blocking detection as identifying spatial patterns in 2D atmospheric fields, analogous to semantic image segmentation, and employ a U-Net architecture to produce daily blocking masks. A two-stage training strategy is adopted: the network is first pre-trained using labels from the standard Hybrid Index (HYB; Dunn-Sigouin et al. 2013) across all seasons and then fine-tuned with a regionally modified variant, the Regional Hybrid Index (RHYB), using boreal-winter data. This strategy allows the model to incorporate regional dependence in background variability while retraining the broad blocking characteristics learned from HYB.

Although fine-tuning is restricted to boreal winter, the trained model generalizes to boreal summer and detect additional blocking events relative to HYB. When applied to the CESM2 Large Ensemble (LESN2), the framework mitigates the tendency of traditional indices to under-detect blocking frequency. Overall, this approach offers a more objective and transferable detection method that may improve the consistency of blocking diagnostics and support more reliable evaluations of blocking-related extremes in climate-model simulations.

How to cite: Noh, H., Park, H.-J., Kim, J.-H., Kim, B.-M., Kang, D., and Sung, M.-K.: U-Net-based Objective Detection of Atmospheric Blocking , EGU General Assembly 2026, Vienna, Austria, 3–8 May 2026, EGU26-8842, https://doi.org/10.5194/egusphere-egu26-8842, 2026.

EGU26-10101 | Orals | AS1.20

Dynamical Controls on Pacific-Origin Rossby Wave Propagation Across the North Atlantic–European Sector 

Ramon Fuentes-Franco, Julia F. Lockwood, Nick Dunstone, Adam Scaife, and Torben Koenigk

Pacific-origin atmospheric teleconnections play a central role in shaping Northern Hemisphere summer circulation, yet their downstream expression over the North Atlantic–European sector varies substantially across models. Here, we assess the robustness, structure, and background-state dependence of these teleconnections using CMIP6 large ensembles together with idealized SST-perturbation experiments from the Decadal Climate Prediction Project (DCPP-C). The study focuses on Rossby Wave Sources (RWS) over the northeastern Pacific and the resulting wavetrain that propagates across North America, the Atlantic, and Eurasia during boreal summer.

All large ensembles reproduce a coherent circumglobal Rossby wave train associated with enhanced RWS in the northeastern Pacific. However, the degree of agreement deteriorates downstream, with the largest spread occurring over the North Atlantic and Europe. Model differences in upper-tropospheric jet strength and meridional position strongly modulate the phasing and amplitude of the wave train in this region. Models with small jet biases compared to the ERA5 reanalysis maintain a realistic sequence of alternating geopotential height anomalies, while stronger or latitudinally displaced jets distort or shift the European node of the teleconnection.

Idealized DCPP-C experiments reveal that the Pacific-Atlantic interaction is strongly state-dependent. Simulations with intensified RWS (negative IPV phase) produce a PDO-like surface cooling pattern in the northeastern Pacific and a robust cooling response in the North Atlantic, confirming a direct trans-basin link. Atlantic SST anomalies further modulate the downstream atmospheric response: a warm Atlantic suppresses the Pacific–Europe teleconnection, while a cold Atlantic allows for a strengthened and more coherent wave train. Additional experiments combining AMV and IPV phases demonstrate that the Pacific signal can be either reinforced or damped depending on the Atlantic background state.

These results highlight the joint role of northeastern Pacific RWS variability, upper-level jet biases, and Atlantic SST state in shaping the structure and persistence of Pacific-to-Europe summer teleconnections. Improving the representation of these elements is essential to reduce inter-model spread and enhance confidence in simulated boreal-summer circulation patterns.

How to cite: Fuentes-Franco, R., Lockwood, J. F., Dunstone, N., Scaife, A., and Koenigk, T.: Dynamical Controls on Pacific-Origin Rossby Wave Propagation Across the North Atlantic–European Sector, EGU General Assembly 2026, Vienna, Austria, 3–8 May 2026, EGU26-10101, https://doi.org/10.5194/egusphere-egu26-10101, 2026.

    Winter precipitation over the Tibetan Plateau (TP) and the European Alps exhibits pronounced interannual to decadal variability, yet the stability of their large-scale linkage and the associated dynamical and moisture-related processes remain incompletely understood. Using multiple observational datasets and ERA5 reanalysis for the period 1940–2018, this study examines the decadal evolution of the TP–Alps winter precipitation relationship and its connections with atmospheric circulation and moisture transport.

    The results indicate that the relationship between winter precipitation over the two regions undergoes a marked decadal transition, with contrasting behavior before and after the late twentieth century. During the earlier period, precipitation variability over the TP and the Alps displays a coherent out-of-phase structure, whereas this relationship becomes substantially weaker in subsequent decades.

    Further analyses suggest that these changes are associated with variability in large-scale climate modes linked to tropical sea surface temperature anomalies and midlatitude atmospheric circulation. Regression analyses of upper-tropospheric circulation reveal organized Rossby wave responses over Eurasia, while the corresponding wave activity flux pathways exhibit pronounced decadal dependence, indicating changes in the background circulation structure. Consistent with these circulation variations, regressions of whole-column integrated vapor transport (IVT) show notable decadal differences in the strength and pathways of moisture transport toward the TP and the Alps, with implications for regional moisture convergence.

    Overall, this study highlights the importance of large-scale circulation variability and moisture transport in shaping the decadal evolution of winter precipitation linkages over Eurasia, providing a broader context for understanding long-term hydroclimate variability across distant mountainous regions.

How to cite: Qie, J. and Wang, Y.: Decadal changes in the teleconnection of winter precipitation across Eurasian mountainous regions, EGU General Assembly 2026, Vienna, Austria, 3–8 May 2026, EGU26-11470, https://doi.org/10.5194/egusphere-egu26-11470, 2026.

EGU26-12607 | ECS | Posters on site | AS1.20

Comparison of Different Blocking Indices and Analysis of Underlying Dynamics and Synoptic Situations 

Lisa Ruff and Stephan Pfahl

Atmospheric blockings are among the most frequently studied weather patterns. They not only cause extreme weather events and associated losses but also significantly influence general weather variability. A deeper understanding and more reliable prediction of these phenomena would therefore be of great value to both the scientific community and the public.

However, various definitions and identification methods for atmospheric blockings are currently applied, which can lead to inconsistent results and confusion. While all approaches are valid and justified, the precise differences between these definitions and their implications often remain unclear.

This study examines two widely used blocking algorithms: the Anomaly Index, which is based on vertically integrated potential vorticity (PV) anomalies (see Schwierz et al., 2004), and the Absolute Index, which identifies blockings through the reversal of the 500 hPa geopotential height gradient (see Davini et al., 2012).

The two indices differ substantially already with regard to climatological blocking frequencies: the Anomaly Index primarily detects blockings south of Greenland/Iceland, whereas the Absolute Index identifies a local maximum over southern Scandinavia. Our analyses have not indicated any systematic longitudinal, latitudinal, or temporal offset between the events captured by the two indices. A synoptic investigation suggests that the algorithms detect different types of blockings: the Absolute Index requires a Rossby wave breaking for identification, while the Anomaly Index considers an extended ridge sufficient.

Further research aims to clarify the differences in dynamical and synoptic conditions between these and other algorithms.

How to cite: Ruff, L. and Pfahl, S.: Comparison of Different Blocking Indices and Analysis of Underlying Dynamics and Synoptic Situations, EGU General Assembly 2026, Vienna, Austria, 3–8 May 2026, EGU26-12607, https://doi.org/10.5194/egusphere-egu26-12607, 2026.

EGU26-14616 | Posters on site | AS1.20

Method dependence of Antarctic atmospheric blocking and implications for large-scale circulation and climate extremes 

Deniz Bozkurt, Charlie Opazo, Julio C. Marín, Kyle R. Clem, Benjamin Pohl, Victoire Buffet, Vincent Favier, Tomás Carrasco-Escaff, and Bradford S. Barrett

Atmospheric blocking is a key driver of persistent circulation anomalies and associated extreme events in the Southern Hemisphere, yet its characteristics around Antarctica remain poorly understood due to methodological diversity and the absence of a consolidated, long-term dataset. This contribution investigates how methodological choices in blocking detection influence the inferred characteristics of Antarctic blocking and discusses the implications for large-scale circulation variability and climate extremes. Using ERA5 reanalysis for the period 1979 to 2024, we apply several established blocking diagnostics based on geopotential height and potential vorticity within a unified spatiotemporal framework. By standardising filtering, event identification, tracking, and aggregation procedures, we isolate differences that arise specifically from the diagnostic formulation rather than from implementation details. The comparison reveals substantial method dependent variability in blocking frequency, spatial extent, persistence, and intensity, particularly at high southern latitudes where circulation regimes differ from classical midlatitude blocking. Geopotential height based diagnostics identify a broader range of quasi stationary anticyclonic anomalies, including events extending toward the Antarctic continent, while potential vorticity based diagnostics isolate fewer and more spatially confined events associated with dynamically coherent upper level disturbances near the polar vortex. These methodological contrasts have direct implications for how blocking related climate extremes are interpreted, including links to temperature anomalies, moisture intrusions, and surface melt episodes. Differences in diagnosed event duration and location can substantially alter the attribution of extreme conditions to blocking regimes. Ongoing work examines how blocking characteristics identified by different diagnostics relate to variability in large scale circulation modes such as the Southern Annular Mode and ENSO, highlighting the importance of methodological awareness when assessing teleconnections and long term variability. Overall, the results demonstrate that Antarctic atmospheric blocking cannot be fully characterised by a single diagnostic perspective and that method dependence must be explicitly considered in studies of polar circulation variability, climate extremes, and future change.

How to cite: Bozkurt, D., Opazo, C., Marín, J. C., Clem, K. R., Pohl, B., Buffet, V., Favier, V., Carrasco-Escaff, T., and Barrett, B. S.: Method dependence of Antarctic atmospheric blocking and implications for large-scale circulation and climate extremes, EGU General Assembly 2026, Vienna, Austria, 3–8 May 2026, EGU26-14616, https://doi.org/10.5194/egusphere-egu26-14616, 2026.

EGU26-14802 | ECS | Orals | AS1.20

A Lagrangian perspective on jet streams 

Louis Rivoire, Yohai Kaspi, Talia Tamarin-Brodsky, and Or Hadas

Synoptic systems are understood to organize heat and momentum transport along jet streams, yet the diagnostics used to identify jets remain fundamentally Eulerian in nature. This creates conceptual tension: if the eddy-driven jet can be meaningfully separated from the synoptic eddies that maintain it, then it must be a persistent flow that Eulerian diagnostics are not designed to isolate. An alternative Lagrangian perspective on jet streams (JetLag) was recently developed and identifies jets not as maxima of wind speed (or derivative variables), but as maxima of isentropic displacement. In this view, jets become persistent features that remain identifiable over synoptic timescales. This definition recovers well-known features of the atmospheric circulation, with some systematic differences relative to Eulerian diagnostics. Here we adopt the Lagrangian definition to revisit jets and their variability using a hierarchy of models, ranging from idealized configurations to reanalyses. We explore the connections between synoptic systems and jets, and those between the upper troposphere and the surface.

How to cite: Rivoire, L., Kaspi, Y., Tamarin-Brodsky, T., and Hadas, O.: A Lagrangian perspective on jet streams, EGU General Assembly 2026, Vienna, Austria, 3–8 May 2026, EGU26-14802, https://doi.org/10.5194/egusphere-egu26-14802, 2026.

EGU26-15695 | ECS | Posters on site | AS1.20

Influences of planetary- and synoptic-scale Rossby waves on the intraseasonal variability of Yangtze River Basin precipitation in summer 

Peishan Chen, Riyu Lu, Liang Wu, Nedjeljka Žagar, and Frank Lunkeit

The Yangtze River Basin (YRB) is a critical economic and agricultural center in China, and the large summer precipitation variability here causes severe effects on social and economic. It is well known that the YRB precipitation (YRBP) is affected by multi factors, including anomalous anticyclone over the western North Pacific and local cyclone in the lower troposphere, the meridional displacement of the East Asian jet in the upper troposphere, et al. However, from the perspective of wave dynamics, influences of multi-scale Rossby waves on the intraseasonal variability of Yangtze River Basin precipitation are poorly understood. In this study, the authors used the three-dimensional multivariate circulation decomposition to quantify the multi-scale Rossby wave variability associated with the YRBP. Rossby waves with zonal wavenumber (k) being 1-20 are analyzed and categorized into planetary (k=1-3) and synoptic (k=4-20) scales, with waves of larger wavenumbers excluded due to their negligible amplitudes.  
Results indicate that the planetary- and synoptic- scale Rossby waves associated with the YRBP are favorable to the precipitation by different physical processes. On the one hand, planetary-scale Rossby waves contribute to the large-scale circulation anomalies, including the anticyclone over the western North Pacific, and the zonal cyclone over East Asia in the upper troposphere, which suggests a southward displacement of the East Asian jet. On the other hand, synoptic-scale Rosby waves are featured by a zonal wave train and contribute to local cyclonic anomalies in the lower troposphere to enhance the YRBP. 
Further lead-lag regression analysis is on-going.

How to cite: Chen, P., Lu, R., Wu, L., Žagar, N., and Lunkeit, F.: Influences of planetary- and synoptic-scale Rossby waves on the intraseasonal variability of Yangtze River Basin precipitation in summer, EGU General Assembly 2026, Vienna, Austria, 3–8 May 2026, EGU26-15695, https://doi.org/10.5194/egusphere-egu26-15695, 2026.

The climatological quasi-stationary waves (QSW) amplitude has a distinct spatial pattern, with clear zonal asymmetries, particularly in the Northern Hemisphere; those asymmetries must be impacted by stationary forcings such as land, topography, and sea surface temperatures (SSTs). To investigate the effects of stationary forcings on QSW characteristics, including their duration and spatial distribution, we conducted eight CAM6 simulations with prescribed SSTs, spanning realistic, semi-realistic, and fully idealized configurations. Stationary forcings tend to extend the duration of QSWs and strongly impact their zonal asymmetric distribution. QSWs are primarily influenced by both the local stationary wavenumber Ks, which depends on jet speed and its second-order meridional gradient, and by the strength of transient eddies. However, the covariation between transient eddies and QSWs varies across different types of stationary forcings. For example, in experiment pairs showing the impact of zonal SST patterns, the correlation between changes in QSW strength and transient eddies is stronger, while the correlation with stationary wavenumber is of similar magnitude across all experiments. In some cases, QSW strength is also associated with the strength of the stationary waves. When the timescale of the QSWs is changed, the relative contributions from different mechanisms changes, but stationary wavenumber Ks and transient eddies strength are important in all time scales for experiments with realistic land. This work suggests that transient Rossby waves with given wavenumbers can become stationary under background conditions with the corresponding stationary wavenumbers.

How to cite: Fei, C. and White, R.: The Role of Topography, Land and Sea Surface Temperatures on Quasi-Stationary Waves in Northern Hemisphere Winter: Insights from CAM6 Simulations, EGU General Assembly 2026, Vienna, Austria, 3–8 May 2026, EGU26-16052, https://doi.org/10.5194/egusphere-egu26-16052, 2026.

EGU26-16164 | Posters on site | AS1.20

A role of cold air outbreak in an early winter heavy snowfall event over the Korean Peninsula 

Yujoo Oh, Eun-hyuk Baek, and Joowan Kim

Cold air outbreaks (CAOs), characterized by the southward intrusion of high-latitude cold air into the midlatitudes, often cause severe weather phenomena such as extreme cold waves and heavy snowfall during winter months. This study investigates the critical role of a CAO in a record-breaking heavy snowfall event over the Korean peninsula in November 2024. During the event, the accumulated snowfall was recorded over 43 cm across the central region of the Korean Peninsula for about 3 days, causing severe socioeconomic disasters.

Two days prior to the heavy snowfall event, an upper-level cut-off low generated over eastern Siberia propagated southward, inducing an extreme CAO over the northern Peninsula. The cut-off low enhanced an upper-level frontogenesis with tropopause folding, which transported cold and dry air downward and formed a barotropic cold dome over the region. Concurrently, the Yellow Sea located west of the Korean Peninsula exhibited anomalous high sea surface temperatures, which created an intense air-sea temperature contrast exceeding 17°C. The resulting sensible and latent heat fluxes triggered meso-scale convection, which persistently intruded into the central region of the Korean Peninsula along the southern boundary of the cold dome. It is known that CAO is often accompanied by atmospheric blocking linked to upper-level Rossby wave breaking. In this event, Kamchatka blocking prevented the upper-level cut-off low from propagating eastward and maintained it in a quasi-stationary state during about 3 days. Consequently, the unexpected CAO enhanced by quasi-stationary cut-off low and the persistent snowstorms by lake-effect resulted in the record-breaking heavy snowfall over the Korean Peninsula during early winter.

Our findings demonstrate that upper-level atmospheric circulation patterns, which have received little attention in previous studies, can play a crucial role in heavy snowfall events over the Korean Peninsula. 


Key words: Heavy snowfall, Cold air outbreak, cut-off low, air-sea contrast, blocking


This work was funded by the Korea Meteorological Administration Research and Development Program under Grant (RS-2023-00240346)

How to cite: Oh, Y., Baek, E., and Kim, J.: A role of cold air outbreak in an early winter heavy snowfall event over the Korean Peninsula, EGU General Assembly 2026, Vienna, Austria, 3–8 May 2026, EGU26-16164, https://doi.org/10.5194/egusphere-egu26-16164, 2026.

EGU26-16728 | ECS | Orals | AS1.20

A simple statistical approach for establishing dynamical linkages between specific atmospheric circulation patterns and spatially compounding persistent extremes and impacts 

Dominik Diedrich, Miguel Lima, Ricardo Trigo, Ana Russo, Giorgia Di Capua, Guruprem Bishnoi, and Reik V. Donner

During the last years, the statistical analysis of compound extremes has gained increasing interest among the scientific community due to the multiple threats posed by such events to society, economy, and the environment. In many situations, this analysis is based on bivariate extreme value theory and measures provided by this framework. Such methods may however not properly address two relevant aspects: the non-zero duration of extreme events (which can be rather persistent, e.g. in the case of droughts or heatwaves, heavily violating the independence assumption of classical extreme value theory) and the fact that not all events of practical relevance can actually be described as cases falling into the tails of the continuous distribution of some observable of interest.

A versatile approach addressing the non-extremeness aspect is event coincidence analysis (ECA), which quantifies the empirical frequency of co-occurring events of arbitrary types and allows its comparison with the values for certain random null models like independent Poisson processes with prescribed event rates. While standard ECA builds upon the concept of temporal point processes and hence may be criticized for not applying to persistent events, a new methodological variant called interval coverage analysis (InCA) provides a straightforward generalization specifically addressing co-occurrence properties of persistent events. To highlight the broad range of potential applications of ECA and InCA in the context of compound event studies, we study two examples of co-occurrences between specific atmospheric circulation configurations and different types of surface extremes.

Example 1 highlights the instantaneous as well as time-lagged co-occurrence between boreal summer Northern hemispheric jet stream configurations with two distinct zonal wind maxima (“double jet”) and atmospheric heat waves. The presented results demonstrate that double jet conditions over certain sectors are closely linked with a statistically significant enhancement or suppression of heatwave activity in distinct regions, resembling the spatial patterns of atmospheric wave trains. These patterns provide a useful starting point for further targeted research to reveal the underlying atmospheric circulation mechanisms and their association with other spatially compounding extreme events and impacts.

Example 2 subsequently addresses the co-occurrence of subtropical ridges and atmospheric blockings with precipitation patterns in the Southern hemisphere. The obtained results indicate that the presence of ridges in specific sectors is commonly accompanied by a suppression of precipitation within these sectors, while surrounding regions may exhibit characteristic spatial clusters of significantly elevated probability of precipitation.

This work has been partially supported via the JPI Climate/JPI Oceans NextG-Climate Science project ROADMAP and the bilateral German-Portuguese science exchange project EXCECIF (jointly funded by DAAD and FCT).

How to cite: Diedrich, D., Lima, M., Trigo, R., Russo, A., Di Capua, G., Bishnoi, G., and Donner, R. V.: A simple statistical approach for establishing dynamical linkages between specific atmospheric circulation patterns and spatially compounding persistent extremes and impacts, EGU General Assembly 2026, Vienna, Austria, 3–8 May 2026, EGU26-16728, https://doi.org/10.5194/egusphere-egu26-16728, 2026.

EGU26-19201 | Orals | AS1.20

Perturbation and uncertainty growth along the jet stream: the role of tropical cyclones, jet stream dynamics, and sensitivity to resolution 

Mark Rodwell, Aristofanis Tsiringakis, Suzanne Gray, John Methven, and Doug Wood

We investigate the development of ensemble forecast uncertianty associated with jet stream perturbations and dynamics. We partition uncertainty growth into diabatic and dynamic processes. A case study focusses on the recent Fujiwara-style interaction of Hurricanes Humberto and Imelda , and their subsequent interactions with the jet stream. These are seen to be able to perturb the jet and inject considerable uncertainty via diabatic processes. Later, dynamical processes along the jet (such as the development of cut-of features) act to further magnify uncertainty. The result for Europe was Storm Amy, which caused significant damage and some loss of life, but which was not well predicted. Through further experimentation, we try to understand the key diabatic and dynamical processes, how they combine to govern operational predictive skill, and their sensitivity to model resolution.

How to cite: Rodwell, M., Tsiringakis, A., Gray, S., Methven, J., and Wood, D.: Perturbation and uncertainty growth along the jet stream: the role of tropical cyclones, jet stream dynamics, and sensitivity to resolution, EGU General Assembly 2026, Vienna, Austria, 3–8 May 2026, EGU26-19201, https://doi.org/10.5194/egusphere-egu26-19201, 2026.

EGU26-19251 | Orals | AS1.20

Do Rossby wave packet envelopes exhibit enhanced predictability? 

Michael Riemer and Lorenz Gölz

Rossby wave packets (RWPs) organize large-scale energy transport in the atmosphere. The significance of this energy transport for atmospheric predictability and teleconnections has long been recognized. We here focus on RWPs along the midlatitude jet, which have received much attention as predictable precursors to high-impact weather events. RWPs are frequently considered as physical entities identified by the Rossby-wave envelope. From this perspective, RWPs appear as features on a scale larger than that of the underlying troughs and ridges. In particular, a long-standing hypothesis by Lee and Held (1993) states that "the packet envelope should be more predictable than the individual weather systems, because the packet can remain coherent despite chaotic internal dynamics". Testing this hypothesis with ERA5 re-forecasts, we find that the RWP envelope does not exhibit this hypothesized higher predictability, at least when compared to the pattern of the underlying Rossby waves themselves, and until the end of the available lead time range of 10 days. This statistical result is substantiated by the examination of the underlying error-growth mechanisms. We will further provide a dynamics-based explanation of the counterintuitive result that the (seemingly) larger-scale envelope feature does not exhibit higher predictability. We conclude the presentation with a discussion of the role of the envelope perspective for predictability questions beyond the medium range.

How to cite: Riemer, M. and Gölz, L.: Do Rossby wave packet envelopes exhibit enhanced predictability?, EGU General Assembly 2026, Vienna, Austria, 3–8 May 2026, EGU26-19251, https://doi.org/10.5194/egusphere-egu26-19251, 2026.

EGU26-19340 | Orals | AS1.20

Concurrent heat waves and their linkage to large-scale meridional heat transports through planetary-scale waves 

Valerio Lembo, Gabriele Messori, Davide Faranda, Vera Melinda Galfi, Rune Grand Graversen, and Flavio Emanuele Pons

There is increasing interest within the community in the mechanisms behind the development of concurrent heatwaves, i.e., heatwaves that occur simultaneously in geographically remote regions. This interest is motivated by their socio-economic implications and by the fact that they are occurring more frequently with global warming.

While the large-scale atmospheric dynamical drivers of concurrent heatwaves have often been emphasized, with a focus on quasi-stationary wave patterns favoring the formation of blockings, particularly in Summer, the thermodynamic drivers have so far received less attention, despite the recognized role of moisture and latent heat transport for the development of blockings, especially in Winter.

Here, we relate extremes in hemispheric meridional heat transport (MHT) to occurrences of hemispheric land-surface temperature (LST) warm and cold extremes. We find that the combination of extremely weak MHT and extremely warm hemispheric LST days occurs significantly more often than other combinations, and that these events are associated with a substantial amount of concurrent heatwaves in the Northern Hemisphere mid-latitudes, both in boreal Winter and Summer. We highlight that, in Summer, the phase and amplitude of high-latitude blockings associated with these occurrences lead to vanishing, and sometimes even equatorward, overall MHT, together with an intensification of the Pacific branch of the jet stream. In Winter, MHT is largely suppressed by an excessively zonal flow, bringing mild and moist air towards continental regions, both in Eurasia and North America. The reversal or suppression of zonal wavenumber-2 and -3 contributions to MHT is found to be related to these MHT extremes, pointing towards the predominant role of ultra-long planetary-scale waves.

How to cite: Lembo, V., Messori, G., Faranda, D., Galfi, V. M., Graversen, R. G., and Pons, F. E.: Concurrent heat waves and their linkage to large-scale meridional heat transports through planetary-scale waves, EGU General Assembly 2026, Vienna, Austria, 3–8 May 2026, EGU26-19340, https://doi.org/10.5194/egusphere-egu26-19340, 2026.

EGU26-19586 | Posters on site | AS1.20

Jet regimes, waviness metrics, and links to extreme weather 

Ruth Geen, Myles Jones, Ruby Riggs, and Yuran Cao

Extreme midlatitude weather is often associated with pronounced Rossby waves. This has motivated interest in how the ‘waviness’ of the atmosphere is changing as Earth warms. Multiple summary metrics have been used to assess midlatitude waviness, which include both descriptions of the magnitudes of associated anomalies in geopotential height, and geometric measures of deviations of the jet from a more zonal state.

Recent work illustrated that a) these metrics can respond differently to warming, and that the same metric can respond differently to warming applied in different ways (Geen et al. 2023), and b) that different metrics can link to rather different patterns of extreme temperature (Roocroft et al. 2025). It remains unclear what specific types of characteristic jet structures these various metrics capture, and how these dynamically link to surface weather extremes.

Here, we first explore how different metrics relate to extreme winter weather events (cold, rain and wind) over Europe and North America, and how these relationships compare to known modes of climate variability such as the NAO. Next, to explore underlying jet structures driving these extremes, we apply a Self Organising Maps analysis to 500-hPa geopotential height anomalies. This allows us to map the values taken by different metrics and the likelihoods of extreme events for different jet configurations in a reduced dimensionality space.


References

Geen, R., Thomson, S. I., Screen, J. A., Blackport, R., Lewis, N. T., Mudhar, R., ... & Vallis, G. K. (2023). An explanation for the metric dependence of the midlatitude jet‐waviness change in response to polar warming. Geophysical Research Letters, 50(21), e2023GL105132.

Roocroft, E., White, R. H., & Radić, V. (2025). Linking atmospheric waviness to extreme temperatures across the Northern Hemisphere: Comparison of different waviness metrics. Journal of Geophysical Research: Atmospheres130(20), e2024JD042631.

How to cite: Geen, R., Jones, M., Riggs, R., and Cao, Y.: Jet regimes, waviness metrics, and links to extreme weather, EGU General Assembly 2026, Vienna, Austria, 3–8 May 2026, EGU26-19586, https://doi.org/10.5194/egusphere-egu26-19586, 2026.

EGU26-20078 | ECS | Posters on site | AS1.20

Dynamical linkage between blocking predictability and jet stream quasi-stationary states 

Suzune Nomura and Takeshi Enomoto

This study investigates atmospheric blocking from the perspective of the instantaneous stationarity of the jet stream. The framework of the quasi-stationary state (QS) dynamical theory is applied to characterize the behavior of ensemble prediction members. Using the Japanese Reanalysis for Three Quarters of a Century (JRA-3Q), we classified atmospheric conditions over the Northern Hemisphere into states characterized by small and large temporal variability in jet stream tendency, referred to as QS and Non-QS respectively, and examined the relationship between the former and blocking patterns.

During QS conditions, the westerlies exhibited significant meandering, and blocking occurred regardless of the blocking type (Omega or Dipole). These results are consistent with blocking defined by potential vorticity reversal at the dynamical tropopause and its persistence.

Based on linearized equations, a relationship is identified between QS and the non-stationary minimum point (MP), where at least one of its eigenvalues is zero. Analysis of forecast data from JMA's Global Ensemble Prediction System (GEPS) revealed that ensemble spread tends to increase with forecast time when the initial state is QS. This result is consistent with the proposed dynamics. Conversely, under a Non-QS initial state, initial uncertainty persists throughout forecast evolution.

These findings suggest that atmospheric blocking is a manifestation of the instantaneous stationarity of the jet stream, indicating that this theoretical framework is valuable for examining the predictability of blocking and interpreting ensemble forecasts.

How to cite: Nomura, S. and Enomoto, T.: Dynamical linkage between blocking predictability and jet stream quasi-stationary states, EGU General Assembly 2026, Vienna, Austria, 3–8 May 2026, EGU26-20078, https://doi.org/10.5194/egusphere-egu26-20078, 2026.

EGU26-20138 | ECS | Orals | AS1.20

Linking jet stream and Rossby wave spectra changes within internal variability and climate change responses 

Zhenghe Xuan, Jacopo Riboldi, and Robert Jnglin Wills

The occurrence and magnitude of extreme events have been linked to quasi-stationary waves (QSW). However, the response of QSWs to climate change is uncertain. Here, we gain insight into the forced QSW response by looking at internal variability in QSW activity. The Rossby wave spectra is highly influenced by the location and strength of the background jet stream. It is known that the poleward shift of the jets in response to external forcing resembles internal variability in the jet such as the Southern Annular Mode. Although open questions remain on the driving mechanisms of these jet responses, we can identify common changes in the Rossby wave spectra within internal variability and the climate change response. 

Using the daily meridional velocity from the Community Earth System Model 2 Large Ensemble, we calculate a space-time spectral decomposition over the midlatitudes, revealing changes in the wavenumber-phase speed structure of synoptic Rossby waves. We investigate the climate change response of the spectra and use maximum covariance analysis between the spectra and the vertically integrated zonal wind to find co-varying patterns of internal variability. Under the SSP3-7.0 scenario in the Southern Hemisphere, we observe a polewards shift of the jet, faster jet speeds, and a corresponding shift of the spectra perpendicular to the barotropic Rossby wave dispersion relationship. This results in a decrease in power in higher wavenumbers and an increase in lower wavenumbers across all phase speeds, including quasi-stationary ones, corresponding to a decrease in stationarity (i.e. wave power with near-zero phase speed). We find this relationship holds on monthly timescales and in response to climate change. The response in the Northern Hemisphere is more complex and differs between the Atlantic and Pacific basin. Our results provide a simple explanation for the wavenumber-dependent changes in Rossby waves and the reduced stationarity of QSWs in response to climate change, which have implications for future changes in weather extremes.

How to cite: Xuan, Z., Riboldi, J., and Jnglin Wills, R.: Linking jet stream and Rossby wave spectra changes within internal variability and climate change responses, EGU General Assembly 2026, Vienna, Austria, 3–8 May 2026, EGU26-20138, https://doi.org/10.5194/egusphere-egu26-20138, 2026.

EGU26-20715 | ECS | Orals | AS1.20

European Heatwave Exacerbated by Summer Arctic Changes 

El Noh, Joowan Kim, Yu Kosaka, Sang-Wook Yeh, Seok-Woo Son, Sang-Yoon Jun, and Woosok Moon

Since 2010, European heatwaves have dramatically escalated in both duration and severity. The cumulative intensity of European heatwaves has surged by over 50% in the recent decade. Recent studies have reported accelerating Arctic warming and associated mid-latitude circulation changes. However, its summer impacts remain uncertain. Here we provide evidence that the recent summer changes in the Arctic play a critical role in the escalation of European heatwaves. The Arctic has experienced unprecedented regional changes with substantial sea-ice loss since 2010. The Barents-Kara Seas have warmed by 2.3 °C per decade, while western Greenland has cooled by 0.6 °C per decade. The temperature changes in these two regions influenced European weather through two different pathways: 1) Barents-Kara Sea warming weakened daily weather activities over western Eurasia, thereby promoting persistently hot weather; 2) Greenland cooling shifted the North Atlantic jet stream, which allowed easy invasion of warm flows from the subtropics and Sahara. These pathways have intensified concurrently since 2010, which likely exacerbates heatwave risks in Europe. 

How to cite: Noh, E., Kim, J., Kosaka, Y., Yeh, S.-W., Son, S.-W., Jun, S.-Y., and Moon, W.: European Heatwave Exacerbated by Summer Arctic Changes, EGU General Assembly 2026, Vienna, Austria, 3–8 May 2026, EGU26-20715, https://doi.org/10.5194/egusphere-egu26-20715, 2026.

The response of upper-tropospheric jet streams to warming effects is a pivotal uncertainty in current climate projections. This study provides a rigorous diagnostic analysis of the spatio-temporal variability and seasonal evolution of jet stream characteristics over North America (NA) and the North Pacific Ocean (NPO) during the four-decade period of 1984-2023. Utilizing high-resolution ERA5 and NCEP/NCAR reanalysis datasets, we analyzed the three-dimensional structure of jet cores and their interaction with localized baroclinic environments.

Our diagnostics reveal two distinct centers of action where jet dynamics are significantly perturbed: the North Pacific Ocean (NPO) and the Eastern portion of North America (EPNA). A systematic poleward migration of the jet axes approximately 10 degrees in latitude is identified across all seasons except summer, concurrent with a persistent altitudinal ascent. Seasonal analysis indicates that trajectory instability reaches its maximum during summer in the NPO, whereas the most pronounced variability in EPNA occurs during the autumn months. Notably, our results establish a significant positive trend in zonal wind speeds, ranging from 0.5 to 1.5 m/s per decade, which is closely coupled with enhanced meridional temperature gradients in the mid-to-upper troposphere.

Furthermore, wavelet power spectrum analysis across multiple pressure levels (100-400 hPa) uncovers dominant multi-annual periodicities of 5, 7, and 10 years, suggesting robust modulation by large-scale climatic oscillations. A critical finding is the divergent altitudinal behavior between the two regions: while NPO jet streams exhibit an upward trend with stabilized flow, winter and autumn jet streams over EPNA demonstrate a significant downward intrusion into the lower troposphere. This vertical shift facilitates intensified moisture advection from the Gulf of Mexico, potentially exacerbating the frequency and magnitude of extreme hydrological events, such as atmospheric rivers, in northeastern Canada. These findings underscore the non-uniform regional response of the global circulation to a warming atmosphere and provide a framework for improving regional climate predictability.

How to cite: Salimi, S. and Ouarda, T. B. M. J.: Decadal Evolution of Mid-latitude Jet Stream Dynamics: Spatio-temporal Trends and Seasonal Oscillations over North America and the North Pacific Ocean, EGU General Assembly 2026, Vienna, Austria, 3–8 May 2026, EGU26-21982, https://doi.org/10.5194/egusphere-egu26-21982, 2026.

EGU26-23268 | Posters on site | AS1.20

Atmospheric waveguides, quasi-stationary waves, and temperature extremes 

Rachel White and Lualawi Mareshet Admasu

Atmospheric waveguides can affect the propagation of Rossby waves, and have been hypothesized to be associated with amplified quasi-stationary waves and thus to extreme weather events in the mid-latitudes. Here, we compare different methods of calculating temporally and spatially varying waveguides, including different ways of separating the waveguides (background flow) from waves, and show that upstream PV waveguides are often present in the days prior to heatwaves. We compare waveguides from potential vorticity (PV) gradients (“PV waveguides”) with barotropic waveguides based on what is known as the stationary wavenumber, or KS (“KS waveguides”). Composites of days with high waveguide strength over particular regions show distinct differences between the two waveguide definitions. Strong KS waveguides in many regions are associated with a double-jet structure, consistent with previous research; this structure is rarely present for strong PV waveguides. The presence of high geopotential heights occurs with the double-jet anomaly, consistent with atmospheric blocking creating the KS waveguide conditions through the influence on local zonal winds, highlighting that this methodology does not sufficiently separate non-linear perturbations (i.e. blocking) from the waveguides, or background flow. Significant positive correlations exist between local waveguide strength and the amplitude of quasi-stationary waves; these correlations are stronger and more widespread for PV waveguides than for KS waveguides, and they are strongest when the rolling-zonalization background flow method is used. We caution against using KS waveguides on temporally and/or zonally varying scales and recommend rolling-zonalization PV waveguides for the study of waveguides and their connections to quasi-stationary atmospheric waves. Using PV waveguides, we find strong connections with heatwaves, with enhanced waveguides upstream from 1-6 days prior to heatwave days.

How to cite: White, R. and Admasu, L. M.: Atmospheric waveguides, quasi-stationary waves, and temperature extremes, EGU General Assembly 2026, Vienna, Austria, 3–8 May 2026, EGU26-23268, https://doi.org/10.5194/egusphere-egu26-23268, 2026.

EGU26-112 | ECS | Orals | NP6.6

Lagrangian methods in 2D annular Rayleigh-Bénard convection 

Luis Álamo, Jezabel Curbelo, and Kathrin Padberg-Gehle

In this project, we approach convective instabilities from the perspective of dynamical systems theory, as we seek to identify structures that organize the global and long-term behavior of a system. Lagrangian Coherent Structures (LCSs) are patterns in fluid flows delineating regions that share a certain notion of material coherence, shape global transport and act as mixing barriers [5]. Thus, characterizing these objectively defined structures allows us to gain new insight into how certain invariant manifolds have a fundamental impact on transport and mixing processes in complex natural environments.

On the other hand, thermal convection turns out to be a fundamental process in geophysical and astrophysical flows by driving large amounts of materials through plumes that allow physical processes to be in constant renewal. Examples are convective cores in massive stars and the interior of planets [1]. It also happens to be a crucial driver of turbulence in even more complicated systems, such as accretion disks [8].

To this end, we present an analysis of coherent structures in convective flows in a particularly unexplored geometry: a 2D annulus under the action of a radial inwardly increasing gravity contribution, g∝1/r (r denotes radius). As disks in astrophysical settings are often modeled as rotating concentric cylinders with small height-to-radius ratio, this simple 2D model allows us to make a fairly global picture of the 3D case with reduced computational cost. Thus, we perform hydrodynamic simulations using spectral tau methods via open-source software Dedalus3 [4]. Equipped with a set of tracer trajectories, we implement different (but complementary) coherent structures approaches, namely objective geometrical techniques such as Finite-Time Lyapunov Exponents (FTLE) and Lagrangian-Averaged Vorticity Deviation (LAVD) [6-7] as well as network-based methods [8].

In this presentation, we will discuss our latest results combining these approaches. We will also make some useful comparisons with [2-3] that complement their Eulerian study in the same geometry.

References

[1] E.H. Anders et al., The Astrophysical Journal, 926, 169 (2022).

[2] A. Bhadra, O. Shiskina, X. Zhu, Journal of Fluid Mechanics, 999, R1 (2024).

[3] A. Bhadra, O. Shiskina, X. Zhu, International Journal of Heat and Mass Transfer, 241, 126703 (2025).

[4] K.J. Burns, G.M. Vasil, J.S. Oishi, D. Lecoanet, B.P. Brown, Phys. Rev. Res., 2, 23–68 (2020).

[5] G. Haller and G. Yuan, Physica D: Nonlinear Phenomena, 147, 352-370 (2000)

[6] G. Haller, Journal of the Mechanics and Physics of Solids, 86, 70–93 (2015).

[7] G. Haller, A. Hadjighasem, M. Farazmand, F. Huhn, Journal of Fluid Mechanics, 795,

136–173 (2016).

[8] C. Schneide, P.P. Vieweg, J. Schumacher, K. Padberg-Gehle, Chaos, 32, 013123 (2022).

[9] R. Teed and H. Latter, MNRAS, 507, 5523-5541 (2021).

How to cite: Álamo, L., Curbelo, J., and Padberg-Gehle, K.: Lagrangian methods in 2D annular Rayleigh-Bénard convection, EGU General Assembly 2026, Vienna, Austria, 3–8 May 2026, EGU26-112, https://doi.org/10.5194/egusphere-egu26-112, 2026.

Ocean currents transport material like nutrients, plankton and plastic over the globe. The most natural way to study these transport pathways and the connections between ocean basins is by using trajectories, computed by simulating virtual Lagrangian particles in fine-resolution ocean models.

In this presentation, I will show how my team uses our open source parcels-code.org framework to simulate the dispersion of virtual plastic particles by the three-dimensional ocean flow. I will discuss how we develop new parameterizations for subgrid-scale transport processes of buoyant plastics; and compare these parameterizations to field measurements.

I will particularly focus on how we combine the resulting dispersion maps with estimates of plastic pollution sources and then apply Bayesian inference techniques to find the most likely sources for heavily polluted locations.

While our application is plastic pollution in the ocean, the framework could be applied in other geophysical contexts where the sources of a signal in a complex Lagrangian transport process have to be determined, from air pollution tracking to glaciological proxy reconstruction.

How to cite: van Sebille, E.: Combining Lagrangian simulations and Bayesian inference for source attribution of ocean plastic pollution, EGU General Assembly 2026, Vienna, Austria, 3–8 May 2026, EGU26-1946, https://doi.org/10.5194/egusphere-egu26-1946, 2026.

EGU26-4256 | ECS | Orals | NP6.6

Vertical distribution of weakly inertial, quasi-neutrally buoyant particles in a convective ocean mixed layer 

Luz Andrea Silva Torres, Stefano Berti, and Enrico Calzavarini

Microplastic pollution is one of the major threats to ocean health. However, the processes governing the transport and redistribution of microplastics remain poorly understood due to the interaction of multiple physical mechanisms at different scales  We investigate the vertical transport and concentration of quasi-neutrally buoyant microplastics by direct numerical simulations of small inertial particles in an inhomogeneous turbulent flow. An idealized two-dimensional convective mixed-layer model reproduces some relevant features of the upper ocean: at the surface, a well-mixed region where temperature and density are nearly homogeneous, and a lower region of weak mixing and gravity waves with strong temperature and density gradients. The dynamics of these inertial particles in both regions are analyzed using a simplified model derived from the Maxey-Riley-Gatignol equation. The model assumes particle density equal to a reference fluid density at a given depth, with density variations only affecting buoyancy (i.e., the Boussinesq approximation). Our results show that temperature differences along Lagrangian paths determine whether particles settle at specific depths or remain near the surface. The observed vertical concentration profiles in the thermocline are explained using a discrete particle framework based on a stochastically forced wave–driven relaxation model. Particle accumulation occurs preferentially near specific depths where internal gravity wave signatures are detected through oscillations of the local isopycnal structure. In the proposed description, these wave-induced fluctuations imprint a structured modulation of the concentration profile, while turbulent fluctuations are represented as a white-noise forcing that accounts for particle spreading around the accumulation depths. The relative importance of wave-driven relaxation and turbulent diffusion varies with depth, reflecting the anisotropic and inhomogeneous nature of the stratified flow. This approach consistently reveals that, while gravity has a pivotal role on particle transport and accumulation, the fluid’s eddy diffusivity can also have non-negligible effects on the spreading of particles, depending on the physical properties of the latter.

How to cite: Silva Torres, L. A., Berti, S., and Calzavarini, E.: Vertical distribution of weakly inertial, quasi-neutrally buoyant particles in a convective ocean mixed layer, EGU General Assembly 2026, Vienna, Austria, 3–8 May 2026, EGU26-4256, https://doi.org/10.5194/egusphere-egu26-4256, 2026.

EGU26-7025 | ECS | Orals | NP6.6

Mesoscale fronts and eddies shape neon flying squid distribution through effective transport 

Zixuan Niu, Zhaohui Chen, Wei Yu, and Jia-Zhen Wang

Mesoscale oceanic fronts and eddies form coherent structures that regulate transport, retention, and mixing in the upper ocean, yet how their internal physical and biogeochemical structure shapes the distribution of mobile predators remains poorly understood. Here we adopt an active Lagrangian perspective to investigate the distribution of neon flying squid (Ommastrephes bartramii) using a decade-long fisheries dataset from the Northwest Pacific, combined with mesoscale diagnostics and Biogeochemical Argo observations.

Across multiple frontal systems, squid catches exhibit a robust cross-frontal asymmetry: catches are on average 1.6-fold higher on the warm side, with an optimal fishing offset of ~10 km toward warmer waters. This pattern arises from behaviorally mediated effective transport across a sloping frontal interface. Squid undergo diel vertical migration, occupying colder subsurface layers during daytime and ascending toward frontal zones at night. Because frontal surfaces tilt downward toward the warm side, subsurface squid habitats are systematically displaced relative to surface frontal indicators and fishing locations, producing a persistent warm-side bias without invoking passive advection.

In mesoscale eddies, squid distributions display a contrasting but complementary structure. Squid preferentially aggregate near the cores of warm-core eddies, whereas in cold-core eddies they are predominantly distributed along the outer periphery. Biogeochemical Argo float observations reveal that these patterns are closely linked to differences in the vertical structure of temperature and dissolved oxygen, which modulate habitat depth and suitability. Warm-core eddies provide vertically expanded, oxygen-rich habitats conducive to retention near the eddy center, while cold-core eddies constrain suitable habitat to peripheral regions.

Together, these results demonstrate how mesoscale coherent structures—fronts acting as transport barriers and eddies acting as retentive or exclusionary features—interact with active predator behavior to shape asymmetric spatial distributions. This study highlights how effective transport and mixing of mobile marine organisms can be interpreted within a Lagrangian framework integrating physical structure, biogeochemical environment, and behavioral dynamics.

How to cite: Niu, Z., Chen, Z., Yu, W., and Wang, J.-Z.: Mesoscale fronts and eddies shape neon flying squid distribution through effective transport, EGU General Assembly 2026, Vienna, Austria, 3–8 May 2026, EGU26-7025, https://doi.org/10.5194/egusphere-egu26-7025, 2026.

EGU26-9297 | ECS | Posters on site | NP6.6

Time-variable flux of sinking aggregates to the deep ocean: Hybrid Eulerian-Lagrangian model 

Seongbong Seo, Vladimir Maderich, Kateryna Kovalets, Igor Brovchenko, and Kyeong Ok Kim

The descending flux of organic particles, formed in the euphotic layer of the ocean, is a key mechanism for delivering carbon and nutrients into the deep ocean layers. Our study aimed to enhance the model and numerical Eulerian-Lagrangian algorithm developed by Maderich et al. (2025) so that it can consider the time-dependent dynamics of aggregate flux and account for ballast minerals (silicate and calcium carbonate) in aggregate sinking. In the algorithm, the Euler equations were solved for spectral concentrations of aggregate components with different sizes, while the Lagrangian equations were solved for depth and sizes of individual aggregates. Novel analytical unsteady solutions of the system of one-dimensional equations in the Eulerian framework for the particulate organic matter (POM) concentration and the Lagrangian framework for the particle mass and depth for constant and age-dependent degradation were compared with numerical solutions. The impact of a bloom event on POM profile variability was simulated using the developed numerical algorithm.


Vladimir Maderich, Igor Brovchenko, Kateryna Kovalets, Seongbong Seo, and Kyeong Ok Kim (2025). Simple Eulerian–Lagrangian approach to solving equations for sinking particulate organic matter in the ocean. Geosci. Model Dev., 18, 7373–7387

How to cite: Seo, S., Maderich, V., Kovalets, K., Brovchenko, I., and Kim, K. O.: Time-variable flux of sinking aggregates to the deep ocean: Hybrid Eulerian-Lagrangian model, EGU General Assembly 2026, Vienna, Austria, 3–8 May 2026, EGU26-9297, https://doi.org/10.5194/egusphere-egu26-9297, 2026.

EGU26-10343 | ECS | Posters on site | NP6.6

Lagrangian evaluation of surface transport around the Canary Islands using drifter observations and OpenDrift simulations 

Jacob S. Torres-Ojeda, Ángel Rodríguez-Santana, Antonio J. Gonzáles-Ramos, Ana M. Mancho, Alejandro Garcia-Mendoza, Giovanny A. Cuervo-Londoño, Luis Yubero, and Ángeles Marrero-Díaz

The prediction of ocean surface trajectories remains a key challenge in coastal and island-influenced regions, were strong spatial variability limits model skill. Previous Lagrangian studies have shown the usefulness of drifter observations to assess trajectory predictability and to compare different sources of surface currents (e.g. Dagestad and Röhrs, 2019). In this context, Lagrangian approaches provide a direct and observation-based framework to evaluate surface transport.
This study assesses surface transport predictability around the Canary Islands using trajectories from two surface drifters (CODE/Davis type, drogued at 1 m depth) and numerical simulations performed with the OpenDrift framework (Dagestad et al., 2018). Simulations are forced with surface currents from the Iberia–Biscay–Ireland (IBI) regional ocean model distributed by the Copernicus Marine Environment Monitoring Service (CMEMS), and, where available, from the high-resolution coastal forecasting system SAMOA (Sotillo et al., 2019), operationally implemented for Spanish ports. Wind forcing is provided by ERA5 atmospheric fields, and wave-induced Stokes drift is included using IBI wave products from CMEMS.
From each observed drifter position, short-term forward simulations are performed to predict the subsequent drifter location. Model performance is quantified through the separation distance between simulated and observed positions, allowing a direct comparison of transport skill between different current products and forcing configurations.
The oceanic and atmospheric datasets used in this study correspond to operational or near-real-time products rather than fully consolidated reanalysis, reflecting realistic conditions for trajectory forecasting applications. The results reveal pronounced spatial and temporal variability in the separation between modeled and observed positions, with the relative performance of SAMOA and IBI depending on location and conditions, and neither consistently outperforming the other. While further improvements in transport predictability are expected once consolidated reanalysis products become available, the present results already provide a robust assessment of Lagrangian model skill under operational conditions.


Acknowledgments:
This work was supported by the projects SIRENA and SIRENA 2, funded by the collaboration of the Biodiversity Foundation of the Ministry for the Ecological Transition and the Demographic Challenge, through the Pleamar Program, and are co-financed by the European Union through the EMFAF (European Maritime, Fisheries and Aquaculture Fund).


References:
Dagestad, K.-F., Röhrs, J., Breivik, Ø., & Ådlandsvik, B. (2018): OpenDrift v1.0: a generic framework for trajectory modelling, Geoscientific Model Development, 11, 1405–1420, https://doi.org/10.5194/gmd-11-1405-2018
Dagestad, K.-F., & Röhrs, J. (2011): Prediction of ocean surface trajectories using satellite derived vs. modeled ocean currents, Ocean Modelling. https://doi.org/10.1016/j.rse.2019.01.001
Sotillo, M. G., Cerralbo, P., Lorente, P., Grifoll, M., Espino, M., Sanchez-Arcilla, A., & Álvarez-Fanjul, E. (2019): Coastal ocean forecasting in Spanish ports: the SAMOA operational service, Journal of Operational Oceanography, 13, 37–54, https://doi.org/10.1080/1755876X.2019.1606765
Copernicus Marine Environment Monitoring Service (CMEMS): IBI Ocean Currents Product, https://doi.org/10.48670/moi-00027
Copernicus Marine Environment Monitoring Service (CMEMS): IBI Stokes Drift Product, https://doi.org/10.48670/moi-00025
Hersbach, H. et al. (2020): ERA5 global reanalysis, Copernicus Climate Change Service (C3S), https://doi.org/10.24381/cds.adbb2d47

How to cite: Torres-Ojeda, J. S., Rodríguez-Santana, Á., Gonzáles-Ramos, A. J., Mancho, A. M., Garcia-Mendoza, A., Cuervo-Londoño, G. A., Yubero, L., and Marrero-Díaz, Á.: Lagrangian evaluation of surface transport around the Canary Islands using drifter observations and OpenDrift simulations, EGU General Assembly 2026, Vienna, Austria, 3–8 May 2026, EGU26-10343, https://doi.org/10.5194/egusphere-egu26-10343, 2026.

We apply  generalized spectral clustering methods to the global Argo dataset and compare the identified clusters with those obtained from established dynamical systems approaches, including finite-time Lyapunov exponents (FTLEs), Lagrangian-averaged vorticity deviation (LAVD), encounter volume, and a newly introduced tool— retention volume.

Spectral clustering provides a powerful framework for identifying Lagrangian coherent clusters from particle trajectories, grouping together trajectories that evolve similarly while remaining distinct from others. Traditionally, spectral clustering relies on physical proximity to define similarity between particles. Here, we extend this approach by incorporating additional oceanographic properties—such as temperature, salinity, density, and spiciness—into the similarity measure. This generalization allows us to detect coherent water masses that are not only spatially coherent but also share key physical characteristics.

Our results highlight the potential of the generalized spectral clustering method, combined with Argo measurements, to provide new insights into ocean transport and water mass transformations.

How to cite: Curbelo, J. and Rypina, I. I.: Application of a generalized spectral clustering method for characterizing water masses using Argo floats, EGU General Assembly 2026, Vienna, Austria, 3–8 May 2026, EGU26-14129, https://doi.org/10.5194/egusphere-egu26-14129, 2026.

EGU26-17328 | ECS | Posters on site | NP6.6

Lagrangian Dynamics of Anisotropic Crystals in Vigorous Mantle Convection 

Raaghava Murthi, Anu V S Nath, and Anubhab Roy

The dynamics of anisotropic crystals in cellular convective flows are critical for understanding the development of seismic anisotropy and chemical mixing in the Earth's mantle. In this study, we investigate the transport and orientation of slender rigid inclusions, proxies for anisotropic minerals such as olivine, using a Lagrangian framework. The crystals are modelled as inertialess rod-like tracers, with translational motion derived by averaging the background flow velocity along the crystal's major axis, and rotational dynamics determined by the moment of the background velocity field evaluated along the length. Unlike passive point tracers, these extended objects exhibit intrinsically coupled translation and rotation, resulting in preferred orientations (LPO) that depend sensitively on both the convective flow structure and crystal aspect ratio.

To benchmark the model, crystal dynamics are first examined in idealised laminar flows relevant to mantle kinematics, including two-dimensional Taylor–Green cellular flow and eigenmodes of Rayleigh–Bénard convection. These configurations allow for the analysis of crystal trajectories, stability near stagnation points, and the influence of density contrasts (settling) on crystal residence times. The study is then extended to vigorous, chaotic thermal convection by generating high-Rayleigh-number flows using direct numerical simulations of the Boussinesq-approximated Navier–Stokes equations. Crystals are introduced into the statistically steady flow field to simulate entrainment and mixing processes.

Confinement effects, representing lithospheric boundaries or phase transitions, are modelled using a soft-wall collision scheme, while periodic boundary conditions mimic the lateral extent of the mantle. We quantify crystal dispersion and alignment over a range of geophysical parameters, exploring variations in the Rayleigh number and crystal geometry. Statistical analyses focus on long-time orientation distribution functions (ODFs) and dispersion rates. Our results reveal how convective vigour and coherent structures (e.g., plumes and downwellings) jointly govern the evolution of fabric in the mantle, offering a controlled framework for interpreting seismic anisotropy in thermally driven flows.

How to cite: Murthi, R., V S Nath, A., and Roy, A.: Lagrangian Dynamics of Anisotropic Crystals in Vigorous Mantle Convection, EGU General Assembly 2026, Vienna, Austria, 3–8 May 2026, EGU26-17328, https://doi.org/10.5194/egusphere-egu26-17328, 2026.

The ocean biological carbon pump transfers particulate organic matter (POM) from surface waters to the deep ocean, playing a key role in long-term sequestration of organic matter. Small-scale turbulence and stratification strongly influence particle sinking, yet these processes are poorly represented in global models, which rely on simplified parameterizations.

We investigate these effects using high-resolution direct numerical simulations (DNS) of stratified turbulence, designed to capture small-scale ocean dynamics, coupled with a Lagrangian inertial particle model. By resolving turbulent structures and particle–fluid interactions, we aim to quantify how turbulence intensity, stratification, and particle properties control sinking velocities and export efficiency. Multiple particle types are tracked under ocean-relevant conditions, constrained using oceanographic observations and reanalysis data to provide realistic ranges for turbulence, stratification, and vertical shear.

To bridge microscale processes to large-scale modeling, we incorporate DNS-derived insights into climate simulations using the Earth System Model EC-Earth, a fully coupled atmosphere–ocean configuration. The ocean and its biogeochemistry are simulated with NEMO-PISCES, and the atmosphere with OIFS. This approach allows us to assess how unresolved turbulence and particle dynamics affect particulate export at global scales. By combining turbulence-resolved Lagrangian simulations with global climate experiments, this work aims to reduce uncertainties in particle transport and improve understanding of biogeochemical microscale processes and their climate feedbacks. Simulation data and tools will be openly available to enable further research on microscale ocean transport processes and their representation in global climate and ocean models.

How to cite: Sozza, A. and Davini, P.: Towards a Lagrangian-informed representation of ocean particulate export: from small-scale turbulence to climate models, EGU General Assembly 2026, Vienna, Austria, 3–8 May 2026, EGU26-18046, https://doi.org/10.5194/egusphere-egu26-18046, 2026.

EGU26-19360 | ECS | Orals | NP6.6

Tracing the toxic bloom: Dispersion, impacts, and perspectives of Prymnesium parvum in the Oder Lagoon 

Bruna de Ramos, Siren Rühs, Clemens Engelke, Thomas Neumann, and Gerald Schernewski

Harmful Algal Blooms (HABs) caused by the haptophyte Prymnesium parvum represent an ecological and socio-economic threat in brackish waters worldwide. In summer 2022, a catastrophic bloom in the Oder River (Germany–Poland) caused mass fish kills (~360 t). The Oder River discharges into the Oder (Szczecin) Lagoon, a region with fisheries tradition and growing importance for tourism and recreation. Understanding how the bloom affected the lagoon is important for future risk assessment.

We combined long-term (1972-2024) phytoplankton monitoring data from Polish and German environmental authorities, high-resolution (200m horizontal grid from MOM – Modular Ocean Model) hydrodynamic modeling, and Lagrangian particle tracking (Parcels framework) to (1) assess historical occurrence of Prymnesiophyceae in the lagoon, (2) simulate decay and transport of the 2022 bloom from the river into the lagoon, (3) evaluate connectivity between different regions in the lagoon and the Baltic Sea, and (4) generate ecological and socio-economic risk maps.

Phytoplankton time series show that Prymnesiophyceae have been present in the lagoon since 2007, with the higher abundance (~ 100 million cells L-1) recorded in July 2022, in the German side of the lagoon. Regarding the 2022 bloom, we released virtual water parcels with a P. parvum initial abundance of 150 million cells L-1 from the river mouth. We started the simulation on July 15 2022, applying different decay scenarios (no decay, 5-day and 10-day half-life). Particles were tracked for 30 days to identify hotspots and connectivity.

Even under slow decay, all water parcels remained in the Polish sector (Wielki Zalew), affecting beaches like Plaża w Czarnocinie about 6km from the river mounth. Connectivity matrix based on releasing water parcels from German and Polish sides supported the low connectivity between lagoon portions and the Baltic in a one-month time frame. This suggests that P. parvum observed on the German side in 2022 likely originated from local or previously established populations rather than direct influence by the bloom event.

We integrated modeled bloom dispersion with ecological subjects (key fish species and habitats) and socio-economic features (fisheries harbors, bathing beaches) to produce risk maps. Polish side areas were more affected from the bloom regardless the decay rate and presented higher risk.

However, in future scenarios, increasing drought frequency may support long-term risk of toxic algae blooms in the Oder River. Monitoring identifying Prymnesiophyceae and our risk maps could serve as important management information. Also, our particle tracking applied to different hydrodynamic conditions could help to improve the understanding of risk areas.

How to cite: de Ramos, B., Rühs, S., Engelke, C., Neumann, T., and Schernewski, G.: Tracing the toxic bloom: Dispersion, impacts, and perspectives of Prymnesium parvum in the Oder Lagoon, EGU General Assembly 2026, Vienna, Austria, 3–8 May 2026, EGU26-19360, https://doi.org/10.5194/egusphere-egu26-19360, 2026.

EGU26-21101 | ECS | Orals | NP6.6

Tracking Industrial Emissions and Odor Nuisance through Integrated Modeling and Citizen Reporting 

Giorgio Veratti, Anna Abita, Nicolò Tirone, Giorgio Resci, Giovanni Guidi, Paolo Bonasoni, and Tony Christian Landi

The management of air quality in residential areas adjacent to large industrial hubs requires addressing two distinct yet overlapping challenges: monitoring pollutants with health implications and mitigating odor nuisances that significantly degrade quality of life. This study presents a multidisciplinary, integrated system designed to track, quantify and attribute these atmospheric impacts in one of Europe’s largest coastal petrochemical complexes. In the industrial area of Syracuse Province (Sicily, Italy), the emissions from refineries and port activities are a persistent source of both health concerns and community complaints. The NOSE (Network for Odour SEnsitivity) system has been operational since 2019 across the municipalities of Melilli, Priolo, Augusta and Siracusa, enabling citizens to report, via a dedicated web-app, the intensity and specific characteristics of odor episodes. In this framework, we developed an experiment based on three integrated pillars: a network of air quality and meteorological monitoring stations, the GRAMM-GRAL Lagrangian dispersion model and the data collected by the NOSE system. To address the frequent underestimation of the emissions in standard inventories, a Bayesian inversion framework was implemented to optimize prior emission estimates of benzene (C6H6), toluene (C7H8) and hydrogen sulphide (H2S). Given the limitations of Lagrangian models in representing the photochemistry of complex volatile organic compounds, C6H6 and H2S were used as conservative tracers and proxies for highly odorant non-methane hydrocarbon mixtures typically emitted by refinery processes.
Our findings demonstrate that the inversion procedure substantially improved dispersion model performance. The use of posterior emissions reduced the average Root Mean Square Error across all stations from 1.69 to 0.78 µg m-3 for C6H6, from 2.46 to 0.76 µg m-3 for C7H8, and from 8.1 to 0.81 µg m-3 for H2S. Correspondingly, the average Pearson correlation coefficient increased from 0.25 to 0.67 for C6H6 and C7H8, and from near-zero values to 0.45 for H2S. Finally, we compared forward simulations using posterior emissions with spatio-temporal clusters of odor nuisance reports submitted by citizens. These results suggest that two major coastal refineries are the primary contributors to regulated pollutant concentrations and citizen-reported odor impacts. This integrated system, which combines citizen reporting, Lagrangian dispersion modeling and Bayesian inversion, provides local authorities with a powerful tool for identifying high-impact sources and developing targeted strategies for health protection and odor mitigation.

How to cite: Veratti, G., Abita, A., Tirone, N., Resci, G., Guidi, G., Bonasoni, P., and Landi, T. C.: Tracking Industrial Emissions and Odor Nuisance through Integrated Modeling and Citizen Reporting, EGU General Assembly 2026, Vienna, Austria, 3–8 May 2026, EGU26-21101, https://doi.org/10.5194/egusphere-egu26-21101, 2026.

EGU26-21936 | ECS | Orals | NP6.6

An Integrated clear air turbulence scheme for the FLEXPART model 

Lokahith Narendra Agasthya and Andreas Stohl

Atmospheric turbulence above the planetary boundary layer (PBL) plays a critical role in the vertical and horizontal mixing of aerosols and trace gases. In the troposphere, such turbulence is highly intermittent and primarily associated with jet stream boundaries and planetary-scale waves, while in the stratosphere it is strongly modulated by the quasi-biennial oscillation. Owing to the long residence times of air masses in the stratosphere, vertical mixing across the tropopause and within the stratosphere is a key process controlling stratospheric composition. Accurate representation of stratospheric transport is also essential to understand the dispersion and lifetime of sulphur aerosols injected for potential solar radiation management applications.

Lagrangian atmospheric transport models commonly represent turbulent mixing using spatially and temporally constant diffusion coefficients, despite the inherently intermittent nature of turbulence in the free atmosphere. In this study, we implement a time- and space-dependent turbulent mixing scheme in the FLEXPART model, based on local diffusion coefficients derived from the Richardson number. This parameterization is consistent with the scheme used natively in the IFS model to represent turbulent exchange above the PBL.

Using a suite of sensitivity experiments, we investigate the impact of intermittent turbulent mixing on the distribution of trace gases in both the troposphere and stratosphere. Our approach provides a unified representation of turbulence from the boundary layer to the uppermost model levels, enabling a more physically consistent treatment of atmospheric mixing across dynamical regimes.

How to cite: Agasthya, L. N. and Stohl, A.: An Integrated clear air turbulence scheme for the FLEXPART model, EGU General Assembly 2026, Vienna, Austria, 3–8 May 2026, EGU26-21936, https://doi.org/10.5194/egusphere-egu26-21936, 2026.

EGU26-22376 | ECS | Orals | NP6.6

Priority conservation areas based on plankton particle trajectories as an alternative to marine protected areas 

Oscar Julian Esteban-Cantillo, Damien Eveillard, Sabrina Speich, and Roberto Casati

Ecological modelling has enhanced our understanding of ecosystems and biodiversity, and it has been widely used in policy decision-making. Strengthening our ability to represent ecosystems and their interactions with human activities is a global priority for achieving conservation goals. However, most existing spatial conservation frameworks rely on staticMarine Protected Areas (MPAs), defined by fixed geographic boundaries and invariant management rules that do not account for the strong temporal variability, circulation-driven connectivity, and climate-induced shifts that characterize marine ecosystems. As a result, static MPAs may fail to consistently protect key ecological processes, particularly in pelagic systems where biological organization is shaped by moving water masses. One way to address this is through the design and implementation of “dynamic” Marine Protected Areas (dMPAs) - areas that shift in space and time based on plankton trajectories, given their ecological importance. The recognition of the importance of marine plankton for human well-being has sparked proposals to prioritize plankton in marine policymaking. Yet scientific investigation into defining species-based areas has not been undertaken, despite their fundamental role in sustaining the oceans and marine life. Our research demonstrates the value of adopting dynamic approaches for conserving marine ecosystems, which are highly variable and interconnected by ocean circulation. Using a Lagrangian particle-tracking framework implemented with OceanParcels, we simulate the transport, retention, and aggregation of planktonic communities by integrating hydrodynamic fields with plankton distribution models. From these simulations, we identify spatiotemporal hotspots of particle aggregation and retention, interpreted as regions of enhanced ecological significance, which we define as Plankton Priority Areas for Conservation (PPACs). By comparing aggregation patterns across winter, spring, summer, and autumn, we identify both seasonal hotspots and areas of persistent retention. To place PPACs in a broader conservation context, we assess their overlap with four complementary indicators - biodiversity distribution, climate resilience, carbon sequestration potential, and ecosystem vulnerability. Our results demonstrate that dynamic, circulation-informed conservation areas can reveal ecologically critical regions that are poorly represented by static MPAs and provide a flexible, scalable complement to existing conservation tools in a changing ocean. 

How to cite: Esteban-Cantillo, O. J., Eveillard, D., Speich, S., and Casati, R.: Priority conservation areas based on plankton particle trajectories as an alternative to marine protected areas, EGU General Assembly 2026, Vienna, Austria, 3–8 May 2026, EGU26-22376, https://doi.org/10.5194/egusphere-egu26-22376, 2026.

Atmospheric Lagrangian particle dispersion models (LPDMs) are commonly combined with Bayesian inversion/optimization methods to infer emission fluxes across spatial scales from local to global. These tools are central to monitoring greenhouse gases, especially CO₂, CH₄, and N₂O. However, uncertainties in flux estimates arise from multiple sources: prior flux information, representation of the background atmospheric composition, statistical model choices (including hyperparameters and error covariance assumptions), and errors in atmospheric transport. In this presentation, we describe current uncertainty quantification activities linked to ongoing projects (e.g. EYE-CLIMA). We will discuss the use of meteorological ensemble simulations to assess transport related uncertainty and explore connections with dynamical systems tools and common assumptions such as Gaussian errors. Emphasis will be placed on high-resolution transport modelling applications.

How to cite: Pisso, I.: Uncertainties associated with Lagrangian transport in greenhouse gas flux estimates, EGU General Assembly 2026, Vienna, Austria, 3–8 May 2026, EGU26-22836, https://doi.org/10.5194/egusphere-egu26-22836, 2026.

EGU26-1670 | ECS | Posters on site | AS1.22

Modelling climate change in the MLT with a gravity-wave permitting setup of UA-ICON 

Hannes Pankrath, Markus Kunze, Christoph Zülicke, Yanmichel Morfa Avalos, Nicholas Pedatella, and Claudia C. Stephan

The anthropogenic emission of carbon dioxide has been attributed as the main driver of global warming. However, its radiative properties also cause the middle atmosphere to cool and contract. This cooling, as well as associated changes in large-scale circulation patterns of the troposphere and stratosphere, result in trends in the mesosphere and lower thermosphere (MLT) region. We conducted a whole-atmosphere simulation employing the ICOsahedral Non-hydrostatic general circulation model with Upper Atmosphere extension (UA-ICON) in the configuration with the numerical weather prediction (NWP) physics package. As gravity waves are the main driver of the dynamics in the MLT and thus critically influence its thermal structure, we chose a horizontal resolution of 20 km to model a large portion of the gravity wave spectrum explicitly. A realistic large-scale circulation up to 50 km is ensured by constraining the dynamics of the troposphere and stratosphere to the ECMWF Reanalysis v5 (ERA5) dataset.
From the simulation, we derive trends of the atmospheric mean circulation and temperature. Additionally, the run is analyzed within the Transformed Eulerian Mean (TEM) framework to derive trends related to gravity waves and wave-mean flow interaction. For validation, the results are compared with the Atmospheric General circulation model for the Upper Atmosphere Research-Data Assimilation System (JAGUAR-DAS) whole neutral atmosphere reanalysis dataset (JAWARA).

How to cite: Pankrath, H., Kunze, M., Zülicke, C., Avalos, Y. M., Pedatella, N., and Stephan, C. C.: Modelling climate change in the MLT with a gravity-wave permitting setup of UA-ICON, EGU General Assembly 2026, Vienna, Austria, 3–8 May 2026, EGU26-1670, https://doi.org/10.5194/egusphere-egu26-1670, 2026.

EGU26-1843 | ECS | Posters on site | AS1.22

Revisiting Intrinsic Predictability of Wave-Convection Coupled Bands Over Southern China: Variable and Scale-Dependent Error Growth Characteristics 

Manshi Weng, Junhong Wei, Yu Du, Y. Qiang Sun, and Xubin Zhang

This talk will present our recent work of Weng et al. (2025, in manuscript). Intrinsic predictability of the weather defines the ultimate limit of our day-to-day weather forecasts. This study aims to investigate the variable- and scale-dependent intrinsic predictability of wave-convection coupled bands lasting nearly 10 hours near the south coast of China on 30 January 2018, by conducting perturbed and unperturbed convection-permitting simulations with 1-km horizontal grid spacing under varying initial moisture conditions. In particular, the predictability time scale of each selected forecast variable is quantified in the current study via the Loss Predictability Index (LPI), defined as the ratio of the forecast error (difference between perturbed and unperturbed) power spectrum to the reference (unperturbed) power spectrum at a given scale or within a range of scales. Spectral analysis reveals substantial differences in the reference power spectral slopes among variables, while their error growth behaviors consistently exhibit upscale features. The intrinsic predictability limit of the banded convection, measured by the difference total energy (DTE), is approximately 7 hours. Predictability varies with both scale and altitude: smaller scales (i.e., ~10 km) have shorter limits than larger scales (i.e., ~40 km), and the middle-level moist neutral stability layer is less predictable than the low-level ducting stable layer. In particular, for the moist neutral stability layer, different variables become more correlated under the coupling between gravity waves and moist convection, yielding more coherent predictability characteristics. In the dry experiment, predictability exceeds 12 hours with minimal error growth, regardless of the variable, scale, or altitude. Finally, the decomposition of the horizontal kinetic energy spectrum into divergent and rotational components (proxies for unbalanced and balanced components, respectively), demonstrates contrasting power spectra, intrinsic predictability limits, and their sensitivity to initial moist content, with the divergent component exhibiting longer predictability in the ducting stable layer at wavelengths <40 km. These findings highlight how vertical flow structure, moisture content, and distinct dynamical components jointly constrain the intrinsic predictability of mesoscale convective systems.

Reference:

Manshi Weng, J. Wei, Y. Du, Y. Q. Sun, and X. Zhang, 2025: Revisiting Intrinsic Predictability of Wave-Convection Coupled Bands Over Southern China: Variable and Scale-Dependent Error Growth, Journal of Geophysical Research: Atmospheres (Major Revision).

How to cite: Weng, M., Wei, J., Du, Y., Sun, Y. Q., and Zhang, X.: Revisiting Intrinsic Predictability of Wave-Convection Coupled Bands Over Southern China: Variable and Scale-Dependent Error Growth Characteristics, EGU General Assembly 2026, Vienna, Austria, 3–8 May 2026, EGU26-1843, https://doi.org/10.5194/egusphere-egu26-1843, 2026.

EGU26-3063 | ECS | Posters on site | AS1.22

Denoising Stratospheric Nadir Sounder Observations using a Machine Learning Technique for Gravity Wave Detection 

Adam Hayes, Corwin Wright, Neil Hindley, Lars Hoffmann, and Phoebe Noble

Satellite observations of the atmosphere are often extremely noisy due to both hardware limitations and the inherent complexity of retrieving and making measurements of the atmosphere. Gravity waves, which are low amplitude signals present in the atmosphere, are hard to resolve in this data due to their relatively low amplitude and small spatial extent. As a result, noise becomes a limiting factor when trying to identify and characterise them in real observed data.

Current methods to address this problem often lean upon smoothing approaches; however, such approaches suppress small scale signals and reduce measured amplitude and momentum fluxes significantly. This impedes the process in developing the next generation of models where these waves must be resolved accurately.

A novel supervised machine learning approach is introduced which is able to accurately remove small scale noise features from nadir observations of gravity waves. This model was trained on synthetic observations derived from high resolution DYAMOND model runs.  This is then applied to 22 years of NASA AIRS data and 12 years of MetOp IASI data and used to produce a new gravity wave climatology to better access small amplitude gravity waves.

How to cite: Hayes, A., Wright, C., Hindley, N., Hoffmann, L., and Noble, P.: Denoising Stratospheric Nadir Sounder Observations using a Machine Learning Technique for Gravity Wave Detection, EGU General Assembly 2026, Vienna, Austria, 3–8 May 2026, EGU26-3063, https://doi.org/10.5194/egusphere-egu26-3063, 2026.

EGU26-4568 | ECS | Orals | AS1.22

Measuring tropospheric gravity waves over stratocumulus cloud decks  

Mathieu Ratynski, Brian Mapes, and Hanna Chaja

Tropospheric internal gravity waves, often originating from jets, fronts, or deep convection, leave subtle but discernible imprints on the vast stratocumulus decks that cover subtropical oceans. These waves represent a non-negligible, yet poorly quantified, interaction between the free atmosphere and the marine boundary layer. This presentation introduces a robust, twopass methodology using 2D continuous wavelet transforms (CWT) on geostationary satellite imagery (GOES-16) to objectively detect, track, and characterize these wave packets. The core of our framework is its ability to precisely separate the intrinsic wave propagation signal from the dominant, large-scale advective flow of the cloud field.

Our method quantifies the primary physical signature of these waves: the modulation of cloudtop brightness caused by vertical displacements at the boundary layer inversion. By tracking these propagating brightness patterns, our algorithm identifies individual wave packets as dynamically evolving objects and measures their physical properties, including wavelength, propagation speed, and direction. To validate the method, we generate synthetic satellite imagery by superimposing the signatures of hypothetical wave fields (with known properties such as wavelength, speed, and direction) onto realistic, advected cloud scenes. This process allows us to confirm the method's ability to faithfully retrieve the initial parameters and to characterize its measurement uncertainties.

We then apply this validated methodology to a real-world case study from 12 October 2023 over the Southeast Pacific. The analysis successfully isolates a coherent wave packet with a ~150 km wavelength and tracks its dynamic evolution.

Potential applications are numerous, including the construction of wave climatologies, the study of wave-cloud interactions, the analysis of their role in organizing shallow convection, and the assessment of their long-range predictability. The tool, made available as open-source software, is intended to facilitate a systematic exploration of these key, yet often hidden, components of the climate system.

How to cite: Ratynski, M., Mapes, B., and Chaja, H.: Measuring tropospheric gravity waves over stratocumulus cloud decks , EGU General Assembly 2026, Vienna, Austria, 3–8 May 2026, EGU26-4568, https://doi.org/10.5194/egusphere-egu26-4568, 2026.

EGU26-6563 | ECS | Posters on site | AS1.22

Data-Driven Gravity Wave Source Parameterization Using Machine Learning 

Erfan Mahmoudi, Zuzana Prochazkova, Stamen Dolaptchiev, Anke Pohl, and Ulrich Achatz

Representing gravity wave (GW) sources accurately remains a major challenge for climate models. While parameterizations for orographic and convective gravity waves are well established, studies have shown that additional sources, including fronts, jet streams, and jet exit regions, also generate gravity wave activity. These sources driven by dynamics are often not clearly defined in current parameterization methods, which leads to biases in momentum deposition and large-scale circulation.
In this study, we propose a machine learning-based framework to model gravity wave sources in a unified and data-driven way. We use high-resolution ICON simulations to resolve gravity wave generation from a wide range of atmospheric processes. A reduced-order representation of the gravity wave action density spectrum serves as the target function. This allows for a compact yet meaningful description of gravity wave emission. Input features include resolved large-scale flow characteristics, subgrid-scale orographic properties, and convective indicators taken from the model fields.
We train supervised machine learning models to learn the nonlinear relationship between the atmospheric state and the resulting gravity wave emission. The resulting parameterization accounts for gravity wave generation related not only to orography and convection but also to dynamically driven sources such as frontogenesis and jet-related processes.

How to cite: Mahmoudi, E., Prochazkova, Z., Dolaptchiev, S., Pohl, A., and Achatz, U.: Data-Driven Gravity Wave Source Parameterization Using Machine Learning, EGU General Assembly 2026, Vienna, Austria, 3–8 May 2026, EGU26-6563, https://doi.org/10.5194/egusphere-egu26-6563, 2026.

EGU26-7463 | ECS | Orals | AS1.22

Using an oceanic acoustic noise model to evaluate and constrain simulated atmospheric states 

Pierre Letournel, Constantino Listowski, Marc Bocquet, Alexis Le Pichon, and Alban Farchi

Among the different types of atmospheric waves, infrasound corresponds to low-frequency acoustic waves that can propagate over thousands of kilometers within atmospheric waveguides formed between the  surface and the middle-atmosphere (MA, 15-90 km) or the lower thermosphere (90-120 km). Infrasound is a technology used to monitor the atmosphere for the Comprehensive Nuclear-test Ban Treaty (CTBT). Infrasound stations of the International Monitoring System put in place to monitor compliance with CTBT continuously record infrasound waves, which can be seen as a tracer of the MA and lower thermosphere dynamics. At these altitudes, Numerical Weather Prediction (NWP) models are biased, notably due to the lack of observations to assimilate, especially for winds, or for instance due to an approximate representation of the impact of atmospheric gravity waves on the dynamics. We propose a method based on the observation of infrasound of oceanic origin, known as microbaroms, to evaluate and compare the performances of atmospheric models in the middle atmosphere. We present a complete processing chain that simulates microbarom arrivals at an infrasound station and that compares them to observations. It explicitly accounts for both the oceanic source emission mechanism and the atmospheric propagation. Beyond the atmospheric diagnostics enabled by this method, we have implemented our modeling of microbarom arrivals within a variational data assimilation (DA) framework to constrain wind and temperature atmospheric fields in the MA. As proof-of-concept, first DA synthetic experiments were conducted in simplified atmospheric configurations to demonstrate the added value of infrasound observations in constraining the MA dynamics.

How to cite: Letournel, P., Listowski, C., Bocquet, M., Le Pichon, A., and Farchi, A.: Using an oceanic acoustic noise model to evaluate and constrain simulated atmospheric states, EGU General Assembly 2026, Vienna, Austria, 3–8 May 2026, EGU26-7463, https://doi.org/10.5194/egusphere-egu26-7463, 2026.

EGU26-7532 | ECS | Posters on site | AS1.22

Spatial Distribution of Internal Tides in the Deep Southwestern Atlantic Ocean 

Xuehang Zhou, Zhiyuan Gao, and Zhaohui Chen

Internal tides are internal gravity waves with tidal frequencies, generated by the interaction of barotropic tides with rough seafloor topography. The breaking of internal tides constitutes one of the fundamental mechanisms for sustaining mixing within the deep ocean. However, past lack of large-scale deep-ocean observations caused uncertainties in characterizing their properties and spatial distribution patterns. The Southwestern Atlantic, with complex and diverse seafloor topography, provides an ideal site for studying deep-ocean internal tides while Deep Argo floats with full-water-depth observation capabilities enable this research. Based on data collected by Deep Argo floats during parking phase, the characteristics and spatial distribution of internal tides at 3000-4000 m in the deep Southwestern Atlantic Ocean are investigated. The analysis quantifies significant amplitudes of internal tides in the deep ocean, revealing spatial patterns distinct from the upper ocean. While upper-ocean internal tides are primarily modulated by large-scale topography, deep-ocean internal tides are subject to small-scale seafloor topography. Consequently, deep-ocean internal tides are spatially locked to local topography features rather than following far-field propagation paths, with semidiurnal internal tides exhibiting higher amplitudes in the Mid-Atlantic Ridge region, whereas diurnal internal tides are intensified near 28°S. These findings provide essential observational support for unraveling complex dynamics driven by small-scale seafloor topography.

How to cite: Zhou, X., Gao, Z., and Chen, Z.: Spatial Distribution of Internal Tides in the Deep Southwestern Atlantic Ocean, EGU General Assembly 2026, Vienna, Austria, 3–8 May 2026, EGU26-7532, https://doi.org/10.5194/egusphere-egu26-7532, 2026.

Tropical cyclones (TCs) are a source of atmospheric gravity waves, which contribute to mixing in  the upper troposphere and lower stratosphere. Here, we conducted a large ensemble simulation run of the Weather and Forecasting Research (WRF, V4.4.1) model, assessing the impact of 15 combinations of microphysics (MP), planetary boundary layer physics (PBL), and a cumulus scheme (CU) on the model's ability to simulate the physics of Typhoon Soudelor (2015) and this typhoon's generation of gravity waves. The simulation is performed using a moving nested domain at 3 km  horizontal resolution, with a 15 km exterior main domain. We use data from International Best Track Archive for Climate Stewardship to measure bias in track position and intensity of the typhoon, supported by the use of AIRS/Aqua satellite observations as a benchmark. Moving beyond traditional analyses, we also apply a kernel density estimator (KDE) approach to produce more comprehensive results. 

Our results indicate that, while track errors remain below 100 km for the first 42 hours of the run, the simulated storm intensity and speed varied significantly from observations. Notably, simulations incorporating cumulus parameterization generally yield wider track spreads, whereas microphysics produced higher storm intensities and a more accurate representation of deep convective clouds compared to WSM6, despite an overall tendency to overestimate storm strength. We then examined coupling between tropical cyclone dynamics and stratospheric wave generation by comparing simulated Outgoing Longwave Radiation (OLR) and vertical wind speeds against satellite and reanalysis data. KDEs of OLR suggests, that while the Goddard MP effectively captures deep convection, the addition of a Grell-3 CU parameterization tends to produce more extensive mid-to-high-level cloud cover but underestimates the deepest convective cores. In the stratosphere, vertical wind speed profiles indicate that the MYJ and Goddard combinations produce the strongest wave activity, especially during the chosen peak events. Although the simulations slightly overestimate background wind speeds near the tropopause compared to ERA5 reanalysis output, the overall wave morphology remains consistent with observations. These findings reinforce the conclusion that no single physics combination optimally captures all TC attributes, though Goddard MP and specific PBL schemes offer superior performance in representing the convective forcing essential for stratospheric gravity wave excitation.

How to cite: Lu, Y.-S., Wright, C. J., Wu, X., and Hoffmann, L.: Sensitivity Analysis of Gravity Wave Characteristics to Physical Parameterization Options in WRF Simulations : A Case Study of Typhoon Soudelor (2015), EGU General Assembly 2026, Vienna, Austria, 3–8 May 2026, EGU26-9749, https://doi.org/10.5194/egusphere-egu26-9749, 2026.

EGU26-9936 | ECS | Posters on site | AS1.22

Using ICON to model from ground to thermosphere - a global perspective 

Tom Dörffel and Claudia Stephan

We present a new global, high-resolution (10 km) simulation of the atmosphere using the ICON modeling framework and extending the vertical domain from the surface to the mid-thermosphere up to 250 km. With this configuration, gravity waves (GWs) are explicitly resolved up to a horizontal wavelength of about 50 km, and we can study the generation and dissipation across atmospheric layers, providing an opportunity to investigate GW propagation into the mesosphere and lower thermosphere (MLT) and their interactions with large-scale tides. Particular emphasis is put on cascading gravity waves, whereby primary waves generate secondary and higher-order GWs, and on their role in coupling the lower and upper atmosphere.

The simulation captures the interaction of gravity waves and tides with dynamically active regions, including the polar vortex leading to a sudden stratospheric warming (SSW). Achieving global, whole-atmosphere simulations at this resolution poses significant numerical challenges, including maintaining a consistent energy budget and ensuring the stability of the forward-in-time integrator across a wide range of scales and densities. We discuss strategies employed to address these challenges and assess their implications for model fidelity.

This modeling capability represents a critical step toward realistic whole-atmosphere prediction and provides an essential tool for the design and interpretation of coordinated satellite observation campaigns targeting GW–tide interactions and vertical coupling processes.

How to cite: Dörffel, T. and Stephan, C.: Using ICON to model from ground to thermosphere - a global perspective, EGU General Assembly 2026, Vienna, Austria, 3–8 May 2026, EGU26-9936, https://doi.org/10.5194/egusphere-egu26-9936, 2026.

EGU26-10233 | ECS | Posters on site | AS1.22

Simulation of Internal Waves within an ALE ocean model: numerical challenges and modelling 

Andreas Alexandris-Galanopoulos and George Papadakis

Internal Solitary Waves (ISWs) are among the most important physical processes in oceanic systems. Specifically, they play a significant role in vertical mixing, energy transfer across the continental shelf, sediment resuspension, nutrient redistribution, and the regulation of thermocline structure. Their breaking and subsequent turbulent dissipation contribute significantly to the global energy cascade. Additionally, ISWs remain challenging to study: they are strongly nonlinear, inherently nonhydrostatic, and often require three-dimensional, high-resolution modelling to capture steep fronts, overturning, and mixing. Consequently, accurate numerical simulation of ISWs is vital for improving our understanding of their mechanisms and impact on ocean circulation and climate-relevant processes. 

Since the mid-20th century, numerical models have become indispensable tools for analyzing and predicting oceanic systems and processes. As such, considerable research has focused on developing discretization methods that faithfully simulate physical phenomena while minimizing numerical artifacts. Such frequent artifact is the Spurious Diapycnal Mixing (SDM), in which, due to numerical diffusion, the vertical advection scheme introduces mixing across the density layers, thus severely altering the stratification. Due to this, various methods to track and remedy SDM have been proposed [1]. 

SLS is a numerical ocean model introduced by A. Alexandris and co-authors in [2]. It uses a hybrid Finite Volume / Finite Element spatial discretization and treats the full pressure field through a Pressure Poisson equation. Thus, SLS is inherently a nonhydrostatic ocean model and can faithfully simulate dispersive phenomena, such as solitons. The main novelty of SLS is its Arbitrary Lagrangian Eulerian (ALE) scheme that suitably defines the vertical grid motion. 

Since the seminal paper, the ALE scheme of SLS was further improved through extensive numerical modelling and simulation of ISWs. To facilitate this, an optimization process was designed with the goal of reducing SDM. The optimality is expressed through a variational principle that defines the ALE grid motion through an elliptic equation. The mathematical derivation/ analysis of the scheme and its impact on SDM is organized in the preprint [3], which is submitted to Ocean Modelling and is under review. This also includes extensive simulations of ISWs including breaking and overturning on a sloping beach. 

In the present work, further experiences of simulating ISWs with SLS are presented. This includes the application of the ALE method to more challenging 3D turbulent simulations, where the ability of SLS to control SDM is further tested. Additionally, the stability of the ALE scheme is investigated, alongside analysis of some spurious behaviors that are caused by the interplay of the Lagrangian and Eulerian mesh dynamics. 

 References:

[1] Fox-Kemper, Baylor, et al. "Challenges and prospects in ocean circulation models." Frontiers in Marine Science 6 (2019): 65. 

[2] Alexandris-Galanopoulos, Andreas, George Papadakis, and Kostas Belibassakis. "A semi-Lagrangian Splitting framework for the simulation of non-hydrostatic free-surface flows." Ocean Modelling 187 (2024): 102290. 

[3] Alexandris-Galanopoulos, Andreas, and George Papadakis. "An ALE approach to reduce spurious numerical mixing through variational minimizers: application to internal waves." arXiv preprint arXiv:2511.20092 (2025) 

How to cite: Alexandris-Galanopoulos, A. and Papadakis, G.: Simulation of Internal Waves within an ALE ocean model: numerical challenges and modelling, EGU General Assembly 2026, Vienna, Austria, 3–8 May 2026, EGU26-10233, https://doi.org/10.5194/egusphere-egu26-10233, 2026.

EGU26-10944 | ECS | Orals | AS1.22

Impact of gravity waves on ice-cloud microphysics in a global NWP model using online coupling 

Alena Kosareva, Stamen Dolaptchiev, Axel Seifert, Peter Spichtinger, and Ulrich Achatz

Gravity waves (GWs) are well known for their role in shaping large-scale dynamics of the atmosphere, but they also induce strong local variability in the vertical velocity, temperature, and other fields.  Such variability is often omitted when it comes to global effects due to averaging and resolution limitations. However, small-scale dynamics, such as gravity waves, have a crucial role in cirrus microphysics and life cycle. Ice clouds, on the other hand, can have a pronounced effect on the Earth’s radiation budget and global moisture distribution, making their accurate representation in climate and numerical weather prediction (NWP) models particularly important.

This work investigates the effects of gravity waves on cirrus cloud microphysics using the global ICON (Icosahedral Nonhydrostatic) model. A novel, self-consistent parameterization of GW-induced homogeneous ice nucleation developed by Dolaptchiev et al. (2023) is employed, and additional GW effects on depositional ice growth are considered. The local GW field is represented using the Multi-Scale Gravity Wave Model (MS-GWaM), which supports multiple GW source types and three-dimensional wave propagation, thereby enhancing the physical realism of the parameterized GW dynamics. The full coupling of GW forcing, along with feedback from the supplemented ice scheme into the overall microphysics and radiation schemes, has been implemented and assessed within the ICON model.

The results of the global test runs reveal significant GW impacts on ice formation mechanisms, leading to enhanced homogeneous nucleation in the upper troposphere–lower stratosphere (UTLS) compared to the baseline ICON configuration. Furthermore, GW-induced temperature fluctuations obtained from MS-GWaM and coupled online to depositional growth substantially increase ice growth efficiency. It results in larger ice mixing ratios in the mid-latitudes and subtropical regions. Further analyses are planned to assess the sensitivity of the coupled version to different MS-GWaM configurations, the role of lateral GW propagation, and the relative contributions of different gravity wave sources.

How to cite: Kosareva, A., Dolaptchiev, S., Seifert, A., Spichtinger, P., and Achatz, U.: Impact of gravity waves on ice-cloud microphysics in a global NWP model using online coupling, EGU General Assembly 2026, Vienna, Austria, 3–8 May 2026, EGU26-10944, https://doi.org/10.5194/egusphere-egu26-10944, 2026.

EGU26-13026 | Orals | AS1.22

EnKF and EM based parameter estimation of a convective gravity wave parameterization using Strateole 2 constant level balloon data 

Francois Lott, Pierre Tandeo, Manuel Pulido, and Deborah Bardet

An offline methodology is applied to estimate parameters of a subgrid-scale non-orographic gravity-wave scheme using observations from constant-level balloons. The approach integrates the Ensemble Kalman Filter (EnKF) with an iterative parameter estimation method based on the expectationmaximization (EM) algorithm. The meteorological fields required for the parameterization offline are taken from the ERA5 reanalysis, corresponding to the instantaneous meteorological conditions found underneath the Strateole-2 balloon observations made in the lower tropical stratosphere from November 2019 to February 2021 and October 2021 to January 2022. Compared to a direct approach that minimizes a cost function and uses Bayesian inference of parameters, our analysis demonstrates that the EnKF/EM method effectively characterizes the launching amplitudes and altitudes of the parameterized gravity waves and while quantifying their associated uncertainties. Furthermore, we illustrate how the method can help improving a scheme, specifically the results indicate that introducing a background wave activity renders the convective wave parameterization more realistic.

How to cite: Lott, F., Tandeo, P., Pulido, M., and Bardet, D.: EnKF and EM based parameter estimation of a convective gravity wave parameterization using Strateole 2 constant level balloon data, EGU General Assembly 2026, Vienna, Austria, 3–8 May 2026, EGU26-13026, https://doi.org/10.5194/egusphere-egu26-13026, 2026.

EGU26-13124 | ECS | Posters on site | AS1.22

2D transient parameterization of gravity waves generated above an isolated mountain range 

Felix Jochum, François Lott, and Ulrich Achatz

Most operational gravity-wave parameterizations use single-column and steady-state approximations, thus neglecting horizontal propagation and transience. Recent studies indicate that these simplifications can lead to inaccurate predictions. Orographic gravity waves, e.g., can propagate over substantial horizontal distances, leading to the deposition of momentum far from their sources. The neglect of this could be a cause of regional momentum-flux deficits in atmospheric models, e.g. downstream of the Andes. Moreover, the variability of low-level winds can make mountain-wave generation a highly transient process, challenging the legitimacy of the steady-state approximation. This motivates the development of more complex models.

  MS-GWaM is a Lagrangian gravity-wave parameterization that is based on a multi-scale WKB theory allowing for both transience and horizontal propagation. In a previous study (Jochum et al., 2025), it was used in simulations within the idealized atmospheric flow solver PincFlow to investigate its ability to correctly describe the interaction between orographic gravity waves and a large-scale flow. 2D flows over periodic monochromatic orographies were considered, using MS-GWaM either in its fully transient implementation or in a steady-state implementation that represents classic mountain-wave parameterizations. Comparisons of wave-resolving simulations (not using MS-GWaM) and coarse-resolution simulations (using MS-GWaM) showed that allowing for transience leads to a significantly more accurate forcing of the resolved mean flow. The present study supplements MS-GWaM (within PincFlow's successor PinCFlow.jl) with a new blocked-layer scheme and continues the investigation with the more realistic case of an isolated 2D mountain range, where the impact of upstream blocking and horizontal propagation increases substantially, resulting in a more complex wave-mean-flow interaction. The blocked-layer scheme uses a relatively simple approach to blocking that is consistent with MS-GWaM's spectral representation of the unresolved orography. Its two parameters are calibrated via Ensemble Kalman Inversion, using a wave-resolving simulation as reference. The results show that the inclusion of this scheme yields a slightly improved forcing of the mean flow.

References

Jochum, F., Chew, R., Lott, F., Voelker, G. S., Weinkaemmerer, J., and Achatz, U. (2025). The impact of transience in the interaction between orographic gravity waves and mean flow. Journal of the Atmospheric Sciences.

How to cite: Jochum, F., Lott, F., and Achatz, U.: 2D transient parameterization of gravity waves generated above an isolated mountain range, EGU General Assembly 2026, Vienna, Austria, 3–8 May 2026, EGU26-13124, https://doi.org/10.5194/egusphere-egu26-13124, 2026.

Gravity waves (GWs) are ubiquitous in stably stratified background states of the atmosphere from the boundary layer to the thermosphere. As a mesoscale phenomenon with typical scales smaller than the model effective resolution, they need to be parameterized in climate models based on numerous underlying simplifications. However, our understanding of the GW climate impacts is based mainly on their parameterized effects and may be model dependent and with uncertain relation to the real atmosphere dynamics.

                  Based on the whole span of the ERA5 reanalysis, here I present a "quasi - observational" assessment of GW dynamical effects in the extratropical upper troposphere and stratosphere. Part of our results confirms the textbook knowledge and expectations regarding the gravity wave role in decelerating the jet streams. But, after a closer inspection of the data, we found also previously unreported interactions and dynamical effects connected with GWs in the vicinity of the subtropical jet that can change the way how we parameterize them.

How to cite: Šácha, P., Procházková, Z., and Zajíček, R.: Dynamical effects of atmospheric gravity waves in the upper troposphere and stratosphere as revealed by a high-resolution reanalysis., EGU General Assembly 2026, Vienna, Austria, 3–8 May 2026, EGU26-17239, https://doi.org/10.5194/egusphere-egu26-17239, 2026.

EGU26-17588 | Orals | AS1.22

Lead-time independence of gravity-wave forecast skill in operational analysis and forecasts 

Corwin J Wright, Peter Berthelemy, Neil P Hindley, Inna Polichtchouk, and Lars Hoffmann

Atmospheric gravity waves (GWs) are a key driver of vertical energy and momentum transport in the atmosphere, with important implications for large-scale dynamics and chemistry. However, they remain difficult to predict in operational weather and climate models due to their small spatial scales relative to model resolution, and are typically not assimilated into numerical weather prediction (NWP) systems because of the large departures they introduce from model initial conditions.Here we use stratospheric temperature measurements from the Atmospheric Infrared Sounder (AIRS) and the Cross-track Infrared Sounder (CrIS) to evaluate how well archived operational analyses and forecasts from ECMWF’s Integrated Forecast System reproduce observed GW activity over Greenland, a major Northern Hemisphere source region for orographic GWs. The combined AIRS–CrIS sampling at high latitudes provides an unusually high measurement cadence, enabling assessment of forecast performance and time variability at relatively fine temporal resolution.Operational analyses and forecasts with lead times of up to 240 h are sampled at the AIRS and CrIS measurement footprints and regridded to a common resolution to allow consistent spectral analysis. A 2D+1 Stockwell Transform is applied to both synthetic and real observations to characterise GW amplitudes and spatial structure, producing directly comparable GW fields across forecast lead times.Using a Structure–Amplitude–Location (SAL) framework adapted from precipitation forecast verification, we quantify the evolution of GW forecast skill with lead time. We find that model performance exhibits only weak dependence on forecast range: across all lead times, the model systematically produces GWs with smaller horizontal scales and reduced amplitudes relative to observations, while errors in wave location increase only modestly with lead time. This behaviour is unexpected, as shorter lead times are associated with more accurate resolved winds, and would therefore be expected to yield more accurate GW generation. The results suggest that errors in simulated GW characteristics in operational forecasts are dominated by structural and representational limitations rather than by forecast wind errors alone.

How to cite: Wright, C. J., Berthelemy, P., Hindley, N. P., Polichtchouk, I., and Hoffmann, L.: Lead-time independence of gravity-wave forecast skill in operational analysis and forecasts, EGU General Assembly 2026, Vienna, Austria, 3–8 May 2026, EGU26-17588, https://doi.org/10.5194/egusphere-egu26-17588, 2026.

EGU26-19243 | ECS | Orals | AS1.22

Scattering of internal gravity waves by inhomogeneities 

Michael Cox, Hossein Kafiabad, and Jacques Vanneste

Internal gravity waves are scattered by inhomogeneities, such as background currents and bottom topography. Scattering modifies the wave's length and direction of propagation and in doing so, redistributes energy across wavenumbers and frequencies. When inhomogeneities are large relative to the waves, scattering reduces to a spectral diffusion process. Prior work on spectral diffusion considers only current-induced scattering via Doppler shift of the wave frequency. We generalise the diffusion framework to account for all large-scale inhomogeneities. This includes current-induced effects other than Doppler shift, and entirely different mechanisms such as scattering on bottom topography. We support our results with ray tracing simulations and analytical solutions.


How to cite: Cox, M., Kafiabad, H., and Vanneste, J.: Scattering of internal gravity waves by inhomogeneities, EGU General Assembly 2026, Vienna, Austria, 3–8 May 2026, EGU26-19243, https://doi.org/10.5194/egusphere-egu26-19243, 2026.

EGU26-19909 | Posters on site | AS1.22 | Highlight

The MATS satellite: Mission update and 3-D mesospheric temperatures 

Linda Megner, Lukas Krasauskas, Jörg Gumbel, Donal Murtagh, Nickolay Icvhenko, Björn Linder, Jacek Stegman, Ole Martin Christensen, Jonas Hedin, and Julia Hetmanek

The MATS (Mesospheric Airglow/Aerosol Tomography and Spectroscopy) mission is a Swedish satellite mission designed to study atmospheric gravity waves the mesopause region. MATS was launched in November 2022 and carries a limb-imaging instrument that observes the Earth’s atmosphere in the altitude range from approximately 70 to 110 km and a nadir camera. The primary observables are airglow emissions in the O₂ A-band and ultraviolet light scattered by noctilucent clouds.

The limb instrument is a telescope that continuously images the atmospheric limb in six spectral channels: four channels in the near-infrared targeting the airglow, and two ultraviolet channels dedicated to noctilucent cloud observations. By exploiting limb geometry and multi-view sampling along the orbit, MATS enables tomographic reconstruction of three-dimensional atmospheric structures. The airglow measurements yield a high–vertical-resolution 3-D temperature product, allowing characterization of individual gravity waves, while the ultraviolet observations enable reconstruction of the spatial distribution and characteristics of noctilucent clouds.

This presentation will focus on the newly completed 3-D mesospheric temperature data set derived from the MATS airglow measurements. We will describe the tomographic retrieval, the characteristics and coverage of the temperature product. If available, early validation results will be presented.

The presentation will also provide an update on the current status of the MATS mission, which after severe technical and regulatory challenges since 2023, is expected to resume operations in February 2026.

How to cite: Megner, L., Krasauskas, L., Gumbel, J., Murtagh, D., Icvhenko, N., Linder, B., Stegman, J., Christensen, O. M., Hedin, J., and Hetmanek, J.: The MATS satellite: Mission update and 3-D mesospheric temperatures, EGU General Assembly 2026, Vienna, Austria, 3–8 May 2026, EGU26-19909, https://doi.org/10.5194/egusphere-egu26-19909, 2026.

EGU26-20157 | ECS | Orals | AS1.22

Evaluations of wave-wave interactions for the oceanic internal gravity wave field at very high grid resolution  

Pablo Sebastia Saez, Manita Chouksey, Carsten Eden, and Dirk Olbers

Internal gravity waves (IGWs) play a key role in ocean dynamics by interacting with mesoscale eddies, topography, and other waves, leading to wave breaking and mixing that influence small and large-scale circulations. Despite local variability, the IGW energy distribution exhibits a remarkably universal spectral shape, the Garrett-Munk (GM) spectrum, within which we study the scattering of IGWs via wave-wave interactions under the weak-interaction assumption.

We use the kinetic equation derived from a non-hydrostatic Boussinesq system with constant rotation and stratification. By developing Julia-native numerical codes, we evaluate the energy transfers for resonant and non-resonant interactions. Our results confirm that resonant triads dominate energy transfers, while non-resonant interactions are negligible in isotropic spectra but can contribute under anisotropic conditions. We show that the Boltzmann rates are small such that the weak-interaction assumption is satisfied. We find non-local interactions to be essential to understand the energy transfers within the IGW field, while local interactions are of minor importance. Parametric subharmonic instability drives a forward energy cascade in vertical wavenumber and an inverse cascade in frequency. Induced diffusion emerges as a primary energy transfer to small scales, and elastic scattering plays a similar but weaker role. We also find a new interaction mechanism, the third parametric generation, which provides a forward energy cascade in frequency and vertical wavenumber. We assess the convergence of the kinetic equation by introducing a cutoff in the IGW energy spectrum, or with a change in slope mimicking the transition to turbulence. Our findings provide convergent results at reduced computational costs, improving the efficiency and reliability of energy transfer evaluations in oceanic IGW spectra.

How to cite: Sebastia Saez, P., Chouksey, M., Eden, C., and Olbers, D.: Evaluations of wave-wave interactions for the oceanic internal gravity wave field at very high grid resolution , EGU General Assembly 2026, Vienna, Austria, 3–8 May 2026, EGU26-20157, https://doi.org/10.5194/egusphere-egu26-20157, 2026.

EGU26-20398 | ECS | Posters on site | AS1.22

Role of mixed layer turbulence on the generation of  internal waves  

Swarnali Dhar, Kannabiran Seshasayanan, and Eric D'Asaro

Turbulence in the ocean mixed layer is a major source of internal gravity waves, yet the efficiency and pathways of this energy transfer remain less understood. We investigate how mixed-layer turbulence excites internal waves and drives the rapid decay of mixed-layer kinetic energy following strong forcing events. Using numerical simulations of a turbulent mixed layer overlying a stratified interior, we explicitly resolve the generation and propagation of internal waves. The non-hydrostatic model shows that surface wave-generated turbulence in the mixed layer radiates high-frequency internal waves near the buoyancy frequency, exporting ~13% of the mixed-layer energy in 20 hours. A hydrostatic model shows that near-inertial baroclinic modes, especially mode 2, redistribute this energy vertically over 2–10 days. These mechanisms provide a fast, localized pathway for upper‑ocean mixing. Normal-mode and spectral analyses link this turbulent radiation to low-baroclinic modes, near-inertial adjustment, and anisotropic wave emission in the presence of a background flow. Together, these results provide compact scaling relations that connect observable mixed-layer properties and turbulence intensity to internal-wave energy fluxes, enabling realistic parameterizations of mixed–layer–to–interior energy transfer in ocean and climate models.

How to cite: Dhar, S., Seshasayanan, K., and D'Asaro, E.: Role of mixed layer turbulence on the generation of  internal waves , EGU General Assembly 2026, Vienna, Austria, 3–8 May 2026, EGU26-20398, https://doi.org/10.5194/egusphere-egu26-20398, 2026.

Internal and inertial waves play a substantial role in ocean dynamics. They can transport a considerable amount of kinetic energy over long distances, and their amplitude in the abyssal ocean can reach gigantic vertical scales of several hundreds of meters. At the same time, packets of internal and inertial waves conserve a fixed angle with respect to gravity or the rotation axis upon reflection, which makes both their linear and nonlinear dynamics rather peculiar. Most hydrodynamical systems in closed domains can be described in terms of modes. In this framework, one usually assumes eigenfunctions satisfying the boundary conditions, for example Fourier standing modes in rectangular domains. These modes oscillate in time at every point in space but do not propagate in a specific spatial direction. Internal and inertial waves constitute a remarkable exception to this approach. It has been shown that, in a general geometry, wave beams of travelling waves converge toward a limiting path, known as a wave attractor, while global modes form a set of zero measure. Rectangular tanks aligned with gravity and/or rotation, actually represent an exceptional but very important case. Our work focuses on two aspects of internal waves in this context: first, the influence of the aspect ratio on the transition to turbulence and mixing for structurally stable wave attractors; second, the interplay between wave-attractor regimes and modal structures in the vicinity of rectangular geometries. Surprisingly, a conventional rectangular geometry may exhibit much more complex and strongly multistable regimes than those observed for simple wave attractors. We demonstrate competition between different triadic instability pairs, leading to multistability and a nearly uniform picket-fence spectrum, which is markedly different from the spectrum resulting from cascades of triadic instabilities driven by large-aspect-ratio wave attractors.

How to cite: Sibgatullin, I.: Aspect ratio effects, multistability and quantisation in wave attractors., EGU General Assembly 2026, Vienna, Austria, 3–8 May 2026, EGU26-21268, https://doi.org/10.5194/egusphere-egu26-21268, 2026.

The Yarlung Zsangbo Grand Canyon (YGC) acts as a critical water vapor channel for the Tibetan Plateau, profoundly influencing regional and downstream hydrometeorology. Significant research progress has recently been made in understanding the complex precipitation processes within this unique corridor, integrating multi-source observations, satellite retrieval evaluation, and model simulations.

A core finding is the systematic underestimation of precipitation over the eastern Himalayas by widely used products like GPM IMERG, which has been quantitatively reduced through improved algorithms informed by dense in-situ gauge data. Comprehensive investigations utilizing a novel multi-platform observational network have elucidated the complete three-dimensional structure and life cycle of precipitation systems within the YGC. This network, combining ground-based radars, disdrometers, and radiosondes, has revealed distinct seasonal shifts in precipitation microphysics. Notably, mixed-phase and ice-phase processes play a key role in these seasonal transitions, with significant differences identified between the southeastern Tibetan Plateau and lower-altitude regions. Furthermore, two dominant types of heavy precipitation events have been classified and their distinct dynamic and thermodynamic mechanisms have been established.

Research also highlights the challenges of reanalysis accuracy in complex terrain, while providing pathways for improvement. Leveraging these mechanistic insights, recent efforts have successfully improved the forecasting of heavy precipitation in the YGC through optimized model physics, specifically by integrating enhanced cumulus and turbulent orographic form drag (TOFD) parameterization schemes. Collectively, these studies advance the quantitative understanding of precipitation processes in this major water vapor channel, offering crucial insights for hydrological modeling, climate studies, and numerical weather prediction in high-altitude complex terrain.

How to cite: Chen, X.: Research progress of precipitation process in the water vapor channel of Yarlung Zsangbo Grand Canyon, China, EGU General Assembly 2026, Vienna, Austria, 3–8 May 2026, EGU26-1414, https://doi.org/10.5194/egusphere-egu26-1414, 2026.

EGU26-2245 | Posters on site | AS1.23

Kilometer-Scale Convection-Permitting Simulations in Representing Winter Precipitation over the Indian Himalayas 

Raju Attada, Nischal Sharma, Kieran Hunt, and Valentine Anantharaj

Kilometer-scale (k-scale) simulations, with explicit treatment of convection at sub-grid scales, are useful for understanding precipitation characteristics. Such simulations with their high spatiotemporal resolution can be particularly valuable in complex topographies like the Hindu Kush Himalayas (HKH), where sparse observations and uncertainties in coarse-resolution datasets pose challenges. This study evaluates a regional AMIP-style k-scale (1 km) simulation, initialised from the ECMWF IFS analysis, for winter mean and extreme precipitation (December 2018-February 2019) in the HKH region, using high-resolution gridded precipitation datasets from multiple sources. The model realistically depicts the spatial distribution of precipitation, particularly the ridge-valley variations, often missed in coarser products. In general, it aligns more with reanalysis datasets but closely matches station observations too. Mean precipitation exhibits sensitivity to elevation, and the highest rates occur at about 2500 m in most of the reference products (observations/reanalysis), which the k-scale model represents well. The diurnal cycle depicts sub-daily precipitation maxima in the local afternoon and early morning hours. The analysis for precipitation extremes indicates the model’s close fidelity with reanalysis products in capturing higher-intensity and prolonged precipitation events in the western Himalayas. Radiosonde profiles and atmospheric thermodynamic characteristics highlight a highly saturated and unstable environment during extremes, which is favourable for enhanced convective developments and heavy precipitation. The model captures these atmospheric conditions well and represents the localized variations and intensifications in valley wind flows during extremes, which are often missed in coarser-resolution and parameterized ERA5 data. Our findings highlight the added value of k-scale convection-permitting models over coarser-resolution, parameterized models in resolving subgrid-scale processes, particularly in complex terrains like the HKH, without the need for convective parameterization.

How to cite: Attada, R., Sharma, N., Hunt, K., and Anantharaj, V.: Kilometer-Scale Convection-Permitting Simulations in Representing Winter Precipitation over the Indian Himalayas, EGU General Assembly 2026, Vienna, Austria, 3–8 May 2026, EGU26-2245, https://doi.org/10.5194/egusphere-egu26-2245, 2026.

EGU26-3384 | ECS | Posters on site | AS1.23

Systematic analysis of flow-orography interactionin idealized numerical simulations 

Šimon Bartoň and Petr Šácha

Current generation climate and global numerical weather prediction models still must parameterize
the effects of subrgid-scale orography, which they cannot explicitly resolve. One of the effects are
the orography gravity waves that affect the dynamics and transport throughout the atmosphere due
to flux convergences during their dissipation. Complicating the problem further is the interplay with
the turbulence parameterization schemes, which influence the dynamics and mixing near the
surface and then aloft in unstable regions in the free atmosphere.
In this work, we study the life cycle of orography gravity waves numerically under background
conditions and set-ups ranging from idealistic to realistic. A hierarchy of idealized three-
dimensional simulations of mountain–flow interaction is developed for various orographic shapes,
atmospheric conditions and model settings (with turbulence parameterizations or in large-eddy
resolving mode) to address the coupling between orographic gravity waves and turbulence. The
ultimate goal of the study is to provide constraints for parameterized mixing in climate models and
establish foundations for coupling the turbulence and gravity wave parameterizations.

How to cite: Bartoň, Š. and Šácha, P.: Systematic analysis of flow-orography interactionin idealized numerical simulations, EGU General Assembly 2026, Vienna, Austria, 3–8 May 2026, EGU26-3384, https://doi.org/10.5194/egusphere-egu26-3384, 2026.

EGU26-4515 | ECS | Orals | AS1.23

Future alpine precipitation extremes under high-impact atmospheric circulation patterns 

Marc Lemus-Canovas, Alice Crespi, and Manuela Brunner

Understanding the behaviour of future extreme precipitation in the European Alps is a major adaptation challenge, as these events often cause flooding and severe impacts on infrastructure and society. Convection-permitting models (CPMs) have recently emerged as a key tool to better represent extreme precipitation processes in complex Alpine terrain, overcoming limitations of regional climate models (RCMs). While previous studies have analysed future changes in hourly and daily precipitation extremes using CPMs, it remains unclear how extremes will evolve under known impactful atmospheric circulation patterns, such as deep Mediterranean cyclones or persistent southerly flow regimes associated with major Alpine flood events.

Here, we investigate future precipitation changes conditioned on circulation types associated with observed high-impact events. We build on 6 impactful historical circulation types derived from the circulation classification scheme proposed in Lemus-Canovas et al. (2025). To identify circulation and   precipitation patterns analogous to these target circulation types, we apply a combined circulation–precipitation analogue framework. Candidate days are required to belong to the 10% closest circulation analogues, defined by the joint similarity of daily sea-level pressure and 500 hPa geopotential height fields simulated by each of the five EURO-CORDEX RCMs relative to the corresponding ERA5 circulation-type composite, quantified using a root-mean-square distance over the European domain. In addition, these candidate days must exhibit high precipitation-pattern agreement, defined as correlations exceeding the 90th percentile between CPM-simulated daily precipitation and an Alpine-wide observational precipitation dataset. Note that CPM outputs are first aggregated from hourly to daily resolution for the purpose of analogue selection. The final analogue dates are retained when basin-averaged precipitation exceeds the 90th percentile—computed separately for each experiment (Historical: 1996–2005; RCP8.5: 2090–2099) and weather type—if either 1-hour or 24-hour accumulated precipitation exceed the threshold in the most affected Alpine basins.

Our results show a precipitation intensification of autumn Mediterranean-origin weather types across all accumulation steps by the end of the century. For these circulation types, hourly precipitation extremes in CPMs scale with temperature   at or above the Clausius–Clapeyron rate (~7%/K), while weaker scaling is found at daily timescales. In contrast, summer-dominated weather types exhibit slight intensity increases at hourly scales but decreases at daily accumulations. These findings highlight strong circulation-dependent and scale-dependent changes in Alpine precipitation extremes and are particularly relevant for future risk management in the Alps.

References:

Marc Lemus-Canovas, Manuela Irene Brunner, Massimiliano Pittore, et al. Spatio-temporal patterns and drivers of high-impact precipitation events in the European Alps (1961-2022). ESS Open Archive . September 12, 2025. https://doi.org/10.22541/essoar.175767109.93227583/v1

How to cite: Lemus-Canovas, M., Crespi, A., and Brunner, M.: Future alpine precipitation extremes under high-impact atmospheric circulation patterns, EGU General Assembly 2026, Vienna, Austria, 3–8 May 2026, EGU26-4515, https://doi.org/10.5194/egusphere-egu26-4515, 2026.

EGU26-4643 | ECS | Posters on site | AS1.23

Convection-Permitting Projections of Summer Extreme Precipitation Over the Tibetan Plateau 

Yongjun Chen, Wenxia Zhang, Liwei Zou, and Tianjun Zhou

Extreme precipitation is crucial for hydrological cycle and water resources, and has increased over many regions in recent decades. However, simulating and projecting precipitation extremes remain challenging over complex terrains, such as the Tibetan Plateau (TP). In this study, we evaluate the performance of the kilometer-scale (3.3 km) convection-permitting ICON model in simulating summer daily precipitation characteristics and extremes over the TP and project its future changes, focusing on the comparison with coarser-resolution CMIP6 models. ICON reasonably reproduces the observed daily precipitation characteristics, reducing the bias by ~80–95% for dry day frequency and precipitation-event persistence compared to ERA5 and the CMIP6 ensemble, and substantially lowering biases in extreme precipitation. For future projections, both ICON and CMIP6 project qualitatively consistent signals, including increasing extreme precipitation over almost the entire TP and, over the southeastern TP, increasing dry-day frequency and more frequent but shorter precipitation events. Despite consistent signs, ICON suggests an overall drier future over the southeastern TP than CMIP6, characterized by larger increases in dry days, smaller increases in extreme precipitation and event frequency, and a larger reduction in event duration. The systematic drier future in ICON compared to CMIP6 are linked to projected weakened low-level southwesterlies south of the TP, which suppress moisture transport into the interior southeastern TP and thus, reduce both daily and extreme precipitation. As water from southeastern TP affects downstream populations closely, these results are expected to provide more reliable projections for future risk assessments.

How to cite: Chen, Y., Zhang, W., Zou, L., and Zhou, T.: Convection-Permitting Projections of Summer Extreme Precipitation Over the Tibetan Plateau, EGU General Assembly 2026, Vienna, Austria, 3–8 May 2026, EGU26-4643, https://doi.org/10.5194/egusphere-egu26-4643, 2026.

EGU26-4921 | ECS | Posters on site | AS1.23

From Global to Regional: The Added Value of High-Resolution Dynamical Downscaling for Precipitation in Southwest Asia's Complex Terrain 

Markella Bouchorikou, Thi Quynh Trang Nguyen, and Christoph Raible

Southwest Asia (SWA) is a climatically sensitive region where water resources are determined by the complex interactions between the Indian Summer Monsoon and Mediterranean winter systems. Coarse-resolution Global Climate Models (GCMs) have difficulties in capturing the arid-to-semi-arid hydroclimate of the region, which is characterized by high variability and orographically intensified precipitation. This study evaluates the added value of dynamical downscaling in representing mean and extreme precipitation in SWA. We use the Weather Research and Forecasting (WRF) model at a resolution of 10 km, driven by boundary conditions from the Community Earth System Model (CESM v1.2.2). For evaluating the models, we compare the native CESM (~2° resolution), the downscaled WRF simulation, and the ERA5 reanalysis for the common period 1950-2002. Our analysis reveals two outcomes for regional downscaling. First, the downscaled WRF simulation significantly improves the representation of the annual cycle, closely agreeing with ERA5, while the original CESM overestimates precipitation during summer. This overestimation can also be seen in the extreme precipitation values of CESM, especially in the south part of our region. Second, in areas of complex orography, like the Zagros Mountains, WRF tends to exaggerate precipitation compared to ERA5. Spatial differences between WRF and ERA5 precipitation in these complex regions can be attributed to the higher resolution of WRF. The extreme precipitation pattern generally agrees between WRF and ERA5 even though we observe the aforementioned spatial differences. The findings point out that dynamical downscaling can accurate simulate  topographically forced precipitation,  reducing large-scale GCM biases. This offers an important baseline for improved representation of precipitation in complex mountainous regions with low observational data availability, such as SWA.


How to cite: Bouchorikou, M., Nguyen, T. Q. T., and Raible, C.: From Global to Regional: The Added Value of High-Resolution Dynamical Downscaling for Precipitation in Southwest Asia's Complex Terrain, EGU General Assembly 2026, Vienna, Austria, 3–8 May 2026, EGU26-4921, https://doi.org/10.5194/egusphere-egu26-4921, 2026.

Although the concept of enhanced mountain warming has been around for several decades, it was not until just over a decade ago that the concept of elevation-dependent warming, whereby warming rates may be stratified by elevation, was widely identified by the scientific community as an important phenomenon. Unlike Arctic amplification, which is broadly homogenous, elevation dependent warming (EDW) is more complex, and although systematic changes in warming rates over the elevation gradient are often present, the pattern of the elevation profile is often non-linear and it can change with season, time of day and location. This is probably because there are a wide variety of drivers which can be responsible for contrasting warming rates, including patterns of surface albedo change (often driven by retreating snow cover and/or vegetation changes), aerosol loadings (and deposition on snow), changes in the free atmospheric lapse rate, Planck feedback and moisture controls on downward longwave emission (DLR) and clouds. In any one season or location, one or more of these drivers may have a dominant impact, leading to contrasting elevation patterns of change. 
Over recent years there has been an acknowledgement that elevation dependent changes involve broad adjustments in the climate system, which includes vertical gradients of precipitation, condensation, wind speed and shear, humidity and clouds. There has been a change in emphasis from EDW towards EDCC (elevation-dependent climate change). However our understanding of elevation dependent changes in variables other than temperature is in its infancy, in part because of lack of reliable observations at high elevations. Mountain precipitation (rain and snow) is particularly hard to measure accurately, and gridded datasets often interpolate to higher elevations based on limited observations. 
Future developments in EDCC research must involve both improving high elevation observations and learning from the new tranche of convection permitting models which can explicitly resolve more atmospheric processes such as mountain slope winds and small scale convection. Particular questions concern how orographic precipitation gradients may change, both for widespread stratiform precipitation and more intense localised convective storm development (often in summer). How the frequency and intensity of extreme events in mountain regions will change is also an important unanswered question, in particular how enhanced hourly precipitation extremes and heatwaves will be impacting high elevation regions. How EDCC will interact with the rate of snow loss and cryospheric change is also a major area of future concern, including impacts on downstream water supply. Other areas of EDCC research which have so far received relatively little attention include teleconnections with large scale circulation features such as the jet stream and Asian Monsoons, and interactions with ecological zonation and habitat hypsometry. The impact on mountain micro-climates, including the frequency, intensity and location of cold air pools is also not well understood. Thus, there are still numerous unanswered questions about climate change in mountain regions and at high elevations. 

How to cite: Pepin, N.: A decade of research in elevation dependent climate change (EDCC): A review of past discoveries and perspectives on future developments, EGU General Assembly 2026, Vienna, Austria, 3–8 May 2026, EGU26-5737, https://doi.org/10.5194/egusphere-egu26-5737, 2026.

EGU26-6475 | ECS | Posters on site | AS1.23

ERA5L Temperature validation in the Extended European Alpine Region 

Marco Bongio, Matteo Sangiorgio, and Carlo De Michele

Reanalysis products, like ERA5-Land, offer user-friendly, high-resolution gridded climate data (9 km) by combining ground observations, remote sensing, and model estimates. However, they inevitably contain uncertainties due to data gaps and modelling. Validating these datasets with land-based measurements is essential, though these observations also suffer from errors and inconsistencies. For this reason, this study validates ERA5-Land Temperature over the Extended European Alpine Region using the EEAR-Clim dataset, which includes only observational data records that meet strict reliability and temporal-consistency criteria.

The validation process involves 159 land-based meteorological stations, along with their corresponding nearest grid points in the ERA5-Land dataset. These grid points meet two criteria: a maximum elevation difference of ±100 meters and a maximum horizontal distance of ±0.5°. The selection procedure is designed to avoid repetition. The 159 grid points are different from each other. The stations are located between 504 and 2,965 meters above sea level and cover the period 1980–2020. We compared the daily temperature probability distributions for each station, grouping the stations into five elevation bands as well as considering the entire dataset. Our analysis examined temperature bimodality, the autocorrelation function, the ‘near-0°C probability’, and the ongoing issue of elevation-dependent warming trend.

The analysis shows that ERA5-Land generally underestimates temperature, with a global mean bias of –0.94 °C, and overestimates the standard deviation by +0.24 °C. The mean absolute error ranges from +1.37 °C in the lowest elevation band to +2.19 °C in the highest. The EEAR-Clim dataset provides clear evidence that low-elevation stations exhibit a bimodal temperature probability distribution, while stations above 1,500 m show a transition toward a unimodal distribution. ERA5-Land does not reproduce this transition, as even the highest grid points retain two main modes. The autocorrelation function of the observations decreases with elevation, whereas ERA5-Land shows increasing errors in its estimates, particularly at high elevations. The ‘near-0 °C probability’ is overestimated at low elevations and underestimated at high elevations. Despite this, the two datasets show good agreement in their estimates of the mean annual temperature trend rate, irrespective of elevation. However, the EEAR-Clim dataset indicates that lower elevations have warmed faster than the highest ones. These results are influenced by high variability and the limited number of stations above 2,000 m, which may affect or obscure the true temperature behavior. This underscores the urgent need for additional instrumentation, particularly at high elevations.

How to cite: Bongio, M., Sangiorgio, M., and De Michele, C.: ERA5L Temperature validation in the Extended European Alpine Region, EGU General Assembly 2026, Vienna, Austria, 3–8 May 2026, EGU26-6475, https://doi.org/10.5194/egusphere-egu26-6475, 2026.

EGU26-6720 | Orals | AS1.23

The impact of forest cover on the modeled valley atmosphere 

Manuela Lehner and Gaspard Simonet

The spatial resolution and accuracy of land-cover datasets used in numerical models can have a significant impact on the modeled mountain boundary layer. The land-surface cover influences the surface-energy budget through, for example, the effect of albedo on net shortwave radiation and roughness length on the turbulent exchange between the surface and the atmosphere. Local heating and cooling of the near-surface valley atmosphere are thus equally affected by the land-surface cover, which in turn influences the development of thermally driven slope and valley winds. In addition, the roughness length impacts near-surface turbulent momentum transport and flow fields, which may be of particular importance for shallow slope winds.

We have performed a series of WRF simulations for the Inn Valley, Austria, using three different land-use datasets and three idealized land-cover distributions. The two standard WRF land-use datasets MODIS and USGS strongly overestimate the amount of forest cover in the valley compared to the newer and better resolved CORINE Land Cover (CLC18) dataset. To further analyze the impact of this overestimation in forest cover, semi-idealized simulations are performed with a prescribed amount of forest cover across the model domain. The presentation will show the impact of the land cover on the local surface-energy budget and near-surface atmosphere as well as on the bulk valley atmosphere. Differences in the local sensible heat flux averaged over the surface of the valley are linked to total heating of the valley and the resulting valley-wind circulation.

How to cite: Lehner, M. and Simonet, G.: The impact of forest cover on the modeled valley atmosphere, EGU General Assembly 2026, Vienna, Austria, 3–8 May 2026, EGU26-6720, https://doi.org/10.5194/egusphere-egu26-6720, 2026.

EGU26-6869 | ECS | Posters on site | AS1.23

Exploring the complex dynamic of summer extreme events in the European Alpine Region using the high-resolution CORDEX-FPS ensemble 

Anna Napoli, Nikolina Ban, Claudia Pasquero, and Dino Zardi

Extreme summer precipitation events pose significant challenges, particularly in regions with complex topography such as the European Alps. Furthermore, the pronounced vulnerability of this region to climate change underscores the need to better understand its precipitation dynamics and processes at different spatial and temporal scales.

To in-depth investigate the spatial and temporal characteristics of these events, this study employs high-resolution regional climate simulations from the Coordinated Regional Climate Downscaling Experiment Flagship Pilot Studies (CORDEX-FPS) on convection over the Alps and the Mediterranean region. Focusing specifically on elevation-dependent patterns and sub-daily variability, we analyze the spatial distribution of summer precipitation extremes and the underlying processes associated with these events.

The results identify key hotspots of precipitation intensity and frequency, providing valuable insights for risk assessment, management, and adaptation strategies in mountainous regions. They also demonstrate how topography and other static factors, together with dynamic processes, affect the distribution of extreme precipitation events.

How to cite: Napoli, A., Ban, N., Pasquero, C., and Zardi, D.: Exploring the complex dynamic of summer extreme events in the European Alpine Region using the high-resolution CORDEX-FPS ensemble, EGU General Assembly 2026, Vienna, Austria, 3–8 May 2026, EGU26-6869, https://doi.org/10.5194/egusphere-egu26-6869, 2026.

EGU26-7635 | Orals | AS1.23

On the proper use of near-surface temperature observations in atmospheric models deployed over mountain regions 

Isabelle Gouttevin, Danaé Préaux, Ingrid Etchevers, and Yann Seity

Near surface air temperature is a key meteorological parameter with high implications for the understanding and modelling of snow and water resource in mountain regions. Yet, it is hard to estimate and forecast accurately in these environments due to observational scarcity and model limitations in complex terrain.

In the present study, we analyze whether structural inhomogeneities in observational networks for temperature in mountain regions contribute to errors in their representations in numerical weather prediction (NWP) systems. Taking the case of the Arome-France NWP system over the French Alps, we analyze in particular the effects of the disparity in height above ground of the temperature sensors, of the inhomogeneous geographical distribution of stations that are preferentially located in valleys, and of the frequent altitude mismatch between stations’ real location and model grid points. We evaluate the consequences of these inhomogeneities in terms of model evaluation and data assimilation.

We especially show that measurement height is of high impact for model evaluation, providing a strong incentive to revisit model scores in mountain regions. It also carries strong implications for the assimilation, leading in the case of Arome-France to a negative impact of the assimilation of high-altitude temperature data if their height above ground is not properly considered. Inhomogeneities in data density between mountains and valleys also play a role that can be modulated depending on the assimilation system. This work paves the way for a better use of high-altitude near-surface observations within models deployed over mountain regions.

How to cite: Gouttevin, I., Préaux, D., Etchevers, I., and Seity, Y.: On the proper use of near-surface temperature observations in atmospheric models deployed over mountain regions, EGU General Assembly 2026, Vienna, Austria, 3–8 May 2026, EGU26-7635, https://doi.org/10.5194/egusphere-egu26-7635, 2026.

EGU26-8111 | ECS | Posters on site | AS1.23

Anabatic Flows over Idealized Mountain Ridges and the Relation between Slope Angle and Turbulence Anisotropy 

Andreas Rauchöcker, Ivana Stiperski, and Alexander Gohm

Anabatic winds are thermally-driven flows that develop over heated mountain slopes. These upslope winds develop when the air near the slope rises due to the along-slope component of the buoyancy force, driven by the horizontal temperature contrast between the heated slope-adjacent air and the cooler ambient air at the same elevation. Due to the temperature difference, a horizontal pressure gradient forces the air to rise along the slope. Anabatic flows have a distinct vertical structure, with a near-surface wind maximum and a jet-like profile.

According to Prandtl’s analytical model and data from numerical simulations, the strength and depth of the anabatic flow layer are sensitive to the slope angle. The slope angle has also been suspected as a potential driver of turbulence anisotropy based on measurement results. The impact of the slope angle on turbulence anisotropy, however, has not been investigated in numerical simulations so far. To address this gap, we used the Cloud Model 1 (CM1) to conduct high-resolution large-eddy simulations of anabatic flows above idealized ridges to evaluate the influence of ridge height, slope angle and slope curvature on turbulence anisotropy. In total, 10 simulations have been conducted so far, consisting of 7 simulations for sinusoidal ridges of different heights, widths and slope angles and three simulations for ridges with the same constant slope angle but different ridge heights. The simulations were initialized with a constant potential temperature gradient throughout the domain and a constant surface heat flux of 0.12 K m s-1 and ran with a grid spacing of 10 m horizontally and 5 m vertically.

First results suggest that steeper slopes lead to more anisotropic turbulence. Apart from the slope angle itself, terrain curvature has a pronounced effect on the degree of anisotropy, as turbulence is more isotropic above slopes with constant slope angles compared to concave slopes of sinusoidal ridges. This is expected since upslope flow along a concave slope implies concave streamlines, and concave streamlines enhance shear stress and the momentum flux according to to the streamline curvature analogy. To gain further insights into the processes causing anisotropic turbulence, we plan to also investigate potential correlations between the degree of anisotropy and individual terms in the turbulent kinetic energy budget.

How to cite: Rauchöcker, A., Stiperski, I., and Gohm, A.: Anabatic Flows over Idealized Mountain Ridges and the Relation between Slope Angle and Turbulence Anisotropy, EGU General Assembly 2026, Vienna, Austria, 3–8 May 2026, EGU26-8111, https://doi.org/10.5194/egusphere-egu26-8111, 2026.

Coastal Santa Barbara is among the most wildfire-prone communities in Southern California. Downslope, dry, and gusty windstorms frequently occur along the south-facing slopes of the east–west-oriented Santa Ynez Mountains (SYM), which separate the Pacific Ocean from the Santa Ynez Valley. These winds, known as Sundowner Winds, typically peak after sunset and often persist overnight. They represent the most critical fire-weather phenomenon in the region.

The Sundowner Winds Experiment (SWEX), conducted from 1 April to 15 May 2022, integrated airborne and ground-based observations to examine interactions between continental and marine atmospheric boundary layers (ABLs), assess mountain waves and hydraulic jumps and their influence on surface winds and dew point, and evaluate forecasting challenges in mesoscale models.

This study analyzes two Sundowner events—IOP-2 (April 5–6) and IOP-10 (May 12–13)—affecting the eastern SYM. IOP-2 occurred during a heat wave, with temperatures reaching the 95th percentile, whereas IOP-10 reflected typical spring conditions.

During IOP-2, observations revealed sharp elevated inversions near the SYM, with mountain waves propagating across these layers. The free atmosphere was extremely dry, and strong horizontal winds were confined near inversion height. On the lee side, a large-amplitude lee wave evolved into a hydraulic jump, followed by wave breaking and a downslope jet. Despite strong offshore forcing, a shallow sea breeze developed over the eastern foothills, while nighttime marine boundary layer (MBL) intrusion—capped by a strong inversion—played a key role in the Sundowner cycle. Descending wave structures and rotor circulations produced reversed flows and enhanced surface winds. A nocturnal mid-channel eddy over the Santa Barbara Channel further stratified the MBL and decoupled it from the downslope jet. WRF simulations at 1-km resolution underestimated ridgetop and lee slope winds and overestimated coastal winds, with biases linked to misrepresentation of ABL height, inversion strength, and delayed MBL advection.

IOP-10 was investigated using ground-based instruments and radiosondes. It featured the second-largest observed mean sea level pressure difference between Santa Barbara and Bakersfield during SWEX. However, winds exceeding 20 m/s occurred on eastern slopes hours before peak pressure differences. LiDAR detected vertical motions near 6 m/s, associated with lifting of the lee-slope jet and weakening of surface winds—evidence of mountain wave activity influencing wind intermittency. Similar to IOP-2, the nocturnal mid-channel eddy contributed to lifting the lee jet and terminating Sundowners near the surface.

These findings emphasize the need for accurate representation of inversion structure and height, as well as marine–continental ABL interactions, in mesoscale models. Realistic simulation of complex flow dynamics—such as mountain waves and hydraulic jumps—is essential to improve forecasts of downslope winds in coastal environments. The SWEX campaign provided unique measurements to evaluate these features.

How to cite: Carvalho, L. M. V.: Downslope Windstorms in Coastal Mountains: Observations and Modeling during the Sundowner Wind Experiment (SWEX), EGU General Assembly 2026, Vienna, Austria, 3–8 May 2026, EGU26-8550, https://doi.org/10.5194/egusphere-egu26-8550, 2026.

EGU26-8916 | Posters on site | AS1.23

East Asian Spring Precipitation and its Dry Trend revealed by CMIP6 High-Resolution Coupled Models 

Peng Zi, Jiandong Li, Ruowen Yang, Yimin Liu, ZihanYang Yang, Taohui Li, Bian He, and Qing Bao

The persistent spring precipitation over East Asia, with a notable drying trend in recent decades, poses substantial impacts on the regional hydrological cycle and socio-economy. This study investigates the climatology and long-term trend of East Asian spring precipitation during 1980-2014 simulated from CMIP6 HighResMIP coupled models, focusing on the role of model horizontal resolution. Our results show that high-resolution models outperform their low-resolution counterparts in simulating the spatial pattern and intensity of East Asian spring mean precipitation, owing to improved representations of low-level winds and moisture transport. However, many high-resolution models in HighResMIP fail to reproduce the long-term variation of East Asian spring precipitation and associated remote influencing factors (e.g., tropical Pacific and North Atlantic sea surface temperature) while only two models (FGOALS-f3-H and EC-Earth3P-HR) show improved performance for this unique climate phenomenon. Particularly, the high-resolution FGOALS-f3-H model exhibits the best skill in simulating this regional climatic change, increasing a regional mean drying trend from -0.10 in its low-resolution version to -0.33 mm day-1 decade-1 (observed: -0.43). This remarkable improvement in FGOALS-f3-H stems from more realistic representations of both the weakening Western North Pacific Anticyclone and strengthening Mongolia High, which are key regional circulation drivers of the East Asian spring drying trend, as well as its improved simulation of the weakening vertical velocity over East Asia. By contrast, five out of all seven high-resolution models show degraded performance in reproducing this precipitation trend, even showing amplified simulation biases in precipitation trend and improper relationships with remote and regional influencing factors relative to their low-resolution counterparts. This study suggests that the simultaneous improvement of horizontal resolution and physical parameterizations governing precipitation-related interannual variability in climate models is critical for simulating East Asian climatic change.

Keywords: East Asia, spring precipitation, high-resolution models, CMIP6

How to cite: Zi, P., Li, J., Yang, R., Liu, Y., Yang, Z., Li, T., He, B., and Bao, Q.: East Asian Spring Precipitation and its Dry Trend revealed by CMIP6 High-Resolution Coupled Models, EGU General Assembly 2026, Vienna, Austria, 3–8 May 2026, EGU26-8916, https://doi.org/10.5194/egusphere-egu26-8916, 2026.

EGU26-9157 | ECS | Orals | AS1.23

Impact of black carbon on slope and valley winds in idealised simulations  

Johannes Mikkola, Victoria A. Sinclair, Giancarlo Ciarelli, Alexander Gohm, and Federico Bianchi

Thermally-driven valley circulation governs heat, momentum, and pollutant transport in mountains and is affected by the valley topography, large-scale weather, surface properties, and thermal forcing. Aerosols alter the heat distribution in the atmosphere through absorption and scattering of the incoming solar radiation, influencing the boundary layer (BL) development. From studies considering urban BL over flat terrain, it is known that depending on the radiative properties and vertical distribution of the aerosol population, aerosols can either enhance or suppress the buoyancy and mixing in BL, and cause simultaneous cooling and warming at different altitudes within BL. The impact of aerosols on the thermally-driven valley circulation remains poorly understood, a shortcoming addressed by this study.

This study examines how the absorption of incoming solar radiation by black carbon (BC) affects the daytime valley and slope winds in high-resolution idealised simulations using the Weather Research and Forecasting model coupled with chemistry (WRF-Chem). The simulations have an idealised valley topography that has a sinusoidal shape in the cross-valley direction and is 100 km long, 20 km wide, and 2 km deep. The study consists of two simulations: one including realistic BC concentrations interacting with the meteorological fields through absorption of shortwave radiation, and a reference simulation without BC. Heat and momentum budgets for the valley volumes are computed to understand the mechanisms behind the differences in the winds between the two simulations.

BC absorption acts to warm the upper BL and cool the lower levels during daytime, enhancing stability and reducing surface heating. Consequently, up-slope winds are weaker and confined to a shallower layer in the BC simulation. In the afternoon the up-valley winds are stronger in the BC simulation, although BC weakens the daytime temperature difference between the valley atmosphere and the BL above the plain. Based on the classic valley wind theory, the stronger temperature difference, hence a stronger pressure-gradient force, should lead to stronger up-valley winds. The average up-valley wind speed in the afternoon is 2.6 m s-1 in the BC simulation and 2.3 m s-1 in the simulation without BC. However, in the evening when the up-valley winds peak in magnitude, the maximum wind speed is stronger in the simulation without BC with a 0.5 m s-1 margin.

Momentum budget analysis shows that in the simulation without BC the pressure-gradient force is indeed stronger than in the BC simulation, which is in line with the stronger temperature difference. The advection term shows that the vertical export of along-valley momentum out from the valley by the cross-valley circulation, which is seen in the simulation without the BC, is suppressed or even absent in the BC simulation. This occurs likely due to the weaker up-slope winds which allow the stronger up-valley winds to develop in the afternoon despite the weaker pressure-gradient forcing. These results show that realistic BC concentrations can affect the thermally-driven valley circulation and fluxes of heat and momentum, revealing a pathway through which absorbing aerosols can modify the daytime slope and valley wind characteristics.

How to cite: Mikkola, J., Sinclair, V. A., Ciarelli, G., Gohm, A., and Bianchi, F.: Impact of black carbon on slope and valley winds in idealised simulations , EGU General Assembly 2026, Vienna, Austria, 3–8 May 2026, EGU26-9157, https://doi.org/10.5194/egusphere-egu26-9157, 2026.

EGU26-10030 | ECS | Orals | AS1.23

Assessment of temperature variability over the Central System of the Iberian Peninsula: Multi-resolution model evaluation 

Sara Madera Sánchez, Fidel González Rouco, Elena García Bustamante, Jorge Navarro Montesinos, Cristina Vegas Cañas, Esteban Rodríguez Guisado, Ernesto Rodríguez Camino, Juan Carlos Sánchez Perrino, Ignacio Prieto Rico, Emilio Greciano Zamorano, Rita M. Cardoso Tavares, and Luana Cardoso dos Santos

Mountain regions are particularly vulnerable to climate change, as warming reduces snow and ice reserves, thus amplifying positive temperature feedbacks. These processes also have consequences for the hydrological cycle  and, therefore, having wide-ranging impacts on society by altering ecosystem services and products. This highlights the importance of understanding how climate change affects mountain areas. However, the limited availability of long-term climate records at high elevations, due to adverse weather conditions, makes high-resolution regional climate models essential for studying complex terrain. 


The CIMAs (Climate Research Iniciative for Iberian Mountain Areas) project is focused on analyzing climate variability and the impact of climate change on the Central System of the Iberian Peninsula. The studied area is the largest mountain range of the peninsula, reaching 2.592 m at its highest point (Almanzor Peak) and includes surrounding areas with lowest altitudes. 

CIMAs data is gathered from several institutions in Portugal and Spain and distributes over the domain of interest. It was used to asses the accuracy of two regional climate models: the WRF and the HCLIM models at 4 and 1 km horizontal resolution. Both were configured as convection permitting to allow for explicitly simulating convection. In addition, both models were driven by the same boundary conditions provided by the ERA5 reanalysis, which was also used to evaluate the added value of increased resolution by each regional model. 

Results show how increasing resolution improves the simulation of temperature at high elevations and allow for better understanding of the climatology of temperature in this mountain range. The comparison of the WRF and HCLIM simulations with observations highlights differences, mostly in the reproduction of extremes.

How to cite: Madera Sánchez, S., González Rouco, F., García Bustamante, E., Navarro Montesinos, J., Vegas Cañas, C., Rodríguez Guisado, E., Rodríguez Camino, E., Sánchez Perrino, J. C., Prieto Rico, I., Greciano Zamorano, E., Cardoso Tavares, R. M., and Cardoso dos Santos, L.: Assessment of temperature variability over the Central System of the Iberian Peninsula: Multi-resolution model evaluation, EGU General Assembly 2026, Vienna, Austria, 3–8 May 2026, EGU26-10030, https://doi.org/10.5194/egusphere-egu26-10030, 2026.

EGU26-10153 | ECS | Posters on site | AS1.23

Missing drag due to orographic gravity waves in a global numerical weather prediction model 

Hette Houtman, Miguel Teixeira, Suzanne Gray, Peter Sheridan, Simon Vosper, and Annelize van Niekerk

Various studies have shown that low-level drag in the atmosphere is parametrised inconsistently across the world’s numerical weather prediction and climate models, ultimately due to a lack of constraints on the underlying physical processes and the overlap in scale between them. Trapped lee waves (TLWs) are not parametrised in most models but have been shown in theoretical and case studies to produce significant drag (necessarily at low levels) on the atmosphere under the right conditions. To investigate whether TLWs contribute to low-level drag consistently, the resolved momentum fluxes in the archived analyses of the TLW-resolving UKV model are calculated and compared to the resolved plus parametrised gravity wave fluxes in the coarse-resolution, global version of the Met Office Unified Model (MetUM), which does not resolve TLWs.

The comparison between the models reveals that gravity wave momentum fluxes in the UKV model are about double that of the global MetUM in the mid-troposphere and up to four times that in the boundary layer. Only a portion of this discrepancy in momentum fluxes can be explained by the presence of trapped lee wave modes, which are found using a numerical solver of the Taylor-Goldstein equation. The other part is likely to be caused by orographic gravity waves that are reflected due to the general decrease of the Scorer parameter with altitude (and are distinct from the resonant TLWs). This work therefore demonstrates that the inclusion of the drag produced by both reflected and trapped lee waves would alleviate the current issues with low-level drag parametrisation.

How to cite: Houtman, H., Teixeira, M., Gray, S., Sheridan, P., Vosper, S., and van Niekerk, A.: Missing drag due to orographic gravity waves in a global numerical weather prediction model, EGU General Assembly 2026, Vienna, Austria, 3–8 May 2026, EGU26-10153, https://doi.org/10.5194/egusphere-egu26-10153, 2026.

EGU26-10268 | ECS | Posters on site | AS1.23

Differences in the Dominant Modes of the Interannual Variability of Eastern Tibetan Plateau Precipitation between Early and Peak Summers 

Erfan Liu, Song Yang, Haolin Luo, Jiehong Xie, and Ziqian Wang

The spatiotemporal variation of summer precipitation on the Tibetan Plateau (TP) is complex. In this study, we propose that there exist visible differences in the dominant modes of the interannual variability of eastern TP (ETP) precipitation between early (June) and peak (July–August) summers during 1979–2022. A north-south dipole pattern of the precipitation interannual variability appears in early summer, but in peak summer, the dominant mode is changed to be a monopole pattern. This phenomenon is mainly due to the intraseasonal transition of the dominant atmospheric circulation patterns over the TP and surrounding areas. In early summer, the north-south dipole pattern of the interannual variability of ETP precipitation is associated with the upper-level anomalous anticyclonic circulation over the western TP, which is primarily forced by the convective heating of South Asian summer monsoon. Under the control of anomalous northerlies on the eastern side of the anticyclonic circulation, the precipitation on the northern ETP is suppressed by both negative moist enthalpy advection and negative moisture advection. While in peak summer, the monopole pattern of the interannual variability of ETP precipitation is mainly regulated by the large-scale meridional displacement of the subtropical westerly jet. When the westerly jet shifts southward, the strengthened westerlies control the entire plateau and create unified positive moist enthalpy advection over the ETP, finally resulting in anomalous upward motions and increased precipitation; and vice versa. This study provides an insight that further investigations on the ETP summer precipitation should consider the intraseasonal difference. 

How to cite: Liu, E., Yang, S., Luo, H., Xie, J., and Wang, Z.: Differences in the Dominant Modes of the Interannual Variability of Eastern Tibetan Plateau Precipitation between Early and Peak Summers, EGU General Assembly 2026, Vienna, Austria, 3–8 May 2026, EGU26-10268, https://doi.org/10.5194/egusphere-egu26-10268, 2026.

Arctic mountainous environments show pronounced spatial and temporal variability in near-surface air temperature (Tair), driven by complex terrain, frequent temperature inversions, seasonal snow cover, and strong seasonal contrasts in solar radiation. Local atmospheric and surface processes, such as cold-air pooling, can cause rapid temperature changes over short distances and timescales. These dynamics are important for understanding Arctic ecosystem change and climate sensitivity, but remain difficult to quantify using sparse in situ temperature observations alone. Satellite-derived land surface temperature (LST) provides spatially continuous information on surface thermal conditions and has increasingly been explored as a proxy for Tair. However, LST-Tair relationships in Arctic mountain environments are highly variable, complicating the application of satellite LST for characterising fine-scale Tair patterns.


This study uses a unique in situ Tair dataset from the Kevo valley in northern Finland (26.88–27.05°E, 69.72–69.78°N), which is characterised by strong topographic shading, seasonal snow cover and frequent temperature inversions, and is subjected to the polar night and continuous summer daylight. The dataset comprises 65 stations spanning elevations from 74 to 330 m and recording hourly Tair since 2007. These observations are used to evaluate satellite‑derived LST and to develop models for mapping local Tair using Landsat LST combined with terrain and surface variables, including elevation, slope orientation, snow cover and vegetation indices. We analyse higher spatial resolution LST from Landsat sensors together with coarser resolution LST from MODIS Terra/Aqua and Sentinel-3 SLSTR, examining how terrain, snow cover and surface properties influence LST-Tair relationships and the ability of different LST products to represent microclimate variability across the valley. A focused case study examines high-resolution thermal patterns during nighttime and polar-night conditions using Landsat 8/9 LST acquired from October 2024 to August 2025. Preliminary results indicate that strong apparent LST-Tair agreement is largely driven by the seasonal cycle, with correlations in MODIS LST decreasing from ~0.95 to ~0.74 after deseasonalisation. For Landsat, performance is highly sensitive to data quality, with good‑quality data aligning closely with Tair and poorer‑quality data producing large scatter and a cold bias.

How to cite: Mo, Y., Pepin, N., and Lovell, H.: Mapping Arctic mountain microclimates using satellite land surface temperature: insights from the Kevo valley, northern Finland, EGU General Assembly 2026, Vienna, Austria, 3–8 May 2026, EGU26-10471, https://doi.org/10.5194/egusphere-egu26-10471, 2026.

EGU26-11637 | ECS | Orals | AS1.23

Coupling between Free Tropospheric Warming and Elevated Surface Warming 

Pietro Martuzzi and Marco A. Giorgetta

Elevation-dependent warming (EDW) has been reported in observations and climate models, yet its magnitude and controlling mechanisms remain uncertain, particularly due to the complexity of mountain regions. However both theoretical studies and climate simulations indicate a reduction in lapse rates and enhanced tropospheric warming under climate change. In this study, we examine EDW, and its relationship to tropospheric warming, in atmosphere-only experiments. This is done through the comparison between a historical control simulation and a perturbed climate state driven by uniform 4K warming in the prescribed sea surface temperatures. These simulations were performed with the ICON model in its Sapphire configuration at ∼10 km horizontal grid spacing. This setup offers an improved representation of high-elevation terrain compared to common climate change simulations, key to adequate analysis of EDW, together with a strong free-tropospheric warming, important for understanding its role in shaping EDW. 
The simulation exhibits a robust, statistically significant increase in surface warming with elevation, ranging from ∼4.9 K below 500 m to almost 7 K above 5500 m, corresponding to a global EDW slope of 0.317 K km-1. Regional contrasts are most pronounced at low elevations, while at intermediate and high elevations the surface warming profiles converge toward the tropospheric warming profile. Seasonal variations suggest an influence from snow-related processes, yet the majority of the seasonal variability in surface warming can be explained by seasonal variations in tropospheric warming.
A direct comparison of binned surface and tropospheric temperature changes at corresponding heights reveals a tight coupling, with small deviations possibly resulting from radiative processes near the surface. These results indicate that, under strong free-tropospheric warming, EDW can be approximated to first order by the vertical structure of tropospheric warming, with surface energy-balance processes largely providing secondary modulation. The sensitivity of this coupling to different forcing magnitudes and climate states warrants further investigation.

How to cite: Martuzzi, P. and Giorgetta, M. A.: Coupling between Free Tropospheric Warming and Elevated Surface Warming, EGU General Assembly 2026, Vienna, Austria, 3–8 May 2026, EGU26-11637, https://doi.org/10.5194/egusphere-egu26-11637, 2026.

EGU26-11787 | Orals | AS1.23

Radiative impacts of particulate matter in a Himalayan valley: A modelling case study of the Khumbu Valley, Nepal. 

Giancarlo Ciarelli, Ludovico Di Antonio, Johannes Mikkola, Victoria A. Sinclair, Arineh Cholakian, Bertand Bessagnet, Tursumbayeva Madina, Angela Marinoni, Paolo Tuccella, and Federico Bianchi

Air pollution in mountain ecosystems has recently received particular attention. The peculiar and complex topography of such regions, combined with region-specific heating practices, has been shown to significantly reduce air quality levels, particularly in locations and communities situated on mountain valley floors.

The Khumbu Valley, located in the Himalayan ridge, connects the Indo-Gangetic Plain to the Nepal Climate Observatory – Pyramid (NCO-P) observation site at the foothills of Mount Everest (5079 m a.s.l). It often experiences high levels of particulate matter, including carbonaceous aerosols species (e.g. black carbon), which are largely modulated by the typical mountain valley circulation. These aerosols can be transported into the Khumbu valley from the Indo-Gangetic plain through thermally driven up-valley flows. However, the extent to which such circulation is directly impacted by absorbing and scattering aerosol compounds is currently unknown.

In this study, we conducted a one-month regional chemical transport model (CTM) simulation using the WRF-CHIMERE model at 1 km horizontal grid spacing, centered over the Khumbu Valley. The resolution was chosen to best account for the valley wind circulation typical of the region, while maintaining a trade-off with computational demands. We evaluated the impact of aerosols on meteorology due to aerosol-radiation interactions (ARI) over the Khumbu Valley and quantified its overall absolute magnitude. The pre-monsoon month of April was chosen as the period when transport of particulate matter from the Indo-Gangetic Plain is at its peak. Our results indicated that the model was able to reproduce the influx of particulate matter from the Indo-Gangetic Plain, with the modelled midday average peak in line with measurements at the NCO-P site. Accounting for ARI in the meteorological host model indicated a statistically significant cooling of the valley induced by aerosols, with potential implications for valley wind circulation. Given the extent of the Himalayan range, the results presented here may have implications for future climate scenarios, as aerosol-radiation interactions are often not resolved in coarse Earth system model applications.

How to cite: Ciarelli, G., Di Antonio, L., Mikkola, J., Sinclair, V. A., Cholakian, A., Bessagnet, B., Madina, T., Marinoni, A., Tuccella, P., and Bianchi, F.: Radiative impacts of particulate matter in a Himalayan valley: A modelling case study of the Khumbu Valley, Nepal., EGU General Assembly 2026, Vienna, Austria, 3–8 May 2026, EGU26-11787, https://doi.org/10.5194/egusphere-egu26-11787, 2026.

EGU26-12250 | Posters on site | AS1.23

Optimizing Meteorological Station Placement for High-Resolution Field Reconstruction in Mountainous Terrain 

Anna Poltronieri and Nikolas Olson Aksamit

Reconstructing high-resolution geophysical fields from sparse observations is a central challenge for environmental sensing and model evaluation in complex terrain. While high-resolution climate models provide detailed insights, they are computationally expensive and difficult to validate in remote mountainous regions. This work adapts a data-driven sparse sensor placement framework [1] to identify optimized meteorological station locations for an arbitrary number of sensors in complex terrain.

Applied to a mountainous region in northern Norway, our approach can help hydrologists, glaciologists, and climate scientists determine where to place sensors to obtain independent streams of data, supporting a comprehensive representation of variables such as wind speed, humidity, or snow depth. We generalize the original framework by introducing a spatial weighting formulation, allowing users to prioritize specific sub-regions or account for physical constraints such as inaccessible terrain. In addition, prevailing wind patterns are incorporated into the selection criteria, guiding sensor placement toward configurations that capture the most frequent and impactful flow regimes. An orthogonal component approach is further introduced to integrate existing stations, ensuring that newly deployed sensors capture complementary information rather than redundant data. Ongoing work explores the use of the same framework to reconstruct missing or partially degraded measurements when stations are temporarily unavailable, using information from the remaining network.

A key advantage of the framework is its transparency. In contrast to many data-driven or machine-learning-based downscaling approaches, the reconstruction relies on explicit linear algebra operations, providing a traceable link from point observations to a domain-wide target field. For operational safety applications such as monitoring airport winds or avalanche hazards, this offers a computationally efficient and flexible alternative when high-resolution simulations are unavailable.

[1] Xihaier Luo, Ahsan Kareem, and Shinjae Yoo. “Optimal sensor placement for reconstructing wind pressure field around buildings using compressed sensing”. In: Journal of Building Engineering 75 (2023), p. 106855. issn: 2352-7102.

How to cite: Poltronieri, A. and Olson Aksamit, N.: Optimizing Meteorological Station Placement for High-Resolution Field Reconstruction in Mountainous Terrain, EGU General Assembly 2026, Vienna, Austria, 3–8 May 2026, EGU26-12250, https://doi.org/10.5194/egusphere-egu26-12250, 2026.

EGU26-13277 | ECS | Posters on site | AS1.23

Representing local-scale temperature patterns in complex terrain: performance of high-resolution datasets 

Elena Maines, Alice Crespi, Piero Campalani, Massimiliano Pittore, and Marc Zebisch

Gridded near-surface air temperature datasets are essential for environmental and climate applications, providing spatially continuous information beyond point measurements. In mountain regions, however, accurately representing temperature is particularly challenging. Strong spatial variability, frequent departures from simple elevation-based gradients, and cold-air pooling driven by nocturnal cooling and drainage flows lead to complex temperature patterns that are generally underrepresented when interpolating temperature observations from sparse weather stations. These limitations can reduce the accuracy in capturing extreme conditions, such as hot spells in the valley bottoms and urban areas or cold spells and strong thermal inversions. High-resolution dynamical models offer a complementary, physically based perspective by explicitly resolving terrain and atmospheric processes, improving representation of temperature gradients, diurnal cycles, and local circulations. Yet, near-surface temperatures in complex terrain remain sensitive to model resolution and surface-atmosphere coupling. The distinct strengths and limitations of these approaches raise the question of how different methods perform in representing local temperature patterns in complex terrain. In this study, we compare a 1-km dataset of daily near-surface air temperature produced through an interpolation scheme with high-resolution fields from dynamical modelling to assess the abilities to represent temperature variability in a complex mountainous terrain like the one of the Adige River catchment in Eastern Italian Alps. The interpolation method estimates the vertical temperature structure through a daily fitted, non-linear temperature-elevation profile based on more than 600 station observations at multiple altitudes and accounts for topographic complexity (Frei, 2014). Model-based products include the km-scale reanalysis VHR-REA_IT (Raffa et al., 2022) obtained by a dynamical downscaling of ERA5 for Italy at approximately 2-km resolution and the Copernicus European Regional ReAnalysis (CERRA). The comparison is conducted over the period 1990-2020 and focuses on the representation of temperature extremes and their spatial variability, e.g., cold-air pooling and heatwaves, and on the description of daily vertical profiles. Interpolated fields capture local extremes and cold-air pools where observations are available but are limited in resolving broader spatial variability and vertical thermal structure. In contrast, high-resolution reanalyses provide a more physically consistent depiction of thermal gradients, although systematic differences in describing extremes emerge. Our results will illustrate how the complementarity of approaches can guide the appropriate use and integration of temperature products in mountainous regions to support temperature-related hazard monitoring and risk assessment. 

How to cite: Maines, E., Crespi, A., Campalani, P., Pittore, M., and Zebisch, M.: Representing local-scale temperature patterns in complex terrain: performance of high-resolution datasets, EGU General Assembly 2026, Vienna, Austria, 3–8 May 2026, EGU26-13277, https://doi.org/10.5194/egusphere-egu26-13277, 2026.

EGU26-13515 | ECS | Posters on site | AS1.23

Recent high-altitude observations (2013-2024) of extreme air temperatures and associated atmospheric circulation patterns in the tropical Andes 

Tania Ita Vargas, Jean Emmanuel Sicart, Isabella Zin, Thomas Condom, Wilson Suarez, Kelita Quispe, Clementine Junquas, and Jhan-Carlo Espinoza

High-altitude mountains play a key role in modulating regional weather and climate. The tropical Andes in South America are characterized by strong climatic diversity and complex orography. In this region, identifying atmospheric circulation patterns (CPs) that control the meteorological extremes across different altitudinal and latitudinal gradients remains challenging. Using unique, quality-controlled hourly air temperature observations from four automatic weather stations located above 4700 m a.s.l. in the Peruvian Andes, this study links local extreme air temperature events to large-scale CPs during 2013-2024. CPs were identified using a k-means clustering algorithm applied to the standardized anomalies of the daily 200-hPa wind field from the ERA5 reanalysis over South America (10° N-30° S, 90°-30° W) for the 1980-2024 climatological period. Nine CPs were identified and classified into dry (D1-D4), wet (W1-W3), and transitional (T1-T2) circulation types, consistent with the regional seasonal cycle. Results show that warm nights (daily minimum air temperature exceeding the 90th percentile) are closely related to the occurrence of the transitional (dry-to-wet season) CP T1. This pattern is linked to warmer-than-normal conditions relative to the daily climatology, with a high frequency of warm nights observed from April to November. The 200-hPa circulation associated with T1 exhibits an upper-level ridge extending down to 500-hPa, resembling the Bolivian High. This circulation enhances easterly flow, favoring the advection of warm and moist air into the Andes and increasing nighttime and early-morning cloud cover. These conditions inhibit nocturnal radiative cooling and maintain elevated minimum air temperatures during a climatologically cold period in the Andes. During the 2023-2024 El Niño event, warm nights increased markedly compared to the previous years, while cold events became less frequent. This behavior appears to be primarily linked to an increased frequency of the T1 pattern, reaching up to 35%, particularly during July-October 2023 and April-July 2024. These findings provide a framework for future analyses of changes in this circulation regime under future climate scenarios and its role in modulating warm temperature extremes over the tropical glaciers.

How to cite: Ita Vargas, T., Sicart, J. E., Zin, I., Condom, T., Suarez, W., Quispe, K., Junquas, C., and Espinoza, J.-C.: Recent high-altitude observations (2013-2024) of extreme air temperatures and associated atmospheric circulation patterns in the tropical Andes, EGU General Assembly 2026, Vienna, Austria, 3–8 May 2026, EGU26-13515, https://doi.org/10.5194/egusphere-egu26-13515, 2026.

EGU26-14380 | Orals | AS1.23

Is bias correction necessary for CPRCM-driven flood simulation in mountainous region? 

Lu Li, Kun Xie, Hua Chen, Stefan P. Sobolowski, Øyvind Paasche, and Chong-yu Xu

Convection-permitting regional climate models (CPRCMs) at kilometer scale can better represent intense precipitation, yet their added value for flood-risk applications is still limited and often inconsistent. A key reason is the presence of systematic biases in precipitation and temperature over complex terrain, which may strongly affect hydrological response. To address whether bias correction is necessary when using CPRCM forcing for flood modelling in complex terrain, we run WRF-Hydro with raw and bias-corrected 3-km HCLIM3 precipitation and temperature for two contrasting basins spanning coastal to mountainous terrain in western Norway: Røykenes (coastal, rainfall-driven floods) and Bulken (mountainous, snowmelt-influenced floods). We further compare two widely used bias-correction approaches, i.e., Quantile Mapping (QM) and Distribution Delta Mapping (DDM), applied to precipitation and temperature prior to the hydrological simulations.

The results show that bias correction reduces mean biases in both variables, but its effectiveness depends on basin type and metric. In Røykenes basin, QM does not adequately correct annual maximum 1-hour precipitation, whereas DDM provides a better adjustment of extreme precipitation. For temperature, the correction reduces absolute bias relative to raw HCLIM3 but also shifts the bias from cold to warm. In terms of hydrological performance, raw HCLIM3 forcing already yields a small flood-peak bias in Røykenes basin (~3% underestimation), while bias-corrected forcing can further worse this peak underestimation. In Bulken basin, temperature correction improves both flood peaks and flood seasonality, underscoring the strong sensitivity of snowmelt-influenced floods to temperature errors. By contrast, precipitation correction in this mountainous basin degrades flood-simulation skill. Overall, our results show that CPRCM forcing can be highly informative for flood simulations, but the benefits depend on process regime: temperature correction is critical for snowmelt-dominated basins, while precipitation correction over mountains requires particular caution.

How to cite: Li, L., Xie, K., Chen, H., Sobolowski, S. P., Paasche, Ø., and Xu, C.: Is bias correction necessary for CPRCM-driven flood simulation in mountainous region?, EGU General Assembly 2026, Vienna, Austria, 3–8 May 2026, EGU26-14380, https://doi.org/10.5194/egusphere-egu26-14380, 2026.

EGU26-15032 | Posters on site | AS1.23

CIMAs: A multi-source climate dataset for high-mountain environments in the Iberian Central System 

Cristina Vegas Cañas, J. Fidel González Rouco, Esteban Rodríguez Guisado, Ernesto Rodríguez Camino, Rita M. Cardoso, Luana C. Santos, Jorge Navarro Montesino, Elena García Bustamante, Carlos Pereira, Yolanda Luna, Ana B. Morata, Guillermo Robles Martínez, and Jose A. Hinojal

The Climate research initiative for Iberian Mountain Areas (CIMAs) is a collaborative framework involving several Spanish institutions: the Spanish Meteorological Office (AEMET), Complutense University of Madrid (UCM), Institute of Geosciences (IGEO, CSIC-UCM) and CIEMAT. The main goal of the initiative is to advance the characterization and understanding of climate variability and change in the Central System of the Iberian Peninsula. Mountain regions are particularly sensitive to climate change, however observational data in these environments remain scarce, heterogeneous and difficult to maintain. CIMAs addresses this challenge by integrating multi-source meteorological datasets from institutions with different measurement protocols, temporal resolutions and data formats, such as AEMET, the Guadarrama Monitoring Network (GuMNet), the Portuguese Meteorological Office (IPMA), hydrological agencies operating Automatic Hydrological Information Systems in Spain (SAIH Duero, SAIH Tajo) and the Portuguese National Water Resources Information System (SNIRH). 

In this work, the development of the CIMAs observational database is presented. The workflow includes harmonization of formats and units, metadata consolidation, systematic quality control, temporal aggregation and a version-controlled architecture that ensures traceability and facilitates future updates. The temperature and precipitation databases are currently operational, incorporating station records distributed across Spain and Portugal. As part of the evaluation of the current data releases, spatial summaries of data availability and temporal coverage are also presented, together with preliminary climatological fields used to assess the internal consistency of the integrated datasets. The system additionally provides web-based tools for data visualization and access. Ongoing developments include the integration of wind and snow products and the coupling of the observational database with simulations. 

The CIMAs framework provides a structured and interoperable basis for integrating climate observations across high-mountain areas of the Iberian Peninsula. Its aim is to improve data accessibility, consistency and usefulness for scientific and operational purposes. In addition, it offers an observational basis for assessing simulation performance and for the development of climate-service applications.

How to cite: Vegas Cañas, C., González Rouco, J. F., Rodríguez Guisado, E., Rodríguez Camino, E., Cardoso, R. M., Santos, L. C., Navarro Montesino, J., García Bustamante, E., Pereira, C., Luna, Y., Morata, A. B., Robles Martínez, G., and Hinojal, J. A.: CIMAs: A multi-source climate dataset for high-mountain environments in the Iberian Central System, EGU General Assembly 2026, Vienna, Austria, 3–8 May 2026, EGU26-15032, https://doi.org/10.5194/egusphere-egu26-15032, 2026.

EGU26-15938 | ECS | Orals | AS1.23

Ground validation of high-resolution WRF model precipitation estimates over Colombia 

Wesly Huertas, German Poveda, Kyoko Ikeda, and Roy Rasmussen

In this study, we perform a thorough validation of precipitation estimates from the high-resolution WRF model, run with a 4-km horizontal grid spacing over Colombia during 2000-2022, using in-situ data from the Colombia weather, climate and hydrology service (IDEAM) at annual, monthly, and diurnal scales. Model outputs were validated against IDEAM rain gauge data using multiple statistical metrics, including Spearman correlation, p-value, RMSE, ME, MAE, and BIAS.  Results show that the model is able to capture the main precipitation regimes, with notable contrasts between coastal (Caribbean and Pacific) and low-lying and plain regions (Orinoco and Amazon), and over the Andes cordillera. While the model generally tends to overestimate rainfall throughout most of the country, the error metrics are smaller over the Andean regions, where the spatial and seasonal variability are better represented. Comparisons across regions at monthly, interannual, and diurnal scales highlight significant differences between model estimates over the Pacific region and those over the Andes. The analysis includes the incidence of both phases of ENSO (El Niño and La Niña), showing positive and negative precipitation anomalies ranging between -300 mm and 350 mm per month, with higher anomalies during El Niño. Results of the validation at monthly and diurnal timescales highlight characteristic nighttime precipitation peaks consistent with the literature. These results confirm that, although the model effectively reproduces high-rainfall regions and their seasonal and diurnal variability, systematic biases remain, especially in the wettest periods (MAM and SON) underscoring the need for further calibration to improve its accuracy and practical applicability.

How to cite: Huertas, W., Poveda, G., Ikeda, K., and Rasmussen, R.: Ground validation of high-resolution WRF model precipitation estimates over Colombia, EGU General Assembly 2026, Vienna, Austria, 3–8 May 2026, EGU26-15938, https://doi.org/10.5194/egusphere-egu26-15938, 2026.

EGU26-16295 | Orals | AS1.23

A scale-adaptive parameterization of the horizontal wind field in the mountainous boundary layer 

Guang Li, Yuqi Feng, Hongxiang Yu, and Chenghai Wang

In mid-latitude regions, seasonal snow cover is predominantly distributed over high mountain areas characterized by complex terrain. Wind-driven snow transport is a key process controlling snow redistribution, accumulation patterns, and surface mass balance in these environments. However, a gap exists between the accurate representation of drifting snow processes, which requires boundary-layer wind fields at hundred-meter scales, and the coarse horizontal resolution of most atmospheric models on the order of 10 km, leading to large uncertainties in simulations of snow–atmosphere interactions in mountainous regions. In this study, multi-level nested simulations are performed using the WRF–LES framework to resolve boundary-layer horizontal wind fields across a range of spatial scales (from 9 km to 111 m) relevant to drifting snow. Wind speed statistics at different resolutions are analyzed, and their relationships with an integrated topographic factor are systematically quantified. Based on these analyses, a topography- and scale-dependent statistical downscaling scheme is developed to bridge the gap between coarse-resolution atmospheric forcing and fine-scale wind fields governing snow erosion, transport, and deposition. The result is also evaluated using in situ observations from a snow monitoring station in the Qilian Mountains, demonstrating an improved representation of near-surface wind characteristics, which are critical for snow redistribution.

How to cite: Li, G., Feng, Y., Yu, H., and Wang, C.: A scale-adaptive parameterization of the horizontal wind field in the mountainous boundary layer, EGU General Assembly 2026, Vienna, Austria, 3–8 May 2026, EGU26-16295, https://doi.org/10.5194/egusphere-egu26-16295, 2026.

EGU26-16406 | Posters on site | AS1.23

SPARTACUS version 3: An improved gridded climate dataset for Austria at daily resolution 

Yuri Brugnara, Angelika Höfler, Anna Rohrböck, and Ulrike Romatschke

SPARTACUS (Spatial Climate Observation Dataset for Austria) version 3 is the latest iteration of the main gridded dataset used by Geosphere Austria for operational climate monitoring. It provides daily values of temperature (mean, minimum, and maximum), precipitation sum, and sunshine duration at 1 km resolution for the territory of Austria and for selected surrounding regions (catchment areas of relevant rivers), covering the period from 1961 to the present. SPARTACUS is based solely on in-situ measurements of the Austrian network and of neighboring countries, which are interpolated by adapting statistical methods specifically developed for mountainous regions (e.g., Frei, 2014).

The most important addition with respect to the previous version (v2.1) is the calculation of the actual daily mean temperature (based on 24 hourly measurements) that replaces the arithmetic averages of maximum and minimum temperature. For the years preceding the automation of the measurements (when only three measurements per day are available) station-specific corrections were calculated by means of multi-linear regression to take into account a network-wide change of the observation times that took place in 1971 (Hiebl et al., 2025). In general, the temporal homogeneity of the input data has improved. Moreover, the number of ingested stations has been increased.

We demonstrate the improved suitability of the new version for climate‑change analyses compared to its predecessor (with particular focus on elevation-dependent climate change), examine the remaining issues, and offer an outlook on forthcoming developments.


References:

Frei, C. (2014), Interpolation of temperature in a mountainous region using nonlinear profiles and non-Euclidean distances. Int. J. Climatol., 34: 1585-1605. https://doi.org/10.1002/joc.3786

Hiebl, J., Rohrböck, A., and Haslinger, K. (2025), Correcting breaks in temperature and humidity observations: Implications for climate variability analysis in Austria. Int. J. Climatol., e70214. https://doi.org/10.1002/joc.70214

How to cite: Brugnara, Y., Höfler, A., Rohrböck, A., and Romatschke, U.: SPARTACUS version 3: An improved gridded climate dataset for Austria at daily resolution, EGU General Assembly 2026, Vienna, Austria, 3–8 May 2026, EGU26-16406, https://doi.org/10.5194/egusphere-egu26-16406, 2026.

EGU26-16598 | ECS | Orals | AS1.23

 Modelling the black carbon dynamics over Almaty, Kazakhstan, during winter and summer seasons. 

Madina Tursumbayeva, Giancarlo Ciarelli, Ludovico Di Antonio, Manuel Bettineschi, and Nassiba Baimatova

Due to the close proximity of large urban areas to mountainous environments, air pollution can pose a serious threat to sensitive ecosystems through rapid transport driven by advection and mountain–valley circulation. Almaty (Kazakhstan), frequently ranked among the most polluted cities globally, is situated at the foothills of the Ile Alatau (part of the northern Tien Shan mountains). The city’s urban area located about 15-35 km from the major glacial systems, that have experienced a substantial decrease over the past years.  In this study, we investigated the impact of locally emitted black carbon (BC) from Almaty on the surrounding mountain areas using the WRF-CHIMERE regional chemistry-transport model with three nested domains up to 1 km resolution for periods representative of winter and summer conditions (i.e. January and July of 2023, respectively).

Simulation results indicated that during winter, BC concentrations remained trapped over the Almaty basin, at the lower elevations north of the city, and along the main valleys, due to stable atmospheric conditions and limited vertical mixing. In contrast, in summer, despite lower anthropogenic emissions arising from the city, BC was found to reach the mountain tops more effectively (up to 4000 m a.s.l.), likely due to increased vertical mixing and enhanced mountain–valley circulation. The peak BC concentrations at the mountain stations occurred approximately 5 (in July) – 8 (in January) hours after the maximum values in the city, suggesting faster upslope transport from the city in summer than in winter.

Additionally, model runs with and without online exchange between meteorology and chemistry were conducted to quantify the effect of BC concentrations on the radiative fluxes. Estimates of BC direct radiative effect (DRE) confirmed that the presence of BC over Almaty decreases solar radiation at the bottom of the atmosphere (BOA, BC DREBOA up to -1.20 W m-2) and enhances absorption within the atmosphere (BC DREATM up to +1.33 W m-2). Analysis of the potential temperature gradients in both months indicated, on average, no significant effect of BC concentrations on vertical atmospheric mixing, which in January can be attributed to strong temperature inversions over the region.

This research represents the first assessment of dynamics, transport and radiative effects of BC over the mountainous regions in Central Asia and highlights the need for further analysis extending to transitional periods (spring, autumn) when the temperature inversions are weaker or absent, but emissions rates remain high.

How to cite: Tursumbayeva, M., Ciarelli, G., Di Antonio, L., Bettineschi, M., and Baimatova, N.:  Modelling the black carbon dynamics over Almaty, Kazakhstan, during winter and summer seasons., EGU General Assembly 2026, Vienna, Austria, 3–8 May 2026, EGU26-16598, https://doi.org/10.5194/egusphere-egu26-16598, 2026.

EGU26-20304 | ECS | Orals | AS1.23

Large scale atmospheric drivers of intraseasonal snowfall variability on Kilimanjaro's glaciers 

Robert Peal, Emily Collier, and Douglas Hardy

Due to the thermal homogeneity of the tropics, the rapidly retreating glaciers in Eastern Africa, such as at the summit of Kilimanjaro, are predominantly influenced by moisture and precipitation variability. Several case studies have shown that significant snowfall events with durations of just a few days can lead to deep snow cover that can persist for several months on the glaciers, with significant impacts on their long-term mass balance. However, the large-scale phenomena that influence this intraseasonal variability at high elevations remain poorly understood. Here, we use a unique dataset of daily surface height observations from Kilimanjaro’s Northern Ice Field and the ERA5 reanalysis to investigate the large-scale weather patterns that are associated with snowfall at the summit of Kilimanjaro from 2000-2022. We highlight that over 50% of surface height increase on the glacier was associated with the recently identified phenomenon known as westerly moisture transport events (WMTEs), atmospheric river like features that bring moisture into Eastern Africa from the Congo basin and can lead to enhanced precipitation in Eastern Africa. This work develops understanding of the processes that influence the mass balance of East Africa’s glaciers, which will help to improve the interpretation of these glaciers’ unique proxy record of the sparsely observed tropical mid-troposphere.

How to cite: Peal, R., Collier, E., and Hardy, D.: Large scale atmospheric drivers of intraseasonal snowfall variability on Kilimanjaro's glaciers, EGU General Assembly 2026, Vienna, Austria, 3–8 May 2026, EGU26-20304, https://doi.org/10.5194/egusphere-egu26-20304, 2026.

Complex terrain poses significant challenges for Numerical Weather Prediction (NWP) models, particularly in capturing localized boundary layer phenomena such as thermal circulations, katabatic flows, and temperature inversions. This study focuses on the Pyrenees mountain range, a region where accurate high-resolution forecasting is critical for understanding local weather extremes and variability, especially during synoptically quiescent conditions.

As part of a doctoral research project integrating Artificial Intelligence with high-resolution NWP, this work presents the foundational optimization of the Weather Research and Forecasting (WRF) model (v4.6.1). The modeling setup utilizes a one-way nested domain configuration bridging synoptic scales down to turbulence-resolving resolutions (333 m and 111 m LES), driven by ERA5 and GFS boundary conditions. We hypothesize that standard static input data provided by default in the WRF Preprocessing System (WPS) are insufficient to resolve the intricate surface heterogeneity of the Pyrenees. To address this, we conduct sensitivity experiments comparing the default USGS/MODIS configurations against enhanced high-resolution static datasets: 1-arc-second (~30 m) SRTM topography and the 100 m Copernicus Global Land Cover (CGLS-LC100). We evaluate the model’s performance in reproducing key local effects, focusing on surface wind fields, valley-floor cold pools, and thermal gradients under stable stratification.

Preliminary results quantify the bias reduction achieved by updating surface boundary conditions, establishing a robust baseline configuration. These findings are a prerequisite for subsequent full Large Eddy Simulations (LES) and the development of AI-driven bias correction schemes aimed at reducing computational costs while preserving accuracy in complex terrain.

This research has been funded by projects ARTEMIS (PID2021-124253OB-I00) and LIFE22-IPC-ES-LIFE PYRENEES4CLIMA.

How to cite: Toledano Rubí, A.: High-resolution WRF modeling in the Pyrenees: Sensitivity to static data for complex terrain, EGU General Assembly 2026, Vienna, Austria, 3–8 May 2026, EGU26-21196, https://doi.org/10.5194/egusphere-egu26-21196, 2026.

The atmospheric boundary layer (ABL) over mountainous terrain plays an important role in modulating the exchange of momentum, heat, and moisture between the surface and the free atmosphere. Unlike flat terrain, where boundary layer dynamics are relatively homogeneous, the mountain boundary layer (MoBL) exhibits pronounced heterogeneity driven by the complex interplay of multiscale orographic features. These interactions generate a broad spectrum of atmospheric motions, from turbulent eddies and coherent thermals to thermally and dynamically induced slope and valley flows. Understanding this complexity is essential for improving weather prediction, climate modeling, and air quality assessment in mountainous regions. This study investigates the structure and dynamics of the convective boundary layer (CBL) over highly complex terrain during a TEAMx test flight on 18 September 2024. Specifically, we address the following questions: What are the dominant characteristics of coherent structures in the CBL? How stationary are these features in space and time? What is their diurnal cycle? How does the model compare to observations?

To address these questions, we employ the ICON model in large-eddy simulation (LES) mode at a horizontal resolution of 65 m, using a nested domain configuration (520 m to 65 m) to capture processes across scales. The simulation domain encompasses a region around the Sarntal Alps, one of the TEAMx target areas. The ICON-LES results are compared with novel airborne wind measurements obtained during a test flight of the AIRflows system aboard the TU Braunschweig Cessna F406 research aircraft. AIRflows delivers high-resolution, three-dimensional wind profile measurements along the aircraft track, providing a unique opportunity to validate and evaluate the LES output in real atmospheric conditions. Preliminary results reveal a complex, spatially variable CBL structure with persistent thermal features and localized regions of enhanced turbulence. The comparison with AIRflows data confirms the presence and spatial organization of key dynamical structures captured by the model, while also highlighting discrepancies that inform model improvement. This work contributes to a deeper understanding of the CBL in mountainous regions and demonstrates the value of combining advanced numerical simulations with targeted airborne observations for model validation and process studies.

How to cite: Schmidli, J. and Gasch, P.: Structure of the convective boundary layer over complex terrain: ICON-LES and high resolution 3D wind observations during a TEAMx test flight, EGU General Assembly 2026, Vienna, Austria, 3–8 May 2026, EGU26-1856, https://doi.org/10.5194/egusphere-egu26-1856, 2026.

EGU26-4439 | PICO | AS1.25

Synergistic Observations of Flow in Complex Terrain: Integrating Lidar and Drones During the TEAMx Campaign 

Norman Wildmann, Almut Alexa, Francesca Lappin, Andrea Wiech, and Alexander Gohm

Atmospheric boundary layer (ABL) dynamics in complex terrain are inherently three-dimensional, where microscale turbulence plays a critical role in driving larger-scale flow evolution. With numerical weather prediction models approaching sub-kilometer resolutions, it is increasingly important to challenge and validate the models on the small scales with high-resolution observations. Contributing to the TEAMx goal of understanding scale interactions, we present results from an intensive field experiment conducted at the Nafingalm, a pasture at the valley head of a tributary to the Inn Valley (Austria).

The experimental site, a north-south aligned valley system approximately 2x2 km wide and 500 m deep, was instrumented during the Summer 2025 Extended Observation Period (EOP). The setup included two scanning lidars, a profiling lidar, and a network of ground-based meteorological stations. These continuous observations were augmented by the SWUF-3D fleet of multicopter drones (aka Uncrewed Aircraft Systems, UAS) between 1 and 23 July 2025. Up to 30 UAS were operated simultaneously, reaching heights of 220 m above the valley floor to collect distributed measurements of 3D wind, temperature, humidity, and pressure in regions inaccessible to traditional instrumentation.

While continuous lidar scanning mapped the along- and cross-valley flow, the UAS fleet provided direct in situ validation of the assumptions required to derive turbulence statistics from remote sensing. Furthermore, the spatial distribution of the drones allows for direct measurement of shear contributions, buoyancy, and advective tendencies. We present preliminary analyses of two contrasting Intensive Observation Periods (IOPs): one characterized primarily by thermally driven flow and another with increased mesoscale forcing. These cases highlight the strength of synthesizing remote sensing with distributed UAS measurements to resolve scmall-scale dynamics in complex terrain.

How to cite: Wildmann, N., Alexa, A., Lappin, F., Wiech, A., and Gohm, A.: Synergistic Observations of Flow in Complex Terrain: Integrating Lidar and Drones During the TEAMx Campaign, EGU General Assembly 2026, Vienna, Austria, 3–8 May 2026, EGU26-4439, https://doi.org/10.5194/egusphere-egu26-4439, 2026.

EGU26-4800 | ECS | PICO | AS1.25

Linking valley flow and vertical exchange in complex terrain – the LIVAVERT(EX)2 project 

Philipp Gasch and Loren Schaeffler

Quantifying the exchange of mass, momentum and energy between the earth’s surface and the atmosphere is pivotal for the understanding and prediction of weather and climate processes. Due to the superposition of horizontal and vertical transport, exchange processes in complex terrain are especially efficient and important.

This contribution presents a new project embedded in the international TEAMx campaign. The LIVAVERT(EX)2 project - linking valley flow and vertical exchange in complex terrain - focuses on observing exchange processes in the Sarntal Alps region, a local hotspot of convection initiation in the Alps. As part of the project, a novel airborne Doppler lidar (ADL) is deployed for the first extended measurements in complex terrain. Thereby, 3D wind observations are available at 100 m along-track and vertical resolution, providing spatially resolved insight into valley wind systems and vertical exchange. The variability observed across repeated flights enables the differentiation between recurring and transient features.

TEAMx also encompasses a KITcube deployment in the Sarntal Alps region, which establishes an extensive meso-scale ground-based Doppler lidar (GDL) network. Through the comparison of ADL and GDL observations of valley flow, the Doppler lidar wind profiling accuracy and representativeness can be validated. Additionally, new ways to validate existing GDL-based volume flux estimation methods are created. Combining volume flux budget and direct vertical exchange observations allows a more quantitative insight into valley flow and its relation to convective initiation over the surrounding mountains than ever before. Overall, the LIVAVERT(EX)2 project aims to improve our understanding and the prediction of atmospheric processes in complex terrain.

How to cite: Gasch, P. and Schaeffler, L.: Linking valley flow and vertical exchange in complex terrain – the LIVAVERT(EX)2 project, EGU General Assembly 2026, Vienna, Austria, 3–8 May 2026, EGU26-4800, https://doi.org/10.5194/egusphere-egu26-4800, 2026.

EGU26-5662 | ECS | PICO | AS1.25

First Results from HEFEXIII - current state of the Hintereisferner boundary layer 

Leopold Schlagbauer, Ivana Stiperski, Alexander Georgi, Tobias Sauter, and Lindsey Nicholson

In the greater TEAMx framework and following HEFEX in 2018 and HEFEXII in 2023, the third HinterEisFerner EXperiment (HEFEXIII) took place in August and September 2025 on Hintereisferner glacier, Tyrol, Austria. During one month, a 9 m tower was deployed on the glacier, equipped with high-frequency measurements of three-dimensional wind components and temperature at five levels (0.5 m, 1 m, 3 m, 5 m and 9 m), as well as low-frequency measurements of two-dimensional wind components, temperature, and relative humidity at three additional levels (2 m, 4 m and 7 m). Furthermore, two lidar systems and a swarm of drones strategically measuring at various locations along the glacier axis, were used to assess the flow conditions in the atmosphere above the glacier. This dataset enables an evaluation of boundary-layer characteristics close to the surface while relating them to the flow in the larger mountain boundary layer above.
Here, we describe the general meteorological conditions observed during the campaign, as well as the turbulence characteristics. We contrast periods with an undisturbed boundary layer with conditions characterised by external disturbances, such as thermally driven upvalley winds or mountain waves on the glacier boundary layer and their influence on the katabatic flow. We focus specifically on vertical profiles of temperature and wind obtained during one of the drone IOPs, as well as the average turbulent fluxes of momentum and heat, and the budget terms of the turbulent kinetic energy at the different measurement heights. 

How to cite: Schlagbauer, L., Stiperski, I., Georgi, A., Sauter, T., and Nicholson, L.: First Results from HEFEXIII - current state of the Hintereisferner boundary layer, EGU General Assembly 2026, Vienna, Austria, 3–8 May 2026, EGU26-5662, https://doi.org/10.5194/egusphere-egu26-5662, 2026.

EGU26-7284 | ECS | PICO | AS1.25

The Role of Horizontal Shear Production in Hectometre-Scale WRF Simulations over Alpine Terrain 

Elias Wahl, Gionata Freddi, Alexander Gohm, Andreas Platis, Moritz Kippenberger, and Manuela Lehner

Traditional planetary boundary layer (PBL) parametrisations in numerical weather prediction (NWP) models assume horizontally homogeneous conditions. Under this assumption, one-dimensional (1D) PBL parametrisations are used, which only consider vertical mixing and neglect horizontal shear production in the prognostic turbulent kinetic energy (TKE) equation used by 1.5-order parametrisations. However, as high-performance computing capabilities continue to improve, NWP model resolutions are reaching the hectometre scale, resolving more surface features and smaller atmospheric processes, thus increasingly violating the 1D PBL assumption. This is especially true in complex terrain, where, for example, thermally driven circulations create persistent slope and valley winds characterised by intense shear in both horizontal speed and direction.

We set up nested simulations with the Weather Research and Forecasting (WRF) model for the Inn Valley, Austria, down to a hectometre-scale resolution using a modified PBL parametrisation that introduces an additional tendency for horizontal shear production into the TKE equation. This helps to account for horizontal heterogeneity in the atmosphere induced by local flow processes and acts as an intermediate step towards a complete representation of horizontal wind shear.

During the TEAMx 2025 summer Extended Observation Period (sEOP), uncrewed aircraft systems (UAS) measured vertical profiles – including TKE and turbulent fluxes – at multiple locations along a transect across the Inn Valley. Complementary radiosoundings and remote-sensing measurements captured mean wind and temperature profiles at various locations along the valley. These observations allow us to evaluate modelled vertical and horizontal wind shear, as well as turbulent properties. Results using the modified PBL parametrisation are compared with those using the traditional PBL parametrisation, which does not take into account horizontal wind shear.

How to cite: Wahl, E., Freddi, G., Gohm, A., Platis, A., Kippenberger, M., and Lehner, M.: The Role of Horizontal Shear Production in Hectometre-Scale WRF Simulations over Alpine Terrain, EGU General Assembly 2026, Vienna, Austria, 3–8 May 2026, EGU26-7284, https://doi.org/10.5194/egusphere-egu26-7284, 2026.

Mesoscale numerical weather prediction (NWP) models typically employ planetary boundary layer (PBL) schemes to represent subgrid-scale turbulence, including 1.5-order parameterizations that explicitly predict turbulent kinetic energy (TKE). One crucial assumption of these models is that horizontal gradients, such as horizontal shear, can be neglected in the TKE tendency terms. This assumption may not hold in complex terrain, where the interaction between terrain-induced flows and the orography itself can create substantial horizontal mixing.

We investigate this limitation using a high-resolution (Δx=500 m) WRF model simulation employing the traditional 1.5-order Mellor–Yamada–Nakanishi–Niino (MYNN) PBL scheme. We focus on a valley wind case in the Inn Valley, Austria, which occurred on 29 June 2025 during the TEAMx campaign. The event was characterized by clear skies and weak synoptic forcing, favoring the development of a convective boundary layer and thermally driven daytime up-valley winds with substantial mechanical mixing.

The simulations are compared against observational data from four Doppler wind lidars and several ground measurement stations in the valley. The evolution of the wind system is represented reasonably well by the model, but the peak strength of the valley wind is underestimated. Observations from one of the lidars show that the PBL scheme appears to underestimate TKE when the turbulence is dominated by mechanical production. This bias may result from the lower wind speeds or an incomplete representation of TKE production in the PBL scheme, with potential interactions between the two factors. An estimate of the horizontal subgrid-scale diffusion suggests that accounting for the currently neglected horizontal shear production in the TKE equation could lead to an improved TKE representation.

How to cite: Freddi, G., Gohm, A., Wahl, E., and Lehner, M.: Underestimation of Mechanically Generated Turbulence in a Traditional PBL Scheme over Complex Terrain: A TEAMx Case Study for the Inn Valley, EGU General Assembly 2026, Vienna, Austria, 3–8 May 2026, EGU26-7862, https://doi.org/10.5194/egusphere-egu26-7862, 2026.

EGU26-9639 | PICO | AS1.25

Anisotropy scaling of a sloping glacier boundary layer 

Samuele Mosso and Ivana Stiperski

Glacier boundary layers present an ideal atmospheric laboratory for studying persistently stable boundary-layer dynamics over inclined surfaces. On glaciers in summer, turbulence is strongly controlled by the katabatic flow dynamics that is intimately coupled with very stable stratification at the glacier surface and the slope angle. In these kind of conditions, the basic assumptions of Monin–Obukhov Similarity Theory (MOST) are rarely met, due to the significant flux divergence, and the imposition of an alternative limiting scale. Still, bulk approaches based on MOST have shown good agreement under very stringent conditions, while alternative scaling approaches that add the slope angle into the scaling parameter, or use jet maximum height have shown promise in providing scaling frameworks for such flows.

Here we use a dense network of atmospheric turbulence observations during the HEFEX II campaign, that took place on the Hintereisferner Glacier, Austria in 2023. The campaign features ten turbulence towers with multi-level observations, distributed across the entire glacier surface (from the accumulation area to downstream of the glacier tongue) and therefore experiencing different flow conditions (katabatic flow depth) or slope angles. We focus on the mathematical invariant representing turbulence anisotropy that has recently been used to extend MOST to more realistic terrain conditions. Focusing on the flux-variance relations we show that katabatic flows over glaciated terrain display distinct turbulence characteristics at varying degrees of anisotropy that differ considerably to the previous studies over non-glaciated terrain. These peculiarities are further examined to isolate the difference between katabatic and canonical flows in terms of their flow anisotropy. We also test alternative scaling approaches, including those based on the katabatic jet height, local terrain slope, and formulations designed to avoid the self-correlation that is shown to be an issue in very stable stratification.

How to cite: Mosso, S. and Stiperski, I.: Anisotropy scaling of a sloping glacier boundary layer, EGU General Assembly 2026, Vienna, Austria, 3–8 May 2026, EGU26-9639, https://doi.org/10.5194/egusphere-egu26-9639, 2026.

EGU26-9768 | PICO | AS1.25

Flow Regimes and Turbulence Structure on a Steep Slope in Winter: Findings from the TEAMx wEOP 

Ivana Stiperski, Christophe Brun, Mauro Ghirardelli, Alexander Gohm, Mathias Rotach, and Manuela Lehner

During the TEAMx winter EOP, an extensive measurement campaign took place on a steep undulating slope in the Inn Valley, Austria. This six-week long campaign featured a suite of instrumentation, including a network of eight turbulence towers installed at two across-slope and an along-slope transects equipped with two levels of sonic anemometers, nano-barometers, and slow response sensors. In addition, four component radiation at two heights measured radiative flux divergence at a central location on the slope, a short-range Doppler wind lidar (Wind Ranger) at the bottom of the slope recorded wind speed and direction, while a fibre optic array at one along-slope and two-across slope transects, and two vertical sections complemented the set-up. Additional observations during intense observational periods included temperature profile measurements using a drone and wind speed and temperature observations using tethered balloon at the top of the slope.

Here we present the measurement campaign design and focus on the first results that highlight the spatio-temporal variability of the flow on the slope, tightly coupled with the synoptic forcing. During conditions of low synoptic forcing, persistent katabatic flows developed on the slope with acceleration down the slope and warmer conditions towards one side of this non-uniform slope. On the other hand, during foehn conditions, very large differences in the mean and turbulence characteristics can be observed between the upper across-slope transect and lower stations that are more exposed to foehn. These differences translate to distinct behaviour of similarity scaling relations, as well as the importance of different terms in the momentum and TKE budgets. 

How to cite: Stiperski, I., Brun, C., Ghirardelli, M., Gohm, A., Rotach, M., and Lehner, M.: Flow Regimes and Turbulence Structure on a Steep Slope in Winter: Findings from the TEAMx wEOP, EGU General Assembly 2026, Vienna, Austria, 3–8 May 2026, EGU26-9768, https://doi.org/10.5194/egusphere-egu26-9768, 2026.

EGU26-11044 | ECS | PICO | AS1.25

Validation of High-Resolution ICON-LES Using Observations from HEFEX II and HEFEX III Field Campaigns 

Alexander Georgi, Tobias Sauter, and Leopold Schlagbauer

High-resolution numerical weather prediction (NWP) models are increasingly being used to study the interactions between the atmosphere and glaciers in complex alpine terrain. However, their performance under these conditions has not been sufficiently confirmed by observations, especially at a dekameter scale. This study comprehensively validates the Large-Eddy Simulation (LES) configuration of the ICOsahedral Nonhydrostatic (ICON) model using observations from the HEFEX II (2023) and HEFEX III (2025) field campaigns. Both campaigns included four weeks of intensive observations at Hintereisferner in the Ötztal Alps and were part of the international TEAMx research program, which studies multi-scale transport and exchange processes in mountainous environments.

HEFEX II focused on characterizing the spatial gradients and temporal variability of surface-layer variables, such as temperature, humidity, and wind. HEFEX III utilized coordinated UAV-based vertical profiling in combination with multiple on-glacier lidar systems to resolve atmospheric flow fields and wind patterns within the valley. Together, the two campaigns provide a unique and unprecedented observational dataset in complex glacierized terrain, offering an exceptional basis for model evaluation.

ICON-LES was applied in a one-way nested configuration, achieving a target horizontal resolution of 51 meters over the study area. We assessed model performance using qualitative and quantitative validation approaches, particularly emphasizing the model’s ability to reproduce the spatio-temporal variability of key atmospheric parameters across surface and boundary-layer scales. The results demonstrate strong agreement between ICON-LES simulations and multi-platform observations, indicating that the model realistically captures flow structures and variability in a high alpine glacier environment.

These findings support the use of ICON-LES as a reliable tool for studying atmosphere-glacier interactions and lay the groundwork for future climate impact and feedback studies in complex terrain. At the same time, the analysis highlights the current limitations of high-resolution numerical modeling and emphasizes the importance of using advanced observational techniques and large-eddy simulations together to improve our understanding of processes in mountainous regions.

How to cite: Georgi, A., Sauter, T., and Schlagbauer, L.: Validation of High-Resolution ICON-LES Using Observations from HEFEX II and HEFEX III Field Campaigns, EGU General Assembly 2026, Vienna, Austria, 3–8 May 2026, EGU26-11044, https://doi.org/10.5194/egusphere-egu26-11044, 2026.

EGU26-12279 | PICO | AS1.25

Lidar-based observations of flow regimes and turbulence in a small Alpine valley during TEAMx 

Alexander Gohm, Norman Wildmann, Almut Alexa, and Andrea Wiech

The summer Extended Observation Period (sEOP) of the 2025 TEAMx observational campaign provided a unique opportunity to investigate multi-scale interactions in the mountain boundary layer (MoBL) and enhance our understanding of its structure and turbulent processes. In this study we present a preliminary analysis of observations from two Doppler wind lidars operated in the Weer Valley (Nafingalm, Austria) from 6 June to 24 July 2025. The focus is on 12 Intensive Observation Periods (IOPs) for which complementary airborne observations are available (June 29 and July 2, 5, 9, 11, 13, 15, 18, 19, 20, 22, and 23), though the latter are not included in this initial study. The aim is to characterize observed events by classifying different flow regimes and turbulent features, primarily using Doppler wind lidar data supported by a weather station network. This classification provides a framework for future in-depth studies and large-eddy simulations. Emphasis is placed on identifying recurring scale interactions between local and regional flows—such as valley winds and cross-mountain flows—and the resulting processes, including flow separation, waves, and shear-flow instabilities. Finally, initial turbulence metrics are calculated to support the event classification.

How to cite: Gohm, A., Wildmann, N., Alexa, A., and Wiech, A.: Lidar-based observations of flow regimes and turbulence in a small Alpine valley during TEAMx, EGU General Assembly 2026, Vienna, Austria, 3–8 May 2026, EGU26-12279, https://doi.org/10.5194/egusphere-egu26-12279, 2026.

EGU26-13553 | PICO | AS1.25

Investigating the surface energy balance closure over mountain areas: results from the INTERFACE project 

Lorenzo Giovannini, Sebastiano Carpentari, Martina Destro, Dario Di Santo, Manuela Lehner, Roberto Monsorno, Mathias W. Rotach, Mira Shivani Sankar, Beth Saunders, Mohammadamin Soltaninezhad, Stefano Tondini, Nadia Vendrame, and Dino Zardi

This contribution presents an overview of the activities and results of the INTERFACE project, which aims to quantify the non-closure of the surface energy balance across various Alpine sites, where processes related to the lack of closure, i.e., advection due to the development of thermally-driven circulations, are expected to be particularly significant. This objective is addressed by combining flux station and unmanned aerial system (UAS) measurements. The UAS provides spatially distributed observations around eddy-covariance sites, which are essential for estimating advection.

The analysis of eddy-covariance data from various sites representing diverse Alpine contexts (e.g., valley floor, slope, and mountain top) and climatic settings (North vs. South of the main Alpine crest) allows a systematic quantification and comparison of the characteristics of the surface energy balance, including the lack of closure. Particular emphasis is placed on the evaluation of the role of thermally-driven circulations in the non-closure of the surface energy balance, utilizing objective criteria to select days with well-developed slope and valley winds.

The INTERFACE project contributes to the TEAMx international research programme, which aims to improve our understanding of exchange processes in the atmosphere over mountains.

How to cite: Giovannini, L., Carpentari, S., Destro, M., Di Santo, D., Lehner, M., Monsorno, R., Rotach, M. W., Sankar, M. S., Saunders, B., Soltaninezhad, M., Tondini, S., Vendrame, N., and Zardi, D.: Investigating the surface energy balance closure over mountain areas: results from the INTERFACE project, EGU General Assembly 2026, Vienna, Austria, 3–8 May 2026, EGU26-13553, https://doi.org/10.5194/egusphere-egu26-13553, 2026.

EGU26-18348 | ECS | PICO | AS1.25

The observational effort for characterising turbulence and transport processes on the pre-Alpine range of Monte Baldo during the TEAMx Observational Campaign.  

Giorgio Doglioni, Sebastiano Carpentari, Lorenzo Giovannini, and Dino Zardi and the Monte Baldo partners

We present the intensive field campaign conducted from mid-June to mid-October 2025 on Monte Baldo (Italian Pre-Alps) within the TEAMx programme, aimed at improving process understanding and model representation of mountain boundary-layer exchanges. This effort was driven by the DECIPHER project, which aims at disentangling mechanisms controlling atmospheric transport and mixing processes over mountain areas at different space- and timescales.

Measurements targeted a steep (~25°), east-facing, grass-covered slope in the southern Monte Baldo range, selected for its regular topography and pronounced diurnal cycle of thermally driven slope winds. The setting also enables investigation of coupling at the mountain–plain interface, linking local slope circulations to the adjacent lowland atmosphere in the Po Valley.

A coordinated suite of instruments captured processes from the surface layer to the lower troposphere and their interactions across scales. Near-surface thermodynamic variability and turbulent exchange were monitored using multi-level flux towers and a slope-wide network of thermohygrometers. Variability in aerosol and particulate matter was measured using co-located mass and optical sensors. Along- and cross-slope winds were observed with multiple wind lidars, while boundary-layer and lower-tropospheric profiles were obtained with a tethered balloon system and a Raman lidar. The surface heat budget was characterized using radiation measurements together with soil temperature and moisture observations. Complementary observations included high-frequency near-surface turbulence profiling and distributed soil-moisture monitoring using a cosmic-ray neutron sensor.

This contribution details the observational setup, characterizes the regional setting, and illustrates the potential of the dataset for evaluating slope-wind structure and the associated surface fluxes, boundary-layer mixing, and exchange pathways between mountains and adjacent plains.

How to cite: Doglioni, G., Carpentari, S., Giovannini, L., and Zardi, D. and the Monte Baldo partners: The observational effort for characterising turbulence and transport processes on the pre-Alpine range of Monte Baldo during the TEAMx Observational Campaign. , EGU General Assembly 2026, Vienna, Austria, 3–8 May 2026, EGU26-18348, https://doi.org/10.5194/egusphere-egu26-18348, 2026.

EGU26-20048 | ECS | PICO | AS1.25

Dual Radiosonde Soundings of Gravity Wave Breaking over the Alps during the 2025 Winter TEAMx Observational Campaign 

Timothy Banyard, Neil Hindley, Andrew Orr, Corwin Wright, Siddharth Gumber, and Andrew Ross
The TEAMx programme provides us with a unique observational data set which is extensive in spatial and temporal coverage and encompasses a diverse range of measurement techniques. A campaign such as this is ideal for studying the fine-scale behaviour of orographic gravity waves, including their generation, propagation and eventual breaking. As future weather and climate models are run at progressively higher resolutions, it is critical that these waves are simulated accurately across all spatial scales. Notably, regions of high vertical wind shear can lead to errors in the modelled behaviour of these waves which cause misrepresentations in both the altitude and magnitude of gravity wave drag. Furthermore, the partitioning between resolved and parameterised gravity wave drag should vary inversely across spatial scales and with consistency between different numerical models, such that the total drag remains constant. Whilst this is yet to be achieved, TEAMx has the potential to bring this closer to reality.
 
Here, we present results from the UK-funded TEAMx-FLOW project, which focuses on analysis of dual radiosonde launches during the winter extended observational period (wEOP). We analyse and quantify mountain wave momentum transport in these measurements, including using cross-spectral analysis of balloon pairs to obtain scale separation of observed waves. We also explore observations of partial wave breakdown in directionally sheared flow, a process which is not currently considered in parameterisation schemes. We will use our results to validate MetUM simulations, and hope that this research will be able to inform the development of scale-aware models in the future.

How to cite: Banyard, T., Hindley, N., Orr, A., Wright, C., Gumber, S., and Ross, A.: Dual Radiosonde Soundings of Gravity Wave Breaking over the Alps during the 2025 Winter TEAMx Observational Campaign, EGU General Assembly 2026, Vienna, Austria, 3–8 May 2026, EGU26-20048, https://doi.org/10.5194/egusphere-egu26-20048, 2026.

EGU26-20164 | ECS | PICO | AS1.25

Measuring Horizontal Shear and Turbulence in Mountain Valleys using UAS and Lidar 

Moritz Kippenberger, Martin Schön, Marisa Ruhl, Elias Wahl, Gionata Freddi, Alexander Gohm, Manuela Lehner, Jens Bange, and Andreas Platis
Turbulent mixing in complex terrain remains a major source of uncertainty for weather and climate models. Many processes within the planetary boundary layer (PBL) occur on spatial scales that numerical models cannot resolve explicitly and thus require parameterization. For complex terrain, however, the common mesoscale-model assumption that horizontal shear production of turbulent kinetic energy (TKE) is negligible no longer holds. This motivates the need to develop 3D PBL parameterizations that include horizontal shear production of TKE. However, observational datasets that quantify the relative contributions of horizontal versus vertical shear production are still lacking. We deployed a combined measurement strategy utilizing small uncrewed aircraft systems (UAS) and Doppler wind lidar stations to provide the missing high-resolution measurements and thus to improve the understanding of multi-scale exchange processes in mountainous regions.
The measurement strategy incorporated commercially available and automatically operating multi-rotor UAS equipped with fast-response meteorological sensors to collect high-resolution measurements of the 3D wind vector, temperature and humidity, with additional aerosol particle measurements. During the TEAMx 2025 summer Extended Observation Period, four UAS performed simultaneous in-situ measurements at multiple heights and key valley locations (valley floor, foot of sidewall, mountain slope and crest) along a valley transect in the Inn Valley at the TEAMx Radfeld supersite in Austria. This included vertical profiles up to 2 km above mean sea level and horizontal cross-sections through the valley. The vertical profile spacing was representative of the grid resolution of targeted operational weather forecast simulations and was coordinated with the locations of the three deployed Doppler wind lidar systems, which continuously measured vertical profiles of wind.
The combined measurements deliver a unique observational dataset of wind distribution in the Inn Valley, enabling a spatially and temporally highly-resolved analysis of horizontal and vertical wind shear. The UAS measurement systems resolve the turbulent scales of wind up to 3 Hz, which corresponds to a vortex size of about 3 m at a mean horizontal wind speed of 10 ms-1, allowing the calculation of turbulent kinetic energy and turbulent fluxes. For up-valley winds, which are thermally driven and characteristic of the afternoon in mountain valleys, TKE increases in the horizontal direction from the valley center toward the mountain and reaches its vertical maximum near the mountain ridge. This observed rise in TKE coincides with strong horizontal wind shear, peaking at 0.01 s-1 near the mountain ridge, with the horizontal wind speed decreasing toward the mountain. By combining UAS- and lidar-based measurements with model parameterization development within the TEAMx framework, we aim to make turbulence representation in high-resolution numerical weather prediction models both more accurate and physically grounded, leading to more reliable forecasts in mountainous regions.

How to cite: Kippenberger, M., Schön, M., Ruhl, M., Wahl, E., Freddi, G., Gohm, A., Lehner, M., Bange, J., and Platis, A.: Measuring Horizontal Shear and Turbulence in Mountain Valleys using UAS and Lidar, EGU General Assembly 2026, Vienna, Austria, 3–8 May 2026, EGU26-20164, https://doi.org/10.5194/egusphere-egu26-20164, 2026.

EGU26-612 | ECS | Posters on site | AS1.26

Diurnal Relation between CAPE and Precipitation over Indian Region 

Thanangka Chutia, Arindam Chakraborty, and Ganapati Shankar Bhat

Accurate representation of the diurnal cycle of convection remains a persistent challenge in numerical weather and climate models. Previous studies have highlighted the importance of the phase relationship between convective available potential energy (CAPE) and precipitation in improving the simulation of rainfall timing and intensity. This study investigates the spatial and temporal characteristics of this phase relationship during the Indian summer monsoon, emphasizing the occurrence, intensity, and underlying causes of lead (days when CAPE maxima leads precipitation maxima) and lag (days when CAPE maxima lags precipitation maxima) days using 22 years of half-hourly IMERG precipitation data alongside temperature and humidity profiles from ERA5. Spatial maps reveal that precipitation exhibits greater variability in its diurnal phase than CAPE, with CAPE maxima generally preceding rainfall peaks except over the Bay of Bengal (BB), the Himalayan foothills, and parts of the Arabian Sea and Pakistan. Over Central India (CI), CAPE leads precipitation by about 3.5 hours, whereas over BB, it lags by approximately 9.5 hours. CAPE over CI shows a bimodal structure driven by both temperature and humidity variations, while over BB it displays a single, humidity-controlled peak. Across the monsoon season, about 72% of days are lead days and 25% are lag days. Despite their lower frequency, lag days often produce comparable or greater rainfall intensity, contributing 10–30% of the total seasonal precipitation, compared to 60–80% from lead days. The diurnal phase shift between CAPE and precipitation is primarily governed by changes in precipitation timing rather than CAPE evolution. Enhanced early-morning convection on lag days is linked to strong negative surface pressure anomalies and associated mid-tropospheric moistening, highlighting a distinct thermodynamic control on rainfall phase variability over the monsoon region.

How to cite: Chutia, T., Chakraborty, A., and Bhat, G. S.: Diurnal Relation between CAPE and Precipitation over Indian Region, EGU General Assembly 2026, Vienna, Austria, 3–8 May 2026, EGU26-612, https://doi.org/10.5194/egusphere-egu26-612, 2026.

EGU26-697 | ECS | Posters on site | AS1.26

Beyond Beta Drift: Multi-level Steering and Deep Vortex Structures in Anomalous Monsoon Depression Propagation  

Samudra Jit Boruah, Ravi Nanjundiah, and Arindam Chakraborty

The dominant northwestward propagation of Monsoon Depression (MD) has been well established by the existing theoretical framework that is analogous to Beta Drift theory; however, rare northeastward-moving cases remain unexplored. We investigate six northeastward-moving systems (NEMS) that occur over the Bay of Bengal and the Indian subcontinent, while comparing them with northwestward-moving systems (NWMS) to identify their distinctive structures and the mechanisms driving atypical propagation.

Structural analysis reveals that NEMS possess a substantially deeper relative vorticity core at the mid and upper troposphere, along with higher rainfall to the east of the depression center. Vorticity equation diagnosis reveals that horizontal vorticity advection, specifically the asymmetric advection of symmetric vorticity (AASV) term, dominates the vorticity tendency and exhibits a persistent dipole structure for both NEMS and NWMS, although towards different directions at different pressure levels. This highlights a multi-level steering, particularly prevalent in NEMS cases, which is effective in understanding track variabilities.

Further analysis reveals distinctive negative geopotential anomalies (centered at ~37°N) at the upper troposphere extending from the extratropics into the subtropics for NEMS and eventually interacting with these depressions to modulate their trajectories. These anomalies are significantly stronger and quasi-stationary, resulting in large-scale impacts on overall track directions. The previous theory fails due to the assumption of a single pressure level primarily impacting depression propagation. This work establishes that understanding and predicting monsoon depression tracks requires explicit representation of multi-level steering and deep vortex structures.

How to cite: Boruah, S. J., Nanjundiah, R., and Chakraborty, A.: Beyond Beta Drift: Multi-level Steering and Deep Vortex Structures in Anomalous Monsoon Depression Propagation , EGU General Assembly 2026, Vienna, Austria, 3–8 May 2026, EGU26-697, https://doi.org/10.5194/egusphere-egu26-697, 2026.

EGU26-704 | ECS | Posters on site | AS1.26

Barotropic or Baroclinic: The Hybrid Genesis of Indian Summer Monsoon Low-Pressure Systems 

Charudatt J. Puri and Sandeep Sukumaran

Synoptic-scale vortices play a central role in regulating atmospheric energy and the hydrological cycle, but the dynamical identity of Indian Summer Monsoon Low-Pressure Systems (ISM-LPSs), critical for delivering 60−80% of India's seasonal rainfall, remains fundamentally unresolved. This persistent failure stems from reductive attempts to interpret these crucial systems within a binary tropical or baroclinic framework, which is inadequate for the unique monsoon environment. To address this gap, we present a systematic, comparative dynamical analysis of the large-scale environment (LSE) and storm-centered structure of synoptic vortices across the Northern Hemisphere. Using high-resolution reanalysis, we reveal that ISM-LPSs are associated with strong large-scale ascent forcing despite negligible near-surface baroclinicity, a unique combination that distinguishes them sharply from both canonical tropical and mid-latitude cyclones. Storm-centred composite analyses further reveal vertically coherent circulations that lack the pronounced frontal asymmetry characteristic of baroclinic systems. Together, these results indicate that ISM-LPSs occupy a distinct dynamical regime defined by monsoon-specific large-scale conditions, exhibiting systematic similarities to and departures from canonical tropical and baroclinic storms. By moving beyond dualistic classification, this study provides a clearer dynamical context for interpreting ISM-LPS genesis and evolution, with implications for their representation in weather and climate models.

How to cite: J. Puri, C. and Sukumaran, S.: Barotropic or Baroclinic: The Hybrid Genesis of Indian Summer Monsoon Low-Pressure Systems, EGU General Assembly 2026, Vienna, Austria, 3–8 May 2026, EGU26-704, https://doi.org/10.5194/egusphere-egu26-704, 2026.

EGU26-1003 | ECS | Posters on site | AS1.26

Changes in Monsoon Storm Under Extreme Sea Surface Warming  

Swathy Changamsseril Raj and Vishnu S Nair

Changes in Monsoon Storm Under Extreme Sea Surface Warming 


Rising global temperatures have become a serious concern in the 21st century. As a result, the intensity and frequency of extreme weather events have increased worldwide. This study examines anomalies in Sea Surface Temperature (SST) in the Bay of Bengal (BoB), identified as Marine Heat Waves (MHWs), and their influence on the synoptic-scale atmospheric vortex, using satellite-derived SST observations and atmospheric reanalysis data spanning 1982-2022.

The regions that frequently experience marine heatwaves (MHWs) closely correspond with areas where the Monsoon Low-Pressure Systems (LPS) — common atmospheric vortices during the boreal summer monsoon — originate, typically occurring during the latter half of the MHW life cycle. While widespread studies have examined MHWs and monsoon systems independently, the coupled interactions between these phenomena in the Bay of Bengal remain poorly understood, despite the region's vulnerability to the impacts of extreme weather.

The presence of MHWs during the genesis phase of Monsoon Depressions (MDs), the intense monsoon LPS, appears to intensify as it modifies the pressure gradient, wind, and rainfall distributions. MDs forming under MHW conditions tend to be more intense, faster-moving, and associated with stronger winds and enhanced precipitation. Furthermore, an increase in Extreme Rainfall Events (EREs) is observed in these MHW-influenced MDs, with most EREs concentrated in the southwest quadrant of the systems. Underlying environmental conditions that could modulate this variability were analyzed using empirical indices to quantify the major mechanisms at play. The analysis reveals absolute vorticity and relative humidity as the two dominant factors contributing to MD intensification through MHWs. These analyses provide insights into how MHWs modify the background state of the atmosphere and ocean. 


How to cite: Changamsseril Raj, S. and S Nair, V.: Changes in Monsoon Storm Under Extreme Sea Surface Warming , EGU General Assembly 2026, Vienna, Austria, 3–8 May 2026, EGU26-1003, https://doi.org/10.5194/egusphere-egu26-1003, 2026.

Diabatic heating and microphysical processes remain major sources of uncertainty in tropical cyclone simulations. This study evaluates the sensitivity of cyclone structure and intensity to microphysical assumptions using a dynamically calibrated WRF-ARW framework applied to Extremely Severe Cyclonic Storm (ESCS) Fani (2019). Track and timing errors were first reduced via grid nudging in the outer domain, coupled with the Multi-Scale Kain–Fritsch (MSKF) cumulus scheme, YSU boundary layer physics, RRTMG radiation, and an ocean mixed-layer model. This configuration improved landfall timing accuracy from ~11 to ~2 hours and reduced spatial error to ~60–70 km. Initial results indicate that ice-inclusive physics enhance vortex strength and structural realism compared to warm-rain schemes, albeit with a reduced translation speed. Building on this setup, we compare several double-moment microphysics schemes that prognose both hydrometeor mass and number concentration. Simulated radar reflectivity fields are generated using a physically consistent forward operator, which incorporates hydrometeor-specific reflectivity (dBZ) retrievals and liquid-equivalent scattering assumptions. These fields are evaluated against Doppler Weather Radar (for eyewall and convective structure), GPM DPR (for vertical hydrometeor and melting-layer profiles), and GPM IMERG (for surface rainfall distribution). A phase-locked evaluation strategy enables a structural comparison across schemes despite differences in landfall timing. The results highlight how microphysics choices modulate convective organisation and precipitation features in high-resolution simulations over the Bay of Bengal, offering guidance for improving microphysical representations in cyclone forecasting models.

How to cite: Khan, S. and Roy, A.: Sensitivity Of Tropical Cyclone Structure To Double-Moment Microphysics In A Dynamically Calibrated WRF Framework , EGU General Assembly 2026, Vienna, Austria, 3–8 May 2026, EGU26-1085, https://doi.org/10.5194/egusphere-egu26-1085, 2026.

EGU26-1117 | ECS | Posters on site | AS1.26

Quasi-biweekly Oscillations During the Boreal Summer 

Shubhrangshu Biswas, Jai Sukhatme, and Bishakhdatta Gayen

We study the large-scale westward-propagating quasi-biweekly oscillation (QBWO) in the
global tropics. During the boreal summer, these waves exhibit significant activity over
Southeast Asia and the Western Pacific Ocean. Although comparatively weaker, this os-
cillation is also found across much of the northern tropics throughout this season. The
structure of the QBWO shows a strong resemblance to equatorial Rossby waves, but a
few fundamental features vary across different regions and result in different growth and
propagation mechanisms. Due to their cyclonic-anticyclonic gyres, once formed, these
waves can trigger or suppress extreme events, such as tropical cyclones/depressions. In
fact, these large-scale systems can also influence heatwaves/regional temperature changes,
intense/suppressed rainfall events, and changes in humidity.
Composites from multiple decades of data reveal significant differences between circula-
tion and convection structures in various tropical regions. Convective coupling modifies
the theoretically predicted structure of the equatorial Rossby waves [1] in relatively moist
regions, such as the Western Pacific, Bay of Bengal, and the Arabian Sea. Specifically,
in the very moist regions over the Bay of Bengal and the Arabian Sea, convection is
collocated with circulation, instead of the expected quadrature lag in these variables [2].
A vorticity budget indicates that while meridional advection of planetary vorticity is the
primary controller of the tendency in both moist and dry regions, other terms are essential
in approximating the evolution of the vorticity anomaly. Planetary stretching hinders the
propagation, while horizontal advection by the zonal wind supports it in the dry regions.
In moist regions, while stretching appears to aid growth, it is required in combination
with horizontal vorticity advection to match the vorticity tendency. The moisture budget
illustrates that in relatively dry regions, the zonal mean advection of perturbed moisture
in regions with strong easterlies contributes to the evolution of moisture. On the other
hand, in moist regions, horizontal advection of the background moisture by the anoma-
lous winds and a combination of vertical advection, evaporation, and precipitation are
crucial for approximating the moisture tendency. These results help us develop a better
understanding of the QBWO and lead the way for simplified theoretical models of this
intraseasonal tropical mode of variability.
[1] T. Matsuno, Journal of the Meteorological Society of Japan. Ser. II, 44(1):25–43, (1966).
[2] Y. Nakamura and Y.N. Takayabu, Journal of the Atmospheric Sciences, 79(1):247–262,
(2022).

How to cite: Biswas, S., Sukhatme, J., and Gayen, B.: Quasi-biweekly Oscillations During the Boreal Summer, EGU General Assembly 2026, Vienna, Austria, 3–8 May 2026, EGU26-1117, https://doi.org/10.5194/egusphere-egu26-1117, 2026.

EGU26-1339 | ECS | Orals | AS1.26

Tropical Cyclones in CAM7: Assessing the Impact of Prognostic Momentum Fluxes and Convective Parameterization at Global and Storm Scales 

Benjamin Stephens, Colin Zarzycki, Julio Bacmeister, Vincent Larson, Kyle Nardi, Katherine Thayer-Calder, and Cecile Hannay

Accurately simulating tropical cyclones (TCs) in global climate models remains a key challenge due to not only multiscale interactions that govern storm genesis, intensity, and structure, but computational constraints that limit model grid spacing. Here we evaluate TC representation in a development version of the Community Atmosphere Model, version 7 (CAM7), which introduces several major updates, including higher vertical resolution, a revised Zhang-McFarlane deep convection scheme, and a new prognostic formulation for turbulent momentum fluxes in the boundary-layer scheme CLUBB. Using a suite of globally-uniform and variable-resolution simulations at 0.25deg grid spacing, we assess both large-scale statistics (global and basinwise TC frequency) and storm-scale characteristics (inflow angle, inflow depth, and wind structure).

CAM7 with prognostic momentum fluxes produces improved spatial patterns of TC activity and more realistic intensity metrics compared to prior CAM generations. However, default configurations overproduce storms by roughly a factor of two. By increasing the parameterized CAPE consumption by deep convection during TC genesis, we achieve a ~40% reduction in global TC counts and improved agreement with observed basin distributions. At the storm scale, we reduce boundary-layer diffusivity, leading to stronger tangential winds, larger inflow angles, and shallower inflow layers, consistent with idealized f-plane sensitivity experiments and more in line with both observations and large-eddy simulations.

These results demonstrate that targeted parameter tuning in deep convection and boundary-layer turbulence schemes can substantially improve both the frequency and structure of simulated TCs in CAM7, advancing its capability for high-resolution climate and weather prediction applications.

How to cite: Stephens, B., Zarzycki, C., Bacmeister, J., Larson, V., Nardi, K., Thayer-Calder, K., and Hannay, C.: Tropical Cyclones in CAM7: Assessing the Impact of Prognostic Momentum Fluxes and Convective Parameterization at Global and Storm Scales, EGU General Assembly 2026, Vienna, Austria, 3–8 May 2026, EGU26-1339, https://doi.org/10.5194/egusphere-egu26-1339, 2026.

EGU26-2526 | ECS | Orals | AS1.26

Upper-level warming and its effect on tropical cyclone intensity 

Giousef Alexandros Charinti, Andrea Davin, Andrea Polesello, Caroline Muller, and Claudia Pasquero

Deep convection associated with tropical cyclones (TCs) can reach the tropopause, which can induce mixing between the troposphere and the stratosphere. Such exchanges have been documented in both numerical simulations and observational studies, which indicate that stratospheric subsidence into the eye of an intensifying storm contributes to the formation of an upper-level warm core. Despite these findings, the influence of this upper-level warming on TC intensity is still poorly understood. In our study, we demonstrate using idealized simulations that the upper-level warming originates from subsiding stratospheric air outside of the storm eye, rather than from subsidence in the eye alone. We show that overshooting convection penetrating into the stratosphere is responsible for the induced subsidence, with both processes intensifying with higher sea surface temperatures (SSTs).

How to cite: Charinti, G. A., Davin, A., Polesello, A., Muller, C., and Pasquero, C.: Upper-level warming and its effect on tropical cyclone intensity, EGU General Assembly 2026, Vienna, Austria, 3–8 May 2026, EGU26-2526, https://doi.org/10.5194/egusphere-egu26-2526, 2026.

EGU26-3251 | Posters on site | AS1.26

Influence of the Diurnal Insolation Cycle on MJO Propagation Across the Maritime Continent 

Xin Zhou, Pallav Ray, Jimy Dudhia, Samson Hagos, Nathaniel Johnson, Efthymios Nikolopoulos, and Bradford Barrett

The Maritime Continent (MC) has long been hypothesized to hinder the eastward propagation of the Madden–Julian Oscillation (MJO) through its strong diurnal cycle of convection. To evaluate this mechanism, a regional model is used to simulate a boreal spring 2013 MJO event that weakened and stalled over the MC. Two experiments are performed: a control with realistic diurnal insolation (CTL) and a no-diurnal-cycle experiment (NO_DC). MJO propagation is objectively identified using a large-scale precipitation tracking (LPT) method, which distinguishes propagating and non-propagating behavior better than the conventional RMM index. In NO_DC, suppressed diurnal heating reduces land precipitation, leading to more continuous eastward propagation. Moist static energy budget analysis shows that MJO maintenance in NO_DC arises from enhanced longwave heating and reduced advection, while persistent propagation is linked to increased advection and reduced longwave and latent heat flux damping. These responses vary regionally across the MC, highlighting the complex role of diurnal processes in modulating MJO propagation.

How to cite: Zhou, X., Ray, P., Dudhia, J., Hagos, S., Johnson, N., Nikolopoulos, E., and Barrett, B.: Influence of the Diurnal Insolation Cycle on MJO Propagation Across the Maritime Continent, EGU General Assembly 2026, Vienna, Austria, 3–8 May 2026, EGU26-3251, https://doi.org/10.5194/egusphere-egu26-3251, 2026.

EGU26-3333 | Orals | AS1.26 | Highlight

A holistic view of tropical modes of variability as drivers of humid heat  

Cathryn Birch, Lawrence Jackson, Anistia Hidayat, Guillaume Chagnaud, John Marsham, Chris Taylor, Juliane Schwendike, Claudio Sanchez, and Adrian Matthews

Extreme humid heat threatens human health by limiting the body’s ability to cool through sweating. Its impacts are greatest in the tropics and subtropics, where high population density coincides with hot and humid conditions that are projected to intensify under climate change. While temperature extremes in the mid-latitudes have been widely studied, the drivers and predictability of tropical humid heat remain poorly understood.

We identify historical humid heat extremes in reanalysis across tropical and subtropical land. We use logistic regression to holistically examine the relationships between hot-humid days and the major modes of tropical variability.

We find that ENSO exerts a dominant influence on humid heat extremes across much of the tropics at interannual timescales, acting through combined effects on temperature and humidity. The Indian Ocean Dipole and the Atlantic modes further modulate the extremes.

On shorter timescales, the MJO is the dominant driver of humid heat variability in the regions surrounding the Indian Ocean. Humid heat peaks according to a fine, regionally varying, balance between increased humidity and longwave warming in the active MJO phases and increased shortwave warming in the suppressed MJO phases.

Over central Africa, north-west South America and parts of the Maritime Continent, Kelvin waves dominate over the MJO. The divergent and easterly phases of Kelvin waves increase humid heat predominantly through temperature increases, driven adiabatically through subsidence and diabatically through shortwave warming. Rapid transitions between the convergence and divergence Kelvin wave phases tend to constrain the duration of humid heat extremes, typically to no more than three consecutive days. Rossby and WMRG waves only dominate over smaller regions of the sub-tropics. 

This study has significantly advanced understanding of the drivers of tropical humid heat and highlights pathways for improved prediction. Our findings have important implications for model evaluation, seasonal outlooks, and the design of early warning systems.

How to cite: Birch, C., Jackson, L., Hidayat, A., Chagnaud, G., Marsham, J., Taylor, C., Schwendike, J., Sanchez, C., and Matthews, A.: A holistic view of tropical modes of variability as drivers of humid heat , EGU General Assembly 2026, Vienna, Austria, 3–8 May 2026, EGU26-3333, https://doi.org/10.5194/egusphere-egu26-3333, 2026.

Tropical cyclone (TC) Freddy traversed the South Indian Ocean (SIO) in 2023, setting a record for longevity and ranking secondly among historical TCs for both accumulated cyclone energy and potential destructiveness. Freddy’s long lifespan benefited from an anomalously strong Mascarene High, which steered Freddy westward along its northern flank, thereby preventing it encountering cold water areas. In addition to its long lifespan, we found Freddy experienced a record-breaking six rapid intensification (RI) events and analyzed the atmosphere-ocean conditions driving Freddy’s multiple RI events. The results indicated that during the six RI events, Freddy experienced high sea surface temperatures, weak vertical wind shear, high potential intensity, and high relative humidity, with all four environmental factors more favorable than historical averages. Notably, three of these RI events occurred within the Mozambique Channel, which also prolonged its coastal activity (21 d). This phase of TC Freddy generated extreme rainfall with maximum cumulative precipitation of 877 mm, compounded by secondary disasters, which caused substantial economic losses and fatalities in coastal areas. Additionally, it was found that the frequency of RI events and the number of intense TCs reaching Category 4 or above in the SIO showed statistically significant upward trends during 1980–2023, indicating a growing threat to Africa, which is likely to face more intense TCs in a warming climate. With rising sea levels and increasing threat from TCs, greater focus on coastal disaster prevention and mitigation strategies is needed to address the escalating risks associated with TCs in the SIO in the context of global warming.

How to cite: Wang, Q. and Guan, S.: Record-breaking lifespan, rapid intensification, and long-lasting coastal activity of Tropical Cyclone Freddy (2023) in the South Indian Ocean, EGU General Assembly 2026, Vienna, Austria, 3–8 May 2026, EGU26-4204, https://doi.org/10.5194/egusphere-egu26-4204, 2026.

Understanding how changing conditions influence tropical cyclone (TC) intensity is of great importance. This study applies a stochastic model (IRIS) to attribute the causes of the increased North Atlantic hurricane intensity from 1979 to 2024. In the model, the increased potential intensity and southward track shifts towards higher potential intensity comparably contribute to an increasing trend of 0.08 m/s per year in the lifetime maximum intensity. However, the simulated trends were not sensitive to the epochal changes in relative intensity to date. The model also predicts a southward shift in landfall (-0.10 °/yr), which is hard to detect. Our findings emphasize an increasing recent TC risk, particularly at low latitudes.

How to cite: Li, M. and Toumi, R.: Attributing causes of increased intensity of North Atlantic hurricanes using a stochastic model (IRIS), EGU General Assembly 2026, Vienna, Austria, 3–8 May 2026, EGU26-4300, https://doi.org/10.5194/egusphere-egu26-4300, 2026.

The initiation and subsequent intensification of tropical disturbances (TDs) remain challenging for numerical weather prediction. This study examines a systematic over-intensification tendency in the Korean Integrated Model (KIM) for a June 2025 case near the Mariana Islands and explores plausible mechanical and thermodynamic contributors. Using high-resolution (8 km) WRF simulations, we find evidence that the tendency is linked to an interaction between island-induced low-level convergence and the energy-based initiation logic of the operational KSAS convection scheme. In this case, topography appears to provide an important physical trigger for TD initiation by modifying low-level flow and enhancing convergence. While topography is closely associated with initiation, the convection scheme influences subsequent vertical development and the resulting intensity. Specifically, the operational KSAS-KIM configuration tends to respond early to lower-tropospheric energy maxima, which can favor rapid growth. In contrast, applying the NTDK (New Triggering Design for KIM; KSAS-EXP) approach—which uses buoyancy and condensate thresholds—reduces unrealistic intensification by limiting deep convection to more physically plausible conditions. These results suggest that as global models move toward finer resolutions, carefully balancing topographic forcing and convection-initiation mechanisms may help improve forecast realism.

How to cite: Kim, H.-R. and Kim, B.-M.: Numerical Simulation of Rapid Tropical Disturbance Development: Sensitivity to Topography and Convection Triggering, EGU General Assembly 2026, Vienna, Austria, 3–8 May 2026, EGU26-4404, https://doi.org/10.5194/egusphere-egu26-4404, 2026.

Bridging the gap between medium-range weather forecasting and seasonal outlooks, the Central Weather Administration (CWA) has implemented a multi-model ensemble framework to enhance tropical cyclone (TC) monitoring on sub-seasonal timescales (weeks 1–4). This operational platform synthesizes objective TC detection from leading global systems, including the 46-day ECMWF ensemble, the 32-day NCEP ensemble, and the CWA’s Global Ensemble Prediction System (GEPS), etc. We also developed a region-specific Probabilistic Formation Index, which serves as an operational Forecast Confidence Level (FCL) for the TC Threat Potential Forecast product.

The FCL is developed by using a deep learning architecture utilizing a Long Short-Term Memory (LSTM) model. The model is specifically designed to extract signals from key sub-seasonal drivers, such as the Western North Pacific Monsoon Index (WNPMI), sea surface temperature (SST), and intraseasonal oscillations including the Madden-Julian Oscillation (MJO) and Boreal Summer Intraseasonal Oscillation (BSISO). A specialized loss function was implemented during the training phase to address the inherent data imbalance of TC formation events. 

Systematic evaluations across the 1–4 week horizon demonstrate substantial forecast skill, particularly within the first two weeks. Notably, the correlation between dynamical model performance and the AI-derived FCL reveals the latter's efficacy as a proxy for forecast reliability in real-time operations. The practical value of this integrated approach is exemplified by the successful subseasonal prediction of Super Typhoon Ragasa (2025). This case study highlights the system's ability to provide early TC formation signals and reliable track outlooks, offering critical leadtime for disaster risk reduction. Complementing these efforts, probabilistic TC rainfall outlook products specifically designed for S2S timescales have been developed to provide valuable reference for water resources management and disaster mitigation. More details will be presented at the meeting.

How to cite: Tsai, P.-E., Lin, J.-Y., Tsai, H.-C., and Lo, T.-T.: Week 1–4 Tropical Cyclone Forecasting in the Western North Pacific: Verification of Super Typhoon Ragasa (2025) and Application of a Deep Learning-based Probabilistic Index, EGU General Assembly 2026, Vienna, Austria, 3–8 May 2026, EGU26-4657, https://doi.org/10.5194/egusphere-egu26-4657, 2026.

The complex behavior of the Madden–Julian Oscillation (MJO), a key source for global subseasonal-to-seasonal predictability, has often been attributed to stochastic forcing by unresolved processes. Here, we demonstrate that its erratic evolution is fundamentally deterministic. Our data-driven model reveals a spectral dichotomy in low-dimensional MJO dynamics: predictable, quasi-periodic oscillations coexist with and are perturbed by deterministic chaotic forcing. The latter governs the emergent complexity of the system. Contrasting true deterministic forcing against stochastic surrogates shows that the system with deterministic forcing preserves bounded amplitude, while the stochastic processes induce unboundedness. Furthermore, we quantify how deterministic forcing yields greater complexity and unpredictability in the MJO’s evolution than stochastic surrogates. Specifically, deterministic mechanisms induce chaos through the mixing of periodic orbits within the spectral dichotomy, whereas stochastic forcing can only generate quasi-periodic behavior via resonant interaction with these orbits. These results reveal the deterministic origins of MJO complexity and offer new pathways for improving its prediction and understanding its predictability.

How to cite: Chen, G.: Deterministic Nonlinearity Over Stochastic Noise: Resolving MJO's Complexity and Predictability Drivers, EGU General Assembly 2026, Vienna, Austria, 3–8 May 2026, EGU26-5114, https://doi.org/10.5194/egusphere-egu26-5114, 2026.

EGU26-5320 | Orals | AS1.26

Tropics-wide intraseasonal oscillations 

Jiawei Bao, Sandrine Bony, Daisuke Takasuka, and Caroline Muller

The tropical climate variability is characterized by various oscillations across a range of timescales. Oscillations that imprint the tropical mean state are generally attributed to slow processes, such as the seasonal cycle or interannual variability. Here, we identify a pronounced tropics-wide intraseasonal oscillation (TWISO) in satellite observations and reanalyses. This oscillation, with a period of 30 to 60 days, is evident across multiple variables and involves interactions between convection, radiation, surface fluxes, and large-scale circulation. It is primarily manifested as convective perturbations in the tropical Indo-Pacific warm pool accompanied by oscillations in the large-scale tropical overturning circulation. Here, we examine the relationship between TWISO, the Madden-Julian Oscillation (MJO), and the instability of radiative-convective equilibrium. Certain phases of TWISO coincide with specific phases of the MJO, suggesting a potential connection between the two. However, although the MJO can amplify the oscillation amplitude of TWISO, it is not essential for TWISO to occur. Finally, due to its broad manifestation across the tropics, TWISO potentially exerts widespread influence on tropical weather and climate at regional scales.

How to cite: Bao, J., Bony, S., Takasuka, D., and Muller, C.: Tropics-wide intraseasonal oscillations, EGU General Assembly 2026, Vienna, Austria, 3–8 May 2026, EGU26-5320, https://doi.org/10.5194/egusphere-egu26-5320, 2026.

This study investigates the characteristics of east Pacific (EPAC) easterly waves (EWs) in ten ensemble members of the Community Earth System Model version 2 Large Ensemble (CESM2-LENS) under the current climate, as well as their projected changes by the end of the 21st century under the Shared Socioeconomic Pathway 3–7.0 (SSP370) warming scenario. Under the current climate, the CESM2 ensemble mean produces realistic summer climatological mean precipitation, horizontal winds, and EW-filtered vorticity variability over the EPAC, although the amplitude of EW filtered precipitation variability is underestimated relative to observations. CESM2 also realistically simulates the distribution of EW tracks identified using 700-hPa curvature vorticity in the Caribbean and EPAC, along with the horizontal structure, amplitude, and propagation characteristics of EW disturbances. However, CESM2 EWs exhibit a more top-heavy vertical velocity profile and an eastward-tilted vertical structure relative to ERA5, suggesting some biases in vertical dynamical processes.

In the future warming scenario at the end of the 21st century, the mean precipitation over the EPAC strengthens and shifts southward, accompanied by intensified low-level mean easterly winds in the Papagayo jet region, although the increase in EW-filtered precipitation variability in this region is modest. EW track density and anomalous vorticity amplitude decrease along the Central American coast, while increasing within the southwestern ITCZ region. Changes in static stability with warming and weaker upper-level vertical velocity per unit precipitation explain the weakened midlevel vorticity in EWs, indicating that CESM2-simulated EPAC EWs have moisture mode characteristics. The weakened dynamical signal of the EWs may limit convective activity, thus resulting in only modest increases in EW precipitation amplitude.

How to cite: Maloney, E. and Zhou, Y.: East Pacific easterly waves in the CESM2 large ensemble: Present-day characteristics and projected future changes, EGU General Assembly 2026, Vienna, Austria, 3–8 May 2026, EGU26-5901, https://doi.org/10.5194/egusphere-egu26-5901, 2026.

EGU26-6190 | ECS | Posters on site | AS1.26

Precipitation Microphysics Evolution of Typhoon During the Sharp Turn: A Case Study of Vongfong (2014) 

Guiling Ye, Wentao Zhang, Jeremy Leung, Fengyi Wang, Bangling Zhang, and Weijie Dong

The sudden turn of tropical cyclones (TCs) can rapidly alter the affected disaster-prone regions and associated rainfall distributions, posing severe threats to coastal areas and creating major challenges for operational forecasting. However, most of these events occur over the open ocean, where the scarcity of in situ observations limits our understanding of how precipitation and cloud microphysical processes evolve during the sudden turning. In this study, we analyzed the precipitation evolution and associated microphysical characteristics during the sudden turn of Super Typhoon Vongfong (2014) using the latest GPM satellite observations. The main findings are as follows: (1) During the sudden-turning period, the precipitation coverage expanded significantly. Strong convective precipitation was distributed from the inner eyewall to the outer eyewall and spiral rainbands and weakened in intensity, whereas stratiform precipitation broadened in coverage and intensified. (2) The increase in stratiform precipitation was attributed primarily to increased cloud water content, which strengthened collision–coalescence processes, promoted the formation of larger and more numerous raindrops, and consequently increased precipitation efficiency and intensity. (3) The weakening of convective precipitation was related to the reduction in eyewall updrafts, which suppressed ice-phase processes and limited the development of deep convection.

How to cite: Ye, G., Zhang, W., Leung, J., Wang, F., Zhang, B., and Dong, W.: Precipitation Microphysics Evolution of Typhoon During the Sharp Turn: A Case Study of Vongfong (2014), EGU General Assembly 2026, Vienna, Austria, 3–8 May 2026, EGU26-6190, https://doi.org/10.5194/egusphere-egu26-6190, 2026.

EGU26-6200 | Posters on site | AS1.26

Situational Estimation of Tropical Cyclone Track Forecast Uncertainty Using an Autoregressive Encoder-Decoder LSTM Framework 

Yi-Shin Liu, Fang-Yi Lin, Yu-Ting Yang, and Hsiao-Chung Tsai

Providing reliable information on tropical cyclone (TC) track forecast uncertainty is essential for effective disaster preparedness. Conventionally, the radius of the Cone of Uncertainty (CoU) is derived from historical distance errors, often resulting in a static, climatological value that fails to account for the characteristics of individual storms. While traditional approaches attempt to categorize scenarios based on factors like translation speed, they are often limited by sample sparsity and struggle to objectively incorporate complex environmental influences.

To address these limitations, this study proposes an autoregressive encoder-decoder Long Short-Term Memory (LSTM) framework to generate situation-dependent CoU estimates. We utilize a multi-source dataset comprising official forecasts from the Central Weather Administration (CWA) and global models (ECMWF and NCEP) from the past five years. By employing an autoregressive architecture, the model can also iteratively generate a large ensemble of potential track realizations to characterize the forecast error distribution while preserving serial correlations across lead times.

In this presentation, we compare traditional methods with the proposed LSTM approach to highlight the advantages of situation-dependent estimation. Our results also show that the LSTM-based CoU provides a robust representation of observed tracks, covering approximately 68% and 95% of observations within one and two standard deviations, respectively. Furthermore, integrating global numerical model information significantly reduces the uncertainty radius while maintaining reliable coverage. Overall, this work demonstrates how deep learning can offer context-aware uncertainty quantification, serving as a promising advancement for TC forecasting.

How to cite: Liu, Y.-S., Lin, F.-Y., Yang, Y.-T., and Tsai, H.-C.: Situational Estimation of Tropical Cyclone Track Forecast Uncertainty Using an Autoregressive Encoder-Decoder LSTM Framework, EGU General Assembly 2026, Vienna, Austria, 3–8 May 2026, EGU26-6200, https://doi.org/10.5194/egusphere-egu26-6200, 2026.

EGU26-6609 | ECS | Posters on site | AS1.26

Persistent Convective-Dominated Inner-Core Clouds: A Key Driver of Tropical Cyclone Genesis 

Ziqing Wang and Guanghua Chen

This study investigates Typhoon Ma-on (2022) genesis in a high-resolution simulation. Results show that multiple peaks of convection occur in the inner core (within 100 km) of Ma-on, accompanied by periodic evolution of convective and stratiform clouds. A new concept, key period, is defined as a period that starts with increasing vertical motion associated with convective bursts, followed by the development of stratiform clouds and dissipation of convective clouds. To identify potential indicators of TC genesis, the key period of genesis is compared with an earlier key period.

Diagnosis of the vorticity equation reveals that convective clouds make most contributions to vorticity growth through vertical advection and stretching. The results further indicate that deeper convection is not necessarily more conducive to genesis; rather, persistent convection with its maximum upward motion at lower to middle levels more effectively drives lower-level spin-up. Additionally, diagnosis of water vapor equation shows that, convective-dominated inner-core clouds enhance the secondary circulation through diabatic heating, thereby ensuring the radial inflow of moisture. In contrast, when stratiform clouds occupy large areas in the inner core, lower-level divergence becomes dominant, which may cause moisture outflow and therefore insufficient moisture supply.

These confirm the crucial role of persistent convective-dominated inner-core clouds during the key period approaching TC genesis. That requires a strengthened mid-level vortex, to which temperature responds to maintain thermal wind balance, forming a cold anomaly near the disturbance center, below the mid-level vortex. Consequently, convective instability increases in the boundary layer, favoring more sustained convective clouds and new convective bursts. That maintains convective-dominated inner-core clouds and ultimately promotes TC genesis.

How to cite: Wang, Z. and Chen, G.: Persistent Convective-Dominated Inner-Core Clouds: A Key Driver of Tropical Cyclone Genesis, EGU General Assembly 2026, Vienna, Austria, 3–8 May 2026, EGU26-6609, https://doi.org/10.5194/egusphere-egu26-6609, 2026.

EGU26-6739 | ECS | Posters on site | AS1.26

Analysis of convective activity in Tropical Storm Delta in a warmer climate 

Pedro Gómez-Plasencia, Ernesto Javier Rodríguez-Acosta, Juan Jesús González-Alemán, Carlos Calvo-Sancho, Javier Díaz-Fernández, Ana Montoro-Mendoza, Pedro Bolgiani, María Luisa Martín, Íñigo Gómara, and Ana Morata

Under future climate change scenarios, warmer ocean conditions are expected to substantially modify the behavior of tropical cyclones, particularly in regions where these systems are currently uncommon. In this work, tropical storm Delta (2005), which developed in the northeastern Atlantic basin, is used as a case study to explore how elevated sea surface temperatures influence cyclone intensity, internal convection, and the characteristics of its extratropical transition. Using high-resolution HARMONIE-AROME simulations, a reference experiment of the storm with boundary and initial conditions from ERA5 is compared with a warmer scenario in which sea surface temperatures are increased. The simulations reveal that enhanced surface heat fluxes strongly reinforce convection in Delta’s eyewall in a warmer scenario, promoting more vigorous and sustained updrafts, driving a marked deepening of the cyclone during its tropical stage. This intensification allows Delta to reach hurricane intensity. Later, the transition to an extratropical system begins earlier, extends over a longer period, and evolves into a more severe system. These changes translate into substantially stronger impacts over the Canary Islands (Spain), particularly through extreme wind gusts during the post-tropical stage. The findings underline the potential for anthropogenic climate change to increase the severity of storms with tropical features affecting western Europe, with important implications for future risk assessment in the region.

How to cite: Gómez-Plasencia, P., Rodríguez-Acosta, E. J., González-Alemán, J. J., Calvo-Sancho, C., Díaz-Fernández, J., Montoro-Mendoza, A., Bolgiani, P., Martín, M. L., Gómara, Í., and Morata, A.: Analysis of convective activity in Tropical Storm Delta in a warmer climate, EGU General Assembly 2026, Vienna, Austria, 3–8 May 2026, EGU26-6739, https://doi.org/10.5194/egusphere-egu26-6739, 2026.

EGU26-6850 | ECS | Orals | AS1.26

Synoptic-Scale Environments of African Easterly Waves with Anomalous Northward Trajectories  

Ernesto Javier Rodríguez Acosta, Pedro Gómez Plasencia, Juan Jesús González Alemán, Carlos Calvo Sancho, Pedro Bolgiani, Javier Díaz Fernández, María Yolanda Luna, Ana Montoro Mendoza, María Luisa Martín, and Iñigo Gomara

This study investigates the climatological environments and large-scale forcing mechanisms that promote anomalous northward trajectories of African Easterly Waves (AEWs) over the central-eastern Atlantic. AEWs are identified through a tracking algorithm based on 700 hPa relative vorticity using the ERA5 reanalysis dataset from 1940 to 2024, and a subset of waves with anomalous trajectories is selected (aAEWs). The synoptic-scale atmospheric and oceanic environments associated with these aAEWs are characterized and compared against a 30-year climatology to identify the key dynamical and thermodynamical factors favouring their northward propagation. The results reveal that aAEWs follow a particular large-scale configuration. This setup is characterized by a significantly strengthened Azores High, displaced poleward from its climatological position, in conjunction with an enhanced mid-level trough over the northeastern Atlantic. A pronounced cooling near the tropopause and anomalously warm sea surface temperatures within the wave’s intensification zone are also identified. Furthermore, substantial modifications in low level moisture transport and wind shear along the West African coast are identified as acritical factor in steering the aAEWs from their common westward trajectories. These results have important climatic implications, as these anomalous environments promote the northward migration of AEWs and significantly increases the likelihood of tropical cyclogenesis in the northeastern Atlantic, a region that is climatologically weakly active.

How to cite: Rodríguez Acosta, E. J., Gómez Plasencia, P., González Alemán, J. J., Calvo Sancho, C., Bolgiani, P., Díaz Fernández, J., Luna, M. Y., Montoro Mendoza, A., Martín, M. L., and Gomara, I.: Synoptic-Scale Environments of African Easterly Waves with Anomalous Northward Trajectories , EGU General Assembly 2026, Vienna, Austria, 3–8 May 2026, EGU26-6850, https://doi.org/10.5194/egusphere-egu26-6850, 2026.

EGU26-7496 | Posters on site | AS1.26

Spatiotemporal Patterns of Typhoon Rainfall in Taiwan Associated with Track Clusters 

Wen-Hsin Huang, Shien-Tsung Chen, Hsiao-Chung Tsai, and Szu-Yu Chen

Typhoon rainfall is one of the primary meteorological hazards in Taiwan, with its spatial distribution strongly modulated by storm tracks and complex topography. In this study, landfalling typhoons affecting Taiwan from 1950 to 2024 are analyzed using gridded precipitation data. Hierarchical clustering is first applied to typhoon tracks to derive interpretable track types, with cluster numbers objectively determined from within-cluster variance. For each track type, a data-driven pattern extraction framework is subsequently applied to the corresponding rainfall fields, enabling the identification of dominant spatial features and representative canonical rainfall patterns. We further focus on typhoon events associated with pronounced rainfall impacts, systematically examining the correspondence between their rainfall characteristics and the identified canonical patterns, and quantitatively assessing the relationship between track clusters and high-risk rainfall spatial features. In addition, detailed grid-point analyses are conducted for extreme rainfall cases, including Typhoons Gaemi (2024) and Danas (2025), to evaluate whether their rainfall spatial distributions conform to the identified canonical patterns. By quantifying the linkage between typhoon track clusters and rainfall spatial patterns, this study provides a physically grounded reference framework for subseasonal-to-seasonal typhoon rainfall prediction and scenario-oriented analysis.

How to cite: Huang, W.-H., Chen, S.-T., Tsai, H.-C., and Chen, S.-Y.: Spatiotemporal Patterns of Typhoon Rainfall in Taiwan Associated with Track Clusters, EGU General Assembly 2026, Vienna, Austria, 3–8 May 2026, EGU26-7496, https://doi.org/10.5194/egusphere-egu26-7496, 2026.

Tropical cyclone (TC) intensification is strongly influenced by the oceanic thermal structure, shaped by both temperature and salinity stratification. However, the role of salinity stratification remains debated. We conducted idealized experiments using a fully coupled atmosphere–ocean model to systematically assess its impact on TC evolution. Generally, vertical advection dominates the thermal response. An intact barrier layer (BL) enhances vertical advection by intensifying vertical velocity gradients, whereas partial erosion suppresses it but inversion layer compensation emerges. Once the BL is fully eroded, the inversion layer vanishes, and the influence of salinity stratification on TC intensity is substantially diminished. These processes are modulated by TC translation speed. At the fastest translation speed (6 m s⁻¹), strong stratification maintains an intact BL that confines vertical velocity to the upper ocean. This enhances the contribution of the velocity gradient to vertical advection, allowing the TC to reach maximum intensity. Under moderate and weak stratification, partial erosion of the BL weakens vertical advection, leading to reduced TC intensity. At a moderate translation speed (3 m s⁻¹), BL erosion becomes more pronounced, weaker salinity stratification exerts less suppression on vertical advection and mixing, amplifies thermal compensation from the inversion layer, and favors TC intensification. For slow-moving TCs (1 m s⁻¹), the BL and inversion layer are fully eroded, salinity stratification plays a negligible role in modulating TC intensity. Overall, these findings highlight the non-negligible role of salinity stratification in regulating TC intensity and provide physical insights for improving intensity forecasts.

How to cite: li, L., li, Y., and Tang, Y.: The modulation of Tropical Cyclone Intensity by Subsurface Salinity Stratification: An Idealized Study Using Coupled General Circulation Model, EGU General Assembly 2026, Vienna, Austria, 3–8 May 2026, EGU26-7742, https://doi.org/10.5194/egusphere-egu26-7742, 2026.

EGU26-8329 | ECS | Orals | AS1.26

Common Gravity Wave Patterns from Multi-Hurricane Analysis 

Yuying (Alice) Wang, Spiros Pagiatakis, and Panagiotis Vergados

Hurricanes are important sources of convectively generated gravity waves (GWs) that play a critical role in modifying the thermodynamics in the upper troposphere-lower stratosphere (UTLS) region. There are several widely used theories that describe the GW convective generation, but their validation using model simulations or satellite measurements is not sufficient due to the lack of high resolution measurements and the difficulties in isolating the convection force.  The GNSS - radio occultation (RO) measurements therefore stand out since they are capable of determining the hurricane thermal structures and identify the small-vertical-scale GWs, because of their high-vertical-resolution (<0.1km) and high accuracy (<0.5K) temperature retrievals.

This study seeks to characterize the GWs generated by hurricanes by investigating three intense hurricanes of similar intensity, to determine their common GW features that can be extended and compared to GWs induced by other hurricanes. We approach this goal by analyzing the GW properties using multiple RO temperature retrievals along each hurricane’s track by illustrating the consistency of the tropopause height and convection strength within the analyzed periods. We then evaluate the correspondence between the RO-determined GW properties and the hurricane environment revealed by the ERA5 model-level data. This comparison clearly demonstrates that the RO profiles could vertically penetrate the hurricane structure close to the eye with a small horizontal drift, allowing us to identify the link between the wave characteristics and their sources of generation. Our results show a good agreement with the conceptual GW theories, from which we identify three distinct GW wavelength bands that correspond to different generation mechanisms with strong consistency among the hurricanes studied. The Least Squares Wavelet Analysis (LSWA) also uniquely demonstrates the wind filtering effects that modify the GW wavelength via the dispersion relation. Our study suggests a common GW pattern exhibited by multiplication of the selected profiles from each studied hurricanes that might be applicable to other hurricanes of similar intensity.

How to cite: Wang, Y. (., Pagiatakis, S., and Vergados, P.: Common Gravity Wave Patterns from Multi-Hurricane Analysis, EGU General Assembly 2026, Vienna, Austria, 3–8 May 2026, EGU26-8329, https://doi.org/10.5194/egusphere-egu26-8329, 2026.

The period between 1 June and 30 November has been established by the National Oceanic and Atmospheric Administration (NOAA) as the operational hurricane season in the North Atlantic (NA), reflecting the environmental conditions typically conducive to tropical cyclogenesis and tropical cyclone (TC) intensification. However, historical records indicate that cyclonic activity may occasionally begin prior to the official season start. This study investigates 12 TCs at the tropical storm (TS) stage that occurred in April or May (defined here as the preseason) in the NA from 1980 to 2023 (NOAA’s HURDAT2). The analysis of this particular stage is motivated by the fact that it represents the highest intensity reached by preseason TCs during the study period. The research focuses on associated atmospheric and oceanic conditions derived from ERA5 reanalysis data available in the Copernicus Climate Data Store, including sea surface temperature (SST), 600-hPa relative humidity (RH) and vertical wind shear (VWS) between 200 and 850 hPa. Anomalies associated with preseason TSs were identified, characterized by unusually high SST (up to 1°C above the climatological mean) and mid-tropospheric RH (up to 40% above average), accompanied by significantly reduced VWS (up to 10 m/s below average). Additionally, positive seasonal trends in both mean and percentile values of SST (up to 0.4°C per decade) and RH (up to 3% per decade), along with decreasing VWS (up to −2 m/s per decade), were observed in regions where preseason TSs typically occurred. The waters northeast of the Florida Peninsula emerged as a particularly sensitive area, as half of the analysed preseason TSs occurred there. Furthermore, the Florida Peninsula and its surrounding region exhibited statistically significant trends in the examined variables, all of which are associated with the occurrence of preseason TSs. Results indicate that the environmental window for the occurrence of TCs in the NA may continue to expand, potentially increasing the likelihood of such events. These results may contribute to improving long-range preseason TC outlooks and to identifying regions potentially vulnerable to an extension of the hurricane season. Observed springtime trends may be connected with climate change (rising SST and RH) or reflect complex circulation changes (decreasing VWS in certain areas), highlighting the need for further research, particularly through climate projections assessing the persistence of these trends and the physical mechanisms underlying the observed anomalies.

How to cite: Szczapiński, A.: Atmospheric and Oceanic Conditions Associated with Preseason Tropical Storms in the North Atlantic (1980–2023), EGU General Assembly 2026, Vienna, Austria, 3–8 May 2026, EGU26-9538, https://doi.org/10.5194/egusphere-egu26-9538, 2026.

African Easterly Waves (AEWs) are the dominant synoptic-scale tropical disturbance in the boreal summer Atlantic. However, direct three-dimensional observations of these waves and their modulation of the Intertropical Convergence Zone (ITCZ) remain limited.

Observations from the Eastern Atlantic leg of ORCESTRA are used to characterize the mean vertical and horizontal structure of seven robust AEWs in a wave-relative framework. The observations reveal coherent vertical wind and moisture structures, with upstream–downstream asymmetries relevant for both synoptic-scale organization and deep convection. These results motivate a focused investigation of how AEWs influence the structure and organization of the ITCZ.

We test the hypothesis that AEWs play a central role in constraining ITCZ structure during boreal summer. Based on the observed AEW structure, we hypothesize that wave-modulated moisture distributions and gradients influence the organization of deep convection within the ITCZ. Large-eddy simulations conducted over the campaign period are compared with the observations to assess the representation of AEWs and to further explore AEW–ITCZ interactions.

How to cite: Rowe, D.: The Relationship Between African Easterly Waves and the Atlantic ITCZ: Structural Insights from ORCESTRA , EGU General Assembly 2026, Vienna, Austria, 3–8 May 2026, EGU26-10760, https://doi.org/10.5194/egusphere-egu26-10760, 2026.

EGU26-11016 | ECS | Orals | AS1.26

Beyond the Mean: the Mesoscale Cloud Patterns of the Atlantic ITCZ 

Lennéa Hayo and Julia Windmiller

The organization of clouds in the Intertropical Convergence Zone (ITCZ) varies markedly from day to day. To investigate how different mesoscale cloud patterns relate to the mean properties of the ITCZ, e.g. precipitation, we have identified and classified recurrent patterns. Focusing on the Atlantic ITCZ, we define five mesoscale cloud patterns: Line, Double Line, Broad, Cluster, and Speckles. We investigate the patterns using two different methods, human labeling and automated identification based on profile-fitting. The human labelers classified a total of ~6,600 images for the seasons July, August and September and December, January and February. The profile-fitting is based on typical signals seen in the human classified labels but automates the detection of the patterns. Both methods show that the preferred location of the most cloudy pattern (Broad) and the least cloudy pattern (Speckles) is seasonally dependent. Additionally, they hint at a connection between the pattern distribution and the regions of highest and lowest precipitation. While the human labeling results are restricted to the afternoon peak in convection, the automated detection method is applied to additional seasons, regions and even times of day. 

How to cite: Hayo, L. and Windmiller, J.: Beyond the Mean: the Mesoscale Cloud Patterns of the Atlantic ITCZ, EGU General Assembly 2026, Vienna, Austria, 3–8 May 2026, EGU26-11016, https://doi.org/10.5194/egusphere-egu26-11016, 2026.

EGU26-11111 | ECS | Posters on site | AS1.26

Diurnal Cycles of Tropical Convective Processes in Satellite-Observed, Reanalysed and Simulated Frozen Water Paths 

Lara Leko, Gunnar Behrens, Nils Müller, Adrià Amell, Axel Lauer, and Patrick Eriksson

In Earth System Model (ESM) simulations, estimates of Frozen Water Path (FWP), i.e., the column-integrated mass of precipitating and suspended ice particles, exhibit large uncertainties. In tropical regions with prevailing deep convection, FWPs are further characterised by a strong diurnal variability in simulations and observations. However, evaluating the simulated diurnal cycles has been difficult due to a lack of long-term satellite observations. Here, we use the novel machine-learned Chalmers Cloud Ice Climatology (CCIC), based on merged satellite datasets, to explore potential deviations of the captured diurnal cycle of FWP, both in ERA5 and km-scale models of the DYAMOND project. Moreover, we crosslink the diurnal cycle of FWP with the ones of precipitation and high-cloud cover to gain a broader view of the diurnal cycle of deep convection.  We find a general agreement on the phase of the diurnal cycle of FWP in CCIC and DYAMOND km-scale models. In contrast, ERA5 shows shifted FWP diurnal cycles over all evaluated tropical regions. Both DYAMOND models and ERA5 underestimate the diurnal amplitude of FWP and overestimate the diurnal amplitude of precipitation. Diurnal cycles of the observed variables are characterised by pronounced land-ocean contrasts. Tropical land areas show a year-round afternoon peak of precipitation, which is closely followed by a peak of FWP, while high cloud cover peaks are delayed towards evening or midnight, depending on the season. Tropical oceans have a broad peak in high cloud cover in the evening hours. This is followed by a build-up of both precipitation and FWP over the night towards an early morning peak. These findings indicate that different processes drive the observed diurnal cycles of tropical deep convection over land and ocean, in line with previous research. This complicates the task of properly capturing the diurnal cycles of deep convection in reanalysis products, km-scale or in highly parameterised ESMs. Here, novel satellite products like CCIC with a high temporal resolution will help to identify and assess biases of the modelled diurnal cycles of deep convection in the tropics and to better understand the underlying drivers of deep convection.

How to cite: Leko, L., Behrens, G., Müller, N., Amell, A., Lauer, A., and Eriksson, P.: Diurnal Cycles of Tropical Convective Processes in Satellite-Observed, Reanalysed and Simulated Frozen Water Paths, EGU General Assembly 2026, Vienna, Austria, 3–8 May 2026, EGU26-11111, https://doi.org/10.5194/egusphere-egu26-11111, 2026.

EGU26-11320 | ECS | Orals | AS1.26 | Highlight

Simulated diurnal pulses in developing tropical cyclones 

Katharina Schmitt, James Ruppert, Naoko Sakaeda, and Raphaela Vogel

The diurnal cycle is one of the most fundamental characteristics of tropical cyclones (TCs), influencing a wide range of processes including cloud coverage, rainfall, and the timing of intensity changes. Recent studies have identified outward-propagating features known as diurnal pulses (DPs). These pulses appear as rings of localized cooling in brightness temperature that propagate radially outward from the storm center over several hours. DPs occur in the majority of TCs and have been observed across all storm intensities, from tropical storms to major hurricanes. Furthermore, DPs have been linked to changes in TC structure and intensity.

Because DPs have mainly been observed via brightness temperature anomalies in the cirrus canopy, their vertical structure remains poorly understood. While prior work indicates that they may extend vertically, the complete depth of these pulses throughout the storm has yet to be determined. Here, we show that DPs are not confined to the upper troposphere but instead represent column-depth features, producing coherent anomalies across multiple atmospheric variables.

Despite the growing body of literature on DPs, their propagation mechanism remains an open question. Several hypotheses have been proposed, with particular emphasis on inertial–gravity waves. Support for this interpretation comes mainly from observed propagation speeds, which are consistent with theoretical inertial–gravity wave speeds in the TC environment, as well as from the strong latitude dependence of the pulses. Here, we investigate this hypothesis using classical dry gravity wave theory, finding propagation angles and inter-variable phase relationships that are consistent with theoretical expectations.

Beyond their propagation, the timing of DP initiation has been a central focus. Originally, DPs were described using a “diurnal clock” framework (Dunion et al., 2014), with initiation typically occurring between 00:00 and 04:00 local solar time (LST) and outward propagation to a radius of approximately 200 km by 04:00–08:00 LST. However, accumulating observational evidence suggests that this timing is not universal. Accordingly, we examine the preferred nighttime initiation of DPs and investigate the physical mechanisms that may underlie this tendency.

How to cite: Schmitt, K., Ruppert, J., Sakaeda, N., and Vogel, R.: Simulated diurnal pulses in developing tropical cyclones, EGU General Assembly 2026, Vienna, Austria, 3–8 May 2026, EGU26-11320, https://doi.org/10.5194/egusphere-egu26-11320, 2026.

EGU26-12860 | Orals | AS1.26

Rainy Season Climatology and Trends in Southern Africa Using Multiple Rainfall Datasets 

Andreas. H. Fink, Carlos A. Peirera, Pedro M. Soares, and Alexandre M. Ramos

Rainfall variability critically affects rainfed agriculture and water resources across the Southern Africa subcontinent, where communities are highly vulnerable to shifts in rainy season dynamics. This study provides a comprehensive assessment of the rainy season’s modality, onset, cessation, duration, and trend over the Southern African subcontinent using multiple and recent gridded rainfall datasets together with an extensive collection of in-situ observations. The analysis uses the rainy season definition methodology based on Liebmann & Marengo (2001) that can be applied to a range of climates ranging from semi-arid to humid. The method is applied to daily satellite, satellite-gauge-calibrated, gauge-only, and reanalysis datasets and a large collection of daily station data from about 1980 to 2020.  The approach is complemented by Fast Fourier Transform (FFT) analysis to enhance the robustness of seasonal signal detection rainy season modality.

Our results reveal a clear north-to-south rainfall gradient, with wetter equatorial regions and drier southwestern areas. This gradient is less pronounced southeastwards. Rainfall modality varies spatially, with bimodal regimes dominating the equatorial zone linked to the north-south movement of the rain belt (aka. Intertropical Convergence Zone (ITCZ)), while interior and southeastern zones exhibit unimodal summer rainfall peaks. The southwestern tip of South Africa displays a distinctive winter rainfall peak, mostly driven by extratropical low pressure systems. Transitional zones with complex orography as well as coastal zones show larger dataset disagreement, bringing challenges in capturing rainfall seasonality.

Trend analysis over recent decades indicates a trend towards delayed onsets (~2-3 days/year), earlier cessations (-3 to <~-4 days/year) and shortened durations of the rainy season (-2 to ~-4 days/year ) in regions such as Angola, Namibia and western South Africa. Cessation trends show higher spatial variability than onset trends. These changes are more pronounced in gridded datasets but also appear in station records, reinforcing confidence in the observed tendencies. The findings align with future climate projections under high-emission scenarios, highlighting risks for water availability, agricultural planning, and food security. The study emphasizes the need for improved observational coverage and integration of onset and cessation monitoring into early warning and climate adaptation systems.

How to cite: Fink, A. H., Peirera, C. A., Soares, P. M., and Ramos, A. M.: Rainy Season Climatology and Trends in Southern Africa Using Multiple Rainfall Datasets, EGU General Assembly 2026, Vienna, Austria, 3–8 May 2026, EGU26-12860, https://doi.org/10.5194/egusphere-egu26-12860, 2026.

EGU26-13618 | ECS | Posters on site | AS1.26

Regional and sub-basin seasonal tropical cyclone activity in the CMCC-SPS3.5 model 

Giacomo Giuliani, Leone Cavicchia, Salvatore Pascale, Antonella Sanna, Pier Luigi Vidale, and Enrico Scoccimarro

Reliable seasonal forecasts of tropical cyclone (TC) activity are fundamental in helping stakeholders make informed decisions and mitigate economic and societal losses. While several public and private institutions issue seasonal forecasts of tropical storms for traditionally investigated basins, like the North Atlantic and the Western North Pacific, only a few provide global coverage, limiting confidence for other densely inhabited regions. Here, we evaluate the retrospective seasonal forecasts of TC activity across five basins (North Atlantic, Eastern and Western North Pacific, South Indian and South Pacific) over the period 1993-2016, using the Euro-Mediterranean Center on Climate Change Seasonal Prediction System 3.5 (CMCC-SPS3.5), a coupled general circulation model used for operational seasonal forecasts. CMCC-SPS3.5 skillfully captures key features of TC climatology (i.e., spatial distribution and seasonal cycle) and predicts with statistically significant skill their interannual variability, both in terms of numbers of tropical cyclones (NTC) and pressure-based accumulated cyclone energy (PACE). The model shows asymmetric performance, with TC activity overestimated in the Southern Hemisphere and underestimated in the Northern Hemisphere compared to the observations. Using a probabilistic clustering approach, we show that the model has statistically significant skill in year-to-year variability for specific track patterns across each basin. Using the North Atlantic basin as a case study, we show that the ENSO-TC teleconnection is stronger in CMCC-SPS3.5 compared to the observations, with implications for cyclone predictability. Moreover, our findings suggest that the basin-wide predictability is the result of the cumulative skill of individual clusters, providing insights for developing track-based forecasts. This study also demonstrates the readiness of CMCC-SPS3.5 for operational global TC seasonal forecasting.


How to cite: Giuliani, G., Cavicchia, L., Pascale, S., Sanna, A., Vidale, P. L., and Scoccimarro, E.: Regional and sub-basin seasonal tropical cyclone activity in the CMCC-SPS3.5 model, EGU General Assembly 2026, Vienna, Austria, 3–8 May 2026, EGU26-13618, https://doi.org/10.5194/egusphere-egu26-13618, 2026.

EGU26-14787 | ECS | Orals | AS1.26

Characteristics of Precipitation across the Atlantic Inter-Tropical Convergence Zone from Shipborne Sea-Pol Radar Observations during ORCESTRA 

Delián Colón-Burgos, Michael Bell, Daniel Klocke, Allison Wing, and James Ruppert

The governing mechanisms of mesoscale convective organization and precipitation across the inter-tropical convergence zone (ITCZ) are an open area of research, due in part to the lack of detailed observations over the tropical oceans. The Process Investigation of Clouds and Convective Organization over the atLantic Ocean (PICCOLO), a sub-campaign of Organized Convection and EarthCARE Studies over the Tropical Atlantic (ORCESTRA), deployed the Colorado State University Sea-Going Polarimetric (Sea-Pol) radar on the German R/V Meteor during August and September of 2024, to bridge this gap. This is the first ship-stabilized polarimetric radar deployment in this region to our knowledge. In this study we use 3D 120 km range Sea-Pol radar retrievals to analyze the spatial structure, rate, and microphysical characteristics of precipitation across the Atlantic ITCZ. We perform calculations of the height of the 10 dBZ echo and find three convection groups based on a trimodal division of frequency: shallow (1- 4 km), congestus (5- 7 km), and deep (8 km+). Results show echoes in the congestus group contributing the most to the total rain accumulation across the campaign. These congestus echoes are frequently obscured on satellite brightness temperatures by higher clouds. Deep convective echoes were found to be more infrequent but have higher rain rates per fractional area. Higher populations of deep and congestus clouds are often found in proximity, while the remaining cloud population of shallow convection is found to be more distinct spatially. The interdependence of these convective populations in the context of the ITCZ and African Easterly Wave passages, will be discussed.

How to cite: Colón-Burgos, D., Bell, M., Klocke, D., Wing, A., and Ruppert, J.: Characteristics of Precipitation across the Atlantic Inter-Tropical Convergence Zone from Shipborne Sea-Pol Radar Observations during ORCESTRA, EGU General Assembly 2026, Vienna, Austria, 3–8 May 2026, EGU26-14787, https://doi.org/10.5194/egusphere-egu26-14787, 2026.

The Madden–Julian oscillation (MJO) is the dominant intraseasonal wave phenomenon influencing extreme weather and climate worldwide. Realistic simulations and accurate predictions of MJO genesis are the cornerstones for successfully monitoring, forecasting, and managing meteorological disasters 3–4 weeks in advance. Nevertheless, the genesis processes and emerging precursor signals of an eastward-propagating MJO event remain largely uncertain. The year 2023 has witnessed the sequential genesis of a record-breaking Madden–Julian oscillation (MJO) and an unprecedented coastal El Niño in March–April, thus offering another opportunity to understand the dynamics of MJO–El Niño interactions. Here, we show that the March 2023 MJO is quite unusual as it starts from the South China Sea due to the dry intrusion of extratropical cold northerly winds and moist preconditioning effects of equatorial Rossby waves, propagates eastward fast as a double Kelvin wave system, and expands over the entire tropical Pacific largely as a Kelvin wave response to its strong suppressed convection over the Maritime Continent. Because of these unusual features, the MJO exerts widespread westerly wind forcing to the ocean surface, with two maxima over the western and far eastern tropical Pacific. Due mainly to the depressed local Ekman upwelling under MJO westerly, the upper ocean gets warmer than normal near the coast of South America, thereby helping trigger the 2023 coastal El Niño. Using an El Niño ensemble forecasting system, we quantify that the MJO westerly over the far eastern Pacific explains approximately 30% of coastal warming signals off Peru. Although only marginally increasing the end-of-year Niño-3.4 index, the March MJO can induce small-scale oceanic westward-propagating disturbances, which significantly decrease the intermember spread of the forecasted basin-scale 2023/24 El Niño. These results highlight the pivotal importance of tropical–extratropical interactions in initiating those MJOs from outside the Indian Ocean and also point out the potential roles of MJOs in dynamical El Niño evolution and prediction.

How to cite: Wei, Y.: Initiation of the Record-breaking March 2023 MJO Event: Implications for El Niño Onset and Prediction, EGU General Assembly 2026, Vienna, Austria, 3–8 May 2026, EGU26-15555, https://doi.org/10.5194/egusphere-egu26-15555, 2026.

Accurately reproducing historical extreme tropical cyclone (TC) seasons is essential for understanding the physical mechanisms governing TC intensity and for improving future projections. However, previous studies have primarily relied on observational analyses, and the capability of climate models to reproduce extreme TC intensity—especially during the pre-satellite era—remains poorly explored. As an example, the year 1959 represents one of the most extreme TC seasons over the western North Pacific (WNP), during which five Category-5 TCs occurred between August and October, accounting for 15.6% of all TC records, the highest on record.
Based on TC best-track data and reanalysis products, we show that both anomalous TC genesis locations and frequent rapid intensification (RI) events contributed to the exceptionally high basin-mean lifetime maximum intensity (LMI) in 1959. More TCs formed over the open WNP basin around 150°E, where storms tend to achieve higher LMI, while the number of RI events far exceeded the climatological mean. These features are closely linked to large-scale circulation anomalies, including an enhanced monsoon trough, a weakened subtropical high, and the eastward shift of tropical upper-tropospheric trough (TUTT). Together, these circulation changes modulated TC genesis positions and enhanced RI occurrences, ultimately leading to a higher basin-mean TC LMI.
To further investigate the role of sea surface temperature anomalies (SSTAs) and assess the reproducibility of this extreme season, we conducted a set of three-month ensemble simulations using the Nonhydrostatic Icosahedral Atmospheric Model (NICAM) at 28-km horizontal resolution, with 10 ensemble members for each experiment. Four experiments were performed: a climatological SST experiment (CLIM), a realistic 1959 SST experiment (REAL), and two sensitivity experiments representing subtropical Central Pacific warming (CPW) and Indian Ocean warming (IOW), respectively. The REAL experiment successfully reproduces the enhanced TC intensity in 1959, along with the associated large-scale circulation anomalies, demonstrating the capability of NICAM to simulate historical extreme TC seasons. Sensitivity experiments reveal that CPW plays a dominant role in driving the extreme TC activity. The positive SSTA in the central Pacific induces a Matsuno–Gill–type response, generating anomalous low-level cyclonic circulation and upper-level anticyclonic circulation over the WNP. This response strengthens the monsoon trough and weakens the subtropical high, thereby shifting TC genesis locations, increasing RI frequency, and finally enhancing basin-mean LMI. In contrast, the IOW experiment shows a much weaker impact on both large-scale circulation and TC intensity.
These results highlight the critical importance of subtropical central Pacific SST forcing in shaping historical extreme TC seasons and demonstrate the value of high-resolution climate models in advancing our understanding of TC intensity variability.

How to cite: Chen, X. and Satoh, M.: Reproducing the Extreme 1959 Tropical Cyclone Season over the Western North Pacific Using a High-Resolution Model, EGU General Assembly 2026, Vienna, Austria, 3–8 May 2026, EGU26-15690, https://doi.org/10.5194/egusphere-egu26-15690, 2026.

EGU26-15893 | ECS | Orals | AS1.26

Exploring Drivers of Unexpected Diurnal Variations in Tropical Oceanic Cold Cloud Production 

Sarah Wessinger, Anita Rapp, Gregory Elsaesser, Rémy Roca, and Thomas Fiolleau

The diurnal cycle of cold cloud cover is underestimated within Earth system models (ESMs) with the greatest underestimation in the afternoon. To better understand the diurnal cycle of tropical oceanic cloud cover, the diurnal cycle of deep convective system (DCS) initiation and the subsequent contributions to cloud cover resulting from systems initiating at earlier times is analyzed using newly developed DCSs Lagrangian tracking methodologies. Satellite infrared-based Tracking Of Organized Convection Algorithm through 3D segmentatioN (TOOCAN) DCSs are matched to Global Precipitation Measurement (GPM) mission precipitation and diabatic heating products. Matched data are then binned by their hour of initiation (in local solar time) to evaluate morphological characteristics and contributions to rain and cloud cover diurnal cycles. Analysis reveals an unexpectedly large peak in daytime DCS initiation that produce subsequent afternoon cloud cover, thus suggesting that the discrepancy between ESMs and observations is likely due, in part, to ESM misrepresentation of initiation or maintenance of daytime-initiated DCSs. Results also show that daytime DCSs produce less precipitation, but relatively more cloud shield compared to DCS that initiate overnight. As a framework to understand these diurnal variations in cold cloud production, we will apply a semi-empirical source-sink cold cloud area growth model that includes a convective area source term and latent heating source term. Vertical latent heating profiles from GPM, DCS morphology from TOOCAN, and atmospheric lapse rates and density from ERA5 are fit to the semi-empirical model to estimate cloud growth and decay timescales. Observation-estimated timescales and the source term variations will be evaluated to understand key drivers in the differences in DCS cold cloud production across the diurnal cycle.

How to cite: Wessinger, S., Rapp, A., Elsaesser, G., Roca, R., and Fiolleau, T.: Exploring Drivers of Unexpected Diurnal Variations in Tropical Oceanic Cold Cloud Production, EGU General Assembly 2026, Vienna, Austria, 3–8 May 2026, EGU26-15893, https://doi.org/10.5194/egusphere-egu26-15893, 2026.

Tropical cyclone (TC) intensification is strongly regulated by air–sea interactions and the thermal–salinity structure of the upper ocean. While salinity stratification influences vertical mixing and mixed-layer stability, its role in modulating rapid intensification (RI) remains insufficiently quantified in fully coupled modeling systems. Here we investigate multiscale air–sea coupling during Super Typhoon DOKSURI using a high-resolution Unified Wave Interface–Coupled Model (UWIN-CM). The UWIN-CM couples the Weather Research and Forecasting (WRF) Model, the University of Miami Wave Model (UMWM), and the Hybrid Coordinate Ocean Model (HYCOM) in a single framework that explicitly resolves momentum, heat, and freshwater exchanges among the atmosphere, surface waves, and ocean. Model simulations show that salinity-stratified barrier layers and subsurface warm layers suppress vertical entrainment beneath the storm core, thereby limiting storm-induced sea surface cooling and preserving near-surface ocean thermal energy during the intensification phase. The reduced surface cooling sustains stronger air–sea enthalpy fluxes and maintains elevated boundary-layer moist static energy, reinforcing the thermodynamic support for continued RI. Comparative experiments further demonstrate that salinity-controlled modulation of upper-ocean mixing governs the surface thermal response, whereas the associated enhancement of sea surface temperature and latent heat flux acts mainly as a positive feedback that reinforces storm convection.

How to cite: Mo, H. and Su, H.: Influence of Ocean Salinity on Tropical Cyclone Intensification in the Western North Pacific, EGU General Assembly 2026, Vienna, Austria, 3–8 May 2026, EGU26-15948, https://doi.org/10.5194/egusphere-egu26-15948, 2026.

EGU26-16193 | ECS | Posters on site | AS1.26

The Role of Convectively Coupled Equatorial Waves on the Intensity of Extreme Precipitation Events Over the West Coast of India 

Prajwal Koovekallu, Ajil Kottayil, Prince Xavier, and Aurélien Podglajen

This study attempts to understand how convectively coupled equatorial waves (CCEWs) can modulate extreme rainfall events along the west coast of India during different seasons. The waves are filtered from Outgoing Longwave Radiation (OLR), and their impact on extreme precipitation events is explored. The results show that CCEWs significantly amplify rainfall extremes over the west coast, with Rossby waves having the highest impact, followed by Mixed Rossby-Gravity (MRG) and Kelvin waves. The amplification in rainfall is largely driven by wave-induced enhancement in moisture convergence and the formation of large deep convective cloud systems. The CCEWs are also observed increasing likelihood of extreme events, with Rossby and MRG waves being the main contributors. These results advance our understanding of processes that can trigger extreme rainfall along the west coast and emphasise the potential to improve their forecasts by using the filtered equatorial wave activity.

How to cite: Koovekallu, P., Kottayil, A., Xavier, P., and Podglajen, A.: The Role of Convectively Coupled Equatorial Waves on the Intensity of Extreme Precipitation Events Over the West Coast of India, EGU General Assembly 2026, Vienna, Austria, 3–8 May 2026, EGU26-16193, https://doi.org/10.5194/egusphere-egu26-16193, 2026.

EGU26-16691 | ECS | Orals | AS1.26

Mid-level longwave heating accelerates tropical cyclogenesis: insights from ML-informed WRF simulations 

Frederick Iat-Hin Tam, James Ruppert, and Tom Beucler

Evidence from idealized and real-case modeling suggests that the longwave (LW) component of the cloud-radiative feedback (CRF) is fundamental to tropical cyclogenesis (TCG), accelerating a ~5-day process by multiple days in idealized studies. However, existing CRF mechanism-denial frameworks - such as spatial homogenization of radiative heating or utilizing “cloud-transparent” radiative schemes - preclude counterfactual analysis on how TCG efficiency is affected by specific radial and vertical structures of CRF, which is determined by the distribution of different cloud types in the TC. 


To address whether an “optimal LW CRF pattern” that maximizes TCG efficiency exists, we developed an ML-informed WRF modeling framework that enables counterfactual experiments by adding an external 3D, ML-discovered, heat forcing to the total heating tendency returned by the RRTMG longwave radiation scheme. Physics-informed inverted LASSO regressions, trained on a WRF ensemble on Typhoon Haiyan (2013), isolate an “optimal LW perturbation” in the form of inner-core mid-level heating. which is strikingly different from a longwave perturbation that maximizes near the cloud top obtained with simple data analysis (2-day azimuthal mean).


We conduct a series of pattern-perturbation experiments to validate this data-driven proposed “optimal CRF pattern”: the ML-discovered mid-level perturbation accelerates the intensification of Haiyan more efficiently than an empirical 2-day mean upper-level LW perturbation. Changes in vertical velocity precede changes in precipitation characteristics in the perturbation experiments, establishing a causal chain from CRF to intensity change. The mid-level-heating runs exhibit higher inner-core stratiform fractions, more intense convective bursts, stronger mid-level vorticity, and lower mean sea-level pressure. These results demonstrate that ML can serve as an objective hypothesis generator, reducing the scientific search space and facilitating efficient data-driven discovery of the structural drivers to TCG.

How to cite: Tam, F. I.-H., Ruppert, J., and Beucler, T.: Mid-level longwave heating accelerates tropical cyclogenesis: insights from ML-informed WRF simulations, EGU General Assembly 2026, Vienna, Austria, 3–8 May 2026, EGU26-16691, https://doi.org/10.5194/egusphere-egu26-16691, 2026.

The Maritime Continent is a complex system of islands—often with significant topography, deep oceans, and shallow seas—located in the heart of the Indo-Pacific warm pool. The region is characterized by very high average daily precipitation, strongly modulated by a pronounced diurnal cycle. Precipitation variability in the Maritime Continent, influenced by subseasonal, seasonal, and interannual modes, has long been of interest to the research community, as it can easily lead to extreme precipitation events. However, the observational network over the region is sparse, and coherent datasets capable of assessing the physical properties of the atmosphere are limited, particularly on diurnal timescales.

An example of this complex interaction can be found in Sumatra, where the diurnal evolution of convection and precipitation is characterized by two modes. Convective clouds begin developing before noon along the western, upwind slopes of the Barisan Mountains; they grow and move inland during the afternoon, advected by the mean flow in the lower to middle troposphere. However, there is also propagation in the opposite direction: offshore, upwind-moving squall lines that produce an offshore precipitation maximum throughout the evening and night. This local variability is strongly modulated by large-scale circulation variability, which in turn affects precipitation over the island. Several physical mechanisms have been proposed to explain the offshore progression of precipitating cloud systems on diurnal timescales, but these have been based primarily on high-resolution numerical modeling. Due to the lack of observational data these mechanisms remain poorly constrained.

The aim of the Barisan–Anai Meteorological Network (BAM-Net) is to fill this observational gap by providing consistent, long-term near-surface meteorological data (pressure, temperature, humidity, horizontal winds, and rainfall), as well as cloud cover and column-integrated water vapor. To date, the dataset spans over one full year of observations collected across five stations along the Anai Valley, between the Indian Ocean coast and the first mountain pass across the Barisan Mountains at 1000 m ASL. This dataset provides a unique opportunity to continuously monitor the diurnal cycle of near-surface atmospheric properties and to assess its variability associated with seasonal, intraseasonal, synoptic, and mesoscale circulations.

In this submission, BAM-Net observations are used to study variability in the diurnal cycle from day-to-day up to seasonal timescales across the five locations, focusing on November 2025 period, when unprecedented extreme precipitation event span across west and north Sumatra and southern part of Malay peninsula, associated with development of a rare near-equatorial Tropical Cyclone Senyar in Malakka Strait. This high impact event caused over 1000 fatalities, vast devastation of civil infrastructure and personal property. BAM-Net stations in West Sumatra show precipitation accumulation exceeding 1000 mm of rain in 10 days, and indicate even higher rainfall amounts in the north and north-east part of the island. BAM-Net observations provide unique insight into event’s dynamics in the up-wind slope region, including spatio-temporal variability across region and within it. This type of observations can be used in process studies of extreme events as well as high resolution model validation.

How to cite: Baranowski, D., Marzuki, M., and Baldysz, Z.: Extreme precipitation event in November 2025 in Sumatra observed with high resolution in-situ observations from BAM-Net, EGU General Assembly 2026, Vienna, Austria, 3–8 May 2026, EGU26-17740, https://doi.org/10.5194/egusphere-egu26-17740, 2026.

EGU26-18087 | ECS | Orals | AS1.26

Initial Structure and Downstream Evolution of Caribbean Developing African Easterly Waves 

Alexis Wilson, Sharanya Majumdar, Will Downs, Jonathan Zawislak, and Jason Dunion

While African easterly waves (AEWs) are a common precursor to tropical cyclogenesis in the Atlantic basin, the majority of AEWs weaken and fail to develop upon departing Africa. Despite this, prior research has found that AEWs that undergo genesis in the Caribbean are on average drier and weaker when first departing Africa than AEWs that develop in the open Atlantic, closer to Africa. In this study, we investigate the initial structure and evolution of Caribbean developing AEWs and how they differ from non-developing and open Atlantic developing AEWs. 

Caribbean developing AEWs and non-developing AEWs that reached the Caribbean were identified from 1996 to 2024 using the AEW tracking algorithm developed by Downs et al. (2025). Using ECMWF Reanalysis v5 (ERA5) data, we found that Caribbean developing AEWs had statistically significant low-level northerly wind anomalies and mid-level easterly wind anomalies when first departing Africa compared to non-developing cases. While open Atlantic developing AEWs have been shown to be significantly moister with stronger low- to mid-level relative vorticity and anomalously warm upper-level temperatures compared to non-developing cases, these favorable anomalies were not statistically significant in Caribbean AEWs until around 40°W. Although not initially as favorable for genesis, Caribbean developing AEWs were, on average, able to avoid the initial significant weakening observed in non-developing cases over the eastern Atlantic and were therefore better able to take advantage of a more favorable downstream environment and strengthen before eventually undergoing genesis in the Caribbean.

How to cite: Wilson, A., Majumdar, S., Downs, W., Zawislak, J., and Dunion, J.: Initial Structure and Downstream Evolution of Caribbean Developing African Easterly Waves, EGU General Assembly 2026, Vienna, Austria, 3–8 May 2026, EGU26-18087, https://doi.org/10.5194/egusphere-egu26-18087, 2026.

EGU26-18118 | ECS | Orals | AS1.26

Deterministic chaotic behavior in the propagation of the Madden-Julian oscillation 

Daisuke Takasuka, Tamaki Suematsu, Hiroaki Miura, and Masuo Nakano

The Madden–Julian oscillation (MJO) is a planetary-scale tropical weather disturbance marked by eastward propagating cumulus cloud clusters over the Indo-Pacific region, causing severe weather and climate events worldwide. The mechanism and predictability of MJO propagation remain elusive, partly because relevant multi-scale processes are poorly understood. Here, we reveal chaotic MJO propagation arising from cross-scale nonlinear interactions, based on 4,000-member ensemble simulations of two MJO events in November and December, 2018, using the Nonhydrostatic Icosahedral Atmospheric Model (NICAM) at 14-km horizontal resolutions. Against conventional linear MJO theories, multiple regimes with distinct timings of MJO propagation emerge under a single atmosphere-ocean background in December. The emergence of regime bifurcation depends critically on the equatorial asymmetry of climatological sea surface temperature, mainly regulated by the seasonal march. Selection of the bifurcated regimes is probabilistic, influenced by whether tropical-extratropical interplay promotes moistening associated with westward-propagating tropical waves over the western Pacific. Specifically, this regime distinction is rooted in differences in MJO-related upper-tropospheric westerly strengths over the western Pacific when MJO convection is located in the Indian Ocean, affecting the degree of the extratropical Rossby-wave refraction that can interefere with the tropical waves. These results contribute to a more complete MJO conceptual model and help foresee when coherent MJO propagation emerges.

How to cite: Takasuka, D., Suematsu, T., Miura, H., and Nakano, M.: Deterministic chaotic behavior in the propagation of the Madden-Julian oscillation, EGU General Assembly 2026, Vienna, Austria, 3–8 May 2026, EGU26-18118, https://doi.org/10.5194/egusphere-egu26-18118, 2026.

EGU26-20305 | ECS | Posters on site | AS1.26

Recent changes in tropical cyclone rainfall over China 

Shifei Tu, Shunqi Zeng, Quanjia Zhong, and Jianjun Xu

The increasing impact of tropical cyclone (TC) rainfall underscores the need to understand regional variations in its spatial distribution. Using high-resolution satellite precipitation data from 1998-2023, this study investigates changes in the spatial inhomogeneity of TC rainfall across China. Results show that TC rainfall inhomogeneity decreases significantly by about 65%, indicating a reduced rainfall in historically high-TC-rainfall areas and an increase in low-TC-rainfall areas. Regionally, this decline is mainly governed by the intra‐regional component in East China, where opposing trends between high- and low-rainfall areas have substantially reduced spatial disparities. In contrast, North China shows a marked increase in TC rainfall, accompanied by increased intra‐regional but decreased inter‐regional inhomogeneity, largely offsetting each other. Other regions exhibit minor or insignificant contributions. These spatial reorganizations of TC rainfall in East and North China are closely linked to the northward migration of TC activity in recent decades, driven by reduced landfalling TCs over Taiwan and Fujian and increased inland penetration of TCs into East and North China. The findings reveal a restructuring of TC rainfall patterns and emphasize the growing regional contrasts in TC‐related hydroclimatic impacts, providing new insights for disaster risk assessments and regional climate adaptation strategies in China.

How to cite: Tu, S., Zeng, S., Zhong, Q., and Xu, J.: Recent changes in tropical cyclone rainfall over China, EGU General Assembly 2026, Vienna, Austria, 3–8 May 2026, EGU26-20305, https://doi.org/10.5194/egusphere-egu26-20305, 2026.

EGU26-20410 | Posters on site | AS1.26

A significant drop in tropical cyclones’ lifespan in the Pacific over the past 40 years 

Kuilin Zhu, Hui Su, and Chengxing Zhai

Tropical cyclones (TCs) are among the most damaging weather systems, making it essential to understand how their characteristics evolve over time. While long-term variations in TC track and intensity have been widely examined, long-term trends in their lifespans remain poorly quantified. Using observational data from 1982 to 2024, we show that the annual mean duration of TCs has decreased significantly at a rate of -14.6±5.3 and -7.1±5.8 hours per decade, corresponding to total reductions of approximately 63 and 31 hours, in the Eastern and Western Pacific, respectively. Over the same period, TCs exhibit faster intensification on average prior to reaching their lifetime maximum intensity, followed by more rapid weakening afterward. These changes likely reflect the combined influence of evolving large-scale environmental conditions and modifications in TC internal convective processes. The shorter TC lifespan over the open ocean before entering coastal zones poses greater challenges for weather forecasting and disaster preparedness.

How to cite: Zhu, K., Su, H., and Zhai, C.: A significant drop in tropical cyclones’ lifespan in the Pacific over the past 40 years, EGU General Assembly 2026, Vienna, Austria, 3–8 May 2026, EGU26-20410, https://doi.org/10.5194/egusphere-egu26-20410, 2026.

Tropical cyclone (TC) translation is governed by large-scale environmental steering and by the interaction between the vortex circulation and the planetary vorticity gradient (β-effect). This interaction generates asymmetric secondary gyres that induce a systematic poleward and westward drift (β-drift), which can persist even under weak steering and substantially modify TC trajectories. Despite its recognized dynamical importance, β-drift remains poorly quantified over the Indian Ocean and is rarely treated explicitly in operational track prediction systems. In this research, we present a basin-wide assessment of β-effect–induced TC drift over the Indian Ocean during pre-monsoon and post-monsoon seasons. Zonal and meridional winds and relative vorticity from ERA5 reanalysis at 850–200 hPa are collocated with IBTrACS best-track data to compute vertically averaged environmental steering velocities. Residual translation vectors, obtained by removing the steering component from observed TC motion, are interpreted as β-drift within a barotropic dynamical framework. The analysis reveals a statistically significant increase in β-drift magnitude with latitude, consistent with planetary vorticity gradient control. A non-linear regression model applied to multi-storm residual motion identifies dominant predictors of β-drift and yields an empirical parameterization of β-effect–induced translation for Indian Ocean cyclones. The results demonstrate that β-drift contributes substantially to TC motion variability, particularly under weak-steering regimes, and represents a systematic source of track forecast error. Incorporating this parameterization into forecast systems offers a pathway to improve operational TC track predictability over the Indian Ocean.

Keywords: Indian Ocean, Tropical Cyclones, β-Drift, Track Predictability, Weak Steering Flow, ERA5 Reanalysis

How to cite: Anoop, A. and c., S.: Quantifying β-Effect–Induced Drift of Tropical Cyclones over the Indian Ocean and Its Implications for Track Forecasting , EGU General Assembly 2026, Vienna, Austria, 3–8 May 2026, EGU26-20987, https://doi.org/10.5194/egusphere-egu26-20987, 2026.

EGU26-21161 | ECS | Posters on site | AS1.26

Elucidation of Indian Summer Monsoon: Impact of “ASHOBAA” and “KOMEN” 

Dr. Ishita Sarkar, Dr. Habibur rahaman Biswas, Dr. Jayanti Pal, Biplob Sana, and Dr. Sutapa Chaudhuri

Tropical Cyclones Ashobaa and Komen over the North Indian Ocean in 2015 represent a rare and remarkable event that formed during the monsoon season, making their occurrences uncommon. Ashobaa developed over the Arabian Sea during the transition phase, just prior to monsoon onset, while Komen formed over the Bay of Bengal during the active monsoon phase. Notably, Komen was the first system during the monsoon month of July to intensify into a cyclonic storm during the active monsoon period in the past 25 years.

The current study investigates the ocean-atmospheric conditions that facilitated the genesis and intensification of these systems into cyclonic storms. The associated dynamic and thermodynamic characteristics during their formation and evolution are analyzed to elucidate their interaction with the monsoon circulation. Our analysis reveals that warm sea surface temperature anomalies and weak surface winds over the northern Arabian Sea provided conducive conditions for the genesis of cyclonic storm Ashobaa, despite forming during the monsoon onset phase. The intensification of Ashobaa was aided by low vertical wind shear, high tropical cyclone heat potential, and enhanced moisture availability. These favorable conditions enabled the monsoon vortex to intensify unusually into cyclone Ashobaa. On the other hand, oceanic influence was comparatively weaker during the active monsoon phase. The evolution of cyclonic storm Komen was primarily driven by high low-level relative vorticity, enhanced moisture convergence, and a gradual increase in surface wind energy over the Bay of Bengal. Although both cyclones developed under low to moderate wind shear, their genesis and intensification processes were different. The 2015 monsoon variability over the North Indian Ocean was modulated by Komen through enhanced atmospheric forcing and monsoon–land interactions, whereas Ashobaa was largely driven by the oceanic parameters. The vital role of the ocean surface and the subsurface in the genesis and the intensification highlights the importance of incorporating accurate ocean initial conditions (surface and sub-surface) in the operational cyclone forecasting framework.

How to cite: Sarkar, Dr. I., Biswas, Dr. H. R., Pal, Dr. J., Sana, B., and Chaudhuri, Dr. S.: Elucidation of Indian Summer Monsoon: Impact of “ASHOBAA” and “KOMEN”, EGU General Assembly 2026, Vienna, Austria, 3–8 May 2026, EGU26-21161, https://doi.org/10.5194/egusphere-egu26-21161, 2026.

Tropical cyclones (TCs) making landfall in China from 2008 to 2016 were grouped into three clusters based on landfall location and movement. The first two clusters made landfall in Southeast China (SEC), moving either northward or westward/northwestward, while the third cluster made landfall in Southern China (SC) and moved westward or northwestward. A statistical analysis examined differences in precipitation distribution and influencing factors. This analysis utilized data from the China Meteorological Administration (CMA) tropical cyclone database, ECMWF ERA-Interim reanalysis data, and CMORPH (Climate Prediction Center Morphing Technique) precipitation data, derived from both station observations and satellite retrievals. The findings reveal significant differences between strong (more intense than a tropical storm) and weak (less intense than a tropical storm) TCs in different clusters. Strong TCs in first cluster (SECstrong) cause heavy rainfall areas to shift farther north, particularly in Jiangsu Province, with extreme rainfall occurring in the inner rainbands in a relatively symmetrical pattern. Conversely, rainfall from SEC-weak TCs is markedly asymmetric, concentrated in the inner regions and predominantly to the south of the middle rainbands. For SC-weak TCs, intense precipitation is primarily located in the southwest quadrant. This analysis highlighted significant differences in the positioning of the South Asian High (SAH), the intensity of vertical wind shear (VWS), and the characteristics of moisture convergence zones. Differences are also evident in their vertical structures, including variations in warm-core intensity, radial vertical motion, the asymmetric distribution of convergence and divergence fields, and instability conditions. Similarly, SC-strong and SC-weak TCs differ in the positioning of the 500 hPa subtropical high and the distribution of integrated atmospheric precipitable water (PW).

How to cite: Yan, L.: Composite analysis of the rainfall distribution caused by strong and weak landfalling tropical cyclones over the China Mainland, EGU General Assembly 2026, Vienna, Austria, 3–8 May 2026, EGU26-21966, https://doi.org/10.5194/egusphere-egu26-21966, 2026.

EGU26-11 | ECS | Posters on site | AS1.27

Causal inference and mediation for summer precipitation over middle and lower reaches of the Yangtze River 

Yuheng Tang, Wenting Hu, Anmin Duan, and Die Hu

The accurate attribution of summer precipitation in the middle and lower reaches of the Yangtze River (MLYR) is essential for operational forecasting and disaster prevention. However, traditional linear correlation methods are insufficient for capturing reliable causal linkages, making causal discovery algorithms a more appropriate solution. Causal effect measures suggest that tropical climate anomalies exert strong driving and mediating influences during boreal summer, while the Asian climate anomalies exhibit greater sensitivity. Causal analysis identifies seven direct drivers of MLYR precipitation: pressure anomalies over northwest Pacific, Northeast Asia, mid-latitude eastern Pacific, Ural Mountains, southwest Pacific, Scandinavia and Greenland. Additionally, we uncovered the further causal pathways linking MLYR precipitation with tropical Pacific and Antarctic Oscillation signals. These results identify the detailed mediations through the direct drivers of MLYR precipitation, which are crucial to capture its remote precursors. Our findings reveal the physical attributions of MLYR precipitation from the global climate, which may improve its operational prediction skills, and even broaden the precursors of East Asian summer monsoon.

How to cite: Tang, Y., Hu, W., Duan, A., and Hu, D.: Causal inference and mediation for summer precipitation over middle and lower reaches of the Yangtze River, EGU General Assembly 2026, Vienna, Austria, 3–8 May 2026, EGU26-11, https://doi.org/10.5194/egusphere-egu26-11, 2026.

EGU26-172 | ECS | Posters on site | AS1.27

Understanding Future changes in Semi-Permanent Systems and associated Rainfall during the Indian Summer Monsoon 

Sripathi Gollapalli, Krishna Kishore Osuri, Koteswararao Kundeti, and Suryachandra Rao Anguluri

This study employs Coupled Model Intercomparison Project Phase 6 (CMIP6) simulations to assess how large-scale semi-permanent systems of Indian Summer Monsoon (ISM) change in future under varying greenhouse gas emission scenarios. Eight CMIP6 models are analyzed for three Shared Socioeconomic Pathways (SSP1-2.6, SSP2-4.5, and SSP5-8.5) across two future periods: near future (2031-2060) and far future (2071-2100). Model evaluation shows that MCM-UA-1-0 and MIROC-ES2L capture ISMR variability more realistically, whereas ACCESS-CM2 and CanESM5-CanOE exhibit dry biases. Projections indicate an overall intensification of ISMR with increasing emissions, most pronounced under SSP5-8.5. Dynamic responses reveal a strengthening and equatorward shift of the Subtropical Westerly Jet (SWJ), a weakening and southward displacement of the Tropical Easterly Jet (TEJ), and a poleward shift of the Low-Level Jet (LLJ) from the near- to far-future period. Thus, the meridional wind shear weakens while zonal shear strengthens, modifying monsoon dynamics in higher emission scenarios. Teleconnection analysis indicates a persistently negative ENSO-ISMR relationship, while DMI-ISMR and NAO-ISMR linkages intensify under higher emission scenarios. In accordance with these changes, the Central and South Peninsular India would be experiencing more rainfall, particularly in September, but a noticeable decrease is noted in Northeast India rainfall. These findings highlight the future changes in synoptic conditions and rainfall of the ISM over homogeneous regions.

How to cite: Gollapalli, S., Osuri, K. K., Kundeti, K., and Anguluri, S. R.: Understanding Future changes in Semi-Permanent Systems and associated Rainfall during the Indian Summer Monsoon, EGU General Assembly 2026, Vienna, Austria, 3–8 May 2026, EGU26-172, https://doi.org/10.5194/egusphere-egu26-172, 2026.

EGU26-683 | Orals | AS1.27

Wetting Asian monsoon and drying American monsoon under global warming: Mechanism of zonal asymmetric responses 

Chao He, Tianjun Zhou, Tim Li, Wen Zhou, Xiaolong Chen, Fred Kucharski, Ziqian Wang, and Fengfei Song

   Climate model projections reveal zonally asymmetric changes in monsoon rainfall under global warming. American Monsoon rainfall decreases substantially, primarily due to a pronounced weakening of upward air motion, whereas Asian monsoon rainfall generally increases as a result of enhanced atmospheric moisture and minor changes in vertical motion.

   Using abrupt CO2-quadrupling experiments, we separate the impacts of direct radiative forcing from those mediated by sea surface temperature (SST) changes. First, because the Eastern Hemisphere is dominated by large landmasses while the Western Hemisphere is dominated by oceans, an increase in atmospheric CO2 can alter large-scale circulation and suppress upward air motion over tropical America, in particular the North American monsoon region. Second, SST warming exhibits a characteristic pattern with amplified warming over the equatorial Pacific relative to the tropical mean warming, and the increase of latent heating over equatorial Pacific induces a Gill-type atmospheric circulation response, suppressing convection and rainfall over tropical American sector. Third, global warming substantially strengthens summertime latent heating over the Tibetan Plateau, and the enhanced heating counteracts the weakening tendency of the Asian monsoon circulation. Therefore, Asian monsoon rainfall changes are dominated by increasing moisture content, while American monsoon rainfall changes are dominated by weakening monsoon circulation.

   These three mechanisms exhibit distinct spatial controls: the first operates at planetary scale and affects both the Asian and American monsoon regions, while the second and third primarily govern changes in the American and Asian monsoons, respectively. The magnitude of equatorial Pacific warming is strongly linked to the historical zonal SST gradient in the tropical Pacific; however, the systematic model bias toward a too-weak historical SST gradient may lead to an underestimation of future drying over the American monsoon regions. Observation-constrained projections suggest that the magnitude of tropical American drying could be up to 1.6 times larger than indicated by raw model projections.


References

[1] He C, Wang Z, Zhou T, Li T (2019) Enhanced Latent Heating over the Tibetan Plateau as a Key to the Enhanced East Asian Summer Monsoon Circulation under a Warming Climate. J Climate 32 (11):3373-3388.

[2] He C, Li T, Zhou W (2020) Drier North American Monsoon in Contrast to Asian–African Monsoon under Global Warming. J Climate 33 (22):9801-9816.

[3] He C, Zhou W (2020) Different Enhancement of the East Asian Summer Monsoon under Global Warming and Interglacial Epochs Simulated by CMIP6 Models: Role of the Subtropical High. J Climate 33 (22):9721-9733.

[4] He C, Zhou T (2022) Distinct Responses of North Pacific and North Atlantic Summertime Subtropical Anticyclones to Global Warming. J Climate 35 (24):4517-4532.

[5] He C, Chen X, Zhou T, Kucharski F, Song F (2025) Drying tropical America under global warming: Mechanism and emergent constraint. Geophys Res Lett. (Under 2nd round review)


How to cite: He, C., Zhou, T., Li, T., Zhou, W., Chen, X., Kucharski, F., Wang, Z., and Song, F.: Wetting Asian monsoon and drying American monsoon under global warming: Mechanism of zonal asymmetric responses, EGU General Assembly 2026, Vienna, Austria, 3–8 May 2026, EGU26-683, https://doi.org/10.5194/egusphere-egu26-683, 2026.

EGU26-1105 | ECS | Posters on site | AS1.27

QBW Dynamics and Multiscale Interactions in Contrasting Indian Summer Monsoon Years 

Alice Jeeva P J, Sarvesh Kumar Dubey, and Sukumaran Sandeep

Previous studies have extensively examined the intraseasonal and synoptic-scale variability of the Indian summer monsoon, but the Quasi-Biweekly (QBW) mode remains less explored. This study investigates the key modes of subseasonal variability in the homogeneous rainfall regions of India over the past 73 summer monsoon seasons, with a particular focus on the QBW scale. By analysing scale energetics in the frequency domain, the study finds that QBW variability over Northeast India is mainly driven by Rossby wave-like atmospheric disturbances from the Western North Pacific (WNP), which are triggered by diabatic heating and the resulting generation of available potential energy. The strength of QBW variability varies significantly between different monsoon years, with stronger variability during deficit monsoons and weaker variability during excess monsoons. The enhanced (or reduced) available potential energy over the WNP during deficit (or excess) monsoons is responsible for the stronger (or weaker) QBW activity. Wave–wave interactions are identified as the primary mechanism for the formation and propagation of QBW oscillations, while mean–wave interactions play a secondary role, though with contrasting effects over the Indian monsoon region. The interaction between QBW, intraseasonal oscillations, and synoptic systems reveals a multiscale exchange of kinetic energy that impacts the formation and clustering of low-pressure systems over the Bay of Bengal. These findings underscore the significant role of QBW-scale dynamics in shaping the variability and extremes of the Indian summer monsoon.

How to cite: Jeeva P J, A., Dubey, S. K., and Sandeep, S.: QBW Dynamics and Multiscale Interactions in Contrasting Indian Summer Monsoon Years, EGU General Assembly 2026, Vienna, Austria, 3–8 May 2026, EGU26-1105, https://doi.org/10.5194/egusphere-egu26-1105, 2026.

EGU26-1289 | ECS | Posters on site | AS1.27

A Monsoon Bridge Across Continents: Untangling the Strengthening Link Between Indian and Sahel Rainfall 

Abhishek Bordoloi, Arindam Chakraborty, and Ravi S Nanjundiah

Monsoons, although embedded within the large-scale Intertropical Convergence Zone, exhibit distinct regional dynamics. Two major components viz Indian Summer Monsoon and Sahelian Summer Monsoons display substantial interannual variability that affects a significant part of the world’s population. Thus, understanding how these systems interact is essential for the predictability both at the intraseasonal and interannual timescales. 

In this study, we combine observational datasets and reanalysis products to investigate a dynamical pathway that couples the two Monsoon systems. We also analyze the strength of this coupling in a changing climate. Our analysis suggests that the Indian Monsoon Rainfall (IMR) and Sahelian Monsoon Rainfall (SMR) have become coupled in recent decades (1985–2020), showing a much stronger interannual relationship than during 1950–1984. This enhanced coupling is closely linked to large-scale dynamical changes, particularly those associated with the African Easterly Jet (AEJ). 

The coupling between the two systems is governed by the intraseasonal convective disturbances that originate over Northern India and propagate westwards and reach Sahel roughly two weeks later, enhancing moist convection and rainfall anomalies. A defining feature of these westward-propagating intraseasonal disturbances is their coherent potential vorticity (PV) core in the mid-troposphere, which collocates with the core of the AEJ in the mid-troposphere. This alignment of the PV core with the AEJ core dynamically traps these waves along the AEJ and thus results in a coherent wave propagation.  

In the recent decades, the AEJ has strengthened due to an increased meridional temperature gradient, thus the propagation of these waves from Indian region to Sahel have become more effective thereby contributing to the observed strengthening of the two large scales Monsoons. 

How to cite: Bordoloi, A., Chakraborty, A., and Nanjundiah, R. S.: A Monsoon Bridge Across Continents: Untangling the Strengthening Link Between Indian and Sahel Rainfall, EGU General Assembly 2026, Vienna, Austria, 3–8 May 2026, EGU26-1289, https://doi.org/10.5194/egusphere-egu26-1289, 2026.

EGU26-1399 | ECS | Posters on site | AS1.27

Contrasting Effects of Aerosols and Greenhouse Gases on Subseasonal Variability of the Indian Summer Monsoon 

Sanya Narbar, Sandeep Sukumaran, and Dilip Ganguly

Subseasonal variability strongly influences the seasonal mean and spatial distribution of rainfall in the Indian Summer Monsoon (ISM). While the late-twentieth-century weakening of ISM precipitation has been widely attributed to anthropogenic aerosols, their effects on subseasonal variability remain less well understood. Using single-forcing and all-forcing simulations from the Coupled Model Intercomparison Project Phase 6 (CMIP6) Detection and Attribution Model Intercomparison Project (DAMIP), this study investigates how aerosol and greenhouse gas (GHG) forcings modify monsoon variability across synoptic and intraseasonal timescales. Results show that aerosols and GHGs exert opposing influences: aerosol forcing suppresses convection, reduces low pressure system (LPS) rainfall intensity by about eight percent, and weakens the 25–90-day monsoon intraseasonal oscillation (MISO), whereas GHG forcing enhances moisture availability and amplifies both LPS-related and intraseasonal rainfall by roughly six percent. These contrasting effects are consistent with associated changes in vertically integrated moisture flux convergence, with aerosols diminishing oceanic moisture inflow and GHGs strengthening it. The combined historical forcing produces a nonlinear response, indicating interactions between radiative and dynamic feedback that cannot be explained by a linear superposition of individual forcings. The findings suggest that aerosols suppress subseasonal rainfall variability, while GHGs amplify it through thermodynamic and moisture feedback. Understanding these competing influences is critical for interpreting past monsoon trends and projecting future variability under evolving aerosol mitigation and greenhouse gas emission pathways. 

How to cite: Narbar, S., Sukumaran, S., and Ganguly, D.: Contrasting Effects of Aerosols and Greenhouse Gases on Subseasonal Variability of the Indian Summer Monsoon, EGU General Assembly 2026, Vienna, Austria, 3–8 May 2026, EGU26-1399, https://doi.org/10.5194/egusphere-egu26-1399, 2026.

EGU26-2130 | Posters on site | AS1.27

Fading influence of El Niño-Southern Oscillation on East Asian Summer Monsoon Northern Boundary after the late-1980s 

Zixuan Ren, Wen Chen, Shangfeng Chen, Zhibiao Wang, and Lin Wang

This study reveals that the linkage between the El Niño-Southern Oscillation (ENSO) and the northern boundary of the East Asian summer monsoon (EASM) has experienced a marked interdecadal weakening since the late 1980s. We further explore the underlying mechanisms of this interdecadal transition, emphasizing the role of Indian Ocean sea surface temperature (SST) anomalies. Before the late-1980s, ENSO-induced warming of the Indian Ocean—driven by atmospheric teleconnections and ocean-atmosphere interaction­­­—­­suppressed Indian summer monsoon rainfall (ISMR) via enhanced convective heating and a strengthened Hadley circulation. The resulting decrease in ISMR triggered a negative-phase Silk Road Pattern (SRP), leading to a southward shift of the EASM northern boundary and a decline in precipitation over the monsoon transition zone. After the late 1980s, concurrent cold SST anomalies in the tropical North Atlantic suppressed the ENSO-driven Indian Ocean warming by enhancing easterly winds, increasing cloud cover, and reducing downward shortwave radiation. This weakened the associated Hadley circulation and SRP response, thereby diminishing the influence of ENSO on the monsoon boundary. The proposed mechanism is further supported by numerical experiments conducted with the atmospheric general circulation model.

How to cite: Ren, Z., Chen, W., Chen, S., Wang, Z., and Wang, L.: Fading influence of El Niño-Southern Oscillation on East Asian Summer Monsoon Northern Boundary after the late-1980s, EGU General Assembly 2026, Vienna, Austria, 3–8 May 2026, EGU26-2130, https://doi.org/10.5194/egusphere-egu26-2130, 2026.

EGU26-2136 | ECS | Posters on site | AS1.27

Evolving subseasonal impacts of the Western Pacific pattern on winter temperature over South Korea 

Suyeon Moon, Seul-Hee Im, OkYeon Kim, and Woo-Seop Lee

The Western Pacific (WP) pattern is a crucial driver of mid-latitude teleconnections in the Northern Hemisphere, strongly influencing East Asian winter temperatures. While its seasonal impacts are well established, its subseasonal variability and long-term changes remain less understood. This study identifies significant changes in the subseasonal influence of the WP pattern on surface temperature over South Korea since the mid-1990s using observational and reanalysis datasets. Our analysis reveals a significant shift in the WP teleconnection, with its influence strengthening in December but weakening in January and February. These changes are associated with an anomalous displacement of the WP-associated anticyclone and modulated by interactions with the Arctic Oscillation. Furthermore, seasonal forecast models from the Asia–Pacific Economic Cooperation Climate Center multi-model ensemble capture the WP-induced temperature variations in December; however, strong modulation by El Nino–Southern Oscillation inhibits the independent effect of the WP teleconnection. These findings highlight important deficiencies in current seasonal forecast models and emphasize the need for improved representations of WP teleconnections at subseasonal timescales. A refined understanding of winter temperature variability is essential for enhancing climate predictions, supporting climate adaptation strategies, and mitigating societal risks associated with increasing winter temperature variability in South Korea.

How to cite: Moon, S., Im, S.-H., Kim, O., and Lee, W.-S.: Evolving subseasonal impacts of the Western Pacific pattern on winter temperature over South Korea, EGU General Assembly 2026, Vienna, Austria, 3–8 May 2026, EGU26-2136, https://doi.org/10.5194/egusphere-egu26-2136, 2026.

EGU26-2763 | ECS | Orals | AS1.27

Can monsoon low pressure systems propagate even under reduced mean monsoon precipitation? 

Tresa Mary Thomas and Mankulam Sivaprasad

Monsoon low pressure systems (LPS) are synoptic scale disturbances that form over South Asia during the summer monsoon season and often produce extreme precipitation events, causing disastrous floods. Numerous modelling and observational studies have confirmed the role of convection as a major energy provider for the propagation of LPS. Here, using NCAR’s Community Earth System Model (CESM1.2.2), we investigate the major energy providers for LPS propagation under a reduced mean monsoon precipitation. Four simulations are performed in which the height of the Tibetan and Himalayan Orography (THO) is altered by 1.5, 1.0, 0.5, and 0.0 times its original height. Earlier studies have found a decrease in mean monsoon precipitation with a decrease in the height of THO. However, even with reduced precipitation and convective activity, the number, intensity, and lifetime of LPS are higher when the height of THO is decreased. Barotropic instability associated with the horizontal shear of mean meridional wind is found to increase with a decrease in height of THO, providing energy for LPS formation. However, in the later stages, horizontal advection of dry static energy (DSE) is found as the major energy source for LPS propagation. The decrease in height of THO leads to an increase in dry air intrusion into the Indian mainland and an increase in surface temperature. This leads to an increase in horizontal DSE advection, which in turn induces vertical motion and moistens the atmosphere to the west of LPS. The moist ascent over the west of LPS maintains the precipitation and leads to the intensification of LPS. This idealized study suggests that monsoon LPS can form and propagate in scenarios of reduced mean monsoon precipitation, potentially leading to extreme precipitation events even in drought years.

How to cite: Thomas, T. M. and Sivaprasad, M.: Can monsoon low pressure systems propagate even under reduced mean monsoon precipitation?, EGU General Assembly 2026, Vienna, Austria, 3–8 May 2026, EGU26-2763, https://doi.org/10.5194/egusphere-egu26-2763, 2026.

EGU26-2941 | ECS | Orals | AS1.27

Anatomy of moist heatwaves in India during the summer monsoon season 

Akshay Deoras, Andrew Turner, Dr Lekshmi S, Cathryn Birch, Ambrogio Volonté, Arathy Menon, Reinhard Schiemann, and Laura Wilcox

Moist heat impairs the human body’s ability to cool through sweat-based evaporative cooling, posing a serious health risk. In India, this risk is especially acute, since the Indian summer monsoon (ISM) brings abundant moisture, and socio-economic conditions significantly increase the exposure and vulnerability to moist heat. However, there is a limited understanding of the characteristics and large-scale drivers of moist heatwaves during the ISM. This study uses the ERA5 reanalysis to analyse moist heatwaves and their relationship with active and break periods of the ISM during 1940–2023. An empirical orthogonal function analysis of daily maximum wet-bulb temperature (Tw) anomalies reveals that the first two principal components (PCs) explain key patterns of variability of moist heatwaves, with PC1 controlling their occurrence and PC2 controlling their spatial extent. Whilst breaks in the monsoon favour moist heatwaves in eastern and peninsular India, active rainfall events, corresponding to phases 5–7 of the Boreal Summer Intraseasonal Oscillation, favour moist heatwaves in northern and northwestern India. Specific humidity plays a larger role than dry-bulb temperature in controlling Tw variability in India. The results of this study reveal important characteristics of moist heatwaves during the ISM and offer potential for developing forecasting tools, which could ultimately benefit stakeholders in India.

How to cite: Deoras, A., Turner, A., Lekshmi S, D., Birch, C., Volonté, A., Menon, A., Schiemann, R., and Wilcox, L.: Anatomy of moist heatwaves in India during the summer monsoon season, EGU General Assembly 2026, Vienna, Austria, 3–8 May 2026, EGU26-2941, https://doi.org/10.5194/egusphere-egu26-2941, 2026.

EGU26-3603 | ECS | Posters on site | AS1.27

Strengthening linkage between the Boreal Summer Intraseasonal Oscillation and extreme rainfall events over India 

Aditya Kottapalli, Vinayachandran Pn, and Ori Adam

Extreme rainfall events (EREs) over India are strongly influenced by the Boreal Summer Intraseasonal Oscillation (BSISO), yet how this relationship
has evolved in recent decades remains poorly understood. Using observational datasets and reanalysis from the past four decades, we examine the changes in BSISO characteristics in the recent past and their role in modulating EREs over the Indian monsoon region. We find a marked strengthening of BSISO-associated rainfall over central India (15N–25N), along with a spatially coherent increase in rainfall accumulation from EREs as well as in seasonal mean monsoon rainfall.

Our results suggest that these trends mainly stem from an increase in the number of active BSISO days. Increased BSISO activity creates a more favourable environment, which supports the occurrence and persistence of extreme rainfall. A dynamic-thermodynamic decomposition of the BSISO precipitation shows that the dynamic component, associated with the BSISO circulation, dominates the changes in precipitation. However, increased vertical velocity is limited to areas with increased background moisture, indicating a strong connection between dynamic forcing and thermodynamic conditions.

In summary, our findings highlight a linkage between BSISO variability and extreme rainfall in India over recent decades. The mechanisms we identified provide a physical framework for understanding observed changes in monsoon rainfall and offer insights into how intraseasonal variability might impact future monsoon extremes in the warming climate.

How to cite: Kottapalli, A., Pn, V., and Adam, O.: Strengthening linkage between the Boreal Summer Intraseasonal Oscillation and extreme rainfall events over India, EGU General Assembly 2026, Vienna, Austria, 3–8 May 2026, EGU26-3603, https://doi.org/10.5194/egusphere-egu26-3603, 2026.

EGU26-3634 | Posters on site | AS1.27

Atmospheric Stabilization Weakened Proto-Low-Level Jet over the IndianOcean during the Eocene Hothouse 

Kyung-Ja Ha, Pratik Kad, Sebastian Steinig, Agatha de Boer, Wing-Le Chan, David Hutchinson, Kaustubh Thirumalai, Daniel Lunt, Igor Niezgodzki, Anant Parekh, and Himadri Saini

The early Eocene represents one of the warmest periods in Earth’s history, with atmospheric CO₂ concentrations and global temperatures far higher than today. Studying this period offers a useful way to explore how monsoon systems behave under extreme greenhouse conditions. However, the markedly different paleogeography, including altered land–sea distributions and the absence of the Himalayas, makes direct comparison with the modern monsoon challenging. Here, we examine the behavior of low-level monsoonal circulation over the Indian Ocean during the early Eocene using five climate model simulations from the Deep-time Model Intercomparison Project (DeepMIP). All simulations show a coherent monsoon-like circulation, indicating that a proto-monsoon system existed during this warm climate state. We further identify low-level jet structures aligned with paleotopographic features over the Eastern African Rift and the Deccan Plateau, which we refer to as the Proto-LLJ. Despite enhanced land–sea temperature contrasts under elevated CO₂, the strength of the Proto-LLJ weakens across the simulations. This contrasts with present-day behavior, where a stronger land–sea contrast is often linked to intensified or poleward-shifted monsoon jets. Our results indicate that CO₂-driven warming leads to increased tropical atmospheric stability, reduced vertical temperature gradients, and weaker convective overturning. As a result, the vertical motion needed to sustain strong low-level monsoon winds is suppressed. These findings suggest that in very warm climates, increased atmospheric stability can outweigh thermal forcing and lead to weaker monsoonal circulation, highlighting a key control on paleo-monsoon dynamics under extreme greenhouse conditions.

How to cite: Ha, K.-J., Kad, P., Steinig, S., Boer, A. D., Chan, W.-L., Hutchinson, D., Thirumalai, K., Lunt, D., Niezgodzki, I., Parekh, A., and Saini, H.: Atmospheric Stabilization Weakened Proto-Low-Level Jet over the IndianOcean during the Eocene Hothouse, EGU General Assembly 2026, Vienna, Austria, 3–8 May 2026, EGU26-3634, https://doi.org/10.5194/egusphere-egu26-3634, 2026.

EGU26-3819 | ECS | Orals | AS1.27

Explaining how SST patterns influence monsoon interannual variability using a moist static energy framework 

Juan Pablo Garcia Valencia, Chris Holloway, Andrew Turner, and Lorenzo Tomassini

Sea surface temperature (SST) patterns strongly influence tropical convection, large-scale circulation, and the global energy balance. Yet, the physical mechanisms linking SST patterns to monsoon variability remain insufficiently understood, particularly from an energetic perspective. This study aims to understand how SST patterns, particularly those related to the El Niño Southern Oscillation (ENSO), have influenced Northern Hemisphere monsoons using a subcloud moist static energy (MSE) framework. Utilising 6-hourly ERA5 reanalysis and GPCP precipitation data, we find that Northern Hemisphere monsoon systems exhibit significant negative regressions with boreal summer SST anomalies in the eastern equatorial Pacific, consistent with ENSO-driven variability. Removing the ENSO signal strengthens relationships with other SST patterns, including those over the Mediterranean and tropical North Atlantic for the West African monsoon. Findings also reveal that the theoretical monsoon extent, defined by the latitude of peak subcloud MSE, remains relatively stable interannually, independent of ENSO conditions. ENSO phases instead modulate the distribution and local gradient of subcloud MSE, producing a dipole structure in MSE anomalies. In El Niño years, reduced subcloud MSE poleward of the climatological MSE maximum corresponds to suppressed precipitation, consistent with the upped-ante mechanism in which enhanced tropospheric warming increases the energetic threshold for deep convection at the northern edge of the monsoon where moisture is limited. These results highlight that ENSO-driven SST patterns primarily alter the energetics of monsoon systems remotely through a top-down mechanism that modulates atmospheric stability and local MSE gradients. They also underscore the importance of region-specific processes in mediating SST–monsoon interactions.

How to cite: Garcia Valencia, J. P., Holloway, C., Turner, A., and Tomassini, L.: Explaining how SST patterns influence monsoon interannual variability using a moist static energy framework, EGU General Assembly 2026, Vienna, Austria, 3–8 May 2026, EGU26-3819, https://doi.org/10.5194/egusphere-egu26-3819, 2026.

We propose a novel diagnostic framework within a unified monsoon coordinate system to quantify the variability of the East Asian Summer Monsoon (EASM). This framework introduces two new concepts: Monsoon Vector Projection (MVP), which quantifies monsoon intensity, and Directed Angle (DA), which captures directional variability. The newly developed MVP and DA indices exhibit highly significant correlations with summer precipitation over the middle–lower Yangtze River basin and outperform traditional EASM indices. Moreover, they offer a clearer and more comprehensive representation of the spatial pattern of the Meiyu–Changma–Baiu rainbelt.

Strong EASM years are characterized by pronounced convergence along the Meiyu front, as indicated by enhanced MVP, and are accompanied by anomalous cyclonic shear reflected in DA deflection. This circulation pattern is associated with enhanced rainfall in the Meiyu region, a westward extension and southward shift of the Western Pacific Subtropical High, and suppressed precipitation over northern China, collectively forming a north–south dipole in rainfall anomalies. In contrast, weak EASM years display the opposite pattern. These circulation features are closely linked to the Indo–Asian–Pacific (IAP) teleconnection, as revealed by horizontal Rossby wave ray trajectories and the newly introduced Rossby wave ray flux (Li-Yang WRF). Furthermore, the monsoon coordinate framework is extendable to other monsoon regions, offering a promising tool for better capturing monsoon variability and improving our understanding of its relationship with broader climate dynamics.

How to cite: Yang, Y. and Li, J.: Novel monsoon indices based on vector projection and directed angle for measuring the East Asian summer monsoon, EGU General Assembly 2026, Vienna, Austria, 3–8 May 2026, EGU26-4466, https://doi.org/10.5194/egusphere-egu26-4466, 2026.

EGU26-6649 | Orals | AS1.27

Past warm intervals inform the future South Asian summer monsoon 

Tianjun Zhou, Linqiang He, and Zhun Guo

In the future, monsoon rainfall over densely populated South Asia is expected to increase, even as monsoon circulation weakens. In contrast, past warm intervals were marked by both increased rainfall and a strengthening of monsoon circulation, posing a challenge to understanding the response of the South Asian summer monsoon (SASM) to warming. Here we show consistent SASM changes in the mid-Pliocene, Last Interglacial, mid-Holocene, and future scenarios, characterized by an overall increase in monsoon rainfall, a weakening of the monsoon trough-like circulation over the Bay of Bengal, and a strengthening of the monsoon circulation over the northern Arabian Sea, as revealed by a compilation of proxy records and climate simulations. Increased monsoon rainfall is thermodynamically dominated by atmospheric moisture following the rich-get-richer paradigm, and dynamically dominated by the monsoon circulation driven by the enhanced land warming in the subtropical western Eurasia and northern Africa. The coherent response of monsoon dynamics across warm climates reconciles past strengthening with future weakening, reinforcing confidence in future projections. Further prediction of SASM circulation and rainfall by physics-based regression models using past information agrees well with climate model projections, with spatial correlation coefficients of approximately 0.8 and 0.7 under the high-emissions scenario. These findings underscore the promising potential of past analogs, bolstered by paleoclimate reconstruction, in improving future SASM projections.

How to cite: Zhou, T., He, L., and Guo, Z.: Past warm intervals inform the future South Asian summer monsoon, EGU General Assembly 2026, Vienna, Austria, 3–8 May 2026, EGU26-6649, https://doi.org/10.5194/egusphere-egu26-6649, 2026.

EGU26-7065 | ECS | Orals | AS1.27

A novel constraining method for a better description of the Indian monsoon precipitation change 

George Whittle, Hervé Douville, and Pascal Terray

Beyond future emission pathways, projections of precipitation in a changing climate are still showing a large spread among CMIP's Global Circulation Models (GCMs), especially at the regional scale. This is mainly arising from the so-called model uncertainty, i.e. from our limited knowledge in but also from the plural representation of climate system's complex mechanisms. Those uncertainties represent a point of great concern for the design of responsible regional adaptation policies, and it is urgent to reduce these uncertainties to better assess future change in regional precipitation. While ongoing and future improvement of GCMs will surely allow for precision of climate change trajectory, here we suggest to make the best use of already existing information for uncertainty reduction now.

We will focus on the example of the Indian summer monsoon, being a regional phenomenon of importance for the livelihood of billions of people; yet its evolution under climate change is largely uncertain. Using the two latest generations of GCMs (CMIP5 and CMIP6), we suggest an original method for constraining models' projections of Indian summer precipitation change based on observations and using an inter-model Maximum Covariance Analysis (MCA) technique. Our method is compared to a straightforward emergent constraint approach and shows  promising and robust results, both in terms of reduction in uncertainty and in the explanation of underlying physical mechanisms. Additionally, a robustness assessment is done through a perfect model validation i.e. by checking the ability of our method to reliably predict a left one out model. We believe robustness-checks are a needed procedure for an honest and trustworthy reduction in uncertainty of future change.

How to cite: Whittle, G., Douville, H., and Terray, P.: A novel constraining method for a better description of the Indian monsoon precipitation change, EGU General Assembly 2026, Vienna, Austria, 3–8 May 2026, EGU26-7065, https://doi.org/10.5194/egusphere-egu26-7065, 2026.

EGU26-7070 | Posters on site | AS1.27

Summer PM2.5 concentrations in the northern subtropics modulated by the Hadley circulation edge location 

Shuang Wang, Juan Feng, Sijia Lou, Jianping Li, Xuanliang Ji, and Falei Xu

Atmospheric aerosols play a pivotal role in impacting the global energy budget and public health. Meteorological conditions significantly affect PM2.5 concentrations at regional scales, while the potential influence of circulation on PM2.5 concentrations in the entire latitude belt from a hemispheric scale remains unknown. Here, we focused on the impact of interannual variations of northern Hadley circulation (HC) edge (NHCE) on PM2.5 concentrations variations during boreal summer on the hemispheric scale. We determined that a northward (southward) shift in the NHCE leads to increased (decreased) PM2.5 concentrations over the northern subtropics within 20°–30°N, mainly through circulation processes. Variations in the latitude of the NHCE explain about 30% of the PM2.5 concentrations averaged over 20°–30°N, with the strongest impacts over North Africa, where NHCE-regulated anomalies of local PM2.5 concentrations reach 36%. The northwards shift of NHCE is accompanied by an overall migration of the northern cell of HC, corresponding to anomalous rising as well as divergence (convergence) in the upper (lower) troposphere over northern subtropics, resulting in enhanced PM2.5 concentrations. Our results are verified by numerical model with fixed anthropogenic emissions. Besides, the amplitude of poleward HC over the past four decades is comparable to the interannual NHCE variation, indicating that the risk of increased PM2.5 concentrations over the northern subtropics may increase. This study highlights the significant modulation of interannual variation of NHCE latitude on PM2.5 concentrations, implying that the effects of circulation may be essential for environmental policy formulation in the northern subtropics.

How to cite: Wang, S., Feng, J., Lou, S., Li, J., Ji, X., and Xu, F.: Summer PM2.5 concentrations in the northern subtropics modulated by the Hadley circulation edge location, EGU General Assembly 2026, Vienna, Austria, 3–8 May 2026, EGU26-7070, https://doi.org/10.5194/egusphere-egu26-7070, 2026.

EGU26-7201 | Posters on site | AS1.27

Western North Pacific Tropical cyclones act to suppress its adjacent Hadley circulation 

Falei Xu, Juan Feng, Jianping Li, Xuanliang Ji, and Yaqi Wang

The Hadley circulation (HC) is an important atmospheric circulation system connecting the tropics and subtropics, and variabilities of regional HC exhibit significant impacts on tropical cyclones (TC). However, the potential feedback of TC on the regional HC remains unclear. Here, we reveal that western North Pacific TC (WNPTC) activity exerts a significant 1-month lagged negative effect on the western Pacific HC intensity (WPHCI), and this relationship is independent of the influence of El Niño–Southern Oscillation (ENSO). We show that WNPTC activity can influence variations in environmental fields through modulating the variations of sea surface temperature over WP, thereby altering the thermal conditions and energy conversion, ultimately contributing to the weakening of the WPHC. The mechanism is further validated by sensitivity experiments. Our results demonstrate the significant effect of WNPTC activity on its adjacent meridional circulation, and illustrate the unignorable cumulative effect of extreme weather systems on the climate systems, which is especially important for that more frequent extreme events are projected under global warming.

How to cite: Xu, F., Feng, J., Li, J., Ji, X., and Wang, Y.: Western North Pacific Tropical cyclones act to suppress its adjacent Hadley circulation, EGU General Assembly 2026, Vienna, Austria, 3–8 May 2026, EGU26-7201, https://doi.org/10.5194/egusphere-egu26-7201, 2026.

EGU26-7218 | Posters on site | AS1.27

Summer tropical Atlantic drives autumn North American Arctic warming through western Pacific Bridge 

Wei Lou, Cheng Sun, and Jianping Li

The Arctic climate system exhibits dramatic changes in autumn, yet its connection to the tropics remains unclear. This study leverages inter-basin/region teleconnectivity (IB(R)T) analysis to unveil the key teleconnected regions responsible for the connection between autumn Arctic temperature and tropical sea surface temperature (SST). A robust positive correlation is identified between North American Arctic (NAA) temperatures and North Tropical Atlantic (NTA) SST, with the NTA SST leading by one season. Observational evidence reveals that western Pacific (WP) subtropical high (WPSH) and SST play an intermediary role in this cross-seasonal tropical-Arctic connection. Summertime NTA warming triggers an intensification of the WPSH, subsequently inducing autumnal warming of WP SST via inter-basin interactions. This intensified WP convection generates a Rossby wave train propagating from the Northern WP eastward towards the NAA, ultimately leading to an anomalous high over the NAA. The increased atmospheric thickness and air temperature enhances downward longwave radiation, further contributing to surface warming over the NAA. The linear baroclinic model experiments, forced with thermal anomalies corresponding to WP SST warming, successfully reproduce the observed atmospheric circulation response and the associated air temperature changes over the NAA. Our findings provide insights into the role of inter-basin connections in Tropical-Arctic linkages.

How to cite: Lou, W., Sun, C., and Li, J.: Summer tropical Atlantic drives autumn North American Arctic warming through western Pacific Bridge, EGU General Assembly 2026, Vienna, Austria, 3–8 May 2026, EGU26-7218, https://doi.org/10.5194/egusphere-egu26-7218, 2026.

During the 2025 Indian summer monsoon, north India was impacted by 17 western disturbances (WDs) – extratropical storms whose impacts over this region are more typically felt in winter months. WD-monsoon interactions often lead to high impact weather as strong synoptic forcing from the WD meets the monsoon's abundant moisture supply. In 2025, this led to, among others, flash flooding in Mandi (killing 3), the devastating Dharali floods in early August (killing at least 5), and the Kishtwar floods several weeks later (killing at least 50). The total number of WDs, 17, was claimed by the media as record-breaking and unprecedented.

In fact, despite the extraordinary number of high-impact weather events, 2025 was comparable to previous years in terms of WD frequency (2024 had 17 WDs as well; 2023 had 15; 2019 had 22). In this talk, I will identify the large-scale atmospheric conditions present during the 2025 monsoon that led to these WDs being so impactful over north India, and discuss how atypical they were compared to the last 80 years. I will explore the relative roles of climate change and internal variability and ask whether such an unusual season is likely to happen again.

How to cite: Hunt, K.: The 2025 Indian summer monsoon and its 17 western disturbances – beyond unprecedented?, EGU General Assembly 2026, Vienna, Austria, 3–8 May 2026, EGU26-7402, https://doi.org/10.5194/egusphere-egu26-7402, 2026.

This study examines how the summertime Indian Ocean (IO) SST anomalies (SSTAs) affect the Indian Summer Monsoon (ISM) and its predictability in the El Niño developing years from the perspective of seasonal predictions for the years 1997 and 1972. The CFSv2-COLA ensemble seasonal reforecasts successfully predicted the ISM in 1972 but failed in 1997, as those years exhibited drastically different ISM states. Our sensitivity experiments, in which the ocean and atmosphere are decoupled in the tropical IO with the prescribed SST, reveal that the erroneous prediction of cold IO SSTAs in 1997 exacerbates an El Niño-induced ISM drought and “correcting” these SST errors improves the ISM prediction substantially, whereas a good prediction of the summertime IO SSTAs contributes positively to the skillful ISM reforecast in 1972.

It is also demonstrated that the warm IO SSTAs centered in the Arabian Sea in 1997 reduce sea-level pressures locally and steer the low-level anomalous winds to transport water vapor into the India. This regional process counters the El Niño-induced drought tendency and results in a nearly normal ISM that defies the historical El Niño-ISM relation. However, the warm SSTAs centered at the western equatorial IO in 1972 strengthen the anomalous Walker circulations originally set up by the developing El Niño in the Indo-Pacific domain, which further enhance the El Niño evolution and its teleconnection to the ISM. This inter-basin feedback process intensifies the typical El Niño-ISM relation. The spatial structure of the summer IO SSTAs may determine whether the IO regional process or the inter-basin process prevails.

Our study shows that reexamination of current reforecasts on how realistically they predict the key elements of specific historical events in a case-by-case fashion is a useful approach in making progress on exploring physical mechanisms and evaluating model qualities. This synoptic-style examination, combined with modeling experiments and diagnostic analysis, can also help us to identify more regional, delicate, or event-specific sources of seasonal predictability beyond conventional assessment of prediction skill and statistical patterns.

How to cite: Shin, C.-S.:  Understanding the sources of the Indian Summer Monsoon Predictability in the El Niño developing years , EGU General Assembly 2026, Vienna, Austria, 3–8 May 2026, EGU26-7884, https://doi.org/10.5194/egusphere-egu26-7884, 2026.

EGU26-8197 | Posters on site | AS1.27

Glacial Changes in Indian Summer Monsoon δ¹⁸O Driven by Circulation and Moisture-Source Shifts 

Thejna Tharammal, Govindasamy Bala, and Jesse Nusbaumer

In this study, we investigate how the Indian summer monsoon, its water vapor sources, and isotopic signature of precipitation (δ¹⁸Oprecip) responded to the Last Glacial Maximum (LGM, ~21 ka BP) boundary conditions using an isotope-enabled general circulation model with water-vapor source tagging (iCESM1). The LGM presents a valuable case study for understanding the Indian monsoon responses to reduced CO₂, the presence of Laurentide ice sheets and ice-sheet topography, and orbital forcing.

The simulations show a pronounced weakening of Indian summer monsoon precipitation (~15%) during the LGM, in agreement with available proxy records. The drying reflects both thermodynamic and dynamic controls: lower temperatures reduce atmospheric water vapor content, while enhanced zonal temperature gradients between the relatively warm western Pacific and the cooler Indian subcontinent lead to anomalous subsidence over India, further suppressing rainfall.

Moisture source tagging indicates that the dominant source regions to monsoon rainfall-the South Indian Ocean, Arabian Sea, Central Indian Ocean, and continental recycling-remain the same between the pre-industrial control and the LGM, but their relative contributions are reduced under glacial conditions. The δ¹⁸Oprecip values over the Indian monsoon region are enriched by approximately 1‰ in the LGM simulation. A decomposition analysis shows that the enrichment is driven primarily by reduced contributions from distant, isotopically depleted water vapor sources and secondarily by weaker rainout during moisture transport from the Indian Ocean. These results suggest that glacial changes in Indian monsoon δ¹⁸Oprecip primarily reflect large-scale circulation and moisture-source shifts rather than local rainfall amount ("Amount Effect"), highlighting the importance of atmospheric dynamics when interpreting monsoon isotope records.

How to cite: Tharammal, T., Bala, G., and Nusbaumer, J.: Glacial Changes in Indian Summer Monsoon δ¹⁸O Driven by Circulation and Moisture-Source Shifts, EGU General Assembly 2026, Vienna, Austria, 3–8 May 2026, EGU26-8197, https://doi.org/10.5194/egusphere-egu26-8197, 2026.

ENSO typically reaches its peak during the boreal winter but can exert a lasting influence on the East Asian summer monsoon (EASM) for up to six months. The remarkably prolonged impact of ENSO establishes it as a valuable precursor for predicting the EASM, which is beneficial to approximately 1.6 billion people. Over the past three decades, scientists have made significant strides in understanding this relationship, benefiting not only from their own efforts but also from the heightened role of ENSO on the EASM since the late 1970s.
However, our present study discovered that the influence of ENSO on the EASM has been diminishing in the last two decades. Moreover, we revealed that this interdecadal weakening of ENSO's impact is linked to changes in ENSO's decaying rate around the early 2000s. From 1977 to 1999, ENSO events peaking in the boreal winter frequently displayed a gradual decay, which triggered robust positive feedback in the tropical Indian Ocean and the western North Pacific, resulting in pronounced EASM anomalies. In contrast, during the period of 2000 to 2022, ENSO events exhibited a faster decay, leading to a substantial decrease in the ENSO-induced anomalies in the Indo-western Pacific and the associated EASM anomalies. These findings are well supported by model simulations.
The recent decline in ENSO's impact on EASM anomalies poses a significant challenge for predicting EASM in the coming decades. At a time when global warming is causing severe heatwaves and droughts in the EASM region, the changing role of ENSO in influencing the EASM introduces new uncertainties in our efforts to adapt to the global warming crisis.

How to cite: Chen, W. and Yu, T.: Weakened influence of ENSO on the East Asian summer monsoon since the early 2000s, EGU General Assembly 2026, Vienna, Austria, 3–8 May 2026, EGU26-9006, https://doi.org/10.5194/egusphere-egu26-9006, 2026.

Over the past century, East Asian land monsoon rainfall (EALMR) has exhibited significant decadal variations, primarily linking to sea surface temperature anomalies (SSTAs) in the tropical and North Pacific (TNP). However, how will the decadal variability of EALMR change and the role of TNP SSTAs in a warming world remain uncertain. Projections from the Coupled Model Intercomparison Project Phase 6 (CMIP6) indicate that the leading mode of decadal EALMR will retain its near-uniform spatial pattern, but no significant change in the intensity of decadal EALMR compared to the historical period, which may attribute to the insignificant change in intensity of TNP SSTAs and its relationship with the decadal EALMR. It hints that TNP SSTAs may continue to serve as a key predictability source for decadal EALMR. Comparisons with different external forcings and pre-industrial control experiments indicate that the unchanged property and the role of TNP SSTAs are primarily influenced by the internal variability, which possibly results in the insignificant intensity changes of decadal EALMR under various future scenarios.

How to cite: Li, J.: Insignificant future changes in decadal variability of East Asian summer monsoon rainfall, EGU General Assembly 2026, Vienna, Austria, 3–8 May 2026, EGU26-9416, https://doi.org/10.5194/egusphere-egu26-9416, 2026.

EGU26-10243 | ECS | Orals | AS1.27

Increasing heat low size and frequency in major monsoon regions. 

Kitty Attwood, Richard Washington, and Callum Munday

Heat lows are key components of monsoon systems, forming as areas of low pressure in response to strong surface heating. Heat lows can affect the intensity, timing and location of monsoon rainfall by altering horizontal pressure gradients, encouraging low-level convergence and generating mid-level dry air outflow. It may be expected that heat lows will strengthen in response to surface warming, particularly as they form in arid regions which are heating faster than the global average. Despite this, trends in heat lows globally have neither been fully investigated nor compared, and the role of heat lows in monsoon change remains uncertain.

Here we analyse trends across the planet’s five strongest heat lows in reanalysis data spanning the last 45 years. We demonstrate that heat lows have increased in average size (50,000–120,000 km2 per decade) and frequency of occurrence (3.2–12.7 heat low days per decade) in North America, the Sahara, the Arabian Peninsula and southern Africa. Between regions, however, we note diversity in the spatial and seasonal characteristics of heat low trends. For example, trends in the Southern African heat low are uniquely concentrated in the pre-monsoon period, consistent with delayed regional rainfall onset. Moreover, we point to regionally variable mechanisms of heat low change, whereby trends are either driven by increased downward longwave radiation associated with increased atmospheric moisture (the Sahara, West Asia, Australia), or by increased downward shortwave radiation caused by reductions in cloud cover (North America, southern Africa).

Results point to rapid changes to heat lows which are likely to have significant impacts on adjacent monsoon systems, particularly during the pre-onset period. Critically, we show that heat low trends and their respective driving mechanisms are not globally uniform, hence their impact on monsoons is likely to be regionally dependent, motivating further research into heat-low–monsoon interactions at the regional scale.

How to cite: Attwood, K., Washington, R., and Munday, C.: Increasing heat low size and frequency in major monsoon regions., EGU General Assembly 2026, Vienna, Austria, 3–8 May 2026, EGU26-10243, https://doi.org/10.5194/egusphere-egu26-10243, 2026.

EGU26-10366 | ECS | Posters on site | AS1.27

Investigating monsoon dynamics in CMIP6 models using a combination of novel and classic energetic frameworks 

Marianne Pietschnig, Ruth Geen, and Robin Chadwick

Recent decades have seen major advances in monsoon theory, shifting from the traditional “large-scale land-sea breeze” view towards the understanding that the world’s monsoons are partly local manifestations of the seasonal migration of the ITCZ. There are a handful of frameworks which explain different aspects of the monsoons through energy or momentum conservation approaches. For example, the “Energy Flux Equator” – a proxy for the tropical rainband latitude at seasonal or longer timescales – is located where the meridional column-integrated moist static energy transport is zero. While furthering our understanding of the monsoons, these frameworks have typically used a zonal-mean approach. Here we explore a recent approach using the energy flux potential which allows the study of zonal asymmetries in combination with the moist static energy budget to shine a light on regional monsoon dynamics in present-day and future CMIP6 simulations, for the Asian and West African Monsoons.  

How to cite: Pietschnig, M., Geen, R., and Chadwick, R.: Investigating monsoon dynamics in CMIP6 models using a combination of novel and classic energetic frameworks, EGU General Assembly 2026, Vienna, Austria, 3–8 May 2026, EGU26-10366, https://doi.org/10.5194/egusphere-egu26-10366, 2026.

Uncovering predictability sources of Northern Hemisphere land monsoon rainfall (NHLMR) is a vital importance for disaster prevention and mitigation as well as sustainable economic development. Using observations from 1971 to 2020, the present study reveals a regime shift of the tropical oceanic drivers of the interannual variation of NHLMR. We show that the interannual variation of NHLMR is dominated by a zonal sea surface temperature (SST) contrast in the tropical Pacific and a uniform SST pattern in tropical Atlantic, and accompanied by a dipole SST pattern in the tropical Indian Ocean. While the relationship of NHLMR with tropical Pacific remains stable over the past five decades, the relationship with tropical Atlantic is strengthened around the mid-1990s. Observations and numerical experiments demonstrate that decadal warming of the tropical Indian Ocean and Atlantic Ocean, associated with the phase transition of the Atlantic multidecadal oscillation, is the main contributor to the enhanced influence of the tropical Atlantic on NHLMR after mid-1990s by modulating the pantropical Walker circulation.

How to cite: Zhu, Z.: Stronger Influence of the Tropical Atlantic on Interannual Variability of Northern Hemisphere Land Monsoon Rainfall since the Mid-1990s, EGU General Assembly 2026, Vienna, Austria, 3–8 May 2026, EGU26-10575, https://doi.org/10.5194/egusphere-egu26-10575, 2026.

EGU26-11139 | Orals | AS1.27

Monsoon hysteresis reveals atmospheric memory: implications for Arctic winter sea ice 

Anders Levermann and Anja Katzenberger

Within Earth’s climate system, the ocean, cryosphere, and vegetation exhibit hysteresis behavior such that their state depends on their past and not merely on their current boundary conditions. The atmosphere’s fast mixing time scales were thought to inhibit the necessary memory effect for such multistability. Here, we show that moisture accumulation within the atmospheric column generates hysteresis in monsoon circulation independent of oceanic heat storage and yields two stable atmospheric states for the same solar insolation. The dynamics of monsoon rainfall is thus that of a seasonal
transition between two stable states. The resulting hysteresis is shown in observational data and reproduced in a general circulation model where it increases with decreasing oceanic memory and exhibits the two distinct states that persist for more than 60 y. They are stabilized by moisture accumulation within the atmospheric column that carries information across time scales much longer than those typical for mixing. We discuss possible implication of an observed seasonal tipping of monsoon systems for the analysis of a future Arctic winter sea ice threshold.

How to cite: Levermann, A. and Katzenberger, A.: Monsoon hysteresis reveals atmospheric memory: implications for Arctic winter sea ice, EGU General Assembly 2026, Vienna, Austria, 3–8 May 2026, EGU26-11139, https://doi.org/10.5194/egusphere-egu26-11139, 2026.

EGU26-12911 | Orals | AS1.27

The height of the Himalaya exceeded a climate tipping point 11 million years ago 

Alexander Farnsworth, Lui Jia, Paul Valdes, Robert Spicer, and Su Tao

The Himalaya hosts some of the world’s richest biodiversity and affects climate globally. However, the environmental impacts, in particular on the Asian monsoon, of a rising Himalaya are still intensely debated. Dated and analyzed proxy-observations, from a location at ~5,800 m elevation on Mt. Shishapangma, central Himalaya, the world’s highest fossil baring site, reveal a lush mid-Miocene forest, where today cool arid conditions persist. Together with data from surrounding regions, a major vegetation transition from mixed forest to alpine meadow occurred on the northern slopes of the Himalaya at approximately 11 million years ago, but why? New high-resolution paleoclimate model simulations show significant climate and vegetation transition occurred when the Himalaya passed through a critical height tipping point of 6,000–6,500 m over by pushing out monsoonal conditions from the Tibetan region, yet this rapid uplift of the Himalaya had little impact on the wider monsoon in Asia, contrary to previous interpretations. 

How to cite: Farnsworth, A., Jia, L., Valdes, P., Spicer, R., and Tao, S.: The height of the Himalaya exceeded a climate tipping point 11 million years ago, EGU General Assembly 2026, Vienna, Austria, 3–8 May 2026, EGU26-12911, https://doi.org/10.5194/egusphere-egu26-12911, 2026.

EGU26-13241 | ECS | Posters on site | AS1.27

The Monsoon as a Hydrological Capacitor: Memory Effects and Interannual Variability 

Sreelakshmi Raju and Udaya Bhaskar Gunturu

The monsoon plays a very important role in controlling water availability over land, especially in regions like South Asia. While monsoon rainfall is often studied as a seasonal event, it is also influenced by what happens before and after the monsoon season. In this work, we study the idea that the monsoon system behaves like a **hydrological capacitor**, where land water storage accumulates during the monsoon and slowly releases afterward, affecting future conditions.

In this framework, soil moisture and subsurface water storage act as a memory of past rainfall. During the monsoon, rainfall adds water to the land surface, similar to charging a capacitor. During the dry season, this stored water is lost through evaporation, transpiration, and runoff, which is like discharging the capacitor. Because this discharge happens slowly, the land retains memory of past monsoon conditions over several months or even years.

We develop a simple mathematical model to describe how water storage changes from year to year under monsoon rainfall forcing. The model shows that the amount of storage before the monsoon can strongly influence surface dryness and land–atmosphere interactions in the following season. Even small changes in monsoon duration or intensity can lead to large differences in pre-monsoon dryness, especially when the storage decay timescale is long.

Using idealized stochastic rainfall forcing, we derive expressions for the variability and persistence of land water storage. The results show that interannual variability in monsoon rainfall naturally produces correlations across years because of this storage memory. The model also suggests that a shift in monsoon onset or withdrawal by about 10–20 days can significantly change the amount of water stored in the land system.

As part of the ongoing work, observational data from reanalysis and gridded precipitation products will be used to estimate realistic storage timescales and to test whether the predicted relationships are seen in real monsoon regions. The model will also be extended to study how large-scale climate variability influences the monsoon through changes in rainfall statistics.

Overall, this study shows that viewing the monsoon as a capacitor-like system provides a simple and useful way to understand monsoon memory, interannual variability, and the persistence of dry and wet conditions.

How to cite: Raju, S. and Gunturu, U. B.: The Monsoon as a Hydrological Capacitor: Memory Effects and Interannual Variability, EGU General Assembly 2026, Vienna, Austria, 3–8 May 2026, EGU26-13241, https://doi.org/10.5194/egusphere-egu26-13241, 2026.

EGU26-13558 | ECS | Posters on site | AS1.27

Impact of high-cloud radiative effects on monsoons 

Marijan Trogrlić, Blaž Gasparini, and Aiko Voigt

Understanding how high-level clouds shape the global energy balance is critical for characterizing the physical processes driving monsoon systems, which serve as a primary engine of the global water cycle and support billions of people. High-level clouds significantly influence Earth’s energy balance, not only by modulating top-of-atmosphere fluxes, but also their radiative interactions within the atmosphere itself. This high-level cloud radiative effect (HCRE) represents the internal atmospheric heating or cooling caused by high-level clouds. By modifying temperature gradients, the HCRE serves as a key component of the global energy balance and has been shown to influence circulation patterns and precipitation. While such findings suggest that the HCRE also modulates monsoon systems, its specific impact has not yet been investigated. The impact of the HCRE on monsoons involves two pathways: a pathway linked to changes in atmospheric temperatures, and a surface pathway linked to changes in surface temperatures. To date, research has primarily focused on the atmospheric pathway, and has neglected interactions with the ocean surface that are known to be central to monsoon dynamics.

In this study, we aim to quantify how the HCRE modulates monsoon systems when the temperature of the surface layer of the ocean responds to changes in the atmosphere. Specifically, we address how HCRE impacts the seasonal thermodynamic structure of the troposphere, circulation patterns, and the spatial extent and magnitude of monsoon rainfall. To achieve this, we use the Icosahedral Non-hydrostatic Earth System Model (ICON-ESM). Simulations are performed using both prescribed sea surface temperatures and an interactive slab ocean that allows sea surface temperatures to adjust to cloud-driven surface flux changes. For each ocean setup, a control simulation is compared to a simulation in which high-level clouds are made radiatively transparent but remain physically present. Simulations with prescribed sea surface temperatures, are used to isolate the atmospheric pathway. We then identify the surface pathway by subtracting the atmospheric pathway from the total impact of the slab ocean setup. We anticipate stronger and more spatially coherent shifts in the Intertropical Convergence Zone and Hadley-circulation, when the surface pathway is included. This is hypothesized to drive a northward expansion of the northern hemisphere monsoon, even as increased atmospheric stability suppresses mean tropical precipitation.

How to cite: Trogrlić, M., Gasparini, B., and Voigt, A.: Impact of high-cloud radiative effects on monsoons, EGU General Assembly 2026, Vienna, Austria, 3–8 May 2026, EGU26-13558, https://doi.org/10.5194/egusphere-egu26-13558, 2026.

EGU26-14438 | ECS | Orals | AS1.27

Robustness of the South American monsoon system to an AMOC collapse in a kilometer-scale atmosphere-only model 

Keno Riechers, Hauke Schmidt, Cathy Hohenegger, and Bjorn Stevens

The Earth’s monsoon systems are closely linked to seasonal migration of the Intertropical Convergence Zone (ITCZ) while the Atlantic Meridional Overturning Circulation (AMOC) acts as a major control on the ITCZ’s latitudinal position through cross-equatorial heat transport. Under sustained global warming, climate models consistently predict a weakening of the AMOC, with some recent studies suggesting a potential tipping, i.e. an irreversible and substantial decline to approximately 3–5 Sv. Such an AMOC collapse is associated with significant cooling and drying in the Northern Hemisphere and a southward shift of the ITCZ.
To assess the impact of a potential AMOC shutdown on the South American Monsoon System (SAMS), we conducted an atmosphere-only simulation using the ICON model at 10 km horizontal resolution. At this resolution, convection is explicitly resolved, and no convective parameterization is required. Sea surface temperatures (SSTs) were taken from an existing AMOC shutdown experiment conducted with a coupled climate model.
Our results broadly reproduce the large-scale precipitation and temperature anomalies observed in lower-resolution coupled model experiments. The southward displacement of the ITCZ produces a zonally elongated dipole precipitation anomaly over the Atlantic Ocean. However, over the South American continent, this signal is attenuated in the high-resolution simulation compared to the lower resolution coupled simulations, where the dipole extends much further inland. This is consistent with previous research indicating that land–atmosphere interactions differ in convection-resolving models compared to CMIP-type models, potentially altering the precipitation response to large-scale perturbations.
In particular, precipitation associated with the SAMS is remarkably robust to the ITCZ shift. Key features such as the Bolivian High, the South Atlantic Convergence Zone, and the South American Low-Level Jet remain qualitatively unchanged despite the AMOC shutdown. This suggests that other drivers—such as the seasonal solar cycle, the orography and geometry of South America, and moisture recycling from the Amazon rainforest—may dominate the spatiotemporal structure of the SAMS, outweighing the influence of large-scale AMOC-driven changes.

How to cite: Riechers, K., Schmidt, H., Hohenegger, C., and Stevens, B.: Robustness of the South American monsoon system to an AMOC collapse in a kilometer-scale atmosphere-only model, EGU General Assembly 2026, Vienna, Austria, 3–8 May 2026, EGU26-14438, https://doi.org/10.5194/egusphere-egu26-14438, 2026.

EGU26-14692 | ECS | Posters on site | AS1.27

Atlantic-Pacific constructive interference drives decadal East Asian Summer Monsoon variations 

Tiantian Yu, Matthew Collins, Ping Huang, and Wen Chen

The East Asian summer monsoon (EASM) has undergone two distinct decadal transitions recently: a weakening in the late 1970s that established the “southern-flood-northern-drought” pattern, followed by a recovery around the late 1990s that shifted the rain belt northward. Yet, why the summer monsoon exhibits such changes in a warmer climate remains debated. Identifying the mechanisms controlling recent monsoon changes is a demanding task, with great societal and economic value across this densely populated region.

Here we examine the relative roles of internal climate variability and external forcing using eight large ensemble simulations, finding that recent observed EASM variations are largely governed by internal variability, whereas external forcing exerts a limited positive effect. Pacemaker model experiments further show that the out-of-phase shifts of Atlantic Multidecadal Oscillation and Interdecadal Pacific Oscillation play a dominant role in these monsoon changes, through both tropical and midlatitude pathways.

How to cite: Yu, T., Collins, M., Huang, P., and Chen, W.: Atlantic-Pacific constructive interference drives decadal East Asian Summer Monsoon variations, EGU General Assembly 2026, Vienna, Austria, 3–8 May 2026, EGU26-14692, https://doi.org/10.5194/egusphere-egu26-14692, 2026.

EGU26-15250 | ECS | Posters on site | AS1.27

How ENSO modifies the Boreal summer intraseasonal oscillation (BSISO) in the Asian monsoon region 

Indrakshi Mukherjee, Andrew G. Turner, Kieran M. R. Hunt, Robert W. Lee, Ambrogio Volonté, and Stephanie J. Johnson

The monsoon intraseasonal oscillation (ISO), marked by alternating active and break phases, plays a crucial role in modulating water resources and high-impact weather events in the tropics. The tropical ISO comprises of two distinct seasonal modes: the Madden-Julian Oscillation (MJO), which is active during boreal winter (December to February), and the boreal summer intraseasonal oscillation (BSISO), which dominates during boreal summer (May to October). While the dependence of the MJO on interannual variations associated with the El Niño-Southern Oscillation (ENSO) has received considerable attention, the corresponding influence of ENSO phases on the BSISO remains poorly understood. Mechanisms controlling the BSISO may be made more complex since it operates on a sheared mean state arising from the monsoon. In this study, we investigate the nonlinear interaction between ENSO and the BSISO, focusing on how the slowly varying, seasonally persistent ENSO signal modulates the background mean state through which the BSISO propagates. Using 43 years (1979–2021) of observational and reanalysis data during the summer monsoon period (June-September), we examine how the frequency, amplitude, phase speed, and spatial extent of BSISO-related convection vary between El Niño and La Niña years by performing simple compositing and statistical analysis. Results reveal the following notable features: (1) Overall, El Niño years support a greater number of active BSISO days than La Niña years. (2) El Niño years tend to produce zonally extended stronger BSISO convection anomalies over the west and central Pacific (during BSISO phase 6), whereas La Niña years form a more conducive environment for convective activity over the Indian Ocean basin (in phase 3). (3) The northward propagation of the BSISO is stronger during El Niño than La Niña, both over the Bay of Bengal and the western North Pacific. The findings are statistically robust based on Welch’s t-test and bootstrapping. To investigate the physical mechanisms, we analyse the meridional structures of key atmospheric variables and conduct vorticity budget analyses for each phase of BSISO under El Niño and La Niña conditions to assess how ENSO induced changes in the background mean state influence the vertical shear mechanism governing BSISO propagation. The findings in this study potentially pave the way for conditional forecasts of BSISO based on ENSO mean state.

How to cite: Mukherjee, I., Turner, A. G., Hunt, K. M. R., Lee, R. W., Volonté, A., and Johnson, S. J.: How ENSO modifies the Boreal summer intraseasonal oscillation (BSISO) in the Asian monsoon region, EGU General Assembly 2026, Vienna, Austria, 3–8 May 2026, EGU26-15250, https://doi.org/10.5194/egusphere-egu26-15250, 2026.

EGU26-15994 | ECS | Posters on site | AS1.27

Seasonal-Intraseasonal Coupling and Systematic CMIP6 Biases in the Indian Summer Monsoon  

Ritesh Jha, Ravi Nanjundiah, and Ashwin Seshadri

The Indian Summer Monsoon (ISM) supplies nearly 80% of annual rainfall over the Indian mainland during June–September and exhibits variability across multiple timescales. Intraseasonal variations, especially the timing and intensity of active and break spells, are critical for water resources and agriculture. However, how well CMIP6 models capture the observed link between the seasonally persistent background state and intraseasonal variability remains unexamined. 

We apply Multichannel Singular Spectrum Analysis (MSSA) to IMD rainfall observations (1979–2014) and CMIP6 historical simulations over the Indian mainland to evaluate how well models represent the observed spatial structure and amplitude of the dominant intraseasonal oscillation (ISO) modes: a low-frequency mode (20–60 days) with poleward propagation from the equatorial Indian Ocean and a high-frequency mode (10–20 days) with northwestward propagation from the Bay of Bengal. Across CMIP6 models, systematic biases are evident in both the spatial structure and amplitudes of these modes. Most models also fail to reproduce the observed relationship between seasonal rainfall and ISO intensity: observations show a negative correlation between all-India summer monsoon rainfall and the low-frequency ISO and a positive correlation with the high-frequency ISO, whereas many models simulate the opposite. These errors suggest that widely reported JJAS rainfall biases, particularly dry biases over the monsoon core region, may be closely linked to deficiencies in simulated intraseasonal variability. 

To investigate further and diagnose processes, we introduce a moisture budget framework that decomposes the total variability into contributions from the daily climatology, daily anomalies, and a seasonally persistent component defined as the seasonal mean of daily anomalies. By combining this persistent component with the daily climatology to construct an augmented mean state, we quantify interannual variability embedded within the mean advection terms, which incorporates the seasonally persistent component of daily anomalies, and isolate residual transient anomalies upon subtracting both the daily climatology and the seasonally averaged daily anomalies. The seasonally persistent component of both wind and moisture anomalies emerges as the key term differentiating flood and drought years with respect to both horizontal and vertical moisture advection.  

We extend the same framework to analysis of vorticity budgets and examine biases in moisture and vorticity budget terms to understand biases in the rainfall-weighted latitude of precipitation (ITCZ) i.e. assess the ability of a model to realistically simulate this parameter vis-a-vis observations. Some models simulate a northward-displaced ITCZ, while others show a southward bias relative to the climatological mean ITCZ position of 23.8° N derived from IMD data. These analyses help elucidate mechanisms governing intraseasonal ITCZ migration. Finally, phase composites of budget terms conditioned on low- and high-frequency ISO phases identify the dominant dynamical and thermodynamical contributions to northward and westward propagation, respectively, and highlight the processes CMIP6 models fail to represent accurately. 

Overall, the analysis provides a systematic assessment of intraseasonal variability dynamics and their biases in CMIP6. By linking ISO dynamics to persistent large-scale circulation and background moisture fields, this study advances diagnostics of interannual variations in active and break spell occurrence across models.  


How to cite: Jha, R., Nanjundiah, R., and Seshadri, A.: Seasonal-Intraseasonal Coupling and Systematic CMIP6 Biases in the Indian Summer Monsoon , EGU General Assembly 2026, Vienna, Austria, 3–8 May 2026, EGU26-15994, https://doi.org/10.5194/egusphere-egu26-15994, 2026.

EGU26-16309 | Orals | AS1.27

Future intensification of Northern Hemisphere Monsoons due to Declining Remote Aerosols 

Sooraj Kallikkal Puthiyaveettil, Chirag Dhara, Ayantika Dey Choudhury, Kalik Vishisth, Sumit Kumar Mukherjee, Andrew Turner, and Krishnan Raghavan

Anthropogenic aerosol emissions have significantly shaped historical monsoon precipitation, yet uncertainties persist in the projected response to future emissions. This study employs models contributing at least ten ensemble members to the Detection and Attribution Model Intercomparison Project—MIROC6 and CanESM5—to examine the mid-century response of the Northern Hemisphere (NH) summer monsoons to changes in aerosol burdens. We focus on a scenario characterized by an increase in aerosol burdens over South Asia, but strong reductions over the NH extra-tropical continents (i.e., over United States, Europe, and East Asia), since this is consistent with observed trends. These anomalous reductions induce an inter-hemispheric energy imbalance, prompting a large-scale response in the atmospheric meridional overturning circulation. The upper-tropospheric levels of the overturning circulation enhance heat transport towards the Southern Hemisphere, while the lower levels bring enhanced moisture convergence into the NH, leading to more rainfall across NH monsoon regions. Our findings highlight that global aerosol pollution control measures may have wide-ranging impacts well beyond the aerosol source regions. For South Asia, these findings suggest that widespread remote aerosol reductions could offset the precipitation suppression from rising local aerosols.

How to cite: Kallikkal Puthiyaveettil, S., Dhara, C., Dey Choudhury, A., Vishisth, K., Kumar Mukherjee, S., Turner, A., and Raghavan, K.: Future intensification of Northern Hemisphere Monsoons due to Declining Remote Aerosols, EGU General Assembly 2026, Vienna, Austria, 3–8 May 2026, EGU26-16309, https://doi.org/10.5194/egusphere-egu26-16309, 2026.

EGU26-16982 | ECS | Posters on site | AS1.27

Proxy-Model Constraints on Holocene Indian Summer Monsoon Variability and Seasonality in Northwest India 

Aakanksha Kumari, William F. Defliese, Krishna AchutaRao, and Yama Dixit

The Indian Summer Monsoon (ISM) is a critical driver of global water availability, agriculture, and food security, yet future climate projections rely largely on instrumental records that are insufficient to capture its long-term, non-linear variability. The Holocene epoch (~11.7 ka to present) provides a crucial framework for resolving these dynamics and evaluating climate models under near-modern boundary conditions, as well as constraining nonlinear monsoon behaviour and large-scale teleconnections through the investigation of abrupt events. The margins of the Thar Desert represent a highly sensitive archive of ISM variability, where monsoon weakening and abrupt climatic events have been linked to the decline of the Bronze Age Indus Civilisation. Despite this significance, continuous high-resolution Holocene records and a clear understanding of seasonal precipitation dynamics remain absent from this region.

Here, we reconstruct Holocene ISM variability and its impacts along the margins of the Thar Desert using an integrated proxy-model approach. Multi-proxy lake sediment records are compared with Paleoclimate Modelling Intercomparison Project (PMIP) and transient TraCE-21ka climate simulations. Results indicate an early Holocene shift from arid to wetter conditions. PMIP results indicate significant mid-Holocene seasonality changes. Furthermore, lake water mass balance modelling is employed to quantify seasonal precipitation–evaporation dynamics during abrupt climatic events captured in proxy records. By resolving the mechanisms driving Holocene monsoon variability and non-linear responses, this work offers insights for refining regional climate projections and assessing future climate risks.

How to cite: Kumari, A., Defliese, W. F., AchutaRao, K., and Dixit, Y.: Proxy-Model Constraints on Holocene Indian Summer Monsoon Variability and Seasonality in Northwest India, EGU General Assembly 2026, Vienna, Austria, 3–8 May 2026, EGU26-16982, https://doi.org/10.5194/egusphere-egu26-16982, 2026.

EGU26-17955 | Posters on site | AS1.27

Dynamics and evolution of a case study monsoon depression in a high-resolution simulation of the Met Office Unified Model 

Andrew Turner, Arathy Menon, Ambrogio Volonte, Kieran Hunt, and Akshay Deoras

Monsoon depressions (MD) are synoptic-scale cyclonic vortices that form over the Bay of Bengal and propagate north-westward through the monsoon trough onto the Indian subcontinent, bringing substantial amounts of rainfall to central and northern India.

Despite their importance, key questions on the mechanisms driving their generation and development are still open.  Motivated by aircraft and ground-based observations made during the INCOMPASS field campaign in India in 2016, here we inspect the structure and dynamics of a MD case study (1-10 July 2016) using a variety of Met Office model simulations (1.5 km, 4.4 km and 17 km horizontal resolutions). 

The 1.5 km simulation proves effective at resolving intense rainfall caused by deep convection, convergence lines, and kilometre-scale orographic interactions.  The evolution of the case-study MD can be divided into two stages: initially the MD is completely embedded in a near-saturated environment up to the mid-troposphere.  Then, an intrusion of low-potential-temperature dry air from the west at low and mid-levels starts interacting with the MD.

Using Lagrangian trajectory analysis, we find that during the initial stage of the MD, high-θe air from mesoscale convective systems in the vicinity of the MD reaches its centre at low and mid-levels, enabling its growth.  During the second stage, the intrusions of stable and subsiding dry air bring low-θe, low-PV air at low and mid-levels towards the centre of the depression, hindering its development.

The 1.5-km simulation enables us to highlight the presence of individual vorticity towers or filaments embedded within the MD that were not otherwise resolved at coarser (17km) resolution.  We use analysis with Stokes' theorem to explore the aggregation of these filaments and their contribution to central vorticity as the MD develops.  The work paves new directions for theoretical understanding of growth of monsoon depressions.

How to cite: Turner, A., Menon, A., Volonte, A., Hunt, K., and Deoras, A.: Dynamics and evolution of a case study monsoon depression in a high-resolution simulation of the Met Office Unified Model, EGU General Assembly 2026, Vienna, Austria, 3–8 May 2026, EGU26-17955, https://doi.org/10.5194/egusphere-egu26-17955, 2026.

EGU26-18476 | ECS | Posters on site | AS1.27

Centennial variability of the Afro-Asian monsoon during the Holocene 

Raphaël Bouguemari, Pascale Braconnot, and Olivier Marti

The monsoon plays a major role in the Asian and African climate. Its variability exerts a strong control of water resources in lots of countries and its future evolution is of concern. While there is extensive knowledge of its mean-state evolution during the Holocene, its centennial variability has remained little explored. Such variability scale cannot be explored from the too short instrumental observation period, but high-resolution paleoclimate archives, such as speleothems, allows to access to indirect measurements of monsoon variability over long time scales.

In this work, we use data from an IPSL-CM6A-LR simulation to investigate this range of variability, both in spatial domains, using ordination techniques derived from Principal Component Analysis, and in frequency domains, using spectral analysis.

To assess the model correspondence to climate reconstructions, we first compare the simulated precipitation with speleothems δ¹⁸O records from the SISALv2 database1, considering the long-term trends. The speleothems δ¹⁸O records constitute a composite proxy of temperature and precipitation. Following Parker et al. 20212, we applied a principal coordinate analysis (PCoA) to the δ¹⁸O and precipitation datasets in order to explore their spatial similarities. In both cases, a strongly predominant first coordinate is found. However, it explains more variance in the precipitation data (about 90%) than in the δ¹⁸O data (about 70%). This ordination technique also makes it possible to discuss similarities between regions by performing a clustering in the reduced PCoA space. A strong coherence is found in Asian monsoon variability, while the African monsoon is shown to be closer to the South American monsoon.

We then explore the centennial band of variability in the Fourier spectrum of precipitation time series (from simulation) for each tropical monsoon region. In this centennial band, most regions exhibit a white-noise spectrum, indicating that monsoon variability on these timescales has no memory. Significant peaks are identified in the East Asian monsoon.

References

1 Comas-Bru, L., Atsawawaranunt, K., Harrison, S., and SISALworking group members: SISAL (Speleothem Isotopes Synthesis and AnaLysis Working Group) database version 2.0, University of Reading [data set], https://doi.org/10.17864/1947.256, 2020a.

2 Parker, S. E., Harrison, S. P., Comas-Bru, L., Kaushal, N., LeGrande, A. N., & Werner, M. (2021). A data–model approach to interpreting speleothem oxygen isotope records from monsoon regions. Climate of the Past, 17(3), 1119-1138.

How to cite: Bouguemari, R., Braconnot, P., and Marti, O.: Centennial variability of the Afro-Asian monsoon during the Holocene, EGU General Assembly 2026, Vienna, Austria, 3–8 May 2026, EGU26-18476, https://doi.org/10.5194/egusphere-egu26-18476, 2026.

Successive CMIP model generations have indicated a future delay in the onset of the rainy season in some monsoonal regions worldwide, driven mostly by the reduction in the onset phase precipitation. These projections are in agreement with the observed drying trend in these regions, coupled with an increased likelihood of recurring drought-like conditions resulting from rising temperatures. Here, we use a novel methodology to characterise the present-day and future rainy season onset in monsoonal regions over Southern Africa (SAfr) and South America (SAm). The Dry-to-Wet Transition Period (DWTP) expands the current use single date onset methods to consider a period, incorporating more information about the transition, such as duration, precipitation intensity, and dry spells. The DWTP starts with the first significant rains of the season and ends when the rain becomes regular and sustained. The DWTP starts in the southeastern and northwestern SAfr regions between August and September and progresses towards central SAfr by mid-October. Over SAm, the DWTP starts in late August in the western Amazon progressing eastward to reach eastern Brazil in late October. In both regions, the onset date defined using established methodologies occurs within the DWTP. Future projections, based on global parameterised and regional convection-permitting simulations, confirm a delay in the DWTP of about 20 days over SAfr and 20-30 days over SAm. Future scenarios project a later start of the rains in both monsoon areas, resulting in a shorter DWTP. Over SAfr, the DWTP will see more dry days over the Congo basin while over eastern SAfr, the fraction of dry days will increase, resulting in a more abrupt start of the rainy season. Over SAm, the DWTP is projected to have lower rain rates and more dry days over the Amazon, resulting in a shorter but more abrupt transition into the rainy season. These results exemplify the advantages of using a period to better characterise the transition into the rainy season and identify observed and future trends in its characteristics. It provides a novel framework to better quantifying the diverse response to global warming that can modulate regional hydrological cycles and water availability. The methodology can be further expanded to account for different variables, such as temperature and soil moisture, and can be easily implemented in the seasonal forecast system as a tool to improve the overlook into the dry-to-wet transition periods. 

How to cite: Zilli, M., Samuel, J., Morris, F., and Hart, N.: Future changes in the characteristics of the dry-to-wet transition period in the monsoonal regions of Southern Africa and South America , EGU General Assembly 2026, Vienna, Austria, 3–8 May 2026, EGU26-18928, https://doi.org/10.5194/egusphere-egu26-18928, 2026.

Projections of the Asian–Australian, African, and American monsoons are currently challenged by considerable levels of uncertainty, which influences the effectiveness of climate change adaptation strategies. Clarifying the uncertainty sources is essential to reduce this uncertainty. Most previous studies have addressed this issue based on limited members in individual models, which cannot strictly isolate the forced model response from the internal variability. Here, we first employ the latest multi-model large ensemble (MMLE), with a total of 550 members from eight models, under very-high emission scenarios. The results show that model uncertainty (internal variability) increases (decreases) with time for all monsoon regions, but with notably regional disparities in their relative contributions. On the grid scale, internal variability dominates the total uncertainty of summer precipitation changes during the near-term (2020–2039) and mid-term (2040–2059) periods in most monsoon regions. For monsoon circulation, internal variability exerts an even greater influence over the Asian–Australian monsoon region. Compared with the MMLE results, a conventional approach to isolate the forced signal based on polynomial fitting tends to underestimate the fraction of internal variability, particularly when and where that fraction is large. Consequently, the conventional approach overestimates the forced signal of monsoon precipitation relative to internal noise, leading to an earlier time of emergence by about 10 years compared with that derived from the MMLE, which is before 2050 for most monsoon regions. The results highlight the necessity of using MMLEs to quantify sources of uncertainty in climate projections, providing important implications for improving the robustness of future climate assessments.

How to cite: Wang, L., Chen, X., and Lin, P.: Disentangling Internal Variability and Forced Response in Global Land Monsoon Projection Uncertainty: Insights from Multi-Model Large Ensembles, EGU General Assembly 2026, Vienna, Austria, 3–8 May 2026, EGU26-19186, https://doi.org/10.5194/egusphere-egu26-19186, 2026.

EGU26-21203 | Orals | AS1.27

Energetic constraints unify the Breeze and ITCZ interpretations of monsoons and explain regional monsoon variability 

Ori Adam, Sujatra Bhattacharyya, and Arindam Chakraborty

Monsoons are historically understood as continental-scale land-ocean Breeze. Modern studies, however, link monsoons to seasonal migrations of the inter-tropical convergence zone (ITCZ) -- a band of intense precipitation that lies along the rising limb of the tropical overturning circulation. Here, we explore in reanalysis data the relative role of zonal vs. meridional migrations of tropical convergence zones in the Asian-Australian monsoon, employing energetic constraints. Both seasonal ITCZ shifts and seasonal land-ocean energetic contrasts are shown to have a critical influence on monsoons. Energetic constraints, therefore, merge the Breeze and ITCZ interpretations of monsoons and provide a simple analytic framework for understanding monsoon variations. Specifically, we provide energetic constraints on South Asian Summer Monsoon (SASM) onset, retreat, and strength, which yield a mechanism explaining the known tendency for enhanced SASM during La Niña episodes. Similarly, the tendency for enhanced Australian monsoon during La Niña episodes is shown to be related to energetically constrained zonal shifts of the Indo-Pacific regional overturning circulation. Moreover, we show that meridional and zonal energetic contrasts in the Indo-Pacific sector are both statistically independent and precede SASM variations by up to two months. Regional energetic contrasts may therefore be used for predictive applications of seasonal SASM variability.

How to cite: Adam, O., Bhattacharyya, S., and Chakraborty, A.: Energetic constraints unify the Breeze and ITCZ interpretations of monsoons and explain regional monsoon variability, EGU General Assembly 2026, Vienna, Austria, 3–8 May 2026, EGU26-21203, https://doi.org/10.5194/egusphere-egu26-21203, 2026.

EGU26-1551 | ECS | Orals | AS1.28

Interactions between the tropical moist margin and extratropical Rossby waves for rainfall extremes 

Corey Robinson, Sugata Narsey, Christian Jakob, and Bethan White

Extreme precipitation in the subtropical regions is often influenced by a combination of tropical and extratropical processes. In this work, we examine two-way feedbacks between the tropical moist margin, which is a proxy for heavy rainfall, and extratropical Rossby waves, defined by upper-level potential vorticity (PV). Firstly, cyclonic PV anomalies that approach the moist margin induce strong poleward moisture transport resulting in heavy rainfall, but only if the PV anomaly extends into the low- to mid-troposphere. The enhanced convection and associated upper-level divergence then feeds back onto the upper-level PV field by contributing to ridge building, potentially having downstream impacts. These processes are highlighted in composite analysis and a case study of a subtropical cyclone affecting New Zealand in January 2018. Experiments with modified latent heating in the ACCESS-rAM3 model reveal the critical role of moist processes in such events.

How to cite: Robinson, C., Narsey, S., Jakob, C., and White, B.: Interactions between the tropical moist margin and extratropical Rossby waves for rainfall extremes, EGU General Assembly 2026, Vienna, Austria, 3–8 May 2026, EGU26-1551, https://doi.org/10.5194/egusphere-egu26-1551, 2026.

EGU26-2900 | ECS | Posters on site | AS1.28

Downstream development of the extratropical transition of tropical cyclones in the Southern Hemisphere 

Chenhui Jin, Elizabeth A. Ritchie, and Neil J. Holbrook

Tropical cyclones (TCs) that move into the midlatitudes undergo changes in their structure and transition into extratropical cyclones. The process is known as extratropical transition (ET), which can affect the weather further downstream.

The current study conducts a comprehensive synoptic-climatological analysis of the downstream development of the midlatitude flow associated with ET over the Southern Hemisphere. We use a state-of-the-art low-pressure system detection and classification scheme to objectively track tropical cyclones and detect those that undergo ET based on ERA5 data. Case-to-case variability of the TC structural changes and downstream influence during ET is examined by clustering ET events into four clusters.

We found that the transitioning cyclones in clusters 2 and 3 lead to a pronounced downstream ridge development. Mechanisms of the interaction between the cyclone and midlatitude flow are investigated using potential vorticity and eddy kinetic energy diagnostics. In the potential vorticity framework, the diabatically-driven divergent TC outflow anchors the eastward-propagating upstream trough and contributes substantially to downstream ridge amplification. The nonlinear interaction between the cyclone and midlatitude flow serves as a secondary important factor for the ridge building. From the eddy kinetic energy viewpoint, the downstream development occurs because the transitioning cyclone injects additional energy into the midlatitude flow, which is redistributed by the ageostrophic wind and thus enhances downstream energy.

Clusters 2 and 3 highlight two pathways of the interaction between the cyclone and midlatitude flow. In Cluster 2, the transitioning cyclone deforms an initially zonally-oriented jet anticyclonically and excites Rossby wave development downstream. This is characterised by the development of a notable downstream trough and associated surface cyclone development. Conversely, in Cluster 3, a preexisting upstream Rossby wave captures the cyclone during ET, and while the downstream ridge amplifies, no downstream trough development is observed.

How to cite: Jin, C., Ritchie, E. A., and Holbrook, N. J.: Downstream development of the extratropical transition of tropical cyclones in the Southern Hemisphere, EGU General Assembly 2026, Vienna, Austria, 3–8 May 2026, EGU26-2900, https://doi.org/10.5194/egusphere-egu26-2900, 2026.

EGU26-3247 | ECS | Posters on site | AS1.28

Process-based understanding of improved MJO propagation across the Maritime Continent in GloSea6 

Gayoung Kim, Sun-Hee Shin, and Kang-Jin Lee

Given the critical role of the Madden–Julian Oscillation (MJO) in modulating global climate variability and subseasonal-to-seasonal (S2S) predictability, this study evaluates its simulation in the Korea Meteorological Administration’s Global Seasonal Forecasting System version 6 (GloSea6) and compares it with version 5 (GloSea5), focusing on prediction skill and key physical processes over the Maritime Continent (MC). Both models exhibit systematic biases, including weaker amplitudes and a tendency for the MJO to stall over the MC. Nevertheless, GloSea6 shows enhanced propagation across the MC, consistent with improved thermodynamic processes. The eastward-to-westward spectral power ratio increases from 1.52 in GloSea5 to 1.93 in GloSea6, closer to the observed 2.79, reflecting a more realistic dominance of eastward propagation. Process-based diagnostics reveal region-dependent improvements: more pronounced over the MC but limited over the Indian Ocean (IO). MC improvements are linked to better simulation of lower-level moisture convergence, equivalent potential temperature, and available potential energy, supported by reduced SST biases and a steeper meridional moisture gradient. These background-state changes strengthen moistening processes that precondition convection and sustain eastward propagation over the MC. These findings highlight that thermodynamic and mean-state improvements in GloSea6 are process- and region-dependent, and play a key role in shaping MJO-driven variability relevant to subtropical climate, emphasizing the importance of reducing systematic biases for improving S2S prediction system. However, improvements in spatial pattern similarity did not always translate into propagation skill gains, particularly over the IO, underscoring the complexity of dynaical responses.

How to cite: Kim, G., Shin, S.-H., and Lee, K.-J.: Process-based understanding of improved MJO propagation across the Maritime Continent in GloSea6, EGU General Assembly 2026, Vienna, Austria, 3–8 May 2026, EGU26-3247, https://doi.org/10.5194/egusphere-egu26-3247, 2026.

EGU26-3378 | ECS | Orals | AS1.28

Linking upper-tropospheric dynamics to precipitation changes and extremes in the MENA region: insights from idealized experiments 

Andreas Karpasitis, Panos Hadjinicolaou, and George Zittis

Future climate change is projected to substantially alter the precipitation patterns across subtropical regions of the planet. These precipitation changes are largely attributed to modifications of upper-tropospheric dynamics. Idealized climate simulations with stabilized global warming levels (GWLs) provide a controlled framework to investigate these responses in detail. In this study, we focus on the MENA region, a pronounced climate change hotspot, which is expected to be extensively affected by the shifting precipitation patterns. We identify the changes in the precipitation patterns and extremes for different global warming levels, and we link these changes to changes in the upper tropospheric dynamics. Specifically, we diagnose shifts in convergence regions and their associated changes in the large-scale vertical motion in the troposphere. In addition, we study changes in the Rossby wave patterns and amplitude, and the associated transient eddy activity.  Finally, we explore how these dynamical changes modulate extreme precipitation events over MENA, thereby clarifying the physical drivers of the region’s emerging hydroclimatic risks under warming.

How to cite: Karpasitis, A., Hadjinicolaou, P., and Zittis, G.: Linking upper-tropospheric dynamics to precipitation changes and extremes in the MENA region: insights from idealized experiments, EGU General Assembly 2026, Vienna, Austria, 3–8 May 2026, EGU26-3378, https://doi.org/10.5194/egusphere-egu26-3378, 2026.

EGU26-3922 | Posters on site | AS1.28 | Highlight

The 2024 Hajj heat disaster: a glimpse into the future 

George Zittis, Tommaso Alberti, Mansour Almazroui, Fatima Driouech, Davide Faranda, Diana Francis, Panos Hadjinicolaou, Mehmet Levent Kurnaz, Georgia Lazoglou, Grigory Nikulin, Sergey Osipov, Tugba Ozturk, Georgiy Stenchikov, Meryem Tanarhte, Rashyd Zaaboul, and Jos Lelieveld

Extreme heat events in the Middle East have become increasingly frequent and intense due to human-driven climate change. During the Hajj pilgrimage in Mecca, Saudi Arabia, in June 2024, temperatures soared to a record-breaking 51.8°C, resulting in the tragic deaths of at least 1,300 pilgrims and over 2,700 non-fatal injuries on 16 June alone. Considering that the intensity and persistence of this heatwave exceed all recorded analogues in the available historical record, it may be considered statistically unprecedented within the context of the observed climate. Our analysis of future projections, tailored for the region, indicates that in a warmer climate, we can expect such devastating events to become a regular occurrence, potentially happening every year. In the hottest scenarios, the absolute maximum temperatures in Mecca are projected to reach or exceed 57°C. Addressing these challenges through effective climate mitigation and adaptation is essential to building resilience against future extreme heat risks.

How to cite: Zittis, G., Alberti, T., Almazroui, M., Driouech, F., Faranda, D., Francis, D., Hadjinicolaou, P., Kurnaz, M. L., Lazoglou, G., Nikulin, G., Osipov, S., Ozturk, T., Stenchikov, G., Tanarhte, M., Zaaboul, R., and Lelieveld, J.: The 2024 Hajj heat disaster: a glimpse into the future, EGU General Assembly 2026, Vienna, Austria, 3–8 May 2026, EGU26-3922, https://doi.org/10.5194/egusphere-egu26-3922, 2026.

EGU26-4642 | ECS | Orals | AS1.28

The Energy-Pump Mechanism Behind Dubai ‘16•4’ Record-Breaking Rainfall 

Yuan Liu, Jianping Li, Yang Zhao, HongYuan Zhao, and Emerson DeLarmea

Located in the subtropics, the record-breaking extreme rainfall (ER) that struck Dubai on April 16, 2024, provides a high-impact case for diagnosing subtropical jet–moist-convection coupling from an energetics perspective. This study applies the perturbation potential energy (PPE) framework to diagnose the energetics of this event. We develop an energetically closed, self-reinforcing energy-pump feedback mechanism, identify extreme conditions using the Rank Attribution Method relative to the 1979–2024 baseline, and quantify moisture source contributions using the Water Accounting Model (WAM). The energetics exhibit clear precursors, with stratospheric PPE and upper-tropospheric perturbation kinetic energy (PKE) becoming significantly anomalous 24–48 h before rainfall onset. Critically, as the bridge between PPE and PKE, the perturbation conversion from PPE to PKE term (PCK) leads to rainfall by about 2 h and effectively anchors both subsequent intensity and the primary rainband. When PCK intensifies, PKE increases in both the upper and lower troposphere, enhancing upper-tropospheric divergence and lower-tropospheric convergence; ascent then accelerates and rainfall amplifies. Latent heating (LH) further warms the column, increases PPE, and strengthens conversion, closing the positive energy-pump feedback loop (LH–PPE–PCK–PKE–LH) that sustains deep convection. Two distinct episodes in this event share this mechanism but differ dynamically: Process I is upper-level dominated and primarily jet-divergence forced, whereas Process II is lower-tropospheric dominated with stronger moisture transport, producing a more rapid rise to peak intensity. Moisture sourcing is dominated by the northwestern Arabian Sea (50.4%), with secondary contributions from the Red Sea (8.2%), the Gulf of Aden (6.7%), and the eastern Mediterranean (4.5%). These results deepen understanding of the energetics of ER over the Arabian Peninsula and highlight PCK as a physically based early-warning indicator for forecasting and risk assessment.

How to cite: Liu, Y., Li, J., Zhao, Y., Zhao, H., and DeLarmea, E.: The Energy-Pump Mechanism Behind Dubai ‘16•4’ Record-Breaking Rainfall, EGU General Assembly 2026, Vienna, Austria, 3–8 May 2026, EGU26-4642, https://doi.org/10.5194/egusphere-egu26-4642, 2026.

The Arabian Peninsula (AP) has an arid climate with the whole annual precipitation falling in non-summer months, high levels of ambient dust, and extreme surface temperatures. The characteristics of the climate of the AP changed comprehensively since the late 1990s. The climate of the region is closely tied to the baroclinic activity mediated by the subtropical jet stream flowing over the northern region of the Peninsula. Synoptic disturbances on the Subtropical Jet over the Arabian Peninsula create and regulate most of the weather patterns in the region. The STJ has a high Ertel's potential vorticity gradient that acts as a restoring force for disturbances. Rossby waves formed by these disturbances create mid- and upper-level vortices downstream of the STJ exit, causing precipitation, deep convection, dust storms, and turbulent winds at the surface as they travel south. Changes in the STJ can cause significant variations in the frequency and strength of these disturbances, altering the region's climate. Here I show that there have been significant changes in the baroclinic activity after 1998: (a) the magnitude of the PV gradient in the region of the maximum PV gradient (MGPV) has decreased, and (b) the mean location of the latitude of the MGPV has generally moved north,. These changes resulted in lowered convection an increased stability of the region. CRU data shows that there have been abrupt changes in several climate variables in 1998: the mean and variance before and after 1998 are different. Thus, the distributions of climate variables changed before and after 1998. Abrupt changes in climate variables cannot be explained in a slowly changing climate. Here we decompose the mean meridional temperature gradient into its intrinsic constituent frequency components using Empirical Mode Decomposition, and show that: (a) the high frequency components gain strength after 1998, and (b) the low frequency components have a reduced magnitude after 1998. These time-frequency changes in terms of frequency and amplitude result in abrupt changes in almost all the climate variables.

These changes are likely to destabilize the sustainability of the region. Further, I will also discuss the implications of such an abrupt comprehensive climate change in the Arabian Peninsula, and keep the results in the context of global climate change.

How to cite: Gunturu, U. B.: Abrupt climate change in the Arabian Peninsula mediated by the subtropical jet stream dynamics, EGU General Assembly 2026, Vienna, Austria, 3–8 May 2026, EGU26-6352, https://doi.org/10.5194/egusphere-egu26-6352, 2026.

The Southern Hemisphere polar vortex provides a key pathway for stratosphere–troposphere coupling and can influence Australian spring and summer climate, including extreme heat, drought, and fire weather. However, the extent to which this coupling depends on the phase of the Quasi-Biennial Oscillation (QBO) remains unclear. Here, we assess how the QBO modulates the influence of polar-vortex variability on Australian spring and summer climate.

Using ERA5 reanalysis, we define a weak-vortex index based on polar-cap temperature at 100 hPa (Temp100; 65–90°S), where anomalously warm Temp100 indicates weak-vortex conditions. Associated circulation and surface anomalies are diagnosed using regression and composite analyses, conducted separately for easterly (EQBO) and westerly (WQBO) QBO phases. Downward propagation of stratospheric anomalies is examined using height–time regressions of polar-cap geopotential height and temperature. Tropospheric coupling is quantified through correlations with the Southern Annular Mode (SAM) index and Australian near-surface temperature.

Weak-vortex events are characterised by anomalous polar-cap warming and coherent stratospheric height anomalies that descend toward the lower stratosphere. The timing of this downward influence exhibits a pronounced dependence on the QBO phase. During EQBO, the tropospheric response is delayed, emerging in November and persisting into mid-December, whereas under WQBO the surface response is largely confined to October. Temp100 is negatively correlated with the SAM index in both QBO phases, but peak coupling occurs in November–December during EQBO and in October during WQBO. Australian near-surface temperature shows corresponding seasonality and distinct spatial patterns. Under EQBO, warming is strongest over southeastern Australia in November and shifts toward northeastern regions in December. Under WQBO, warming emerges over northern Australia in October, while cooling dominates southern regions.

These results highlight the QBO as a key modulator of Southern Hemisphere polar-vortex variability and its downward influence, identifying a potential source of extended-range predictability for regional Australian climate. Ongoing work will quantify impacts on heat and fire-weather extremes, test sensitivity to event definitions, and assess whether subseasonal forecast systems reproduce the observed QBO dependence.

How to cite: Jiang, X., Love, P., and Marshall, A.: Weak Polar Vortex Events and QBO Modulation: Pathways Linking Stratospheric Variability to Australian Heat and Fire Risk, EGU General Assembly 2026, Vienna, Austria, 3–8 May 2026, EGU26-7086, https://doi.org/10.5194/egusphere-egu26-7086, 2026.

Summer rainfall over eastern China is shaped by interactions between the East Asian monsoon and mid–high latitude circulation regimes. The Northeast China Cold Vortex (NCCV), a cut-off low over East Asia and the western Pacific, plays a central yet poorly understood role in modulating large-scale rainfall patterns and the timing and meridional position of summer rain belts. Here, we investigate the summer manifestation of NCCV activity using long-term reanalysis and gridded precipitation datasets from a circulation-regime perspective.

NCCVs are identified from 500-hPa geopotential height and temperature minima using a set of simplified, consistently applied detection schemes formulated under different constraint conditions across ERA5, NCEP/NCAR, and CRA reanalyses, yielding an ensemble NCCV dataset. Summer precipitation characteristics of the three major rain belts—Meiyu, North China, and Northeast China—are objectively quantified using five independent precipitation datasets (MSWEP, ERA5, NCEP/NCAR, CRA, and CPC), including onset, withdrawal, duration, accumulated precipitation, and a composite precipitation index.

Composite differences between years of exceptionally high and low NCCV activity, selected using strict criteria based on NCCV frequency and rain-belt precipitation indices, reveal a robust, recurring three-dimensional circulation regime. A pronounced dry–wet boundary emerges between 30°–40°N, accompanied by a meridional dipole in 500-hPa geopotential height and temperature, with positive anomalies to the south and negative anomalies to the north. This pattern persists throughout June–August but exhibits systematic seasonal migration, with the latitude of maximum upper-tropospheric westerly anomalies shifting northward from ~30°N in June to ~40°N in August.

Vertical cross-sections of the same composite differences further reveal pronounced meridional asymmetry, characterized by upper-tropospheric westerly wind anomalies near 40°N and deep-tropospheric easterly wind anomalies near 55°N. These anomalies are collocated with sharply tilted extrema in potential temperature and geopotential height, with a sign reversal in potential temperature across ~200 hPa and a coincident geopotential height anomaly maximum, indicating the dominance of meridional dynamical processes rather than purely zonal adjustments. Convergent meridional flow emerges as a preferred environment for NCCV development and precipitation enhancement, while thermal anomalies in the tropical upper atmosphere (10–100 hPa) may play a role in modulating the background westerly strength and the excitation of NCCV-related precipitation over eastern China.

Across datasets, NCCV activity primarily regulates summer rainfall over eastern China by shifting the timing and meridional position of regional rain belts rather than uniformly intensifying precipitation. Significant linkages are identified with Meiyu rainfall amount, the onset and withdrawal of North China rainfall, and the duration of Northeast China rainfall. Together, these results establish a physically interpretable circulation regime through which mid–high latitude systems interact with the monsoon to shape East Asian summer rainfall, offering robust observational constraints for future dynamical studies.

How to cite: Zhang, N.: When Mid–High Latitude Systems Meet the Monsoon:How the Northeast China Cold Vortex Regulates Summer Rain-Belt Timing and Meridional Shifts, EGU General Assembly 2026, Vienna, Austria, 3–8 May 2026, EGU26-8760, https://doi.org/10.5194/egusphere-egu26-8760, 2026.

EGU26-9468 | ECS | Posters on site | AS1.28

Sub-seasonal predictability of heavy precipitation–associated cyclones in the Sahara 

Moshe Armon, Guorong Ling, and Hilla Afargan-Gerstman

Heavy precipitation events (HPEs) are a precious source of water in the Sahara, but they also trigger potentially devastating flooding. Saharan HPEs are strongly associated with surface cyclones, making accurate cyclone forecasting crucial for predicting hydrometeorological hazards and their impacts. In this study, we investigate the predictability of HPE-associated cyclones across the Sahara and its drivers. We use ERA5 reanalysis between December 2000 and November 2020 to evaluate ensemble ECMWF reforecasts and to identify the atmospheric conditions controlling forecast skill. Short-, medium-, and extended-range forecast skill is evaluated based on the overlapping areas of observed and forecasted cyclones over the Sahara. Results show that the lead time of skilful prediction is up to about 10 days. On short-range lead times, forecast skill is higher in winter, whereas on medium to extended lead times, skill is higher in summer and fall. In winter, when cyclones are mainly located in the northern Sahara, forecast skill is higher for deeper cyclones. In summer, skill is higher for cyclones located in the southwestern Sahara. Rossby wave patterns extending over the North Atlantic are associated with both high and low skill forecasts, highlighting a flow-dependent control on predictability over the Sahara and underscoring the need for more detailed investigation. These findings show key characteristics of skilful HPE-associated cyclone forecasts on timescales of a few days to two weeks in advance. Understanding these variations across regions and seasons is key to improving the predictability of HPEs and their related impacts.

How to cite: Armon, M., Ling, G., and Afargan-Gerstman, H.: Sub-seasonal predictability of heavy precipitation–associated cyclones in the Sahara, EGU General Assembly 2026, Vienna, Austria, 3–8 May 2026, EGU26-9468, https://doi.org/10.5194/egusphere-egu26-9468, 2026.

EGU26-9909 | Posters on site | AS1.28

 The influence of El Niño-Southern Oscillation on cool-season precipitation variability in the arid Middle East 

Andries Jan De Vries, Steven B. Feldstein, Jake W. Casselman, Georgios Fragkoulidis, Jos Lelieveld, and Daniela I.V. Domeisen

Interannual variability in precipitation across the arid Middle East has profound societal and environmental importance. While previous studies have identified a linkage between El Niño-Southern Oscillation (ENSO) and interannual precipitation variability in this region, this relationship and the underlying mechanisms are not fully understood. Using observation-based datasets and a range of diagnostics, this study quantifies the influence of ENSO on Middle Eastern precipitation variability during the extended cool season (October-May) and explores the underlying atmospheric drivers. Consistent with previous studies, we find that El Niño is associated with increased precipitation, whereas La Niña is associated with decreased precipitation. This relationship varies substantially within the cool season with a strong precipitation increase during autumn and a modest increase in spring under El Niño conditions, and a persistent precipitation decrease throughout the cool season under La Niña conditions. These precipitation anomalies during El Niño (La Niña) are associated with an equatorward (poleward) displacement of the subtropical jet along with increased (decreased) Rossby wave breaking frequencies at the poleward flank of the jet and underneath the jet core. Simultaneously, a mid-tropospheric cyclonic (anticyclonic) circulation anomaly over the Middle East promotes strengthened (weakened) atmospheric moisture transport into the region leading to enhanced (reduced) atmospheric moisture content across the region. From a global perspective, these regional circulation patterns result from (1) a zonally symmetric shift in the meridional position of the subtropical jet, (2) a barotropic Rossby wave response reaching from the tropical Pacific toward the Middle East via the extratropics, and (3) a baroclinic response in the tropical circulation extending westwards over the Indian Ocean and South Asia consistent with the Gill-Matsuno model. Co-varying circulation patterns over the Indian Ocean, linked to the Indian Ocean Dipole, contribute to the intraseasonally varying and asymmetric influence of ENSO on Middle Eastern precipitation. Our findings advance process understanding of precipitation variability in the water-scarce Middle East, having implications for seasonal predictions, flood and drought warnings, and the evaluation of climate model projections.

How to cite: De Vries, A. J., Feldstein, S. B., Casselman, J. W., Fragkoulidis, G., Lelieveld, J., and Domeisen, D. I. V.:  The influence of El Niño-Southern Oscillation on cool-season precipitation variability in the arid Middle East, EGU General Assembly 2026, Vienna, Austria, 3–8 May 2026, EGU26-9909, https://doi.org/10.5194/egusphere-egu26-9909, 2026.

EGU26-11724 | ECS | Posters on site | AS1.28

A tropical Pacific convection ENSO index suitable for measuring the impact of ENSO on the East Asian winter monsoon 

Jia Huang, Renhe  Zhang, and Yanke Tan

The current El Niño-Southern Oscillation (ENSO) indices are defined based on the sea surface temperature anomalies (SSTAs) in different regions of the equatorial Pacific. Considering that the impact of ENSO on the large-scale atmospheric circulation is mainly through the release of latent heat associated with convection anomalies, we found a zonal dipole distribution of convection anomalies expressed by outgoing long wave radiation anomalies (OLRAs) over the central-western tropical Pacific, which links well with both the ENSO and the East Asian winter monsoon (EAWM). A new index (ITC) based on the anomalous tropical Pacific convection dipole is thus defined to measure ENSO and its impact on EAWM. It is illustrated that the new index ITC can well represent ENSO events. Detailed comparisons are made for the differences in the connections of each ENSO index with the EAWM indices, precipitation and atmospheric circulation over East Asia in winter. It is demonstrated that the ITC is more closely related to the EAWM and can better depict the impact of ENSO on the precipitation and atmospheric circulation over East Asia than the ENSO indices defined by SSTAs .The new ENSO index ITC can act as a single representative among the numerous existing ENSO indices in understanding, monitoring and predicting the impact of ENSO on the EAWM,eliminating the uncertainty and inconvenience that numerous existing ENSO indices defined by SSTAs may have caused.

How to cite: Huang, J.,  Zhang, R., and Tan, Y.: A tropical Pacific convection ENSO index suitable for measuring the impact of ENSO on the East Asian winter monsoon, EGU General Assembly 2026, Vienna, Austria, 3–8 May 2026, EGU26-11724, https://doi.org/10.5194/egusphere-egu26-11724, 2026.

EGU26-13690 | ECS | Orals | AS1.28

Mechanisms of South Pacific hydroclimate variability on decadal to multi-decadal time scales 

Connor Robbins, Daniel Skinner, Gordon Inglis, Manoj Joshi, Peter Langdon, Adrian Matthews, Mark Peaple, Timothy Osborn, and David Sear

The South Pacific Convergence Zone (SPCZ) is the dominant perennial rainfall feature of the Southern Hemisphere, yet the physical mechanisms driving its variability on decadal to multi-decadal timescales remain poorly constrained. Using prescribed sea-surface temperature (SST) perturbations in the atmosphere-only IGCM4 model, we investigate how three major modes of low-frequency climate variability – the Inter-decadal Pacific Oscillation (IPO), Atlantic Multi-decadal Variability (AMV), and Southern Ocean SST-driven mid-latitude jet shifts – modulate South Pacific hydroclimate. IPO forcing produces the most substantial and spatially coherent SPCZ response: a positive (negative) IPO anomaly drives a north-eastward (south-westward) shift in the SPCZ. This behaviour arises from coupled dynamic and thermodynamic dynamic changes, with anomalous moisture convergence – rather than altered Rossby wave refraction – emerging as the dominant control on SPCZ position. By contrast, AMV-forced atmospheric tele-connections exert only weak and statistically insignificant impacts on South Pacific precipitation; any apparent signal is best interpreted as an alias of IPO-like SST anomalies in  the Pacific. Southern Ocean SST anomalies induce significant shifts in the Southern Hemisphere mid-latitude jet and associated Hadley–Ferrel cell  structure, but these changes do not generate a coherent SPCZ displacement. Instead, precipitation anomalies reflect large-scale regions of anomalous  ascent and descent, driven by Hadley and Ferrel cell shifts, rather than modifications to SPCZ dynamics.

How to cite: Robbins, C., Skinner, D., Inglis, G., Joshi, M., Langdon, P., Matthews, A., Peaple, M., Osborn, T., and Sear, D.: Mechanisms of South Pacific hydroclimate variability on decadal to multi-decadal time scales, EGU General Assembly 2026, Vienna, Austria, 3–8 May 2026, EGU26-13690, https://doi.org/10.5194/egusphere-egu26-13690, 2026.

EGU26-13880 | ECS | Orals | AS1.28

Seasonal and synoptic scale circulation linked to dry spring conditions in Brazil 

Iago Perez and Marcia Zilli

Brazilian spring (SON) of 2023 was marked by the occurrence of heatwaves and droughts in the tropics as well as extreme daily rainfall produced by a series of extratropical cyclones in subtropical latitudes. These events were (partially) attributed to a persistent ridge over western subtropical South Atlantic which blocked the propagation of extratropical disturbances further equatorward over Brazil. El Niño conditions further intensified the tropical subsidence, contributing to the tropical drought. Here, we assess whether this combination of extreme events was just only a coincidence or could be attributed to a new emerging trend. We compared two periods (1979-1993 and 2009-2024) using ERA5 upper-level (300hPa) circulation during austral spring (SON), we identify a strengthening of the polar jet over South Pacific and the weakening (strengthening) of the subtropical jet over South Pacific (South America) that favours (hinders) the propagation of synoptic-scale  (planetary scale) RW towards subtropical South America. We evaluate the extent to which some of these changes  may emerge from the displacement and change of intensity of the tropical and subtropical convection, which is the dominant diabatic control on the intensity and location of the Rossby Wave Sources over the (sub)tropical Pacific. Finally, we evaluate the connection between the seasonal changes in large-scale circulation and the synoptic-scale events throught changes in the activity of Rossby Wave Packets (RWPs) and Rossby Wave Breaking (RWB) events over the region. These provisional results provide insight about changes in the interaction between diabatic forcing, Rossby waves, and synoptic-scale circulation contributing to compound extreme events like those observed over South America in 2023.

How to cite: Perez, I. and Zilli, M.: Seasonal and synoptic scale circulation linked to dry spring conditions in Brazil, EGU General Assembly 2026, Vienna, Austria, 3–8 May 2026, EGU26-13880, https://doi.org/10.5194/egusphere-egu26-13880, 2026.

Large-scale tropical and extratropical responses to anthropogenic warming are well studied. These include mean poleward shifts of the extratropical jet streams and expansion of Hadley cells. Debate about the interaction between the two in changing the poleward limit of the Hadley cell continues. However, this literature has limited focus on subtropical drying. Hadley cell expansion does appear a leading candidate for the observed and projected winter drying across the mediterranean climates of the Southern Hemisphere. But the most unambiguous drying signal in climate model projections is in the southern monsoons and their extensions during austral spring (September-November). In this contribution, we argue that understanding this drying requires new climate theory developed with a specific subtropical dynamics lens.

Subtropical westerly flow on the edge of tropical convective hotspots allows the propagation of synoptic-scale Rossby waves into low latitudes. The propagation of these extatropical upper-level westerly waves towards the tropics is known to modulate rainfall across subtropical deserts, monsoons, and monsoon extensions.

The unique geographic distribution of ocean and land in the Southern Hemisphere preferentially supports such wave propagation and absorption into three well-defined subtropical convergence zones in the South Pacific, Atlantic, and Indian Oceans. While the subtropical belt is a zone of mean subsidence, hence the large deserts, frequent synoptic-scale interaction between upper-level westerly waves and tropically-sourced warm humid air intermittently overcomes this mean subsidence in these subtropical convergence zones. The resulting tropical-extratropical cloud bands produce much of the rainfall supporting the water resources and agro-economies across southern Africa, the South Pacific Islands, and South America.

Here, we present contemporary trends of decline in these cloud bands which are projected to continue under planetary warming. These trends are most robust in austral spring (October-November), coinciding with delays to the onset of southern monsoons. Declines in cloud bands are partially associated with poleward shifts of the eddy-driven jet, however, analysis of the annual cycle shows that across the CMIP model ensembles the equinoctial switch of the Hadley cell from the southern into the northern hemisphere is delayed about one month. This delayed switch explains a relative enhancement of subtropical subsidence during austral spring which is reflected in monsoonal dynamics, especially over South America and Southern Africa.

How to cite: Hart, N.: Subtropical dynamics and change and their influence on the monsoons, especially in the Southern Hemisphere., EGU General Assembly 2026, Vienna, Austria, 3–8 May 2026, EGU26-19926, https://doi.org/10.5194/egusphere-egu26-19926, 2026.

EGU26-20465 | Posters on site | AS1.28

The Link Between Rossby Wave Breaking and the Maintenance of Tropical-Extratropical Cloud Bands over the South Pacific 

Romain Pilon, Andries de Vries, and Daniela Domeisen

Tropical-extratropical cloud bands are elongated cloud structures bridging tropical and midlatitude regions, and play an important role in the hydrological cycle. While the role of Rossby wave breaking in the formation of cloud bands is established, the extent to which this dynamic precursor governs their formation, duration, spatial distribution, and seasonality has not yet been systematically quantified. In this study, we use an object-based approach applied to reanalysis data to investigate how stratospheric potential vorticity (PV) intrusions, as indicators of Rossby wave breaking, influence cloud band formation and persistence over the South Pacific region. Our climatological analysis confirms a robust statistical link, in which cyclonic PV anomalies steer tropical moisture poleward and eastward and shape the diagonal orientation of the cloud bands. We also reveal that the longevity of cloud bands is modulated by the properties of PV structures: long-lived cloud bands are sustained by persistent PV intrusions that penetrate significantly farther equatorward than those associated with transient events. These findings highlight that equatorward-breaking Rossby waves create a tropospheric environment not only favouring the formation but also the maintenance of tropical-extratropical cloud bands. Consequently, accurately resolving PV intrusion forcing is critical for improving the predictability of cloud band duration and associated precipitation.

How to cite: Pilon, R., de Vries, A., and Domeisen, D.: The Link Between Rossby Wave Breaking and the Maintenance of Tropical-Extratropical Cloud Bands over the South Pacific, EGU General Assembly 2026, Vienna, Austria, 3–8 May 2026, EGU26-20465, https://doi.org/10.5194/egusphere-egu26-20465, 2026.

EGU26-1447 | ECS | Posters on site | CR7.3

Spatio-temporal patterns of dust storms and population exposure across land use and land cover types 

Yeganeh Soleimani, Hassan Dashtian, Amir AghaKouchak, Kaveh Madani, and Nima Shokri

Dust storms are driven by land-atmosphere interaction that transport dust and sand particles over vast distances. Dust storms have far-reaching impacts on air quality, ecosystems and human health, that affect hundreds of millions of people worldwide each year. Recognizing the importance of mitigating dust storm events and impacts, the United Nations has declared 2025-2034 as the Decade on Combating Sand and Dust Storms. However, a comprehensive understanding of the global distribution, seasonality, and land-surface controls of dust storm events remains limited, largely due to the lack of consistent ground-based, long-term, globally measured datasets.

NASA’s Atmospheric Infrared Sounder (AIRS) satellite provides a valuable global record of dust indicators, and analyzing these data enables large-scale tracking of where dust storm events occur and how their intensity evolves over time. In this study we analyze monthly dust storm data of AIRS satellite from 2003 to 2023 to show the global spatiotemporal trends in dust storms. In addition to mapping the spatial and temporal distribution of these events, we estimate the population affected by dust storms each year and assessed the intensity and frequency of these events across different land cover types. The study enables a better understanding of the regions and populations most at risk and provides valuable insights for policymakers and planners to develop strategies for mitigating the impacts of dust storms on human health, agriculture, and infrastructure.

How to cite: Soleimani, Y., Dashtian, H., AghaKouchak, A., Madani, K., and Shokri, N.: Spatio-temporal patterns of dust storms and population exposure across land use and land cover types, EGU General Assembly 2026, Vienna, Austria, 3–8 May 2026, EGU26-1447, https://doi.org/10.5194/egusphere-egu26-1447, 2026.

Snow cover can significantly influence climate via modulating surface energy balance, yet its cross-seasonal impacts on Arctic temperatures remain poorly understood. Here, based on diagnostic analysis and numerical experiments, we reveal a robust linkage between reduced early spring (March-April) snow water equivalent (SWE) in northern Europe and increased May-June-July (MJJ) 2m air temperature over the East Siberian-Chukchi Sea during 1951–2022. Specifically, March-April SWE negative anomaly can persist to June and result in drier surface conditions due to reduced snowmelt. It led to elevated turbulent heat fluxes and positive geopotential height anomalies over northern Europe via snow-albedo and snow-hydrological effects during April-May-June. Hence, the eastward-propagating wave train enhanced over northern Europe and reaches South Siberia, causing cyclonic activity and enhanced precipitation. The resultant soil moisture increases persist into MJJ, favoring less sensible heat fluxes, upward wave activity flux, and wave train poleward-propagation. Finally, an anticyclonic anomaly appears over East Siberian-Chukchi Sea, enhancing anomalous descending motion, water vapor and downward longwave radiation, collectively raising near-surface temperatures. Moreover, numerical experiments successfully reproduce this cascade of mechanisms, confirming the physical pathway. Our study provides a new perspective for the studies of the snow cover climate effect, especially its impacts to the Arctic temperature variability.

How to cite: Wei, Z. and Ma, L.: Mechanism of Cross-Seasonal Response of Arctic Temperature to Eurasian Early Spring Snow Loss: The Critical Roles of Soil Moisture and Stationary Wave Propagation, EGU General Assembly 2026, Vienna, Austria, 3–8 May 2026, EGU26-2661, https://doi.org/10.5194/egusphere-egu26-2661, 2026.

EGU26-3486 | Orals | CR7.3

Drivers of observed winter–spring sea-ice and snow thickness at a coastal site in East Antarctica 

Ricardo Fonseca, Diana Francis, Narendra Nelli, Petra Heil, Joanathan Wille, Irina Gorodetskaya, and Robert Massom

Antarctic sea ice and its snow cover play a pivotal role in regulating the global climate system through feedback on both the atmospheric and the oceanic circulations. Understanding the intricate interplay between atmospheric dynamics, mixed-layer properties, and sea ice is essential for accurate future climate change estimates. This study investigates the mechanisms behind the observed sea-ice and snow characteristics at a coastal site in East Antarctica using in situ measurements in winter–spring 2022. The observed sea-ice thickness peaks at 1.16 m in mid–late October and drops to 0.06 m at the end of November, following the seasonal solar cycle. On the other hand, the snow thickness variability is impacted by atmospheric forcing, with significant contributions from precipitation, Foehn effects, blowing snow, and episodic warm and moist air intrusions, which can lead to changes of up to 0.08 m within a day for a field that is in the range of 0.02–0.18 m during July–November 2022. A high-resolution simulation with the Polar Weather Research and Forecasting model for the 14 July atmospheric river (AR), the only AR that occurred during the study period, reveals the presence of AR rapids and highlights the effects of katabatic winds from the Antarctic Plateau in slowing down the low-latitude air masses as they approach the Antarctic coastline. The resulting convergence of the two airflows, with meridional wind speeds in excess of 45 m s−1, leads to precipitation rates above 3 mm h−1 around coastal Antarctica. The unsteady wind field in response to the passage of a deep low-pressure system with a central pressure that dropped to 931 hPa triggers satellite-derived pack ice drift speeds in excess of 60 km d−1 and promotes the opening up of a polynya in the Southern Ocean around 64° S, 45° E from 14 to 22 July. Our findings contribute to a better understanding of the complex interactions within the Antarctic climate system, providing valuable insights for climate modeling and future projections.

How to cite: Fonseca, R., Francis, D., Nelli, N., Heil, P., Wille, J., Gorodetskaya, I., and Massom, R.: Drivers of observed winter–spring sea-ice and snow thickness at a coastal site in East Antarctica, EGU General Assembly 2026, Vienna, Austria, 3–8 May 2026, EGU26-3486, https://doi.org/10.5194/egusphere-egu26-3486, 2026.

Large-scale atmospheric circulation exerts a dominant control on the surface mass balance (SMB) of the Greenland Ice Sheet, yet circulation classifications are often optimized for atmospheric variability rather than for surface impacts. Here, we present an impact-oriented classification approach that emphasizes those regions of large-scale atmospheric circulation that are most relevant for Greenland’s SMB. Daily summer (June-August) 500 hPa geopotential height fields over a North Atlantic-Arctic domain encompassing Greenland are classified using self-organizing maps (SOMs). Prior to classification, the geopotential height fields are weighted based on their correlation with Greenland-wide SMB derived from a regional climate model (Modèle Atmosphérique Régional), such that regions exhibiting a strong linkage to SMB variability influence the circulation classification more. The weighting is derived from correlation patterns between geopotential height anomalies and Greenland-wide SMB anomalies, with a scaling factor systematically varied and selected to maximize both the separation of SMB characteristics across circulation regimes and the distinctness of the associated geopotential height composites. The resulting classification yields a set of circulation types that closely relate to differences in Greenland-wide SMB. Compared to unweighted SOM classifications, the impact-weighted approach enhances the separation of SMB responses across circulation regimes. By further analyzing the evolution of circulation regimes and their impact on Greenland’s SMB over time, we aim to improve understanding of changes in large-scale drivers relevant for the Greenland Ice Sheet mass loss.

How to cite: Fipper, J., Sasgen, I., and Abermann, J.: Connecting large-scale atmospheric circulation with Greenland's surface mass balance variability by impact-weighted self-organizing maps, EGU General Assembly 2026, Vienna, Austria, 3–8 May 2026, EGU26-3859, https://doi.org/10.5194/egusphere-egu26-3859, 2026.

EGU26-5491 | ECS | Orals | CR7.3

Attributing atmospheric phenomena driving Greenland Ice Sheet melt and their future changes 

Andrea Vang, Marco Muccioli, André Düsterhus, Hjalte Jomo Danielsen Sørup, Priscilla Mooney, and Jens Hesselbjerg Christensen

Compound warm and wet atmospheric events play a key role in driving extreme melt of the Greenland Ice Sheet (GIS), yet the relative contribution of different atmospheric phenomena remains poorly quantified. While atmospheric rivers (ARs) are frequently associated with extreme melt episodes, a systematic attribution of GIS melt to distinct types of atmospheric circulation features is still lacking.

Here, we apply a modified version of the Multi Object Analysis of Atmospheric Phenomena (MOAAP) tracking algorithm, optimized for Arctic conditions, to identify and track ARs, cyclones, jets, and frontal systems over Greenland. We quantify precipitation from each phenomenon. Together with temperature anomalies and surface melt, we relate these to individual phenomena and their compound occurrences. Extreme melt events are identified based on runoff, and attribution is performed by relating runoff to the presence and overlap of tracked phenomena over the ice sheet.

The analysis is applied to ERA5 reanalysis data and to PolarRES regional climate model projections. PolarRES includes a historical period and two RCP4.5 simulations representing distinct storylines. The first is characterized by enhanced Arctic amplification, which refelcts stronger local feedbacks. The second by reduced sea ice cover, which can indicate patterns of change is driven more by sea-ice loss and associated surface processes than by relative amplification of near-surface atmospheric warming. Using these scenarios allows us to investigate how differences in large-scale thermodynamic conditions may influence the atmospheric drivers of GIS melt, while applying the same phenomenon-based attribution framework across present-day and future climates.

By combining Arctic-optimized tracking of atmospheric phenomena with a GIS melt attribution framework, we investigate how extreme GIS melt events relate to specific atmospheric configurations and how these relationships may change under enhanced Arctic amplification or reduced sea ice. This study aims to improve our understanding of compound warm–wet events, their links to different types of atmospheric phenomena, and their role in GIS melt, as well as how they will shape the future GIS melt in climate projections.

How to cite: Vang, A., Muccioli, M., Düsterhus, A., Jomo Danielsen Sørup, H., Mooney, P., and Hesselbjerg Christensen, J.: Attributing atmospheric phenomena driving Greenland Ice Sheet melt and their future changes, EGU General Assembly 2026, Vienna, Austria, 3–8 May 2026, EGU26-5491, https://doi.org/10.5194/egusphere-egu26-5491, 2026.

EGU26-8348 | ECS | Orals | CR7.3

Impact of multi-mode and multi-species aerosols on 1D snow simulation at observational sites distributed at different latitudes. 

Sujith Krishnakumar, Martin Ménégoz, Samuel Albani, Christophe Dumas, Catherine Ottlé, Marie Dumont, Charles Amory, Philippe Conesa, and Yves Balkanski

Snow plays a critical role in energy budget by reflecting a significant portion of incoming solar radiation, thereby influencing local and global climate dynamics. However, the state-of-the-art climate models still face challenges to simulating global snow amount partly due to inadequate representation of snow albedo. Current models predominately parameterize snow albedo as an age-dependent, exponentially decaying function, which oversimplify its complexity. Also, most of these models neglect the deposition of aerosols (such as dust, black and organic carbons) and their ability of absorbing visible part of solar radiation, leading to reduced albedo and accelerated snowmelt. This “snow darkening effect” process is essential for improving the transient simulation of snow for climate and enhancing our understanding of climate feedback mechanism. To incorporate this phenomenon in ORCHIDEE, the land surface component of IPSL’s Earth System Model, we have implemented a comprehensive tracer framework that simulate the deposition and vertical transport of four log-normal modes of dusts, hydrophobic and hydrophilic black and organic carbons within snowpack. In order to enhance the snow aging processes, a snow metamorphism approach has been used that explicitly simulates the physical evaluation of snow optical diameter and sphericity, rather than relying on a simple chronological aging parametrization. To replace the empirically decaying albedo parametrization with a physics-based impure snow albedo, we have employed unique combination of Warren-Wiscombe’s uni-directional snow radiative transfer scheme with online optical property calculations of snow using Khokhanovsky’s scheme and mie-theory based offline aerosol optical properties. This enhanced physical representation of snow albedo dynamics. For validation against observation, offline ORCHIDEE simulations are conducted using in-situ meteorological forcing and MERRA-2 reanalysis aerosol deposition data across observation sites localized in different climatic areas over the Earth. These sites are selected to represent different aerosols regimes, each characterized by distinct dominant aerosol species. In these simulations, as snowpack develops seasonally, it harnesses aerosols deposited on the surface which are subsequently buried by additional snowfall and redistributed during melt-refreeze cycles. Consequently, snow albedo fluctuates, starting at high values following fresh snowfall and decreasing gradually due to increase in snow optical diameter (metamorphism) and accumulation of impurities, influenced by snow liquid content, vertical temperature gradient, aerosol species and deposition rate. The buried aerosols act as a memory and re-emerge at the surface in high concentration during the melting season. This re-exposure further reduces snow albedo, thereby accelerating melt rates. This simulated behavior is validated against in-situ observation of surface aerosol concentration and snow albedo. Through sensitivity experiments isolating the effects of different modes of dusts and other species, we further identified non-linear dynamics that critically influence the timing of snow melt and the end of the snow season.

How to cite: Krishnakumar, S., Ménégoz, M., Albani, S., Dumas, C., Ottlé, C., Dumont, M., Amory, C., Conesa, P., and Balkanski, Y.: Impact of multi-mode and multi-species aerosols on 1D snow simulation at observational sites distributed at different latitudes., EGU General Assembly 2026, Vienna, Austria, 3–8 May 2026, EGU26-8348, https://doi.org/10.5194/egusphere-egu26-8348, 2026.

EGU26-8363 | ECS | Orals | CR7.3

A Vorticity-Based Climatology of Mesocyclogenesis Hotspots in the Southern Ross Sea 

Samira Hassani, Marwan Katurji, Peyman Zawar-Reza, Alena Malyarenko, and Alexandra Gossart

Polar lows (PLs) are intense small-scale cyclones whose detection remains challenging, limiting our understanding of their climatology. This study addresses this gap by developing an objective tracking algorithm to create a 35-year (1990-2024) climatology of potential PLs for the Southern Ross Sea using high resolution ERA5 reanalysis.

The method employs a multi-scale filtering approach to identify the key dynamical drivers and characteristic signatures of mesocyclogenesis. Potential systems are first detected using a primary dynamical criterion, defined by a significant maximum in 850-hPa relative vorticity, typically associated with an upper-level trough. Candidates are then filtered using a deep static instability criterion representing the thermodynamic contribution. The final selection retains features that exhibit canonical mesoscale characteristics of mesocyclones, including a compact vortex size, a short lifetime, strong surface winds, and a distinct negative mean sea level pressure (MSLP) anomaly. The results reveal that the primary regions for potential PL formation are concentrated along the Transantarctic Mountain coastline, with key hotspots near Terra Nova Bay, the Byrd Glacier and Siple Coast. The seasonal cycle is dominated by peaks in the transitional months of March and October, which represent the highest frequency of polar low candidates annually. A secondary, less pronounced peak in activity is observed during the mid-winter months of June and July. On an interannual scale, the climatology reveals a significant negative trend in summer PLs from 2008 to 2018. This decreasing trend is strongly correlated with a concurrent decline in regional atmospheric static instability, suggesting that a stabilization of the lower troposphere is a key driver of potential decline in PL number occurrence in the Ross Sea region. A key limitation of this vorticity-based approach is the potential for false positives, particularly the detection of shear-induced vorticity features that lack a coherent surface circulation.  This work creates the comprehensive, long-term, and objective climatology of mesocyclogenesis for the Ross Sea Region. This foundational dataset enables a quantitative analysis of the key drivers of mesocyclogenesis in the region. It provides a crucial benchmark for systematically investigating the interaction between large-scale atmospheric patterns, katabatic wind surges, sea ice extent, and topography in forcing high-latitude PLs activity, and for assessing how these relationships may shift under future climate change.


How to cite: Hassani, S., Katurji, M., Zawar-Reza, P., Malyarenko, A., and Gossart, A.: A Vorticity-Based Climatology of Mesocyclogenesis Hotspots in the Southern Ross Sea, EGU General Assembly 2026, Vienna, Austria, 3–8 May 2026, EGU26-8363, https://doi.org/10.5194/egusphere-egu26-8363, 2026.

The relationship between El Niño-Southern Oscillation (ENSO) and Southern Annular Mode (SAM) during austral summer is examined. It is found that their relationship is nonstationary and depends on the phase of the Interdecadal Pacific Oscillation (IPO). A strong ENSO-SAM relationship is observed during the positive IPO phase, while this relationship is weak during the negative IPO phase. The effects of sea surface temperature anomalies (SSTA) in the equatorial central-eastern Pacific, atmospheric stationary wave train, and synoptic-scale high-frequency eddies are found to be responsible for this interdecadal change in ENSO-SAM relationship. During the positive IPO phase, warm SSTA in the equatorial eastern Pacific associated with El Niño events induce a poleward-propagating wave train and cause an anomalous anticyclone over Antarctica. The anomalous baroclinicity to the north of the anomalous anticyclone is conducive to the eastward extension of eddy activity within the entrance of the mid-latitude jet stream, resulting in the development and maintenance of the negative SAM phase. However, during the negative IPO phases, the tropical SSTA centers during ENSO events shift towards the equatorial central Pacific, forcing the Rossby wave train that generates an anomalous anticyclone over the Ross-Amundsen Sea, to the north of that caused by ENSO during the positive IPO phase. Consequently, the anomalous baroclinicity does not align with the mid-latitude jet stream core, and the eddy-mean flow interaction at the jet stream cannot be effectively triggered, inducing a meridionally arched pattern confined to the Pacific-South American sector. Additionally, when the IPO and ENSO are out of phase (in phase), the superposition effect tends to amplify (dampen) the ENSO-SAM connection.

How to cite: Cai, X., Zhang, R., and Tan, Y.: Modulation of Interdecadal Pacific Oscillation on the Relationship Between El Niño-Southern Oscillation and Southern Annular Mode during Austral Summer, EGU General Assembly 2026, Vienna, Austria, 3–8 May 2026, EGU26-9116, https://doi.org/10.5194/egusphere-egu26-9116, 2026.

EGU26-9380 | ECS | Orals | CR7.3

On the relevance of serial cyclone clustering for Arctic sea ice 

Lars Aue, Sofie Tiedeck, Peter Finocchio, Timo Vihma, Petteri Uotila, Gunnar Spreen, and Annette Rinke

Short-term changes in Arctic sea-ice area are largely driven by weather events such as synoptic-scale cyclones, which typically cause ice loss during warm and stormy conditions in the Arctic. Physical mechanisms of this ice loss include enhanced sea-ice divergence, poleward ice drift, and changes in the surface energy budget due to advection of warm-moist air masses. In extreme cases, enhanced basal melt of sea ice occurs due to upward mixing of relatively warm ocean water. Such anomalous conditions are prolonged when several cyclones follow rapidly on each other, a phenomenon referred to as serial cyclone clustering. Serial cyclone clustering has been identified as a high-impact phenomenon, substantially amplifying wind damage, precipitation, and sea level extremes across several regions of the Earth. However, this weather phenomenon and its impacts have not yet been examined in the polar regions.

Here, we analyze changes in Arctic sea-ice concentration (SIC) for periods of serial cyclone clustering utilizing satellite observations and reanalysis data from 1979-2024. While cyclones generally decrease SIC compared to non-cyclone conditions in cold and warm seasons, the impact of cyclone clusters is approximately twice as strong and persists 2.5 times longer than for solitary cyclones. The amount of SIC-loss due to cyclone clusters scales with the intensity and number of clustered storms, and greater SIC-loss occurs during 2000-2024 compared to 1979-1999.

These findings emphasize the need to better understand drivers of serial cyclone clustering in the Arctic and more generally highlight the relevance of accumulated impacts of clustered weather events for Arctic sea-ice variability. Applying similar frameworks to other types of weather events and other target quantities (e.g. snow accumulation on sea ice or wind-driven ocean currents) could help to further sharpen our understanding of the role of weather extremes in the coupled polar climate system.

How to cite: Aue, L., Tiedeck, S., Finocchio, P., Vihma, T., Uotila, P., Spreen, G., and Rinke, A.: On the relevance of serial cyclone clustering for Arctic sea ice, EGU General Assembly 2026, Vienna, Austria, 3–8 May 2026, EGU26-9380, https://doi.org/10.5194/egusphere-egu26-9380, 2026.

EGU26-10119 | ECS | Posters on site | CR7.3

The Role of the Southern Annular Mode and the El Niño-Southern Oscillation on Extreme and Unprecedented Antarctic Heat 

Charlie Suitters, James Screen, Jennifer Catto, Julie Jones, and Sihan Li

It was recently demonstrated using an ensemble of seasonal hindcasts with the “UNprecedented Simulated Extremes using ENsembles” (UNSEEN) technique that most of the Antarctic continent could experience record-breaking heat in both January and August. Here this analysis is continued, through the investigation of the role of large-scale modes of variability with known teleconnections to Antarctica, namely the Southern Annular Mode (SAM) and the El Niño-Southern Oscillation (ENSO), towards bringing relative warmth to Antarctica and its ice shelves during these months. The relationship between 2-metre temperature (T2m) and the SAM in the UNSEEN ensemble is consistent with the observed correlations: predominantly negative in both January and August. This negative correlation is strongest in magnitude along the coast of East Antarctica, while in the extreme north of the Peninsula a weaker positive correlation emerges. January correlations between T2m and ENSO are mostly positive in both observations and the UNSEEN ensemble, but spatial disparity between the two arises in August and perhaps suggests that the phase of ENSO could have a more varied influence on heatwave occurrence on different parts of the continent.

The polarity of the SAM dominates the Antarctic-wide mid-level circulation, and the teleconnection of ENSO is superimposed on top of this through modulation of the Amundsen Sea Low. This behaviour is identified in both observations and the UNSEEN ensemble. Therefore, for much of the continent heatwave days are dominated by negative SAM (SAM-) and are often combined with El Niño (EN) conditions. For example, SAM- patterns are more than twice as common during Antarctic-wide heatwave days than during all other days, and the combination of SAM- and EN is the most prevalent pattern that leads to heatwave days in the UNSEEN ensemble. However, in some locations (notably on ice shelves along the Peninsula) the relative occurrence of SAM- is no different between all days and heatwave days, and heatwaves occur with approximately equal probability across all combinations of SAM and ENSO phases. Strikingly, unprecedented T2m in Antarctica does not result from unprecedented SAM or ENSO values, suggesting either a deficiency in the UNSEEN ensemble, or that other processes not considered in this work are responsible for the most exceptional heatwaves in Antarctica. Further investigation into the large-scale drivers of unprecedented heat days in Antarctica is therefore required.

How to cite: Suitters, C., Screen, J., Catto, J., Jones, J., and Li, S.: The Role of the Southern Annular Mode and the El Niño-Southern Oscillation on Extreme and Unprecedented Antarctic Heat, EGU General Assembly 2026, Vienna, Austria, 3–8 May 2026, EGU26-10119, https://doi.org/10.5194/egusphere-egu26-10119, 2026.

EGU26-11340 | ECS | Posters on site | CR7.3 | Highlight

Impacts of atmospheric rivers on major West Antarctic sea ice retreat in May 2025  

Michelle Maclennan, Michael Haigh, Caroline Holmes, Andrew Orr, Siddharth Gumber, Haosu Tang, Grant LaChat, Rebecca Baiman, Meghan Sharp, Paul Holland, Sihan Li, and Julie Jones

Sea ice acts as a dynamic membrane around the Antarctic continent, modulating atmosphere-ocean interactions and dampening the waves, precipitation, and heatwaves associated with poleward-propagating storms. In May 2025, intense wind and waves from an atmospheric river family wrought destruction on the Amundsen-Bellingshausen sea ice margin, leading to major sea ice retreat at the time of year typically marked by sea ice growth, and closing coastal polynyas.

In this study, we examine the linkages between anomalous atmospheric forcing and storm structure in May 2025, associated with the atmospheric rivers, and the resultant ocean response and sea ice retreat in the Amundsen Sea. First, we use ERA5 atmospheric reanalysis and satellite observations to classify the large-scale atmospheric drivers of the initial mid-May event and subsequent month-long marine intrusion conditions, including successive Rossby waves breaking and the buildup of a blocking high over the Antarctic Peninsula. Then, using the 1.5km resolution version of the atmosphere-only UK Met Office Unified Model (with sophisticated microphysics CASIM), we dynamically downscale ERA5 to examine the detailed vertical and spatial characteristics of the storm at the sea ice margin, including winds, air temperature, clouds, and rainfall and snowfall on sea ice. Finally, we examine the downstream, lasting impacts of the storm on sea ice, polynyas, and ocean temperature in the Amundsen Sea using a regional configuration of the Massachusetts Institute of Technology general circulation model (MITgcm) and satellite observations of sea ice concentration and drift.

Ultimately, after a monotonic decrease in extent from mid-May until mid-June, sea ice extent in the Amundsen-Bellingshausen sector never recovered in 2025. Our results suggest that individual atmospheric events can produce compounding impacts on the ocean and sea ice of the Amundsen Sea Embayment.

How to cite: Maclennan, M., Haigh, M., Holmes, C., Orr, A., Gumber, S., Tang, H., LaChat, G., Baiman, R., Sharp, M., Holland, P., Li, S., and Jones, J.: Impacts of atmospheric rivers on major West Antarctic sea ice retreat in May 2025 , EGU General Assembly 2026, Vienna, Austria, 3–8 May 2026, EGU26-11340, https://doi.org/10.5194/egusphere-egu26-11340, 2026.

EGU26-11393 | ECS | Posters on site | CR7.3

Spatio-temporal variability of dust on snow: interactions with topography and snowpack dynamics observed with UAVs 

Pablo Domínguez Aguilar, Jesús Revuelto, Eñaut Izagirre, Javier Bandrés, Francisco Rojas Heredia, Pablo Ezquerro, and Juan Ignacio López Moreno

Aeolian dust surface deposition on seasonal snowpacks strongly influences snow albedo and melt dynamics, yet the environmental drivers of dust accumulation and redistribution at metre-scale resolution remain incompletely understood. UAV-based multispectral imagery enables detailed mapping of snow surface darkening associated with Light Absorbing Particles (LAP) such as mineral dust, offering new opportunities to investigate spatial distribution patterns in complex alpine terrain. This study examines the potential of UAV multispectral acquisitions to determine dust-on-snow spatial distribution and the relative influence of topographic factors on its variability during the seasonal evolution of the snowpack.

Data were collected in 2025 over a ~0.5 km2 alpine study basin in the Spanish Pyrenees using a MicaSense Altum multispectral sensor mounted on a DJI Matrice 300 UAV. Five UAV acquisition campaigns were conducted between initial Saharan dust deposition and snowpack melt-out. Spectral indices sensitive to snow surface darkening by LAP were computed from the UAV imagery. Additionally, from 10 to 20 distributed in situ snow surface samples were manually collected concurrently with UAV acquisition flights to determine surface LAP concentration and close-range spectral response using a hand-held hyperspectral radiometer to calibrate UAV-derived surface LAP concentration.

A suite of potential predictors to represent potential controls on surface LAP redistribution and accumulation were selected: elevation, slope, northness, topographic position index (TPI), maximum upwind slope (Sx), diurnal anisotropic heat index (DAH), snowpack depth and snowpack depth difference. Random forest (RF) models were applied independently to each acquisition date in order to assess how the relative importance of these controls evolved through time considering the different states of the dust layer in the snowpack.

The RF models generally reproduced the spatial variability of the LAP indices well, according to internal out-of-bag evaluation and the RMSE errors remained around low for days with larger LAP concentration variability. Throughout the study period, the state of the snowpack notably influenced the relative importance of the predictors to the response variable. We were able to observe days in which fresh snow partially covered the dust layer, causing predictor variables related to snow accumulation and elevation to show the highest relative importance. Subsequently, after the full surfacing of the dust layer, the largest LAP concentrations were found in concave areas, notably increasing the relative importance of TPI.

The results demonstrate the value of combining multi-temporal UAV multispectral observations with interpretable machine-learning approaches to account for the temporal sequence of dust deposition, burial, re-exposure, and melt to advance understanding of aeolian dust processes in alpine snow-covered environments.

How to cite: Domínguez Aguilar, P., Revuelto, J., Izagirre, E., Bandrés, J., Rojas Heredia, F., Ezquerro, P., and López Moreno, J. I.: Spatio-temporal variability of dust on snow: interactions with topography and snowpack dynamics observed with UAVs, EGU General Assembly 2026, Vienna, Austria, 3–8 May 2026, EGU26-11393, https://doi.org/10.5194/egusphere-egu26-11393, 2026.

EGU26-12591 | ECS | Orals | CR7.3

Curved atmospheric rivers and their moisture remnants: a new detection tool for Antarctica 

Victoire Buffet, Benjamin Pohl, Vincent Favier, and Jonathan Wille

Atmospheric rivers (ARs) represent the main intrusions of moisture and heat into Antarctica, exerting a major influence on the continent’s surface mass balance. Yet, due to geometric and directional constraints, existing detection algorithms often fail to track their evolution inland after landfall or in regions where abrupt directional changes occur. We introduce DARK (Detecting ARs using their Kurvature), a new Antarctic AR detection framework designed to overcome these limitations. DARK applies a strict 98th-percentile threshold to total integrated vapor transport and computes AR length along the curved axis to evaluate the 2000-km AR criterion. This enables the continuous detection of ARs with complex geometries, including those that curve, overturn, or extend across the South Pole. An additional AR-children module identifies smaller but still intense moisture remnants that detach from parent ARs after landfall yet continue to transport vapor and heat inland. The resulting climatology shows that DARK ARs account for about 18 % of total Antarctic precipitation and are linked to roughly half of top 1 % daily precipitation anomalies, 60 % of top 1 % daily maximum temperature anomalies, and 80 % of compound warm-and-wet events. DARK provides a more detailed assessment of AR-related precipitation and temperature impacts in the South Pole region. Despite slightly higher occurrence, risk-ratio analysis shows that DARK ARs more effectively capture the most intense events than earlier Antarctic schemes. Including AR-children further strengthens these associations, especially over Victoria Land, where they contribute to about one-third of AR-related precipitation.

How to cite: Buffet, V., Pohl, B., Favier, V., and Wille, J.: Curved atmospheric rivers and their moisture remnants: a new detection tool for Antarctica, EGU General Assembly 2026, Vienna, Austria, 3–8 May 2026, EGU26-12591, https://doi.org/10.5194/egusphere-egu26-12591, 2026.

EGU26-12689 | ECS | Orals | CR7.3

Quantifying the Radiative Impact of Light-Absorbing Particles on Alpine Snowpack Dynamics  

Sepehr Norouzi, Carlo De Michele, and Biagio Di Mauro

Light-absorbing particles (LAPs) such as black carbon, mineral dust, and organic carbon, when deposited on snow, reduce its surface albedo and increase the absorption of solar radiation. This enhanced absorption accelerates snowmelt and alters snowpack dynamics, particularly during the melt season. Field studies have measured seasonal concentrations of LAPs and confirmed their presence and significant effects on snow albedo. Even small quantities of LAPs can measurably reduce reflectance, particularly in the visible spectrum, and lead to earlier melt-out. A snowpack modeling assessment that isolates the individual and combined effects of each particle type under controlled scenarios can improve our understanding of their specific roles in snowpack evolution. Identifying the contribution of different LAPs to albedo reduction and snowpack dynamics is essential for alpine snow hydrology, where snowmelt timing governs runoff generation and water availability, and helps anticipate how LAPs-driven changes may amplify with climate change and reshape mountain hydrological regimes.

We first developed a one-layer energy budget snowpack model based on HyS (De Michele et al., 2013) and applied it over 18 hydrological years (2005–2023) at the Col de Porte experimental site in the French Alps, using local meteorological forcing. The model, referred to as HyS 3.0, was evaluated against long-term in situ measurements of snow depth and snow water equivalent (SWE), confirming its ability to accurately reproduce seasonal snow accumulation and melt dynamics. Due to its simplicity and low computational cost, HyS 3.0 is also well-suited for hydrological applications and sensitivity testing.

To assess the radiative effects of LAPs, we used field measurements of them along with spectral albedo data from two alpine sites Col de Porte (2014) and Col du Lautaret (2016–2018), capturing contrasting snow conditions. These datasets were used to evaluate BioSNICAR radiative transfer model performance, which computes snow albedo based on impurity concentration, grain size, and snow layer structure. After validation, BioSNICAR was used to generate a suite of LAP scenarios with varying concentrations and compositions. The resulting albedo changes were then used as input to HyS 3.0 to simulate the snowpack response under each scenario.

Results from these simulations revealed measurable changes in snowpack behavior, particularly in melt-out timing and snow specific surface area (SSA), compared to clean-snow conditions. This highlights both the direct radiative and indirect metamorphic effects of LAPs on seasonal snow evolution.

This work is supported by the “Light-Absorbing ParticleS in the Cryosphere and Impact on Water ResourcEs (LAPSE)” project, funded by MUR under the PRIN22 program.

How to cite: Norouzi, S., De Michele, C., and Di Mauro, B.: Quantifying the Radiative Impact of Light-Absorbing Particles on Alpine Snowpack Dynamics , EGU General Assembly 2026, Vienna, Austria, 3–8 May 2026, EGU26-12689, https://doi.org/10.5194/egusphere-egu26-12689, 2026.

EGU26-12858 | ECS | Orals | CR7.3

Future Changes in Northern Hemisphere Extreme Snowfall 

Nick Romijn, Richard Bintanja, Eveline van der Linden, and Marlen Kolbe

While mean and extreme snowfall are projected to decline across many mid-latitude regions, particularly those close to the melting point. An opposing signal is expected in high-latitude and high-elevation regions, including the Arctic. Future changes in Northern Hemisphere extreme snowfall are investigated using KNMI’s Large ENsemble TIme Slice (LENTIS) model. Snowfall changes are closely linked to climate warming. Regional present-day seasonal mean climatological temperatures determine the sign of snowfall change through seasonally dependent temperature turning points. These turning points vary between -11℃ and -18℃ for median snowfall, whereas extreme snowfall exhibits higher turning-point temperatures ranging from -4 ℃ to -11℃ across seasons. As a result, increases in median snowfall event frequency and amount are confined to the coldest regions, while extreme snowfall is already increasing across a wider range of regions with higher climatological temperatures. Under warming conditions, sufficiently cold regions are projected to experience substantially larger increases in extreme snowfall frequency (up to 278%), and amount (up to 271%) than in median snowfall (up to 101%, and 152%, respectively). Regions that approach or exceed the melting point are primarily governed by thermodynamic effects, whereas colder regions remain influenced by a combination of thermodynamic and dynamical circulation changes. As snowfall is likely to influence the surface mass balance of the Greenland Ice Sheet, atmospheric circulation patterns over Greenland are examined in detail. Extreme snowfall over Greenland is found to occur predominantly during a dipole in sea level pressure anomalies spanning Greenland and Northern Europe, which promotes the northward transport of warm, moist North Atlantic air. Using the Greenland Oscillation Index (GOI), which quantifies the strength of this dipole, it is found that the projected increase in extreme snowfall is dynamically driven, with a higher frequency of circulation conditions, characterized by an above-median GOI, impacting particularly Eastern, Central and Northern Greenland. These future increases in extreme snowfall arise from more frequent favorable circulation patterns rather than from an intensification of circulation anomalies. 

How to cite: Romijn, N., Bintanja, R., van der Linden, E., and Kolbe, M.: Future Changes in Northern Hemisphere Extreme Snowfall, EGU General Assembly 2026, Vienna, Austria, 3–8 May 2026, EGU26-12858, https://doi.org/10.5194/egusphere-egu26-12858, 2026.

EGU26-13334 | ECS | Orals | CR7.3

Impacts of High-Resolution Coupling of Solar Radiation Between Atmospheric and Cryospheric Components in Earth System Models 

Juan Tolento, Charles Zender, Andrew Roberts, Erin Thomas, and Mark Flanner

Earth system models (ESMs) often exchange solar fluxes and albedos between components using only two spectral bands (visible (VIS) and near-infrared (NIR)). In an effort to predict the albedo of cryospheric surfaces, which varies significantly through the NIR region, models often attempt to repartition these spectrally coarse incident solar fluxes into higher resolutions using prescribed, time-invariant weights. Here, we increase the resolution of solar fluxes and albedos exchanged between the atmosphere and snow-covered land surfaces within a fully coupled ESM from two bands to eight (one VIS and seven NIR bands). The exchange of higher resolution solar fluxes at the surface allows the surface models to dynamically weight the mean NIR albedo in response to time-varying atmospheric conditions. Diagnostic experiments within a fully coupled ESM show that the induced forcing on surface absorption caused by using the dynamic high resolution NIR insolation rather than prescribed weights ranges between -1.90-4.73 Wm-2. This forcing is strongly modulated by atmospheric humidity, as the presence of water vapor absorbs NIR radiation, thus changing the spectral distribution of NIR radiation at the surface, which cannot be captured with fixed weights. We find low/high humidity generally increases/reduces surface absorption. Regional climate responses over snow-covered surfaces are consistent with the applied forcing both in sign and magnitude. Replacing the coarse two-band surface albedo with an eight-band albedo better captures the steep drop of snow reflectance at longer NIR wavelengths, reducing the solar warming rate in the lower atmosphere. These advances provide a foundation for implementing a high resolution, spectrally consistent coupling of solar radiative fluxes across components within ESMs, demonstrating that increasing the spectral resolution of radiative processes yields a more physically realistic representation of albedo, surface absorption, and atmospheric absorption.

How to cite: Tolento, J., Zender, C., Roberts, A., Thomas, E., and Flanner, M.: Impacts of High-Resolution Coupling of Solar Radiation Between Atmospheric and Cryospheric Components in Earth System Models, EGU General Assembly 2026, Vienna, Austria, 3–8 May 2026, EGU26-13334, https://doi.org/10.5194/egusphere-egu26-13334, 2026.

EGU26-13536 | ECS | Orals | CR7.3

A Comprehensive Snow Monitoring System to Detect the Impact of Rain-on-snow (ROS) at Ny-Ålesund, Svalbard  

Federico Scoto, Roberto Salzano, Mauro Mazzola, and Andrea Spolaor

In recent decades, the Svalbard archipelago has experienced the fastest warming on Earth, with rates approximately four times higher than the global average. Due to Arctic amplification, the weakening of the polar vortex, rising sea surface temperatures, and retreating sea ice have led to increasingly frequent intrusions of warm, moist air masses from the North Atlantic, resulting in winter temperature anomalies often accompanied by liquid precipitation. In turn, winter rain-on-snow (RoS) events have become more frequent and intense in recent years, causing complex and unprecedented interactions with ecosystems, hydrology, transportation, and infrastructure. Precipitation can substantially alter the physical state of snow cover by increasing liquid water content (LWC) and enhancing surface runoff, while refreezing of meltwater can form basal and internal ice layers, limiting accessibility to the underlying tundra for wildlife such as reindeer. In addition, RoS can also promote early seasonal snowmelt, altering nutrient release timing in Arctic ecosystems and increasing risk to local communities due to flooding and avalanches.

Although remote sensing and atmospheric reanalyses have proven effective for detecting RoS, accurate and reliable in situ measurements remain critical for bridging the multiscale gap . Ground-based snow data not only provide essential validation, but also offer the spatial and temporal resolution needed to resolve rapid, small-scale physical processes within the snowpack. To this end, a comprehensive snow observation system was installed in Ny-Ålesund (Western Spitsbergen, Svalbard) at the end of 2020, providing continuous, high-resolution measurements of several key parameters, including snow depth, SWE, albedo, and vertical profiles of snow temperature and LWC. Over the past five years, the system has been able to record both the seasonal evolution of the snowpack, generally lasting from November to the end of May, and the short-lived perturbations triggered by RoS events, improving our understanding of Arctic snowpack dynamics during extreme events. Here we present the instrumental setup, the main observational results collected between 2020 and 2025, and discuss the diagnostic parameters relevant for RoS process studies and model evaluation.

How to cite: Scoto, F., Salzano, R., Mazzola, M., and Spolaor, A.: A Comprehensive Snow Monitoring System to Detect the Impact of Rain-on-snow (ROS) at Ny-Ålesund, Svalbard , EGU General Assembly 2026, Vienna, Austria, 3–8 May 2026, EGU26-13536, https://doi.org/10.5194/egusphere-egu26-13536, 2026.

EGU26-13762 | ECS | Orals | CR7.3

Evidence of Increasing trend of snow cover in himalayas implicate  snow darkening 

Saqib Ahmad Zargar, Chandan Sarangi, Priya Bhariti, Pranab Deb, Argha Banerjee, and Karl Rittger

While persistent snow cover traditionally preserves high surface albedo and buffers against early glacier melt, shifting precipitation regimes and light-absorbing aerosols are disrupting this protective mechanism. MODIS data indicates that the pre-monsoon snow season in the North Western Himalayas (NWH) extended by 7±3 days between 2000 and 2020. This extension is driven by large-scale dynamics, specifically moisture convergence and a deepened geopotential trough at 200 hPa.Crucially, snowfall resulting from these conditions enhances the wet deposition of atmospheric aerosols. As these aerosols resurface, they diminish the albedo benefits of fresh snow by 20%. This establishes a critical feedback loop wherein increased snowfall paradoxically facilitates surface darkening and accelerates melt. This snow-aerosol interaction necessitates a revision of surface energy balance models to accurately project future regional water availability.

How to cite: Zargar, S. A., Sarangi, C., Bhariti, P., Deb, P., Banerjee, A., and Rittger, K.: Evidence of Increasing trend of snow cover in himalayas implicate  snow darkening, EGU General Assembly 2026, Vienna, Austria, 3–8 May 2026, EGU26-13762, https://doi.org/10.5194/egusphere-egu26-13762, 2026.

EGU26-14783 | Orals | CR7.3

Mineral Dust in Seasonal Snow and Firn on Svalbard Glaciers: Deposition Rates, Composition, and Albedo Impacts 

Susan Kaspari, Elisabeth Isaksson, Oscar Orme, Jean-Charles Gallet, Andy Hodson, William Hartz, Andrea Spoloar, Federico Scoto, Denise Diaz Vega, and Tess Kraics

Warming on Svalbard is occurring up to seven times faster than the global average and is driving widespread glacier retreat. In addition to rising air temperatures, light absorbing particles (LAP; including black carbon and mineral dust) can enhance snow and ice melt by reducing surface albedo. While black carbon has been studied extensively on Svalbard, mineral dust remains relatively understudied despite growing evidence that high latitude dust emissions may increase due to decreases in snow cover and glaciers retreat.

To address this knowledge gap, we analyzed mineral dust and black carbon in seasonal snow and firn cores collected from twelve spatially distributed Svalbard glaciers between 2022 and 2026. Dust concentrations and deposition rates were quantified using gravimetric filtration and ICP-MS, while dust mineral composition was characterized using X-ray diffraction and scanning electron microscopy with energy-dispersive spectroscopy. Black carbon was measured on select firn samples using a Single Particle Soot Photometer.

Results show pronounced seasonal variability, with low winter dust concentrations and enhanced summer–fall deposition, as well as substantial spatial variability in dust concentration, mineralogy, and spectral reflectance. Winter dust concentrations ranged from 0.3 to 17.6 µg g⁻¹ (median 0.9 µg g⁻¹), with deposition rates between 0.1 and 1.5 g m⁻² (median 0.4 g m⁻²). Mineralogical analyses reveal abundant sheet silicates and common rock-forming minerals across all sites, with carbonates largely restricted to central Svalbard glaciers, indicating variability in dust sources and depositional processes. Radiative transfer modeling demonstrates that mineral dust dominates LAP driven albedo reductions, exceeding contributions from black carbon. These findings highlight the growing importance of mineral dust for Svalbard snow and ice melt in the warming Arctic.

How to cite: Kaspari, S., Isaksson, E., Orme, O., Gallet, J.-C., Hodson, A., Hartz, W., Spoloar, A., Scoto, F., Diaz Vega, D., and Kraics, T.: Mineral Dust in Seasonal Snow and Firn on Svalbard Glaciers: Deposition Rates, Composition, and Albedo Impacts, EGU General Assembly 2026, Vienna, Austria, 3–8 May 2026, EGU26-14783, https://doi.org/10.5194/egusphere-egu26-14783, 2026.

EGU26-14921 | ECS | Posters on site | CR7.3

Extreme events and impacts of High Latitude Dust  

Pavla Dagsson Waldhauserova, Outi Meinander, and IceDust members

Sand and dust storms, including High Latitude Dust (HLD), were identified as a natural hazard that affects 11 of the 17 Sustainable Development Goals. HLD is a significant contributor to land degradation, severe erosion and ecosystem collapse, as documented for example in Iceland. HLD contributes to Arctic Amplification, and it was recognized as an important climate driver in Polar Regions (IPCC SROCC, 2019; AMAP, 2021). HLD has impacts on climate, such as effects on cryosphere, cloud properties, atmospheric chemistry and radiation, and marine and terrestrial environment. Main socio-economic sectors such as health protection, road safety, energy production, aviation, and land degradation, are negatively impacted by HLD (eg. severe air pollution, mortality on roads due to reduced visibility).

Many extreme events causing severe air pollution were observed and measured in Iceland, Svalbard and Antarctica. In Iceland, we measured i. tens of severe dust storms at multiple locations annually as well as long-range transport from Iceland to Scandinavia, Faroe and British Isle, and Svalbard; ii. Snow-dust storms; iii. Saharan dust plumes causing air pollution in Iceland; iv. Extreme wind erosion events of volcanic ash mixed with dust; v. dust storms during high precipitation/low wind periods; vi. Dust storms during glacial outburst floods, vii. Arctic winter dust storms during Polar Vortex conditions, and viii. Black/Organic Carbon haze from burning mosses around the eruption in Reykjanes Peninsula, transported > 300 km to Northeast Iceland. Several dust storms were measured also in Antarctic Peninsula. In Svalbard, aerosol measurements revealed high concentrations of both dust, coal dust and Black Carbon, while dirty snow evidenced the occurrences of Snow-Dust Storms, similarly to Iceland.    

In-situ particulate matter data and observations from these extreme events will be presented. It is crucial to provide long-term daily aerosol measurements and dust forecasts from the remote high latitude dust regions. Additional in-situ observations around HLD sources would confirm that the background air quality is not as good as expected, and in some cases, it is worse than industrial or some urban stations, such as in Iceland during the CAMS NCP Iceland projects.

More information and activities of HLD networks can be found at the Icelandic Aerosol and Dust Association (IceDust) websites (https://ice-dust.com/, https://icedustblog.wordpress.com/publications/), UArctic Network on High Latitude Dust (https://www.uarctic.org/activities/thematic-networks/high-latitude-dust/), NORDDUST (https://ice-dust.com/projects/norddust/), and CAMS NCP Iceland (https://ice-dust.com/projects/cams-ncp-iceland/, https://atmosphere.copernicus.eu/iceland).

How to cite: Dagsson Waldhauserova, P., Meinander, O., and members, I.: Extreme events and impacts of High Latitude Dust , EGU General Assembly 2026, Vienna, Austria, 3–8 May 2026, EGU26-14921, https://doi.org/10.5194/egusphere-egu26-14921, 2026.

EGU26-16196 | ECS | Orals | CR7.3

Climatology of Atmospheric Rivers-related precipitation over different surface types in the Southern Ocean 

Melanie Lauer, Christopher Horvat, Michelle McCrystall, and Anna Possner Lowdon

Antarctica experienced a rapid decline in sea ice extent in 2016 following a modest increase in annual sea ice extent. Rapid changes in Antarctic sea ice have consequences for the Antarctic climate system; however, the coupled atmosphere-ocean-ice processes driving these changes remain poorly understood. Precipitation is a key atmospheric variable influencing both the surface mass balance of the Antarctic ice sheet and the formation and persistence of Antarctic sea ice.  Two major moisture sources contribute to precipitation: local evaporation due to the reduced insulation effect of sea ice and poleward moisture transport from lower latitudes, often associated with atmospheric rivers (ARs) – long, narrow corridors that transport large amounts of heat and moisture from the mid-latitudes to the polar regions. 

Despite their rarity, ARs play an important role in the Antarctic climate system, contributing to surface melt on the West Antarctic Ice Sheet and extreme precipitation events across East Antarctica. However, the role of ARs and AR-related precipitation, particularly in relation to Antarctic sea ice, has been less explored. 

Here, we analyze ERA5 reanalysis data to investigate the contribution of ARs to precipitation over the Southern Ocean (60 – 90S), distinguishing between different surface characteristics (open ocean and sea ice) and precipitation phase (rain and snow). Our results show that ARs contribute more to rainfall (50%) than snowfall (25%). AR-related snowfall is relatively evenly distributed across the entire study region, whereas around 75% of AR-related rainfall occurs over the Ross Sea and Amundsen-Bellingshausen Seas. While AR-related snowfall exhibits weak seasonal variability, AR-related rainfall is more pronounced in winter and spring. Regarding different surface types, AR-related rainfall primarily occurs over the open ocean throughout the year but extends over sea ice during winter. In contrast, AR-related snowfall shifts seasonally, dominating over the open ocean in summer and autumn and over sea ice in winter and spring.  

Area-normalized precipitation reveals that AR-related precipitation events are more intense than non-AR events, with higher intensities in winter compared to summer.  These findings highlight the important role of ARs and their potential changes in Antarctica. Finally, we compare these results with simulations from the newly developed climate model ICON-XPP to assess its ability to represent AR characteristics over the Southern Ocean.

How to cite: Lauer, M., Horvat, C., McCrystall, M., and Possner Lowdon, A.: Climatology of Atmospheric Rivers-related precipitation over different surface types in the Southern Ocean, EGU General Assembly 2026, Vienna, Austria, 3–8 May 2026, EGU26-16196, https://doi.org/10.5194/egusphere-egu26-16196, 2026.

EGU26-17359 | ECS | Posters on site | CR7.3

Impact of Motion Correction on Momentum and Sensible Heat Fluxes over Ice and Water Measured on a Moving Vessel in the Arctic 

Florian Fröhlich, Theresa Mathes, Sabine Lüchtrath, Philipp Oehlke, Holger Siebert, Birgit Wehner, and Andreas Held

The Arctic exhibits an alarming warming rate, mainly caused by increasing greenhouse gas emissions and the climate forcing effect of aerosols. To get a better understanding of the relevance of local aerosol sources and sinks in the Arctic, vertical near-surface particle, momentum and sensible heat fluxes were investigated by collecting a large eddy covariance data set including three-dimensional wind speed, temperature and particle number concentration over ice, water and mixtures thereof during the PS131 expedition of the German research icebreaker Polarstern in 2022 using a 3-axis ultrasonic anemometer (Gill Solent HS-044, Lymington, United Kingdom) and a mixing condensation particle counter (Brechtel Model 1720, Hayward, USA). Both instruments were installed on the bow crane outrigger.

To minimize the influence of the inadvertent movement of the vessel caused by waves and wind on the anemometer data, two separate motion correction approaches were tested. The first method is based on the work of Fujitani (1981) and Edson et al. (1998). It realigns the wind vector (u, v, w) recorded in the vessel coordinate system with a reference frame while also correcting for apparent winds resulting from the tilting motion and the vessel movement in the reference coordinate system itself. Alternatively, by making use of the periodicity of the vessel movement and finding the frequencies with which the vertical wind vector component w oscillates using spectral FFT analysis, affected frequencies can be replaced assuming spectral similarity of atmospheric turbulence. Thus, it is possible to remove the impact of the movement without having to rely on the measured pitch, roll and yaw angles.

Both approaches were successfully used to correct the recorded data in preparation for calculating the sensible heat and momentum fluxes. Preliminary results suggest that the choice of motion correction approach has an impact on the obtained fluxes, though a complete evaluation of the resulting data is still pending at the time of abstract submission.

This study was funded by the Deutsche Forschungsgemeinschaft (DFG, German Research Foundation): HE5214/10-1, HE5214/11-1 and WE 2757/6-1.

How to cite: Fröhlich, F., Mathes, T., Lüchtrath, S., Oehlke, P., Siebert, H., Wehner, B., and Held, A.: Impact of Motion Correction on Momentum and Sensible Heat Fluxes over Ice and Water Measured on a Moving Vessel in the Arctic, EGU General Assembly 2026, Vienna, Austria, 3–8 May 2026, EGU26-17359, https://doi.org/10.5194/egusphere-egu26-17359, 2026.

EGU26-17631 | Orals | CR7.3

Drivers and Impacts of Extreme Weather Events in Antarctica: Recent Results and Future Plans of the ExtAnt Project 

Tom Bracegirdle, Sammie Buzzard, Will Dow, Danny Feltham, Neven Fučkar, Amelie Kirchgaessner, Hua Lu, Amanda Maycock, Andrew Orr, Sarah Shannon, Shivani Sharma, Martin Widmann, and Ryan Williams

In recent years a number of record-breaking, even record shattering, extreme weather and climate events have occurred over Antarctica. Such events can drive increased surface melt, thinning and even break-up of Antarctica’s ice shelves. They also pose threats to Antarctic species, ecosystems and the globally important services they provide. However, our knowledge and understanding of how extreme events over Antarctica may respond under climate forcing is lacking. To addresses this gap, the ExtAnt project is an ambitious four-year programme of research that brings together leading UK and international scientists to use new modelling resources and methods to elucidate drivers of extreme events in Antarctica. It aims to provide a comprehensive assessment of present day and future high impact extreme weather events in Antarctica, and associated risks. Key foci for impacts are surface melt on ice shelves and the highly specialised Antarctic biodiversity.

Recent science highlights will be presented on characteristics and drivers of extreme events and a new database of Antarctic extremes. An example of current early initial analysis relates to large ensembles, which shows that global climate models exhibit larger biases in mid-tropospheric daily meridional wind extremes at 65°S in summer (too weak) than in winter, in contrast to larger winter biases in the mean climatology. There is a fairly small, but clear, increase in the magnitude of meridional wind extremes in summer in the ozone hole period compared with the pre-ozone period. Wider implications the results so far will be discussed along with future plans for the project in downscaling (using both machine learning and traditional approaches), event attribution and surface melt modelling.

How to cite: Bracegirdle, T., Buzzard, S., Dow, W., Feltham, D., Fučkar, N., Kirchgaessner, A., Lu, H., Maycock, A., Orr, A., Shannon, S., Sharma, S., Widmann, M., and Williams, R.: Drivers and Impacts of Extreme Weather Events in Antarctica: Recent Results and Future Plans of the ExtAnt Project, EGU General Assembly 2026, Vienna, Austria, 3–8 May 2026, EGU26-17631, https://doi.org/10.5194/egusphere-egu26-17631, 2026.

EGU26-17638 | Orals | CR7.3

Experimental Reduction of Snow Surface Albedo by Local Black Carbon and Mineral Dust Deposition in the Andes of Laguna del Maule, Chile 

Tomás R. Bolaño-Ortiz, Felipe McCracken, María F. Ruggeri, Lina Castro, Luciano A. González-Faune, José A. Neira Román, Fredy A. Tovar-Bernal, and Magín Lapuerta

Snowmelt from the Andes is the primary source of freshwater for central Chile, a region experiencing prolonged drought and increasing anthropogenic pressures. Light-absorbing particles (LAPs), such as black carbon (BC) from mining vehicles and locally derived mineral dust (MD), accelerate snowmelt by reducing surface albedo. This study presents experimental results from a field campaign conducted on 27 August 2025 near Laguna del Maule, where controlled deposits of BC and MD were applied to the snow surface to quantify their impact on spectral albedo. BC (simulating mining truck emissions) and MD (local soil) were deposited cumulatively at masses of 1, 2, 3, 5, and 7 grams over a defined snow area. Surface albedo was measured using a spectroradiometric system consisting of six synchronized spectroradiometers covering 300–2500 nm. For each contamination level, 12 replicate measurements were taken. Broadband albedo (300–2500 nm) was averaged across replicates to evaluate the reduction induced by each LAP type. Due to wind-driven dispersion, the average effective mass deposited on the snow surface was 58% of the applied BC and 93% of the applied MD. Results show a consistent decrease in average broadband albedo with increasing deposition mass. A linear regression between broadband albedo and the effective surface concentration (accounting for wind loss) yielded an average albedo reduction slope of 0.014 ± 0.002 per gram of BC and 0.011 ± 0.001 per gram of MD. This indicates that, under these experimental conditions, BC exerts a stronger per-mass darkening effect than MD. These findings demonstrate that vehicular BC and wind-blown MD from mining and disturbed soils can significantly darken snow surfaces, thereby enhancing melt rates. In a region already affected by megadrought and shrinking snowpack, such albedo reductions threaten to further diminish freshwater availability. This study emphasizes the need to integrate local aerosol emissions—particularly from mining and transport activities—into hydrological and climate models for the Central Andes. The authors acknowledge the support of the National Research and Development Agency of Chile (ANID), namely, ANID-FONDECYT 3230555, ANID-FONDECYT 11220482, ANID-FONDECYT 11220525, ANID Vinculación Internacional FOVI240088, and ANID FONDEQUIP EQM250078, as well as the Multidisciplinary Research Project PI_M_24_03 from Universidad Técnica Federico Santa Maria (Chile). The spectroradiometric system was funded by the Spanish Ministry of Science and Innovation through the Acquisition of Scientific-Technique Equipment (2019) grant (ref. EQC2019-006105-P).

How to cite: Bolaño-Ortiz, T. R., McCracken, F., Ruggeri, M. F., Castro, L., González-Faune, L. A., Neira Román, J. A., Tovar-Bernal, F. A., and Lapuerta, M.: Experimental Reduction of Snow Surface Albedo by Local Black Carbon and Mineral Dust Deposition in the Andes of Laguna del Maule, Chile, EGU General Assembly 2026, Vienna, Austria, 3–8 May 2026, EGU26-17638, https://doi.org/10.5194/egusphere-egu26-17638, 2026.

EGU26-18048 | ECS | Posters on site | CR7.3

Experimental assessment of different mineral dust on snow properties and melt dynamics under cold laboratory conditions 

Javier Bandrés, Eric Sproles, Jorge Pey, Xavier Querol, Carlos Pérez García-Pando, and Juan Ignacio López-Moreno

Understanding the role of mineral dust deposition on snow-covered surfaces is essential for improving predictions of snowmelt timing and magnitude in mountain and polar regions. This is particularly relevant given the global diversity of dust sources, such as North Africa and Central Asia, or regional sources related to human activities. While the radiative forcing of light-absorbing impurities is increasingly well documented, there is still limited understanding of how distinct mineral dust types and their associated mineralogical and geochemical compositions differently affect snowpack energy balance and melt processes. This knowledge gap persists because many models still assume a globally uniform mineralogical composition, leading to substantial uncertainties.

In this study, we present a series of controlled experiments conducted in the SubZero cold laboratories at Montana State University, using mini-lysimeters filled with snow artificially doped with varying and environmentally realistic concentrations of mineral dust samples originating from four distinct source regions (North Africa, Iceland, North America and the Middle East) under controlled environmental conditions in the cold chamber.

Our results suggest that Fe content is a key driver of the variability observed in snow darkening and melt enhancement. Dust-emitting sediments from the studied regions display distinct mineralogical compositions, with Fe contents varying 3.0 wt% in U.S. desert samples, 3.6 wt% in Moroccan dust, 5.5 wt% in mixed African dust sources, and substantially higher levels in Icelandic surface sediments, reaching up to 9.5 wt%.

Across experiments, the results show clear reductions in snow albedo, changes in specific surface area (SSA), and increases in liquid water content (LWC) and meltwater production for different dust types samples and concentrations.

The first author has an FPI predoctoral grant in the frame of MARGISNOW project (PID2021-124220OB-100) funded by the Spanish Ministry of Science and Innovation. This research received support from SNOWDUST (AEI, TED2021-130114B-I00), POSAHPI-2 (PID2022-143146OB-I00) and FRAGMENT (ERC-2017-COG, Grant agreement ID: 773051).

How to cite: Bandrés, J., Sproles, E., Pey, J., Querol, X., Pérez García-Pando, C., and López-Moreno, J. I.: Experimental assessment of different mineral dust on snow properties and melt dynamics under cold laboratory conditions, EGU General Assembly 2026, Vienna, Austria, 3–8 May 2026, EGU26-18048, https://doi.org/10.5194/egusphere-egu26-18048, 2026.

EGU26-18685 | ECS | Orals | CR7.3

Centennial Changes in Microclimate and Surface Mass Balance: A West Greenland Case Study 

Florina Roana Schalamon, Sebastian Scher, Andreas Trügler, Wolfgang Schöner, and Jakob Abermann

The local microclimate is both a key driver and in turn impacted by glacier wastage. Such feedbacks become particularly relevant in rapidly changing regions such as for West Greenland, where e.g. Qaamarujup Sermia has retreated by approximately 2 km between 1930/31 and 2022. This is the site where Alfred Wegener’s last expedition took place and where its members conducted pioneering glaciological and meteorological studies . Starting in 2022, we re-established a spatially distributed monitoring network extending from the coastline to the upper glacier, including automated weather stations, distributed air-temperature and humidity sensors, and surface mass-balance stakes. These observations allow us to investigate how a significant increase in the extent of ice-free valley surfaces caused by glacier retreat influences altitudinal temperature profiles and, ultimately, glacier melt.
Cluster analyses of temperature gradients reveal that the often-assumed environmental lapse rate of −6.5 K per kilometer only applies under certain conditions. In several cases, lapse rates differ markedly between the ice-free valley and the air above the glacier and show complex patterns. We investigate how these patterns are linked to synoptic forcing and cloud conditions, which control the depth and persistence of temperature inversions. 
To quantify the implications of these microclimatic structures for glacier melt, we combine the atmospheric observations with high-resolution melt measurements from automated and conventional mass-balance stakes. We find that in recent years, higher melt rates occur under the same air temperature departure as they did in the 1930s.  Sparse snow observations indicate that snow accumulation in 1930/31, with a maximum snow height of approximately 2 m, was higher than in the years since 2022, but remains within the range of extreme snow amounts as for instance represented in the CARRA reanalysis period (1991-2024).
Together, our results demonstrate that ongoing glacier retreat at Qaamarujup Sermia not only responds to atmospheric forcing but can actively reshape the local microclimate, leading to increasingly effective melt processes. These feedbacks are critical for understanding future mass-balance evolution of glaciers in a changing climate. 

How to cite: Schalamon, F. R., Scher, S., Trügler, A., Schöner, W., and Abermann, J.: Centennial Changes in Microclimate and Surface Mass Balance: A West Greenland Case Study, EGU General Assembly 2026, Vienna, Austria, 3–8 May 2026, EGU26-18685, https://doi.org/10.5194/egusphere-egu26-18685, 2026.

EGU26-19610 | ECS | Posters on site | CR7.3

Climate indices change during 21st century in high-resolution RCMs 

Anastasiia Chyhareva, Svitlana Krakovska, Liudmyla Palamarchuk, Marte Hofsteenge, Clara Lambin, José Abraham Torres Alavez, and Ruth Mottram

The Antarctic is a critical component of the global atmosphere-ocean-cryosphere interaction and is simultaneously one of the regions most sensitive to climate change. However, the response to climate change varies significantly across the continent. Therefore, it is crucial to understand how the Antarctic will be impacted by climate change during the 21st century.

The aim of the study is to define general features of climate change in the Antarctic based on climate indices simulated by  regional climate models (RCMs). We used WCRP standard climate indices: frost days (number of days with a daily minimum temperature  < 0°C),  ice days (number of days with a maximum temperature < 0°C), total annual precipitation, longest consecutive wet spell (number of consecutive days with >1 mm/day), longest dry spell (number of consecutive dry days <1 mm/day), simple precipitation intensity (annual precipitation divided by wet days), intense, heavy and extreme precipitation for the daily precipitation amounts (90th, 95th and 99th percentiles respectively). Indices were computed from three RCMs (HCLIM, MAR, RACMO) under the two storylines: (1) strong sea ice decrease and weak strengthening of the southern polar vortex; (2) weak sea ice loss but strong polar vortex strengthening. Results were compared across three periods: 1986–2005 (historical), 2041–2060 (mid-century), and 2081–2100 (end-of-century). Models results and further postprocessing were performed under Horizont2020 PolarRES and OCEAN ICE Projects.

A comparison of climatic indices from historical to the end of the century reveals a significant transition toward a warmer and wetter climate. These changes are most pronounced in the coastal regions and the Antarctic Peninsula, while the high-elevation interior remains relatively stable. Dramatic reduction in 'Ice Days' particularly on the Peninsula is projected. This reduction implies a substantial increase in surface melt potential and an extended thaw season, accompanied by a corresponding—though less severe—decrease in 'Frost Days'.

Simultaneously, the models project a clear increase in total annual precipitation, primarily over the Southern Ocean and coastal zones. Precipitation characteristics also shift, exhibiting increased daily intensity and a modest decrease in the length of 'Consecutive Dry Days' over the continental interior.

Precipitation extremes (99 th percentile) are heavily concentrated along the Antarctic Peninsula and coastal West Antarctica. In regions with significant orographic enhancement, localized intensities exceed 100 mm/day, whereas the interior plateau remains much less (<10 mm/day). 

Overall, both storylines illustrate a fundamental shift in the Antarctic climate during the 21st century—particularly in coastal zones—characterized by a longer, more intense melt season and hydrological cycle. These changes hold significant implications for ice shelf stability and overall ice-sheet mass balance.

How to cite: Chyhareva, A., Krakovska, S., Palamarchuk, L., Hofsteenge, M., Lambin, C., Torres Alavez, J. A., and Mottram, R.: Climate indices change during 21st century in high-resolution RCMs, EGU General Assembly 2026, Vienna, Austria, 3–8 May 2026, EGU26-19610, https://doi.org/10.5194/egusphere-egu26-19610, 2026.

EGU26-20553 | ECS | Orals | CR7.3

How Changes in Relative Humidity in the Polar Boundary Layer impact Arctic Amplification in Climate Models 

Sophia Wüsteney, Andreas Platis, Jens Bange, and Felix Pithan

The Arctic is warming three to four times faster than the global average due to multiple feedback processes – a phenomenon known as Arctic Amplification. Cloud feedbacks, in particular, represent one of the largest sources of uncertainty in projections of this amplified warming. Relative humidity (RH) is critical to these cloud feedbacks through its influence on cloud formation and radiation balance, yet changes in Arctic RH under a warming climate remain poorly understood.

Using 27 CMIP6 Coupled Model Intercomparison Project (CMIP6) models, this study investigates Arctic RH changes and their drivers by comparing historical conditions (1985-2015) with future projections under SSP5-8.5 (2070-2100). The multi-model mean reveals a robust vertical dipole pattern in surface-temperature-normalized RH changes across the Arctic. Near the surface (1000-925 hPa), RH decreases by up to 2 % K−1 in winter, while mid-tropospheric RH (950-750 hPa) increases. This counterintuitive pattern – surface drying despite increased open ocean from sea-ice loss – is particularly pronounced during autumn and winter. The dipole signal is strongest over regions experiencing substantial sea ice loss, but remains visible at reduced amplitude over persistent ice regions, indicating both local (sea-ice driven) and broader (stability-driven) components to the RH response.


The multi-model mean, however, emerges from markedly different individual model responses. DIPOLE models reproduce the characteristic dipole pattern with drying near the surface and moistening around 1 km above the surface; DECREASE models show drying in both layers; INCREASE models show moistening at both levels. While DIPOLE and DECREASE models both exhibit a dipole pattern over ice-loss regions, INCREASE models do not, suggesting fundamental differences in model physics that are also evident in present-day RH distributions. Cloud liquid and ice water changes do not follow the dipole pattern but instead show increases across all groups, with inter-group differences in magnitude and vertical extent. Cloud liquid water increases peak near 925 hPa in all groups but are strongest over ice-loss regions in DECREASE and DIPOLE models, while DIPOLE models show strong cloud ice increases throughout the lower troposphere (surface–700 hPa), INCREASE and DECREASE models exhibit two distinct maxima at 850 and 500 hPa.


The primary driver of the dipole pattern is the transition from a predominantly stable atmosphere over sea ice (with an RH maximum near the surface) to a well-mixed atmosphere over open ocean (with an RH maximum at cloud base). This physical mechanism suggests that the DIPOLE models have a more realistic representation of moisture in the Arctic boundary layer and its response to sea-ice loss. If further analysis can rule out the behaviour of the INCREASE and DECREASE models, we expect that this will allow us to better constrain Arctic cloud feedbacks.

How to cite: Wüsteney, S., Platis, A., Bange, J., and Pithan, F.: How Changes in Relative Humidity in the Polar Boundary Layer impact Arctic Amplification in Climate Models, EGU General Assembly 2026, Vienna, Austria, 3–8 May 2026, EGU26-20553, https://doi.org/10.5194/egusphere-egu26-20553, 2026.

EGU26-20625 | ECS | Posters on site | CR7.3

Effect of Increasing freezing point Sea Ice Albedo, on controlling Arctic Climate variables in ICON 

Josien Rompelberg, Dörthe Handorf, Christoph Jacobi, and Evelyn Jäkel

Climate models have difficulties accurately representing Arctic mid-latitude linkages. This might partly be caused by surface parametrizations that are not able to accurately represent the Arctic surface conditions. As a result, large uncertainties arise in the modelling of energy exchange between the surface and the atmosphere, since sea ice surface albedo (SIA) controls the energy input in the Arctic region. The present study aims to gain insights in how the SIA parameterization scheme in the Icosahedral Nonhydrostatic (ICON) model can influence Arctic climate.

In order to identify the sources of error in the current SIA parameterization scheme, it is evaluated against Arctic observational data. The data includes both on-ice measurements to capture the SIA temporal evolution (MOSAiC), as well as airborne measurements from several flight campaigns performed within the (AC)3 project to capture a larger spatial variability. The offline evaluation, in which the SIA parametrization is isolated from the ICON model and observations are used as input for the parametrization, shows that the biggest disagreement between the scheme and the observations occurs at freezing point temperatures.  

Inspired by this outcome and to better understand how SIA parametrization can control the Arctic climate, a simulation with increased SIA at freezing point temperatures is performed. With this long term, limited area, pan-arctic simulation, changes in energy exchange between surface and atmosphere are analyzed. 

This work was supported by the DFG funded Transregio-project TRR 172 “Arctic Amplification (AC)3“.

How to cite: Rompelberg, J., Handorf, D., Jacobi, C., and Jäkel, E.: Effect of Increasing freezing point Sea Ice Albedo, on controlling Arctic Climate variables in ICON, EGU General Assembly 2026, Vienna, Austria, 3–8 May 2026, EGU26-20625, https://doi.org/10.5194/egusphere-egu26-20625, 2026.

EGU26-22142 | ECS | Posters on site | CR7.3

Assessment of Circulation Weather Types around Svalbard and their Impact on the Ny-Ålesund Atmospheric Column 

Phillip Eisenhuth and Sandro Dahlke

Meteorological conditions in Ny-Ålesund (NYA), Svalbard, are influenced by the large-scale atmospheric circulation patterns, such as southerly or northerly advection as well as cyclonic or anticyclonic circulation regimes. We classify the prevailing synoptic circulation into a number of recurrent circulation weather types (CWT), to quantify their influence on local atmospheric column properties and their contribution to the observed Arctic amplification in NYA.

We construct a 45+ year CWT catalogue for NYA based on hourly 850 hPa geopotential fields from ERA5 reanalysis data using a modified Jenkinson-Collison classification. This catalogue is combined with long-term observational records from the AWIPEV radiosonde programme and the Baseline Surface Radiation Network (BSRN) in NYA.

Composite analyses reveal a pronounced directional and seasonal dependence of near-surface temperature, longwave net radiation and humidity on the prevailing CWT. Trends in CWT frequency indicate an increased occurrence of southerly advection in winter and autumn, which contributes to the enhanced warming in NYA in these seasons. Conversely, a higher frequency of northerly CWT in spring is associated with the observed cooling, particularly in March.

Consequently, CWT analysis and their long-term trends quantify the influence of synoptic circulation to atmospheric conditions in NYA and contribute to the explanation of the observed seasonal changes in the Svalbard region.


This work was supported by the DFG funded Transregio-project TRR 172 “Arctic Amplification (AC)3“.

How to cite: Eisenhuth, P. and Dahlke, S.: Assessment of Circulation Weather Types around Svalbard and their Impact on the Ny-Ålesund Atmospheric Column, EGU General Assembly 2026, Vienna, Austria, 3–8 May 2026, EGU26-22142, https://doi.org/10.5194/egusphere-egu26-22142, 2026.

EGU26-20 | ECS | Orals | AS1.30

Extreme Dry-Hot in North America and Europe: The Amplified Role of Warming-Enhanced Land-Air Coupling 

Liang Qiao, Zhiyan Zuo, Renhe Zhang, Wei Mei, Deliang Chen, Meiyu Chang, and Kaiwen Zhang

Greenhouse gases (GHGs) drive global land warming with varying regional impacts, but the role of land-atmosphere interactions in amplifying future warming hotspots remains underexplored. Our study shows that, under uncontrolled GHG emissions, North America and Europe are projected to experience the highest warming by the late 21st century (3.7°±0.7°C and 3.8°±0.5°C, respectively), exceeding the global average of 2.7°±0.4°C in other regions. Approximately one-quarter of this warming in North America and Europe is linked to land-air coupling and associated hot-dry feedback mechanisms, where warming accelerates soil drying, further intensifying surface heating. This feedback could transform nearly 30% of land in these regions into arid or extremely arid zones, significantly impacting ecosystems and agriculture. These results underscore the vulnerability of North America and Europe to amplified climate risks driven by GHG emissions and strengthened land-atmosphere feedbacks.

How to cite: Qiao, L., Zuo, Z., Zhang, R., Mei, W., Chen, D., Chang, M., and Zhang, K.: Extreme Dry-Hot in North America and Europe: The Amplified Role of Warming-Enhanced Land-Air Coupling, EGU General Assembly 2026, Vienna, Austria, 3–8 May 2026, EGU26-20, https://doi.org/10.5194/egusphere-egu26-20, 2026.

Accurate seasonal drought prediction is crucial for mitigating socio-economic and ecological losses, yet dynamical models are often evaluated on drought indices rather than integrated events, and their skill variation linked to drought mechanisms remains unclear. This study assesses SEAS51, CFSv2, and CPS3 for five extreme droughts (2018-2022) over China using a 3D event-oriented framework based on the SPAI and DBSCAN clustering. The deterministic and probabilistic prediction skills are assessed using the threat score, and the models’ ability to capture critical precursors and circulation patterns is examined. Our results indicate that deterministic drought predictions generally skillful within lead times of 45 days. Probabilistic predictions extend the skillful lead time, in some cases beyond 120 days. Model performance varies substantially across events, closely linked to their capacity to simulate key drought-driving processes, such as the weakened Walker Circulation during the 2018 South China drought and Rossby wave dynamics associated with the 2022 Yangtze River Basin drought. Moreover, we identify the limitation of predicting persistent and large-scale precipitation deficits in dynamical models, which leads to an optimal probability threshold of 25% for ensemble-based drought prediction. These findings highlight the operational value of probabilistic ensemble predictions for drought early warning and provide a mechanistic basis for understanding model skill differences, supporting the development of drought prediction systems.

How to cite: Yin, H.: Assessment of Prediction Skills for Seasonal Drought Events Using Dynamical Models, EGU General Assembly 2026, Vienna, Austria, 3–8 May 2026, EGU26-2061, https://doi.org/10.5194/egusphere-egu26-2061, 2026.

The upper reaches of the Yangtze River observed record-breaking droughts, heatwaves, and forest fires in rapid sequence during the 2022 summer, challenging the established mechanistic understanding. We here explained the compound event through a trans-seasonal vegetation-land-atmosphere interacting perspective. The wetter spring and sunnier summer pattern resulted in record high loads of vegetation and enhanced transpiration. This led to progressive depletion of soil moisture to a critical threshold that shifted the originally weak response of air temperature into hypersensitive mode. The resulting rapid rise of air temperature amplified atmospheric evaporative demand to an unprecedentedly high level, which in turn exacerbated the drying-out of soil and vegetation. These favorable weather and fuel factors combined to cause unseasonal forest fires of unprecedented burning intensity. Our results remind of preparedness against drought-heat-fire compounding hazards even in humid regions under opportune configurations between ecological and meteorological conditions.

How to cite: An, N. and Chen, Y.: Trans-Seasonal Vegetation-Land-Atmosphere Interactions Explained Record-Breaking Cascading Extremes in the Upper Reaches of the Yangtze River, EGU General Assembly 2026, Vienna, Austria, 3–8 May 2026, EGU26-2917, https://doi.org/10.5194/egusphere-egu26-2917, 2026.

EGU26-3303 | ECS | Orals | AS1.30

Amplified soil moisture variability multiplies summer heat extremes in humid regions 

Meiyu Chang, Zhiyan Zuo, Aiguo Dai, Deliang Chen, Renhe Zhang, Kaiwen Zhang, and Liang Qiao

In recent decades, unprecedented summer heatwave events have frequently erupted in humid regions. Our analysis of the period 1980–2022 demonstrates that the surging heat extremes are closely linked to both a progressive drying of mean soil moisture and a concurrent intensification of its intra-seasonal variability. While the drying trend contributes to two-week extreme hot days, amplified intra-seasonal variability multiplies these extremes to four weeks by further enhancing shortwave radiation and high-pressure anomalies. Climate projections indicate that a future characterized by drier and more variable soil moisture shifts summer climates towards an intensified ‘mega hot’ stage, where over two-thirds of summer days in humid regions will experience extreme heat by the end of the 21st century under high-emission scenario. Our findings highlight that amplified soil moisture variability—a marker of intensifying soil moisture-air coupling under global warming—is nonlinearly accelerating the occurrence of extreme dry-hot events, pushing humid climates into a new and unprecedented normal.

How to cite: Chang, M., Zuo, Z., Dai, A., Chen, D., Zhang, R., Zhang, K., and Qiao, L.: Amplified soil moisture variability multiplies summer heat extremes in humid regions, EGU General Assembly 2026, Vienna, Austria, 3–8 May 2026, EGU26-3303, https://doi.org/10.5194/egusphere-egu26-3303, 2026.

EGU26-3530 | ECS | Posters on site | AS1.30

Contrasting Ecosystem Responses to the Dynamics of Compound Climate Extremes 

Min Liu, Daniel Hagan, and Diego G. Miralles

The ecological impact of compound climate extremes often exceeds that of individual events; however, the cumulative responses of vegetation to the dynamics of these extremes remains unexplored. In this study, we utilized the Normalized Difference Vegetation Index (NDVI) as a proxy for vegetation to investigate the cumulative responses of global vegetation greenness to the duration, frequency, and magnitude of three types of events: compound hot-dry extremes (CHDE), extreme heat (EHE), and extreme drought (EDE) from 1982 to 2020. Our results reveal a pronounced increasing trend in CHDE across transitional climate zones, where more persistent and stronger events occur in densely vegetated regions. This was characterized by a strong positive correlation between CHDE and vegetation dynamics in these zones, likely driven by intensified land–atmosphere feedbacks, with vegetation response maximized at a 4-month timescale, identified from cross-correlation analysis. Meanwhile, the Amazon and Congo basins emerge as hotspots for heat-related extremes, where EDE and CHDE exhibit greater persistence. At high latitudes of the Northern Hemisphere, vegetation exhibits a robust sensitivity to temperature-driven events, particularly under EHE dominance, where the response shows no temporal lag, indicating an immediate physiological reaction to thermal relief or stress. Furthermore, we observe a global divergence in climate risk and response: while arid regions are experiencing a significant warming trend, humid regions are increasingly threatened by desiccation (drying). Notably, vegetation productivity in humid ecosystems shows a predominant temporal response to EDE, suggesting a higher initial resistance but eventual vulnerability to prolonged water deficits. Finally, we employed machine learning to identify the primary drivers behind these temporal vegetation responses and elucidate how their interactions shape ecosystem sensitivity. These findings underscore the critical role of compound extremes in modulating vegetation dynamics and provide insights for enhancing ecosystem resilience under future climate scenarios.

How to cite: Liu, M., Hagan, D., and Miralles, D. G.: Contrasting Ecosystem Responses to the Dynamics of Compound Climate Extremes, EGU General Assembly 2026, Vienna, Austria, 3–8 May 2026, EGU26-3530, https://doi.org/10.5194/egusphere-egu26-3530, 2026.

EGU26-3647 | ECS | Orals | AS1.30

A novel index to quantify land-atmosphere coupling: asymmetric response of hot-dry and cold-wet compound extremes. 

Yixuan Guo, Zuntao Fu, Emanuele Bevacqua, Jakob Zscheischler, and Yu Huang

Compound hot-dry and cold-wet extreme events can pose severe threats to human health, social economy, and agricultural production, with their synergistic impacts far exceeding the linear integral of individual events. Land-atmosphere coupling is a key physical process impacting these extremes. However, limitations persist in current studies for quantifying its strength, and the different roles and sensitivities in hot-dry and cold-wet events remain poorly understood. To address these gaps, this work innovatively employs a data-driven Dynamical Systems Method to establish a novel framework for the objective and instantaneous quantification of land-atmosphere coupling globally. Utilizing this framework, this research aims to evaluate the sensitivity of global summer compound hot-dry and cold-wet extremes to land-atmosphere coupling and reveal the spatial patterns of their asymmetric responses. Furthermore, the key local physical processes and large-scale atmospheric circulation modulating mechanisms underlying the observed asymmetries are analyzed through multi-perspective attribution. The results of this project can significantly contribute to the understanding of the relationship between land-atmosphere coupling and compound extremes, providing crucial support for decision-makers to enhance resilience against these complex extremes and to formulate targeted prevention and mitigation strategies.

How to cite: Guo, Y., Fu, Z., Bevacqua, E., Zscheischler, J., and Huang, Y.: A novel index to quantify land-atmosphere coupling: asymmetric response of hot-dry and cold-wet compound extremes., EGU General Assembly 2026, Vienna, Austria, 3–8 May 2026, EGU26-3647, https://doi.org/10.5194/egusphere-egu26-3647, 2026.

Compound drought and hot extremes (CDHEs) exert disproportionately larger impacts on natural systems and agriculture than individual climate extremes.  Existing research indicates that CDHEs are increasing in frequency and intensity, posing significant risks of severe agricultural drought and soil moisture exhaustion. However, the variations of CDHEs have been primarily studied at single timescales, leaving their multi-timescale characteristics and the resulting impacts on agricultural drought development poorly understood. We investigates the spatiotemporal evolution of CDHEs across different timescales using ERA5 reanalysis data and CMIP6 simulations. We then quantify the impacts of CDHEs on soil moisture, demonstrating that CDHEs significantly amplify the probability and severity of deficits in both surface and root-zone layers compared to independent droughts. Furthermore, the variability of the sensitivity of soil moisture deficits to CDHEs   over recent decades has been explored. These findings provide a comprehensive perspective on how compound extremes drive agricultural water stress across timescales, offering critical scientific support for developing robust early-warning systems and water management strategies in a warming climate.

How to cite: Yitong, Z. and Zengchao, H.: Changes in compound droughts-hot extremes across different timescales and their impact on soil moisture deficits, EGU General Assembly 2026, Vienna, Austria, 3–8 May 2026, EGU26-3941, https://doi.org/10.5194/egusphere-egu26-3941, 2026.

EGU26-4156 | ECS | Posters on site | AS1.30

Anthropogenic exacerbation of global high-risk compound hot–dry events over the past century 

Zizhen Dong, Ruowen Yang, Jie Cao, and Lin Wang

As climate warms, the compound hot–dry events (CHDEs) have become more frequent across most regions of the globe, bringing serious threats to both the human population and the natural environment in affected areas. In the study, a copula-based probability index (PI) is used to explore variations in risk indicators associated with global and regional CHDEs by considering both the annual PI mean and variability. Across most of the world, the risk associated with CHDEs has increased significantly over the past century during 1901–2020, with approximately 89% of land grid cells experiencing increasing trends in high-risk CHDEs. In contrast, the low-risk CHDEs has declined evidently. Detection and attribution analysis indicates that anthropogenic greenhouse gas dominates the high-risk CHDEs and follows similar trends to the observed increase at subregional to continental scales, especially in North America, Europe, Asia, and Oceania. These results emphasize the importance of reducing anthropogenic greenhouse gas emissions to restrict the expansion of high-risk CHDE areas in the globe.

How to cite: Dong, Z., Yang, R., Cao, J., and Wang, L.: Anthropogenic exacerbation of global high-risk compound hot–dry events over the past century, EGU General Assembly 2026, Vienna, Austria, 3–8 May 2026, EGU26-4156, https://doi.org/10.5194/egusphere-egu26-4156, 2026.

EGU26-4284 | ECS | Posters on site | AS1.30

Human-Induced Westerly Jet Shifts Coordinate Terrestrial Productivity at the Hemispheric Scale 

Xiaoye Yang, Aiguo Dai, Gabriele Messori, Bin He, Zhibo Li, Ziqian Zhong, Xing Yuan, Chang-Hoi Ho, Dim Coumou, Botao Zhou, and Deliang Chen

Previous studies have established how regional climate variability regulates local terrestrial gross primary productivity (GPP), yet the hemispheric-scale spatial organization of GPP, coordinated by coherent large-scale atmospheric circulation, has received far less attention. By integrating multi-source observations with numerical simulations, we demonstrate that anthropogenically driven shifts in the Northern Hemisphere westerlies fundamentally reorganize the spatial pattern of terrestrial GPP. Around the year 2000, the curvature of the westerlies reversed, transitioning from a southward to a northward bend over eastern Europe, Northeast Asia, and western North America, while exhibiting opposite changes over central Asia and central North America. The observed spatial pattern of GPP trends closely mirrors the GPP response to variations in westerly curvature. Sensitivity analyses using CESM1 large-ensemble simulations and single-forcing experiments identify greenhouse gas forcing as the dominant driver of these circulation changes, thereby reshaping GPP distributions. Under the RCP8.5 scenario, further intensification of westerly curvature shifts is projected to enhance GPP growth across northern Europe, Northeast Asia, and western North America, while suppressing productivity in southern Europe and central North America. Together, these results reveal a previously underappreciated pathway through which anthropogenic forcing influences terrestrial carbon uptake via large-scale atmospheric circulation, with important implications for projecting future carbon–climate feedback.

How to cite: Yang, X., Dai, A., Messori, G., He, B., Li, Z., Zhong, Z., Yuan, X., Ho, C.-H., Coumou, D., Zhou, B., and Chen, D.: Human-Induced Westerly Jet Shifts Coordinate Terrestrial Productivity at the Hemispheric Scale, EGU General Assembly 2026, Vienna, Austria, 3–8 May 2026, EGU26-4284, https://doi.org/10.5194/egusphere-egu26-4284, 2026.

Global warming exacerbates atmospheric dryness, yet the role of soil moisture (SM)-atmosphere feedbacks in regulating its spatiotemporal dynamics remains poorly understood. This study employs Earth system model experiments to quantify how SM dynamics influence local atmospheric dryness and its spatial propagation. Reduced SM drives the self-intensification of extreme atmospheric dryness in three key hotspots: Europe, North America, and South America. SM-atmosphere feedbacks amplify the spread of atmospheric dryness from these hotspots to surrounding areas, yielding extreme dryness events that are more persistent, intense, and spatially extensive. Mechanistically, SM deficit alters surface energy fluxes, deepens the planetary boundary layer, and strengthens mid-tropospheric high-pressure ridges. These processes promote downward advection of dry air and accelerate spatial expansion of atmospheric dryness. These findings confirm that SM-atmosphere feedbacks enhance both the local intensification and spatial propagation of atmospheric dryness, underscoring critical implications for developing ecosystem and societal adaptation strategies to mitigate large-scale extreme dryness under future climate change.

How to cite: Zhou, S. and Liang, J.: Soil moisture-atmosphere feedbacks amplify atmospheric dryness and its spatial propagation, EGU General Assembly 2026, Vienna, Austria, 3–8 May 2026, EGU26-4402, https://doi.org/10.5194/egusphere-egu26-4402, 2026.

Dry–hot compound events exert strong and nonlinear impacts on terrestrial ecosystems, with consequences that extend through land–atmosphere feedbacks across scales. This presentation provides an overview of biophysical vegetation–atmosphere feedbacks during dry–hot compound events, highlighting recent research that shows how processes from ecosystem to circulation scales shape the evolution and predictability of these events.

At the ecosystem level, concurrent drought and heat rapidly impair vegetation functioning. Satellite-based indicators of plant physiology show that functional responses to dry–hot stress occur within days, well before structural degradation becomes detectable. This rapid response marks the loss of ecosystem evaporative regulation and sets the conditions for local land–atmosphere feedbacks to emerge. Stomatal closure triggered by rainfall scarcity and high vapour pressure deficit shifts the partitioning of available energy toward sensible heating, while subsequent changes in vegetation structure modify surface albedo and aerodynamic roughness. Together, these processes alter near-surface temperature and humidity, enhance boundary-layer growth, and affect atmospheric stability and cloud formation. These feedbacks operate on diurnal time scales and lead to the self-intensification of dry–hot compound conditions, particularly in regions where vegetation strongly controls surface energy and water fluxes.

As dry–hot conditions persist, these biophysical feedbacks can propagate beyond the local boundary layer and influence atmospheric processes at larger spatial scales. Vegetation-mediated anomalies in sensible and latent heat fluxes modify boundary-layer depth, entrainment, and thermodynamic structure, affecting mesoscale circulation and the advection of heat and moisture. Reduced evaporation lowers atmospheric humidity and precipitation efficiency downwind, allowing dry–hot anomalies to extend beyond their region of origin. These processes favour the spatial organization, persistence, and propagation of dry–hot extremes, especially in transitional and semi-arid regions where land–atmosphere coupling is strong and soil moisture constraints are pronounced. When widespread, coherent surface anomalies can also influence synoptic circulation by modifying diabatic heating patterns and land–sea thermal contrasts, affecting the positioning and persistence of high-pressure systems. Through these cross-scale interactions, ecosystem stress aggravates dry–hot regimes and reinforces coupling between ecosystem dynamics and atmospheric circulation.

Despite growing evidence that vegetation actively modulates dry–hot extremes, major challenges remain. These include disentangling bidirectional causality between ecosystems and the atmosphere, constraining ecosystem influences on atmospheric circulation, and understanding how ecosystem heterogeneity and biodiversity modulate feedback strength. Addressing these challenges is essential to improve vegetation–atmosphere coupling in current forecasting systems and to enhance the predictability of dry–hot compound extremes under ongoing climate change.

How to cite: Miralles, D. G.: From ecosystem stress to circulation response: biophysical feedbacks during dry–hot compound extremes, EGU General Assembly 2026, Vienna, Austria, 3–8 May 2026, EGU26-4422, https://doi.org/10.5194/egusphere-egu26-4422, 2026.

In June 2024, the Eastern Mediterranean experienced an unprecedented heatwave, with regional mean temperature exceeding the climatological average by more than 3 °C, the highest since 1960. However, the relative contributions of anthropogenic forcing and natural variability, as well as the respective roles of atmospheric circulation and soil moisture to this event, have remained unclear. Based on ERA5 reanalysis and HadGEM3-A-N216 attribution simulations, we estimate that anthropogenic forcing accounted for roughly half of the observed temperature anomalies. Human activities not only directly increased surface warming through greenhouse gas emissions but also reduced soil moisture, which in turn amplified temperature anomalies via land-atmosphere coupling. Using the flow analogue and circulation projection methods, we find that another half of warming anomalies attributable to natural variability is dominated by atmospheric circulation change, which features an anomalous anticyclone driven by an upstream wave train and sustained by warm North Atlantic SST anomalies. Additionally, in the component of natural variability, we found a thermodynamic cooling contribution from the wetting soil moisture anomalies, which is likely associated with above-normal preceding precipitation, indicating that wetting soil related land-atmosphere coupling slightly offset the circulation-induced warming in this heatwave. The results highlight contrasting roles of soil moisture in anthropogenic forcing and natural variability in the climate change hotspot, providing new physical insights into future extreme heatwave events.

How to cite: Ma, K. and Yu, H.: Attribution of the record-breaking June 2024 Eastern Mediterranean heatwave: Contrasting roles of soil moisture in anthropogenic forcing and natural variability, EGU General Assembly 2026, Vienna, Austria, 3–8 May 2026, EGU26-4705, https://doi.org/10.5194/egusphere-egu26-4705, 2026.

EGU26-4721 | ECS | Posters on site | AS1.30

Process-oriented compound long-duration dry and hot events in China 

Yi Yang and Jianping Tang

Summertime compound dry and hot events pose severe threats to human health and agriculture, particularly when events are persistent. Based on the joint evolution of such hazards in space and time, we identified spatiotemporal compound long-duration dry and hot (SLDDH) events across China (1961-2022) using a process-oriented method. These events are consistently associated with anomalous high-pressure systems, which induce sinking air motions, increase solar radiation at the surface, and reduce moisture convergence. The primary driver of precipitation deficits is the dynamical suppression of vertical moisture transport by this subsidence, not atmospheric moisture content changes. For the accompanying high temperatures, anomalous subsidence and the resulting adiabatic warming are the dominant cause across most of China, with surface heating (diabatic processes) playing a minor or even cooling role. However, in northern regions like North China and Xinjiang, extreme heat results from a combination of diabatic heating and adiabatic warming. These findings suggest that the anomalous sinking motion associated with the high pressure systems is partially responsible for the occurrence of these compound extremes over different regions of China. 

How to cite: Yang, Y. and Tang, J.: Process-oriented compound long-duration dry and hot events in China, EGU General Assembly 2026, Vienna, Austria, 3–8 May 2026, EGU26-4721, https://doi.org/10.5194/egusphere-egu26-4721, 2026.

Exceptionally strong summertime warming occurred over the Mongolian Plateau between 1986 and 2004, at a rate that was three times the average terrestrial warming in the Northern Hemisphere. The physical processes responsible for this extreme warming remain unclear. Here we show that the synchronous phase shift of the Interdecadal Pacific Oscillation and the Atlantic Multidecadal Oscillation contributed to this extreme Mongolian Plateau warming, which cannot be fully explained by the increasing anthropogenic CO2 alone. Pacemaker model experiments show that the Interdecadal Pacific Oscillation and Atlantic Multidecadal Oscillation excited an atmospheric wave train, resulting in an upper-level anticyclonic circulation over the Mongolian Plateau. This anticyclonic circulation increased surface warming by enhancing downward solar radiation, and the surface warming was further boosted by positive land–atmosphere feedbacks. Our results highlight the important role of internal climate variability in driving rapid regional climate change over the Mongolian Plateau.

How to cite: Cai, Q.: Recent pronounced warming on the Mongolian Plateau boosted by internal climate variability, EGU General Assembly 2026, Vienna, Austria, 3–8 May 2026, EGU26-4759, https://doi.org/10.5194/egusphere-egu26-4759, 2026.

EGU26-4773 | Orals | AS1.30

Human-induced intensification of subsurface soil moisture drought 

Xihui Gu, Yansong Guan, and Lunche Wang

Anthropogenic climate change has intensified soil moisture droughts worldwide, but how this intensification manifests in the spatiotemporal evolution of soil droughts’ vertical structure remains insufficiently understood. We develop a Lagrangian four-dimensional (longitude, latitude, depth, and time) tracking framework to identify contiguous drought events in both space (horizontally and vertically) and time. We reveal a distinct drought type, i.e., deep droughts. These events exhibit bottom-heavy, iceberg-like morphologies, with moisture deficits that are more extensive in deeper layers than in surface soils. Deep droughts account for approximately one-quarter of all events, yet they are largely overlooked by surface-focused soil moisture monitoring. Reanalyses and climate models consistently indicate that the duration and intensity of deep droughts have increased markedly over the past four decades, and that these increases are attributable to anthropogenic climate change. Future projections further indicate that deep droughts will become more persistent and severe globally, with the stronger amplification in deeper soil layers under higher-emission scenarios. Hidden below the surface, deep droughts challenge satellite-based agricultural drought monitoring, potentially leading to an underestimation of drought impacts on ecosystems.

How to cite: Gu, X., Guan, Y., and Wang, L.: Human-induced intensification of subsurface soil moisture drought, EGU General Assembly 2026, Vienna, Austria, 3–8 May 2026, EGU26-4773, https://doi.org/10.5194/egusphere-egu26-4773, 2026.

EGU26-5665 | Orals | AS1.30

Impact of compound drought and heat extremes on terrestrial ecosystems 

Yao Zhang, Yuantian Jiang, and Ruonan Qiu

Compound drought and heat extremes (CDHE) are expected to intensify and become more frequent as the climate warms, yet their consequences for forest growth and ecosystem stability remain incompletely understood. Here, we combine long-term tree-ring observations with satellite remote sensing to quantify how CDHE influence tree growth and ecosystem resilience across contrasting climate regimes. We find that increasing CDHE frequency leads to widespread growth reductions across most regions, with the exception of cold and humid ecosystems. Growth declines are particularly pronounced in warm–dry, warm–humid, and cold–dry regions. Notably, tree growth in humid ecosystems exhibits increasing sensitivity to CDHE, indicating that these systems may experience disproportionately large growth losses under compound extremes. In parallel, ecosystem resilience declines with rising drought frequency, with the strongest reductions observed in dryland regions. Together, these results suggest that the intensification of compound drought and heat extremes poses growing risks to forest productivity and stability under continued climate warming.

How to cite: Zhang, Y., Jiang, Y., and Qiu, R.: Impact of compound drought and heat extremes on terrestrial ecosystems, EGU General Assembly 2026, Vienna, Austria, 3–8 May 2026, EGU26-5665, https://doi.org/10.5194/egusphere-egu26-5665, 2026.

EGU26-6719 | ECS | Posters on site | AS1.30

Probabilistic prediction of tipping points in Earth system with deep learning 

Wenjie Zhang, Yu Huang, Sebastian Bathiany, Yechul Shin, Suiping Zhou, and Niklas Boers

Abrupt transitions in the Earth system can arise from bifurcation-induced tipping, rapid forcing rates, or noise-driven excursions, making early warning inherently probabilistic. Using the Atlantic Meridional Overturning Circulation (AMOC) as a case study, we run large ensemble simulations of a calibrated AMOC model under time-varying freshwater forcing and stochastic perturbations. Even under identical forcing scenarios, only a subset of ensemble members undergoes a tipping transition, highlighting an intrinsically stochastic regime. In this setting, conventional early-warning signals based on critical slowing down (CSD, e.g., increasing lag-1 autocorrelation and variance) show limited prediction ability and are easily confounded by non-stationary forcing and noise. We develop a deep-learning (DL) indicator trained on labeled ensemble trajectories to distinguish transitioning from non-transitioning dynamics using sliding windows of time series, thereby capturing high-order temporal statistics beyond traditional early-warning indicators. In application, the model outputs trajectory-specific probabilities of tipping in real time, enabling probabilistic warnings ahead of tipping. Across a range of freshwater forcing pathways and noise amplitudes, the DL indicator provides earlier and more robust probabilistic forecasts than CSD indicators and supports a probabilistic interpretation of safe operating boundaries. The framework is transferable to other Earth system components where tipping risk must be assessed under uncertainty from stochastics and forcing.

How to cite: Zhang, W., Huang, Y., Bathiany, S., Shin, Y., Zhou, S., and Boers, N.: Probabilistic prediction of tipping points in Earth system with deep learning, EGU General Assembly 2026, Vienna, Austria, 3–8 May 2026, EGU26-6719, https://doi.org/10.5194/egusphere-egu26-6719, 2026.

EGU26-7165 | ECS | Posters on site | AS1.30

Predicting Maize Production in Northeastern China: Unraveling the Influence of Summer Compound Heat-Drought Events through Physical Mechanisms 

Yeran Zhou, Huixin Li, Bo Sun, Huijun Wang, Hui Ju, Yuan Yuan, and Jiani Zeng

Northeastern China (NEC), known as the granary of China, is significantly affected by compound heat-drought events (CHDEs), which have detrimental impacts on maize production. This study aims to investigate the physical mechanisms underlying the occurrences of CHDEs on maize production in NEC. Our findings indicate that CHDEs are associated with anomalous positive geopotential height at 500 hPa, the presence of anticyclone at 850 hPa and a uniform downward motion in NEC, all of which are adverse to maize production. Using a year-to-year increment method, we reveal that several key factors collectively influence CHDEs and maize production in NEC, including sea ice concentration in the Barents Sea in May, sea surface temperature (SST) in the equatorial East Pacific in February and March, soil water over northwestern Siberia in April, and the North Atlantic Oscillation (NAO) in February. To differentiate the diverse influences of these key factors on CHDEs and maize production, we developed two distinct prediction models (Prediction Model #1 and #2). Both Prediction Model #1 (r=0.90, p<0.01) and #2 (r=0.91, p<0.01) demonstrate high correlation coefficients between predicted and observed values, as validated through leave-one-out cross-validation (Prediction Model #1: r=0.90, p<0.01; Prediction Model #2: r=0.90, p<0.01) and independent hindcasts (Prediction Model #1: r=0.72, p<0.01; Prediction Model #2: r=0.79, p<0.01). This study provides precise predictions of maize production in eastern China, offering significant safeguards for national food security.

How to cite: Zhou, Y., Li, H., Sun, B., Wang, H., Ju, H., Yuan, Y., and Zeng, J.: Predicting Maize Production in Northeastern China: Unraveling the Influence of Summer Compound Heat-Drought Events through Physical Mechanisms, EGU General Assembly 2026, Vienna, Austria, 3–8 May 2026, EGU26-7165, https://doi.org/10.5194/egusphere-egu26-7165, 2026.

EGU26-7338 | ECS | Posters on site | AS1.30

Influences of Summer Northeastern Arctic Sea Ice on September Compound Heatwave and Drought Events in the South China 

Jiani Zeng, Huixin Li, Huijun Wang, Yuan Yuan, and Mingkeng Duan

Compound heatwave and drought events (CHDEs) in South China (SC) have intensified in early autumn, yet their driving factor remains unclear. Based on reanalysis data and numerical experiments, this study investigates the potential influence of the summer northeastern Arctic Sea ice concentration (NEASIC) on the interannual variation of September CHDEs in the SC. Results demonstrate that positive NEASIC anomalies during summer trigger a quasi-barotropic Rossby wave train, originating over the Greenland Sea, arching across the North Atlantic and the Mediterranean–Caspian region, and extending into East Asia. This wave dynamically drives a northward-shifted and intensified East Asian subtropical jet and anomalous anticyclonic circulation over SC. The resulting subsidence induces moisture flux divergence, suppresses cloud cover, and enhances surface radiative forcing, explaining about 28.4% of the CHDEs variability per interquartile NEASIC increase. This mechanism enhances predictive frameworks for subtropical compound extremes, emphasizing the role of NEASIC in regional climate resilience strategies.

How to cite: Zeng, J., Li, H., Wang, H., Yuan, Y., and Duan, M.: Influences of Summer Northeastern Arctic Sea Ice on September Compound Heatwave and Drought Events in the South China, EGU General Assembly 2026, Vienna, Austria, 3–8 May 2026, EGU26-7338, https://doi.org/10.5194/egusphere-egu26-7338, 2026.

Europe has been identified as a Heatwave hotspot in two important ways. Firstly, temperatures warm faster than over most regions globally (Rousi et al. 2022, Vautard et al. 2023), secondly the hottest temperatures increase significantly faster compared to more moderate temperatures (Kornhuber et al. 2024, Patterson 2023). Large scale atmosphere dynamical patterns have been suggested to be associated with these trends, such as an increase in double jet patterns (Rousi et al. 2022), trends in circumglobal Rossby waves (Teng et al. 2022) and local high pressure systems (Vautard et al. 2023).

In this talk we reflect on the fact that climate models underestimate these trends. We show that during persistent circulation regimes, typically present during quasi-stationary Rossby waves (Kornhuber et al. 2023, Luo et al 2021) or double jets (Liu et al., in prep.), models underestimate the heatwave response. We link this to model biases in a three-way feedback process between temperature, high-pressure and soil moisture, which becomes active after a threshold in soil moisture and temperature is crossed (Tian et al. in prep.). We provide evidence that models substantially underestimate this process which is particularly important in driving changes in most extreme heat events over humid to semi-arid regions globally.

How to cite: Kornhuber, K., Tian, Y., and Liu, S.:  Atmosphere Dynamical Processes and Soil moisture Feedbacks associated with accelerating heatwave trends , EGU General Assembly 2026, Vienna, Austria, 3–8 May 2026, EGU26-7687, https://doi.org/10.5194/egusphere-egu26-7687, 2026.

EGU26-9025 | ECS | Posters on site | AS1.30

Attribution analysis of the persistent and extreme drought in southwest China during 2022–2023 

Tianjiao Ma, Wen Chen, Qingyu Cai, Zizhen Dong, Lin Wang, Peng Hu, Lu Gao, and Chaim I. Garfinkel

Southwest China experienced a severe drought during winter 2022–spring 2023. This drought mainly struck Yunnan Province and surrounding regions (21°–30°N, 97°–106°E), with precipitation deficit lasting for about 8 months from Oct 2022 to May 2023. The area-mean precipitation and surface soil moisture in the study region during the drought were both the lowest recorded for the same period since 1950. The Standardized Precipitation Evapotranspiration Index (SPEI) also reached its lowest level since 1950 at −2.76. Quantitative analysis shows that precipitation deficit and potential evapotranspiration (PET) increase contributed 71.36%, and 28.64% to the SPEI, respectively. Of the raw contribution of PET, 7.05% can in turn be attributed to the changes in precipitation. Using data from the CMIP6 Detection and Attribution Model Intercomparison Project (DAMIP), we found that anthropogenic forcing increased the likelihood of a PET anomaly such as the one during the drought by about 133 times, with a fraction of attributable risk (FAR) of 0.99 [0.98, 1.00]. For the precipitation anomaly, we obtained a FAR of 0.26 [−1.12, 0.70], suggesting that anthropogenic forcings may have little impact. The extreme drought also increased the risk of fires, with the Fire Weather Index reaching its second-highest value since 1950 and abnormally high burned areas observed by satellites.

How to cite: Ma, T., Chen, W., Cai, Q., Dong, Z., Wang, L., Hu, P., Gao, L., and Garfinkel, C. I.: Attribution analysis of the persistent and extreme drought in southwest China during 2022–2023, EGU General Assembly 2026, Vienna, Austria, 3–8 May 2026, EGU26-9025, https://doi.org/10.5194/egusphere-egu26-9025, 2026.

The boreal summer circumglobal teleconnection (CGT) provides primary predictability sources for mid-latitude Northern Hemisphere climate anomalies and extreme events. Here, we show that the CGT’s circulation structure has displaced westward by a half-wavelength since the late 1970s, more severely impacting heatwaves and droughts over East Europe, East Asia, and southwestern North America. We present convergent empirical and modelling evidence to reveal the essential role of El Niño-Southern Oscillation (ENSO) in shaping this change. Before the late 1970s, ENSO indirectly promoted CGT by modulating the Indian summer monsoon rainfall (ISMR). Recently, the ENSO–ISMR linkage was weakened, but the westward-displaced ENSO forcing was able to directly trigger a Rossby wave response at the exit of the East Asian westerly jet due to the easterly vertical shear of the zonal basic flow over the tropical western North Pacific, thus shifting the previous CGT’s North Pacific and downstream centers westward along the subtropical jet waveguide. Moreover, the state-of-the-art models with prescribed anthropogenic forcing cannot simulate such changes, indicating their origin from natural variability. The knowledge gained from this work highlights the importance of studying the impacts of changing ENSO to improve seasonal prediction of mid-latitude extreme events.

How to cite: Qiao, S.: Recent changes in ENSO’s impacts on the summertime circumglobal teleconnection and mid-latitude extremes, EGU General Assembly 2026, Vienna, Austria, 3–8 May 2026, EGU26-10712, https://doi.org/10.5194/egusphere-egu26-10712, 2026.

EGU26-12039 | Orals | AS1.30

Heatwave trends linked to atmospheric circulation and land–atmosphere coupling 

Fenying Cai, Caihong Liu, Dieter Gerten, Song Yang, Tuantuan Zhang, Kaiwen Li, Shuheng Lin, and Jürgen Kurths

Pronounced spatial disparity in heatwave trends is closely linked to changes in atmospheric circulation and land-atmosphere coupling. By using a complex-network method, we quantify the close relationships between heatwaves and atmospheric teleconnection in the Northern Hemisphere. We find that changes in atmospheric teleconnections (AT) explain about half of the interannual variability in heatwaves and correctly capture nearly 80% of the signs of zonally asymmetric heatwave trends in the mid-latitudes. Moreover, the probability of extremely hot summers has increased sharply by a factor of 4.5 since 2000 over the regions with enhanced AT, but remained almost unchanged over the areas with attenuated AT. By the end of the century, the intensification of heat-dome-like circulation is projected to promote summertime hotspots over western Asia and western North America. Enhanced soil-moisture–temperature coupling may further exacerbate heatwave intensity, particularly over western Asia. Overall, our study provides scientific support for developing impact-based mitigation strategies and more effectively managing future heatwave risks.


References:

Cai, F. et al. Sketching the spatial disparities in heatwave trends by changing atmospheric teleconnections in the Northern Hemisphere. Nat. Commun. 15, 8012 (2024). https://doi.org/10.1038/s41467-024-52254-0

Cai, F. et al. Pronounced spatial disparity of projected heatwave changes linked to heat domes and land-atmosphere coupling. npj Clim. Atmos. Sci. 7, 225 (2024). https://doi.org/10.1038/s41612-024-00779-y

How to cite: Cai, F., Liu, C., Gerten, D., Yang, S., Zhang, T., Li, K., Lin, S., and Kurths, J.: Heatwave trends linked to atmospheric circulation and land–atmosphere coupling, EGU General Assembly 2026, Vienna, Austria, 3–8 May 2026, EGU26-12039, https://doi.org/10.5194/egusphere-egu26-12039, 2026.

Since the 1980s, both incoming shortwave radiation (SW) and atmospheric vapor pressure deficit (VPD) have increased significantly across Europe and are projected to continue rising in the coming decades, potentially altering forest photosynthesis, carbon uptake, and carbon storage. However, the joint impacts of SW and VPD on forest carbon sequestration remain poorly understood. Here, using half-hourly flux tower observations combined with remotely sensed vegetation indices, we show that SW and VPD are the dominant energy- and water-related drivers of forest net ecosystem exchange (NEE; negative values indicate net carbon uptake) at the half-hourly scale in Europe. We identify a distinct threshold in the VPD–NEE relationship at approximately 7 hPa, beyond which influence of VPD shifts to positive values and strengthens sharply. The influence of VPD on NEE is strongly mediated by SW, increasing gradually under low SW conditions but intensifying sharply under high SW conditions. This pattern arises because strong solar radiation amplifies VPD-induced stomatal closure, thereby suppressing photosynthesis and altering ecosystem carbon exchange. Together, these findings suggest that future increases in atmospheric dryness—potentially reinforced by continued brightening—may substantially constrain forest productivity and carbon sequestration. Our results underscore the importance of accounting for SW–VPD interactions in climate impact assessments and forest management strategies.

How to cite: Zhong, Z.: Elevated shortwave radiation enhances the limitation of atmospheric dryness on forest carbon sequestration , EGU General Assembly 2026, Vienna, Austria, 3–8 May 2026, EGU26-12397, https://doi.org/10.5194/egusphere-egu26-12397, 2026.

Under global climate change, intensified land-atmosphere coupling has amplified the synergy between droughts and heatwaves, triggering a nonlinear escalation of compound hot-dry events (CHDEs) that threatens Earth systems. However, current research often lacks rigorous process-based classification at the atmosphere-soil interface, and understanding of energy partitioning and hydro-thermal feedback mechanisms remains limited, impeding systematic comprehension of these extremes. Using daily ERA5 and GLDAS data from 1965–2024, this study develops a mutually exclusive event identification framework based on four variables—vapor pressure deficit (VPD), air temperature (Tair), soil moisture (SM), and soil temperature (Tsoil)—classifying events into Single-Atmosphere (SA), Single-Soil (SS), and Compound Atmosphere-Soil (CAS) types. We systematically analyze event characteristics, identify high-risk regions, and conduct nonlinear trend analysis using Ensemble Empirical Mode Decomposition (EEMD). A progressive framework integrating event evolution analysis, Copula-based dependence modeling, and Structural Equation Modeling (SEM) is employed to elucidate the underlying physical mechanisms. Key findings are as follows: (1) Spatial patterns reveal mechanistic divergence. SA events display a "tropical zonal clustering" pattern with the highest frequency (8.12 events/decade) but shortest duration (5.09 days) and moderate intensity. SS events show a scattered distribution along land-sea margins with intermediate frequency (3.82 events/decade), longest duration (6.37 days), and lowest intensity. In contrast, CAS events expand extensively across mid-latitudes with the largest frequency increase (251%) and highest intensity (6.60 standardized units), marking a global shift from tropical single-process dominance toward mid-latitude land-atmosphere coupling dominance. (2) Evolution trends exhibit nonlinear acceleration. EEMD outperforms traditional linear regression in trend significance and fitting accuracy, demonstrating superior capability in capturing the nonlinear dynamics of extreme events. SA events intensify persistently in tropical regions but decelerate in later periods; SS events exhibit regional heterogeneity with abrupt shifts in arid zones; CAS events show synchronized global acceleration, with late-period growth rates exceeding early-period rates by 119%–232%. (3) Physical mechanisms differ fundamentally. Analysis reveals that SA events represent rapid boundary-layer responses to radiative forcing (energy-limited) with passive soil moisture depletion. SS events are driven by cumulative hydrological deficits (memory-dominated) with significant recovery lags. CAS events involve synergistic positive feedback: once SM drops below critical thresholds, a self-reinforcing loop (SM↓→LH↓/SH↑→Tair↑→VPD↑→SM↓↓) is triggered, fundamentally altering surface energy partitioning and hydro-thermal coupling regimes. Copula and SEM analyses confirm that SA events exhibit linear synchronous dependence under atmospheric forcing; SS events show lower-tail threshold effects dominated by soil memory; CAS events demonstrate significant cumulative atmospheric driving effects (with soil response lagged by 10–15 days) and enhanced tail dependence under extreme conditions, reflecting strong coupling between atmospheric triggers and soil feedbacks. Furthermore, large-scale climate modes such as ENSO modulate these processes by regulating regional background wet-dry states. This study establishes a comprehensive framework from event identification and characterization to mechanistic interpretation, elucidating the transformation of global hot-dry risks from "tropical single-process dominance" to "mid-latitude land-atmosphere coupling dominance," providing a robust scientific basis for monitoring, early warning, and risk management of compound extreme events.

How to cite: Yang, R., Zhao, L., and Li, X.: Distinct Energy and Hydro-Thermal Coupling Regimes at the Land-Atmosphere Interface Shape Global Compound Hot-Dry Extremes, EGU General Assembly 2026, Vienna, Austria, 3–8 May 2026, EGU26-12468, https://doi.org/10.5194/egusphere-egu26-12468, 2026.

Extreme stratospheric ozone-loss events, such as the Arctic spring of 2020, can emerge spontaneously in free-running chemistry–climate models during winters and springs with a strong and persistent polar vortex. While ozone is known to potentially affect stratospheric variability, its specific role in the subseasonal-to-seasonal (S2S) predictability of the stratosphere remains unclear. The first step consists of assessing its role in the prediction of internally generated extreme depletion events.

Here we analyse a suite of targeted hindcast experiments for several extreme ozone-loss winters identified in a 200-year free-running WACCM integration. Hindcasts are initialized from January to April to examine how predictability evolves through the winter season, and paired experiments compare configurations with fully interactive ozone to those in which the radiative transfer scheme uses a prescribed climatological ozone distribution.

Preliminary results show that early-winter vortex conditions are not a good predictor of the occurrence of extreme depletion events in late winter-spring, highlighting the limited predictability of the polar vortex, even under the strong vortex conditions that are conducive to ozone depletion in spring. For the most pronounced ozone-loss case, differences between interactive and prescribed ozone ensembles indicate that ozone–radiative feedbacks can, under certain conditions, support the persistence of a strong, cold vortex into late winter and spring, thereby maintaining the dynamical environment in which severe ozone depletion can occur. At the same time, the impact of interactive ozone on S2S skill varies with initialization date and event characteristics.

These findings provide first insights into how chemistry–dynamics coupling affects the predictability of extreme stratospheric states and point to the value of interactive ozone schemes in S2S prediction systems.

How to cite: Hu, W., Chiodo, G., and Chrysanthou, A.: The value of interactive ozone in predicting extreme stratospheric ozone-loss events in the Arctic: insights from targeted WACCM hindcasts, EGU General Assembly 2026, Vienna, Austria, 3–8 May 2026, EGU26-571, https://doi.org/10.5194/egusphere-egu26-571, 2026.

EGU26-1002 | ECS | Posters on site | AS1.31

Orographic gravity wave drag in CMIP6 and its influence on the polar vortex 

Dominika Hájková, Petr Šácha, and Aleš Kuchař

Orographic gravity waves (OGWs) are ubiquitous in our atmosphere and play an important role in the energy transport both horizontally as well as vertically to the higher levels. Due to their scales, they have to be parameterized in the models.

In this work we are trying to show how the differences in OGW drag between the models in CMIP6 initiative influence the resolved waves propagation and subsequently also the polar vortex.

Taking OGW drag over the maximum in the mid-latitudes in the lower stratosphere, we can show high correlations with Eliassen-Palm flux divergence, but also the zonal winds. Using different descriptive measures of poler vortex such as sudden stratospheric warming frequency (SSW) or Northern Hemisphere annular mode (NAM) we also try to connect this relationship to the strength of the polar vortex.

How to cite: Hájková, D., Šácha, P., and Kuchař, A.: Orographic gravity wave drag in CMIP6 and its influence on the polar vortex, EGU General Assembly 2026, Vienna, Austria, 3–8 May 2026, EGU26-1002, https://doi.org/10.5194/egusphere-egu26-1002, 2026.

EGU26-1847 | Orals | AS1.31

Cold Air Outbreaks in Midlatitude Asia With and Without Precursory Pulse in the Stratospheric Poleward Warm Air Transport 

Yueyue Yu, Zhiqiang Ding, Haishan Chen, Xiaocen Shen, and Ming Cai

Using ERA5 data from 1979 to 2024, this study classifies 173 wintertime Cold Air Outbreak (CAO) events in midlatitude Asia, based on their temporal phasing relative to pulse-like intensifications of warm air mass transport into the polar stratosphere above 400 K (PULSEs). Two PULSE-related types are identified: PULSE_lead (18.0%), where the PULSE precedes the CAO peak, and PULSE_lag (21.4%), where it follows. PULSE_lead events exhibit more persistent and widespread cold anomalies across Eurasia. The phasing is found to be governed by the planetary-wave driven coupling between the poleward stratospheric warm branch and equatorward tropospheric cold branch of the isentropic meridional mass circulation at 60°N, respectively dominated by warm air transport over the Northwestern Pacific and cold air transport over Asia. PULSE_lead events are preceded by rapid propagation of wavenumber-2 energy into the stratosphere, simultaneously intensify both branches. In contrast, PULSE‐lag events are triggered by a stronger Ural ridge and downstream energy dispersion, with delayed wavenumber‐1‐dominated upward wave flux strengthening the stratospheric warm branch only after the CAO. While PULSE_lag events are mainly caused by tropospheric processes, a downward impact from the stratosphere is found for PULSE_lead. The precursory PULSE induces a stratospheric mass deficit over the East Asian trough region, resulting in barotropic low anomalies, which helping maintain the trough and prolong the CAO. Furthermore, PULSE_lead events have detectable stratospheric polar vortex anomalies 2 weeks in advance. This study clarifies that though most Asian CAOs have a lagged stratospheric response, a significant subset is preceded by active stratospheric forcing.

How to cite: Yu, Y., Ding, Z., Chen, H., Shen, X., and Cai, M.: Cold Air Outbreaks in Midlatitude Asia With and Without Precursory Pulse in the Stratospheric Poleward Warm Air Transport, EGU General Assembly 2026, Vienna, Austria, 3–8 May 2026, EGU26-1847, https://doi.org/10.5194/egusphere-egu26-1847, 2026.

Weak stratospheric polar vortex (WSPV) events are dynamically connected with the variations in the tropospheric circulation, serving as crucial harbingers for surface cold extremes in the Northern Hemisphere. Although WSPV events are usually featured with either displaced or split stratospheric polar vortex pattern, a notable portion of WSPV events experiences both patterns successively, leading to inconclusive surface impacts of different WSPV events. Here, we propose a novel method to quantitatively identify WSPV events with vortex transition (namely, mixed-type WSPV events) by performing clustering analysis on WSPV days based on 42-yr ERA5 reanalysis, and further examine their climatological features, surface impacts and tropospheric precursors. Results show that the mixed-type WSPV events are usually featured with a routine vortex evolution from displacement to split. In contrast to comparatively weak tropospheric response to pure displaced- and split-type events, the mixed-type WSPV events feature the longer persistence of stratospheric circulation anomalies and are followed by stronger negative Arctic Oscillation-like surface signatures, further contributing to more robust cold anomalies over northern Eurasia and the central U.S. 10–39 days after event onset. Moreover, mixed-type events are typically induced by upward propagated wave activity flux into the stratosphere contributed by the synergistic enhancement of tropospheric planetary wavenumbers 1 and 2. The enhancement of tropospheric planetary wavenumbers 1 and 2 is associated with deepening of the Aleutian Low and strengthening of the dipole over northern Scandinavia-eastern Siberia, respectively. This tropospheric configuration can sevrve as a vital precursor pattern for mixed-type WSPV events, hinting at extreme cold events with far-reaching societal impacts.

How to cite: Zhang, M., Yang, X.-Y., and Huang, Y.: A strong stratospheric harbinger for cold extremes: Weak polar vortex transition from displacement to split pattern, EGU General Assembly 2026, Vienna, Austria, 3–8 May 2026, EGU26-2667, https://doi.org/10.5194/egusphere-egu26-2667, 2026.

EGU26-3643 | Posters on site | AS1.31

Insights from Idealized Modelling into the Quasi-Biennial Oscillation  

Thomas Reichler and Zac Johns

Most climate models that simulate the Quasi-Biennial Oscillation (QBO) substantially underestimate tropical zonal wind amplitudes in the lower stratosphere, which limits their ability to represent global QBO teleconnections. To investigate the causes of this long-standing bias and to identify the key requirements for simulating a realistic QBO, we use an idealized atmospheric model with simplified physics based on the GFDL dry spectral dynamical core. The model incorporates empirically derived latent heating from observed tropical precipitation to represent the effects of tropical convection on the generation of resolved waves that drive the QBO.

We perform an extensive set of sensitivity experiments that systematically vary tropical heating, parameterized gravity wave drag, gravity wave drag strength and formulation, vertical resolution, and horizontal resolution. The results demonstrate that high vertical resolution (L80) is the most critical factor for reproducing realistic QBO amplitudes in the lower stratosphere. Parameterized gravity wave drag is also essential, as tropical heating alone is insufficient to sustain a robust QBO. In contrast, increasing horizontal resolution beyond moderate values provides little benefit, with simulations at T42 resolution already producing a reasonable QBO.

How to cite: Reichler, T. and Johns, Z.: Insights from Idealized Modelling into the Quasi-Biennial Oscillation , EGU General Assembly 2026, Vienna, Austria, 3–8 May 2026, EGU26-3643, https://doi.org/10.5194/egusphere-egu26-3643, 2026.

EGU26-8539 | Orals | AS1.31

Searching for the links between minor sudden stratospheric warmings in the Southern Hemisphere and polar vortex parameters 

Gennadi Milinevsky, Asen Grytsai, Ruixian Yu, Oleksandr Evtushevsky, Diana Zazubyk, Andrew Klekociuk, and Yuliia Yukhymchuk

The relationship between minor sudden stratospheric warmings (SSWs) in the Southern Hemisphere (SH) and polar vortex parameters is poorly understood and requires new approaches. A key issue is identifying possible tropospheric and stratospheric precursors to minor SSWs in the SH. Such precursors could include unique blocking structures over the Southern Ocean and Rossby wave trains from the Indian Ocean-El Niño Dipole. Unlike the Northern Hemisphere, where such precursors are frequently studied, precursors in the Southern Hemisphere are less well known. They are likely related to oceanic or ocean-atmosphere transitions rather than topography. We analyzed the parameters of the polar vortex geometry during minor and major sudden stratospheric warmings in the Southern Hemisphere, as well as total ozone anomalies, to determine whether they could provide early warning signals for SSWs by identifying changes in vertical transport. We analyzed changes in vortex area based on potential vorticity at 60°S, which reveals vortex compression or expansion. We also explored the pathways of downward influence, specifically, whether the surface signal of minor SSWs in the Southern Hemisphere is predictable and whether it depends on the vortex's vertical structure, particularly its downward propagation velocity. Unlike the Northern Hemisphere, where an evident downward influence is observed, the signal in the SH is noisy, possibly due to factors such as vortex depth or the phase of the quasi-biennial oscillation (QBO). A search for the possible influence of the QBO on the occurrence and parameters of minor SSWs in the SH was conducted. The downward propagation rate of geopotential height anomalies and the SAM index response after a warming event were examined. Possible links between minor SSWs in the SH and predictable surface impacts were discussed. Unlike the Northern Hemisphere, where SSWs cause extremely low surface temperatures, a search was conducted for links between the SH minor SSW events and extremely high precipitation in Chile, New Zealand, and Australia.

How to cite: Milinevsky, G., Grytsai, A., Yu, R., Evtushevsky, O., Zazubyk, D., Klekociuk, A., and Yukhymchuk, Y.: Searching for the links between minor sudden stratospheric warmings in the Southern Hemisphere and polar vortex parameters, EGU General Assembly 2026, Vienna, Austria, 3–8 May 2026, EGU26-8539, https://doi.org/10.5194/egusphere-egu26-8539, 2026.

Sudden stratospheric warmings (SSWs) are among the most dramatic regime transitions in the winter stratosphere, yet their onset remains difficult to diagnose and predict. We explore SSWs from a critical-transition perspective using Eigen Microstate Theory (EMT), which provides an entropy-based measure of how the circulation reorganizes during the event life cycle. In reanalysis composites of major SSWs, we identify a robust, non-monotonic entropy evolution: it rises during vortex deceleration, reaches a maximum prior to onset, and then collapses sharply as the vortex breaks. This “order–disorder–order” sequence provides direct empirical evidence that SSWs exhibit signatures of phase transitions and criticality in the real atmosphere. 

To connect this statistical signature to dynamics, we analyze a one-dimensional wave–mean-flow interaction model that captures the nonlinear feedbacks underpinning vortex destabilization. The model reproduces the same entropy peak and collapse when the system is driven toward instability, supporting the interpretation of eigen-microstate entropy as an order parameter for an intrinsically nonequilibrium transition. Across both reanalysis and model experiments, supported by analytical considerations, the entropy shows a pronounced response as the system approaches loss of stability and provides a clearer precursor than conventional single-series early-warning indicators such as lag-1 autocorrelation (AR1). These results suggest a physically interpretable, entropy-based diagnostic of SSW criticality with potential value for subseasonal prediction.

How to cite: Zhao, D. and Zhang, Y.: Sudden stratospheric warmings as nonequilibrium transitions: evidence from eigen-microstate entropy, EGU General Assembly 2026, Vienna, Austria, 3–8 May 2026, EGU26-8570, https://doi.org/10.5194/egusphere-egu26-8570, 2026.

EGU26-8711 | ECS | Orals | AS1.31

Stability Behind the Nonstationarity: The Case of the Recent Reversal in the ENSO–Stratospheric Polar Vortex Teleconnection 

Xiaocen Shen, Marlene Kretschmer, Theodore G. Shepherd, and Adam. A. Scaife

Teleconnections are crucial for regional climate variability and prediction. However, they often appear to be unstable over time, known as nonstationarity. The recent reversal of the well-established ENSO–stratospheric polar vortex (SPV) teleconnection illustrates this puzzle. As this teleconnection is a key pathway for ENSO to influence wintertime circulation in the mid-to-high latitudes, its apparent breakdown questions its reliability as a source of predictability. Here we demonstrate that this nonstationarity is more a statistical artifact than a dynamical shift. By distinguishing the underlying physical linkage from statistical association, we reveal that the observed reversal is driven by an extreme winter outlier and a persistent weakening trend. Much of this weakening can be attributed to the confounding influence of the Quasi-Biennial Oscillation (QBO), whose intermittent alignment with ENSO introduces spurious low-frequency fluctuations in the ENSO–SPV statistical relationship. A physically motivated toy model confirms that such apparent nonstationarity can arise even when the underlying ENSO–SPV linkage remains unchanged, emerging from chance alignment between ENSO and QBO. After accounting for these effects, the ENSO–SPV linkage is substantially more stable than suggested by the raw statistical relationship. Our findings suggest that caution is needed when interpreting time-varying fluctuations in short climate records as structural changes.

How to cite: Shen, X., Kretschmer, M., Shepherd, T. G., and Scaife, A. A.: Stability Behind the Nonstationarity: The Case of the Recent Reversal in the ENSO–Stratospheric Polar Vortex Teleconnection, EGU General Assembly 2026, Vienna, Austria, 3–8 May 2026, EGU26-8711, https://doi.org/10.5194/egusphere-egu26-8711, 2026.

EGU26-9980 | ECS | Posters on site | AS1.31

Types of Stratospheric Wave Reflection Events and their Surface Impacts 

Julia Dworzak and Daniela I.V. Domeisen

Variability in the stratospheric polar vortex can exert significant impacts on the tropospheric circulation and thereby influence mid-latitude winter weather. A notable winter-time phenomenon are stratospheric wave reflection events, characterized by upward-propagating Rossby waves that are reflected downward by the stratosphere. Previous studies have established a strong link between reflected waves over Canada and cold spells over North America.

Recent work on stratosphere-troposphere coupling during wave reflection has mainly focused on events in the North Pacific and North American region. However, wave reflection can occur in different regions, be triggered by distinct vortex states, and lead to different surface impacts. Therefore, identifying and characterizing different types of reflection events will help improve our understanding of stratosphere-troposphere coupling and identify conditions under which the stratosphere may provide enhanced predictability for winter weather.

To identify distinct types of wave reflection, we apply cluster analysis to spatial patterns of daily meridional eddy heat flux anomalies at the 100hPa level, which in the zonal mean is proportional to the vertical component of the Eliassen-Palm flux. The analysis reveals several modes of wave propagation that differ in region and magnitude and are associated with distinct zonally asymmetric vortex states. One specific type is associated with regionally reflected waves over Europe and a shift of the polar vortex towards Europe. During these events, surface temperatures are anomalously low across Europe. We compare these European reflection events with the more frequently studied North Pacific/North American reflection events. In addition, we examine how the frequency of these events may change under climate change, as previous studies have indicated a persistent shift of the Arctic polar vortex towards the Eurasian continent.

By expanding the understanding of spatial patterns of stratospheric wave reflection events, their regional influence on the tropospheric circulation, and potential future changes in their frequency, this work aims to advance the foundation for improved predictability of mid-latitude winter weather.

How to cite: Dworzak, J. and Domeisen, D. I. V.: Types of Stratospheric Wave Reflection Events and their Surface Impacts, EGU General Assembly 2026, Vienna, Austria, 3–8 May 2026, EGU26-9980, https://doi.org/10.5194/egusphere-egu26-9980, 2026.

EGU26-10386 | ECS | Posters on site | AS1.31

Are SSW impacts on surface temperature extremes changing due to increasing CO2 concentrations? 

Daniel De Maeseneire, Blanca Ayarzagüena, and Natalia Calvo

Sudden Stratospheric Warmings (SSWs) represent the dominant mode of variability in the winter polar stratosphere and play a key role in modulating tropospheric circulation and surface climate. SSWs can influence surface temperature extremes, with important implications for regional climate variability. However, how SSW characteristics and their surface impacts may change under strong greenhouse gas forcing remains an open question, and current projections show substantial inter-model uncertainty. In this study, we examine the response of SSW-related surface temperature extremes in the Northern Hemisphere to an abrupt quadrupling of CO2 concentrations (abrupt-4xCO2) relative to preindustrial conditions, using simulations from CMIP6 models. To better characterize the model uncertainty, we separate the models into two groups according to their projected change in SSW frequency under 4xCO2 forcing: models exhibiting a decrease in SSW frequency and models showing an increase.

Models with a decrease in SSW frequency project a strengthened polar vortex and a more persistent SSW signal in the lower stratosphere under 4xCO2 with respect to preindustrial conditions. Consequently, they show a stronger stratosphere–troposphere coupling and a more pronounced surface response following SSW events. SSWs for this group of models are associated with an increased probability and longer duration of cold spells over Scandinavia, and to a lesser extent over northern Siberia, under 4xCO2 conditions. In contrast, models with increasing SSW frequency exhibit weaker persistence of the stratospheric signal and reduced surface impacts as a response to 4xCO2. The results highlight contrasting responses between the two model groups, suggesting that projected changes in polar vortex strength and stratosphere-troposphere coupling play an important role in shaping future SSW impacts at surface extreme events.

How to cite: De Maeseneire, D., Ayarzagüena, B., and Calvo, N.: Are SSW impacts on surface temperature extremes changing due to increasing CO2 concentrations?, EGU General Assembly 2026, Vienna, Austria, 3–8 May 2026, EGU26-10386, https://doi.org/10.5194/egusphere-egu26-10386, 2026.

EGU26-10798 | Posters on site | AS1.31

Year to year variability of stratospheric NO2 (1995 to 2026) above Kiruna, Northern Sweden, derived from ground-based and satellite DOAS observations 

Thomas Wagner, Myojeong Gu, Carl-Fredrik Enell, Ulrich Platt, Uwe Raffalski, and Andreas Richter

Stratospheric NO2 originates from the decomposition of N2O after its transport from the troposphere into the stratosphere. Due to anthropogenic activities the tropospheric mixing ratios of N2O increased from pre-industrial levels of about 265 ppb to about 339 ppb in 2025. Alone during the time of our ground based DOAS measurements the increase of tropospheric N2O was around +9%, which should result in a similar NO2-increase. In order to test this hypothesis we investigated stratospheric NO2 column densities from long-term zenith DOAS measurements (1995 – 2026) in Kiruna (northern Sweden). We also compare the ground-based data to satellite observations from several UV/vis sensors (GOME-1, SCIAMACHY, OMI, GOME-2AB, TROPOMI). Good agreement of the relative temporal variations is found between both data sets, but systematic deviations occur for the absolute values, which can be explained by differences in the solar zenith angles during the measurements and the analysis details. Interestingly, no clear trend in the stratospheric NO2 columns during the whole time series is found, which is in contradiction to the above assumption. Moreover, a strong year-to-year variability of up to about +/-10% is found. Both findings indicate that the stratospheric NO2 amount is influenced by more complex processes, most probably related to variations of the Brewer-Dobson circulation. We investigate such influences by comparing our long term data sets of stratospheric NO2 to variables describing the entry of tropospheric air into the stratosphere and the strength of the Brewer-Dobson circulation. 

How to cite: Wagner, T., Gu, M., Enell, C.-F., Platt, U., Raffalski, U., and Richter, A.: Year to year variability of stratospheric NO2 (1995 to 2026) above Kiruna, Northern Sweden, derived from ground-based and satellite DOAS observations, EGU General Assembly 2026, Vienna, Austria, 3–8 May 2026, EGU26-10798, https://doi.org/10.5194/egusphere-egu26-10798, 2026.

EGU26-12252 | ECS | Posters on site | AS1.31

The MJO-SSW Teleconnection: ENSO Modulation and a Recent Intensification over the Past Two Decades 

Ji Ma, Wen Chen, and Ruowen Yang

The Madden-Julian Oscillation (MJO) has been demonstrated to play an important role in the occurrence of sudden stratospheric warming (SSW) events, suggesting possible extratropical impacts of MJO via a stratospheric pathway. However, the existence of this stratospheric pathway is determined by the horizontal and vertical propagation of Rossby waves, which is closely related to both the MJO convection itself and the extratropical basic state. Our studies suggest that the El Niño-Southern Oscillation (ENSO) significantly regulates the MJO-SSW relationship, which is robust during La Niña winters but almost nonexistent during El Niño winters. Further analysis indicates that ENSO influences the extratropical response to MJO, which facilitates the amplification and vertical propagation of the wavenumber 2 component of planetary waves during La Niña winters. Moreover, we have identified a pronounced intensification of the MJO‐SSW relationship in the past two decades, probably due to the prolonged duration of MJO‐related enhanced convection during P7 and the shifts in the extratropical basic state.

How to cite: Ma, J., Chen, W., and Yang, R.: The MJO-SSW Teleconnection: ENSO Modulation and a Recent Intensification over the Past Two Decades, EGU General Assembly 2026, Vienna, Austria, 3–8 May 2026, EGU26-12252, https://doi.org/10.5194/egusphere-egu26-12252, 2026.

EGU26-12813 | Posters on site | AS1.31

Analogue-based identification of preconditioned polar vortex states preceding sudden stratospheric warmings 

Cristina Peña-Ortiz, David Gallego, and Carmen Álvarez-Castro

Sudden stratospheric warmings (SSWs) are known to be associated with the presence of a preconditioned polar vortex state that facilitates the upward propagation of planetary waves from the troposphere. Previous studies have suggested that this pre-warming state differs depending on the SSW type, with displacement events characterized by a weakened, funnel-shaped vortex, and split events associated with a narrower and more vertically aligned vortex displaced towards the pole. More recent evidence, however, indicates that the majority of SSWs, largely independent of their type, are preceded by enhanced tropical stratopause wave driving, which shifts the zero-wind line poleward, displaces the vortex towards higher latitudes and promotes the focusing of wave activity into the polar stratosphere and mesosphere.

Despite this progress, there remains an open debate as to whether SSWs require an anomalously strong pulse of tropospheric wave activity, or whether climatological tropospheric forcing is sufficient when combined with a favorable stratospheric state. In this study, we address this question by applying a Euclidean-distance-based analogue method to identify pre-warming polar vortex states using daily ERA5 reanalysis data. Analogous vortex configurations are objectively defined based on their similarity to a reference pattern and are subsequently classified according to whether they precede an SSW or not.

Our results show that approximately 75% of SSWs occurring between December and February during the period 1980–2021 (18 out of 23 events) are preceded by a recurrent preconditioned state characterized by a poleward-displaced vortex north of 60°N. This preconditioning phase persists over a variable number of consecutive days and terminates with a strong stratopause-level vortex deceleration, accompanied by the development of easterly winds that subsequently propagate downward through the stratosphere, marking the onset of vortex decline. A key distinction between cases that do and do not lead to an SSW lies in the strength of lower-tropospheric wave activity. Thus, while wave forcing is enhanced relative to climatology in both cases, it is stronger in SSW events, supporting the idea that both a favorable preconditioned vortex state and anomalously strong tropospheric wave forcing are necessary ingredients for SSW generation. Finally, split SSWs tend to be associated with stronger and more persistent tropospheric wave activity, both during the establishment of the preconditioning state and throughout the subsequent vortex breakdown.

How to cite: Peña-Ortiz, C., Gallego, D., and Álvarez-Castro, C.: Analogue-based identification of preconditioned polar vortex states preceding sudden stratospheric warmings, EGU General Assembly 2026, Vienna, Austria, 3–8 May 2026, EGU26-12813, https://doi.org/10.5194/egusphere-egu26-12813, 2026.

EGU26-13230 | ECS | Orals | AS1.31

Short-Term Solar Influences via the MJO on the Northern Hemisphere Storm Tracks 

Charles A. Hoopes, Lon L. Hood, and Thomas J. Galarneau, Jr.

Prior work has shown that the Northern Hemisphere storm tracks are modulated by the tropical Madden-Julian oscillation (MJO) and that the modulation is strongest during the easterly phase of the stratospheric quasi-biennial oscillation (Guo et al., 2017; Wang et al., 2018).  Prior work has also identified a ~27-day solar rotational modulation of the MJO and its eastward propagation (Hoopes et al., 2024).  Here, lagged composite analyses of storm tracks relative to 97 strong solar UV peaks and 90 strong solar UV minima occurring during the northern cool season over a 66-year period demonstrate a significant weakening and southward shift of the storm tracks, in both the North Pacific and North Atlantic, near and following UV peaks.  Evidence is presented supporting the hypothesis that reduced MJO convection in the Indian Ocean region prior to solar UV peaks produces a positive Rossby wave source that results in a cyclonic circulation anomaly in the Northwest Pacific, thereby causing the weakening and southward shift of the storm tracks. 


1 Guo, Y., Shinoda, T., Lin, J., and Chang, E. K. M. (2017).  Journal of Climate, 30, 4799-4818.  https://doi.org/10.1175/1520-0469(2004)061%3C0023:TEOVIJ%3E2.0.CO;2.

2 Wang, J., Kim, H.-M., Chang, E. K. M., & Son, S.-W. (2018), Journal of Geophysical Research: Atmospheres, 123, 3976-3992. https://doi.org/10.1029/2017JD027977 

3 Hoopes, C. A., Hood, L.L., & Galarneau, T. J., Jr. (2024). Geophysical Research Letters, 51, e2023GL107701. https://doi.org/10.1029/2023GL107701

How to cite: Hoopes, C. A., Hood, L. L., and Galarneau, Jr., T. J.: Short-Term Solar Influences via the MJO on the Northern Hemisphere Storm Tracks, EGU General Assembly 2026, Vienna, Austria, 3–8 May 2026, EGU26-13230, https://doi.org/10.5194/egusphere-egu26-13230, 2026.

EGU26-13869 | ECS | Posters on site | AS1.31

The QBO Buffer Zone: Insights from a Hierarchy of Models 

Malcolm Maas, Alison Ming, and Peter Haynes

The Quasi-Biennial Oscillation (QBO) is a pattern of alternating zonal wind regimes in the tropical stratosphere which are forced by upward propagating waves. It extends from around 17km to 50km above the surface, leaving a gap, the “buffer zone”, between its lower limit and the effective source of the waves that provide the forcing (the upper troposphere). The explanation for this buffer zone has been a subject of recent research, notably by Match and Fueglistaler (2019, 2020). They use an idealised one-dimensional model of the QBO to conclude that the buffer zone is formed by mean-flow damping (likely due to horizontal momentum fluxes). We explore this mechanism in two- and three-dimensional models. By imposing mean-flow damping of various shapes and sizes on an idealised 2D (height-latitude) QBO model, we can induce formation of a buffer zone, as well as interesting behaviour not found in the 1D model. We also investigate whether the same behaviour occurs in a 3D GCM, where the horizontal momentum fluxes are due to resolved waves, rather than being imposed as an ad hoc damping. Our results thus far seem to strengthen recent theories on the buffer zone formation mechanism, and will contribute to better understanding of the dynamics at work.

How to cite: Maas, M., Ming, A., and Haynes, P.: The QBO Buffer Zone: Insights from a Hierarchy of Models, EGU General Assembly 2026, Vienna, Austria, 3–8 May 2026, EGU26-13869, https://doi.org/10.5194/egusphere-egu26-13869, 2026.

EGU26-14795 | ECS | Orals | AS1.31

Sensitivity of the QBO to the turbulent diffusion scheme in an idealized model 

Vincent Bremaud, Aurélien Podglajen, Annelize Van Niekerk, Albert Hertzog, and Riwal Plougonven

Vertical diffusion in the free atmosphere due to turbulence has received limited attention in the literature, but its parameterization has significant effects on the models' general circulation. In the new cycle 50r1 of the ECMWF Integrated Forecasting System (IFS), scheduled to become operational in February and already used in the ERA6 reanalysis currently in production, the turbulence scheme was updated to reduce vertical momentum and heat diffusivities in the lower stratosphere. This change is motivated by persistent biases in IFS seasonal forecasts in that region, including biases in the amplitude and vertical descent of the simulated Quasi-Biennial Oscillation (QBO) (ECMWF Newsletter No.185, Autumn 2025). 

In this study, we use a recently developed idealized two-dimensional (longitude–altitude) tropical channel model to investigate, in a controlled framework, the impact of these recent changes in the vertical diffusion scheme on the QBO. The model is based on the Weather Research and Forecasting (WRF) model and reproduces, in two dimensions, the canonical wave–mean-flow interaction regime of the QBO following Holton, Lindzen, and Plumb: two monochromatic, planetary-scale gravity waves diabatically forced in the lower model layer propagate upward and force the mean flow as they dissipate. We compare a cycle-49–like long-tail Richardson-number closure (Viterbo, 1999, fLTG) with a cycle-50–like blended stability function that reduces vertical mixing over a finite layer in the lower stratosphere and relies on a cycle-38–like short-tail Richardson-number closure (Beljaars and Holtslag, 1991, fMO). 

The new reduced diffusion formulation substantially modifies the simulated QBO, with larger amplitudes in the lower stratosphere and a longer period. This shows how an idealized framework can help identify key sensitivities in a global forecasting system.

How to cite: Bremaud, V., Podglajen, A., Van Niekerk, A., Hertzog, A., and Plougonven, R.: Sensitivity of the QBO to the turbulent diffusion scheme in an idealized model, EGU General Assembly 2026, Vienna, Austria, 3–8 May 2026, EGU26-14795, https://doi.org/10.5194/egusphere-egu26-14795, 2026.

EGU26-15198 | ECS | Orals | AS1.31

A novel diagnostic metric for quantifying Antarctic ozone hole dynamics 

Hannah Kessenich, Annika Seppälä, Dan Smale, Craig Rodger, and Mark Weber

For the next several decades, the Antarctic ozone hole will remain an annual phenomenon. As concentrations of stratospheric chlorine gradually decrease, so will the severity of ozone depletion within the ozone hole. Chemical influences on the ozone hole are relatively well-understood and readily modelled. However, the dynamical state of the polar stratosphere is considerably more challenging to evaluate. Dynamical conditions exert a strong influence on the springtime progression of the ozone hole, affecting the strength and structure of the polar vortex, transport of ozone, and temperatures across the polar cap. In this work, we share a new diagnostic metric, the Mesospheric Parcel Altitude (MPA), which traces the descent of mesospheric air into the springtime polar vortex. The MPA captures the dynamical state of the vortex interior and serves as a directly observable proxy for horizontal ozone transport. With this novel metric, we can more accurately attribute the chemical and dynamical drivers of uniquely long/short-lived ozone holes.

How to cite: Kessenich, H., Seppälä, A., Smale, D., Rodger, C., and Weber, M.: A novel diagnostic metric for quantifying Antarctic ozone hole dynamics, EGU General Assembly 2026, Vienna, Austria, 3–8 May 2026, EGU26-15198, https://doi.org/10.5194/egusphere-egu26-15198, 2026.

EGU26-16471 | ECS | Posters on site | AS1.31

Tropospheric and stratospheric polar vortex variability and winter surface weather 

Elena Mirela Polifronie and Sorin Cheval

Winter surface weather during the cold season is frequently discussed in relation to polar vortex variability, particularly in the stratosphere. However, winter weather events characterised by cold outbreaks, snowfall, and blizzard conditions exhibit substantial variability in surface expression across different circulation settings. This motivates a detailed diagnostic analysis of how tropospheric and stratospheric polar vortex variability relate to winter surface weather.

In this study, several winter periods over the Northern Hemisphere are analysed using ERA5 reanalysis data, with the objective of examining the relationship between vortex variability and surface weather characteristics. The analysis focuses on the correspondence between tropospheric circulation regimes, the vertical structure of vortex variability, and the resulting diversity of winter surface weather outcomes.

The analysis follows a troposphere-first approach, in which surface and lower-tropospheric circulation is examined prior to assessing the stratospheric state. Winter surface weather is described in terms of near-surface temperature, snowfall-related precipitation, and associated large-scale circulation regimes.

Tropospheric dynamics are diagnosed using sea-level pressure, 500 hPa geopotential height, 850 hPa temperature advection, upper-tropospheric jet structure, and potential vorticity near the dynamical tropopause, providing a framework for identifying jet displacement, blocking, and cyclone pathways. Stratospheric variability is examined using zonal-mean zonal wind at 60°N and 10 hPa, polar-cap temperature, geopotential height, and potential vorticity across multiple stratospheric levels (10–50 hPa), together with eddy heat flux diagnostics to characterise wave forcing and vertical structure.

By explicitly contrasting cases with similar stratospheric signatures but differing tropospheric configurations, the findings underline the importance of considering tropospheric circulation regimes when interpreting stratospheric polar vortex variability in relation to surface weather.

How to cite: Polifronie, E. M. and Cheval, S.: Tropospheric and stratospheric polar vortex variability and winter surface weather, EGU General Assembly 2026, Vienna, Austria, 3–8 May 2026, EGU26-16471, https://doi.org/10.5194/egusphere-egu26-16471, 2026.

EGU26-18784 | Posters on site | AS1.31

Impacts of energetic electron precipitation on the atmosphere: results from a 300-year chemistry-climate model experiment 

Timo Asikainen, Antti Salminen, Mikhail Vokhmyanin, Pavle Arsenovic, and Timofei Sukhodolov

Many past studies based on climate reanalysis data have strongly indicated that energetic electron precipitation (EEP) from space into the polar atmosphere leads to mesospheric and stratospheric ozone loss. This in turn affects radiative balance in the atmosphere and leads to thermal changes, which enhance the stratospheric polar vortex.

Here we study the EEP influence on the atmosphere and climate system using the SOCOL3-MPIOM chemistry-climate model. We run idealized 300-year long timeslice simulations with (experiment run) and without (control run) EEP forcing. The control run captures the internal variability of the climate system without EEP forcing, while the experiment run depicts the variability of the climate system when it is forced with EEP. The EEP forcing employs a parameterization to represent the influx of NOx molecules through the model top created by low-energy auroral precipitation. We also include the direct ionization produced by EEP evaluated from a new data composite based on POES satellite observations. The model is repetitively forced each year throughout the entire simulation with the EEP forcing observed during winter 2003/2004.

Here we discuss the preliminary findings from these long model runs and show that they confirm the EEP-driven ozone loss and subsequent enhancement of the stratospheric polar vortex.

How to cite: Asikainen, T., Salminen, A., Vokhmyanin, M., Arsenovic, P., and Sukhodolov, T.: Impacts of energetic electron precipitation on the atmosphere: results from a 300-year chemistry-climate model experiment, EGU General Assembly 2026, Vienna, Austria, 3–8 May 2026, EGU26-18784, https://doi.org/10.5194/egusphere-egu26-18784, 2026.

EGU26-19297 | ECS | Posters on site | AS1.31

Southern hemispheric large-scale circulation changes in two opposing storylines of future Antarctic climate change 

Konstantin Richter, Ludovica Gatti, Dörthe Handorf, and Raphael Köhler

The Southern Hemisphere (SH) stratospheric polar vortex (SPV) is a key dynamical component of the atmospheric circulation, exerting a strong influence on tropospheric circulation and near-surface climate through stratosphere–troposphere coupling. Despite its importance, the future evolution of the SH SPV remains highly uncertain, as projections depend sensitively on the magnitude and character of Antarctic climate change. To address this uncertainty, storyline approaches offer a physically plausible framework that explores contrasting Antarctic climate futures in a structured way, without collapsing distinct responses into an ensemble mean.

Building on the storyline framework of Williams et al. [1], this study investigates the influence of two opposing scenarios of Antarctic climate change on the large-scale circulation of the SH using the ICON (ICOsahedral Nonhydrostatic) atmospheric model. Two physically motivated future scenarios are considered: one characterised by strong Antarctic sea-ice loss combined with an earlier breakdown of the SH stratospheric polar vortex, and one featuring weaker sea-ice loss and a delayed vortex breakdown. These contrasting boundary conditions provide a controlled framework to assess how different Antarctic climate pathways can force distinct stratospheric and tropospheric circulation responses within a single model.

For each storyline, 30-year simulations are analysed for present-day (1985–2014) and end-of-century (2070–2099) conditions. The analysis focuses on changes in stratospheric variability and stratosphere–troposphere coupling, with particular attention to the frequency and near-surface impacts of SPV weakening and strengthening events, thereby assessing the circulation pathways through which contrasting Antarctic boundary conditions affect the SH larg-scale circulation within one model.


 [1] R. S. Williams et al., “Future Antarctic Climate: Storylines of Midlatitude Jet Strengthening and Shift Emergent from CMIP6,” Journal of Climate, vol. 37, no. 7, pp. 2157–2178, Apr. 2024, doi: 10.1175/JCLI-D-23-0122.1.

How to cite: Richter, K., Gatti, L., Handorf, D., and Köhler, R.: Southern hemispheric large-scale circulation changes in two opposing storylines of future Antarctic climate change, EGU General Assembly 2026, Vienna, Austria, 3–8 May 2026, EGU26-19297, https://doi.org/10.5194/egusphere-egu26-19297, 2026.

EGU26-19363 | Orals | AS1.31

A framework to compare GNSS-RO and reanalysis equatorial wave spectra of Cold-point tropopause temperature 

Robin Pilch Kedzierski, Sean Davis, Susann Tegtmeier, Krzysztof Wargan, and Martin Weissmann

The tropical Cold-point tropopause temperature (CPT) controls the amount of water vapor that enters the stratosphere, as air masses that cross through the equatorial tropopause are subjected to freeze-drying.

GNSS radio-occultation (GNSS-RO) provide temperature profile measurements with high vertical resolution and global coverage, enabling the monitoring of the CPT evolution outside of the few tropical regions covered by radiosondes. Reanalyses are all known to have a modeled CPT that is on average too warm, compared to GNSS-RO measurements.

The reanalysis CPT warm bias maximizes near the Equator, hinting at a possible role of equatorial waves. However, to date the reanalysis CPT biases have only been studied from a zonal-mean and long-term perspective, without looking at the effects of equatorial waves.

Observed equatorial CPT shows peaks in the wavenumber-frequency spectrum coinciding with equatorial wave’s theoretical dispersion curves. This means that equatorial waves that propagate through the equatorial tropopause are modulating CPT variability. The observational study of CPT wave spectrum by Kim and Son (2012) used the COSMIC RO mission, and had a relatively limited space-time resolution: 10°N-10°S meridional average and 3-day running mean, i.e. only showing the symmetric part of the spectrum. Meanwhile, efforts to compare reanalyses’ wave spectra used data at the standard 100 hPa level close to the tropical tropopause, with no observational dataset as reference.

In our study, we showcase a framework to inter-compare CPT wavenumber-frequency spectra from various reanalyses to that of observed CPT from GNSS-RO. We combine multiple GNSS-RO mission data and grid them on 5° x 5° longitude-latitude daily resolution for the years 2007-2018. Model-level CPT from ERA5, ERA-Interim, JRA55 and MERRA-2 reanalyses, are interpolated/averaged onto the same 5° x 5° daily grid from GNSS-RO, enabling a 1-to-1 comparison on the same space-time grid, at the cold-point. Our goals using this dataset are: a comparison between purely observational and reanalyses’ CPT spectra that is as fair as possible, with a better resolution and longer time-period than previous studies, and the separation of the symmetric and anti-symmetric parts of the spectra. This provides valuable information about what types of CPT variability are most troubling to reproduce by the reanalyses.

Observational CPT wavenumber-frequency spectra of power above background from GNSS-RO show well-defined spectral peaks near the MJO domain and the theoretical dispersion curves of Kelvin and equatorial Rossby waves in the symmetric spectrum, as well as mixed Rossby-gravity waves in the anti-symmetric part.

We show the importance of sampling reanalysis data at the observation locations only, as even at synoptic-scales and frequencies of around a week, this can influence spectral power. Reanalyses increasingly struggle at shorter and faster space-and-time-scales, more markedly in the anti-symmetric part of the spectrum.

How to cite: Pilch Kedzierski, R., Davis, S., Tegtmeier, S., Wargan, K., and Weissmann, M.: A framework to compare GNSS-RO and reanalysis equatorial wave spectra of Cold-point tropopause temperature, EGU General Assembly 2026, Vienna, Austria, 3–8 May 2026, EGU26-19363, https://doi.org/10.5194/egusphere-egu26-19363, 2026.

EGU26-20757 | ECS | Orals | AS1.31

The role of QBO in tropical high-cloud variability in CMIP6 models and observations 

Aleena M. Jaison, Paulo Ceppi, and Sarah Wilson Kemsley

The Quasi-Biennial Oscillation (QBO) is a dominant mode of stratospheric zonal wind variability. Observations indicate that the QBO influences tropical phenomena such as convection, precipitation, and the Madden–Julian Oscillation (MJO), yet climate models often fail to capture these relationships. This study examines the QBO’s impact on high clouds in CMIP6 historical simulations and MODIS observations, given that cloud feedback remains a major source of uncertainty in climate sensitivity estimates.

The QBO modulates dynamic and thermodynamic properties near the tropical tropopause layer, such as temperature, static stability, and vertical wind shear, all linked to cloud formation. Building on recent findings that highlight the major cloud-controlling factors (CCFs) for high clouds, we apply CCF analysis to assess QBO-driven changes in high-cloud amount and interpret these changes in terms of contributions from controlling factors.

Results confirm that the QBO westerly (QBOW) phase is associated with reduced tropical mean high-cloud cover, with strong zonal asymmetry in observations. CMIP6 models successfully capture the reduction in tropical high clouds associated with QBOW, but with a strong inter-model spread. Among the analysed CCFs, upper-tropospheric temperature and relative humidity contribute most to this reduction, followed by static stability. Inter-model differences primarily arise from uncertainty in the high-cloud sensitivity to upper troposphere temperature. The strong inter-model spread highlights that improved constraints on high‑cloud sensitivity to upper‑tropospheric thermodynamics could help enhance how models capture QBO‑related cloud responses.

How to cite: M. Jaison, A., Ceppi, P., and Wilson Kemsley, S.: The role of QBO in tropical high-cloud variability in CMIP6 models and observations, EGU General Assembly 2026, Vienna, Austria, 3–8 May 2026, EGU26-20757, https://doi.org/10.5194/egusphere-egu26-20757, 2026.

The stratospheric Quasi-Biennial Oscillation (QBO) is characterized by descending bands of wind and temperature anomalies in the tropical stratosphere with a mean period of 17 ∼28 months. Numerous studies have argued that the QBO has a significant impact on tropical tropospheric climate. However, the observational support for such an impact is complicated by the competing signatures of internal tropospheric climate phenomena. Here we apply an observationally-based, “physical-kernel” methodology that identifies the “direct” component of the tropospheric response that arises from the combination of 1) the influence of the QBO on upper tropospheric static stability and 2) the physical linkages between upper tropospheric static stability, vertical motion, and clouds. Consistent with previous analyses, the results suggest that the westerly phase of the QBO is linked to robust decreases in vertical motion and cloud fraction over the Indian/western tropical Pacific Oceans; in contrast to previous analyses, they indicate only weak direct linkages between the QBO and tropical climate elsewhere. It is argued that the methodology provides a refined estimate of how the QBO directly influences tropical climate variability, with implications for its impacts on the Madden-Julian Oscillation.

How to cite: Thompson, D. and Chen, Y.-J.: A novel methodology for probing the influence of the QBO on tropical tropospheric climate, EGU General Assembly 2026, Vienna, Austria, 3–8 May 2026, EGU26-21625, https://doi.org/10.5194/egusphere-egu26-21625, 2026.

EGU26-568 | ECS | PICO | AS1.32 | Highlight

Numerical modeling of infrasonic emissions from clear-air turbulence 

Christopher Drapeau, Afshin Shaygani, Mohammad Mohammadifar, Jean-Pierre Hickey, and Michael Waite

Turbulence is a significant contributor to weather-related aviation incidents, with profound economic and safety implications. Clear-air turbulence (CAT) refers to turbulence occurring in the atmosphere, typically near the tropopause, without the observable convective cloud features. CAT is particularly hazardous as it remains invisible to pilots and many onboard instruments. With its occurrence expected to increase due to anthropogenic climate change, improved CAT detection is essential.

This study examines the infrasonic signature of CAT as a means for remote detection. Turbulence is a well-established source of sound, and infrasound has proven effective in detecting a range of geophysical events as the long-wavelength acoustic information can travel long distances with minimal attenuation. Using the Weather Research and Forecasting (WRF) model and observed meteorological data, high-resolution simulations were performed to reproduce representative case studies of CAT, including a documented event over Trout Peak in Wyoming, USA. These simulations provide the inputs for the acoustic model, with the dominant acoustic sources arising from turbulence and vorticity.

Acoustic pressure was computed at various far-field observation locations for two subdomains, one containing the CAT region and another representing the background flow with only minor fluctuations, to isolate the acoustic contributions from CAT specifically. The acoustic propagation is assumed to occur in a static and homogeneous medium, neglecting the effects of refraction and convection. Results reveal a significant increase in acoustic power associated with the CAT, with distinct and directionally dependent spectral peaks. These findings support the feasibility of using infrasound as a tool for real-time remote CAT detection.

How to cite: Drapeau, C., Shaygani, A., Mohammadifar, M., Hickey, J.-P., and Waite, M.: Numerical modeling of infrasonic emissions from clear-air turbulence, EGU General Assembly 2026, Vienna, Austria, 3–8 May 2026, EGU26-568, https://doi.org/10.5194/egusphere-egu26-568, 2026.

EGU26-2721 | ECS | PICO | AS1.32

Variability of local gravity wave spectra 

Zuzana Procházková, Erfan Mahmoudi, Ray Chew, Stamen Dolaptchiev, Claudia Christine Stephan, Georg Sebastian Völker, and Ulrich Achatz

Gravity waves influence atmospheric dynamics through transport of momentum and energy, and their understanding is thus essential for improving their parametrisations in atmospheric models. In this work, we study gravity waves using data from a global ICON simulation with a horizontal resolution of approximately 2.5 km. The data are divided into triangular subdomains defined by a low-resolution ICON model grid, which has a horizontal resolution of about 160 km. We evaluate 3D spatiotemporal spectra within these subdomains and subsequently filter the spectra using linear gravity wave theory, yielding the global distribution of local gravity wave spectra. Analysis of the spectra reveals latitudinal dependence, with the zonal wind direction shaping the spectral form. Notably, spectra simplify dramatically using tens to hundreds of principal components, capturing variance efficiently. This approach enhances gravity wave parametrizations by providing low-dimensional spectral representations, enabling more accurate and computationally efficient global modeling.

How to cite: Procházková, Z., Mahmoudi, E., Chew, R., Dolaptchiev, S., Stephan, C. C., Völker, G. S., and Achatz, U.: Variability of local gravity wave spectra, EGU General Assembly 2026, Vienna, Austria, 3–8 May 2026, EGU26-2721, https://doi.org/10.5194/egusphere-egu26-2721, 2026.

Infrasound is a key component of the geophysical monitoring network that detects large-scale artificial and natural events such as nuclear tests, earthquakes, volcanic eruptions, and fireballs. In this context, full waveform propagation modeling at regional and local distances enables more sophisticated identification of source properties. However, infrasound propagation modeling often suffers from heavy computation due to the dense grid nodes to avoid the numerical dispersion. This study proposes a hybrid dispersion relation preserving (DRP) finite difference to efficiently implement modeling on staggered grid. DRP offers a trade-off between numerical dispersion and accuracy by optimizing finite difference coefficients through least squares fitting within a given wavenumber range. We modify the previous staggered grid DRP schemes to ensure that dispersion error is evenly distributed within the designated wavenumber domain. Then, this is applied to the collocated grid as well, so that advection terms in infrasound governing equations can be handled accordingly. We establish the relationship between the cutoff wavenumber in DRP and minimum points per wavelength (PPW) for modeling, so this relationship suggests minimum PPW required for each finite difference order. Numerical simulations demonstrate that the proposed hybrid DRP outperforms the traditional finite difference method of the same order, particularly in suppressing numerical dispersion. Our modeling is 2D modeling in Cartesian coordinates and is associated with a line source. Therefore, attenuation by geometrical spreading is smaller than that of point source observations. To address this, a line-source to point-source transformation filter is applied to compensate for the attenuation difference, allowing for a direct comparison with observed infrasound signals. The processed synthetic signal shows good agreement with acoustic explosion models, such as Kinney and Graham (1985) model. Lastly, 155 mm artillery acoustic signals are experimentally acquired at distances of 200 m, 1, 3, 5, 10 km, and the source time function was estimated from the recording at 200 m. The synthetic results show a good match with observations from 1 to 10 km, proving that proposed modeling is capable of identifying source properties.

How to cite: Won, M. and Che, I.-Y.: Hybrid dispersion relation preserving finite difference approach to infrasound propagation modeling on staggered grids , EGU General Assembly 2026, Vienna, Austria, 3–8 May 2026, EGU26-3246, https://doi.org/10.5194/egusphere-egu26-3246, 2026.

EGU26-4679 | PICO | AS1.32

Estimation of Dam Water Discharge Rate Using Observations of Low-Frequency Acoustic Waves 

Il-Young Che, Moosoo Won, Junghyun Park, Chris Hayward, Alexis Le Pichon, and Kwangsu Kim

Weak, sustained infrasound waves associated with natural and environmental sources (e.g., waterfalls, avalanches, dams, and debris flows) can be detected by remote infrasound arrays. Large-volume water flows at waterfalls and dams convert the mechanical energy of flowing water into various forms of energy, including acoustic energy in the infrasound range. Under certain circumstances, infrasound observations of sudden and otherwise unexpected large-scale water flow events can be used for early disaster warning, thereby contributing to disaster mitigation. Beyond early warning, this study investigates whether remote infrasound observations can be used to quantify the intensity of water release (discharge rates) at dams. To establish a relationship between infrasound energy and water discharge at a reference distance of 1 km, data were obtained from controlled water-release events at a dam in South Korea. Since water-release signals observed at regional distances are generally noise-like and exhibit low signal-to-noise ratios, two infrasound detection algorithms, based on the correlation (PMCC) and the maximum likelihood (MCML), were applied, and their detection results were compared to evaluate the performance of each method. Based on the detected infrasound signals at a distance of 15 km from the dam, discharge rates were estimated using the derived empirical relationship. The estimated discharge rates show promising agreement with the actual discharge rates, demonstrating the feasibility of this approach. Overall, our results indicate that infrasound monitoring has practical potential not only for early warning but also for quantifying hazardous water discharge, thereby enhancing disaster monitoring and response capabilities.

How to cite: Che, I.-Y., Won, M., Park, J., Hayward, C., Le Pichon, A., and Kim, K.: Estimation of Dam Water Discharge Rate Using Observations of Low-Frequency Acoustic Waves, EGU General Assembly 2026, Vienna, Austria, 3–8 May 2026, EGU26-4679, https://doi.org/10.5194/egusphere-egu26-4679, 2026.

This poster is devoted to analysis of polar vortex state in the stratosphere. We use the ERA-5 data of daily averages of zonal wind poleward of 60° N at the selected layers from 250 hPa up to 1 hPa in the winter period 1979/80 (October-March). We compute the latitudinal average of longitudinal averages U. Thus we obtain one value per day. It is a very important, because its negative value is one of signs of sudden stratospheric warmings. In each day we made a map of geographical distribution of geopotential height, geographical distribution of grids with easterly wind. For each grid point we compute the vertical difference of zonal wind between adjacent layers: lower layer –upper layer and we consider the following types of differences: Type 1: in both layers the west wind is present, but in the type +1 the west wind is stronger in the lower layer, so this grid increases U, type -1 has weaker wind in lower layer, so it decreases U. Type 2: in both layers the east wind is present, but in the type +2 the east  wind is weaker in the lower layer, so this grid increases U. Type -2 has stronger east  wind in lower layer, so it decreases U. Type 3 has opposite wind direction at adjacent layers in the case of +3 we observe east wind in upper layer and west wind in lower layers –increases U. The opposite is true for -3 type with decreases U. We divided the total difference in zonal wind between adjacent layers into 6 parts. In each part we compute the total sum. We also computed the number of grids in each part and we made a maps of geographical distribution of these points. We compare these sums and we found the largest one for each layer and day and we compare the results between days with positive and negative U


How to cite: Krizan, P.: Analysis of state of polar vortex in the stratosphere, EGU General Assembly 2026, Vienna, Austria, 3–8 May 2026, EGU26-4947, https://doi.org/10.5194/egusphere-egu26-4947, 2026.

EGU26-5411 | PICO | AS1.32

Effects of Non-Classical Gravity-Wave Dynamics on Middle-Atmosphere Circulation and Solar Tides 

Ulrich Achatz, Tridib Banerjee, Young-Ha Kim, Tobias Kühner, Gökce Tuba Masur, Zuzana Prochazkova, and Georg Sebastian Voelker

Mostly for reasons of efficiency, the standard approach to parameterizing gravity wave leaves out various effects. Among others, two of those are oblique wave propagation and horizontal flux convergences, summarized as 3D effects. Another aspect is deviations of wave-mean-flow interaction that arise if the mean flow is not balanced, so that pseudo-momentum (Eliassen-Palm) fluxes do not suffice for the quantification of the wave impact on the resolved flow (Wei et al 2019). The comparative importance of these effects for zonal-mean winds and temperatures, residual-mean transport, and solar tides has been investigated, using the Lagrangian gravity-wave parameterization MS-GWaM (Bölöni et al 2021, Kim et al 2021, 2024, Voelker et al 2024) in the global circulation model ICON. Comparisons between ensembles of boreal-winter simulations show that 3D dynamics leads to a statistically significant relative circulation that lowers and cools the summer mesopause but also cools/heats the summer/winter stratopause region and cools the mid-latitude winter stratosphere. Replacing pseudo-momentum forcing by a more general approach mainly affects in December the summer mesopause in manner opposite to 3D, and in February also reduces significantly the polar-night jet in the stratosphere. Gravity waves seem to be responsible for most of the differences, but modified Rossby-wave fluxes partly compensate for their effects, in a manner similar as observed by Cohen et al (2013). Solar tides show a related response, where non-balanced dynamics mostly affects the summer mesosphere / lower thermosphere, but 3D has significant effects on tides in both hemispheres and down into the stratosphere.

How to cite: Achatz, U., Banerjee, T., Kim, Y.-H., Kühner, T., Masur, G. T., Prochazkova, Z., and Voelker, G. S.: Effects of Non-Classical Gravity-Wave Dynamics on Middle-Atmosphere Circulation and Solar Tides, EGU General Assembly 2026, Vienna, Austria, 3–8 May 2026, EGU26-5411, https://doi.org/10.5194/egusphere-egu26-5411, 2026.

EGU26-5982 | PICO | AS1.32

Investigating vertical gravity wave spectra to calibrate a gravity wave perturbation model: comparison with ERA5 reanalysis products and application to infrasound propagation simulations 

Constantino Listowski, Manon Jaulgey, Fabrice Chane-Ming, Alain Hauchecorne, Pierre Sochala, Julien Vergoz, and Alexis Le Pichon

Infrasound technology is used to monitor the atmosphere and to verify compliance with the Comprehensive Nuclear Test-Ban-Treaty. Acoustic signals recorded by the International Monitoring System allow to characterize sources of interest.

Fine-scale atmospheric perturbations of the order of a few kilometers to a few hundred meters in vertical wavelength are necessary to explain the duration and amplitude of acoustic signals. Such internal gravity wave (GW) perturbations must be added to atmospheric specifications for propagation simulations. Indeed, operational meteorological products underestimate or miss that part of the GW spectrum. The GW universal spectrum approach provides a convenient framework to quickly derive vertical perturbation profiles of GW using inverse Fourier transform along the atmospheric column.

Using radiosonde and lidar measurements from the Observatoire De Haute-Provence in South of France (43° 55′ 51″ N, 5° 42′ 48″ E) and from La Réunion Island (21° 04′ 47″ S, 55° 22′ 59″ E) across many years, we characterize monthly GW vertical wavenumber spectra in different altitude layers. We fit those spectra using the modified Desaubies analytical model in order to retrieve relevant parameters (namely the maximum amplitude of the spectrum and the characteristic wavenumber m*). We also compare the observed spectra and their related parameters and quantities, notably kinetic and potential energies, to those derived from ERA5 products.

Using the calibrated parameters of the GW spectra, we derive the associated ensemble perturbation profiles in a stochastic approach using bootstrap techniques. The goal is to be representative of the observed vertical distribution of the spectra. The ensembles of perturbation profiles are then used as input to infrasound propagation simulations. We discuss how waveform simulations used in operational monitoring can benefit from these better-constrained atmospheric fine-scale uncertainties.

How to cite: Listowski, C., Jaulgey, M., Chane-Ming, F., Hauchecorne, A., Sochala, P., Vergoz, J., and Le Pichon, A.: Investigating vertical gravity wave spectra to calibrate a gravity wave perturbation model: comparison with ERA5 reanalysis products and application to infrasound propagation simulations, EGU General Assembly 2026, Vienna, Austria, 3–8 May 2026, EGU26-5982, https://doi.org/10.5194/egusphere-egu26-5982, 2026.

EGU26-6974 | ECS | PICO | AS1.32

Seismoacoustic analysis of a Falcon-9 rocket stage reentry on 19 February 2025 

Patrick Hupe, Christoph Pilger, Jelle Assink, Simon Schneider, Jon Grumer, Sven Peter Naesholm, and Gerd Baumgarten

Since more than sixty years, rockets have transported tens of thousands of satellites to space. More and more rocket stages and other space debris are returning to Earth, sometimes intentionally, sometimes unexpected.  Such descending objects move supersonically through the atmosphere, disintegrate, and can even explode. During these processes, they can produce shock and sound waves which can be monitored using pressure sensors at the Earth’s surface. The infrasound component of the International Monitoring System (IMS) for monitoring compliance with the Comprehensive Nuclear-Test-Ban Treaty (CTBT), as well as additional national infrasound arrays, are therefore well suited for detecting and characterizing such events. Additionally, the infrasound waves can couple to the subsurface as seismic waves.

On 19 February 2025, the upper stage of a SpaceX Falcon 9 rocket reentered Earth’s atmosphere approximately over Ireland and produced a bright fireball along its trajectory over the United Kingdom, the Netherlands, northern Germany and western Poland, where fragments of the rocket were eventually recovered. This highlight case of a reentry of space material was not only visually observed, but also recorded by various scientific instruments, including infrasound arrays in the Netherlands, Germany, Sweden and Norway and the dense seismic borehole network in the northern part of the Netherlands. This case study investigates the potential of infrasound to monitor space rockets during their reentry. We characterize the Falcon 9 reentry event and reconstruct its trajectory based on infrasound and seismoacoustic recordings.

How to cite: Hupe, P., Pilger, C., Assink, J., Schneider, S., Grumer, J., Naesholm, S. P., and Baumgarten, G.: Seismoacoustic analysis of a Falcon-9 rocket stage reentry on 19 February 2025, EGU General Assembly 2026, Vienna, Austria, 3–8 May 2026, EGU26-6974, https://doi.org/10.5194/egusphere-egu26-6974, 2026.

EGU26-8082 | ECS | PICO | AS1.32

The impact of gravity wave parameterizations on the upper atmosphere ICON model and infrasound propagation. 

Samuel Kristoffersen, Constantino Listowski, Ulrich Achatz, Georg-Sebastian Völker, Robin Wing, Sergey Khaykin, Gerd Baumgarten, Alain Hauchecorne, Alexis Le Pichon, and Julien Vergoz

Infrasound signals are generated by various anthropogenic and natural sources, and are one of the technologies used in monitoring compliance with the Comprehensive Nuclear-Test Ban Treaty (CTBT). It is, therefore, of interest to study and better understand the impacts of atmospheric parameters, notably gravity waves (GW), on infrasound propagation. Middle-atmosphere dynamics, up to the lower thermosphere, must be simulated to account for the different acoustic waveguides that allow the long-range propagation and infrasound detections by the CTBT’s International Monitoring System.


Since infrasound propagates up to the lower thermosphere, an upper atmospheric model like the upper-atmosphere extension of the ICON model (UA-ICON) is necessary to properly understand and predict infrasound propagation. Toward this goal, we will present studies of UA-ICON using two different GW parameterizations: the operational one also used for the operational ICON forecasts issued by DWD, and a 3D gravity wave parameterization scheme (MS-GWaM) that includes improved GW propagation. We also propose a method to derive stochastic predictions of realistic GW perturbation profiles using MS-GWaM. These results are compared to lidar observations, showing the importance of correctly tuned GW parameterizations on temperature profiles, from tropical to high latitudes. In addition, we will present case studies of infrasound propagation to highlight the importance of mesospheric wind and temperature, as well as GWs, on infrasound propagation and source localization. Notably, infrasound allows us to investigate equatorial latitudes where lidar measurements are missing.

How to cite: Kristoffersen, S., Listowski, C., Achatz, U., Völker, G.-S., Wing, R., Khaykin, S., Baumgarten, G., Hauchecorne, A., Le Pichon, A., and Vergoz, J.: The impact of gravity wave parameterizations on the upper atmosphere ICON model and infrasound propagation., EGU General Assembly 2026, Vienna, Austria, 3–8 May 2026, EGU26-8082, https://doi.org/10.5194/egusphere-egu26-8082, 2026.

EGU26-9638 | PICO | AS1.32

Acoustic emissions from an industrial facility recorded during the TRANSAT stratospheric balloon flight 

Sven Peter Näsholm, Daniel C. Bowman, Jonathan M. Lees, Jacob F. Anderson, Marouchka Froment, and Johan Kero

Human activity can create acoustic emissions capable of traveling many kilometers. Narrow band, “tonal” signatures are particularly distinct, as there are few processes in nature that produce them (e.g., volcanic tremor). Although stratospheric balloon flights over cities commonly record these signals, the plethora of emitters makes any single source difficult to distinguish. Acoustic sensors aboard the TRANSAT balloon flight from Sweden to Canada captured a multi-hour narrowband signal while crossing northern Norway. This distinct, isolated recording indicates a singular emitter capable of projecting sound nearly 40 km in the air and at least 100 km laterally. We describe the signal properties, calculate the detection range of the floating sensor, and constrain possible locations of the emission source. This is a first step towards the detection, characterization, and geolocation of narrowband acoustic signals from the stratosphere using a single free flying sensor. This has implications for characterizing anthropogenic activity on Earth as well as evaluating volcanic activity during proposed balloon missions to Venus.

How to cite: Näsholm, S. P., Bowman, D. C., Lees, J. M., Anderson, J. F., Froment, M., and Kero, J.: Acoustic emissions from an industrial facility recorded during the TRANSAT stratospheric balloon flight, EGU General Assembly 2026, Vienna, Austria, 3–8 May 2026, EGU26-9638, https://doi.org/10.5194/egusphere-egu26-9638, 2026.

EGU26-9780 | PICO | AS1.32

Seismo-acoustic observation of the Éowyn impactful storm at Romanian infrasound and seismic arrays 

Daniela Ghica, Dragos Ene, and Bogdan Antonescu

Strong storms in the North Atlantic are a significant natural source of low-frequency seismic and acoustic signals (microseisms and microbaroms), commonly detected by monitoring stations in Romania. Storm Éowyn was an intense extratropical cyclone that impacted Ireland and the United Kingdom on 24 January 2025, driven by an exceptionally strong jet stream. The storm produced maximum wind gusts of 183 km/h and sustained winds of 135 km/h in western Ireland, breaking national records dating back to 1945.

This study presents a joint seismo-acoustic analysis of Storm Éowyn as an intense source of oceanic ambient noise, using simultaneous seismic and infrasonic observations from the Romanian arrays BURAR, BURARI, and IPLOR. Infrasonic and seismic data were processed using the PMCC correlation-based method to characterize the temporal variability of microbarom and microseism signals between 21 and 27 January 2025. Seismo-acoustic detections in the 0.1–0.6 Hz frequency range were analyzed with DTK-PMCC and DTK-DIVA software packaged into CTBTO NDC-in-a-Box.

The storm trajectory was computed using CyTRACK, an open-source Python toolbox for cyclone detection and tracking. ERA5 hourly reanalysis data from the Copernicus Climate Data Store provided mean sea level pressure, 10-m wind speed, and relative vorticity fields. Seismo-acoustic detections were compared with ARROW products from IFREMER describing microseism and microbarom source models. To assess detection performance and backazimuth discrepancies, we calculated the effective sound speed ratio (Ceff) at 50 km altitude using temperature and wind profiles from ECMWF operational analyses obtained via CAMS.

During the storm's peak impact on 24 January, power spectral density analysis revealed microbarometric peaks at 0.23 Hz (BURARI) and 0.22 Hz (IPLOR), while the microseismic peak at BURAR reached 0.29 Hz. Results demonstrate good agreement between observed signals and modeled source locations.

This study confirms the capability of Romanian infrasound and seismic arrays to monitor microbaroms and microseisms generated by intense North Atlantic storms. These findings provide a foundation for investigating other seismo-acoustic low-frequency signals from North Atlantic cyclones, which dominate winter detections at Romanian stations.

How to cite: Ghica, D., Ene, D., and Antonescu, B.: Seismo-acoustic observation of the Éowyn impactful storm at Romanian infrasound and seismic arrays, EGU General Assembly 2026, Vienna, Austria, 3–8 May 2026, EGU26-9780, https://doi.org/10.5194/egusphere-egu26-9780, 2026.

EGU26-10899 | ECS | PICO | AS1.32

Cluster-based waveform surrogate model for three-dimensional propagation of the sonic boom : an application to Carancas 

Antoine Verdier, Olaf Gainville, Régis Marchiano, and Pierre Sochala

The amplitude of infrasonic arrivals at ground level depends on both atmospheric propagation conditions and the three-dimensional geometry of the source. Temperature and wind speed gradients, as well as the source's directivity, can create shadow zones where the geometric acoustic approximation incorrectly predicts no arrival. For instance, during the 2007 Carancas meteorite entry, the I08BO infrasound station was located at the boundary between the geometric arrival zone and the shadow zone. In such configuration, conventional ray-tracing models were unable to simulate the recorded signals while a full wave code, such as Flhoward3D, can simulate arrivals in both zones. However, a small variation in the trajectory azimuth or elevation, or in the sound speed profile, can sharply change the dynamics of the arrivals at the station. To invert the trajectory, we rely on a surrogate model capable of reproducing the discontinuities in the numerical signal predictions.

To address this challenge, our surrogate construction approach proceeds in three steps. First, the parametric domain is partitioned using clustering techniques applied to numerical signals. Each cluster is then associated with a physical behavior, such as a shadow or light zone. Second, a principal component analysis (PCA) is performed for each cluster. Third, the relationship between the PCA coordinates and the input parameters is approximated using least-squares regression.

We compare the method's performance to that of a global surrogate model. Next, the method is applied to invert the Carancas trajectory angles using only arrivals at a single infrasonic station. This work paves the way for inferring wind or gravity wave profiles when infrasound propagation is highly sensitive to small atmospheric variations.

How to cite: Verdier, A., Gainville, O., Marchiano, R., and Sochala, P.: Cluster-based waveform surrogate model for three-dimensional propagation of the sonic boom : an application to Carancas, EGU General Assembly 2026, Vienna, Austria, 3–8 May 2026, EGU26-10899, https://doi.org/10.5194/egusphere-egu26-10899, 2026.

EGU26-11372 | ECS | PICO | AS1.32

Three-dimensional reconstruction of gravity waves in the UMLT derived from dual OH airglow observations using a tomographic retrieval 

Rebecca Winkler-Zurlinden, Patrick Hannawald, Gunter Stober, Sabine Wüst, and Michael Bittner

Gravity waves transport momentum and energy vertically and horizontally and play a key role for the circulation in the upper mesosphere and lower thermosphere (UMLT). They can experience convective or dynamic instabilities or undergo nonlinear interactions with the background flow. The UMLT is of particular importance, as gravity waves frequently reach their breaking levels in this region, often referred to as the turbopause.

This altitude range is observed using two FAIM cameras measuring the OH-airglow emission centered at approximately 86 km altitude, with a full width at half maximum of about 7–8 km, from different locations. By applying a newly developed tomographic reconstruction technique to coordinated dual-camera OH-airglow observations of the same air volume, the three-dimensional structure of gravity waves in the UMLT can be recovered. The resulting volumetric data provide detailed information about horizontal and vertical gravity-wave features, representing a middle-atmosphere sounding technique complementary to established methods such as lidar or radar observations.
To characterize these waves, vertical wavelengths are extracted in a dedicated post-processing step by applying a two-dimensional FFT to selected altitude layers of the tomographically reconstructed volume. This approach provides access to vertical phase progression and vertical wavelength information that is fundamentally unattainable with a single OH airglow imager. By analyzing the phase differences of the wave signals in the FFT spectra between different altitude layers, the vertical propagation angle can be derived. In combination with the horizontal wavelength, this enables the determination of the vertical wavelength and thus a full three-dimensional gravity-wave characterization.
First results from this dual-FAIM tomographic approach are presented, demonstrating both the feasibility and the performance of the method. The analysis is based on coordinated OH-airglow observations from FAIM installations at Oberpfaffenhofen (lon = 11.28, lat = 48.09) and Otlica (lon = 13.91, lat = 45.94) over a one-year period. These data are used to assess retrieval quality, identify sensitivity limits for vertical wavelength derivations, and demonstrate the enhanced scientific value of three-dimensional gravity-wave characterization for multi-instrument analyses of middle-atmosphere dynamics.

Within the project GIGAWATT, a collaboration of the German Aerospace Center, the University of Augsburg and the University of Bern, we are currently advancing this work by incorporating new measurements and combining complementary observational techniques, including radiometric temperature and wind observations in the stratosphere and lower mesosphere and multi-static OH airglow tomography, to establish a high-resolution gravity-wave observatory for the Alpine region. This work is funded by the Deutsche Forschungsgemeinschaft (DFG, German Research Foundation) under the project number 540878795.

How to cite: Winkler-Zurlinden, R., Hannawald, P., Stober, G., Wüst, S., and Bittner, M.: Three-dimensional reconstruction of gravity waves in the UMLT derived from dual OH airglow observations using a tomographic retrieval, EGU General Assembly 2026, Vienna, Austria, 3–8 May 2026, EGU26-11372, https://doi.org/10.5194/egusphere-egu26-11372, 2026.

EGU26-11429 | ECS | PICO | AS1.32

Revisiting the Hungarian Seismoacoustic Bulletins 

Kamilla Cziráki and Marcell Pásztor

Hungary's first and only infrasound station has been operating in Piszkéstető since 2017. During its eight years of operation, it has recorded numerous events, including quarry blasts, which are published annually in the Hungarian Seismoacoustic Bulletin (HSAB).

Our research aims to model the effect of azimuth deviation due to cross-winds and to investigate its impact on the location of mine explosions in Hungary and neighbouring countries, using data from the Piszkéstető infrasound station (PSZI). 

Using seismic data to determine the dates and locations of the mine explosions, we modeled the resulting infrasound waves using ray tracing. The resulting ground intercepts were used to determine the azimuths of the rays closest to PSZI. With the modeled azimuths of these events, we re-determined their locations using the iLoc single-event location algorithm, which were then compared with the detected azimuths and locations determined without an infrasound phase.

The difference between the detected and modeled azimuth values is less than 5º in most cases, but there were also larger values of around 10º. The differences between locations with and without an infrasound phase were the largest in these cases, and in many instances, the calculation using modeled azimuths was more accurate than the detected ones.

Overall, our research provides a basis for incorporating ray tracing into seismo-acoustic positioning to improve the accuracy of HSAB’s event locations. The method still has some shortcomings, especially when the proximity of the mines to PSZI means no suitable ground intersection point is calculated.

How to cite: Cziráki, K. and Pásztor, M.: Revisiting the Hungarian Seismoacoustic Bulletins, EGU General Assembly 2026, Vienna, Austria, 3–8 May 2026, EGU26-11429, https://doi.org/10.5194/egusphere-egu26-11429, 2026.

EGU26-11703 | ECS | PICO | AS1.32

Investigation of the short- and medium-term variability of OH airglow at Cerro Paranal, Chile within the project AirMon-VLT, using statistical and artificial intelligence methods 

Patrick Hannawald, Rainer Lienhart, Alain Smette, Jay Stephan, Lara Olbing, Carsten Schmidt, Sabine Wüst, and Michael Bittner

Gravity waves are a significant driver of middle atmosphere dynamics with various excitation sources, e.g. the jet stream, convection zones, flow over orography and natural hazards such as tsunamis. OH-airglow measurements allow continuous night-time observations of gravity waves and various other wave types including singular events like bores and wall events at an altitude of about 86 km.

Their respective signals are subject to the measurement system “Observations of Airglow with Spectrometer and Imager Systems” (OASIS). Imager systems allow the derivation of wave parameters such as the horizontal wavelength and the propagation direction. Data from spectrometers complement this information with wave amplitudes derived in temperature and absolute OH radiance.

Since November 2022, the measurement system OASIS started routine observations at the Very Large Telescope (VLT) in the Atacama Desert at Cerro Paranal, Chile (24.6°S, 70.4°W) in cooperation with the European Southern Observatory (ESO). It is composed of two Fast Airglow Imagers (FAIM) and one Ground-based infrared P-branch Spectrometer (GRIPS) with high temporal resolution (1 image every 1/2 seconds, 1 spectrum every 15 seconds). Currently, over three years of data with nearly 100% night-time data coverage have been acquired. One of the goals of the observation site beside the general investigation of atmospheric dynamics is the investigation of tsunami-induced signals in OH airglow.

Monitoring the OH airglow provides a unique opportunity to make continuous night-time observations of the middle atmosphere with high temporal and spatial resolution.  However, the OH airglow causes noise in ground-based astronomical observations in the short-wave infrared like performed with the VLT due to its emissions in this spectral range. The project AirMon-VLT (“Airglow Monitor at the VLT”) brings together the interests of atmospheric scientists to understand middle atmosphere dynamics even better and astronomers who want to precisely know about the OH airglow variability and radiance. With this detailed knowledge an improved scheduling of deep sky observations for example at times with low OH airglow variability and radiance could be achieved. Also, precise and highly temporally resolved information about the change of OH airglow radiance can help to improve the correction of astronomical spectra.

Within AirMon-VLT, the short and medium-term variability of OH airglow is investigated with statistical methods answering questions like which changes in airglow radiance could typically be expected within minutes/hours/days/etc., e.g. due to infrasound, gravity waves, tides, planetary waves, and by singular events like bore or wall events. With methods from the field of artificial intelligence predictions of the airglow variability will be made into the near and medium future (nowcasting and forecasting) to allow for a better scheduling of the astronomical targets. Also, additional data like ERA5 reanalysis data will be investigated for a more comprehensive understanding of causes of the variability from lower atmospheric layers.

We present the project AirMon-VLT and the measurement system OASIS. We show first results of statistical evaluations about typical changes of airglow radiances related to various wave phenomena, including singular events like a potential wall event with an exceptional high radiance change of 60% within only one hour.

How to cite: Hannawald, P., Lienhart, R., Smette, A., Stephan, J., Olbing, L., Schmidt, C., Wüst, S., and Bittner, M.: Investigation of the short- and medium-term variability of OH airglow at Cerro Paranal, Chile within the project AirMon-VLT, using statistical and artificial intelligence methods, EGU General Assembly 2026, Vienna, Austria, 3–8 May 2026, EGU26-11703, https://doi.org/10.5194/egusphere-egu26-11703, 2026.

Since the deployment of the Hungarian infrasound array (PSZI) in May 2017, a large number of PMCC (Progressive Multichannel Correlation) detections have been collected and manually categorized using ground-truth information from independent sources. This dataset enabled the training and evaluation of machine learning (ML) models for infrasound signal classification.

The final ensemble model consists of a Random Forest model trained on PMCC-related features and a Convolutional Neural Network trained on spectrograms.  To automate infrasound signal processing, these were trained to distinguish detections originating from known sources from those of unknown origin.

 Based on the ensemble ML model, we designed a monitoring system to help with daily routine processing. We aimed to remove noise, such as detections associated with industrial activity from the daily list of detections and highlight those that are from signals of interest, for instance quarry blasts, thunderstorms and activity of the Etna. During the one-year-long test phase, the system achieved high accuracy in classifying quarry blast signals and successfully identified multiple eruptions of Mount Etna, highlighting its capability for automated infrasound signal source classification.

How to cite: Pásztor, M. and Bondár, I.: Lessons learned from a one-year-long deployment of a machine learning-based infrasound monitoring system, EGU General Assembly 2026, Vienna, Austria, 3–8 May 2026, EGU26-11707, https://doi.org/10.5194/egusphere-egu26-11707, 2026.

EGU26-12366 | PICO | AS1.32

A Bayesian framework for explosive yield estimation using statistical signal characterization and attenuation modeling 

Alexis Le Pichon, Samuel Kristoffersen, Julien Vergoz, and Sven Peter Näsholm

We investigate explosive yield estimation from infrasound signals generated by controlled ground explosions at the Hukkakero ammunition disposal site in northern Finland. Since 1988, highly repeatable blasts with yields of approximately 20 tons TNT equivalent have been conducted annually, providing a valuable reference dataset.

Explosive yield is estimated using a Bayesian framework that explicitly accounts for uncertainties in source characteristics and transmission loss statistics. Spectral characteristics of the signals are extracted using the multichannel maximum-likelihood (MCML) method, providing robust inputs for yield estimation. Propagation effects are represented through an updated statistical transmission loss law derived from extensive full-wave simulations under realistic atmospheric conditions. Rather than relying on deterministic scaling relations, transmission loss is incorporated as a probability distribution within the Bayesian formulation as a function of frequency and effective sound speed ratio.

Applying this approach to historical infrasound observations from the IMS array IS37 (northern Norway, ~320 km from Hukkakero) yields probabilistic explosive energy estimates with physically meaningful uncertainty bounds. The results demonstrate improved robustness and reduced bias compared with traditional methods, particularly for regional-distance observations where atmospheric effects strongly influence signal amplitudes.

How to cite: Le Pichon, A., Kristoffersen, S., Vergoz, J., and Näsholm, S. P.: A Bayesian framework for explosive yield estimation using statistical signal characterization and attenuation modeling, EGU General Assembly 2026, Vienna, Austria, 3–8 May 2026, EGU26-12366, https://doi.org/10.5194/egusphere-egu26-12366, 2026.

EGU26-13511 | ECS | PICO | AS1.32

The Impact of Non-Orographic Gravity Waves on Transport and Mixing: Effects of Oblique Propagation and Coupling to Turbulence 

Tridib Banerjee, Young-Ha Kim, Georg Sebastian Voelker, Sebastian Borchert, Alena Kosareva, Daniel Kunkel, Gökce-Tuba Masur, Zuzana Procházková, Juerg Schmidli, and Ulrich Achatz

Gravity waves (GWs) are a fundamental driver of circulation, tracer transport, and mixing in the middle and upper atmosphere, but their treatment in global circulation models remains incomplete. In particular, standard parameterizations typically restrict propagation to the vertical and treat GW–turbulence interactions in only a rudimentary manner, potentially leading to systematic biases in simulated dynamics and transport. This manuscript uses the Multi-Scale Gravity-Wave Model (MS-GWaM) implemented in Community Climate Icosahedral Nonhydrostatic Model UA-ICON, together with a novel theoretical framework to quantify the impact of (i) oblique GW propagation and (ii) explicit bidirectional coupling between GWs and turbulence. The Ensemble simulations for non-orographic GWs reveal that allowing for oblique propagation lowers and cools the summer mesopause by shifting the deposition of momentum and heat to lower altitudes, reduces GW-induced vertical shear in the middle and lower atmosphere, and enhances turbulent kinetic energy (TKE) in the upper mesosphere and lower thermosphere. In contrast, coupling GWs to turbulence produces a nearly opposite mesopause response, lifting and warming the mesopause, while maintaining a reduction in wave-induced shear and further enhancing turbulence. Tracer experiments additionally show that turbulent coupling significantly increases mixing in regions of enhanced TKE with implications for chemical redistribution. These results demonstrate that both oblique GW propagation and GW–turbulence interactions exert leading-order controls on mesosphere–lower thermosphere circulation, temperature structure, and tracer transport. Neglecting these processes in global models likely contributes to biases in the Brewer–Dobson circulation, energy balance, and constituent distributions, underscoring the need for next-generation GW parameterizations that capture these effects.

How to cite: Banerjee, T., Kim, Y.-H., Voelker, G. S., Borchert, S., Kosareva, A., Kunkel, D., Masur, G.-T., Procházková, Z., Schmidli, J., and Achatz, U.: The Impact of Non-Orographic Gravity Waves on Transport and Mixing: Effects of Oblique Propagation and Coupling to Turbulence, EGU General Assembly 2026, Vienna, Austria, 3–8 May 2026, EGU26-13511, https://doi.org/10.5194/egusphere-egu26-13511, 2026.

EGU26-16888 | PICO | AS1.32

Coincident measurements of ground-based lidar and the AWE OH imager onboard the ISS above the Southern Andes 

Natalie Kaifler, Bernd Kaifler, Robert Reichert, Dominique Pautet, David C. Fritts, and Robert Stockwell

Ground-based lidar measurements with the CORAL instrument at the southern tip of South America (53.8S, 67.8E) provide vertical temperature measurements and gravity wave characteristics at a resolution of 15 min throughout the middle atmosphere, up to the OH emission layer. Of this layer, the AWE instruments onboard the International Space Station provides global imaging of OH brightness and temperature at 2 km x 2 km resolution. We identified coincident and common-volume observations during winter 2024 and analyze these for gravity wave and instability dynamics. The geographic region is known for strong orographic wave forcing and deep propagation of gravity waves into the middle atmosphere during winter, including mountain wave breaking, secondary wave generation, and the generation of vortex rings and Kelvin-Helmholtz instabilities in the upper mesosphere. Gravity waves identified by lidar are typically 2-3 hours in period and 10-15 km in vertical wavelength in the upper stratosphere, lower mesosphere. In the upper mesosphere, smaller scales prevail. By wavelet analysis, we find that periods down to 40 min sporadically occur in thin, confined altitude layers. These observations are combined with AWE measurements showing varied local responses including mesospheric bores, small-scale mountain waves and large- and small-scale vortex rings and ring clusters related to the breaking of the gravity waves propagating from below.

How to cite: Kaifler, N., Kaifler, B., Reichert, R., Pautet, D., Fritts, D. C., and Stockwell, R.: Coincident measurements of ground-based lidar and the AWE OH imager onboard the ISS above the Southern Andes, EGU General Assembly 2026, Vienna, Austria, 3–8 May 2026, EGU26-16888, https://doi.org/10.5194/egusphere-egu26-16888, 2026.

EGU26-18017 | PICO | AS1.32

Ground-based observations of periodic temperaturefluctuations in the mesopause region with periods larger than 2 days 

Christoph Kalicinsky, Robert Reisch, and Peter Knieling

We analysed more than 30 years of OH*(3,1) rotational temperatures that have been observed
from Wuppertal, Germany, since 1988 with respect to periodic fluctuations (2 to 60 d) using the
Lomb-Scargle periodogram. The main type of fluctuation observed in the last decades shows
a period of about 28 d. Other periods which are frequently detected in the observations lie in
the period ranges around 2 d, from 5 to 6 d, from 8 to 12 d, and around 15 d and can likely
be assigned to the quasi-2-day, the quasi-5-day, the quasi-10-day , and the quasi-16-day wave,
respectively.
The wave activity is typically larger in winter time than in summer time because of the different
wave filtering in summer and winter. This winter to summer difference holds for waves with
longer periods, but it breaks off in the case of shorter periods below about 20 d. The occurrence
frequency of these waves (< 20 d) exhibit two smaller maxima around the equinoxes. Thereby
the waves with periods below 10 d account for the majority of observations in the months from
April to September, whereby the waves with periods between 10 d and 20 d were more equally
observed in the whole year except for the late spring and summer, where almost no events were
observed.
The long-term behaviour of the wave activity indicates a quasi-bidecadal oscillation, which is
seen in different proxies for the wave activity. A further comparison of these proxies indicates
that this long-term oscillation is likely driven by the amplitude of the waves, i.e. the strength
of the events and not the duration of the events.

How to cite: Kalicinsky, C., Reisch, R., and Knieling, P.: Ground-based observations of periodic temperaturefluctuations in the mesopause region with periods larger than 2 days, EGU General Assembly 2026, Vienna, Austria, 3–8 May 2026, EGU26-18017, https://doi.org/10.5194/egusphere-egu26-18017, 2026.

Infrasound, and more generally acoustic waves, are omnipresent in the atmosphere due to their intrinsic characteristics and a wide variety of sources. The propagation of these waves is strongly influenced by the properties of the propagation environment, such as the speed of sound and wind. Therefore, observing and studying these waves can reveal important details about the state of the atmosphere.

The concept of using infrasound to improve atmospheric modeling by exploiting the sensitivity of waveforms is illustrated in a preliminary investigation (Gerier et al., 2025). From a data assimilation technique perspective, our goal here is to investigate and extend further their work by adapting the sensitivity kernel of infrasound full waveform to the sensitivity kernel of infrasound arrival times.

Sensitivity of arrival times to a specific model corresponds to the Fréchet derivative of the difference between the arrival time of the observation and that of the synthetic infrasound. First, the synthetic infrasound is computed by solving the linearized Euler equation using finite differences discretization. Then, the Fréchet derivative is obtained by using the adjoint method, which requires solving an adjoint wavefield problem and cross-correlating the adjoint wavefield with the synthetic direct wavefield.

The validation of the arrival time sensitivity kernels is discussed, along with the effects and implication of source frequency. The explosion at the Hukkakero site in Finland is chosen as a case study. A comparison between the sensitivity of waveforms and travel times is also performed.

How to cite: Gerier, S., Martin, R., and Garcia, R. F.: Sensitivity kernels of infrasound travel times to atmospheric parameters: numerical developments, validation and tests cases, EGU General Assembly 2026, Vienna, Austria, 3–8 May 2026, EGU26-18408, https://doi.org/10.5194/egusphere-egu26-18408, 2026.

EGU26-19244 | ECS | PICO | AS1.32

Interpretable Neural Networks to Estimate Momentum Fluxes of Orographic Gravity Waves 

Elias Haslauer, Mierk Schwabe, Andreas Dörnbrack, Edwin P. Gerber, Markus Rapp, Nedjeljka Žagar, and Veronika Eyring

State-of-the-art Earth system models (ESMs) cannot explicitly resolve many small-scale atmospheric processes such as atmospheric gravity waves, and thus must represent, or parameterize, them based on the resolved state. Machine learning (ML) has the potential to address this. In our study, we train neural networks on ERA5 reanalysis data to predict momentum fluxes of orographic gravity waves as function of the lower resolution state variables as would be represented by a coarse ESM. Employing a full year of ERA5 data, we filter inertia-gravity waves by normal-mode function decomposition using the software MODES, and train ML models, more precisely: U-Nets, on data coarse-grained to the ESM's target resolution. We consider four different cases: the full spectrum of resolved inertia-gravity waves or just its subgrid-scale part, both over all land or just over mountainous terrain. Our neural networks successfully predict momentum fluxes, with a global coefficient of determination (R2) ranging from 0.72 to 0.56, depending on the case, when evaluated offline with unseen data. An analysis of our models using SHAP values, an explainable AI technique, shows that the networks are learning physically meaningful relationships. In addition, we give a comparison with the physics-based parameterization scheme by Lott and Miller. These results offer the opportunity for the development of operational ML-based parameterizations to improve the representation of gravity waves and their effects in climate models.

How to cite: Haslauer, E., Schwabe, M., Dörnbrack, A., Gerber, E. P., Rapp, M., Žagar, N., and Eyring, V.: Interpretable Neural Networks to Estimate Momentum Fluxes of Orographic Gravity Waves, EGU General Assembly 2026, Vienna, Austria, 3–8 May 2026, EGU26-19244, https://doi.org/10.5194/egusphere-egu26-19244, 2026.

EGU26-20004 | ECS | PICO | AS1.32

Investigating equatorial waves with high-density ROMEX GNSS-RO observations 

Lina Lucas, Neil Hindley, Corwin Wright, Phoebe Noble, and William Randel

Remote sensing from satellites provides a powerful means of observing the Earth’s atmosphere with global coverage and high vertical resolution. Among these techniques, Global Navigation Satellite System radio occultation (GNSS-RO) offers a low-cost approach that delivers large volumes of high-quality atmospheric temperature profiles. While several tens of thousands of GNSS-RO observations are assimilated daily into numerical weather prediction systems from multiple satellite missions, only a subset of these are made available for community research. Here we explore the Radio Occultation Meteorology and Climate Experiment (ROMEX) dataset: a unique, community-available collection of high-density GNSS-RO observations, combining measurements from multiple satellite missions to provide approximately 30,000-40,000 profiles per day during September-November 2022, resulting in an unprecedented sampling density for scientific applications.

In this study, we investigate the ROMEX dataset to assess the additional insight enabled by such exceptionally dense spatial and temporal sampling, with a focus on fast-moving equatorial waves in the tropical atmosphere. The high sampling density of ROMEX is particularly suited to resolving planetary-scale equatorial wave modes with short periods, which are difficult to capture using conventional measurements such as those by radiosondes or sun-synchronous satellites. ROMEX’s strongest performance in the upper troposphere and lower stratosphere further provides access to a key region of equatorial wave activity. Using temperature perturbations derived from the GNSS-RO profiles, we separate symmetric and antisymmetric wave components and examine their distribution in frequency-wavenumber space to identify distinct equatorial wave modes and recover their characteristic horizontal structures. We show that multiple equatorial wave modes, including Kelvin waves, mixed Rossby-gravity waves, equatorial Rossby waves, and both eastward and westward inertia-gravity waves, can be exceptionally clearly identified and studied using ROMEX observations. Among these, Kelvin waves with periods of approximately 10-13 days are observed, with maximum amplitudes near 18 km. In addition to the large-scale planetary waves themselves, we also investigate their modulation of the small-scale gravity wave flux in the tropics, and vice versa, revealing new insights into wave-wave interaction and momentum driving reaching the mid stratosphere.

Our results demonstrate that dense GNSS-RO datasets such as ROMEX offer substantial potential for atmospheric science beyond their established role in numerical weather prediction. In particular, the unique coverage and vertical resolution of ROMEX open new opportunities to study tropical wave dynamics and their impact on the structure of the tropical and extratropical atmosphere.

How to cite: Lucas, L., Hindley, N., Wright, C., Noble, P., and Randel, W.: Investigating equatorial waves with high-density ROMEX GNSS-RO observations, EGU General Assembly 2026, Vienna, Austria, 3–8 May 2026, EGU26-20004, https://doi.org/10.5194/egusphere-egu26-20004, 2026.

EGU26-22136 | ECS | PICO | AS1.32

Multi-instrument Characterization of Convectively Generated Gravity Waves Over Europe Using AWE, AIRS, and GNSS Observations 

Jaime Aguilar Guerrero, Björn Bergsson, Jonathan Snively, Ludger Scherliess, Yucheng Zhao, and Pierre-Dominique Pautet

NASAs Atmospheric Waves Experiment (AWE), installed on the International Space Station in November 2023, provides high-resolution nighttime imaging of mesospheric hydroxyl (OH) airglow emissions near 87 km altitude, enabling detailed observation of atmospheric gravity waves (AGWs) on regional to global scales. With ~2 km horizontal resolution, ~1.1s cadence, and repeated mid-latitude coverage from the ISS orbit, AWE offers new opportunities to investigate the generation and vertical propagation of gravity waves associated with tropospheric weather systems. This study examines European cases of deep convection observed during the current AWE mission lifetime (2023–present), focusing on the identification and characterization of convectively generated AGWs and their vertical coupling through the stratosphere, mesosphere, and ionosphere. Convective activity is identified using publicly available European precipitation radar products, while stratospheric temperature perturbations are analyzed using observations from the Atmospheric Infrared Sounder (AIRS). Mesospheric wave signatures are characterized using AWE airglow imagery, and ionospheric responses are examined using GNSS-derived total electron content (TEC) data from European ground-based GNSS networks. A unified analysis framework incorporating keogram construction and Fourier- and wavelet-based spectral methods is applied to quantify horizontal wavelengths, phase speeds, and propagation characteristics of observed wave fields across atmospheric layers. Similar studies in the CONUS region have indicated coherent AGW signatures spanning multiple altitudes, with mesospheric horizontal wavelengths on the order of tens of kilometers and higher-altitude ionospheric disturbances consistent with medium-scale traveling ionospheric disturbances. The coordinated use of satellite- and ground-based observations is intended to improve identification of gravity wave sources, constrain vertical coupling processes, and assess their role in middle-atmosphere dynamics over Europe. These results highlight the capability of coordinated, multi-instrument observations to resolve gravity wave generation and propagation in the middle atmosphere. The study contributes to improved understanding of middle-atmosphere dynamics, vertical coupling processes, and their implications for atmospheric predictability and modeling.

How to cite: Aguilar Guerrero, J., Bergsson, B., Snively, J., Scherliess, L., Zhao, Y., and Pautet, P.-D.: Multi-instrument Characterization of Convectively Generated Gravity Waves Over Europe Using AWE, AIRS, and GNSS Observations, EGU General Assembly 2026, Vienna, Austria, 3–8 May 2026, EGU26-22136, https://doi.org/10.5194/egusphere-egu26-22136, 2026.

EGU26-260 | ECS | Orals | AS1.34

Using Backwards Trajectories to Estimate Atmospheric Rivers’ Contributions to Colorado’s Wettest Days 

Deanna Nash, Jon Rutz, Jason Cordeira, Zhenhai Zhang, F. Martin Ralph, Kris Sanders, and Erin Walter

Heavy precipitation in Colorado (CO) is key to water resources, and the presence or absence of a few strong storms can make or break the yearly snowpack that delivers water to four major river basins. However, predicting precipitation in CO is challenging because it has high spatial and temporal variability. Atmospheric rivers (ARs) are one type of storm that results in a large fraction of extreme precipitation in the western U.S. and lends itself to improved forecasts over the region. Extensive knowledge of AR frequency, intensity, impacts, and key meteorological processes has been developed for U.S. West Coast landfalling ARs; however, relatively limited research has examined AR characteristics further inland, particularly for Colorado (CO), where high and complex topography, as well as the distance from the coast, complicate attempts to track ARs, AR-derived moisture, and AR-related impacts. Previous research efforts attributing precipitation to ARs based on their spatial footprint have yielded less than 30% of cool-season precipitation in CO as related to ARs. However, a large volume of anecdotal evidence suggests that ARs play a larger role in CO precipitation. To quantify this, we used trajectory-based methods to quantify the contribution of landfalling ARs to top-decile precipitation in subbasins throughout CO. Moisture sourced from landfalling ARs penetrates inland along relatively low-elevation corridors through the Interior West, and exhibits substantial geographic and interannual variability. Using the backward trajectory approach, we found that landfalling ARs contribute 21–78% of western CO’s top-decile cool season precipitation. Most of the AR-related precipitation across western CO during the cool-season is sourced from landfalling ARs near Southern California, the Baja Peninsula, and the Pacific Northwest. These results indicate a larger role for ARs in CO weather and hydroclimate than previous research suggests and highlight the importance of AR representation in forecast models to improve predictability of precipitation in CO. 

How to cite: Nash, D., Rutz, J., Cordeira, J., Zhang, Z., Ralph, F. M., Sanders, K., and Walter, E.: Using Backwards Trajectories to Estimate Atmospheric Rivers’ Contributions to Colorado’s Wettest Days, EGU General Assembly 2026, Vienna, Austria, 3–8 May 2026, EGU26-260, https://doi.org/10.5194/egusphere-egu26-260, 2026.

EGU26-1034 | ECS | Posters on site | AS1.34

Structural Characteristics of Moisture Transport Systems over the Indian Subcontinent during the Summer Monsoon 

Deepak Pandidurai and Ankit Agarwal

Extreme precipitation and flooding during the monsoon season in India are closely linked to anomalies in atmospheric moisture transport. Two of the primary mechanisms that govern moisture flux into the Indian region are Monsoon Low-Level Jets (LLJ) and Atmospheric Rivers (ARs), the latter of which are under-recognized over the tropics, especially in the monsoon dominated regions. The low level jets are characterized by nocturnal intensification and boundary-layer thermal forcing and ARs are synoptic scale, transient corridors of intense horizontal water vapor transport. While these two phenomena have been extensively characterized individually, their degree of structural correspondence, coexistence, and synergistic impact on monsoon rainfall and extremes over India remains poorly quantified. This study presents a comparative structural analysis of LLJ and ARs that landfall over the Indian subcontinent during the Indian summer monsoon season (June to September). We apply standard detection methodologies on the horizontal winds and Integrated Water Vapor Transport (IVT) fields, derived from high resolution reanalysis data for AR and LLJ detection. We then stratify events into combinations of LLJ and AR occurrences, and construct composites to characterize the horizontal structural properties and vertical structures quantitatively. The results reveal quantitative distinctions in the wind and moisture characteristics associated with the LLJs and ARs that traverse. This study addresses a critical gap in distinguishing the ARs from the large-scale monsoon moisture transported by LLJs, by quantifying the structural distinctness between these transport mechanisms. Providing process level insights on these mechanisms may have implications in improving their representation in weather and climate models and potential predictability.

Keywords: Atmospheric Rivers, Low Level Jets, Indian Summer Monsoon, Monsoon Moisture Transport

How to cite: Pandidurai, D. and Agarwal, A.: Structural Characteristics of Moisture Transport Systems over the Indian Subcontinent during the Summer Monsoon, EGU General Assembly 2026, Vienna, Austria, 3–8 May 2026, EGU26-1034, https://doi.org/10.5194/egusphere-egu26-1034, 2026.

EGU26-2671 | Orals | AS1.34

Hysteresis of global atmospheric rivers to carbon dioxide removal 

Seok-Woo Son, Seohyun Chung, Chanil Park, Yeeun Kwon, Andrew Winters, and Wenhao Dong

Atmospheric rivers (ARs) are key agents regulating global hydroclimate and extreme precipitation. Climate models project the increase and intensification of ARs in a warming climate, but their responses to CO2 mitigation remain unclear. Based on large-ensemble climate model experiments in which CO2 concentrations are systematically increased and then decreased to the present-day levels, we show that AR frequency and intensity do not fully return to their present-day states when CO2 concentrations are reduced. Instead ARs are projected to become more frequent and intense after CO2 removal, particularly along the western coasts of North America, Europe and South America, in East Asia, and along the Antarctic coast, leading to increased extreme precipitation in the midlatitudes and potential threat to Antarctic ice shelf stability. These hysteretic responses of ARs are attributed to both thermodynamic and dynamic changes that manifest differently by region but are closely related to the delayed recovery of the Atlantic meridional overturning circulation and the Southern Ocean temperature.

How to cite: Son, S.-W., Chung, S., Park, C., Kwon, Y., Winters, A., and Dong, W.: Hysteresis of global atmospheric rivers to carbon dioxide removal, EGU General Assembly 2026, Vienna, Austria, 3–8 May 2026, EGU26-2671, https://doi.org/10.5194/egusphere-egu26-2671, 2026.

EGU26-3564 | ECS | Posters on site | AS1.34

Global Atmospheric River Historical Data Record: Combining AR Detection and Intensity Categorization  

Emily Slinskey, Jonathan Rutz, Bin Guan, and F. Martin Ralph

The U.S. National Centers for Environmental Information (NCEI) is sponsoring the development of a reanalysis-based global atmospheric river (AR) historical data record (HDR) to serve as a valuable resource for the scientific, operations-based, and decision-making communities. The AR HDR uses a novel combination of two techniques: (1) the AR scale, which broadly characterizes AR strength from 1-5 based on the peak integrated water vapor transport (IVT) and duration of AR conditions (i.e., IVT ≥ 250 kg m-1 s-1) at a given location, and (2) the tARget AR detection algorithm–a tool that uses climatological, geometric, and directional thresholds to identify ARs. Since the AR scale has no geometric criteria (and thus identifies/ranks non-AR events such as tropical cyclones, cutoff lows, and monsoons) and tARget does not provide characterization of AR strength, these two methods complement each other: tARget differentiates between ARs and other storm types, while the AR scale provides rankings. The resulting AR database is used to examine select global cases, interannual variability, long-term climatologies of global AR characteristics categorized by rank, and reanalysis-based precipitation. The results demonstrate the combined capability of tARget to identify ARs and the AR scale to subsequently characterize their intensity, such that AR-related impacts globally can be better understood. The AR HDR will be hosted by NCEI. Future work includes implementation of the HDR method in forecasts, comparison to observed hydrometeorological datasets where available such as precipitation, streamflow, and drought, and an examination of AR scale modifications in polar and mountainous regions.

How to cite: Slinskey, E., Rutz, J., Guan, B., and Ralph, F. M.: Global Atmospheric River Historical Data Record: Combining AR Detection and Intensity Categorization , EGU General Assembly 2026, Vienna, Austria, 3–8 May 2026, EGU26-3564, https://doi.org/10.5194/egusphere-egu26-3564, 2026.

EGU26-3710 | ECS | Posters on site | AS1.34

Atmospheric Rivers as Drivers of Precipitation Variability and Flood Extremes  

Sucheta Pradhan, Conrad Wasko, and Murray Peel

Atmospheric rivers (ARs) are narrow corridors of concentrated moisture that play a key role in global precipitation and extreme hydroclimatic events. Despite their importance, their contribution to precipitation variability, flood risk, and long-term climate change remains poorly quantified. In this study, we combine global hydrological observations, high-resolution precipitation datasets, and multi-model climate simulations to assess the impact of ARs on interannual variability, extreme precipitation, and rare flooding. Our results indicate that ARs account for 70–90% of year-to-year precipitation variability across mid-latitude regions and are linked to more than 70% of the largest precipitation and streamflow events globally. Their presence can increase the likelihood of rare flood events by up to an order of magnitude in parts of North America, Europe, and Australia. Additionally, there have been notable increases in the frequency of ARs and the associated precipitation totals over the past decades. Climate model projections further suggest that AR-induced precipitation is likely to become more frequent and intense in the future, even in areas where mean precipitation may decline, potentially amplifying their role in hydroclimatic extremes. Together, these findings highlight that ARs are not only key drivers of present-day precipitation and flood events but will also increasingly shape future global hydroclimatic conditions. Understanding AR processes is therefore essential for anticipating changes in regional water availability, managing flood hazards, and adapting to a changing climate.

How to cite: Pradhan, S., Wasko, C., and Peel, M.: Atmospheric Rivers as Drivers of Precipitation Variability and Flood Extremes , EGU General Assembly 2026, Vienna, Austria, 3–8 May 2026, EGU26-3710, https://doi.org/10.5194/egusphere-egu26-3710, 2026.

EGU26-4283 | ECS | Posters on site | AS1.34 | Highlight

Impeded Arctic sea ice recovery: The role of declining southeastern North Atlantic atmospheric rivers 

Shiyue Zhang, Gang Zeng, Hans W Chen, and Deliang Chen

The increasing frequency of Arctic atmospheric rivers has significantly slowed the recovery of Arctic sea ice in recent decades. However, existing studies primarily focused on the local impacts of Arctic-internal atmospheric rivers, while how polar-external atmospheric rivers influence Arctic sea ice remains largely unexplored. This study reveals a significant decline in the genesis and poleward tracks of southeastern North Atlantic atmospheric rivers (NAARs) during the sea ice recovery season (October to March) since the mid-2000s. Both reanalysis and simulations suggest that large-scale atmospheric teleconnection wave trains associated with southeastern NAARs play a critical role in Barents Sea ice recovery by enhancing local Arctic cooling. However, the decline in southeastern NAARs activity after the mid-2000s has weakened this restorative effect, leading to a 31% slowdown in Barents Sea ice growth. These findings highlight the important influence of mid- to low-latitude climate changes on Arctic sea ice decline.

How to cite: Zhang, S., Zeng, G., Chen, H. W., and Chen, D.: Impeded Arctic sea ice recovery: The role of declining southeastern North Atlantic atmospheric rivers, EGU General Assembly 2026, Vienna, Austria, 3–8 May 2026, EGU26-4283, https://doi.org/10.5194/egusphere-egu26-4283, 2026.

EGU26-4381 | ECS | Posters on site | AS1.34

Dynamic Factors Dominate the Summer Precipitation Intensity of Atmospheric Rivers Landfalling Eastern China 

Yang Yang, Dongdong Peng, Lijuan Hua, Linhao Zhong, Zhaohui Gong, Wenshuo Huang, and Huiqi Li

Atmospheric rivers (ARs), narrow and intense moisture corridors typically extending poleward, significantly shape the hydrometeorological patterns across mid-latitudes. In this study, summer days with AR-related precipitation in eastern China (EC) during 1979−2022 were identified and categorized into six distinct levels based on precipitation intensity percentiles, derived from both the ERA5 and CN05.1 datasets. Results reveal a significant positive correlation between the maximum AR precipitation and maximum integrated water vapor transport (IVT) within each category, while no such correlation exists between mean AR precipitation and mean IVT. As precipitation strengthens, the proportion of areas experiencing precipitation on AR days progressively expands, approaching 100% in the strongest cases. The Sichuan Basin, Northeast China, and coastal South and East China exhibit relatively higher precipitation intensity and efficiency under weak–moderate categories. For moderate−heavy categories, the middle and lower Yangtze River and North China emerge as additional key AR precipitation-affected areas, while the influence on coastal regions significantly decreases. The frequency of AR precipitation days shows a distinct north–south gradient, with hotspots shifting systematically from Northeast to South China as intensity rises. Moisture budget analysis shows that the primary factor controlling AR precipitation intensity is vertical moisture convection, particularly its dynamic component, and zonal advection ranks second. Vertical motion, which governs these processes, is mainly driven by anomalous convergence and divergence linked to the subtropical westerly jet, with topography and atmospheric instabilities further enhancing its impact. These findings may offer valuable insights for future research on AR precipitation and related disasters in China.

How to cite: Yang, Y., Peng, D., Hua, L., Zhong, L., Gong, Z., Huang, W., and Li, H.: Dynamic Factors Dominate the Summer Precipitation Intensity of Atmospheric Rivers Landfalling Eastern China, EGU General Assembly 2026, Vienna, Austria, 3–8 May 2026, EGU26-4381, https://doi.org/10.5194/egusphere-egu26-4381, 2026.

EGU26-7669 | ECS | Orals | AS1.34

The role of Warm Conveyor Belts Ascent in Modulating Atmospheric River Characteristics and Cyclone Interaction: a composite analysis 

Tiago M. Ferreira, Ricardo M. Trigo, Svenja Christ, Julian Quinting, Joaquim G. Pinto, and Alexandre M. Ramos

A large amount of work has been devoted to identifying and characterizing the main drivers associated with Extreme Precipitation Events (EPEs). Among these drivers the main ones are Extratropical Cyclones (ETCs) and in particular their Warm Conveyor Belts (WCBs) and Atmospheric Rivers (ARs). These features can be intrinsically linked to the other through powerful feedbacks involving moisture, latent heat, and potential vorticity.

This study aims to increase the understanding of the intricate association between ARs, WCBs, and ETCs in driving EPEs on the North Atlantic basin through a comprehensive composite analysis. Using ERA-5 data from 1979 to 2023, we investigate first the characteristics of ARs based on their interaction with the ascent phase of WCBs, a key mechanism for moisture uplift and precipitation generation within ETCs. Results show that the influence of the ascent phase intensifies the precipitation values within the AR, and that those values extend northwestward towards the cyclone location. This clearly shows the influence of the ascent phase on the precipitation generation within both ARs and ETCs.

We then develop a composite analysis of AR cases, examining the evolution of meteorological fields at 12-hour intervals from 24 hours prior to the maximum deepening point (MDP) of the associated ETC, until 24 hours after this point. This detailed temporal analysis provides insights into how the structure and intensity of ARs and WCBs evolve in relation to the dynamic development of ETCs, which is critical for understanding extreme weather phenomena (e.g., EPEs). Results show that the moisture content within the AR is at its peak on the MDP timestep, and that the precipitation values start within the AR but as the ETC develops, the pattern extends northwestward (coinciding with the ascent phase occurrence composite), with the highest values occurring also at the MDP timestep.

These results suggest that WCB-influenced ARs are characterized by a more intense and focused precipitation core, well aligned with the cyclone’s warm sector, and exhibiting a stronger coupling with cyclone deepening. This research will contribute to a more comprehensive understanding of the link between the three systems, potentially improving their predictability and supporting more effective flood and landslide mitigation strategies. Such insights are vital given the increasing frequency and intensity of extreme weather events in a changing climate.

This work was supported by the Portuguese Fundação para a Ciência e Tecnologia, FCT, I.P./MCTES through the project AMOTHEC (DRI/India/0098/2020) with DOI 10.54499/DRI/India/0098/2020 and also through national funds (PIDDAC): LA/P/0068/2020 - https://doi.org/10.54499/LA/P/0068/2020, UID/50019/2025, https://doi.org/10.54499/UID/PRR/50019/2025, UID/PRR2/50019/2025. Tiago M. Ferreira was supported by FCT through PhD grant UI/BD/154496/2022.

How to cite: Ferreira, T. M., Trigo, R. M., Christ, S., Quinting, J., Pinto, J. G., and Ramos, A. M.: The role of Warm Conveyor Belts Ascent in Modulating Atmospheric River Characteristics and Cyclone Interaction: a composite analysis, EGU General Assembly 2026, Vienna, Austria, 3–8 May 2026, EGU26-7669, https://doi.org/10.5194/egusphere-egu26-7669, 2026.

We investigates the remote influence of diabatic heating over the Tibetan Plateau (TP) on atmospheric river (AR) activity in the North Pacific. We first identify a heating-sensitive region over the southern TP, where enhanced diabatic heating is significantly and positively correlated with AR frequency. This relationship is primarily associated with latent heat release sustained by abundant moisture supply. Further analyses indicate that the dynamical effects of eastward-propagating Rossby waves, originating over the Atlantic and modulated by the TP, promote upward moisture transport.Using the Water Accounting Model–2Layers, we show that the anomalous heating over the southern TP is mainly driven by increased moisture transport from the Indian Ocean, Arabian Sea, and Bay of Bengal, which is further intensified by the westward extension of the western North Pacific subtropical high (WNPSH). Additional moisture contributions are also detected from Eurasia. Moreover, Rossby wave activity emanating from the TP propagates eastward toward Japan, strengthening the westerlies and generating upper-level divergence that induces a coupled cyclonic–anticyclonic circulation over the North Pacific. This circulation enhances moisture convergence, thereby increasing AR activity in the region.In addition, a positive feedback is identified between southern TP heating and an eastward-propagating upper-level anticyclone, which further reinforces the westward extension of the WNPSH. These results highlight the TP’s far-reaching climatic influence and underscore its critical role in regulating atmospheric river activity over the North Pacific.

How to cite: Zhao, Y.: Impacts of Thermal Heating over the Tibetan Plateau on Atmospheric River Activity, EGU General Assembly 2026, Vienna, Austria, 3–8 May 2026, EGU26-9462, https://doi.org/10.5194/egusphere-egu26-9462, 2026.

EGU26-9523 | ECS | Posters on site | AS1.34

Improving Atmospheric River Forecast Over Himalayas using Convolutional Neural Network  

Sheikh Imran Fayaz, Munir Ahmad Nayak, and Adnan Kaisar Khan

Long, narrow zones of the Integrated Vapor Transport (IVT) in the lower troposphere are known as Atmospheric Rivers (ARs). ARs are major causes of heavy rain, and they are often associated with serious cases of flooding. For instance, the 2014 Kashmir flood and the 2013 Uttarakhand flood are linked to Himalayan ARs. Therefore, ARs are important in causing extreme weather and risk of floods in the Himalayan region. Thus, skillful prediction of ARs can be helpful in better severe weather risk management. The most widely accepted metric for identifying ARs is IVT as it integrates moisture content and its transport. Although the Global Forecast System (GFS) forecasts IVT globally, it is shown to suffer from systematic error over the West Coast of USA, especially for high magnitude IVT, and also fails in the accurate spatial organization of AR events. Recently, Chapman et al. (2019) proposed a Convolutional Neural Network (CNN) to the enhance the skill of GFS IVT forecasts in mid-latitude areas on the West Coast. However, the model lacks correction of IVT direction, which is critical in defining the precipitation produced from an AR upon impacting a mountain barrier. In addition, there is no machine learning model that is specifically designed for the Himalayan region. This work modifies the Chapman CNN architecture, in the South Asian region, incorporating the Himalayan region for correcting both the magnitude and direction of GFS IVT. In our work we take Modern Era Retrospective Analysis for Research and Applications Version 2 (MERRA-2) as a proxy to ground truth. The model significantly reduced various metrics, such as the Root Mean Square Error (RMSE) and Mean Angular Error (MAE), in comparison to GFS IVT, in the Himalayan region and in the entire study domain. When the model was tested for AR events, its performance significantly improved the AR forecast. These advances show that the model offers a powerful deep learning framework for AR prediction as compared to the raw GFS baseline.

How to cite: Fayaz, S. I., Nayak, M. A., and Khan, A. K.: Improving Atmospheric River Forecast Over Himalayas using Convolutional Neural Network , EGU General Assembly 2026, Vienna, Austria, 3–8 May 2026, EGU26-9523, https://doi.org/10.5194/egusphere-egu26-9523, 2026.

EGU26-9930 | ECS | Posters on site | AS1.34

Multi-Model Evaluation of Atmospheric River Forecast Skill and Uncertainty over the Himalayas 

Adnan Kaisar Khan, Munir Ahmad Nayak, and Sheikh Imran Fayaz

Atmospheric Rivers (ARs) are long (>2000 km) and narrow (<1000 km) corridors of enhanced moisture transport, with typical water vapour fluxes of 400–500 kg m⁻¹ s⁻¹. When these moisture-laden systems encounter the steep Himalayan terrain, strong orographic uplift produces intense precipitation, supplying much of the seasonal snowpack that sustains regional rivers and water resources. Approximately 56–73% of extreme precipitation events and floods in the Himalayas occur during the presence of ARs, underscoring their critical role in hydrological extremes and downstream water availability for millions of people.

Numerical Weather Prediction (NWP) models play a crucial role in forecasting extreme weather systems, and evaluating their performance over the complex terrain of the Himalayas is a vital first step toward improving regional predictability. In this study, we assessed the capability of multiple NWP models, including ECMWF, IMD, NCEP, and NCMRWF, to detect and forecast ARs at various lead times. ARs were identified using the tARget algorithm based on Integrated Vapour Transport (IVT) thresholds. Our analysis shows that the Hit Rate varies between 0.3 and 0.6 across models and lead times, while the False Alarm Rate ranges from 0.03 to 0.09, indicating considerable uncertainty in AR prediction. The ECMWF generally performs better at short lead times, capturing a larger fraction of observed AR events, whereas the NCEP model exhibits comparatively better skill at longer lead times, extending beyond 10 days. For all models, forecast skill consistently decreases with increasing lead time, reflecting the growing uncertainty associated with longer-range predictions. The relatively low hit rate of the IMD model can be largely attributed to its tendency to overestimate IVT over the Indian subcontinent. This positive bias leads to an exaggerated frequency of AR detections, thereby inflating false alarms and reducing the overall reliability of the forecasts.

Beyond event detection, substantial discrepancies are also found in AR characteristics, including their intensity, spatial extent, geographical position, and orientation. These differences highlight limitations in how current NWP models represent moisture transport and orographic interactions over the Himalayas. Consequently, further improvements in physical processes, parameterizations, and model resolution are required to achieve more accurate and reliable AR forecasts for this highly complex and hydrologically sensitive region.

How to cite: Khan, A. K., Nayak, M. A., and Fayaz, S. I.: Multi-Model Evaluation of Atmospheric River Forecast Skill and Uncertainty over the Himalayas, EGU General Assembly 2026, Vienna, Austria, 3–8 May 2026, EGU26-9930, https://doi.org/10.5194/egusphere-egu26-9930, 2026.

EGU26-10210 | Posters on site | AS1.34

Atmospheric rivers around Antarctica are behind daily global temperature spikes and dips 

Andrew King, Kimberley Reid, Jonathan Wille, and Eduardo Alastrué de Asenjo

The global mean surface temperature is the primary metric used to track how the climate is changing. While variability and change in global mean temperatures on interannual scales has been studied extensively, there has been limited analysis of daily global temperature variability. This is despite record-setting daily global average temperature events, such as in July 2024, generating widespread media interest.

Here, we explore the characteristics of spikes and dips in daily global average temperatures using the ERA5 reanalysis. We find that daily global temperature spikes are typically associated with Antarctic heatwaves while dips are related to Antarctic cold spells. For other parts of the world, the relationship between local and global average temperatures is much weaker. As Antarctic heatwaves are often preceded by atmospheric rivers, we examine poleward integrated water vapour transport and atmospheric river coverage in the days prior to daily global temperature spikes and dips. We find a strong signal of heightened poleward moisture transport 3-6 days prior to spikes in daily global mean temperature and the opposite pattern ahead of global temperature dips. We then examine to see if atmospheric river activity around Antarctica can help explain annual global mean temperature anomalies and find some effect, albeit weaker relative to daily scales.

This work highlights the importance of Southern Ocean atmospheric rivers in explaining variability in global mean temperatures across scales. Further study of modelling and prediction of global average temperatures based on atmospheric river activity is envisaged.

How to cite: King, A., Reid, K., Wille, J., and Alastrué de Asenjo, E.: Atmospheric rivers around Antarctica are behind daily global temperature spikes and dips, EGU General Assembly 2026, Vienna, Austria, 3–8 May 2026, EGU26-10210, https://doi.org/10.5194/egusphere-egu26-10210, 2026.

EGU26-11549 | ECS | Orals | AS1.34

Anatomy of atmospheric rivers: the internal signature of extreme events 

Enora Le Gall, Benjamin Fildier, and Sandrine Bony

Atmospheric rivers are transient filaments of high integrated water vapour transport (IVT), spanning across oceanic basins, that can be associated with heavy precipitation. Possible feedbacks between convection at the mesoscale and moisture transport could modulate impacts at the leading end of atmospheric rivers, but while the link with synoptic-scale dynamics and more specifically with extratropical cyclones has been the object of numerous studies, finer scale phenomena remain less investigated, apart from case-studies in specific regions such as the Californian coast.

This work aims at characterizing convection within atmospheric rivers and its interactions with moisture fluxes. We investigate the extent to which the conceptual scheme for the structure of atmospheric rivers is valid, and whether it should be refined.

A Lagrangian perspective on atmospheric rivers is key in order to study their internal structure from tail to head, from genesis to termination. We therefore use the tARget database of ERA5 atmospheric rivers (Guan and Waliser, 2024), detected globally on the basis of a relative regional threshold for high-IVT structures. We point out that it catches high-IVT objects that differ from the classical picture of atmospheric rivers and that could be separately classified through the description of their structure. We then develop an algorithm that detects the internal features of atmospheric rivers. We show that there can be multiple moisture transport axes, with varying connections to a cold front. Moreover, atmospheric rivers associated with extreme precipitation or IVT exhibit specific internal structures in terms of overturning circulations and tilted updrafts. 

This work underlines the need to consider the diversity of atmospheric rivers to better understand their impacts.

How to cite: Le Gall, E., Fildier, B., and Bony, S.: Anatomy of atmospheric rivers: the internal signature of extreme events, EGU General Assembly 2026, Vienna, Austria, 3–8 May 2026, EGU26-11549, https://doi.org/10.5194/egusphere-egu26-11549, 2026.

EGU26-11748 | ECS | Orals | AS1.34

Atmospheric rivers and energy transport in a hierarchy of idealized models 

Serena Scholz and Juan Lora

Atmospheric rivers (ARs) play a major role in both global moisture and energy transport. There has been substantial research exploring the sources and pathways of moisture in these features, which often cooccur with extratropical cyclone systems and spatially overlap with the cyclone’s warm conveyor belt. However, how these features contribute to the convergence and transport of energy at a local and global scale is less well understood. Our new work uses Isca, an idealized modeling framework, to construct a hierarchy of models with varying complexity. By varying the radiation scheme from a simple, gray radiation scheme, to a scheme including water vapor feedbacks, to a full radiative transfer scheme, this model hierarchy allows us to use mechanism denial to better understand the physical processes that govern the AR size, frequency, and their role in energy convergence and transport. We examine how moisture and energy transport change throughout the AR lifecycle, and with varying levels of CO2 forcing. We also present a new, threshold-free AR identification method that performs equally well across a variety of warming and cooling experiments, without arbitrary adjustments of thresholds, allowing us to accurately assess changes to AR frequency, size, and energy and moisture transport in a variety of climate states. This work provides new insight into the nature of ARs, their internal structure and lifecycles, and their role in the global energy budget.

How to cite: Scholz, S. and Lora, J.: Atmospheric rivers and energy transport in a hierarchy of idealized models, EGU General Assembly 2026, Vienna, Austria, 3–8 May 2026, EGU26-11748, https://doi.org/10.5194/egusphere-egu26-11748, 2026.

Atmospheric rivers (ARs) are increasingly recognized as key contributors to moisture and heat transport into Antarctica, yet their dominant time scales of variability and links to large-scale climate modes remain insufficiently quantified. We analyze sector-resolved AR frequency and integrated vapor transport around the Antarctic margin using band-pass filtering and canonical correlation analysis applied to reanalysis-based circulation and thermodynamic fields. The results show a pronounced scale dependence of AR variability, with weak and spatially incoherent signals at interannual (6–18-month) time scales, but robust and hemispherically organized patterns at multiyear (36–72-month) periods.

At these longer time scales, AR activity is strongly coupled to tropical–extratropical modes, in particular ENSO, the Indian Ocean Dipole, and the Southern Annular Mode, through their modulation of storm-track intensity, subtropical jet position, and meridional moisture transport. The strongest canonical responses occur in the Weddell Sea and Atlantic–Indian sectors, characterized by negative sea-level pressure anomalies, enhanced westerlies, and intensified poleward integrated vapor transport. In contrast, the East Antarctic and Ross–Bellingshausen sectors exhibit weaker and more localized circulation anomalies, indicating a strong modulation by regional geometry and background flow.

The associated wind and pressure patterns reveal preferred pathways for AR intrusions, involving strengthened midlatitude westerlies, anticyclonic anomalies over the Amundsen–Bellingshausen Seas, and shifts in the subtropical jet that facilitate tropical–polar moisture exchange. These results demonstrate that Antarctic ARs are organized by large-scale tropical–extratropical coupling acting predominantly at multiyear time scales, with pronounced sectoral contrasts. Such scale-dependent behavior has important implications for understanding and predicting variability in Antarctic precipitation, surface temperature, and surface mass balance.

How to cite: Justino, F., Bromwich, D., and Gurjao, C.:  Dominant time scales of tropical–extratropical coupling in atmospheric rivers over the Southern Ocean and coastal Antarctica, EGU General Assembly 2026, Vienna, Austria, 3–8 May 2026, EGU26-13680, https://doi.org/10.5194/egusphere-egu26-13680, 2026.

EGU26-14258 | Orals | AS1.34

The contribution of atmospheric rivers to ice-related flooding in Québec, Canada, from 1990 to 2022 

François Anctil, Benjamin Bouchard, Daniel F. Nadeau, Marc-André Bourgault, Romane Hamon, Benoît Brault, Nicolas Roy, Clarence Gagnon, Alexis Bédard-Therrien, and Tadros Ghobrial

In the province of Québec in eastern Canada, ice-related floods (IRF) have affected several municipalities and caused over 50 million dollars in personal damage over the past 35 years. Dynamic river ice breakup occurs when river discharge increases due to snowmelt runoff and rainfall, before any significant thermal deterioration of the ice cover. Fragmented ice blocks then jam at river constrictions, triggering the formation of ice jams and consequently flooding adjacent urban areas. Atmospheric rivers (AR) are long and narrow corridors of high-water vapor transport that travel poleward and often result in large amounts of rainfall. Although the frequency of mid-winter ice breakup and AR have increased in recent years in eastern Canada, the effect of AR on IRF has never been investigated systematically at the regional scale. This study assesses the impact of AR on IRF in Québec from 1990 to 2022. To investigate the influence of streamflow, surface, and atmospheric conditions on IRF, we leveraged a provincial flood-related insurance claim database along with the publicly available repository of historical ice jams (IJ) in Québec, the Québec hydroclimatic Atlas dataset of simulated river discharge, the version 3.1 of the Canadian Surface Reanalysis and the EDARA atmospheric river database. Our results show that more than 81% of the 732 analyzed IJ were related to AR conditions, defined as an integrated water transport (IVT) greater than 250 kg m–1 s–1. The IJ-related IVT and rainfall intensity were significantly higher in mid-winter (n = 325) than spring (n = 407). In contrast, greater snowmelt contribution during spring IJ resulted in larger streamflow when compared to mid-winter events. Among the mid-winter IJ, those associated to a flood (n = 26) happened under significantly more intense AR conditions. This research demonstrates the significant role of AR on mid-winter IRF and provides new insights for improving winter flood awareness and early warning systems. Next analyses will focus on the characteristics of AR during IJ and IRF.

How to cite: Anctil, F., Bouchard, B., F. Nadeau, D., Bourgault, M.-A., Hamon, R., Brault, B., Roy, N., Gagnon, C., Bédard-Therrien, A., and Ghobrial, T.: The contribution of atmospheric rivers to ice-related flooding in Québec, Canada, from 1990 to 2022, EGU General Assembly 2026, Vienna, Austria, 3–8 May 2026, EGU26-14258, https://doi.org/10.5194/egusphere-egu26-14258, 2026.

EGU26-14978 | ECS | Orals | AS1.34

The ARTMIP Polar Synthesis: A comparative analysis of polar atmospheric river tracking methods in historical and future climate states 

Kyle Mattingly, Michelle Maclennan, Joseph Schnaubelt, and Christine Shields and the ARTMIP Polar Synthesis Team

Atmospheric rivers (ARs) are the conduit for the majority of atmospheric moisture transport into the polar regions and influence the evolution of the polar ice sheets and sea ice. Their impacts on the polar cryosphere are expected to intensify as atmospheric moisture content and temperatures increase in a warming climate. In order to assess these polar AR impacts, some method for identifying ARs in reanalysis and/or model datasets must be chosen. Prior studies facilitated by the Atmospheric River Tracking Method Intercomparison Project (ARTMIP) show that quantitative and qualitative conclusions about the global climatology, impacts, and future changes of ARs depend on the choice of AR detection tool (ARDT) used in the analysis. There is a community need for a similar comparison of ARDTs in the polar regions (both the Arctic and Antarctica), where the unique atmospheric conditions require different parameters for AR detection relative to global ARDTs.

In this presentation, we report initial findings from the ARTMIP polar synthesis project, a collaborative effort to provide community guidance on best practices for ARDT selection in polar studies. This project builds upon the existing ARTMIP framework to curate and compare AR catalogues from a number of ARDTs that have been developed for polar AR identification. We first analyze polar AR climatology across ARDTs in the historical record using MERRA-2 atmospheric reanalysis, focusing on similarities and differences among ARDTs linked to their algorithm design. These historical catalogues are also used to analyze how differences in AR detection across ARDTs affect interpretation of ice sheet and sea ice impacts. We then extend our analysis to future AR projections by applying each ARDT to three members of the CESM2 large ensemble under the SSP3-7.0 emissions scenario. We focus on cross-algorithm differences in AR detection and associated cryosphere impacts that may be accentuated by future atmospheric warming and moistening. Finally, we use a subset of four ARDTs in a case study to assess how existing ARDTs may be tuned to more accurately identify polar ARs.

How to cite: Mattingly, K., Maclennan, M., Schnaubelt, J., and Shields, C. and the ARTMIP Polar Synthesis Team: The ARTMIP Polar Synthesis: A comparative analysis of polar atmospheric river tracking methods in historical and future climate states, EGU General Assembly 2026, Vienna, Austria, 3–8 May 2026, EGU26-14978, https://doi.org/10.5194/egusphere-egu26-14978, 2026.

EGU26-17184 | Orals | AS1.34

Recent Intensification of Moderate-to-Extreme Atmospheric Rivers and Associated Hydroclimate Extremes 

June-Yi Lee, Gopi Nadh Konda, Arjun Babu Nelllikkattil, and Bin Guan

Atmospheric Rivers (ARs) play a fundamental role in global and regional hydroclimate, accounting for up to 35% of annual mean precipitation, approximately 50% of extreme precipitation, and around 85% of flood events in the midlatitudes.  Using multiple observational and reanalysis datasets spanning 1979-2025 and applying several AR detection techniques, including the SCAlable Feature Extracting and Tracking (SCAFET) method, we systematically examine recent changes in AR characteristics and their associated hydroclimate extremes. Our analysis shows no significant trend in the total annual frequency of all AR events, despite a pronounced long-term increase in integrated vapor transport over the last several decades. In contrast, the frequency and maximum intensity of moderate-to-extreme ARs have increased significantly, accompanied by a robust intensification of AR-related extreme precipitation.  We further find pronounced seasonal dependence in these changes, characterized by a robust poleward shift of ARs, associated with storm-track displacement and moisture-transport pathway migration during boreal winter, and by a notable increase in AR activity over East Asia and the western North Pacific during boreal summer. These findings are consistent across different reanalysis products and detection algorithms, underscoring the robustness of the detected signals. The recent increase in moderate-to-extreme AR events highlights an emerging amplification of hydroclimate extremes, with important implications for water resources management, flood risk assessment, and climate adaptation strategies in midlatitude regions.

How to cite: Lee, J.-Y., Konda, G. N., Nelllikkattil, A. B., and Guan, B.: Recent Intensification of Moderate-to-Extreme Atmospheric Rivers and Associated Hydroclimate Extremes, EGU General Assembly 2026, Vienna, Austria, 3–8 May 2026, EGU26-17184, https://doi.org/10.5194/egusphere-egu26-17184, 2026.

EGU26-18467 | Posters on site | AS1.34

Major differences between two atmospheric reanalyses seen by an aerosol atmospheric river detection algorithm 

Marco Gaetani, Giulia Sturlese, and Benjamin Pohl

Aerosol Atmospheric Rivers (AARs) are long, narrow regions in the atmosphere transporting large concentrations of aerosols. Previous literature focused on AARs detected only based on MERRA-2 reanalysis data. In this study, global AAR catalogues of different species (organic carbon, black carbon, and dust) are constructed for the 2003 – 2023 period by applying an AAR detection algorithm to two reanalysis products: MERRA-2 and CAMS. These catalogues provide information regarding the location and extension of the AARs found at 6-hourly timesteps, as well as their geometric characteristics (length, width) and their tracking over time. Results show large discrepancies between the catalogues based on the two reanalyses. Specifically, substantial differences are found between the spatial and temporal frequencies of occurrence of AARs in for each aerosol species considered. These findings underscore the need for caution when using AAR catalogues obtained from only one reanalysis product.

How to cite: Gaetani, M., Sturlese, G., and Pohl, B.: Major differences between two atmospheric reanalyses seen by an aerosol atmospheric river detection algorithm, EGU General Assembly 2026, Vienna, Austria, 3–8 May 2026, EGU26-18467, https://doi.org/10.5194/egusphere-egu26-18467, 2026.

EGU26-18470 | ECS | Posters on site | AS1.34

Network Analysis of Atmospheric River Moisture Transport: Connectivity, Trend, and Climatology 

Jitendra Sharma and Bellie Sivakumar

Atmospheric Rivers (ARs) are lengthy, narrow atmospheric corridors that transport substantial moisture over great distances, often resulting in heavy precipitation upon landfall. Characterization of the connectivity and spatial organization of AR events across regions is highly challenging due to their dynamic nature and the complex nonlinear interactions governing moisture transport pathways. This study applies complex network theory to analyse AR moisture transport patterns and connectivity over the West Coast of North America. The ERA5 reanalysis data and 7 CMIP6 climate model outputs over the period 1970–2014 are studied. We first employ the Mann-Kendall trend analysis to examine long-term changes in integrated water vapor transport intensity, thereby establishing the temporal evolution of AR characteristics that the network analysis will contextualize. We next evaluate model performance through Spearman correlation analysis and develop a hybrid network construction methodology that integrates six different threshold selection techniques to determine the optimal correlation threshold for network construction. We then apply several network measures, including degree centrality, clustering coefficient, and closeness centrality, to characterize the organization of an AR system. The Mann-Kendall analysis reveals significant intensification on the West Coast (+0.5-1.0 kg/m/s per year), strengthening in the Gulf of Alaska (p < 0.05). Climatological composites reveal the primary AR corridor at 40–50°N, with peak intensities of 450–500 kg/m/s in the central Pacific and making landfall along the Northern California/Oregon coast at intensities exceeding 400 kg/m/s. Model evaluation identifies EC-Earth3 and EC-Earth3-CC as the best-performing (Spearman r > 0.40), substantially outperforming other CMIP6 models (r = 0.02–0.24). Network validation establishes optimal parameters at r = 0.35 correlation threshold and 5% edge density, with network stability exceeding 0.95 and >90% inter-model agreement on top 100 nodes. Network centrality analysis reveals a hierarchical organization with uniform clustering coefficients (0.6–0.8) across the North Pacific, a north-south gradient in degree centrality (0.08–0.11 in the northern, 0.02–0.04 in the subtropical region), and identifies a critical moisture transport hub at 30–40°N, 120–140°W. The northern Pacific storm corridor (40–55°N) dominates all network measures, confirming primary AR pathways, with the EC-Earth models reliably reproducing the observed patterns. These findings demonstrate that network theory offers a quantitative framework for understanding AR connectivity and organization, with applications for climate change assessment and water resource management.

How to cite: Sharma, J. and Sivakumar, B.: Network Analysis of Atmospheric River Moisture Transport: Connectivity, Trend, and Climatology, EGU General Assembly 2026, Vienna, Austria, 3–8 May 2026, EGU26-18470, https://doi.org/10.5194/egusphere-egu26-18470, 2026.

EGU26-22609 | ECS | Posters on site | AS1.34

Landfalling Atmospheric Rivers in Ireland: Statistical and Machine Learning Insights 

Shafkat Sharif and Pete D. Akers

Atmospheric rivers (ARs) transport high concentrations of water vapor in narrow bands from the tropical and subtropical Atlantic to western European coasts. Ireland frequently falls in their paths and receives ~50 ARs annually. To better understand AR-specific synoptic states and behaviour in Ireland, we examine how statistical and machine learning analysis fares in identifying and characterising ARs at both 6-hourly and daily resolutions. We use a dataset based on 1949 landfalling Irish ARs detected using the “tARget” AR detection tool for a 42-year period of 1980-2021, and which are linked to ~80% of Ireland’s daily extreme precipitation events.

Notably, traditional statistical analyses (e.g., correlations, PCA) of daily weather parameters (e.g., 10-m wind, 10-m highest wind gust, air temperature) loosely identify AR days for different landfall regions, but 6-hourly reanalysis variables such as Integrated Vapor Transport (IVT), 850 hpa vertical velocity (ω), and 500 hpa geopotential height strongly distinguish ARs. K-means clustering shows that persistent ARs with high IVT and long overland durations are most common with southern and western Ireland landfalls, whereas northern and eastern landfall sites receive weaker ARs. When trained with daily observational data, machine learning models (Random Forest, XGBoost, and LSTM) identify AR vs. non-AR days with 75-85% F1 scores (precision/recall efficiency). With reanalysis data, the models score ~75% at multi-class classification for AR ranks detection but are less successful for high-intensity ARs (ranked 4 and 5). The Random Forest model performs the best at predicting daily maximum precipitation (R2: 0.63), with key predictors being the 850 hpa upward motion of air (-ω, in %) and maximum IVT. The important reanalysis and observation variables identified above can be selected to reduce model complexity and to train specialized hybrid models for future AR studies.

How to cite: Sharif, S. and Akers, P. D.: Landfalling Atmospheric Rivers in Ireland: Statistical and Machine Learning Insights, EGU General Assembly 2026, Vienna, Austria, 3–8 May 2026, EGU26-22609, https://doi.org/10.5194/egusphere-egu26-22609, 2026.

EGU26-508 | ECS | Posters on site | CL4.2

Future Trends in Upper-Atmospheric Shear Instability from Climate Change 

Joana Medeiros and Paul Williams

Understanding how jet streams respond to a warming climate is crucial for anticipating changes in atmospheric circulation and their broader impacts. Previous studies have highlighted the influence of anthropogenic warming on the meridional temperature gradient, which directly affects jet stream dynamics and variability. This study investigates projected trends in upper-level jet stream shear instability under future climate change scenarios using CMIP6 multi-model simulations. Building on previous findings linking anthropogenic warming to strengthened meridional temperature gradients, we analyse annual means of zonal wind speed, vertical wind shear, and stratification profiles from 2015 to 2100 globally. Results show strengthened multi model annual-mean vertical shear at 250 hPa, particularly in high-emission scenarios, with trends ranging from 0.04 to 0.11 m s¹ (100 hPa)¹ decade¹ depending on the scenario, and region (a total relative increase of 16 - 27% over 86 years). Decreasing trends are observed in the annual-mean Brunt-Väisälä frequency (N²) at 250 hPa, with multi-model ensemble mean values across regions ranging from -0.018 to -0.040 × 10⁴ s² decade¹ for lower and higher emissions scenarios, respectively (a total relative decrease of -10 to -20%). Similarly, the Richardson number (Ri) shows decreasing trends of -0.014 to -0.050 decade¹ across emissions scenarios and regions (a total relative decrease of -38 to -47%). These findings suggest an increased likelihood of more favourable conditions for stronger and more frequent Clear-Air Turbulence (CAT), posing critical challenges for aviation safety and operations in a warming climate.

How to cite: Medeiros, J. and Williams, P.: Future Trends in Upper-Atmospheric Shear Instability from Climate Change, EGU General Assembly 2026, Vienna, Austria, 3–8 May 2026, EGU26-508, https://doi.org/10.5194/egusphere-egu26-508, 2026.

The Western Pacific Hadley Circulation (WPHC), the strongest regional Hadley circulation, plays a crucial role in regional and global climate variability. Observations since 1979 indicate a significant strengthening of the boreal spring WPHC in the Northern Hemisphere; however, the relative roles of internal climate variability and external forcing remain unclear. Here, using large ensemble climate simulations together with observational constraints, we quantify the drivers of recent WPHC changes and provide near-term future projections.

We show that approximately 71% of the observed strengthening is attributable to internal variability associated with phase transitions in three key tropical inter-basin sea surface temperature (SST) gradients—tropical Western Pacific (TWP)-Western North Pacific, TWP-Tropical Eastern Pacific, and TWP-Tropical Indian Ocean. By constraining future projections using ensemble members that better reproduce the historical evolution of these SST gradients, we reduce projection uncertainty by nearly 49%. The constrained projections consistently indicate a likely weakening of the WPHC in the coming decades. 

Our results highlight the critical importance of tropical inter-basin SST gradients in shaping regional Hadley circulation variability and underscore their value for improving the reliability of near-term regional climate projections.

How to cite: Xu, W., Chen, W., and Chen, S.: Recent strengthening of the Western Pacific Hadley Circulation driven by tropical inter-basin sea surface temperature gradients, EGU General Assembly 2026, Vienna, Austria, 3–8 May 2026, EGU26-1784, https://doi.org/10.5194/egusphere-egu26-1784, 2026.

Some time ago, resonant amplification of Rossby waves along a circumglobal jetstream was hypothesized as the underlying reason for extreme weather in observed episodes. The argument is based on refractive index theory in the framework of the linear barotropic model. This theory allows one to diagnose the existence of a zonal waveguide - and, hence, the possibility of Rossby wave resonance - by a straightforward analysis of the meridional profile of the basic state zonal wind. The current paper contrasts the results from this theory with a recently developed method that makes less assumptions and approximations and is, hence, considered as benchmark. Comparison between the two methods shows that refractive index theory gives results that are both qualitatively and quantitatively inconsistent with the benchmark method. Experiments with idealized jets allow one to understand the shortcomings of refractive index theory. It is concluded that refractive index theory is fundamentally inappropriate as a diagnostic for Rossby wave resonance.

How to cite: Wirth, V.: How to diagnose Rossby wave resonance along a circumglobal jetstream?, EGU General Assembly 2026, Vienna, Austria, 3–8 May 2026, EGU26-2693, https://doi.org/10.5194/egusphere-egu26-2693, 2026.

Equilibrium climate sensitivity remains highly uncertain due to cloud feedbacks, which are strongly influenced by the pattern effect—the dependence of the atmospheric response and radiative feedbacks on the spatially heterogeneous sea surface warming. The pattern effect depends on the representation of convection, boundary-layer dynamics, and the large-scale circulation. Because it links small-scale processes with global climate, it provides an ideal test of the added value of global storm resolving models for simulating climate dynamics.

We investigate the atmospheric response to an idealized 1.5 °C sea surface temperature perturbation applied to the Indo-Pacific Warm Pool using the ICON model in the XPP configuration across a range of horizontal resolutions, from CMIP-like scales to kilometer-scale simulations. A set of experiments spanning different physical parameter configurations is used to examine how variations in moisture and convective processes influence the large-scale circulation response to regional warming. While higher resolution tends to produce a stronger response, differences in moisture distribution associated with changes in the ITCZ and Walker circulation, as well as variations in convective aggregation, exert a comparably strong influence on the circulation adjustment.

These results demonstrate that the coupling between moisture, convection, gravity-wave processes, and the large-scale circulation is a key control on the simulated pattern effect, shaping the atmospheric response to spatially heterogeneous warming and influencing circulation-driven climate feedbacks under climate change.

How to cite: Kroll, C. and Jnglin Wills, R. C.: The pattern effect in storm resolving ICON: How newly resolved processes influence the moisture distribution and large-scale circulation response to sea surface temperature perturbations, EGU General Assembly 2026, Vienna, Austria, 3–8 May 2026, EGU26-3160, https://doi.org/10.5194/egusphere-egu26-3160, 2026.

EGU26-3310 | Orals | CL4.2

Amplified European future warming under mesoscale-resolving sea surface temperature forcing 

Pablo Ortega and Eduardo Moreno-Chamarro

Ocean mesoscale sea surface temperature (SST) variability associated with eddies, fronts, and filaments strongly modulates air–sea heat and moisture exchanges, yet its role in shaping future regional climate change remains poorly constrained. This uncertainty largely stems from the fact that most global climate models do not resolve the ocean mesoscale. Here, we assess how the SST mesoscale influences the North Atlantic–European climate under present-day and future warming conditions. We use a high-resolution (~16 km) global atmospheric model forced with SSTs from an eddy-rich coupled model, comparing simulations with fully resolved mesoscale SSTs to experiments in which these have been spatially smoothed. While the atmospheric mean state shows only minor sensitivity to mesoscale SSTs under present-day conditions, under future climate conditions, mesoscale SST anomalies contribute to amplifying European winter climate change. Enhanced latent heat release along the Gulf Stream associated with mesoscale SST anomalies increases baroclinic instability, intensifies the North Atlantic storm track, and drives a circulation response resembling a positive phase of the North Atlantic Oscillation. This results in substantially warmer and wetter European winters. In contrast, suppressing mesoscale SST variability weakens storm activity, favors atmospheric blockings, and strongly reduces projected warming. Our results demonstrate that the ocean mesoscale exerts a first-order control on the response of the mid-latitude atmospheric circulation to climate warming, and suggest that climate projections based on standard resolution models may systematically underestimate regional climate change over Europe. Resolving mesoscale ocean–atmosphere interactions emerges as a key requirement for  more reliable future climate projections.

How to cite: Ortega, P. and Moreno-Chamarro, E.: Amplified European future warming under mesoscale-resolving sea surface temperature forcing, EGU General Assembly 2026, Vienna, Austria, 3–8 May 2026, EGU26-3310, https://doi.org/10.5194/egusphere-egu26-3310, 2026.

EGU26-3869 | ECS | Posters on site | CL4.2

Resolution Dependence of Tropical Poleward Energy Transport in Aquaplanet GCMs 

Chiung-Yin Chang, Pu Lin, Isaac Held, Timothy Merlis, and Pablo Zurita-Gotor

The tropical atmosphere plays an important role in transporting energy poleward and driving the global circulation. However, understanding and simulating this fundamental aspect of our climate remains difficult due to its sensitivity to convective parameterizations and horizontal resolution. This study focuses on benchmarking the resolution dependence of tropical poleward energy transport in two aquaplanet atmospheric general circulation models with disabled convective parameterizations: a nonhydrostatic high-resolution (100–6 km) finite-volume cubed-sphere model with a full physics package and a lower-resolution (300–100 km) hydrostatic spectral model with idealized moist physics. Despite differences in their physics and numerics, both models demonstrate that column-integrated poleward moist static energy transport by the mean meridional circulation increases with resolution in the deep tropics, while transport by transient eddies decreases. These changes are associated with enhanced gross moist stability that switches from negative to positive due to an increasingly top-heavy mean circulation and reduced eddy activity diffusing water vapor along an unchanging mean moisture gradient. Further analysis rules out extratropical baroclinic eddies and radiation as the main drivers of these changes. Instead, the resolution dependence of both the mean meridional circulation and transient eddies appears to reflect the resolution dependence of tropical explicit (unparameterized) deep convection. We speculate the multiscale interactions of convection allow for a coupling between gross moist stability and eddy moisture flux, leading to their concurrent changes with resolution. We discuss the implications of this resolution dependence for developing theories and models of the tropical atmosphere.

How to cite: Chang, C.-Y., Lin, P., Held, I., Merlis, T., and Zurita-Gotor, P.: Resolution Dependence of Tropical Poleward Energy Transport in Aquaplanet GCMs, EGU General Assembly 2026, Vienna, Austria, 3–8 May 2026, EGU26-3869, https://doi.org/10.5194/egusphere-egu26-3869, 2026.

Vertical wind structure plays a central role in tropospheric dynamics, yet its variability is rarely characterized beyond surface-level fields. Summarizing this variability over multi-decadal timescales requires reducing the dimensionality of wind profiles while preserving their dynamical content. Here, we develop an objective classification of vertical wind regimes using the ERA reanalysis (1940–2024), to identify a compact set of representative tropospheric structures and quantify their temporal evolution.

We first derive spatio-temporal averaged wind profiles from the reference regions defined within the IPCC framework. Although these regions are based on surface climate characteristics, the resulting regional wind profiles provide a baseline against which we compare new wind profile classifications from vertical climate variability.

Dominant modes of variability are extracted using empirical orthogonal functions applied to multi-level wind profiles. Clustering (k-means and hierarchical approaches) is then performed in the reduced phase space to identify dynamical regimes, with robustness assessed through bootstrap resampling and multiple validation metrics. We show that a limited number of regimes capture most of the tropospheric wind variance over the 84-year period, each characterized by distinct vertical shear and directional signatures. The length of the record allows us to examine persistence, transition probabilities, and modulation across seasonal to multi-decadal variability.

Overall, this framework provides a physically interpretable compression of vertical wind variability over a uniquely long ERA dataset, offering new diagnostic tools for atmospheric dynamics and a potentially valuable input for transport, dispersion, and predictability studies.

How to cite: Goursaud Oger, S.: A robust classification of tropospheric wind profiles from ERA reanalyses (1940–2024), EGU General Assembly 2026, Vienna, Austria, 3–8 May 2026, EGU26-5049, https://doi.org/10.5194/egusphere-egu26-5049, 2026.

EGU26-5314 | ECS | Posters on site | CL4.2

North Atlantic variability in a warmer world: what can the Pliocene tell us? 

Abigail Buchan, Alan Haywood, Aisling Dolan, Julia Tindall, and Daniel Hill

The Late Pliocene (3 million years ago) is the last period of sustained warmth characterised by elevated carbon dioxide (~400 ppmv), smaller ice sheets and warmer temperatures (~3.2°C above pre-industrial), with a similar to modern continental configuration. This period gives us an insight into how the climate system behaves in a warmer than present state. The majority of research on the Late Pliocene focuses on long term mean states, but examining variability and extreme events provides a deeper understanding of the response of the climate to different forcings, and how these changes are captured across different climate models.

Here, we present an overview atmospheric circulation in the North Atlantic in the Late, including changes to the jet stream and the North Atlantic Oscillation (NAO).

We use data from the Pliocene Model Intercomparison Project Phase 2 (PlioMIP2), a multi-national modelling effort consisting of 17 climate models. We find that the NAO tends towards a more positive phase of the NAO and this shift can explain the mean state precipitation pattern change observed in the PlioMIP2 ensemble. We investigate the drivers of the change using the Hadley Centre Coupled Climate Model, Version Three (HadCM3) to separate out the impacts of Pliocene CO2, orography and ice sheets on the NAO.

This work highlights the benefit of using past climates to improve understating of the climate system and shows the need to consider a multi-model, multi-centennial viewpoint when examining higher frequency variability in past climates.

How to cite: Buchan, A., Haywood, A., Dolan, A., Tindall, J., and Hill, D.: North Atlantic variability in a warmer world: what can the Pliocene tell us?, EGU General Assembly 2026, Vienna, Austria, 3–8 May 2026, EGU26-5314, https://doi.org/10.5194/egusphere-egu26-5314, 2026.

EGU26-5844 | ECS | Orals | CL4.2

Dependence of inter-hemispheric teleconnections on the climatological ITCZ pattern 

Valentina Collavini, Moritz Günther, and Sarah M. Kang

Extratropical forcing can generate strong non-local responses via teleconnections. For example, the Hadley circulation responds to high-latitude forcing by shifting its ascending branch, the intertropical convergence zone (ITCZ), towards the warmer hemisphere. However, the ITCZ location has been shown to modulate the inter-hemispheric communication of an extratropical surface anomaly through the ITCZ blocking mechanism.
In this study, we investigate how the climatological ITCZ position affects the climate response to extratropical forcing. We conduct aquaplanet slab ocean simulations in MPI-ESM by imposing a southern hemispheric extratropical cooling of 50 Wm-2 to five control states, each differing in the ITCZ location. 
Results show that the Hadley cell response and consequent ITCZ northward shift are the largest when the climatological ITCZ is in the same hemisphere as the forcing.  Both responses progressively weaken as the climatological ITCZ is displaced northward.
The amplitude and progressive weakening of the atmospheric response are shaped by the cloud radiative effect (CRE). If the ITCZ lies in the forced hemisphere, extratropical low-cloud formation enhances the imposed cooling locally, thus increasing the atmospheric compensation for the energetic imbalance. However, when the ITCZ is in the opposite hemisphere, a weak but positive low-cloud anomaly extending equatorward from the forced extratropics results in a dampened atmospheric compensation.
Locking the clouds mutes the atmospheric response, further highlighting the role of cloud feedbacks for ITCZ shifts.
Furthermore, we show that the negative sea surface temperature (SST) anomaly originating in the forced extratropics does not extend substancially beyond the ITCZ, reinforcing the idea that the ITCZ location limits the propagation of surface signals. We propose that changes in latent heat fluxes tied to the surface-wind response to the forcing are at the core of the ITCZ blocking mechanism, as an anomalous increase (decrease) in wind speed southward (northward) of the new ITCZ location leads to an enhancement (reduction) of the negative SST anomaly.
Our findings reveal that the ITCZ location and blocking effect strongly modulate extratropical-tropical interactions, implying that model biases in the ITCZ location might produce inaccurate responses to high-latitude forcing.

How to cite: Collavini, V., Günther, M., and Kang, S. M.: Dependence of inter-hemispheric teleconnections on the climatological ITCZ pattern, EGU General Assembly 2026, Vienna, Austria, 3–8 May 2026, EGU26-5844, https://doi.org/10.5194/egusphere-egu26-5844, 2026.

EGU26-5883 | ECS | Orals | CL4.2

Dynamical controls on tropical circulation and precipitation–evaporation responses to cloud radiative changes 

Emily Van de Koot, Tim Woollings, Michael Byrne, and Aiko Voigt

While a range of processes have been linked to uncertainty in tropical precipitation minus evaporation (P–E) and circulation changes, growing evidence links cloud-radiative changes to inter-model spread. Radiation-locking studies further demonstrate strong sensitivities of circulation and P–E to cloud-radiative changes in aquaplanet models; however, the physical mechanisms linking CO2-driven cloud-radiative changes to tropical circulation and P–E responses remain poorly understood. Here, we use the radiation-locking technique to elucidate these mechanisms in a climate model configured with realistic continents, sea ice, and a seasonal cycle, with the ocean represented by a slab ocean model with prescribed climatological q-fluxes. We introduce a novel analytical framework in which the P–E response is analysed as a function of climatological P–E, enabling direct comparison with thermodynamic scaling arguments.

Despite inducing weak surface warming, CO2-driven cloud-radiative changes substantially modify the tropical hydrological response, driving a robust wet-gets-drier, dry-gets-wetter P–E pattern that opposes the canonical wet-gets-wetter, dry-gets-drier signal associated with climate warming. Moisture and moist static energy budget analyses show that this response is driven by a weakening of the tropical overturning circulation associated with enhanced upper-tropospheric cloud-radiative heating. Sea surface temperature pattern changes induce additional P–E responses, including a poleward shift of precipitation maxima over the Indian and western Pacific Oceans. Our results demonstrate that circulation changes strongly shape tropical P–E responses to cloud-radiative changes, and that the balance between dynamic and thermodynamic responses may be a key control on inter-model spread. We further highlight the coupling between cloud-radiative heating and latent heat release as critical for the resulting circulation response.

How to cite: Van de Koot, E., Woollings, T., Byrne, M., and Voigt, A.: Dynamical controls on tropical circulation and precipitation–evaporation responses to cloud radiative changes, EGU General Assembly 2026, Vienna, Austria, 3–8 May 2026, EGU26-5883, https://doi.org/10.5194/egusphere-egu26-5883, 2026.

EGU26-5907 | ECS | Orals | CL4.2

Revisiting the origin of the Walker circulation: the importance of land 

Moritz Günther and Sarah M. Kang

The Walker circulation's rising branch is located over the warm water in the Western Pacific Warm Pool, and the air sinks over the cold Eastern Pacific. It is usually taken for granted that the Walker circulation exists because the dynamic ocean induces this SST gradient: efficient dynamical cooling by upwelling water keeps the SST cold in the East, while the warm water piles up in the West.

Here, we revisit this paradigm and offer a new perspective on the origin of the Walker circulation. We show that a Walker circulation arises even in climate model simulations with a zonally symmetric slab ocean where there is no oceanically forced zonal temperature gradient. Instead, a zonally asymmetric land distribution is sufficient to elicit a realistic Walker circulation. We find that the presence of South America alone can cause an atmospheric heating profile which forces a pan-tropical wave response leading to a Walker circulation. Rather than the oceanically induced SST gradient, we emphasize the importance of cold/dry advection from the subtropical anticyclones for explaining the climatological existence of the Walker circulation. Furthermore, we demonstrate the importance of water vapor and cloud feedbacks in amplifying the perturbation that creates the Walker circulation.

Our results show that the canonical coupled air-sea framework of the Walker circulation is incomplete, and that land-driven atmospheric teleconnections play a fundamental role in setting up the climatological Walker circulation.

How to cite: Günther, M. and Kang, S. M.: Revisiting the origin of the Walker circulation: the importance of land, EGU General Assembly 2026, Vienna, Austria, 3–8 May 2026, EGU26-5907, https://doi.org/10.5194/egusphere-egu26-5907, 2026.

Radiative transfer lies at the heart of Earth's climate system, governing the fundamental energy balance that drives atmospheric circulation and the hydrological cycle. Yet idealized climate models often use gray radiation schemes, which ignore the spectral nature of light. These schemes are easy to use and simple to understand, but this simplicity comes at a cost: gray radiation fundamentally distorts the large-scale atmospheric circulation and its response to climate change. 

Using an idealized aquaplanet GCM with a hierarchy of radiation schemes, I show that gray radiation produces a tropopause that is too low, a subtropical jet that is displaced equatorward, and a Hadley Cell that is too weak. Under warming, gray radiation underestimates tropical upper-tropospheric amplification and produces unrealistic changes in jet structure and Hadley Cell strength.

I then introduce the “Simple Spectral Model” (SSM), a radiation scheme which represents the spectral nature of greenhouse gas absorption using simple, analytic fits. This scheme is simple and easy to understand (like gray radiation), but faithfully represents the spectral nature of radiative transfer. I show that this scheme alleviates the significant circulation biases associated with gray radiation, and provides a more accurate picture of the response of the large-scale atmospheric circulation to warming. This work demonstrates that radiative transfer is not merely a "detail" in climate modeling, but that it fundamentally shapes the atmospheric circulation.

How to cite: Williams, A. I. L.: How radiative transfer assumptions shape the large-scale atmospheric circulation and its response to warming, EGU General Assembly 2026, Vienna, Austria, 3–8 May 2026, EGU26-5953, https://doi.org/10.5194/egusphere-egu26-5953, 2026.

EGU26-6613 | ECS | Orals | CL4.2

The latent heating feedback on the midlatitude circulation in a warming world 

Henrik Auestad, Abel Shibu, Paulo Ceppi, and Tim Woollings

Midlatitude storms transport warm and moist air poleward and upward, releasing latent heat. Latent heating is thus organized by the
circulation but then modifies temperature gradients and winds, constituting a nonlinear feedback. We define the latent heating feedback
as the effects that arise from latent heating being coupled with the circulation. Because of its nonlinearity, the climatic effects of this
feedback are difficult to isolate and remain poorly understood.

By decoupling latent heating from the circulation in an atmospheric general circulation model, we show that the latent heating feedback
enhances storm track eddy diffusivity, modifying eddy heat fluxes beyond changes in mean baroclinicity. Simultaneously, tracked storms
occur at lower latitudes, intensify more, and propagate further poleward, while the subtropical jet strengthens as coupled latent heating
preserves lower latitude baroclinicity. The feedback response supports the idea that diabatic effects cause the “too zonal, too
equatorward” storm track biases in climate models.

Finally, we extend the analysis to climate change experiments where we isolate the contribution from the latent heating feedback on
storm intensity and eddy kinetic energy as the world warms. The feedback is most important in summer where it accounts for most of the
changes in eddy kinetic energy. In winter, the feedback is constrained. Isolating the latent heating
feedback helps to quantify how storminess changes as the atmosphere warms, which climate models currently struggle with.

How to cite: Auestad, H., Shibu, A., Ceppi, P., and Woollings, T.: The latent heating feedback on the midlatitude circulation in a warming world, EGU General Assembly 2026, Vienna, Austria, 3–8 May 2026, EGU26-6613, https://doi.org/10.5194/egusphere-egu26-6613, 2026.

EGU26-6707 | ECS | Orals | CL4.2

Recent summertime North American weather regime trends in a very large seasonal model ensemble 

Simon H. Lee and Lorenzo M. Polvani

Recurrent and persistent large-scale circulation patterns, known as weather regimes, are widely employed in operational medium-range and subseasonal prediction. However, they have been used less often in studies of long-term climate variability and change. Here, we use a recently defined year-round North American regime classification to identify trends in the summertime circulation from 1981 to 2024. We find large increases in the frequency, persistence and interannual variability of the Greenland High (GH) regime, which is similar to Greenland blocking and the negative summer North Atlantic Oscillation. Recent extremes include the summers of 2023, 2019 and 2016. A first-order Markov model shows that the increased GH frequency and interannual variability can arise from increased GH persistence.

The GH frequency trend resembles previously reported trends in summertime Greenland blocking, which are absent in uninitialised climate models but have been seldom analysed in initialised models. We therefore investigate whether the observed GH trends can be reproduced by SEAS5, ECMWF’s current operational seasonal prediction system. To do so, we construct a 10,000-member ensemble by randomly sampling a single member from the May initialisation each year from 1981 to 2024 and stitching them together to create 10,000 different time series.

Our results show that the very large SEAS5 ensemble fails to capture the observed trend in GH frequency because persistence trends are too weak. This occurs despite SEAS5 producing summers with more GH days and individual regimes more persistent than observed, so the issue is not simply an overall inability of the model to generate persistent regimes. Hence, the missing GH trends must arise from fundamental model deficiencies which develop on subseasonal timescales and are not rectified by initialisation. Our work adds to a growing body of literature showing the benefit of using seasonal model data to understand the development of climate model trend errors.

How to cite: Lee, S. H. and Polvani, L. M.: Recent summertime North American weather regime trends in a very large seasonal model ensemble, EGU General Assembly 2026, Vienna, Austria, 3–8 May 2026, EGU26-6707, https://doi.org/10.5194/egusphere-egu26-6707, 2026.

EGU26-6846 | ECS | Orals | CL4.2

Maintaining the North Atlantic storm track 

Rhiannon Biddiscombe

The maintenance of the storm tracks relies on maintaining the baroclinic zones from which mid-latitude cyclones develop. By expressing baroclinicity (a standard measure of baroclinic growth) in terms of dry entropy and constructing an entropy budget for the North Atlantic storm track, we find that the climatological maintenance of the storm track is due to large-scale advective processes in the free troposphere. We find the most important factor contributing to the maintenance of the baroclinic zone to be the import of cold continental air from North America towards the storm track, characterised by the zonal advection of lower entropy air masses. For eddy timescales, however, these advective processes weaken baroclinicity as they are dominated by the growth of weather systems. Our findings suggest that local diabatic effects, dominated by latent heating, are of secondary importance and may even damp the strength of the baroclinicity on average.

Our results indicate that the storm track in the N. Atlantic is essentially governed by the “discharging condenser” mechanism proposed by Jerome Namias in 1950. In that picture, the diabatic effects ultimately responsible for the maintenance of the N. Atlantic storm track are remote rather than local.

Namias, J. 1950. The index cycle and its role in the general circulation, Journal of Atmospheric Sciences 7, no. 2,
130 –139.

How to cite: Biddiscombe, R.: Maintaining the North Atlantic storm track, EGU General Assembly 2026, Vienna, Austria, 3–8 May 2026, EGU26-6846, https://doi.org/10.5194/egusphere-egu26-6846, 2026.

EGU26-7405 | Orals | CL4.2

Enhanced weather persistence due to amplified Arctic warming 

Rune Grand Graversen, Rachel White, and Timo Vihma

Changing weather is an aspect of global warming potentially constituting a major challenge for humanity in the coming decades. Some climate models indicate that, due to global warming, future weather will become more persistent, as regard surface-air temperature anomalies lasting longer. However, to date, an observed change in weather persistence has not been robustly confirmed. Here we show that weather persistence in terms of temperature anomalies, across all weather types and seasons, has increased during recent decades in the Northern Hemisphere mid-latitudes.

This persistence increase is linked to Arctic temperature amplification – the Arctic warming faster than the global average – and hence global warming. The Arctic amplification weakens the meridional geopotential-height gradient at 500 hPa, which, through geostrophic balance and the thermal wind relation, leads to a reduction of the westerly zonal mass flow (density-weighted zonal winds integrated through the atmosphere) in the northern midlatitudes. The westerly atmospheric mass flow helps transport weather systems such as cyclones and other weather anomalies. Hence, when the background flow reduces, the transport of weather systems slows, and the local weather tends to become more persistent.

Persistent weather may lead to extreme weather, and for many plants such as crops, weather persistence can be devastating, as these plants often depend on weather variations. Hence, our results call for further investigation of weather-persistence impact on extreme weather, biodiversity, and the global food supply.

Graversen, R.G., White, R.H. & Vihma, T. Enhanced weather persistence due to amplified Arctic warming. Commun Earth Environ 6, 997 (2025). https://doi.org/10.1038/s43247-025-03050-1

How to cite: Graversen, R. G., White, R., and Vihma, T.: Enhanced weather persistence due to amplified Arctic warming, EGU General Assembly 2026, Vienna, Austria, 3–8 May 2026, EGU26-7405, https://doi.org/10.5194/egusphere-egu26-7405, 2026.

EGU26-7436 | Orals | CL4.2

Quantifying the Inter-Model Uncertainty of Extreme Extratropical Cyclones in the North Atlantic winter in a Warming Climate  

Lara C. Mercier, Hilla Afargan Gerstman, Matthew D.K. Priestley, Jens H. Christensen, and Daniela I.V. Domeisen

Extratropical cyclones (ETCs) are the primary drivers of severe weather over the North Atlantic, yet projections of changes in the intensity of the most
extreme storms under climate change remain highly uncertain. This study investigates inter-model uncertainty in future climate projections of extreme cyclones in winter, arising from competing processes of reduced midlatitude baroclinicity and enhanced moisture availability. We assess their contributions to projected changes in extreme cyclone intensity.

We analyze the future changes in the most intense 100 ETCs in winter across 13 CMIP6 models under the highest forcing scenario (SSP5-8.5; 2070–2100 vs 1980–2010), using 850 hPa vorticity tracking and cyclone-centered composites of precipitation, near-surface temperature gradients, and surface winds. Our results show that the majority of models project an intensification of the most intense cyclones in the North Atlantic, relative to the historical runs, with an increase in precipitation associated with extratropical cyclones in 11 out of 13 models. Near-surface meridional temperature gradients, however, exhibits a weakening in 9 out of 13 models, reflecting reduced low-level baroclinicity.

Furthermore, surface wind projections reveal no clear consensus, with half of the models projecting strengthening and half projecting weakening of surface winds. In addition, 7 out of 13 models project an eastward shift in peak intensity towards northwestern Europe, while latitudinal changes lack a robust pattern.

Our results show that projected intensification of extreme North Atlantic cyclones in terms of vorticity is accompanied by robust thermodynamic sig-
nals, with intensified precipitation in most models despite weakened near-surface meridional temperature gradient. In contrast, the associated surface wind response shows large inter-model variability, with no consistent change across models, highlighting the need for further assessment of surface wind projections.

How to cite: Mercier, L. C., Afargan Gerstman, H., Priestley, M. D. K., Christensen, J. H., and Domeisen, D. I. V.: Quantifying the Inter-Model Uncertainty of Extreme Extratropical Cyclones in the North Atlantic winter in a Warming Climate , EGU General Assembly 2026, Vienna, Austria, 3–8 May 2026, EGU26-7436, https://doi.org/10.5194/egusphere-egu26-7436, 2026.

EGU26-7616 | ECS | Posters on site | CL4.2

Projected Changes in Northern Hemisphere Weather Regimes Using a Deep Learning–Based Classification Approach 

Abdellah bizdaz, Christoph Jacobi, Dörthe Handorf, and Sina Mehrdad

The accelerated warming of the Arctic relative to the rest of the globe has sparked ongoing debate about its influence on Northern Hemisphere atmospheric circulation. Many studies suggest that this warming may alter large-scale circulation through changes in temperature gradients, storm tracks, and planetary wave dynamics. From a weather regime perspective, which describes preferred and recurrent large-scale circulation patterns, this study investigates the projected changes in Northern Hemisphere atmospheric circulation across different seasons. First, the ability of CMIP6 models to reproduce observed circulation regimes is evaluated against ERA5 reanalysis. We then assess the projected response of these regimes under climate change scenarios in terms of their frequency of occurrence and persistence. The analysis focuses on mean sea level pressure and applies a physically informed convolutional autoencoder combined with k-means clustering. This data-driven climate classification workflow uses unsupervised deep learning to reduce the dimensionality of spatiotemporal climate simulation data into compact representations.

Results show that CMIP6 models generally reproduce the main Northern Hemisphere circulation patterns and their seasonal behavior, particularly in winter and spring, although performance varies among models. The ensemble mean slightly underestimates the amplitude of mean sea level pressure anomalies in all seasons, most notably in summer. Despite this bias, the main circulation patterns and their seasonal characteristics are reasonably well reproduced. Based on this present-day evaluation, projections toward the end of the twenty-first century indicate that changes in regime frequency are stronger and more robust under SSP5-8.5. Zonal regimes, such as the NAO+ pattern, as well as regimes associated with negative pressure anomalies over the Arctic, tend to become more frequent, in agreement with previous studies, while blocking regimes exhibit a systematic decline under warming. Finally, the weather regime framework provides the basis for an ongoing investigation of the associated impacts of projected circulation shifts on the regional climate system.

How to cite: bizdaz, A., Jacobi, C., Handorf, D., and Mehrdad, S.: Projected Changes in Northern Hemisphere Weather Regimes Using a Deep Learning–Based Classification Approach, EGU General Assembly 2026, Vienna, Austria, 3–8 May 2026, EGU26-7616, https://doi.org/10.5194/egusphere-egu26-7616, 2026.

EGU26-7676 | ECS | Posters on site | CL4.2

Meteorological Controls on Air Pollution in India 

Ashish Dwivedi and Saroj Kanta Mishra

This study examines the large-scale circulation and thermodynamic anomalies associated with extreme air pollution events over India using a composite analysis based on detrended PM₂.₅ data. High- and low-pollution episodes are identified from monthly anomalies in near-surface air quality, and composites are constructed to reveal consistent dynamical and thermodynamic patterns. During high-pollution periods, anomalous upper-tropospheric anticyclonic circulation and positive height anomalies are observed, accompanied by suppressed vertical motion and warming, which inhibit ventilation and favor pollutant accumulation. In contrast, low-pollution events exhibit enhanced upper-level divergence, stronger ascent, and cooling throughout the troposphere, supporting efficient dispersion and wet removal of aerosols. The divergence and vertical velocity fields highlight the role of weakened overturning circulation and reduced convection in modulating stagnant conditions. Analysis of moist static energy (MSE) further distinguishes polluted and clean regimes: elevated MSE during high-pollution periods indicates enhanced stability and reduced convective potential, while lower MSE during cleaner phases reflects greater instability and active vertical exchange that promotes pollutant removal. At the surface, positive sea-level pressure anomalies and weakened low-level winds limit horizontal ventilation, whereas negative pressure anomalies and intensified winds enhance dispersion. Overall, the results highlight that large-scale circulation and thermodynamic variability strongly modulate monthly air pollution extremes over India. The detrended composite effectively isolates meteorological drivers, offering clearer insight into the processes governing severe pollution episodes.

How to cite: Dwivedi, A. and Mishra, S. K.: Meteorological Controls on Air Pollution in India, EGU General Assembly 2026, Vienna, Austria, 3–8 May 2026, EGU26-7676, https://doi.org/10.5194/egusphere-egu26-7676, 2026.

EGU26-7887 | ECS | Orals | CL4.2

Dynamical Axisymmetric Modes of the Hadley Circulation 

João B. Cruz, Carlos C. DaCamara, and José M. Castanheira

The Hadley circulation is the primary large-scale meridional circulation in the tropics and is conventionally seen as axisymmetric. However, meridional dynamics in the tropics are far from zonally uniform and recent developments have highlighted the importance of contributions from regional and time confined meridional overturning circulations to the global Hadley regime.

In the present work, we decompose the Hadley circulation into axisymmetric modes (AMs) which retain the linearized dynamics of an axisymmetric atmospheric circulation. Such modes are the normal mode solutions of the linearized axisymmetric equations of horizontal atmospheric motion, which coincide with the zonal wavenumber zero (k = 0) normal mode solutions to the linearized equations of horizontal atmospheric motion (Laplace tidal equations). We propose a method for the decomposition into AMs which draws similarities to previously developed local identification methods for equatorial waves ([1] and [2]).

The diagnostic potential of the decomposition is shown by analysing the preferred AMs of the Hadley circulation and recalling their physical underpinnings. In the literature, axisymmetric theory and constraints are frequently employed in the study of zonally confined meridional circulations ([3]). Therefore, we also analyse the validity and applicability of the decomposition into AMs in the case of zonally confined regional overturning circulations. Our work aims to be a contribution to the study of different regional meridional overturning regimes and the analysis of the regional contributions to the global Hadley circulation.


References:

[1] Cruz, J.B., Castanheira, J.M. & DaCamara, C.C. (2024) Local identification of equatorial Kelvin waves in real-time operational forecasts. Quarterly Journal of the Royal Meteorological Society, 150(761), 2440–2457. https://doi.org/10.1002/qj.4717

[2] Cruz, J.B., DaCamara, C.C. & Castanheira, J.M. (2025) Local identification of equatorial mixed Rossby–gravity waves. Quarterly Journal of the Royal Meteorological Society, 151(770), e4978. https://doi.org/10.1002/qj.4978

[3] Geen, R., Bordoni, S., Battisti, D. S., & Hui, K. (2020). Monsoons, ITCZs, and the concept of the global monsoon. Reviews of Geophysics, 58, e2020RG000700. https://doi.org/10.1029/2020RG000700


This work is supported by FCT, I.P./MCTES through national funds (PIDDAC): LA/P/0068/2020- https://doi.org/10.54499/LA/P/0068/2020 , UID/50019/2025, https://doi.org/10.54499/UID/PRR/50019/2025 , UID/PRR2/50019/2025, UID/50017/2025 (doi.org/10.54499/UID/50017/2025) and LA/P/0094/2020 (doi.org/10.54499/LA/P/0094/2020).

How to cite: B. Cruz, J., C. DaCamara, C., and M. Castanheira, J.: Dynamical Axisymmetric Modes of the Hadley Circulation, EGU General Assembly 2026, Vienna, Austria, 3–8 May 2026, EGU26-7887, https://doi.org/10.5194/egusphere-egu26-7887, 2026.

Wintertime variability of both the strength of the jet stream and the North Atlantic Oscillation (NAO) index are known to be significantly correlated on the decadal scale and have positive trends since the 1960s which have been recently proposed to be connected to anthropogenic global warming (Blackport and Fyfe, 2022). At the same time there is a rich literature explaining both the observed variability and also the discrepancy with circulation models in which the variability is usually much smaller. The North Atlantic sector is known to be the nexus of the so called signal-to-noise paradox in climate modelling (Scaife and Smith, 2018) with models underestimating the interdecadal variability in both atmospheric circulation (NAO) and ocean temperatures (AMO/AMV) by an order of magnitude Smithe et al. 2020.

Scaife and Smith (2018) offer a selection of possible lacking processes causing this problem: (“lack of extratropical ocean–atmosphere coupling, weak eddy feedback in current resolution models, errors in remote teleconnections, or errors in parameterized processes such as atmospheric convection”. On the other hand, it is well known that the pattern of SST values on the North Atlantic and the position of the Gulf Stream affect the value (and sign) of wintertime NAO (Hermoso et al. 2024). The covariation of the jet stream strength and NAO on the decadal time scale seen in observation data suggests that this coupling may be one of the most important missing factors, however the phenomenon itself may be too weak in the models, which is one of the hypotheses to be tested.

This study tries is a first step in trying to find spatial patterns of differences in decadal-scale variability of atmospheric circulation at different altitudes in the Atlantic sector between (observation data assimilating) climate reanalyses and (non-assimilating) CMIP 5 & 6 runs The aim is to pinpoint where and how they differ. This presentation shows the preliminary results of such analysis.


How to cite: Piskozub, J.: Is the coupling of the jet stream strength in the Atlantic sector and NAO too weak in the circulation models?, EGU General Assembly 2026, Vienna, Austria, 3–8 May 2026, EGU26-7965, https://doi.org/10.5194/egusphere-egu26-7965, 2026.

Internally inconsistent approximations made in the Community Atmosphere Model result in local violation of energy conservation to the rate of several hundreds of TW when integrated globally, comparable to the total power currently absorbed by the entire observed Earth System -- not just the atmosphere, which is probably absorbing about 1 TW.
This problem, which is not unique to CAM among CMIP-class atmosphere models, may cast doubts on its use for current projections of climate change.
Fortunately, once understood, it is easily resolved.
We show how, and compare simulations with good energy conservation with those currently used in CMIP7 integrations to clarify the impact of non-conservation on the results.

How to cite: Toniazzo, T.: Local and global energy conservation in the Community Atmosphere Model (CAM), EGU General Assembly 2026, Vienna, Austria, 3–8 May 2026, EGU26-11503, https://doi.org/10.5194/egusphere-egu26-11503, 2026.

EGU26-11941 | ECS | Orals | CL4.2 | Highlight

Reduced subseasonal variability of the North Atlantic jet stream due to climate change 

Andrea Vito Vacca, Jacob Perez, Katinka Bellomo, Jost von Hardenberg, and Amanda Maycock

The North Atlantic eddy-driven jet strongly shapes Euro-Atlantic weather and climate.  Its variability at subseasonal tiemescales is linked with regional storm tracks, atmospheric blocking, European weather and the occurrence of extreme events. However, how this variability responds to climate change has not yet been explored. Here, we use a novel jet diagnostic method to show that over the past 75 years, wintertime subseasonal variability in jet latitude and tilt has declined by 18% and 14%, respectively. Climate models indicate part of the reduction in jet variability is due to external forcing, although they tend to underestimate its magnitude. Models further project a continuous decline in jet variability throughout the 21st century under global warming. These findings reveal a robust response of the North Atlantic large-scale atmospheric circulation to climate change, and contribute to the growing body of evidence of a too low signal-to-noise in current climate models, with implications for current and future European weather predictability.

How to cite: Vacca, A. V., Perez, J., Bellomo, K., von Hardenberg, J., and Maycock, A.: Reduced subseasonal variability of the North Atlantic jet stream due to climate change, EGU General Assembly 2026, Vienna, Austria, 3–8 May 2026, EGU26-11941, https://doi.org/10.5194/egusphere-egu26-11941, 2026.

EGU26-12553 | ECS | Orals | CL4.2

Diabatic processes on synoptic timescales drive variability in midlatitude storm tracks 

Andrea Marcheggiani, Helen Dacre, Clemens Spensberger, and Thomas Spengler

The storm tracks along the two main western boundary currents, the Kuroshio-Oyashio and Gulf Stream, are an integral feature of the Northern Hemisphere climate. Even though diabatic processes play a fundamental role in the evolution of storm tracks, especially related to the enhanced water cycle along sea surface temperature fronts, our theoretical understanding of the impact of moist dynamic processes is still incomplete. To shed light on the relative importance of diabatic effects on storm tracks, we quantify diabatic and adiabatic contributions to variations in baroclinicity using a framework based on isentropic slope tendencies.

We reveal a dichotomy in the maintenance of baroclinicity between the near-surface and free troposphere. Specifically, changes in baroclinicity due to adiabatic and diabatic processes have opposite phases with adiabatic depletion preceding diabatic generation of baroclinicity in the near-surface, while diabatic generation precedes adiabatic depletion in the free troposphere.

In the near-surface troposphere, cold air outbreaks (CAOs) are the primary contributors to variability in baroclinicity, while outside of CAOs variability is significantly weaker and largely incoherent with the overall near-surface variability. In the free troposphere, on the other hand, most of the variability in baroclinicity is attributable to extra-tropical cyclones and fronts. Despite their limited areal extent, they explain more than half the total variance in baroclinicity. The contribution to total variability from atmospheric rivers is small, indicating that the presence of moisture alone does not necessarily translate into diabatic production of baroclinicity in the absence of a mechanism for ascent.

How to cite: Marcheggiani, A., Dacre, H., Spensberger, C., and Spengler, T.: Diabatic processes on synoptic timescales drive variability in midlatitude storm tracks, EGU General Assembly 2026, Vienna, Austria, 3–8 May 2026, EGU26-12553, https://doi.org/10.5194/egusphere-egu26-12553, 2026.

Subtropical land regions are projected to experience drying under increasing greenhouse gas concentrations due to widening of the tropical circulation. The magnitude and mechanisms of this response vary strongly across different regions. Using an idealised set-up for an atmospheric general circulation model coupled to a slab ocean, we investigate how the latitudinal position of a simplified square subtropical continental land mass influences the formation, extent and CO2 sensitivity of continental dry zones (CDZ). For all land positions, a continental dry zone emerges on the equatorward side of the land mass in boreal summer, extending significantly further poleward than the zonally symmetric edge of the Hadley cell. The poleward extent of the emerging CDZ is consistently constrained to a narrow latitude band in which subtropical subsidence weakens and midlatitude eddy activity increases. The amount of CDZ widening under CO2 increase strongly depends on the type of climatic dry zone established over land. Land configurations that produce persistent all-year round arid, continental-type dry climates exhibit weak sensitivity to circulation changes, while Mediterranean-type dry climates show enhanced dynamical drying associated with poleward CDZ expansion. These results provide a unifying framework for understanding why robust subtropical land drying in observations and projections is confined to very specific regions. The importance of differentiating continental dry zones by their climate regime is highlighted, underlining the heightened sensitivity of Mediterranean-type dry climates to circulation-driven drying under climate change. 

How to cite: Doerfler, N. and Levermann, A.: Square Island on Aqua Planet: mechanisms of expansion of subtropical continental dry zones under CO2 increase, EGU General Assembly 2026, Vienna, Austria, 3–8 May 2026, EGU26-12676, https://doi.org/10.5194/egusphere-egu26-12676, 2026.

Double Jets (DJ) refer to a specific configuration of the large-scale atmospheric circulation in which the Northern Hemisphere polar and subtropical jets occur as two clearly separated branches. European heatwave trends have been linked to an increased persistence of Eurasian DJs (Rousi et al. Nat. Comms. 2022). However, it remains unclear to what extent observed trends are anthropogenically forced or associated with internal variability. A central necessity to answer this question is the ability of climate models to reproduce central DJ properties and their association with surface anomalies.

Based on models from the sixth phase of the Coupled Model Intercomparison Project (CMIP6), we provide first insights into model representation of DJ characteristics. Our findings show that most models qualitatively capture the structural configuration of the DJs, while systematically underestimating the magnitude of the polar jet branch by approximately 35%.We further demonstrate that this response is associated with an underestimation of the high-latitude (60°N–90°N) meridional temperature gradient across models, where models with weaker gradients exhibit weaker winds, in line with the thermal wind relation. Crucially, this underestimated polar jet intensity acts as a dynamical constraint, causing models to underestimate the cumulative heatwave intensity over Western Europe by approximately 30%.

Finally, by extending our analysis to future projections (2021–2100)  under the SSP3-7.0 scenario we reveal a transition toward a weakened DJ regime. Our work highlights the need for improved representation of DJ characteristics and their coupling with heat extremes in climate models to enhance our confidence in future heat risk projections.

How to cite: Liu, S., Tian, Y., and Kornhuber, K.: Double Jet circulation regimes and their association with Western European Heatwaves in present and future climates, EGU General Assembly 2026, Vienna, Austria, 3–8 May 2026, EGU26-13168, https://doi.org/10.5194/egusphere-egu26-13168, 2026.

EGU26-13451 | ECS | Posters on site | CL4.2

An in-depth analysis of the North Pacific storm track bias in CESM2-LENS 

Nora Zilibotti, Heini Wernli, and Sebastian Schemm

Earth system models are widely used to make projections not only about the mean atmospheric state under climate warming, but also about the circulation on synoptic to seasonal timescales and their related weather extremes. However, the statistics and characteristics of synoptic weather systems, such as extratropical cyclones, exhibit substantial biases relative to observations and reanalysis data. Although model resolution and the representation of moist processes have been pinpointed as important contributors to these biases, the exact pathway by which they affect the cyclone evolution and the coupling between the surface and upper-level flow needs further investigation.

Here, we present a spectral analysis that reveals pronounced biases in the extratropical upper-level kinetic energy, especially at the upper end of synoptic scales, when comparing Community Earth System Model version 2 large ensemble simulations (CESM2-LENS) to ERA5. Focusing on the North Pacific storm track, we show that upper-level eddy kinetic energy (EKE) is underestimated by up to 30% and upper-level forcing as measured by QG omega forcing is reduced in CESM2. In addition, we observe differences in the vertical structure of diabatic heating between CESM2 and ERA5. CESM2 exhibits weak and permanent heating in the planetary boundary layer, whereas ERA5 shows more intermittent, localised heating that extends further into the free troposphere. We discuss possible relationships between these biases and cyclone properties in the North Pacific storm track. This provides a pathway by which model biases in both the upper and lower levels can influence the structure and evolution of extratropical cyclones, potentially amplifying upper-level errors.

How to cite: Zilibotti, N., Wernli, H., and Schemm, S.: An in-depth analysis of the North Pacific storm track bias in CESM2-LENS, EGU General Assembly 2026, Vienna, Austria, 3–8 May 2026, EGU26-13451, https://doi.org/10.5194/egusphere-egu26-13451, 2026.

EGU26-13927 | Orals | CL4.2

Monthly CAPE generation rates predict tropical precipitation. 

Monica Figueroa, Robert Fajber, and Yi Huang

Predicting the spatial distribution, intensity, and variability of tropical precipitation is important in the context of present and future climate change. However, climate models have consistently failed to simulate tropical precipitation correctly, even as their resolution has progressively improved (Tian and Dong, 2020). Convective Available Potential Energy (CAPE) is a measure of the amount of buoyant energy usable by convection. Inspired by convective quasi-equilibrium theory (Arakawa, 1974), we test whether the rate of CAPE generation is a good indicator of tropical precipitation in the past four decades of the Japanese Reanalysis for Three Quarters of a CenturyWe find that CAPE generation predicts the spatial distribution and intensity of observed tropical precipitation significantly better than CAPE itself, as well as precipitation trends and extreme seasonal precipitation. CAPE generation is therefore a good proxy to study convective events which are too small to be directly simulated at the resolution of climate models. Further, we decompose the physical sources of buoyancy generation and find that local evaporation is the main energy source in the tropical rainbands, and surprisingly, heat and moisture convergence play a minor role in providing buoyancy for convection. Based on these conclusions, it may be more useful to study air-sea fluxes and local evaporation as a key to improving climate precipitation simulations. 

How to cite: Figueroa, M., Fajber, R., and Huang, Y.: Monthly CAPE generation rates predict tropical precipitation., EGU General Assembly 2026, Vienna, Austria, 3–8 May 2026, EGU26-13927, https://doi.org/10.5194/egusphere-egu26-13927, 2026.

EGU26-14250 | Orals | CL4.2

Enhanced Highland Warming Intensifies Midlatitude Moist Heat and Convection 

Talia Tamarin Brodsky and Funing Li

Extreme heat events and severe convective storms are among the leading causes of weather-related damages in North America (NA). Under climate change, western NA highlands experience a faster rise in extreme near-surface temperatures, while central and eastern NA show stronger amplification of moist heat and convective activity. In recent theoretical work, we showed that low-level energy inversions significantly contribute to the buildup of near-surface moist heat and convection in the midlatitudes. Here, we demonstrate using CMIP6 simulations that future intensification of extreme moist heat over central NA is associated with substantial warming upstream over high terrains, which is advected eastward by strong westerlies, enhancing downstream low-level energy inversions. The projected increase in inversion strength provides a tight upper bound for the projected increase in near-surface moist heat. We further validate these findings through a General Circulation Model (GCM) experiment in which eliminating elevated heating over western high terrains substantially reduces extreme moist heat and convective instability across eastern NA. Our findings identify elevated heating and low-level inversions as critical drivers of compound heat-convection risks, offering new insights into the mechanisms and projected changes of midlatitude extreme weather.

How to cite: Tamarin Brodsky, T. and Li, F.: Enhanced Highland Warming Intensifies Midlatitude Moist Heat and Convection, EGU General Assembly 2026, Vienna, Austria, 3–8 May 2026, EGU26-14250, https://doi.org/10.5194/egusphere-egu26-14250, 2026.

EGU26-15850 | ECS | Posters on site | CL4.2

Simulated Southern Hemisphere Response in the PlioMIP3 Ensemble: A Preliminary Analysis 

Paul Gravis, Josephine Brown, Christian Stepanek, and Russell Drysdale

The Pliocene Model Intercomparison Project (PlioMIP) provides model ensemble results to various forcings associated with the Pliocene. Here we investigate the response in the Southern Hemisphere of the large-scale climate features in the PlioMIP3 ensemble, e.g. the strength of the Hadley Cell, changes in the westerly winds, and possible mechanisms for their response, e.g. increased stability in the atmosphere, changes in convection sites, and ocean temperature anomaly response, for instance. In addition, the interconnection between features is explored. With PlioMIP at (or nearing) the end of its submission stage for phase three (PlioMIP3) this presentation will provide a first look at the response in the Southern Hemisphere, comprising the tropics through to the mid-latitudes.

How to cite: Gravis, P., Brown, J., Stepanek, C., and Drysdale, R.: Simulated Southern Hemisphere Response in the PlioMIP3 Ensemble: A Preliminary Analysis, EGU General Assembly 2026, Vienna, Austria, 3–8 May 2026, EGU26-15850, https://doi.org/10.5194/egusphere-egu26-15850, 2026.

EGU26-15986 | ECS | Orals | CL4.2

Does ENSO set the footprint of extreme rainfall? Insights from dynamical eddy length scales 

Akash Devgan and Akshaya Nikumbh

The spatial footprint of extreme rainfall events (EREs) governs the extent of affected regions and strongly influences flood severity and socio-economic impacts. While changes in the intensity of precipitation extremes are relatively well understood, a robust physical framework for characterising their spatial scales remains lacking. In particular, it is unclear to what extent large-scale dynamical constraints regulate the size of extreme precipitation systems if they. In this study, we investigate whether the theoretical eddy length scale, specifically the Rhines scale and the Rossby radius of deformation, can provide a physical basis for understanding the spatial extent of EREs during ENSO. We examine whether variations in these length scales are reflected in observed changes in ERE size during  El Niño–Southern Oscillation (ENSO), which is known to modulate the large-scale background flows. By stratifying EREs according to ENSO phase, we assess how changes in the background circulation during ENSO influence the relationship between eddy length scales and the spatial footprint of extreme rainfall. This work would provide a dynamical framework linking large-scale atmospheric eddy scales to precipitation extreme size. Results to be presented at the conference will discuss on the extent to which theoretical length scales constrain ERE spatial organisation and how these constraints vary across ENSO phases, with implications for understanding and projecting flood risk under climate variability.

How to cite: Devgan, A. and Nikumbh, A.: Does ENSO set the footprint of extreme rainfall? Insights from dynamical eddy length scales, EGU General Assembly 2026, Vienna, Austria, 3–8 May 2026, EGU26-15986, https://doi.org/10.5194/egusphere-egu26-15986, 2026.

EGU26-16173 | ECS | Posters on site | CL4.2

The Role of ENSO in Modulating the Tropical Upper Tropospheric Humidity 

Devika Moovidathu Vasudevan, Ajil Kottayil, and Viju O John

Upper tropospheric water vapour plays a crucial role in the climate system by providing a strong positive feedback, particularly in the tropics. Upper Tropospheric Humidity (UTH) is strongly linked to large-scale atmospheric circulation, including the Hadley and Walker circulations, which undergo pronounced modulation during El Niño–Southern Oscillation (ENSO) events. In this study, we examine ENSO-related changes in the tropical distribution of UTH using long-term climatological datasets of UTH and sea surface temperature (SST). Significant upper-tropospheric drying (moistening) during El Niño (La Niña) years is observed over the Maritime Continent, the western Pacific, and the Indian subcontinent. These UTH anomalies are accompanied by corresponding negative (positive) anomalies in precipitation and upper-level cloud fractions, indicating a strong coupling between UTH and tropical convection. However, the statistical significance of these signals over the Indian subcontinent is limited, suggesting that ENSO influences UTH over India indirectly, likely mediated by regional circulation and monsoon dynamics. Overall, our results highlight ENSO as a key driver of tropical UTH variability through its impact on atmospheric circulation and convection.

How to cite: Moovidathu Vasudevan, D., Kottayil, A., and O John, V.: The Role of ENSO in Modulating the Tropical Upper Tropospheric Humidity, EGU General Assembly 2026, Vienna, Austria, 3–8 May 2026, EGU26-16173, https://doi.org/10.5194/egusphere-egu26-16173, 2026.

EGU26-16925 | ECS | Orals | CL4.2

Impact of Jet Stream Orientation on Northern Hemisphere Winter Storm Activity 

Or Hadas and Yohai Kaspi

The Pacific and Atlantic storm tracks are regions of enhanced storm activity that shape the Northern Hemisphere climate. According to the basic theory, stronger jet-streams should be associated with more intense storm activity. However, despite the Pacific jet being stronger in winter, storms over the Atlantic are more intense, a puzzling observation that has long challenged our understanding of midlatitude climate. Here, we address this paradox by analyzing how differences in jet orientation influence its interaction with midlatitude storms (cyclones). Using 84 years of ERA-5 data and tracks of all winter storms over this period (and JRA-3Q for validation), we show that the Pacific jet's zonally elongated structure forces storms to exit high jet intensity regions rapidly. Conversely, the Atlantic jet's tilted orientation aligns with the storms' trajectories, enabling storms to remain in high-intensity jet regions for extended periods. Lagrangian-Energetic analyses reveal that while Pacific storms exhibit rapid initial growth, over the Atlantic, prolonged exposure to strong jets drives greater energy extraction, resulting in storms that reach higher peak intensities and sustain their strength for longer durations. These findings reconcile the observed Northern Hemisphere winter storm track activity with basic theory, suggesting a new explanation for this long-standing question and underscoring the importance of capturing individual storm dynamics within the climate system to advance our understanding of present-day and future climates.

How to cite: Hadas, O. and Kaspi, Y.: Impact of Jet Stream Orientation on Northern Hemisphere Winter Storm Activity, EGU General Assembly 2026, Vienna, Austria, 3–8 May 2026, EGU26-16925, https://doi.org/10.5194/egusphere-egu26-16925, 2026.

The western Pacific (WP) pattern, North Pacific Oscillation (NPO), and the Pacific-North American (PNA) pattern are dominant teleconnection patterns over the wintertime North Pacific, which are characterized by a meridional dipole of height anomalies. To comprehensively understand why these patterns are dominant, our previous study systematically extracted 286 meridional teleconnection patterns anchored at various locations spanning the basin from monthly mean fields and investigated the energetics for each of the patterns. The study quantitatively revealed that patterns that efficiently gain kinetic energy (KE) and available potential energy (APE) through the energy conversion from the climatological mean state and high-frequency eddies tend to have larger total energy (KE+APE), which explains the dominance of the specific teleconnection patterns. In addition, we found baroclinic energy conversion from the climatological mean field is the most efficient process for the maintenance of almost all the patterns, arising from the vertically phase-tilted height anomalies embedded in the baroclinic climatological mean state.

This result implies that the dominance of a pattern could change under different background states. The present study further investigated changes in energetics of the systematically extracted 286 teleconnection patterns under global warming through a comparison between d4PDF historical and +4K experiments. We found an increase in the total energy associated with patterns whose node lines are located at 35°N, including the PNA pattern, in the warmer climate, while an energy decrease is found for the patterns with node lines at 45°N, including the WP pattern and NPO. These energy changes are highly correlated with the changes in the net energy conversion efficiency. Changes in barotropic and baroclinic energy conversion efficiencies from the climatological mean state are the primary cause of the net efficiency changes, and those can be explained partly by structural changes in the background Pacific jet and decreased horizontal temperature gradients associated with Arctic amplification and more enhanced warming over land than over the ocean. Moreover, baroclinic conversion efficiency decreases for almost all the patterns due to the changes in the vertical structure of circulation anomalies and the background temperature field. These results provide clues for the mechanisms of the magnitude changes in the meridional teleconnection patterns and implications for the potential predictability in the warmer climate.

How to cite: Satoh, R. and Kosaka, Y.: Changes in Wintertime North Pacific Meridional Teleconnection Patterns due to Global Warming: An Energetics Perspective, EGU General Assembly 2026, Vienna, Austria, 3–8 May 2026, EGU26-17106, https://doi.org/10.5194/egusphere-egu26-17106, 2026.

EGU26-17438 | Orals | CL4.2

A weather feature perspective on jet dynamics 

Thomas Spengler, Clemens Spensberger, Kjersti Konstali, Henrik Auestad, Andrea Marcheggiani, and Orli Lachmy

When decomposing the atmospheric flow into a basic state and perturbations, the perturbations are generally interpreted as the contribution from chaotic non-linear weather. We explore the link between day-to-day weather and the climatological zonal mean perspective on zonal momentum in more detail by systematically linking eddy momentum fluxes to weather events. Specifically, we first decompose the full momentum flux divergence into contributions from mean flow and perturbations both in the time and zonal direction as well as their combinations, and then systematically relate synoptic jets, cyclones, and Rossby wave breaking events to the instantaneous momentum fluxes. We thus construct a step-by-step link between the time-zonal mean perspective on momentum flux convergence and the synoptic perspective.

With this approach, we show that both the time and zonal averaging are a residual of a large compensation of momentum flux convergence and divergence. In both dimensions, the mean must be regarded as a residual that is at least an order of magnitude smaller than the original signal. Further, a large fraction of eddy momentum flux convergence and divergence occurs in association with weather features, with synoptic jets alone accounting for 60-80% of the convergence from the subtropics throughout the mid-latitudes. Rossby wave breaking, on the other hand, only features less than 30% of the momentum flux convergence in the midlatitudes.

Finally, the attribution of the full-field momentum flux convergence is nearly indistinguishable from the attribution of eddy-momentum flux convergence, irrespective of whether the eddies are defined as perturbations in time, zonal direction, or the combination of both. The effect of stationary waves to the momentum fluxes is thus implicitly included in the selected transient weather events.

How to cite: Spengler, T., Spensberger, C., Konstali, K., Auestad, H., Marcheggiani, A., and Lachmy, O.: A weather feature perspective on jet dynamics, EGU General Assembly 2026, Vienna, Austria, 3–8 May 2026, EGU26-17438, https://doi.org/10.5194/egusphere-egu26-17438, 2026.

EGU26-19069 | ECS | Orals | CL4.2

Unlocking Dynamical Insights across the Model Hierarchy with Interpretable Machine Learning 

Arijeet Dutta, Ruth Geen, and Maike Sonnewald

Hierarchical modelling is a valuable tool, which has supported our understanding of, for example, controls on jet latitude, and the nature of monsoon circulations. However, it is not always clear if and how the insights developed in simpler models, such as aquaplanets, generalise to more realistic situations (e.g. CMIP or reanalysis). Here, we present a new, interpretable machine learning framework for translating dynamical insights across the model hierarchy, and show how this can develop our understanding of large-scale monsoon circulations.

Our goal is to identify dominant balances between terms in the governing equations, which characterise dynamical regimes. We identify these balances, both regionally and across the climatological year, at each stage in a model hierarchy. Our hierarchy comprises simulations with different levels of complexity in the lower boundary conditions, from aquaplanets up to reanalysis. This approach allows us to explore when, where, how and why different dynamical processes arise at each level in the model hierarchy, and to investigate how their extents and timings are altered by changes to model parameters.

Specifically, we employ NEMI, a pipeline previously applied to the vorticity budget of realistic ocean simulations. This pipeline uses UMAP to reduce the complexity of the selected equation into a low-dimensional latent space. Agglomerative hierarchical clustering, along with a combinatorial hypothesis selection algorithm, then facilitate partitioning and labelling the latent space into distinct dynamical regimes. Evaluating entropy, a measure of how consistently a sample is assigned to a given cluster, allows us to objectively choose appropriate hyperparameters, and also conveniently allows study of the regional and seasonal robustness of the different regimes identified.

We apply NEMI to the 200-hPa momentum budget, which has previously been used to study the Hadley cells in aquaplanets. We demonstrate how parallels to known regimes identified in aquaplanets can then be objectively studied in more complex datasets such as ERA5. Within the global tropics, in addition to angular momentum conserving/eddy-driven Hadley circulations, we identify regimes influenced by geostrophic balance and rotational flows. Implications for our understanding of the tropical circulation are discussed.

How to cite: Dutta, A., Geen, R., and Sonnewald, M.: Unlocking Dynamical Insights across the Model Hierarchy with Interpretable Machine Learning, EGU General Assembly 2026, Vienna, Austria, 3–8 May 2026, EGU26-19069, https://doi.org/10.5194/egusphere-egu26-19069, 2026.

EGU26-19328 | ECS | Posters on site | CL4.2

Past trends in near-cloud turbulence diagnosed from reanalysis data 

Chaoyue Lin and Paul Williams

Turbulence is the principal cause of in-flight bumpiness at cruise level, causing economic loss and threatening passenger safety. Following the growth of aviation transport, the impact of turbulence has become critical, making it necessary to investigate its response to climate change. This study will examine the historical frequencies of near-cloud turbulence (NCT), which is difficult to avoid because it is invisible to radar and satellites. Previous research has been scarce because cloud boundaries are ill-defined and multiple influencing mechanisms are involved. In this study will use the latest ERA5 reanalysis (1979-2024) and a dedicated parameterization. We examine global NCT climate trends across seven regions, four diagnostics, five turbulence-intensity bins and four seasons. At typical cruise altitudes, diagnosed NCT probabilities have risen in the mid-latitudes, most notably along heavily trafficked corridors over Europe, the North Atlantic, the North Pacific, and the south-western United States, with local relative increases reaching 100%. Conversely, probabilities have fallen in the tropics—especially over long-standing hotspots such as Southeast Asia and the Caribbean Sea. A lower occurrence rate, however, may signal fewer but deeper and more vigorous convective events, increasing the risk to commercial aviation. These findings in the tropics differ from earlier climate-model projections and should help refine future NCT forecasts, providing a fuller basis for assessing aviation exposure in a warming climate.

How to cite: Lin, C. and Williams, P.: Past trends in near-cloud turbulence diagnosed from reanalysis data, EGU General Assembly 2026, Vienna, Austria, 3–8 May 2026, EGU26-19328, https://doi.org/10.5194/egusphere-egu26-19328, 2026.

EGU26-21108 | ECS | Orals | CL4.2

The dynamics of extreme wave-activity events in a warming climate. 

Pragallva Barpanda and Camille Li

Climate change is projected to have wide ranging impacts on  atmospheric extreme events. However, it remains uncertain how a warming climate will influence the waviness of the jet stream and extreme wave-activity events in the midlatitude storm track. An objective identification of this phenomena is important as wave activity aloft plays an important role in driving the weather extremes over the continents. Here we use the local wave activity (LWA) metric to quantify stationary and transient wave activity during wintertime from multi-member ensembles of state-of-the-art climate model simulations including, NorESM, CESM-LENS2 and MPI-LE simulations for Historical and various SSP warming scenarios. Our analysis reveals a statistically significant decrease in the waviness of the jet stream and regional changes in the probability of extreme wave-activity events in the midlatitudes. These changes are found to be dynamically consistent with the theoretical predictions from the non-acceleration relation and the recently proposed traffic-jam theory of atmospheric blocking.

How to cite: Barpanda, P. and Li, C.: The dynamics of extreme wave-activity events in a warming climate., EGU General Assembly 2026, Vienna, Austria, 3–8 May 2026, EGU26-21108, https://doi.org/10.5194/egusphere-egu26-21108, 2026.

EGU26-1370 | ECS | Orals | CL3.1.1

Projecting Daily Extreme Heat Events in the Iberian Peninsula using Statistical Downscaling with 700, 500 and 300 Geopotential Fields 

Elsa Barrio, Zeus Gracia-Tabuenca, Jesús Asín, and Ana C. Cebrián

Global warming is evident in the extreme events (XE) of daily maximum temperature (Tx) in the Iberian Peninsula, but this behaviour is not fully explained by the mean evolution of temperature, Castillo-Mateo et al (2025). In this context, it is clear that projections of XE risk are required for future climates, and they must be obtained using methods specifically designed for extremes.

This work proposes a new statistical tool to obtain daily and local-scale projections for the occurrence of XE, defined as days with Tx above a pre-established threshold. First, the tool relies on a geostatistical model that links the occurrence of XE at each point of the study region with atmospheric covariates at different geopotential levels, taken from grid points in a surrounding area. Second, a selection of AR6 GCM trajectories is performed using criteria that account for (1) the reproduction of the daily frequency and persistence of weather types over the region, and (2) the reproduction of the empirical distribution of ERA atmospheric variables at the daily scale. Third, the projected values of the atmospheric covariates are used as inputs for the statistical model, allowing estimations of daily characteristics at both local and regional scales.

Model estimation is carried out using daily Tx data for 1960--2024 from 36 Spanish stations (European Climate Assessment& Dataset), for June-August. XE is defined by the 95th percentile of Tx for 1991--2020. Covariates consist of geopotential variables at 12 p.m. for pressure levels of 500 and 700 hPa, on a 1º x1º grid over the area 45º--35º N and 10ºW--5ºE, obtained from the ERA5 reanalysis. The statistical models achieve high goodness-of-fit, with AUC values above 0.8 for validation conditions at most stations.

Trajectories from 36 AR6 GCMs are analysed to select those that meet the criteria, and only six trajectories remain. Finally, projections for 2031--2060 are obtained for the Iberian Peninsula under different scenarios.

References

Castillo-Mateo, J., Gelfand, A.E., Gracia-Tabuenca, Z., Asín, J., Cebrián, A. C. (2025). Spatio-temporal modeling for record-breaking temperature events in Spain. Journal of the American Statistical Association, 120, 645-657.

How to cite: Barrio, E., Gracia-Tabuenca, Z., Asín, J., and Cebrián, A. C.: Projecting Daily Extreme Heat Events in the Iberian Peninsula using Statistical Downscaling with 700, 500 and 300 Geopotential Fields, EGU General Assembly 2026, Vienna, Austria, 3–8 May 2026, EGU26-1370, https://doi.org/10.5194/egusphere-egu26-1370, 2026.

The North Atlantic Oscillation (NAO) has been confirmed to be closely related to the weather and climate in many regions of the Northern Hemisphere; however, its effect and mechanism upon the formation of dust events (DEs) in China have rarely been discussed. By using the station observation dataset and multi­ reanalysis datasets, it is found that the spring dust aerosols (DAs) in North China (30-40° N, 105- 120° E), a non-dust source region, show high values with a strong interannual variability, and the spring DAs in North China are significantly correlated with the previous winter's NAO. According to the nine spring DEs affected significantly by the negative phase of the preceding winter's NAO in North China during 1980-2020, it is shown that before the outbreak of DEs, due to the transient eddy momentum (heat) convergence (divergence) over the DA source regions, the zonal wind speed increases in the upper-level troposphere, strengthening the zonal wind in the middle-lower levels through momentum downward transmission. Simultaneously, there is transient eddy momentum (heat) divergence (convergence) around the Ural Mountains, which is favorable for the establishment and maintenance of the Ural ridge, as well as the development of the air temperature and vorticity advections. The combined effects of temperature and vorticity advections result in the Siberian Highs and Mongolian cyclone to be established, strengthen, and move southward near the surface, guiding the cold air from high latitudes southward, and is favorable for the uplift and transmission of DAs to North China downstream. Simultaneously, the changes in upstream transient eddy flux transport can cause both energy and mass divergence in North China, resulting in diminishing winds during DEs, which would facilitate the maintenance of dust aerosols here and promote the outbreak of DEs. This study reveals the impact of transient eddy flux transport on the dusty weather anomalies modulated by the NAO negative signal in North China, which deepens the understanding of the formation mechanism of DEs in China.

How to cite: Li, Y.: Influence of the previous North Atlantic Oscillation (NAO) on the spring dust aerosols over North China, EGU General Assembly 2026, Vienna, Austria, 3–8 May 2026, EGU26-1779, https://doi.org/10.5194/egusphere-egu26-1779, 2026.

Keeping oscillation of low frequency of 30~60 days, Butterworth band-pass filter method was used to process the NCEP/NCAR reanalysis data. Based on the application of the low-frequency synoptic map, low frequency features of the two extreme low temperature events were analyzed in order to reveal the characteristics of the low frequency systems during these two events. The results show that in early 2008, large-scale atmospheric systems including blocking-high and upper-level jet stream all featured a distinct 30-60-day oscillation. The positive (negative) anomaly of geopotential height was closely coincided with the low frequency high (low) pressure of the low frequency systems, and the center of positive zonal wind anomaly was consistent with the high value center of low frequency zonal wind. Meanwhile, the positive phase of the AO favored the strengthening of the Middle East jet and the maintenance of the blocking high, resulting in durative low temperature in south China. The 30-60-day oscillation features of the weather systems including upper-level jet and blocking high were not so obvious during “overlord”-level cold wave in 2016. However, the low pressure of low frequency can describe the generating and developing of the polar vortex. Under north air stream at the front of blocking high ridge guidance, the rapid invasion of strong cold air in the middle of polar vortex caused temperature in China drop fast. The low-frequency synoptic map reflected the phase transition of AO before and after the cold wave. The phase of AO was positive in later December 2015 while negative in early January 2016. Then the polar cold air invaded southern China, which can be conclude as the main cause of the sharp drop in temperature. The low-frequency flow field showed the phase transition of AO lagging behind the synoptic flow field about two days during the two events.

How to cite: Li, X.: Low-frequency features during the two typical extreme cold events in China, EGU General Assembly 2026, Vienna, Austria, 3–8 May 2026, EGU26-1782, https://doi.org/10.5194/egusphere-egu26-1782, 2026.

Based on the observational hourly precipitation data and the European Centre for Medium-Range Weather Forecasts (ECMWF) reanalysis 5 (ERA5) products from 2006 to 2020, 22 rainstorm processes in the eastern foot of Helan Mountain are objectively classified through the hierarchical clustering method, and the circulation characteristics of different patterns are comparatively analyzed in this study. The results show that the occurrences of rainstorm processes in the eastern foot of Helan Mountain are most closely related to three circulation patterns. Patterns I and III mainly occur in July and August, with similar zonal circulations in synoptic backgrounds. Specifically, the South Asia high and the western Pacific subtropical high are stronger and more northward than in normal years. The frontal systems in westerlies are inactive, while the water vapor from the ocean surface in the south is mainly transported to the rainstorm area by the southerly jet stream at 700 hPa. The dynamic lifting anomalies are relatively weak, the instability of atmospheric stratification is anomalously strong, and thus the localized severe convective rainstorm is more significant. Comparatively, rainstorm processes of pattern I are accompanied by stronger and deeper ascending motions, and the warm-sector rainstorm is more extreme. Pattern III shows a stronger and deeper convective instability, accompanied by larger low-level moisture. Rainstorm processes of pattern II mainly occur in the early summer and early autumn, presenting a meridional circulation pattern of high in the east and low in the west in terms of geopotential height. Besides, the two low-level jets transporting the water vapor northward from the eastern ocean encounter with the frontal systems in westerlies, which makes the ascending motion in pattern II anomalously strong and deep. The relatively weak instability of atmospheric stratification causes weak convection and long-lasting precipitation formed by the confluence of cold air and warm air. This study is helpful to improve the forecasting ability of rainstorm in arid regions.

How to cite: Chen, Y. and Li, A.: Circulations and Thermodynamic Characteristics of Different Patterns of Rainstorm Processes in the Eastern Foot of Helan Mountain, EGU General Assembly 2026, Vienna, Austria, 3–8 May 2026, EGU26-2163, https://doi.org/10.5194/egusphere-egu26-2163, 2026.

Winter cold extreme events have been observed to frequently take place over North America mainly over its east side, which show significant interannual and decadal variability and cause huge economic losses in the United States. However, it is unclear what leads to the interannual-decadal variability of winter cold extremes over the eastern North America. In this study, we indicate that the decadal variability of winter cold extremes over the eastern North America, whose period is shortened in the recent decades, is mainly tied to Pacific decadal oscillation (PDO), whereas their interannual variability is mainly regulated by Victoria mode (VM). A positive PDO promotes cold extremes in the lower latitudes of the eastern North America mainly owing to the presence of positive Pacific North American (PNA+) patterns, whereas a positive VM is favorable for intense cold extremes in the higher latitudes of the eastern North America mainly due to the occurrence of negative North Pacific oscillation (NPO-) patterns. Thus, the positive VM and PDO combine to significantly contribute to the interannual-to-decadal variability of winter cold extremes over the eastern North America through changes in the winter NPO- and PNA+ patterns due to the variations of meridional background potential vorticity gradient and basic zonal winds. These new findings can help us understand what are the origins of the interannual-decadal variability of winter cold extremes over the eastern North America.

How to cite: Ge, Y.: Winter cold extremes over the eastern North America: Pacific origins of interannual-to-decadal variability, EGU General Assembly 2026, Vienna, Austria, 3–8 May 2026, EGU26-2505, https://doi.org/10.5194/egusphere-egu26-2505, 2026.

EGU26-2717 | ECS | Posters on site | CL3.1.1

Increased Interannual Variability of Snowfall Frequency in Eurasia during Autumn after 2000 

Siyu Zhou, Bo Sun, Huijun Wang, Fei Li, Hua Li, Huixin Li, Botao Zhou, and Shengping He

This study reveals a significant increase in the intensity of interannual variability (IIV) of snowfall frequency during autumn in the mid–high latitudes of Eurasia after 2000. During 2000–2021, the combination of warm and humid air from the Mediterranean with dry and cold air from the Arctic is conducive to increased snowfall frequency over Central Siberian Plateau. Anomalous positive temperatures due to increased specific humidity inhibit the occurrence of snowfall over central Asia. Further research demonstrates that the increased IIV of sea ice growth in the Barents–Kara Seas during autumn plays a crucial role in strengthening the snowfall frequency IIV. The rapid increase in autumn sea ice growth leads to more pronounced negative anomaly of Arctic temperature through the local thermal positive feedback, which enlarges the temperature gradient between the Arctic and the mid–high latitudes of Eurasia, thereby causing anomalous westerlies over Central Siberian Plateau and central Asia. Additionally, the rapid increase in sea ice growth may stimulate southward-propagating Rossby waves, contributing to anomalous cyclone/anticyclone over Central Siberian Plateau/ central Asia. The anomalous westerlies and cyclone/anticyclone circulation will jointly impact the pathways of water vapor transport and thus modulate the IIV of snowfall frequency over Eurasia. Through numerical experiments with increased sea ice growth of different intensities and AMIP-like experiments, it can be demonstrated that the increased IIV of sea ice growth can affect the location of westerlies and stimulate the southward-propagating Rossby waves, thereby promoting an increase in the IIV of snowfall frequency in the mid–high latitudes of Eurasia.

How to cite: Zhou, S., Sun, B., Wang, H., Li, F., Li, H., Li, H., Zhou, B., and He, S.: Increased Interannual Variability of Snowfall Frequency in Eurasia during Autumn after 2000, EGU General Assembly 2026, Vienna, Austria, 3–8 May 2026, EGU26-2717, https://doi.org/10.5194/egusphere-egu26-2717, 2026.

EGU26-3311 | ECS | Orals | CL3.1.1

Extreme storm track seasons and their influence on wind and precipitation extremes 

Tom Carrard, Hanin Binder, Seraphine Hauser, Sven Voigt, and Heini Wernli

Extratropical cyclones are important modulators of extreme weather in the midlatitudes, with impacts ranging from sub-hourly to seasonal time scales. On seasonal time scales, the aggregation of cyclones in specific regions can lead to anomalous storm track configurations, inducing a seasonal clustering of surface weather extremes with significant societal impacts. Notable examples include the southward shifted storm track associated with the exceptionally negative North Atlantic Oscillation during winter 2009/2010 and the exceptionally stormy winter of 2013/2014 over the British Isles and Ireland. While the role of anomalous storm tracks is often discussed in case studies of extreme seasons, a systematic identification and characterization of extreme seasonal configurations of the extratropical storm tracks is lacking.

We use eddy kinetic energy at 850 hPa to identify anomalous extratropical storm track seasons – referred to as storm track extremes – in the ERA5 reanalysis and explore their characteristics. Using a cyclone-tracking algorithm, we show that storm track extremes are generally induced by both changes in regional cyclone frequency and shifts in the mean intensity of these cyclones. We then assess the role of the El Niño–Southern Oscillation (ENSO) by examining the occurrence of storm track extremes across different ENSO phases and regions. Finally, we investigate how seasonal storm track extremes are linked to surface weather by assessing the frequency of daily precipitation and wind extremes during extreme storm track seasons and how they are related to individual extratropical cyclones. Our work presents the first systematic identification of anomalous storm track seasons and a multi-scale analysis of cyclone-related extremes, highlighting the role of cyclones in shaping seasonal variability and anomalous configurations of storm tracks.

How to cite: Carrard, T., Binder, H., Hauser, S., Voigt, S., and Wernli, H.: Extreme storm track seasons and their influence on wind and precipitation extremes, EGU General Assembly 2026, Vienna, Austria, 3–8 May 2026, EGU26-3311, https://doi.org/10.5194/egusphere-egu26-3311, 2026.

In recent decades, Eurasia has experienced a substantial increase in cold extremes. While the North Atlantic Oscillation (NAO) is well established as a modulater of Eurasian cold extremes, we uncovered a previously overlooked, yet increasingly critical, driver in a warming climate—the Barents Oscillation (BO). With accelerated Arctic warming, the BO has emerged as a dominant atmospheric circulation pattern. This intensified BO accounts for 59% of the observed severe cold extremes across Eurasia. In the future during 2015−2100, the BO is projected to intensify across SSP scenarios, with its increasing rate in SSP5-8.5 doubling that of SSP1-2.6. The enhanced BO is expected to exacerbate cold extremes by approximately −0.5°C for each standard deviation increase in the BO intensity. These findings emphasize the BO’s growing importance in amplifying Eurasian cold extremes under global warming, challenging the prevailing NAO-centric framework.

How to cite: Wang, H.: Regime Shift in a Warming Climate—Emerging Barents Oscillation and its Dominance in Eurasian Cold Extremes, EGU General Assembly 2026, Vienna, Austria, 3–8 May 2026, EGU26-3332, https://doi.org/10.5194/egusphere-egu26-3332, 2026.

EGU26-3912 | ECS | Posters on site | CL3.1.1

Dynamic and Thermodynamic Drivers of Precipitation Change in Mediterranean-type Climates 

Robert Doane-Solomon, Tim Woollings, and Isla Simpson

All Mediterranean-type climate regions have experienced recent wintertime precipitation declines, contributing to severe droughts in many cases. Understanding whether these declines are driven primarily by changes in large-scale circulation, atmospheric moisture, or submonthly weather systems is critical for interpreting past trends and anticipating future hydroclimate risk. We use constructed circulation analogues together with a Reynolds-decomposition moisture budget to diagnose the respective roles of dynamic circulation change, thermodynamic humidity change, and submonthly eddy activity in driving these wintertime precipitation trends.

We apply both approaches to observations and reanalyses, multiple large climate model ensembles, and a preindustrial control simulation to understand how these processes regulate moisture convergence and precipitation variability across Mediterranean-type climate regions. Circulation analogue results indicate that observed wintertime precipitation declines are predominantly dynamically driven. However, the thermodynamic drying inferred from the analogue method is stronger than that simulated by large ensembles in all Mediterranean-type regions. Moisture budget diagnostics additionally highlight a substantial contribution from submonthly eddy trends in some locations.

By directly comparing the two frameworks, we highlight that estimates of dynamic and thermodynamic trends can depend strongly on the diagnostic method used. In particular, dynamically driven moisture anomalies and changes in submonthly variability can contaminate thermodynamic estimates derived from both approaches. Using the large ensembles, we show that thermodynamic trends inferred from the two methods can even differ in sign. These results underscore the importance of combining multiple diagnostic methods to more robustly quantify the influence of large-scale circulation and humidity changes on regional precipitation decline.

How to cite: Doane-Solomon, R., Woollings, T., and Simpson, I.: Dynamic and Thermodynamic Drivers of Precipitation Change in Mediterranean-type Climates, EGU General Assembly 2026, Vienna, Austria, 3–8 May 2026, EGU26-3912, https://doi.org/10.5194/egusphere-egu26-3912, 2026.

Impactful midlatitude heatwaves are often triggered by persistent anticyclonic atmospheric blocks. Objectively defining such impactful blocking circulations remains a challenge for climate impacts analysis and theoretical understanding, which this work seeks to address. Here, persistent midtropospheric anticyclones over the entire northern hemisphere midlatitude region that lead to anomalously warm surface conditions are identified, independently of specific blocking metrics, with a two-step identification method. This method’s input is daily boreal-summer midtropospheric geopotential height, from reanalysis or from earth-system models (ESMs), over a circumglobal set of midlatitude domains spanning about longitude and latitude. The method’s output is a set of days featuring persistent states that reflect the predominant flow pattern, Archetype 1, extracted using Archetype Analysis. Persistence is defined by high values of a persistence metric, symbolized θ-1, that reflects how long the atmosphere tends to stay near a specific atmospheric configuration. The high θ-1 Archetype 1 is a barotropic anticyclonic block with warm surface conditions, lasting about a week. Extending previous European-domain persistence analysis, the archetype analysis filters out less-impactful persistent cyclonic systems associated with anomalously cold conditions. Over land regions, heatwaves are 5-10 times more frequent under persistent Archetype 1 conditions than in the record as a whole. Persistent Archetype 1 patterns are realistically represented in historical ESM simulations. There is a regional increase of θ-1  by the end of the century, which can signify a continuation of recent trends of the weakening of the boreal summer circulation. Archetype 1 persistent events spatial structure does not change by the end of the century, but their persistence increases by about 7% as part of the overall θ-1 increase, which can signify that they are getting longer as a result of climate change. 

How to cite: Vakrat, E. and Kushner, P.: Robust Identification of Impactful Boreal Summer Anticyclones and Implications for Future Climate , EGU General Assembly 2026, Vienna, Austria, 3–8 May 2026, EGU26-4093, https://doi.org/10.5194/egusphere-egu26-4093, 2026.

Wildfires in Eastern Siberia have intensified rapidly in recent decades, with increasing impacts on air quality and Earth’s climate. This intensification is closely linked to rising fire weather risk, as indicated by vapor pressure deficit (VPD), which is jointly modulated by large-scale circulation and land–atmosphere coupling, yet their respective contributions remain poorly quantified. Here we attribute the 2004–2024 summer VPD trend over Eastern Siberia using the circulation and soil moisture analogue methods. Observations show a pronounced VPD increase of 0.67 hPa decade⁻¹, which is primarily associated with variations in atmospheric circulation that contribute 0.41 hPa decade⁻¹, while the soil-moisture-related land contribution reaches 0.38 hPa decade⁻¹. These two contributions are not independent, reflecting a coupled pathway of circulation-induced land feedbacks, estimated at ~0.20 hPa decade⁻¹. CMIP6 simulations further confirm the robustness of this mechanism, showing that land–atmosphere coupling amplifies the circulation-driven VPD trend. The dominant circulation anomalies are associated with warm sea surface temperature (SST) anomalies over the Barents Sea, which excite a Rossby wave train across high-latitude Eurasia and favor subsidence, suppressed precipitation, and reduced near-surface relative humidity, thereby elevating VPD. Circulation-induced soil drying, likely related to precipitation suppression, further enhances atmospheric dryness by altering surface energy partitioning and increasing net radiation. Together, these results show that recent fire-weather risk intensification in Eastern Siberia is primarily controlled by atmospheric circulation, with substantial amplification by circulation-triggered land–atmosphere feedbacks.

How to cite: Bai, D. and Yu, H.: Quantifying the contributions of atmospheric circulation and land–atmosphere coupling to the rapid increase in fire weather risk over Eastern Siberia, EGU General Assembly 2026, Vienna, Austria, 3–8 May 2026, EGU26-4646, https://doi.org/10.5194/egusphere-egu26-4646, 2026.

EGU26-4856 | ECS | Posters on site | CL3.1.1

Bridging Regional Hydroclimatic Extremes and Atmospheric Blocking: A German Case Study 

Pedro Alencar and Annette Rudolph

Germany has experienced an increasing number of hydroclimatic extreme (HCE) events in recent decades. Heavy rainfall, dry spells, heatwaves, and (flash) droughts have intensified in both frequency and severity under ongoing climate change. However, the definition and monitoring of HCEs remain largely based on near-surface variables (e.g. precipitation, potential evapotranspiration, 2 m air temperature, and soil moisture), while their links to large-scale atmospheric dynamics and synoptic systems are still not well understood.

In this study, we map the occurrence and trends of multiple HCE types prevalent in Germany, investigate their co-occurrence, and assess their teleconnections with atmospheric blocking patterns. We use downscaled, gridded (1 × 1 km), daily data from the German Weather Service for the period 1970–2025 for precipitation, temperature, air humidity, and solar radiation to characterise the occurrence and trends of heavy rainfall, dry spells, heatwaves, and flash droughts. In addition, we use ERA5 reanalysis data to compute the Standardised Precipitation–Evapotranspiration Index (SPEI) and to assess drought occurrence and trends across Germany. ERA5 fields are also employed to identify blocking events following Detring et al. (2021).

Preliminary results indicate positive trends in the occurrence of dry spells, heatwaves, and flash droughts, particularly in southern Germany, and reveal strong links between droughts and Omega blocking, exemplified by the 2022 drought event.

How to cite: Alencar, P. and Rudolph, A.: Bridging Regional Hydroclimatic Extremes and Atmospheric Blocking: A German Case Study, EGU General Assembly 2026, Vienna, Austria, 3–8 May 2026, EGU26-4856, https://doi.org/10.5194/egusphere-egu26-4856, 2026.

EGU26-4905 | ECS | Posters on site | CL3.1.1

Interdecadal variation in the relationship between November Barents Sea Ice and the subsequent March Eurasian surface air temperature 

Yuan Yuan, Huixin Li, Bo Sun, Fei Li, and Shengping He

Changes in Arctic sea ice concentration (SIC) significantly affect mid- to low-latitude climates, yet research regarding its effect on Eurasian climate change in early spring remains insufficient. Based on reanalysis datasets and model simulations, this study reveals a significant weakening in the relationship between the dipole pattern with opposite SIC anomalies in the northern (76–82N, 20–50E) and southern (70–76N, 47–67E) regions over the Barents Sea during late autumn and the dipole mode of surface air temperature (SAT) with opposite anomalies in the southern (15–45N, 35–100E) and northern (50–75N, 15–180E) regions over Eurasia during early spring around the 2000s. This change is attributed to different spatial patterns of SIC interannual anomalies in two subperiods. During Period 1 (1978/1979–1999/2000), the dipole SIC anomalous pattern may persist from November toward the following March, which modulates the SAT in situ by affecting turbulent heat flux and longwave radiation, which further strengthening eastward-propagating wave trains originating from the North Atlantic and inducing the dipole SAT pattern in Eurasia in the following March. In contrast, during Period 2 (2000/2001–2021/2022), consistent interannual SIC anomalies over the Barents Sea in late autumn weakened this relationship due to less pronounced wave trains propagating from the Barents Sea to Eurasia. The findings of this paper reveal that different patterns of Arctic SIC can lead to varying characteristics in the Eurasian climate, suggesting the complex relationship between Arctic and Eurasian climates.

How to cite: Yuan, Y., Li, H., Sun, B., Li, F., and He, S.: Interdecadal variation in the relationship between November Barents Sea Ice and the subsequent March Eurasian surface air temperature, EGU General Assembly 2026, Vienna, Austria, 3–8 May 2026, EGU26-4905, https://doi.org/10.5194/egusphere-egu26-4905, 2026.

EGU26-5040 | ECS | Orals | CL3.1.1

Contributions of synoptic and planetary-scale drivers to precipitation extremes 

Anjali Thomas and Gabriele Messori

Large-scale precipitation extremes in the mid-latitudes arise from the interaction of multiple synoptic and planetary-scale circulation features. While a considerable body of literature exists on individual drivers, comparability and joint attribution across different spatial scales—from planetary to synoptic—remain challenging. 

Here, we use an object-based, spatio-temporal framework to identify and characterise key large-scale drivers of precipitation extremes like atmospheric rivers (ARs), frontal systems, blocking, cut-off lows, and anticyclonic and cyclonic Rossby wave breaking (RWB) using multi-decadal ERA5 reanalysis data. Each circulation driver is identified using established object-tracking algorithms applied to the respective diagnostic fields. The detected circulation objects are linked to spatiotemporal extreme precipitation objects. This allows assessing the relative and joint contributions of different synoptic- and planetary-scale drivers to extreme precipitation intensity, duration, and spatial extent across seasons and hemispheres. 

By analysing synoptic- and planetary-scale features within a consistent framework, the work aims to provide insights into the multi-scale dynamical controls on precipitation extremes, supporting dynamical attribution and improving understanding of how trends in dynamics may reflect on trends in precipitation extremes. 

How to cite: Thomas, A. and Messori, G.: Contributions of synoptic and planetary-scale drivers to precipitation extremes, EGU General Assembly 2026, Vienna, Austria, 3–8 May 2026, EGU26-5040, https://doi.org/10.5194/egusphere-egu26-5040, 2026.

EGU26-5268 | ECS | Orals | CL3.1.1

Role of the atmospheric circulation in the observed warming over Europe using a neural network. 

Enora Cariou, Julien Cattiaux, Saïd Qasmi, and Aurélien Ribes

Daily temperature variations over Europe are strongly linked to fluctuations in the large‐scale atmospheric circulation over the North Atlantic basin. Recently, Europe has been warming rapidly, and it is important to accurately estimate the contribution of atmospheric circulation to this trend.

Here, we present an innovative dynamical adjustment framework based on a convolutional neural network (UNET) trained on CMIP6 simulations and fine-tuned on reanalysis, to estimate the observed circulation-induced temperature at the daily timescale and the subsequent trends over 1979-2024. This approach offers robust estimators at the daily scale, and performs generally better than the commonly used methods for dynamical adjustment (e.g. analogues).

When applying this method on temperature averaged over western Europe, and using the winds at 850 hPa as the circulation predictor, we find that the temperature trends induced by the dynamics between 1979 and 2024 are of 0.05 [-0.03,0.14]°C/decade annually and greater in summer (0.08 [-0.00,0.17]°C/decade) and in winter, but with higher uncertainty (0.09 [-0.11,0.29]°C/decade).

Further, we conduct sensitivity tests to the circulation predictor. Considering the wind at 700 hPa rather than 850 hPa makes no substantial difference, but considering the SLP can increase the estimated dynamical trends up to a factor of 2. This discrepancy might be due to surface processes affecting the temperature-SLP relationship, and our findings suggest that dynamical adjustment methods can be sensitive to the predictor used.

How to cite: Cariou, E., Cattiaux, J., Qasmi, S., and Ribes, A.: Role of the atmospheric circulation in the observed warming over Europe using a neural network., EGU General Assembly 2026, Vienna, Austria, 3–8 May 2026, EGU26-5268, https://doi.org/10.5194/egusphere-egu26-5268, 2026.

EGU26-5678 | ECS | Orals | CL3.1.1

Role of the stratosphere in the January 2025 Pan-Atlantic Event: A Case Study of Storm Éowyn 

Iana Strigunova, Michael Schutte, and Gabriele Messori

Storm Éowyn made landfall in the British Isles on 24 January 2025, becoming one of the most devastating extratropical cyclones in recent years with average wind speeds exceeding 39 m/s. This storm, following record-breaking low temperatures and snowfall in the Southern United States, constitutes a Pan-Atlantic cold and windy compound extreme. Given the widespread impacts of these compound extremes, identifying their atmospheric precursors is critical for improving predictability and preparedness.

The stratosphere played an important role in the January 2025 Pan-Atlantic event. We demonstrate how a strong stratospheric polar vortex, in conjunction with tropospheric drivers like the Alaskan Ridge weather regime, facilitated enhanced southward cold air advection in North America and the intensification of cyclone Éowyn over the North Atlantic. This case study provides an archetype for future compound Pan-Atlantic cold-windy events and outlines possible pathways for improved sub-seasonal forecasting.

How to cite: Strigunova, I., Schutte, M., and Messori, G.: Role of the stratosphere in the January 2025 Pan-Atlantic Event: A Case Study of Storm Éowyn, EGU General Assembly 2026, Vienna, Austria, 3–8 May 2026, EGU26-5678, https://doi.org/10.5194/egusphere-egu26-5678, 2026.

EGU26-7026 | ECS | Orals | CL3.1.1

Data-Driven Discovery of Non-Linear Weather Regimes driving Regional Precipitation Extremes in Europe 

Jonathan Ortved Melcher, Jens H. Christensen, Chongyang Zhang, Peter L. Langen, and Shuting Yang

The NAO’s correlation with precipitation in Norway and the Iberian Peninsula is well established, yet its explanatory power diminishes across much of Europe. Other patterns may drive precipitation variability in these regions, but traditional methods for identifying circulation-precipitation relationships have limitations. Prescribed indices assume a causal link between specific sites and physically coherent structures, whereas EOF methods impose linearity and orthogonality constraints that atmospheric circulation does not obey. This study identifies weather regimes associated with precipitation extremes across representative European regions using a non-linear, non-orthogonal, data-driven approach.

Specifically, we employ a machine learning approach that discovers weather regimes directly from mean sea level pressure fields, without prescribing their structure a priori. The method builds upon Spuler et al. 2024 & 2025, with changes that allow for larger, higher-resolution input domains. It identifies distinct atmospheric states associated with different precipitation intensities at target locations, linking discovered patterns directly to their impacts. Importantly, once regimes are identified, indices analogous to traditional teleconnection indices can be derived, enabling comparison with established frameworks while capturing dynamics they may miss.

We apply this method to daily ERA5 fields, targeting precipitation in selected European regions with contrasting dynamical drivers, including Bergen, the Iberian Peninsula, and Copenhagen. This allows us to present teleconnection patterns identified through this approach over the entire Northern Hemisphere as well as relevant sub-regions, including the North Atlantic and Arctic, focusing on extreme precipitation drivers. We find multiple regimes that resemble different flavors of the well-known NAO pattern, alongside circulation states consistent with blocking-like structures. Comparisons with traditional EOF analysis highlight the effects of relaxing linearity and orthogonality constraints. Correlation maps are produced for both methods, enabling direct evaluation of how the data-driven regimes compare to established EOF-based patterns.

The non-linear, data-driven framework remains physically interpretable and avoids the limitations of linear orthogonal decomposition. Though currently applied to ERA5, the approach transfers directly to CMIP6 historical and scenario runs, enabling assessment of how regime frequencies and precipitation associations may shift under climate change. Overall, this study illustrates how ML-based approaches can complement traditional synoptic climatology by allowing circulation–impact relationships to emerge directly from the data.

Bibliography
  • Spuler, Fiona R. et al. (2024): Identifying probabilistic weather regimes targeted to a local-scale impact variableEnvironmental Data Science3, e25.
  • Spuler, Fiona R. et al. (2025): Learning predictable and informative dynamical drivers of extreme precipitation using variational autoencodersWeather and Climate Dynamics6, 995-1014.

How to cite: Melcher, J. O., Christensen, J. H., Zhang, C., Langen, P. L., and Yang, S.: Data-Driven Discovery of Non-Linear Weather Regimes driving Regional Precipitation Extremes in Europe, EGU General Assembly 2026, Vienna, Austria, 3–8 May 2026, EGU26-7026, https://doi.org/10.5194/egusphere-egu26-7026, 2026.

EGU26-7871 | ECS | Orals | CL3.1.1

Future changes in Mediterranean Heavy Precipitation Events : weather regime frequency and intensity drivers 

Lilian Noirot, Margot Bador, Julien Boé, and Cécile Caillaud

The Mediterranean region is particularly sensitive to extreme precipitation, with Heavy Precipitation Events (HPEs) predominantly occurring in autumn. These events are typically associated with organised, often quasi-stationary mesoscale convective systems that can produce over 100 mm of rainfall in 24 hours, or even in a few hours. This can lead to major damage to infrastructure and loss of life.

Global climate models (GCMs) show uncertainty regarding the future evolution of Mediterranean HPEs. This uncertainty is primarily driven by inter-model differences in projected large-scale atmospheric circulation, which control the occurrence of weather regimes associated with extreme precipitation. Beyond changes in weather regime occurrence, for a given weather regime, uncertainties exist regarding the role of remote climate drivers, such as sea surface temperature or specific humidity anomalies, in influencing the intensity of Mediterranean HPEs and their future evolution.

In this study, we assess how projected changes in Mediterranean HPEs during autumn can be explained by future changes in the occurrence of weather regimes identified as favourable to HPEs. Using ERA5 reanalysis, we identify four weather regimes that favour the occurrence of Mediterranean HPEs. Analyses based on a CMIP6 multi-model ensemble indicate that three of these four HPE-favourable weather regimes are projected to become less frequent towards the end of the century.

Beyond changes in weather regime frequency, we investigate the role of local and remote climate drivers in explaining the spread in GCM projections of future changes in Mediterranean HPEs within a given weather regime. To provide a physical basis for interpreting this dispersion, we first identify the factors that control the intensity of HPEs in the two weather regimes most favourable to HPEs. Based on ERA5, in the most HPE-favourable weather regime, HPEs intensity is controlled by local Mediterranean moisture availability and upper-level circulation over western Europe. Additional remote influences are associated with Atlantic moisture anomalies and Caribbean sea surface temperature anomalies preceding the events. In the second weather regime, HPEs intensity is primarily driven by local Mediterranean moisture conditions, with remote influences are mainly associated with enhanced moisture over North Africa prior to HPEs occurrence.

These results reveal weather-regime-dependent differences in the role of local and remote drivers controlling the intensity of Mediterranean HPEs. This framework can be used to interpret future changes and uncertainties in GCMs projections, and provides a basis for future storyline-based analyses of Mediterranean HPEs.

How to cite: Noirot, L., Bador, M., Boé, J., and Caillaud, C.: Future changes in Mediterranean Heavy Precipitation Events : weather regime frequency and intensity drivers, EGU General Assembly 2026, Vienna, Austria, 3–8 May 2026, EGU26-7871, https://doi.org/10.5194/egusphere-egu26-7871, 2026.

The daily temperature variation (DTV) in March over East Asia (EA) during the period 1979–2020 is examined in this study. Using the JRA-55 dataset, we analyze the respective roles of atmospheric circulation and global warming in modulating regional DTV. Among the high-frequency components of surface air temperature (SAT) variability in spring, March DTV exhibits a statistically significant increasing trend over EA during the four decades. Composite analysis reveals that above-normal March DTV is closely associated with anomalous anticyclonic circulation over the North Pacific and anomalous cyclonic circulation over Russia. These circulation anomalies enhance the meridional SAT gradient and increase the frequency of mid-latitude synoptic-scale pressure systems traversing EA. Consequently, enhanced thermal advection leads to increased variability in March SAT across the region. Furthermore, the circulation anomaly pattern linked to large March DTV displays characteristics consistent with a weakened EA winter monsoon (EAWM). Regression analyses employing indices of the EAWM and the long-term global warming trend indicate that both large-scale atmospheric circulation variability and global warming have contributed significantly to the observed changes in March DTV over EA. In particular, spatially heterogeneous warming rates and localized soil drying during the period are likely key factors explaining the influence of global warming on the increasing March DTV in EA.

How to cite: Ahn, J.-B.: Increasing March Daily Temperature Variation over East Asia: Roles of Atmospheric Circulation and Global Warming, EGU General Assembly 2026, Vienna, Austria, 3–8 May 2026, EGU26-7876, https://doi.org/10.5194/egusphere-egu26-7876, 2026.

The North Atlantic (NATL) jet stream plays a central role in shaping weather and climate over the North Atlantic and Europe. It continuously fluctuates in latitude and strength, guiding storm tracks across the basin. When these fluctuations become unusually persistent, they can anchor weather regimes for extended periods, increasing the likelihood of extreme events such as droughts and floods. Here, we investigate the persistence of summer NATL jet latitudinal variability and of the closely related Summer North Atlantic Oscillation using CMIP6 models and the ERA5 reanalysis. Using the relative vorticity tendency equation, we quantify the strength of the eddy–mean flow feedback and show that it explains a large fraction of the intermodel spread in jet persistence. In contrast, differences in feedback strength do not account for the persistence discrepancy between models and ERA5, which we suggest arises from differences in sea–air coupling strength. We further find that intermodel differences in jet persistence are closely linked to differences in the persistence of European precipitation. These results underscore the importance of accurately characterizing dynamical uncertainty, as it directly translates into uncertainty in regional climate impacts.

How to cite: Ossó, A.: The persistence of the Summer North Atlantic Jet Variability: Dynamical Feedbacks and Model‐Observation Discrepancies, EGU General Assembly 2026, Vienna, Austria, 3–8 May 2026, EGU26-7947, https://doi.org/10.5194/egusphere-egu26-7947, 2026.

EGU26-8303 | ECS | Orals | CL3.1.1

Trends in Northern Hemisphere cold spells across the winter periods 1980/81-2024/25 

Weronika Osmolska, Amanda Maycock, and Charles Chemel

Midlatitude cold spells (CSs) are often associated with disruptions to transportation and energy infrastructures and increased risk to life and livelihoods. While the Sixth Assessment Report of the Intergovernmental Panel on Climate Change (IPCC AR6 2021) assessed that CSs have become less frequent across most land areas due to human caused climate change, some studies suggest that their frequency may not be declining everywhere.

In this work, we investigate Northern Hemisphere trends of CS characteristics in reanalysis data since the winter 1980-81, using a novel spatio-temporal CS tracking algorithm based on daily 2m temperature anomalies (Osmolska et al., 2025).  We analyse the changes in frequency, severity, duration and area of CSs identified using raw and detrended temperature data to disentangle the effects of mean background warming (thermodynamics) versus circulation changes (dynamics).

We show that in the Northern Hemisphere, the average winter frequency of CSs decreases due to background warming at a rate of 19 days decade-1, with similar trends in North America, Europe and East Asia. These regions are also experiencing less severe CSs, with the average 5th percentile temperature threshold in the Northern Hemisphere increasing by 0.3 K decade-1. We find that the decline in the cumulative annual area occupied by CSs is mainly due to the decrease in frequency, with the area decrease being equal to 1x10⁸ km2 per decade. Finally, we also show that the average duration of CSs has significantly decreased in northern North America (-1.3 days decade-1) and southern Europe (-1.0 days decade-1).

When dynamical effects are considered alongside the thermodynamical effects, we show that dynamical variability contributes to CS becoming less frequent in the Northern Hemisphere (-2.9 days decade-1), and contributes to a decreasing persistence and cumulative CS area over northern North America. In all other regions, we found minimal change in CS characteristics from circulation changes.

In this work, we demonstrate that the rise in mean temperature is the primary driver of recent Northern Hemisphere CS trends; however, changes in dynamical variability have contributed to regional reductions in CSs in northern North America in contrast to some studies which have suggested circulation changes have enhanced CSs there.

How to cite: Osmolska, W., Maycock, A., and Chemel, C.: Trends in Northern Hemisphere cold spells across the winter periods 1980/81-2024/25, EGU General Assembly 2026, Vienna, Austria, 3–8 May 2026, EGU26-8303, https://doi.org/10.5194/egusphere-egu26-8303, 2026.

Historical extreme precipitation events over Central European river catchments often resulted in flooding events. Climate simulations show an increasing intensity of very extreme precipitation in a warmer climate for most parts of Europe. In order to analyse the atmospheric mechanisms leading to the intensification of very extreme precipitation events, we investigate 100-year daily precipitation events over Central European river catchments from large ensembles of multiple CMIP6 global climate models. Extreme events are identified in a historical (1970-2000) and a future (2070-2100, ssp370) period and uncertainties of projected changes are quantified through inter-model differences. Also, future changes are separated into dynamic and thermodynamic contributions with the precipitation scaling diagnostic by O’Gorman & Schneider (2009) and compared to synoptic composites in order to identify the main sources of uncertainty of projected changes and to understand the underlying mechanisms. Extreme precipitation events in the historical period mainly occur during the core summer season (June-August), while there is a slight broadening of the seasonality in the future period towards May and October. Averaged over all models, precipitation intensity in each catchment significantly increases by about 6-9%/K, similar to the Clausius-Clapeyron rate, but the increases vary regionally across models and catchments. This multi-model uncertainty is partly due to a varying representation of dynamical processes between most models, as indicated by the scaling diagnostic, while they mostly agree on a rather homogeneous precipitation increase due to thermodynamic mechanisms. Composites show that projected future changes in the synoptic situation during the extreme events are generally small. Nevertheless, significant changes both in dynamical parameters, such as an intensifying ridge over the North Atlantic, and thermodynamic variables, e.g. larger total column water vapour, enhance the precipitation rate in future events.

How to cite: Ruff, F. and Pfahl, S.: Uncertainty of future changes of very extreme precipitation events over central European river catchments from ensemble simulations of multiple global climate models, EGU General Assembly 2026, Vienna, Austria, 3–8 May 2026, EGU26-9154, https://doi.org/10.5194/egusphere-egu26-9154, 2026.

EGU26-9731 | ECS | Orals | CL3.1.1

Variability of Hot Days in the Middle Latitudes of Europe between 1973 and 2024 

Yingxin Li, Jean-Philippe Baudouin, and Kira Rehfeld

Hot days gain great attention around the world for their wide impacts on water resources, agriculture, society productivity, biosystems, and public health. We explore daily data from weather stations, the global surface summary of day product produced by the National Centers for Environmental Information of the United States, to determine changes in the monthly frequency of hot days (maximum daily temperature above 35 degrees Celsius) in Western, Central, and Eastern Europe. The monthly percentages show increasing trends in June, July, and August between 1973 and 2024. They are positively correlated with the monthly average geopotential height at 500hPa: Correlation coefficients computed with monthly ERA5 reanalysis data over the three regions lie between 0.54 and 0.78 (p<0.01). We further investigate the impact of anthropogenic global warming and internal climate modes such as the Pacific Decadal Oscillation (PDO) and El Niño-Southern Oscillation (ENSO) using geopotential height at 500 hPa and the surface air temperature (SAT) from ERA5. We draw on results for the three regions based on a decomposition method, Cyclo-Stationary Empirical Orthogonal Functions. We illustrate the method for two exemplary time points: July 1976, for which the hot days percentage was the least (1.3%), and July 2024, for which the percentage was the most (16.3%) in the considered areas. As expected, the anthropogenic global warming contributed to an increase in SAT between the two example months. By contrast, PDO statistically contributed to slightly lower SAT in July 2024 but slightly higher SAT in July 1976. Similarly, the ENSO mode played a small positive (negative) role in SAT in the West, Central Europe, but a slightly negative (positive) role in Eastern Europe in July 1976 (2024). In all three modes, the geopotential height positive and negative anomalies are consistent with those in SAT. Positive anomalies in geopotential height are usually accompanied by subsidence and strong solar irradiance at the surface, and therefore favor SAT increase, and vice versa. Regressing the anthropogenic global warming mode on SAT in Europe for the five July months with the most (in 2024, 2007, 2015, 2012, 2023) and the least hot days percentages (in 1976, 1992, 1979, 1986, 1989), clearly shows a positive impact for the former and a negative contribution for the latter, except 1989. We test the robustness of our results by comparison to a second method, Low-Frequency Component Analysis. Our results will enhance the understanding of the influence of forced and internal climate variability, specifically, modes of variability, on the frequency of hot days in the mid-latitudes.

How to cite: Li, Y., Baudouin, J.-P., and Rehfeld, K.: Variability of Hot Days in the Middle Latitudes of Europe between 1973 and 2024, EGU General Assembly 2026, Vienna, Austria, 3–8 May 2026, EGU26-9731, https://doi.org/10.5194/egusphere-egu26-9731, 2026.

EGU26-10673 | ECS | Orals | CL3.1.1

Projected evolution of dust-favourable weather regimes over the western Mediterranean across different climate scenarios 

David Scofield-Teruel, Pedro Salvador, Blas L. Valero-Garcés, and Jorge Pey

Large-scale atmospheric circulation and synoptic systems strongly modulate regional environmental variability. Over the western Mediterranean, Saharan dust outbreaks provide a clear circulation-controlled signal, with consequences for aerosol loading, visibility, and air quality. Here we quantify how dust-favourable circulation regimes evolve from recent decades to the end of the 21st century under multiple Shared Socioeconomic Pathways (SSP1-2.6 to SSP5-8.5), using a fixed-centroid synoptic classification applied consistently to reanalyses and daily CMIP6 circulation fields.
Daily atmospheric circulation states were characterized by 850 hPa geopotential height ERA5 reanalysis data fields over North Africa and the western Mediterranean for the period 1980-2014. Each day was assigned to one of 11 pre-defined circulation types (weather regimes) using a non-hierarchical K-means cluster analysis procedure (Salvador et al., 2022). Along with daily regime labels, we retained distances to the nearest centroid and performed internal diagnostics (e.g., centroid stability and assignment consistency) to ensure that the fixed-reference classification remained comparable across datasets.
We linked regimes to an observable regional indicator by evaluating dust relevance using two independent datasets: (I) satellite-constrained dust aerosol extinction optical depth from the MERRA-2 reanalysis (DUEXTTAU) and (II) an observational catalogue of Saharan dust days identified over the Iberian Peninsula. For each regime we quantified conditional dust occurrence and typical dust loading, identifying 6 of the 11 regimes as consistently dust-favourable, i.e., systematically enhancing Saharan dust export and advection into Iberia and the western Mediterranean.
The same classification was applied to 15 CMIP6 models for historical (1980–2014) and future (2020–2100) simulations. We validated each model against ERA5 using metrics that capture agreement in overall regime frequencies, seasonal cycle, interannual variability, and trends, providing an objective basis to interpret uncertainty and to optionally filter or weight models prior to projection.
Finally, we built multi-model ensembles for each SSP and diagnose changes in regime frequency, seasonality, and trend significance through the 21st century. Across SSPs we find a robust increase in dust-favourable regimes, with the strongest changes under SSP5-8.5. In an equal-weight SSP5-8.5 ensemble, the fraction of days assigned to dust-favourable regimes increases from 61.5% (2020s) to 74.5% (2090s), while individual models show larger increases (up to ~20 percentage points), implying sensitivity to model weighting. Regimes typically associated with summer dust transport also become more frequent in spring, indicating a seasonal expansion of dust-conducive synoptic conditions.
By translating projected circulation changes into interpretable regime statistics tied to dust occurrence and loading, this framework provides a transparent bridge between large-scale dynamics and future regional dust-related aerosol variability over the western Mediterranean.

How to cite: Scofield-Teruel, D., Salvador, P., Valero-Garcés, B. L., and Pey, J.: Projected evolution of dust-favourable weather regimes over the western Mediterranean across different climate scenarios, EGU General Assembly 2026, Vienna, Austria, 3–8 May 2026, EGU26-10673, https://doi.org/10.5194/egusphere-egu26-10673, 2026.

EGU26-11183 | Orals | CL3.1.1

The role of Mediterranean Troughs on Boreal Winter Dry Season Rainfall over Eastern Africa 

Caroline Wainwright, Neil Ward, Joshua Talib, Declan Finney, Samantha Clarke, John Marsham, Chris Taylor, and Richard Keane

Unexpected rainfall events during the January-February dry season over Eastern Africa have significant impact upon society, particularly when they lead to, or exacerbate, ongoing flooding (as in Kenya in 2020 and 2022). Populations across Eastern Africa do not expect rainfall to occur during the January-February dry season, and a lack of preparedness can exacerbate impacts when heavy rainfall does occur. Whilst recent dry season rainfall across Eastern Africa has severely impacted livelihoods and communities, the mechanisms controlling such rainfall are poorly understood, since the majority of previous research has focussed upon the climatological wet seasons.  Here, we aim to further explore the drivers of these boreal winter dry season rainfall events.

Recent research suggests that boreal winter precipitation and temperature anomalies over tropical central Africa are influenced by large-scale atmospheric variability originating in the Mediterranean region. Building on these findings, this study investigates the role of Mediterranean troughs in driving January–February dry season rainfall over Eastern Africa.

Our results show that dry season rainfall over Eastern Africa is linked to an upper-level ridge-trough pattern over the Mediterranean. The presence of a ridge in the central Mediterranean and trough in the Eastern Mediterranean leads to westerly wind anomalies across Central Africa, and anomalous westerly moisture transport that enhances moisture over Eastern Africa and a region extending north-east from Eastern Africa into the Arabian Peninsula and Asia. This enhanced moisture leads to enhanced rainfall over Eastern Africa, during the climatologically dry January-February season.

These findings will improve future forecasts of dry season rainfall over Eastern Africa, which will enhance preparedness for future rainfall events.  Furthermore, climate projections from CMIP5 and CMIP6 models indicate enhanced dry season rainfall over Eastern Africa under future climate change. Improving our understanding of drivers of present-day dry season rainfall will support our understanding of future rainfall changes. 

How to cite: Wainwright, C., Ward, N., Talib, J., Finney, D., Clarke, S., Marsham, J., Taylor, C., and Keane, R.: The role of Mediterranean Troughs on Boreal Winter Dry Season Rainfall over Eastern Africa, EGU General Assembly 2026, Vienna, Austria, 3–8 May 2026, EGU26-11183, https://doi.org/10.5194/egusphere-egu26-11183, 2026.

EGU26-12363 | ECS | Orals | CL3.1.1

Northern Hemisphere warming hotspots linked to intensified tripole wind anomaly patterns 

Caihong Liu, Fenying Cai, Vera Melinda Galfi, Tamara Happé, and Dim Coumou

Spatially heterogeneous surface warming across continents is strongly governed by atmospheric circulation changes, as demonstrated by observations and climate models. The accelerated warming observed in eastern Europe, northwestern China, eastern Siberia, and western North America aligns with the long-term changes in upper-level zonal winds. However, the hemispheric-scale structure of the upper-tropospheric zonal wind field linked to regional heat extremes remains poorly understood. Using a complex network approach, we identify a north–south-oriented tripole wind anomaly pattern characterised by westerly–easterly–westerly zonal wind anomalies surrounding heat extremes. Variability in this tripole pattern explains up to 70% of the dynamics-induced interannual temperature variability and at least 50% of its long-term warming trend in hotspot regions. Multiple climate models project that the dynamics-induced temperature trend over western North America will double by the end of the 21st century in response to an amplified tripole wind anomaly pattern. Our findings highlight the need to integrate upper-level wind-field dynamics for predicting regional surface temperature.

How to cite: Liu, C., Cai, F., Galfi, V. M., Happé, T., and Coumou, D.: Northern Hemisphere warming hotspots linked to intensified tripole wind anomaly patterns, EGU General Assembly 2026, Vienna, Austria, 3–8 May 2026, EGU26-12363, https://doi.org/10.5194/egusphere-egu26-12363, 2026.

EGU26-12518 | Orals | CL3.1.1

Projected future changes in Omega blocking and subtropical ridges and their relationship to European heatwaves in two SMILEs 

Alexander Lemburg, Andreas H. Fink, Miguel M. Lima, and Joaquim G. Pinto

Over the last few decades, Europe has emerged as a hotspot for heatwaves (HWs), with prominent examples such as 2003, 2010, 2018 and 2022. The development of European HWs is often linked to atmospheric blocking, in summer most notably in the form of a so-called Omega blocking. However, not all HWs necessitate atmospheric blocking, particularly over Southern and Central Europe, where they can also be caused by poleward extensions of the subtropical high pressure belt, so-called subtropical ridges. These can be positioned such that they induce southward flow anomalies of hot and dry air, which have been suggested before as an explanation of the overproportional increase in heat extremes over Europe.

Future projections show a clear increase in the number and intensity of HWs but are inconclusive with respect to changes in atmospheric blocking. Moreover, subtropical ridges are generally not considered, although they may play a greater role in a warmer climate. We present ongoing research into CMIP6-projected changes of both Omega (and other) atmospheric blocking and subtropical ridges for Europe. Besides overall trends, we are particularly interested in the most intense and most persistent HWs and whether their link to large-scale atmospheric flow anomalies such as Omega blocking or ridges might change.

Preliminary results based on two large ensembles (SMILEs; MPI-GE and SMHI-LENS) suggest that subtropical ridges are projected to increase in frequency during summer in Western and Central Europe, while for Omega and other atmospheric blocking a small reduction or no change is identified. Particularly during HWs, the frequency of ridge detection increases substantially for a warmer climate in both ensembles. This is of particular interest as such ridge-type HWs are generally found to more intense (albeit not more persistent) than Omega-type HWs, both in the present and the projected future climate.

How to cite: Lemburg, A., Fink, A. H., Lima, M. M., and Pinto, J. G.: Projected future changes in Omega blocking and subtropical ridges and their relationship to European heatwaves in two SMILEs, EGU General Assembly 2026, Vienna, Austria, 3–8 May 2026, EGU26-12518, https://doi.org/10.5194/egusphere-egu26-12518, 2026.

EGU26-13081 | ECS | Orals | CL3.1.1

IArctic land surface hydrology influences on regional and hemispheric temperature and circulation responses 

Nagore Meabe-Yanguas, Jesus Fidel González-Rouco, Félix García-Pereira, Álex Martínez-Vila, Philipp de Vrese, Johann Jungclaus, and Stephan Lorenz

Global warming is expected to have a stronger impact on the Arctic than on the rest of the globe, not only due to interactions between sea ice, snow, and radiation, but also because of the presence of permafrost. These soils store large amounts of carbon (around 1100–1700 Gt), which, if thawed, can affect the carbon cycle, soil hydrology, and surface energy exchanges. Accurately representing soil hydro-thermodynamic processes is therefore essential for realistically simulating Arctic climate change. However, limitations in the representation of soil processes and resolution in land surface models (LSMs) within Earth System Models (ESMs) lead to large uncertainties, for instance leaving it unclear whether the Arctic will become wetter or drier under future warming.

In this study, we use a modified version of the Max Planck Institute for Meteorology ESM (MPI-ESM) in which key thermodynamic and hydrological processes are enhanced particularly in permafrost regions. By tuning model parameters, we generate two idealized set-ups that create wetter and drier soil conditions in permafrost regions and that allow for testing the sensitivity to soil thermo- and hydrodynamics. Based on these configurations, we produce an ensemble of simulations, referred to as the Permafrost Physics Ensemble (PePE), covering the historical (1850-2014) period and extended up to 2300 CE under multiple climate change scenarios.

Our results show that differences in Arctic soil hydrology affect surface energy partitioning and consequently, permafrost extension, near-surface temperature, snow cover and sea ice fraction. Changes in soil moisture modify the background climate state and the strength of feedbacks related to snow and sea ice, contributing to Arctic amplification (AA). In our simulations, AA converges to a warming factor of about 2–3 when external forcing dominates over internal variability. Furthermore, these changes influence the large scale latitudinal gradient and Northern Hemisphere circulation variability by modulating patterns like the Arctic Oscillation (AO).

How to cite: Meabe-Yanguas, N., González-Rouco, J. F., García-Pereira, F., Martínez-Vila, Á., de Vrese, P., Jungclaus, J., and Lorenz, S.: IArctic land surface hydrology influences on regional and hemispheric temperature and circulation responses, EGU General Assembly 2026, Vienna, Austria, 3–8 May 2026, EGU26-13081, https://doi.org/10.5194/egusphere-egu26-13081, 2026.

EGU26-14213 | ECS | Posters on site | CL3.1.1

Pathways and processes leading to the warming of air masses in northern hemispheric summer anticyclones 

Michael Thomas and Stephan Pfahl

Summer anticyclones are known for their strong connection to extreme near-surface temperatures, potentially leading to severe natural hazards in the mid-latitudes. Although our understanding of the processes causing these heat extremes is growing, the causal relationship between soil conditions, near-surface air temperature and the synoptic systems above them is still far from being fully understood.
The aim of this work is to provide insight into the interaction between near-surface air masses and heat-generating mid-tropospheric summer anticyclones. Using Lagrangian analyses and a temperature change decomposition method, we illustrate the contributions from advection, diabatic and adiabatic heating in air streams during different phases of the anticyclone life cycle from a composite perspective. Moreover we look for coherent trajectory patterns that could contribute to the coupling of near-surface temperature extremes and the mid-tropospheric flow.
We demonstrate that the role of diabatic warming increases in the southeast of the mid-level anticyclone during more intense heat waves over land. In contrast, the areas in the west of the anticyclone, where the heat waves occur, are primarily affected by advection and adiabatic warming. We also provide evidence for the occurrence of coherent air streams injected from the outflow of dry intrusions or post frontal subsidence in troughs adjacent to the anticyclone and explore their implications for the life cycle of the anticyclone.

How to cite: Thomas, M. and Pfahl, S.: Pathways and processes leading to the warming of air masses in northern hemispheric summer anticyclones, EGU General Assembly 2026, Vienna, Austria, 3–8 May 2026, EGU26-14213, https://doi.org/10.5194/egusphere-egu26-14213, 2026.

Atmospheric responses to extratropical sea-surface temperature (SST) anomalies are known to be sensitive to model resolution, yet the exact mechanisms controlling this sensitivity remain an open question. In the North Atlantic (NA), where strong air-sea coupling and stormtrack dynamics interact, resolving mesoscale frontal processes may be essential for correctly representing SST-driven atmospheric variability and its feedback onto large-scale circulation patterns such as the North Atlantic Oscillation (NAO).

We analyze a new ensemble of variable-resolution CAM6 simulations with prescribed SST anomalies. The atmospheric grid is globally 110 km and refined over the North Atlantic to 28 km and 14 km, allowing explicit representation of weather fronts and associated mesoscale circulations at the highest resolution. Imposed SST anomalies are derived by regressing the observed NAO index onto SSTs over 1958–2018, producing a cold–warm–cold tripole for a controlled comparison of NA SST feedbacks onto the NAO across resolutions.

We find that the NA SST tripole anomaly induces a positive feedback onto the NAO in the 14-km simulations, whereas this feedback is absent in the 28-km and 110-km configurations, which exhibit weaker and structurally different circulation responses. The atmospheric adjustment pathways also differ markedly across resolutions, with strongly contrasting responses in both the vertical and meridional eddy heat fluxes. In comparison to the lowest resolution, the intermediate resolution exhibits enhanced horizontal eddy heat flux responses, whereas the highest-resolution simulations respond to the positive Gulf Stream SST anomaly primarily through vertical eddy heat fluxes. While the mean states of the two higher-resolution simulations are in closer agreement, the SST-forced responses are more similar between the two lower-resolution simulations, suggesting that resolving the mesoscale might be particularly crucial for correctly representing ocean–atmosphere coupling.

As climate models move toward increasingly high resolution and computationally demanding coupled configurations, these results offer important guidance on the atmospheric resolution required to realistically represent ocean-atmosphere coupling and the climate response to SST perturbations, including those arising from changes in ocean circulation.

How to cite: Müller, J. and Jnglin Wills, R. C.: How Eddy Heat Fluxes Shape the Resolution-Dependent Atmospheric Response to North Atlantic SST Anomalies, EGU General Assembly 2026, Vienna, Austria, 3–8 May 2026, EGU26-14620, https://doi.org/10.5194/egusphere-egu26-14620, 2026.

EGU26-14690 | Posters on site | CL3.1.1

The influence of circulation types on drought variability in Croatia 

Christoph Beck and Ivana Marinović-Šekerija

Droughts are a recurring feature of climate variability in Croatia and are of great importance as they cause high economic losses and severe damage in particular to the agriculture and water management sectors. Understanding the origin and course of drought events, as well as developing forecasting approaches, requires knowledge of the synoptic framework of droughts. In this context, weather and circulation type classifications provide one feasible approach for characterizing main synoptic patterns and for analyzing related impacts on drought dynamics.
Against this background, a new circulation type classification for Croatia has been developed and applied to time series of the Standardized Precipitation Index (SPI) to analyze the spatial and temporal variability of drought events in Croatia.
In our contribution the development of the new classification is documented and the resulting 20 circulation types are characterized with regard to their main synoptic-climatological properties.
Using SPI time series for 31 stations from the official Croatian network for the period from 1981 to 2020, we investigate the relationship between weather patterns and drought events. Based on the estimation of percentage anomalies significant drought relevant circulation types are identified for varying SPI period lengths and drought thresholds also taking into account seasonal and spatial variations. Temporal variations in occurrence frequencies of drought-relevant circulation types are then related to SPI time series and the relevance of the circulation types for the temporal drought variability is statistically quantified.
Preliminary results of our analyses show that:
- identified relevant weather patterns reflect clear synoptic configurations associated with drought.
- Partly distinct differences in drought-related patterns can be observed between seasons and depending on the SPI-period length, while
- respective differences between climatic regions of Croatia are barely pronounced.
- Large parts of the interannual SPI variability at the stations can be attributed to corresponding frequency variations in drought-relevant circulation types.

How to cite: Beck, C. and Marinović-Šekerija, I.: The influence of circulation types on drought variability in Croatia, EGU General Assembly 2026, Vienna, Austria, 3–8 May 2026, EGU26-14690, https://doi.org/10.5194/egusphere-egu26-14690, 2026.

EGU26-15011 | ECS | Posters on site | CL3.1.1

Flood discharge in Europe influenced by atmospheric blocking 

Diego Hernandez, Miriam Bertola, David Lun, Bodo Ahrens, James McPhee, and Günter Blöschl

Floods are among the most disastrous and costly extreme weather events in Europe. Atmospheric blocking patterns (persistent and self-preserved weather systems that propagate very slowly and slow down the large-scale circulation) are part of the main weather regimes in the Euro-Atlantic region and play a central role in shaping the extreme weather of Europe and its impacts on the surface. Nevertheless its socioeconomic importance, the covariability between atmospheric blocking and river flood has rarely been examined on the climate and continental scales. Our study explores the hydrological way that atmospheric blocking propagates into floods and how this relationship varies over space and time, in >6000 basins of Europe during the last 60 years. We analyse flood discharge observations from a pancontinental database and atmospheric and terrestrial variables derived from reanalysis. Our results show clear relationships between flood characteristics and atmospheric blocking occurring in upstream to downstream relative positions. Our analyses highlight that atmospheric blocking significantly influences spatial and temporal variability of flood discharge in Europe, being this relationship modulated by regional hydrological characteristics and the interaction between soil and rainfall. These findings provide a framework to understand the regional impacts of atmospheric blocking over floods and point towards near-climate sources of predictability for floods in Europe.

How to cite: Hernandez, D., Bertola, M., Lun, D., Ahrens, B., McPhee, J., and Blöschl, G.: Flood discharge in Europe influenced by atmospheric blocking, EGU General Assembly 2026, Vienna, Austria, 3–8 May 2026, EGU26-15011, https://doi.org/10.5194/egusphere-egu26-15011, 2026.

An ensemble of 12 CMIP6 models was used to project future changes in summer extreme precipitation over eastern China during 2036-2055 under the SSP2-4.5 scenario. Extreme precipitation was quantified using the total precipitation from days exceeding the 95th percentile of wet-day precipitation (R95pTOT). Large inter-model uncertainty is evident over the Huabei region, substantially reducing the reliability of the multi-model ensemble (MME) projection there. To address this inter-model uncertainty, a pattern-based clustering analysis was applied to the MME projections, yielding three distinct and equally likely patterns (Clusters 1-3) of summer extreme precipitation change. Clusters 1 and 3 project increases in extreme precipitation over Huabei for 24.8 mm and 12.7 mm, whereas Cluster 2 indicates a decrease for -1.2 mm. An atmospheric moisture budget analysis reveals that the inter-cluster differences in extreme precipitation changes are primarily driven by dynamic effect associated with contrasting circulations. In Cluster 1, a strengthened and westward-shifted western North Pacific subtropical high (WNPSH) enhances southerly moisture transport, which is associated with cold SSTA over the central tropical Pacific. Cluster 3 exhibits a circulation pattern similar to that of Cluster 1, but with weaker intensity. In contrast, Cluster 2 is characterized by a weakened and eastward-shifted WNPSH at lower level, together with a southward-displaced East Asian subtropical westerly jet at upper level, resulting in less southerly moisture transport. In addition to differences in summer-mean circulation, atmospheric stability conditions over Huabei were compared across these clusters. Clusters 1 and 3 exhibit higher frequency of cases with large convective potential energy (CAPE), whereas Cluster 2 indicates more frequent occurrence of cases with large convective inhibition (CIN). 

How to cite: Guo, Y.: Causes of inter-model uncertainty in projecting future summer extreme precipitation changes over eastern China, EGU General Assembly 2026, Vienna, Austria, 3–8 May 2026, EGU26-15469, https://doi.org/10.5194/egusphere-egu26-15469, 2026.

EGU26-15484 | ECS | Posters on site | CL3.1.1

Assessment of GFS weather forecast model performance in reproducing the main atmospheric circulation patterns linked to precipitation in western tropical South America 

Kelita Quispe, Vincent Moron, Katerina Goubanova, J. Alejandro Martínez, Isabella Zin, Clementine Junquas, Jean Emmanuel Sicart, Thomas Condom, Tania Ita, Wilson Suarez, and Jhan-Carlo Espinoza

Rainfall events in South America have increased in frequency and intensity over recent decades, causing significant socio-economic impacts. Understanding the large-scale atmospheric circulation patterns (CPs) associated with these events is crucial for improving weather forecasting and risk assessment. Therefore, this study aims to evaluate the skill of the Global Forecast System (GFS) forecasts in reproducing the main CPs and their associated rainfall over western tropical South America.
Daily winds at 200 and 850 hPa from the ERA5 reanalysis and GFS (D0 to D5, where D0 is the initial state and D1–D5 are the 1–5 day forecast) are used. In addition, gridded precipitation data from CHIRPS and GFS are analyzed. All datasets have a spatial resolution of 0.25° and cover the period 2015–2024. A combined principal component analysis (PCA) and k-means clustering approach is applied to identify nine circulation patterns for ERA5 and GFS. Composite analysis is used to relate each CP to its characteristic spatial precipitation patterns. The analysis is structured in two stages: (i) a comparison between ERA5 and the first step of GFS (GFS-D0) and (ii) an evaluation of forecast consistency from GFS-D0 to the subsequent five forecast days (GFS-D1 to GFS-D5). For both stages, the Heidke Skill Score (HSS) is calculated based on the daily occurrence frequency of the CPs.
ERA5 and GFS (D0 to D5) consistently identify the nine CPs, which are classified into three wet, two transitional, and four dry patterns, exhibiting a well-defined seasonal behavior over tropical South America (10°N–30°S, 90°W–30°W). ERA5 and GFS-D0 identify CPs with similar frequency and spatial behavior with a statistically significant association and high seasonal HSS values close to 0.9. When analyzed at the individual CP scale, all patterns exhibit high agreement, although transitional patterns show slightly lower skill. As forecast lead time increases, forecast consistency gradually degrades. HSS values decrease from approximately 0.9 on day 1 to about 0.5 on day 5 during austral winter, autumn, and spring, indicating a predictability limit beyond the third forecast day. Predictability is seasonal, with the highest persistence during austral summer and the lowest during winter. In this context, wet CPs exhibit the greatest stability, while dry patterns show the fastest degradation. Increasing lead time is also associated with growing spatial differences in wind and precipitation fields. Regarding precipitation, CHIRPS and GFS show a consistent spatial behavior, especially for the first forecast day, while these differences become more pronounced by the fifth forecast day. It is important to remark that CHIRPS and GFS present some discrepancies that could be associated with model biases.
These results demonstrate that GFS accurately reproduces dominant circulation patterns at short lead times. However, there is a clear degradation of predictability beyond three days, with important implications for rainfall forecasting and its spatial representation.

How to cite: Quispe, K., Moron, V., Goubanova, K., Martínez, J. A., Zin, I., Junquas, C., Sicart, J. E., Condom, T., Ita, T., Suarez, W., and Espinoza, J.-C.: Assessment of GFS weather forecast model performance in reproducing the main atmospheric circulation patterns linked to precipitation in western tropical South America, EGU General Assembly 2026, Vienna, Austria, 3–8 May 2026, EGU26-15484, https://doi.org/10.5194/egusphere-egu26-15484, 2026.

EGU26-16564 | ECS | Posters on site | CL3.1.1

Summer warming in the Northern Hemisphere midlatitudes amplified by tropical-extratropical interactions 

Dániel Topál, Qinghua Ding, Thierry Fichefet, and Csaba Torma

The Northern Hemisphere (NH) midlatitudes have exhibited intensified summer heat extremes over the past decades and growing evidence suggests that this reflects not only the thermodynamic background warming but also dynamical variability that promotes persistent ridging and land-atmosphere feedback. Here we assess the extent to which tropical-extratropical interactions, and in particular ENSO-like tropical Pacific variability, modulate NH summer circulation and eddy-mean flow feedbacks in ways that amplify midlatitude warming and extremes in addition to studying how the dynamical contribution may evolve under anthropogenic forcing. The analysis is motivated by an observed shift in the distribution of the summer daily surface temperatures across the midlatitudes towards more extreme warm conditions during years when tropical Pacific sea surface temperatures (SST) are anomalously cold over the period 1979-2024. The La Niña-like conditions in the tropics are accompanied by a coherent upper-tropospheric response characterized by enhanced ridging and meridional convergence of eddy momentum flux around 40°N. However, trends in eddy momentum flux convergence over the same period show opposite sign changes relative to the La Niña composite, despite tropical Pacific SST trends that appear La Niña-like, emphasizing that ENSO-like SST patterns in trends do not necessarily imply ENSO-like eddy-mean flow feedbacks and highlighting the role of the evolving mean state conditions. To isolate the role of radiative forcing versus SST changes, we analyze two sets of tropical Pacific pacemaker simulations conducted with the fully-coupled Community Earth System Model v.2, in which reanalysis SST anomalies are prescribed while radiative forcing is either held fixed or allowed to evolve. This design allows us to study how the evolving forced mean state alters the tropical precipitation/divergence response to SST and the midlatitude waveguide and eddy momentum convergence. We find that the observed shift towards more extreme warm summers during La Niña years emerges only when radiative forcing is fixed despite identical tropical Pacific SST nudging. We interpret this contrast through CO2-driven “fast” atmospheric adjustments (reduced radiative cooling) that weaken tropical vertical motions independent of SST warming, thereby altering the effective ENSO heating anomalies that drive teleconnections. Implications for the dynamical modulation of NH summer hot extremes by ENSO under continued anthropogenic forcing are discussed. Lastly, we show that a composite conditioned on capturing the observed trends in summer heat extremes in the CESM2 Large Ensemble also shows a La Niña-like tropical Pacific cooling and a chain of high-pressure trends across the NH midlatitudes, which suggests that tropical-extratropical interactions can amplify midlatitude summer warming albeit with a likely mean state-dependent response.

How to cite: Topál, D., Ding, Q., Fichefet, T., and Torma, C.: Summer warming in the Northern Hemisphere midlatitudes amplified by tropical-extratropical interactions, EGU General Assembly 2026, Vienna, Austria, 3–8 May 2026, EGU26-16564, https://doi.org/10.5194/egusphere-egu26-16564, 2026.

Despite ongoing global warming, extreme cold winter events continue to occur, with some winters experiencing more frequent extremes on an interannual scale, impacting densely populated mid-latitude regions. Previous studies have established a close link between Arctic sea ice anomalies and mid-latitude extreme cold events. Our findings reveal that since 2000, two key mechanisms have amplified the interannual variability of Arctic sea ice and its subsequent influence on extreme cold events in Asia. Firstly, accelerated phase transitions of ENSO have intensified the Western North Pacific anticyclone, which excites stronger Rossby waves propagating toward the Arctic. These waves enhance the interannual variability of Arctic sea ice by inducing anomalous anticyclonic circulation over the Arctic, which in turn increases moisture and heat fluxes into the region. Secondly, heightened interannual variability of the North Atlantic Oscillation (NAO) has increased poleward heat and moisture transport into the Arctic, further amplifying sea ice variability on interannual scales. This enhanced Arctic sea ice interannual variability then induces greater atmospheric instability in the Arctic, generating stronger Rossby waves that propagate into mid-latitude Eurasia. Consequently, anomalous anticyclonic circulation and more frequent blocking highs develop over Eurasia, ultimately intensifying the influence of Arctic sea ice on winter cold extremes in Asia.

How to cite: Wang, C. and Su, H.: Enhanced Impact of Arctic Sea Ice on Asian Cold Extremes: Interannual Variability Driven by ENSO and NAO, EGU General Assembly 2026, Vienna, Austria, 3–8 May 2026, EGU26-17908, https://doi.org/10.5194/egusphere-egu26-17908, 2026.

EGU26-18725 | ECS | Orals | CL3.1.1

AI reconstruction of European temperature and precipitation anomalies from Euro-Atlantic weather regimes 

Alessandro Camilletti, Gabriele Franch, Elena Tomasi, and Marco Cristoforetti

Euro-Atlantic weather regimes (WRs) provide a description of quasi-stationary large-scale circulation patterns that strongly modulate European weather variability and extremes. Yet, most existing work focuses on the correlation and impacts of the WR on European weather, while the estimation of ground-level meteorological variables, such as temperature and precipitation, from Euro-Atlantic WR remains largely unexplored.

This contribution presents an AI-based framework that maps Euro-Atlantic WR indices to monthly European 2-m temperature and precipitation anomalies, thereby making explicit the circulation–surface link at seasonal time scales. Using ERA5 (1940–2024), seven year-round WRs and four seasonal WRs (DJF/JJA) are derived from Z500 over the Euro-Atlantic sector via EOF analysis and k-means clustering. A residual neural network takes as input monthly WR indices and calendar information, and reconstructs anomaly fields over Europe.

The model achieves high anomaly correlation and low error across large parts of Europe, especially in winter, and substantially outperforms classical linear WR-composite reconstructions. When the model is driven by the WR indices predicted by the bias-corrected SEAS5, it achieves comparable or better performance across most of the evaluated metrics. To address the question “How accurately do we have to predict the monthly mean WR indices to obtain a seasonal forecast of two-meter temperature and total precipitation that is better than SEAS5?”, we systematically degrade the WR indices, quantify how reconstruction skill depends on WR forecast accuracy, and identify the threshold beyond which the AI reconstruction surpasses the ECMWF SEAS5 seasonal forecast in reproducing European temperature and precipitation anomalies for the winter and summer seasons.

Results demonstrate that a large fraction of the spatial structure of European monthly anomalies can be inferred from the low-frequency Euro-Atlantic regime state. This provides a quantitative basis for AI approaches that exploit regime predictability to enhance sub-seasonal to seasonal forecast of European weather anomalies and related risks.

How to cite: Camilletti, A., Franch, G., Tomasi, E., and Cristoforetti, M.: AI reconstruction of European temperature and precipitation anomalies from Euro-Atlantic weather regimes, EGU General Assembly 2026, Vienna, Austria, 3–8 May 2026, EGU26-18725, https://doi.org/10.5194/egusphere-egu26-18725, 2026.

EGU26-18823 | ECS | Orals | CL3.1.1

From Linear Clustering to Deep Learning: Assessing Weather Regimes’ Impacts on Winter Extreme Temperatures over Northwestern Africa with a Focus on Morocco. 

Saloua Balhane, Fatima Driouech, Rachida El Ouaraini, Mohammed El Aabaribaoune, and Hasnae Zerouaoui

This work investigates the connection between large-scale atmospheric dynamics in the North Atlantic and winter temperature variability by analyzing the contribution of weather regimes to the occurrence of daytime and nighttime cold and warm events in Northwest Africa, focusing on Morocco. 

Weather regimes are first identified using a conventional circulation-based framework relying on k-means clustering of geopotential height anomalies. The sensitivity of the inferred circulation–temperature relationships to the choice of regime identification method is then investigated by comparing classical geopotential-based regimes with classifications incorporating jet-stream information and with non-linear regimes derived from variational autoencoders. This analysis is intended to evaluate the robustness and impact relevance of weather regimes for winter temperature extremes in Morocco.

For daytime temperatures, warm winter days are generally associated with a Greenland Anticyclone (NAO−) configuration across most of Morocco, while the zonal regime (NAO+) exhibits a marked inland–coastal contrast, with warmer conditions inland. In contrast, Blocking (BL) and Atlantic Ridge (AR) regimes are more likely to lead to cold daytime events. The AR regime, in particular, shows a dominant influence, accounting for more than 80% of cold daytime events, especially in northern and coastal regions. For nighttime temperatures, the AR regime clearly favors cold outbreaks over the entire country, whereas NAO− conditions strongly enhance the occurrence of warm winter nights. These relationships can be physically interpreted in terms of large-scale warm and cold air mass advection from the Atlantic, with an additional contribution from local radiative warming or cooling under anticyclonic and cyclonic conditions. The intersections and differences between the above-mentioned methods are also analyzed in terms of correlations with the four extremes in addition to weather regime structure.

How to cite: Balhane, S., Driouech, F., El Ouaraini, R., El Aabaribaoune, M., and Zerouaoui, H.: From Linear Clustering to Deep Learning: Assessing Weather Regimes’ Impacts on Winter Extreme Temperatures over Northwestern Africa with a Focus on Morocco., EGU General Assembly 2026, Vienna, Austria, 3–8 May 2026, EGU26-18823, https://doi.org/10.5194/egusphere-egu26-18823, 2026.

EGU26-19853 | ECS | Orals | CL3.1.1

Identifying Climatological Regions and Driving Mechanisms of Frontogenesis 

Johannes Lutzmann, Clemens Spensberger, Kjersti Konstali, and Thomas Spengler

Due to their strong temperature gradients, fronts are a focal point of intense precipitation and gustiness related to extratropical cyclones. In addition, sustained condensational heating along trailing cold fronts has been shown to raise background baroclinicity, which can trigger secondary cyclogenesis and, consequentially, cyclone clustering.

To study the driving mechanism, synoptic-scale characteristics, and impacts of fronts throughout their lifecycles, we have developed a front tracking algorithm. A frontal lifecycle is therein defined as a 4-dimensional space-time volume of strong gradients in equivalent potential temperature that is coherent in both time and space.

Based on the climatology of frontal lifecycles, we identify distinct frontogenesis regions in the mid-latitudes. Frontogenesis typically occurs in the lee of meridionally oriented mountain ranges, such as the Rocky Mountains or the Andes, or along western boundary currents, such as the Gulf Stream or the Kuroshio. Fronts forming in these regions travel eastward along the storm tracks over a lifetime of one to two weeks. Such lifecycle characteristics distinguish mid-latitude fronts from stationary or short-lived airmass boundaries in lower latitudes, which are typically classified as fronts by conventional algorithms.

We furthermore associate characteristic dynamic drivers of frontogenesis in the identified frontogenesis regions to lifecycle properties such as duration, strength, and the occurrence of one or multiple secondary cyclogenesis. Thus, investigating how fronts link large-scale atmospheric conditions with downstream storm activity in the Storm Track regions.

How to cite: Lutzmann, J., Spensberger, C., Konstali, K., and Spengler, T.: Identifying Climatological Regions and Driving Mechanisms of Frontogenesis, EGU General Assembly 2026, Vienna, Austria, 3–8 May 2026, EGU26-19853, https://doi.org/10.5194/egusphere-egu26-19853, 2026.

EGU26-20140 | ECS | Posters on site | CL3.1.1

Circulation versus background warming: drivers of European hot and wet extremes since 1980 

Victoria M. Bauer, Dominik L. Schumacher, and Sonia I. Seneviratne

Changes in regional extreme weather and climate events intensify under human-induced global warming. We unravel the drivers and mechanisms driving historical European hot and wet extremes through high-resolution regional climate model simulations, using the ICOsahedral Nonhydrostatic model in climate limited area mode (ICON-CLM). Specifically, we disentangle the contributions of the large-scale weather situation (dynamic conditions) and the local temperature and humidity (thermodynamic conditions) in heatwaves and heavy precipitation events over Europe since 1980.

To this end, we drive ICON-CLM simulations over Europe using boundary conditions from a global model constrained to follow the observed large-scale circulation. We run two sets of experiments: one where both the regional and global model use historical forcing, and one where both use pre-industrial greenhouse gas and aerosol concentrations, while the large-scale circulation remains identical. The difference between these simulations isolates the thermodynamic contribution of anthropogenic climate change to extreme events. Moreover, we perform a simulation with climatological soil moisture, to further quantify the role of land-atmosphere interactions for climate extremes. This model chain and experimental design allows us to disentangle the dynamic and thermodynamic drivers of hot and wet extremes at high resolution, resolving mesoscale processes that are especially critical to heavy precipitation events. It also enables a process-based attribution of all major European extreme events since 1980, moving beyond the case-study paradigm that dominates current research.

How to cite: Bauer, V. M., Schumacher, D. L., and Seneviratne, S. I.: Circulation versus background warming: drivers of European hot and wet extremes since 1980, EGU General Assembly 2026, Vienna, Austria, 3–8 May 2026, EGU26-20140, https://doi.org/10.5194/egusphere-egu26-20140, 2026.

EGU26-20954 | Orals | CL3.1.1

A probabilistic event-storyline approach to assessing projected changes in a high-impact Mediterranean storm track 

Giuseppe Zappa, Paolo Ghinassi, Salvatore Pascale, Federico Grazzini, Cristina Iacomino, Alice Portal, and Claudia Simolo

An increase in precipitation extremes is one of the most robust signals of anthropogenic climate change. However, the latest IPCC assessment still reports low confidence in projected changes over the Mediterranean region. Despite this uncertainty, several Mediterranean cyclones—intense mid-latitude storms—have caused severe precipitation extremes and substantial economic damage in recent decades. The role of climate change in these events remains poorly quantified.

Here, we develop a probabilistic event-storyline approach and apply it to assess projected changes in a high-impact Mediterranean storm track. The storyline describes an autumn large-scale trough over the Iberian Peninsula, followed by cyclone development and northeastward propagation over the western Mediterranean Sea, leading to widespread daily extreme precipitation over the Italian Peninsula. This evolution was characteristic of two notable historical high-impact events: storm Adrian (Vaia) in October 2018 and the November 1966 storm that caused major flooding in Florence.  The probability of such events is decomposed into three conditional components: (i) the occurrence of the large-scale trough, (ii) the probability of northeastward-propagating Mediterranean cyclones given the precursor, and (iii) the probability of extreme precipitation given cyclone development. These probabilities are estimated using ERA5 reanalysis and a 17-member ensemble of the CMIP6 EC-Earth3 climate model under present-day and future (SSP2-4.5) climate conditions.

We show that EC-Earth3 provides a satisfactory representation of the Mediterranean autumn storm track, with ERA5-based conditional probabilities lying within the model ensemble spread. However, none of the ensemble members simulates a storm with a trajectory and intensity comparable to storm Adrian, highlighting the rarity of such events. Under SSP2-4.5, the ensemble projects no overall change in the frequency of events following this storyline. This result arises from a compensation between a strong reduction in the frequency of the large-scale precursor (risk ratio r ≈ 0.6), a moderate decrease in cyclone development given the precursor (r ≈ 0.8), and a strong increase in the probability of extreme precipitation conditional on storm development (r ≈ 2). The shallowing of large-scale troughs and the reduced frequency of deep cyclones counteract the expected thermodynamic intensification of precipitation over the Alpine region.

Overall, these findings highlight the need to explicitly account for dynamical changes when assessing future projections of cyclone-driven Mediterranean precipitation extremes. While based on a single large ensemble, the proposed framework can be extended by estimating individual conditional probabilities from different global and regional climate models, offering a pathway to integrate complementary sources of information.

How to cite: Zappa, G., Ghinassi, P., Pascale, S., Grazzini, F., Iacomino, C., Portal, A., and Simolo, C.: A probabilistic event-storyline approach to assessing projected changes in a high-impact Mediterranean storm track, EGU General Assembly 2026, Vienna, Austria, 3–8 May 2026, EGU26-20954, https://doi.org/10.5194/egusphere-egu26-20954, 2026.

Autumn precipitation in Southeast China (SC) exhibits substantial interannual variability, yet it has received considerably less attention compared to boreal summer precipitation. This study identifies a significant interdecadal shift in the teleconnection between the El Niño-Southern Oscillation (ENSO) and the SC autumn climate. We find that the influence of preceding winter ENSO on the subsequent early autumn precipitation in SC was weak and statistically insignificant during the late 20th century, but has become robustly positive since the early 2000s. Our analysis reveals that in the post-2000s period, El Niño events tend to decay more rapidly and transition into a developing La Niña phase by the following summer. This accelerated decay, coupled with persistent cold sea surface temperature anomalies (SSTA) in the eastern Pacific, sustains the Western North Pacific Anticyclone (WNPAC) from summer into autumn. Moreover, due to the “seesaw pattern” in the developing La Niña phase, the warming central Indo-Pacific triggers a meridional contraction of the local Hadley circulation and contributes to the cyclonic circulation over SC. This circulation change induces anomalous subsidence over the South China Sea and significant ascending motion over inland SC. Consequently, a distinct anticyclone-cyclone dipole emerges after the early 2000s, which provides both the anomalous moisture transport and the dynamical lifting necessary for enhanced precipitation. These findings offer critical insights for improving seasonal forecasting and climate model evaluation for East Asian autumn hydroclimate.

How to cite: Xu, L., Su, H., and Lau, W. K. M.: Strengthened Influence of Preceding Winter ENSO on the Following Early Autumn Precipitation in Southeast China since the Early 2000s, EGU General Assembly 2026, Vienna, Austria, 3–8 May 2026, EGU26-21038, https://doi.org/10.5194/egusphere-egu26-21038, 2026.

EGU26-21515 | Orals | CL3.1.1

Atmospheric drivers and climate change attribution of the October 2024 Valencia flooding  

Marika Koukoula, Andries-Jan de Vries, and Herminia Torelló Sentelles

On 29 October 2024, Valencia experienced one of the most catastrophic flood events in Spain’s recorded history, resulting in 232 deaths and widespread damage to infrastructure and property. This event raised urgent questions in science and society on the atmospheric processes that led to this extreme event and the influence of climate change in shaping its severity. The purpose of this study is twofold. First, using observation-based datasets, we investigate the large-to-local scale atmospheric processes leading to this extreme event. Second, using pseudo-global warming simulations with the Weather Research and Forecasting (WRF) model, we quantify the influence of climate change on this extreme event and determine how similar events may unfold in the future.


By identifying and tracking potential vorticity (PV) streamers and cut-off lows as 3-dimensional objects in ERA5, we show that this extreme event resulted from Rossby wave breaking over the North Atlantic nearly a week prior to the event. The cut-off low moved southwards and persisted over northwest Africa and the Iberian Peninsula for four consecutive days. The cyclonic circulation associated with this cut-off low initiated and sustained the transport of warm and moist air masses towards the eastern coast of Spain, generating favorable conditions for deep moist convection.


Present-day WRF simulations generally reproduce the extreme precipitation event well, despite a shift in its location and an underestimation of the highest rainfall amounts as observed at some stations. The consistency of simulated heavy precipitation across different initialization times further supports the robustness of the model results. While spatially aggregated daily precipitation amounts show little sensitivity across pre-industrial, present-day, and future scenarios, the most extreme sub-hourly precipitation intensities systematically increase with warming levels. Therefore, our findings suggest that flood events similar to the October 2024 Valencia flood are likely to recur under future climate conditions with comparable or greater short-duration precipitation intensity, underscoring the need for improved early warning systems and flood risk management.

How to cite: Koukoula, M., de Vries, A.-J., and Torelló Sentelles, H.: Atmospheric drivers and climate change attribution of the October 2024 Valencia flooding , EGU General Assembly 2026, Vienna, Austria, 3–8 May 2026, EGU26-21515, https://doi.org/10.5194/egusphere-egu26-21515, 2026.

EGU26-22703 | Posters on site | CL3.1.1

Synoptic circulation types related to the boundary layer height in Augsburg, Germany 

Andreas Philipp, Christoph Münkel, Annette Straub, Christoph Beck, and Klaus Schäfer

The thickness of the planetary boundary layer is one of the most important factors determining vertical transport and concentration of pollutants near the surface. However, the boundary layer height (BLH) as well as its structure, especially the occurrence of stable layering, depends to a large extent on the synoptic situation, i.e. mainly on strength and direction of the synoptic wind, advection of air masses of different properties and cloudiness. Several former studies show an increasing trend of the BLH, especially during daytime, throughout the last decades. The study presented here evaluates the dependence of the BLH for a selected region around the city of Augsburg in southern Germany on synopticcirculation types in order to better understand short term as well as long term BLH changes and their effects on the urban air quality of Augsburg.

Boundary layer heights are retrieved from ceilometer measurement series starting in 2017 using a routine for estimating BLH from Vaisala CL51 ceilometer laser backscatter data. They are compared to hourly ERA5 BLH data (1940 to 2025) in order to evaluate the uncertainty when using the ERA5 reanalysis data as replacement for observation data at the considered location for long term studies.

The algorithm for determination of synoptic circulation and weather type patterns related to the BLH is based on the SANDRA algorithm (Simulated Annealing and Diversified Randomization) where the target variable multiplied by an empirically determined weight is included into the clustering process. Different synoptic field variables including geopotential height, wind components and temperature at different atmospheric heights as well as the influence of cloud cover are examined and their contribution to the explained variance of the boundary layer height is presented and discussed. Finally, the suitability of the prescribed correlations for establishing statistical short term prediction models is discussed.

How to cite: Philipp, A., Münkel, C., Straub, A., Beck, C., and Schäfer, K.: Synoptic circulation types related to the boundary layer height in Augsburg, Germany, EGU General Assembly 2026, Vienna, Austria, 3–8 May 2026, EGU26-22703, https://doi.org/10.5194/egusphere-egu26-22703, 2026.

EGU26-1783 | Orals | AS1.38

Dust Storms and Long-Range Transport of Dust by Kelvin Waves in East Asia 

Ashok Kumar Pokharel and Michael Kaplan

A detailed study of the role of Kelvin waves in the development of dust storms resulting in the subsequent large-scale transport of dust was performed for three severe dust storm cases that occurred in China and Mongolia on May 3, 2020, March 15, 2021, and March 20, 2023. Observational and numerical model data were analyzed in depth. These data include MODIS satellite images, MERRA reanalysis, surface observations, atmospheric soundings, NAAPS aerosol modeling plots, and WRF simulations. This study found that there were adjustment processes resulting in Kelvin waves in all three cases. The resulting lower tropospheric wind and instability forced by these Kelvin waves caused dust ablation and transport parallel to the Tien Shan, Gobi Altai, and Khangai Mountains. The Kelvin waves developed in association with a cold air mass behind the large-scale cold front that propagated along the periphery of these major mountains. This study demonstrated that the interaction between those mountains and the rapidly changing background atmosphere were the contributing factors for the genesis and propagation of Kelvin waves. These waves caused three dust storms and the subsequent synoptic scale transport of dust impacting East Asia.

How to cite: Pokharel, A. K. and Kaplan, M.: Dust Storms and Long-Range Transport of Dust by Kelvin Waves in East Asia, EGU General Assembly 2026, Vienna, Austria, 3–8 May 2026, EGU26-1783, https://doi.org/10.5194/egusphere-egu26-1783, 2026.

EGU26-2133 | ECS | Posters on site | AS1.38

Role of North Atlantic warming in the extremely hot summer of 2023 in North China 

Yan Chen, Juan Feng, Wen Chen, Shangfeng Chen, and Shuoyi Ding

A deadly heatwave hit North China in the summer of 2023, causing severe damage to human health and public infrastructure. However, the underlying physical mechanism is still unknown completely. In this study, we explore the causative role of anomalous sea surface temperatures in three oceans using observation and reanalysis data, as well as partial regression and correlation methods. This heatwave exhibited the longest maximum duration of the past 50 years. According to the probability density function, the maximum temperature also reached an unprecedented high. A long-lived anticyclone dominated North China, causing persistent downward motion and adiabatic heating, enabling the heatwave to form and continue for more than 20 d. The Indian, Pacific, and North Atlantic oceans all experienced extreme warming. However, our results indicate that North Atlantic warming played a decisive role in the occurrence of this heatwave by exciting a Rossby wave train that propagated eastward, generating the long-lived anomalous anticyclone and inducing heatwaves. In comparison, the other two oceans exhibited weak or negative contributions to the heatwave. As the North Atlantic shows an obvious warming trend with increasing global warming, more attention should be paid to its relationship with heatwaves in North China.

How to cite: Chen, Y., Feng, J., Chen, W., Chen, S., and Ding, S.: Role of North Atlantic warming in the extremely hot summer of 2023 in North China, EGU General Assembly 2026, Vienna, Austria, 3–8 May 2026, EGU26-2133, https://doi.org/10.5194/egusphere-egu26-2133, 2026.

EGU26-2459 | Posters on site | AS1.38

Extreme Heat During the Warm Season Along the Lithuanian Baltic Sea Coast Based on In Situ Observations and Copernicus Data 

Inga Dailidienė, Anjelina Delalande, Donatas Valiukas, Remigijus Remigijus, Aleksas Narščius, Toma Dabulevičienė, and Filippos Tymvios

In recent decades, extreme heat events have emerged as one of the most significant indicators of accelerating climate change worldwide. New technologies, including remote monitoring, improve the monitoring, early warning, and forecasting of extreme climate events. Heat waves—prolonged periods of unusually high temperatures—are occurring with increasing frequency, intensity, and duration across the World, including regions historically characterized by moderate climate summers. This study examines extreme heat waves and tropical nights—phenomena historically uncommon in the mid-latitude Southeastern Baltic Sea region. Extreme heat and heat waves are defined as any period during which the daily maximum air temperature exceeds 30 °C, and a tropical night is one in which the daily minimum air temperature does not fall below 20 °C. Both in situ observations and model output from the Copernicus Climate Change Service were employed in the 1982–2024 analysis. The results reveal that the frequency of extreme heat waves is increasing. Extreme events have become an integral aspect of the unusually intensified climate change characterizing this century. Since 2018, the southeastern Baltic Sea coast has experienced at least one extreme heat wave and one tropical night each year. The observed rise in mean air and sea-surface temperatures has driven an uptick in tropical night occurrence. Forecasts of tropical-night formation could be substantially improved by integrating sea-surface temperature assessments for the southeastern Baltic coast. Moreover, timely adaptation to evolving weather conditions—through enhanced forecasting techniques and the incorporation of high-resolution reanalysis datasets—is essential for optimizing early-warning systems capable of safeguarding human health and lives. Climate change increases the frequency and intensity of heat waves, posing significant challenges to public health, the economy, the environment, and infrastructure. Therefore, advancing the understanding of extreme heat events through the use of cutting-edge technologies, remote sensing, and Copernicus reanalysis data represents a key sustainability task. Such approaches enable more accurate assessments and forecasts of extremes, thereby supporting a safer, healthier, and more resilient future.

How to cite: Dailidienė, I., Delalande, A., Valiukas, D., Remigijus, R., Narščius, A., Dabulevičienė, T., and Tymvios, F.: Extreme Heat During the Warm Season Along the Lithuanian Baltic Sea Coast Based on In Situ Observations and Copernicus Data, EGU General Assembly 2026, Vienna, Austria, 3–8 May 2026, EGU26-2459, https://doi.org/10.5194/egusphere-egu26-2459, 2026.

A needle snow process lasting 10 hours occurred in Weihai,east of Shandong Province,China on February 21, 2024. The snowfall amount reached blizzard level, which was rare. In this paper, synoptic background and microphysical characteristics of the needle snow process were analyzed by the comprehensive observation data of dual polarization radar, precipitation weather instrument, ground automatic station, sounding,ERA5 reanalysis data and quasi-vertical profiles(QVP) method. The causes of needle snow were discussed. The results show that: (1) The needle snow process occurred under the background of large-scale rain and snow in China. During the needle snow period, freezing rain changed to ice pellets in the southern part of Shandong Province, and ice pellets changed to sheet or branch snow in the central and northern parts. The influencing system was backflow situation, with strong northeast wind below 925hPa and strong southwest wind above 700hPa.(2) The cloud top height of needle snow is about 500hPa, and the temperature below 600 hPa is always maintained at-6~-3℃ when needle snow occurs, which is also the main characteristic of needle snow to distinguish it from other snowfalls, such as ice pellets, freezing rain and plate crystal.(3) The diameter of needle crystal particles is 3~4mm, the maximum is 8mm, the final falling velocity is mainly below 2m/s, and the particle number concentration is two orders of magnitude higher than sleet. The snowfall intensity has a certain relationship with the size and particle number concentration of snowfall particles. The diameter of heavy snowfall particles with hourly snowfall of more than 1mm is larger and the particle number concentration is higher.(4) Reflectance factor ZH is generally 20~30dBZ, polarization correlation coefficient ρHV decreases, differential reflectivity ZDR is as high as 0.8~1.0dB, and the high value area of differential propagation phase shift KDP is concentrated below 1km during heavy snowfall.(5) Supercooled water is abundant during needle snow, and there is secondary production of Ice, which leads to high ice crystal particle number concentration.

How to cite: Yang, C. F.: Synoptic background and microphysical characteristics of a rare needle snow event, EGU General Assembly 2026, Vienna, Austria, 3–8 May 2026, EGU26-2506, https://doi.org/10.5194/egusphere-egu26-2506, 2026.

EGU26-3017 | ECS | Posters on site | AS1.38

The role of moisture source and temperature anomalies in the 2022 European Drought  

José C. Fernández-Alvarez, Raquel Nieto, Sergio M. Vicente Serrano, David Carvalho, and Luis Gimeno

The 2022 European drought was characterized by positive temperature anomalies associated with both adiabatic and diabatic physical processes, which favored excessive moisture absorption by the atmosphere. This warming, combined with peak atmospheric evaporative demand, marked atmospheric stability, and the predominance of anticyclonic conditions, resulted in a prolonged precipitation deficit. Positive temperature anomalies were identified in North Africa, the Mediterranean Sea, the central and eastern Atlantic Ocean, and Central and Eastern Europe, reinforcing the link between large-scale atmospheric circulation and drought development. In the months following the drought peak, particularly in September 2022, the redistribution of previously accumulated water vapor, along with the establishment of atmospheric instability, triggered episodes of extreme precipitation in southern and eastern Europe. These events were driven by the release of moisture from the affected regions, as well as additional contributions from the Mediterranean source, advective cooling, and positive anomalies in integrated vertical water vapor transport. This study highlights the importance of analyzing not only the development of droughts but also their subsequent impacts, since rising temperatures in a changing climate could intensify the occurrence of compound events, characterized by the concurrence of droughts and heat waves, and favor the emergence of extreme precipitation episodes associated with dry periods.

How to cite: Fernández-Alvarez, J. C., Nieto, R., Vicente Serrano, S. M., Carvalho, D., and Gimeno, L.: The role of moisture source and temperature anomalies in the 2022 European Drought , EGU General Assembly 2026, Vienna, Austria, 3–8 May 2026, EGU26-3017, https://doi.org/10.5194/egusphere-egu26-3017, 2026.

EGU26-3130 | Orals | AS1.38

A cul-de-sac effect makes Emilia-Romagna more prone to floods in a changing climate 

Enrico Scoccimarro, Andrea Borrelli, Lorenzo Sangelantoni, Leone Cavicchia, Stefano Tibaldi, Massimiliano Pasqui, and Giulio Boccaletti

The disastrous flood of May 2023 in Emilia-Romagna, Italy, displaced thousands of residents and had severe impacts on the economy, with extensive damage to infrastructure—roads, buildings, bridges— and losses in agriculture and livestock.

The flood was caused by two consecutive precipitation events, during which no hourly rainfall extremes were recorded, but for which accumulated rainfall over several days produced nonetheless extreme flooding, with a return period of over 500 years. The persistent, long-lasting precipitation was fueled by an uninterrupted vertically integrated water flux from the Adriatic Sea over the Po Valley, driven by a cyclonic circulation over Italy that remained stationary for several days.

A “cul-de-sac” effect, due to mountains that blocked moisture fluxes from the Adriatic Sea, amplified rainfall and was a root cause of the disaster. In this study, we analyze the dynamics of this case study in the context of the large-scale atmospheric circulation, focusing on the role of the stationary cyclonic structure over Italy, a feature that also characterized a similar event over the same area in 2024.

Furthermore, by examining the frequency of stationary cyclones in the Mediterranean region over recent decades, we are able to suggest that the persistent, dangerous configuration observed during the 2023 and 2024 events should be of concern to other Mediterranean areas that share similar conditions. A preliminary analysis also suggests that this class of events may become more frequent in a changing climate with important implications for the early warning systems. This work is part of ARTEMIS EU project # 101225852.

How to cite: Scoccimarro, E., Borrelli, A., Sangelantoni, L., Cavicchia, L., Tibaldi, S., Pasqui, M., and Boccaletti, G.: A cul-de-sac effect makes Emilia-Romagna more prone to floods in a changing climate, EGU General Assembly 2026, Vienna, Austria, 3–8 May 2026, EGU26-3130, https://doi.org/10.5194/egusphere-egu26-3130, 2026.

EGU26-4218 | ECS | Posters on site | AS1.38

Convection-Permitting RegCM Simulations of the September 2024 Czechia Floods: Sensitivity to Microphysics and Soil Moisture 

Manas Pant, Peter Huszár, Shruti Verma, Natália Machado Crespo, Tomas Halenka, Eva Holtanova, and Michal Belda

The extreme precipitation event of September 2024 over Central Europe caused widespread flooding in Czechia. Around 200 rivers were reported to have crossed their banks, and life in several cities came to a standstill. Representing such high-impact extreme events accurately remains a challenge for regional climate models. In the present study, we aim to explore the ability of the latest version of RegCM in representing such extreme rainfall events with different types of microphysical parameterizations and soil moisture representation at convection-permitting levels. A triple-nested domain framework has been adopted with a 27 km outer domain (EURO-CORDEX) nested to 9 km (covering central Europe) and further to 3 km (focused on Czechia). The 27 km and 9 km simulations use the Tiedtke convective parameterization, while the convection-permitting mode is chosen in the 3 km run to explicitly resolve the deep convection. Three microphysics schemes, namely WSM5, WSM7, and the Nogherotto–Tompkins scheme (NOG), are examined with soil moisture initialization switched on and off. This experimental design allows a systematic assessment of scale interactions and physical process sensitivities across resolutions. All these simulations are carried out with the 6-hourly initial and boundary conditions derived from ERA5 reanalysis data sets. Preliminary analysis indicates that RegCM is able to capture the heavy rainfall accumulation over the highly affected locations in the region of interest. The influence of soil moisture initialization becomes increasingly pronounced at convection-permitting scales, emphasizing the role of land surface conditions during extreme rainfall events. Among all the considered combinations, the simulations with WSM5 with soil moisture initialization seem to be closest to the observations with 3 km resolution. This study demonstrates the sensitivity of state-of-the-art RegCM to the microphysics parameterization, soil moisture initialization, and convection-permitting resolution, which are critical for improving the simulation of extreme precipitation and flood events over the European region.

How to cite: Pant, M., Huszár, P., Verma, S., Machado Crespo, N., Halenka, T., Holtanova, E., and Belda, M.: Convection-Permitting RegCM Simulations of the September 2024 Czechia Floods: Sensitivity to Microphysics and Soil Moisture, EGU General Assembly 2026, Vienna, Austria, 3–8 May 2026, EGU26-4218, https://doi.org/10.5194/egusphere-egu26-4218, 2026.

This study presents a novel unified extreme value theory (UEVT) for the simultaneous analysis of positive and negative anomalous events derived from anomaly time series. This framework enables the characterization of the return level–return period relationship, and by providing clear definitions for the critical and average intensity of N-year anomalous events, quantifies the temporal evolution of their intensity and frequency characteristics. Based on the UEVT, an interval extreme value distribution (IEVD) is further developed, which offers a statistical model for fitting both the upper and lower tails of anomaly series and for predicting changes of anomalous events with longer return periods. The UEVT and IEVD demonstrate broader applicability, higher accuracy, and improve practical utility compared to the traditional extreme theory and distributions. The results for N-year temperature anomalies suggest that there is a consistent increase in the intensity and frequency of warm events and a decrease in those of cold events under global warming. Regions exhibiting warming holes or cooling blobs, driven by internal climate variability, offer critical areas for future research on climate extremes. Notably, a southward expansion of warm events from the northern high latitudes and the increasing intensity of warm events in tropical regions show new characteristics of climate change. The hindcast intensity of anomalous events under longer return periods agrees well with the observed trend, and this framework is used to derive short-term predictions for future climate extremes. Additionally, a new prediction method integrating sliding trend with variability can provide a new perspective for modeling non-stationary extremes under strong climatic trends. These methods can be extended to the detection and attribution of extreme events and applied to the future climate projection with climate models.

How to cite: Ban, W. and Li, J.: The unified extreme value theory for characterizing changes in return periods and levels of N-year temperature anomalies, EGU General Assembly 2026, Vienna, Austria, 3–8 May 2026, EGU26-4696, https://doi.org/10.5194/egusphere-egu26-4696, 2026.

EGU26-5137 | Orals | AS1.38

Examining extreme weather events in the Middle East: Trends and future outlooks. 

Diana Francis, Ricardo Fonseca, Narendra Nelli, Charfeddine Cherif, George Zittis, and Andries Jan de Vries
In this presentation, we will showcase the latest knowledge on trends and projections of extreme weather events over the Middle East with a particular focus on convection and extreme rainfall and flood events. For instance, in April 2024, the United Arab Emirates experienced unprecedented rainfall, triggering severe flooding and widespread disruption. We will present the driving mechanisms, localized impacts, and potential influence of human-driven climate change on this extraordinary event. We will also examine how anthropogenic climate change is increasing the frequency of extreme events in the Middle East and the role of large-scale circulation and dynamics in these events. Additionally, trends in convection development and rainfall during the last 4 decades will be presented for the two main seasons in the region: summer and winter/spring. 
Published papers related to this presentation: https://www.nature.com/articles/s41612-025-01073-1 and https://doi.org/10.1029/2025GL118960


How to cite: Francis, D., Fonseca, R., Nelli, N., Cherif, C., Zittis, G., and Jan de Vries, A.: Examining extreme weather events in the Middle East: Trends and future outlooks., EGU General Assembly 2026, Vienna, Austria, 3–8 May 2026, EGU26-5137, https://doi.org/10.5194/egusphere-egu26-5137, 2026.

EGU26-5391 | ECS | Posters on site | AS1.38

Environment-dependent hail hazard maps from high-resolution modelling 

Iciar Guerrero-Calzas, Foteini Baladima, Ana Cortés, Mauricio Hanzich, and Josep Ramón Miró

Hail is one of the most damaging convective hazards. However, hail hazard maps are commonly derived from long-term climatologies or numerical simulations based on a single, fixed model configuration that do not account for the influence of the large-scale atmospheric environment on hail-producing convection, limiting the physical consistency and reliability of hazard estimates.

In this study, we present hail hazard maps derived from a synoptic-regime-aware modelling framework. To construct these maps, hail days are first classified into distinct synoptic situations using a clustering analysis of large-scale atmospheric fields. For each synoptic regime, a genetic algorithm is used to optimize the physical parameterization configuration of the Weather Research and Forecasting (WRF) model, targeting an improved simulation of hail occurrence evaluated against ground-based hail observations. This approach results in a regime-specific WRF configuration for hazard map generation, rather than a single configuration applied across all atmospheric conditions.

High-resolution, convection-permitting WRF simulations are then performed to generate hail hazard maps. Each simulation is run using the configuration optimized for its corresponding synoptic regime. The regime-specific simulations are subsequently combined to produce hazard maps.

The proposed approach provides a physically informed, flow-dependent strategy for hail hazard mapping, enabling a more realistic representation of extreme convective events and their spatial variability. This methodology could offer a robust framework for regional hail risk assessment.

How to cite: Guerrero-Calzas, I., Baladima, F., Cortés, A., Hanzich, M., and Miró, J. R.: Environment-dependent hail hazard maps from high-resolution modelling, EGU General Assembly 2026, Vienna, Austria, 3–8 May 2026, EGU26-5391, https://doi.org/10.5194/egusphere-egu26-5391, 2026.

EGU26-5414 | ECS | Orals | AS1.38

Ensemble Forecasting of Extreme Events at Subkilometer Scales 

Martin Frølund, Xiaohua Yang, Emy Alerskans, Ole Wignes, and Ulf Andrae

Extreme weather events, such as heavy precipitation, strong winds, and convective storms, pose significant challenges to societies. Accurate forecasting of these events at high spatial and temporal resolutions, including uncertainty estimates, is crucial for effective disaster preparedness and mitigation.
In this work, we present recent developments in the EPS (Ensemble Prediction System) aspects of the Destination Earth On-Demand Extremes Digital Twin (DE_330_MF), which offers a highly configurable, on-demand workflow capable of detecting extreme weather events and triggering high-resolution forecasting at subkilometer scales. These features are valuable in supporting decision-makers in impact sectors such as hydrology, air quality, and energy. We showcase and evaluate the performance of the ensemble forecasting capabilities of this workflow with respect to prediction skill and uncertainty estimates.
We assess the workflow's performance for a selection of European extreme weather events relative to kilometer-scale forecasting systems like DINI-EPS, which is operationally deployed in the UWC West Consortium (Denmark, Ireland, the Netherlands, and Iceland). The subkilometer results from these investigations generally demonstrate skillful performance compared to the coarser models, providing potential added value for national meteorological services and decision-makers.

How to cite: Frølund, M., Yang, X., Alerskans, E., Wignes, O., and Andrae, U.: Ensemble Forecasting of Extreme Events at Subkilometer Scales, EGU General Assembly 2026, Vienna, Austria, 3–8 May 2026, EGU26-5414, https://doi.org/10.5194/egusphere-egu26-5414, 2026.

EGU26-6320 | ECS | Posters on site | AS1.38

Recently Intensified Extreme Precipitation in Late Spring in the Hengduan Mountains 

Meiying Zheng, Shengyuan Liu, and Huizhi Liu

Using multiple sources of daily precipitation datasets, ERA5 reanalysis data, and HadISST sea surface temperature data from 1979 to 2024, this study identifies a significant increasing trend in May precipitation over the Hengduan Mountains (HM). The contribution of extreme precipitation (R95p) to total precipitation (PRCPTOT) increased at a rate of 1.48% (10yr)⁻¹. A regime shift occurred around 1998, after which PRCPTOT and R95p increased by 18.2% and 46.9%, respectively. This increase is primarily driven by vertical and horizontal moisture advection. Thermodynamic effects (increased moisture) dominate the southwestern Yunnan portion of HM, while dynamic effects (anomalous ascent) are more prominent in its Tibetan portion. Furthermore, R95p exhibits higher sensitivity to specific humidity than PRCPTOT, causing its contribution to total precipitation to rise from 17.76% to 22.07% post-1998. These changes are linked to the phase shifts of the Atlantic Multidecadal Oscillation (AMO) to positive and the Pacific Decadal Oscillation (PDO) to negative in the late 1990s. This combination triggered wave activity flux, establishing a "high-level divergence, low-level convergence" structure over HM and the Bay of Bengal. This structure facilitated the early establishment of the onset of the Bay of Bengal Summer Monsoon (BOBSM). Three pathways—BOBSM-induced cyclonic anomalies, enhanced upper-level westerlies, and southeasterly flow from the South China Sea—channeled moisture into HM. These results highlight the potential of AMO and PDO as interdecadal predictors for water resource management in this critical "water tower" region.

How to cite: Zheng, M., Liu, S., and Liu, H.: Recently Intensified Extreme Precipitation in Late Spring in the Hengduan Mountains, EGU General Assembly 2026, Vienna, Austria, 3–8 May 2026, EGU26-6320, https://doi.org/10.5194/egusphere-egu26-6320, 2026.

EGU26-6393 | ECS | Posters on site | AS1.38

Recent global intensification of per capita exposure to extreme precipitation 

Shengyuan Liu, Shifei Tu, and Jianjun Xu

While extreme precipitation intensifies globally, aggregate exposure metrics often mask the individual experience of climate risk. To address this gap, we quantify per capita exposure to extreme precipitation from 2000 to 2024 using population-weighted gridded analysis, decomposing exposure trends into contributions from climate intensification, demographic shifts, and their spatial covariance. Our observational analysis reveals that per capita exposure to extreme precipitation is intensifying at a rate significantly exceeding global mean precipitation change. This amplification is primarily driven by the spatial synchronization between urbanization patterns and the thermodynamic “wet-get-wetter” paradigm, resulting in increased geographical overlap between high-density settlements and extreme precipitation hotspots. Regional analysis reveals distinct mechanisms: while exposure in East Asia and North America is predominantly climate-driven, the increases in Africa and Oceania are dictated by structural shifts in population distribution. By bridging macro-scale climate statistics with individual-level risk perception, the per capita exposure metric offers a more intuitive proxy for personal hazard experience. These findings offer critical baselines for regional adaptation and the development of more resilient societies against extreme event-related disasters.

How to cite: Liu, S., Tu, S., and Xu, J.: Recent global intensification of per capita exposure to extreme precipitation, EGU General Assembly 2026, Vienna, Austria, 3–8 May 2026, EGU26-6393, https://doi.org/10.5194/egusphere-egu26-6393, 2026.

EGU26-6588 | ECS | Orals | AS1.38

Assessing the performance of the CERRA dataset in reproducing extreme weather events in Poland 

Kinga Kulesza, Maciej Jefimow, and Joanna Strużewska

Understanding the extreme weather events — such as heat waves, heavy precipitation, and episodes of strong winds — is crucial for assessing and managing climate-related impacts on human activities, ecosystems, and the environment. Global reanalysis datasets, including ERA5, and ERA5-Land, are widely used for studying such extremes; however, their relatively coarse spatial resolution can limit their ability to accurately capture localized and high-impact events. The high-resolution Copernicus European Regional ReAnalysis (CERRA) provides a regional alternative that has the potential to improve the representation of extreme meteorological conditions. This study benchmarks the performance of CERRA against established ERA-based reanalyses (ERA5 and ERA5-Land) using in-situ observations from Poland as an independent reference. The evaluation focuses on a set of temperature, precipitation, and wind-related extreme indices to assess how effectively each reanalysis reproduces observed extremes. The results indicate that CERRA outperforms the ERA-based products in representing extreme temperature and precipitation events, while improvements for wind speed extremes are more limited. In addition, three representative case studies — a severe heat wave from July 2010, a heavy rainfall event which led to a flood in June 2010, and a strong wind episode caused by the cyclone Kyrill in 2007 — are examined to provide a process-oriented comparison of CERRA and ERA reanalyses. Overall, the findings demonstrate that CERRA offers clear added value over ERA5 and ERA5-Land for the analysis of extreme weather events in Poland, highlighting its suitability for high-resolution climatological applications.

How to cite: Kulesza, K., Jefimow, M., and Strużewska, J.: Assessing the performance of the CERRA dataset in reproducing extreme weather events in Poland, EGU General Assembly 2026, Vienna, Austria, 3–8 May 2026, EGU26-6588, https://doi.org/10.5194/egusphere-egu26-6588, 2026.

Global warming is profoundly reshaping the terrestrial water cycle. Relative Humidity (RH), serving as a critical nexus between the water and carbon cycles, plays a pivotal role in maintaining ecosystem stability. Although a consensus exists regarding the long-term decline in global surface RH, focusing exclusively on the mean state often masks the asymmetric amplification of extreme RH events in terms of frequency and intensity, potentially leading to an underestimation of future climate risks. Based on ERA5-Land reanalysis data from 1980–2023, this study systematically evaluates the spatiotemporal characteristics of extreme low (RH05d) and extreme high (RH95d) RH events and unravels their driving mechanisms using detrended partial correlation analysis. Our study find that the significant decreasing trend in global land surface RH (−0.49%/decade) is primarily driven by the surge in extreme low RH events. Over the past 44 years, the evolution of extreme RH events has exhibited distinct asymmetry: the frequency of extreme low RH events has increased significantly (0.22 days/year), a rate approximately three times that of the decrease in extreme high RH events. This intensification is statistically significant across 47.2% of global land pixels, particularly concentrated in the Amazon, Central Africa, and the mid-to-high latitudes of the Northern Hemisphere. Attribution analysis confirms that this asymmetry stems from a "mechanistic divergence": the intensification of extreme low RH events is dominantly driven by thermodynamic factors (temperature and radiation), reflecting the surge in "atmospheric water demand" caused by the exponential increase in Vapor Pressure Deficit (VPD) under warming. Conversely, extreme high RH events are strictly limited by "moisture supply constraints"; the supplementation rates of precipitation and soil moisture fail to keep pace with the rising thermodynamic demand, thereby suppressing the occurrence of high-humidity events in most regions. The "mechanistic divergence" framework proposed in this study elucidates the non-linear response of RH from its mean state to its extremes. This finding provides a novel physical perspective for understanding the evolution of extreme humidity under non-stationary climate conditions and offers a scientific basis for overcoming the limitations of the traditional mean-state perspective to accurately assess the asymmetric eco-hydrological risks under global warming.

How to cite: Yu, Z. and Xia, H.: Stable decline in global surface relative humidity masks the distinct intensification of extremes, EGU General Assembly 2026, Vienna, Austria, 3–8 May 2026, EGU26-6658, https://doi.org/10.5194/egusphere-egu26-6658, 2026.

EGU26-6961 | ECS | Posters on site | AS1.38

Coherent Modes of Northern Hemisphere Wind Extremes and Their Links to Global Large-Scale Drivers 

Kai Bellinghausen, Eduardo Zorita, and Birgit Hünicke

We investigate the spatially coherent modes of storminess over the Northern Hemisphere (NH) land regions during 1940–2023. Locally, stormy days are defined by us as local exceedances of the 95th-percentile of wind speed anomalies derived from ERA5 reanalysis data. Applying a Principal Component Analysis (PCA) to seasonal (ONDJFM) local storm indices reveals a leading mode of hemispheric variability characterised by a north–south dipole structure. 

Regions north of 50° N (Europe–Asia) fluctuate coherently, in opposite phase to those farther south. 
Correlation analyses between the principal component time series and global spatial fields of sea surface temperature (SST), mean sea level pressure (MSLP), and skin temperature (i.e. surface temperature at radiative equilibrium; SKT) identify teleconnections to the North Atlantic Oscillation (NAO) and Pacific SST anomalies, indicating that known climate modes modulate storm synchrony.

To explore physical causality between SKT and storminess modes related to the atmospheric response to SKT anomalies, the relevant patterns of SKT identified in the SKT–storm correlation analysis were used to drive the ACE2 climate emulator. The ACE2 emulator is a recently released artificial-intelligence emulator trained with ERA5 reanalysis. The emulator experiments reproduce the observed storm variability pattern and yield a split jet-stream response with both poleward and equatorward branches. 

These results provide causal evidence that coherent large-scale patterns of seasonal storminess exist and that large-scale surface temperature gradients can excite those coherent patterns of hemispheric storm variability.

Our findings bridge statistical climate variability with physical processes, offering a framework for understanding how continental storm risks respond to changes in global surface temperature.

How to cite: Bellinghausen, K., Zorita, E., and Hünicke, B.: Coherent Modes of Northern Hemisphere Wind Extremes and Their Links to Global Large-Scale Drivers, EGU General Assembly 2026, Vienna, Austria, 3–8 May 2026, EGU26-6961, https://doi.org/10.5194/egusphere-egu26-6961, 2026.

EGU26-8991 | ECS | Orals | AS1.38

Sensitivity of extreme 2022 Pakistan precipitation to physics parametrization options in WRF 

Alex Martínez-Vila and Santos J. González-Rojí

Pakistan is one of the most vulnerable countries to climate change due to its large exposure and vulnerability. In particular, climate models project an increase in heavy precipitation and flood intensity or frequency in the area. However, some uncertainties remain, which are in part related to its complex orography interacting with local dynamics, such as the Karakoram high-mountain region and the Indian summer monsoon. As a consequence, convection-permitting high-resolution simulations are needed. These allow for a better representation of steep orography and resolve deep convection, improving the simulation of precipitation. However, physics parametrization options need to be tested at high-resolution in order to improve these models.

This work evaluates the performance of different parametrization schemes in the Weather Research and Forecasting (WRF) model in simulating the extreme precipitation events that occurred in Pakistan in August 2022. This extreme precipitation primarily affected Southern provinces and led to disastrous flooding that resulted in numerous deaths, displaced people and loss of infrastructure and crop production. It was caused by westward propagating cyclones interacting with hot, moist air advected from the Arabian sea.

Results show differences in the spatial distribution and intensity of precipitation. In most setups, cyclones show a northward bias, where they interact with steep orography producing anomalous precipitation. Simulations are most sensitive to the microphysics parametrization, with the Thompson microphysics scheme producing the best results with respect to observations and reanalysis.

How to cite: Martínez-Vila, A. and González-Rojí, S. J.: Sensitivity of extreme 2022 Pakistan precipitation to physics parametrization options in WRF, EGU General Assembly 2026, Vienna, Austria, 3–8 May 2026, EGU26-8991, https://doi.org/10.5194/egusphere-egu26-8991, 2026.

EGU26-9971 | Orals | AS1.38

Climate Extremes in Europe: A Comparative Analysis of Climate Model Datasets 

Anton Laakso, Mira Hulkkonen, Akash Deshmukh, Ian G. Brosnan, Taejin Park, Hugo Lee, Weile Wang, Bridget Thrasher, Jessica L. McCarty, Harri Kokkola, and Tero Mielonen

Ongoing climate change is increasing the need for reliable climate information to support adaptation, particularly for climate extremes whose frequency and intensity are projected to rise and cause substantial societal and environmental impacts. Adaptation planning often requires highly localized information, yet global climate models (GCMs) typically operate at coarse spatial resolutions (~100 × 100 km) and have limited skill in representing extremes. To address this, downscaling techniques are widely used to generate higher-resolution climate information. Statistical downscaling links large-scale model output to local observations, while dynamical downscaling employs high-resolution regional climate models driven by GCM boundary conditions. The strengths and limitations of each approach need to be evaluated.

In this study, temperature- and precipitation-related climate extreme indices were computed using multiple publicly available datasets, including global model outputs from CMIP5 and CMIP6, statistically downscaled products (NEX-GDDP-CMIP6 and CIL-GDPCIR), and dynamically downscaled regional simulations from EURO-CORDEX. All datasets were harmonized to a common spatial resolution to enable direct comparison. The analysis covers a historical period (1990-2019) and a future period (2071-2100) under a middle-of-the-road emissions scenario (RCP4.5/SSP2-4.5). Historical simulations were evaluated against a gridded observational dataset (E-OBS) and two reanalysis products (ERA5 and GMFD). Using daily temperature and precipitation data, 17 climate extreme indices were calculated, along with detailed analyses of mean conditions and two representative extremes: annual maximum temperature and maximum 5-day precipitation.

Downscaling generally improves the representation of the European climate compared to global models. Statistically downscaled and bias-corrected datasets perform better for mean and extreme temperature and for mean precipitation, while improvements for precipitation extremes are limited. Dynamically downscaled EURO-CORDEX simulations show systematic regional biases, particularly in Nordic regions, and generally produce higher precipitation extreme indices. No single dataset consistently outperforms others across all regions, with complex terrain and coastal areas remaining challenging. Despite performance differences, all datasets project similar overall trends in climate extremes under warming, although the magnitude and regional patterns vary. Uncertainties in observational and reanalysis datasets, especially for precipitation, further complicate model evaluation. Overall this analysis highlights the need for clearer guidance on dataset selection for adaptation applications.

How to cite: Laakso, A., Hulkkonen, M., Deshmukh, A., Brosnan, I. G., Park, T., Lee, H., Wang, W., Thrasher, B., McCarty, J. L., Kokkola, H., and Mielonen, T.: Climate Extremes in Europe: A Comparative Analysis of Climate Model Datasets, EGU General Assembly 2026, Vienna, Austria, 3–8 May 2026, EGU26-9971, https://doi.org/10.5194/egusphere-egu26-9971, 2026.

EGU26-10616 | Posters on site | AS1.38

Extreme precipitation event in Slovakia in September 2024. 

Juraj Holec, Ladislav Markovič, and Pavol Faško

In September 2024, much of Central Europe experienced above-average precipitation. In mid-September, Storm Boris brought heavy rainfall, flooding, and significant damage to Central and Eastern Europe. This study analyzes the intensity, spatial distribution, and meteorological drivers of the event using observational data from more than 600 precipitation stations across Slovakia. The event is placed in a historical context by comparing its maximum, multi-day, and cumulative precipitation totals recorded between September 11 and September 16, 2024, with previous extreme precipitation occurrences. Additionally, return period estimates and standard deviations [σ] were employed to assess the rarity of the event. The results indicate that the highest-ever recorded 2-day (267.3 mm in Borinka) and 5-day (379.8 mm in Pernek) precipitation totals in Slovakia occurred during this event. More than 20% of stations with available data recorded new maximum 2-day or 5-day precipitation totals, with multi-day totals surpassing the 100-year and 200-year quantiles. The extremity of the precipitation was most pronounced in 5-day totals, with some stations reporting values at or above the 6-sigma level.

How to cite: Holec, J., Markovič, L., and Faško, P.: Extreme precipitation event in Slovakia in September 2024., EGU General Assembly 2026, Vienna, Austria, 3–8 May 2026, EGU26-10616, https://doi.org/10.5194/egusphere-egu26-10616, 2026.

EGU26-11491 | Orals | AS1.38

Indicators of extreme hazards in regional and convection-permitting climate models from the EU-Impetus4Change project 

Stephen Outten, Francesca Raffaele, Natalia Zazulie, and Silius Vandeskog

Europe suffers great financial loss and loss of life every year due to extreme events, particularly heat waves, flooding, droughts, and wildfires. The impacts of these events are increasing with both the increasing exposure of society and the increasing intensity and frequency of the events themselves under a warming climate. Accurate projections of the future changes in extreme events are vital for those stakeholders responsible for preparing the European cities to withstand future extreme events. They are also highly valuable to many industries which are heavily exposed to the impacts of extreme events, including insurance, construction, agriculture, health and energy. However, any adaptation requires information that is tailored to the needs and workflow of the decision makers.

In the EU-Impetus4Change project (I4C), we worked with stakeholders from four cities across Europe to select hazard indicators that are relevant to their ongoing adaptation work. The cities of Paris, Prague, Barcelona, and Bergen, were selected because they represent a wide range of climates across Europe and because they provide a sample of the different types of hazardous events faced by most European cities. The selected indicators focus primarily on extreme temperatures and precipitation hazards, though some relate to other sectors including energy and human health. The indicators have been calculated in 67 Euro-CORDEX simulations covering 120 years from 1980 to 2100 at a horizontal resolution of 0.11°. They have also been calculated in various convection permitting simulations of 10-year time slices in the current, mid-century and end of century, with a horizontal resolution of 3 km. This talk will present highlights from the analysis of this unique dataset, show the projected changes in these stakeholder-relevant indicators across different Global Warming Levels (GWLs), explore the biases compared to reanalysis, and examine the improvements of the convection permitting simulations compared to the lower resolution Euro-CORDEX simulations. The full dataset of these indices is planned to be made openly available through an online, user-friendly toolkit as part of the ongoing I4C project.

How to cite: Outten, S., Raffaele, F., Zazulie, N., and Vandeskog, S.: Indicators of extreme hazards in regional and convection-permitting climate models from the EU-Impetus4Change project, EGU General Assembly 2026, Vienna, Austria, 3–8 May 2026, EGU26-11491, https://doi.org/10.5194/egusphere-egu26-11491, 2026.

EGU26-11774 | Posters on site | AS1.38

Performance of two global models in forecasting extreme rainfall volumes over southern Brazil 

Henrique Fuchs Bueno Repinaldo, Mateus Da Silva Teixeira, and Cintia Rabelo da Rocha Repinaldo

Extreme rainfall in late April–early May 2024 led to the most severe flooding ever recorded in the Guaíba River Basin, southern Brazil.. Waters from this basin drain into Patos Lagoon before reaching the Atlantic Ocean. As a result, the exceptional precipitation volumes caused widespread flooding both along the river network and in cities surrounding the lagoon. The event affected 2,398,255 people in 478 cities (96% of the cities in the state of Rio Grande do Sul), causing 184 fatalities and leaving 25 people missing. The Guaíba Basin lies in a topographically complex region, with mountainous areas that amplify orographic precipitation and increase the difficulty of forecasting by global models. The event was associated with an atmospheric configuration conducive to persistent rainfall, characterized by an intensified subtropical jet, strong warm and moist air transport by a low-level jet, and the passage of cold fronts. Together, these factors promoted the development of mesoscale convective systems and produced exceptionally high rainfall accumulations. Nearly all National Institute of Meteorology (INMET) stations within the basin recorded more than 200 mm over five days, with peak totals reaching 540 mm, resulting in exceptionally large runoff volumes. This study evaluates how well the global GFS and ECMWF models forecast accumulated precipitation over the Guaíba Basin at lead times of up to 72 hours. Model precipitation forecasts were converted to basin-integrated rainfall volumes (m³) and evaluated against observations from INMET automatic stations interpolated onto the same grid. This volumetric approach captures the basin’s hydrological response more directly than traditional metrics based on point measurements or spatial averages. The results show that both models strongly underestimated the precipitation volume over the basin, with biases on the order of 10 to 18 billion m³ at lead times of 48 to 72 hours. Although the ECMWF showed better performance during the first 12–24 hours, both models quickly converged toward similarly underestimated solutions. This behavior indicates a failure to represent the persistence of the atmospheric circulation and the sustained moisture transport associated with the event. Such behavior suggests that the models were able to initiate precipitation but failed to maintain the synoptic and mesoscale forcing required to reproduce the observed hydrological magnitude of the event. This pattern is consistent with events characterized by atmospheric blocking and persistent low-level jets. These findings highlight important limitations of global models in forecasting persistent extreme events over complex river basins. They emphasize the need for hydrometeorological forecasting strategies that combine global and mesoscale models with ensemble prediction systems, regional adjustments, and volumetric metrics to better anticipate hydrological impacts and support early warning and disaster risk reduction.

How to cite: Fuchs Bueno Repinaldo, H., Da Silva Teixeira, M., and Rabelo da Rocha Repinaldo, C.: Performance of two global models in forecasting extreme rainfall volumes over southern Brazil, EGU General Assembly 2026, Vienna, Austria, 3–8 May 2026, EGU26-11774, https://doi.org/10.5194/egusphere-egu26-11774, 2026.

EGU26-12007 | Orals | AS1.38

Effect of Low-Level Jets on the Movement of the Mei-Yu Front and Heavy Rainfall 

Pay-Liam Lin, Mu-Qun Huang, and Chuan-Chi Tu

On 2 June 2017, a slow-moving Mei-Yu front produced extreme rainfall along the northern coast of Taiwan, with a maximum observed daily accumulation of 645.5 mm. This study employs Weather Research and Forecasting (WRF) Model simulations to investigate how variations in barrier jet intensity influence frontal movement and rainfall distribution during this event. The control simulation (CTRL) successfully reproduces the quasi-stationary Mei-Yu front, a pronounced barrier jet along the northwestern coast of Taiwan, and a maximum daily rainfall of about 680 mm.

A series of sensitivity experiments was designed to systematically modify barrier jet intensity while retaining the interaction between the front and northern Taiwan’s terrain. The results reveal a clear dependence of frontal propagation on barrier jet strength. When the barrier jet is weakened, the front advances southward more rapidly, shortening its residence time over northern Taiwan and leading to reduced rainfall accumulation. In contrast, a stronger barrier jet maintains a more northward frontal position, enhances low-level convergence and upward motion, and shifts the rainfall maximum northward, producing rainfall amounts comparable to those in CTRL.

The low-level equivalent potential temperature () gradients are similar across all experiments, indicating that the contribution of the large-scale environment to the frontal system is comparable among cases. Consequently, differences in frontal evolution and rainfall distribution can be attributed primarily to variations in barrier jet intensity. Vorticity budget analyses further demonstrate that a stronger barrier jet enhances low-level convergence and moisture transport, thereby slowing frontal propagation and resulting in increased rainfall accumulation over northern Taiwan.

How to cite: Lin, P.-L., Huang, M.-Q., and Tu, C.-C.: Effect of Low-Level Jets on the Movement of the Mei-Yu Front and Heavy Rainfall, EGU General Assembly 2026, Vienna, Austria, 3–8 May 2026, EGU26-12007, https://doi.org/10.5194/egusphere-egu26-12007, 2026.

EGU26-12261 | Posters on site | AS1.38

Atmospheric Conditions Associated With A Flash Flood Of The Piratini River Em Pedro Osório/Cerrito Municipalities In Rio Grande Do Sul, Brazil, In April 1992 

Mateus da Silva Teixeira, Luciana Cardoso Neta, Henrique Fuchs Bueno Repinaldo, Samuel Beskow, and Tamara Leitzke Caldeira

Southern Brazil is highly vulnerable to extreme precipitation events, particularly the state of Rio Grande do Sul, where severe flooding is favored by the frequent influence of cold fronts, convective systems, and extratropical cyclones. In April 1992, under the influence of the El Niño phenomenon, a historic flood affected Pedro Osório and Cerrito in the Piratini River Basin. River levels rose by nearly 17 meters, destroying much of the local urban and productive infrastructure. This study aimed to analyze the meteorological factors responsible for this extreme event using rainfall observations and atmospheric reanalysis data. Daily precipitation data from four stations of the National Water and Basic Sanitation Agency (ANA) and ERA5/ECMWF reanalysis fields at 0.25° resolution were used. The results indicated accumulations exceeding 300 mm between 11 and 14 April, reaching up to 460 mm by the end of the analyzed period. This period was marked by cyclogenesis over the state of Rio Grande do Sul, Brazil.On 11–12 April, a mid-level trough approached, intensifying a surface low-pressure system over northern Argentina. The low-level cyclonic circulation, initially over northern Argentina and later over Rio Grande do Sul, increased atmospheric instability by transporting warm and moist air from the north. This condition generated upward air motions that persisted from the afternoon of 11 April through 12 April. The mid-level trough enhanced the intensification of the surface system and the destabilization of the atmosphere due to strong advection of negative relative vorticity over the region. Upper-level diffluence east of the mid-level trough enhanced divergence and intensified atmospheric instability. Approximately 200 mm of rainfall was recorded during this period. From the night of 12 April, the cyclone entered its dissipation phase, when its occlusion became evident.. Even under the cyclone’s occluded area, the study region received over 100 mm of rainfall due to persistent upward motion and continuous moisture transport by the cyclone from the Atlantic Ocean. Persistent instability and moist air transport to the study region contributed to the extreme rainfall and the historic Piratini River flood.

How to cite: da Silva Teixeira, M., Cardoso Neta, L., Fuchs Bueno Repinaldo, H., Beskow, S., and Leitzke Caldeira, T.: Atmospheric Conditions Associated With A Flash Flood Of The Piratini River Em Pedro Osório/Cerrito Municipalities In Rio Grande Do Sul, Brazil, In April 1992, EGU General Assembly 2026, Vienna, Austria, 3–8 May 2026, EGU26-12261, https://doi.org/10.5194/egusphere-egu26-12261, 2026.

EGU26-13517 | ECS | Posters on site | AS1.38

Moisture sources of extreme precipitation events in Northern Europe 

Alina Reininger, Marina Dütsch, and Andreas Stohl

In August 2023, an extreme precipitation event named Storm Hans occurred in Northern Europe, which produced flooding and landslides in southeastern Norway and large parts of Sweden, resulting in casualties and considerable infrastructural damage. We used a Lagrangian moisture tracking algorithm and a global Lagrangian reanalysis dataset to identify the moisture source regions that contributed to precipitation during Storm Hans. Additionally, we applied the moisture tracking algorithm over an 83-year period to compare climatological patterns with key source regions for extreme precipitation events in southeastern Norway and Sweden. For Storm Hans, a temporal evolution of moisture uptake regions indicates a shift of origins for the different phases of the event. Eastern Europe contributed the most moisture during the first phase of the event, which occurred between August 6 and 8. During the second phase between 9 and 10 August, moisture sources were mostly located in the Atlantic, the precipitation region, the North Sea, the Baltic Sea, and Eastern Europe. Overall, the majority of the moisture came from Eastern Europe, which is rare for extreme precipitation events that occurred in southeastern Norway and Sweden. This case study of the extreme event in August 2023, along with the climatological analysis, helps in determining which processes are most important for these kinds of events. Identifying recurring pathways, key source regions, and their trends can further help climate and forecast model evaluation and development by pointing out areas where land-atmosphere coupling or transport requires better parameterizations.

How to cite: Reininger, A., Dütsch, M., and Stohl, A.: Moisture sources of extreme precipitation events in Northern Europe, EGU General Assembly 2026, Vienna, Austria, 3–8 May 2026, EGU26-13517, https://doi.org/10.5194/egusphere-egu26-13517, 2026.

EGU26-14320 | ECS | Orals | AS1.38

Multidecadal Heatwave Magnitude Variability of Türkiye 

Tolga Karakaya and Barış Önol

Human-induced climate change is rapidly increasing the magnitude and frequency of temperature extremes across the Mediterranean Basin. Türkiye is critically situated within this region due to its distinctive peninsular nature, being bounded by seas on three sides and intersected by complex mountain chains that strongly modulate local climate patterns. Observations indicate a distinct transition in summer temperatures. Between 1970 and 1990, average summer temperatures persisted within the 22–23°C. However, a rapid warming phase beginning in the early 2000s increased the mean summer temperature to the 24–25°C range. This steady warming trend peaked in 2024, when the average summer temperature reached a historical maximum of 26.1°C. Against this backdrop, this study prioritizes the analysis of extreme heat intensity rather than mean temperature trends. Accordingly, a comprehensive spatiotemporal assessment of heatwave magnitudes across Türkiye is conducted for the 1950–2024 period, using the HeatWave Magnitude Index daily (HWMId) derived from daily maximum temperatures obtained from the ERA5-Land reanalysis dataset. The resulting time series reveal a robust upward trend in heatwave magnitude, characterized by a progressive escalation in annual mean values. Quantitative analysis establishes a baseline mean HWMId of 1.68 for the reference period. While the pre-2000 era was dominated by a low-magnitude regime, with annual averages largely remaining below 1.6, the post-2010 period marks a clear regime shift, frequently sustaining annual averages nearly 100% higher than the historical baseline. Specifically, the summer of 2023 experienced an unprecedented increase in severity, with the spatially averaged HWMId reaching approximately 10.5 marking an increase of more than 5 times the reference period mean. In contrast, although seasonal mean temperatures peaked in the summer of 2024, the corresponding HWMId exhibited only a 60% increase above the reference period. These findings indicate that the magnitude of extreme heatwaves is not always highly correlated with record-breaking seasonal mean temperatures, suggesting that extreme heat events are evolving into a more acute and non-linear phase. Overall, these results point to a fundamental shift in the regional climate regime, underscoring the urgent need for enhanced predictive capabilities and robust adaptation strategies.

How to cite: Karakaya, T. and Önol, B.: Multidecadal Heatwave Magnitude Variability of Türkiye, EGU General Assembly 2026, Vienna, Austria, 3–8 May 2026, EGU26-14320, https://doi.org/10.5194/egusphere-egu26-14320, 2026.

The Clausius-Clapeyron (CC) relation has - over the past two decades - been extensively discussed as a benchmark for the scaling of short duration rainfall extremes [1-3]. Recent work [4], using a large dataset from Germany, suggests that both convective and stratiform extremes scale approximately at the Clausius-Clapeyron rate of 7%/K when detecting the two types individually at high temporal and spatial resolution. Here we ask if such short-duration extremes also respond at similar rates to the observed temperature trends in Germany over the past 30 years. Indeed, over this timespan, our analysis shows a pronounced warming trend for Germany. However, short-duration precipitation extremes display relatively modest increases or no detectable increase during the same period. Conditioning on temperature at (dry) intervals leading up to precipitation events we find that the temperature trend of this conditioned dataset is also far more modest. In line with previous reports we find relative humidity to remain all but constant. Our results imply that, whereas mean and extreme temperatures in Germany increase markedly with global warming, changes in rainfall extremes may be much more gentle as the occurrence of rainfall appears to be tied to moderate temperatures. Deeper mechanistic understanding of the exact conditions for rainfall initiation under global warming, perhaps using cloud-resolving models, would therefore be useful for the projection of future meteorological flood risk.   


[1] Lenderink, Geert, and Erik Van Meijgaard. "Increase in hourly precipitation extremes beyond expectations from temperature changes." Nature Geoscience 1.8 (2008): 511-514.

[2] Haerter, Jan O., and P. Berg. "Unexpected rise in extreme precipitation caused by a shift in rain type?." Nature Geoscience 2.6 (2009): 372-373.

[3] Berg, Peter, Christopher Moseley, and Jan O. Haerter. "Strong increase in convective precipitation in response to higher temperatures." Nature Geoscience 6.3 (2013): 181-185.

[4] Da Silva, Nicolas A., and Jan O. Haerter. "Super-Clausius–Clapeyron scaling of extreme precipitation explained by shift from stratiform to convective rain type." Nature Geoscience (2025).

How to cite: Haerter, J. O., Hollstein, M., and Da Silva, N.: Do short-duration precipitation extremes follow observed temperature trends as predicted by the Clausius-Clapeyron relation?, EGU General Assembly 2026, Vienna, Austria, 3–8 May 2026, EGU26-14767, https://doi.org/10.5194/egusphere-egu26-14767, 2026.

EGU26-14864 | Orals | AS1.38

Large-scale atmospheric conditions and sea surface temperature variability associated with Mediterranean waterspouts 

Elenio Avolio, Claudia Fanelli, Andrea Pisano, and Mario Marcello Miglietta

Waterspouts are small-scale vortices occurring over water and may be associated with severe impacts in the Mediterranean region. However, their climatological characteristics and related environmental drivers remain only partially documented at the basin scale, particularly regarding the combined influence of large-scale atmospheric conditions and observed sea surface temperature (SST) variability.

This ongoing study addresses the characterization of Mediterranean waterspouts and investigates their relationship with atmospheric variables obtained from the ERA5 reanalysis and satellite-derived SST fields. Waterspout occurrences are identified using the reports from the European Severe Weather Database, focusing on the last two decades; the analysis aims to characterize both the seasonal and environmental context associated to these events.

Reanalyses are used to characterize the atmospheric conditions associated with waterspout occurrence, including convective instability, moisture availability, vertical wind shear, and large-scale circulation patterns. In parallel, high-resolution daily Mediterranean SST datasets are employed to characterize the background oceanic conditions at the time of the events. Particular attention is given to the combined role of favorable convective environments identified in ERA5 and concurrent SST anomalies. This contribution provides a first integrated assessment of atmospheric and oceanic variability in the framework of the Mediterranean waterspout climatology, with the goal of improving the understanding of these occasionally impactful events over the Mediterranean Sea.

How to cite: Avolio, E., Fanelli, C., Pisano, A., and Miglietta, M. M.: Large-scale atmospheric conditions and sea surface temperature variability associated with Mediterranean waterspouts, EGU General Assembly 2026, Vienna, Austria, 3–8 May 2026, EGU26-14864, https://doi.org/10.5194/egusphere-egu26-14864, 2026.

EGU26-15335 | ECS | Posters on site | AS1.38

The effect of remapping techniques in assessing extreme precipitation events in CMIP6 models over West Africa 

Kwame Karikari Yamoah, Petr Štěpánek, and Aleš Farda

Quantitatively assessing climate simulations across models and observational datasets often requires mapping fields to a common spatial grid, a procedure commonly referred to as remapping.  This procedure can substantially alter key statistical properties of simulated variables, with impacts that depend on both the variables and the interpolation method under consideration. While some remapping techniques smooth extremes, others preserve the integral properties of the variable fields, leading to different conclusions in model evaluation.

A variable highly sensitive to these techniques is precipitation, due to its high spatial variability and intermittency.  In this study, we examine the effect of bilinear and conservative remapping techniques on precipitation statistics in CMIP6 simulations over West Africa. We quantify spatially explicit differences between original and remapped fields, with particular emphasis on changes in the representation of extreme precipitation events associated with floods and droughts.

Our results highlight that remapping-induced distortions can significantly influence assessments of extreme precipitation events and model performance, underscoring the need for careful selection and reporting of remapping strategies in climate analysis.

How to cite: Yamoah, K. K., Štěpánek, P., and Farda, A.: The effect of remapping techniques in assessing extreme precipitation events in CMIP6 models over West Africa, EGU General Assembly 2026, Vienna, Austria, 3–8 May 2026, EGU26-15335, https://doi.org/10.5194/egusphere-egu26-15335, 2026.

EGU26-15886 | Orals | AS1.38

Improving the Numerical Representation of Turbulent Fluxes During the March 2019 Nebraska Rain-on-Snow Event 

Ross D. Dixon, Erik J. Janzon, Tirthankar Roy, and Zachary J. Suriano

Rain-on-snow (ROS) events—during which liquid precipitation falls on an existing surface snowpack—are highly impactful to society, with severe flooding being the primary hazard. ROS events remain a highly challenging problem in several aspects of land surface model development, pushing the limits of land-atmosphere, snowpack, and runoff modeling. In particular, the representation of turbulent fluxes during these events is critical as energy into the snowpack controls the rate of melt and may impact the magnitude of resulting flooding. In this study, we investigate the representation of these turbulent fluxes in the Weather Research & Forecasting (WRF) model coupled to the Noah-MP land model during a ROS event.

For this case study, we use an extreme ROS event which occurred on 12-13 March 2019 across Nebraska, Iowa, and Missouri, resulting in historic flooding and damages. Our WRF simulation of this event was compared with observations from AmeriFlux, snow products, and ERA5 reanalysis fields. While the simulation was able to produce the synoptic dynamics leading up to and during the event, there were notable discrepancies between the observed and modeled turbulent fluxes, suggesting that during ROS events, latent heat flux into the snowpack is underrepresented. Furthermore, analysis of the kilometer-scale WRF simulation run across the CONtiguous United States for 40 years at 4-km resolution (CONUS404) reveals the same underrepresented latent heat fluxes. Simple snowmelt and runoff models, forced with the observed fluxes as well as an experiment with reduced latent heat fluxes, shows that including the latent heat flux melts the snowpack quicker than without it, which has implications for the modeling of flooding in the region.

In order to improve the model representation of this event, we explored the model sensitivity to evaporative resistance and snow surface roughness. Our results show that the evaporative resistance, which is usually represented as symmetric for fluxes into and out of the surface, is critical for producing latent heat flux into the surface. Adjusting these parameters can significantly improve representation of turbulent fluxes during ROS events.

How to cite: Dixon, R. D., Janzon, E. J., Roy, T., and Suriano, Z. J.: Improving the Numerical Representation of Turbulent Fluxes During the March 2019 Nebraska Rain-on-Snow Event, EGU General Assembly 2026, Vienna, Austria, 3–8 May 2026, EGU26-15886, https://doi.org/10.5194/egusphere-egu26-15886, 2026.

EGU26-16320 | Orals | AS1.38

Sensitivity of heatwave simulation to radiation parameterization in WRF and MPAS-A: A case study over Bangladesh 

Yeamin Rabbany, Saiful Islam Fahim, Md. Aminul Islam Haque Laskor, Salah Uddin Ahmed Dipu, Faysal Bhuiyan, and AKM Saiful Islam

Heatwaves represent one of the most impactful categories of extreme climate events and remain difficult to simulate accurately in numerical weather prediction and regional climate models. In tropical regions like Bangladesh, where strong monsoonal circulations, heterogeneous land-use patterns, and sparse in situ observations limit constraint of model physics and thus remain constant challenge for heatwave representation. This study evaluates the performance of the Weather Research and Forecasting (WRF) model and the Model for Prediction Across Scales-Atmosphere (MPAS-A) in reproducing a documented heatwave event during 26 April - 3 May 2024, to identify the modeling configuration that more reliably represents near-surface thermodynamic conditions. Model-simulated 2-m air temperature (t2) and 2-m specific humidity (q2) were evaluated against the MERRA reference dataset (0.5° × 0.625° spatial resolution) using root mean square error (RMSE) and Pearson correlation coefficients. Both models employed an identical suite of physical parameterizations, including WSM-6 microphysics, the Kain-Fritsch cumulus scheme, the Yonsei University planetary boundary layer scheme, MM5 surface layer physics, and the Noah land surface model, while radiative transfer was represented using the Rapid Radiative Transfer Model for Global Climate Models (RRTMG) and the Community Atmosphere Model (CAM) schemes. WRF was configured with two nested domains at 27 km and 9 km spatial resolution, whereas MPAS-A employed a variable-resolution mesh refined from 46 km globally to 12 km over the study region. Results indicate that WRF with RRTMG achieved the highest skill score in simulating 2-m air temperature (RMSE = 2.52 °C; r = 0.95), outperforming MPAS-A configured with CAM (RMSE = 3.04 °C; r = 0.82). For 2-m specific humidity, WRF-RRTMG minimized overall error (RMSE = 0.003), while WRF-CAM exhibited the strongest temporal correlation (r = 0.899); within the MPAS-A framework, the RRTMG configuration consistently outperformed CAM. Moreover, WRF-RRTMG more accurately captured the timing of heatwave onset, showing smaller temporal displacement relative to the reference dataset than MPAS-A configurations, indicating improved representation of the initiation phase of extreme heat events. Overall, the findings demonstrate that WRF provides more accurate heatwave simulation over Bangladesh under the adopted configuration, while MPAS-A shows competitive performance when configured with radiation transfer schemes, supporting its potential utility for multiscale atmospheric modeling applications.

How to cite: Rabbany, Y., Fahim, S. I., Laskor, Md. A. I. H., Dipu, S. U. A., Bhuiyan, F., and Islam, A. S.: Sensitivity of heatwave simulation to radiation parameterization in WRF and MPAS-A: A case study over Bangladesh, EGU General Assembly 2026, Vienna, Austria, 3–8 May 2026, EGU26-16320, https://doi.org/10.5194/egusphere-egu26-16320, 2026.

EGU26-16899 | Posters on site | AS1.38

Availability of Newly Developled Reginal Climate Data for Improving Reproducibility of Extreme Events 

Natsumi Kawano, Motoki Nishimori, Akio Yamakami, Tomohide Shimada, and Hiroaki Yamato

Accurate prediction of extreme weather information is crucial for disaster risk management, social and economic development security, and climate change research. However, state-of-the-art regional climate models still have difficulties in simulating extreme weather such as extreme precipitation. In order to take appropriate measures to reduce the risk of water-related disasters, which are expected to become more severe with climate change, there is an urgent need to develop technologies that can accurately represent predict localized weather patterns by regional weather models.

We have investigated the predictability of extreme rainfall event in Japan with utilizing two global reanalysis products (JRA-55, ERA-5) which are widely used in regional weather modelling studies. As compared total precipitation on two reanalysis products with observation data, the results indicated that JRA-55 tended to overestimate daily precipitation whereas ERA-5 tended to underestimate it. In this presentation, we utilized newly developed high-resolution regional atmospheric reanalysis for Japan, called as RRJ-ClimCORE (Nakamura et al., 2022) to be compared with two global products to clarify the predictability of summertime extreme rainfall events in regional weather models.

How to cite: Kawano, N., Nishimori, M., Yamakami, A., Shimada, T., and Yamato, H.: Availability of Newly Developled Reginal Climate Data for Improving Reproducibility of Extreme Events, EGU General Assembly 2026, Vienna, Austria, 3–8 May 2026, EGU26-16899, https://doi.org/10.5194/egusphere-egu26-16899, 2026.

EGU26-18338 | ECS | Orals | AS1.38

The 2023 record-breaking heatwave in North Africa: characteristics and driving mechanisms 

Khadija Arjdal and Fatima Driouech

Global mean temperatures reached unprecedented levels in 2023, and large parts of the world experienced prolonged and recurrent heatwave conditions, resulting in severe consequences for public health and socioeconomic systems (Perkins-Kirkpatrick et al., 2024). North Africa was among the regions most severely affected. However, quantitative assessments of the spatial extent and seasonal progression of record-breaking heatwaves over North Africa remain limited. This study uses the Excess Heat Factor (EHF, Nairn et al. 2009) to characterize heatwaves across North Africa in 2023, examining their spatial patterns and seasonal evolution with reference to the past five decades. 

North Africa experienced exceptionally warm conditions in 2023 characterized by prolonged heatwaves and a markedly expanded spatial extent compared with the 1972–2022 reference period. Indeed, temperature anomalies reached up to 5K over most of the region, with the strongest differences occurring during the boreal autumn (SON). Notably, approximately 35% of the study domain experienced the highest seasonal mean near-surface temperature on record since 1972. The heatwave analysis revealed pronounced anomalies in 2023 relative to the baseline climatology; the event frequencies ranged from 2 to 5 events per year, and their duration exceeded the reference by 4 to 7 days across large parts of the domain during summer (JJA) and autumn (SON), particularly over Morocco, the central Sahara, and surrounding regions. In addition, record-breaking daily maximum temperatures (Tmax) were detected at multiple timescales over the 50-year record. During two major episodes in 2023, the spatial extent affected by these record-breaking conditions exceeded 4 × 10⁶ km², occurring from 25 July to 5 August and from 25 October to 10 November, respectively.

These hot events were also assessed in terms of related large-scale atmospheric circulation. The mid-atmosphere conditions were characterized by positive geopotential height anomalies at 500 hPa, with an anomalous ridge centered over northern Morocco and Algeria bringing persistent atmospheric blocking and enhanced warm air advection, favoring the development and persistence of extreme surface temperatures. Concurrently, temperature anomalies at 850 hPa ranged from 2 to 4 K over northeastern Morocco, Algeria, and Egypt, while more moderate anomalies of approximately 1 to 2 K were observed along the Atlantic coasts and across the southern Sahara. These findings highlight the exceptional severity, persistence, and spatial extent of the 2023 heatwaves in North Africa, underscoring the region’s increasing vulnerability to extreme thermal events under ongoing global warming.

References:

Perkins-Kirkpatrick, S., Barriopedro, D., Jha, R. et al. Extreme terrestrial heat in 2023. Nat Rev Earth Environ 5, 244–246 (2024).  https://doi.org/10.1038/s43017-024-00536-y

Nairn, J., R. Fawcett, and D. Ray, 2009: Defining and predicting excessive heat events: A national system. CAWCR Tech. Rep. 017, 83–86

How to cite: Arjdal, K. and Driouech, F.: The 2023 record-breaking heatwave in North Africa: characteristics and driving mechanisms, EGU General Assembly 2026, Vienna, Austria, 3–8 May 2026, EGU26-18338, https://doi.org/10.5194/egusphere-egu26-18338, 2026.

EGU26-19102 | Orals | AS1.38

Diurnal Variability and Long-Term Changes in Extreme Summer Precipitation over South Korea 

Do-Hyun Kim, Jin-Uk Kim, Jaekwan Shim, Chu-Yong Chung, and Kyung-On Boo

In this study, the diurnal characteristics and long-term changes of extreme precipitation over South Korea were investigated using hourly precipitation data from 59 Automated Synoptic Observing System (ASOS) stations for the 50-year period from 1973 to 2022. The analysis focused on the summer season (June–September), during which extreme precipitation events most frequently occur. Extreme precipitation events were defined using station-specific thresholds based on the 95th percentile of 3-hourly precipitation amounts during the early period (1973–1997).

During the early period, both the amount and frequency of extreme precipitation exhibited a pronounced maximum during the 01–09 LST period. In contrast, precipitation intensity showed two comparable maxima during 01–09 LST and 16–24 LST, with smaller diurnal amplitudes than those of precipitation amount and frequency. In the later period (1998–2022), a substantial increase in extreme precipitation amount and frequency was observed during the 04–12 LST period, accompanied by a shift in the timing of their diurnal maxima toward this time frame.

To better understand the mechanisms associated with extreme precipitation, the characteristics and changes of related atmospheric variables were also examined. During extreme precipitation events, a negative sea-level pressure anomaly was identified over western Korea, inducing southerly winds and positive moisture anomalies over southern Korea relative to the summer mean state. Compared to the early period, the later period exhibited increased atmospheric moisture and a higher frequency of moist conditions over South Korea. These moisture changes are likely associated with the enhanced extreme precipitation amount and frequency during the 04–12 LST period. In contrast, no statistically significant changes were found in the strength or frequency of southerly winds.

How to cite: Kim, D.-H., Kim, J.-U., Shim, J., Chung, C.-Y., and Boo, K.-O.: Diurnal Variability and Long-Term Changes in Extreme Summer Precipitation over South Korea, EGU General Assembly 2026, Vienna, Austria, 3–8 May 2026, EGU26-19102, https://doi.org/10.5194/egusphere-egu26-19102, 2026.

EGU26-493 | ECS | Orals | CL3.2.4

Storyline-based climate attribution reveals strong intensification of 2018-2022 multi-year droughts in Europe 

Ray Kettaren, Antonio Sanchez-Benitez, Helge Goessling, Marylou Athanase, Rohini Kumar, Luis Samaniego, and Oldrich Rakovec

Prolonged summer droughts represent a significant and growing threat across Europe, as their persistence hinders hydrological recovery and severely impacts water resources, ecosystems, and agricultural systems under ongoing climatic warming. These extended dry periods can create soil-moisture deficits, ecological stress, and amplified heat extremes. Understanding the response of multi-year droughts to different warming levels is vital for shaping both adaptation and mitigation strategies.

In this study, we investigate the behaviour and severity of the 2018-2022 European multi-year soil moisture drought across a range of climate warming levels. We apply an innovative storyline attribution approach, which enables a physically consistent comparison of the same drought sequence under different climate conditions. Specifically, we utilise spectrally nudged AWI-CM-1-1-MR, constrained to follow observed synoptic-scale circulation from ERA5, to force the mesoscale Hydrologic Model (mHM). This modelling setup allows us to specifically isolate how anthropogenic warming modifies soil-moisture deficits, without altering the real-world atmospheric conditions that triggered the drought sequence.

Under the present-day climate conditions, the 2018-2022 drought produced a soil-moisture deficit of -44 (±11.8) km3, affecting 0.63 (±0.07) million km2 (11.5% of the study area). In the absence of anthropogenic climate change (pre-industrial climate conditions), the 2018-2022 multi-year event would have shown a soil moisture surplus nearly double the magnitude of present-day losses, with drought spatial extent only about one-third of current levels. Future warming levels further exacerbate these impacts. With warming of 2 K to 4 K, the losses increase from -82 (±6.6) to -256 (±7.1) km3, while drought extent expands from approximately 16% to 43%.

Overall, our results demonstrate that rising global temperatures substantially intensify multi-year droughts by both enlarging their spatial footprint and deepening hydrological deficits. As climate warming increases the likelihood that single-year droughts transition into persistent multi-year events, the findings emphasise the urgent need for effective climate mitigation and adaptation strategies across Europe. A full version of this work is currently under review in Earth’s Future; the preprint can be accessed at https://doi.org/10.22541/au.176220208.89936181/v1 . 

How to cite: Kettaren, R., Sanchez-Benitez, A., Goessling, H., Athanase, M., Kumar, R., Samaniego, L., and Rakovec, O.: Storyline-based climate attribution reveals strong intensification of 2018-2022 multi-year droughts in Europe, EGU General Assembly 2026, Vienna, Austria, 3–8 May 2026, EGU26-493, https://doi.org/10.5194/egusphere-egu26-493, 2026.

EGU26-505 | ECS | Orals | CL3.2.4

Climate archetypes of simultaneous global crop failures  

Tamara Happé, Raed Hamed, Weston Anderson, Chris Chapman, and Dim Coumou

Most of the world's food is produced in a handful of countries, the so-called breadbaskets of the world. Due to climate change, there is an increasing risk of crop failures, due to compounding hot and dry extremes. Furthermore, certain climate drivers – through  teleconnections – have shown to lead to simultaneous crop failures around the globe. This highlights the importance to understand which climate processes drive global crop yield variability. Here we show global crop yield failures (Maize, Soya, Wheat, Rice, and combined) are associated with La Nina-like sea surface temperature (SST) anomalies, using Archetype Analysis. The adverse crop-yield archetypes show simultaneous hot-dry-surface imprints across the world, highlighting these high risk crop failure scenarios are driven by climate extremes. Our results demonstrate the importance in understanding the climate drivers of global crop production, and highlights the deep uncertainty associated with a changing climate. The response of ENSO due to anthropogenic activities is not yet fully understood and climate models often inaccurately reproduce the observed La Nina trends. Thus the fact that our results indicate that simultaneous crop failures are linked to La Nina like SSTs, highlights the deep uncertainty we currently face regarding food security in the future. 

How to cite: Happé, T., Hamed, R., Anderson, W., Chapman, C., and Coumou, D.: Climate archetypes of simultaneous global crop failures , EGU General Assembly 2026, Vienna, Austria, 3–8 May 2026, EGU26-505, https://doi.org/10.5194/egusphere-egu26-505, 2026.

EGU26-537 | ECS | Orals | CL3.2.4

Linking Emissions from Fossil Fuel Megaprojects to Lifetime Climate Extremes Across Generations and Multi-Century Committed Change  

Amaury Laridon, Wim Thiery, Rosa Pietroiusti, Chris Smith, Joeri Rogelj, Jiayi Zhang, Carl-Friedrich Schleussner, Inga Menke, Harry Zekollari, Lilian Schuster, Alexander Nauels, Matthew Palmer, and Jacob Schewe

Carbon bombs comprise 425 fossil fuel megaprojects whose cumulative potential emissions exceed by at least a factor of two the remaining global carbon budget compatible with the Paris Agreement. The full exploitation of these projects would therefore generate substantial additional warming. As high-impact climate extremes intensify with each increment of warming, a central challenge is to quantify how emissions from individual projects translate into concrete physical and societal impacts across current and future generations. 

Within the Source2Suffering project, we develop a modelling framework that links project-level CO₂ and CH₄ emissions to lifetime exposure to six categories of high-impact climate extremes, including heatwaves, droughts, and floods, using a storyline-based approach. The framework also quantifies each project’s contribution to committed glacier mass loss and multi-century sea-level rise. By explicitly representing uncertainties, it provides probabilistic estimates of how warming increments induced by individual fossil fuel projects propagate through physical processes to generate compound and cascading risks. 

The results reveal marked spatial and intergenerational inequalities in exposure. These arise from (i) physical mechanisms that amplify extreme hazards in many regions of the Global South, and (ii) demographic trends that concentrate most of the world’s present and future population in these highly affected areas. By establishing a tractable link between specific emission sources, the physical drivers of high-impact extremes, and their long-term societal consequences, this framework contributes to the development of scientifically grounded information to support climate mitigation efforts. 

How to cite: Laridon, A., Thiery, W., Pietroiusti, R., Smith, C., Rogelj, J., Zhang, J., Schleussner, C.-F., Menke, I., Zekollari, H., Schuster, L., Nauels, A., Palmer, M., and Schewe, J.: Linking Emissions from Fossil Fuel Megaprojects to Lifetime Climate Extremes Across Generations and Multi-Century Committed Change , EGU General Assembly 2026, Vienna, Austria, 3–8 May 2026, EGU26-537, https://doi.org/10.5194/egusphere-egu26-537, 2026.

EGU26-1535 | ECS | Orals | CL3.2.4

Regional aerosol changes modulate the odds of record-breaking heat extremes 

Florian Kraulich, Peter Pfleiderer, and Sebastian Sippel

Record-breaking heat extremes imply large health risks and can disrupt critical infrastructure, because societies are often adapted only up to previously observed extremes. Understanding how new records evolve is therefore essential. The probability of record-breaking heat events depends on the regional warming rate. This rate is mainly driven by greenhouse gas-induced global warming and has increased in recent decades. The resulting annual probability of record-breaking heat extremes is additionally modified in a nonlinear way by other regional forcing changes, such as aerosols. Because aerosol concentrations have changed substantially in many regions, they can amplify or reduce the annual likelihood of exceeding previous temperature records. 

We first analyze single forcing large ensemble simulations that isolate the effects of aerosols and greenhouse gases. In Europe, decreasing aerosol concentrations have increased the regional warming rate and thereby the probability of record-breaking heat extremes by about 35% today. In contrast, in South Asia, where aerosol concentrations are increasing, we find a dampening of record-breaking probabilities of about 40%. To evaluate the effect of near-future aerosol reductions, we use simulations from the Regional Aerosol Model Intercomparison Project (RAMIP). In RAMIP, aerosol emissions are reduced from SSP3-7.0 to SSP1-2.6 either globally or only in selected regions. This allows us to analyze the regional effects of aerosol reductions as well as their remote responses. In general, aerosol reductions lead to an increased probability of record-breaking heat extremes.

Finally, we examine recent observed record-breaking events and evaluate whether their regional frequency matches the expected record breaking probabilities from model simulations. We expect that changes in aerosol concentrations contribute to changes in the annual record-breaking probability in regions with major aerosol concentration changes in recent decades, such as Europe, North America, East Asia, and South Asia. Overall, these results suggest that changes in aerosol concentrations are important for the present and near-future probability of record-breaking heat extremes.

How to cite: Kraulich, F., Pfleiderer, P., and Sippel, S.: Regional aerosol changes modulate the odds of record-breaking heat extremes, EGU General Assembly 2026, Vienna, Austria, 3–8 May 2026, EGU26-1535, https://doi.org/10.5194/egusphere-egu26-1535, 2026.

EGU26-2212 * | Orals | CL3.2.4 | Highlight

Challenges and Opportunities for Understanding Societal Impacts of Climate Extremes 

Gabriele Messori, Emily Boyd, Joakim Nivre, and Elena Raffetti

Climate extremes exact a heavy and differential toll on society. Reported economic losses are primarily concentrated in developed economies, whereas reported fatalities occur overwhelmingly in developing economies. Moreover, even at single locations the adverse impacts of extreme climate events are often unequally distributed across the population. Understanding such impacts holds enormous societal and economic value, and is a key step towards climate resilience and adaptation. Recent research advances include improved impact forecasting and enhanced understanding of how the interaction between human and natural systems shapes the impacts of climate extremes. Nonetheless, there are some key challenges that have hindered progress. We focus on three: Limited availability and quality of impact data, difficulties in understanding the processes leading to impacts and lack of reliable impact projections. We argue that newly released datasets and recent methodological and technical advances open a window of opportunity to address several dimensions of these challenges. Notable examples include extracting impact information from textual sources using large language models and developing impact projections using data-driven approaches. Moreover, interdisciplinary collaborations between the social and natural sciences can elucidate processes underlying past climate impacts and enable building storylines of future societal impacts. We call for building momentum in seizing these opportunities for a breakthrough in the study of impacts of climate extremes. Achieving meaningful progress will require interdisciplinary and intersectoral research, and strong collaboration across academic, policy and practitioner communities.

How to cite: Messori, G., Boyd, E., Nivre, J., and Raffetti, E.: Challenges and Opportunities for Understanding Societal Impacts of Climate Extremes, EGU General Assembly 2026, Vienna, Austria, 3–8 May 2026, EGU26-2212, https://doi.org/10.5194/egusphere-egu26-2212, 2026.

EGU26-2537 | ECS | Orals | CL3.2.4

Dry and moist convective upper bounds for extreme surface temperatures 

Quentin Nicolas and Belinda Hotz

How hot can heatwaves get in a given region of the world? The current pace of climate change challenges the statistical methods traditionally used to answer this question. An alternative approach is to seek a physics-based upper bound to extreme surface temperatures (Ts). Recent work proposed to address this problem using the hypothesis that convective instability limits the development of heat extremes. Here, we show that under this hypothesis, the absolute upper bound for extreme Ts --- obtained in the limit of zero surface humidity --- is set by dry convection: that is, this bound is reached when the mid-troposphere and the surface are connected by a dry adiabat. Previous work suggested that this upper bound is instead set by moist convective instability and is several degrees hotter. We resolve this discrepancy by showing that moist convection only limits heatwave development when surface specific humidity is larger than a threshold, and that the moist convective upper bound cannot exceed the dry limit. Yet, numerous temperature profiles in observational and reanalysis records do exceed the dry convective limit. We show that these occur exclusively in regions with an extremely deep boundary layer and where a daytime superadiabatic layer develops near the surface. We conclude with an overview of the different upper bounds applicable in dry and moist scenarios, including the roles of processes such as entrainment and convective inhibition.

How to cite: Nicolas, Q. and Hotz, B.: Dry and moist convective upper bounds for extreme surface temperatures, EGU General Assembly 2026, Vienna, Austria, 3–8 May 2026, EGU26-2537, https://doi.org/10.5194/egusphere-egu26-2537, 2026.

EGU26-2749 | Posters on site | CL3.2.4

Co-occurrence of large hail and heatwaves in European regions in current and future climate scenarios 

Ellina Agayar, Brennan Killian, Iris Thurnherr, and Heini Wernli

Large hail and heatwaves are among the most extreme weather phenomena, posing serious risks to human health, ecosystems, and infrastructure, while also leading to significant economic losses. However, the co-occurrence of large hail and heatwaves, and the potential physical mechanisms linking these two phenomena, remain poorly understood. In this study, we investigate the climatology of large hail and the atmospheric drivers of large hail and heatwave co-occurrences across selected European regions, using an 11-year convection-permitting climate simulation with the COSMO regional climate model (2011–2021). In addition, we assess how these extremes may evolve under future climate conditions (+3°C global warming).

Results show increases in large hail frequency across Europe in a warmer climate. In central and eastern regions, the frequency rises approximately 20 %, whereas in the Alpine, Mediterranean, and Baltic regions it nearly doubles. Exceptions are France and Spain, where large-hail frequency declines by 26% and 33%, respectively. Also, there is a notable correlation between the occurrence of heatwaves and large hail across central and eastern Europe.  This relationship is less evident in southern Europe, due to large hail occurs mainly in autumn storms caused by large-scale disturbances. Additionally, large hail during heatwave days is forms in environments with higher median values of most-unstable convective available potential energy and 2 m temperature than large hail in the absence of heatwaves. A spatiotemporal analysis revealed that the days leading up to large hail events increasingly coincide with heatwave conditions. In the present climate, large hail is most often found within ~500 km of heatwave boundaries, both inside and outside them. The future climate scenario indicates a spatial shift of large hail events beyond the heatwave extent across all continental domains.

How to cite: Agayar, E., Killian, B., Thurnherr, I., and Wernli, H.: Co-occurrence of large hail and heatwaves in European regions in current and future climate scenarios, EGU General Assembly 2026, Vienna, Austria, 3–8 May 2026, EGU26-2749, https://doi.org/10.5194/egusphere-egu26-2749, 2026.

EGU26-2967 | ECS | Posters on site | CL3.2.4

Separating dynamic and thermodynamic contributions in Mediterranean extreme precipitation (in a storyline approach) 

Cosimo Enrico Carniel, Reto Knutti, and Erich Fischer

Extreme precipitation in the Mediterranean basin emerges from a complex interaction between large-scale circulation, moisture transport and mesoscale dynamics, making the most damaging events difficult to sample in conventional climate simulations. This work presents a storyline-based framework to explore  very rare and  extreme rainfall under present and future climate conditions. 

We apply ensemble boosting to the fully coupled CESM2 model to generate alternative realizations of the most intense precipitation events affecting the Southern Alps and the Spanish Mediterranean coast. Starting from a 35 member parent ensemble of CESM2, these occurrences are identified and resimulated through boosted ensembles, resulting in a large sets of dynamically consistent trajectories that preserve the synoptic evolution of the original event while sampling its internal variability by perturbing the initial conditions. Comparisons with ERA5 reanalysis and available observations are performed to assess the realism of the simulated circulation patterns and precipitation characteristics associated with these extreme events. 

Preliminary results demonstrate that ensemble boosting successfully reproduces the temporal evolution of reference precipitation extremes, with many boosted members closely matching the timing and peak intensity of the parent events. In several cases, individual boosted realizations exceed the peak intensity of the reference simulation, revealing physically consistent more intense scenarios within the same large-scale setup. The amplification potential depends strongly on the perturbation lead time: short lead starts tend to cluster near the reference intensity, whereas longer lead times display a broader ensemble spread and occasionally generate substantially stronger or delayed rainfall peaks. 

In a second step, a conditional attribution methodology is applied in which the large-scale circulation is constrained while the thermodynamic background is modified to represent different climate states. This allows us to isolate the thermodynamic contribution of climate change to extreme precipitation intensity, providing physically interpretable estimates of how much more intense these events become in a warmer climate. 

By bridging weather-scale event evolution with climate-scale statistics, this approach provides new insight into the physical limits of Mediterranean extreme precipitation and offers a robust basis for assessing future extreme rainfall scenarios. 

How to cite: Carniel, C. E., Knutti, R., and Fischer, E.: Separating dynamic and thermodynamic contributions in Mediterranean extreme precipitation (in a storyline approach), EGU General Assembly 2026, Vienna, Austria, 3–8 May 2026, EGU26-2967, https://doi.org/10.5194/egusphere-egu26-2967, 2026.

EGU26-3456 | ECS | Orals | CL3.2.4

Demonstrating the plausibility of worst-case month-long heatwave storylines in Western Europe 

Florian E. Roemer, Erich M. Fischer, Robin Noyelle, and Reto Knutti

What are the worst-case heatwaves that are plausible in the present or near-future climate? Model-based experiments using ensemble boosting, a computationally efficient method to simulate unprecedented extremes, suggest that month-long heatwaves that break previous records by more than 5 K across Germany and France are possible in the near future. But how can we assess the plausibility of these heatwaves unprecedented in the observational record? We here test whether the most extreme simulated month-long heatwaves in Germany and France are consistent with current process understanding and with historical heatwaves.
We show that despite their extreme record-breaking characteristics both events cannot be ruled out as implausible. To demonstrate this, we compare these two worst-case events with historical heatwaves in the reanalysis record. To this end, we calculate standardized anomalies relative to a time-evolving climatology of relevant physical variables such as temperature, 500 hPa geopotential, surface solar radiation, and soil moisture. We focus on two different worst-case events — one in Germany and one in France — which exhibit distinct characteristics and physical drivers. The event in Germany features extreme anomalies in most physical drivers, particularly those associated with land-atmosphere feedbacks, and features three short heatwaves in quick succession. In contrast, the event in France mostly features less extreme anomalies in these drivers and consists of one less intense but very persistent heatwave caused by anomalously weak zonal flow combined with above-average southerly winds. Using a multilinear statistical model and comparing with historical analogues, we show that the characteristics and physical drivers of both events are consistent with current process understanding and with historical events.

How to cite: Roemer, F. E., Fischer, E. M., Noyelle, R., and Knutti, R.: Demonstrating the plausibility of worst-case month-long heatwave storylines in Western Europe, EGU General Assembly 2026, Vienna, Austria, 3–8 May 2026, EGU26-3456, https://doi.org/10.5194/egusphere-egu26-3456, 2026.

EGU26-3579 | ECS | Posters on site | CL3.2.4

ERA5-Based Validation of Thermodynamic Extreme Heatwave Drivers of the Paris region in CMIP6 simulations. 

Maeve Mayer, Sylvie Parey, Claire Petter, Soulivanh Thao, and Pascal Yiou

Previous studies have argued that the upper bound of temperature extremes in mid-latitude regions is reached by minimizing near-surface moisture during high low-tropospheric temperatures. Here, we revisit these theories for the Île-de-France region using the ERA5 reanalysis and show that the highest annual temperatures occur within the moist-to-expected range of the summer (June–August) near-surface humidity distribution. However, during the most extreme events, relative humidity is minimized as soil moisture approaches the wilting point and the atmospheric boundary layer deepens. Using the statistical distributions of these indicators and their temporal evolution in ERA5, we evaluate the representation of thermodynamic drivers in selected CMIP6 large ensembles. Finally, we apply a recently published revised framework of dry convective instability to estimate maximum attainable temperatures in both ERA5 and CMIP6, highlighting how climate change may modify heatwave dynamics in the Paris region.

How to cite: Mayer, M., Parey, S., Petter, C., Thao, S., and Yiou, P.: ERA5-Based Validation of Thermodynamic Extreme Heatwave Drivers of the Paris region in CMIP6 simulations., EGU General Assembly 2026, Vienna, Austria, 3–8 May 2026, EGU26-3579, https://doi.org/10.5194/egusphere-egu26-3579, 2026.

EGU26-4070 | ECS | Orals | CL3.2.4

Enhancing impact monitoring by using computational text analyses 

Mariana Madruga de Brito, Jingxian Wang, Jan Sodoge, Ni Li, and Taís Maria Nunes Carvalho

Climate extremes, such as floods, heatwaves, and droughts, have myriad impacts across natural and social systems. However, traditional methods used for monitoring impacts tend to focus on single hazards or indicators (e.g., fatalities), address only quantitative consequences (e.g., economic losses), and frequently overlook indirect and social consequences (e.g., conflicts, mental health). Here, we show how text data can be used to measure the societal impacts of climate extremes across diverse text sources, including newspapers, social media, and Wikipedia articles.

First, we analyze over 26,000 newspaper articles on the July 2021 river floods in Germany to reveal cascading impacts across sectors like infrastructure, water quality, mental health, and tourism. Second, Twitter data from the 2022 drought in Italy is used to map public concern and perceived consequences, which align with observed socioeconomic indicators. Finally, we scale our analysis globally with Wikimpacts 1.0, a database of climate impacts extracted from 3,368 Wikipedia articles covering 2,928 events from 1034 to 2024, providing national and sub-national records of deaths, injuries, displacements, damaged buildings, and economic losses.

Together, these case studies illustrate the value of text-derived impact datasets for complementing traditional monitoring approaches. We also discuss the challenges of using such datasets, including representational biases, uneven temporal and spatial coverage, and differences in how impacts are reported. We conclude by discussing how the field can move towards shared standards and best practices, enabling more comparable and transparent use of text data for monitoring the impacts of climate extremes.

How to cite: Madruga de Brito, M., Wang, J., Sodoge, J., Li, N., and Nunes Carvalho, T. M.: Enhancing impact monitoring by using computational text analyses, EGU General Assembly 2026, Vienna, Austria, 3–8 May 2026, EGU26-4070, https://doi.org/10.5194/egusphere-egu26-4070, 2026.

EGU26-4263 | ECS | Orals | CL3.2.4

Why was the 2023 jump in global temperature so extreme? 

Julius Mex, Christophe Cassou, Aglaé Jézéquel, Sandrine Bony, and Clara Deser

Global surface air temperature (GSAT) reached unprecedented heights in 2023. The record of year-to-year temperature increases was surpassed by a significant margin, especially in early boreal fall. We attribute the majority of this seasonal jump to the onset and maturing stages of the 2023 El Niño event. Using a process-based analysis of multiple observational datasets, we show that the uniqueness of the 2023 event can be largely related to the La Niña-like ocean-atmosphere background state upon which it developed.
This resulted in (1) a steep year-to-year increase of Sea Surface Temperature (SST), particularly in mean atmospheric subsidence regions, leading to extreme reduction of low-cloud-cover and giving rise to a record-breaking change in the radiative budget over the central and eastern Indo-Pacific; (2) anomalous sustained precipitation over climatological high SSTs in the Western Pacific, fueling unusual diabatic heating and an exceptionally early increase in tropical tropospheric temperature in boreal fall, ultimately influencing the GSAT jump with an additional contribution from the North Atlantic.
Our study improves the understanding of the interactions between interannual internally-driven processes and changes in mean climate background state, which a changing background is crucial to assess the evolution and modulation of anthropogenically-driven trends.

How to cite: Mex, J., Cassou, C., Jézéquel, A., Bony, S., and Deser, C.: Why was the 2023 jump in global temperature so extreme?, EGU General Assembly 2026, Vienna, Austria, 3–8 May 2026, EGU26-4263, https://doi.org/10.5194/egusphere-egu26-4263, 2026.

EGU26-4462 | ECS | Orals | CL3.2.4

Future cost of climate change for humanitarian crises 

Juha-Pekka Jäpölä, Anna Berlin, Charlotte Fabri, Arthur Hrast Essenfelder, Sepehr Marzi, Karmen Poljanšek, Michele Ronco, Steven Van Passel, and Sophie Van Schoubroeck

Humanitarian crises are the tip of the iceberg in climate change adaptation, yet their future is rarely quantified in human and economic terms. We use machine learning to simulate future estimates of people in need of humanitarian aid and required funding under the business-as-usual scenario (SSP2-RCP4.5) with warming of 2.1–2.4°C by 2100. Humanitarian needs rise to a baseline of 410±22 million people and USD2024 64±8 billion annually by 2050 worldwide, increases of 28% and 30% respectively compared to the current (320 million people and USD 49 billion). A lightly optimistic simulation holds needs near the current, while a medium pessimistic simulation leads to 614±68 million people and USD2024 96±19 billion by 2050, increases of 92% and 96% respectively. Our results show empirical vulnerabilities and an opportunity cost, as resources for crisis response displace funding for adaptation and mitigation. Yet, sustained investment could curb the impacts even with climate inertia.

How to cite: Jäpölä, J.-P., Berlin, A., Fabri, C., Hrast Essenfelder, A., Marzi, S., Poljanšek, K., Ronco, M., Van Passel, S., and Van Schoubroeck, S.: Future cost of climate change for humanitarian crises, EGU General Assembly 2026, Vienna, Austria, 3–8 May 2026, EGU26-4462, https://doi.org/10.5194/egusphere-egu26-4462, 2026.

EGU26-4864 | ECS | Posters on site | CL3.2.4

Assessing the UNSEEN Flood-Relevant Winter Extreme Precipitation Over the Island of Ireland in the Present Climate 

Mohamed Bile, Conor Murphy, and Peter Thorne

Ireland’s winters are getting wetter, with more frequent heavy precipitation events increasing flooding risk across the Island. Extreme precipitation is a key driver of flooding in northwestern Europe; however, observational records are relatively short and represent only a single realisation of the climate state. As a result, they are inadequate for sampling low-likelihood, high-impact flood-relevant extreme precipitation events and for quantifying plausible maxima of such extremes. In this study, we quantify plausible maxima for flood-relevant winter precipitation under the current climate. We apply the UNprecedented Simulated Extremes using Ensembles (UNSEEN) approach to the flood-relevant winter precipitation indices (Rx1day, Rx5day, and Rx30days), using daily winter observations, the ECMWF SEAS5 seasonal prediction systems, and the CANARI Single Model Initial-condition Large Ensemble (SMILE) over the Island of Ireland. These indices are consistently derived across observations, pooled SEAS5 winter ensembles (ensemble member x lead times), and the CANARI SMILE. Model fidelity for CANARI and ensemble independence, stability, and fidelity for pooled SEAS5 are assessed to ensure that both models realistically represent extreme precipitation. Preliminary results indicate that both SEAS5 and the CANARI sample the physically plausible Rx1day and Rx5day extremes that exceed the maximum observed in the current climate, while neither system produces UNSEEN values exceeding the observed maximum Rx30day.  The CANARI large ensemble passes the fidelity test without bias correction, whereas the SEAS5 passes the fidelity test after applying simple multiplicative mean scaling bias correction. For CANARI, plausible maxima are approximately 18.01% higher for Rx1day and 20.77% higher for Rx5day than observed maxima, while Rx30day plausible maxima are approximately 8.70% lower than the highest observed Rx30day. For SEAS5, plausible maxima exceed observations by approximately 3.05% for Rx1day and 17.68% for Rx5day, while Rx30day plausible maxima are approximately 17.74% lower than the highest observed. These results highlight the limitations of observational records in sampling extreme tails and indicate that CANARI SMILE captures a broader range of internal climate variability than the initialised SEAS5 seasonal prediction system. They also show that UNSEEN ensembles are more effective at sampling short-duration precipitation extremes (Rx1day and Rx5day) than longer-duration accumulation precipitation extremes (Rx30day). Our study highlights the value of combining the UNSEEN approach with both seasonal prediction systems and SMILEs to better understand unprecedented flood-relevant precipitation extremes in the current climate.

How to cite: Bile, M., Murphy, C., and Thorne, P.: Assessing the UNSEEN Flood-Relevant Winter Extreme Precipitation Over the Island of Ireland in the Present Climate, EGU General Assembly 2026, Vienna, Austria, 3–8 May 2026, EGU26-4864, https://doi.org/10.5194/egusphere-egu26-4864, 2026.

Many countries rely on international trade to ensure food security. With climate change and projected increases in the frequency and severity of extreme weather events, a significant portion of currently traded crops is vulnerable to climate extremes. While many studies have quantified the impact of extreme weather on crop production, few have linked these impacts to international trade and analyzed how future risks differ from the past. In this study, I combined crop modeling with FAOSTAT on crop and food trade data to identify the worst-case scenario in which extreme weather affects global staple crop trade. Six staple crops were included in the analysis. Probability distributions of each crop’s production were estimated for both historical and future periods under the 2020 crop distribution baseline. The worst-case scenario was determined based on the amount of traded crop affected in the past and future climates. The results provide insight into how future risks differ from historical patterns and whether international trade can continue to ensure food security under changing climate conditions.

How to cite: Su, H.: Identify the worst-case scenario where extreme weather has the greatest impact on the global staple crop trade, EGU General Assembly 2026, Vienna, Austria, 3–8 May 2026, EGU26-5916, https://doi.org/10.5194/egusphere-egu26-5916, 2026.

EGU26-8004 | ECS | Posters on site | CL3.2.4

Better serving impact assessments via AI: Reconstructing daily extremes from spatiotemporal downscaling of monthly fields 

Yu Huang, Sebastian Bathiany, Shangshang Yang, Michael Aich, Philipp Hess, and Niklas Boers

Climate impact assessment studies strongly depend on fine representations of meteorological fields. Downscaling addresses the trade-off between data requirements and storage capacity, yet the faithful replication of extreme-value statistics and spatiotemporal consistency presents a persistent issue. We present an efficient generative AI model for spatiotemporal downscaling. Using coarse-resolution monthly fields as inputs, the model reconstructs sequences of daily fields with the enhanced spatial resolution. The AI-generated daily fields accurately reproduce spatial coherence, temporal persistence, and extreme-value characteristics, showing strong agreement with ground-truth daily observations. We look forward to applying this framework more effectively to future studies on the impacts of extreme events. 

How to cite: Huang, Y., Bathiany, S., Yang, S., Aich, M., Hess, P., and Boers, N.: Better serving impact assessments via AI: Reconstructing daily extremes from spatiotemporal downscaling of monthly fields, EGU General Assembly 2026, Vienna, Austria, 3–8 May 2026, EGU26-8004, https://doi.org/10.5194/egusphere-egu26-8004, 2026.

EGU26-8241 | ECS | Posters on site | CL3.2.4

A process-based physical climate storyline for the Hercules storm in Portugal: extreme coastal flooding under climate change 

Gil Lemos, Pedro MM Soares, Ricardo Simões, Carlos Antunes, Ivana Bosnic, and Celso Pinto

In the beginning of 2014, exceptionally energetic swells associated with the Hercules storm (also known as “Christina”) produced one of the most devastating coastal events ever recorded in Portugal. Between January 6th and 7th, coastal flooding affected more than 30 municipalities along the Portuguese coastline, with offshore buoys registering maximum individual wave heights and periods of 14.91 m and 28.10 s, respectively. The storm resulted in more than 16 million euros in direct damages due to overtopping and coastal flooding, while indirect losses (considering affected businesses and populations) are estimated to have reached hundreds of millions of euros. In this study, two physical climate storylines are developed to assess the impacts of a “Hercules”-like storm, at five key-locations along the Portuguese coastline, occurring by the end of the 21st century, under the combined influence of sea-level rise (SLR), projected changes in wave climate, and altered coastal morphology, while retaining the same statistical representativeness observed in 2014. The storyline approach enables a clear linkage to the original event and facilitates the assessment of future extreme events such as Hercules within the context of a changing climate, supporting decision-making by working backwards from specific vulnerabilities or decision points. Results indicate that the impacts of a future Hercules-like storm are projected to intensify, considering SLR and increases in high-percentile wave energy. Extreme coastal flooding is expected to affect 1.9 to 2.4 times more area than in 2014, resulting in 3.2 to 6.5 times more physically impacted buildings, particularly in densely urbanized coastal sectors. As coastal erosion is expected to reduce the natural protection of Portuguese sandy coastlines, the currently employed protection mechanisms will require robust adaptation measures, strategically defined to withstand long-return-period extreme events.


This work is supported by FCT, I.P./MCTES through national funds (PIDDAC): LA/P/0068/2020 - https://doi.org/10.54499/LA/P/0068/2020, UID/50019/2025, https://doi.org /10.54499/UID/PRR/50019/2025, UID/PRR2/50019/2025. The authors would like also to acknowledge the project “Elaboração do Plano Municipal de Ação Climática de Barcelos (PMACB).

How to cite: Lemos, G., MM Soares, P., Simões, R., Antunes, C., Bosnic, I., and Pinto, C.: A process-based physical climate storyline for the Hercules storm in Portugal: extreme coastal flooding under climate change, EGU General Assembly 2026, Vienna, Austria, 3–8 May 2026, EGU26-8241, https://doi.org/10.5194/egusphere-egu26-8241, 2026.

EGU26-9101 | Posters on site | CL3.2.4

Hot-dry compound events in the European Alps: Multi-century assessment (1600-2099 CE) indicates the need for fast adaptation 

Raphael Neukom, Tito Arosio, Alessandra Bottero, Anne Kempel, Veruska Muccione, Christian Rixen, Kerstin Treydte, and Pierluigi Calanca

Compound hot–dry events have recently led to severe consequences globally, often triggering cascading impacts across ecological and socio-economic systems. Currently, most analyses of hot–dry extremes rely on short observational records or projections, limiting evaluation against pre-industrial variability—the climatic range to which many natural and human systems adapted over centuries. This makes it difficult to place impacts of the increased intensity and frequency of compound events in an appropriate context for examining adaptation needs.

Here we leverage a unique data coverage in the Swiss Alps to quantify changes in summer mean climate and in compound hot–dry extremes and their associated return periods from 1600 to 2099 CE. Data used include multi-century temperature and atmospheric drought reconstructions from tree rings going back to 1600 CE, instrumental station records, and local-scale climate projections for 1981-2099.

Copula-based modelling shows that summers classified as extreme in pre-industrial conditions have become common in today's climate and are expected to correspond to cold and wet conditions by the end of the century. Our analysis further shows that the hot–dry conditions witnessed in summer 2003—characterized by simultaneous positive temperature and vapor pressure deficit (VPD) anomalies of 5.3°C and 2.6 hPa relative to the pre-industrial mean, respectively—were unprecedented over at least the past 400 years and are projected to remain rare until the end of the century under RCP2.6. By contrast, they are likely to occur every 2-3 years under RCP4.5 and even to become colder and wetter than average by 2070-2099 under RCP8.5, since in the latter case, temperature and VPD anomalies are projected to exceed pre-industrial conditions by 10.4°C and 8.1 hPa in the extreme case (30-year return period).

Without countermeasures, the consequences of these changes will include, among other things, dramatic losses in agricultural production and undesirable changes in forest ecosystem dynamics. Ultimately, our analysis suggests that rapid adaptation is necessary to avoid facing more frequent extreme heat and drought conditions than those observed under pre-industrial conditions. Under RCP8.5, in particular, socio-ecological systems will need to continuously adapt within 15 years to changes in the average climate to avoid facing high-impact hot-dry compound event frequencies higher than those experienced at any time over the past 400 years. Given that adaptation in mountain regions is currently not keeping up with the realized and projected climate impacts, as pointed out in several studies, we argue that the required speed of adaptation can pose substantial challenges for alpine societies.

How to cite: Neukom, R., Arosio, T., Bottero, A., Kempel, A., Muccione, V., Rixen, C., Treydte, K., and Calanca, P.: Hot-dry compound events in the European Alps: Multi-century assessment (1600-2099 CE) indicates the need for fast adaptation, EGU General Assembly 2026, Vienna, Austria, 3–8 May 2026, EGU26-9101, https://doi.org/10.5194/egusphere-egu26-9101, 2026.

EGU26-9800 | ECS | Posters on site | CL3.2.4

Sensitivity of Storm Boris rainfall intensification to wind nudging strength in event-based climate-change storyline simulations 

Antonio Sánchez Benítez, Marylou Athanase, and Helge F. Goessling

Understanding how climate change influences environmental extremes is vital for developing effective adaptation and mitigation strategies. In this study, we apply an event-based storyline approach to assess changes in accumulated precipitation associated with Storm Boris, which impacted Central Europe in September 2024. We examine both historical changes (attribution) and future projections and extend previous work by investigating the sensitivity of results to the degree of imposed dynamical constraint. Using the global CMIP6 coupled climate model AWI-CM1, we nudge simulations toward observed ERA5 winds—including the jet stream—across a range of climate backgrounds: preindustrial, present-day, and possible future states with 2, 3, and 4 °C global warming relative to preindustrial conditions. Two nudging configurations are compared: (1) a “weak constraint” configuration, in which only synoptic- and planetary-scale winds in the free troposphere are nudged, permitting some dynamical adjustment with warming; and (2) a “strong constraint” configuration, in which winds at all vertical levels and scales are imposed, thereby completely suppressing dynamical changes.

Both configurations capture the event, with stronger present-day rainfall in the strongly constrained configuration. The observed climate change between pre-industrial and present day is robust, with increases of 7% (4%) in accumulated rainfall under the weak (strong) constraint. Projections up to a 3ºC warmer climate show linear increases in the accumulated rainfall for both configurations. Beyond +3ºC, the response strongly diverges. Under weak constraint, rainfall changes at +4ºC are marginal or even mildly reduced relative to present-day, whereas the strongly constrained configuration continues to show linear increases. This divergence is linked to thermally-driven dynamical adjustments permitted under weak constraint. Whether these adjustments reflect a realistic response or methodological artifacts, and whether similar behaviour occurs in other events, remains to be explored. Our results highlight remaining uncertainties in storyline-based extreme precipitation projections, and demonstrate the importance of considering multiple possibilities.

How to cite: Sánchez Benítez, A., Athanase, M., and Goessling, H. F.: Sensitivity of Storm Boris rainfall intensification to wind nudging strength in event-based climate-change storyline simulations, EGU General Assembly 2026, Vienna, Austria, 3–8 May 2026, EGU26-9800, https://doi.org/10.5194/egusphere-egu26-9800, 2026.

EGU26-10410 | ECS | Orals | CL3.2.4

Extreme rainfall attribution distorted by structural warming biases in climate models 

Damián Insua Costa, Marc Lemus Cánovas, Martín Senande Rivera, Victoria M. H. Deman, João L. Geirinhas, and Diego G. Miralles

While the performance of climate models in simulating the magnitude of global warming has been extensively assessed, their fidelity in representing the three-dimensional (3-D) structure of warming, and how this affects extreme event attribution, remains poorly understood. Pseudo-global-warming experiments implicitly assume that imposed anthropogenic warming perturbations realistically capture the observed vertical and horizontal distribution of atmospheric temperature change. However, this assumption is rarely evaluated explicitly.

We diagnose 3-D structural warming discrepancies by comparing a representative set of six CMIP6 climate models against ERA5 temperature trends over 1940–2024. We show that widely used models exhibit systematic vertical and horizontal warming biases, typically over-amplifying warming in the mid-to-upper troposphere while damping the response near the surface, particularly across Northern Hemisphere mid-latitudes. We further show that these structural biases propagate into substantially different estimates of extreme rainfall intensification.

Using an ensemble of 81 high-resolution MPAS simulations within a storyline attribution framework, we analyze the October 2024 Valencia flood-producing storm as a high-impact case study. The diagnosed anthropogenic rainfall signal is highly sensitive to the 3-D structure of the imposed warming: CMIP6-based counterfactual experiments yield weak reductions in extreme rainfall (~10%), whereas observation-constrained warming profiles produce a stronger and more significant anthropogenic contribution (~30%). This amplification arises from enhanced low-level moistening and increased convective instability, together with dynamically consistent upper-level flow strengthening. The results confirm that 3-D warming structure is a first-order control on extreme-rainfall attribution, and that persistent model-structural errors can lead to a systematic underestimation of attribution signals in mid-latitude, high-impact precipitation extremes.

How to cite: Insua Costa, D., Lemus Cánovas, M., Senande Rivera, M., M. H. Deman, V., L. Geirinhas, J., and G. Miralles, D.: Extreme rainfall attribution distorted by structural warming biases in climate models, EGU General Assembly 2026, Vienna, Austria, 3–8 May 2026, EGU26-10410, https://doi.org/10.5194/egusphere-egu26-10410, 2026.

EGU26-10755 | ECS | Posters on site | CL3.2.4

Ensemble boosting of extreme precipitation in the Alps 

Laurenz Roither, Andreas F. Prein, Erich Fischer, and Neil Aellen

The Alps, with their complex topography, important geographic location and varying climatic influences have become a highly vulnerable region. Especially extreme precipitation and its associated impacts - from floods to landslides - are directly amplified by this distinct local environment.

Because observational timeseries are rather short and sample only limited locations, the impact-producing extreme tail of the precipitation distribution remains largely unexplored. In addition, the non-stationarity of the climate system makes data from a past climate less useful for gaining insights into current and future conditions. Coarse resolution global climate models can be used to produce long simulations including rare extreme events, but important processes such as topographic forcing and deep convection are poorly resolved, which limits physical interpretability. A different approach is needed to produce robust and actionable climate information on the local scales required for stress testing, early warning, adaptation and risk mitigation.

We suggest expanding the method of Ensemble Boosting into the realm of high-resolution modeling. We employ a global ICON setup with 10-20 km grid spacing with a two-way nested kilometer-scale European domain. Our initial goal is to simulate the 2013 Northern Alps flooding using ERA5 initial conditions. We asses lead time sensitivities for reinitializing simulations to optimize for variability and intensity within the boosted ensemble. We expect to produce physically consistent, interpretable and realistic storylines based on a historic extreme precipitation event in the Alps. These storylines enable us to assess driving processes and test physical limits of extreme precipitation in today’s climatic conditions.

With the current focus on a specific region and event we want to exercise a proof of concept embedded in a user-oriented framework. Next steps include producing a catalogue of extremes sampling across event types with the goal to physically constrain the extreme tail of precipitation distributions to reduce uncertainty in extreme value estimation, and to estimate return periods. Further applications of our approach could also be focused on climate projections or pseudo global warming simulations to gain insights into possible extremes in future climates.

How to cite: Roither, L., Prein, A. F., Fischer, E., and Aellen, N.: Ensemble boosting of extreme precipitation in the Alps, EGU General Assembly 2026, Vienna, Austria, 3–8 May 2026, EGU26-10755, https://doi.org/10.5194/egusphere-egu26-10755, 2026.

This study investigates the impact of climate change on the extreme 2020 Meiyu over the middle and lower reaches of the Yangtze River (MLYR) through global variable-resolution ensemble subseasonal hindcasts. Results reveal that post-1980 climate change enhanced the 2020 extreme Meiyu rainfall over the MLYR region by approximately 17.19% at monthly scale, while simultaneously decreasing light and moderate precipitation frequency but intensifying heavy and extreme precipitation occurrences. Climate change intensified the low-pressure over northern China and southern China while weakening the Western Pacific subtropical high and the low-pressure over the Indian Peninsula. The circulation pattern results in significant shear between northeasterly and northwesterly winds in the southern MLYR region, contrasting with the high-pressure dominance in the northern MLYR region. This configuration suppressed convergence, vertical motion, and precipitation in the northern MLYR while enhancing these processes along its southern. Comparison between frequently re-initialized and subseasonal simulations further demonstrates that subseasonal simulations, by allowing full development of interactions between regional systems and large-scale circulation, more realistically represent climate change impacts on Meiyu season. In contrast, the frequently updated initial conditions in re-initialized simulations constrain such feedback processes. This study highlights the importance of utilizing global variable-resolution simulations at subseasonal-scale for climate attribution studies. Future studies would benefit from improved subseasonal forecasting capabilities to enhance attribution reliability.

How to cite: Xu, M. and Zhao, C.: Investigating Climate Change Impacts on the 2020 extreme Meiyu Through Global Variable-Resolution Ensemble Subseasonal Hindcasts, EGU General Assembly 2026, Vienna, Austria, 3–8 May 2026, EGU26-11244, https://doi.org/10.5194/egusphere-egu26-11244, 2026.

EGU26-11790 | Posters on site | CL3.2.4

Exploring the changing dynamics of atmospheric blocking with a modified event-based storyline approach 

Wenqin Zhuo, Antonio Sánchez-Benítez, Marylou Athanase, Thomas Jung, and Helge Gößling

How atmospheric circulation patterns associated with extreme weather respond to climate change remains a challenging question. To explore this issue, we combine spectral nudging in a global climate model (AWI-CM1) with hindcasts, similar to ensemble boosting, in an event-based storyline framework. We examine the dynamic response to climate change of selected atmospheric blocking events associated with winter cold-air outbreaks and summer heatwaves in Eurasia. First, the large-scale circulation during the preconditioning phase of a blocking is constrained by spectral nudging toward reanalysis data, ensuring that the synoptic and planetary-scale environment is realistically and consistently reproduced in different climate backgrounds. The nudging is then switched off a few days before the blocking onset, allowing the model (including the atmospheric circulation) to evolve freely. We generate an ensemble with perturbed initial conditions to sample internal variability of the blocking development due to chaotic error growth. By applying this procedure under pre-industrial and +4 °C warmer climates compared to the present-day climate, we can separate the thermodynamic effects of climate change from the dynamical response, and quantify how a warming climate modifies both the evolution of atmospheric blocking (e.g., intensity and persistence) and the associated extreme weather impacts. We find that the climate state exerts a moderate and event-specific influence on blocking dynamics.

How to cite: Zhuo, W., Sánchez-Benítez, A., Athanase, M., Jung, T., and Gößling, H.: Exploring the changing dynamics of atmospheric blocking with a modified event-based storyline approach, EGU General Assembly 2026, Vienna, Austria, 3–8 May 2026, EGU26-11790, https://doi.org/10.5194/egusphere-egu26-11790, 2026.

EGU26-12438 | Orals | CL3.2.4

Surface flux contributions to Mediterranean heatwaves: a new Lagrangian diagnostic 

Vinita Deshmukh, Andreas Stohl, and Marina Dütsch

The increasing frequency of Mediterranean heatwaves is associated with widespread impacts on human health, agricultural productivity, and infrastructure. Previous studies have shown that large-scale circulation patterns, such as persistent ridges and atmospheric blocking, play a key role in triggering heatwaves, along with subsidence and warm-air advection. However, the intensity and persistence of these events depends not only on the advection of heat and moisture but also on the heat and moisture supplied by turbulent surface fluxes into the advected air mass. Sensible and latent heat fluxes modify air-mass temperature and humidity (and thus equivalent potential temperature) along transport pathways to the heatwave region. These flux contributions, and their relative importance for heatwave anomalies, remain uncertain.

In this study, the contribution of surface sensible and latent heat fluxes to near-surface moisture and temperature anomalies during heatwaves is quantified using a new Lagrangian framework that combines backward air-mass trajectories from the FLEXPART particle dispersion model with surface fluxes from ERA5 reanalysis data. Surface flux contributions to the moist static energy are estimated by coupling them with near-surface residence times of air parcels arriving in the heatwave region. The approach is first validated by showing that moist static energy at the heatwave location can be reproduced by the sum of the particle initial conditions (i.e., most static energy at trajectory termination points) and the surface flux contributions accumulated over the Lagrangian tracking period. Following this validation, surface flux contributions can be split into latent and sensible heat flux contributions and mapped geographically.

The method is then applied to two recent Mediterranean heatwaves to assess the relative roles of sensible and latent heat fluxes and to identify the dominant land and sea source regions. Overall, this framework provides a direct and physically consistent way to attribute the moist static energy associated with heatwaves to surface fluxes, offering new insights into the processes that build and maintain Mediterranean heatwaves.

How to cite: Deshmukh, V., Stohl, A., and Dütsch, M.: Surface flux contributions to Mediterranean heatwaves: a new Lagrangian diagnostic, EGU General Assembly 2026, Vienna, Austria, 3–8 May 2026, EGU26-12438, https://doi.org/10.5194/egusphere-egu26-12438, 2026.

EGU26-12593 | ECS | Posters on site | CL3.2.4

Unprecedented storm surges across European coastlines 

Irene Benito Lazaro, Philip J. Ward, Jeroen C. J. H. Aerts, Dirk Eilander, and Sanne Muis

Recent research has considerably advanced our ability to model extreme storm surges. Nevertheless, simulating unprecedented events remains a challenge. Current large-scale storm surge studies often rely on conventional statistical approaches to extrapolate data beyond historical records. However, these approaches entail large uncertainties and lack the capacity to physically characterise individual events. Furthermore, research on unprecedented events primarily focuses on hazard magnitude, often overlooking other dimensions relevant for risk management decisions.

This study addresses these gaps by examining unprecedented storm surges at a European scale across multiple dimensions. We follow a large-ensemble approach to generate numerous alternative pathways of reality, capturing a broader range of climate variability than the observational records. By pooling ensembles from the ECMWF SEAS5 seasonal forecast and forcing the Global Tide and Surge Model (GTSM), we obtain a 525-year dataset of unbiased, independent storm surge events. This synthetic dataset enables the identification of physically plausible events beyond those found in historical records. We evaluate the dataset against reanalysis-based storm surges to uncover and characterise unprecedented events across three dimensions: magnitude, spatial extent and temporal occurrence. Understanding these different dimensions of unprecedence provides a significant advance in our knowledge of coastal flood risk in Europe and supports improved coastal flood risk management decisions.

How to cite: Benito Lazaro, I., Ward, P. J., Aerts, J. C. J. H., Eilander, D., and Muis, S.: Unprecedented storm surges across European coastlines, EGU General Assembly 2026, Vienna, Austria, 3–8 May 2026, EGU26-12593, https://doi.org/10.5194/egusphere-egu26-12593, 2026.

EGU26-12603 | ECS | Posters on site | CL3.2.4

The influence of sea surface temperatures on moisture sources of Central European Storm Boris in September 2024 

Philipp Maier, Marina Dütsch, Imran Nadeem, Martina Messmer, and Herbert Formayer

This study investigates the role of climate-change-driven sea surface temperature (SST) anomalies in intensifying extreme precipitation associated with Storm Boris. During the period 12th to 16th September 2024, Storm Boris produced extreme precipitation and subsequent flooding in Central Europe, recording over 350 mm accumulated precipitation in five days in parts of Austria. To assess the influence of climate-change-driven SSTs in the Atlantic, Mediterranean and Black Sea, we perform pseudo experiments, in which the SSTs of these water bodies are systematically reduced by 2 K. For that purpose, a model chain consisting of the Weather Research and Forecasting (WRF) model coupled to the Lagrangian particle dispersion model FLEXPART run with back-trajectory settings and a moisture source and transport diagnostic is utilized. The WRF model is further run with wind and pressure nudging over the entire simulation period and without nudging during the event in order to separate thermodynamic and dynamic responses. The moisture uptakes and losses of air parcels arriving in the Central European study region are traced backward in time for up to ten days, enabling the identification of the dominant moisture sources contributing to the observed extreme precipitation. Our analysis reveals the Eastern Europe land areas and the Mediterranean – where SSTs exhibited a strong positive anomaly compared to the long-term climatology – as primary moisture sources for Storm Boris. We further show that the decrease in available moisture by SST reduction in the Black Sea and/or the Atlantic is partially compensated by additional moisture uptake in the Mediterranean. Finally, we assess the thermodynamic sensitivity of mean precipitation to SST changes by comparing the simulated rainfall across different historical SST climatologies. The results indicate an average precipitation increase of approximately 3 % per Kelvin of SST warming for this event, emphasizing the contribution of climate-driven SST increases to the extreme precipitation observed during Storm Boris.

How to cite: Maier, P., Dütsch, M., Nadeem, I., Messmer, M., and Formayer, H.: The influence of sea surface temperatures on moisture sources of Central European Storm Boris in September 2024, EGU General Assembly 2026, Vienna, Austria, 3–8 May 2026, EGU26-12603, https://doi.org/10.5194/egusphere-egu26-12603, 2026.

EGU26-12831 | ECS | Posters on site | CL3.2.4

Towards actionable storylines: development of a reproducible workflow 

Niels Carlier

Storylines, or tales of future weather, are an increasingly popular climate communication strategy. Storyline research aims to inform about how extreme events arise and how severe they may become under different background climates, connecting scientific knowledge and lived experience. Central to this approach is a focus on plausibility rather than probability.  Such "what-if" scenarios can stress-test policy and infrastructure, guiding or strengthening adaptation efforts. This study presents a reproducible chain of methodological steps for constructing such tales through data mining, which is demonstratively applied to the EURO-CORDEX ensemble to produce a coherent and communicable extreme heat storyline for Belgium. We present the results from a first workshop with city officials and emergency coordinators, which successfully launched an ongoing dialogue between stakeholders and scientists about the broader use of storylines as an accessible tool for climate adaptation.

How to cite: Carlier, N.: Towards actionable storylines: development of a reproducible workflow, EGU General Assembly 2026, Vienna, Austria, 3–8 May 2026, EGU26-12831, https://doi.org/10.5194/egusphere-egu26-12831, 2026.

EGU26-12895 | Orals | CL3.2.4

How reliably can we estimate trends of surface weather extremes? A conceptual study using ERA5 reanalyses 

Heini Wernli, Tomasz Sternal, Sven Voigt, Michael Sprenger, and Torsten Hoefler

How the frequency and intensity of extreme weather events is affected by global warming in different regions is one of the central questions of climate change research, with obvious direct implications for climate change adaptation. A standard approach of defining weather extremes is to consider the exceedance of a percentile threshold, calculated from the statistical distribution of a meteorological variable of interest in a predefined reference period. Trends can then be assessed by considering the frequency of threshold exceedances in a period that extends beyond the reference period. While this approach appears rather straightforward, it comes with several choices related to the parameter, percentile threshold, aggregation period, reference period, and boosting interval. Here aggregation period refers to the question whether, e.g., precipitation extremes are considered with a duration of 1 hour or 1 day or multiple days, and the boosting interval is the symmetric time window used to calculate percentiles for a given day of year. When checking these partly methodological choices in previous studies, e.g., those referenced in the IPCC report, it becomes evident that different studies made different choices. Since there is no obvious “best choice”, it is important to quantify the influence of these choices on the resulting trend estimates. Therefore, this study uses ERA5 reanalysis data to systematically and globally explore the trends in 2-m temperature (T2m) and precipitation (P) and their robustness with respect to the aforementioned parameters. Key results are that (i) trends vary strongly between regions, (ii) they are methodologically more robust for T2m than for P, (iii) in regions with weak P trends, the sign of the trend depends on the methodological choices. These explorative analyses with ERA5 data are complemented by synthetic data experiments, in particular to investigate the influence of the boosting window. We suggest that trend analyses of percentile threshold exceedances of any parameter in any dataset should consider these methodological sensitivities in order to communicate robust estimates.

How to cite: Wernli, H., Sternal, T., Voigt, S., Sprenger, M., and Hoefler, T.: How reliably can we estimate trends of surface weather extremes? A conceptual study using ERA5 reanalyses, EGU General Assembly 2026, Vienna, Austria, 3–8 May 2026, EGU26-12895, https://doi.org/10.5194/egusphere-egu26-12895, 2026.

EGU26-13076 | ECS | Orals | CL3.2.4

Global characterisation of the vertical temperature anomaly structure of heat extremes over land in ERA5 

Belinda Hotz, Heini Wernli, and Robin Noyelle

The formation of surface heat extremes is usually described in terms of surface processes and upper-level dynamics. However, their full vertical temperature profile contains additional essential information about the involved processes and dynamics. So far, it remains unclear whether heat extremes are associated with characteristic vertical temperature anomaly profiles and how they vary across the globe.
In this study, we globally and systematically classify vertical temperature anomaly profiles during annual maximum 2-m temperatures, so-called TXx events, using a k-means clustering approach. After a suitable normalisation and scaling of the anomaly profiles, we find three clusters, whose global distribution closely follows the polar, mid-latitude, and tropical climate zones. The three clusters capture key structural differences of heat extremes. Within the tropical cluster, positive temperature anomalies during TXx events are confined to the (often deep) boundary layer and intensify progressively in the days leading up to the event, while the upper troposphere is not deviating from its climatological mean. The mid-latitude cluster also exhibits bottom-heavy temperature anomalies, which, however, extend throughout the full troposphere, showing a strong vertical coupling during heat extremes. In the polar cluster, heat extremes are characterised by deep tropospheric warm anomalies, accompanied by the erosion of the near-surface inversion layer, resulting in a shallow layer of particularly strong temperature anomalies near the ground.
These results show that while multiple physical mechanisms can generate a heat extreme, at first order, temperature anomaly profiles during heat extremes are very similar to each other within a given climate zone. The variability between TXx events is much larger than the variability between the median profile of different grid points in the same cluster. Besides, the temperature profiles of the most extreme events are more similar to those of their cluster than the more moderate events, suggesting a typical dynamics of the most extreme heat events. 

How to cite: Hotz, B., Wernli, H., and Noyelle, R.: Global characterisation of the vertical temperature anomaly structure of heat extremes over land in ERA5, EGU General Assembly 2026, Vienna, Austria, 3–8 May 2026, EGU26-13076, https://doi.org/10.5194/egusphere-egu26-13076, 2026.

EGU26-13386 | Posters on site | CL3.2.4

An emergent constraint for the future frequency of European windstorms 

Matthew Priestley, David Stephenson, Adam Scaife, and Daniel Bannister

Windstorms are one of the most damaging natural hazards in western Europe, yet large inter-model spread limits robust assessment of future frequency changes. Previous assessments have suggested an increasing frequency, however models often have equal and opposite future responses. Using a novel statistical technique to quantify trends in these damaging windstorms we show that the historical mid-latitude meridional pressure gradient explains much of the inter-model variability in projected windstorm frequency across a large CMIP6 ensemble. Constraining projections using the pressure gradient index reduces uncertainty lowers the likelihood of increasing windstorm frequency and indicates a robust decline in pan-European windstorm frequency over the twenty-first century. We present a plausible mechanism via atmosphere–ocean feedbacks important for the North Atlantic storm track and circulation. These results suggest extreme increases in windstorm frequency are unlikely, despite projected increases in storm severity, with important implications for future loss and impact assessments.

How to cite: Priestley, M., Stephenson, D., Scaife, A., and Bannister, D.: An emergent constraint for the future frequency of European windstorms, EGU General Assembly 2026, Vienna, Austria, 3–8 May 2026, EGU26-13386, https://doi.org/10.5194/egusphere-egu26-13386, 2026.

EGU26-13482 | ECS | Orals | CL3.2.4

Global projections of short-duration rainfall extremes using temperature-covariate models 

Jovan Blagojević, Andreas Prein, Nadav Peleg, and Peter Molnar

Short-duration, high-intensity rainfall extremes associated with convective storms pose a growing risk to urban areas under a warming climate, yet their future evolution remains difficult to quantify at the global scale using existing modelling approaches. Local projections are often constrained by the lack of long high-resolution observations and by the limited ability of climate models to accurately simulate sub-daily precipitation processes at the global scale. Here, we present a globally applicable framework for projecting changes in rare, short-duration rainfall extremes using temperature as a covariate in a non-stationary extreme value framework building on the TENAX model, driven entirely by global climate model output and without reliance on local observational data. The focus on rare, short-duration extremes directly targets the class of events responsible for a disproportionate share of climate-related impacts.


The approach links changes in rainfall intensity distributions to projected shifts in wet-day temperature distributions from CMIP6 models, integrating over the full temperature distribution rather than relying on uniform scaling or mean-shift assumptions. Dew-point temperature is employed as a proxy for atmospheric moisture availability, allowing thermodynamically constrained intensification of convective rainfall extremes to be represented consistently across climates. In an initial multi-regional application, the framework projects robust intensification of hourly-scale rare rainfall events, with increases of order 10–20% by late century under intermediate emissions scenarios and substantially larger changes under high-emissions pathways. Accounting for changes in the full temperature distribution shows that the strongest intensification occurs for the rarest events, which is underestimated when intensities are scaled only by mean temperature changes.


We further extend the framework to a global scale to assess spatial patterns and key structural uncertainties in projected short-duration rainfall intensification. Results highlight that methodological choices, including the selection of temperature covariate (dew-point versus surface air temperature), can introduce differences comparable to inter-model climate uncertainty in some regions, particularly in moisture-limited and continental climates. Treating these choices explicitly as structural uncertainties provides a clearer interpretation of projection robustness across diverse hydroclimatic regimes and highlights uncertainties beyond inter-model spread alone.


Overall, this work demonstrates that temperature-covariate approaches, when carefully formulated and driven by global climate models, offer a transferable and physically grounded pathway for projecting rare, short-duration rainfall extremes worldwide. The framework enables consistent global assessments in data-scarce regions and supports climate-change impact studies and urban adaptation planning by explicitly quantifying the uncertainties that matter most for short-duration rainfall risk.

How to cite: Blagojević, J., Prein, A., Peleg, N., and Molnar, P.: Global projections of short-duration rainfall extremes using temperature-covariate models, EGU General Assembly 2026, Vienna, Austria, 3–8 May 2026, EGU26-13482, https://doi.org/10.5194/egusphere-egu26-13482, 2026.

EGU26-13670 | Orals | CL3.2.4

Understanding, interpreting, and communicating future extreme precipitation risk using flow precursors 

Joshua Oldham-Dorrington, Camille Li, Stefan Sobolowski, Robin Guillaume-Castel, and Johannes Lutzmann

Many of the most societally impactful weather events in Europe occur on short timescales and there is a growing demand for improved projections of how such extremes will change in the future. That is, how will global climate change over decades impact extreme weather over days? The multiscale nature of this question challenges the capabilities of current earth system models, and this is especially the case for hydrometeorological extremes. Accurately simulating the hazards posed by extreme precipitation requires faithfully resolving interactions between the large-scale circulation, synoptic dynamics, the local boundary-layer, and hydrological and land surface conditions.


This is not only a quantitative modelling challenge, but a challenge of interpretation and narrative: the dynamics of extreme precipitation are diverse across space and time, and the statistics of the highest impact events are necessarily poorly constrained. These challenges are complicated further by the evergrowing size and hetereogeneity of multi-model datasets How can we explain model biases and trends in extreme precipitation? When models project similar changes in hydrometeorological risk do they do so for the same reasons? What implications do these factors have for regional downscaling and impact modelling? Can we relate future extremes quantitatively and robustly to historical high-impact events, as often requested by societal stakeholders?


We tackle these questions through a novel flow-precursor framework, applied to observational data, large ensemble climate simulations and subseasonal weather forecasts. We decompose extreme event risk into contributions from different scales and flow conditions, using regionally specific synoptic flow precursors which are directly associated with individual high-impact extremes or classes of extreme. These precursors are algorithmically identified and can be easily computed in large datasets, allowing us to obtain a physical interpretation of changing extreme risk across Europe without obscuring regional or seasonal diversity in precipitation dynamics.


We show how climate model biases and forced changes in extreme precipitation can be explained, categorised, and visualised in a succinct way that highlights important differences in their suitability for use in downscaling, impact modelling and storyline development. We demonstrate how dynamical decomposition can extract usable climate information even from heavily biased models, and how insights from models at different scales–such as from large climate ensembles and high-resolution weather forecasts–can be quantitatively synthesised to provide new insights on future hazards and plausible worst-case scenarios. Finally, we show how the method can be used to reframe complex, probabilistic climate projections and weather forecasts in terms of individual high impact historical events, aiding scenario visualisation, and allowing stakeholders to leverage their experience and domain knowledge when preparing for future high-impact extremes.

How to cite: Oldham-Dorrington, J., Li, C., Sobolowski, S., Guillaume-Castel, R., and Lutzmann, J.: Understanding, interpreting, and communicating future extreme precipitation risk using flow precursors, EGU General Assembly 2026, Vienna, Austria, 3–8 May 2026, EGU26-13670, https://doi.org/10.5194/egusphere-egu26-13670, 2026.

EGU26-13840 * | ECS | Orals | CL3.2.4 | Highlight

Behind or ahead of committed warming: what it means for future hot extremes 

Dominik L. Schumacher, Victoria Bauer, Lei Gu, Lorenzo Pierini, and Sonia I. Seneviratne

Virtually all land regions have warmed over recent decades, yet heatwave trends show striking regional differences. The thermodynamic rise of hot extremes can be strongly modulated by atmospheric circulation, a phenomenon that has received increasing attention for regions such as Europe and parts of North America, where observed trends in hot extremes have been amplified and dampened, respectively. But what about other regions? How persistent are these circulation anomalies? And what are the implications for future heatwaves?

Using dedicated climate model experiments, we quantify how atmospheric internal variability has modulated historical heatwave trends globally. Building on a large ensemble framework, we interpret observed circulation contributions as placing regions on unusual warming trajectories — either well below or above the ensemble mean expectation. Regions currently displaying less warming compared to climate model simulations are effectively "lagging behind" the warming already committed to by anthropogenic forcing; those running warm are "ahead".

This warming trajectory position has profound implications for the pace of future change. Regions currently lagging behind, including much of North America, face substantially faster increases in hot extreme probability between now and the mid-century than ensemble mean projections suggest. Conversely, other regions have already experienced much of the expected probability increase. We illustrate these divergent futures through the evolving return period of what was once a 1-in-100-year hot extreme, showing how the present trajectory position determines the pace of change over the coming decades.

How to cite: Schumacher, D. L., Bauer, V., Gu, L., Pierini, L., and Seneviratne, S. I.: Behind or ahead of committed warming: what it means for future hot extremes, EGU General Assembly 2026, Vienna, Austria, 3–8 May 2026, EGU26-13840, https://doi.org/10.5194/egusphere-egu26-13840, 2026.

EGU26-14325 | ECS | Orals | CL3.2.4

A combined storyline-statistical approach for conditional attribution of climate extremes to global warming 

Dalena León-FonFay, Alexander Lemburg, Andreas H. Fink, Joaquim G. Pinto, and Frauke Feser

Quantifying the influence of anthropogenic global warming on extreme events requires both physical and statistical understanding. We present a framework combining two complementary conditional attribution methods: spectrally nudged storylines and flow-analogues. The storyline approach provides insights on how a specific event is shaped by the thermodynamic conditions representing past (counterfactual), present (factual) and future global warming levels (+2K, +3K, +4K). The flow-analogue method provides a statistical analysis of the recurrence of the observed event, and the future storyline-projected events based on similar dynamical patterns that lead to the event of interest. Together, this combined approach allows us to determine not only the change in likelihood of an extreme event occurring as it did in the present, but also the probability that an intensified version (storyline-projected) of it occurred in the future.

Applied to the 2018 Central European heatwave, storylines show an area-mean warming rate of 1.7 °C per degree of global warming. Through the flow-analogue method, it was evidenced that the atmospheric blocking leading to this event remains equally likely to occur regardless of global warming. Despite it, the storyline-projected intensities might become more frequent and extreme at their corresponding warming levels than the factual 2018 event was under present conditions. Specifically, the 2018 heatwave, with an intensity of 2.2 °C and a return period of 1-in-277-years today, is projected to intensify to 6.6 °C with a 1-in-26-years return period in a +4K world. This behavior revealed the importance of other physical mechanisms and interactions influencing the occurrence and intensification of heatwaves beyond the atmospheric circulation pattern and thermodynamic conditions. We conclude that this combined framework is promising for climate change attribution of individual extreme events, offering both a physical assessment of anthropogenic warming and its associated likelihood while accounting for potential shifts in atmospheric dynamics.

How to cite: León-FonFay, D., Lemburg, A., Fink, A. H., Pinto, J. G., and Feser, F.: A combined storyline-statistical approach for conditional attribution of climate extremes to global warming, EGU General Assembly 2026, Vienna, Austria, 3–8 May 2026, EGU26-14325, https://doi.org/10.5194/egusphere-egu26-14325, 2026.

EGU26-14525 | Posters on site | CL3.2.4

Extreme weather events in agriculturally important regions in the Bay of Bengal 

Martina Messmer, Santos José González-Rojí, and Sonia Leonard

The Bay of Bengal is one of the most densely populated regions globally, bordered by India, Bangladesh, and Myanmar. Its coastal zones represent critical hotspots from both societal and agricultural perspectives. Major river deltas, including those of the Brahmaputra and Ganges in Bangladesh, the Mahanadi in India, and the Ayeyarwady in Myanmar, provide essential freshwater resources that sustain highly productive agricultural systems and support large local populations. However, ongoing climate change is increasingly associated with extreme weather conditions, such as elevated temperatures, prolonged droughts, and intense precipitation events.

To investigate how climate change at different time horizons and levels of warming influences these extremes, we conducted five regional climate simulations using the Weather Research and Forecasting (WRF) model at 5km horizontal spacing. One simulation represents a 30-year reference period (1981–2010). Two additional simulations cover the mid-21st century (2031–2060) under the SSP2-4.5 and SSP5-8.5 scenarios, respectively. The remaining two simulations represent the late 21st century (2071–2100) under the same SSP2-4.5 and SSP5-8.5 emission pathways.

The results indicate a substantial increase in extreme heat across all river deltas. The number of days exceeding 40 °C is projected to double under SSP2-4.5 and to triple under SSP5-8.5 by the end of the century. Drought frequency increases markedly, with the number of drought events projected to quadruple under both scenarios. Concurrently, extreme precipitation, measured by the RX5 index, shows significant increases in the Ayeyarwady and Brahmaputra deltas. The combined effects of intensified heat stress, more frequent droughts, and increasingly severe precipitation events present major challenges for both local populations and agricultural systems, potentially increasing the risk of displacement in these vulnerable regions.

How to cite: Messmer, M., González-Rojí, S. J., and Leonard, S.: Extreme weather events in agriculturally important regions in the Bay of Bengal, EGU General Assembly 2026, Vienna, Austria, 3–8 May 2026, EGU26-14525, https://doi.org/10.5194/egusphere-egu26-14525, 2026.

EGU26-14618 | ECS | Orals | CL3.2.4

Evolution of global climate and regional hot extremes following CO2 emissions cessation. 

Andrea Rivosecchi, Andrea Dittus, Ed Hawkins, Reinhard Schiemann, and Erich Fischer

Reaching net zero greenhouse gas emissions is essential to halt the current global warming trend and attempt to stabilise global temperatures. However, uncertainties remain on the sign and the magnitude of the long-term responses of the climate system following anthropogenic emissions cessation.

This study contributes to constraining this uncertainty by exploring the global and regional temperature evolution under zero CO2 emissions conditions in the UKESM1.2 projections following the TIPMIP protocol (Jones et al., 2025). Stabilised warming levels spanning +1.5°C to +5°C above pre-industrial conditions are analysed to understand the impact of antecedent conditions on post zero-emissions trends. We find that the global average surface air temperature (GSAT) keeps increasing in all stabilised warming scenarios. The increase is more pronounced in the +3°C to +5°C scenarios, where it approaches 0.25°C per century. Most of the warming is registered in the Southern Hemisphere, particularly in the Southern Ocean, while the Northern Hemisphere experiences a slight cooling trend over land.

These regional cooling trends are more marked for the annual temperature maxima, with several regions across 45-65°N experiencing cooling of >1°C per century. The strongest cooling trends emerge in the higher warming scenarios, and we investigate their drivers in North America, where the cooling magnitude exceeds 1.5°C per century. Using a method based on constructed circulation analogues, we find that the projected cooling trend is almost completely explained by thermodynamic drivers and we reconcile this finding with the model vegetation changes. Our findings serve a double purpose. On one hand, they show the significant contribution that land-use changes can have regionally for the attenuation of annual temperature maxima, supporting the case for their careful consideration in future mitigation and adaptation strategies. On the other, they highlight how highly idealised protocols like TIPMIP could bias climate projections post emissions cessation if they do not include realistic projections of land use changes.


Bibliography

Jones, Colin, Bossert, I., Dennis, D. P., Jeffery, H., Jones, C. D., Koenigk, T., Loriani, S., Sanderson, B., Séférian, R., Wyser, K., Yang, S., Abe, M., Bathiany, S., Braconnot, P., Brovkin, V., Burger, F. A., Cadule, P., Castruccio, F. S., Danabasoglu, G., … Ziehn, T. (2025). The TIPMIP Earth system model experiment protocol: phase 1. https://doi.org/10.5194/egusphere-2025-3604.

How to cite: Rivosecchi, A., Dittus, A., Hawkins, E., Schiemann, R., and Fischer, E.: Evolution of global climate and regional hot extremes following CO2 emissions cessation., EGU General Assembly 2026, Vienna, Austria, 3–8 May 2026, EGU26-14618, https://doi.org/10.5194/egusphere-egu26-14618, 2026.

In the aftermath of extreme weather, policy makers, contingency planners and insurers often seek to understand the likelihood of experiencing such events. The most common tool for this is extreme value analysis (EVA), but likelihood estimates based on observed or reanalysis data can be highly uncertain due to the relatively short observational record. Substantially larger samples of plausible extreme weather events can be obtained using the UNprecedented Simulated Extremes using ENsembles (UNSEEN) approach, which involves applying EVA to large forecast/hindcast ensembles. While larger sample sizes generally reduce the uncertainty associated with EVA, using seasonal or decadal forecast data introduces additional uncertainties related to model bias and model diversity. In this study, a multi-model ensemble of hindcast data from the CMIP6 Decadal Climate Prediction Project was analysed to quantify these additional uncertainties in the context of extreme temperature and rainfall across Australia. Factoring in model bias and diversity dramatically increased the uncertainty associated with estimated event likelihoods from the UNSEEN approach, to the point that it equaled or exceeded the uncertainty from an observation-based approach at most locations. Model diversity tended to be the largest source of uncertainty (60-70% of the total). Bias correction was also a significant source of uncertainty (30-40%), while the uncertainty associated with EVA was trivial. Our results suggest that an UNSEEN-based approach to estimating the likelihood of climate extremes should be understood as an approach that has different uncertainty characteristics to an observation-based approach, as opposed to less uncertainty.

How to cite: Irving, D., Stellema, A., and Risbey, J.: Quantifying the uncertainty associated with extreme weather likelihood estimates derived from large model ensembles, EGU General Assembly 2026, Vienna, Austria, 3–8 May 2026, EGU26-14625, https://doi.org/10.5194/egusphere-egu26-14625, 2026.

EGU26-14884 | ECS | Posters on site | CL3.2.4

Emerging intra-annual sequences of climate extremes in Europe  

Andrea Böhnisch, Matthew Lee Newell, Ophélie Meuriot, Jorge Soto Martin, Ane Carina Reiter, and Martin Drews

Climate change drives an increase in the frequency of multiple meteorological extreme event types (e.g., extreme precipitation, storms, droughts, heatwaves) by affecting thermodynamic and dynamic processes in the coupled land-atmosphere system. For example, the extended droughts during 2018-2020 in Europe, flooding triggered by extreme precipitation in Germany in 2021, as well as Valencia and central France in 2024, or prolonged heatwaves in 2003, 2015, 2018, and 2022 across continental Europe had strong adverse impacts on socio-economic systems and the environment. Given a higher frequency of extreme events, it becomes more likely that regions experience events of the same or different types in consecutive seasons, thereby challenging the regions’ short-term coping and recovery ability and long-term resilience.

While extreme events are generally well-studied, holistic analyses of typical sequences of extreme events are missing. Compound analyses commonly focus on specific combinations of events, but usually miss typical intra-annual sequences of extreme events with the potential for high impacts.

Our analysis addresses the question 1) which sequences of extremes occur most often, 2) how robust they are, and 3) their physical implications. We assess intra-annual sequences of extreme seasons on the European scale in a regional multi-member ensemble of the Canadian Regional Climate Model version 5 (CRCM5) covering the European CORDEX domain at a high spatial resolution (0.11°, 12 km). The CRCM5 was driven by four members of the Max-Planck-Institute Grand Ensemble (MPI-ESM-LR) under SSP3-7.0. Given that the four members differ only by initial conditions and thus share the same climate, this setup quadruples the sample size for finding extreme events. We selected extreme event indicators for extreme heat, droughts, extreme precipitation and wind. They cover hazards of regionally varying importance, but each of them poses considerable risks to human and natural systems in Europe. The sequences of extreme events were derived using the sequential pattern mining algorithm cSPADE.

In this contribution, we show first findings on the most prevalent sequences of seasonal events under SSP3-7.0. We map vulnerability hotspots associated with intra-annual extreme event characteristics and present physical “stories” corresponding to the sequences. Furthermore, we aim to provide the basis for understanding potential interrelations of seasonal extreme events.

How to cite: Böhnisch, A., Lee Newell, M., Meuriot, O., Soto Martin, J., Reiter, A. C., and Drews, M.: Emerging intra-annual sequences of climate extremes in Europe , EGU General Assembly 2026, Vienna, Austria, 3–8 May 2026, EGU26-14884, https://doi.org/10.5194/egusphere-egu26-14884, 2026.

EGU26-15041 | ECS | Orals | CL3.2.4

Amplified socioeconomic impacts of compound drought–heatwave events 

Koffi Worou and Gabriele Messori

Isolated and compound climate extremes, such as droughts and heatwaves, are intensifying under global warming. Although recent studies have advanced the physical understanding and classification of compound events, their socioeconomic impacts remain poorly quantified at the global scale using disaster record databases. Building on evidence that compound drought–flood events can generate impacts substantially larger than those from isolated hazards, this study extends the inquiry by providing a global assessment of the socioeconomic impacts of compound drought–heatwave (CDH) events.

To achieve this, we use the Emergency Events Database (EM-DAT) for the period 1960–2025 and analyse reported drought and heatwave disasters at the global scale. CDH events are identified using complementary approaches, including overlapping drought and heatwave records within the same location (top-level administrative unit) and the “Associated Types” information in EM-DAT, thereby allowing assessment of sensitivity to event definition. Furthermore, EM-DAT drought events are compared with heatwave conditions derived from the ERA5 reanalysis to evaluate consistency between reported impacts and climatic co-occurrence. Socioeconomic impacts are quantified using the affected population, human fatalities, and reported damages.

Preliminary results show a clear increase in the number of reported areas affected by CDH events globally, particularly since the mid-2010s. Moreover, CDH events are consistently associated with greater impacts than single hazards. Specifically, using matching events within EM-DAT, compound events exhibit greater total damage, while fatalities during heatwaves increase by up to a factor of five when drought conditions co-occur. Furthermore, when drought impacts from EM-DAT are associated with heatwaves identified in ERA5, the damage and affected population are, respectively, two to four times higher than for isolated drought events.

Taken together, these findings provide global-scale evidence that co-occurring droughts and heatwaves substantially amplify socioeconomic impacts. This underscores the need to explicitly account for compound extremes in climate risk assessment, adaptation planning, and disaster risk reduction.

How to cite: Worou, K. and Messori, G.: Amplified socioeconomic impacts of compound drought–heatwave events, EGU General Assembly 2026, Vienna, Austria, 3–8 May 2026, EGU26-15041, https://doi.org/10.5194/egusphere-egu26-15041, 2026.

EGU26-15607 | ECS | Orals | CL3.2.4

Intensification of Short-Duration Extreme Precipitation in Greater Sydney 

Leena Khadke, Jason P. Evans, Youngil Kim, Giovanni Di Virgilio, and Jatin Kala

Short-duration extreme precipitation is a key driver of urban flooding and associated socio-economic impacts in a warming climate. Increasing urbanization further amplifies the vulnerability of cities to intense rainfall occurring over minutes to hours. These extremes frequently trigger flash floods and pose substantial risks to urban infrastructure and public safety. Despite growing recognition of its importance, regional-scale assessments of sub-hourly extreme precipitation remain limited. Emerging observational evidence indicates that short-duration precipitation events (≤1 hour) are intensifying at a faster rate than longer-duration events. In this study, we analyze short-duration extreme precipitation events at 5-, 10-, 20-, 30-, and 60-minute timescales using observations from 16 automated weather stations (AWS) across the rapidly urbanizing Greater Sydney region, New South Wales, Australia. Our results show a pronounced increasing trend in extreme precipitation at higher percentiles, particularly at the 5–10 minute timescales, compared to hourly extremes. At the hourly scale, we evaluate the performance of five convection-permitting regional climate model simulations (4 km ensemble) against AWS observations. The models reasonably capture the upper tail of the precipitation distribution but tend to slightly overestimate the frequency of extreme events. To assess future changes, we examine the intensity of 99th percentile precipitation extremes across three periods—historical (1951–2014), near future (2015–2057), and far future (2058–2100)—under three Shared Socioeconomic Pathway scenarios (SSP126, SSP245, and SSP370). The projections indicate a consistent intensification of extreme precipitation, with a substantial upward shift in the top 1% of historical extremes, most pronounced under the high-emission SSP370 scenario. Interestingly, the simulations also project a reduction in the total number of wet hours relative to the historical baseline, suggesting a transition toward shorter-duration but more intense precipitation events. Although considerable inter-model spread and spatial variability exist, increases in 99th percentile extremes are robust across most scenarios. Notably, under SSP126, a decline in extreme precipitation is projected in the far future, highlighting the potential benefits of strong emission mitigation. These findings underscore the need to explicitly incorporate short-duration precipitation extremes into urban planning and flood risk management under climate change.

Keywords: Automatic Weather Station, Climate change, Flash floods, NARCliM2.0, Regional climate models, Sub-hourly extreme precipitation

How to cite: Khadke, L., Evans, J. P., Kim, Y., Virgilio, G. D., and Kala, J.: Intensification of Short-Duration Extreme Precipitation in Greater Sydney, EGU General Assembly 2026, Vienna, Austria, 3–8 May 2026, EGU26-15607, https://doi.org/10.5194/egusphere-egu26-15607, 2026.

On 1 October 2020, the intense extra-tropical storm Alex impacted the north-west coast of France, producing unusually strong wind gusts for the season. On 2 October, the storm triggered record-breaking rainfall over the south-eastern French Alps and north-western Italian Alps. In France, this Heavy Precipitation Event (HPE) caused severe flooding and land­slides, resulting in casualties, and over 1 billion euros in economic losses.

We used convection-permitting regional climate modeling with a spa­tial resolution of 2.5 km to investigate these observed events. Simulations were conducted over September-October 2020 on an extensive domain centered on France. Our model successfully reproduces the characteristics of both the HPE and storm Alex, including the observed sequence of events and impacts (Bador et al., 2025).

We then explored how the observed 2020 Mediterranean HPE could have been differ­ent had it occurred 2 years later, in 2022, where warmer sea surface was recorded in the western Mediterranean Sea. This storyline analysis suggested reduced precipitation impacts over the south-eastern French Alps but enhanced impacts in Italy. Additional sensitivity experiments confirmed the key role of regional sea surface temperatures (SSTs) in shaping the HPE’s intensity in the western Alps, with an eastward shift of heavy precipitation with higher Mediterranean SSTs. Our simulations consistently show that sea surface warming can further intensify the Mediterranean HPE, while cooling reduces the intensity of extreme precipitation and local impacts. In contrast, modifications to the Atlantic SSTs affecting storm Alex itself have a limited influence on the regional Mediterranean circulation and the HPE.

All simulations were performed using initial-condition large ensembles to assess the role of internal variability in shaping local extremes. We highlighted variations among ensemble members in both local rainfall extremes and in gustiness. As impact sectors increasingly rely on km-scale climate modelling to inform local climate change assessments, our results underscore the importance of the ensemble-based approaches to fully capture the range of possible outcomes for extreme events locally.

How to cite: Bador, M., Noirot, L., Caillaud, C., and Boé, J.: Cooler than observed sea surface could have reduced impacts of storm Alex and induced mediterranean heavy precipitation event in France, EGU General Assembly 2026, Vienna, Austria, 3–8 May 2026, EGU26-16649, https://doi.org/10.5194/egusphere-egu26-16649, 2026.

EGU26-16825 | Orals | CL3.2.4

 Trends and Drivers of Cold Extremes in a Changing Climate 

Daniela Domeisen, Hilla Afargan-Gerstman, Russell Blackport, Amy H. Butler, Edward Hanna, Alexey Yu. Karpechko, Marlene Kretschmer, Robert W. Lee, Amanda Maycock, Emmanuele Russo, Xiaocen Shen, and Isla R. Simpson

Cold extremes — also referred to as cold air outbreaks, cold spells, or cold snaps — have received less attention in the scientific literature than hot extremes, largely because their frequency and intensity are projected to decrease under climate change. Nevertheless, cold extremes continue to exert substantial impacts across a wide range of sectors, including human health, agriculture, and infrastructure. Superimposed on their overall global decline is pronounced regional and seasonal variability, driven by variability in the underlying physical mechanisms, which themselves may be influenced by climate change. Here, we provide an overview of global and regional trends in cold extremes, examine their key drivers in both present and future climates, and discuss outstanding questions related to the dynamical forcing of cold extremes and their projected evolution under climate change.

How to cite: Domeisen, D., Afargan-Gerstman, H., Blackport, R., Butler, A. H., Hanna, E., Karpechko, A. Yu., Kretschmer, M., Lee, R. W., Maycock, A., Russo, E., Shen, X., and Simpson, I. R.:  Trends and Drivers of Cold Extremes in a Changing Climate, EGU General Assembly 2026, Vienna, Austria, 3–8 May 2026, EGU26-16825, https://doi.org/10.5194/egusphere-egu26-16825, 2026.

The increasing frequency of extreme hot events poses major societal and scientific challenges due to their adverse impacts on human and natural systems, compounded by their unpredictable nature. Climate models are essential for identifying the mechanisms that amplify extremes and for anticipating long-term changes that inform decision making, yet their accuracy is limited by internal variability, structural uncertainties, and systematic biases. Observational constraint approaches that link past and future behavior of physical observables offer a promising way to address these limitations, though they often rely on region-specific empirical relationships.

Here, we show that future changes in hot event probabilities and their uneven spread across global land areas depend critically on the historical properties of temperature distributions. In particular, historical variability controls the growth rates of probabilities, either amplifying or dampening the effects of regional background warming, with important implications for climate-change projections. Building on this insight, we develop a universal analytical framework that combines observational evidence with model output to provide more robust assessments of future changes. Results indicate that hot event probabilities may increase faster than suggested by models alone across much of the land surface. In large areas, including the Euro-Mediterranean and Southeast Asia, observation-constrained increases could exceed model-based estimates by nearly a factor of two, even at low levels of global warming. Surpassing the 2 °C warming threshold could push highly vulnerable regions, such as the Amazon and other tropical land areas, into uncharted climate conditions where extreme heat becomes routine.

These findings support more realistic evaluations of future risk and underscore the need for strengthened mitigation efforts to prevent rapid and potentially irreversible climate shifts.

How to cite: Simolo, C. and Corti, S.: Hot extremes increase faster than models suggest: evidence from observation-constrained projections, EGU General Assembly 2026, Vienna, Austria, 3–8 May 2026, EGU26-17562, https://doi.org/10.5194/egusphere-egu26-17562, 2026.

EGU26-18203 | ECS | Orals | CL3.2.4

Heat extremes in subseasonal hindcasts: a General Extreme Value perspective 

Pauline Rivoire, Maria Pyrina, Philippe Naveau, and Daniela Domeisen

Understanding and characterizing temperature extremes is essential for assessing climate impacts and risks. Robust statistical analysis of such extremes requires large datasets, yet observational records often provide limited samples of rare events. Hindcasts, i.e., retrospective forecast model runs for past dates, are typically used to correct model biases, but their potential for extreme event analysis remains underexplored. Approaches such as UNSEEN (UNprecedented Simulated Extremes using Ensembles) have investigated the potential of seasonal hindcast ensembles to provide large samples of events that are physically plausible, particularly for assessing rare events. However, seasonal hindcasts often focus on monthly means.

In this study, we explore whether a similar approach can be applied to subseasonal hindcasts, evaluating their potential to serve as alternative realizations of extreme events at daily resolution.  We use two complementary methods to compare global temperature extremes in ECMWF subseasonal hindcast with ERA-5 reanalysis: (1) the statistical upper bound of daily 2-meter temperature, and (2) the probability of record-breaking daily 2-meter temperature. By leveraging existing subseasonal hindcast ensembles, we aim to evaluate whether these datasets can be repurposed to study temperature extremes that have not yet been observed but are plausible under current climate conditions

How to cite: Rivoire, P., Pyrina, M., Naveau, P., and Domeisen, D.: Heat extremes in subseasonal hindcasts: a General Extreme Value perspective, EGU General Assembly 2026, Vienna, Austria, 3–8 May 2026, EGU26-18203, https://doi.org/10.5194/egusphere-egu26-18203, 2026.

Unclear and inconsistent terminology for high impact climate phenomena, including concepts such as tipping points, irreversibility, ‘collapse’ and ‘shutdown’, presents a substantial barrier to clear understanding of Earth system risks. These terms are frequently used in assessments of major subsystem shifts in ocean circulation, ice sheets and forest biomes, yet they are often applied without shared definitions across scientific, policy and public contexts. This inconsistency affects how scientific results are interpreted, including perceptions of how quickly changes may unfold and whether different parts of the climate system might influence one another. It also has important psychological and emotional impacts. Language that sounds dramatic or alarming may be intended to motivate action, but it can instead lead to desensitisation, message fatigue, denial or even the spread of misinformation. These reactions can weaken engagement and undermine societal preparedness for potential climate driven transitions.

Government science and policy teams, rely on clear and consistent terminology for effective decision making in situations where thresholds and impacts remain uncertain. To support this need, we – as communication specialists work extensively at the interface between science and policy - are developing an evidence-based glossary and guidance for terminology related to tipping points and other high impact climate concepts. The aim is to improve internal communication and to support clearer interpretation of scientific assessments used in national risk planning.

The project is grounded in social science and uses a mixed methods design. It began with a review of existing definitions and research on the psychological effects of climate language. We carried out semi-structured interviews and workshops with scientists and government officials, and this highlighted how linguistic ambiguity affects policy development and the evaluation of uncertain risks. Utilising ta broad cross section of Met Office staff, we carried out focus groups to explore how different definitions were perceived and understood. Participants, including those with strong scientific backgrounds, showed substantial disagreement about the meaning and implications of key terms. This indicates that confusion around terminology linked to tipping point research is not limited to public audiences but also exists within expert communities.

Insights from this analysis are guiding the co creation of a public facing glossary developed with an expert working group of twelve multidisciplinary specialists at the Met Office. Completion is planned for March 2026, alongside continued engagement with international bodies including WCRP and IPCC. By strengthening shared understanding of terms related to climate system transitions and critical thresholds, this work aims to support more coherent communication of high impact climate concepts, improve public and policy interpretation of uncertain risks and reduce unintended emotional and behavioural responses that can undermine, and distract from effective, and much needed climate action.

How to cite: Macneill, K. and Martin, L.: An Up-HILL Battle: Building consensus on terminology for high impact climate events and tipping point risks., EGU General Assembly 2026, Vienna, Austria, 3–8 May 2026, EGU26-18736, https://doi.org/10.5194/egusphere-egu26-18736, 2026.

EGU26-19875 | ECS | Posters on site | CL3.2.4

Using Stochastic Data to Simulate and Communicate Alternative Multi-Hazard Weather Extreme Events 

Judith Claassen, Wiebke Jäger, Marleen de Ruiter, Elco Koks, and Philip Ward

A stochastic weather generator (SWG) simulates realistic weather time series beyond the historical record by capturing the statistical properties of observed weather patterns. Here, we present a new spatiotemporal SWG, the MYRIAD Stochastic vIne-copula Model (MYRIAD-SIM), which simulates temperature, wind speed, and precipitation. MYRIAD-SIM captures both spatiotemporal and multivariate dependencies using conditional vine copulas. The simulated data enable new insights into compound climate and multi-hazard events by generating high-impact multivariate weather scenarios. For example, the triple storm sequence Dudley, Eunice, and Franklin, which impacted the UK and Europe in 2022, can be simulated as alternative triple-storm events, illustrating not only what happened but also what could have occurred under statistically plausible conditions, such as higher wind speeds or varying precipitation patterns. This study demonstrates how stochastic counterfactuals of historical events can support risk communication by framing hazards in a narrative, event-focused way rather than through abstract probabilities.

How to cite: Claassen, J., Jäger, W., de Ruiter, M., Koks, E., and Ward, P.: Using Stochastic Data to Simulate and Communicate Alternative Multi-Hazard Weather Extreme Events, EGU General Assembly 2026, Vienna, Austria, 3–8 May 2026, EGU26-19875, https://doi.org/10.5194/egusphere-egu26-19875, 2026.

EGU26-19952 | ECS | Posters on site | CL3.2.4

Circulation pathways and surface drivers of extreme summer heat stress over Europe 

Qi Zhang, Joakim Kjellsson, and Emily Black

Extreme summer heat stress presents increasing public health risks across Europe. These extremes are strongly influenced by large-scale atmospheric circulation, yet the specific pathways linking circulation evolution to surface heat stress amplification remain poorly understood. Using the simplified Wet Bulb Globe Temperature (sWBGT), which accounts for both temperature and humidity effects on heat stress, we analyze extreme summer (JJA) events during 1979–2023 based on ERA5 reanalysis and a seven-class European weather regime (WR) classification. We define extreme events as regional sWBGT exceeding the 95th percentile for at least three consecutive days. Extreme sWBGT events across Europe occur predominantly during blocking regimes, with European and Scandinavian blocking playing a dominant role in many regions. We then examine how blocking evolves prior to heat stress peaks. Results show that only Scandinavia exhibits a statistically robust tendency for blocking to develop shortly before the peak, suggesting a circulation transition preceding extreme heat stress. In contrast, most other European regions experience peak heat stress under blocking conditions that are already established several days in advance, highlighting the dominant role of persistent circulation patterns. The time interval between the onset of blocking and the heat stress peak typically ranges from 3 to 7 days. These contrasting circulation pathways are closely linked to different surface amplification processes. Circulation transitions maybe associated with rapid atmospheric adjustment and surface warming, whereas persistent blocking likely promotes the accumulation of radiative forcing and progressive soil moisture depletion. Understanding how these mechanisms vary across pathways can help explain regional differences in European heat stress extremes and may improve predictions of future events.

How to cite: Zhang, Q., Kjellsson, J., and Black, E.: Circulation pathways and surface drivers of extreme summer heat stress over Europe, EGU General Assembly 2026, Vienna, Austria, 3–8 May 2026, EGU26-19952, https://doi.org/10.5194/egusphere-egu26-19952, 2026.

EGU26-20226 | Orals | CL3.2.4

Robust and actionable information on climate change and extreme rainfall events in South America 

Alice M Grimm, Lucas G Fanderuff, and João P J Saboia

Obtaining robust and actionable information on regional precipitation change to enable adaptation planning and decision-making is a matter of great concern, since there are multiple sources of information.  Projections from large CMIP6 model ensembles (e.g., IPCC Interactive Atlas) show weak signal of climate change in total annual and seasonal precipitation over most of South America (SA), with low agreement between models. Besides, information from smaller ensembles is frequently discrepant. A dynamic framework for climate change in SA is necessary to achieve robust and actionable changes.

Even though they are weak and not robust, the precipitation changes produced over SA by large model ensembles suggest that their main driver is the ENSO increased variability in eastern Pacific, especially intensified El Niño events, produced by transient greenhouse-gas-induced warming. This is consistent with the large impact of ENSO on precipitation in SA. This dynamical framework requires that models used for climate projections in SA demonstrate good simulation not only of the climatology, but also of ENSO and its teleconnections with SA. The assessment of 31 models that provided at least three runs from the present (1979-2014) to the future climate (2065-2100), based on both criteria, selected five best-performing models. This reduced set accurately reproduces the observed seasonal impact of ENSO on precipitation in SA and produces strong and robust patterns of climate change with seasonal variation dynamically consistent with more intense future ENSO in a more El Niño-like mean state.

Since the most dramatic impacts of climate change are produced by changes in the frequency and intensity of extreme precipitation events, it is essential that robust and actionable information is also provided on changes of these events, defined as above the 90th percentile. The analysis is based on the same dynamic framework of the changes in total seasonal/monthly rainfall, since ENSO also exerts a large impact on the extreme events in SA, and the selected set of models shows good simulation of the observed seasonal/monthly impact of ENSO on the frequency and intensity of extreme events. The available information usually shows changes of annual extreme indices. We adopt a seasonal/monthly resolution, which is very useful, especially in a monsoon regime with pronounced annual precipitation cycle. The future changes in extreme events is obtained for SA with monthly temporal resolution and 1 degree spatial resolution. The patterns of change in frequency and intensity of extreme events do not coincide, as changes in frequency depend on dynamic changes, while changes in intensity also depend on thermodynamic changes that determine the precipitable water vapor. Patterns of change in the frequency of extreme events in future are similar to the patterns of El Niño impact on the frequency of extreme events in the present. Changes in the average intensity of precipitation in future extreme events are generally positive and predominate in southeastern South America, where the frequency also generally increases, maximizing impacts on densely populated areas of great importance for agricultural and energy production. The provided information contributes to increase societal preparedness to extreme precipitation in SA.

How to cite: Grimm, A. M., Fanderuff, L. G., and Saboia, J. P. J.: Robust and actionable information on climate change and extreme rainfall events in South America, EGU General Assembly 2026, Vienna, Austria, 3–8 May 2026, EGU26-20226, https://doi.org/10.5194/egusphere-egu26-20226, 2026.

EGU26-21160 | ECS | Posters on site | CL3.2.4

The influence of soil moisture on the extreme precipitation event in July 2021 in Western Europe 

Till Fohrmann, Svenja Szemkus, Oliver Heuser, Arianna Valmassoi, and Petra Friederichs

Soil moisture-precipitation feedback is an important factor in the water and energy cycles, but how important is it on the time scale of an atmospheric extreme precipitation event? We are investigating this question using the example of heavy precipitation in July 2021, which led to destructive flash floods in Western Europe.

We quantify the importance of soil moisture by running a storyline simulation. We compare the precipitation simulated in the ICON-DREAM reanalysis and in our control run to counterfactual scenarios with soils dried out to plant wilting point and soils wetted to saturation. We find that saturating the soil increases precipitation by about 10% while drying the soil decreases precipitation by about 36% comparing ensemble median values.

Moisture tracking shows that one reason is that land surfaces in the vicinity of the impacted region are relevant for fueling the heavy precipitation. We find that evaporation is not limited by water availability, which explains the non-linear response in the precipitation amounts. 

The changes in evaporation also affect the synoptic scale evolution of the event, which amplify the precipitation decrease in the dry scenario. Constraining the evolution of the event enough to produce the extreme of July 2021 was a major challenge of this study. The limited predictability of free forecasts conflicts with the need for enough lead time to allow soil moisture to impact the atmosphere in a meaningful way. We solve this problem by using data assimilation to constrain the large scale circulation of our global ICON simulations while disabling the assimilation within our region of interest.

Our work is part of the German Research Foundation (DFG) Collaborative Research Center 1502 DETECT. In DETECT we aim to answer the question of whether regional changes in land and water use impact the onset and evolution of extreme events. Our coarse approach to changes in water availability gives us an upper bound on changes we can expect as a result of human influence.

How to cite: Fohrmann, T., Szemkus, S., Heuser, O., Valmassoi, A., and Friederichs, P.: The influence of soil moisture on the extreme precipitation event in July 2021 in Western Europe, EGU General Assembly 2026, Vienna, Austria, 3–8 May 2026, EGU26-21160, https://doi.org/10.5194/egusphere-egu26-21160, 2026.

EGU26-21435 | ECS | Orals | CL3.2.4

Robust response of Antarctic sea ice to large-scale wind anomalies across different climate backgrounds 

Lingyun Lyu, Antonio Sánchez-Benítez, Marylou Athanase, Lettie A. Roach, Thomas Jung, and Helge F. Goessling

Antarctic sea ice has experienced small increases from 1979 to 2015, followed by an unexpectedly rapid decline reaching record-low anomalies in 2016 and 2023. The significant reduction is raising questions regarding the drivers of this decline and how the Antarctic sea ice will respond to future climate changes. Here we apply an event-based storyline approach based on a coupled global climate model (AWI-CM-1-1-MR), where the large-scale free-troposphere dynamics is constrained to ERA5 data. We focus on two multi-year sea-ice loss events, 2014–2017 and 2020–2023, to examine the response of sea ice to the observed atmospheric circulation anomalies if they occurred under different global climate backgrounds. By comparing the sea-ice response under present-day climate and projected future warm climates (+2°C, +3°C, and +4°C global mean surface warming relative to preindustrial), we separate the thermodynamic and dynamic effects of climate change and explore how the background climate state modulates the sea-ice response to wind anomalies. We find that the Antarctic sea-ice response remains surprisingly robust across this broad range of climate states, with a few exceptions where seasonal and regional deviations occur.

How to cite: Lyu, L., Sánchez-Benítez, A., Athanase, M., A. Roach, L., Jung, T., and F. Goessling, H.: Robust response of Antarctic sea ice to large-scale wind anomalies across different climate backgrounds, EGU General Assembly 2026, Vienna, Austria, 3–8 May 2026, EGU26-21435, https://doi.org/10.5194/egusphere-egu26-21435, 2026.

EGU26-544 | ECS | Orals | ERE2.1

Modelling the impacts of climate extremes on Africa's future power systems 

Tinne Mast, Sebastian Sterl, Wim Thiery, and Ruchi Gupta

As Africa accelerates to become one of the world’s largest integrated electricity markets and sets the target to increase renewable generation capacity, the continent’s power systems are becoming more vulnerable to extreme weather and climate events. With growing shares of renewable resources in the power mix, events such as heatwaves, periods of low wind and solar availability or prolonged hydrological drought periods —so-called energy droughts— threaten to challenge the continent’s power system resilience. However,  little is known about how these climate extremes interact with Africa’s rapidly evolving power infrastructure. In this study, we identify and characterise the climate extremes that could impact future African power systems. By integrating the power system design from the African Continental Masterplan with decades of weather and climate data, we examine how variability in wind, solar and hydropower generation, coupled with temperature-driven demand peaks, shape periods of power system stress. Power system stress is  measured through load shedding in high resolution dispatch simulations, developed in the PyPSA modelling framework. We will evaluate scenarios of increasing inter- and intra- regional connections between power pools to investigate whether interconnection alleviates power system stress periods by leveraging Africa’s diverse resource potential and complementary spatio-temporal profiles. In this way, this research aims to inform energy planners and policymakers about strategies that enhance the resilience of Africa’s future power systems to climate extremes, ensuring sustainable electricity supply under a changing energy and climate landscape.

How to cite: Mast, T., Sterl, S., Thiery, W., and Gupta, R.: Modelling the impacts of climate extremes on Africa's future power systems, EGU General Assembly 2026, Vienna, Austria, 3–8 May 2026, EGU26-544, https://doi.org/10.5194/egusphere-egu26-544, 2026.

EGU26-1045 | ECS | Posters on site | ERE2.1

Novel approaches for filling gaps in the spatial wind field in the coastal regions of India 

Pragati Prajapati, Sohan Pandit, and Sanjeev kumar Jha

Coastal regions in India possess an exceptional wind energy potential, exceeding 8,000 MW, with wind speeds ranging from 6.8 to 7.1 m/s. However, these areas face critical data gaps in wind monitoring networks due to sparse instrumentation, station failures, and disruptions from tropical cyclones that frequently impact India's eastern coast. Accurate, high-resolution wind field data is essential for renewable energy planning, infrastructure resilience assessment, and identifying optimal sites for wind farm development in cyclone-vulnerable regions. This study presents novel approaches for filling spatial wind field gaps. We used two approaches based on Multiple-Point Statistics (MPS), which reconstructs wind patterns by learning spatial relationships from training images, and Deep Learning (DL) using ConvLSTM2D neural networks. We apply these methods to ERA5 reanalysis data at 25 km resolution spanning the Andhra Pradesh region. Two gap scenarios were tested: (i) systematic contiguous gaps, and (ii) random scattered gaps using MPS and DL methods. Preliminary results indicate that the MPS approach yields a Pearson correlation of 0.40 with a mean absolute error (MAE) of 0.42 m/s for contiguous gaps and a Pearson correlation (r) of 0.97 with an MAE of 0.34 m/s for random gaps. The DL method for both random and contiguous gaps exhibit better performance, with r > 0.998 and MAE < 0.16 m/s. Ground-based validation with operational wind farm data remains necessary to confirm site-specific accuracy for practical wind energy applications. These gap-filled wind datasets enable the identification of optimal wind farm locations and support climate risk assessments for existing renewable infrastructure and enhance resilience planning against tropical cyclone hazards.

Keywords: Wind field, Multiple-point statistics, Deep learning, Renewable energy.

How to cite: Prajapati, P., Pandit, S., and Jha, S. K.: Novel approaches for filling gaps in the spatial wind field in the coastal regions of India, EGU General Assembly 2026, Vienna, Austria, 3–8 May 2026, EGU26-1045, https://doi.org/10.5194/egusphere-egu26-1045, 2026.

EGU26-1605 | ECS | Orals | ERE2.1

The impact of sea breezes on offshore wind energy resources in Australia 

Andrew Brown and Claire Vincent

The amount of offshore wind capacity has been growing rapidly on the global scale. In Australia, there is currently no installed offshore wind capacity, but this is projected to change over the coming decades following government targets. Therefore, it is important to assess how wind energy availability varies in coastal areas, to understand potential opportunities and risks of offshore wind in the context of the broader energy system.

A key mode of local wind variability in coastal areas is the sea breeze, associated with daytime differential surface heating of the land and ocean, and the resulting thermal circulation with onshore flow near the surface. Although the sea breeze has been characterised by previous studies at individual coastal sites, there has yet to be a robust assessment of occurrences across the broader region of Australia, due to a lack of observational data and generalisable identification methods. As a result, several aspects of the sea breeze and associated wind variations have remained unexplored, including in regions relevant for future wind energy generation.

Here, we use a km-scale atmospheric reanalysis to characterise sea breeze occurrences over Australia. We investigate the spatial and temporal variability in their occurrences, as well as potential impacts on offshore wind energy. This includes the development and application of a new method for defining sea breezes as objects from reanalysis output, using a diagnostic of atmospheric fronts.

We find that there is more wind energy available during the afternoon over offshore wind areas on days with a sea breeze identified, compared to other days during the summer. Sea breeze days also tend to have higher average regional energy demand compared with other days, likely due to warmer surface air temperatures over the land that provide sea breeze forcing and lead to enhanced electricity demand from cooling. However, the amount of offshore wind energy also tends to be lower in the morning on sea breeze days relative to other days, likely due to weak prevailing winds that are then opposed by the formation of the sea breeze. Finally, due to the role of the prevailing wind direction in sea breeze formation, there is an anti-correlation in occurrences between opposite-facing coastlines.

These spatial and temporal variations in offshore winds associated with the sea breeze suggests a potentially important source of renewable energy. The sea breeze is shown here to drive local winds during the late afternoon in the summer, when demand is often high, and solar resources are reduced, representing large potentially value in the energy system. In addition, anti-correlation in occurrences between opposite-facing coastlines suggests that a diversity of offshore wind farm locations could be beneficial for energy reliability.

How to cite: Brown, A. and Vincent, C.: The impact of sea breezes on offshore wind energy resources in Australia, EGU General Assembly 2026, Vienna, Austria, 3–8 May 2026, EGU26-1605, https://doi.org/10.5194/egusphere-egu26-1605, 2026.

EGU26-1873 | ECS | Orals | ERE2.1

Selecting representative climate years for national to continental-scale energy system studies 

Bram van Duinen, Karin van der Wiel, and Laurens Stoop

Due to the ongoing energy transition to variable renewable energy sources, climate variability plays a central role in energy system studies. Climate science routinely addresses this variability by simulating large ensembles spanning hundreds to thousands of model years. However, energy system and power-grid models used for industrial applications are computationally intensive and typically cannot process more than a few years to a few decades of climate data. This mismatch necessitates the selection of a small but representative subset of climate years.

A common workaround is the use of composite or “typical” meteorological years constructed from individual months. While computationally efficient, such synthetic time series disrupt temporal coherence, and fail to capture memory effects that are critical for adequacy assessments, such as storage dynamics of hydropower. As a result, many energy system studies instead select a limited number of complete climate years, typically ranging from one to fifty. Selecting such subsets from large climate simulations constitutes a combinatorial optimisation problem: choosing X years from N>>X, for which brute-force optimisation is computationally infeasible due to ‘combinatorial explosion’.

Current practices rely heavily on (pseudo) random sampling or heuristic selection methods, including clustering-based approaches such as k-medoids (or k-means). While useful, these methods provide no guarantee of near-optimal solutions and often struggle to balance representativeness across multiple, interacting climate variables relevant for energy systems.

In this study, we systematically review existing climate-year selection methodologies and introduce simulated annealing as a flexible and computationally efficient optimisation framework for selecting representative subsets of complete climate years. The method targets representativeness of the joint distribution of multiple energy generation and demand variables. We apply the approach to the Pan-European Climate Database, which comprises 85 years of simulations from six CMIP6 climate models under four SSP scenarios, together with associated energy demand and renewable generation time series. Two use cases are considered: the selection of a larger subset of 30 representative years for adequacy-type studies, and a smaller subset of 5 years for investment-type studies. Across both cases and for both national and contintental-scale applications, simulated annealing consistently outperforms existing methods, proving to be the most robust method for climate year selection in large-scale energy system modelling.

How to cite: van Duinen, B., van der Wiel, K., and Stoop, L.: Selecting representative climate years for national to continental-scale energy system studies, EGU General Assembly 2026, Vienna, Austria, 3–8 May 2026, EGU26-1873, https://doi.org/10.5194/egusphere-egu26-1873, 2026.

EGU26-3024 | ECS | Orals | ERE2.1

 How Technology and Modelling Choices Shape European Wind and Solar Energy Droughts and Stress Events 

Lukas Karkossa, Aleksander Grochowicz, and Marta Victoria

In highly renewable power systems, weather-related variability increasingly translates into system stress. Dunkelflauten are multi-day to multi-week periods of unusually low wind and solar that can span multiple countries. These renewable energy droughts significantly shape storage needs, installed capacity, and transmission requirements, far more so than average conditions. Yet, simulated renewable output is highly sensitive to assumptions regarding meteorology, spatial layout, and plant‑level effects, complicating the detection of these extremes.

We address this by quantifying renewable output in a one-at-a-time sensitivity analysis varying bias-correction methods, spatial representation, technology settings, and wake-loss assumptions. Using hourly reanalysis data, we compute country‑aggregated wind and solar generation for 80 historical weather years to evaluate impacts on annual capacity factors, drought frequency and duration for wind and solar separately. These drought metrics are then linked to system outcomes by running PyPSA‑Eur for five critical weather years under a net-zero scenario, assessing changes in optimal capacities and system‑defining stress events. We find that capacity factors are driven mainly by technology specification, with bias correction exerting little influence on solar means and a moderate effect on wind, while spatial capacity layouts appear negligible for solar but more consequential for wind. Quantile‑mapping bias correction modestly improves energy drought detection, and certain technology configurations reduce risk of low‑generation. At the system level, these differences re‑order stressful periods and shift optimal capacity across technologies and regions.

By identifying the modelling choices that have the greatest impact on energy‑drought detection and associated system stress, this study helps strengthen power system resilience to weather extremes and can improve resource‑adequacy planning for a fully renewable European system

How to cite: Karkossa, L., Grochowicz, A., and Victoria, M.:  How Technology and Modelling Choices Shape European Wind and Solar Energy Droughts and Stress Events, EGU General Assembly 2026, Vienna, Austria, 3–8 May 2026, EGU26-3024, https://doi.org/10.5194/egusphere-egu26-3024, 2026.

EGU26-3066 | ECS | Orals | ERE2.1

Advancing Resilient Renewable Energy Deployment in Africa: A Weather-Aware Optimization Framework 

Rajeev Kurup, Hannah Bloomfield, PushpRaj Tiwari, Nachiketa Acharya, and Evelyn Hesse

Ensuring reliable energy supply and infrastructure resilience in Africa requires renewable energy (RE) deployment that takes into account the continent’s pronounced weather variability. Here, we introduce a weather-aware framework that integrates multi-criteria decision analysis with assessments of meteorological variability to optimize renewable site selection. Optimal solar and wind energy deployment locations are identified using an adapted methodology. These sites are chosen not only by their highest average resource potential but also by evaluating weather variability at each location. We provide insights into generation variability from these optimal deployment sites under major climate oscillations, including the Madden–Julian Oscillation (MJO) modulated by the El Niño–Southern Oscillation. In addition, a set of novel Africa-centric synoptic regimes (AORs) are derived through Self-Organizing Map cluster analysis, providing insight into region-specific drivers of variability that are often missed by global modes like the MJO. Detailed country-level renewable yield estimates under these dominant meteorological patterns are provided along with their frequencies of occurrence. Our findings highlight a critical need for sub-seasonal to seasonal (S2S) forecasting of these regimes to enhance system resilience. While AORs linked to large-scale oscillations like the MJO may inherit its known predictive skill, the predictability of more localized African regimes remains a critical challenge. By explicitly linking generation variability from optimized RE deployment locations to underlying climate drivers, this framework offers a robust pathway for optimizing RE expansion across the continent.

How to cite: Kurup, R., Bloomfield, H., Tiwari, P., Acharya, N., and Hesse, E.: Advancing Resilient Renewable Energy Deployment in Africa: A Weather-Aware Optimization Framework, EGU General Assembly 2026, Vienna, Austria, 3–8 May 2026, EGU26-3066, https://doi.org/10.5194/egusphere-egu26-3066, 2026.

EGU26-3213 | ECS | Posters on site | ERE2.1

Changes in diurnal wind generation during heatwave events 

Mehara Salpadoru, Sarah Perkins-Kirkpatrick, Bjorn Sturmberg, and Bin Lu

Australia’s National Electricity Market (NEM) is in a period of transition. Decarbonization pressures, regulatory incentives, and consumer preferences are driving up the share of renewable generation in the NEM. Concurrently, the nation faces pressure to adapt to a changing climate and the extreme weather that entails. As renewable penetration increases variability of electricity supply, climate change reduces the predictability of the weather that fuels renewables. Extreme weather events are changing; heatwaves are getting more severe, more frequent, and lasting longer.  While the physical processes caused by heat on generation technologies are well defined, quantifying and predicting the systemic impacts of extreme events is an ongoing line of inquiry. Modern electricity markets are relatively young and have evolved rapidly. Generally, market datasets are short in duration, poorly standardised, and have limited coverage relative to meteorological data. They are rarely publicly available, as data publication could be considered a risk to the interests of market participants. This presentation utilises Australia’s National Electricity Market’s (NEM) Market Management System Data Model, alongside the BARRA-R2 regional climate reanalysis, to analyse historical changes in the diurnal generation profiles of wind energy during heatwaves. By bootstrapping composite generation profiles of heatwave and baseline summer days, we present how heatwaves impact generation profiles. We then compare how these profiles vary through time and space. Impact curves (bootstrapped difference curves of heatwave and baseline generation) are calculated and used to analyse patterns of heatwave impact across the NEM using principal component analysis and timeseries clustering. Investigating the scales and patterns of heatwave impacts reveal the weather-scale drivers of generation variability. This allows us to identify how large-scale synoptic systems (such as heatwaves) have myriad localised impacts. We then discuss how these localised variations may contribute to larger shifts in generation dispatch and grid stability on heatwave days. This exploratory data analysis leverages a recent, unexplored dataset to develop methods that quantify the impact of heatwaves on wind generation. The primary contribution of this research is methodological; it also offers exploratory empirical findings, highlighting areas for further research.

How to cite: Salpadoru, M., Perkins-Kirkpatrick, S., Sturmberg, B., and Lu, B.: Changes in diurnal wind generation during heatwave events, EGU General Assembly 2026, Vienna, Austria, 3–8 May 2026, EGU26-3213, https://doi.org/10.5194/egusphere-egu26-3213, 2026.

EGU26-3461 | ECS | Posters on site | ERE2.1 | Highlight

Climate2Energy: a framework to consistently include climate change into energy system modeling 

Jan Wohland, Luna Bloin-Wibe, Erich Fischer, Leonhard Göke, Reto Knutti, Francesco De Marco, Urs Beyerle, and Jonas Savelsberg

Climate models become increasingly sophisticated over time, capitalizing on better modeling techniques, process understanding and computational power. Energy systems become more exposed to climatic changes owing to the increased deployment of weather-dependent renewables as well as heating and cooling systems. There is thus an urgent need for improved usage of climate model simulations in the energy sector.

Here, we present dedicated hourly climate model simulations with CESM2 and a new pipeline to translate climate model output to renewable generation timeseries and heating/cooling demand. We showcase the Climate2Energy workflow that combines bias-correction with existing open-source tools for individual energy sector components (GSEE, windpowerlib, demandninja). We include all relevant types of renewable generation, namely onshore wind, offshore wind, PV, hydropower, and heating/cooling demand in a consistent and synchronized manner. In contrast to assessments drawing from published climate datasets such as CMIP and EURO-CORDEX, we can use non-standard climate model outputs, such as model level winds, air densities, and river discharge.

Using the SSP370 scenario and sampling different phases of the North Atlantic Oscillation to account for climate variability, our results reveal strongly altered future heating (up to 50% reductions) and cooling demand (up to 20-fold increases). In line with previous studies, the impacts on renewable generation are substantially smaller in terms of mean capacity factors. For instance, onshore wind potentials drop by a few percent in many countries while PV potentials increase by similar amounts. More pronounced changes manifest, for example, in the seasonal cycle and in inter-technology complementarity. Furthermore, stochastic optimizations with AnyMOD reveal that a future cost optimal power system looks substantially different from a current one.

Overall, our results underline the need for further analysis of the combined effects of climate change on energy systems. We provide the Climate2Energy pipeline and the data with an open license, aiming to contribute to better and more standardized climate change impact assessments in the energy sector.  


REFERENCE

Wohland, J. et al. Climate2Energy: a framework to consistently include climate change into energy system modeling. Environ. Res.: Energy 2, 041001 (2025) https://doi.org/10.1088/2753-3751/ae2870


How to cite: Wohland, J., Bloin-Wibe, L., Fischer, E., Göke, L., Knutti, R., De Marco, F., Beyerle, U., and Savelsberg, J.: Climate2Energy: a framework to consistently include climate change into energy system modeling, EGU General Assembly 2026, Vienna, Austria, 3–8 May 2026, EGU26-3461, https://doi.org/10.5194/egusphere-egu26-3461, 2026.

EGU26-3466 | Posters on site | ERE2.1

Renewable Energy Variability in the Italian Peninsula: A Weather Regime Perspective 

Riccardo Bonanno and Elena Collino

From the perspective of the energy transition in Europe, the Fit for 55 package outlines a comprehensive set of measures aimed at achieving climate neutrality by 2050 and reducing net greenhouse gas (GHG) emissions by 55% by 2030 relative to 1990 levels. In line with these objectives, the latest Italian Integrated National Energy and Climate Plan foresees a rapid expansion of renewable energy by 2030, with solar capacity rising from 37 GW in 2024 to 80 GW, and wind capacity growing from 13 GW to 28 GW.

As renewable generation expands and electricity demand rises due to increasing electrification, the power system becomes progressively more sensitive to meteorological conditions. This growing dependence highlights the need to better understand how the variability of solar and wind resources affects renewable power production throughout the year, as well as whether this variability has changed over recent decades.

In this context, weather regimes provide a valuable framework for energy system analysis, as they describe large-scale, physically consistent, and persistent atmospheric patterns that are inherently more predictable than local grid-point variables. Several studies suggest that weather-regime-based methods are more effective at predicting medium to long-term weather patterns, making them particularly useful for planning energy systems over the subseasonal-to-seasonal timescale.

Against this background, this study aims to characterize the variability of renewable energy production over the Italian peninsula as a function of weather regimes. In fact, while this approach has been widely applied in northern and central Europe—especially to investigate winter energy droughts (Dunkelflauten)—its application to Italy remains limited.

The methodology involves the estimation of solar and wind capacity factors using dedicated datasets. For solar energy, surface solar radiation from the Surface Solar Radiation Data Set – Heliosat, version 3 is combined with near-surface temperature data from the MEteorological Reanalysis Italian DAtaset - MERIDA to assess changes in solar production efficiency under increasing temperatures. Wind resources are characterized using the wind atlas Atlante EOLico ItaliANo - AEOLIAN, which provides wind speed data at multiple heights representative of wind turbine hub levels and has been specifically adapted for the Italian peninsula. Weather regimes are identified from ERA5 sea-level pressure fields using Principal Component Analysis.

The results show that distinct synoptic regimes are associated with markedly different renewable energy production patterns across Italy. For example, wintertime high-pressure regimes are generally linked to reduced energy production, although notable differences emerge depending on the specific high-pressure configuration and between northern and southern regions of the country.

Overall, these findings highlight the added value of a weather-regime perspective for interpreting and anticipating variability in renewable energy production in Italy, providing a robust basis for improving energy system management and resilience in a weather-dependent power system.

How to cite: Bonanno, R. and Collino, E.: Renewable Energy Variability in the Italian Peninsula: A Weather Regime Perspective, EGU General Assembly 2026, Vienna, Austria, 3–8 May 2026, EGU26-3466, https://doi.org/10.5194/egusphere-egu26-3466, 2026.

A renewable energy resource with much potential, yet which is often overlooked in energy roadmaps, is tidal energy (both kinetic energy – tidal stream, and potential energy – tidal range). Tidal energy is particularly attractive in the energy mix due to its predictability. However, it is as yet under-developed globally, particularly the tidal stream resource. Morlais (“voice of the sea” in Welsh) is a 35 km2 grid-connected tidal energy site in the Irish Sea, UK. Although the site has the potential for 240 MW of tidal stream energy, currently developers have agreed 38 MW of electricity at a Strike Price of £261/MWh. To aid development of the site, we have conducted measurement campaigns over the last decade, including complete multibeam coverage of the 35 km2 site and the deployment of eleven acoustic Doppler current profiles (ADCPs), along with additional wave buoy and meteorological measurements.

Peak (spring) undisturbed power density exceeds 10 kW/m2 over much of Morlais, with the most energetic locations closest to the shore — facilitating power export to the grid. There is a large submerged sand bank extending from a major headland (South Stack) which is responsible for some of the most energetic tidal streams. This sand bank has a width of around 300 m, rises around 20 m compared to the surrounding sea bed, and there is evidence that it produces secondary flows that have been observed at many of the ADCP moorings. There is significant interaction of waves and currents across Morlais. However, this mainly influences wave properties, which could affect maintenance of moorings or devices (due to increased wave steepness), rather than directly influencing the tidal energy resource. There are large variations in flood/ebb asymmetry across the site, and this can largely be explained by the phase relationship between the principal lunar semidiurnal constituent M2 and its first harmonic, M4. Although prominent tidal energy test sites (e.g. EMEC in Orkney) also exhibit strong tidal asymmetry, it could be more of an issue for a commercial site like Morlais since it affects the timing of power export to the grid.

How to cite: Neill, S. and Chisholm, J.: Tidal Stream Energy Resource – a case study at grid-connected Morlais, Irish Sea, EGU General Assembly 2026, Vienna, Austria, 3–8 May 2026, EGU26-3569, https://doi.org/10.5194/egusphere-egu26-3569, 2026.

EGU26-3732 | Posters on site | ERE2.1

Hybrid Analysis and Nowcasting of Surface Solar Radiation Components in the INCA Framework 

Jasmina Hadzimustafic, Irene Schicker, Nikta Madjdi, and Günter Wind

Gridded short-wave surface radiation components are essential for meteorology, hydrology, and renewable energy forecasting. In particular, solar power prediction for photovoltaic (PV) and concentrated solar power (CSP) systems depends critically on accurate short-range forecasts of global, direct, and diffuse irradiance. Delivering such high-resolution, site-specific estimates is a core objective of the FFG-funded PV4Community project and the focus of the presented work. 

A hybrid analysis–nowcasting approach has been implemented in the INCA (Integrated Nowcasting through Comprehensive Analysis; Haiden et al. 2011) radiation module. It combines global irradiance and sunshine duration observations from the Austrian monitoring network, MTG satellite retrievals, and high-resolution NWP guidance from AROME and C-LAEF. Strong coupling to INCA’s cloud analysis and cloud-motion nowcasting enables high spatial detail and very short-range accuracy, while accounting for low-sun-angle conditions and the effects of Alpine topography (terrain shading, slope, aspect). 

Radiation fields are produced on a 1 km × 1 km grid at 15-minute frequency with lead times up to 48 h. A key advancement is the derivation of diffuse and direct radiation components using an adapted version of the Gassel (1999) algorithm. The original Gassel method describes a physically consistent partitioning of global horizontal irradiance into its beam and diffuse components based on solar geometry and atmospheric transmissivity. Our adaptation extends this approach for operational nowcasting by: (i) dynamically coupling the algorithm with INCA’s global irradiance output, (ii) incorporating MTG-based cloud physical properties, and (iii) adjusting the clear-sky and turbidity assumptions to the Alpine environment. This yields a robust irradiance decomposition that remains stable across rapidly changing cloud scenes and complex terrain. 

Validation against measurements from the ARAD radiation network (Olefs et al. 2016) demonstrates high correlation and low bias for both diffuse and direct irradiance, confirming the suitability of the new components for operational solar energy applications. Their integration into the INCA framework ensures sustained, near-real-time availability and opens the door for improved PV nowcasting, solar ramp detection, and future energy system applications. 

Funding: This work was supported by the Austrian Research Promotion Agency (FFG; www.ffg.at). 


Haiden, T., Kann, A., Wittmann, C., Pistotnik, G., Bica, B., & Gruber, C. (2011). The Integrated Nowcasting through Comprehensive Analysis (INCA) system and its validation over the Eastern Alpine region. Weather and Forecasting, 26(2), 166-183. 

Gassel, A. (1999). Beiträge zur Berechnung solarthermischer und exergieeffizienter Energiesysteme (Doctoral dissertation, Fraunhofer-IRB-Verlag). 

Olefs, M., Baumgartner, D. J., Obleitner, F., Bichler, C., Foelsche, U., Pietsch, H., ... & Schöner, W. (2016). The Austrian radiation monitoring network ARAD–best practice and added value. Atmospheric Measurement Techniques, 9(4), 1513-1531. 

How to cite: Hadzimustafic, J., Schicker, I., Madjdi, N., and Wind, G.: Hybrid Analysis and Nowcasting of Surface Solar Radiation Components in the INCA Framework, EGU General Assembly 2026, Vienna, Austria, 3–8 May 2026, EGU26-3732, https://doi.org/10.5194/egusphere-egu26-3732, 2026.

EGU26-4000 | ECS | Orals | ERE2.1

Modeling the surface energy balance of a vegetated solar farm 

Shunko Bolsée and Sylvain Dupont

In response to global climate change, photovoltaic (PV) power plants have been rapidly deployed over the past decade in order to reduce greenhouse gas emissions in electricity production. This massive deployment of large-scale solar parks in rural areas raises questions about the modifications in micrometeorology they cause in contrast to conventional rural land surfaces. This calls for physically based land surface models able to represent the specific land-atmosphere interactions induced by solar parks within weather and climate models. In these models, land surface schemes often neglect the alterations in radiative transfer, surface energy balance, and near-surface turbulence caused by solar panels, potentially leading to biases in weather and climate simulations over regions with large-scale PV power plants.

In this contribution, we present PV-LAND, a photovoltaic land surface model developed as an extension of the Interactions between Soil, Biosphere, and Atmosphere (ISBA) scheme, specifically designed to represent the surface energy balance of a coupled soil-vegetation-PV-atmosphere system. The solar park is represented as a periodic array of panel rows over a vegetated surface, and the surface energy balance is resolved using a nodal approach that explicitly describes the front and back surfaces of PV modules, the photovoltaic cell, the underlying vegetated or bare ground, and the air layers within and above the PV canopy. Shortwave and longwave radiative exchanges account for panel shadowing and multiple reflections between panels and the ground, while turbulent exchanges of momentum, heat, and moisture are computed using parameterizations adapted to the specific geometry and aerodynamic properties of PV canopies, as well as to the wind direction relative to the panel rows.

The model has been run in offline mode over an extensive solar park in southwestern France, where flux measurements (radiative, momentum, heat, and water vapor) have been collected for several years. The PV-LAND performances will be presented at the conference, with a focus on the model's ability to represent the surface energy balance and the surface temperatures.

How to cite: Bolsée, S. and Dupont, S.: Modeling the surface energy balance of a vegetated solar farm, EGU General Assembly 2026, Vienna, Austria, 3–8 May 2026, EGU26-4000, https://doi.org/10.5194/egusphere-egu26-4000, 2026.

EGU26-4045 | ECS | Posters on site | ERE2.1

Revealing Global Patterns of Hydropower Plants via Multimodal AI 

Jiahao Li and Xiaomeng Huang

Hydropower stands as the dominant source of renewable electricity worldwide, playing a pivotal role in global transitions to low-carbon energy systems and climate change mitigation. Yet, the planetary distribution of hydropower infrastructure remains poorly quantified at a global scale—a critical gap that hinders accurate assessments of energy security, freshwater resource allocation, and environmental sustainability. Current public inventories, which are largely compiled through fragmented bottom-up reporting schemes reliant on national or regional submissions, are plagued by pervasive incompleteness, inconsistent geospatial referencing, and significant lags in updates, rendering them inadequate for evidence-based global policy and conservation planning. Here, we present a multimodal artificial intelligence (AI) framework that enables the automated identification of hydropower plants from remote sensing imagery via a globally uniform, top-down methodology. Applied to 8,330,487 river segments across the globe, this framework detects 12,640 hydropower installations, 55.7% of which are unrecorded in leading contemporary public inventories. The resultant global dataset uncovers striking regional disparities and transboundary clustering in hydropower development. It further demonstrates that hydropower infrastructure impacts 56.97% of the world’s protected areas, with marked biomass loss occurring during the construction phase. Complementary hydrological analyses reveal that 29.9% of these installations have experienced declining runoff over the past two decades, while 12.0% are exposed to high flood risk. This work establishes a scalable framework for monitoring global hydropower expansion and its associated environmental and climatic risks, providing a critical foundation for evidence-based energy and conservation policy. The study releases a topdown remote sensing-based hydropower monitoring platform https://glohydro.cn. 

How to cite: Li, J. and Huang, X.: Revealing Global Patterns of Hydropower Plants via Multimodal AI, EGU General Assembly 2026, Vienna, Austria, 3–8 May 2026, EGU26-4045, https://doi.org/10.5194/egusphere-egu26-4045, 2026.

EGU26-4858 | ECS | Posters on site | ERE2.1

Can Reanalysis Products Reliably Represent Solar and Wind Energy Resources and Their Complementarity over China 

Xuanhua Song, Yanyi He, Mingyu Zhang, Jingjing Zhou, and Yan Zhou

Global reanalysis products are indispensable for reconstructing historical meteorological conditions and are crucial particularly for estimation of solar and wind energy resources. Although previous studies have evaluated reanalysis performance for individual resources or regional biases, systematic assessments of their capacity to simultaneously simulate solar and wind energy as well as their complementarity remain limited. This study evaluates the performance of ERA5, MERRA-2, and JRA-55 in estimating solar and wind energy resources across China during 1980–2022, with the help of ground-based observations as a reference. Results show that ERA5 displays superior overall performance in reproducing spatiotemporal patterns of solar and wind energy. Reanalysis products generally reproduce interannual variations and declining trends in solar energy, none fully capture the observed “decline-then-recovery” pattern in wind energy. ERA5 also demonstrates a strong spatial consistency with observations in representing solar-wind complementarity at daily to monthly scales. At the annual scale, ERA5 performs best in representing solar-wind complementarity in southern China, while MERRA-2 overperforms in northern China. This study calls for caution in interpreting solar–wind complementarity in existing studies that rely solely on reanalysis products and provides guidance for their applications in supporting solar and wind energy planning and management.

How to cite: Song, X., He, Y., Zhang, M., Zhou, J., and Zhou, Y.: Can Reanalysis Products Reliably Represent Solar and Wind Energy Resources and Their Complementarity over China, EGU General Assembly 2026, Vienna, Austria, 3–8 May 2026, EGU26-4858, https://doi.org/10.5194/egusphere-egu26-4858, 2026.

EGU26-5004 | ECS | Posters on site | ERE2.1

Towards a better understanding of Atmospheric stability for Wind-Energy Applications with the MiRadOr Project 

Jule Schrepfer, Hannes Juchem, Feifei Mu, Justin Shenolikar, Harald Czekala, Julia Gottschall, and Stephanie Fiedler

We present the Microwave Radiometer for the Detection and Assessment of Offshore Wind Resources (MiRadOr) project, a year-long offshore measurement campaign designed to evaluate how microwave radiometer (MWR) technologies can improve the assessment of offshore wind resources. MiRadOr evaluates vertical profiles of temperature and humidity and compares them with traditional radiosonde and meteorological mast observations, as well as output from numerical weather prediction (NWP) and climate models.

The overarching goal of MiRadOr is to better characterize the dynamics of the lowest levels of the atmosphere in the context of wind energy. We will evaluate the quality and reliability of MWR observations for assessing atmospheric stability- a key metric for wind energy applications.

In November 2025, the MiRadOr project completed a week-long measurement campaign with an intensive radiosondes program, LiDAR measurements, and a 200m-tall met mast in Northern Germany. MiRadOr’s one-year measurements with MWRs and LiDARs are carried out in the Netherlands. Our main intensive observation period in the Netherlands will take place in March 2026 and will include data collection with several MWRs, LiDAR, and a radiosonde program.

Moreover, we evaluate simulated atmospheric stability from reanalysis and weather prediction models with measurements. Ground truth is provided by LiDAR, MWR, and meteorological mast observations from the 2025-2026 MiRadOr campaigns, paired with previously existing measurement data, e.g., from the 2021 FESSTVaL campaign and the Tall Tower Dataset. We assess the performance of atmospheric models against the observations concerning metrics relevant to wind energy.

How to cite: Schrepfer, J., Juchem, H., Mu, F., Shenolikar, J., Czekala, H., Gottschall, J., and Fiedler, S.: Towards a better understanding of Atmospheric stability for Wind-Energy Applications with the MiRadOr Project, EGU General Assembly 2026, Vienna, Austria, 3–8 May 2026, EGU26-5004, https://doi.org/10.5194/egusphere-egu26-5004, 2026.

EGU26-5124 | ECS | Posters on site | ERE2.1

Validation of a rooftop photovoltaic module in large-eddy simulations using eddy-covariance observations 

Haoyuan Zhai, Julian Anders, Björn Maronga, and Matthias Mauder

The rapid expansion of rooftop photovoltaic (PV) systems in urban areas provides substantial renewable energy capacity while also modifying surface radiative and turbulent energy exchange in the urban boundary layer.  As a result, PV installations can contribute to phenomena such as the photovoltaic heat island (PVHI), which refers to increased ambient temperatures associated with heat absorbed and emitted by PV panels. Understanding these coupled effects is essential to assess PV impacts on the urban surface energy balance and boundary layer structure. Despite growing observational and mesoscale modeling studies, building-resolving large-eddy simulation (LES) investigations with direct comparison to rooftop measurements remain rare. In this study, we evaluate a newly developed rooftop PV energy balance module implemented in the LES model PALM. The module solves the PV surface energy balance with temperature dependent conversion efficiency, providing a physically consistent link between radiative forcing, PV surface temperature, thermal and turbulent exchanges, and power production. Simulations are conducted for a large industrial rooftop near Dresden, Germany, equipped with approximately 2,700 PV panels, using realistic building geometry and multiple representations of rooftop PV layouts. Three clear-sky days representing summer and winter conditions are simulated and compared against rooftop observations, including eddy-covariance (EC) measurements of sensible heat flux, near-surface air temperature, PV surface temperature, and recorded power output. We analyze the ability of the PV module to capture the observed diurnal evolution across these thermal, turbulent, and electrical variables. Sensitivity experiments investigate the influence of grid resolution and different rooftop PV layout representations on thermal and turbulent exchange processes. This work aims to advance the understanding of interactions between rooftop PV systems and the urban boundary layer and to support future interpretation of PV impacts on the urban boundary layer.

How to cite: Zhai, H., Anders, J., Maronga, B., and Mauder, M.: Validation of a rooftop photovoltaic module in large-eddy simulations using eddy-covariance observations, EGU General Assembly 2026, Vienna, Austria, 3–8 May 2026, EGU26-5124, https://doi.org/10.5194/egusphere-egu26-5124, 2026.

EGU26-5258 | ECS | Posters on site | ERE2.1

Leveraging large ensembles for renewable resource assessments: how to subselect? 

Isabel Cristina Correa-Sánchez and Jan Wohland

How climate impacts energy is widely recognised as a complex research area, given the diversity of phenomena and spatiotemporal scales at which climate and weather patterns influence the energy sector. While climate models have contributed to understanding climate risk in renewable energy implementation, the systematic use of large ensembles in the climate-energy interface still needs further assessment. This study therefore aims to evaluate changes and internal variability of the main resources for solar photovoltaic, wind, and hydropower energy generation based on large ensembles. To this end, we focus on the historical and SSP3-7.0 experiments from four Single Model Large Ensembles (SMILEs) that provide at least 40 realizations: CESM2, MPI-ESM1.2-LR, ACCESS-ESM1.5 and CanESM5. We evaluate solar radiation at surface and near-surface wind speed, and runoff across the globe because they are the primary resources for renewable energy generation. Given the different number of realizations per model, we identify the optimal ensemble size to assess trends and internal variability following the approach of Milinski et al. (2020).  As suggested therein, we use the pi-control simulation and extract 200, 100, and 40 time series of 20-year duration that we consider as different realizations of each model. We report that the optimal number of realizations varies depending on the variable, region, and maximum number of realizations available. For example, starting from a 100-member ensemble, the optimal number of realizations to assess internal variability in solar radiation can reach up to 60 for some models while 40 are sufficient for runoff.  Our findings provide additional insights into renewable energy resource changes around the world by leveraging multiple realizations of GCMs, which can increase our understanding of the impacts of climate variability and change on renewable energy resources. These results highlight the need to carefully consider the number of realizations when assessing large ensembles. 

Reference: Milinski, S., Maher, N., & Olonscheck, D. (2020). How large does a large ensemble need to be?. Earth System Dynamics, 11(4), 885-901. https://doi.org/10.5194/esd-11-885-2020 

How to cite: Correa-Sánchez, I. C. and Wohland, J.: Leveraging large ensembles for renewable resource assessments: how to subselect?, EGU General Assembly 2026, Vienna, Austria, 3–8 May 2026, EGU26-5258, https://doi.org/10.5194/egusphere-egu26-5258, 2026.

EGU26-5419 | ECS | Posters on site | ERE2.1

Towards climate-responsive demand modelling: quantifying the value of temperature and strategies to resolve the true dependency 

Inger Kristin Nesbø Gjøsæter, Asgeir Sorteberg, and Michael Scheuerer

Modelling daily electricity demand is an essential step to ensure grid stability and to meet society’s needs. Temperature is a key driver of demand, as it not only influences the seasonal variability but also the extremes. Day number is commonly used as a proxy for seasonality and is especially efficient at capturing the lower demand of the summer holiday. This is, however, a static feature and therefore not a sufficient choice when modelling demand in a changing climate. It is therefore of great interest to further investigate how to best resolve the true impact of temperature in demand models.

This study quantifies the gain in model performance when utilizing meteorological parameters directly versus using day number only. Furthermore, we evaluate feature engineering strategies to improve the model's ability to leverage the predictive information embedded in temperature. This was done using Generalized Additive Models (GAMs) to model the weather- and calendar-dependent daily electricity demand for nine European countries and assessing different feature combinations.

The results demonstrate an overall improvement in model performance when temperature is included in the modelling across all countries. The most significant improvements are seen in the Nordics and France, with up to 51.5% decrease in mean absolute error (MAE) compared to using day number alone. The significance of temperature is most pronounced when assessing model performance on the upper 5th percentile of daily demand, where the reduction in MAE is up to 69.0%. These findings underscore temperature’s critical role in capturing extreme demand events and highlight the need for climate-responsive modelling strategies.

How to cite: Nesbø Gjøsæter, I. K., Sorteberg, A., and Scheuerer, M.: Towards climate-responsive demand modelling: quantifying the value of temperature and strategies to resolve the true dependency, EGU General Assembly 2026, Vienna, Austria, 3–8 May 2026, EGU26-5419, https://doi.org/10.5194/egusphere-egu26-5419, 2026.

We introduce a novel spatiotemporal framework for intraday photovoltaic (PV) power forecasting and apply it to a systematic comparison of seven PV nowcasting approaches, assessing their accuracy, reliability and sharpness. The benchmarked methods range from satellite-based deep learning and optical-flow techniques to physics-based numerical weather prediction models, and include both deterministic and probabilistic configurations. Model performance is first evaluated at the irradiance level using satellite-derived surface solar irradiance fields as reference data. The irradiance forecasts are subsequently converted into PV power estimates using a station-specific machine-learning-based irradiance-to-power model, which takes local solar irradiance and local solar azimuth and elevation angles as predictors. This approach enables the transformation of solar irradiance forecasts into PV power forecasts. The latter are validated against measured production from 6434 PV installations across Switzerland. To our knowledge, this work represents the first national-scale analysis of spatiotemporal PV power forecasting. In addition, we present novel visualizations illustrating the influence of mesoscale cloud dynamics on national PV generation at hourly and sub-hourly temporal resolutions. The results indicate that satellite-based models consistently outperform the Integrated Forecast System ensemble (IFS-ENS) at short forecast horizons, although their performance degrades more rapidly than that of IFS-ENS as lead time increases. SolarSTEPS and SHADECast yield the highest accuracy in both irradiance and power predictions, with SHADECast exhibiting the most reliable ensemble dispersion. While the deterministic IrradianceNet model achieves the lowest root mean square error, probabilistic forecasts from SolarSTEPS and SHADECast provide superior uncertainty calibration. Forecast skill is found to decline with increasing elevation. Moreover, cloudy and high-variability weather conditions remain the most challenging for PV power forecasting. At the national level, satellite-based models reproduce daily total PV production with relative errors below 10% for 82% of days during 2019–2020, highlighting their robustness and suitability for operational deployment.

How to cite: Lanzilao, L. and Meyer, A.: A spatiotemporal framework for intraday PV power forecasting using satellite-based and numerical weather prediction models, EGU General Assembly 2026, Vienna, Austria, 3–8 May 2026, EGU26-5577, https://doi.org/10.5194/egusphere-egu26-5577, 2026.

Soiling losses are a major source of uncertainty in photovoltaic energy yield, particularly in regions exposed to high aerosol concentrations and intermittent precipitation. These losses are strongly modulated by meteorological conditions making their quantification a key challenge in energy meteorology. Estimating soiling losses is challenging due to complex interactions between deposition processes, cleaning events such as rain, wind-driven dust transport, and proximity to local aerosol sources.

Soiling losses can be derived from irradiance measurements using paired modules subjected to differing cleaning schedules. In this work, one year of measurements from monitoring networks in West Africa and Pacific islands are used. Meteorological drivers are extracted from ECMWF reanalysis products, including precipitation and particulate matter.

We evaluate two widely used semi-physical soiling models as benchmark, HSU and Kimber, and develop a hybrid physical-machine learning framework that integrates a physics-based empirical model with XGBoost trained on meteorological reanalysis data. Model performance is assessed using temporal cross-validation across all stations and a leave-one-out approach to evaluate spatial portability, followed by an application to a real-world photovoltaic case study in Mali.

The hybrid model significantly improves soiling losses estimation compared to semi-physical benchmarks across most sites. However, its performance decreases in environments characterised by persistently low soiling, highlighting the importance of physical constraints for extrapolation beyond the training domain.

These results highlight the potential and limitations of hybrid physical-machine learning approaches for meteorology-driven soiling assessment, supporting maintenance decisions and photovoltaic energy yield optimization.

How to cite: Turpin, M., Dalmard, A., and Schmutz, N.: Hybrid physical-machine learning estimation of photovoltaic soiling losses from meteorological reanalysis data in Africa and Pacific islands, EGU General Assembly 2026, Vienna, Austria, 3–8 May 2026, EGU26-6300, https://doi.org/10.5194/egusphere-egu26-6300, 2026.

EGU26-6521 | Posters on site | ERE2.1

From Climate DT to Hectoscale Forecasts For Renewable Energy Systems   

Marianne Bügelmayer-Blaschek, Katharina Baier, Paolo Gazzaneo, Kristofer Hasel, Annemarie Lexer, and Irene Schicker


Combining Climate Digital Twin (DT) and Extremes DT offers significant benefits for renewable energy planning. Climate DT provides long-term simulations, while Extremes DT focuses on detecting high-impact events. Although Climate DT includes wind energy aspects, it lacks emphasis on extreme events. Integrating both approaches can address uncertainties in renewable energy supply under current and future climate conditions, as PV and wind are highly sensitive to short-term changes. Within the presented study we aim to evaluate the added value of downscaling Climate DT data from ~5 km to hectometric resolution (400–800 m) to better represent local conditions. Further, we analyse the usability of Climate DT output for the renewable energy sector, either directly or as stated above, as input for setting up dynamical climate simulations at the hecto-scale by using regional climate simulation models WRF and ICON. We therefore have the following objectives: (i) to assess the skill of the Global Climate DT scenarios with respect to representativeness of extreme (meteorological) events, synoptic patterns, and their impact on renewables; (ii) estimate the added value of highly resolved climate scenarios dynamically downscaled to hectometric spatial resolution (and higher vertical resolution) with respect to selected renewables extreme events (negatively affecting either the supply or the infrastructure itself).

For assessing the added value of hecto-scale simulations, on the one hand, regional climate simulations using the WRF and ICON model were conducted – initiated by ERA5 data – for 5 km, 1.6 km, 800 m and 400 m. These simulations display that higher regional climate model resolution from 5 km down to 1.6 km, to 400 m increases the model skill to represent local wind patterns.

On the other hand, to evaluate the skill of Climate DT versus hecto-scale simulations initialized by Climate DT, a model year representative of a real year is selected and simulated using ICON and WRF. Consequently, the meteorological parameters (e.g. wind speed, radiation, temperature) as well as the post-processed energy production (e.g. mean annual and mean monthly values) data are validated.

How to cite: Bügelmayer-Blaschek, M., Baier, K., Gazzaneo, P., Hasel, K., Lexer, A., and Schicker, I.: From Climate DT to Hectoscale Forecasts For Renewable Energy Systems  , EGU General Assembly 2026, Vienna, Austria, 3–8 May 2026, EGU26-6521, https://doi.org/10.5194/egusphere-egu26-6521, 2026.

EGU26-7222 | ECS | Orals | ERE2.1

Bias-Corrected High-Resolution Wind Speed Time Series for Renewable Energy System Modelling 

Florian Scheiber, Sebastian Wehrle, Max Nutz, Isabelle Grabner, and Johannes Schmidt

Future energy systems increasingly rely on weather-driven variable renewable energy (VRE) sources. As a result, the accuracy, resolution, and statistical consistency of meteorological inputs have become key considerations in energy system modelling (ESM). In particular, wind power estimates strongly depend on local wind speed characteristics, including both distributional properties and temporal variability. However, existing wind datasets at continental to national scale often lack sufficient spatial detail, exhibit systematic or statistical biases, or are insufficiently validated against observations. As a result, substantial uncertainty is introduced into wind energy assessments and system-level analyses. To address these limitations, we develop a framework for generating high-resolution hourly wind speed time series for Europe by combining distributional information with statistical downscaling techniques. We estimate a two-parameter Weibull distribution for each region using linear regression across multiple gridded products, including the Global Wind Atlas, ERA5 and E-OBS. The distribution is then evaluated using leave-one-out cross-validation against station measurements. In a second step, we use the validated Weibull distributions to bias-correct and downscale existing wind speed time series using several statistical downscaling approaches. Using station data as an observational benchmark, we assess the accuracy of the reconstructed time series and quantify the structural uncertainty associated with wind speed inputs derived from gridded datasets. The resulting high-resolution, bias-corrected wind speed products provide more robust meteorological inputs for renewable energy system modelling, improving estimates of wind power generation potential and supporting more reliable long-term system planning across Europe. 

How to cite: Scheiber, F., Wehrle, S., Nutz, M., Grabner, I., and Schmidt, J.: Bias-Corrected High-Resolution Wind Speed Time Series for Renewable Energy System Modelling, EGU General Assembly 2026, Vienna, Austria, 3–8 May 2026, EGU26-7222, https://doi.org/10.5194/egusphere-egu26-7222, 2026.

EGU26-7339 | ECS | Orals | ERE2.1

Simulating Atmospheric Dust Impact on Photovoltaic Performance: A sensitivity analysis to guide modelling choices in a data scarce region 

Amy Tamunoibinyemiem Banigo, Louise Crochemore, Benoit Hingray, Béatrice Marticorena, and Sandrine Anquetin

As solar photovoltaic (PV) systems are deployed globally to decarbonize energy production systems, atmospheric dust has emerged as a critical challenge due to its potential to drastically reduce production efficiency in many regions. Dust particles both attenuate incoming solar radiation and accumulate on photovoltaic module surfaces thereby reducing light transmission and power output. Soiling losses (defined as power production losses due to dust accumulation on PV panels) vary at daily, monthly and interannual timescales, as dust accumulation and removal processes depend on time-varying factors such as particulate matter concentration, wind, relative humidity, precipitation and cleaning operations. Capturing these dynamics thus requires assessments spanning several years.

Numerous studies have examined dust impacts on solar power generation, most relying on observations from solar farms or experimental sites. However, such observations remain scarce and often cover short time periods, particularly in data-scarce regions thus preventing comprehensive dust impact assessments. Dust simulation models offer an alternative approach: they enable the reconstruction of dust accumulation dynamics and their impacts on power production from meteorological data over extended periods.

This simulation approach was applied by Isaacs et al. (2023) for West Africa with atmospheric reanalysis (MERRA-2) and satellite-derived data. However, the extent to which input data and modelling choices may influence the conclusions of simulated estimates remains unclear. Reanalysis products are subject to substantial uncertainties and errors, especially in regions where ground-based observations used for their development are scarce. Dust models also typically rely on simplified process representations and poorly constrained parametrizations.

In this study, we introduce PVWAT, a simple dust simulation model developed for dust impact assessment as part of the ANR-funded NETWAT project, which examines water-energy nexus challenges in West Africa. Linking different sub-models from literature, it uses meteorological inputs from on-site observations or atmospheric reanalysis to simulate time series of dust deposition fluxes, deposited dust amounts and the resulting soiling losses.

We then use PVWAT to demonstrate how simulated dust impacts depend on input data and modeling choices. For this, we consider West Africa, a hot spot for dust-related PV production losses. The region's high solar potential and unmet energy demand are expected to drive large PV expansion in the coming years (10+ GW of solar capacity by 2030; IRENA, 2023) but the region borders the Sahara and Bodélé depression, the world's most prolific dust source. Our analysis considers three sites along a north-south transect, representing contrasting dust conditions, climates (arid to humid), and land covers (savanna to tropical forest), in order to draw recommendations for diverse solar production contexts.

Through systematic sensitivity analysis, we perturb model parameters up to 8× and meteorological variables up to 2× to quantify their effects on long-term soiling ratios. This reveals the dominant sources of uncertainty and assesses how the model responds to parametric versus variable perturbations across contrasting sites.

References
International Renewable Energy Agency. (2023). Scaling up renewable energy investments in West Africa. https://www.irena.org
Isaacs et al., 2023. Dust soiling effects on decentralized solar in West Africa. Applied Energy, 340, 120993. https://doi.org/10.1016/j.apenergy.2023.120993

How to cite: Banigo, A. T., Crochemore, L., Hingray, B., Marticorena, B., and Anquetin, S.: Simulating Atmospheric Dust Impact on Photovoltaic Performance: A sensitivity analysis to guide modelling choices in a data scarce region, EGU General Assembly 2026, Vienna, Austria, 3–8 May 2026, EGU26-7339, https://doi.org/10.5194/egusphere-egu26-7339, 2026.

EGU26-7748 | ECS | Posters on site | ERE2.1

Analysis of the intermittency of simultaneous wind speed and power output data of two groups of wind turbines from a wind park. 

Audrey Rised, François G. Schmitt, and Rudy Calif

We consider wind speed and power output time series from six turbines of a wind farm located in the Guadeloupe archipelago, in the eastern Caribean Sea. Simultaneous measurements of wind speeds and power outputs were sampled at a 10-minute temporal resolution throughout the year 2024, using an anemometer mounted on the nacelle of each turbine at a height of 48 m above ground level.

We first study their power spectral behavior and scaling statistics in the framework of fully developed turbulence and Kolmogorov’s theory and also in relation with atmospheric boundary-layer effects producing an inertial range with a power-law slope different from 5/3. We obtain an inertial range between scales from 10-7 ≤ f ≤ 10-4 Hz (10 min ≤ T ≤ 56 days), where f is the frequency and T the time scale, for both the velocity data and the power output.

On this inertial range, the Fourier power spectra E(f) follow a scale-invariant relation of the form E(f)=Cf , where C is a constant, f is the frequency, and  ß is the slope of the power law. We determine the values of ßv = 1.24 ± 0.07 for the wind velocity and   ßP= 1.18 ±0.08.  for the power output. We find a one-to-one relationship between both slopes: the steeper  ßv , the steeper  ßP . Furthermore, over the detected inertial range, using structure function analysis, we obtain intermittent and multifractal properties. In the framework of a lognormal model for the intermittency, we extract the different parameters to characterize this intermittency: the Hurst index H and the intermittency parameter µ. Within this intermittency and turbulent framework, our aim is to better understand the multi-scale relationship between the wind speed and the output power of the turbines.

How to cite: Rised, A., Schmitt, F. G., and Calif, R.: Analysis of the intermittency of simultaneous wind speed and power output data of two groups of wind turbines from a wind park., EGU General Assembly 2026, Vienna, Austria, 3–8 May 2026, EGU26-7748, https://doi.org/10.5194/egusphere-egu26-7748, 2026.

EGU26-7808 | ECS | Orals | ERE2.1

Quantifying future wind resources in complex terrain using data-driven predictions from large-scale GCM inputs 

Ruben Borgers, Claude Abiven, Sophia Buckingham, and Nicole van Lipzig

The expected lifetime energy yield of wind turbines and wind farms is to a large extent determined by the wind climate in which they operate. Importantly, the wind climate of the coming 25 years might differ significantly from that of the past 25 years as a consequence of natural climate variability and/or anthropogenically forced climate changes. Research on the uncertainty in future wind resources often relies on bias-corrected surface wind output from General Circulation Model (GCM) projection ensembles. However, for locations in complex terrain, the accuracy of modelled near-surface winds by these GCMs may be severely impacted by their coarse grid resolution and therefore also the associated wind climate change signals. Here, we assess the added value of a statistical GCM downscaling algorithm which employs GCM output from higher atmospheric levels as predictors. More specifically, we compare it to the standard, surface wind-based approach for a Chilean wind farm located in complex terrain. Furthermore, we assess the performance sensitivity to the choice of statistical model, predictor set, training data and temporal resolution. Finally, we apply both approaches to a GCM projection ensemble to illustrate the necessity of more advanced approaches for quantifying the future wind resource uncertainty for sites in complex terrain.

How to cite: Borgers, R., Abiven, C., Buckingham, S., and van Lipzig, N.: Quantifying future wind resources in complex terrain using data-driven predictions from large-scale GCM inputs, EGU General Assembly 2026, Vienna, Austria, 3–8 May 2026, EGU26-7808, https://doi.org/10.5194/egusphere-egu26-7808, 2026.

EGU26-7982 | ECS | Orals | ERE2.1

Integrating Wind Power into Graph-Based Limited-Area Weather Forecasting Models 

Aaron Van Poecke, Michiel Van Ginderachter, Joris Van den Bergh, Geert Smet, Dieter Van den Bleeken, Hossein Tabari, and Peter Hellinckx

Machine learning-based limited-area models (LAMs) have been shown to rival or even outperform conventional numerical weather prediction models at local, high-resolution forecasting tasks. This study investigates how the Encoder-Processor-Decoder architecture, which has been successfully employed in numerous applications, can be adapted for wind power prediction. Leveraging the Anemoi framework developed by the European Centre for Medium-Range Weather Forecasts (ECMWF) and various national weather services, we implement graph-based neural networks over a spatial domain encompassing the North Sea region. Different weather models, including standard graph neural networks and attention-based methods, are trained using high-resolution weather data from the Copernicus Regional Reanalysis for Europe (CERRA). We explore several strategies for incorporating wind power at different stages of the training pipeline, including training weather models jointly with wind power data from scratch, as well as finetuning pretrained weather models specifically for wind power forecasting. Training and verification are performed utilizing the publicly available wind power production data from the European Network of Transmission System Operators for Electricity (ENTSO-E). The impact of input feature selection and architectural design choices on forecast skill is evaluated. In addition, the resulting wind power forecasts are benchmarked against those obtained from conventional physics-based methods and state-of-the-art data-driven approaches. This comparison provides insight into the benefits and limitations of end-to-end learning frameworks for renewable energy forecasting and their operational applicability.

How to cite: Van Poecke, A., Van Ginderachter, M., Van den Bergh, J., Smet, G., Van den Bleeken, D., Tabari, H., and Hellinckx, P.: Integrating Wind Power into Graph-Based Limited-Area Weather Forecasting Models, EGU General Assembly 2026, Vienna, Austria, 3–8 May 2026, EGU26-7982, https://doi.org/10.5194/egusphere-egu26-7982, 2026.

EGU26-8475 | ECS | Orals | ERE2.1

Solar Irradiation Nowcasting with Flow-Guided Cloud Dynamics Prediction by SimVP-Flow 

Dongjin Kim and Jongmin Yeom

Accurate prediction of solar irradiation is important for renewable energy integration, agriculture, and environmental studies. However, solar power output is highly intermittent, with rapid fluctuations driven by cloud advection, formation, and dissipation. This intermittency increases operational uncertainty for grid operators and can raise reserve requirements. We present a deep learning framework for ultra-short-term forecasting of cloud evolution and solar irradiation up to 7.5 hours ahead using a 5-hour morning history ending at 09:00 (30-minute sampling). The model is trained with GK-2A geostationary satellite observations and auxiliary meteorological information. Conventional video prediction models often under-represent early-stage advection signals and tend to produce overly smooth forecasts, which limits their utility for irradiation prediction. To address these issues, we propose SimVP-Flow (Simple Video Prediction) with three components. First, we use the GK-2A water vapour (WV) infrared channel, infrared window channel and solar zenith angle (SZA) as inputs to provide both mid-to-upper-tropospheric flow cues and physically consistent diurnal geometry during pre-dawn and post-sunrise periods. Second, we incorporate optical-flow-derived motion fields as an explicit constraint to encourage sharper and more advective-consistent forecasts. Third, the decoder is modified with hybrid skip connections and PixelShuffle-based upsampling to better retain high-frequency cloud boundaries and reduce blurring artifacts in long-horizon predictions. We evaluate the proposed method on GK-2A case studies and compare it against single-channel baselines and the original SimVP. Performance is assessed using image-based metrics for cloud fields (e.g., MSE and SSIM) and error statistics for irradiation. This work aims to improve physically consistent short-horizon solar forecasting in data-sparse regions using satellite imagery and lightweight auxiliary variables.

This work was supported by the National Research Foundation of Korea(NRF) grant funded by the Korea government(MSIT)(RS-2025-00515357).

How to cite: Kim, D. and Yeom, J.: Solar Irradiation Nowcasting with Flow-Guided Cloud Dynamics Prediction by SimVP-Flow, EGU General Assembly 2026, Vienna, Austria, 3–8 May 2026, EGU26-8475, https://doi.org/10.5194/egusphere-egu26-8475, 2026.

EGU26-8814 | Posters on site | ERE2.1

Variability of Weather Windows in the Taiwan Strait and Their Linkages to Various Climate Drivers 

Wan-Ling Tseng, Yi-Hui Wang, Yi-Chi Wang, and Yueh-Shyuan Wu

Previous studies of offshore operational weather windows have typically relied on relatively short records (often less than a decade), limiting the characterization of low-frequency variability and its climate drivers. Here, we use more than 60 years of ERA5 reanalysis data to examine weather-window variability relevant to Taiwan’s offshore wind development and to identify the dominant climate processes governing this variability across timescales. Summer months provide the greatest number of operational weather windows and exhibit relatively stable year-to-year variability, making them the primary season for offshore operational activities. Interannual variability of June-July0August mean weather-window counts is dominated by a coherent regional wind pattern across the Taiwan Strait, with secondary contributions from modulation by the western North Pacific summer monsoon, ENSO, and episodic tropical cyclone activity. Together, these multiscale processes explain more than 50% of the variance in summer weather-window availability. Notably, during the period corresponding to the onset of Taiwan’s offshore wind development (2018-2024), summers have exhibited near-maximum accessibility relative to other time windows in the 60-year record, indicating that such favorable conditions may not persist and should be considered in long-term planning. Outside of summer, weather-window variability displays pronounced low-frequency behavior, including decadal oscillations and trends, with transitional months (e.g., October) associated with the Pacific Meridional Mode and colder months modulated by ENSO. These results highlight the importance of accounting for low-frequency climate variability when assessing offshore operational risk, with implications for reducing weather-related delays and supporting sustained progress toward offshore wind deployment goals. The framework presented here is transferable to other offshore wind regions with appropriate regional adaptation.

How to cite: Tseng, W.-L., Wang, Y.-H., Wang, Y.-C., and Wu, Y.-S.: Variability of Weather Windows in the Taiwan Strait and Their Linkages to Various Climate Drivers, EGU General Assembly 2026, Vienna, Austria, 3–8 May 2026, EGU26-8814, https://doi.org/10.5194/egusphere-egu26-8814, 2026.

EGU26-9666 | Posters on site | ERE2.1

Turbulence Intensity from ICON: A study of the potential for Wind Energy Applications 

Eileen Päschke and Maike Ahlgrimm

In addition to wind speed, turbulence intensity (TI) is a key atmospheric variable in the wind energy sector, as it affects both mechanical loads on wind turbines and their power production. Enhanced turbulence levels can increase structural fatigue and wear, while also influencing electricity generation. Consequently, reliable measurements and forecasts of wind speed and TI are essential for technical planning, safe operation, and accurate power yield forecasting for grid integration.

The German Meteorological Service (Deutscher Wetterdienst, DWD) runs the ICOsahedral Nonhydrostatic (ICON) model operationally as a numerical weather prediction model with horizontal grid size resolution of 2.1 km. This model provides wind data and subgrid-scale turbulent kinetic energy (TKE) using the TURBDIFF turbulence parameterization scheme. In parallel, Doppler Lidar (DL) systems are deployed at DWD's Lindenberg Meteorological Observatory to measure wind and turbulence profiles, including TKE, within the lowest 600 m of the atmospheric boundary layer. TI can be derived from both model output and observations by combining wind speed and TKE, enabling an evaluation of ICON with respect to wind-energy-relevant parameters.

In the presented study the model results for wind speed and TI from ICON simulations are compared with DL measurements over a five-day period with a typical summertime convective boundary layer evolution during daytime, while low level jets (LLJ) were observed during nighttime. Although the comparisons show reasonable overall agreement, it also becomes clear that uncertainties in both variables vary depending on atmospheric stratification.

In addition, the results of theoretical investigations into the potential benefits of using ICON forecasts of wind speed and ambient TI as inputs for wind energy power forecasts are presented. For this purpose, a performance model with a single turbine was used, which was driven with measured and simulated wind speed and TI in order to estimate the power output. The respective power outputs were compared with each other and the results suggest that incorporating TI information from ICON into wind power modelling can be advantageous, particularly under convective boundary-layer conditions. However, under stable stratification, the impact of simulated TI appears to be less significant, as uncertainties in LLJ forecasts can outweigh the effect of TI on electricity generation.

Although higher-resolution atmospheric models may better resolve ambient turbulence at rotor scales, their operational applicability is often limited by computational costs and data availability. This study therefore focuses on assessing whether freely available, operational ICON turbulence forecasts, which are available continuously and spatially consistently across Germany, can provide added value for wind energy applications under realistic practical constraints. The studies are limited to the investigation of ambient turbulence. Wake effects and turbine-turbine interactions, which will additionally occur in wind farms with more than one turbine, are not taken into account.


How to cite: Päschke, E. and Ahlgrimm, M.: Turbulence Intensity from ICON: A study of the potential for Wind Energy Applications, EGU General Assembly 2026, Vienna, Austria, 3–8 May 2026, EGU26-9666, https://doi.org/10.5194/egusphere-egu26-9666, 2026.

EGU26-10089 | ECS | Posters on site | ERE2.1

Evaluating Reanalysis Reliability under Compound Climate Extremes for Energy Resilience in the Maritime Continent  

Dea Bestari, Hannah Bloomfield, Craig Robson, Hayley Fowler, and Agie Wandala Putra

Future energy systems in the Maritime Continent are expected to be increasingly dominated by solar power as part of the broader decarbonization and energy transition agenda, with substantial growth in solar potential projected across Indonesia. While overall resource availability is likely to remain high due to Indonesia’s equatorial location, climate change may increase spatial and seasonal variability in surface solar radiation through shifts in cloudiness and atmospheric circulation, underscoring the need for climate-informed energy planning. 

However, the robustness of the reanalysis products under intensifying hydro-climatic extremes remains insufficiently assessed. This study evaluates the performance of the ERA5-Land reanalysis in reproducing surface solar irradiance relative to observations from 23 ground-based stations over the period 2019–2025, using the 2020–2022 triple-dip La Niña event as a natural stress test. Results are further contextualized within observed multi-decadal climate trends spanning 1981–2024. 

The evaluation reveals a systematic clear-sky bias in ERA5-Land that is strongly dependent on the atmospheric regime. While the reanalysis captures the phase of the diurnal irradiance cycle reasonably well under moderate conditions, its performance degrades markedly during high-impact weather regimes. During the deep convective phases of the 2021 La Niña, in situ observations show pronounced attenuation of surface solar irradiance associated with persistent cloud cover, whereas ERA5-Land frequently maintains elevated irradiance estimates. This behavior points to limitations in the representation of cloud optical properties, especially for thick stratiform cloud decks characteristic of the Asian Winter Monsoon. As a result, ERA-5 reproduces rainfall occurrence but underestimates the magnitude of associated solar dimming, leading to a systematic overestimation of solar resource availability during periods of heightened system vulnerability, which may translate into biased generation forecasts, inadequate reserve allocation, and increased operational risk for solar-dominated power systems. 

Other characteristics of climate data that are particularly relevant for future energy systems include emerging climate trends, especially those reflected in extreme climate indices. Analysis of ground stations indicates widespread asymmetric warming, with minimum temperatures increasing more rapidly than maximum temperatures, alongside a statistically significant intensification of wet extremes (RX1DAY) and changes in dry spell characteristics. The increasing prevalence of hydro-climatic extremes implies that the atmospheric regimes under which reanalysis performance is weakest are likely to become more frequent. 

Overall, this study identifies a critical resilience gap in renewable energy resource assessment for the Maritime Continent. Reliance on unadjusted reanalysis data may lead to systematic underestimation of solar power drought risk. We argue that future energy planning should move beyond uniform bias correction and adopt regime-aware approaches that explicitly account for limitations in the representation of cloud-radiative processes under extreme monsoonal conditions. 

How to cite: Bestari, D., Bloomfield, H., Robson, C., Fowler, H., and Putra, A. W.: Evaluating Reanalysis Reliability under Compound Climate Extremes for Energy Resilience in the Maritime Continent , EGU General Assembly 2026, Vienna, Austria, 3–8 May 2026, EGU26-10089, https://doi.org/10.5194/egusphere-egu26-10089, 2026.

EGU26-10118 | Orals | ERE2.1

Investigation of Wind Turbine Wakes in Complex Terrain at the WINSENT Test Site Using UAS Measurements 

Lukas Gruchot, Martin Schön, Yann Büchau, Kjell Zum Berge, Andreas Rettenmeier, Jens Bange, and Andreas Platis

Wind energy plays a key role in achieving carbon-neutral power generation, yet its deployment in complex terrain remains challenging. The WINSENT (Wind Science and Engineering Test Site in Complex Terrain) research facility addresses these challenges by operating research wind turbines in complex terrain.
The test site is located on the Swabian Alb near Stuttgart, Germany, in close proximity to a steep, forested escarpment that influences the local flow conditions. It is equipped with two research wind turbines (RWTs) and four meteorological masts with heights of 100 m. Unlike purely commercial turbines, the research turbines are operated under full experimental control, permitting deliberate activation and shutdown of the turbine and enabling wake studies under well-defined operating conditions.
Additional observation is provided by the University of Tübingen through campaign-based in-situ measurements using multicopter uncrewed aircraft systems (UAS). The UAS are simultaneously deployed at strategic locations, including the upstream inflow and multiple horizontal distances downstream of the turbines. They resolve turbulent structures down to sub-metre scales, allowing detailed investigation of flow variability, terrain-induced influences, flux measurements, turbulent kinetic energy (TKE), and mean wind statistics.
An extensive investigation of RWTs’ wake formation and horizontal and vertical structure is presented during multiple simultaneous UAS measurements. Despite the high surface roughness and the strongly heterogeneous flow conditions induced by the present complex terrain, turbine wakes can be clearly identified from the ultra-near-wake region at distances as close as 20 m downstream of the rotor, as well as at downstream locations corresponding to one-, two-, and three-rotor-diameter distances, with maximum observed wind-speed deficits reaching approximately one third of the inflow wind speed. Measurements acquired during turbine operation and under powered-off conditions are compared, revealing pronounced differences in wake structure, turbulence levels, and wake recovery, and confirming that the observed wind-speed deficits are primarily turbine-induced.

How to cite: Gruchot, L., Schön, M., Büchau, Y., Zum Berge, K., Rettenmeier, A., Bange, J., and Platis, A.: Investigation of Wind Turbine Wakes in Complex Terrain at the WINSENT Test Site Using UAS Measurements, EGU General Assembly 2026, Vienna, Austria, 3–8 May 2026, EGU26-10118, https://doi.org/10.5194/egusphere-egu26-10118, 2026.

Wind turbine wakes can significantly impact the performance of downstream turbines, reducing power generation and increasing loads. The characteristics of these wakes are heavily influenced by conditions within the atmospheric boundary layer (ABL). We investigate the interaction between wind turbines and the atmosphere with focus on the near wake region, up to 4 rotor diameters downstream. A large dataset of inflow conditions and wake characteristics comprises measurements from a nacelle-mounted Doppler wind lidar, a meteorological mast and turbine operational data. The data are collected at the research wind farm WiValdi in northern Germany. The lidar scans multiple horizontal planes to derive wake characteristics and near wake lengths, which are then analyzed across a range of atmospheric conditions. The results show that wake velocity deficits are reduced in turbulent conditions and enhanced under stable conditions. Wind veering across the rotor layer is found to correlate with increased wake deflection and vertical tilting, while a high shear exponent and potential temperature gradient which are both characteristic of the stable ABL are associated with increased lateral asymmetry of the velocity deficit. The near wake length is observed to extend on average around 2.01 rotor diameters downstream and exhibits greater sensitivity to atmospheric conditions than to turbine operational parameters. In stable conditions with low turbulence, near wake lengths can be particularly long. Further analysis will explore the asymmetry of the near wake and its vertical tilting in more detail, with complementary measurements from a second, ground-based lidar scanning vertically through the wake during a campaign to improve understanding of the three-dimensional wake dynamics.

How to cite: Menken, J. and Wildmann, N.: Wind turbine wake characteristics in various atmospheric conditions investigated with lidar measurements at WiValdi, EGU General Assembly 2026, Vienna, Austria, 3–8 May 2026, EGU26-10801, https://doi.org/10.5194/egusphere-egu26-10801, 2026.

EGU26-11025 | ECS | Orals | ERE2.1

Impact of floating photovoltaic power plant on reservoir evaporation: insights from eddy-covariance measurements 

Baptiste Berlioux, Rémi Le Berre, Martin Ferrand, Ronnie Knikker, and Hervé Pabiou

Aim and Approach

Increasing pressure on water resources, driven by the growing demand for drinking water, irrigation, and industrial uses, calls for improved water management strategies (Unesco, 2024). In this context, floating photovoltaic (FPV) systems have emerged as a promising solution. Initially developed to address land-use constraints, FPV installations also present a substantial potential for reducing evaporation losses from the reservoirs on which they are deployed (Sahu, 2016). By partially covering the water surface, these systems modify air–water interactions, reducing incoming solar radiation and altering convective heat and mass exchanges, thereby potentially limiting evaporative losses (Taboada, 2017).

However, despite this widely assumed benefit (Taboada, 2017; Gonzalez, 2025; Bontempo, 2021), evaporation reduction induced by FPV systems has not yet been robustly demonstrated or quantified at the scale of industrial installations. This lack of large-scale assessment primarily stems from the complexity of the physical processes involved, including the coupled effects of surface shading, altered turbulence, and modified atmospheric boundary-layer dynamics, which cannot be reliably captured by indirect or simplified approaches and require direct, high-resolution measurements (Tanny, 2008).


To address this gap, two eddy-covariance (EC) systems were deployed on a reservoir partially covered by an industrial-scale FPV plant (see Figure 1). This experimental setup enables a direct and simultaneous monitoring of evaporative fluxes over both covered and uncovered water surfaces, providing new insights into the impact of FPV installations on reservoir-scale evaporation dynamics.

Figure 1 - Location of EC measurements on the reservoir partially covered by an FPV power plant.

Results and Perspectives

Figure 2 presents the daily evaporation rates measured for several days in July over the covered area (EC) and the adjacent uncovered area (EUC), and compares them with evaporation from the reservoir assuming free-water conditions (Efree, PM). The results clearly indicate a substantial reduction in evaporation over the partially covered reservoir compared to the free-water reference.


Over the full observation period (2025-05 to 2025-10), an average evaporation reduction of 44% was observed above the FPV-covered area. More unexpectedly, this reduction extends beyond the direct footprint of the FPV installation. Evaporation over the uncovered area is also significantly reduced, with a mean decrease of 35%. This finding is particularly significant, as it challenges the common assumption in the literature that covered and uncovered areas behave as weakly coupled systems. Instead, our results reveal a strong coupling between these zones, indicating that FPV installations induce non-local modifications of the surface–atmosphere exchanges that affect evaporation at the reservoir scale.

Building on these observations, the next objective is to identify the key physical drivers controlling evaporation under FPV deployment and to explain the observed differences. Ultimately, this work aims to develop a simplified, physically based model capable of estimating evaporation losses from reservoirs partially covered by FPV systems.

Figure 2 - Daily mean evaporation from several days of 2025-07 over covered (orange) and uncovered (blue) areas. Gray bars correspond to the estimated free-lake evaporation of the reservoir. 

How to cite: Berlioux, B., Le Berre, R., Ferrand, M., Knikker, R., and Pabiou, H.: Impact of floating photovoltaic power plant on reservoir evaporation: insights from eddy-covariance measurements, EGU General Assembly 2026, Vienna, Austria, 3–8 May 2026, EGU26-11025, https://doi.org/10.5194/egusphere-egu26-11025, 2026.

EGU26-11402 | Posters on site | ERE2.1

Assessing weather windows for the offshore wind development using combined meteorological and oceanographic reanalysis data 

Thomas Möller, Janosch Michaelis, Akio Hansen, Felicitas Hanse, Thomas Spangehl, Sabine Hüttl-Kabus, Maren Brast, Johannes Hahn, Olaf Outzen, Axel Andersson, Mirko Grüter, and Bettina Kühn

Germany aims to substantially expand its offshore wind energy by 2045, increasing the installed capacity from about 10 GW today to almost 70 GW, with offshore wind expected to supply up to 25 % of the national electricity demand. Achieving this target requires the development of offshore wind in increasingly remote areas, where long-term observational reference data are scarce and meteorological and oceanographic conditions are less well understood. However, a key factor for the safe and cost-effective installation, operation, and maintenance of the offshore wind farms is the assessment of “weather windows”, defined as periods during which meteorological and oceanographic conditions like wind and waves are below the operational limits of the vessels used. The frequency and duration of such weather windows directly affect installation schedules, turbine accessibility during operation, as well as the vessel requirements, and thus the financial viability of offshore wind projects. At the same time, this has a major impact on the corresponding bids submitted in tenders of new offshore wind sites.

To achieve Germany’s offshore targets, new offshore wind sites have been tendered annually since 2021 by the Federal Network Agency, in cooperation with the Federal Maritime and Hydrographic Agency (BSH), according to the Offshore Wind Energy Act (WindSeeG). The German Weather Service (DWD) supports the BSH in compiling detailed information on the prevailing meteorological conditions at the tendered sites and in continuously providing new and improved products. The meteorological dataset for each site typically combines one year of site-specific in-situ measurements obtained with floating LiDARs and several long-term reanalysis datasets. Both provide the basis for the comprehensive report on the expected conditions at an offshore wind site. All data and reports are publicly available via the BSH’s PINTA portal – https://pinta.bsh.de.

This study presents a new comprehensive assessment of combined wind and wave conditions for selected offshore wind sites, using multi-decadal atmospheric and oceanographic reanalysis data. For the first time, the new regional reanalysis product ICON-DREAM-EU from DWD is included alongside well-established reanalysis datasets. The resulting weather windows are evaluated in terms of their frequency, duration, and seasonal variability, considering both average and extreme cases. Generic thresholds relevant to the offshore wind industry are used with a focus on near-surface wind speed and sea state.

The results show distinct patterns of favourable conditions and reveal substantial differences between the reanalysis datasets. These differences highlight uncertainties inherent in assessments based solely on reanalyses and underscore the importance for high-quality, site-specific in-situ measurements. The study supports improved planning and risk assessment for the offshore wind development and emphasizes the value of the in-situ and reanalysis data provided year after year via the PINTA portal for the energy transition.

How to cite: Möller, T., Michaelis, J., Hansen, A., Hanse, F., Spangehl, T., Hüttl-Kabus, S., Brast, M., Hahn, J., Outzen, O., Andersson, A., Grüter, M., and Kühn, B.: Assessing weather windows for the offshore wind development using combined meteorological and oceanographic reanalysis data, EGU General Assembly 2026, Vienna, Austria, 3–8 May 2026, EGU26-11402, https://doi.org/10.5194/egusphere-egu26-11402, 2026.

EGU26-11439 | ECS | Orals | ERE2.1

Influence of aerosol input data on WRF-Solar global horizontal irradiance forecasts for solar energy in West Africa 

Amélie Solbès, Emmanuel Cosme, Damien Raynaud, and Sandrine Anquetin

West Africa has significant solar energy resources, and the growing number of photovoltaic power plants is increasing solar production. The establishment of a day-ahead market should make it possible to increase the share of this intermittent energy in the energy mix. However, this type of market requires estimating the production a day in advance, and thus addressing the challenges of weather and solar forecasting.

Dust advection and clouds are the two meteorological phenomena that most influence photovoltaic production in West Africa. They are still poorly represented by numerical weather models in this region, as no operational high-resolution regional forecasting systems exist. Moreover, the available global operational forecasting systems generally use a low-resolution aerosol climatology that does not account for high-frequency spatiotemporal variability of atmospheric dust content.

This study aims to evaluate the potential improvements achieved through a regional model that incorporates aerosol information and offers high resolution (3 km, 15 min) over Burkina Faso. The Weather Research & Forecasting Model (WRF), an atmospheric simulation system from NCAR, is supplemented by an extension for solar application: WRF-Solar. It can be used with different types of aerosol data, calculating the influence of Aerosol Optical Depth (AOD) on Global Horizontal Irradiance (GHI). In this study, WRF-Solar is used with three different configurations: without AOD data, with the monthly aerosol climatology built into WRF, and with the hourly 2D AOD forecast from CAMS (an atmospheric chemistry model produced by ECMWF). The WRF-Solar simulations are forced by ECMWF IFS forecasts. The simulations have a duration of 36 hours to meet the requirements of the day-ahead market. Two study periods were chosen: during the monsoon season, from July 2023 to September 2023 and during the dry season, from January 2024 to march 2024. The forecasts are evaluated against in-situ GHI measurements from a pyranometer located at Zagtouli photovoltaic power plant.

The results show that simulations using the CAMS 2D AOD forecast and those using the built-in monthly aerosol climatology give similar overall results, with their own specific characteristics. Both configurations simulate an overestimated GHI. They both have a clear advantage over the WRF-Solar configuration without AOD data. Slight differences between the configurations are observed in the calculated GHI on cloudy days during the monsoon, which are related to differences in cloud representation.

How to cite: Solbès, A., Cosme, E., Raynaud, D., and Anquetin, S.: Influence of aerosol input data on WRF-Solar global horizontal irradiance forecasts for solar energy in West Africa, EGU General Assembly 2026, Vienna, Austria, 3–8 May 2026, EGU26-11439, https://doi.org/10.5194/egusphere-egu26-11439, 2026.

EGU26-12138 | ECS | Posters on site | ERE2.1

Evaluating Dual-Doppler Radar Wind Speed Performance Under Different Scanning Strategies and Atmospheric Conditions  

Arianna Jordan, Lin-Ya Hung, Gerrit Wolken-Möhlmann, and Julia Gottschall

With the rapid growth of wind farms worldwide, it is increasingly relevant to identify reliable measurement approaches for characterizing wind turbine wakes. Scanning wind lidars are commonly used for this purpose, but they are constrained by limited spatial coverage and can face performance challenges under certain atmospheric conditions (i.e., precipitation). In contrast, a dual-Doppler radar setup, in which two radars sample the same scanning volume, has emerged as a promising approach. It retrieves wind velocities over larger areas and can capture the spatial extent and evolution of turbine wakes, particularly during precipitation when radar returns are strongest. Recent field operations as part of the American WAKE ExperimeNt have demonstrated the value in using this dual-Doppler radar approach over a large domain encompassing several wind farms. However, there still remains uncertainty about its ability to resolve winds in different locations and under various radar configurations and atmospheric regimes. 

The 2025 Krummendeich field experiment in northern Germany provided an ideal testbed to address this gap. This onshore campaign took place at a wind farm consisting of only a few turbines to target finer, turbulence-based measurements. Along with the dual-doppler setup of the radars, the site was equipped with scanning lidars, met masts, laser disdrometers, a commercial vertical profiling lidar, and other instruments. By leveraging observations collected from Krummendeich, dual-Doppler radar wind measurements can be validated against datasets previously used extensively in wind-energy research, and a systematic evaluation of this novel dual-Doppler setup can provide new insights into how its performance responds to different external factors. As part of an ongoing effort, this study examines under what conditions the dual-Doppler radar approach does and does not supply optimal data availability for resolving turbine wakes. Preliminary results suggest that data coverage and quality increases with rainfall intensity, motivating a more in-depth analysis across precipitation regimes, atmospheric conditions, and scan configurations. 

How to cite: Jordan, A., Hung, L.-Y., Wolken-Möhlmann, G., and Gottschall, J.: Evaluating Dual-Doppler Radar Wind Speed Performance Under Different Scanning Strategies and Atmospheric Conditions , EGU General Assembly 2026, Vienna, Austria, 3–8 May 2026, EGU26-12138, https://doi.org/10.5194/egusphere-egu26-12138, 2026.

EGU26-12727 | ECS | Orals | ERE2.1

Evaluating the Operational Skill of Deterministic and Probabilistic Wind Power Ramping Event Predictions for the Belgian Offshore Zone 

Ruoke Meng, Geert Smet, Joris Van den Bergh, Hossein Tabari, Dieter Van den Bleeken, and Piet Termonia

This study proposes methods of wind power predictions from Numerical Weather Prediction (NWP) models and evaluates wind power ramping event predictions in the Belgian Offshore Zone. We verify the operational deterministic model ALARO-4km at the Royal Meteorological Institute of Belgium, its enhanced version incorporating Wind Farm Parameterization (WFP), and the ECMWF ensemble prediction system. To convert meteorological variables into power forecasts, we implement both physical power curves and machine learning methods, including XGBoost and Transformer models. Within the machine learning models, we over-sample rare but high-impact events such as turbine cut-outs during high wind speeds, enabling the models to effectively learn these critical extreme states. While initial validation using traditional metrics suggests that the Transformer model achieves the lowest Mean Absolute Error (MAE) for deterministic and Continuous Ranked Probability Score (CRPS) for probabilistic, we argue that these aggregate scores may mask deficiencies in the capture of rapid power fluctuations, which is vital for stable grid operations.

Since ramping events pose challenges to power system operations, we further verify the capability of these models to predict significant ramps. We highlight the limitations of standard metrics like MAE and CRPS, as they often optimize average timing and magnitude errors in a way that rewards "over-smoothing", even though such smoothing renders the forecast ineffective for detecting ramps. To overcome this, we propose a verification framework that introduces an error buffer for deterministic contingency analysis (hits, misses, and false alarms) and adapts this buffer concept for probabilistic verification within the Brier Score. We apply these proposed verification solutions to our power model outputs and evaluate the models' useful skills. In deterministic forecasting, the XGBoost model achieves higher scores for most ramping events compared to other models, whereas the power curve approach proves more effective for capturing large-scale ramps within the ensemble-based probabilistic predictions. Our results demonstrate that the Transformer’s low CRPS is largely a result of its smoothed output, which is unfavourable for predicting actual ramping events. These findings emphasize the need for operational caution when identifying "optimal" models, suggesting that lower scores in average error metrics do not inherently guarantee reliability for managing critical power ramps. Our proposed verification solutions provide an intuitive framework for understanding and comparing the predictive skill of various models specifically regarding ramping events.

How to cite: Meng, R., Smet, G., Van den Bergh, J., Tabari, H., Van den Bleeken, D., and Termonia, P.: Evaluating the Operational Skill of Deterministic and Probabilistic Wind Power Ramping Event Predictions for the Belgian Offshore Zone, EGU General Assembly 2026, Vienna, Austria, 3–8 May 2026, EGU26-12727, https://doi.org/10.5194/egusphere-egu26-12727, 2026.

Wind direction is critical for wind energy assessment, as it influences turbine yaw alignment, wake effects, and energy production estimates. This is especially relevant in mountainous regions, where complex terrain and atmospheric processes contribute to directional variability. Despite its importance, wind direction from global atmospheric reanalysis has received little attention in wind resource assessments, which mainly focus on wind speed. This study identified clusters of daily-cycle patterns of angular errors in hourly ERA5 wind direction and evaluated a machine-learning calibration using ERA5 surface meteorological variables. The analysis was applied in the complex terrain of the Ecuadorian Andes (3800 m a.s.l.), using one year of data (2021) of ERA5 wind direction (100 m height) and ground-based wind measurements (80 m). K-means clustering was applied to the sine and cosine components of wind direction from both reanalysis and observations. A Random Forest model was trained independently for each cluster using wind speed at 100 m, sine and cosine components of wind direction, 10 m wind gust, near-surface air temperature, dew point temperature, skin temperature, surface pressure, radiation fluxes, and precipitation. Results revealed three clusters related to the daily-cycle and the magnitude of the angular error: Cluster 1- predominantly nocturnal and early morning (8 pm-10 am, minimum at 4 pm); and small angular error (median 16°); Cluster 2 - daytime and predominantly afternoon (10 am - 8 pm, peak at 4 pm), and large angular error (80°); and Cluster 3 - evenly distributed throughout the day, with a slight maximum at 3 pm; and medium angular error (47°). The largest errors coincided with lower wind speed and post-midday decreases in air temperature, skin-surface temperature, and surface pressure. They also coincided with large variability in wind direction since Cluster 1 was dominated by easterly to southeasterly winds, Cluster 3 by westerly, while Cluster 2 showed a large dispersion from easterly to westerly flows. Calibration substantially improved wind direction representation. For the nocturnal cluster, the most informative predictors were 10 m wind gust, skin temperature, and surface pressure, reducing the median angular error to 8° and improving the wind direction distribution (Perkins Skill Score - PSS from 0.50 to 0.69). For the high-error afternoon cluster, wind speed, total precipitation, and surface pressure were the dominant predictors, decreasing the median angular error to 15° and improving PSS from 0.32 to 0.60. Finally, for the evenly-distributed cluster, surface pressure, dew point temperature, and wind speed were most relevant predictors, yielding a median angular error of 8° and PSS increase from 0.36 to 0.68. The findings highlight the strong dependence of the angular error of ERA5 wind direction on the daily-cycle and thermal processes. 

How to cite: Ballari, D. and Contreras, J.: Daily-cycle patterns of angular errors in ERA5 wind direction: clustering and calibration using surface meteorological variables, EGU General Assembly 2026, Vienna, Austria, 3–8 May 2026, EGU26-12857, https://doi.org/10.5194/egusphere-egu26-12857, 2026.

EGU26-12889 | Posters on site | ERE2.1

Potential of regridding of FMCW lidar wind profiles to improve data availability 

Finja Baumer, Piet Markmann, Finn Burgemeister, and Gerhard Peters

Continuous wave lidars have been widely applied in wind site assessment in recent years. The CW technique uses the adjustment of the beam focus for ranging. A known constraint of this technique is the poor definition of the range weighting function, particularly at upper ranges. In case of inhomogeneous reflectivity distribution, for example caused by low hanging clouds, the center of the scattering volume does not necessarily agree with the center of the adjusted focus range leading to a wrong range allocation of the wind measurements.

As a solution to this fundamental issue, a frequency modulation (FM) of a CW lidar provides independent information of the actual measuring height. The beat frequency of the FMCW lidar depends on the real range of the center of the scattering volume, which may differ from the assumed range based on the focus adjustment. Based on this real range information, the wind profile can be regridded to the expected or defined measuring heights. We will showcase the impact of regridding FMCW wind profiles using a Wind Ranger 200 for cases with inhomogeneous reflectivity distributions and compare the results with a reference pulsed wind lidar.

How to cite: Baumer, F., Markmann, P., Burgemeister, F., and Peters, G.: Potential of regridding of FMCW lidar wind profiles to improve data availability, EGU General Assembly 2026, Vienna, Austria, 3–8 May 2026, EGU26-12889, https://doi.org/10.5194/egusphere-egu26-12889, 2026.

EGU26-13162 | Orals | ERE2.1

Incorporating wake effects in Belgian offshore wind and power forecasts 

Geert Smet, Dieter Van den Bleeken, Joris Van den Bergh, Idir Dehmous, Daan Degrauwe, Michiel Van Ginderachter, and Alex Deckmyn

The Royal Meteorological Institute of Belgium (RMI) has been delivering offshore wind and power forecasts to Elia, the Belgian transmission system operator for high-voltage electricity, as part of a dedicated storm forecast tool, in an operational setting since November 2018. With an installed capacity of 2.26 GW fully completed by the end of 2020, the Belgian offshore zone (BOZ) is one of the highest density wind energy zones in the world. Each Belgian wind farm has a relatively high number of turbines and/or installed power per area. Moreover, due to lack of space in the Belgian North Sea, all Belgian wind farms lie close together in a narrow band, with the Dutch Borssele wind farm zone nearby. There is thus a considerable impact of intra-farm and inter-farm wakes on both power production and mesoscale wind. 

In order to improve offshore wind and power forecasts in the Belgian North Sea, the BeFORECAST research project was funded by the Energy Transition Funds of the Belgian federal government, from 01 November 2022 until 31 October 2025. The project was coordinated by the von Karman Institute for Fluid Dynamics (VKI), in a consortium with KU Leuven, the Royal Meteorological Institute of Belgium (RMI), SABCA, 3E and Vrije Universiteit Brussel (VUB).

We give an overview of RMI's main results in the BeFORECAST project over the past 3 years. In particular a wind farm parameterization was implemented in RMI's operational weather model ALARO, and an artificial neural network for power forecasting was trained on power production data and NWP forecasts. Both wind and power forecasts were further compared with VKI's mesoscale WRF model, and against real-world observations from turbine SCADA, lidar and power production data. The influence of the planned second Belgian offshore zone, the future Princess Elisabeth zone (PEZ), on the BOZ production was also studied. Additionally, 3DVar assimilation of Doppler radar radial wind (VRAD) in ALARO was tested, with very promising results on offshore wind speed forecasts, showing a positive impact up to 24 hours in forecast lead time. Finally, two methods for postprocessing wind speed NWP forecasts using historical lidar and SCADA data were investigated. We developed a neural network for postprocessing of deterministic ALARO forecasts, and a modified member-by-member approach with special emphasis on storm events for the ensemble forecasts of ECMWF.

How to cite: Smet, G., Van den Bleeken, D., Van den Bergh, J., Dehmous, I., Degrauwe, D., Van Ginderachter, M., and Deckmyn, A.: Incorporating wake effects in Belgian offshore wind and power forecasts, EGU General Assembly 2026, Vienna, Austria, 3–8 May 2026, EGU26-13162, https://doi.org/10.5194/egusphere-egu26-13162, 2026.

EGU26-13601 | ECS | Posters on site | ERE2.1

The implications of atmospheric gravity waves for wind farm and turbine design 

Timothy Rafferty and Christopher Vogel

Understanding how wind turbines interact with large-scale atmospheric phenomena is an increasingly important issue for wind farm developers. With the latest 15 MW turbines reaching heights of 270 m, several studies have predicted that farms of these turbines will be able to induce Atmospheric Gravity Waves (AGWs). These buoyancy-driven waves are triggered as a result of a farm vertically deflecting thermally stratified flow above the turbine array. In particular, as the temperature inversion above the North Sea is typically located at heights near the top of a 15 MW turbine, farms in this region may be especially susceptible to generating AGWs. Hence, with most European offshore wind farms based in the North Sea, understanding the interactions with, and impact of, these waves is vital for yield prediction.

Recent studies have shown that AGWs cause a redistribution of flow at the farm scale, altering wind farm power production. As a result, AGWs provide a new challenge for wind farm planning and raise questions about whether farm design can influence how the AGW is triggered, and if these AGWs also have impacts at the turbine scale. To address these questions, large eddy simulations using actuator line turbine representations were undertaken. These simulations replicated the typical atmospheric turbulence, Coriolis force and thermal parameters seen in the North Sea.

First, the middle turbine of an infinitely wide row was simulated. The turbine triggered an AGW, and the flow field was compared to a wave-free case. The AGW was found to cause upstream flow deceleration, accelerate bypass flow above the turbine wake, and cause pockets of acceleration within the wake itself at AGW troughs. Overall, this led to faster wake recovery than in a wave-free case.

Following this, simulations were conducted using two turbines aligned in the streamwise direction, each representative of the middle turbine in an infinitely wide row. Introducing a second turbine triggered stronger AGWs, magnifying their effects on the flow. Furthermore, by varying the position of the downstream turbine, it was possible to both amplify and dampen the AGW produced, along with causing a shift in the wave phase. The power of the second turbine was found to vary sinusoidally with the change in turbine position. When in line with an AGW trough, the second turbine even outperformed the first despite sitting in its wake. However, the increased power came at the cost of a higher mean blade loading and an increase in cyclic loading.

This work demonstrates that AGWs can impact intra-farm flows and turbine performance. Additionally, it confirms an interdependence between AGWs and wind farm turbine spacing. Given the variation in the AGW with spacing, it may become an important factor in design which considers both intra-farm and farm-to-farm scale flows.

How to cite: Rafferty, T. and Vogel, C.: The implications of atmospheric gravity waves for wind farm and turbine design, EGU General Assembly 2026, Vienna, Austria, 3–8 May 2026, EGU26-13601, https://doi.org/10.5194/egusphere-egu26-13601, 2026.

EGU26-13902 | ECS | Posters on site | ERE2.1

Physics-Constrained Latent Dynamics for Solar PV Forecasting via Interpretable Deep Learning 

Jun-Wei Ding and I-Yun Lisa Hsieh

As solar photovoltaic (PV) generation becomes increasingly central to global renewable energy systems, cloud-induced intermittency of solar irradiance remains a major challenge for power system stability and economic dispatch. Due to the sparse spatial coverage of ground-based measurements, high-resolution geostationary satellite imagery (e.g., Himawari-8/9) has become essential for real-time solar forecasting. However, satellite observations provide only two-dimensional projections of integrated atmospheric optical effects, lacking explicit information on cloud vertical structure and microphysics, which fundamentally complicates the inference of physically meaningful irradiance dynamics. Despite recent advances, deep learning–based satellite forecasting methods continue to face three key limitations: limited interpretability due to black-box model structures, excessive parameterization that constrains real-time or edge deployment, and strong sensitivity to quasi-static background signals embedded in satellite imagery. To address these challenges, we propose a Physics-Constrained Latent Dynamics Framework that reframes image reconstruction as an auxiliary constraint governing latent dynamical evolution rather than a prediction target. By minimizing reconstruction errors between predicted and observed satellite images, the framework guides neural physical operators to learn physically consistent cloud motion in latent space. Inspired by PhyDNet, the model decomposes prediction into two parallel pathways: a physics-based branch that governs latent state evolution through neural physical operators, and a data-driven residual branch that compensates for non-physical visual components beyond simplified physical representations. The framework comprises three core components: (i) neural physical operators that approximate partial differential equations (PDEs) via architectural constraints in latent space, enforcing conservation and temporal continuity; (ii) a clear-sky background representation to isolate deterministic irradiance patterns; and (iii) a Global Horizontal Irradiance (GHI) prediction head. In parallel, a ConvLSTM-based residual branch captures cloud formation and dissipation, illumination variability, and sensor noise, forming a dual-branch architecture that integrates physics-based structure with data-driven flexibility. To further decouple stochastic cloud variability from quasi-static background signals, a bootstrap-based extreme-quantile method is employed to construct clear-sky deviation maps, enabling more effective separation of dynamic cloud processes. Preliminary experiments using multiple ground stations in Tokyo, Japan, demonstrate that, without direct irradiance inputs, the proposed framework achieves an R2 of 0.801 and a mean absolute error of 0.5 MJ m-2 for one-hour-ahead GHI forecasts. Analysis of the learned higher-order PDE coefficients suggests that the latent dynamics capture nonlinear physical behaviors beyond simple translational motion. Ablation studies further show that, compared with a pure ConvLSTM baseline, the proposed decoupled architecture reduces parameter counts by approximately 30% while improving forecasting performance by about 12%. While autoregressive frame-based prediction remains susceptible to error accumulation at longer horizons, ongoing work explores replacing the autoregressive formulation with Neural Ordinary Differential Equations to model temporal evolution as continuous dynamical flows, aiming to mitigate long-horizon error growth and establish a more robust foundation for physics-informed solar forecasting and dynamical analysis.

How to cite: Ding, J.-W. and Hsieh, I.-Y. L.: Physics-Constrained Latent Dynamics for Solar PV Forecasting via Interpretable Deep Learning, EGU General Assembly 2026, Vienna, Austria, 3–8 May 2026, EGU26-13902, https://doi.org/10.5194/egusphere-egu26-13902, 2026.

EGU26-14164 | Posters on site | ERE2.1

Potential and limitations of efficient machine-learning wind downscaling for energy-relevant applications in mountainous environments 

Nora Helbig, Florian Hammer, Gert-Jan Duine, Leila Carvalho, Sarah Barber, and Charles Jones

Accurately representing complex spatio-temporal wind fields in mountainous terrain requires high-resolution atmospheric models, but these come with substantial computational cost. Although generally less accurate than physics-based models, machine learning-based wind downscaling offers computationally efficient alternatives for many energy-relevant applications; however, its performance depends on training data and local conditions, limiting its broad applicability.

We present an enhanced version of the deep-learning-based near-surface wind downscaling model Devine (Le Toumelin et al., 2023), trained on controlled atmospheric simulations over synthetic topographies covering a wide range of slopes and terrain features. Wind-direction-dependent descriptive features facilitate deployment across different mountainous sites. We evaluate the model using high-resolution atmospheric simulations and ground-based observations in two mountainous regions with contrasting climates and topography, performing a spatio-temporal assessment of its strengths and limitations.

The enhanced Devine model reproduces fine-scale wind patterns for terrain-induced flow as used in the training data, demonstrating transferability across mountainous sites. Its rapid generation of high-resolution wind fields enables applications such as wind resource assessment, atlas generation, climate impact studies, and short-term operational forecasts for wind farm operation. Overall, the evaluation shows how the enhanced Devine model can guide energy-related applications, indicating where it performs reliably and where caution is needed due to unrepresented wind regimes such as large-scale pressure-driven flow.

LeToumelin, L., Gouttevin, I., Helbig, N., Galiez, C., Roux, M., and Karbou, F. (2023). Emulating the adaptation of wind fields to complex terrain with deep-learning. Artificial Intelligence for the Earth Systems, 2(1):1–39.

How to cite: Helbig, N., Hammer, F., Duine, G.-J., Carvalho, L., Barber, S., and Jones, C.: Potential and limitations of efficient machine-learning wind downscaling for energy-relevant applications in mountainous environments, EGU General Assembly 2026, Vienna, Austria, 3–8 May 2026, EGU26-14164, https://doi.org/10.5194/egusphere-egu26-14164, 2026.

EGU26-14460 | ECS | Posters on site | ERE2.1

Improving wind energy estimates in mountainous terrain using optimal ERA5 model level heights 

Juan Contreras, Nicole van Lipzig, Esteban Samaniego, and Daniela Ballari

Mountainous regions worldwide offer substantial yet underutilized wind energy potential. A key challenge limiting the expansion of wind energy in such areas is the difficulty of obtaining accurate wind resource estimates in complex terrain. Traditionally, long-term wind speed series are derived from short-term site observations combined with reanalysis products. Conventional reanalysis products such as the ERA5 single levels at 10 m and 100 m often misrepresent local orography, resulting in biased wind speed predictions and unreliable inputs for Measure-Correlate-Predict (MCP) methods used in wind resource assessment. Our study addresses this challenge by employing high-quality mast observations at high-elevation sites in the tropical Andes and by leveraging ERA5 model level wind fields, which remain largely unexplored in wind energy research and industry. We compared wind speed estimates at different atmospheric heights of ERA5 model level data with hourly wind speed observations at 80 m from four meteorological masts (2829–3796 m a.s.l.) in the tropical Andes of southern Ecuador. We developed site-specific Random Forest (RF) models to calibrate ERA5 wind speeds. Our results indicate that wind speeds extracted from upper ERA5 model levels (approximately 1000–1500 m for most sites) are stronger correlated with mast measurements than those at the hub-heights (near the surface). Relative to single level inputs, RF estimates driven by model level data show mean improvements of 59% in the Perkins Skill Score, 40% in R², and 23% in MAE and RMSE. In addition, the bias in annual energy production is reduced to below 7%, compared to 22% when ERA5 single level data are used. The largest gains are observed at sites located on exposed ridgelines and peaks, typical targets for wind farm development, where upper model levels more effectively represent the local atmospheric flow. Our results demonstrate that selecting optimal ERA5 model level offers a strategy for generating reliable site-specific wind time series in complex terrain providing useful information for wind resource assessment studies accelerating the development of wind energy projects in mountainous regions.

How to cite: Contreras, J., van Lipzig, N., Samaniego, E., and Ballari, D.: Improving wind energy estimates in mountainous terrain using optimal ERA5 model level heights, EGU General Assembly 2026, Vienna, Austria, 3–8 May 2026, EGU26-14460, https://doi.org/10.5194/egusphere-egu26-14460, 2026.

EGU26-16324 | ECS | Posters on site | ERE2.1

Harnessing Synoptic-Scale Information in Wind and Photovoltaic Energy Forecasting Using Machine Learning 

Fernando Lezana Duran and Carlos A. Ochoa Moya

A supervised machine-learning regression framework is presented for forecasting wind and photovoltaic (PV) power generation by integrating local and synoptic-scale meteorological information. The approach is evaluated across multiple sites, including 39 wind and 18 PV stations in Mexico, and 3 wind and 8 PV stations in China. For each station, an XGBoost regression model is trained to predict hourly energy production using local meteorological variables, derived from ERA5 reanalysis data for Mexico and on-site measurements for the Chinese stations.

To assess the added value of large-scale atmospheric information, dimensionally reduced synoptic-scale predictors extracted from ERA5 using self-organizing maps and principal component analysis are incorporated. These predictors are designed to represent dominant atmospheric circulation patterns potentially influencing local renewable energy production. Model performance is assessed through station-specific cross-validation, comparing configurations with and without synoptic-scale features across multiple predictor combinations.

Results indicate that the inclusion of synoptic-scale atmospheric patterns can improve short-term power forecasts at several locations, although the overall gains are generally modest. The analysis suggests that improvements in local meteorological inputs are likely to yield larger increases in forecast skill than further refinement of synoptic-scale representations. Nevertheless, the proposed framework demonstrates clear operational relevance: when customized for individual stations, synoptic-scale information can contribute to improved forecasting performance while maintaining the computational efficiency of machine-learning-based methods.

How to cite: Lezana Duran, F. and Ochoa Moya, C. A.: Harnessing Synoptic-Scale Information in Wind and Photovoltaic Energy Forecasting Using Machine Learning, EGU General Assembly 2026, Vienna, Austria, 3–8 May 2026, EGU26-16324, https://doi.org/10.5194/egusphere-egu26-16324, 2026.

EGU26-17332 | ECS | Orals | ERE2.1

Impact of Euro-Atlantic teleconnection phases on satellite-based solar irradiance forecasting errors 

Swati Singh, Sylvain Cros, and Jordi Badosa

Satellite-based solar irradiance forecasting plays a key role in the short-term management of photovoltaic (PV) power generation. It provides intraday Global Horizontal Irradiance (GHI) forecasts more accurate than NWP models, but their performance remains highly sensitive to cloud cover dynamics and synoptic weather situations.

Large-scale circulation over the Euro-Atlantic area can be commonly described by four leading teleconnection patterns: the North Atlantic Oscillation (NAO), East Atlantic (EA), East Atlantic–Western Russia (EAWR), and Scandinavian (SCA) patterns, each characterized by positive and negative phases. While their influence on climate variability and seasonal renewable energy production has been widely studied, their impact on satellite-based solar irradiance forecasting errors has never been quantified. Previous analyses have shown that individual NAO circulation indices can modulate solar irradiance forecast errors, motivating a comprehensive daily assessment of Euro-Atlantic teleconnection phases.

Here, we analyze eight years (2016-2023) of satellite-derived GHI forecasts at the SIRTA observatory near Paris (France). Four-hour-ahead forecasts with a 15-minute temporal resolution are generated using CMV-based extrapolation of geostationary satellite cloud fields and evaluated against pyranometer observations. Daily Euro-Atlantic teleconnection indices (NAO, EA, EAWR, SCA) are computed from ERA5 500 hPa geopotential height anomalies using an EOF-based methodology. Each day is classified according to the dominant teleconnection pattern and its positive or negative phase.

Forecast errors are quantified using the relative root mean square error (RRMSE) up to a lead time of 4 hours, with a particular focus on the 2-hour forecast horizon as a representative forecast skill assessment. The RRMSE across the full period is 30.8%. Distinct error regimes emerge across the eight teleconnection states (NAO±, EA±, EAWR±, SCA±), with generally lower forecast errors during NAO+, EA+, and SCA phases, and higher errors during NAO-, EA-, and EAWR phases.

Pronounced seasonal contrasts are observed, with the highest (37.4%) and lowest (27.9%) RRMSE values occurring in winter and summer, respectively. Variations in forecast errors across teleconnection phases reflect both circulation dominance and phase frequency. For example, EAWR- exhibits elevated errors in winter (+18.5% relative to the seasonal mean), which progressively decrease from spring to autumn, while NAO- shows reduced errors in winter (-12.8%) but increased errors during spring, summer, and autumn. RRMSE were elevated in winter and spring (20.5% and 7.7%) and reduced in summer and autumn (-15.8%, -6.3%) during EA+. Similar but opposite error patterns were observed during EA- phases across consecutive seasons.

These results highlight the importance of considering the full Euro-Atlantic teleconnection framework when interpreting satellite-based solar irradiance forecast performance. By extending teleconnection analysis to intraday forecast errors, this study demonstrates that large-scale circulation phases provide valuable information for understanding and anticipating variability in solar forecasting skill, with direct implications for PV forecasting and energy system management.

How to cite: Singh, S., Cros, S., and Badosa, J.: Impact of Euro-Atlantic teleconnection phases on satellite-based solar irradiance forecasting errors, EGU General Assembly 2026, Vienna, Austria, 3–8 May 2026, EGU26-17332, https://doi.org/10.5194/egusphere-egu26-17332, 2026.

EGU26-17575 | Posters on site | ERE2.1

Impact of Offshore Wind Farm Expansion Scenarios on Wave Climate in the German Bight 

Nikolaus Groll, Naveed Akhtar, and Beate Geyer

The growing demand for renewable energy has accelerated the development of offshore wind farms (OWFs), particularly in the German Bight, where significant expansion is planned. The construction of these installations in the shallow southern North Sea can significantly alter the lower atmosphere by introducing turbulence and modifying wind profiles. Observations and atmospheric simulations suggest that OWFs reduce near-surface wind speeds and affect vertical wind structure, depending on the size and layout of the turbines, as well as the expansion scenario.

In order to evaluate the potential impact on ocean waves, we use atmospheric simulations representing various OWF development scenarios as input for the spectral wave model WAM (v4.6), investigating changes in the regional wave climate over a 10-year period. The results suggest that OWFs affect not only local wave conditions, but also lead to a reduction in significant wave height and wave power downstream over larger areas. These findings emphasise the importance of considering OWF-induced atmospheric changes when modelling waves and assessing the impact on the coast.

How to cite: Groll, N., Akhtar, N., and Geyer, B.: Impact of Offshore Wind Farm Expansion Scenarios on Wave Climate in the German Bight, EGU General Assembly 2026, Vienna, Austria, 3–8 May 2026, EGU26-17575, https://doi.org/10.5194/egusphere-egu26-17575, 2026.

EGU26-17646 | ECS | Posters on site | ERE2.1

Operationalizing Satellite-Based Solar Nowcasting: A Collaborative Partnership between DMI and Energinet for National Grid Planning  

Irene Livia Kruse, Kristian Holten Møller, Kasper Stener Hintz, Henrik Vedel, Ulrik Ankjær Borch, and Julia Sommer

The rapid expansion of solar power capacity necessitates the development of advanced, high-resolution meteorological tools to ensure national grid stability and efficient energy market integration. This poster presents a high-visibility collaboration between the Danish Meteorological Institute (DMI) and Energinet, the Danish Transmission System Operator (TSO), focused on the end-to-end development and operationalization of a satellite-based solar nowcasting system.  

The project is strategically structured into three distinct development tracks designed to modernize grid planning capabilities through improved short-term forecasts. In the first track, we have successfully transitioned a current optical-flow model based on Meteosat Second Generation (MSG) data into a live production environment. This system currently operates at a 15-minute temporal resolution and update frequency. As of early 2026, the first operational version of this system is live within a containerized Kubernetes environment orchestrated by AirFlow, which triggers automated updates every fifteen minutes. This infrastructure utilizes stable S3-storage for data handling and is transitioning from temporary researcher-led server solutions to permanent, integrated data flows. Validation of this system against current state-of-the-art operational numerical weather prediction output will be presented. The second development track involves adapting these models for the newly available Meteosat Third Generation (MTG) data, which provides significantly improved spatial resolution at 10-minute intervals. This transition includes establishing routines for skill comparison to quantify improvement over the first nowcasting system. Finally, the third track explores the development of an AI-based nowcasting model designed to learn realistic cloud development from historical MTG satellite imagery to further reduce nowcast uncertainty. This project serves as a technical blueprint for the integration of meteorological research into operational IT infrastructure to support the ongoing green energy transition. 

How to cite: Kruse, I. L., Holten Møller, K., Stener Hintz, K., Vedel, H., Ankjær Borch, U., and Sommer, J.: Operationalizing Satellite-Based Solar Nowcasting: A Collaborative Partnership between DMI and Energinet for National Grid Planning , EGU General Assembly 2026, Vienna, Austria, 3–8 May 2026, EGU26-17646, https://doi.org/10.5194/egusphere-egu26-17646, 2026.

EGU26-18742 | ECS | Posters on site | ERE2.1

Compound Drought-Heatwave Events: Brazil’s Energy Sector 

Anna Bradley, Andrew Hartley, Rachel James, Lincoln Alves, and Dann Mitchell

Hydropower provides more than half of Brazil’s electricity, making the energy system sensitive to climate variability. Recent droughts have had severe impacts on hydropower generation, including the 2014/15 event that affected production in Southeast Brazil. Heatwaves in densely populated areas of the country can also drive an increase in energy demand for cooling. The co-occurrence of these drought and heatwaves events can be considered a spatially compound event which occur when interconnected locations experience hazards concurrently, amplifying impacts beyond that of the individual hazards. Therefore, these events represent a substantial risk to the energy security of Brazil.

This study investigates how the occurrence of these drought-heatwave compound events has changed since 2004. Impacts metrics, including the Standardised Precipitation Evapotranspiration Index and Cooling Degree Days derived from ERA5, combined with energy demand and energy production data were used to investigate both the univariate and compound nature of the changes observed, and the implications this has for the energy system. The results indicate that the nature of the most extreme compound events vary, and that a compound approach offers a more comprehensive assessment of climate impacts on the energy system than a univariate approach. These findings also have the potential to aid adaptation research by providing a basis to explore how climate-energy stress events may change under future climate projections.  

How to cite: Bradley, A., Hartley, A., James, R., Alves, L., and Mitchell, D.: Compound Drought-Heatwave Events: Brazil’s Energy Sector, EGU General Assembly 2026, Vienna, Austria, 3–8 May 2026, EGU26-18742, https://doi.org/10.5194/egusphere-egu26-18742, 2026.

EGU26-19096 | Orals | ERE2.1

A Comparative Analysis of Mesoscale and Microscale Vertical Wind Profiles for Wind Energy Assessment 

Jēkabs Priedītis, Tija Sīle, Pēteris Bethers, Uldis Bethers, and Rauls Poļs

Accurate characterization of the vertical wind profile is essential for wind energy assessment, particularly in regions with heterogeneous surface conditions that are challenging for mesoscale modelling. In Latvia, extensive forest cover introduces significant surface roughness, increasing uncertainty when extrapolating wind conditions from mesoscale models to local, mast-measured wind profiles.

This study investigates wind speed and direction profiles based on measurements from communication masts at heights between 10 and 85 meters across three sites in Latvia. Two years of 10-minute averaged wind measurements at several height levels are analysed, with additional remote sensing data used where available. The measured wind profiles are compared against mesoscale model products commonly used in wind resource assessment, with a focus on the influence of surface roughness.

The analysis focuses on surface roughness related differences in mean wind speed, wind shear, and directional dependence between mast-based observations and modelled wind fields. The results demonstrate systematic differences between measured and modelled wind profiles over forested terrain, highlighting the limitations of mesoscale models in resolving local surface effects relevant for wind energy applications. The analysis identifies conditions under which these deviations are most pronounced, providing guidance for the interpretation of mesoscale model output at microscale sites.

These findings emphasize the importance of site-specific measurements for wind energy applications in Latvia and provide insight into the sources of uncertainty when applying wind atlases and reanalysis data in regions with complex terrain and surface roughness.

How to cite: Priedītis, J., Sīle, T., Bethers, P., Bethers, U., and Poļs, R.: A Comparative Analysis of Mesoscale and Microscale Vertical Wind Profiles for Wind Energy Assessment, EGU General Assembly 2026, Vienna, Austria, 3–8 May 2026, EGU26-19096, https://doi.org/10.5194/egusphere-egu26-19096, 2026.

This work is a multidisciplinary approach that analyzes the growing vulnerability of renewable energy production systems to climate variability dominated by just a few large-scale atmospheric regimes. In particular, the Portuguese electricity system is  heavily influenced by atmospheric vulnerability, due to its current high dependance on solar and wind energy, which increases the risk of energy shortages as a consequence of poor meteorological conditions, particularly in situations of low production and high demand. These episodes, known as energy compound events (ECEs), compromise the security and stability of the Portuguese energy system.

The main objective is to investigate the relationship between ECEs and large-scale atmospheric patterns, as well as to assess their evolution in the context of climate change. The methodology is structured in three phases: i) defining and characterizing ECEs in the Portuguese electricity system; ii) identifying the meteorological patterns associated with these events; and iii) assessing the impact of climate change on the frequency and intensity of these patterns. To this end, data on national electricity demand and solar energy production for the period 1989-2025 were obtained from the energy dataset of the European Copernicus Climate Change Service (C3S, https://climate.copernicus.eu/). Wind energy production was calculated from the CERRA atmospheric wind speed fields at 10 meters. The meteorological regimes affecting the Portuguese energy system were calculated from the 500 hPa geopotential height of the ERA5 database, based on the decomposition of the daily Z500 into empirical orthogonal functions and their grouping using k-means clustering. Finally, data from 14 global climate models (GCMs) obtained from the CMIP6 ensemble were used to analyze the evolution of the frequency and intensity of the identified regimes, as well as their consistency with the ERA5 observations (during the historical period) and in the future using different climate scenarios.

From the analysis, six meteorological regimes were identified as having an impact on renewable energy production in Portugal. Out of the 234 ECEs detected throughout the period, 144 occurred under the predominance of the positive phase of the North Atlantic Oscillation (NAO+), indicating an important contribution for ECEs occurrence. It is expected that the analysis of future projections will enable a robust assessment of the evolution of ECE risk in a constantly changing climate, contributing to adaptation and mitigation strategies and ensuring the reliability of energy systems.


This work is supported by FCT, I.P./MCTES through national funds (PIDDAC): LA/P/0068/2020- https://doi.org/10.54499/LA/P/0068/2020 , UID/50019/2025,  https://doi.org /10.54499/UID/PRR/50019/2025 ,UID/PRR2/50019/2025

This work has also received funding from the European Union’s Horizon 2.5 – Climate Energy and Mobility programme under grant agreement No. 101081661 through the 'WorldTrans – TRANSPARENT ASSESSMENTS FOR REAL PEOPLE' project

How to cite: Ganhão, C., Molina, M., and Trigo, R.: Analysis of synoptic conditions that lead to Energy Compound Events (ECEs) in the Portuguese electrical system, in current and future climates, EGU General Assembly 2026, Vienna, Austria, 3–8 May 2026, EGU26-19171, https://doi.org/10.5194/egusphere-egu26-19171, 2026.

PV generation is affected strongly by the short-term fluctuations in meteorological conditions - from clear sky to cloudy, which would be considered normal conditions, to more rare events like snow fall, freezing rain or dust that covers the modules. Rare events are hard to forecast reliably, they are usually not well represented in the training data and cause imbalances in training and prediction. However, they can have huge impacts on the energy system as for example snowfall usually covers many PV plants simultaneously over extended areas. Such events, if not foreseen in time, require balancing action of network operators and thereby cause large costs and possibly strain on the energy infrastructure.

State of the art PV forecasting models are overwhelmingly being trained on datasets without accounting for changing conditions and rare situations. To improve the prediction of such events we present a new method in the form of a data labeler and classifier for snow conditions in PV forecasting based only on meteorological and historical PV generation data to allow for a classification of the expected forecasting conditions over a time horizon of the next few hours up to days. With the classification performed, the best suited model trained for the expected condition can be employed to yield the most reliable PV forecast.

The method is site-specifically trained with historical PV generation data of the site, but no other metadata, module specifications, satellite or visual data are required. The data is combined with historical weather measurements (like irradiance, temperature and precipitation) from a close-by meteorological station. By classifying the conditions in the training dataset with the method, rare conditions are identified and labelled. The labels do not require exact validation, a high likelihood is sufficient. Expert models for those conditions can then be trained in a supervised setting. These are exposed to a training dataset that has dense samples of the selected rare condition and can include augmented samples of the condition. Thereby, a range of specialized forecasting models is created and benchmarked against each other to ensure selection of the best performing models for forecasting in case of a forecast rare condition.

Preliminary results from Austrian PV systems indicate a high accuracy of 99.6% and true positive rate of 96% for the labelling method with a false positive rate of only 0.05% on a test dataset. An LSTM neural network-based classifier to forecast conditions 24 hours ahead shows similar performance metrics and an LSTM regressor expert model achieved only 30% of the PV forecasting error of a similar non-expert model. Both classifier and expert regressor were trained on the labelled and condition enriched dataset.

The work was funded by the Austrian Climate and Energy Fund and carried out under the program "Energieforschung 2022".

How to cite: Reisenbauer, S. and Schicker, I.: Forecasting rare but impactful events in renewable energy generation - condition classification for optimal expert model training and model selection in PV forecasting, EGU General Assembly 2026, Vienna, Austria, 3–8 May 2026, EGU26-19429, https://doi.org/10.5194/egusphere-egu26-19429, 2026.

EGU26-19728 | ECS | Posters on site | ERE2.1

Synthetic PV Data for Energy Communities  

Petrina Papazek and Irene Schicker

Accurate and transferable photovoltaic (PV) power forecasting is essential for grid operation and energy system planning, particularly as PV installations continue to expand and energy communities increasingly rely on decentralized, locally managed generation. However, PV production is inherently site-specific, and many community-scale systems lack sufficiently long and continuous observation records to support robust data-driven forecasting approaches.

We present a scalable machine-learning nowcasting framework designed to support PV forecasting for energy communities. The approach integrates (downscaling) spatial radiation nowcasts and combining openly available meteorological data with local information to generate PV power forecasts tailored to individual PV systems or entire communities. It builds on semi-synthetic data generation and post-processing techniques and is specifically designed for data-scarce environments. Local high resolution weather prediction model output such as our in-house post-processing model INCA is used as a primary source of covariates, complemented by available satellite-derived radiation products from CAMS and reanalysis data from ERA5.

The methodology follows a two-fold strategy to address insufficient historical PV data. Where individual PV systems or communities provide a sufficient amount of measured production data for supervised learning, semi-synthetic PV time series are generated using classical approaches based on auxiliary meteorological and radiation data. In this setting, Random Forest models are employed due to their robustness for limited, seasonal datasets and their ability to capture nonlinear feature interactions without excessive overfitting. In cases where observational data are extremely scarce, an alternative strategy is applied using pre-trained foundation models. These models are driven by a set of meteorological and temporal covariates and calibrated using forecast radiation fields converted into site-specific PV power via PVLib and detailed PV meta-data (e.g. system geometry, technical parameters, and location). In both cases, semi-synthetic PV time series are effectively used to augment training data and optimize data driven nowcasting.

Model performance is evaluated across a diverse set of PV sites and compared against persistence and climatological baselines. Results indicate that semi-synthetic data combined with local covariates provide a robust approach for transferable PV power nowcasting and is useful for energy community use cases.

How to cite: Papazek, P. and Schicker, I.: Synthetic PV Data for Energy Communities , EGU General Assembly 2026, Vienna, Austria, 3–8 May 2026, EGU26-19728, https://doi.org/10.5194/egusphere-egu26-19728, 2026.

EGU26-20178 | ECS | Posters on site | ERE2.1

Simulating Climate Responses to Large-Scale Photovoltaic Deployment with PlaSim 

Arya Samanta and Kira Rehfeld

The rapid integration of renewable energy into national and global electricity systems is a cornerstone of climate mitigation strategies consistent with the Paris Agreement. Photovoltaics (PV) are central to this transition, with global installed capacity exceeding 800 GW by 2021 and projections indicating multi-terawatt deployment by mid-century (IRENA, World energy transitions outlook, 2023). While large-scale PV expansion is essential for decarbonization, it also constitutes a substantial land-surface modification that can influence surface energy fluxes, radiation balance, and atmospheric circulation. Quantifying these interactions is therefore important for understanding the broader environmental implications of renewable energy systems at scale.

Here, we investigate the climatic response to spatially extensive PV deployment using the intermediate-complexity climate model PLASIM (Fraedrich et al., 2005). We perform idealized global simulations with varying fractions of land surface covered by PV, across multiple horizontal resolutions (T21, T31, T42) and three model configurations: atmosphere-only, mixed-layer ocean, and a large-scale geostrophic ocean. This framework allows us to contrast short-term atmospheric adjustments with longer-term, ocean-coupled responses, and to assess the sensitivity of results to spatial resolution and coupling timescales.

Our results show that the climate response to PV deployment is strongly dependent on the albedo contrast between PV panels and the underlying surface. Low effective panel efficiency leads to surface warming due to reduced albedo, while intermediate efficiencies yield mixed regional responses. At high efficiencies, cooling emerges relative to the control climate. These non-linear responses highlight the importance of background land properties and surface–radiation interactions in shaping the climatic impacts of renewable energy deployment.

While the simulations represent idealized and prospective scenarios, we discuss pathways for linking such model-based assessments with long-term field measurements and remote-sensing observations of existing solar installations. Although a clear scale mismatch exists between climate-model grid cells and observed PV sites, observational datasets provide valuable constraints on surface temperature, albedo changes, and land-cover effects. Combining retrospective observations with prospective climate-model experiments offers a promising avenue for cross-examining renewable energy impacts across spatial and temporal scales.

This study contributes to the spatial and temporal modelling of renewable energy systems by bridging climate-system modelling, land-surface impacts, and future deployment scenarios, and by outlining how modelling and observations together can inform sustainable pathways for large-scale solar energy expansion.

How to cite: Samanta, A. and Rehfeld, K.: Simulating Climate Responses to Large-Scale Photovoltaic Deployment with PlaSim, EGU General Assembly 2026, Vienna, Austria, 3–8 May 2026, EGU26-20178, https://doi.org/10.5194/egusphere-egu26-20178, 2026.

EGU26-20893 | ECS | Orals | ERE2.1

The Economic Benefit of AI-Driven Day-Ahead Hydropower Production Forecasts 

Kamilla Wergeland, Christoph Ole Wilhelm Wulff, and Asgeir Sorteberg

To reach the goal of net-zero emissions and carbon neutrality, the European power system is changing towards more variable renewable energy production. The increasing share of weather-dependent energy production however, makes it more challenging to maintain a stable grid frequency. This results in larger penalties for energy producers contributing to instability.

Norway is well connected to the European energy system, exposing it to market conditions in neighboring countries. To ensure a stable grid frequency, the national transmission system operator is responsible for balancing production and consumption volumes. To support the balancing operations, all power producers must submit day-ahead production forecasts. Deviations from the predicted volumes are subject to imbalance fees. In addition, power producers need to buy and sell energy in a dedicated market to balance deviations. To avoid large imbalance costs and support grid stability, accurate high-resolution day-ahead production forecasts are essential.

In Norway, the largest variable renewable energy source is run-of-river hydropower. Forecasting run-of-river hydropower production is equivalent to forecasting streamflow. The industry has expanded rapidly lately, resulting in many newly commissioned plants with limited streamflow observations. Thus, there is a need for a forecasting model that can make accurate predictions with limited training data.

In this study, we explore the potential of using a Long Short-Term Memory neural network to forecast hourly streamflow. The model is trained on historical data from 215 Norwegian gauging stations. To improve training efficiency, we adopt a multi-frequency approach in which earlier time steps are processed at a daily resolution, while more recent inputs retain their original hourly resolution. We explore two approaches of improving model performance: including data from 139 run-of-river hydropower plants during training and including streamflow estimated from production data through a data assimilation approach.

The results show that both approaches improve the performance of the model and the final model outperforms both a persistence model and one of the leading providers of run-of-river hydropower production forecasts in Norway. The potential economic value of the improved day-ahead forecast is estimated on the basis of both reduced imbalance fees and reduced exposure to volatile prices in the balancing market. This shows that the model we propose has the potential to improve upon existing models and contribute to overall grid stability.

How to cite: Wergeland, K., Wulff, C. O. W., and Sorteberg, A.: The Economic Benefit of AI-Driven Day-Ahead Hydropower Production Forecasts, EGU General Assembly 2026, Vienna, Austria, 3–8 May 2026, EGU26-20893, https://doi.org/10.5194/egusphere-egu26-20893, 2026.

EGU26-21298 | Posters on site | ERE2.1

Numerical simulation of wind loads on PV systems placed on the ground and a flat roof 

Marten Klein, Marcelin Kabongo, Heiko Schmidt, and Richard Meyer

Wind loads are a major design constraint for photovoltaic (PV) systems, in particular when modules are installed on flat roofs not connected to the building. Such PV system designs must be heavy enough to assure safe and durable operation under varying and peak wind conditions, but should not be much heavier. The additional weight required for a selected configuration cannot be easily deduced from wind engineering standards (codes) without a calibrated aerodynamic model and without knowledge of the local wind environment. Consequently, risk and lifetime analysis, by means of critical loads for PV panel disposition and fracture initiation due to extreme wind events, as well as fracture worsening due to unsteady aerodynamic loads, cannot be addressed.

To overcome the mentioned limitations, case-specific loading rules have to be developed based on design-specific aerodynamics and site-specific wind conditions within the atmospheric surface layer (ASL), potentially in an urban environment. Numerical simulations provide means to develop such case-specific loading rules. For this purpose, the simulations need to offer sufficient fidelity to enable the prediction of lift and drag forces that act on the selected PV system, simulataneously providing further insight into the flow. Nevertheless, the computational approach is limited by numerical approximations and modeling assumptions. The corresponding numerical and modeling errors manifest themselves by a dependence of the simulated wind loads on the mesh, timestep, selected turbulence model, and inflow condition, among others.

In the contribution, large-eddy simulations (LES) of wind loads on PV systems placed on the ground and a flat roof will be presented. First, starting from the case of a single (South-oriented) PV panel placed on the ground, LES results obtained with OpenFOAM and PVade are compared to each other in order to establish a minimal reference set-up. Second, the geometry is extended to a double-panel (East-West) configuration, which is likewise simulated with both solvers. Third, a single building is introduced in the OpenFOAM-based set-up so that LES for a building without and with a roof-placed PV system are conducted. For comparison, the same PV array is simulated placed on the ground. These results demonstrate the significant influence of the local wind environment on panel-based wind loads and the derived case-specific loading rules. Last, an outlook is given to fluid-structure interaction and fracture initiation.

How to cite: Klein, M., Kabongo, M., Schmidt, H., and Meyer, R.: Numerical simulation of wind loads on PV systems placed on the ground and a flat roof, EGU General Assembly 2026, Vienna, Austria, 3–8 May 2026, EGU26-21298, https://doi.org/10.5194/egusphere-egu26-21298, 2026.

EGU26-21392 | Orals | ERE2.1 | Highlight

Unlocking Renewable Energy Insights with Plume: Extensions for Wind Energy and Beyond  

Clara Ducher, Antonino Bonanni, Domokos Sarmany, and Tiago Quintino

Destination Earth (DestinE) is the European Union's flagship initiative to develop Digital Twin (DT) models of the Earth system. It leverages cutting-edge advances in numerical prediction, digital technologies, high-performance computing, and AI to enhance our understanding of climate change and evolving weather extremes. One of its key objectives is to support the European Commission's Green Deal by enabling the large-scale integration of renewable energy into Europe's energy system. This ambition is pursued through several energy-related use cases, such as the ongoing Onshore & Offshore Wind Energy Information project, or closed Energy Systems for making a resilient power system.

European Centre for Medium-Range Weather Forecasts (ECMWF) has developed Plume, co-funded by the European Commission under the DestinE initiative. Plume is a plugin mechanism for Earth system models that extends their processing capabilities through modular add-on functionalities. Plume dynamically loads plugins at runtime and provides read access to in-memory model fields via a well-defined interface (based on the Atlas library (Deconinck, et al., 2017)), enabling application-specific processing alongside the main model without costly I/O operations. This framework has been applied in the EU Horizon project DTWO, which develops a Digital Twin for wind energy applications. In collaboration with DTWO partners, ECMWF created two Plume plugins, introduced at the 2025 European Meteorological Society Annual Meeting, for wind farm modelling and extreme weather event detection, tested in Extremes DT-like experiments.

This presentation focuses on recent extensions to the Plume framework that enhance these plugins' usability and relevance for the wind energy value chain, while enabling broader development of renewable-energy applications through improved configurability. Wind energy applications require high-frequency, high-resolution data at turbine hub heights (50-200m). The Extremes DT, running the Integrated Forecasting System (IFS), computes wind fields on model levels, from which hub-height winds can be interpolated. However, certain heights, e.g., 100m, are only computed at output steps, limiting availability for plugins during model integration, and the typical output heights do not fully capture the required range. To address these limitations, Plume now includes its own data generation capability. Beyond interfacing with original model fields, Plume can manage derived fields and variables, feeding plugins with relevant data while centralising processing costs and methods, e.g., hub-height wind interpolation. This feature is implemented using an observer pattern, propagating updates from source model data to Plume-managed fields and triggering strategy-based recalculations. The design prioritises extensibility and avoids redundancy in plugin code by concentrating derived data generation within Plume. For the wind farm modelling plugin, this enhancement enables direct retrieval of wind data at configured hub heights, supporting more accurate resource assessments while keeping the implementation application-focused. By consolidating these capabilities within Plume, the framework fosters greater collaboration on iterative improvements and plugin development, engaging a broader community of stakeholders in shaping its evolution.

How to cite: Ducher, C., Bonanni, A., Sarmany, D., and Quintino, T.: Unlocking Renewable Energy Insights with Plume: Extensions for Wind Energy and Beyond , EGU General Assembly 2026, Vienna, Austria, 3–8 May 2026, EGU26-21392, https://doi.org/10.5194/egusphere-egu26-21392, 2026.

EGU26-21603 | ECS | Posters on site | ERE2.1

A Comparative Study on Micro-meteorology and Vegetation Effects of Centralized Photovoltaic Power Stations in High-Altitude Desert Regions 

Yingying Cui, Hongyuan Ma, Deli Ye, Jiachen Zhang, Zhongxue Ma, and Feifei Tang

To investigate the differences in microclimatic and eco-environmental effects of centralized photovoltaic (PV) power stations under diverse climatic backgrounds, high-altitude desert PV stations in Qinghai Province representing hyper-arid, arid, and semi-arid climates were selected. Micro-meteorology factors and vegetation evolution characteristics inside and outside the PV arrays were analyzed by employing paired inside-outside observations and long-time-series NDVI retrieval. It is indicated that the micro-meteorology and eco-environmental effects exhibit differential responses along the aridity gradient, with water availability identified as the core regulatory factor. A significant “heat island effect” with no vegetation recovery was observed in the hyper-arid zone; nocturnal warming and slight humidification with a trend of vegetation recovery were exhibited in the arid zone; while positive ecosystem feedback was demonstrated in the semi-arid zone, where the shading and wind-blocking effects of PV modules facilitated soil moisture conservation, leading to rapid vegetation recovery that offset physical warming through transpiration cooling. The evolutionary pattern of PV ecological effects transitioning from physical disturbance to ecological regulation is elucidated, and the feasibility of synergy between PV development and ecological restoration under suitable water conditions is confirmed.

How to cite: Cui, Y., Ma, H., Ye, D., Zhang, J., Ma, Z., and Tang, F.: A Comparative Study on Micro-meteorology and Vegetation Effects of Centralized Photovoltaic Power Stations in High-Altitude Desert Regions, EGU General Assembly 2026, Vienna, Austria, 3–8 May 2026, EGU26-21603, https://doi.org/10.5194/egusphere-egu26-21603, 2026.

EGU26-21675 | Posters on site | ERE2.1

A Generative Approach for Surface Solar Irradiance Nowcasting 

Georg Ertl, Alberto Carpentieri, Simon Albergel, David Benhaiem, Khalid Oublal, Malo Guichard, and Emmanuel Le Borgne

Accurate short-term forecasting of surface solar irradiance (SSI) is essential for renewable energy integration and trading considerations. In operations, it enables flexibility mechanisms, provides a hedge against rapid weather transitions and overall facilitates decision-making for intraday arbitrage. The ability to anticipate rapid ramp events in particular allows for the proactive management of renewable assets, maximizing capture prices and minimizing imbalance settlements. 

To this end, we present a new probabilistic framework for SSI forecasting over the contiguous United States (CONUS), developed within the NVIDIA Earth-2 platform. The framework builds upon Stormscope, NVIDIA's latest generative model for short-term Geostationary Operational Environmental Satellite (GOES) imagery forecasting, which serves as its core component. Stormscope predicts the spatio-temporal evolution of cloud fields, producing probabilistic satellite imagery sequences that capture atmospheric variability at high temporal resolution across eight spectral bands.

On top of this forecasting backbone, we apply a diagnostic diffusion model to estimate surface solar irradiance from GOES imagery using the National Solar Radiation Database (NSRDB) as reference data. This diagnostic model converts predicted satellite imagery into uncertainty-aware irradiance fields. Real-time inference is performed through Earth2Studio, providing continuous processing of live GOES data streams suitable for operational deployment. 

We evaluate the system’s performance against the High-Resolution Rapid Refresh SSI forecasts, demonstrating improved skill in capturing rapid irradiance fluctuations and cloud-driven variability at short lead times. The integration of Stormscope and the diagnostic diffusion model represents a significant expansion of TotalEnergies' global weather forecast capabilities, bridging the gap between real-time and medium-range weather forecast. This work advances the reliability of solar resource prediction and contributes to improving the profitability of renewable asset portfolios in increasingly volatile merchant markets.

How to cite: Ertl, G., Carpentieri, A., Albergel, S., Benhaiem, D., Oublal, K., Guichard, M., and Le Borgne, E.: A Generative Approach for Surface Solar Irradiance Nowcasting, EGU General Assembly 2026, Vienna, Austria, 3–8 May 2026, EGU26-21675, https://doi.org/10.5194/egusphere-egu26-21675, 2026.

EGU26-21779 | ECS | Orals | ERE2.1

Decadal wave power variability form satellite altimetry in Ireland 

Nahia Martinez Iturricastillo, Alain Ulazia, Sonia Ponce de León Alvarez, and John V. Ringwood

Ireland is the first landmass between the northeast Atlantic Ocean and Europe; its geographical location endows it with high energy potential in the ocean. At present, around 40% of the energy in Ireland is generated by renewable technologies, the majority of which is produced by onshore wind turbines. However, given the marine energy potential, the integration of wave energy converters into the future energy mix is a plausible proposition. This integration would result in a more stable energy mix, which is not reliant upon a single renewable resource. This study aims to analyse the wave power potential in Ireland by employing long-term satellite altimeter and weather buoy observations. Satellite altimeters offer long-term measurements, and cover a broader area compared to weather buoys. Data spanning from 1995 until 2024 is employed, encompassing a total of 30-years. This timeframe is particularly pertinent in the context of the analysis, as it encompasses the projected lifespan of the wave energy converters to be potentially installed. The goal is to assess whether decadal variations on the available wave power would affect the devices’ performance. To this end, wave power variation maps are generated. As satellite altimeters do not measure wave period, a regression following the method proposed by Gommenginger et. al. (2003) is employed to estimate the zero-crossing wave period by relating the significant wave height and the back-scatter coefficient measured by the altimeters, with Irish moored buoy observations. The wave energy period is obtained from wave period ratio maps created from results by Haoyu Jiang et. al. (2022); ultimately wave power is calculated assuming deep water and panchromatic seas. Decadal variations are calculated with via Theil-Sen approach, after removing the lag-1 autocorrelation, and the statistical significance its evaluated by means of the Mann Kendall test. 

How to cite: Martinez Iturricastillo, N., Ulazia, A., Ponce de León Alvarez, S., and Ringwood, J. V.: Decadal wave power variability form satellite altimetry in Ireland, EGU General Assembly 2026, Vienna, Austria, 3–8 May 2026, EGU26-21779, https://doi.org/10.5194/egusphere-egu26-21779, 2026.

EGU26-22824 | ECS | Posters on site | ERE2.1

Economic implications of inter-farm wake losses 

Ward Winters, Ruben Borgers, Erik Delarue, and Nicole van Lipzig

To decarbonize its power sector, the European Union plans a major expansion of wind energy in the North Sea. However, closely spaced turbines can cause wake losses, which may aggregate at the wind farm scale and extend tens of kilometres. This study examines the economic impact of inter-farm wake effects, accounting for the correlation between wind speed and electricity prices. As a case study, we assess the planned Princess Elisabeth Zone (PEZ) and its potential impact on the existing Belgian North Sea cluster. Previous work used the meso-scale climate model COSMO-CLM with the Fitch wind farm parameterization to estimate wind farm energy production for both the current and a potential future layout that includes PEZ. The difference in energy production of the existing Belgian cluster between both runs is attributed to the PEZ’s wake effect and parameterized by wind speed and direction. The energy deficit is applied to ERA5 wind velocity time series, enabling synchronous multiplication with historical electricity prices. We find that energy is lost at about the average price at which wind energy is sold. This price is below the average market price due to a negative wind speed – price correlation. Wind farm owners may thus expect about the same relative revenue loss as their energy deficit. However, different locations for the PEZ as well as higher wind penetration in the electricity market lead to different outcomes, nuancing this statement.

How to cite: Winters, W., Borgers, R., Delarue, E., and van Lipzig, N.: Economic implications of inter-farm wake losses, EGU General Assembly 2026, Vienna, Austria, 3–8 May 2026, EGU26-22824, https://doi.org/10.5194/egusphere-egu26-22824, 2026.

AS2 – Boundary Layer Processes

Representation of the exchange of heat, momentum, and moisture between the earth surface and the atmosphere in the stable atmospheric surface layer remains an intricate challenge in weather and climate modelling over mountainous regions. Mostly these representations in the weather and climate models are based on Monin–Obukhov Similarity Theory (MOST) and depend on the stability correction functions. In this study, along with default (Cheng and Brutsaert, 2005), two more nonlinear stability correction functions for momentum and sensible heat fluxes under stable atmospheric conditions suggested by Grachev et al. (2007) and Srivastava et al. (2020) are implemented in the Weather Research and Forecasting (WRFv4.3.3) Model for simulating the fair-weather condition over Uttarakhand, India. The high resolution WRF year-long simulations for each case was carried out over Uttarakhand, India. Further, the model outputs are evaluated against reanalysis data and high-frequency turbulent data collected over a year (Nov 2024 to Oct 2025) from a CSAT3 three-dimensional sonic anemometer installed at 27-meter on the tower of 30 meters in Ranichauri, Uttarakhand (30.309° N, 78.408° E) with an average altitude of 1950 meters above mean sea level. The results indicate that stability correction function suggested by Grachev et al. (2007) are outperforming the default one and the Srivastava et al. (2020) formulation. The study recommends further steps toward parameterizing surface atmosphere turbulent exchange processes under stable stratifications utilizing the stability correction function suggested by Grachev et al. (2007) for improved weather and climate model’s predictability over mountainous environments.

How to cite: Singh, S. and Srivastava, P.: Parameterization of Surface Layer Processes under Stable Conditions over Mountainous Region, EGU General Assembly 2026, Vienna, Austria, 3–8 May 2026, EGU26-801, https://doi.org/10.5194/egusphere-egu26-801, 2026.

In urban environments, wind is a key meteorological factor that strongly affects the lives of urban residents, including the dispersion of air pollutants and heat as well as thermal comfort at pedestrian level. The distribution of building heights is a major determinant of the surrounding wind field patterns. Solar radiation is also known to exert a substantial influence on the wind field through surface heating and shadow induced thermal contrasts. Therefore, as a fundamental study for urban modeling aimed at predicting urban microclimates, this work quantitatively analyzes how building height variation and radiative heat transfer affect the urban wind environment. To simulate the urban wind environment, we use the PALM large eddy simulation model under idealized urban conditions to examine differences in the wind field around buildings associated with changes in the height distribution of high rise buildings. Under conditions without the radiation module, we compare experiments with different high rise building heights to identify differences in wind distribution at pedestrian level. With the radiation module activated for the same building configurations, changes in turbulent kinetic energy driven by radiation are found. In future work, we plan to extend these findings to simulations of real urban environments. The results obtained under such idealized conditions are expected to provide a basic reference for interpreting physical processes and validating model results in simulations of complex real world urban settings.

How to cite: Lee, S.-H., Kim, J., and Yoo, J.: Analysis of wind field and turbulence characteristics according to high-rise building distribution and surface radiation conditions using PALM, EGU General Assembly 2026, Vienna, Austria, 3–8 May 2026, EGU26-2910, https://doi.org/10.5194/egusphere-egu26-2910, 2026.

EGU26-3027 | Orals | AS2.1

Experimental study in a rotating tank on the interaction between turbulent flow and obstacles 

Enrico Ferrero, Massimiliano Manfrin, Valentina Andreoli, and Sara Rubinetti

This study investigates the interaction between simplified urban-like obstacles and boundary layer flows under rotational effects through laboratory experiments in the 5-m diameter rotating water tank TURLAB at the Physics Department of the University of Turin, Italy. Idealized building arrays were used to analyze how obstacle geometry influences flow, turbulence, and momentum transfer at the urban scale. The Rossby number (Ro) was varied to explore different regimes where rotational effects compete with inertial forces. Two different buildings height were compared in order to investigate how this geometric factor influences the flow characteristics with respect to the rotations. The comparison examines flow, turbulence fields, and vertical profiles of turbulent quantities within and outside urban canyons. The results contribute to the understanding of how rotation modifies boundary layer flow interactions with urban geometries, providing experimental insights relevant for urban flow modeling and environmental applications.

How to cite: Ferrero, E., Manfrin, M., Andreoli, V., and Rubinetti, S.: Experimental study in a rotating tank on the interaction between turbulent flow and obstacles, EGU General Assembly 2026, Vienna, Austria, 3–8 May 2026, EGU26-3027, https://doi.org/10.5194/egusphere-egu26-3027, 2026.

EGU26-3474 | ECS | Posters on site | AS2.1

An Iterative Method for Estimating Turbulence Kinetic Energy Dissipation Rate Considering Random Sweeping and Sensor Low-Pass Filtering Effects   

Aleksandra Kujawska, Marta Wacławczyk, and Szymon Malinowski

This work concerns the estimation of the turbulence kinetic energy dissipation rate from time series recorded by a fixed-point sensor or from lidar data. For such estimates, it is usually assumed that the wind velocity spectrum follows Kolmogorov scaling at small scales. To convert the measured time series into space-dependent data, the Taylor frozen-eddy hypothesis is typically employed, in which the mean wind velocity is assumed to advect turbulence structures past the sensor without distortion. This assumption works well for strong winds and when the turbulence intensity (defined as the ratio of the root-mean-square of the wind velocity fluctuations to the mean wind speed) is small.

However, the Taylor hypothesis is not always fulfilled, for example in the convective regime with weak winds, or in the neutral or stable boundary layer when the wind becomes weaker but decaying turbulent motions are still present. As the turbulence intensity increases, it can no longer be assumed that turbulence structures, “frozen” in time, are simply advected past the sensor. Instead, the sweeping of small eddies by larger ones becomes an important mechanism, considerably affecting the frequency spectra. In this case, no simple relationship between frequency and wavenumber exists. In addition, the measured time series are subject to effective spectral cut-offs due to the finite sampling frequency of the sensor. This acts as a low-pass filter, which may also affect the resolved large-scale motions.

In this work, we consider an iterative method for estimating the turbulence kinetic energy dissipation rate, originally proposed by Wacławczyk et al. (Atmos. Measur. Tech., 10, 2017) and Akinlabi et al. (J. Atmos. Sci., 76, 2019), and extend it to account for the effects of random sweeping and the finite frequency of the sensor. The iterative method has several advantages over standard spectral estimates. In spectral methods (or methods based on structure functions), a fitting range in which Kolmogorov scaling holds must be defined a priori. In contrast, the iterative method requires only the calculation of the time derivative of the time series, its standard deviation, and a correcting factor that accounts for the shape of the unresolved part of the spectrum. In the proposed improved iterative method, the assumed spectral form incorporates modifications due to both random sweeping and low-pass filtering by the sensor.


How to cite: Kujawska, A., Wacławczyk, M., and Malinowski, S.: An Iterative Method for Estimating Turbulence Kinetic Energy Dissipation Rate Considering Random Sweeping and Sensor Low-Pass Filtering Effects  , EGU General Assembly 2026, Vienna, Austria, 3–8 May 2026, EGU26-3474, https://doi.org/10.5194/egusphere-egu26-3474, 2026.

EGU26-3748 | ECS | Orals | AS2.1

From Coherent Motions to Extreme Values: Decoupling Scalar Dispersion in the Roughness Sublayer 

Lior Shig, Valery Babin, Yardena Bohbot-Raviv, and Alex Liberzon

The exchange of passive scalars between complex vegetation canopies and the atmosphere is a critical process governing biosphere-atmosphere exchange, fire propagation, and pollution dispersion. However, a central modeling challenge in the Roughness Sublayer (RSL) is the failure of eddy-diffusivity (K-theory) models, which cannot account for transport against the local mean gradient. This study investigates the mechanisms of counter-gradient (CG) transport and their link to extreme scalar events using wind tunnel experiments of a passive scalar released from a localized source at the top of a two-height canopy.

Simultaneous high-resolution velocity and concentration measurements reveal distinct regions of CG flux in the RSL. Using Quadrant Analysis, we conditionally sample the turbulent scalar flux, distinguishing events based on streamwise and vertical velocity fluctuations. We focus on two primary types of coherent motion: sweeps (high-speed downward motion, u'>0, w'<0) and ejections (low-speed upward motion, u'<0, w'>0). We identify sweeps as the primary drivers of CG transport, entraining low-concentration ambient fluid downwards against the local gradient. Conversely, ejections are found to contribute mainly to down-gradient transport. To quantify the interplay between these coherent motions and the statistical distribution of the scalar, we formulate a semi-analytical closure model employing an orthogonal series expansion of the three-component joint Probability Density Function (PDF). This approach allows us to rigorously link the imbalance of sweep and ejection events to the non-Gaussian tails of the scalar PDF. We demonstrate that the breakdown of gradient diffusion is not a random error, but a deterministic consequence of these extreme, intermittent events. These results provide a mechanistic and statistical basis for improving scalar-transport models at the canopy–atmosphere interface.

How to cite: Shig, L., Babin, V., Bohbot-Raviv, Y., and Liberzon, A.: From Coherent Motions to Extreme Values: Decoupling Scalar Dispersion in the Roughness Sublayer, EGU General Assembly 2026, Vienna, Austria, 3–8 May 2026, EGU26-3748, https://doi.org/10.5194/egusphere-egu26-3748, 2026.

Over last few years we have collected tens of atmospheric gravity wave (GW) events, using a long-range scanning Doppler lidar at Cabauw atmospheric research station in the Netherlands, and our North Sea wind lidar network, in which short-range wind lidars are deployed on platforms within offshore wind farms. These events are ducted GWs that are trapped in the stable boundary layer and propagate horizontally, characterized by a near-monochromatic wave with vertical velocity amplitude up to a few m/s, a period of a few minutes, and duration of a hour or more. The origin of those GWs are non-orographic, and likely linked to fronts and convergence lines. These GWs can lead to a strong modulation of wind in the lower 100m’s of the atmosphere, and are therefore relevant for wind energy. 

Vertical velocity data from Doppler lidars, from either continuous vertical stare measurements or derived from wind profiling scans, provide a direct way to observe and characterize these GWs. We also consider other observations, including tower in-situ measurements at Cabauw, weather radars and our nationwide automatic lidar ceilometers (ALC) network. Together they provide 3D information on the GW event, with detailed information on the vertical profiles from Cabauw, and the spatial extent and evolution from the observational synoptic network.

Here we present two GW events. Firstly, we show observations of a GW event over the Netherlands and Belgium in the night and early morning of June 30, 2022 [1]. Two distinct GW trains were observed, both interpreted as ducted GW that are trapped in the lowermost 500 m of the stable nocturnal boundary layer. The GWs showed large vertical velocity amplitudes up to 3 m/s, resulting in strong modulations of wind, temperature, humidity, and pressure. Secondly, we present observations from the GW event over the North Sea and the Netherlands in the night and early morning of May 2, 2025. This event was also captured by multiple stations in our North Sea wind lidar network.

This work provides a starting point to further explore the occurrence and properties of (anomalous) boundary-layer gravity wave events in the Netherlands, including the North Sea. These comprehensive sets of observations may serve as a testbed for high resolution weather models that aim to capture these type of GW events and the effect they have on the (lower) atmosphere. The particular siting of our North Sea wind lidars, i.e., in the middle of large offshore wind farms, provides the possibility to study the effect of GWs on wind farm performance.

[1]  Knoop S, Assink J D, Leijnse H, Tijm S, de Haij M J, Bosveld F C, Theeuwes N E, Evers L G, Unal C and Laffineur Q 2025 “High-resolution observations of a mesoscale gravity wave event in the nocturnal boundary-layer over The Netherlands and Belgium”, submitted to Journal of Geophysical Research: Atmospheres, preprint on https://doi.org/10.22541/essoar.176478826.60490095/v1

How to cite: Knoop, S. and Assink, J.: Atmospheric boundary-layer gravity waves in the Netherlands: Doppler lidar observations at Cabauw atmospheric research station and North Sea wind farms, EGU General Assembly 2026, Vienna, Austria, 3–8 May 2026, EGU26-3806, https://doi.org/10.5194/egusphere-egu26-3806, 2026.

This study develops a novel implicit large-eddy simulation (ILES) model with strict energy-conserving properties, named Turpy, for high-resolution analysis of microscale turbulent structures in the atmospheric boundary layer. The model is implemented natively in Python and leverages the machine learning framework Pytorch to enable efficient GPU computation, achieving parallel scalability exceeding 90% at meter-scale spatial resolution. The numerics of Turpy is tailored towards the meter-scale turbulence simulation: first, the model adopts the energy-conserving form of the compressible Euler equations as the governing system, ensuring total energy conservation while naturally representing the conversion between internal and kinetic energy; second, the model employs a finite-volume discretization without introducing explicit scale filtering, and subgrid-scale effects are represented through the numerical dissipation generated by a Low Mach Number Approximate Riemann Solver (LMARS), eliminating the need for additional subgrid-scale turbulence parameterizations. Numerical experiments demonstrate that Turpy can reasonably reproduce the characteristic structures of wind and temperature fields in the boundary layer under different thermal stratification conditions. Furthermore, by incorporating a wind turbine model, Turpy accurately captures the spatial structure and evolution of wind turbine wakes, highlighting its strong capability and application potential in boundary-layer turbulence research and wind energy applications.

How to cite: Zhang, W. and Chen, X.: Turpy: A GPU-Native implicit LES Model for Meter-Scale Boundary Layer Turbulence Based on Energy-Conserving LMARS Dynamics, EGU General Assembly 2026, Vienna, Austria, 3–8 May 2026, EGU26-4621, https://doi.org/10.5194/egusphere-egu26-4621, 2026.

EGU26-5495 | ECS | Orals | AS2.1

High-resolution simulation of the evening transition in the atmospheric boundary layer with the spectral element method 

Linnea Huusko, Lorenzo Luca Donati, Timofey Mukha, Peter Sullivan, Philipp Schlatter, and Gunilla Svensson

Numerical simulation of the diurnal cycle in the atmospheric boundary layer is challenging due to the large range of scales present in the turbulent flow. The daytime boundary layer requires a large domain to capture the largest turbulent structures, while the small, stratified structures in the nighttime boundary layer require a high resolution. High-resolution simulation of the full diurnal cycle therefore requires efficient use of computational resources. We are using a newly developed large eddy simulation framework based on the highly parallelizable spectral element method to effectively leverage the currently available resources for this type of demanding simulations. The spectral element method makes it possible to run very large simulations on large compute clusters, and it is highly suitable for use on GPUs. As a first step toward simulation of the full diurnal cycle, we will present results from a large eddy simulation of the evening transition and growth of the stable layer into a layer of residual turbulence. The simulation is based on observations from the CASES99 field campaign. This high-resolution simulation of the evening transition will allow us to study coherent structures that form during the transition phase and have previously not been captured in detail. The data may also provide a better understanding of the role that entrainment may play in the growth of the stable nighttime boundary layer.

How to cite: Huusko, L., Donati, L. L., Mukha, T., Sullivan, P., Schlatter, P., and Svensson, G.: High-resolution simulation of the evening transition in the atmospheric boundary layer with the spectral element method, EGU General Assembly 2026, Vienna, Austria, 3–8 May 2026, EGU26-5495, https://doi.org/10.5194/egusphere-egu26-5495, 2026.

EGU26-5570 | Orals | AS2.1

One-dimensional turbulence model for dry atmospheric boundary layer flows 

Hanchen Li, Marten Klein, and Heiko Schmidt

One-dimensional turbulence (ODT) offers an alternative single-column solver for wall-bounded turbulence that sits between traditional 1D boundary-layer parametrisations and fully 3D direct numerical simulation: in fully resolved mode, molecular transport is explicitly resolved along a 1D vertical domain, while turbulent advection is represented by instantaneous spatial mappings ("eddy events"). For high-Reynolds-number, wall-bounded flows relevant to the atmospheric boundary layer (ABL), resolving Kolmogorov scales is prohibitively expensive. This motivates careful implementation of wall models and subgrid scale models in ODT similar to large eddy simulations (LES).

Here, we develop an ODT formulation operated in an LES-like mode, in which unresolved eddy events are represented by a Smagorinsky–Lilly subgrid-scale (SGS) model, and surface coupling is provided through standard surface parametrisations for an extended range of resolved scales. We assess the formulation on two benchmark problems: (i) canonical smooth turbulent channel flow, using an algebraic wall model to supply surface stress consistent with resolved inertial-sublayer dynamics; and (ii) the GABLS1 intercomparison case (a weakly stable, shear-driven ABL with prescribed surface cooling rate), using Monin-Obukhov similarity theory to compute surface momentum and heat fluxes.

Together, these two cases demonstrate the feasibility of combining ODT's eddy-event transport with LES-style SGS and surface models, thus providing a computationally efficient platform for future studies of ABL regimes, in which turbulence, surface fluxes, entrainment across sharp inversions, and multi-phase physics interact and remain challenging for coarse-resolution weather and climate models.

How to cite: Li, H., Klein, M., and Schmidt, H.: One-dimensional turbulence model for dry atmospheric boundary layer flows, EGU General Assembly 2026, Vienna, Austria, 3–8 May 2026, EGU26-5570, https://doi.org/10.5194/egusphere-egu26-5570, 2026.

EGU26-5867 | Orals | AS2.1

METEX21: Multiscale observations and simulations of plume behavior across the turbulence gray-zone in mountain-valley terrain   

Sonia Wharton, David Wiersema, Rob Newsom, Walter Schalk, and Darielle Dexheimer

Multiscale numerical weather prediction models transition from mesoscale (Δ ≳ 1 km), where turbulence is fully parameterized, to microscale (Δ ≲ 100 m), where the majority of highly energetic scales of turbulence are resolved. This region, called the turbulence gray-zone, was intensively studied during a tracer release experiment called METEX21 in the mountainous U.S. southwest. Terrain-atmosphere interactions that influence local-scale or gray-zone (100’s m to < 5 km) plume transport and dispersion under varying atmospheric forcing conditions were of special interest. Plumes were generated using a smoke tracer released at various sites along horizontal and vertical transects. A full suite of meteorological instruments was deployed in the domain to gather wind, turbulence, thermodynamic and plume observations in the lower boundary layer. Three multiscale simulations which vary by the parameterization used for turbulence and mixing within the gray-zone were evaluated against the 9-days of field data. Here, we highlight significant plume behavior differences on synoptically-forced and locally-forced days and show evidence of how katabatic, anabatic, and mountain-valley diel wind reversals strongly influence plume behavior over the local-scale. We demonstrate that microscale predictions of transport and dispersion can be significantly influenced by the choice of turbulence and mixing parameterization in the terra incognita, particularly over regions of complex terrain and with strong local forcing. Lastly, we highlight the effectiveness of scanning lidars to measure 2-dimensional plume transport out to a 2–3 km distance; much farther than could be visibly observed. We hope that these results motivate future field campaigns involving controlled tracer releases and corresponding modeling studies of the turbulence gray-zone.


How to cite: Wharton, S., Wiersema, D., Newsom, R., Schalk, W., and Dexheimer, D.: METEX21: Multiscale observations and simulations of plume behavior across the turbulence gray-zone in mountain-valley terrain  , EGU General Assembly 2026, Vienna, Austria, 3–8 May 2026, EGU26-5867, https://doi.org/10.5194/egusphere-egu26-5867, 2026.

EGU26-6086 | ECS | Orals | AS2.1

Scaled outdoor validation of the water body model and numerical studies on their impact on urban blocks 

Yujie Zhao, Guanwen Chen, Han Yan, and Jian Hang

Water bodies, whether natural or artificial, are prevalent features in urban landscapes. Studies have shown that they are among the effective strategies for mitigating the urban heat island (UHI) effect. However, research on the interaction between water bodies and buildings, particularly those incorporating the impact of solar radiation and evaporation, remains limited. This study validates a numerical model that accounts for solar radiation and evaporation through a scaled outdoor experiment. The experiment was conducted in Xingtai City, Hebei Province (37°17′N, 114°32′E) over 28 days in the autumn of 2024. Wind temperature, humidity, and radiation at various heights were monitored in the 2D street canyon, both with and without water coverage, with evaporation rates innovatively monitored using a weighing method. Meanwhile, CFD simulations based on this model investigate how solar incidence time and water body size influence surrounding airflows, air temperature, and thermal comfort in an idealized urban block. The numerical simulations considered five water surface areas, ranging from 0% to 900% of the central position in a 7×7 idealized building cluster, along with three solar elevation angles (0° and ±45°). The goal is to provide insights into the maintenance and design of water bodies in urban development.

How to cite: Zhao, Y., Chen, G., Yan, H., and Hang, J.: Scaled outdoor validation of the water body model and numerical studies on their impact on urban blocks, EGU General Assembly 2026, Vienna, Austria, 3–8 May 2026, EGU26-6086, https://doi.org/10.5194/egusphere-egu26-6086, 2026.

The complex structure of the urban canopy and the high spatial heterogeneity of emission sources significantly influence the turbulent dispersion, mixing, and chemical reactions of atmospheric pollutants. However, due to the limitation of model resolutions and insufficient understanding of these processes, current mesoscale atmospheric chemical models struggle to accurately represent these interactions, contributing to major uncertainties in urban air quality simulations. To address this issue, this study employs high-resolution computational fluid dynamics (CFD) simulations with explicitly resolved buildings and large-eddy simulations (LES) coupled with an urban canopy model to systematically investigate the synergistic effects of spatial heterogeneity in building morphology and emission distributions on pollutant turbulent dispersion and chemical reactions. The research will quantify the impact of subgrid-scale heterogeneity on effective chemical reaction rates and develop parameterization schemes for subgrid-scale pollutant turbulent diffusion coefficients and effective chemical reaction rates, designed for mesoscale models.

How to cite: Wang, Y.: Impact of subgrid-scale spatial heterogeneity in the urban canopy on pollutant turbulent dispersion and chemical reactions, EGU General Assembly 2026, Vienna, Austria, 3–8 May 2026, EGU26-6260, https://doi.org/10.5194/egusphere-egu26-6260, 2026.

EGU26-6554 | ECS | Posters on site | AS2.1

Urban Fog Microphysics and Visibility Parameterization Based on Winter 2025–2026 In Situ Measurements in Bucharest 

Alex Vlad, Bogdan Antonescu, Gabriela Iorga, and Nicolae Sorin Vâjâiac

Fog is a type of cloud that forms in direct contact with the Earth’s surface. It is composed of extremely small water droplets or ice particles suspended in the air, similar to those found in clouds. For atmospheric conditions to be classified as fog, horizontal visibility must be reduced to less than 1 kilometer due to the presence of these fine particles, which scatter and absorb light and significantly limit what can be seen near the ground. Fog also plays an important role in the Earth system because it influences the surface radiation budget, in daytime causing cooling and in nighttime causing warming. Fog is a significant phenomenon that impacts the safety of terrestrial, maritime, and especially aviation transportation.

This study investigates variations in fog microphysics and the correlations with horizontal visibility. The analysis is performed on datasets gathered during in situ continuous measurements conducted in wintertime 2025-2026 in Bucharest using the Fog Monitor FM-120 from Droplet Envea Group. A weather station from Luft (WS600-UMB) monitored meteorological parameters: temperature, pressure, humidity, wind direction and wind speed.

The measurements were taken at the National Institute for Aerospace Research (INCAS) in Bucharest (coordinates: 44.4672° N, 26.0814° E), that is located in a Bucharest area with high traffic likely providing plenty of condensation nuclei. We present very recent observational evidence on the fog droplet signature in real time, linking temporal droplet size distribution changes and visibility evolution. We focused on assessing the microphysical parameters of fog, including number concentration (N), effective diameter (ED), liquid water content (LWC), and mean volume diameter (MVD), across a dimensional spectrum from 2 to 50 µm. The observational datasets were then used to test some visibility parameterizations, with the goal of determining a specific parameterization, linking visibility to the fog microphysics, best suited for the Bucharest area.

The results add to the past studies aiming to contribute to a better understanding of fog characteristics and visibility parameterization using regional characteristics, ultimately aiding in improving safety measures in various transport sectors.

How to cite: Vlad, A., Antonescu, B., Iorga, G., and Vâjâiac, N. S.: Urban Fog Microphysics and Visibility Parameterization Based on Winter 2025–2026 In Situ Measurements in Bucharest, EGU General Assembly 2026, Vienna, Austria, 3–8 May 2026, EGU26-6554, https://doi.org/10.5194/egusphere-egu26-6554, 2026.

The atmospheric boundary layer height (ABLH) is a key parameter for understanding turbulent exchange processes, air‑quality dynamics, and land–atmosphere interactions. Radiosonde profiles are traditionally used as a reference for determining the ABLH, but their sparse temporal coverage limits their value for continuous monitoring. Ground‑based remote‑sensing instruments, such as ceilometers and Doppler lidars, offer high‑frequency observations throughout the day, but the derivation of the ABLH from these systems depends strongly on the chosen retrieval method. In this study, we evaluate multiple commonly used algorithms for ABLH estimation, like gradient-based and variance-based methods using a threshold, all applied to co‑located ceilometer and Doppler lidar measurements. The resulting ABLH estimates are systematically compared against radiosonde-derived heights to assess performance under varying meteorological conditions.

Our analysis reveals substantial discrepancies between methods, both within and across instrument types. Ceilometer-based retrievals tend to diverge most strongly during conditions with weak aerosol gradients, at night and during the afternoon transition, while Doppler lidar methods show larger spread during periods with low signal due to weak winds. No single method consistently reproduces radiosonde-derived heights across all stability regimes. Instead, each approach captures different structural aspects of the boundary layer, suggesting that the ABLH is not a single, easily definable quantity, but rather a multifaceted feature of the lower atmosphere.

These findings raise an important question for the boundary layer community: Is the derivation of a robust ABLH from ground-based remote sensing fundamentally limited by the information content of individual instruments and methods, and do we ultimately require a synergistic, multi-sensor, multi-method product to obtain a physically meaningful estimate? This contribution will explore these challenges in detail and discuss pathways towards an integrated ABLH retrieval framework.

How to cite: Baumgarten, K., Päschke, E., and Beyrich, F.: Evaluating the atmospheric boundary layer height from ceilometer and Doppler lidar: Divergent retrievals across methods and the question of what they truly represent, EGU General Assembly 2026, Vienna, Austria, 3–8 May 2026, EGU26-6622, https://doi.org/10.5194/egusphere-egu26-6622, 2026.

Regional numerical weather prediction models are increasingly run at sub-kilometer scale horizontal resolutions, approaching the turbulent gray zone where turbulence can no longer be considered as an entirely subgrid-scale process. This requires scale-adaptive parameterizations that respond consistently to changing resolution, reducing the parameterized contribution as more of the turbulent transport is explicitly represented by the model dynamics.

The ICOsahedral Nonhydrostatic (ICON) model used for operational weather forecasting at the German Weather Service (DWD) uses the TURBDIFF turbulence parameterization, which includes some scale adaptive features. In order to assess the performance of the scheme for horizontal mesh sizes ranging from 2.1km to 78m, we present an evaluation method based on Doppler lidar retrievals of winds and turbulent properties, including the turbulent kinetic energy (TKE), eddy diffusivity rate (EDR) and turbulent length scale within the lowest 600m of the atmospheric boundary layer. We use observations from the Lindenberg observatory over a five-day period in June 2023 with typical daytime convective boundary layers, and stable conditions with low level jets observed at night.

To facilitate a fair comparison, grid-scale and parameterized, subgrid-scale contributions to the simulated TKE are considered consistent with the spatio-temporal scales of the Doppler lidar scan configuration.

Results show that predicted winds remain very similar across all resolutions, while subtle differences are evident in TKE and EDR. This suggests the scale-adaptive features of TURBDIFF turbulence scheme work reasonably well and result in similar validity of the turbulent properties across all scales, though the uncertainties in the simulated turbulence properties vary with time of day. While it is gratifying that the scheme shows no deteriorating performance at higher resolutions, it is somewhat disappointing that we do not see a clear benefit of the increased resolution reflected in the predicted winds either. This may point towards potential limitations in how the turbulence scheme interacts with the resolved dynamics. In addition, systematic errors in the stable night-time boundary layer are evident in all simulations, which coincide with poor representations of the turbulent length scale compared to observations.

Thus we demonstrate the usefulness of the Doppler lidar retrieval as an evaluation tool and highlight specific aspects of the scheme that limit performance for stable night-time conditions.

How to cite: Ahlgrimm, M. and Päschke, E.: Turbulence evaluation of the ICON model at sub-kilometer scales using Doppler lidar observations, EGU General Assembly 2026, Vienna, Austria, 3–8 May 2026, EGU26-6774, https://doi.org/10.5194/egusphere-egu26-6774, 2026.

EGU26-6798 | ECS | Posters on site | AS2.1

Scale‑Aware Anisotropy in Very Stable Boundary Layers: Insights from Ultra‑High‑Resolution LES 

Maja-Sophie Wedel and Ivana Stiperski

Very stable boundary layers (SBLs) exhibit weak, intermittent turbulence with strongly suppressed vertical motions. In these conditions  turbulence is highly anisotropic and varies strongly in space and time. As a result, common scaling approaches and turbulence closures that assume near‑isotropy or rely only on bulk fluxes (e.g., MOST) often fail to represent momentum and scalar transport in very stable regimes. Moreover, many Large Eddy Simulation setups and subgrid models tend to produce overly isotropic small‑scale motions, masking the true scale dependence of anisotropy.

We analyze high-resolution Large Eddy Simulation data from the psNCAR LES code simulating the GABLS1 and modified GABLES 3 case, that correspond to canonical high-Reynolds-number stably stratified boundary layers driven by constant geostrophic winds over a horizontally homogeneous surface, and two different surface cooling rates corresponding to weakly and strongly stratified turbulence. The domain size is 400 m × 400 m × 400 m with a fine grid resolution of approximately 20 cm, enabling detailed capture of turbulent structures. This spatial resolution enables us to determine the scales at which turbulence remains anisotropic, minimizing the influence of subgrid‑scale parameterizations.

We compute anisotropy from the Reynolds stress tensor and use multiresolution decompositions to examine how stratification influences the change of anisotropy with scale. These scale‑aware results are then used to compare this scalewise return to isotropy to the trajectories found in literature (Stiperski et al. 2021) and the predictions of pressure-strain interactions for SBL (Yi et al. 2025), as well as to asses the anisotropy‑aware MOST formulation at different SBL length scales.


How to cite: Wedel, M.-S. and Stiperski, I.: Scale‑Aware Anisotropy in Very Stable Boundary Layers: Insights from Ultra‑High‑Resolution LES, EGU General Assembly 2026, Vienna, Austria, 3–8 May 2026, EGU26-6798, https://doi.org/10.5194/egusphere-egu26-6798, 2026.

EGU26-6844 | Orals | AS2.1

Implementation and evaluation of a prognostic TKE turbulence scheme in the ECMWF IFS 

Ivan Bastak Duran, Richard Forbes, and Peter Bechtold

The ECMWF Integrated Forecasting System (IFS) currently relies on a first-order turbulence closure that is robust at coarse resolution but increasingly limits the representation of atmospheric boundary-layer processes as model resolution increases. To better capture turbulence–surface–cloud interactions, a prognostic turbulence kinetic energy (TKE) scheme has been implemented in the IFS, providing a higher-order closure while maintaining numerical stability and affordable computational cost. By prognosing TKE, the scheme introduces memory of turbulence intensity in space and time, enabling a more physically consistent evolution of mixing and boundary-layer structure.

The formulation builds on the TKE scheme used in the global ARPEGE model and has been adapted for application in the IFS across a wide range of flow regimes. Developments include an extended turbulence length-scale formulation, revised stability functions, the inclusion of prognostic cloud fraction in stability diagnostics, partial equilibrium assumptions for selected source terms, explicit advection of TKE, and improved identification and treatment of stratocumulus regimes.

The impact of the scheme is assessed using high-resolution global simulations at 4.4 km horizontal resolution. Results demonstrate clear improvements in near-surface temperature over complex terrain, with particularly strong performance over mountainous regions, and a general improvement in 10 m wind speed. Upper-air forecast scores remain largely neutral. Further impacts on boundary-layer structure, low-level clouds, and nocturnal jets will be described.

How to cite: Bastak Duran, I., Forbes, R., and Bechtold, P.: Implementation and evaluation of a prognostic TKE turbulence scheme in the ECMWF IFS, EGU General Assembly 2026, Vienna, Austria, 3–8 May 2026, EGU26-6844, https://doi.org/10.5194/egusphere-egu26-6844, 2026.

EGU26-6866 | ECS | Posters on site | AS2.1

Nocturnal Valley Winds in the Aure Valley (France): Analysis of Case Studies using Radiosoundings and High-Resolution WRF simulations 

Pablo Ortiz-Corral, Juan Carbone, Carlos Román-Cascón, Jielun Sun, Fabienne Lohou, Marie Lothon, Mariano Sastre, Juan Alberto Jiménez Rincón, and Carlos Yagüe

Nocturnal valley winds (NVWs) strongly modulate atmospheric stability, turbulence, and scalar transport in complex terrain. However,  their sensitivity to synoptic forcing and their representation in numerical models remain uncertain and extremely site dependent. 

In this work, we analyse an 11-month observational dataset, including several stations deployed at distinct, pre-selected locations along the Aure valley (near central French Pyrenees). These data provide complementary surface wind, radiation and turbulence observations. The valley is oriented north–south , opened to the north onto the Lannemezan Plateau, and its regional synoptic climatology is mainly dominated by westerlies (largely perpendicular to the valley axis).

From the observations, representative NVW cases are selected using a detection algorithm based on local and synoptic filters applied at each station, allowing the selection of events under contrasting large-scale conditions. NVWs are found even under moderate synoptic forcing (700 hPa winds higher than 12 m s⁻¹), consistent with the role of orographic shielding. Particular attention is given to moderate westerly situations (perpendicular to the valley main axis) in which the synoptic flow and the NVW coexist, enabling detailed analysis of their interaction in both wind speed and direction. For each selected case, night-time radiosoundings provide information on low-level jet height, inversion depth, and atmospheric stability, while high-resolution WRF simulations are analysed in detail to study the occurrence, phase, jet structure, and along-valley heterogeneity. 

The combined observational–modeling approach highlights the ability of NVWs to persist even under non-negligible synoptic forcing and provides insight into their vertical structure and spatial variability in complex terrain.

How to cite: Ortiz-Corral, P., Carbone, J., Román-Cascón, C., Sun, J., Lohou, F., Lothon, M., Sastre, M., Jiménez Rincón, J. A., and Yagüe, C.: Nocturnal Valley Winds in the Aure Valley (France): Analysis of Case Studies using Radiosoundings and High-Resolution WRF simulations, EGU General Assembly 2026, Vienna, Austria, 3–8 May 2026, EGU26-6866, https://doi.org/10.5194/egusphere-egu26-6866, 2026.

EGU26-7187 | ECS | Posters on site | AS2.1

Interannual Variability of Wintertime Fog over a Rapidly Urbanising City in the Indo-Gangetic Plains 

Deevi Prathima and Achanta Naga Venkata Satyanarayana

Wintertime fog over the Indo-Gangetic Plains (IGP) exhibits large variability in frequency, duration, and intensity, with significant implications for transportation, air quality, and human health. This study examines the interannual variability of fog hours, fog days, duration, and intensity over Lucknow (26.85° N, 80.95° E), a rapidly urbanizing city in the central IGP, using half-hourly METAR visibility observations and associated meteorological parameters during 2016–2023. Rapid urban expansion and increasing anthropogenic emissions in Lucknow have the potential to modify near-surface thermodynamic conditions, moisture availability, and boundary-layer stability, thereby influencing fog formation and persistence.

The results show that January experiences the highest occurrence in fog hours and days, followed by December and February. Fog hours and fog days increased until 2017, after which fog hours declined by approximately 19%, while fog days increased by about 12% up to 2023. Analysis of the data reveals an increase in shallow and moderate fog events, whereas dense and very dense fog hours exhibit a significant decreasing trend. In contrast, fog days show an increasing tendency across most intensity categories, except for moderate fog days. The results reveal a significant increasing trend in shallow and moderate intensity, whereas a significant decreasing trend in dense and very dense fog hour events, and a similar increasing trend has been noticed in fog intensity days, except in moderate intensity. The study reveals that there is a significant decline in persistence and intensity of fog amidst rising event frequency. These findings indicate a transition toward more frequent but shorter-duration and less intense fog events, suggesting a weakening of long-duration fog persistence and severity over the study period, likely linked to evolving urban and boundary-layer processes in the IGP.

Keywords: Winter fog, Interannual variability, METAR Visibility, Urbanisation

How to cite: Prathima, D. and Satyanarayana, A. N. V.: Interannual Variability of Wintertime Fog over a Rapidly Urbanising City in the Indo-Gangetic Plains, EGU General Assembly 2026, Vienna, Austria, 3–8 May 2026, EGU26-7187, https://doi.org/10.5194/egusphere-egu26-7187, 2026.

EGU26-7313 | Orals | AS2.1

Correction of motion-induced and intrinsic averaging errors in turbulence measurements by floating Doppler wind lidars 

Andreu Salcedo-Bosch, Francesc Rocadenbosch, Jakob Mann, Alfredo Peña, and Simone Lolli

Offshore wind energy has grown rapidly in recent decades due to the stronger and more uniform winds available at sea, but despite significant cost reductions it remains one of the most expensive renewable energy sources, prompting the industry to prioritize cost-effective wind resource assessment [1]. Floating Doppler Wind Lidars (FDWLs) have become the standard tool for this purpose, as they can measure 10-minute mean horizontal wind speed and wind direction with high accuracy compared to reference anemometers. However, FDWLs face challenges in accurately measuring wind turbulence, a critical parameter for turbine design and control, because of two opposing error sources: on one hand, the spatial and temporal averaging inherent to lidar measurements, which underestimates turbulence, and, on the other hand, wave-induced platform motion, which introduces apparent turbulence and leads to overestimation [2].

Recently, Salcedo-Bosch et al. [3] presented a novel methodology to compensate for both sources of FDWL turbulence measurement error using measurement simulations over Mann-model-generated three-dimensional turbulence boxes. The methodology simulates measurements from a FDWL and an ideal sonic anemometer over turbulent wind fields generated to match the experienced atmospheric state by selecting appropriate Mann model parameters [4]: turbulence length scale (LMM), eddy lifetime parameter (Γ), and turbulent energy dissipation rate (ae^2/3) [3]. By comparing the turbulence estimates from the two instruments, a correction scaling factor R is derived and used to compensate FDWL measurement errors.

In this work, we assess the FDWL turbulence compensation method over a three-month period using data from the IJmuiden campaign in the North Sea, where a FDWL was deployed alongside a meteorological mast equipped with anemometers at multiple heights serving as reference measurements. The results show that the compensation method effectively corrects the error sources at all measurement heights (25 m, 56 m, and 87 m a.s.l.), with FDWL turbulence measurements closely matching those of the anemometers, achieving R² > 0.85, RMSE < 0.13 m/s (a 30% improvement), and mean bias < 0.02 m/s (an 80% improvement) compared to uncorrected measurements.

REFERENCES

[1]  M. Taylor, P. Ralon, and S. Al-Zoghoul, “Renewable power generation costs in 2021,” Int. Renew. Energy Agency IRENA, Abu Dhabi, UAE, Tech. Rep., 2022.

[2] A. Peña, G. G. Yankova, and V. Mallini, “On the lidar-turbulence paradox and possible countermeasures,” Wind Energy Science, vol. 10, no. 1, pp. 83–102, 2025.

[3] Salcedo, A.; Rocadenbosch, F.; Peña, A.; Mann, J.; Lolli, S. “Understanding the impact of turbulence on floating lidar measurements.” IEEE transactions on geoscience and remote sensing, 2025, vol. 63, article 5704014.

[4] Jakob Mann, “Wind field simulation,” Probabilistic Engineering Mechanics, vol. 13, no. 4, pp. 269–282, 1998.

ACKNOWLEDGEMENTS

This research is part of the project PID2024-155592OB-C21, funded by MInisterio de Ciencia, Innovación y Universidades (MICIU)/Agencia Estatal de Investigación (AEI)/10.13039/501100011033 and ERDF/EU

How to cite: Salcedo-Bosch, A., Rocadenbosch, F., Mann, J., Peña, A., and Lolli, S.: Correction of motion-induced and intrinsic averaging errors in turbulence measurements by floating Doppler wind lidars, EGU General Assembly 2026, Vienna, Austria, 3–8 May 2026, EGU26-7313, https://doi.org/10.5194/egusphere-egu26-7313, 2026.

EGU26-7513 | ECS | Posters on site | AS2.1

Investigating nuclear events and vector borne disease risk through atmospheric dispersion modelling with HYSPLIT 

Samuel McKeague, Klara Finkele, and Saji Varghese

As a part of the Agricultural Meteorology research unit at Met Éireann, atmospheric dispersion modelling (ADM) is used to investigate and provide forecast for emergency and risk awareness networks. ADM is performed computationally to create mathematical simulations of the transport and dispersion of particles in the atmosphere. At present, Met Éireann uses the HYSPLIT  program in order to calculate and model the trajectory and concentrations of airborne pollutants. HYSPLIT allows for a high degree of customization of the pollutant source terms, which enables dispersion modelling estimations of emission from both man-made and natural sources of interest, including but not limited to nuclear release, smoke, small insects and pollen. This can be used to predict future concentrations, depositions and arrival times of particles under specific scenarios.

Met Éireann currently acts in support of the EPA for nuclear dispersion modelling, in the event of an emergency. We provide daily meteorological forecast data to the EPA and, as a part of the Response and Assistance Network (RANET), can provide additional modelling during an event if requested. We participated with the EPA during the ConvEx-3 exercise in 2025, simulating a nuclear emergency in Romania, to test our communication and dispersion modelling capabilities. Our communications during the event were responsive and modelling results across multiple programs agreed. The experience of the exercise will be used in the development of ensemble dispersion modelling pipelines for future events.

Met Éireann also runs an operational daily forecast of Bluetongue virus, which is based on dispersion modelling the possible transport of the insect that act as the vector. This is provided to relevant agricultural stakeholders, particularly in close collaboration with UCD and DAFM. As climate change continues, a range of pests and possible disease vectors that were either previously unknown to Ireland or inactive at certain times of the year could potentially harm native species of plants & animals. This may necessitate further research and expansion of the current dispersion work on forecasting possible pest or disease vector risks.

How to cite: McKeague, S., Finkele, K., and Varghese, S.: Investigating nuclear events and vector borne disease risk through atmospheric dispersion modelling with HYSPLIT, EGU General Assembly 2026, Vienna, Austria, 3–8 May 2026, EGU26-7513, https://doi.org/10.5194/egusphere-egu26-7513, 2026.

EGU26-7558 | Orals | AS2.1

Trade Cumulus Dynamics in a Lagrangian view, revealing hidden order    

Ilan Koren, Orit Altaratz, Yael Arieli, and Bar Moisa

Non-precipitating marine trade cumulus (TrCu) fields often appear sparse and disorganized, suggesting weak cloud–cloud interaction and localized plume-triggered formation. But is it really the case?

Unlike stratocumulus decks, for which clouds continuously trace boundary-layer circulation, TrCu clouds are intermittent and short-lived, so instantaneous cloud snapshots undersample the underlying dynamics. Using large-eddy simulations, we show that when cloud core locations are corrected for advection in a Lagrangian frame and accumulated over several hours, a persistent cellular convective “machinery” emerges beneath the apparent disorder. These steady convective cells are long-lived and form the dynamical backbone of the cloud field. Cloud formation repeatedly initiates along their updraft walls, so the recovered cellular pattern predicts where clouds recur despite strong intermittency aloft. This reframes sparse trade cumulus as a deterministic organization imposed from below and provides a physically grounded route toward organization-aware parameterizations.

How to cite: Koren, I., Altaratz, O., Arieli, Y., and Moisa, B.: Trade Cumulus Dynamics in a Lagrangian view, revealing hidden order   , EGU General Assembly 2026, Vienna, Austria, 3–8 May 2026, EGU26-7558, https://doi.org/10.5194/egusphere-egu26-7558, 2026.

EGU26-8127 | ECS | Orals | AS2.1

Turbulence-Based Method for Determining Boundary Layer Heights from In-situ Airborne Profiles during ASIA-AQ 

Jason Miech, Joshua DiGangi, Glenn Diskin, Yonghoon Choi, Richard Moore, Luke Ziemba, Francesca Gallo, Carolyn Jordan, Michael Shook, Elizabeth Wiggins, Edward Winstead, Sayantee Roy, Charles Gatebe, Jonathan Dean-Day, Johnathan Hair, Taylor Shingler, Anthony Cook, Marta Fenn, Richard Ferrare, and David Harper and the ASIA-AQ Science Team

The planetary boundary layer confines moisture, turbulence, and locally emitted air pollutants, thus accurately discerning the height of this layer is important for constraining pollutant transport and distribution and improved regional weather and climate forecasting. Traditional methods of boundary layer height (BLH) determination rely on radiosonde measurements of potential temperature profiles. However, these sounding measurements lack the instrumentation needed to characterize the chemical composition of the boundary layer that can be provided by larger airborne platforms. In 2024, the NASA DC-8 flew over the Philippines, South Korea, Taiwan, and Thailand during the Airborne and Satellite Investigation of Asian Air Quality (ASIA-AQ) campaign. Measurements during this campaign included an extensive array of gas, particulate, and meteorological measurements. We will present results of a turbulence-based method using 3D winds to determine the boundary layer height across DC-8 vertical flight profiles, including missed approaches at urban airports. The results from this method were used to develop a boundary layer flag for the campaign, and the computed DC-8 BLHs were compared to mixed layer heights determined by an airborne-based LIDAR system.

How to cite: Miech, J., DiGangi, J., Diskin, G., Choi, Y., Moore, R., Ziemba, L., Gallo, F., Jordan, C., Shook, M., Wiggins, E., Winstead, E., Roy, S., Gatebe, C., Dean-Day, J., Hair, J., Shingler, T., Cook, A., Fenn, M., Ferrare, R., and Harper, D. and the ASIA-AQ Science Team: Turbulence-Based Method for Determining Boundary Layer Heights from In-situ Airborne Profiles during ASIA-AQ, EGU General Assembly 2026, Vienna, Austria, 3–8 May 2026, EGU26-8127, https://doi.org/10.5194/egusphere-egu26-8127, 2026.

EGU26-8642 | Posters on site | AS2.1

Boundary-Layer Wind and Turbulence Retrieval from Doppler Wind Lidar for UAM Applications  

Byung Hyuk Kwon, Anseok Yu, and Yeonung Jung

Doppler wind lidar has recently seen rapidly increasing utilization as an observational instrument capable of continuously retrieving high-resolution vertical profiles of wind. However, the accuracy of the retrieved wind vectors can vary depending on the scanning strategy and data processing configurations. In this study, algebraic algorithms for retrieving wind vectors from line-of-sight velocities observed by a vertically profiling lidar are presented. The performance of each algorithm is evaluated through comparisons with wind vectors derived from GPS-tracked radiosonde observations. In addition, the utility of wind lidar observations is verified by comparison with wind profiler measurements for cases characterized by pronounced local variability.

Differences in wind speed depending on the selected azimuth angles within a single scan cycle violate the assumption of a homogeneous wind field required for height-resolved wind vector retrieval. From another perspective, this suggests the presence of atmospheric turbulence that disrupts the homogeneity of the flow. Using u, v, and w wind components retrieved at approximately 2.3-s intervals, turbulence intensity, momentum flux, and turbulent kinetic energy are estimated and compared with results obtained from a 20-Hz three-dimensional ultrasonic anemometers installed on a 300-m meteorological tower using the eddy correlation method. The two sets of results show very good agreement.

These findings demonstrate that Doppler wind lidar can effectively capture the vertical structure of the atmospheric boundary layer and provide critical hazardous-weather information essential for urban air mobility (UAM) operations. Furthermore, the results highlight the need to reconsider quality control procedures for spectral data, as enforced symmetry checks and corrections may remove genuine turbulent components. Further systematic investigation is required to better understand the impacts of spectral quality control procedures on both the representation and retrieval of atmospheric turbulence.


How to cite: Kwon, B. H., Yu, A., and Jung, Y.: Boundary-Layer Wind and Turbulence Retrieval from Doppler Wind Lidar for UAM Applications , EGU General Assembly 2026, Vienna, Austria, 3–8 May 2026, EGU26-8642, https://doi.org/10.5194/egusphere-egu26-8642, 2026.

EGU26-8896 | ECS | Posters on site | AS2.1

Establishing High-Resolution Meteorological Monitoring for Safe Urban Air Mobility Operations 

Yongmi Park, Subin Han, Seongmin Seo, Jihoon Shin, Jae-Jin Kim, and Wonsik Choi

Urban Air Mobility (UAM) is emerging as a next-generation transportation system that not only alleviates traffic congestion in high-density urban areas but also supports emergency medical response, time-critical logistics and supply delivery, and urban and regional tourism. UAM vehicles operate at low altitudes within the atmospheric boundary layer, where airflow and turbulence are strongly modified by topography, buildings, and other urban structures. In such environments, localized meteorological phenomena, such as gusts, vertical wind shear, and turbulence, frequently develop and pose significant challenges to flight stability and operational safety.

Conventional meteorological observation networks and mesoscale numerical weather prediction models lack the spatial and temporal resolution required to resolve these microscale urban flow features. Consequently, short-term forecasting of boundary-layer winds and turbulence in complex urban environments remains highly uncertain. To support safe UAM operations, a new observation framework providing high-resolution, three-dimensional meteorological information is needed. High-frequency, multi-point surface and remote-sensing observations can capture spatiotemporal variability of meteorological conditions and provide essential inputs for data assimilation in numerical prediction models as well as for training and constraining artificial-intelligence-based forecast systems designed to generate high-fidelity, short-term meteorological fields for UAM operations.

We propose a multi-point meteorological observation network designed to characterize wind and turbulence fields within UAM corridors. The network is configured to resolve the spatiotemporal variability of winds and turbulence in the boundary layer with high fidelity. The resulting dataset can enhance the understanding of urban low-altitude meteorology and provide a foundational dataset for high-resolution forecasting and operational decision-support for safe and efficient UAM operations.


This work was funded by the Korea Meteorological Administration Research and Development Program under Grant (RS-2024-00404042).

How to cite: Park, Y., Han, S., Seo, S., Shin, J., Kim, J.-J., and Choi, W.: Establishing High-Resolution Meteorological Monitoring for Safe Urban Air Mobility Operations, EGU General Assembly 2026, Vienna, Austria, 3–8 May 2026, EGU26-8896, https://doi.org/10.5194/egusphere-egu26-8896, 2026.

EGU26-9274 | ECS | Posters on site | AS2.1

Parameter estimation for the YSU boundary-layer turbulence scheme 

Magdalena Fritz, Stefano Serafin, and Martin Weissmann

Planetary boundary layer (PBL) parameterizations depend on spatially and temporally invariant empirical parameters. These are commonly set by comparing parameterization output with large-eddy simulations (LES) and seeking for the parameter values that minimize the differences. Model errors are caused not only by the oversimplified closure assumptions (structural error), but also by the suboptimal specification of spatially and temporally invariant empirical parameters (parameteric error).

We seek to improve the accuracy of PBL parameterization schemes by making parameters adaptive to atmospheric conditions, and therefore spatially and temporally dependent, using ensemble-based parameter estimation (PE). To achieve this, we utilize an idealized modelling environment implemented with WRF and DART. We conduct Observing System Simulation Experiments (OSSEs), which involve an LES serving as the virtual truth and an ensemble of single-column models (SCM), where the only model error source is the PBL parameterization. Based on previously published parameter identifiability studies, we focus on global parameters influencing the parameterized vertical turbulent mixing. We assimilate vertical profiles from LES using the Ensemble Adjustment Kalman Filter (EAKF), in order to objectively adjust empirical turbulence parameters.

Specifically, we focus on the YSU PBL scheme, which implements a first-order turbulence closure. The empirical parameters in this scheme were originally determined through subjective comparison with a set of dry LES, which represent various wind speed and sensible heat flux regimes. We feed synthetic observations from these LES into the PE algorithm and demonstrate that adjusting turbulence parameters using ensemble-based methods outperforms experiments that estimate the state alone. Moreover, we address the limitations imposed by the EAKF’s linearity assumption. Finally, we discuss how the estimated parameters are affected by environmental conditions.

How to cite: Fritz, M., Serafin, S., and Weissmann, M.: Parameter estimation for the YSU boundary-layer turbulence scheme, EGU General Assembly 2026, Vienna, Austria, 3–8 May 2026, EGU26-9274, https://doi.org/10.5194/egusphere-egu26-9274, 2026.

EGU26-9770 | Orals | AS2.1

The long-term evaluation of boundary-layer turbulence in high-resolution numerical weather prediction simulations using Doppler lidar  

Natalie Harvey, Helen Dacre, Kirsty Hanley, Humphrey Lean, Christopher Walden, Michael Baidu, Steven Boeing, and Andrew Ross

Turbulence in the atmospheric boundary layer governs the exchange of heat, moisture, and other atmospheric constituents between the surface and the free troposphere, influencing the initiation of moist convection. As numerical weather prediction models advance toward sub-kilometre-scale grid spacing, an increasing fraction of boundary-layer turbulent motions becomes explicitly resolved, motivating a critical reassessment of turbulence parameterisation frameworks at the turbulence grey-zone scale (partially resolved and partially parametrized turbulence). 


This study combines long-term Doppler lidar and sonic anemometer observations from Chilbolton, Hampshire (UK) to characterise fundamental turbulence properties of the atmospheric boundary layer, including profiles of vertical velocity variance and skewness, together with surface sensible heat flux. These turbulence statistics are analysed across a range of boundary-layer regimes, identified using cloud and aerosol layer height information, and are used to evaluate the representation of boundary-layer turbulence in the Met Office Unified Model (MetUM). Observational diagnostics are compared with equivalent statistics derived from long-term MetUM forecasts at 1.5 km and 300 m grid spacing using time-step output. Analysis of a case study showed that the sub-km simulation better represents the turbulence than the 1.5 km simulation but still underestimates the peak values and has a different vertical structure compared to observations. Here, emphasis is placed on the long-term statistics of the vertical structure of vertical velocity variance and its sensitivity to boundary-layer regime. Although the analysis focuses on the UK and the MetUM, the methodology is readily transferable to other locations with Doppler lidar observations and high-frequency model output.  

How to cite: Harvey, N., Dacre, H., Hanley, K., Lean, H., Walden, C., Baidu, M., Boeing, S., and Ross, A.: The long-term evaluation of boundary-layer turbulence in high-resolution numerical weather prediction simulations using Doppler lidar , EGU General Assembly 2026, Vienna, Austria, 3–8 May 2026, EGU26-9770, https://doi.org/10.5194/egusphere-egu26-9770, 2026.

In this presentation I will sketch my research journey through stably stratified and nocturnal boundary layers. I will reflect on gained insights and remaining unknowns. The usefulness and limitations of simplifications and conceptual models in stable boundary layer research is discussed. I will share personal experiences in searching for physical explanations of SBL phenomena such as ‘the collapse of turbulence’ and turbulence intermittency.

While observational insights and numerical simulations often complement each other, they may also show significant disagreement.  Although we learned from international model comparisons such as the GABLS initiatives, we still struggle in further translating local processes into generic weather forecast parameterizations. Realistic boundary layers are typically “non-ideal” and simplified assumptions (e.g., homogeneity and stationarity) are violated in practice. Fortunately, new observational and modelling techniques allow for fresh perspectives and conceptual progress.

Here, I will reflect on our recent research on the thermodynamic coupling between the lower atmosphere and the underlying surface. This coupling is becoming increasingly important under strongly stratified conditions, where the impact of turbulent fluxes on the surface temperature and energy budget is weak. New model parameterizations of the coupling must reflect this in order to accurately predict surface temperatures. In the future we therefore aim to further understand this coupling and its impact on near-surface cold extremes in this fascinating field of research

How to cite: Van de Wiel, B.: The Long and Winding Road: Research on Stable Boundary Layers & Surface Coupling, EGU General Assembly 2026, Vienna, Austria, 3–8 May 2026, EGU26-9819, https://doi.org/10.5194/egusphere-egu26-9819, 2026.

EGU26-9908 | Posters on site | AS2.1

Observational and modelling study of coastal breezes and thermal comfort under heatwave conditions 

Carlos Román-Cascón, Juan Carbone, Esther Luján-Amoraga, Pablo Ortiz-Corral, Alberto Martilli, Beatriz Sánchez, Mariano Sastre, Marina Bolado-Penagos, Óscar Álvarez, and Carlos Yagüe

The frequency and impacts of heatwaves have significantly increased in recent decades (1975–2020), with Spain experiencing a marked rise in the occurrence of these extreme events (Núñez-Mora, 2021). In coastal environments, sea breezes —driven by temperature gradients between land and sea surfaces— can play a crucial role in mitigating extreme temperatures. This study examines the impact of coastal breezes on thermal comfort during a heatwave period in the southwest of the Iberian Peninsula.

Coastal areas have undergone intense urban development, and approximately 60% of the Spanish population currently resides in these regions (de Andrés et al., 2017). Consequently, urban heat exposure is modulated by meteorological processes operating across multiple spatial (from meters to hundreds of meters) and temporal scales. Within cities, air temperature and humidity exhibit local variations over hundreds of meters, while wind speed and shortwave/longwave radiation show important microscale heterogeneity influenced by urban settlement.

In this work, we employ the Weather Research and Forecasting (WRF) model coupled with the urban parameterization WRF-Comfort (Martilli et al., 2024) to investigate the impact of coastal breezes on thermal comfort. A comprehensive set of numerical experiments is designed to assess the sensitivity of sea-breeze simulations to key model inputs, including large-scale atmospheric forcing, urban datasets with different levels of morphological detail, and alternative sea surface temperature forcings. Model results are evaluated through systematic evaluation with observational data from surface meteorological stations, radiosoundings launched at strategic coastal locations during sea-breeze conditions, and oceanic measurements from a buoy in the Gulf of Cádiz.

This integrated modelling–observational framework enables investigation of the thermoregulatory effects of coastal breezes and their influence on the vertical structure of the coastal urban boundary layer. The study highlights the importance of accurately representing large-scale forcing, urban characteristics, and air–sea interactions to improve coastal breeze simulation and its role in modulating thermal comfort. The results contribute to a better understanding of mesoscale interactions between urban environments and regional climate processes during extreme heat events, with implications for assessing and mitigating heat stress in coastal cities.

How to cite: Román-Cascón, C., Carbone, J., Luján-Amoraga, E., Ortiz-Corral, P., Martilli, A., Sánchez, B., Sastre, M., Bolado-Penagos, M., Álvarez, Ó., and Yagüe, C.: Observational and modelling study of coastal breezes and thermal comfort under heatwave conditions, EGU General Assembly 2026, Vienna, Austria, 3–8 May 2026, EGU26-9908, https://doi.org/10.5194/egusphere-egu26-9908, 2026.

EGU26-9935 | ECS | Orals | AS2.1

Lake-land interactions in complex terrain 

Aldo Brandi, Gabriele Manoli, Albofazl Irani Rahaghi, and Andrea Zonato

Complex terrain covers the vast majority of the Earth surface and affects local thermal wind flows by adding a gravitational component to the dynamics responding to local pressure gradients. The Leman Lake region, in Switzerland, thanks to its mountaineous topography and the presence of a large alpine lake, represents an ideal testbed for studying the interaction between regional and local scale flows in complex terrain. However, most of the research investigating local fluid dynamics in the area predominantly focuses on the impact of wind flow on internal lake circulations, and limited attention has so far been given to the role of the local lake breeze circulation in modulating wind flow in the area. Here, we use a set of high-resolution Weather Research and Forecast (WRF) model simulation experiments to investigate the diurnal and seasonal evolution of boundary layer dynamics in the Leman Lake region, with a focus on the environmental impacts associated with the city of Lausanne. In order to isolate urban impacts and explore the role of different land cover types, we compare simulation results from an “Urban” scenario featuring a realistic landscape representation, with simulation results from an hypothetical “Rural” scenario where urban areas are replaced by croplands. Analysis of results shows that the Lausanne urban area, although of limited extent, is able to modify wind flows locally, e.g., by anticipating the diurnal onset of the lake breeze circulation. In turn, regional wind flows interact with the local UHI by advecting cold air from the Leman Lake during the winter, in accordance with what has been observed by similar studies in world regions charaterized by different topographical and climatological conditions. In addition, we compare simulation results with Doppler Lidar vertical wind profiles as part of a recently initiated measurement campaign on site.

How to cite: Brandi, A., Manoli, G., Irani Rahaghi, A., and Zonato, A.: Lake-land interactions in complex terrain, EGU General Assembly 2026, Vienna, Austria, 3–8 May 2026, EGU26-9935, https://doi.org/10.5194/egusphere-egu26-9935, 2026.

EGU26-10120 | Orals | AS2.1

 LIAISE-2021 campaign: exploring irrigation impact on boundary layer and precipitation in WRF model simulations  

Mireia Udina, Eric Peinó, Francesc Polls, Jordi Mercader, Iciar Guerrero, Arianna Valmassoi, Alexandre Paci, and Joan Bech


 The Land surface Interactions with the Atmosphere over the Iberian Semi-arid Environment (LIAISE) campaign examined the impact of anthropization on the water cycle in terms of land-atmosphere-hydrology interactions (Boone et al. 2025). The objective of this study is to assess the effects of irrigation on the atmosphere and on precipitation in WRF model simulations during the LIAISE Special Observation Period in July 2021 (LIAISE-2021 SOP). Comparisons between simulations and observations show better verification scores for air temperature, humidity and wind speed and direction when the model included the irrigation parameterization, improving the model warm and dry bias at 2 m over irrigated areas. Other changes found are the weakening of the sea breeze circulation and a more realistic surface energy partitioning representation. The boundary layer height is lowered in the vicinity of irrigated areas, causing a decrease in the lifting condensation level and the level of free convection, which induce increases in CAPE and CIN. Precipitation differences between simulations become relevant for smaller areas, close to the irrigated land. When convection is parameterized, simulations including irrigation tend to produce a decrease in rainfall (negative feedback) while convection-permitting simulations produce an increase (positive feedback), although the latter underestimates substantially the observed precipitation field. In addition, irrigation activation decreases the areas exceeding moderate hourly precipitation intensities in all simulations. There is a local impact of irrigated land on model-resolved precipitation accumulations and intensities, although including the irrigation parameterization did not improve the representation of the observed precipitation field, as probably the precipitation systems during LIAISE-2021 SOP were mostly driven by larger scale perturbations or mesoscale systems, more than by local processes (Udina et al. 2024). Results reported here not only contribute to enhance our understanding of irrigation effects upon precipitation but also demonstrate the need to include irrigation parameterizations in numerical forecasts to overcome the biases found. 


This research has been funded by projects WISE-PreP (RTI2018-098693-B-C32), ARTEMIS (PID2021-124253OB-I00), LIFE22-IPC-ES-LIFE PYRENEES4CLIMA and the Institute for Water Research (IdRA) of the University of Barcelona.

References

  • Boone, A., Bellvert, J., Best, M., Brooke, J. K., Canut-Rocafort, G., Cuxart, J., ... & Zribi, M. (2025). The land surface interactions with the atmosphere over the iberian semi-arid environment (LIAISE) field campaign.Journal of the European Meteorological Society2, 100007.
  • Udina, M., Peinó, E., Polls, F., Mercader, J., Guerrero, I., Valmassoi, A., ... & Bech, J. (2024). Irrigation impact on boundary layer and precipitation characteristics in Weather Research and Forecasting model simulations during LIAISE‐Quarterly Journal of the Royal Meteorological Society150(763), 3251-3273.


How to cite: Udina, M., Peinó, E., Polls, F., Mercader, J., Guerrero, I., Valmassoi, A., Paci, A., and Bech, J.:  LIAISE-2021 campaign: exploring irrigation impact on boundary layer and precipitation in WRF model simulations , EGU General Assembly 2026, Vienna, Austria, 3–8 May 2026, EGU26-10120, https://doi.org/10.5194/egusphere-egu26-10120, 2026.

The Planetary Boundary Layer (PBL), the lowest part of the atmosphere, governs the exchange of energy and moisture and is the zone where the highest concentrations of pollutants occur before reaching the free troposphere. The Planetary Boundary Layer Height (PBLH) is therefore a key variable in many meteorological and air‑quality applications. Despite the wide range of methods available to derive PBLH from atmospheric observations, the associated uncertainties are rarely quantified. This study presents a methodology for propagating radiosonde measurement uncertainty into PBLH estimates obtained from state‑of‑the‑art retrieval methods, including the parcel method, gradient methods, and the Richardson method. The framework builds on three components. First, it uses the GCOS Reference Upper‑Air Network (GRUAN) Data Product (GDP), which provides traceable uncertainty estimates for the variables required in PBLH retrievals. Second, a Monte Carlo approach is used to propagate uncertainties and produce synthetic profile ensembles, allowing for an independent validation of various PBLH detection algorithms. A Monte Carlo scheme is chosen over the GUM framework, as the latter is analytically challenging or often inadequate for the non-analytical derivatives required by PBLH methods. Third, it employs a statistical model that captures the structure of atmospheric profiles and enables the generation of physically plausible synthetic vertical profiles of the atmosphere consistent with both observations and their uncertainties. This method enables a systematic comparison of PBLH retrieval techniques, establishing confidence for their performance and revealing how specific atmospheric conditions modulate uncertainty.

How to cite: Locatelli, T.: Measurement Uncertainty in Planetary Boundary Layer Height via Model-Based Monte Carlo Simulation, EGU General Assembly 2026, Vienna, Austria, 3–8 May 2026, EGU26-11408, https://doi.org/10.5194/egusphere-egu26-11408, 2026.

Static pressure fluctuations lie at the core of the equations governing fluid motion and play a key role in Atmospheric Boundary Layer (ABL) dynamics. They regulate pressure transport in the turbulent kinetic energy budget, drive pressure–strain interactions that redistribute energy among velocity components, and provide a physical mechanism for coupling flow regions separated in space and scale. Yet, compared to velocity fluctuations, turbulent static pressure remains one of the least understood variables in atmospheric turbulence. This imbalance largely reflects experimental limitations: accurately measuring high-frequency static pressure fluctuations in the atmosphere is inherently challenging, restricting the availability of high-quality observations and slowing progress toward a unified description of pressure statistics and spectral scaling in the ABL.

From a theoretical perspective, extending Kolmogorov's inertial-range arguments to pressure, the assumption of local isotropy predicts a k-7/3 scaling for static pressure spectra. Observations under neutral, high–Reynolds-number conditions support this behaviour, while lower frequencies exhibit a transition toward a k-1regime commonly associated with large-scale, energy-containing motions within Townsend's attached-eddy framework. At the same time, the literature reports a broader range of pressure spectral scalings across stability regimes, indicating departures from the neutral behaviour. The physical origins of these deviations remain unclear.

In this study, we examine how stratification and terrain slope jointly influence the spectral scaling of turbulent static pressure using three observational datasets collected over progressively more complex terrain. These include measurements from M2HATS (Multi-point Monin-Obukhov similarity horizontal array turbulence study), representing perfectly flat and horizontally homogeneous conditions in which turbulent pressure was measured at 4m across 16 towers along a cross-flow transect, and at eight vertical levels (up to 28m) distributed across two additional profiled towers; SCP (Shallow Cold Pools experiment), characterised by gently undulating terrain on a shallow slope that featured pressure observations distributed in space across the terrain; and the recently completed TEAMx winter EOP, conducted over a steep, undulating mountainous slope where pressure was measured at a network of 7 towers installed along and across the slope. The TEAMx wEOP additionally featured varying flow conditions characterized by persistent katabatic periods where low level jet was observed at or below 1m, and foehn periods with flow characterized by more canonical profiles.

How to cite: Ghirardelli, M. and Stiperski, I.: Spectral Scaling of Turbulent Static Pressure across Stratification Regimes over Terrains of Increasing Slope, EGU General Assembly 2026, Vienna, Austria, 3–8 May 2026, EGU26-11593, https://doi.org/10.5194/egusphere-egu26-11593, 2026.

EGU26-11793 | ECS | Orals | AS2.1

OTTER – a new instrument for boundary layer turbulence profiling between drones and the ground  

Ollie Farley, Emily Ronson, Perrine Lognoné, Marc Dubbeldam, James Osborn, Paul Williams, John Mooney, Michael Woodhouse, Nick Castledine, Peter Mooney, Ellis Thompson, Toby Lane, Emily Hunt, Aran Dasan, and Sam Maxwell

Direct measurement of the vertical profiles of turbulent fluxes in the atmospheric boundary layer is crucial for understanding of surface/atmosphere processes. Existing robust instrumentation such as eddy covariance provides only a single point measurement near the ground, with long averaging times. Profiles can be obtained by radiosonde, but with limited temporal resolution. Remote sensing is possible, for example by combining various types of LIDAR, however deployment is limited by high Size, Weight, Power and Cost (SWaP-C) requirements.

Here we present a new instrument, OTTER (Optical Turbulence for Tracing Energy in the atmospheRe) which aims to provide profiles of turbulent quantities in the boundary layer with high vertical (10 m) and temporal (<30 minute) resolution at the price point of an eddy covariance setup. OTTER observes the scintillation (twinkling) of laser light as it passes through the atmosphere and applies a mature profiling method from astronomy (SCIDAR – Scintillation Detection and Ranging) to obtain profiles of the optical turbulence strength, from which we can compute the profile of sensible heat flux, although we aim to expand this to other fluxes and turbulence parameters.

The lasers are mounted on small commercial drones which fly up to several kilometres away from a ground-based receiver station, allowing profiles along horizontal, slant or vertical paths along the line of sight. OTTER is designed to be robust and low SWaP, capable of deployment to harsh and remote environments such as ice sheets.

We will present the instrument concept and design, including development of the drone-mounted laser systems and ground station. We will conclude with results from a testing campaign in the UK.  

How to cite: Farley, O., Ronson, E., Lognoné, P., Dubbeldam, M., Osborn, J., Williams, P., Mooney, J., Woodhouse, M., Castledine, N., Mooney, P., Thompson, E., Lane, T., Hunt, E., Dasan, A., and Maxwell, S.: OTTER – a new instrument for boundary layer turbulence profiling between drones and the ground , EGU General Assembly 2026, Vienna, Austria, 3–8 May 2026, EGU26-11793, https://doi.org/10.5194/egusphere-egu26-11793, 2026.

Mixed-phase clouds play a key role in shaping the Arctic atmospheric boundary layer (ABL). Cloud-top radiative cooling drives turbulent processes within these clouds and influences their microphysical and thermodynamic behavior. In recent years, large eddy simulations (LES) have been increasingly used as a research tool for investigating the Arctic atmospheric boundary layer under different conditions. Although encouraging results have been obtained with LES in Arctic conditions, the observational data needed to critically assess its skill in resolving Arctic turbulence were hard to obtain. The recent Multidisciplinary drifting Observatory for the Study of Arctic Climate (MOSAiC) expedition provides unique and state-of-the-art in situ data on turbulence in Arctic ABLs that can effectively be used to evaluate LES. Building on this, this work aims to estimate and optimize the simulation performance of the Dutch Atmospheric Large Eddy Simulation (DALES) model on turbulence by comparison with Campaign datasets. A recently published measurement-informed standardized setup is used for DALES to simulate the Arctic boundary layer on two selected cases based on MOSAiC data. Preliminary results show it’s feasible to compare the LES energy spectrum with observation datasets. And LES simulations on two cases show some agreement with observations in turbulent variance profiles. In the energy spectrum, the inertial subrange following -5/3 can be identified in LES for both cases. Compared with observation, both cases indicate that LES can resolve large-scale eddies in the inertial subrange while smaller-scale eddies are filtered. Overall, DALES partially reproduces the turbulence in the inertial subrange for the examined case studies. Further sensitivity tests are needed in the future.


How to cite: Zhou, X., Schnierstein, N., and Neggers, R.: Confronting resolved turbulence in Large-Eddy Simulations of Arctic mixed-phase clouds with aerial system data collected during the MOSAiC drift, EGU General Assembly 2026, Vienna, Austria, 3–8 May 2026, EGU26-12543, https://doi.org/10.5194/egusphere-egu26-12543, 2026.

EGU26-12694 | ECS | Orals | AS2.1

An object-based porosity approach for modelling turbulent exchanges in urban canopies at neighbourhood-scale 

Baptiste Riboulet, Sylvain Dupont, and Isabelle Calmet

At neighbourhood scale, the urban climate is governed by multi-scale exchanges of momentum, heat, and water vapour occurring at the canopy top and between districts through turbulent diffusion and advection. At the scale of several neighbourhoods, individual buildings cannot be explicitly resolved using for example an immersed boundary method in atmospheric models, and their parameterisation through a simple roughness length is insufficient to accurately represent turbulent exchanges within the roughness sublayer. An alternative consists in modelling the urban canopy as a porous medium, following the drag–porosity approach commonly used for vegetation canopies, in order to improve the representation of wind dynamics inside the roughness sublayer. However, unlike vegetation canopies, urban canopies are characterised by solid volumes, sharp edges and strong spatial heterogeneity, which strongly modulate the dominant turbulent motions responsible for turbulent exchanges. Instead of assuming a horizontally homogeneous porosity field as in vegetation canopies, we investigate an adaptation of the drag–porosity approach for urban canopies by concentrating the porosity at building locations, explicitly accounting for the three-dimensional urban morphology at the metre scale. This so-called object-based porosity approach is evaluated using large-eddy simulations of the flow over a staggered array of buildings in neutral thermal stratification. We analyse the differences in wind dynamics obtained by representing the urban canopy through a drag–porosity approach and the object-based porosity method, in comparison with explicit building-resolving configurations from literature. Flow statistics and conditional averaging show that, compared to the homogeneous drag–porosity approach, the object-based formulation yields a more realistic representation of turbulent momentum exchanges at canopy top and better captures the dominant coherent structures within the roughness sublayer.

How to cite: Riboulet, B., Dupont, S., and Calmet, I.: An object-based porosity approach for modelling turbulent exchanges in urban canopies at neighbourhood-scale, EGU General Assembly 2026, Vienna, Austria, 3–8 May 2026, EGU26-12694, https://doi.org/10.5194/egusphere-egu26-12694, 2026.

EGU26-12817 | Posters on site | AS2.1

Improvement of turbulence estimation by Multi-Path sonic anemometry 

Finn Burgemeister, Hans-Jürgen Kirtzel, and Gerhard Peters

Sonic anemometry is an established approach for turbulence measurement due to the absence of inertia in the sensor transfer function. On the other hand, the sound transducers and their mounting rods cause perturbations of the free flow, which can only be partially corrected, particularly regarding turbulence. The perturbations depend i.a. on the angle of attack to the measuring paths and the position of the mounting rods with respect to the flow direction. Therefore, the optimal sensor array geometry has been a subject of discussions for decades – and still is.

The concept of Multi-Path (MP) anemometry offers a way to realize different geometric approaches with one sensor head, enabling turbulence measurements by directly measured vertical wind components and/or vertical wind components derived from tilted paths. Depending on the free flow conditions, the optimal geometry can be dynamically selected.

For MP-sonics each sound transducer communicates with more than one partner, thus setting up more than one measuring path, in total nine measuring paths instead of three paths with only six transducers. On one hand the redundancy allows to analyze only subsets of data output, consequently the performance of conventional sonics can be simulated. On the other hand the MP concept allows multiple approaches to calculate turbulence parameters.

The benefits of the Multi-Path approach, especially in view of the heat flux, will be demonstrated by comparing results of field measurements with corresponding data from simulated conventional sonics.

How to cite: Burgemeister, F., Kirtzel, H.-J., and Peters, G.: Improvement of turbulence estimation by Multi-Path sonic anemometry, EGU General Assembly 2026, Vienna, Austria, 3–8 May 2026, EGU26-12817, https://doi.org/10.5194/egusphere-egu26-12817, 2026.

EGU26-12837 | ECS | Posters on site | AS2.1

Modeling transitional boundary layers over smooth and rough sufaces with a map-based stochastic modeling approach 

Maharun Nesa Shampa, Marten Klein, Juan A. Medina Méndez, and Heiko Schmidt

Challenges in the numerical simulation of atmospheric flows persist in representing surface roughness effects and near-wall turbulence. While Monin-Obhukov similarity theory (MOST) is extensively used in many numerical solvers due to it's simplicity and efficiency, its limitations are well known, prominently under very stable stratification and over rough surfaces (e.g., [1, 2]). The binding element is the atmospheric surface layer that exhibits strong variability in structure and thickness. Emerging dynamical features, in particular intermittency and laminar-turbulent transitions, present core challenges for advanced surface-flux parameterization. Here, an idealized Atmospheric Boundary Layer (ABL), the so-called Ekman Boundary Layer (EBL) is numerically analyzed to address some of the aforementioned challenges utilizing the dimensionally reduced, stochastic One-Dimensional Turbulence (ODT) model. ODT was applied previously as a stand-alone tool to stratified EBL flows over (almost) smooth and very rough surfaces [3, 4, 5], demonstrating predictive capabilities relevant for developing advanced wall models. Recently, the model has been utilized to obtain homogeneous roughness parameterizations for various types of surfaces in channel flow, demonstrating forward modeling capabilities for the Reynolds shear stress otherwise prescribed, e.g., in widely used Reynolds-averaged Navier-Stokes models [6]. In the contribution, the model's capabilities to capture turbulent-laminar regime transitions are discussed and ongoing work on parameterization for dynamic effects associated with roughness-induced drag is presented.


References

[1] M. Optis, A. Monahan, F. C. Bosveld (2016). Limitations and breakdown of Monin–Obukhov similarity theory for wind profile extrapolation under stable stratification. Wind Energy, 19, 1053–1072. https://doi.org/10.1002/we.1883

[2] J. Kostelecky, C. Ansorge (2025). Surface roughness in stratified turbulent Ekman flow. Boundary-Layer Meteorology, 191, 5. https://doi.org/10.1007/s10546-024-00895-5

[3] A. R. Kerstein, S. Wunsch (2006). Simulation of a Stably Stratified Atmospheric Boundary Layer Using One-Dimensional Turbulence. Boundary-Layer Meteorology, 118, 325-356. https://doi.org/10.1007/s10546-005-9004-x

[4] L. S. Freire, M. Chamecki (2018). A one-dimensional stochastic model of turbulence within and above plant canopies. Agricultural and Forest Meteorology, 250-251, 9-23. https://doi.org/10.1016/j.agrformet.2017.12.211

[5] M. Klein, H. Schmidt (2022). Exploring stratification effects in stable Ekman boundary layers using a stochastic one-dimensional turbulence model. Advances in Science and Research, 19, 117-136. https://doi.org/10.5194/asr-19-117-2022

[6] J. A. Medina Méndez, M. Klein, J. W. R. Peeters, H. Schmidt (2026). International Journal of Heat and Fluid Flow, 117, 110113. https://doi.org/10.1016/j.ijheatfluidflow.2025.110113

How to cite: Shampa, M. N., Klein, M., Medina Méndez, J. A., and Schmidt, H.: Modeling transitional boundary layers over smooth and rough sufaces with a map-based stochastic modeling approach, EGU General Assembly 2026, Vienna, Austria, 3–8 May 2026, EGU26-12837, https://doi.org/10.5194/egusphere-egu26-12837, 2026.

EGU26-12985 | ECS | Posters on site | AS2.1

Life-cycle analysis of fog types in the Inn Valley, Austria 

Klaus Keim-Vera, Jutta Vüllers, Eva Pauli, Hendrik Andersen, and Jan Cermak

Fog and low stratus are a widespread phenomena worldwide, influencing the climate system and human activities. They reflect sunlight, reducing incoming solar radiation, yet also trap Earth’s thermal emission, leading to complex interactions that are not yet fully understood. Fog additionally supplies moisture to ecosystems. In terms of their impacts on human activities, fog reduces visibility, disrupting traffic systems, and, when combined with urban air pollution, can adversely affect human health. Although recent satellite-based research has advanced our understanding of fog and low clouds, accurate observations are still needed in order to describe fog life-cycle phases. Ground-based observations of fog life-cycle processes are essential for constraining the physical parametrization of fog formation and dissipation in weather and climate models.­

To fill these gaps, the Karlsruhe Institute of Technology (KIT), as part of ACTRIS (Aerosol, Clouds and Trace Gases Research Infrastructure), has recently developed a mobile facility: KLOCX (Karlsruhe Low Cloud Exploratory Platform). KLOCX combines in-situ and remote sensing instrumentation, delivering high-resolution vertical and temporal data on fog and low-cloud processes. Here, we analyze KLOCX observations from the TEAMx campaign in Austria’s Inn Valley, spanning the full fog season (winter 2024 – spring 2025). The study aims to identify how life cycle-phases differ among fog types and which mechanisms drive those differences. Our methodology comprised three stages: (1) fog event identification, (2) fog-types classification, and (3) life cycle-phases analysis. Thirty-five fog events were detected and classified by their main physical mechanism prior to fog onset, observing predominantly radiation fog (30 cases), followed by cloud-base lowering fog (3), and precipitation fog (2). These events served as the basis for applying an automated life-cycle algorithm that detected the start and end times of each phase using visibility trends and predefined thresholds. Our results show that the average durations of formation, maturity and dissipation phases vary across fog types. These findings improve our understanding of how complex topography interacts with local atmospheric conditions, which is essential for better models and forecasting accuracy.

How to cite: Keim-Vera, K., Vüllers, J., Pauli, E., Andersen, H., and Cermak, J.: Life-cycle analysis of fog types in the Inn Valley, Austria, EGU General Assembly 2026, Vienna, Austria, 3–8 May 2026, EGU26-12985, https://doi.org/10.5194/egusphere-egu26-12985, 2026.

EGU26-13643 | ECS | Orals | AS2.1

Spatiotemporal analysis of marine stratocumulus-topped boundary layer across the Pacific-Atacama Desert transition 

Vicente Espinoza, Oscar Hartogensis, Felipe Lobos-Roco, and Jordi Vilà-Guerau de Arellano

A semi-permanent stratocumulus-topped boundary layer (STBL) cloud deck is advected daily from the Southeast Pacific Ocean towards the Atacama Desert, regularly producing a fog belt at the coastal mountain range. In the absence of rain (annual rainfall ~2 mm) this fog belt provides the sole water input for ecosystems and a complementary water source that can potentially be tapped by local communities. The STBL is primarily maintained by a balance of cloud-top radiative cooling, entrainment of overlying dry air forced by surface driven convection, and large-scale subsidence. This balance drives the turbulence and regulates the growth and decay of the boundary layer expressed as the tendency of its height (∂h/∂t). While these processes are well-understood over the open ocean, the STBL persistence and dilution during the ocean to inland transition (Pacific to Atacama) remains poorly understood. We aim to quantify the STBL spatiotemporal variability and the contributions of key drivers across this transition (from ~500 km offshore to ~36 km inland) in this hyper arid region (18°S–24°S).

To address this topic, we combine three years (2022-2024) of GOES satellite observations, ERA5 reanalysis data, and the ECMWF EcRAD radiation scheme in order to estimate: 1) the spatiotemporal variability of fog and low cloud cover fraction (CCF) and 2) the STBL height budget, expressed as ∂h/∂t, which we decompose into positive contributions by entrainment and cloud-top longwave radiative cooling, and negative contributions by large-scale subsidence. This approach allows us to link physical processes that control the STBL height with observed CCF variability across the ocean to inland transition.

Our findings show a clear seasonal decrease in CCF across the ocean–inland transition, from values around 0.8 over the ocean to ~0.2 inland, particularly during summer and fall. In contrast, winter and spring exhibit an almost constant CCF (~0.8) extending up to ~12 km inland (~0.4), beyond which desert influence becomes dominant. From a temporal perspective,  oceanic CCF variability is dominated by synoptic periods (7–21 days), whereas inland variability is primarily controlled by the daily cycle (24 hours), likely driven by the strong diurnal heating and enhanced entrainment over the desert. The spatiotemporal variability reflects changes in the STBL height balance. Over the ocean, this balance is close to equilibrium and slightly positive (0.42 cm s⁻¹), with radiative cooling accounting for ~52% of the total contribution. Inland, this balance is disrupted (2.77 cm s⁻¹) as entrainment becomes dominant (~69%), driven by enhanced daytime surface fluxes over the desert. These findings highlight the crucial role of the balance of physical processes controlling STBL and fog variability across the ocean–inland transition. They provide new insights into the mechanisms shaping stratocumulus persistence in coastal desert regions, with implications for ecosystem water availability and regional climate understanding.

How to cite: Espinoza, V., Hartogensis, O., Lobos-Roco, F., and Vilà-Guerau de Arellano, J.: Spatiotemporal analysis of marine stratocumulus-topped boundary layer across the Pacific-Atacama Desert transition, EGU General Assembly 2026, Vienna, Austria, 3–8 May 2026, EGU26-13643, https://doi.org/10.5194/egusphere-egu26-13643, 2026.

EGU26-13644 | ECS | Posters on site | AS2.1

Characterization of heat, water and CO2 fluxes in La Herrería Forest environment (Madrid, Spain) 

Raúl Canino, Carlos Yagüe, and Víctor Manuel Cicuéndez

Vegetation plays a key role in the interchange of water, energy, and carbon fluxes between the land surface and the atmosphere. This study aims to determine the relationship between these fluxes and meteorological conditions, soil moisture, and vegetation dynamics in La Herrería forest area (Madrid, Spain). Observations over two years are available (2018 and 2019) at two nearby mountainous ecosystems with contrasting surface characteristics. The first site (HER) is a grassland with scattered shrubs and trees, while the second site (PORT) exhibits a higher tree density and the soil has a higher sand content, favouring faster water drainage. Turbulent and meteorological variables were measured using eddy-covariance towers, while satellite data was used to estimate the vegetation activity from the normalized difference vegetation index (NDVI). A joint meteorological and turbulent analysis shows that the interannual variability measured at the weather stations is greater than the differences obtained when comparing both locations for the main variables. Both ecosystems show a remarkably similar response to atmospheric forcing, with strong linear correlation for different atmospheric and turbulent parameters. In contrast, vegetation dynamics differ between both sites, showing the impact of soil type on plant growth and demonstrating how precipitation and its distribution modulate vegetation growth and, therefore, CO2 exchanges with the atmosphere. These results underline the importance of combining in situ flux measurements and remote sensing to better understand how soil and vegetation characteristics modulate land-atmosphere interactions in Mediterranean mountainous environments. 

How to cite: Canino, R., Yagüe, C., and Cicuéndez, V. M.: Characterization of heat, water and CO2 fluxes in La Herrería Forest environment (Madrid, Spain), EGU General Assembly 2026, Vienna, Austria, 3–8 May 2026, EGU26-13644, https://doi.org/10.5194/egusphere-egu26-13644, 2026.

EGU26-13938 | Posters on site | AS2.1

Thermally driven mesoscale circulations and their impact on the urban boundary layer and turbulence in Madrid 

Carlos Yagüe, Juan Carbone, Mariano Sastre, Pablo Ortiz-Corral, Carlos Román-Cascón, Víctor Cicuéndez, Alberto Martilli, Beatriz Sánchez, Jose Luis Santiago, Rosa M. Inclán, Jielun Sun, Samuel Viana, and Rafael Borge

During the summer of 2025 (23 June–13 July), an intensive meteorological and turbulence observation campaign was conducted in central Madrid within the framework of the AIRTEC2-CM and MULTIURBAN-II projects. Measurements combined data from a permanent meteorological station and a portable high-frequency eddy-covariance system (IRGASON) from the GuMNet network, both installed on a rooftop at 27 m above ground level. Standard meteorological variables, radiative fluxes, and key turbulence parameters, including friction velocity, turbulent kinetic energy, and sensible heat flux, were recorded.

The observational period was dominated by persistent anticyclonic conditions over the Iberian Peninsula, leading to strong atmospheric stability, weak synoptic forcing, and positive geopotential height anomalies at 500 hPa. These conditions favoured the development of thermally driven mesoscale circulations, particularly nocturnal breezes, which interacted with the urban boundary layer and modulated turbulence and mixing processes. Diurnal cycles of meteorological and turbulent variables are analysed with particular emphasis on the evening transition and the nocturnal stable boundary layer.

Several episodes characterized by very stable conditions and elevated NO₂ concentrations (exceeding 100 μg m⁻³) were observed. The onset of nocturnal breezes was associated with enhanced turbulent mixing and a rapid decrease in pollutant concentrations. High-resolution simulations with the WRF mesoscale model are also presented to evaluate its ability to reproduce the observed thermally driven circulations and their impact on the nocturnal urban boundary layer. Overall, the results highlight the key role of mesoscale thermally driven flows in regulating turbulence, mixing, and scalar transport in urban environments under weak synoptic forcing.

How to cite: Yagüe, C., Carbone, J., Sastre, M., Ortiz-Corral, P., Román-Cascón, C., Cicuéndez, V., Martilli, A., Sánchez, B., Santiago, J. L., Inclán, R. M., Sun, J., Viana, S., and Borge, R.: Thermally driven mesoscale circulations and their impact on the urban boundary layer and turbulence in Madrid, EGU General Assembly 2026, Vienna, Austria, 3–8 May 2026, EGU26-13938, https://doi.org/10.5194/egusphere-egu26-13938, 2026.

EGU26-15106 | ECS | Posters on site | AS2.1

Thermodynamic characterization of the boundary layer under fog and dew events in the coastal hyper-arid climate of the Atacama Desert 

Francisca Munoz, Felipe Lobos, Sara Acevedo, and Camilo Del Río

In the coastal Atacama Desert, fog and dew represent the main atmospheric water inputs to the surface water balance in a context of near-total absence of precipitation. Both processes originate from the advection of the marine boundary layer (MBL) over the coastal topography, strongly influencing the spatial distribution of xeric, highly adapted ecosystems. Despite advances in understanding MBL advection under fog conditions, the physical differentiation between fog and dew remains unclear due to instrumental limitations, hindering their independent quantification and the assessment of their hydrological role. This study focuses on the thermodynamic characterization of the MBL under fog and dew events in the coastal Atacama Desert and is structured around three main objectives: (1) reclassification of atmospheric water harvesting events, (2) analysis of MBL stability, and (3) assessment of moisture tendency evolution. The analysis is based on a topographic transect of meteorological stations facing the ocean, distributed between 48 and 1354 m a.s.l., using 10-minute observations collected during 2024. Event reclassification integrates visibility measurements and the Fog Low Cloud (FLC) product from the GOES satellite, enabling discrimination between fog and dew beyond the signal provided by standard fog and dew collectors (SFC and SDC). Preliminary results indicate that standard collectors fail to adequately distinguish fog from dew events, as the inclusion of visibility and satellite information increases the annual proportion of dew events from 0.5% to 3.4%, while fog events remain close to 3.4%. Analysis of vertical profiles of potential temperature (θ) and specific humidity (q) shows that fog events are associated with a thermally and moisture well-mixed MBL, whereas dew formation occurs under a stratified (stable) MBL. In particular, the vertical gradient of θ reveals distinct stability thresholds differentiating fog (∂θ/∂z < 0.0020 K m⁻¹) from dew (0.0020 K m⁻¹ < ∂θ/∂z < 0.0031 K m⁻¹) events, while vertical profiles of q do not show significant differences between event types. Finally, the analysis of moisture tendency (∂q/∂t) reveals small but significant differences between fog and dew events, with sharper moisture decreases during dew conditions, indicating stronger atmosphere–surface water exchange at dawn. This study contributes to disentangling the atmospheric processes controlling fog and dew occurrence in the driest place on Earth.

How to cite: Munoz, F., Lobos, F., Acevedo, S., and Del Río, C.: Thermodynamic characterization of the boundary layer under fog and dew events in the coastal hyper-arid climate of the Atacama Desert, EGU General Assembly 2026, Vienna, Austria, 3–8 May 2026, EGU26-15106, https://doi.org/10.5194/egusphere-egu26-15106, 2026.

EGU26-15819 | ECS | Posters on site | AS2.1

Urbanization-Induced Changes in Low-Level Temperature and Wind near Gimpo International Airport 

Yoonjeong Choi, Doo-Young Kwon, Jiwon Seo, and Wan-Sik Won

Rapid urbanization is a critical factor altering the atmospheric boundary layer environment of metropolitan areas, particularly in the lower atmosphere, where low-altitude aviation and emerging urban air mobility (UAM) operations are expected to occur. Airports located near urban areas are directly influenced by continuous urban expansion, necessitating an assessment of how urbanization-induced changes in temperature and wind affect aircraft operating environments.

This study examines the long-term effects of urbanization on near-surface temperature and wind characteristics in the vicinity of Gimpo International Airport, which is located adjacent to Seoul, South Korea. Using approximately 30 years of observational records and reanalysis datasets, this study aims to examine how urbanization-related changes in the local meteorological environment are associated with conditions relevant to aircraft operations around the airport.

The results indicate that all sites exhibit strong seasonal variability, and there is a persistent long-term increase in annual mean temperatures. This warming trend is most pronounced at the Gimpo site, where urbanization has progressed most rapidly. Regarding wind characteristics, a gradual weakening of near-surface wind speeds was identified in highly urbanized areas. This trend is attributed to increased surface roughness associated with higher building density.

Overall, the combined long-term observational and reanalysis data confirms the co-occurrence of increasing temperature and weakening near-surface wind tendencies in areas surrounding the airport. Furthermore, persistent near-surface warming may influence surface heating and mixing processes in urban-adjacent regions, potentially contributing to long-term changes in the low-level wind environment. From this perspective, the findings of this study provide a fundamental basis for understanding long-term changes in near-airport low-level environments influenced by urbanization.

How to cite: Choi, Y., Kwon, D.-Y., Seo, J., and Won, W.-S.: Urbanization-Induced Changes in Low-Level Temperature and Wind near Gimpo International Airport, EGU General Assembly 2026, Vienna, Austria, 3–8 May 2026, EGU26-15819, https://doi.org/10.5194/egusphere-egu26-15819, 2026.

EGU26-16036 | ECS | Posters on site | AS2.1

Aircraft Vibration Responses to Terrain-Induced Boundary-Layer Flow Variability during Low-Altitude Flights 

DooYoung Kwon, Yoonjeong Choi, jiWon Seo, and Wan-Sik Won

General aviation (GA) and emerging urban air mobility (UAM) operations are primarily conducted at low altitudes within the atmospheric boundary layer (ABL), where aircraft are directly exposed to turbulence generated by complex terrain. Despite its operational importance, the physical mechanisms linking boundary-layer flow structures to observed aircraft vibration and response characteristics remain insufficiently understood. This limitation is particularly critical in terrain-influenced ABL environments, where flow variability is dominant and conventional turbulence metrics, such as the eddy dissipation rate (EDR), may provide limited insight into aircraft response characteristics.

In this study, aircraft vibration responses observed during low-altitude flights within the ABL over Jeju Island are analyzed using high-frequency (100 Hz) three-axis acceleration data collected from a Cessna aircraft operating at altitudes of 1,000–2,000 ft AGL. Flight segments near mountainous terrain exhibit relatively enhanced aircraft vibration responses compared to surrounding regions. Root-mean-square (RMS) acceleration and power spectral density (PSD) analyses are employed to examine the directional dependence and anisotropic characteristics of aircraft responses under low-altitude turbulent conditions.

To interpret the observed aircraft responses from an ABL physics perspective, numerical simulations are conducted using a high-resolution atmospheric flow model capable of resolving terrain-induced boundary-layer flow structures. These simulations are intended to analyze the spatial and temporal relationships between terrain-modified ABL flow variability and the locations and times at which enhanced aircraft vibration responses are observed.

Rather than treating aircraft acceleration as a direct measure of atmospheric turbulence intensity, this study interprets it as a manifestation of aircraft response to localized ABL flow variability shaped by complex terrain. Through this approach, the study explores the potential of terrain-resolving numerical simulations as an interpretative tool for linking boundary-layer flow structures with low-altitude aircraft responses. The findings of this work are expected to provide meaningful implications for low-altitude flight safety assessment, UAM corridor design, and the applied extension of ABL research. 

How to cite: Kwon, D., Choi, Y., Seo, J., and Won, W.-S.: Aircraft Vibration Responses to Terrain-Induced Boundary-Layer Flow Variability during Low-Altitude Flights, EGU General Assembly 2026, Vienna, Austria, 3–8 May 2026, EGU26-16036, https://doi.org/10.5194/egusphere-egu26-16036, 2026.

The Canopy Urban Heat Island (CUHI) effect profoundly influences the urban thermal environments. While surface energy balance analysis provides a theoretical framework for diagnosing CUHI drivers, the non-local contributions of horizontal thermal transport, particularly Urban Heat Advection (UHA), remain insufficiently characterized. Utilizing five years of high-density meteorological observations and datasets from the Yangtze River Delta urban agglomeration in China, combined with high-resolution Weather Research and Forecasting (WRF) simulations, this study investigates the spatiotemporal linkages and thermal transport mechanisms of regional CUHI under the influence of UHA. The results show significant spatial divergence under prevailing wind conditions: upstream cities experience CUHI attenuation through enhanced ventilation, whereas downstream cities exhibit intensified thermal loads via advective heat. UHA displays distinct diurnal asymmetry, typically stronger at night than during the day, with its peak mean intensity reaching approximately 0.6°C. UHA magnitude is non-linearly regulated by the wind speed and boundary layer turbulence mixing; it modulates downstream CUHI through two pathways: canopy horizontal heat transport, and the long-range transport and vertical mixing of urban boundary layer plumes. These findings deliver important insights for understanding the coordinated evolution of regional-scale CUHI within urban agglomerations.

How to cite: Xue, J. and Yang, Y.: Spatiotemporal Linkage and Transmission of Canopy Urban Heat Islands in the Yangtze River Delta Urban Agglomeration: The Role of Heat Advection, EGU General Assembly 2026, Vienna, Austria, 3–8 May 2026, EGU26-16280, https://doi.org/10.5194/egusphere-egu26-16280, 2026.

EGU26-17534 | ECS | Posters on site | AS2.1

Aerosol and ozone vertical distribution and fluxes over the Amazonian boundary layer 

Rafael Valiati, Cléo Dias-Júnior, Sebastian Brill, Bruno Meller, Anywhere Tsokankunku, Christopher Pöhlker, and Paulo Artaxo

Atmospheric aerosols in the Amazon forest exhibit strong temporal variability driven by seasonally changing sources and boundary-layer processes [1]. In central Amazonia, wet-season conditions are typically dominated by biogenic emissions and secondary organic aerosol (SOA) formation, whereas dry-season conditions are strongly influenced by biomass-burning emissions and long-range transport events [2]. This variability makes the region a natural laboratory for investigating aerosol–boundary layer interactions and vertical exchange processes.

The occurrence of convection, turbulence, and boundary-layer dynamics promotes the vertical motion of particles and trace gases [3]. These processes govern the exchange of particles between atmospheric layers, allowing surface-emitted aerosols to reach the free troposphere through deep convection, while SOA formed at higher levels may be reintroduced into the boundary layer through subsidence and downdrafts. Convective downdrafts associated with precipitation have also been shown to increase ground-level ozone concentration, contributing to new particle formation and growth [4].

In this context, this study aims to evaluate particle and ozone fluxes over the central Amazon, quantifying the importance of vertical transport mechanisms for the atmospheric composition within the lower troposphere. A diverse range of ground-based measurements performed at the 325-m Amazon Tall Tower Observatory (ATTO) was employed, combining long-term aerosol observations, sonic anemometer measurements, and a novel robotic lift system [5] that enables continuous vertical profiling of aerosol properties.

Both eddy covariance and flux-gradient techniques were employed to derive vertical fluxes of particles and ozone during clean wet season conditions. The gradient-based analysis reveals coherent vertical flux patterns associated with rainfall intensity, boundary-layer stratification, and diurnal evolution. Deposition aerosol fluxes dominated, with a mean value of −0.28(12) × 10⁶ m⁻² s⁻¹, in agreement with other flux studies conducted in the Amazon region [6]. Furthermore, negative ozone fluxes were also consistently observed during strong precipitation, indicating the downward transport of ozone-rich air from upper levels in these events.

This study sheds light on the magnitude and importance of multiple vertical transport mechanisms, including emission, dry and wet deposition, downdrafts, and the diurnal evolution of the boundary layer, for the variability of aerosol concentrations in the Amazon. Our results provide quantitative constraints on sources, sinks, and transformation pathways of aerosol particles, contributing to an improved understanding of aerosol–turbulence interactions in tropical forest environments and their implications for the local climate.


[1] P. Artaxo, et al. Tellus Series B 24.1 (2022): 24–163.

[2] R. Valiati, et al. Atmos. Chem. Phys. 25.21 (2025): 14923–14944.

[3] L. A. T. Machado, et al. Atmos. Chem. Phys. 21.23 (2021): 18065–18086.

[4] L. A. T. Machado, et al. Nat. Geosci. 17 (2024): 1225–1232.

[5] S. Brill, et al. Atmos. Meas. Tech. 19.1 (2026): 101–118.

[6] L. Ahlm, et al. Atmos. Chem. Phys. 9.24 (2009): 9381–9400.

How to cite: Valiati, R., Dias-Júnior, C., Brill, S., Meller, B., Tsokankunku, A., Pöhlker, C., and Artaxo, P.: Aerosol and ozone vertical distribution and fluxes over the Amazonian boundary layer, EGU General Assembly 2026, Vienna, Austria, 3–8 May 2026, EGU26-17534, https://doi.org/10.5194/egusphere-egu26-17534, 2026.

EGU26-17840 | ECS | Posters on site | AS2.1

Urban built-up expansion induced accelerated surface cooling modulates fog genesis over Delhi 

Ankit Patel, Rahul Sheoran, Malasani Chakradhar Reddy, Dr. Pengfei Liu, and Dr. Sachin S Gunthe

Severe wintertime fog frequently affects Delhi National Capital Rregion (NCR), causing extreme visibility reduction and exacerbating air quality and transportation disruptions. Fog formation over the Indo-Gangetic Plain is commonly linked to high aerosol loading, elevated humidity, and favourable synoptic conditions; however, the influence of rapid urban expansion and land-use driven surface processes driven by micro-meteorology remains unexplored. Urban built-up surface possesses distinct radiative and thermal properties compared to surrounding agricultural land, potentially modifying nocturnal cooling, near-surface microclimate and thus vertical structure of fog.

This study investigates the influence of urban expansion over the last three decades on the surface energy balance and its feedback on different stages of urban fog genesis to delineate the aerosol induced effects across the extensive urban built-up landmass of the Delhi–NCR region. High-resolution (9–3–1 km) numerical simulations are conducted using the WRF-ARW/Chem model, employing historical (1992) and latest (2024) urban land-use datasets to isolate the impact of urban expansion and to examine the coupled effects of aerosols, radiation and microphysics. The model reasonably captures the spatial and temporal evolution of observed fog events.

Results show that urban built-up areas in Delhi–NCR have expanded by over 100% in recent decades, primarily replacing irrigated cropland and vegetation, thereby altering surface radiative-thermal properties and intensifying the urban heat island effect resulting in distinct impact and effect of surface cooling after sunset. Consequently, during dense fog events, fog onset over urban areas is delayed and dissipation occurs earlier than over surrounding agricultural regions, leading to reduced liquid water content across the fog life cycle, both spatially and vertically. In contrast, radiative fog event exhibits an increase in LWC during the fog evolution, with a pronounced enhancement in the lower fog layers and a simultaneous reduction in the upper fog layers. This vertical redistribution of LWC is consistently reproduced in urban sensitivity simulations. Furthermore, WRF-Chem simulations reveal stronger LWC increases (>0.5 g kg-1) during fog initiation and continues to enhance in the upper fog layers throughout the event, while LWC decreases (< -0.4 g kg-1) in the lower layers during fog development and dissipation.

Overall, the results demonstrate that urban expansion influences fog initiation and dissipation but also its vertical structure and microphysical characteristics through combined thermal and chemical feedback. The results highlight an underexplored pathway linking urbanization and aerosol feedback, surface thermal dynamics, and atmospheric chemistry in fog genesis. 

How to cite: Patel, A., Sheoran, R., Reddy, M. C., Liu, Dr. P., and Gunthe, Dr. S. S.: Urban built-up expansion induced accelerated surface cooling modulates fog genesis over Delhi, EGU General Assembly 2026, Vienna, Austria, 3–8 May 2026, EGU26-17840, https://doi.org/10.5194/egusphere-egu26-17840, 2026.

EGU26-18827 | ECS | Posters on site | AS2.1

Simulation of turbulence recovery in the stable boundary layer over Pampa grasslands using the PALM model 

Luis Fernando Camponogara, Edivaldo Meninea Serra Neto, João Lucas Soares dos Santos, Thiago Ferreira Gomes, Rafael Maroneze, and Felipe Denardin Costa

Observations from the Pampa-2016 field campaign over southern Brazilian grasslands documented nights with a distinct nocturnal transition between two stable boundary layer (SBL) regimes a Very Stable Boundary Layer (VSBL) shortly after sunset, followed by a transition to a Weakly Stable Boundary Layer (WSBL) after midnight. This work investigates the physical mechanisms and forcing components required to reproduce such regime shifts using Large-Eddy Simulations (LES) with the PALM model. The simulations are initialized using convective boundary layer (CBL) profiles observed during the campaign and integrated through a complete diurnal cycle to resolve the evening transition. The numerical domain assumes horizontal homogeneity, representing the natural grassland footprint of the 30 m flux tower. The SBL regime transition is analyzed through the relationship between wind speed (V) and turbulence intensity diagnosed from the square root of the turbulence kinetic energy (VTKE). Model performance is evaluated against tower measurements at 3 m and 29 m and 3-hourly radiosoundings. The comparisons focus on turbulence quantities and in the vertical structure of potential temperature, including inversion strength and depth. Finally, the individual terms of the TKE budget are analyzed to assess the relative roles of radiative cooling and shear-driven mixing during the transition from a radiation-dominated VSBL to a turbulence-driven WSBL.

How to cite: Camponogara, L. F., Serra Neto, E. M., Santos, J. L. S. D., Gomes, T. F., Maroneze, R., and Costa, F. D.: Simulation of turbulence recovery in the stable boundary layer over Pampa grasslands using the PALM model, EGU General Assembly 2026, Vienna, Austria, 3–8 May 2026, EGU26-18827, https://doi.org/10.5194/egusphere-egu26-18827, 2026.

Sea-ice cover exerts important controls on the Arctic climate and may form horizontally heterogeneous patterns, especially in the marginal ice zone (MIZ). Earth System Models (ESMs) represent the sea-ice heterogeneity within a grid cell as an ice fraction. The heterogeneous sea-ice cover, however, causes complex nonlinear surface-atmosphere interacting processes that cannot be quantified appropriately using solely the ice fraction. Among the nonlinear interacting processes are the secondary circulations in the atmospheric boundary layer (ABL) that are driven by the sea-ice and ocean water surfaces and their thermal contrast. An effective representation of the surface-atmosphere momentum, temperature and moisture exchanges for a grid cell of an ESM should accommodate for the occurrence of secondary circulations. This is of particular relevance when leads evolve in the sea ice. These elongated cracks in the sea-ice cover expose local regions of open ocean water with surface temperatures much higher than the surrounding sea ice. As a result, convective plumes develop above leads. Even if leads occupy a small areal fraction only, their impact on the regional temperature, atmospheric stability over sea ice, and surface-atmosphere fluxes in winter is disproportionally large.

To quantify and parameterise secondary circulations related to leads, we extend a thermal heterogeneity parameter [1], which defines the ratio between buoyancy effects of surface thermal contrasts to the inertia of the mean flow. This extension incorporates factors such as temperature difference between the sea-ice and water surfaces, the angle between geostrophic wind and lead orientation and typical length scales. Data are used from the Multidisciplinary drifting Observatory for the Study of Arctic Climate (MOSAiC) campaign and from the BACSAM II flight campaign, where turbulence was measured at two different heights simultaneously: on an aircraft and 60 m below the aircraft using a passive trailing body called T-bird. The aircraft data are analysed with a wavelet transform, enabling a multiscale decomposition to extract a mesoscale contribution to the fluxes. Surface temperature characteristics are obtained from the Modis global Level-2 product (resolution: 1 km). A case study reveals a strong correlation between thermal heterogeneity parameters and mesoscale flux contributions for 20 km subintervals with 1 km rolling steps along the flight legs. The correlation is enhanced for leads oriented normal to wind, and when fetch-dependent downstream effects are included.

[1] Margairaz, Fabien & Pardyjak, Eric & Calaf, Marc. (2020). Surface Thermal Heterogeneities and the Atmospheric Boundary Layer: The Thermal Heterogeneity Parameter. Boundary-Layer Meteorology. 177. 1-20. 10.1007/s10546-020-00544-7.

How to cite: Vercauteren, N. and Staudinger, I.: Representing sea-ice heterogeneities and the Arctic boundary-layer using a thermal heterogeneity parameter, EGU General Assembly 2026, Vienna, Austria, 3–8 May 2026, EGU26-18969, https://doi.org/10.5194/egusphere-egu26-18969, 2026.

EGU26-20240 | Posters on site | AS2.1

Integration of ground-based lidar remote sensing products for model evaluation 

Matthias Zeeman, Dana Looschelders, Ulf Andrae, Abhilash Menon, Natalie Theeuwes, Jean Wurtz, and Andreas Christen

Networks of commercial lidars are being deployed in cities to study how urban surfaces affect the planetary boundary layer (PBL). These observations are essential input for numerical models at various scales. Due to the size and complexity of urban modifications of the PBL, dense networks of sensors and models are required. Our study considers the outcomes from an intensive observation campaign within the greater Paris, France area in 2023 and 2024. The results of this campaign are used to develop, compare and integrate model simulations of the urban atmosphere (e.g., UrbanAIR, Urbisphere). 

The wind field, clouds and structures in the atmospheric boundary layer can be routinely extracted from Doppler lidar (DWL) and ceilometer lidar (ALC) observations. The co-location of such instruments allows diurnal mixed/mixing layer development to be assessed together with turbulence statistics. However, because lidar observations are inherently noisy, the derived outcomes require careful evaluation. 

We present a comprehensive dataset that has been prepared for the purpose of model evaluations. We investigate the impact of processing algorithms on the quantification and classifications of atmospheric boundary layer properties. The approach involves aligning the computations with the level-configuration of models. We will highlight prominent patterns in the observations and examine how they relate to the direction and magnitude of flow relative to the surrounding urban and rural environment, as well as discuss the limitations of comparing such observations with numerical models. 


How to cite: Zeeman, M., Looschelders, D., Andrae, U., Menon, A., Theeuwes, N., Wurtz, J., and Christen, A.: Integration of ground-based lidar remote sensing products for model evaluation, EGU General Assembly 2026, Vienna, Austria, 3–8 May 2026, EGU26-20240, https://doi.org/10.5194/egusphere-egu26-20240, 2026.

EGU26-20607 | Orals | AS2.1

Scale-by-scale evidence for an inverse energy cascade in moist atmospheric turbulence  

Paweł Jędrejko, Marta Wacławczyk, Christos Vassilicos, Benjamin Luce, and Szymon Malinowski

We present a scale-by-scale analysis of atmospheric turbulence based on large-eddy simulation of the BOMEX case. The simulation employs the anelastic approximation and moist thermodynamics to represent stratification and phase changes. The study focuses on the scale-by-scale transport of kinetic energy, diagnosed using second-order velocity structure functions.

Following the approach of Valente and Vassilicos (Phys. Fluids. vol. 27, 2015), we compute all terms of the Kármán–Howarth–Monin–Hill equation and analyze their balance in a six-dimensional space of scales and positions. The budgets are averaged over time and horizontally homogeneous directions, allowing their variation with scale and height to be examined.

The results reveal an inverse average energy cascade within the lower cloud layer where there is moderate liquid water content (800 – 1300m). This inverse cascade coincides with the emergence of  buoyant forcing at small scales due to phase changes and represents the main finding of the study. At higher cloud levels, the inverse-cascade signature weakens and eventually disappears.

The results show good qualitative agreement with recent airborne measurements (Nowak et. al., QJRMS vol. 151, 2025) and highlight the role of moist processes in shaping energy transfer in atmospheric turbulence.

How to cite: Jędrejko, P., Wacławczyk, M., Vassilicos, C., Luce, B., and Malinowski, S.: Scale-by-scale evidence for an inverse energy cascade in moist atmospheric turbulence , EGU General Assembly 2026, Vienna, Austria, 3–8 May 2026, EGU26-20607, https://doi.org/10.5194/egusphere-egu26-20607, 2026.

EGU26-20892 | ECS | Orals | AS2.1

Large-Eddy Simulations of the Wind Field over the Vernagtferner Glacier in Austria 

Javier Balbontín, Yoshiyuki Sakai, and Michael Manhart

Understanding wind flow over complex terrain is critical for accurately modeling surface-atmosphere exchanges and wind field turbulence. This study investigates the dynamics of the atmospheric boundary layer (ABL) over the Vernagtferner Glacier in Austria, using high-resolution large-eddy simulations (LES) under neutrally stratified conditions. The in-house code MGLET is employed to solve the governing equations of motion, incorporating the Coriolis force due to Earth’s rotation as well as a ghost-cell immersed boundary method (GCIBM) to handle complex geometries. A set of simulations was conducted to evaluate the sensitivity of the wind field to variations in domain extent and grid resolution. Special attention was paid to determine how large the numerical domain needs to be to reliably capture the ABL dynamics. Hence, the computational domains were defined as horizontal squares of sizes ranging from 20 km to 60 km, with the glacier at the center, using periodic boundary conditions in the horizontal directions, and the domain top was set between 9 km and 15 km above sea level. For each case, refinement levels were generated to reduce computational effort, with the finest level covering the entire glacier at resolutions ranging from 39 m to 13 m, almost homogeneously in every direction. Additionally, the driving force was a pressure gradient that is in balance with a geostrophic west wind of 10 ms-1. Results show that smaller domain extents produce less friction between the wind flow and the mountainous terrain, whereas the largest evaluated domain yields higher ABL depth and more intensive turbulence over the glacier. Moreover, refined mesh enhances the magnitude of resolved-scale turbulence and improves the quality of the resolved wind field by reducing numerical oscillations. It is also illustrated how, under the simulated conditions, the majority of the glacier is exposed to elevated turbulence levels, evaluated through turbulence kinetic energy (TKE) and Reynolds stresses, especially near sharp ridges. In addition to wind flow characterization, these findings also provide guidance for the setup of numerical domains and grid resolutions in LES simulations over complex terrain, contributing to improved modeling of wind dynamics and turbulence in mountainous environments.

How to cite: Balbontín, J., Sakai, Y., and Manhart, M.: Large-Eddy Simulations of the Wind Field over the Vernagtferner Glacier in Austria, EGU General Assembly 2026, Vienna, Austria, 3–8 May 2026, EGU26-20892, https://doi.org/10.5194/egusphere-egu26-20892, 2026.

EGU26-21253 | Orals | AS2.1

Across-scale boundary layer processes in complex urban environments: the urbisphere - ASSURE Bristol project  

Janet Barlow, Sue Grimmond, Joern Birkmann, Matteo Carpentieri, Andreas Christen, Nek Chrysoulakis, Omduth Coceal, James Matthews, Marco Placidi, Alan Robins, Dudley Shallcross, Stefan Thor Smith, Maarten van Reeuwijk, and Z Tong Xie

Climate change will affect most of the world’s urban population. Developing resilient urban environments requires improved weather and climate modelling. Heterogeneity exists from street (100m) to neighbourhood (1km) to city (10km) scales due to urban form and function. How should it be parameterised, given that it influences atmospheric processes acting over a similar range of scales?

To address this challenge, we combine city-scale field observations, resident interviews, high-resolution numerical (LES, NWP) and wind-tunnel (WT) modelling. The focus is on Bristol, UK, as it is compact, has representative land-use, and has coastal proximity and complex terrain. It follows other year-long urbisphere project campaigns in Berlin, Paris, Freiburg, and Heraklion.

This talk provides an overview of the WT, LES and NWP modelling and observations thus far in the project. A case study is described where the sub-neighbourhood scale Avon River Gorge influences boundary layer and dispersion processes.

How to cite: Barlow, J., Grimmond, S., Birkmann, J., Carpentieri, M., Christen, A., Chrysoulakis, N., Coceal, O., Matthews, J., Placidi, M., Robins, A., Shallcross, D., Smith, S. T., van Reeuwijk, M., and Xie, Z. T.: Across-scale boundary layer processes in complex urban environments: the urbisphere - ASSURE Bristol project , EGU General Assembly 2026, Vienna, Austria, 3–8 May 2026, EGU26-21253, https://doi.org/10.5194/egusphere-egu26-21253, 2026.

EGU26-21856 | Orals | AS2.1

At the Edge of the World: Particle Dispersion in the Atmospheric Boundary Layer over Ushuaia 

Florencia Zapata, Gholamhossein Bagheri, Eberhard Bodenschatz, Paola Rodriguez Imazio, and Florencia Falkinhoff

Understanding the individual and relative motion of particles is fundamental to characterizing transport processes in complex flows. While large-scale transport in the atmosphere is relatively well understood and measured by monitoring stations and satellite observations, our knowledge of the smaller scales, particularly at scales below  50 km within the atmospheric boundary layer (ABL), remains limited. In this region, a wide range of processes involving particles originating from the ground take place, including the dispersion of gases and aerosols, smoke from fires and wind-blown particulate matter such as dust and pollen.
A central open question concerns how pairs of particles separate from each other in realistic, non-stationary ABL conditions, where turbulence, shear, and surface forcing coexist across a broad range of scales. Most in-situ studies have focused on mid-latitude environments and on relatively large spatial and temporal scales, often tracking particle motion over several days, whereas the Global South remains comparatively unexplored. Yet, these regions host  dynamically rich regimes that provide a natural stress test for transport theories developed under more idealized conditions.
Here we present an in-situ study of pair dispersion in the ABL over Ushuaia, Argentina, based on Lagrangian measurements extending from the surface up to approximately 3 km above ground level. We launch up to 10 simultaneous small, lightweight, and biodegradable balloons into the atmosphere and track them for up to two hours using commercial radiosondes. This work aims to provide new observational insight on relative dispersion at small scales in a complex ABL setting and to contribute to a more physically grounded understanding of atmospheric transport. 


How to cite: Zapata, F., Bagheri, G., Bodenschatz, E., Rodriguez Imazio, P., and Falkinhoff, F.: At the Edge of the World: Particle Dispersion in the Atmospheric Boundary Layer over Ushuaia, EGU General Assembly 2026, Vienna, Austria, 3–8 May 2026, EGU26-21856, https://doi.org/10.5194/egusphere-egu26-21856, 2026.

EGU26-696 | ECS | Posters on site | AS2.2

Multivariate driver analysis and moisture attribution of the December 2023 Tuticorin floods 

Nikhil Ghodichore and Vinnarasi Rajendran

Between 17th -18th December 2023, Tuticorin district and adjoining regions in Southern India experienced an exceptional extreme precipitation event, receiving approximately 950 millimetres of rainfall within 24 hours, leading to severe inundation and extensive losses to agriculture and infrastructure. The fact that the amount of rainfall received on a single day exceeded the average annual rainfall over Tuticorin makes this event particularly noteworthy. This study investigates the hydrological and meteorological drivers responsible for this rare extreme event using high resolution reanalysis datasets and India Meteorological Department 0.25° gridded precipitation data. The influence of Integrated water Vapour Transport (IVT), along with other dynamic factors such as atmospheric instability and total column water vapour on the extreme precipitation is assessed using a factor combination methodology based on conditional probability. Additionally, to reveal the moisture sources for this event, the backward trajectory of moisture particles was traced using HYbrid Single Particle Lagrangian Integrated Trajectory (HYSPLIT) model. Results reveal that all three factors exceeded their 99th percentile thresholds, with their peaks occurring one day prior to the rainfall maximum, indicating a strong preconditioning of the atmosphere for extreme convection. HYSPLIT results confirmed sustained moisture influx from the Bay of Bengal and equatorial Indian Ocean up to seven days before the event. A comparative evaluation across El Niño years (1991, 1997, 2005, 2015, and 2023) showed that only the 2023 event exhibited concurrent extremes in all parameters. These findings underscore the compound nature of the 2023 Tuticorin flood and highlight the need for integrated moisture diagnostics in predicting future extreme rainfall events over peninsular India.

How to cite: Ghodichore, N. and Rajendran, V.: Multivariate driver analysis and moisture attribution of the December 2023 Tuticorin floods, EGU General Assembly 2026, Vienna, Austria, 3–8 May 2026, EGU26-696, https://doi.org/10.5194/egusphere-egu26-696, 2026.

EGU26-1138 | ECS | Posters on site | AS2.2

Increased PM levels influence leaf conductance and modify transpiration dynamics, altering groundwater levels in IGP India. 

Sombir Pannu, Prakhar Shrivastava, Vikram Singh, Usha Mina, Chandan Gupta, Bhupinder Singh, Piyush Jain, and Mayank kumar

Aerosols affect the worldwide plant environment in both beneficial and harmful ways. Despite its potential importance, its direct influence on plant–water interactions is little known. Tomato plants were grown in ambient urban air, filtered air, and severely polluted air following precise exposure procedures. While measuring transpiration rate and stomatal density, leaf hydration kinetics, microscopic leaf wetness creation, and aerosol deposition patterns were also assessed.

The experiment was conducted from August 2025 in three plant-growing chambers at IIT Delhi. Temperature and RH were the same. At plant level, plants were exposed to natural daylight (up to 1500 µmol m⁻² s⁻¹). Leaf dust deposition was monitored. Every other day, elevated chambers were sprayed with dust, while HEPA filters cleaned air in filtered chambers. PM2.5 deposition on leaves ranges from 50 µg/cm² to 600 µg/cm² for HEPA filter-equipped and increased PM conc. chambers, respectively. During the monitoring period, PM2.5 levels at several locations in the area averaged 150-600 µgm⁻³.Net photosynthesis, stomatal conductance, and transpiration rate were measured in real time using LI-COR 6400XT.

The mass accumulated on leaves was 10 to 12 times more in the elevated PM chamber. Fresh leaves from plants grown under reduced, ambient, and elevated chamber conditions were collected, affixed to specimen holders using adhesive Leit tabs, and analysed using environmental scanning electron microscopy. Stomatal density was seen to have risen (~170 per mm²) from the seedling stage. The minimum leaf conductance (gmin) was measured on leaflets. Photosynthetic rate increased from 14 µmol m⁻² s⁻¹ to 21 µmol m⁻² s⁻¹. The gmin is anticipated to rise when dust deposition on leaves increases. The rise in water uptake by plants suggests that phenomena such as hydraulic activation of stomata (HAS) or heat retention by deposited aerosols have intensified water loss, either through cooling themselves from the heat absorbed from excessive dust accumulation or by forming wicks into the leaves from the salts in the aerosols, thereby facilitating the escape of water from leaves into the environment through evaporation. The Fv/Fm ratio, a measure of photosynthetic efficiency, was maximised in the lowered chamber.

The impact of aerosols on plants is contingent upon their composition, species, and environmental conditions, affecting the movement of water via stomata and cuticular transpiration. Research indicates that ambient aerosol deposition in polluted urban environments elevates gmin, transpiration rates and modified stomatal density. Severity of impact increases pollution levels and hygroscopic aerosols due to extended exposure. Aerosol-induced water loss diminishes stomatal regulation, impairs drought resilience and water usage efficiency, and complicates carbon-water flow scaling. The increased transpiration rate leads to greater water consumption by plants, which might contribute to the depletion of groundwater levels in the IGP India. Additional investigation is required to elucidate the processes connecting aerosol deposition and stomatal response, considering their significance for global climate change.


How to cite: Pannu, S., Shrivastava, P., Singh, V., Mina, U., Gupta, C., Singh, B., Jain, P., and kumar, M.: Increased PM levels influence leaf conductance and modify transpiration dynamics, altering groundwater levels in IGP India., EGU General Assembly 2026, Vienna, Austria, 3–8 May 2026, EGU26-1138, https://doi.org/10.5194/egusphere-egu26-1138, 2026.

EGU26-1708 | Orals | AS2.2

Cloud–Forest Coupling: New insights integrating Amazon Observations and Explicit Canopy-Cloud Simulations 

Jordi Vila-Guerau de Arellano, Robbert Moonen, Vincent deFeiter, Hugo deBoer, Oscar Hartogensis, Thomas Röckmann, and Raquel Gonzalez-Armas

Forests and clouds are central to Earth’s carbon and water cycles, yet they are rarely studied as a coupled system. Recent observations reveal concurrent shifts in forest CO₂ uptake and cloud regimes across tropical, temperate, and boreal biomes, signaling changes in forest–atmosphere coupling with profound implications for cloud cycling and climate feedbacks. While rising CO₂ may enhance forest assimilation, declining trends in low cloud cover alters radiative fluxes and amplifies warming, potentially modifying forest photosynthesis, turbulence, and biogenic volatile organic compound emissions. In turn, these processes influence clear/cloud boundary layer dynamics by controlling the partitioning of canopy turbulent fluxes, influence boundary-layer dynamics and cloud formation. Yet current Earth system models largely overlook these cross-scale interactions.

To advance our understanding on the forest-cloud coupling, we focus on the Amazon basin as a proof-of-concept where we integrate field observations from the CloudRoots-Amazon22 campaign with new multi-layer canopy large-eddy simulations that explicitly resolve interactions between the forest canopy and the clear/cloudy boundary layer. The CloudRoots-Amazon22 experiment, conducted at the ATTO and Campina supersites during the August 2022 dry season, investigated the sub-diurnal evolution of the common clear-to-cloudy transition in the Amazon.

High-frequency observations reveal that stomatal conductance responds to variations in cloud optical thickness, demonstrating that canopy–cloud radiative perturbations regulate sub-diurnal canopy carbon and water exchange. Turbulent fluxes and vertical transport adjust within minutes to cloud passages, highlighting rapid land–atmosphere coupling. Collocated surface fluxes, profiles of thermodynamic variables, and CO₂ concentrations, further establish causal links between biophysical canopy processes and cloud dynamical development.

Building on these insights, we present an integrated framework that combines high-frequency observations with turbulence-resolving simulations embedded in global storm-resolving models to quantify shifts in cloud–forest coupling under climate change. This coupled approach advances our understanding of how cloud-radiative perturbations, turbulent transport, and photosynthesis co-evolve, bridging leaf-level processes and cloud-scale dynamics, and provides a pathway to constrain key uncertainties in Earth system models.

How to cite: Vila-Guerau de Arellano, J., Moonen, R., deFeiter, V., deBoer, H., Hartogensis, O., Röckmann, T., and Gonzalez-Armas, R.: Cloud–Forest Coupling: New insights integrating Amazon Observations and Explicit Canopy-Cloud Simulations, EGU General Assembly 2026, Vienna, Austria, 3–8 May 2026, EGU26-1708, https://doi.org/10.5194/egusphere-egu26-1708, 2026.

Ultrasonic anemometers (UA) are frequently employed to measure wind, air temperature, and turbulent exchange of energy and matter in the atmospheric boundary layer. They are fast-response, linear, accurate, first-principle instruments.  Their accuracy is determined by the lengths of the acoustic paths, the direction cosines of the path geometry, and the time of flight of the acoustic signals. A fundamental limitation of UA is the self-shadowing wake effect caused by the ultrasonic transducers and support structures interfering with the flow field, leading to underestimation of the wind measurement along the acoustic paths. To minimize the transducer wake effects, numerous UA designs with different geometry, orientation, and length of the ultrasonic paths have been proposed, but there is no consensus on optimal transducer arrangement. In a widely used non-orthogonal UA design each of the three acoustic paths is tilted 60 degrees from the horizontal plane and equally spaced 120 degrees around the vertical axes. The advantage of the non-orthogonal UA is that the transducers are taken out of the horizontal plane and the three sensing paths intersect forming a small measurement volume preserving the correlation between the components of the wind vector. Alternatively, in a less common orthogonal UA design, the acoustic paths are arranged perpendicular to each other and parallel to the axes of a Cartesian coordinate system, allowing the measurement of the vertical wind component by a single pair of transducers. A disadvantage of the orthogonal UA is the large separation between the wind components and the self-shadowing effects of the transducers in the horizontal plane. To compare the performance of the orthogonal and non-orthogonal UAs we designed a unique integrated twelve-transducer probe, combining both designs in one structure with all six acoustic paths referenced to a common coordinate system. Such an arrangement reduces the uncertainty of the combined wind measurements by eliminating the need for coordinate rotation to align each UA coordinate system to the mean flow field. This study is unique because the two UAs use the same ultrasonic transducers, have equal path length to transducer diameter ratios, utilize the same time-of-flight signal processing algorithm, sample rate and measurement bandwidth. The primary difference between the two UAs is the orientation of the six acoustic paths. We demonstrate the details of the design of the combined probe and present results from a field experiment.

How to cite: Bogoev, I. and Strickler, B.: Performance Evaluation of Three-Component Ultrasonic Anemometers with Orthogonal and Non-Orthogonal Transducer Arrays, EGU General Assembly 2026, Vienna, Austria, 3–8 May 2026, EGU26-3170, https://doi.org/10.5194/egusphere-egu26-3170, 2026.

Previous commercially available closed-path eddy covariance instrumentation used to quantify fluxes of trace gases relied on large flow rates from large pumps to attain high frequency response. These pumps would require AC mains power as well as environmental protection, limiting suitable locations for deployment. Building on over 20-years of experience manufacturing field-rugged trace gas analyzers, Campbell Scientific has developed a new novel closed-path analyzer to measure methane or nitrous oxide mixing ratios. The new analyzer achieves excellent frequency response (>3Hz bandwidth) with only 1.8 LPM flow rate and typical power consumption of 40W, while maintaining excellent noise performance (<5 ppb and <1 ppb typical noise at 10Hz Allan deviation for methane and nitrous oxide respectively).

How to cite: Conrad, B.: Frequency Response of a Low-Power Trace Gas Analyzer for Eddy-Covariance Flux Measurements, EGU General Assembly 2026, Vienna, Austria, 3–8 May 2026, EGU26-3183, https://doi.org/10.5194/egusphere-egu26-3183, 2026.

EGU26-3359 | ECS | Posters on site | AS2.2

The Mashash Desert Climate Observatory: A New Megasite for Air–Land Exchange Processes in Subtropical Deserts 

Aviv L. Cohen-Zada, Moshe Armon, Elad Dente, Nili Harnik, Eitan Hirsch, Arnon Karnieli, Ilan Koren, Shira Raveh-Rubin, Maxim Shoshany, Noam Weisbrod, and Nurit Agam

Arid and hyper-arid regions (deserts) are dynamic ecosystems that respond sensitively to changes in water availability, temperature, and atmospheric CO₂, and can both indicate and influence climate change. Although approximately 27% of the world’s land surface is classified as deserts, these regions are second only to oceans in the scarcity of long-term measurement sites. This results in an inadequate representation of the complex interactions among the pedosphere, hydrosphere, and atmosphere in these regions. This knowledge gap limits understanding of desert-specific air–land processes and, given the close coupling between desert climates and the global system, contributes to uncertainty in climate projections.

To address this gap, we are establishing a first-of-its-kind megasite in the Negev Desert representing the subtropical desert belt. Israel’s relatively small size, with ~60% of its territory classified as arid or hyper-arid, makes the Negev uniquely accessible for long-term observations. The Mashash Desert Climate Observatory is built on a record of meteorological data collected at the site since 1973 and extensive micrometeorological measurements conducted in recent years.

The new megasite will generate vertically resolved surface-to-atmosphere profiles of wind, temperature, and moisture, along with detailed radiation, heat, CO2, and dust fluxes, enabling direct analysis of air–land coupling from the soil to the top of the troposphere. Co-located measurements of soil moisture, soil heat flux, and soil CO₂ efflux will allow characterization of subsurface controls on surface energy partitioning and carbon exchange. These continuous estimates will highlight the evolution of dynamics at diurnal, seasonal, and annual scales, linking surface radiative forcing to turbulent transport and boundary-layer development. Combined radiative and thermodynamic profiles will further resolve the vertical structure of moisture transport and non-precipitating systems, clarifying how episodic hydrological inputs propagate through the soil–vegetation–atmosphere continuum in desert environments. The observatory will be open to the international research community, and its data architecture is designed to be compatible with global networks (e.g., FLUXNET and NASA archiving standards), while maintaining access to raw data to ensure transparency and scientific integrity.

By providing sustained observations of air–land interactions in an understudied environment, the Mashash Desert Climate Observatory will deliver essential data for improving land-surface and boundary-layer models, support model–observation intercomparisons and remote-sensing validation, and advance understanding of multi-scale desert processes toward initial upscaling to global climate models.

How to cite: Cohen-Zada, A. L., Armon, M., Dente, E., Harnik, N., Hirsch, E., Karnieli, A., Koren, I., Raveh-Rubin, S., Shoshany, M., Weisbrod, N., and Agam, N.: The Mashash Desert Climate Observatory: A New Megasite for Air–Land Exchange Processes in Subtropical Deserts, EGU General Assembly 2026, Vienna, Austria, 3–8 May 2026, EGU26-3359, https://doi.org/10.5194/egusphere-egu26-3359, 2026.

EGU26-4241 | ECS | Posters on site | AS2.2

Assessment of Surface Energy Balance Closure at eddy-covariance sites in Diverse Alpine Environments 

Sebastiano Carpentari, Mira Shivani Sankar, Nadia Vendrame, Dino Zardi, and Lorenzo Giovannini

The surface energy balance (SEB), which defines the partitioning of energy exchange between the Earth’s surface and the atmosphere, is crucial for characterizing the development and evolution of the atmospheric boundary layer. While an accurate assessment of SEB components is essential for numerous applications, eddy-covariance measurements remain affected by significant uncertainties. Specifically, turbulent heat fluxes typically fail to balance the available energy at the surface. Research suggests that this energy balance closure problem stems primarily from advection driven by secondary circulations, which are prevalent over heterogeneous and complex terrain due to differential heating.

This study assesses the relationship between SEB non-closure, surface heterogeneity, and the subsequent development of local and mesoscale thermally driven circulations. The analysis utilizes data from seven flux sites across diverse Alpine environments (both on flat and sloped terrain) - including vineyards, pastures, pre-alpine and continental forests - incorporating at least two years of data per site, with many exceeding four years. The results provide a systematic and robust quantification of SEB non-closure across several typical Alpine contexts, highlighting key similarities and differences between sites based on their topographic features, land cover, and prevailing meteorological conditions.

The present work is part of the INTERFACE project (INvestigating ThE suRFACe Energy balance over mountain areas), which is performed in the framework of the TEAMx research programme.

How to cite: Carpentari, S., Shivani Sankar, M., Vendrame, N., Zardi, D., and Giovannini, L.: Assessment of Surface Energy Balance Closure at eddy-covariance sites in Diverse Alpine Environments, EGU General Assembly 2026, Vienna, Austria, 3–8 May 2026, EGU26-4241, https://doi.org/10.5194/egusphere-egu26-4241, 2026.

EGU26-5034 | Posters on site | AS2.2

Why Maize Sometimes Behaves Like Pine: Throughfall Microstructure and LAI Influence 

Katarina Zabret, Lana Radulović, Borbala Szeles, Juraj Parajka, Dušan Marjanović, Urša Vilhar, Janez Pavčič, Mark Bryan Alivio, Tamara Kuzmanić, Klaudija Lebar, Nejc Bezak, Peter Strauss, Günter Blöschl, and Mojca Šraj

When vegetation intercepts precipitation, the quantity of rainwater reaching the ground is affected, as it passes through the canopy, drips from it, and runs down the stem. Interception also significantly alters the characteristics of rainfall, which is among others reflected in differences in the number, size and velocity of raindrops. Throughfall drop size distribution was monitored and analysed for three vegetation types, including a single pine tree in an urban park, trees in an urban mixed forest, and a maize field in an agricultural area. Velocity-diameter diagrams were compiled for the 33 selected throughfall events and grouped into three distinct clusters based on similarity using a hierarchical clustering approach. Pine throughfall events were grouped in Cluster 1, urban mixed forest events in Cluster 2, while maize events were split between Clusters 1 (with all the pine tree events) and Cluster 3. A detailed analysis of rainfall microstructure characteristics under maize and pine canopies was conducted in relation to the rainfall event conditions and crop growing stage to evaluate why, in some cases, throughfall microstructure under maize is similar to that beneath pine (events assigned to Cluster 1), and, in other cases, it differs (events assigned to Cluster 3). Throughfall events in Cluster 3 were generally larger and more intense, showing a unimodal temporal distribution. In contrast, maize throughfall events in Cluster 1 exhibited a bimodal distribution, with two intensity peaks separated by a rainfall break. Notably, the maize leaf area index (LAI) exceeded a value of 4 during the period when the shift occurred from the events assigned in Cluster 1 to the subsequent events assigned in Cluster 3. As maize leaves mature, they become less flexible and do not bend as much under the weight of rain. Consequently, throughfall consist of more drips (larger drops) than direct rainfall (smaller drops). Further research could include additional types of vegetation, and the results could be supported by measurements over a longer period of time. These values could also be used for direct analyses of rainfall erosivity.

Acknowledgment: This contribution is part of the ongoing research project entitled “Evaluation of the impact of rainfall interception on soil erosion” supported by the Slovenian Research and Innovation Agency (J2-4489) and the Austrian Science Fund (FWF) I 6254-N.

How to cite: Zabret, K., Radulović, L., Szeles, B., Parajka, J., Marjanović, D., Vilhar, U., Pavčič, J., Alivio, M. B., Kuzmanić, T., Lebar, K., Bezak, N., Strauss, P., Blöschl, G., and Šraj, M.: Why Maize Sometimes Behaves Like Pine: Throughfall Microstructure and LAI Influence, EGU General Assembly 2026, Vienna, Austria, 3–8 May 2026, EGU26-5034, https://doi.org/10.5194/egusphere-egu26-5034, 2026.

EGU26-5092 | ECS | Posters on site | AS2.2

Transport of blowing snow particles through turbulent motions 

Samuele Viaro

In mid-latitudes, and over polar regions, a vast majority of precipitations are linked to the production of ice crystals in clouds. Cloud microphysical processes of complex mountain regions, where mixed-phase clouds (MPC) are consistently present, are therefore better represented if the number of ice crystals are correctly estimated. However, observations have shown that measured ice crystal number concentration (ICNC) can exceed the concentration of ice nucleating particles by orders of magnitude. Moreover, model simulations that rely mainly on primary ice production mechanisms usually underestimate ICNC when compared with observations. Blowing snow particles (BSP) are believed to be one of the causes affecting this discrepancy, but their influence on ICNC in MPS remains poorly understood. Our research uses the numerical model CRYOWRF, which includes blowing snow prognostic equations coupled with the advanced land surface snow model SNOWPACK, to analyze how BSP influence the highly nonlinear cloud microphysics and ICNCs. Numerical results are then validated with observation data from the Cloud and Aerosol Characterization Experiment (CLAVE) 2014 campaign at Jungfraujoch. Results show that, when high wind velocities trigger blowing snow transport, due to the strong updraft typical of mountain regions, BSP reach high levels in the atmosphere thus affecting precipitation and snow redistribution.

How to cite: Viaro, S.: Transport of blowing snow particles through turbulent motions, EGU General Assembly 2026, Vienna, Austria, 3–8 May 2026, EGU26-5092, https://doi.org/10.5194/egusphere-egu26-5092, 2026.

EGU26-5481 | Orals | AS2.2

Integrated observations and atmospheric modeling to bridge the scaling gap from local to landscape 

Mathias Göckede, Sanjid Backer Kanakkassery, Abdullah Bolek, Nicholas Eves, Kseniia Ivanova, Lara Oxley, Elliot Pratt, Mark Schlutow, Nathalie Triches, Judith Vogt, Elias Wahl, Theresia Yazbeck, and Martin Heimann

Many natural ecosystems are subject to fine scale variability in biogeophysical and biogeochemical properties, consisting of a mosaic of patches with individual characteristics in e.g. vegetation, hydrology, or microclimate. Carbon cycle fingerprints between patch types may exhibit strong differences, and reactions to current variability in external forcing as well as to future climate change may substantially differ across spatial gradients of often just a few meters or less. Capturing a representative carbon budget for such landscapes is highly challenging, since footprints of common observation techniques are either rather small with limited representativeness (e.g. flux chambers), or rather large and therefore aggregating signals across multiple patch types (e.g. eddy covariance).

This study is based on a 2025 field campaign at Stordalen Mire in Northern Sweden, a highly structured wetland consisting of a patchwork of fens, bogs, palsas and open water areas. Observational platforms included 2 eddy covariance towers with different instrument heights but nested footprints, stationary (fixed collars) and mobile chamber flux measurements within the tower footprints, a floating mobile auto-chamber system for distributed observations across different lakes and lake zones, and a drone equipped with in-situ greenhouse gas analyzers and meteorological sensors for landscape-integrating surveys using grid, curtain and profile flights. Since all platforms focused their observations on the same wetland section (about 500x500m), our dataset allows to merge detailed process information for individual ecosystem patches (e.g. from flux chamber data) with the landscape-scale integrative products (e.g. by eddy towers or drone).

We present results from different scaling approaches for deriving ecosystem-scale CO2 and CH4 budgets and variability, including e.g. data-driven upscaling, decomposition of eddy-covariance observations into patch-level fluxes, and local scale inversion of drone observations, each focusing on different subsets of the observational database. Through combining all data streams we aim at reducing uncertainties in wetland-scale carbon budgets as well as in the assessment of flux representativeness for the larger region. Comparing upscaled fluxes reveals strengths and weaknesses of individual data streams for constraining net carbon budgets and identifying functional controls, and delivers guidelines towards optimum upscaling strategies.

How to cite: Göckede, M., Backer Kanakkassery, S., Bolek, A., Eves, N., Ivanova, K., Oxley, L., Pratt, E., Schlutow, M., Triches, N., Vogt, J., Wahl, E., Yazbeck, T., and Heimann, M.: Integrated observations and atmospheric modeling to bridge the scaling gap from local to landscape, EGU General Assembly 2026, Vienna, Austria, 3–8 May 2026, EGU26-5481, https://doi.org/10.5194/egusphere-egu26-5481, 2026.

EGU26-6083 | ECS | Posters on site | AS2.2

Investigating the impacts of anthropogenic heat over East China with a global variable-resolution model 

Qike Yang, Chun Zhao, Xuchao Yang, Ziyin Zhang, Jiawang Feng, Gudongze Li, Zihan Xia, Zining Yang, Mingyue Xu, and Jun Gu

Anthropogenic heat (AH) is an important urban forcing factor, with its impacts span local, regional, and larger-scale atmospheric processes. However, its multiscale effects are difficult to quantify using conventional global and regional models. Here we address this challenge by applying a global variable-resolution atmospheric model, the integrated Atmospheric Model Across Scales (iAMAS), which explicitly links urban-scale processes with regional and large-scale atmospheric feedbacks within a single modeling framework. The model employs grid spacing that transitions from 50 km globally to 3 km over the East China with 3 km to resolve the anthropogenic heat effect over urban areas. Two AH parameterizations are implemented in this study: a spatially uniform AH parameterization (UniAH) and a spatially distributed gridded dataset (GrdAH), enabling an investigation of the multiscale atmospheric impacts of different AH parameterizations. At the local boundary-layer scale, both UniAH and GrdAH indicate that AH increases near-surface temperature and planetary boundary layer height, with the strongest responses occurring in winter. Nevertheless, GrdAH reproduces observed 2-m air temperature and 10-m wind speed more accurately than UniAH. At the urban scale, both parameterizations reduce the underestimation of the urban heat island and enhance vertical motion, while producing distinct precipitation responses between urban areas and their surrounding rural regions. At larger scales associated with atmospheric circulation, both UniAH and GrdAH indicate that AH redistributes momentum, partially impeding the upper-level circulation and modifying urban-scale convergence and divergence patterns. The convergent circulation downwind of the city corresponds to enhanced precipitation, demonstrating the coupled interactions across different scales. These results highlight the inherently multiscale nature of AH effects and demonstrate the methodological value of variable-resolution modeling for capturing urban forcing and its associated multiscale atmospheric feedbacks.

How to cite: Yang, Q., Zhao, C., Yang, X., Zhang, Z., Feng, J., Li, G., Xia, Z., Yang, Z., Xu, M., and Gu, J.: Investigating the impacts of anthropogenic heat over East China with a global variable-resolution model, EGU General Assembly 2026, Vienna, Austria, 3–8 May 2026, EGU26-6083, https://doi.org/10.5194/egusphere-egu26-6083, 2026.

EGU26-6583 | Posters on site | AS2.2

Improved wavelet method for accurate high-resolution ecosystem flux estimation and time-derivative analysis 

Gabriel Destouet, Emilie Joetzjer, Nikola Besic, and Matthias Cuntz

We present two major advancements to the wavelet-based, non-stationary flux estimation method of Destouet et al. (2025), enabling accurate calculation of high-resolution (1-minute) ecosystem fluxes and their time-derivatives.

We introduce first a scale-dependent estimation process that explicitly accounts for frequency-dependent eddy correlation times. By assigning different averaging times to each frequency band, we enhances the isolation of turbulent scales, reduces flux estimation errors, and improves the separation of local turbulence from larger scales by eliminating spurious correlations around the 'spectral gap'. This advancement is particularly valuable for wavelet-based flux partitioning, as it preserves high-quality flux estimates while retaining small-scale eddies, such as those hypothesized to transport soil respiration through forest canopies.

Second, our method now enables the computation of flux time-derivatives, allowing analysis of turbulent transport dynamics and ecosystem responses to environmental changes. As a first application, we present how to optimally determine the averaging time required for observed turbulent fluxes to represent underlying ecosystem fluxes. This is achieved by analysing the co-variation of flux time-derivatives with variables such as incoming radiation and carbon storage, which reflect underlying ecosystem dynamics.

These improvements together refine high-resolution flux estimation and unlock new opportunities to investigate ecosystem dynamics from flux towers. They have been implemented in the open-source TurbulenceFlux.jl package, which is readily available for community use.

Reference:

Destouet G, Besic N, Joetzjer E, and Cuntz M (2025) Turbulent transport extraction in time and frequency and the estimation of eddy fluxes at high resolution, Atmospheric Measurement Techniques 18(13):3193–3215, doi:10.5194/amt-18-3193-2025

How to cite: Destouet, G., Joetzjer, E., Besic, N., and Cuntz, M.: Improved wavelet method for accurate high-resolution ecosystem flux estimation and time-derivative analysis, EGU General Assembly 2026, Vienna, Austria, 3–8 May 2026, EGU26-6583, https://doi.org/10.5194/egusphere-egu26-6583, 2026.

EGU26-6602 | Orals | AS2.2

Improving Urban Eddy-Covariance CO2 Flux Estimates Through Removal of Anomalies in High-Frequency Data Using the IMAS Algorithm 

Aneena Binoy, Armin Sigmund, Stavros Stagakis, and Alessandro Bigi

Urban areas are major sources of anthropogenic COemissions, contributing substantially to the global carbon budget. Accurate quantification of urban emissions remains challenging due to uncertainties in measurements and modelling approaches. Eddy covariance (EC) provides direct continuous measurements of net urban CO2 fluxes; however, flux estimates in heterogeneous urban environments can be systematically biased by unresolved micro-scale anthropogenic sources. This study investigates the efficiency of the Identification of Micro-scale Anthropogenic Sources (IMAS) algorithm (Kotthaus and Grimmond, 2012) to detect short-duration, high-frequency micro-scale signals on EC observations. IMAS removes statistically identified micro-scale events from high-frequency data prior to flux computation, enabling retention of standard 30-min averaging periods. Micro-scale event detection is based on statistical metrics computed at 1-min resolution for CO2, H2O and sonic temperature, combining kurtosis, median-based variability, and skewness-sensitive mid-range deviation referenced to a 30-min median.

We applied the IMAS algorithm to two years of continuous EC measurement data, which were collected at the Hardau tall-tower site in the city of Zurich, Switzerland, as part of the ICOS Cities project. Fluxes were measured on a mast on top of a high-rise building at 112 m a.g.l, sampling a heterogeneous footprint influenced by various sources such as residential heating, traffic, railway infrastructure and industrial activities. A local heating unit is located at a horizontal distance of 145 m south-east of the tower, which is used intermittently to support residential heating during cold periods and could potentially affect our tower measurements. Standard EC fluxes and quality control flags were computed using EddyPro software before (L1) and after (L2) the application of the IMAS algorithm. Flux differences between L1 and L2 show a strong dependence on wind direction, with the largest reductions in L2 occuring for sector spanning 120–160°, centered on the direction of a nearby local heating unit (~141°) within the urban footprint. During winter, standard EC processing (L1) overestimates CO2 fluxes by 3.96 ± 0.43 µmol m-2 s-1 (mean ± standard error of the mean) for wind originating from this sector, corresponding to a relative reduction of ~17 % after the IMAS-based removal of micro-scale events. Smaller but consistent mean reductions are also observed for H2O fluxes (0.039 ± 0.005 mmol m-2 s-1, ~12 %) and sensible heat fluxes (4.82 ± 0.75 W m-2, ~38 %). In contrast, IMAS-induced flux changes during summer were minimal. These results demonstrate that unresolved micro-scale emissions can propagate directly into urban CO2 flux calculations, highlighting the need for source-aware, high-frequency preprocessing to complement standard EC quality control in urban carbon flux monitoring.

How to cite: Binoy, A., Sigmund, A., Stagakis, S., and Bigi, A.: Improving Urban Eddy-Covariance CO2 Flux Estimates Through Removal of Anomalies in High-Frequency Data Using the IMAS Algorithm, EGU General Assembly 2026, Vienna, Austria, 3–8 May 2026, EGU26-6602, https://doi.org/10.5194/egusphere-egu26-6602, 2026.

EGU26-6756 | ECS | Posters on site | AS2.2

Tracing Carbon Flux Dynamics and Ecosystem Functioning Along a Land-Use Gradient: Long-Term Eddy Covariance Observations in the western Italian Alps 

Daria Ferraris, Marta Galvagno, Ludovica Oddi, Gianluca Filippa, Edoardo Cremonese, Paolo Pogliotti, Federico Grosso, Umberto Morra di Cella, Sofia Koliopoulous, Chiara Guarnieri, Georg Wohlfahrt, Georg Leitinger, Mirco Migliavacca, Albin Hammerle, and Dario Papale

This study reports a comparative investigation of two alpine research sites situated in the Aosta Valley (Italian Alps), representing distinct neighbouring ecosystems: a high-altitude grassland and a mature larch forest. Eddy covariance flux measurements have been operational since 2008 at the grassland site (2168 m a.s.l.) and since 2012 at the larch forest site (2100 m a.s.l.). Each station is fully instrumented for flux and meteorological observations using  identical instrumentation. The straight-line distance between the two sites is approximately 2.7 km and they experience comparable climatic conditions, thereby enabling direct inter-site comparisons.

The primary aim of this study is to quantify and interpret differences in the carbon dioxide exchange between these ecosystems, with particular attention to the peculiarities of the years showing extreme meteorological conditions.

The two sites represent contrasting stages along a land‑use transition gradient, where the abandoned grasslands — no longer subject to livestock grazing since 2008, when the area was fenced and permanently excluded from grazing — exhibit a progressive encroachment by woody species, ultimately evolving into mature larch stands. This is a widely documented process in the Alpine region: the abandonment of traditional grazing practices and the subsequent natural recolonization of former grasslands by forest species.

To complement this analysis, preliminary results from a third eddy covariance station, installed in 2024 within a transitional ecotone characterized by scattered small larch saplings and shrub species, will also be presented.

Overall, this study demonstrates how multi-year eddy covariance measurements can reveal differences in ecosystem functioning under the same climatic conditions but across distinct vegetation types and successional stages, offering new insights into carbon flux dynamics along alpine land-use gradients.

How to cite: Ferraris, D., Galvagno, M., Oddi, L., Filippa, G., Cremonese, E., Pogliotti, P., Grosso, F., Morra di Cella, U., Koliopoulous, S., Guarnieri, C., Wohlfahrt, G., Leitinger, G., Migliavacca, M., Hammerle, A., and Papale, D.: Tracing Carbon Flux Dynamics and Ecosystem Functioning Along a Land-Use Gradient: Long-Term Eddy Covariance Observations in the western Italian Alps, EGU General Assembly 2026, Vienna, Austria, 3–8 May 2026, EGU26-6756, https://doi.org/10.5194/egusphere-egu26-6756, 2026.

EGU26-6900 | Posters on site | AS2.2

Attributing the surface temperature difference between a northern boreal mire and forest to the differences in their surface biophysical properties 

Erkka Rinne, Juha-Pekka Tuovinen, Maiju Linkosalmi, and Mika Aurela

Restoration of drained peatlands aims to recover the natural carbon sink and storage functions of a mire but also leads to changes in the ecosystems’ biophysical surface properties and, consequently, to their local climate. Impacts of land cover changes on local temperatures are governed by both radiative and non-radiative processes, i.e. changes in albedo and energy partitioning, respectively, with the latter typically as the dominant factor.

There is evidence that the land surface temperature (LST) in degraded peatlands will tend to become similar to that in nearby intact ecosystems1. Therefore, quantifying how the differences in the surface properties between pristine mires and forests contribute to the differences in their LST is relevant to understanding the biophysical effects of peatland restoration. However, data on LST changes following a forest to mire transition are scarce.

We attribute the difference in LST between a boreal mire and forest to the differences in their biophysical surface properties: albedo, energy storage, aerodynamic resistance and bulk surface resistance to evapotranspiration. We use eddy covariance measurements of sensible and latent heat fluxes as well as supporting meteorology. The attribution methodology is the two-resistance mechanism2, but compared to previous studies we also include auto- and cross correlations between the attributed variables using second-order Taylor series expansion3. The attribution is compared between seasons based on vegetation phenology and between weather events based on climatic indicators of warm, cool, wet or dry days.

We hypothesized that contributions to LST difference from the differences in surface resistance would be important because of the very different hydrology and vegetation in the compared ecosystems. However, our results show that the importance of surface resistance was minor compared to aerodynamic resistance which is the dominant factor during spring, summer and autumn. The lower surface roughness of the open mire leads to higher aerodynamic resistance, which has been identified as a strong warming factor also in previous literature comparing forests and open ecosystem such as croplands (e.g. ref.4). During late winter with a continuous snow cover still on the mire, the higher albedo values in the mire explain most of the lower LST there. The interdependencies between the attributed variables emerge as important factors, especially when comparing between different weather conditions.


References

1. Burdun, I. et al. Satellite data archives reveal positive effects of peatland restoration: albedo and temperature begin to resemble those of intact peatlands. Environ. Res. Lett. 20, 084037 (2025).

2. Rigden, A. J. & Li, D. Attribution of surface temperature anomalies induced by land use and land cover changes. Geophys. Res. Lett. 44, 6814–6822 (2017).

3. Chen, C., Wang, L., Myneni, R. B. & Li, D. Attribution of Land-Use/Land-Cover Change Induced Surface Temperature Anomaly: How Accurate Is the First-Order Taylor Series Expansion? J. Geophys. Res. Biogeosciences 125, e2020JG005787 (2020).

4. Chen, C. et al. Biophysical effects of croplands on land surface temperature. Nat. Commun. 15, 10901 (2024).

How to cite: Rinne, E., Tuovinen, J.-P., Linkosalmi, M., and Aurela, M.: Attributing the surface temperature difference between a northern boreal mire and forest to the differences in their surface biophysical properties, EGU General Assembly 2026, Vienna, Austria, 3–8 May 2026, EGU26-6900, https://doi.org/10.5194/egusphere-egu26-6900, 2026.

The persistent lack of energy balance closure in single-tower eddy-covariance measurements remains a major source of uncertainty in surface–atmosphere exchange studies. In most eddy-covariance studies, turbulent fluxes (sensible and latent heat) underestimate available energy (net radiation minus ground heat flux), potentially affecting evapotranspiration estimates used in irrigation management, and propagating uncertainties into land-surface model evaluation and flux upscaling. One important contributor to this imbalance can be the choice of data processing steps, particularly corrections for high-frequency spectral losses, which are known to significantly influence eddy-covariance flux estimates. However, their impact on energy balance closure has not yet been sufficiently quantified for long-term cropland observations.

Here, we investigate how different high-frequency spectral correction methods affect turbulent fluxes and energy balance closure at a managed cropland site in Reinshof, central Germany. Three years of eddy-covariance data collected over rotating crops (winter wheat, winter barley, and sugar beet) during 2022–2024 were processed using EddyPro, applying both analytical (Moncrieff et al., 1997; Massman, 2000; Horst, 1997) and in situ (Ibrom et al., 2007; Fratini et al., 2012) spectral correction methods.

Results show that the choice of spectral correction methods led to differences of up to 3.5% in annual energy balance closure estimates for years using open-path gas analyzers and up to 9.4% for years using closed-path gas analyzers. The in situ correction by Fratini et al. (2012) consistently resulted in the highest energy balance closure across all years, whereas differences among analytical corrections were minor, with a maximum difference of 0.8% in 2023. These effects were driven exclusively by changes in latent heat flux, which increased by 5-15% for open-path systems and by 38% for closed-path systems at the annual scale after spectral correction.

Overall, this study demonstrates that the choice of high-frequency spectral correction methods critically affects energy balance closure estimates in long-term eddy-covariance measurements, with effects varying in magnitude between open- and closed-path systems.

How to cite: Gehrmann, M., Knohl, A., Tunsch, E., and Markwitz, C.: Comparison of high-frequency spectral correction methods for eddy-covariance fluxes over a central German cropland: effects on energy balance closure, EGU General Assembly 2026, Vienna, Austria, 3–8 May 2026, EGU26-7040, https://doi.org/10.5194/egusphere-egu26-7040, 2026.

EGU26-7041 | ECS | Orals | AS2.2

Pitfalls and precautions for understory eddy-covariance processing 

Alexander Platter, Albin Hammerle, and Georg Wohlfahrt

Understory, so within-canopy, eddy-covariance (EC) measurements of energy, water, or CO2 fluxes offer more detailed insights into ecosystem exchange dynamics. Deriving these fluxes from EC systems requires several processing steps, where some of them are only valid for the inertial sublayer (i.e., above the canopy). Here we show that several of these steps are not appropriate for understory EC systems, particularly coordinate rotation, frequency-response correction, and some quality-control procedures. Using a multi-year dataset from a mountain forest site in Austria (At-Mmg), we identify some pitfalls and present precautionary measures.

An underlying assumption of the EC method is that the coordinate system is aligned with the mean flow, which in real-world conditions is not necessarily level or parallel to the surface, requiring coordinate rotations in the post processing of the wind measurements. For complex flow conditions, sectorwise planar fit is a commonly used rotation approach and is often preferred over classical double rotation. We demonstrate advantages of the less commonly used continuous planar fit, which yields more satisfactory results and substantially influences the statistics. Furthermore, the use of seasonal windows is preferable to account for seasonality in the flow structure.

High-frequency response corrections for trace gases (e.g., water vapor, CO₂) require a valid reference spectrum to compensate for instrument-related attenuation. Within the canopy, theoretical reference spectra tailored to the inertial sublayer are not applicable due to altered spectral behavior caused by vegetation elements interacting with the flow. This can introduce additional processes, such as spectral short-cutting, which strongly deviates from expected inertial sublayer behavior and is evident in our dataset. We also show that reference spectra based on temperature measurements are not reliable for trace gases at our site. We therefore explore an experimental, site-specific reference obtained by extrapolating the mid-frequency portion of the CO₂ spectrum to inform corrections.

Quality-control procedures also require revision. Standard turbulence tests assess flux–variance relationships against models to evaluate well-developed turbulence, but these relationships are valid only for the inertial sublayer. Applying them uncritically can misclassify understory data quality. Moreover, some form of low-turbulence filtering is needed. Understory EC systems enable quantification of canopy decoupling, which is becoming an attractive alternative to classical friction-velocity filtering. However, we emphasize that canopy-scale decoupling should not be used to disqualify understory fluxes: for understory measurements, the relevant coupling is between the measurement height and the forest floor, not with the entire canopy.

How to cite: Platter, A., Hammerle, A., and Wohlfahrt, G.: Pitfalls and precautions for understory eddy-covariance processing, EGU General Assembly 2026, Vienna, Austria, 3–8 May 2026, EGU26-7041, https://doi.org/10.5194/egusphere-egu26-7041, 2026.

EGU26-8096 | Orals | AS2.2 | Highlight

The thermal cost of sitting under a parasol: a biometeorological essay 

Georg Wohlfahrt and Albin Hammerle

For many people, beaches are a place they long for and emblematic for summer vacation vibes, even though environmental conditions may be actually physiologically stressful. In order to reduce radiation load, and thereby also exposure to UV radiation, the use of parasols for shading is thus common practise. The parasol, depending on the optical properties of the used fabric, attenuates part of the solar (shortwave) radiation, however at the expense of additional longwave radiation radiated in the downward direction in proportion to the surface temperature of the parasol. Here we ask the question whether sitting under a parasol may actually increase thermal discomfort as the reduction in transmitted shortwave radiation may be compensated by an increase in downward longwave radiation. To this end we have developed a model which allows simulating human thermal comfort in the open (without parasol) compared to below a parasol on a beach. Human thermal comfort is quantified with the Universal Thermal Comfort Index (UTCI). Environmental model inputs are air temperature and relative humidity, mean horizontal wind speed and incident short- and longwave radiation at some reference height above the ground surface. The attenuation of shortwave radiation by the parasol, the upward longwave radiation flux from the sand and the downward longwave radiation flux from the parasol are calculated by solving the radiative and energy balance of the parasol and the sand surface. The radiation calculations below the parasol take the modification of upper and lower hemispheric view factors into account and separately solve for the temperature of the sunlit and shaded sand surface. Our calculations show that the UTCI is generally lower under the parasol (and thus human thermal comfort higher), but differences are often small. Moreover, under certain combinations of conditions, sitting under a parasol feels hotter and we discuss which conditions favour this outcome. Finally, we demonstrate our findings for summertime conditions at some of the globally most well-know beach destinations.

How to cite: Wohlfahrt, G. and Hammerle, A.: The thermal cost of sitting under a parasol: a biometeorological essay, EGU General Assembly 2026, Vienna, Austria, 3–8 May 2026, EGU26-8096, https://doi.org/10.5194/egusphere-egu26-8096, 2026.

Precise estimates of actual evapotranspiration (ETa) are crucial for enhancing our understanding of the water and energy exchanges between land and atmosphere. These estimates are essential for applications and advancements in meteorological, climatological, ecological, and hydrological research. This study compares ET measurements obtained by two commonly used methods: eddy covariance (EC) and lysimeter (LY), based on long-term parallel measurements from 2012 to 2020. The analyses reveal a pronounced seasonal cycle in all measurements, with the highest values observed in summer and the lowest in winter. ET measurements from two lysimeters showed a significant difference of about 30% between areas of vegetation and bare soil. The ET values from the lysimeter method showed good agreement with the EC measurements, with an approximate difference of 7% between the two methods. Additionally, precipitation estimates from the lysimeter method were slightly higher than those from rain gauge measurements. The study identified air temperature as the primary controlling factor of ET, contributing nearly 60%. Net radiation and NDVI also played significant roles, with contributions larger than 10% and approximately 10%, respectively. The main causes of discrepancies between lysimeter and EC measurements were attributed to different measurement scales, varying crop growth stages, and soil moisture conditions. This study quantified ET at two different scales in nine-year period, providing valuable insights into the rational utilization of water resources in the region. The findings underscore the importance of considering measurement scales and environmental conditions when interpreting ET data for water resource management.

How to cite: Xu, Z.: Evapotranspiration measurements in the north China plain: insights from multi-years of lysimeter and eddy covariance system, EGU General Assembly 2026, Vienna, Austria, 3–8 May 2026, EGU26-8519, https://doi.org/10.5194/egusphere-egu26-8519, 2026.

EGU26-8626 | ECS | Orals | AS2.2

Coupled fire-atmosphere behavior observations from a grassland prescribed burn in a Northern California valley 

Ajinkya Desai and the iFireNet Prescribed Burn Research Team

Prescribed burns, primarily aimed at preempting uncontrolled fires, present a valuable opportunity for obtaining field measurements on fire and smoke-plume behavior at micro- and sub-microscales. However, this potential remains underutilized for comprehensive data collection with broad spatio-temporal coverage across the burn unit, in part due to underexplored instrumentation strategies and a lack of synchronous, multidisciplinary observations. During a grassland prescribed burn experiment in a valley region, situated in Trinity County, California, the diverse and extensive instrumentation deployed around the 10-acre burn unit enabled the integration of fire-induced wind patterns with fireline evolution history, air-quality measurements, and fuel characteristics. Small uncrewed aircraft system (sUAS)–based infrared imagery tracked fireline progression and spread rate, together with sUAS-based RGB video that additionally helped quantify flame height via computer-vision techniques. Moreover, high-resolution (cm-scale), sUAS-based measurements of pre- and post-burn multispectral imagery and LiDAR point cloud helped quantify burn severity and post-fire residual fuels in combination with ground-based sampling of fuel characteristics (load, height, moisture). In addition, an autonomous, nano-sized, WeatherHive sUAS swarm sampled high‑resolution temperature, relative humidity, and wind data inside the smoke plumes along “lawnmower” trajectories. An Optical Particle Sizer and a DustTrak II measured high-frequency particle size distributions and mass concentrations near the surface, and were collocated with eddy-covariance (EC) instruments along the burn-unit edges, which measured in-situ turbulence and energy flux statistics. Strong fire-induced horizontal wind convergence at the burn-unit edges was captured by the EC sensors amid variable ambient winds. Within the plume, the WeatherHive swarm recorded temperature excursions up to 8°C with upward redirection of near-surface horizontal flow into strong buoyant updrafts. The dynamic local wind direction and fireline proximity strongly modulated the observed near-surface aerosol mass and number concentrations, which were dominated by fine particulate matter (PM2.5), with background conditions recovered about 2.5 hours post-burn. Additionally, data were leveraged to evaluate a physics-based computational module utilizing the popular Reynold-Averaged Navier Stokes or RANS turbulence model. These integrated datasets provide deeper insight into coupled fire-behavior processes, while also illuminating improved measurement strategies for future experiments, including prolonged pre-burn deployment to characterize terrain-induced ambient flow and calculated sensor placement to capture the burn area flux footprint more effectively. Thus, they contribute to a growing observational database useful in advancing predictive models describing fire and smoke behavior, thereby increasing the reliance on prescribed burns for fire management.

How to cite: Desai, A. and the iFireNet Prescribed Burn Research Team: Coupled fire-atmosphere behavior observations from a grassland prescribed burn in a Northern California valley, EGU General Assembly 2026, Vienna, Austria, 3–8 May 2026, EGU26-8626, https://doi.org/10.5194/egusphere-egu26-8626, 2026.

EGU26-8997 | ECS | Orals | AS2.2

Leveraging CO2 sensor networks to address challenges in urban eddy-covariance measurements 

Armin Sigmund, Dominik Brunner, Jia Chen, Rainer Hilland, Andreas Christen, Christian Feigenwinter, Roland Vogt, Lukas Emmenegger, Markus Kalberer, and Stavros Stagakis

Eddy-covariance measurements allow us to directly monitor the vertical turbulent CO2 flux at a specific point in the urban atmosphere. Under some assumptions such as stationarity and sufficient turbulence, this flux corresponds to the net emissions in a variable footprint area. Combined with a footprint model and a biospheric CO2 flux model, this method has a high potential for validating and optimizing urban emission inventories. However, the reliability of EC measurements depends on a careful site selection, data processing and quality control. Often, sensor heights below z=50 m a.g.l. are chosen to mitigate issues associated with horizontal heterogeneity, storage flux, and horizontal and vertical advection. The storage flux describes the temporal change of the CO2 amount in the control volume between the surface and sensor height. Tall-tower sites (z>50 m a.g.l.) would be beneficial to capture emissions from a larger part of the city but require careful consideration of these issues. While a few studies have reported plausible EC measurements for urban tall-tower sites, little is known about the impact of the storage flux and advection terms. 
In the ICOS-Cities project, tall-tower EC systems and networks of mid-cost and low-cost CO2 concentration sensors were installed in three cities. Here, we aim to better quantify the storage flux and identify periods with horizontal advection by leveraging data from the sensor networks in Zurich, Switzerland, and Munich, Germany, and thus improve the reliability of the observed net CO2 emissions. The low-cost sensors were deployed in the urban canopy layer while the mid-cost sensors were mostly located at the rooftop level and collocated with wind and temperature sensors. We estimate the storage flux by dividing the control volume into three to four layers and averaging data from different sensors in the same layer. The storage flux is then added to the turbulent flux to estimate net surface emissions. To filter out periods in which this estimate is biased by horizontal advection, we consider horizontal CO2 gradients determined using mid-cost sensors at rooftop sites. This approach is compared to the often-used filtering with a friction velocity threshold.
As expected, the storage flux is most important on days with a pronounced diurnal cycle in atmospheric stability. It reduces the net CO2 emission estimates in the morning hours after sunrise and generally increases these estimates at night. From 1.5 to 5 h after sunrise, this effect amounts on average to -7.3 and -8.0 µmol m-2 s-1 in Zurich and Munich, respectively, while in the first 3.5 hours after sunset, it amounts to +4.7 and +3.0 µmol m-2 s-1 (46% and 24% of the turbulent flux) in Zurich and Munich, respectively. On days with a small diurnal cycle in stability, the storage flux plays a smaller role, especially in winter. We will also present insights in the frequency of horizontal advection and favorable conditions for it. Finally, we will discuss the plausibility of median diurnal cycles of the derived net CO2 emissions, considering the directional dependence on land cover and associated sources and sinks.

How to cite: Sigmund, A., Brunner, D., Chen, J., Hilland, R., Christen, A., Feigenwinter, C., Vogt, R., Emmenegger, L., Kalberer, M., and Stagakis, S.: Leveraging CO2 sensor networks to address challenges in urban eddy-covariance measurements, EGU General Assembly 2026, Vienna, Austria, 3–8 May 2026, EGU26-8997, https://doi.org/10.5194/egusphere-egu26-8997, 2026.

EGU26-9186 | Posters on site | AS2.2

Diagnosing LE  

Marie-Claire ten Veldhuis, Judith Jongen-Boekee, and Bas van de Wiel

Despite its omnipresence in atmospheric models, the Penman-Monteith (PM) equation often fails to represent the latent heat (LE) flux accurately. Deviations of several tens of % between modelled and observed LE flux are not an exception. The original PM equation assumed a constant stomatal resistance in time, but most current atmospheric models implement a varying resistance that depends on atmospheric conditions such as radiation, temperature and vapor pressure, while more recent models account for plant physiological stomata control.

In this study, we present a diagnosis of LE fluxes modelled based on the Penman-Monteith equation combined with a fixed, an environmentally driven and a plant physiology driven stomatal conductance model versus observed LE fluxes by Eddy-Covariance. The analysis covers a decade of observations for a grass and three years for a forest site in the Netherlands. We identify atmospheric conditions where the model and observations most strongly disagree and evaluate the contribution of varying stomatal resistance models in reproducing flux observations. We demonstrate that implementing models that account for varying stomatal conductance in response to atmospheric and soil conditions does not help to improve LE model estimates for these two datasets. We investigate the role of aerodynamic versus stomatal conductance in controlling LE flux as well as the effects of diurnal effects of radiation, VPD and stomatal conductance response and how they differ between the grass and forest sites. The aim is to provide suggestions for conceptual improvements that can help resolve some of the shortcomings in the PM-based LE flux estimation. 

How to cite: ten Veldhuis, M.-C., Jongen-Boekee, J., and van de Wiel, B.: Diagnosing LE , EGU General Assembly 2026, Vienna, Austria, 3–8 May 2026, EGU26-9186, https://doi.org/10.5194/egusphere-egu26-9186, 2026.

EGU26-10099 | ECS | Orals | AS2.2

The essence of the Webb, Pearman and Leuning (WPL) correction: w-  correction 

Hanshu Wang, Yaoming Ma, and Jinshu Chi

Vertical wind velocity (w) and gas density (c) are two key variables for estimating trace gas fluxes using the eddy covariance (EC) technique. For many decades within the EC community, the Webb, Pearman and Leuning (WPL) theory proposed by Webb et al. (1980) has been widely accepted as a “density effect correction” for flux calculations. However, we found that Webb et al. (1980) derived their equations correctly by calculating the unmeasurable mean vertical velocity (

How to cite: Wang, H., Ma, Y., and Chi, J.: The essence of the Webb, Pearman and Leuning (WPL) correction: w-  correction, EGU General Assembly 2026, Vienna, Austria, 3–8 May 2026, EGU26-10099, https://doi.org/10.5194/egusphere-egu26-10099, 2026.

EGU26-10326 | ECS | Orals | AS2.2

The Complex Role of Semi-Arid Afforestation-Atmosphere Interactions In Shaping Local Weather 

Yotam Menachem, Leehi Magaritz-Ronen, Eyal Rotenberg, Lior Hochman, Shira Raveh-Rubin, and Dan Yakir

The effects of desert afforestation, such as those used for climate change mitigation, during extreme heat events remain an important yet unresolved question. The well-studied, semi-arid Yatir pine forest, located at the edge of the Negev Desert, provides a unique lens through which we study land surface-atmosphere interactions.

Due to high incoming solar radiation and low albedo, the Yatir Forest's net radiation is higher than in any other eco-region. The massive radiation load is balanced by large sensible heat flux, which can influence the forest microclimate and create a thermal contrast with the surrounding shrubland. These processes, in turn, can affect near-surface atmospheric conditions and boundary-layer dynamics.  

Here, we combine in-situ measurements with high-resolution ICON-LAM simulations to offer new insights into the role of local afforestation in shaping surface weather and boundary-layer dynamics during extreme heat events. The in-situ observations not only describe the forest’s physical and physiological properties but also provide essential inputs for the model, enabling an integrated framework that captures known forest-scale processes and demonstrates their upscaling effects across the region.

Our simulations of a heat wave event from May 20 to May 24, 2019, reveal midday sensible heat flux increases of up to 300 W m⁻² within the forest, resulting in surface (skin) cooling of up to 15 °C, while simultaneously producing warming of up to 2 °C in 2-m air temperature. These contrasts generate pronounced modifications in wind patterns and a distinct forest-induced circulation. Remarkably, this circulation produces strong local instability even under synoptic conditions dominated by harsh subsidence. Our findings underscore the complex and sometimes counterintuitive role of semi-arid afforestation during extreme heat events, with important implications for land-management strategies under different atmospheric forcing regimes.

How to cite: Menachem, Y., Magaritz-Ronen, L., Rotenberg, E., Hochman, L., Raveh-Rubin, S., and Yakir, D.: The Complex Role of Semi-Arid Afforestation-Atmosphere Interactions In Shaping Local Weather, EGU General Assembly 2026, Vienna, Austria, 3–8 May 2026, EGU26-10326, https://doi.org/10.5194/egusphere-egu26-10326, 2026.

EGU26-10726 | ECS | Posters on site | AS2.2

Influence of Atmospheric Water Harvesting on Coupled Land Surface-Atmosphere Processes 

Richard Owusu, Stefan Kollet, Stefan Poll, and Victor Selmert

Direct Air Capture (DAC) technologies designed for atmospheric water harvesting are increasingly being considered as a means of supplying water for green hydrogen production, particularly in arid and semi-arid regions. However, large-scale moisture removal from the atmosphere may affect the thermodynamics of the planetary boundary-layer, yet the magnitude and spatial characteristics of these impacts remain insufficiently characterized. In this study, we implement a physically based DAC parameterization within the ICOsahedral Nonhydrostatic (ICON) model, using Large-Eddy Simulation (LES) to explicitly resolve land–atmosphere exchange processes. DAC operation is represented as an imposed constant moisture extraction flux subtracted from the surface latent heat flux, with configurations spanning a range of flux densities (0–800 W/m) and deployment scales (4–900 units). Simulations reveal systematic near-surface warming and atmospheric drying associated with DAC operation. From the results High flux densities (>= 400 W/m^2)  1) reduce specific humidity of the local lower atmosphere by ~0.2 g/kg, and that of the land surface by 3.5 g/kg relative to the control, 2) decrease relative humidity by ~4 percentage points, 3) and increase virtual potential temperature by ~0.5 K with no significant regional effect. In addition, Large-scale deployments yield spatially distributed but cumulative effects both at the local and regional scale, producing domain-mean warming of ~0.5 K and specific humidity reductions of ~0.1–0.4 g/kg. These perturbations arise from suppressed evaporative cooling and reduced near-surface moisture availability, which may lead to modified local energy partitioning without fundamentally altering boundary-layer stability in the atmospheric boundary layer. For deployment densities above ~400 units, non-physical negative humidity values emerge, indicating that the extraction of moisture exceeds the atmospheric supply—a flux threshold for single unit DAC operation under the atmospheric conditions used here in the study. The results demonstrate that DAC-induced thermodynamic perturbations are non-negligible at both local and regional scales and can influence turbulent mixing, boundary-layer structure. This work provides a quantitative foundation for incorporating DAC into land-surface design, environmental regulation, and future deployment strategy for atmospheric water harvesting systems.

How to cite: Owusu, R., Kollet, S., Poll, S., and Selmert, V.: Influence of Atmospheric Water Harvesting on Coupled Land Surface-Atmosphere Processes, EGU General Assembly 2026, Vienna, Austria, 3–8 May 2026, EGU26-10726, https://doi.org/10.5194/egusphere-egu26-10726, 2026.

Dynamic sub grid-scale turbulence closures require explicit spatial filtering to separate resolved and sub filter-scale contributions. In unstructured-grid atmospheric models such as ICON, constructing consistent filtering operators is nontrivial due to the triangular mesh and the staggered placement of prognostic variables on cells and edges. This work presents the implementation of a spatial filtering framework for the ICON nonhydrostatic dynamical core, designed as methodological infrastructure for scale-aware turbulence modeling.

A coarse-graining filter based on neighbor averaging has been developed on the ICON triangular grid. Cell-centered variables are filtered using edge-connected neighboring cells, while edge-centered variables are treated consistently using the adjacent cell-edge connectivity. The filter may be applied iteratively to achieve a prescribed effective filter width and is compatible with ICON’s block-based data layout on an unstructured mesh.

The filtering operators are integrated into the diffusion module as a diagnostic operation applied after explicit diffusion and halo synchronization, ensuring consistency across MPI subdomain boundaries. Ongoing work focuses on extending this framework toward a dynamic Smagorinsky-type closure using a test-filter formulation.

How to cite: Baksi, A.: Spatial filtering framework for scale-aware turbulence modeling on the ICON unstructured grid., EGU General Assembly 2026, Vienna, Austria, 3–8 May 2026, EGU26-10777, https://doi.org/10.5194/egusphere-egu26-10777, 2026.

EGU26-11416 | Posters on site | AS2.2

Spatial variability of the diurnal cycle of heat fluxes in the atmospheric boundary layer over agricultural land and forest of the GLAFO site in Stuttgart (Germany) on a clear sky day 

Hans-Stefan Bauer, Lisa Jach, Oliver Branch, Diego Lange, Verena Rajtschan, Volker Wulfmeyer, and Kirsten Warrach-Sagi

Spatial heterogeneity of land use impacts land-atmosphere feedback and therefore the spatial and temporal variability of latent and sensible heat fluxes within the atmospheric boundary layer. This is especially visible during clear sky days without notable advection. 
In spring and summer 2025 at the GEWEX Land Atmosphere Feedback Observatory (GLAFO) site of the University of Hohenheim (Stuttgart, Germany) an extensive field campaign was performed by the research group Land Atmosphere Feedback Initiative (LAFI) funded by the German Research Foundation. During five intensive observation periods (IOPs) the GLAFO equipment, which includes two Eddy-Covariance stations, was extended by Lidar measurements of wind, humidity and temperature.
To study the three-dimensional pattern of the heat fluxes over a heterogeneous surface during the day we applied the Weather Research and Forecasting model (WRF). We used WRF in a nested configuration with resolutions of 1250 m, 250 m and 50 m, forced with ECMWF operational data for a clear sky case study on 24 June 2025. In the two inner domains, WRF was applied in Large-Eddy simulation (LES) mode with switched-off turbulence scheme. The simulated evolution of the planetary boundary layer and the influence of the land surface on its development was compared with the temporal and vertical evolution in data from the lidar systems and eddy-covariance stations. 
In addition, we focused on the vertical representation of latent and sensible heat fluxes at the different model resolutions and their dependence on the underlying land surface. This will reveal the so-called blending height, namely the height at which the horizontal distributions of the fluxes are no longer dependent on the underlying surface. The derivation of this important variable paves the way to a more physical coupling of the land surface and the atmosphere in the model.

How to cite: Bauer, H.-S., Jach, L., Branch, O., Lange, D., Rajtschan, V., Wulfmeyer, V., and Warrach-Sagi, K.: Spatial variability of the diurnal cycle of heat fluxes in the atmospheric boundary layer over agricultural land and forest of the GLAFO site in Stuttgart (Germany) on a clear sky day, EGU General Assembly 2026, Vienna, Austria, 3–8 May 2026, EGU26-11416, https://doi.org/10.5194/egusphere-egu26-11416, 2026.

EGU26-11835 | ECS | Posters on site | AS2.2

Earth’s Green Blanket: A study of Heat Transfer through Grass 

Jelle Steenge, Bas van de Wiel, Marie-Claire ten Veldhuis, Nick Romijn, and Steven van der Linden

Land-atmosphere interactions play a key role in the Earth’s climate. The surface temperature is a key parameter in calculating the latent and sensible heat flux and thus important for the closure of the surface energy balance (SEB). Yet vegetated surfaces have different properties compared to bare soil and thus behave differently. Grass-vegetated surfaces are by far the most common type of land cover, covering over 40 % of all land area. Therefore, accurate modelling of soil and grass temperatures is essential for improving numerical weather prediction models.

In current weather models, the surface temperature is often estimated using an empirical skin resistance model, which may lead to significant errors in both the phase and amplitude of the surface temperature, negatively affecting the closure of the SEB. A more refined and physics-based approach is thus needed for accurate modelling of heat transfer processes in the vegetation-soil continuum.

In this research we investigate a new modelling approach for grass-vegetated and topsoil layers, using both analytical and numerical diffusive modelling approaches, building on the work of Van Dijk (2024), where grass was treated as a homogeneous sponge-layer with a uniform thermal diffusivity. The aim is to capture the temperature dynamics within the grass (and soil) layer and compare these with millimetre-resolution observations using distributed temperature sensing (DTS) measurements, as described in Ter Horst (2025).

Results indicate that a purely diffusive model is accurate in describing the temperature dynamics within the soil, but is not fully able to capture the heat transfer within the vegetation layer accurately. Therefore, adjustments are made to the vegetation ‘sponge’-layer, adding a more realistic height-dependent density and a height-dependent (radiative) source term. 

First results from a rudimentary analytic model already show promising results for temperature profiles in quasi-steady state, both during night- and daytime. Similar temperature profile shapes to the DTS measurements are achieved, that would not have been possible for a purely diffusive model.

How to cite: Steenge, J., van de Wiel, B., ten Veldhuis, M.-C., Romijn, N., and van der Linden, S.: Earth’s Green Blanket: A study of Heat Transfer through Grass, EGU General Assembly 2026, Vienna, Austria, 3–8 May 2026, EGU26-11835, https://doi.org/10.5194/egusphere-egu26-11835, 2026.

EGU26-12061 | ECS | Posters on site | AS2.2

Turbulent Fluxes at a Sub-Arctic Peatland and the Role of Data Processing Choices in Carbon Dynamics 

Jon Cranko Page, Rasmus Jensen, Eero Koskinen, Juho Lämsä, Efrén López-Blanco, Hannu Marttila, Mikhail Mastepanov, Riku Paavola, and Torben R. Christensen

Sub-Arctic peatlands are often delicately poised at the carbon source-sink threshold. With peatlands among the most carbon-dense ecosystems on Earth, they are critical players in global climate regulation, with land–atmosphere feedbacks that can disproportionately influence climate change trajectories. However, peatland carbon dynamics, and whether they act as sources or sinks for carbon, are strongly shaped by local conditions underscoring the need for site-specific measurements of turbulent fluxes and meteorology to predict their future role in the carbon cycle. While eddy-covariance is a common and critical in-situ measurement technique, the choice of pre-processing algorithms has the potential to interfere in the clear interpretation of source or sink classification in transitional peatland regimes .  

Here, we present two years of eddy-covariance observations from a newly established eddy-covariance tower in a fen peatland in northeastern Finland. Our analysis characterises the carbon dynamics at the site and addresses a key methodological challenge that is often overlooked: the uncertainty introduced by the subjective choices inherent in eddy-covariance data processing. By generating multiple datasets using alternative processing algorithms, we quantify the sensitivity of flux estimates at the peatland to these decisions, where processing methods affect conclusions regarding its source-sink status. The results provide motivation for a framework for more robust interpretation of peatland carbon fluxes.

How to cite: Cranko Page, J., Jensen, R., Koskinen, E., Lämsä, J., López-Blanco, E., Marttila, H., Mastepanov, M., Paavola, R., and Christensen, T. R.: Turbulent Fluxes at a Sub-Arctic Peatland and the Role of Data Processing Choices in Carbon Dynamics, EGU General Assembly 2026, Vienna, Austria, 3–8 May 2026, EGU26-12061, https://doi.org/10.5194/egusphere-egu26-12061, 2026.

EGU26-12312 | ECS | Orals | AS2.2

Characterizing Scale-Dependent Variance and Flux Patterns Across Heterogeneous Permafrost Landscapes Using Airborne Measurements 

Guo Lin, Torsten Sachs, Manuel Helbig, Patrick Hogan, and Christoph Lotz

Low-level airborne eddy covariance measurements enable the characterization of how surface heterogeneity in Arctic permafrost regions influences the spatial variability of greenhouse gas exchange. This study uses the Polar-5 aircraft to collect high-frequency (20 Hz) data on wind, CO₂, and CH₄ over the Mackenzie Delta, Canada, in 2013. The aircraft operated at approximately 40–60 m above ground level (AGL), enabling detailed observation of near-surface greenhouse gas flux. Flight legs were partitioned into three regions based on surface-type classifications, elevation, and degree of surface heterogeneity. Using wavelet analyses, the scale-dependent variances and covariances (fluxes) are quantified across horizontal scales ranging from microscale (10 m – 2 km) to mesoscale (2-10 km). The results demonstrate that scalar variances exhibit clear scale dependence, linked to surface types, elevation, and the level of heterogeneity. Specifically, CH₄ and CO₂ concentrations and fluxes exhibit enhanced small-scale variability over highly heterogeneous terrain, whereas wetland- and lake-dominated regions are characterized by stronger mesoscale variability. By partitioning the domain into three regions, we highlight how the underlying state of permafrost and surface classification jointly affect greenhouse gas flux. Our findings provide a process-based framework that connects heterogeneity level, variance scaling, and the detectability of airborne fluxes in Arctic permafrost landscapes, thereby enhancing the interpretation of aircraft eddy covariance measurements for regional greenhouse gas budgets, compared to flux tower measurements.

How to cite: Lin, G., Sachs, T., Helbig, M., Hogan, P., and Lotz, C.: Characterizing Scale-Dependent Variance and Flux Patterns Across Heterogeneous Permafrost Landscapes Using Airborne Measurements, EGU General Assembly 2026, Vienna, Austria, 3–8 May 2026, EGU26-12312, https://doi.org/10.5194/egusphere-egu26-12312, 2026.

EGU26-13286 | Orals | AS2.2

Revisiting the Surface Energy Imbalance with Observed Kinetic Energy Dissipation Guided by the Generalized Thermal Energy Balance 

Jielun Sun, Gary Gary Granger, Steve Oncley, Chris Roden, Sebastian Hoch, and Chenning Tong

The disagreement between observed and theoretically expected thermal energy balances in a soil–air system at the ground surface, known as the surface energy imbalance (SEI), has been observed for over 80 years. This intriguing puzzle is marked by a systematic diurnal variation of the SEI across different surface types, beyond observational uncertainties. Guided by total energy conservation, the generalized thermal energy balance equation indicates that the traditional thermal energy balance equation based on the first law of thermodynamics would result in stability-dependent biases. Specifically, it would overestimate the thermal energy increases under convective conditions, underestimate them under stable conditions, and agree with the generalized thermal energy balance under neutral conditions. Considering the diurnal variation of the atmospheric stability within the atmospheric surface layer, these systematic biases align precisely with what field observations reveal in the SEI conundrum. In other words, the observed SEI suggests that a non-isothermal atmosphere is governed by total energy conservation. Furthermore, the limitation of the traditional thermal energy balance equation may also help explain several actively researched issues in the atmospheric boundary layer community, such as the dissimilarity between vertical temperature and humidity profiles under convective conditions and the difficulty of simulating the stable atmospheric boundary layer, including morning and evening transitions.

Turbulence kinetic energy dissipation is estimated using 4-k Hz hot-film observations at four observation heights ranging from 0.5 to 4 m. Its dependence on the atmospheric stability and wind speed is consistent with the development of turbulence driven by both thermal and mechanical forcing. These observations further demonstrate the important contribution of thermal energy transfer to kinetic energy changes, as revealed by the generalized thermal energy balance equation. Overall, this investigation provides additional evidence for the importance of interactions between kinetic and thermal energy variations in explaining the observed surface energy imbalance.


Acknowledgements: The research is supported by the U.S. National Science Foundation, AGS-2231229.


How to cite: Sun, J., Gary Granger, G., Oncley, S., Roden, C., Hoch, S., and Tong, C.: Revisiting the Surface Energy Imbalance with Observed Kinetic Energy Dissipation Guided by the Generalized Thermal Energy Balance, EGU General Assembly 2026, Vienna, Austria, 3–8 May 2026, EGU26-13286, https://doi.org/10.5194/egusphere-egu26-13286, 2026.

EGU26-13661 | ECS | Posters on site | AS2.2

Insights into planetary boundary layer height estimation from the Southern Ontario LIDar (SOLID) Mesonet  

Petra Duff, Robert Crawford, Elisabeth Galarneau, Audrey Lauer, Sylvie Leroyer, Zen Mariani, and Kimberly Strong

Planetary boundary layer height (PBLh), despite being key to atmospheric modelling parametrizations, remains difficult to consistently define, model, and observe. The Southern Ontario Lidar (SOLID) Mesonet, established by Environment and Climate Change Canada (ECCC) in and around Toronto beginning in 2022, provides an opportunity for high spatial and temporal resolution estimates of the PBLh in diverse atmospheric conditions. We present a Doppler lidar-derived PBLh data product using SOLID Mesonet observations, assessed in comparison to PBLh estimates from ECCC’s Global Environmental Multiscale (GEM) model, ERA5, and nearby radiosonde flights in Buffalo, NY. These comparisons highlight the uncertainties between various methods for PBLh estimation, particularly in stable atmospheric conditions such as overnight and in winter months, and give key insights into the accuracy of PBLh estimates for usage in atmospheric modelling as well as avenues for improvements.

How to cite: Duff, P., Crawford, R., Galarneau, E., Lauer, A., Leroyer, S., Mariani, Z., and Strong, K.: Insights into planetary boundary layer height estimation from the Southern Ontario LIDar (SOLID) Mesonet , EGU General Assembly 2026, Vienna, Austria, 3–8 May 2026, EGU26-13661, https://doi.org/10.5194/egusphere-egu26-13661, 2026.

EGU26-13713 | ECS | Orals | AS2.2

A four-Doppler Lidar study to quantify spatio-temporal heterogeneity of wind statistics over a deciduous forest during the LEAFF campaign 

Matteo Puccioni, Sonia Wharton, Stephan De Wekker, Robert Arthur, Tianyi Li, Ye Liu, Sha Feng, Kyle Pressel, Raj Rai, Larry Berg, and Jerome Fast

One fundamental assumption of surface layer flow theory is homogeneity over a horizontal plane, a hypothesis systematically challenged for many atmospheric flows. For example, variability in terrain elevation, presence of heterogeneous roughness sub-layers and mesoscale motions can alter the spatio-temporal flow evolution even over small distances (≈1 km). In this scenario, the experimental investigation of air-land interactions requires simultaneous data acquisitions at multiple sites, against which the hypothesis of flow homogeneity can be assessed. The Appalachian Mountains (in the Southeastern United States) represent a compelling environment to resolve complex flows over small distances due to their irregular terrain (800-1500 m elevation above sea level) and presence of moderately tall deciduous forests (~20 m) and open fields constituting an uneven roughness sub-layer. In this work, three nearby instrument sites (within 2 km of each another) are investigated as part of the Lidar Experiments for Assessing Flow over Forests (LEAFF) campaign located in and around a deciduous forest in mountainous Virginia (U.S.). Ten months of wind statistics are resolved both within the canopy by a well instrumented flux tower, and above it via four remote sensing Doppler Lidar (up to 300 m above ground, i.e. ≈15 times the forest height), thereby resolving the turbulent flow developing over a roughness sublayer with high statistical accuracy. The goal of the present analysis is twofold. First, to quantify the monthly variability of wind statistics induced by the annual cycles of leaf senescence and synoptic winds. Second, to quantify the heterogeneity of the wind statistics between different but closely spaced sites across different months. A year’s worth of data showed that the wind statistics are predominantly affected by synoptic forcing, while the leaf senescence cycle plays a marginal role in shaping mean wind and turbulence within the surface . Additionally, site-to-site heterogeneity is found to change following a monthly time scale, a result emphasizing the importance of selecting a sufficiently long observational period to correctly address site heterogeneity under different background flow conditions. The present study provides a compelling observational dataset to validate  numerical weather prediction tools accounting for the presence of a forest sub-layer, as well as improving our understanding of the physical mechanisms inducing flow heterogeneities over complex terrains.

How to cite: Puccioni, M., Wharton, S., De Wekker, S., Arthur, R., Li, T., Liu, Y., Feng, S., Pressel, K., Rai, R., Berg, L., and Fast, J.: A four-Doppler Lidar study to quantify spatio-temporal heterogeneity of wind statistics over a deciduous forest during the LEAFF campaign, EGU General Assembly 2026, Vienna, Austria, 3–8 May 2026, EGU26-13713, https://doi.org/10.5194/egusphere-egu26-13713, 2026.

EGU26-14605 | Orals | AS2.2

When Rain Meets Heat: Drivers of Peak Carbon Uptake in East African Drylands 

Lutz Merbold, Vincent Odongo, Matti Räsänen, Julius Omondi, Juuso Tuure, Francesco Fava, Petri Pellikka, Timo Vesala, Janne Heiskanen, Janne Rinne, Marcin Jackowicz-Korczynski, Martin Wooster, Thomas Dowling, Matthias Mauder, Rodolfo Ceriani, and Sonja Leitner

Semi-arid landscapes dominate much of Kenya, yet their contribution to regional carbon cycling remains poorly constrained, particularly regarding how peak ecosystem photosynthetic capacity responds to highly variable wet-season rainfall. Here, we synthesize eddy covariance observations from four contrasting Kenyan dryland ecosystems, including natural savannas—a managed savanna grassland at Kapiti and a wooded savanna at Choke—and croplands—a smallholder system at Maktau and a commercial farm at Ausquest. We examine how rainfall, canopy development, and atmospheric demand jointly regulate maximum net ecosystem CO₂ uptake (NEEₘₐₓ) during the wet season, when most annual carbon assimilation occurs and interannual variability in precipitation pulses is pronounced.

Site-specific relationships between rainfall and NEEₘₐₓ were derived, and responses to temperature and vapour pressure deficit (T–VPD) were analysed under light-saturated conditions to disentangle water supply effects from atmospheric constraints on photosynthesis. Across all sites, rainfall primarily acted as a trigger for peak carbon uptake, with NEEₘₐₓ increasing rapidly following rainfall onset but saturating once sufficient soil moisture supported canopy development. In natural savanna ecosystems, increasing rainfall consistently led to higher maximum leaf area index (LAIₘₐₓ) and enhanced NEEₘₐₓ, while differences between grassland and wooded savanna reflected contrasts in vegetation structure and rooting depth. In contrast, croplands exhibited a muted rainfall–NEEₘₐₓ response, with peak uptake largely governed by cropping cycles, crop type, and management practices rather than total rainfall amounts.

Under high-light conditions, temperature and VPD imposed a common upper bound on NEEₘₐₓ across all ecosystems, defining a narrow envelope of maximum photosynthetic capacity. These results demonstrate that peak carbon uptake in East African drylands emerges from interacting controls of rainfall timing, canopy development, vegetation structure, and atmospheric demand and is modulated by management and land use. Our findings provide critical constraints for land–atmosphere coupling in understudied dryland regions and have important implications for modelling carbon cycle responses under increasing rainfall variability and land-use change.

How to cite: Merbold, L., Odongo, V., Räsänen, M., Omondi, J., Tuure, J., Fava, F., Pellikka, P., Vesala, T., Heiskanen, J., Rinne, J., Jackowicz-Korczynski, M., Wooster, M., Dowling, T., Mauder, M., Ceriani, R., and Leitner, S.: When Rain Meets Heat: Drivers of Peak Carbon Uptake in East African Drylands, EGU General Assembly 2026, Vienna, Austria, 3–8 May 2026, EGU26-14605, https://doi.org/10.5194/egusphere-egu26-14605, 2026.

EGU26-14918 | ECS | Posters on site | AS2.2

A method to reduce sampling bias in multi-level tall-tower eddy covariance systems 

Konstantinos Kissas, Anastasia Gorlenko, Ziqiong Wang, Susanne Wiesner, Charlotte Scheutz, and Andreas Ibrom

Tall-tower eddy covariance (TTEC) systems are increasingly used to monitor land–atmosphere exchanges over complex agricultural and urban landscapes. However, interpreting flux estimates is challenging because the eddy covariance footprint varies significantly with meteorological conditions, which can introduce considerable bias assuming that sources and sinks are not uniformly distributed across the landscape or over the diel cycle. For fluxes with systematic diurnal patterns, such as traffic-related emissions, photosynthesis, or agricultural activities, uneven temporal sampling can prevent capturing a full daily cycle, introducing temporal sampling bias into daily flux estimates. The objective of this study was to evaluate the performance of a multi-level TTEC system in reducing footprint-related sampling bias.

The study site is located in an agricultural landscape west of Copenhagen, Denmark. A 15-month dataset (2023-2024) was collected, representing a heterogeneous landscape dominated by grassland and cropland, with scattered settlements, hedgerows, and forested areas. The TTEC system was installed on a 300 m telecommunication tower and equipped with three measurement levels at 70, 90, and 115 m. These sampling heights were selected a priori based on flux footprint estimates from wind data of a nearby tall tower, ensuring a more uniform footprint at a wider range of atmospheric stability conditions. Each level was equipped with a 3D ultrasonic anemometer (uSonic-3 Class A MP, METEK, Germany). A fast-response gas analyser was connected to the system and configured to sample air from one of the three heights at a time based on criteria related to optimal footprint size and constant flux layer requirements.

The results of the study showed that a greater number of observations were collected at the upper sampling height during daytime whereas nighttime observations were predominantly obtained from the lower level. The intermediate level was primarily used during the transition periods between day and night. The multi-level sampling scheme enabled a substantial reduction in sampling bias by actively controlling the horizontal extent of the flux footprint compared to a single-level TTEC system. Consequently, footprint size and the relative contributions of different land-cover types were more consistent across atmospheric stability regimes. The findings from this study highlight the importance of implementing a multi-level approach, particularly for TTEC systems operating over landscapes with greater heterogeneity than those typically sampled by conventional eddy covariance systems.


Acknowledgements

This project is supported by the Independent Research Fund Denmark (DFF-grant 1127-00308B - Observation System of Greenhouse Gas Sources and Sinks at the Landscape Scale for Verification of the Green Transition of Denmark). The authors wish to thank Cibicom A/S for sponsoring access to Hove telecommunication tower. 

How to cite: Kissas, K., Gorlenko, A., Wang, Z., Wiesner, S., Scheutz, C., and Ibrom, A.: A method to reduce sampling bias in multi-level tall-tower eddy covariance systems, EGU General Assembly 2026, Vienna, Austria, 3–8 May 2026, EGU26-14918, https://doi.org/10.5194/egusphere-egu26-14918, 2026.

EGU26-15855 | ECS | Posters on site | AS2.2

On the Role of Land-Atmosphere Coupling in Boundary Layer Cloud Development Over a Mixed Forest in Eastern Canada  

Lukas Rudaitis, Manuel Helbig, Xiaoli Zhou, Deklan Mengering, and Janna Heerah

Forests regulate moisture and heat fluxes in the lower atmosphere, which are inextricably linked to fair weather shallow cumulus formation within the boundary layer. Forest enhanced cloud shading thereby affects the earth’s surface radiation budget, a phenomenon that has been reasonably well studied through modelling and large-scale satellite studies. However, there is a lack of surface-based observational studies linking surface fluxes to cloud formationBy combining flux tower and ceilometer measurements in a mixed Acadian (Atlantic Canadian) forest near Fredericton, New Brunswick, we gain a unique opportunity to study land-cloud coupling using these local, surface-based flux observations. Analysis of 30-minute averaged surface-based tower measurements reveals fair weather summertime shallow cumulus formation over a 3-year period (2023-2025). Shallow cumuli occur on 160 days in total, exhibiting a clear seasonal cycle with a pronounced peak between June and August. We employ machine learning to determine the importance of environmental drivers and surface fluxes on daytime cloud fraction and cloud base height on days with shallow cumuli, with surface moisture exhibiting the strongest influence. Additionally, we show the response of shallow cumulus to extreme surface conditions by examining the period between August and September 2025. Fredericton experienced anomalously dry conditions, receiving only ~15% and ~40% of normal precipitation in August and September, respectively, during which soil moisture falls to 30% typical late-summer values. We find a significant reduction in shallow cumulus formation during the dry conditions, which we hypothesize is caused by the shift of surface flux partitioning from latent to sensible heating, and the concurrent enhancement of daytime lifting condensation level growth. 

How to cite: Rudaitis, L., Helbig, M., Zhou, X., Mengering, D., and Heerah, J.: On the Role of Land-Atmosphere Coupling in Boundary Layer Cloud Development Over a Mixed Forest in Eastern Canada , EGU General Assembly 2026, Vienna, Austria, 3–8 May 2026, EGU26-15855, https://doi.org/10.5194/egusphere-egu26-15855, 2026.

EGU26-16149 | Orals | AS2.2

On controlling regional greenhouse gas emission inventories with landscape scale flux observations 

Andreas Ibrom, Konstantinos Kissas, Anastasia Gorlenko, Ziqiong Wang, Susanne Wiesner, and Charlotte Scheutz

Effective greenhouse gas (GHG) emission policies rely on accurate and actual GHG emission data. Uncertainties in inventories arise from limited knowledge of actual activity data, the technology actually used and local ecosystem features that altogether need to be considered when estimating GHG emissions from a specific area. Independent monitoring and verification are expected to increase credibility of inventory reports and scenario estimations, ideally at the same spatial and temporal level of integration as the desired GHG inventory.

One key challenge to verify distributed anthropogenic GHG emissions with measured net GHG fluxes is that conventional GHG flux observation techniques are limited to process, facility or ecosystem scales and do rarely integrate over a representative fraction of the gross anthropogenic GHG fluxes in a region or country. We developed and built an observation system based on tall tower eddy covariance as one of the pillars of a future measurement based Danish national GHG observation system and explore its effectiveness to observe the integrated GHG exchange in a representative agricultural landscape.

We measured CO2, CH4, N2O and CO exchanges from a telecommunication mas (Hove, in a Danish agricultural landscape, West of Copenhagen (N 55.716, E12.238) for 15 months. We placed substantial efforts on estimating the origin of the measured fluxes and used this information to improve comparability of observed GHG exchanges with regional IPCC GHG emission inventories comparable.

The presentation focusses on 1. necessary processing steps for estimation of annual net GHG exchange budgets (spectral correction, data quality filtering and gap filling). 2. a novel “flux-landscape approach” to define a common reference area with inventories, and 3. an overview over the results of the comparison between observed GHG exchange and local IPCC inventory.

From these results we conclude that such comparisons strongly depend on the distinction of gross fluxes that are relevant for GHG accounting and reporting from other, biotic fluxes that are currently not climate policy relevant. This is particularly challenging for CO2, where we observe a strong net uptake, while the inventory is dominated by gross emissions.

We acknowledge funding by DFF (Independent Research Fund Denmark, ref. 1127-00308B) and sponsoring by CIBICOM A/S Ballerup Denmark.

How to cite: Ibrom, A., Kissas, K., Gorlenko, A., Wang, Z., Wiesner, S., and Scheutz, C.: On controlling regional greenhouse gas emission inventories with landscape scale flux observations, EGU General Assembly 2026, Vienna, Austria, 3–8 May 2026, EGU26-16149, https://doi.org/10.5194/egusphere-egu26-16149, 2026.

EGU26-16151 | Posters on site | AS2.2

Impact of Vertical Mixing on CO2 Simulations during the ASIA-AQ campaign 

Mina Kim, Rokjin J. Park, Jingi Jung, Sang-ik Oh, and Jaein I. Jeong

Uncertainty in vertical mixing is a major source of error in simulations of long-lived trace gases such as CO2 in atmospheric chemical transport models. We perform a set of sensitivity experiments with the GEOS-Chem model by applying different scaling factors to the vertical eddy diffusivity (Kz), thereby varying the strength of vertical mixing. Model results are evaluated using aircraft observations from the ASIA-AQ campaign conducted over Asia, a major anthropogenic CO2 source region where simulations are particularly sensitive to the representation of vertical mixing. The observations cover a wide range of boundary-layer and free-tropospheric conditions. Model–observation agreement is quantified using a suite of statistical metrics. Simulations with weaker vertical mixing consistently show better agreement with aircraft observations across regions than the default model configuration. The improved agreement reflects a better representation of the observed vertical and temporal variability. This study suggests that vertical mixing in GEOS-Chem may be overestimated over Asia and provides a basis for improving the model representation of vertical transport. 

How to cite: Kim, M., Park, R. J., Jung, J., Oh, S., and Jeong, J. I.: Impact of Vertical Mixing on CO2 Simulations during the ASIA-AQ campaign, EGU General Assembly 2026, Vienna, Austria, 3–8 May 2026, EGU26-16151, https://doi.org/10.5194/egusphere-egu26-16151, 2026.

EGU26-17086 | Posters on site | AS2.2

Quantifying Water Stress in Acer pictum subsp. mono and Hovenia dulcis Seedlings Using Thermal Imaging and Sap Flux 

Han Doo Shin, Seoyoung Park, Jiwon Baek, Ahreum Yun, Taegyu Lee, Minsu Lee, Kunhyo Kim, Jeonghyun Hong, and Hyun Seok Kim

 Land–atmosphere interactions at the leaf scale play a critical role in regulating surface energy exchange and plant water use under increasing heat and drought, yet quantitative indicators capturing short-term thermal–hydraulic coupling remain limited. This study compared seedlings of Acer pictum subsp. mono, with highly dissected leaves and low boundary-layer resistance, and Hovenia dulcis, with smoother leaves and thicker boundary layers, to test how leaf morphology constrains thermal and hydraulic regulation. Seedlings were exposed to well-watered, control, and severe-drought treatments, creating a clear soil-moisture gradient, while leaf temperature and sap flux were monitored alongside key environmental drivers. This design enabled evaluation of short-term leaf temperature variability (ΔT, 5-min scale) and its coupling with radiation and transpiration across contrasting water conditions.

 Across both species, ΔT was most strongly coupled with changes in photosynthetically active radiation(PAR). In A. mono, the PAR increase threshold triggering synchronized ΔT responses declined under severe drought (≈103 μmol m⁻² s⁻¹) relative to well-watered conditions (≈135 μmol m⁻² s⁻¹), whereas H. dulcis showed no significant treatment dependence. Under identical PAR reduction levels, higher sap velocity consistently enhanced leaf temperature declines, indicating transpiration-driven amplification of short-term cooling. At high temperatures (30–35 °C), A. mono maintained strong cooling responses, while H. dulcis exhibited flattened sap–ΔT relationships and increased ΔT amplitude under severe drought (≈5.0 °C). These results demonstrate that short-term leaf cooling emerges from the interaction between radiation forcing and transpiration, with species-specific constraints imposed by leaf morphology and hydraulic limitation. Integrating ΔT, PAR, and sap flux provides a quantitative framework for comparing thermal–hydraulic strategies among species and offers a sensitive tool for early diagnosis of drought vulnerability at the seedling stage.


How to cite: Shin, H. D., Park, S., Baek, J., Yun, A., Lee, T., Lee, M., Kim, K., Hong, J., and Kim, H. S.: Quantifying Water Stress in Acer pictum subsp. mono and Hovenia dulcis Seedlings Using Thermal Imaging and Sap Flux, EGU General Assembly 2026, Vienna, Austria, 3–8 May 2026, EGU26-17086, https://doi.org/10.5194/egusphere-egu26-17086, 2026.

EGU26-17305 | Orals | AS2.2

Disentangling the Effects of Forest Structural Heterogeneity on Observed Ecosystem Carbon and Water Fluxes 

Enrico Tomelleri, Anna Candotti, Torben Callesen, and Leonardo Montagnani
Eddy covariance (EC) measurements are essential to characterising biosphere–atmosphere exchanges of carbon (Net Ecosystem Exchange, NEE) and water vapour (Evapotranspiration, ET). However, their interpretation of structurally complex forest canopies remains challenging. EC fluxes integrate spatially variable source areas that are commonly treated as functionally homogeneous, neglecting the role of vegetation structural heterogeneity in regulating observed NEE and ET. Addressing this limitation is critical for improving flux interpretation and land-surface model parameterisation across heterogeneous forest ecosystems. We present a transferable, footprint-based framework. It integrates half-hourly EC fluxes with high-resolution Aerial Laser Scanning (ALS) data to explicitly resolve within-footprint vegetation structural heterogeneity. Using a two-dimensional flux footprint model (Kljun et al., 2015), EC fluxes were assigned according to the spatial contribution of distinct vegetation structural classes. This enables analysis of functional relationships between fluxes and the environment under comparable atmospheric forcing. The approach revealed substantial and systematic differences in both flux magnitude and functional responses among vegetation structural classes. Median differences reached up to 20 µmol m⁻² s⁻¹ for NEE and up to 5 mmol m⁻² s⁻¹ for ET. Light-response parameters and water-use efficiency varied consistently between structural groups. Our results underscore the importance of footprint heterogeneity characterisation for interpreting functional relationships in structurally complex forest ecosystems. By explicitly accounting for spatial heterogeneity within EC footprints, this framework provides a scalable pathway to link vegetation structure with ecosystem-scale carbon and water fluxes. The proposed framework is transferable to other EC sites. It offers the potential to improve the parameterisation of land-surface and dynamic global vegetation models, and ultimately to enhance predictions of biosphere–atmosphere exchange of matter and energy.

How to cite: Tomelleri, E., Candotti, A., Callesen, T., and Montagnani, L.: Disentangling the Effects of Forest Structural Heterogeneity on Observed Ecosystem Carbon and Water Fluxes, EGU General Assembly 2026, Vienna, Austria, 3–8 May 2026, EGU26-17305, https://doi.org/10.5194/egusphere-egu26-17305, 2026.

Atmospheric CO₂ measurements provide essential constraints for carbon-budget estimates and atmospheric modelling. Virtual tall tower (VTT) methods are a promising, but yet underexamined approach for upscaling ecosystem-level CO₂ concentrations measured at eddy covariance (EC) sites (typically 2–50 m above ground) to atmospheric measurements representative of tall towers (TT; ~100 m and higher). Implementing VTT approaches at existing EC stations could therefore expand the currently sparse network of TT observations. In this study, we evaluate the applicability of a VTT approach using collocated EC–TT measurements. We use 2024 data from the combined ecosystem-atmosphere station Svartberget site in northern Sweden (SE-Svb, SVB), part of the ICOS (Integrated Carbon Observation System) network, with brief examples from one or more other sites. A key advantage of the ICOS Svartberget station is that ecosystem EC and atmospheric TT measurements are available at the same location, with EC observations at 35 m and TT measurements at 35 m and 150 m. The 35 m TT measurements are an important asset for post-hoc calibration correction of the concentrations measured by the EC system, since state-of-the-art EC stations typically do not meet the high calibration requirements of a TT measurement. We implemented the VTT method proposed by Haszpra et al. (2015) and tested the gradient functions of Patton et al. (2003) and Wang et al. (2007) to define a base-run configuration. We then performed a sensitivity analysis of key variables in the VTT formulation. Model performance was evaluated using bias, root mean square error (RMSE), and correlation, by comparing VTT-estimated CO₂ concentrations at the TT top height (150 m) against measured TT concentrations. For 2024, approximately 30% of valid hourly data points met the well-mixed criteria required for VTT application. When treating EC calibration and VTT calculations as separate steps, EC calibration exerted the largest influence on estimated CO₂ at TT height, highlighting calibration as a critical prerequisite for reliable mixed-layer concentration estimates. Sensitivity analysis further showed that, when accounting for both numerical perturbations and measurement uncertainty, the planetary boundary layer height was the most influential variable, producing the largest changes in performance statistics relative to the target TT concentrations. Taken together, these results suggest that VTT approaches could increase the coverage of TT-representative atmospheric CO₂ estimates. Improving planetary boundary layer height (PBLH) estimates should further increase VTT accuracy. Further steps, VTT performance should be tested across additional sites and time periods to assess robustness under different conditions.

How to cite: Marcon-Henge, L., Graf, A., and Peichl, M.: Performance of a Virtual Tall Tower (VTT) approach for estimating CO2 concentrations in the mixed layer from eddy covariance measurements near the surface, EGU General Assembly 2026, Vienna, Austria, 3–8 May 2026, EGU26-17469, https://doi.org/10.5194/egusphere-egu26-17469, 2026.

A unified probability density function (PDF) parameterization for subgrid moist convection and turbulence is developed using a Lagrangian stochastic modeling (LSM) approach. The model solves the transport equations of the joint PDF of turbulent velocity and passive scalars by tracking an ensemble of stochastic particles governed by coupled stochastic differential equations (SDEs). Building on previously developed SDEs for particle velocity and temperature, the LSM is extended to represent inhomogeneous stratified turbulence and its entrainment process. Furthermore, using Lagrangian particle tracking data obtained from large-eddy simulations (LES) of boundary layer and moist convection cases, the SDEs are refined and their parameters are optimized to reproduce the Lagrangian statistics diagnosed from the LES. In the proposed model, turbulence statistics and turbulent fluxes are obtained directly from particle ensembles, providing a full representation of the turbulence PDF without invoking traditional closure assumptions for turbulent transport. The proposed model is evaluated against LES results for convective and stable atmospheric boundary layer (ABL) cases, including shallow convection cases. In convective regimes, the LSM realistically captures entrainment processes and reproduces mean thermodynamic profiles and turbulent fluxes that closely agree with LES results. The simulated joint PDFs exhibit pronounced non-Gaussian features and PDF separation in the entrainment zone. In stable ABL simulations, the LSM predicts realistic turbulence intensities and mean profiles, with near-Gaussian PDFs consistent with LES results. In the shallow convection case, the model simulates realistic vertical structures and variability of convection in the cloud layer. These results demonstrate that the proposed LSM framework provides a physically consistent and flexible approach for simulating both moist convection and turbulence with a full representation of the subgrid-scale PDF.

How to cite: Shin, J.: Unified PDF Parameterization of Subgrid Moist Convection and Turbulence Using a Lagrangian Stochastic Approach, EGU General Assembly 2026, Vienna, Austria, 3–8 May 2026, EGU26-18158, https://doi.org/10.5194/egusphere-egu26-18158, 2026.

EGU26-20490 | ECS | Posters on site | AS2.2

Data-Driven Parameterisations for the Multiscale Lorenz 96 System  

Miriam Ridao

Data-driven parameterisations offer a promising route to improving the representation of unresolved processes in geophysical models. In this work, the two-timescale Lorenz 96 system is used as a controlled testbed to systematically compare deterministic, stochastic, and memory-aware machine-learning closures. A range of architectures are implemented, including multilayer perceptrons, convolutional networks, recurrent models, and conditional generative approaches, and are evaluated in both offline and online settings using weather-style forecast metrics and long-term climatological diagnostics. The results show that models incorporating physically motivated inductive biases, such as stochasticity, spatial structure, or temporal memory, outperform simpler deterministic and memoryless closures. In particular, stochastic generative models and recurrent networks better reproduce regime behaviour, spatio-temporal correlations, and long-term statistics, highlighting the importance of representing intrinsic variability and non-Markovian effects. Ongoing and future work will extend this framework to more realistic dynamical systems, including quasi-geostrophic and primitive-equation models, with a focus on enforcing physical consistency, incorporating explicit memory effects, and developing hydrid physics-machine learning closures. 

How to cite: Ridao, M.: Data-Driven Parameterisations for the Multiscale Lorenz 96 System , EGU General Assembly 2026, Vienna, Austria, 3–8 May 2026, EGU26-20490, https://doi.org/10.5194/egusphere-egu26-20490, 2026.

EGU26-20896 | Posters on site | AS2.2

How important is the entrainment flux for characterizing land-atmosphere feedback in the convective boundary layer? 

Volker Wulfmeyer, Frank Beyrich, Thomas Jagdhuber, Harald Kunstmann, Matthias Mauder, Stan Schymanski, Christoph Thomas, Oliver Branch, Verena Rajtschan, Joachim Ingwersen, Natalie Orlowski, Florian Hellwig, Pauline Seeburger, Claudia Voigt, Benjamin Fersch, Anna Winkelmann, Linus von Klitzing, Moritz Schumacher, Andreas Behrendt, and Diego Lange

A high quality of the representation of land-atmosphere (L-A) feedbacks is fundamental for advancing the performance of weather forecasts, seasonal simulations, and climate projections. These feedbacks are due to a highly complex interaction of variables related to the exchange and conservation of momentum, energy, and mass. The Land-Atmosphere Feedback Initiative (LAFI, see https://www.lafi-dfg.de) is the Collaborative Research Unit 5639 funded by the German Research Foundation (DFG). The overarching goal of LAFI is to understand and quantify L-A feedbacks via unique synergistic observations and model simulations from the micro-gamma (» 2 m) to the meso-gamma (» 2 km) scales from diurnal to seasonal time scales.

The fundament to reach this goal is provided by the observation of L-A system processes and feedbacks at the Land-Atmosphere Feedback Observatory (LAFO) of the University of Hohenheim in Stuttgart, Germany. Here, a worldwide-unparalleled synergy of measurements is realized including water stable isotopes, temperature by fiber-optic distributed sensors, and a suite of atmospheric variables with turbulence resolution using scanning lidar systems.

A key research objective of LAFI is to quantify entrainment in the convective boundary layer (CBL), to separate and quantify related processes such as engulfment, and to derive similarity relationships for parameterizing entrainment fluxes. We will present first measurements of entrainment fluxes at LAFO with lidar synergy, which are typically on the order of 100-200 W/m2 around noon with respect to the latent heat. These new measurements allow for quantifying the flux divergences in the CBL that are an essential part of the heat and water-vapor budget equations. Furthermore, we will relate the entrainment flux to surface variables for characterizing feedback metrics such as the relative humidity tendency and the mixing diagram. Finally, we will present an outlook of future work and its collaboration and coordination with the Global Land-Atmosphere System Studies (GLASS) Panel of the Global Energy and Water Exchanges (GEWEX) project.

How to cite: Wulfmeyer, V., Beyrich, F., Jagdhuber, T., Kunstmann, H., Mauder, M., Schymanski, S., Thomas, C., Branch, O., Rajtschan, V., Ingwersen, J., Orlowski, N., Hellwig, F., Seeburger, P., Voigt, C., Fersch, B., Winkelmann, A., von Klitzing, L., Schumacher, M., Behrendt, A., and Lange, D.: How important is the entrainment flux for characterizing land-atmosphere feedback in the convective boundary layer?, EGU General Assembly 2026, Vienna, Austria, 3–8 May 2026, EGU26-20896, https://doi.org/10.5194/egusphere-egu26-20896, 2026.

EGU26-21639 | ECS | Posters on site | AS2.2

Enhancing Great Plains Nocturnal Precipitation and Low-Level Jets in AM4 with an Extended CLUBB Closure 

Emanuele Silvio Gentile, Vince Larson, Ming Zhao, Colin Zarzycki, and Gunilla Svensson

We extend the Cloud Layers Unified by Binormals (CLUBB) turbulence scheme within the GFDL atmospheric model (AM4) by implementing direct momentum-flux prognosis and a multiscale turbulent length scale, to improve the simulation of nocturnal precipitation and associated Low-Level Jets (LLJs) over the Great Plains (GP). Towards this aim, we set up four AM4-CLUBB configurations: diagnosed momentum flux, prognosed momentum flux, diagnosed momentum flux with a multiscale turbulent lengtshcale, and prognosed momentum flux with a multiscale turbulent lengtshcale. Simulations are evaluated against the AM4 control, the Integrated Multi-satellitE Retrievals for GPM (IMERG), and the Doppler wind radar profiles from the Atmospheric Radiation Measurement (ARM) program. Results show that all AM4-CLUBB configurations improve the precipitation timing from the unrealistic midday peak seen in the AM4 control simulation toward the satellite-observed nocturnal maximum. The configuration that prognoses momentum flux and uses a multi-scale turbulent length scale, best matches the timing and intensity of GP precipitation rate. This configuration is also that which more accurately simulates the ARM-observed nocturnal LLJ wind profiles, while increasing the frequency of counter-gradient momentum fluxes near the LLJ core compared to prognosing momentum fluxes with the original AM4-CLUBB turbulent lengthscale. Momentum budget analysis attributes this increase to a nearly fivefold enhancement in the buoyancy production term when using the multiscale formulation, and leads to stronger nocturnal convective activity, as diagnosed from the greater vertical velocity skewness and plume asymmetry.

How to cite: Gentile, E. S., Larson, V., Zhao, M., Zarzycki, C., and Svensson, G.: Enhancing Great Plains Nocturnal Precipitation and Low-Level Jets in AM4 with an Extended CLUBB Closure, EGU General Assembly 2026, Vienna, Austria, 3–8 May 2026, EGU26-21639, https://doi.org/10.5194/egusphere-egu26-21639, 2026.

EGU26-22783 | Posters on site | AS2.2

Towards dynamic closures for higher-order turbulence schemes 

Georgios Efstathiou and Peter Clark

Starting from the spatially filtered equations in the large-eddy simulation (LES) regime,
commonly used turbulence closures assume a local equilibrium between turbulence
production and dissipation, with the closure parameters representing the continuous
cascade of energy from the resolved to the subgrid scales. However, away from grid
resolutions that adequately resolve the inertial subrange of turbulence, this equilibrium
assumption breaks down. Moreover, at such resolutions, the dominant turbulent eddies
are only partially resolved, and the appropriate values of the closure parameters are
generally unknown.
In this study, we explore a dynamic closure for a prognostic turbulent kinetic energy
(TKE) scheme in a quasi-steady convective boundary layer (CBL) case, spanning
resolutions from LES toward the grey zone. The dynamic approach optimises the
closure parameters using information from the resolved small-scale turbulence,
exploiting the assumed similarity between resolved and unresolved scales. Preliminary
results show that the dynamically derived length scales exhibit the desired scale
dependency across resolutions, leading to improved agreement with LES.

How to cite: Efstathiou, G. and Clark, P.: Towards dynamic closures for higher-order turbulence schemes, EGU General Assembly 2026, Vienna, Austria, 3–8 May 2026, EGU26-22783, https://doi.org/10.5194/egusphere-egu26-22783, 2026.

EGU26-23263 | ECS | Orals | AS2.2

A Surface Layer Scheme for an Implicit Large Eddy Simulation Model 

Yuhang Tong, John Thuburn, and Georgios Efstathiou

This research focuses on improving the near-surface performance of an Implicit Large
Eddy Simulation (ILES) model. The ILES model uses the Semi-implicit semi-Lagrangian
numerical method for simulating the atmospheric boundary layer. Moreover, the model
is called an “implicit” model because it includes no explicit scheme to represent
subgrid-scale fluxes but makes use of the numerical dissipation. One of the problems
we’ve met so far is that, for example, in the neutral boundary layer case, some
simulations indicate the weakness of this model in resolving the eddies near the bottom
boundary, which can be reflected by, for example, failure to reproduce a log wind profile
for the neutral case. We hope that this type of issue can be solved by spreading the
eRect of surface flux convergence into several model layers using a surface model. The
purpose of this surface model is to minimize the inability of our ILES model to resolve
the near-surface eddies.

How to cite: Tong, Y., Thuburn, J., and Efstathiou, G.: A Surface Layer Scheme for an Implicit Large Eddy Simulation Model, EGU General Assembly 2026, Vienna, Austria, 3–8 May 2026, EGU26-23263, https://doi.org/10.5194/egusphere-egu26-23263, 2026.

EGU26-2588 | Posters on site | AS2.3

A study on the drivers of methane emissions in a eutrophic lagoon in the Baltic Sea (Darß-Zingst-Bodden chain) 

Oliver Schmale, Peter Holtermann, Volker Brüchert, Rhena Schumann, and Gerald Jurasinski

Coastal shallow water areas are important carbon dioxide sinks, but their sink strength is significantly reduced by the simultaneous emission of other greenhouse gases such as methane (CH4). These areas are often characterized by strong anthropogenic pressure from adjacent agricultural land use, which leads to increased nutrient input, high biological production, oxygen consumption through remineralization of the organic material produced, and ultimately to increased greenhouse gas production. Despite their outstanding importance for marine greenhouse gas emissions, these areas have been little studied to date and the drivers of the spatial and temporal variability of greenhouse gas distribution are poorly understood. To address this problem, we study a lagoon on the German Baltic Sea coast (Darß-Zingst Bodden chain) using a multidisciplinary approach that combines gas chemical and observational oceanographic methods with modeling. Our investigations in the summer of 2024 and 2025 show that the spatial and temporal variability of CH4 concentration in the water and emissions into the atmosphere are primarily caused by wind-driven oceanographic processes, such as water mass transport and mixing. Notably high CH4 concentrations were recorded primarily in protected reed belts and adjacent drainage ditches, indicating the particular importance of these areas as CH4 sources. The high-frequency measurements of CH4 concentrations (Equilibrator-CRDS) provided evidence that changes in water level and the associated pressure change on the sediment have an impact on the CH4 concentration in the water column. Measurements at the water surface with a floating chamber and an eddy covariance flux tower have shown that gas bubble fluxes play a significant role in atmospheric CH4 fluxes and that the intensity of gas bubble release is influenced by water level fluctuations. Our study thus provides a rare CH4 data set from shallow water areas of the German coast and, through its high-frequency data acquisition, reveals the highly dynamic variability of CH4 concentration development and underscores the importance of oceanographic processes in this context.

How to cite: Schmale, O., Holtermann, P., Brüchert, V., Schumann, R., and Jurasinski, G.: A study on the drivers of methane emissions in a eutrophic lagoon in the Baltic Sea (Darß-Zingst-Bodden chain), EGU General Assembly 2026, Vienna, Austria, 3–8 May 2026, EGU26-2588, https://doi.org/10.5194/egusphere-egu26-2588, 2026.

EGU26-2867 | Posters on site | AS2.3

The importance of short-term variability for constraining methane air–sea exchange in a coastal upwelling region  

Laura Farías, Sandy Tenorio, and Diego Narvaez

Short-term variability plays a key role in controlling air–sea CH₄ exchange in coastal upwelling systems, yet it is largely unresolved by conventional low-frequency sampling. Here, we quantify the influence of synoptic-scale variability on CH₄ content and its air–sea exchange using a buoy-based sensor system in a coastal upwelling bay off central Chile (Coliumo Bay, 36.5°S) during the upwelling season (September 2024–February 2025).

Spectral and wavelet analyses revealed a multiscale structure in surface CH₄ levels and alongshore winds, with variance dominated by periods >10 d and 3–10 d in about ~52-21% and ~40-31%, respectively. The latter variability, comprising synoptic oscillations, was mainly associated with alternating periods of active upwelling and relaxation/downwelling events.

At the synoptic scale, during active upwelling events, CH₄ effluxes averaged 25.38 ± 17.74 μmol m⁻² d⁻¹ whereas during relaxation periods effluxes were reduced by almost half (mean ± SD: 9.16 ± 9.58 μmol m⁻² d-1). These results indicate that during active upwelling events, the advection of subsurface waters rich in CH4 and wind-driven gas transfer are key factors triggering the highest CH₄ effluxes.

When the high-frequency time series is compared with a long-term (2007–2025) monthly time series from the same upwelling system, clear differences in capturing real variability emerge. Based on monthly sampling over 18 years, air–sea CH₄ fluxes were on average 9.43 ± 6.95 μmol m⁻² d-1, with a weak seasonal contrast between upwelling-favorable and non-upwelling seasons (10.5 vs. 7.5 μmol m⁻² d⁻¹). These results demonstrate that synoptic variability in CH₄ concentration and air–sea exchange exceeds seasonal variability.

An uncertainty analysis accounting for aliasing under coastal upwelling conditions indicates that high-frequency observations capture CH₄ dynamics that are otherwise missed, thereby reducing bias in coastal CH4 emission estimates. Our results underscore the need to incorporate high-frequency observations, as episodic events such as wind pulses, extreme rainfall, or atmospheric rivers, together with non-linear surface biogeochemical CH₄ production, are required to achieve a more realistic quantification of CH4 emissions from coastal upwelling systems. Main funding FONDECYT (Chile) N° 1250210

.

How to cite: Farías, L., Tenorio, S., and Narvaez, D.: The importance of short-term variability for constraining methane air–sea exchange in a coastal upwelling region , EGU General Assembly 2026, Vienna, Austria, 3–8 May 2026, EGU26-2867, https://doi.org/10.5194/egusphere-egu26-2867, 2026.

Black carbon (BC) is a strong short-lived climate forcer and an important pathway for atmospheric carbon input to the ocean. Although the Northern Indian Ocean (NIO) receives a strong outflow from the Indian subcontinent (high BC emission region), quantitative estimates of its wet deposition to the oceans which is a dominant atmospheric removal mechanism remains largely unavailable for the Bay of Bengal (BoB) and the Arabian Sea (AS). This study provides the first long-term, basin-scale assessment of BC wet deposition fluxes over the NIO for the period 2002–2022, focusing on their seasonal variability and inter annual trends.
BC wet deposition fluxes were estimated using a parameterized approach in which the flux is defined as the product of BC concentration, an empirical particle washout ratio, and the precipitation rate. Near-surface aerosol mass concentration was derived by normalizing MODIS/Aqua Level-2 MYD04_3K (Collection 6.1) derived columnar mass concentration with boundary layer height from ERA5 reanalysis. These near surface mass concentration is corrected by density followed by hygroscopic growth factor. Surface BC mass concentration is estimated by applying a black carbon mass fraction (f_BC) to the hygroscopicity-corrected near-surface aerosol mass concentrations, which is further used to compute the BC wet deposition fluxes.
Results show strong seasonal variability in BC wet deposition over the NIO, with flux maxima during the southwest monsoon driven mainly by enhanced precipitation. Inter annual variability in BC wet deposition correlates to precipitation variability, confirming rainfall as the dominant controlling factor for BC removal over the region. Basin-scale contrasts show higher wet deposition over the BoB than AS, reflecting closer proximity to major continental emission sources. Spatially, BC wet deposition is enhanced over coastal and nearshore regions compared to the open ocean, reflecting a sharp gradient from the coast toward the open ocean and highlighting a strong influence of meteorology and source proximity in BC deposition across the NIO. These results provide the constrained, long-term estimate of BC wet deposition to the BoB and AS, offering inputs for regional climate modeling and improved understanding of aerosol–monsoon–ocean interactions.

How to cite: K. Singh, S. and Tiwari, S.: Estimation of Black Carbon Wet Deposition Fluxes from the Marine Atmospheric Column over the Northern Indian Ocean, EGU General Assembly 2026, Vienna, Austria, 3–8 May 2026, EGU26-5069, https://doi.org/10.5194/egusphere-egu26-5069, 2026.

EGU26-5384 | Posters on site | AS2.3

DMS, MeSH and nanoparticles in semi-controlled deck-borne experiments using Antarctical seawaters: on the effect of UV light 

Karine Sellegri, Guillaume Chamba, Valérie Gros, Clémence Rose, Elisa Berdalet, Charel Wohl, Manuel Dall'Osto, and Rafel Simo

Among the wide variety of VOCs emitted by the oceans, sulfur-containing compounds such as dimethyl sulfide (DMS) and methanethiol (MeSH) can be particularly important due to their prominent role in the marine sulfur cycle and their fate as secondary aerosol precursors. However the quantification of DMS and MeSH emissions as a function of biological components of the ocean under variable environmental factors are still too scarce for reliable future predictions. In this study we report on measurements of natural DMS, MeSH and nanoparticle concentrations within the deckborne Air-Sea Interfacial Tanks (ASITs) and the effect of UV light on their fluxes and concentrations. These measurements were carried out near the Antarctic Peninsula during the PolarChange campaign in 2023. DMS dissolved concentrations showed maxima in the open Southern Ocean north of the peninsula (2.5-3 nM), minima in the Marginal Ice Zone (MIZ) (1 nM) and moderate along the western coast of the peninsula (around 1.5-2 nM). Fluxes measured inside the ASITs were always positive, i.e. degassing from seawater to air, with equivalent 2 m·s-1 wind speed fluxes averaged from 3.03 pmol·m⁻²·s⁻¹ for DMS to 0.64 pmol·m⁻²·s⁻¹ for MeSH. DMS emissions did not vary significantly between day/night conditions, however the ratio of MeSH to DMS did have a clear maximum at night and a decrease around midday. Cryptophytes, nanophytoplankton, and bacterial concentrations showed positive links with dissolved DMS and MeSH concentrations during the experiments. A clear negative impact of UV light on DMS and MeSH fluxes was observed with DMS net fluxes 24% higher and MeSH net fluxes 58% higher in UV light filtered ASIT, and on new particle formation that surprisingly occurred only in the absence of UV light. Interestingly, the highest impact of UV, especially on MeSH emissions, was seen during the night. UV light had also a negative impact on the development of nanophytoplankton especially in Open Southern Ocean waters, and a slight increase in phytoplankton stress at noon .

How to cite: Sellegri, K., Chamba, G., Gros, V., Rose, C., Berdalet, E., Wohl, C., Dall'Osto, M., and Simo, R.: DMS, MeSH and nanoparticles in semi-controlled deck-borne experiments using Antarctical seawaters: on the effect of UV light, EGU General Assembly 2026, Vienna, Austria, 3–8 May 2026, EGU26-5384, https://doi.org/10.5194/egusphere-egu26-5384, 2026.

EGU26-5715 | Posters on site | AS2.3

Concordia ATmospheric CHemistry – Observatory (CATCH-O): a tighter focus on the atmosphere of the Antarctic Plateau 

Rita Traversi, Silvia Becagli, Mirko Severi, Silvia Nava, Franco Lucarelli, Paolo Cristofanelli, Davide Putero, Mery Malandrino, Marco Grotti, Elena Barbaro, and Marco Roman

Atmospheric chemistry in polar areas is a key determinant for climate evolution, and many sets of data and experimental observations from both hemispheres exist to date. However, data on continuous and long-term studies and monitoring in continental polar areas, such as the Antarctic Plateau, are still very scarce. While presenting significant implementation difficulties, such observations are necessary to understand the current climate system of the Southern Ocean and the environmental variables involved in its evolution on a multi-annual scale. Furthermore, the study of atmospheric chemical composition in continental Antarctica can provide important information for the interpretation of chemical stratigraphies from ice cores, which is made complicated in these areas by post-depositional processes due to atmosphere-snow exchanges. To date, there is no permanent observatory on the Antarctic Plateau dedicated to the study of the chemical properties of atmospheric aerosols, excluding the South Pole Observatory, which is nevertheless focused on the study of climate-altering gases and the physical properties of aerosols, except for a few short-term campaigns.

For these reasons, a New Observatory dedicated to the study of the chemical composition of atmospheric aerosol and ozone at the Concordia station (Dome C), on the Antarctic Plateau (CATCH-O Project) is currently in its first phase of implementation. This facility takes advantage of solid infrastructure set up during previous Italian National Antarctic Programs. It will be able to merge Near-Real Time data (ozone concentration and selected ion markers of atmospheric sources and processes) with off-line chemical composition data obtained from sampling and subsequent chemical analysis of several atmospheric source and process markers.

Due to its central location within the Antarctic continent, its elevation (about 3230 m), its distance from the coast (about 1100 km) and from ocean sources and related biogeochemical processes, Dome C can be considered representative of a background atmosphere. In this way, the Atmospheric Chemistry Observatory of Dome C will represent a relevant research opportunity for obtaining a long-term baseline of atmospheric chemical composition in relation to the entire continent.

Here, the already available data obtained by both off-line and on-line measurements within CATCH-O Observatory will be presented for the first time.

How to cite: Traversi, R., Becagli, S., Severi, M., Nava, S., Lucarelli, F., Cristofanelli, P., Putero, D., Malandrino, M., Grotti, M., Barbaro, E., and Roman, M.: Concordia ATmospheric CHemistry – Observatory (CATCH-O): a tighter focus on the atmosphere of the Antarctic Plateau, EGU General Assembly 2026, Vienna, Austria, 3–8 May 2026, EGU26-5715, https://doi.org/10.5194/egusphere-egu26-5715, 2026.

EGU26-6641 | Posters on site | AS2.3

Extreme events in the Eastern South Atlantic Ocean enhance regional coastal N2O emissions 

Damian Leonardo Arévalo-Martínez, Hermann W. Bange, Peter Brandt, Marcus Dengler, Paula Eisnecker, Carolin R. Löscher, Gregor Rehder, Tina Sanders, Caroline P. Slomp, Tobias Steinhoff, and Peihang Xu

Coastal areas within the Eastern South Atlantic Ocean are known hotspots for production and emissions of climate-relevant trace gases. Local circulation, the occurrence of upward tracer transport events through e.g. coastal upwelling and coastally-trapped waves, and a pronounced oxygen minimum zone are crucial in setting the overall emissions of nitrous oxide (N2O) towards the atmosphere. While previous studies quantified the magnitude of cross- and along-shelf gradients of N2O in the region, its main formation pathways, and its seasonal variability, to date it is unclear at what extent extreme events might affect N2O dynamics. Given the projected increase in frequency and severity of events such as storms and oceanic heat waves, which might temporarily, yet significantly modify environmental conditions under which N2O is produced and transported across the sediment-water-air interfaces, it is therefore critical to assess the role of such events on its distribution and emissions. In this study we combine physical, chemical and microbial observations gathered during two major expeditions in 2018 and 2023 to present evidence of a hitherto unseen enhancement in air-sea fluxes of N2O in association with storm events and mesoscale activity. We show that during periods of sustained winds off Walvis Bay at 23°S, water column mixing down to 100 m depth can lead to a two-fold increase in air-sea N2O fluxes driven by the transport of enriched, near-bottom waters towards the surface, which surpasses by far values observed during typical upwelling events. Observations across a mesoscale cyclonic eddy off Angola centered at 16⎼17°S (a rare feature which is thought to occur in average 2 times per year in the region), show that both extreme warming-driven outgassing at the sea surface and enhanced upward transport of N2O-enriched waters at the eddy core play a role in enhancing the overall emissions from waters otherwise thought to be mostly representative of open ocean conditions (i.e. in near equilibrium with the atmosphere). In this contribution, we discuss the main mechanisms by which these extreme events resulted in enhanced N2O air-sea fluxes and how they might impact current marine N2O emission estimates, which due to the lack of targeted observations, do not capture this source of variability.

How to cite: Arévalo-Martínez, D. L., Bange, H. W., Brandt, P., Dengler, M., Eisnecker, P., Löscher, C. R., Rehder, G., Sanders, T., Slomp, C. P., Steinhoff, T., and Xu, P.: Extreme events in the Eastern South Atlantic Ocean enhance regional coastal N2O emissions, EGU General Assembly 2026, Vienna, Austria, 3–8 May 2026, EGU26-6641, https://doi.org/10.5194/egusphere-egu26-6641, 2026.

EGU26-7048 | Orals | AS2.3 | Highlight

Surges of acidity in UK rainwater: implications for ocean acidification? 

Brian Durham and Christian Pfrang

A low-cost project recorded unexpected surges of acidity in UK rainfall events over eight summer weeks. With hindsight we now convert the pH values to xH, thereby showing that these rain events typically have at least one acid spike-and-decay sequence.  We compared the acid decay curves with that in a solution of carbon dioxide (CO2) exposed to a blustery atmosphere, and have separately recorded similar spikes using CO2 spectrometry in the headspace above incoming rainwater. For one rain event a suite of twelve ion analyses was made at three intervals showing no other significant acid anhydride, again indicating the identity of the acidic agent as CO2.

In our most complete week, a frequency analysis showed that 8,840 of the 10,080 records had acidity of less than 3µmols [H+] per mol H2O, representing the local equilibrium state in the sample well between rain events. The remaining 1240 records show active rainfall with acidity averaging 31.3 µmols [H+] per mol water.  Adopting the conversion curve established by Butler (1982), this would represent dissolved CO2 ten times the measured local equilibrium state, i.e. ten times supersaturated, while including three spikes exceeding thirty-five times supersaturated. 

This kinetic behaviour in dissolved CO2 seems to have escaped scientific notice. If occurring over an ocean such surges would contribute to acidification, defined as `reduction in the pH of the ocean over an extended period of time, caused by uptake of CO2 from the atmosphere’ (NOAA accessed 2/11/2025).  This process is monitored on a three-hourly cycle by Global Ocean Acidification Observing Network, and we have therefore downloaded CO2  measurements for tethered buoys WHOTS and SOTS in case CO2 spikes coincide with lowered salinity as an indicator of local rainfall.

In speculating a concentrating mechanism for CO2 within the precipitating atmosphere we review 20th-century arguments for the capture of anionsby cloud ice against a 21st-century thermodynamic model of the formation of CO2 gas hydrate.

How to cite: Durham, B. and Pfrang, C.: Surges of acidity in UK rainwater: implications for ocean acidification?, EGU General Assembly 2026, Vienna, Austria, 3–8 May 2026, EGU26-7048, https://doi.org/10.5194/egusphere-egu26-7048, 2026.

Atmospheric nitrogen deposition has broad implications for global ecosystems and human health. It is largely influenced by local weather conditions and atmospheric transport, which are in turn controlled by large-scale atmospheric circulation patterns. Due to the absence of long-term atmospheric nitrogen deposition data series, the mechanisms of interannual variation of nitrogen deposition are still poorly understood. Here, we investigate relationships between atmospheric nitrogen deposition and atmospheric circulation variability and explore the underlying mechanisms. We find that there is a growing imbalance between regional nitrogen emissions and deposition in global hotspots. Atmospheric nitrogen deposition variations exhibit significant relationships with atmospheric circulation modes, with predominant influences from the El Niño–Southern Oscillation (ENSO). Additionally, we captured significant nitrogen deposition anomalies during different phases of ENSO years by altering global temperature, precipitation, and atmospheric circulation. Significant effects of ENSO on atmospheric nitrogen deposition were observed in the Eastern United States, Eastern Europe, and East Asia.

How to cite: He, Q.: Atmospheric circulation impacts on terrestrial atmospheric nitrogen deposition under growing imbalance of regional nitrogen emissions and deposition  , EGU General Assembly 2026, Vienna, Austria, 3–8 May 2026, EGU26-7272, https://doi.org/10.5194/egusphere-egu26-7272, 2026.

EGU26-9135 | Orals | AS2.3

Investigation of subcloud precipitation sublimation and evaporation with active remote sensing in Ny-Ålesund 

Andreas Foth, Lukas Monrad-Krohn, Beril Aydin, Sabrina Schnitt, Mario Mech, Kerstin Ebell, Marion Maturilli, Maximilian Maahn, and Heike Kalesse-Los

Precipitation is an essential component of the Arctic climate system as part of the hydrological cycle, linking the atmosphere and cryosphere. Much of the Arctic precipitation sublimates or evaporates before it reaches the ground due to dry sub-cloud layers. The processes are thus controlling the input of the surface mass balance.

We use long-term atmospheric observations at Ny-Ålesund, Svalbard, with vertically-pointing cloud radars and backscattering lidars to identify and quantify atmospheric sublimation/evaporation. Radar observation-based sub-cloud precipitation profiles are studied by employing a virga detection tool, the so-called Virga-Sniffer (Kalesse-Los et al., 2023). The quantification of the sublimation/evaporation is based on sub-cloud vertical gradients of radar moments. First statistical results of precipitation thermodynamical phase, virga depth, and full sublimation/evaporation altitude above ground will be shown.

We will show investigations on wind direction dependence on virga statistics. Air masses advected from the Arctic Ocean are more humid and lead to more precipitation reaching the ground and thus less virga. Air masses advected over Ny-Ålesund from Easterly directions are often characterized by low-humidity subcloud layers leading to more evaporation/ sublimation and hence a higher fraction of virga. Furthermore, the occurrence frequency of virga and surface precipitation observed during different weather regimes such as cyclones, fronts, and atmospheric rivers is contrasted.

This work was supported by the DFG funded Transregio-project TRR 172 “Arctic Amplification (AC)3“.

Refernces:

Kalesse-Los, H., Kötsche, A., Foth, A., Röttenbacher, J., Vogl, T., and Witthuhn, J.: The Virga-Sniffer – a new tool to identify precipitation evaporation using ground-based remote-sensing observations, Atmos. Meas. Tech., 16, 1683–1704, https://doi.org/10.5194/amt-16-1683-2023, 2023.

How to cite: Foth, A., Monrad-Krohn, L., Aydin, B., Schnitt, S., Mech, M., Ebell, K., Maturilli, M., Maahn, M., and Kalesse-Los, H.: Investigation of subcloud precipitation sublimation and evaporation with active remote sensing in Ny-Ålesund, EGU General Assembly 2026, Vienna, Austria, 3–8 May 2026, EGU26-9135, https://doi.org/10.5194/egusphere-egu26-9135, 2026.

EGU26-9820 | ECS | Orals | AS2.3

Eddy covariance CO2 air-sea fluxes under variable surfactant conditions in the Baltic Sea 

Leonie Scheidereit, Yuanxu Dong, Lea Lange, Damian L. Arévalo-Martínez, Hermann Bange, Astrid Klöss, Josefine Karnatz, Theresa Barthelmeß, Anja Engel, and Christa Marandino

The gas transfer velocity k for the air-sea exchange of CO2 is often parameterized as a function of wind speed alone, as wind speed fundamentally controls turbulence at the air-sea interface and thus the flux across it. However, numerous other processes affect the air-sea gas exchange, such as the presence of surface-active substances (surfactants) directly at the interface, the so-called sea surface microlayer (SML). These processes are not explicitly accounted for in the wind speed-only parameterizations. Surfactants in the SML likely reduce k, potentially due to two effects. Firstly, the surfactants represent a physicochemical barrier at the interface, and secondly, they dampen the turbulence at the interface. Consequently, the presence of surfactants leads to lower gas transfer velocities than estimated from the wind speed-only parameterizations of k, especially since the SML can be stable up to medium high wind speeds. The mechanisms that control how exactly surfactants in the SML affect the air-sea gas exchange are, however, not yet fully understood. Therefore, it is important to measure air-sea gas exchange under various surfactant conditions to potentially include the SML effects in future parameterizations of k. During a research cruise to the Gotland Basin in the early summer of 2025, the direct air-sea flux of CO2 was measured using the eddy covariance method. This method is particularly well-suited to study the influence of surface processes on gas exchange, as it can determine k on timescales of 10 minutes and is therefore likely to resolve the variability in different surfactant states. In addition to the direct CO2 flux measurements, a range of other parameters influencing air-sea flux were also measured. In particular, the surfactants in the SML were sampled and analysed during the research cruise. Consequently, we investigate the behaviour of k under not only varying wind speeds, but now also under various surfactant states, including the presence of a surface slick.

How to cite: Scheidereit, L., Dong, Y., Lange, L., Arévalo-Martínez, D. L., Bange, H., Klöss, A., Karnatz, J., Barthelmeß, T., Engel, A., and Marandino, C.: Eddy covariance CO2 air-sea fluxes under variable surfactant conditions in the Baltic Sea, EGU General Assembly 2026, Vienna, Austria, 3–8 May 2026, EGU26-9820, https://doi.org/10.5194/egusphere-egu26-9820, 2026.

EGU26-9885 | ECS | Posters on site | AS2.3

Linking Baltic Sea water VOC concentrations with a summertime phytoplankton bloom  

Eve Galen, Kaisa Kraft, Yang Liu, Mari Vanharanta, Pasi Ylöstalo, Lasse Riemann, Heidi Hellén, Jukka Seppälä, and Riikka Rinnan

Long-term nutrient loading and warmer, longer summer temperatures have promoted summer cyanobacteria-dominated phytoplankton blooms in the Baltic Sea, shifting the annual chlorophyll maximum toward peak summer. In turn, organic matter production is increasing, altering the carbon cycle by shifting the bioavailable carbon pool to later in the season and towards microbial heterotrophy. These ecosystem changes may have consequential impacts on the production of trace gases, such as volatile organic compounds (VOC). Enhanced stratification and reduced vertical mixing may further regulate VOC water-air exchange. In the coastal zone, significant changes to macroalgae communities have been observed in association with persistent eutrophication. Shifting coastal dynamics, along with increased warming and, consequently, increased decomposition of organic material, will likely impact VOC production. Therefore, the aim of this study is to evaluate the influence of a summertime phytoplankton bloom on the composition and concentrations of VOCs in seawater, and to examine differences between distinct coastal habitats.

Summer sampling was conducted on Utö Island (59º 46'50N, 21º 22'23E; Archipelago Sea), and samples were processed at the Utö Atmospheric and Marine Research Station. Seawater VOCs were collected using the purge and trap method four times across three habitat types along the open coast—open water (250 m off shore; 4.5 m depth), a cove (15 m off shore; 0.5 m depth), and a vegetated beach (on shore; surface). Samples were stored in stainless steel absorbent cartridges and analyzed with Thermal Desorption Gas Chromatography Mass Spectrometry. Phytoplankton community composition and abundance were captured using an Imaging FlowCytobot, complemented by bacterial abundance from flow cytometry and microscopy.

Preliminary results indicate clear temporal variability in open water VOC concentrations. Some compounds such as isoprene were persistently detected throughout the summer whereas other compounds, e.g. toluene and dimethyl disulfide, varied across the season in association with changes in phytoplankton and bacterial abundance. Taxa-specific links between VOCs and phytoplankton composition, as well as the potential influence of abiotic drivers, including dissolved organic matter and vertical mixing, is still under investigation. Further analysis indicates that VOC concentrations are highly dependent on coastal habitat type, with composition and concentration of VOCs from the vegetated beach showing approximately 10-fold higher values as well as a more unique VOC blend, suggesting contributions from macroalgae and sediment processes. In contrast, the cove was highly dominated by bromoform, comprising >50% of the measured proportional VOC signal throughout the summer.

How to cite: Galen, E., Kraft, K., Liu, Y., Vanharanta, M., Ylöstalo, P., Riemann, L., Hellén, H., Seppälä, J., and Rinnan, R.: Linking Baltic Sea water VOC concentrations with a summertime phytoplankton bloom , EGU General Assembly 2026, Vienna, Austria, 3–8 May 2026, EGU26-9885, https://doi.org/10.5194/egusphere-egu26-9885, 2026.

Methanethiol (MeSH), a reduced sulfur compound, has received far less attention than dimethyl sulfide (DMS) despite its potential importance for atmospheric sulfur cycling and climate-relevant aerosol processes. Compared with DMS, gas-phase oxidation of MeSH yields more SO2 and has a shorter atmospheric lifetime, suggesting a disproportionate influence on new particle formation, aerosol growth, and cloud condensation nuclei (CCN) abundance in the marine atmosphere. Current global estimates of marine MeSH emissions have relied on scaling DMS concentration climatologies using empirical MeSH:DMS ratios, implicitly assuming co-variability between the two compounds.

Here, we present global monthly marine MeSH emissions derived using a machine-learning framework constrained by 27 years of satellite observations, ocean reanalysis products, and shipboard measurements. Key satellite predictors include chlorophyll-a (Chl-a), phytoplankton functional types (PFTs), phytoplankton size classes (PSCs), and photosynthetically active radiation (PAR). Our approach directly predicts MeSH concentrations from environmental drivers, independent of DMS distributions. The regression models were trained and validated using MeSH sea-surface concentration measurements from multiple oceanographic field campaigns.

We estimate a global annual marine MeSH emission of 5.06 Tg S yr-1. Regional emissions were analyzed by dividing the global ocean into nine Longhurst biomes. The largest contributions originate from the Southern Westerlies (29.05%), Pacific Trades (15.22%), and Coastal Ocean regions (14.03%). Both seawater MeSH concentrations and emissions exhibit pronounced seasonal variability, with peak global emissions occurring in October and a minimum in June. These results provide a satellite-based global climatology of marine MeSH emissions and establish a basis for assessing its impacts on atmospheric chemistry and global climate.

How to cite: Zhang, W.: A Global Marine Methanethiol Climatology Estimated Using Machine Learning, EGU General Assembly 2026, Vienna, Austria, 3–8 May 2026, EGU26-9950, https://doi.org/10.5194/egusphere-egu26-9950, 2026.

EGU26-11536 | ECS | Orals | AS2.3

Influence of East Asian Continental Emissions on Marine Atmospheric Chemistry and Ocean Ecosystems in the Northwest Pacific 

Tianle Zhang, Bingxing Zhu, Lin Zhang, Yuntao Wang, Fei Chai, and Mei Zheng

With the acceleration of global economic development and urbanization, the impacts of anthropogenic emissions on the Earth system have intensified. East Asia, as one of the most densely populated and economically active regions in the world, emits substantial amounts of particulate matter into the atmosphere. Influenced by the prevailing westerlies and the East Asian monsoon, these particles are transported downwind to the Northwest Pacific, exerting significant effects on marine atmospheric composition and ocean ecosystems in this region.

Focusing on key marine atmospheric nutrients including iron (Fe) and nitrogen (N), this study employs a multi-platform approach encompassing satellite remote sensing, in situ Argo floats, shipborne observations, and atmospheric chemical transport modeling to investigate the contribution of East Asian continental aerosol outflow to nutrient supply and the subsequent ocean response. A central highlight of this work is quantifying anthropogenic contributions to atmospheric Fe and N over the Northwest Pacific in recent years.

First, by integrating shipborne online measurements (2021–2022) of multiple atmospheric metals with a positive matrix factorization (PMF) model, we developed a high-time-resolution source apportionment framework for marine atmospheric metals including Fe. This approach provides the first observation-based quantification of contributions from several anthropogenic sources to marine atmospheric Fe and soluble Fe at hourly resolution. The results showed land anthropogenic emissions contributed substantially to atmospheric soluble Fe, accounting for 57% in the open Northwest Pacific during spring and increasing to 62% in summer. These results were further cross-validated against advanced Fe isotope–based source apportionment, yielding strong agreement (R2 = 0.94).

Second, for atmospheric nitrogen, shipborne sampling combined with nitrogen isotope analysis revealed sharp spatial gradients in atmospheric nitrate concentrations and sources from the Chinese marginal seas to the open Northwest Pacific. Coupled with an atmospheric chemical transport model, we further quantified the flux and temporal variability of multiple nitrogen species transported from East Asia to the Northwest Pacific during 2005–2019 and assessed the response of marine atmospheric nitrogen deposition to emission reductions in recent years in East Asia. These findings provide novel insights into the important impacts of land-derived emissions on ocean ecosystems, particularly anthropogenic sources, in shaping biogeochemical processes in downwind oceanic regions and advance our understanding of land–ocean interactions under anthropogenic perturbations.

How to cite: Zhang, T., Zhu, B., Zhang, L., Wang, Y., Chai, F., and Zheng, M.: Influence of East Asian Continental Emissions on Marine Atmospheric Chemistry and Ocean Ecosystems in the Northwest Pacific, EGU General Assembly 2026, Vienna, Austria, 3–8 May 2026, EGU26-11536, https://doi.org/10.5194/egusphere-egu26-11536, 2026.

EGU26-13301 | ECS | Orals | AS2.3

Marine Carbohydrates and Other Sea Spray Aerosol Constituents Across Altitudes in the Lower Troposphere of Ny-Ålesund, Svalbard 

Sebastian Zeppenfeld, Jonas Schaefer, Christian Pilz, Kerstin Ebell, Moritz Zeising, Frank Stratmann, Holger Siebert, Birgit Wehner, Matthias Wietz, Astrid Bracher, and Manuela van Pinxteren

Marine carbohydrates are produced by a wide range of micro- and macroorganisms in seawater and are transferred to the atmosphere via sea spray aerosol (SSA). Recent laboratory and modelling studies suggest that these compounds can influence fog and cloud microphysics as ice nucleating particles. However, observational evidence from the atmosphere remains limited, as most field studies have relied on ship- or land-based filter samples, leaving their relevance for cloud processes at cloud-relevant altitudes largely unconstrained.

Here, we present new measurements of marine carbohydrates and other SSA components at altitudes between 300 and 1200 m, obtained using a tethered helium balloon in Ny-Ålesund (Svalbard) during 2021-2022. These observations are compared with fresh SSA directly collected at the Kongsfjorden coast and with surface seawater samples to assess contributions beyond local ocean emissions. Our results highlight the key role of meteorological conditions in lifting and redistributing SSA constituents, including marine carbohydrates, to higher atmospheric layers. The study further examines potential additional sources and formation pathways, providing new insights into the atmospheric behaviour of marine carbohydrates and their implications for cloud microphysics.

We gratefully acknowledge the funding by the Deutsche Forschungsgemeinschaft (DFG, German Research Foundation)—Project Number 268020496—TRR 172, within the framework of the Transregional Collaborative Research Center “ArctiC Amplification: Climate Relevant Atmospheric and SurfaCe Processes, and Feedback Mechanisms (AC)3” 

How to cite: Zeppenfeld, S., Schaefer, J., Pilz, C., Ebell, K., Zeising, M., Stratmann, F., Siebert, H., Wehner, B., Wietz, M., Bracher, A., and van Pinxteren, M.: Marine Carbohydrates and Other Sea Spray Aerosol Constituents Across Altitudes in the Lower Troposphere of Ny-Ålesund, Svalbard, EGU General Assembly 2026, Vienna, Austria, 3–8 May 2026, EGU26-13301, https://doi.org/10.5194/egusphere-egu26-13301, 2026.

EGU26-13392 | Posters on site | AS2.3

Experimental evidence of chemical differences between charged and uncharged snow during blowing snow events 

Kateryna Tkachenko, Denis Pishniak, Se Razumnyi, Hugo El-mansi, Patrick Ginot, and Hans-Werner Jacobi

In this study we tested under field conditions the hypothesis that electrical phenomena may influence chemical composition of snow. The field experiment was conducted at the Akademik Vernadsky Station within the framework of the State Program of Scientific Research of Ukraine in Antarctica during two winter seasons in 2022 and 2023, using a newly designed trap for charged snow. This instrument was constructed to selectively attract charged snow particles from the blowing-snow flux and was deployed during blowing snow events The experiments were performed in winter to ensure that chemical modifications were not affected by photochemical reactions. A similar field experiment was conducted in the Arctic at Ny-Ålesund, Svalbard. Here, we focus on the chemical composition of the snow samples collected by the trap, which were analyzed using ion chromatography and compared with the composition of the background blowing snow.

We found that samples of charged snow were significantly more concentrated than background snow, which is attributed to the sublimation during conditions of blowing snow events. When the measured ion concentrations were compared with the expected concentration ranges and ratios characteristic of sea salt, the charged snow samples were, however, depleted in chloride, with this difference far exceeding the measurement uncertainty. The dependence of chloride “losses” on the fraction of sublimated water indicated a strong change and revealed the presence of a threshold at approximately 80 % sublimated water, beyond which these losses—interpreted as emissions to the atmosphere—increased sharply. Products of chlorine free-radical reactions in the atmosphere have been reported by numerous authors; however, the mechanism responsible for initiating these reactions remains uncertain. The present experiment provides evidence that the charging of snow may serve as such a triggering process. The presence of a similar threshold at 70–80 % sublimated water, after which ion losses increase sharply, was also observed for Br⁻, SO₄²⁻, and Mg²⁺. However, the presence of local sources renders these relationships less significant. The change in the composition at such high sublimation fractions may indicate emission of these ions due to overcoming of the Rayleigh limit indicating that electrical charging affects chemical processes in snow.

In contrast, the experiments conducted in the coastal marine environment at Ny-Alesund indicate that ion ratios characteristic of sea salt were preserved in the charged snow samples, demonstrating that no or only limited chemical transformations took place. The presence of sea ice appears to be critical for the manifestation of chemical effects. When sea ice is present, snow particle charging during blizzards occurs primarily due to frictional and sublimation-driven processes. In the absence of an ice surface, charging is most likely driven by the sorption of marine aerosols maintaining the expected sea salt ratios in the charged snow.

How to cite: Tkachenko, K., Pishniak, D., Razumnyi, S., El-mansi, H., Ginot, P., and Jacobi, H.-W.: Experimental evidence of chemical differences between charged and uncharged snow during blowing snow events, EGU General Assembly 2026, Vienna, Austria, 3–8 May 2026, EGU26-13392, https://doi.org/10.5194/egusphere-egu26-13392, 2026.

Elongated cracks in the Arctic sea-ice cover, so-called leads, expose the cold atmosphere to the relatively warm ocean, and are thus critical to the Arctic energy budget. Here, high-resolution large-eddy simulations (LES) are used to examine the impact of Arctic sea-ice leads on the wintertime lower atmosphere. Fourteen simulated cases representing various realistic atmospheric states are studied based on MOSAiC campaign data, expanding on previous LES studies of leads, which often utilize single idealized conditions. Control runs are contrasted against perturbed runs containing a 1.2 km wide idealized lead, which evolves through a prescribed open–refrozen–closed life cycle. Impacts on the moist static energy budget of the lower atmosphere are then investigated, also in the context of the well-known bimodal state in the surface energy budget in the Arctic. During the lead-open phase, all simulations show large increases in the turbulent heat fluxes, with a slight reversed effect after lead closure. These fluxes are well-predictable from bulk theory applied to a given control atmospheric state. The atmospheric response depends strongly on the initial atmospheric conditions. Cloudy cases remain in a cloudy state, featuring a small increase in near-surface long wave net radiation. The response of clear-sky cases, however, critically depends on initial relative humidity. Moist clear-sky cases can transition to a cloudy state when condensed plumes form, becoming radiatively active and acting as efficient “radiator fins”. Here, energy is efficiently removed from the atmosphere, a surprising behavior argued to have implications for sea-ice melt. In contrast, dry clear-sky cases produce little condensation, and radiative effects remain minimal.

How to cite: Schnierstein, N. and Neggers, R.: Lead Impacts on the Moist Static Energy Budget of the Low-Level Arctic Atmosphere in Large-Eddy Simulations based on MOSAiC Data, EGU General Assembly 2026, Vienna, Austria, 3–8 May 2026, EGU26-13657, https://doi.org/10.5194/egusphere-egu26-13657, 2026.

EGU26-14409 | Posters on site | AS2.3

Influence of Atmospheric Aerosol Deposition and its Elemental Composition on Marine Productivity in the Central Arabian/Persian Gulf  

Ersin Tutsak, Jassem Al-Thani, Çağlar Yumruktepe, Oguz Yigiterhan, Ebrahim M.A.S. Al-Ansari, Yousra Soliman, and Mariem Safi

Influence of Atmospheric Aerosol Deposition and its Elemental Composition on Marine Productivity in the Central Arabian/Persian Gulf The Arabian Gulf is a shallow, warm oligotrophic, and hypersaline marginal sea of the Indian Ocean. Due to intense evaporation, limited freshwater input, recurrent dust event and harsh environmental conditions, nutrient concentrations and productivity are significantly impacted by the harsh and changing environmental conditions. Atmospheric aerosols can impact surface ocean biology and biogeochemical processes in the Arabian Gulf as a result of the dust events and limited inputs. However, the rates of macro- and micronutrient inputs from the atmosphere to the Arabian Gulf are not well constrained. Both inorganic and organic forms of nitrogen and phosphorus may contribute to productivity in the Arabian/Persian Gulf. Productivity and by proxy precious resources such as fisheries can be closely linked to aerosols nutrient deposition. In this study, we use the Arabian Gulf as a natural laboratory for investigating the temporal variability of atmospheric macro- and micronutrients, the partitioning between organic and inorganic forms of nitrogen and phosphorus, and the role of trace metals in marine productivity. Based on annual time-series aerosol measurements, we provide new insights into atmospheric concentrations of macro- and micronutrients in the central Arabian/Persian Gulf. Additionally, using 1-dimensional biogeochemical model simulations, we investigate the influence of atmospheric aerosol deposition on primary productivity in the Gulf. The results obtained suggest that atmospheric deposition is an important process regulating marine productivity in the Arabian Gulf.

How to cite: Tutsak, E., Al-Thani, J., Yumruktepe, Ç., Yigiterhan, O., M.A.S. Al-Ansari, E., Soliman, Y., and Safi, M.: Influence of Atmospheric Aerosol Deposition and its Elemental Composition on Marine Productivity in the Central Arabian/Persian Gulf , EGU General Assembly 2026, Vienna, Austria, 3–8 May 2026, EGU26-14409, https://doi.org/10.5194/egusphere-egu26-14409, 2026.

EGU26-15183 | Posters on site | AS2.3

Variability of Air-Sea Fluxes of CO2 and N2O in Polar Ocean Regions 

Parvadha Suntharalingam, Jayashree Ghosh, Erik Buitenhuis, and Zhaohui Chen

In recent decades the polar oceans have experienced changes in surface temperature and regional circulation associated with large-scale patterns of ocean warming. These ocean regions are important contributors to global budgets of greenhouse gases such as carbon-dioxide (CO2) and nitrous-oxide (N2O), and the regional environmental changes have significant influences on the magnitude, trends and variability of air-sea fluxes of these gases (Yasunaka et al. 2024; Zhan et al. 2020).

The Arctic Ocean has been a net sink of atmospheric CO2 in recent decades, but displays significant heterogeneity in carbon uptake among its regional seas, with changing trends due to regional climate change and sea-ice loss.  The  global ocean is a  net source of N2O to the atmosphere overall; however the distribution of N2O fluxes from the Arctic remains poorly characterized, and regional observations indicate several regions of N2O undersaturation in the surface Arctic Ocean (Kitidis et al. 2010; Zhan et al. 2020).  The Southern Ocean is a major sink for atmospheric anthropogenic CO2 (e.g., ~40% of global uptake according to recent estimates, Dong et al. 2024). Air-sea CO2 fluxes in the Southern Ocean are strongly influenced by circulation patterns associated with oceanographic fronts, and CO2 fluxes display significant seasonal and decadal variability. Flux estimates are subject to uncertainty due to the regional environmental variability and to the sparse network of CO2 measurements available. Estimates of N2O fluxes from the Southern Ocean are also poorly quantified for similar reasons; i.e., limited measurements and significant spatial and temporal variability.  Recent syntheses have suggested the region could contribute ~30% of global ocean N2O emissions (Tian et al. 2020), a disproportionately large component in comparison to the areal extent of the Southern Ocean.

In this work we present recent estimates of air-sea fluxes of CO2 and N2O from these polar regions derived from (i) atmospheric inverse model analyses (using the GEOSChem-LETKF framework of Chen et al. 2021), and (ii) an ocean biogeochemical model (NEMO-PlankTOM; Buitenhuis et al. 2018). We focus on the period 2000-2018, and present estimates for regional fluxes,  decadal trends and  inter-annual variations. We also compare our results to previous estimates derived from surface ocean pCO2 and pN2O data products and ocean biogeochemistry models.

How to cite: Suntharalingam, P., Ghosh, J., Buitenhuis, E., and Chen, Z.: Variability of Air-Sea Fluxes of CO2 and N2O in Polar Ocean Regions, EGU General Assembly 2026, Vienna, Austria, 3–8 May 2026, EGU26-15183, https://doi.org/10.5194/egusphere-egu26-15183, 2026.

EGU26-17322 | ECS | Posters on site | AS2.3

Characterizing the Sources and Transport of Wintertime Ice-Nucleating Particles in Fairbanks, Alaska 

Abdulrahman Younis Alkatheeri, Kathy Law, Diana Francis, Steve Arnold, Emilly Lill, Samantha Greeney, Jessie Creamean, Anderson Da Silva, Jean-Christophe Raut, Tatsuo Onishi, Natalie Brett, William Simpson, and Kerri Pratt


The Arctic is warming at a rate several times faster than the global mean, a phenomenon commonly referred to as Arctic amplification. Short-lived climate forcers, particularly aerosols acting as ice-nucleating particles (INPs), may influence this amplification through aerosol-cloud indirect effects. During the polar night, INPs modulate the ratio of liquid-to-ice in mixed-phase clouds, altering their capacity to trap outgoing longwave radiation and warm the surface. Despite their importance, the sources and transport pathways of INPs in high-latitude regions remain poorly constrained. While truly pristine Arctic environments are rare, cold, polluted sub-Arctic regions such as interior Alaska provide natural laboratories for investigating INP populations under conditions that combine low temperatures with enhanced anthropogenic and regional aerosol influences. Such environments may be particularly relevant to Arctic locations experiencing episodic pollution, long-range aerosol transport, or increasing local emissions. While chemical fingerprinting provides critical insights into particle composition and local abundance, it cannot inherently resolve the geographic origins or transport history of air masses bringing INPs to a given region.

To address this limitation, we apply backward trajectory-based modelling in an attempt to link observed INPs to their potential source regions. We build on recent work investigating the sources of wintertime INPs in the sub-Arctic urban environment of Fairbanks, Alaska, using observations from the Alaskan Layered Pollution and Chemical Analysis (ALPACA) field campaign conducted in January and February 2022. During the campaign, Fairbanks experienced persistent surface-based temperature inversions and extreme cold events that favored the accumulation of locally emitted anthropogenic aerosols. Analysis of ALPACA-2022 data has reported INP concentrations significantly higher at relatively cold freezing temperatures than those typically observed at other high-latitude sites, consistent with three dominant INP classes: heat-labile biological particles, potentially associated with local vegetation such as lichens; organic particles linked to residential wood combustion, supported by correlations with levoglucosan; and a source attributed to road dust, possibly generated by the application of traction gravel on icy roads.

Using a backward trajectory modeling framework, we investigate the spatial origins and atmospheric transport of INP sourced from the Fairbanks region. Backward transport simulations are conducted using the FLEXible PARTicle dispersion model (FLEXPART), driven by 1.33 km resolution wind fields from the Weather Research and Forecasting (WRF) model, including assimilation of meteorological data from the ALPACA campaign. The surface influence and residence time of air masses arriving at the ALPACA measurement site in downtown Fairbanks are quantified. Potential Emission Sensitivity (PES) footprints are calculated by combining with high resolution emissions fields of potential INP sources, based on downscaling emissions using vegetation, road and building datasets. Interpreting PES fields, in conjunction with the observed INP analysis, allows characterization of both the INP sources and their transport pathways in Fairbanks. The results have broad implications for INP sources and aerosol-cloud indirect effects over the wider sub-Arctic and potentially Arctic region.


How to cite: Alkatheeri, A. Y., Law, K., Francis, D., Arnold, S., Lill, E., Greeney, S., Creamean, J., Da Silva, A., Raut, J.-C., Onishi, T., Brett, N., Simpson, W., and Pratt, K.: Characterizing the Sources and Transport of Wintertime Ice-Nucleating Particles in Fairbanks, Alaska, EGU General Assembly 2026, Vienna, Austria, 3–8 May 2026, EGU26-17322, https://doi.org/10.5194/egusphere-egu26-17322, 2026.

EGU26-18714 | Orals | AS2.3

High-resolution air–sea CO₂ observations during the ATL2MED mission: data correction and process variability across the Eastern Atlantic Ocean and the Mediterranean Sea 

Riccardi Martellucci, Carlotta Dentico, Laurent Coppola, Ingunn Skjelvan, Michele Giani, Carolina Cantoni, Sara Pensieri, Vanessa Cardin, Marine Fourrier, Roberto Bozzano, Melf Paulsen, and Elena Mauri

The ATL2MED mission (October 2019–July 2020) investigated air–sea CO₂ exchange across the Eastern Atlantic Ocean and the Mediterranean Sea using high-resolution measurements from Saildrone autonomous surface vehicles (SDs), complemented by fixed stations, gliders, and research vessels. Operating under diverse environmental conditions, the SDs provided detailed observations of seawater CO₂ and hydrographic parameters, although sensor drift and biofouling affected data quality during the long deployment. Dedicated data correction and validation procedures were applied: salinity was corrected using model products and validated against independent observations. Dissolved oxygen was adjusted using the Argo oxygen correction. These efforts compensated for limited discrete sampling during COVID-19 restrictions. The corrected data revealed strong regional contrasts in CO₂ dynamics driven by physical and biogeochemical processes. Intense outgassing occurred in the upwelling regions off northwest Africa, while the western Mediterranean Sea acted as a CO₂ sink during the spring bloom. The Adriatic Sea showed recurrent outgassing episodes linked to stratification, river plumes, and coastal upwelling. The SDs captured sub-mesoscale and short-term variability often missed by traditional platforms and model simulations. The study highlights the importance of high-frequency, multi-platform measurements to resolve the highly variable air–sea CO₂ fluxes occurring at short temporal scales.

How to cite: Martellucci, R., Dentico, C., Coppola, L., Skjelvan, I., Giani, M., Cantoni, C., Pensieri, S., Cardin, V., Fourrier, M., Bozzano, R., Paulsen, M., and Mauri, E.: High-resolution air–sea CO₂ observations during the ATL2MED mission: data correction and process variability across the Eastern Atlantic Ocean and the Mediterranean Sea, EGU General Assembly 2026, Vienna, Austria, 3–8 May 2026, EGU26-18714, https://doi.org/10.5194/egusphere-egu26-18714, 2026.

EGU26-19703 | ECS | Posters on site | AS2.3

A 15-Year Record of Organic–Inorganic Phosphorus Variability in Eastern Mediterranean Wet Deposition  

Kyriaki Papoutsidaki, Maria Tsagkaraki, Kalliopi Violaki, Giorgos Kouvarakis, Nikos Mihalopoulos, and Maria Kanakidou

Wet deposition is a major mechanism of phosphorus (P) deposition to the ultra-oligotrophic Eastern Mediterranean, yet long-term constraints on the relative roles of dissolved inorganic phosphorus (DIP) and dissolved organic phosphorus (DOP) remain limited. In this study, 15-year observations of DIP and DOP variability were conducted at an Eastern Mediterranean regional background site, focusing on the temporal variability, drivers, and deposition. Wet deposition samples were collected on an event basis and analyzed for DIP using a colorimetric molybdate-reactive method. Total dissolved phosphorus (TDP) was determined following oxidative digestion, and DOP was defined by subtracting DIP from TDP. Deposition fluxes were calculated by coupling concentration measurements with precipitation depth, enabling assessment of both concentration-driven and rainfall-driven variability.

Across the 15-year period, both DIP and DOP exhibited pronounced event-to-event variability typical of atmospheric deposition in the region. Preliminary results show that DIP was frequently enhanced during dust outbreak episodes consistent with mineral dust influence, indicating efficient wet scavenging of particulate and soluble inorganic P associated with crustal minerals. In contrast, DOP was more frequently associated with air masses bearing marine and continental/anthropogenic impacts. At the interannual scale, variability in both concentrations and fluxes tracked changes in rainfall intensity and event frequency, as well as the occurrence of dust-transport episodes. To better constrain sources and processes, deposition chemistry was evaluated in tandem with air-mass back trajectories, and, where available, supporting aerosol and meteorological data. The results indicate that dust-driven wet deposition delivers episodic pulses of bioavailable DIP. DOP supplies a more sustained, compositionally diverse pool. This pool may become bioavailable following photochemical and microbial transformation after deposition. Overall, the 15-year record show that the organic fraction is significant and that the annual DIP:DOP partitioning can change depending on the transport pathways and rainfall distribution. This has direct implications for regional external nutrient inputs and their future projections in response to changes in dust emissions and hydroclimate.


Acknowledgments

This work has been supported by the HFRI grant # 4050 BIOCAN.

How to cite: Papoutsidaki, K., Tsagkaraki, M., Violaki, K., Kouvarakis, G., Mihalopoulos, N., and Kanakidou, M.: A 15-Year Record of Organic–Inorganic Phosphorus Variability in Eastern Mediterranean Wet Deposition , EGU General Assembly 2026, Vienna, Austria, 3–8 May 2026, EGU26-19703, https://doi.org/10.5194/egusphere-egu26-19703, 2026.

EGU26-20624 | ECS | Posters on site | AS2.3

Tethered balloon-borne measurements for the characterization of the evolution of the Arctic atmospheric boundary layer at the Villum Research Station (Station Nord, Greenland) 

Henning Dorff, Holger Siebert, Komal Navale, André Ehrlich, Joshua Müller, Michael Schäfer, and Manfred Wendisch

We present a post-processed comprehensive balloon-borne measurement dataset, which was collected from a dedicated Arctic observation campaign conducted from 19 March to 18 April 2024 in the transition from polar night to polar day at the Villum Research Station (VRS, Station Nord, Greenland), as a contribution to the DFG-funded Transregio-project TRR 172 “Arctic Amplification (AC)3. The objective of the balloon-borne observations was to characterize the temporal evolution of the Arctic atmospheric boundary layer (ABL), focusing on key transition periods, including cloud development, low-level jet evolution, and day to night shifts.

The measurements were taken by the Balloon-bornE moduLar Utility for profilinG the lower Atmosphere (BELUGA) tethered-balloon system performing in-situ observations of temperature, humidity, wind speed, turbulence, and thermal infrared irradiance from the surface to several hundred meters altitude, with frequent profiling in high vertical resolution. Twenty-eight research flights delivered more than 300 profiles, with up to 8 profiles per hour, complemented by daily radiosonde launches. For the BELUGA instrumentation at VRS, we specify the data processing procedures. The post-processed Level-2 data (BELUGA and radiosonde) are provided in instrument-separated data subsets listed in a data collection (https://doi.pangaea.de/10.1594/PANGAEA.986431).

One major application of these balloon-borne data is to evaluate different model types—such as numerical weather prediction, single-column models, large-eddy simulations—in representing processes that control the Arctic ABL. As a preparation, we give an overview of the observations, environmental conditions during the campaign, and highlight specific events that are particularly valuable for model comparison. These events include variable cloud scenarios, where transitions between cloudy and cloud-free conditions induce changes in temperature rates and radiative heating rates, thereby influencing the ABL inversion and lapse-rate. Additionally, we examine an observed Arctic low-level jet which we compare with reanalysis. 

How to cite: Dorff, H., Siebert, H., Navale, K., Ehrlich, A., Müller, J., Schäfer, M., and Wendisch, M.: Tethered balloon-borne measurements for the characterization of the evolution of the Arctic atmospheric boundary layer at the Villum Research Station (Station Nord, Greenland), EGU General Assembly 2026, Vienna, Austria, 3–8 May 2026, EGU26-20624, https://doi.org/10.5194/egusphere-egu26-20624, 2026.

EGU26-20888 | Posters on site | AS2.3

Investigating the potential triggering mechanisms of turbulence intermittency in the Arctic Boundary Layer 

Ahana Kuttikulangara, Nikki Vercauteren, Johannes Riebold, Dörthe Handorf, and Sebastian Krumshied

The turbulence in the Arctic is often observed to be intermittent as a result of the interaction with non-turbulent motions. Several studies have examined the triggering mechanisms behind the intermittency, yet the understanding of their influence is still insufficient. In this study, turbulence intermittency in the Arctic stable boundary layer is investigated using observations from the Multidisciplinary drifting Observatory for the Study of Arctic Climate (MOSAiC) expedition, spanning October 2019 to September 2020. Turbulent and sub-mesoscale motions separated using Multi-Resolution Decomposition (MRD) cospectral analysis are used to quantify the strength of turbulent and sub-meso motions. Previous study showed the evolution of intermittency under strong stratification, when sub-mesoscale energy exceeds 10% of the total mean kinetic energy. While such clear indications are not evident in this available data, we further examine the role of additional factors such as radiative forcing or cloud cover, in the triggering of intermittency in turbulence in this region. The triggering mechanisms are analyzed separately for polar night and polar day regimes, using different radiative forcing thresholds. The study is further extended to analyze the stability correction function (φ) and assess the validity of the classic Monin-Obhukov Similarity Theory (MOST) under such motions. These results are compared with the generalized stochastic model to assess its ability to represent these non-stationary motions associated with intermittency. Following the outcome, the stochastic model may be refined to better capture intermittent turbulence processes in the Arctic.

How to cite: Kuttikulangara, A., Vercauteren, N., Riebold, J., Handorf, D., and Krumshied, S.: Investigating the potential triggering mechanisms of turbulence intermittency in the Arctic Boundary Layer, EGU General Assembly 2026, Vienna, Austria, 3–8 May 2026, EGU26-20888, https://doi.org/10.5194/egusphere-egu26-20888, 2026.

EGU26-22179 | ECS | Posters on site | AS2.3

Investigating surface-ocean oxygen dynamics using MIMS-based O₂/Ar measurements 

Ankit Swaraj and Peter Croot

Air–sea gas exchange exerts a critical control on marine biogeochemistry, yet quantifying biologically driven oxygen fluxes in dynamic sea conditions remains challenging. Here, we use membrane inlet mass spectrometry (MIMS) measurements of dissolved gases to estimate net community production (NCP) from biologically driven oxygen anomalies across the Irish Exclusive Economic Zone (EEZ). High-precision dissolved O₂ and Ar measurements were obtained using a Hiden Analytical MIMS system, enabling calculation of O₂/Ar ratios that isolate the biological oxygen signal by normalisation to inert argon and reference to air–sea equilibrium.


Seawater samples collected during multiple research cruises were analysed under controlled temperature conditions. Raw ion currents were corrected using solubility based relative sensitivity factors, and O₂/Ar ratios were converted to biological supersaturation (ΔO₂/Ar) from the temperature and salinity of the sea water sample, providing a robust tracer of biologically driven O₂ fluxes independent of temperature and solubility effects. Data quality was assessed through comparison of flow through cell and dip-probe measurements and analysis of poisoned samples to constrain non-biological influences.


The collected ΔO₂/Ar dataset covers a diverse oceanic condition from coastal to open ocean, from the Irish Exclusive Economic Zone (EEZ) to the North and South Atlantic. Samples were collected in various seasons in 2024, and in 2025, they were collected along the latitudinal transect. The purpose of these observations is to examine the variations in surface-ocean oxygen levels across different regions, seasons, and latitudes, and to analyse the impacts of biological production, stratification, and air-sea gas exchange on different oceanographic conditions. This method will demonstrate how MIMS-based O₂/Ar measurements may assist in identifying short-term air-sea oxygen fluxes and provide more precise constraints on the productivity and carbon cycling of the ocean.


How to cite: Swaraj, A. and Croot, P.: Investigating surface-ocean oxygen dynamics using MIMS-based O₂/Ar measurements, EGU General Assembly 2026, Vienna, Austria, 3–8 May 2026, EGU26-22179, https://doi.org/10.5194/egusphere-egu26-22179, 2026.

EGU26-22600 | Orals | AS2.3

Controls on Benthic Sulfur and Carbon Reservoirs in the Kara Sea: Tracing DMSP and Hydrocarbons across an Ice-Regime Gradient 

Nikolai Pedentchouk, Kai Sun, David Pearce, Jonathan D. Todd, and David J. Lea-Smith

Arctic shelf seas are important sites for global carbon and sulfur cycling, yet their biogeochemical feedbacks are rapidly changing due to climate change. This study characterizes Dimethylsulfoniopropionate (DMSP) and hydrocarbon signatures in surface sediments (0–1 cm) along a six-station transect in the Kara Sea, from the Yenisey River estuary to Novaya Zemlya (from approx. 71°31' to 77°00' N).

The transect spans a distinct environmental gradient from coastal stations dominated by land-fast ice to open-shelf waters characterized by first-year ice or free from ice. By coupling DMSP concentrations with hydrocarbon biomarkers, we differentiate between terrestrial riverine inputs and autochthonous marine production as drivers of the benthic reservoir. DMSP production is low in riverine regions (~2 nmol g-1) but higher in all marine regions (40-80 nmol g-1) with metagenomic analysis suggesting production is primarily from bacteria. Other bacteria contain DMSP catalysis genes encoding proteins converting DMSP to dimethylsulfide (DMS), a global cooling gas. This suggests that production of DMSP and DMS in the Russian Arctic is widespread and large-scale.

Our findings reveal how specific sea-ice regimes and river discharge regulate organic matter provenance and sulfur biochemistry. These baseline data are essential for predicting how Arctic biogeochemical feedbacks — specifically sediment-atmosphere chemical fluxes — will respond to projected declines in sea ice extent and increased river runoff.

How to cite: Pedentchouk, N., Sun, K., Pearce, D., Todd, J. D., and Lea-Smith, D. J.: Controls on Benthic Sulfur and Carbon Reservoirs in the Kara Sea: Tracing DMSP and Hydrocarbons across an Ice-Regime Gradient, EGU General Assembly 2026, Vienna, Austria, 3–8 May 2026, EGU26-22600, https://doi.org/10.5194/egusphere-egu26-22600, 2026.

AS3 – Atmospheric Composition, Chemistry and Aerosols

EGU26-360 | ECS | Orals | AS3.1

Heterogeneous chemistry and regional coal power emissions drive Delhi’s sulfate pollution 

Rakesh Maity, Indranil Nandi, Ajit Kumar, Vikram Singh, Dilip Ganguly, and Mayank Kumar

The Indo-Gangetic Plain (IGP) experiences persistent and severe air pollution, with wintertime conditions particularly extreme. Cities across the IGP, including Delhi, consistently rank among the world’s most polluted. Fine particulate matter (PM2.5) dominates Delhi’s pollution burden, with sulfate contributing about 9-12% of non-refractory PM2.5. Yet atmospheric models consistently underestimate sulfate concentrations, both globally and over in India, largely because key physical and chemical processes governing sulfate formation under local conditions remain insufficiently represented. Moreover, India does not have publicly available emission inventory. As a result, most modelling studies rely on global inventories that do not fully capture region-specific emission characteristics or the impact of recent policy measures.

Sulfate primarily forms through gas-phase oxidation of SO2 by OH radicals and through aqueous-phase oxidation of S(IV) by O3, H2O2, NO2, and transition-metal-ion (TMI)-catalyzed reactions with O2. In extreme pollution episodes over Delhi during winter, suppressed sunlight limits OH production, weakening gas-phase oxidation. Furthermore, aqueous-phase pathways mainly occur in cloud water, whereas haze liquid water content is substantially lower, reducing their effectiveness. Conversely, the large aerosol surface area during haze episodes suggests an enhanced role for heterogeneous reactions.

To better represent regional emissions, we updated the global emissions inventory by integrating local policy interventions and revised regional energy-sector activity profiles. Numerical simulations using this modified inventory were evaluated using comprehensive winter observations at IIT Delhi. While the updated inventory substantially improves representation of total sulfur (NMB of 1.34%), the model continues to underestimate sulfate. After evaluating several recently proposed sulfate formation mechanisms for haze conditions (e.g., H2O2 and NO2 oxidation pathways), we find that metal-catalyzed heterogeneous oxidation of SO2 by O2 on aerosol surfaces is the dominant contributor, accounting for ~43% of the observed sulfate. Implementation of this mechanism significantly improves model agreement with observations. Lagrangian analysis indicates that this pathway is highly pH-dependent, with elevated sulfate production occurring at pH values between 4 and 5. Additionally, a substantial fraction of sulfate is formed during regional transport from nearby states power plants surrounding Delhi.

Our findings highlight that Delhi’s elevated sulfate concentrations are primarily driven by regional transport from nearby coal power plants and by metal-catalyzed heterogeneous oxidation on aerosol surfaces under severe winter haze conditions.

How to cite: Maity, R., Nandi, I., Kumar, A., Singh, V., Ganguly, D., and Kumar, M.: Heterogeneous chemistry and regional coal power emissions drive Delhi’s sulfate pollution, EGU General Assembly 2026, Vienna, Austria, 3–8 May 2026, EGU26-360, https://doi.org/10.5194/egusphere-egu26-360, 2026.

EGU26-2770 | Orals | AS3.1

Urban black-carbon radiative heating intensified by biogenic-anthropogenic interactions 

Xinlei Ge, Yunjiang Zhang, Junfeng Wang, and Haiwei Li

Black carbon (BC) is a global climate forcer due to its strong radiative absorption, which is highly sensitive to coating formation regulated by anthropogenic and biogenic emissions across regions. However, how cross-regional biogenic sources modulate BC coating formation and radiative effects, particularly in high anthropogenic emission environments, remains poorly understood. Here we show, using integrated observations and model simulations, that biogenic volatile organic compounds from vegetation-rich regions undergo atmospheric oxidation to produce oxygenated organic compounds, which are subsequently advected into downwind urban areas. These products enhance regional atmospheric oxidation capacity and supply additional precursors, thereby promoting secondary organic aerosol production. This biogenic-induced strengthening of regional photochemistry significantly drives the formation of highly oxidized secondary organic aerosol coatings on BC particles and increases its fraction within the total particle population. Consequently, BC absorption efficiency increases more steeply with the coating carbon oxidation state under biogenic-rich conditions, yielding an average ~20% enhancement in radiative absorption from the lensing effect relative to biogenic-poor periods. Our findings reveal that cross-regional biogenic-anthropogenic interactions enhance both the formation and particle population fraction of secondary organic aerosol coatings on urban BC, potentially further amplifying its radiative effects as biogenic emissions increase under future warming scenarios.

How to cite: Ge, X., Zhang, Y., Wang, J., and Li, H.: Urban black-carbon radiative heating intensified by biogenic-anthropogenic interactions, EGU General Assembly 2026, Vienna, Austria, 3–8 May 2026, EGU26-2770, https://doi.org/10.5194/egusphere-egu26-2770, 2026.

EGU26-3008 | Orals | AS3.1

Non-additive Secondary Organic Aerosol Formation Yields from Mixed Biogenic and Anthropogenic Precursors 

Song Guo, Ying Yu, Rui Tan, Wenfei Zhu, Shengrong Lou, Yue Zhao, and Min Hu

The mixing of precursors significantly alters secondary organic aerosol (SOA) yield and composition. This study systematically investigates SOA formation from the photooxidation of two polycyclic aromatic hydrocarbons (naphthalene, 2-methylnaphthalene) and two terpenes (isoprene, alpha-pinene), representing anthropogenic and biogenic precursors, as well as their binary mixtures under both low and high NOx conditions in both smog chamber and flow tube reactor. SOA composition is analyzed using a Filter Inlet for Gases and Aerosols coupled to a high-resolution time-of-flight chemical ionization mass spectrometer (FIGAERO-CIMS). Results show that the SOA yield of naphthalene and 2-methylnaphthalene under high NOx is lower than under low NOx, consistent with previous studies. Suppression of SOA formation is observed in mixed precursor systems. This may result from differences in particle volatility between individual and mixed precursor systems, indicating distinct oxidation processes. Additionally, under NOx-free conditions, SOA yields from mixed precursors (e.g., isoprene/naphthalene and α-pinene/naphthalene) are not additive but exhibit a nonlinear dependence on the reactivity ratio—defined as the product of the OH rate constant and consumed concentration of each precursor. A synergistic enhancement of up to 60% is observed at optimal reactivity ratios. Molecular-level analysis reveals unique oxidation products in mixed systems, suggesting novel reaction pathways. The enhanced yield is attributed to an increased condensation sink and potential heterogeneous reactions. A parameterized formula linking yield to reactivity ratio is proposed, which could improve SOA model accuracy. These findings highlight the importance of precursor interactions, quantified via reactivity ratio, for accurately predicting aerosol loading, especially in clean atmospheres. This study provides new insights and a framework for understanding SOA formation from mixed anthropogenic and biogenic precursor systems.

How to cite: Guo, S., Yu, Y., Tan, R., Zhu, W., Lou, S., Zhao, Y., and Hu, M.: Non-additive Secondary Organic Aerosol Formation Yields from Mixed Biogenic and Anthropogenic Precursors, EGU General Assembly 2026, Vienna, Austria, 3–8 May 2026, EGU26-3008, https://doi.org/10.5194/egusphere-egu26-3008, 2026.

EGU26-3019 | Orals | AS3.1

Modelling clusters of complex organic molecules  

Hanna Vehkamäki, Jaakko Kähärä, Theo Kurtén, Stephen Ingram, and Lauri Franzon

Oxygenated organic molecules (OOMs) form in the atmosphere by oxidation of volatile organic compounds from both natural and anthropogenic sources. Highly oxygenated organic molecules are likely to take part in new particle formation, but it is unclear to what extent they can form particles without the involvement of inorganic acids or ions, and whether they have a significant contribution to the initial formation of molecular clusters, or only to the growth of these clusters.  


We have studied clusters of C10-C14 sized accretion products from isoprene and toluene oxidation, as well as clusters of C20 sized accretion products from ⍺-pinene oxidation.  The studied OOMs were obtained   using Gecko-AP, a RO2 + RO2 accretion product generator based on the Gecko-A software.  The main bottleneck for modelling OOM cluster is the conformational sampling of their high-dimensional potential energy surfaces. Thus we we have update previous automated cluster conformational sampling protocols. Initial sampling of cluster configurations was done at semi-empirical level of theory. Minimum free energy configurations were found through successive rounds of filtering and re-optimization at higher DFT levels of theory. As we found that even an extensive sampling of cluster configuration space does not guarantee that the global minimum is found, we introduced constraints to initial sampling which force hydrogen bond formation between molecules. We also used metadynamics simulations to search for additional local minima.  We are currently with neural network potentials which are likely to allow computationally even more effective configurational sampling.


The binding free energies of the OOM homodimers are almost uncorrelated with the saturation vapour pressures predicted by existing group-contribution approaches. Binding energy of heterodimers can, however, be estimated from homodimer binding energies with a spread of   ±1-2 kcal/mol, indicating desired tranferability from unimolecular properties to clustering efficiecy. The predicted binding free energies are too high for substantial clustering to occur in typical lower-tropospheric conditions. For validation purposes we performed calculations on dimers of differently sized polyethylene glycol molecules (PEGs), for which the configurational sampling is relatively straightforward, and the saturation vapor pressures are available both from quantum chemistry (via COSMOTherm) and experimentally. Using the PEG molecules, we demonstrate that both the weak binding, and the lack of correlation between binding free energies and saturation vapour pressures, are likely caused by intramolecular hydrogen bonding. This self-bonding is dictated by the molecular flexibility, which is ultimately a unimolecular property, and potentially a cost-effectively descriptor for assessing the clustering ability of OOMs with machine learning based methods.

How to cite: Vehkamäki, H., Kähärä, J., Kurtén, T., Ingram, S., and Franzon, L.: Modelling clusters of complex organic molecules , EGU General Assembly 2026, Vienna, Austria, 3–8 May 2026, EGU26-3019, https://doi.org/10.5194/egusphere-egu26-3019, 2026.

Accurate determination of the aerosol mixing state is indispensable to assess aerosol direct and indirect effects. However, the characterization of the mixing state is often limited by the scarcity of direct, in situ measurements of chemical composition and single-particle morphology. Consequently, the aerosol community has largely relied on optical closure techniques to infer the aerosol mixing states from optical measurements, which were generally deemed only as probable mixing states. The heuristic nature of these techniques restricts the quantification of inherent uncertainties in the inferred mixing states. To address this gap, this study presents an analytical formulation of the optical inversion problem as a linear system using the Python aerosol optical model, AeroMix. This formulation explicitly characterizes the problem as both ill-posed and ill-conditioned, while offering a scalable, modular framework that remains agnostic to the specific forward model and measurement techniques. To mitigate mathematical instabilities, system dimensionality is reduced by eliminating physically infeasible core-shell components and grouping spectrally indistinguishable core-shell components. Establishing that a unique solution is mathematically impossible, the solution space is characterized as a high-dimensional convex polytope bounded by linear inequalities defined by the range of measured optical properties and physical component constraints. Finally, this study proposes retrieving physically meaningful, sparse solutions by using Markov Chain Monte Carlo (MCMC) techniques to sample the polytope boundaries lying on coordinate hyperplanes. This stochastic approach transforms optical inversion from a heuristic estimation into a probabilistic characterization of the valid solution space, enabling robust uncertainty quantification in the inferred aerosol mixing states.

How to cite: P Raj, S. and Sinha, P. R.: An analytical formulation of the optical inversion of aerosol mixing state and characterization of solution space , EGU General Assembly 2026, Vienna, Austria, 3–8 May 2026, EGU26-3114, https://doi.org/10.5194/egusphere-egu26-3114, 2026.

EGU26-3123 | ECS | Posters on site | AS3.1

Development and Evaluation of Climate Simulations Using Machine Learning Enhanced Aerosol Model in OpenIFS Atmospheric Model 

Hermanni Halonen, Eemeli Holopainen, Tommi Bergman, Anton Laakso, Tero Mielonen, Antti Vartiainen, and Harri Kokkola

Atmospheric aerosols have a significant impact on cloud formation and life cycle. Aerosols enhance cloud formation and affect microphysical and radiative properties of clouds by acting as Cloud Condensation Nuclei (CCN). Aerosol-cloud interactions are very complex, and thus accurate global-scale simulations are challenging. 

Aerosol-cloud interactions occur at a microscopic level, but cloud systems are often on a scale of tens or hundreds of kilometers. Accurate modeling of all aerosol-cloud processes at such a large scale is computationally demanding. Therefore, models simulating aerosols and their interactions with radiation and clouds, are usually greatly simplified, making them inaccurate. In this study, the accuracy of a simple aerosol model HAM-Lite will be enhanced with a machine-learning component, and the enhanced model will be coupled with a global kilometer-scale Numerical Weather Prediction (NWP) model OpenIFS. 

OpenIFS is used for global climate simulations and weather forecasting. It is an easy-to-use version of Integrated Forecasting System (IFS) by the European Centre for Medium-Range Weather Forecasts (ECMWF). IFS models the atmosphere in EC-Earth 3 climate model and it is developed by the European Consortium of National Meteorological Services and Research Institutes. OpenIFS will be the main atmospheric model in the upcoming EC-Earth version 4. 

HAM-Lite is a simplified version of a more complex aerosol model HAM-M7. While HAM-M7 includes seven log-normal aerosol modes and a total of twenty-five tracers, HAM-Lite describes only four tracers. HAM-M7 calculates microphysical processes, like nucleation, condensation and coagulation, as well as other processes like emissions and dry and wet deposition. HAM-Lite simplifies the processes by assuming constant hygroscopicity and very simplified calculations for extinction. These simplifications make the model computationally lighter. 

Since aerosol hygroscopicity and extinction are highly simplified in HAM-Lite, we will incorporate machine learning methods to provide a more accurate representation, bringing its performance closer to that of HAM-M7. Training data for the machine learning component will be produced with HAM-M7 coupled with OpenIFS. The new enhanced HAM-Lite aerosol model will also be coupled with OpenIFS for improved global scale simulations. 

By coupling the new enhanced aerosol model with the climate model, the aim is to make the system more accurate without significantly increasing the computational cost. Results from OpenIFS, with and without the enhanced aerosol model, will be compared to in situ measurements, satellite data, and simulations with other models. Expectation is that OpenIFS, coupled with the light aerosol module and machine learning methods, will achieve higher accuracy with reduced computational cost compared to OpenIFS coupled with HAM-M7. 

This research is funded by the European Union's Horizon EU -project Digital Twin of Earth System for Cryosphere, Land Surface, and Related Interactions – TerraDT 101187992. 

How to cite: Halonen, H., Holopainen, E., Bergman, T., Laakso, A., Mielonen, T., Vartiainen, A., and Kokkola, H.: Development and Evaluation of Climate Simulations Using Machine Learning Enhanced Aerosol Model in OpenIFS Atmospheric Model, EGU General Assembly 2026, Vienna, Austria, 3–8 May 2026, EGU26-3123, https://doi.org/10.5194/egusphere-egu26-3123, 2026.

The distribution and source of atmospheric particles significantly influence the atmospheric environment. This study examines changes in Particle Number Size Distribution (PNSD) and its relationship with Planetary Boundary Layer Height (PBLH), as well as nucleation trajectories during new particle formation (NPF) events in three major Chinese cities: Beijing (BJ), Guangzhou (GZ), and Shanghai (SH). The observation periods include July 2017 to October 2019 (408 effective observation days), November 2019 to March 2020 (127 effective observation days), and April to June 2020 (44 effective observation days) for BJ, GZ, and SH, respectively. The results show that BJ exhibits the highest Nucleation Mode Particle Number Concentration (PNC) at 2.05 × 10⁶ cm⁻³, while GZ records the highest NPF frequency at 25.98%. In contrast, SH has the lowest PNC at 6.27 × 10⁵ cm⁻³ and the lowest NPF frequency (18.87%). High background particle concentrations significantly impact NPF. The sources of PNSD at the three observation sites exhibit distinct trajectories on NPF days. The main source of pollutants in BJ is Mongolia, located to the northwest. In GZ, the contribution mainly comes from Jiangxi and Fujian provinces to the northeast, while in SH, the source lies to the northwest. NPF frequencies consistently exceed 25%, predominantly in the northern regions of each site, indicating higher NPF levels in the north compared to the south. Nucleation-mode particles at all sites originate from continental sources, rather than marine sources, during NPF events. This research provides valuable insights for developing strategies to manage the atmospheric environment.

How to cite: Hu, H., Wu, H., and Zhang, Y.: New insights into the boundary layer revolution impact on new particle formation characteristics in three megacities of China, EGU General Assembly 2026, Vienna, Austria, 3–8 May 2026, EGU26-4879, https://doi.org/10.5194/egusphere-egu26-4879, 2026.

EGU26-5133 | ECS | Orals | AS3.1

Synoptic control on the dynamics and chemistry of regional PM2.5 sulfate transport in South China 

Kun Qu, Xuesong Wang, Yu Yan, Xipeng Jin, Xuhui Cai, Jin Shen, Teng Xiao, Manfei Yin, Mihalis Vrekoussis, Maria Kanakidou, Guy Brasseur, Limin Zeng, and Yuanhang Zhang

The local abundance of PM2.5 sulfate, an aerosol component with important health and environmental impacts, is often influenced by cross-regional transport. However, the associated dynamic and chemical processes governing PM2.5 sulfate transport under different synoptic conditions remain insufficiently understood. Improving this process-level understanding is essential for interpreting sulfate pollution in regions downwind of major emission sources. To this end, this study introduces a process-based framework to investigate how synoptic systems regulate PM2.5 sulfate transport.

Based on WRF/CMAQ simulations, we diagnosed the relative importance of horizontal transport and vertical exchange, as well as various in-plume sulfate production pathways, during two distinct PM2.5 sulfate pollution episodes in South China during autumn 2015. These episodes were linked to contrasting synoptic influences, namely the typhoon periphery and the subtropical high, and were characterized by strong and weak effects of cross-regional transport, respectively.

Our analyses show that vertical exchange across the boundary-layer top served as the major process of PM2.5 sulfate import in both episodes. Interestingly, pronounced vertical exchange occurred under both strong inflow and stagnant conditions, suggesting that they could independently intensify vertical PM2.5 sulfate exchange. Meanwhile, contrasting meteorological conditions and chemical environments in the two episodes resulted in different contributions of in-plume sulfate production pathways: gas-phase OH oxidation dominated within dry, cold and oxidant-rich plumes under typhoon periphery, whereas aqueous-phase H2O2 oxidation prevailed within wet and humid plumes under relatively stable conditions.

Overall, these results highlight the complex coupling between synoptic forcing, atmospheric dynamics and chemistry in cross-regional PM2.5 sulfate transport, providing new perspectives into sulfate pollution mechanisms and implications for future PM2.5 mitigation.

How to cite: Qu, K., Wang, X., Yan, Y., Jin, X., Cai, X., Shen, J., Xiao, T., Yin, M., Vrekoussis, M., Kanakidou, M., Brasseur, G., Zeng, L., and Zhang, Y.: Synoptic control on the dynamics and chemistry of regional PM2.5 sulfate transport in South China, EGU General Assembly 2026, Vienna, Austria, 3–8 May 2026, EGU26-5133, https://doi.org/10.5194/egusphere-egu26-5133, 2026.

EGU26-5897 | ECS | Orals | AS3.1 | Highlight

Airborne characterization of aerosol particles and gases emitted from the 2025 Canadian wildfires at Red Lake 

Keyvan Ranjbar, Norm O'Neill, Nour Elsagan, Islam Gomaa, and Joel Corbin

Wildfires are both a consequence of and a contributor to extreme weather events. Their increasing frequency and intensity significantly impact the atmosphere by virtue of the aerosol particles and gases they release and the radiative forcing impact of those atmospheric injections. In-situ measurements of these aerosols are extremely limited. Here, we present results from an aircraft-based field campaign conducted in July 2025, in the vicinity of Red Lake, Ontario, Canada. Fires with both flaming combustion and lower radiative power following rainfall were sampled. The aerial platform was the National Research Council Canada’s Twin Otter aircraft. The Twin Otter aircraft is a specialized and customizable research platform equipped with a variety of scientific instruments and sensors.

Gaseous measurements including greenhouse gases carbon dioxide (CO2), methane (CH4) and water vapor (H2O) were taken. Auxiliary data included aircraft state (aircraft location, altitude, and orientation) and atmospheric state (temperature, pressure and dew point). Particulate measurements including particle size distributions (PSDs), concentrations, single scattering albedos (SSA) and refractory black carbon (rBC) concentrations are reported. In addition, the number of non-rBC particles observed after thermo-denuding – representing ash or char particles – was measured in a dedicated experiment.

During these dedicated flights, we sampled both aerosols and gases at varying distances from the source and from directly above the fire to several hundred kilometers downwind. Preliminary results will include the properties and characterization of wildfire aerosols and GHGs at different distances from the fire source.

How to cite: Ranjbar, K., O'Neill, N., Elsagan, N., Gomaa, I., and Corbin, J.: Airborne characterization of aerosol particles and gases emitted from the 2025 Canadian wildfires at Red Lake, EGU General Assembly 2026, Vienna, Austria, 3–8 May 2026, EGU26-5897, https://doi.org/10.5194/egusphere-egu26-5897, 2026.

EGU26-6178 | ECS | Posters on site | AS3.1

Influence of the nocturnal residual layer on nitrate formation in the Seoul Metropolitan Area using the Korea Air Quality Observation-Based Box Model (KAB) 

Na-Hyeon Kim, Minjoong J. Kim, Sung Hoon Park, Gook-Young Heo, Jung-Min Park, and Hye Jung Shin

Fine particulate matter has declined across South Korea. Yet haze episodes remain frequent in the Seoul Metropolitan Area. Understanding these events requires a mechanistic analysis of nitrate formation, a major component of fine particulate matter.

Previous box model studies have not fully represented boundary layer evolution. They also have not captured the nighttime influence of residual layer entrainment and dilution. Even multi-layer box model frameworks often assume a fixed boundary layer height. Most related studies have focused on China. As a result, quantitative evidence for the role of boundary layer mixing in the Seoul Metropolitan Area is still limited.

Here we quantified how the residual layer affects nitrate production and loss over the Seoul Metropolitan Area using KAB (Korea Air Quality Observation-Based Box Model). KAB is an emissions- and observation-constrained box model derived from the 3D chemical transport model CMAQ. We extended the conventional single-layer configuration to a two-layer structure. We also diagnosed boundary layer and residual layer heights from ERA5 reanalysis to capture day–night differences. During daytime, we assumed a well-mixed layer. During nighttime, we prescribed distinct concentrations in the two layers to represent vertical gradients and multi-layer effects.

Our results show that residual layer development and boundary layer mixing exert substantial control on nitrate variability in the Seoul Metropolitan Area. Residual layer entrainment increases surface nitrate by transporting aerosol aloft down to the ground. It also enhances aerosol formation. This occurs when undiluted precursors are converted to particulate nitrate during subsequent mixing. These findings indicate that residual layer mixing is a key driver of high haze events in this region.

Acknowledgment: This work was supported by the National Research Foundation of Korea(NRF) grant funded by the Korea government(MSIT) (No. RS-2025-16070879).

How to cite: Kim, N.-H., Kim, M. J., Park, S. H., Heo, G.-Y., Park, J.-M., and Shin, H. J.: Influence of the nocturnal residual layer on nitrate formation in the Seoul Metropolitan Area using the Korea Air Quality Observation-Based Box Model (KAB), EGU General Assembly 2026, Vienna, Austria, 3–8 May 2026, EGU26-6178, https://doi.org/10.5194/egusphere-egu26-6178, 2026.

EGU26-6214 | ECS | Posters on site | AS3.1

Constraining the Imaginary Refractive Index of Brown Carbon via an Observation-Informed Inversion Framework 

Hye-eun Cho, Minjoong J Kim, Seohee H Yang, Yongjoo Choi, Minseo Lee, and Seungun Lee

Brown carbon (BrC) is a significant component of absorbing aerosols, yet its wavelength-dependent complex refractive index (CRI) remains one of the least constrained parameters in aerosol optical modeling. This study aims to constrain the imaginary part of the BrC CRI using an observation-informed physical inversion framework. We utilized in-situ absorption measurements collected in Ansan, South Korea, representing seasonal variations in 2024, alongside aerosol mass concentrations simulated by the A Global/Regional Integrated Model System-Chemistry Climate Model (GRIMs-CCM) and Weather Research & Forecasting Model (WRF) coupled with GEOS-Chem chemistry (WRF-GC) models. Optical properties were computed using the Flexible Aerosol Optical Depth (FlexAOD) system based on Mie theory. In our framework, organic carbon was partitioned into water-soluble and water-insoluble components to account for hygroscopic and compositional differences. The imaginary refractive index was parameterized as a power-law function of wavelength. By iteratively adjusting the spectral exponent to minimize discrepancies between observed and simulated Absorption Ångström Exponent (AAE) values (365–500 nm), we derived optimized CRI values. The results show that the optimized imaginary refractive index decreases monotonically with increasing wavelength, with the strongest spectral gradient observed in winter, indicative of enhanced shortwave absorption by BrC. The retrieved values align with reported ranges for strongly absorbing BrC. This study presents a physically consistent framework for improving the representation of BrC optical properties in radiative forcing assessments.


Acknowledgment: This work was supported by the National Research Foundation of Korea(NRF) grant funded by the Korea government (MSIT) (No. RS-2025-16070879).

How to cite: Cho, H., Kim, M. J., Yang, S. H., Choi, Y., Lee, M., and Lee, S.: Constraining the Imaginary Refractive Index of Brown Carbon via an Observation-Informed Inversion Framework, EGU General Assembly 2026, Vienna, Austria, 3–8 May 2026, EGU26-6214, https://doi.org/10.5194/egusphere-egu26-6214, 2026.

EGU26-6703 | Posters on site | AS3.1

Exploration of complex physical and chemical processes of a severe urban pollution episode over central Taiwan 

Chuan-yao Lin, Wen-Mei Chen, Yang-Fan Sheng, Wan-Chin Chen, Hing Cho Cheung, and Charles, C. K. Chou

Nitrate is a major inorganic aerosol and a dominant component during air quality events in central Taiwan. This study analyzes a haze episode with record-high PM2.5 levels, peaking at 110 µg/m³ in central Taiwan’s urban areas (UAPRS) on 4–5 November 2021. During this event, PM2.5 at UAPRS averaged 29.0 µg/m³ in the daytime and 89.7 µg/m³ at night. Notably, nitrate rose sharply from 4.4 to 39.0 µg/m³, accounting for 43.5% of the nighttime PM2.5 increase in central Taiwan on the event day.

Simulation results indicated that the lee-side vortex, driven by the interaction between the ambient flow and the Central Mountain Range (CMR), facilitated the accumulation of pollutants, transporting them northward to the ocean and then returning as the ambient wind direction changed from easterly to southeasterly. Additionally, the swept-back plume in the afternoon, driven by the lee-side northwesterly flow and overlaid with urban pollution, was a key contributor to the first PM2.5 peak at 20:00-22:00 LST on November 4. The mechanisms study revealed that nitrate aerosol was dominant, with N₂O₅ hydrolysis playing a critical role in its formation in the nocturnal atmospheric chemistry. Furthermore, the convergence of the lee-side northwesterly flow with the mountain downslope wind at midnight, combined with the reduction in planetary boundary layer height, enhanced the second PM2.5 peak, which occurred between 02:00 and 03:00 LST on November 5. The findings of this study can be applied to other regions with similar complex topography, pollution environments, and comparable relief.

How to cite: Lin, C., Chen, W.-M., Sheng, Y.-F., Chen, W.-C., Cheung, H. C., and Chou, C. C. K.: Exploration of complex physical and chemical processes of a severe urban pollution episode over central Taiwan, EGU General Assembly 2026, Vienna, Austria, 3–8 May 2026, EGU26-6703, https://doi.org/10.5194/egusphere-egu26-6703, 2026.

EGU26-6963 | ECS | Posters on site | AS3.1

Study on the Influence of Sulfuric Acid Plumes in Urban Residual Layers on High-Altitude New Particle Formation 

Zhenning Wang, Wei Nie, Chao Yan, Yuliang Liu, Chong Liu, Qiaozhi Zha, Ying Zhang, Tao Xu, Ximeng Qi, Xueyu Zhou, Dafeng Ge, Chang Zhou, Junchao Yin, Haoyu Liu, Liangduo Chen, Caijun Zhu, Xuguang Chi, and Aijun Ding

    Atmospheric new particle formation (NPF) has been recognized as a major contributor to aerosol and cloud condensation nuclei number concentrations, exerting substantial impacts on both air pollution and climate. However, NPF vertical distribution has been left largely uncharacterized because most, if not all, NPF observations were conducted on the ground surface, which may not be representative to the situation within the whole boundary layer. Here we conduct measurements on the vertical profiles of particle number size distribution and key precursors of NPF with a high payload tethered airship in Nanjing, China. We show that, while particle size distribution displays a homogeneous feature in a well-mixed boundary layer as expected, surprising particle nucleation is frequently seen at around 600 m altitude in early morning before the mixing layer is fully developed. The nucleation aloft is associated with sulfuric acid-rich plume, likely contributed by industrial emissions, yet its intensity is limited by low sulfuric acid clustering efficiency and low abundance of condensable organic vapors. Overall, our results reveal that industrial emission acts as an important source of urban sulfuric acid and nanoparticles, unrecognizable from ground-level measurement or in well-mixed atmosphere, and that the boundary layer dynamics has a profound influence on the vertical profiling of particle number size distribution.

How to cite: Wang, Z., Nie, W., Yan, C., Liu, Y., Liu, C., Zha, Q., Zhang, Y., Xu, T., Qi, X., Zhou, X., Ge, D., Zhou, C., Yin, J., Liu, H., Chen, L., Zhu, C., Chi, X., and Ding, A.: Study on the Influence of Sulfuric Acid Plumes in Urban Residual Layers on High-Altitude New Particle Formation, EGU General Assembly 2026, Vienna, Austria, 3–8 May 2026, EGU26-6963, https://doi.org/10.5194/egusphere-egu26-6963, 2026.

EGU26-7261 | Orals | AS3.1

Long-range transport of wildfire emissions over Zugspitze, Germany: An opportunity to test the field calibration of black carbon absorption photometers 

Jorge Saturno, Cedric Couret, Michael Elsasser, Bryan Hellack, and Andreas Nowak

The Schneefernerhaus observatory at Zugspitze, Germany is located at 2650 m a.s.l and provides the opportunity to monitor long-range transport of air pollutants in the free troposphere. In this study, we present aerosol observations performed from July to October 2025, with special focus on aerosol light absorption, i.e. brown and black carbon. Light-absorbing carbonaceous matter (LAC) is relevant to the climate due to its  short atmospheric lifetime and the dynamic behaviour of its optical properties, which change upon aging. Black carbon is included as a metric to be measured in the recent modification of the European Air Quality Directive, underscoring the need for an SI-traceable calibration chain for black carbon. This need is particularly pressing for absorption photometers (e.g., aethalometers), which are widely deployed in air quality monitoring networks. A field calibration has proven challenging given that there is no standard reference material available and that primary measurement methods are not yet ready for straightforward field deployment.

In this study, we have used an Aethalometer AE36s (Aerosol d.o.o., Ljubljana, Slovenia) and a photo-acoustic extinctiometer (PAX, Droplet Measurement Technology, Longmont, USA) to monitor aerosol light absorption during a 10-week field campaign at Schneefernerhaus. Additionally, we have used particle number size distribution (PNSD), and multi-angle absorption photometer (MAAP) data to assess different aerosol physical properties. The primary objective was to use the PAX measurements as a transfer standard to calibrate AE36s measurements in the field. The calibration transfer has proven feasible for the IR wavelength of 880 nm, which is of special interest when the focus is to determine black carbon with the less interference from other LAC components.

Observations in August 2025 show clearly a spike of LAC concentration with different wavelength dependencies (see Fig. 1), indicating a highly variable contribution of brown carbon to the total aerosol mass. HYSPLIT back-trajectory analysis indicate that these aerosol episodes originated from Canadian wildfires, which were highly active during the measurement period.

Overall, the field calibration method using PAX as a transfer standard has proven to be reliable and plausible. However, the method is constrained by the sensitivity and limit of detection of the PAX and also require that the PAX itself is calibrated against a primary method, such as extinction-minus-scattering or photo-thermal interferometry. The development of a robust primary calibration strategy for photo-acoustic spectrometers would significantly improve the traceability chain and would minimize uncertainties for in-field calibration of absorption photometers.

Figure 1. Aerosol absorption coefficient measured by an Aethalometer AE36s at Schneefernerhaus Zugspitze, Germany in August 2025.

How to cite: Saturno, J., Couret, C., Elsasser, M., Hellack, B., and Nowak, A.: Long-range transport of wildfire emissions over Zugspitze, Germany: An opportunity to test the field calibration of black carbon absorption photometers, EGU General Assembly 2026, Vienna, Austria, 3–8 May 2026, EGU26-7261, https://doi.org/10.5194/egusphere-egu26-7261, 2026.

EGU26-8034 | Posters on site | AS3.1

Unraveling the Life Cycle of a Severe Winter Haze in Changsha with Polarization Lidar 

Mingcai Lan, Li Zhou, Qingrou Long, Jingjing Chen, Jingyu Xu, Lianye Liu, Jing Zhang, Hui Zhou, and Ruqi Huang

To investigate the formation and dissipation mechanisms of severe winter haze in Changsha, this study presents a comprehensive analysis of a typical heavy haze episode from December 29 to 31, 2025, based on continuous ground-based multi-wavelength polarization lidar observations combined with near-surface PM2.5 and meteorological data.

Lidar profiling identified a stable pollution aerosol layer of 300-500 m, closely coupled with surface pollution. The episode evolved through four distinct stages. In the initial stage (daytime, 29th), a PM2.5 concentration of ~140 μg/m3, an extinction coefficient of ~1.8 km-1, and a depolarization ratio of 0.17 indicated the presence of mixed aerosols dominated by relatively dry fine particles. The explosive growth stage (17:00-19:00, 29th) was critical, where under stagnant conditions with rising relative humidity (~70%), PM2.5 surged from 134.6 to 244.2 μg/m3. The concurrent increase in the extinction coefficient to 2.3 km-1 and a slight decrease in the depolarization ratio to 0.15 confirmed rapid pollutant accumulation in a compressed boundary layer, with newly added particles being more hygroscopic and spherical. During the mature stable stage (evening 29th to morning 31st), pollution peaked and plateaued (PM2.5: 280-350 μg/m3). The high extinction coefficient (2.5-4.0 km-1) and a further reduced depolarization ratio (0.11) signified fully aged aerosols dominated by hygroscopic, spherical secondary inorganic particles. In the wet scavenging stage (after 12:00, 31st), driven by precipitation and wind, PM2.5 plummeted from 357.8 to 53.4 μg/m3 within 8 hours. Notably, the extinction coefficient temporarily peaked near 5 km-1, and the depolarization ratio increased to 0.2, clearly capturing the scavenging signal from non-spherical raindrops.

This study delineates the complete life cycle of "stagnant accumulation—explosive growth—sustained high pollution—removal by wind and precipitation". The core finding is that the co-evolution of lidar-derived extinction coefficients and depolarization ratios visually elucidates the microphysical processes governing pollution accumulation, aerosol aging, and wet removal. It confirms that polarization lidar is an indispensable tool for dynamically discriminating aerosol phases and quantifying pollution evolution, providing crucial scientific support for understanding haze formation.

How to cite: Lan, M., Zhou, L., Long, Q., Chen, J., Xu, J., Liu, L., Zhang, J., Zhou, H., and Huang, R.: Unraveling the Life Cycle of a Severe Winter Haze in Changsha with Polarization Lidar, EGU General Assembly 2026, Vienna, Austria, 3–8 May 2026, EGU26-8034, https://doi.org/10.5194/egusphere-egu26-8034, 2026.

EGU26-9404 | ECS | Posters on site | AS3.1

Machine Learning Prediction of Long-term Variations in Cloud Condensation Nuclei in the upper boundary layer of North China 

Can Cui, Yujiao Zhu, Jiangshan Mu, Yuqiang Zhang, and Likun Xue

The scarcity of field observations of cloud condensation nuclei (CCN) limits effective constraints on aerosol–cloud interactions. While a small number of recent studies have explored machine learning approaches based on aerosol chemical and optical characteristics, even fewer have explicitly included particle number size distributions (PNSDs). Here, we developed an observation-driven model based on XGBoost to predict CCN number concentrations (NCCN) by incorporating PNSDs and auxiliary variables. The model exhibits robust performance on the test dataset at supersaturations (SS) of 0.2%, 0.4%, and 1.0% (R2 = 0.91–0.92; RMSE = 235–381 ppbv), demonstrating excellent capability in capturing the temporal variability of NCCN. PNSDs are identified as the most influential features for NCCN prediction using the SHapely Additive exPlanation (SHAP) approach, with the dominant size range shifting from 100–150 nm at SS ≤ 0.4% to 50–100 nm at 1.0% SS. The XGBoost model was further employed to reconstruct the long-term variations of NCCN in the upper boundary layer over North China during 2007–2025. Our results show that NCCN predominantly ranges from 866 to 2104 cm-3, with higher values in spring and winter but enhanced activation ratios in summer and autumn. Interannual variability beyond seasonal influences indicates that NCCN exhibits pronounced interannual fluctuations, largely driven by changes in highly oxidized particle sources. In contrast, overall aerosol hygroscopicity and activation ratio exhibit a gradual decline. The proposed XGBoost framework not only extends long-term NCCN records but also provides new mechanistic insights into CCN activation, thereby reducing uncertainties in the assessments of aerosol-cloud interactions.

How to cite: Cui, C., Zhu, Y., Mu, J., Zhang, Y., and Xue, L.: Machine Learning Prediction of Long-term Variations in Cloud Condensation Nuclei in the upper boundary layer of North China, EGU General Assembly 2026, Vienna, Austria, 3–8 May 2026, EGU26-9404, https://doi.org/10.5194/egusphere-egu26-9404, 2026.

EGU26-9815 | ECS | Posters on site | AS3.1

Integrating the Mahalanobis Distance Metric with Spectral Clustering: A Hybrid Aerosol Classification Algorithm 

Swagata Mukhopadhyay and Shantikumar S Ningombam

Aerosols play a critical role in the Earth’s radiation budget by scattering and absorbing solar radiation; however, their classification remains a major source of uncertainty due to overlapping fine and coarse modes, complex mixing states, and strong spatio-temporal variability, particularly over mountainous terrain. This study presents a hybrid aerosol classification framework applied to long-term (2008–2025) sky–sun radiometer (SKYNET) observations from three high-altitude sites in the Ladakh region, together with global AERONET observations spanning 171 sites across six continents from 1993 to 2025. The algorithm is tested under both climatically sensitive high-altitude environments and diverse global conditions to evaluate its robustness and credibility. The approach integrates unsupervised spectral clustering with the statistical Mahalanobis distance (MD) metric to improve aerosol regime separation in high-dimensional feature space. The spectral clustering technique, an unsupervised data-driven approach, involves three main steps: constructing a similarity graph, projecting the data into a low-dimensional space, and forming clusters. Although spectral clustering partitions the entire dataset, real aerosol regimes typically exhibit a dense core of representative observations, with transitional or mixed cases occurring at the periphery. To reduce this overlap, the MD metric is introduced to retain only the core inliers.  Internal validation of the algorithm is performed using the Silhouette coefficient, Calinski–Harabasz index, and Davies–Bouldin index. A traditional threshold-based classification method is employed for external validation of the proposed framework. Using the hybrid algorithm, aerosols are classified into four types: Dust, Mixed, Absorbing, and Non-absorbing. Among the 171 sites analysed, 83 sites are dominated by Absorbing aerosols, 19 by Dust, 1 by Mixed, and 68 by Non-absorbing aerosol types. Africa is primarily dominated by dust aerosols, accounting for 50% of the sites. Absorbing aerosols dominate in Asia (67.3%), Australia (55.6%), and South America (77.3%). In contrast, Europe and North America are largely characterised by Non-absorbing aerosol types, representing 75.8% and 73.5% of the sites, respectively. A strong and statistically significant positive correlation (Pearson’s r = 0.89, p = 0.0166) is observed between the continent-wise dominant aerosol fractions derived from the threshold-based and hybrid classification methods. Individual continental comparisons reveal small deviations for Africa, Europe, and North America (<3%), identical results for Australia, and comparatively larger differences for Asia (+8.4%) and South America (−9.1%), suggesting an enhanced sensitivity of the hybrid approach in regions characterised by complex aerosol regimes. At high-altitude sites, low aerosol concentrations make the development of robust aerosol classification schemes particularly challenging. Nevertheless, major aerosol types—such as absorbing, non-absorbing, and mixed aerosols—can be effectively distinguished using spectral clustering algorithms, thereby enhancing the effectiveness of the proposed hybrid method.


How to cite: Mukhopadhyay, S. and Ningombam, S. S.: Integrating the Mahalanobis Distance Metric with Spectral Clustering: A Hybrid Aerosol Classification Algorithm, EGU General Assembly 2026, Vienna, Austria, 3–8 May 2026, EGU26-9815, https://doi.org/10.5194/egusphere-egu26-9815, 2026.

EGU26-10146 | Posters on site | AS3.1

Constraining the Global Direct Radiative Forcing of Black Carbon via the Chemical Aerosol Mixing State Index 

Fei Jiang, Dantong Liu, David Topping, Hugh Coe, and Zhonghua Zheng

Black carbon (BC) is an important climate forcing agent, yet its direct radiative forcing (DRF) remains highly uncertain at the global scale, largely due to simplified representations of particle morphology and chemical mixing state in numerical models. Despite advances in particle-scale studies, global assessments still commonly assume fully internal mixing. Here, we present an implementable modelling framework that characterises particle-scale chemical heterogeneity using the mixing state index (χ) and coating volume ratio (VR). Particle-resolved simulations are employed to quantify the effects of χ and VR on BC optical properties. Machine learning is then used to map this particle-scale information onto variables accessible in Earth system models, enabling the estimation of BC radiative forcing under more realistic mixing state conditions. This framework provides a practical pathway to improve global assessments of BC radiative effects.

How to cite: Jiang, F., Liu, D., Topping, D., Coe, H., and Zheng, Z.: Constraining the Global Direct Radiative Forcing of Black Carbon via the Chemical Aerosol Mixing State Index, EGU General Assembly 2026, Vienna, Austria, 3–8 May 2026, EGU26-10146, https://doi.org/10.5194/egusphere-egu26-10146, 2026.

EGU26-10426 | ECS | Posters on site | AS3.1

Fixed-Mode inverse-Gamma Fitting of Aerosol Particle Number Size Distributions 

Abdur Rahman, Santtu Mikkonen, Juha Kangasluoma, Tareq Hussein, Tuukka Petäjä, Sasu Tarkoma, and Martha Arbayani Zaidan

Quantitative analysis of aerosol particle number size distributions (PNSDs) measured with a Differential Mobility Particle Sizer (DMPS), commonly relies on modal representations to describe dominant particle populations and their evolution. While lognormal models are widely used, they may inadequately represent skewed or heavy-tailed size spectra frequently observed in atmospheric measurements. However, observational PNSD data often exhibit strong skewness, multimodality, and occasional abnormal spikes arising from instrumental noise or transient sampling artefacts, which complicate conventional fitting approaches.

We present a robust, automated fixed-mode fitting framework for aerosol multi-mode inverse-gamma (AeroMiG) distributions to measured PNSDs across large datasets. The method represents each PNSD as a superposition of inverse-gamma modes, with parameters estimated via a differential evolution technique based on global optimization methods. Model parameters, including shape, scale, and amplitude of each inverse-gamma mode, are estimated by minimizing a robust objective function that combines reconstruction error (mean squared error) and goodness-of-fit measures (R-square). To evaluate fit quality and ensure consistency across time-resolved data, standard statistical metrics such as MSE, Akaike and Bayesian information criteria, and coefficients of determination are computed for each fitted spectrum.

The framework is designed for high-throughput applications to large datasets and supports parallel processing, enabling efficient analysis of long-term aerosol observations. Application to atmospheric PNSD measurements demonstrates that fixed mixtures of inverse-gamma modes effectively capture asymmetric and heavy-tailed distribution features, providing a flexible alternative to conventional lognormal parameterizations. This approach facilitates consistent intercomparison of modal parameters across time and supports improved interpretation of aerosol processes and source contributions. 

How to cite: Rahman, A., Mikkonen, S., Kangasluoma, J., Hussein, T., Petäjä, T., Tarkoma, S., and Zaidan, M. A.: Fixed-Mode inverse-Gamma Fitting of Aerosol Particle Number Size Distributions, EGU General Assembly 2026, Vienna, Austria, 3–8 May 2026, EGU26-10426, https://doi.org/10.5194/egusphere-egu26-10426, 2026.

EGU26-10475 | ECS | Posters on site | AS3.1

Machine Learning Integration of PTAAM and SP2 Measurements for Enhanced Aerosol Absorption Characterization 

Ankur Bhardwaj, Griša Močnik, Jesús Yus-Díez, and Luka Drinovec

Quantifying the light absorption of atmospheric aerosols remains one of the more critical challenges in climate science. Black carbon (BC) and mineral dust (MD) dominate aerosol light-absorption globally, yet their mass absorption cross-sections (MAC)—the fundamental measure linking particle mass to light absorption—vary by orders of magnitude across the literature. This inconsistency stems partly from measurement artefacts inherent to existing techniques. Filter-based methods suffer from systematic errors, photoacoustic approaches introduce thermal biases, and single-particle instruments like the SP2 (Single Particle Soot Photometer) require assumptions about particle morphology that may not hold in the real ambient environments.

This project proposes a hybrid strategy that integrates two complementary measurement platforms with machine learning to address these limitations. Photo-Thermal Aerosol Absorption Monitor (PTAAM) offers high sensitivity while remaining insensitive to scattering effects, whereas the SP2 provides detailed microphysical information about individual particles. The methodological novelty lies not merely in combining these tools, but in developing advanced algorithms—particularly graph neural networks (GNNs)—to extract physically meaningful patterns from their joint data streams.

The work encompasses three interconnected objectives: first, calibrating the SP2 for dust and iron oxide detection through rigorous laboratory work with size-selected aerosols; second, establishing size- and wavelength-resolved absorption spectra using a newly developed PTAAM system; third, constructing machine learning models that fuse these measurements to produce more reliable optical property estimates. Validation occurs through both controlled laboratory experiments and field campaigns in contrasting environments.

By reducing uncertainties in aerosol light-absorption measurements, this study promises to improve climate model predictions and remote sensing retrievals—bridging fundamental aerosol physics with practical applications in understanding aerosol-radiation interactions.

How to cite: Bhardwaj, A., Močnik, G., Yus-Díez, J., and Drinovec, L.: Machine Learning Integration of PTAAM and SP2 Measurements for Enhanced Aerosol Absorption Characterization, EGU General Assembly 2026, Vienna, Austria, 3–8 May 2026, EGU26-10475, https://doi.org/10.5194/egusphere-egu26-10475, 2026.

EGU26-10715 | Posters on site | AS3.1

Sahara dust event of 06.02.21 in Switzerland: Iberulite fall and formation mechanism 

Bernard Grobety, Philippe Favreau, Juanita Rausch, David Jaramillo, and Christoph Neururer

During the Saharan Dust Event (SDE) in February 2021, dust clouds were transported from the Moroccan-Algerian border to Central Europe. In Western Switzerland, large particles up to 300 µm in size falling to the ground were observed in situ. The large "particles" were multimineral spherical aggregates, termed iberulites (IF) after their first recording on the Iberian Peninsula (Díaz-Hernández et al., 2008). The cores contain coarser grains, lacking a visible cement matrix, and have a thin, dense surface layer of much smaller particles. The Particle Size Distribution (PSD) inside the iberulites is ±monomodal, with a maximum at 2.5 µm, i.e., much larger than the value, i.e., 0.2 µm, for Saharan dust sampled at the JungFrauJoch (JFJ) station in the main dust layer. The PSD of the particles inside the iberulites shows a minimum where the JFJ has a maximum, i.e., between 0.1 and 1.0 µm. 

The atmospheric conditions during the IF were well documented (meteorological station in Payerne close to Frribourg!). In contrast to the previous IFs observed in the Iberian Peninsula, this IF occurred under lower-temperature conditions, e.g., near the freezing point in the cloud and at the surface. Two mechanisms have been envisaged for aggregating a large number of dust particles  (Díaz-Hernández et al., 2008) 1. The coalescence of drops within a cloud increases the number of particles within a single growing drop (In-Cloud Scavenging, ICS), or 2. the particle concentration increases by collisions of drops with the latter below the cloud (Below-Cloud Scavenging, BCS). The BCS rate (= collection efficiency, CE) depends on particle size (Slinn, 1977).

Particles >1µm will be included by impaction, and CE is taken as 100%. However, for particles with radii between 0.3µm and 1µm, the CE is <<1. Particles with radii within the size span given above, despite being on collision trajectories, follow the flow lines and are sent around the latter, whereas very small particles (< 0.1µm) may be pushed by Brownian motion and deposited on the droplet's rear end (Brownian capture), and CE is also close to 1. For particles with radii between 0.3 and 1.0 µm, CE decreases by two orders of magnitude. This decrease in CE was first described by Greenfield(Greenfield, 1957) and is therefore referred to as Greenfield gap. The temperature at the upper boundary of the dust layer was below 0°C, and scavenging occurred by frozen hydrometeors, which are known to be better scavengers of aerosol particles than rain. The presence of a Greenfield gap in the iberulites collected in western Switzerland indicates that below-cloud scavenging is the probable formation mechanism

Díaz-Hernández, J. L. and Párraga, J., 2008., Geochimica et Cosmochimica Acta, 72, 3883–3906

Greenfield, S. M.,1957, Journal of Meteorology, 14, 115–125

How to cite: Grobety, B., Favreau, P., Rausch, J., Jaramillo, D., and Neururer, C.: Sahara dust event of 06.02.21 in Switzerland: Iberulite fall and formation mechanism, EGU General Assembly 2026, Vienna, Austria, 3–8 May 2026, EGU26-10715, https://doi.org/10.5194/egusphere-egu26-10715, 2026.

Being the most important alkaline gas in the atmosphere, ammonia (NH3) can react with acidic species to form ammonium salts, which have significant impacts on air quality and human health. Laboratory studies confirm that NH3 can heterogeneously react with carbonyl groups in secondary organic aerosol (SOA) to form nitrogen-containing organic compounds (NOCs), consuming gaseous ammonia and potentially influencing ammonia levels and aerosol composition. In order to study the possible impact of this reaction, we incorporated a first-order loss rate representing the NH3-SOA uptake reaction into the WRF-Chem air quality model and conducted simulations over the North China Plain (NCP) during November 2017. With an uptake coefficient γ of 10-5, the modeled average NOCs concentration was 1.60 μg m-3, closely matching the observed average of 1.52 μg m-3. However, given the presence of other significant sources contributing to NOCs, we consider γ = 10-5 to represent the upper limit for the uptake coefficient of this specific NH3–SOA reaction. Sensitivity tests indicate only minor changes in NH3 concentrations, with an average decrease of 0.69% (0.04 μg m⁻³). The average percentage changes for NO3-, NH4+, and SO42- were -0.08%, -0.06%, and -0.01%, respectively, while SOA and PM2.5 exhibited negligible variations of -0.03% and +0.03%. These results suggest that, although the NH3-SOA heterogeneous uptake can contribute to NOCs formation, its overall effect on atmospheric NH3 and particulate matter is limited, and it does not constitute a significant factor in regional air quality modeling in NCP. 

How to cite: Lu, Y.: Modeling ammonia uptake by secondary organic aerosols in the North China Plain , EGU General Assembly 2026, Vienna, Austria, 3–8 May 2026, EGU26-10819, https://doi.org/10.5194/egusphere-egu26-10819, 2026.

EGU26-11907 | Posters on site | AS3.1

Source Attribution of High-Latitude Aerosols Based on Multi-Wavelength Optical Properties 

Bernadette Rosati, Jane Tygesen Skønager, Zihui Teng, Matthew Salter, Romanos Foskinis, Nikolaos Evangeliou, Athanasios Nenes, Henrik Skov, and Andreas Massling

Atmospheric aerosols represent one of the largest sources of uncertainty in estimates of future climate predictions. A key challenge arises from the large variety of aerosol types differing in physical properties, e.g. size and shape, and chemical composition as well as concentration. Coastal regions are particularly complex environments, where natural and anthropogenic aerosols co-exist, mix and interact, often fundamentally altering their original properties. At the same time, coastal areas are densely populated, hosting approximately 40 % of the global population. Consequently, improved knowledge of aerosol properties in coastal regions is essential not only for climate studies but also because of their relevance to human health.

The aerosols’ optical properties, defined by their interactions with sunlight through scattering and absorption, provide valuable insight into both their physical and chemical properties. The wavelength-dependent light scattering signal can be predominantly related to the particles size, while the wavelength-dependent absorption signal rather more reflects the aerosol particles’ chemical composition. By combining these types of information within a so-called Ångström matrix, the aerosol sources and types can be assessed.

In this work, aerosol optical properties were measured at three different coastal sites representing contrasting environments to identify dominant aerosol sources and types. Measurement campaigns were conducted in an urban environment at Aarhus Bay, Denmark, a rural environment at Askö, Sweden and a pristine Arctic environment at Villum Research Station, Northwest Greenland. Wavelength-dependent scattering coefficients were measured using a nephelometer (AURORA 3000, Ecotech) and wavelength-dependent absorption coefficients were obtained by an aethalometer (AE33 or AE36s, MAGEE). In addition, aerosol number size distributions were measured and air-mass back-trajectory analysis was performed. One intense measurement campaign of approximately five weeks was carried out at each site between spring 2023 and spring 2025. The resulting datasets were analysed regarding dominant aerosol sources, determining the importance of natural vs. anthropogenic emissions and locally emitted vs. long-range transported aerosols.

How to cite: Rosati, B., Skønager, J. T., Teng, Z., Salter, M., Foskinis, R., Evangeliou, N., Nenes, A., Skov, H., and Massling, A.: Source Attribution of High-Latitude Aerosols Based on Multi-Wavelength Optical Properties, EGU General Assembly 2026, Vienna, Austria, 3–8 May 2026, EGU26-11907, https://doi.org/10.5194/egusphere-egu26-11907, 2026.

Atmospheric aerosol acidity governs a wide range of chemical processes, yet current global climate and chemical transport models calculate aerosol and cloud pH assuming that organic aerosol (OA) components are electrically neutral. This omission persists despite observations showing that organics comprise ~40% of global aerosol mass and frequently include weakly and strongly acidic species. As a result, a major contributor to particle-phase hydrogen ion budgets is systematically neglected in models.

Here we address this gap by introducing organic aerosol acidity into a global aerosol–chemistry–climate model. We first implement an idealized representation of OA acidity based on intrinsic bulk-phase acid dissociation, treating organic species as weak acids that contribute dynamically to aerosol hydrogen ion concentrations. This bulk-acidity case serves as an upper-limit, chemically ideal reference. To account for non-ideal behaviour under atmospheric conditions, we then introduce suppressed organic acid dissociation, representing deviations arising from surface effects in small droplets, mixed-acid systems, and other environmental constraints.

In parallel, we identify a second chemical inconsistency in the model: the oxidation of SO₂ by H₂O₂ is treated using a pH-insensitive kinetic formulation. We replace this with a pH-dependent general-acid catalysis mechanism, allowing organic acids to act as proton donors in aqueous sulfate formation. These developments are implemented first in a box-model framework and subsequently translated to the fully coupled global climate model ECHAM–HAMMOZ.

Including organic aerosol acidity substantially increases aqueous sulfate production, leading to enhanced cloud droplet number concentrations across large regions. The resulting changes strengthen shortwave cloud radiative cooling, yielding an additional cloud radiative forcing of approximately -0.6 to -1.0 W m-2, depending on the degree of non-ideality assumed. This forcing is comparable to the current uncertainty range associated with aerosol–cloud interactions, demonstrating that organic aerosol acidity constitutes a previously missing and climatically significant chemical driver that should be represented in global models.

How to cite: Sengupta, G.: Why organic aerosol acidity matters: Bridging molecular acidity and global aerosol–cloud chemistry, EGU General Assembly 2026, Vienna, Austria, 3–8 May 2026, EGU26-12555, https://doi.org/10.5194/egusphere-egu26-12555, 2026.

EGU26-13782 | ECS | Orals | AS3.1

Simultaneous MPSS data inversion and aerosol process rate estimation with uncertainty quantification via Bayesian state-space methods 

Teemu Salminen, Aku Ursin, Kari Lehtinen, and Matti Niskanen

Aerosol particles influence climate both directly, by scattering and absorbing solar radiation, and indirectly, by acting as cloud condensation nuclei. However, the magnitude of these effects remains highly uncertain, largely due to limitations in how aerosol dynamics are represented in global climate models. Current models often rely on simplified process rate approximations and coarse aerosol dynamics, as more accurate simulations are computationally prohibitive.

To improve parameterizations in climate models, there is a need for robust methods to estimate aerosol process rates, such as condensation, formation, and deposition, from both chamber and atmospheric data. These rates are not well constrained, as the underlying physical mechanisms are not yet fully understood. Nevertheless, they are key drivers of aerosol size distribution evolution, which varies with atmospheric conditions.

Bayesian state-space methods offer a way to simultaneously estimate size distribution evolution and process rates from Mobility Particle Sizer Spectrometer (MPSS) data. In addition, Bayesian methods account measurement and process uncertainties directly into the estimation framework, enabling inherent uncertainty quantification.

In this study, we use the extended Kalman Filter (EKF) to estimate the state of the system, i.e., the expected values and credibility intervals of the size distribution and process rates. At each time step, the EKF predicts the next state based on a model of the system dynamics and updates this prediction with new measurements. In the evolution step, we use a finite element approximation of the General Dynamic Equation of Aerosols. We model the process rates as Markov processes. In this work, the measurements consist of time-series of counts given by the MPSS. The Fixed Interval Kalman Smoother (FIKS) back-iterates the EKF estimates refining them in the process by applying information about the future measurements. The inference of process rates using EKF and FIKS was tested both with synthetic and experimental data. The simulated MPSS data are generated by transforming a known aerosol distribution evolution to the output of the MPSS with a system matrix which maps size distributions to counts measured by a condensation particle counter. In the chamber measurement, 𝛼-pinene and ozone reacted chemically forming organic compounds, which caused ammonium sulfate particles to grow due to condensation. The data was measured with scanning mobility particle sizer (SMPS).

The EKF and FIKS captures the true process rates from the simulated data as the true value lies constantly inside the 95-% credibility interval of the estimated process rates. In the chamber measurements, the growth estimates obtained with the EKF and FIKS are close to the estimates obtained with the maximum concentration method. Notably, the EKF and FIKS give estimates for the each particle size at each time step which is not the case with the customary methods. Furthermore, a major strength of the proposed methods is that, in addition to estimates of the mean values, credibility intervals for the variables of interest are obtained simultaneously.

How to cite: Salminen, T., Ursin, A., Lehtinen, K., and Niskanen, M.: Simultaneous MPSS data inversion and aerosol process rate estimation with uncertainty quantification via Bayesian state-space methods, EGU General Assembly 2026, Vienna, Austria, 3–8 May 2026, EGU26-13782, https://doi.org/10.5194/egusphere-egu26-13782, 2026.

EGU26-14194 | Orals | AS3.1

Size-resolved aerosol chemical composition, acidity, and gas-aerosol partitioning of nitrate in the Netherlands 

Juliane L. Fry, Pascale Ooms, Marte Voorneveld, Marten in 't Veld, Susanna Rutlege-Jonker, Roy Wichink Kruit, Margreet van Zanten, and Ulrike Dusek

In the ongoing CAINA project (Cloud-Aerosol Interactions in a Nitrogen-dominated Atmosphere) we investigate multiple aspects of aerosol-cloud interactions under the high concentrations of reactive nitrogen present in the Netherlands. Here, we present results of year-long side-by-side deployment of two aerosol composition instruments with differing size cut inlets (PM2.5 and PM10), to investigate size-dependent composition, acidity, and nitrate speciation at the Cabauw tower, in the central Netherlands. Aerosol and gaseous composition were measured by two Monitors for AeRosols and Gasses in Ambient air (MARGA 2060IC), run at adjacent locations for over 1 year of measurements. We supplement and interpret these in-situ observations using thermodynamic equilibrium models such as ISORROPIA2 and interpret potential sources aided by back-trajectory modeling using HYSPLIT. We observe strong seasonal variations, with the highest monthly average gas-phase NH3 concentration of 15 μg m-3 observed in April 2025, accompanied by large NH4NO3 aerosol concentrations (as high as the wintertime maximum) and resulting in the highest pH period of ~ 5. We interpret this low aerosol acidity in terms of its impact on deposition pathways. Mineral dust contributions appear episodically in spring and winter, dominantly in the PM10 fraction, but they occasionally constitute the majority of aerosol mass (both PM10 and PM2.5) for up to a few days.

How to cite: Fry, J. L., Ooms, P., Voorneveld, M., in 't Veld, M., Rutlege-Jonker, S., Wichink Kruit, R., van Zanten, M., and Dusek, U.: Size-resolved aerosol chemical composition, acidity, and gas-aerosol partitioning of nitrate in the Netherlands, EGU General Assembly 2026, Vienna, Austria, 3–8 May 2026, EGU26-14194, https://doi.org/10.5194/egusphere-egu26-14194, 2026.

EGU26-14913 | Posters on site | AS3.1

Influence of the 2023 Hongseong Wildfire on Atmospheric Aerosol Properties at Anmyeondo, Korea 

Jun-Oh Bu, Hee-Jung Ko, Hee-Jung Yoo, Sang-Min Oh, Su-Min Kim, and Sang-Baek Kim

Wildfires are a significant source of atmospheric aerosols and can strongly affect regional air quality. In April 2023, a large wildfire occurred in Hongseong, western Korea. This study investigates the impact of the Hongseong wildfire on the chemical, physical, and optical properties of atmospheric aerosols observed at the Anmyeondo site. Quasi-real-time aerosol measurements were analyzed to examine variations in aerosol mass concentration, size-related characteristics, and optical parameters, as well as chemical composition, before, during, and after the wildfire event. Source apportionment analysis was applied to identify contributions from biomass burning relative to other emission sources. During the wildfire period, enhanced aerosol loading and biomass-burning-related components were observed, accompanied by changes in aerosol optical behavior. These results indicate that the Hongseong wildfire had a notable influence on aerosol properties at Anmyeondo, including both chemical composition and optical characteristics, despite the site being located downwind of the fire region. This study highlights the role of regional wildfire events in modifying aerosol physical and radiative properties at coastal background sites and emphasizes the importance of integrated observations for understanding wildfire impacts.

How to cite: Bu, J.-O., Ko, H.-J., Yoo, H.-J., Oh, S.-M., Kim, S.-M., and Kim, S.-B.: Influence of the 2023 Hongseong Wildfire on Atmospheric Aerosol Properties at Anmyeondo, Korea, EGU General Assembly 2026, Vienna, Austria, 3–8 May 2026, EGU26-14913, https://doi.org/10.5194/egusphere-egu26-14913, 2026.

EGU26-16055 | Posters on site | AS3.1

 Observed vs. simulated aerosol phase state during the ASIA-AQ campaign: its implication for climate forcing  

Yoonbae Chung, Rokjin J Park, Hyeonmin Kim, Meehye Lee, and Mijung Song

Secondary inorganic aerosols undergo a phase transition between solid and liquid states as a function of relative humidity. Different aerosol phases affect their size, altering their optical properties, radiative effects, and heterogeneous chemical reactions. Despite its importance, however, state-of-the-art chemical transport models have not explicitly simulated aerosol phases because of their complex hysteresis with respect to relative humidity history. We use aerosol phase-state observations from the ASIA-AQ campaign to evaluate ISORROPIA thermodynamic calculations with different hysteresis pathways constrained with observed meteorological conditions from the campaign. Although we found a marginal difference in total aerosol concentrations with the different hysteresis pathways, simulated AODs differ significantly, depending on aerosol phase, suggesting their significance for aerosol radiative forcing.

How to cite: Chung, Y., Park, R. J., Kim, H., Lee, M., and Song, M.:  Observed vs. simulated aerosol phase state during the ASIA-AQ campaign: its implication for climate forcing , EGU General Assembly 2026, Vienna, Austria, 3–8 May 2026, EGU26-16055, https://doi.org/10.5194/egusphere-egu26-16055, 2026.

EGU26-16817 | ECS | Orals | AS3.1

Global aerosol distributions and composition from the Earth's surface to the stratosphere 

Matthias Kohl, Christoph Brühl, Holger Tost, Christos Xenofontos, Theodoros Christoudias, Franziska Köllner, Philipp Joppe, Johannes Schneider, Jos Lelieveld, and Andrea Pozzer

Atmospheric aerosols play a key role in Earth’s climate system, yet their vertical distribution, particularly in the free and upper troposphere, remains poorly constrained, strongly contributing to uncertainties in direct and indirect aerosol radiative forcing. We present an improved version of the EMAC (ECHAM5/MESSy for Atmospheric Chemistry) chemistry-climate model, evaluated against a comprehensive dataset from ground-based, remote-sensing, and aircraft observations, showing good agreement across the troposphere and lower stratosphere. Simulations reveal a global minimum in aerosol mass between 400 and 200 hPa, marking the transition from the free to the upper troposphere/lowermost stratosphere (UTLS), a region characterized by frequent new particle formation. Contrary to earlier model studies, boundary layer primary particles are rarely transported into the upper troposphere and stratosphere in our simulations, consistent with recent observational evidence. Finally, we outline specific aerosol process studies enabled by this improved model setup, in support of recent aircraft campaigns. The improved EMAC setup will provide the basis for detailed numerical studies of aerosol-(cloud-)radiation interactions across the lower and middle atmosphere.

How to cite: Kohl, M., Brühl, C., Tost, H., Xenofontos, C., Christoudias, T., Köllner, F., Joppe, P., Schneider, J., Lelieveld, J., and Pozzer, A.: Global aerosol distributions and composition from the Earth's surface to the stratosphere, EGU General Assembly 2026, Vienna, Austria, 3–8 May 2026, EGU26-16817, https://doi.org/10.5194/egusphere-egu26-16817, 2026.

EGU26-18364 | Orals | AS3.1

Aqueous OH kinetics of aliphatic compounds in the context of formation and evolution of biogenic secondary organic aerosols 

Bartlomiej Witkowski, Priyanka Jain, Myungeun Kim, Katarzyna Pawlak, and Tomasz Gierczak

Hydroxyl radical (OH) is the major daytime oxidant, playing a key role in the atmospheric (photo)chemistry of numerous organics. More recently, there has been an increasing focus on multiphase reactions responsible for the formation and evolution of biogenic secondary organic aerosols (BSOAs). BSOAs are major components of fine particulate matter (PM), which strongly affects the climate and public health. The enhanced formation of SOAs in the aqueous phase (aqSOAs) may, at least in part, explain the discrepancies between observed and modeled budgets of organic aerosols.

Models are essential for understanding and predicting how emissions and chemical transformations shape the atmospheric chemistry. Despite the now well-documented influence of the multiphase reactions on the formation and evolution of BSOAs, modeling such processes remains challenging. This is, in part, because encompassing the OH-mediated transformation of biogenic, water-soluble organic compounds (WSOCs) into the atmospheric models requires advanced predictive tools.

To resolve the extreme molecular complexity of chemical reactions leading to BSOAs, automated generators were introduced. These systems can provide near-explicit reaction schemes, often necessary to represent chemical transformations of the numerous, atmospherically widespread organics. Reaction rate coefficients - (kOH M-1s-1) in case of OH-initiated oxidation in the aqueous phase, are a pivotal element of mechanism generators. However, kinetic databases exist for only a small subset of chemically diverse WSOCs present in the atmosphere. For this reason, generating (near)explicit mechanisms requires predicting the vast majority of rate coefficients. Hence, the reliability of these automated expert systems largely depends on kinetic models, primarily structure-activity relationships (SARs), which predict kOH for structurally diverse reactants.

SARs are regression models that use the measured properties of the (model) molecules to predict the properties (here kOH values) of a larger number of compounds, for which no experimental data exists. SARs are based on and evaluated against experimental data. At the same time, the kinetic data for many atmospherically widespread WSOCs remain limited.

In the work presented, the values of kOH for aliphatic alcohols, carbonyls, carboxylic acids, and esters were measured with the relative rate technique. Measurements were conducted in a custom-designed aqueous photoreactor, and the WSOCs under investigation were quantified using gas and liquid chromatography. With this approach, ≈ 30 kOH values can be measured in a single experiment, generating a significant amount of new data. To date, we have measured temperature-dependent values of kOH for more than 100 aliphatic WSOCs. The values of activation parameters obtained from these measurements provided new insights into the mechanisms of aqueous oxidation of WSOCs by the OH. Furthermore, this new kinetic dataset was combined with the existing data to improve and expand the applicability domain of kinetic SARs.

How to cite: Witkowski, B., Jain, P., Kim, M., Pawlak, K., and Gierczak, T.: Aqueous OH kinetics of aliphatic compounds in the context of formation and evolution of biogenic secondary organic aerosols, EGU General Assembly 2026, Vienna, Austria, 3–8 May 2026, EGU26-18364, https://doi.org/10.5194/egusphere-egu26-18364, 2026.

EGU26-18381 | ECS | Posters on site | AS3.1

Ambient aerosol pH during the CleanCloud PIANO campaign inferred from thermodynamic analysis and spectroscopic pH sensors 

Georgios Theodoropoulos, Carolina Molina, Jun Zhang, Christos Mitsios, Ioanna Kaitsa, Amaia Soto Beobide, George A. Voyiatzis, and Athanasios Nenes

The pH of atmospheric aerosols plays a central role in multiphase chemistry, secondary aerosol formation, gas–particle partitioning, and aerosol toxicity among other processes. Despite its importance, ambient aerosol pH remains poorly constrained, as most estimates rely on indirect thermodynamic inferences from bulk aerosol composition, which induces uncertainties associated with equilibrium assumptions and measurement limitations. On the other hand, pH-responsive substrates can provide direct aerosol pH measurements, fast and reliably. Most of these materials are sensitive to protonation that can be quantified by spectroscopic techniques. In this work, ambient aerosol acidity during the CleanCloud PIANO field campaign in Summer 2025 to Spring 2026 was investigated by combining thermodynamic pH inference with direct spectroscopic measurements using pH-responsive sensors.

The field campaign commenced in summer 2025 and is ongoing, with completion expected in spring 2026, in Patras, Greece. Daily aerosol samples (PM2.5) were collected on quartz filters using a high-volume sampler. Two different pH-responsive substrates were mounted on top of each filter. The first, consisted of polymer-based sensors made from phase-inverted polybenzimidazole (PBI) membranes, whose protonation response was analyzed by Raman spectroscopy. The second substrate employed the low-molecular-weight imidazole probe 2-mercaptobenzimidazole (2-MBI), applied on the filters and analyzed using surface-enhanced Raman spectroscopy (SERS). In both cases, aerosol pH was quantified using laboratory-derived calibration curves, providing a daily pH over the sampling period. Additionally, the other half of the filter was used for offline chemical analysis.

Real time measurements were conducted using an aerosol mass spectrometer (AMS), an ammonia (NH₃) monitor, and a VOCUS chemical ionization time-of-flight mass spectrometer (VOCUS-CI-TOF) to characterize the gas and particle phases. Thermodynamic aerosol pH was inferred with ISORROPIA-lite using 30-min averaged AMS inorganic composition (SO₄²⁻, NO₃⁻, NH₄⁺, Cl⁻), relative humidity, and temperature. Calculations were performed in forward mode under the metastable aerosol assumption, and the resulting pH was aggregated to 24-h averages for comparison with the substrate-based spectroscopic measurements. The spectroscopic and thermodynamic pH estimates show consistent temporal behavior and comparable acidity levels.

This combined observational framework provides complementary and independent constraints on ambient aerosol acidity with diverse techniques. It also demonstrates the potential of Raman-based pH sensors deployed on common aerosol samplers to augment thermodynamic pH estimates in field studies.

This work was supported by the CleanCloud project funded by the EC Horizon Europe Call “Improved knowledge in cloud-aerosol interaction” (HORIZON-CL5-2023-D1-01-04).

How to cite: Theodoropoulos, G., Molina, C., Zhang, J., Mitsios, C., Kaitsa, I., Soto Beobide, A., Voyiatzis, G. A., and Nenes, A.: Ambient aerosol pH during the CleanCloud PIANO campaign inferred from thermodynamic analysis and spectroscopic pH sensors, EGU General Assembly 2026, Vienna, Austria, 3–8 May 2026, EGU26-18381, https://doi.org/10.5194/egusphere-egu26-18381, 2026.

EGU26-18552 | Orals | AS3.1

Cloud-Aerosol Interactions under high reactive Nitrogen concentrations: First highlights from chamber and field experiments of the CAINA project 

Ulrike Dusek, Jinglan Fu, Marije van de Born, Harald Saathoff, Willem Kroese, Rupert Holzinger, Juliane Fry, Birgit Wehner, Namita Sinha, Herman Russchenberg, George Biskos, Tuija Jokinen, and Johannes Schneider and the the CAINA team

The goal of the CAINA (Cloud-Aerosol Interactions in a Nitrogen-dominated Atmosphere) project is to investigate multiple aspects of aerosol-cloud interactions under high concentrations of reactive nitrogen. This chemical regime is starting to emerge in many regions following the strong reduction of SO2 emissions, but is already firmly established at our study location in the Netherlands. CAINA is a consortium project that aims to combine in-situ and remote sensing observations of aerosols and clouds with chamber experiments and high-resolution modelling to study the formation of CCN, cloud chemistry, and aerosol effects on clouds.

This talk will present first highlights of the CAINA project focussing on the cloud chamber experiments and the field campaign conducted in March/April 2025.

Extensive studies in the AIDA cloud chamber have shown that substantially more secondary organic aerosol is formed under high humidity (80-90%) than at dry conditions, when liquid seed particles are present. This is accompanied with distinct differences in the chemical composition of the formed SOA. We can show considerable formation of secondary organic aerosol in the aqueous phase and that the presence of ammonium nitrate in the particles causes the formation of organic nitrogen species and other higher-order reaction products.

First results from the field campaign at a coastal and a regional background site in the Netherlands highlight the high ammonium nitrate contributions to the aerosol mass concentration and especially high gas-phase NH3 concentrations (up to 50 mg m-3) during the field campaign, indicating a chemical regime dominated by reactive nitrogen and relatively high aerosol pH. Further highlights include strong new particle formation events, as well as distinct differences in particle chemical composition between the ground and at 250 m height, particularly when clouds were overhead. A potential effect of nitrogen pollution on cloud properties will be investigated, combining ground-based data, remote sensing by cloud profilers, and in-situ cloud measurements using the helicopter-borne cloud probe ACTOS.

This work is supported by the Dutch Science foundation NWO (grant # OCENW.XL21.XL21.112) and by the ATMO-ACCESS project (ATMO-TNA-3—0000000063).

CAINA: https://sites.google.com/view/cainaproject/

How to cite: Dusek, U., Fu, J., van de Born, M., Saathoff, H., Kroese, W., Holzinger, R., Fry, J., Wehner, B., Sinha, N., Russchenberg, H., Biskos, G., Jokinen, T., and Schneider, J. and the the CAINA team: Cloud-Aerosol Interactions under high reactive Nitrogen concentrations: First highlights from chamber and field experiments of the CAINA project, EGU General Assembly 2026, Vienna, Austria, 3–8 May 2026, EGU26-18552, https://doi.org/10.5194/egusphere-egu26-18552, 2026.

EGU26-18668 | Posters on site | AS3.1

Boundary Layer Influence on Aerosol pH at a High-Altitude Monitoring Station During the Chopin Campaign 

Carolina Molina, Romanos Foskinis, Jun Zhang, Olga Zografou, Konstantinos Granakis, Maria I. Gini, Prodromos Fetfatzis, Konstantinos Eleftheriadis, and Athanasios Nenes

Aerosols have a wide range of impacts on climate, clouds, ecosystems and public health. Much of the properties of aerosols that affect their impacts is related to their acidity levels. However, it remains understudied and only over the recent years ambient datasets become available to constrain it. One aspect that remains highly uncertain is the distribution of pH with height; given the large differences of semi-volatile concentration species affecting pH (like NH3) as well as changes in relative humidity (that affect water content) and temperature (that affect the thermodynamic constants) we expect large changes of aerosol pH with altitude and airmass type.

High-altitude stations provide a unique opportunity to study these variations owing to their ability to sample airmasses that originate from the boundary layer close to ground, and airmasses that are in the free troposphere containing aerosol and gas-phase precursors from long-range transport. In this work, we estimate the aerosol pH at a high-altitude monitoring station during the CHOPIN (CleanCloud Helmos OrograPhic sIte experimeNt campaign, http://go.epfl.ch/chopin-campaign) and CALISHTO field campaigns at Mount Helmos, Greece. Our goal is to identify pH variations when the station is located in the free troposphere compared to periods below the boundary layer  and its variability over time-of-day and over time. Relative humidity, temperature, ammonia concentrations, and aerosol chemical composition observed were used to estimate aerosol pH using the ISORROPIA lite model.

We observed hourly pH variability at the site, with lower pH values between 7 am and 1 pm, before the boundary layer reached the site and after anthropogenic ammonia mixed into the atmosphere dispersed overnight. Higher pH values were observed in the afternoon when ammonia associated with anthropogenic emissions from nearby urban and agricultural activities reached the station. SHapley Additive exPlanations analysis (SHAP) was applied to identify the variables that contribute and influence the most to the observed pH, providing a more robust and reliable attribution than other models. It was found that during the free troposphere condition, SHAP values do not vary significantly with time; however, significant differences were observed when the station is below the boundary layer.


This work was supported by the CleanCloud project funded by the EC Horizon Europe Call “Improved knowledge in cloud-aerosol interaction” (HORIZON-CL5-2023-D1-01-04).

How to cite: Molina, C., Foskinis, R., Zhang, J., Zografou, O., Granakis, K., Gini, M. I., Fetfatzis, P., Eleftheriadis, K., and Nenes, A.: Boundary Layer Influence on Aerosol pH at a High-Altitude Monitoring Station During the Chopin Campaign, EGU General Assembly 2026, Vienna, Austria, 3–8 May 2026, EGU26-18668, https://doi.org/10.5194/egusphere-egu26-18668, 2026.

EGU26-18689 | ECS | Posters on site | AS3.1

FLOTUS: a new FLow TUbe System for the CERN CLOUD chamber 

Eva Sommer, Nirvan Bhattacharyya, Hannah Klebach, João Almeida, Bernhard Mentler, Mattia Busato, Yuanlong Huang, Didier Lombard, Antti Onnela, Serge Mathot, Stefan Weber, Richard Flagan, and Jasper Kirkby

The CERN CLOUD experiment (Kirkby et al. 2011) investigates aerosol particle nucleation and growth under controlled atmospheric conditions. To extend its experimental capabilities, a new FLow TUbe System (FLOTUS) was recently developed as an external 60 litre flow tube directly coupled to the CLOUD chamber. FLOTUS consists of a quartz tube with conical entry and exit geometries for laminar-flow, following the approach of the Caltech Flow Tube Reactor (Huang et al. 2017). The 3 m long x 20 cm diameter quartz tube is mounted vertically to minimise convective turbulence. It is housed in a temperature-controlled enclosure with a gas system independent of the CLOUD chamber. Six separately-controlled ultraviolet lamps mounted inside the FLOTUS thermal housing enable in situ photochemical production of hydroxyl radicals (OH) from water vapour and O3 up to extremely high concentrations of up to 1010 cm-3.

The chemical composition and size distribution of particles generated in FLOTUS can be characterized either at a sampling point at the exit of FLOTUS or after transfer into the CLOUD chamber. We assessed the flow conditions inside the FLOTUS quartz tube and along the transfer line to the CLOUD chamber using computational fluid dynamics simulations with COMSOL, confirming laminar flow and well-defined transport of gases and particles in both the quartz chamber and the transfer line to CLOUD. We quantified OH production rates in FLOTUS using toluene attenuation experiments.

We have used FLOTUS to generate aerosol particles across a wide range of sizes between 10-150 nm and chemical compositions, which include sulfuric acid(–ammonia), highly oxygenated organic molecules (HOM, from α-pinene and isoprene), methanesulfonic acid, and other systems. We characterized the composition and size of particle populations produced in FLOTUS directly using aerosol mass spectrometry and mobility-based size distribution measurements, and after injection into CLOUD using a suite of state-of-the-art measurement instruments to determine particle size and chemical composition.

The controlled injection of freshly formed particles enables subsequent experiments in the CLOUD chamber under novel conditions, including studies of aerosol evaporation, cloud activation, aqueous-phase processing of aerosol, and surface chemistry, all under atmospheric conditions. FLOTUS represents an important technical advancement for the CLOUD experiment by decoupling particle formation from studies under different conditions in the CLOUD chamber, increasing the experimental flexibility and enabling systematic investigations of aerosol transport, fate, and cloud chemistry interactions.


Kirkby, Jasper, et al. "Role of sulphuric acid, ammonia and galactic cosmic rays in atmospheric aerosol nucleation." Nature 476.7361 (2011): 429-433.

Huang, Yuanlong, et al. "The Caltech Photooxidation Flow Tube reactor: design, fluid dynamics and characterization." Atmospheric Measurement Techniques 10.3 (2017): 839-867.

How to cite: Sommer, E., Bhattacharyya, N., Klebach, H., Almeida, J., Mentler, B., Busato, M., Huang, Y., Lombard, D., Onnela, A., Mathot, S., Weber, S., Flagan, R., and Kirkby, J.: FLOTUS: a new FLow TUbe System for the CERN CLOUD chamber, EGU General Assembly 2026, Vienna, Austria, 3–8 May 2026, EGU26-18689, https://doi.org/10.5194/egusphere-egu26-18689, 2026.

EGU26-19173 | ECS | Orals | AS3.1

LONG TERM VARIATION IN ULTRAFINE PARTICLES (UFPs) SOURCES: RISING EVIDENCE FOR INCREASING NUCLEATION SOURCES CONTRIBUTION 

Soatoavina Randrianomenjanahary, Suzanne Crumeyrolle, Hui Chen, and Véronique Riffault

Ultrafine particles (UFPs, with diameters below 100 nm) pose greater health risks, as they can penetrate deep into the pulmonary alveoli and reach the bloodstream (Ohlwein et al., 2019). Understanding the sources of UFPs and their relative contributions to particle number concentration (PNC) through source apportionment is essential for developing effective emission regulation policies. This study aims to develop a newly implemented approach based on Non-Negative Matrix Factorization (NMF) receptor modeling to identify and quantify the sources of UFPs at the ATmospheric Observatory in LiLLe (ATOLL).
To ensure robust source resolution, three temporal scales approaches to source apportionment were applied in this study: (i) a focus analysis of summer months to resolve expected nucleation sources enhance by a strong photochemistry activity (ii) seasonal source apportionment over a full year to quantify intra-annual variability and (iii) a four year long term source apportionment to assess temporal trends of the sources.
The model was first applied to summer data (June – August) for all the year revealing a strong nucleation factor (~26% of PNC). This finding is consistent with previous observations of summer photochemical strong activities and New Particle Formation (NPF) events (Crumeyrolle et al., 2023). As expected, seasonal analysis then showed a lower nucleation contribution on winter (10.6% vs. 37% on summer). Together, these two approaches demonstrate the robustness of NMF to separate the sources of UFPs.
Long-term variations of sources were also investigated using a single source apportionment on a four-year dataset (2020–2024) , and a linear regression model was applied to the results to assess temporal trends. Traffic-related sources showed a decreasing trend with average annual reductions of -7.75 % (gasoline emissions) and -12.68 % (diesel emissions) likely following the impact of European Union regulation on PM (EC, 2023). In contrast, nucleation-related sources exhibit a significant increase of 9.28 % yr-1, consistent with recent observations of rising UFP PNC on ATOLL (Suchánková et al., 2025) but not with other studies on suburban sites (Garcia-Marlès et al., 2024). This observed increase in nucleation sources shows strong evidence on the growing role of secondary formation processes which might be enhance by the emission of gaseous precursors such as SO2 and environmental conditions.
Overall, traffic emissions remained the dominant contributor (~69.20 %) to total PNC with a contribution decreasing trend of -3 %yr-1, in contrast to nucleation contribution (~19.72 %) with an increasing trend of +12.48 %yr-1. These findings highlight the predominantly anthropogenic origin of UFPs on ATOLL and the rising importance of nucleation factor on PNC, emphasizing the need for specific emission policies targeting UFPs alongside existing PM2.5 regulations.

How to cite: Randrianomenjanahary, S., Crumeyrolle, S., Chen, H., and Riffault, V.: LONG TERM VARIATION IN ULTRAFINE PARTICLES (UFPs) SOURCES: RISING EVIDENCE FOR INCREASING NUCLEATION SOURCES CONTRIBUTION, EGU General Assembly 2026, Vienna, Austria, 3–8 May 2026, EGU26-19173, https://doi.org/10.5194/egusphere-egu26-19173, 2026.

EGU26-19264 | ECS | Posters on site | AS3.1

Online monitoring of the particle size-dependent reaction of citric acid with boronic acid in aerosols 

Nico Blum, Marcel Douverne, and Thorsten Hoffmann

Reactions occurring within organic aerosols are a crucial factor influencing both environmental systems and industrial processes. The composition of the atmosphere is heavily impacted by aerosol composition, which in turn is a critical factor in our ability to accurately predict global climate change. To calculate the aerosol budget, a deeper understanding of the reactions within aerosol particles and their influence on particle growth is essential. Specifically, the interactions between aerosols and climate parameters, such as cloud formation and radiation balance, are of paramount importance. Analysing these processes enhances our comprehension of aerosols' effects on climate, enabling more precise integration into climate models.

                In industrial processes that rely on multiphase reactions with aerosol particles, reaction rates are theoretically dependent on particle size (Petters, 2022). This understanding is vital for optimizing processes in the chemical, pharmaceutical, and environmental engineering sectors, as it directly impacts the efficiency and safety of industrial applications. To simulate these reactions and measure product formation, we coupled the developed Chemical Ionization Orbitrap inlet (CI Orbitrap) by Riva et al. (2019) with an aerosol inlet consisting of a flow-through heating cartridge and a gas cooling unit. This setup enables the analysis of aerosol particles through thermal evaporation, combining the high mass resolving power of the Orbitrap (R ≥ 140,000 at m/z 200) with the selectivity and sensitivity to oxidized compounds of chemical ionization mass spectrometry (NO3-CIMS). An activated charcoal denuder removes the gas phase of the sample aerosol before thermal evaporation, preventing sampling artifacts and ensuring high time-resolved measurements (Riva, 2019).

                We observed the size dependent reaction of citric acid with 99% 11B-boronic acid, resulting in a condensation product. The equilibrium reaction shows an exchange of boron isotopes, resulting in an increased 10B percentage in the product molecule.

This work is supported by the Deutsche Forschungsgemeinschaft (DFG) under project number 416710328.

  • S. Petters (2022) Res. Lett 49.
  • Riva, M. Ehn M., D. Li, S. Tomaz, F. Bourgain, S. Perrier, C. George. (2019) Ana. Chem. 91, 9419-9423.

How to cite: Blum, N., Douverne, M., and Hoffmann, T.: Online monitoring of the particle size-dependent reaction of citric acid with boronic acid in aerosols, EGU General Assembly 2026, Vienna, Austria, 3–8 May 2026, EGU26-19264, https://doi.org/10.5194/egusphere-egu26-19264, 2026.

EGU26-20077 | ECS | Posters on site | AS3.1

Assessing nano-particle composition using online filter-based TD-MION-Orbitrap 

Sebastian Holm, Henning Finkenzeller, Aleksei Shcherbinin, Joona Mikkilä, Matti Rissanen, and Juha Kangasluoma

Understanding the role organic aerosols (OA) play in air quality, climate, and human health requires detailed knowledge of their chemical composition. For example, the volatility of OA is further a crucial piece of information in the handling of secondary organic aerosols (SOA) in atmospheric models. Various experimental approaches to assess the composition of aerosol particles have been developed (FIGAERO, VIA, etc.), but they all struggle with limited sensitivity, particularly at small particle sizes.

Here, we demonstrate a novel online filter-based system, leveraging the Thermal Desorption Multi-scheme chemical IONization inlet coupled to an Orbitrap mass spectrometer (TD-MION-Orbitrap). This system enables semi-continuous online measurements of the physicochemical properties of aerosol particles. Aerosol particles are collected onto stainless steel mesh filters positioned inside the thermal desorber unit. By adjusting the collection time, sufficient particle accumulation for analysis is ensured. The sample is then thermally desorbed at temperatures exceeding 300°C. The MION-Orbitrap provides reagent- and polarity-switching chemical analysis of the evaporated molecules at high sensitivity and mass resolution.

We describe the operating principles of this system and present results from laboratory experiments where organic and inorganic aerosol particles are produced, collected, desorbed and analysed with two different chemical ionization schemes. The quantitative performance of the system is also explored, and initial data from a field campaign further demonstrate the capability of this novel analytical technique to advance the characterization of aerosol particles.

How to cite: Holm, S., Finkenzeller, H., Shcherbinin, A., Mikkilä, J., Rissanen, M., and Kangasluoma, J.: Assessing nano-particle composition using online filter-based TD-MION-Orbitrap, EGU General Assembly 2026, Vienna, Austria, 3–8 May 2026, EGU26-20077, https://doi.org/10.5194/egusphere-egu26-20077, 2026.

EGU26-20135 | ECS | Posters on site | AS3.1

Flux Measurements and Chemical Characterization of Ultrafine Aerosol Particles in the Amazon 

Jana Englert, Anywhere Tsokankunku, Cleo Quaresma Dias-Júnior, Andreas Held, Hartwig Harder, Dennis Geis, Michael Chilinski, Sebastian Brill, Bruno Backes Meller, Ulrich Pöschl, and Christopher Pöhlker

As the largest tropical forest with approximately 4.7 million km2, the Amazon rainforest has a significant impact on regional and global climate. Atmospheric aerosols critically shape Earth’s climate by scattering and absorbing solar radiation and by influencing cloud formation and precipitation. Pristine regions such as the Amazon provide a glimpse of pre-industrial atmospheric conditions and are particularly important for assessing climate change. Previous studies have investigated aerosol concentrations, properties, and sources as a function of seasonality and diurnal variation [1–3]. However, the identity and interplay of natural aerosol sources, and their relevance to overall aerosol cycling, remain poorly understood.

In particular, the formation and growth of particles smaller than 100 nm is still uncertain. The very small masses of ultrafine particles present a major analytical challenge, resulting in an incomplete understanding of their origin and properties. Here, we propose two approaches that could provide new insights into the aforementioned questions. The first is size-resolved aerosol flux measurements to determine whether and when ultrafine particles are transported out of or into the canopy. The second is a chemical analysis of characteristic tracers in sub-100 nm aerosol samples.

Aerosol exchange between the forest and the atmosphere is driven by turbulence, influencing both deposition and emission of particles. To obtain turbulent fluctuations with high time resolution we applied the eddy covariance method (ECM) at 52 m on the 80 m walk-up tower at the Amazon Tall Tower Observatory (ATTO). Using 10 Hz eddy covariance measurements of 3D wind and size-resolved particle concentrations, we aim to quantify this exchange to improve our understanding of biosphere–atmosphere interactions. This approach yields a unique long-term dataset of size-resolved aerosol particle fluxes in the Amazon, enabling the investigation of biogenic aerosol exchange and the turbulent transport of nutrients. Preliminary analysis suggests pronounced diurnal cycles and seasonal variability in aerosol fluxes.

Additionally, we focus on the chemical characterization of sub-100 nm aerosol particles. Due to the major analytical challenges, we have applied a 'nanobulk' method combining spot sampler technology with scanning transmission X-ray microscopy and near-edge X-ray absorption fine structure (STXM-NEXAFS) spectroscopy. With this approach we collect and chemically characterize ultrafine particles under clean rainforest conditions. By sampling pristine background and new particle formation events, we aim to investigate potential differences in aerosol particle composition under varying atmospheric conditions.

The chemical characterization of ultrafine particles shows consistent spectroscopic signatures across all samples and deposition spots without major differences as a function of pollution and sub-100 nm events. Spectroscopic signatures suggest the predominance of secondary organic aerosols. Surprisingly, biogenic potassium salts could not be observed below 100 nm, yet they are very abundant at sizes larger than 100 nm.


[1] Artaxo et al., Tellus B: Chemical and Physical Meteorology, 74, 24–163, 2022

[2] Franco et al., ACP, 22, 3469-3492, 2022

[3] Valiati et al., ACP, 25, 14923-14944, 2025  

How to cite: Englert, J., Tsokankunku, A., Quaresma Dias-Júnior, C., Held, A., Harder, H., Geis, D., Chilinski, M., Brill, S., Backes Meller, B., Pöschl, U., and Pöhlker, C.: Flux Measurements and Chemical Characterization of Ultrafine Aerosol Particles in the Amazon, EGU General Assembly 2026, Vienna, Austria, 3–8 May 2026, EGU26-20135, https://doi.org/10.5194/egusphere-egu26-20135, 2026.

Biomass burning (BB) emissions have constituted an important source of ambient air pollution. Previous studies have focused on the impact of open BB (OBB) emissions on the regional air quality and climate, while it remains elusive about the effect of residential BB (RBB) emissions on the particulate matters (PM) pollution and regional climate. The WRF-Chem (Weather Research and Forecast model coupled with Chemistry) model has been used to evaluate the contribution of RBB emissions to the PM pollution in the Guanzhong Basin (GZB) during the persistent air pollution episode from December 14, 2020, to January 6, 2021 in this study. The RBB emission in the GZB is a significant source for primary aerosols under current conditions, with average contribution of 62.8%, 35.9%, and 33.4% for POA (primary organic aerosols), EC (element carbon), and primary PM2.5 (PM with aerodynamic diameter equal or less than 2.5 µm), respectively. The RBB emissions in the GZB also play an important role in the formation of SOA (secondary organic aerosols), with the average contribution of 52.6% to the SOA during the study period. Additionally, the RBB emissions in the GZB are also responsible for 4.6%, 9.4%, and 8.4% of the sulfate, nitrate, and ammonium, respectively. Therefore, the contribution of RBB emissions in the GZB to the near-surface PM2.5 mass concentrations during the simulation period is around 29.2% (18.4 μg m-3) averaged over the GZB. It is noted that the O3 concentration is slightly decreased by 1.6 μg m-3 (4.1%) averaged over the GZB with the exclusion of RBB emissions, which is might be resulted from the small decrease in NO2 concentration (5.9% or 2.0 μg m-3). Besides, the RBB emissions in the GZB contribute 16.4% (1.0 μg m-3) to the NH3 concentrations during the study period. Our results show that the RBB emissions should be considered in the air pollution control strategies for further alleviation of the wintertime PM pollution in the GZB under current conditions.

How to cite: Li, X.: Impact of residential biomass burning emissions on the wintertime particulate pollution in the Guanzhong Basin, China: a case study, EGU General Assembly 2026, Vienna, Austria, 3–8 May 2026, EGU26-20457, https://doi.org/10.5194/egusphere-egu26-20457, 2026.

EGU26-20932 | ECS | Posters on site | AS3.1

Multi-instrumental investigation of aerosol microphysical and optical evolution during a winter smog episode in Wrocław, Poland 

Wiktor Kopeć, Anetta Drzeniecka-Osiadacz, and Małgorzata Werner

Winter smog episodes in Central European cities are associated with a significant increase in aerosol mass and optical effects. In this study, we have analyzed winter smog episode that occurred in January in Wrocław, using an integrated set of in situ measurements taken at an urban background location. Particle size distributions in the diameter range 10 - 800 nm were measured using a scanning mobility particle sizer (SMPS, TSI model 3938) and combined with total particle number concentrations obtained from a condensation particle counter (CPC, TSI model 3750). Aerosol optical properties were characterized using light scattering and backscattering coefficients measured at three wavelengths - 450, 525, and 635 nm with an Aurora 4000 nephelometer. Absorbing aerosol was quantified as equivalent black carbon (eBC) using a filter-based aethalometer (Magee AE43). The dataset was analyzed with different time resolutions to characterize changes before, during, and after the smog episode. During the episode, total particle concentrations and scattering coefficients increased significantly, while the relative contribution of ultrafine particles (<100 nm) decreased, indicating a shift towards larger particle sizes. This was accompanied by an increase in Ångström scattering exponents and an increase in the backscattering fraction, consistent with an increase in aerosol due to condensation and coagulation processes.

How to cite: Kopeć, W., Drzeniecka-Osiadacz, A., and Werner, M.: Multi-instrumental investigation of aerosol microphysical and optical evolution during a winter smog episode in Wrocław, Poland, EGU General Assembly 2026, Vienna, Austria, 3–8 May 2026, EGU26-20932, https://doi.org/10.5194/egusphere-egu26-20932, 2026.

EGU26-21632 | ECS | Posters on site | AS3.1

Chemical composition differences in gas- and particle-phase organic and DMS-derived oxidation products between a pristine marine environment and a wildfire-influenced marine air mass 

Félix Sari Doré, Rongrong Wu, Emily Matthews, Cheng Wu, Thomas Bannan, Hugh Coe, Alexander Archibald, and Mattias Hallquist

Marine dimethyl sulfide (CH3SCH3, DMS) is a major source of natural gas-phase sulfur emissions. Moreover, DMS oxidation products such as methane sulfonic acid (CH3SO3H, MSA) and sulfuric acid (H2SO4) are known to influence the formation of cloud condensation nuclei (CCN). Recently, a stable intermediate formed from DMS oxidation, hydroperoxymethyl thioformate (HOOCH2SCHO, HPMTF), has been shown to sometime exceed mixing ratios of 100 ppt in the marine boundary layer. This product would thus be able to delay the formation of sulfate aerosols and could have a significant impact on cloud formation. In order to investigate these species, a cruise field campaign in the Atlantic Ocean was organized in 2025 to measure pristine marine air. However, we also sampled air masses coming from the Canadian wildfires that occurred early June 2025, which allowed for comparison between pristine marine air and biomass burning (BB) periods. Oxidation products were measured using a time-of-flight chemical ionization mass spectrometer (Vocus 2R-ToF-CIMS) coupled with a Filter Inlet for Gas and Aerosols (FIGAERO inlet), allowing measurements of both gas- and particle-phase chemical composition from one instrument. This FIGAERO CIMS alternated between iodide and bromide reagent ions. Based on the measurements with the iodide reagent ion, the relative distribution between DMS-derived sulfur containing species and oxygenated organic compounds (CHO) remained similar across the two periods, both for gas- and particle-phase. Indeed, the abundance of these species significantly increased by similar factors (2.5 and 2.2 times higher for sulfur containing species and organics, respectively) during the BB period for particle-phase compounds. Particle-phase MSA and H2SO4 were 2.7 and 1.5 times higher, respectively, during the BB period compared to the pristine marine environment. Similarly, many particle-phase CHO species were enhanced during the BB period. Such species include C6H10O5 (levoglucosan, 23 times higher), C4H4O6 (13 times higher), C6H8O6 (12 times higher), C3H4O5 (11 times higher) and C2H2O4 (3 times higher). Contrariwise, HPMTF, both in gas- and particle-phase, was more abundant during the pristine period compared to the BB period. As HPMTF is known to be removed by cloud uptake, this could indicate that biomass burning periods, loaded with sulfate aerosol, could result in higher cloud coverage, which would lead to higher HPMTF sink. Indeed, the irradiance measured from the ship was lower during the BB period compared to the usual pristine period irradiance. This could indicate that HPMTF was either less produced from marine DMS during this period due to lesser irradiance, or experienced higher sink due to enhanced cloud coverage, or both. This work shows that biomass burning can significantly change the abundance of DMS-derived compounds. As wildfires become more common due to global warming, it is important that these changes be considered for accurate modelling and predictions.

How to cite: Sari Doré, F., Wu, R., Matthews, E., Wu, C., Bannan, T., Coe, H., Archibald, A., and Hallquist, M.: Chemical composition differences in gas- and particle-phase organic and DMS-derived oxidation products between a pristine marine environment and a wildfire-influenced marine air mass, EGU General Assembly 2026, Vienna, Austria, 3–8 May 2026, EGU26-21632, https://doi.org/10.5194/egusphere-egu26-21632, 2026.

Anthropogenic biomass burning (ABB) is a major yet least understood source of atmospheric pollution, with significant implications for air quality, visibility, atmospheric chemistry, the Earth’s radiation budget and biogeochemical cycling. This study examines the chemical composition of aerosols during biomass burning (BB) and non-biomass burning (NBB) periods to assess their impact on aerosol composition and their contribution in generating oxidative stress. Sampling of PM₂.₅ and PM₁₀ was carried out at two contrasting sites one of the highly polluted cities of Indo-Gangetic Plain (IGP), Agra: Dayalbagh (suburban) and Rambagh (urban), from December, 2022 to November, 2024. The samples were analyzed for dicarboxylic acids (DCAs), sugars, organic and elemental carbon (OC/EC), water-soluble inorganic ions (WSIIs), metals and polycyclic aromatic hydrocarbons (PAHs). Moderate Resolution Imaging Spectroradiometer (MODIS) and Fire Information for Resource Management System (FIRMS) data identified intense fire hotspots over northwestern India (Punjab–Haryana) during BB, coinciding with elevated particulate concentrations. The mean concentration of PM₂.₅ and PM₁₀ increased considerably during BB (PM₂.₅: 101.1 ± 74.4 µg m⁻³ at Dayalbagh, 120.0 ± 57.5 µg m⁻³ at Rambagh; PM₁₀: 161.2 ± 67.3 and 184.4 ± 61.7 µg m⁻³, respectively) compared to NBB. The Pearson correlation analysis showed that carbonaceous species and biomass tracers (DCAs, K⁺, levoglucosan) showed strong positive correlations (r > 0.8), confirming the influence of agricultural residue and biofuel combustion. Secondary ions (SO₄²⁻, NO₃⁻, NH₄⁺) displayed enhanced interrelationships (r = 0.75–0.77) during NBB, indicating increased secondary aerosol formation. The oxidative potential, assessed using the dithiothreitol (DTT) assay, exhibited markedly higher activity in fine particles (r2 = 0.70 and 0.79) and during BB (DTTv: 18.2 ± 10.1 pmol min⁻¹ m⁻³ at Dayalbagh, 17.1 ± 15.0 pmol min⁻¹ m⁻³ at Rambagh) compared to NBB (7.0 ± 4.0 and 10.0 ± 2.4 pmol min⁻¹ m⁻³, respectively). The correlation between DTTv and biomass tracers (oxalic acid (C2), malonic acid (C3), adipic acid (C6), levoglucosan (Lev), arabitol (Arab); r = 0.50-0.83), OC/EC (r = 0.52-0.70), metals (Fe, Mn, K, Na, Ni, Mn, Cr; r = 0.52-0.64) during BB period suggest higher redox activity during this period. Positive Matrix Factorization (PMF) identified four dominant sources: biomass burning (31–35%), vehicular emissions (26–30%), industrial activities (18–22%), and crustal dust (10–13%). Thus, BB emissions significantly enhanced PM loadings and oxidative potential, posing elevated health risks. The findings highlight the synergistic role of biomass combustion and urban emissions in amplifying aerosol toxicity and degrading air quality over the IGP.

How to cite: Agarwal, M. and Lakhani, A.: Unveiling the chemical composition and sources in PM2.5 at an urban and sub-urban site in Indo-Gangetic Plain: Insights from Biomass Markers, EGU General Assembly 2026, Vienna, Austria, 3–8 May 2026, EGU26-187, https://doi.org/10.5194/egusphere-egu26-187, 2026.

EGU26-959 | ECS | Posters on site | AS3.2

Atmospheric chemistry of Polycyclic Aromatic Hydrocarbons (PAHs) and role of  gas-partitioning in the formation of secondary Nitro-PAHs 

Puneet Kumar Verma, K Maharaj kumari, and Anita Lakhani

Polycyclic Aromatic Hydrocarbons (PAHs) and Nitro-PAHs are ubiquitous semi-volatile organic pollutants. Their high concentration in the ambient air is a severe cause for concern because they are carcinogenic, mutagenic, and teratogenic to humans. This study elucidates the atmospheric chemistry and gas-particle partitioning mechanisms of PAHs and Nitro-PAHs, as well as their role in the formation of secondary aerosols. 16 priority PAHs and two nitro-PAHs were analysed using gas chromatograph-mass spectrometry (GC-MS) from dual-phase (gas and particle) aerosol samples that were simultaneously collected in a rural and traffic-dominated region of Agra. At the traffic and rural sites, the overall concentration of PAHs (gas + particulate) was 2481 and 1011 ng m-3, respectively, while the total concentration of nitro-PAHs was 90 and 28 ng m-3. The dual model governs the gas-particle partitioning of PAHs in Agra's ambient air, demonstrating how the concentration of PAHs is affected by the concentrations of OC and EC in the environment. Regression statistics (R2 > p<0.01) of the dual model, along with a statistically significant negative correlation between 1-NPyr (R2= 0.73, p<0.01)and 3-NFla (R2= 0.78, p<0.01)and their parent compounds, i.e., Pyr and Fla, confirm the formation of nitro-PAHs in the ambient air of Agra. A statistically significant correlation (R2 > 0.75, p<0.01) for Clausius–Clapeyron plots was obtained, indicating the temperature dependency of gas-phase PAHs at both sites. Source analysis of PAHs and Nitro-PAHs reveals that the PAH concentration at the traffic site is primarily attributed to traffic and combustion sources, whereas at the rural site, the PAH concentration is largely due to biomass combustion and pyrogenic sources. However, the Nitro-PAHs concentration at the traffic site is due to both primary and secondary sources. ILCR values of PAHs and Nitro-PAHs show that humans are prone to cancer risk from the dermal exposure pathway, followed by ingestion and inhalation.

How to cite: Verma, P. K., kumari, K. M., and Lakhani, A.: Atmospheric chemistry of Polycyclic Aromatic Hydrocarbons (PAHs) and role of  gas-partitioning in the formation of secondary Nitro-PAHs, EGU General Assembly 2026, Vienna, Austria, 3–8 May 2026, EGU26-959, https://doi.org/10.5194/egusphere-egu26-959, 2026.

EGU26-2246 | Orals | AS3.2

Surface temperatures drive strong seasonality in urban reactive carbon emissions 

Dylan Millet, Michael Vermeuel, Roisin Commane, Timothy Griffis, Trey Maddaleno, Emily Franklin, Katelyn Richard, Rose Rossell, Jeff Peischl, and Delphine Farmer

Urban air quality is affected by a complex mix of volatile organic compound (VOC) sources, including fossil-fuel combustion, volatile chemical products (VCPs), cooking, and vegetation. Prior studies have identified gaps in emissions inventories and a need to better understand the seasonal mechanisms controlling these sources. Here, we combine high-resolution proton-transfer reaction mass spectrometry (PTRMS) with the eddy covariance method to directly quantify VOC fluxes at an urban/suburban site in New York during summer and winter. The emissions are strongly seasonal: over twice as many individual VOCs undergo surface-atmosphere exchange during summer, and the resulting mass-based and OH reactivity-weighted fluxes are 2-3.5x higher at this time. We find that temperature-dependent processes predominate during summer, with VCPs accounting for ~50% of the emitted VOC-C mass flux and ~30% of the emitted OH reactivity. Ethanol alone accounts for ~25% of the total mass fluxes. Biogenic and residential sources are also substantial, contributing 28% of the emitted OH reactivity. During winter, temperature-dependent emissions are reduced and traffic becomes the largest VOC source. An updated inventory agrees with summer observations to within 25%, but overestimates winter fluxes by >2×. The winter discrepancy arises from overestimated VCP and cooking emissions and from missing temperature-dependent volatilization in the inventory framework. Results highlight the need to account for seasonal and temperature-dependent urban VOC emissions to support air quality and mitigation assessment in the context of global change.

How to cite: Millet, D., Vermeuel, M., Commane, R., Griffis, T., Maddaleno, T., Franklin, E., Richard, K., Rossell, R., Peischl, J., and Farmer, D.: Surface temperatures drive strong seasonality in urban reactive carbon emissions, EGU General Assembly 2026, Vienna, Austria, 3–8 May 2026, EGU26-2246, https://doi.org/10.5194/egusphere-egu26-2246, 2026.

EGU26-3057 | ECS | Orals | AS3.2

Physicochemical Characterization of Solid Residential Fuels in Northeast India 

Lokesh Yadav, Tuhin Kumar Mandal, Sashank Choudhary, Asit Patra, Parveen Saini, Manpreet Kaur, Satyendra Pratap Singh, Surajit Mondal, Paulami Ghosh, Shashi Upadhyay, Shivangi Chandel, and Dorthée Charlier

Despite global shifts toward clean energy, traditional biomass remains the primary source of household energy for millions of people in Northeast India. This study presents a comprehensive assessment of residential fuel chemistry using a large-scale, uniform grid-based survey covering 522 grids and 8,577 households, complemented by rigorous laboratory characterization. Physicochemical analyses categorized the fuels into three distinct groups: hardwoods, softwoods, and grasses.

To capture real-world fuel-use conditions, over 312 solid residential fuel samples were collected directly from households and subjected to proximate and ultimate analyses to evaluate their combustion efficiency and energy potential. The results revealed that volatile matter was the dominant component across all samples (>92%), indicating high reactivity and suitability for energy applications. Regionally, samples from Nagaland exhibited the lowest moisture (1.77%) and ash content (1.78%). Among biomass types, softwood (pine) demonstrated the most favourable characteristics, with the highest volatile matter content (96.9%), whereas bamboo (grass) showed the highest ash content (4.97%), significantly exceeding the average for hardwood (3.57%). These findings highlight the importance of considering both regional origin and biomass type when predicting combustion behaviour.

Furthermore, fourteen dominant biomass species were comprehensively analysed using Fourier Transform Infrared Spectroscopy (FTIR; non-destructive) and pyrolysis-gas chromatography/mass spectrometry (Py-GC/MS; destructive) to elucidate their molecular-scale thermal degradation behaviour and correlate it with energy performance. High-acidity species such as Artocarpus heterophyllus (jackfruit) and Quercus spp. (oak) exhibited elevated acetic acid yields (up to 14.20%), indicating a high acetylated hemicellulose content and increased bio-oil corrosivity. Nitrogen-rich feedstocks, including Hevea brasiliensis (rubberwood) and Syzygium cumini (jamun), produced higher levels of nitrogenous compounds such as dimethylamine (11.05%) and ammonium salts (9.93%), suggesting enhanced NOₓ emission potential. In contrast, bamboo (Bambusoideae) was characterized by a high abundance of 4-vinylphenol (~7.39%).

These findings, supported by thermogravimetric analysis (TGA) and FTIR results, provide critical insights into the combustion and pyrolytic behaviour of regional biomass resources and will be used to develop an energy–economic model for predicting the energy potential of solid residential fuels in Northeast India.

Keywords: Solid residential fuel, Energy economic model, thermochemical properties, pyrolytic characteristics

How to cite: Yadav, L., Mandal, T. K., Choudhary, S., Patra, A., Saini, P., Kaur, M., Singh, S. P., Mondal, S., Ghosh, P., Upadhyay, S., Chandel, S., and Charlier, D.: Physicochemical Characterization of Solid Residential Fuels in Northeast India, EGU General Assembly 2026, Vienna, Austria, 3–8 May 2026, EGU26-3057, https://doi.org/10.5194/egusphere-egu26-3057, 2026.

Per- and polyfluorinated alkyl substances (PFAS) are a group of more than 10,000 synthetic compounds that have been widely used in industrial and consumer products for decades. Due to their water-, oil-, and dirt-repellent properties, they are of particular interest to many manufacturers, especially in industries such as textiles, food packaging, and firefighting foams. However, there is growing concern about their environmental persistence and toxicity. According to the Forever Pollution Project, there are at least 22,934 contamination sites across Europe, with 2,032 of these located in Germany alone. The extensive presence of PFAS underscores the urgent need for effective regulation and remediation efforts to address this growing environmental concern. One of the hotspots for PFAS contamination is Rastatt, Germany. Due to the contaminated agricultural soil, the ambient air in Rastatt was analyzed to determine the spread of PFAS in the air.

How to cite: Borkowska, K. I.: Determination of the spread of PFAS in the atmosphere at contaminated sites using adsorptive preconcentration and GC-Orbitrap-MS, EGU General Assembly 2026, Vienna, Austria, 3–8 May 2026, EGU26-3073, https://doi.org/10.5194/egusphere-egu26-3073, 2026.

EGU26-3249 | Posters on site | AS3.2

NOx Dependent Formation Pathways of Particulate Organic Nitrogen Compounds in Urban Seoul 

Na Rae Choi, Yong Pyo Kim, Ji Yi Lee, Eunhye Lee, and Soontae Kim

This study examined how particulate nitrosamines and nitramines form in the urban atmosphere during spring over Seoul. These organic nitrogen compounds are recognized carcinogens and necessitate systematic investigation in metropolitan areas characterized by high population density and elevated exposure risks. We collected 17 daily particulate matter with an aerodynamic diameter equal or less than 2.5 μm (PM₂.₅) samples from May to June 2019 and analyzed them using gas chromatography-mass spectrometry to determine concentrations and formation mechanisms. Measurements showed total nitroso compound levels of 17.51 ± 16.74 ng/m³, markedly higher than previous spring observations, with nitroso-dibutylamine dominating at 7.86 ± 8.59 ng/m³. This represents a notable shift from prior seasonal patterns where nitrosodimethylamine typically predominated, suggesting changes in either emission sources or secondary formation processes. Correlation analysis revealed positive associations with both primary emission markers such as carbon monoxide and polycyclic aromatic hydrocarbons, as well as factors indicative of secondary formation including liquid water content, indicating multiple pathways contribute to ambient concentrations. Box model simulations incorporating comprehensive gas-phase and aqueous-phase reaction mechanisms revealed that secondary atmospheric reactions contributed substantially to measured concentrations, accounting for approximately 24% of nitrosodimethylamine and 55% of N-nitrodimethylamine formation. Examining compound responses to nitrogen oxide variations revealed distinct patterns: nitrogen dioxide increases enhanced both compounds through elevated N₂O₃ and N₂O₄ production, whereas nitrogen monoxide selectively promoted only nitrosodimethylamine formation via the formation of dimethylamino radicals. Our findings demonstrate the complex NOx chemistry governing carcinogenic nitro(so) compound formation in urban environments and suggest that effective mitigation requires coordinated strategies targeting both NOx emissions and precursor amine sources rather than singular approaches.

How to cite: Choi, N. R., Kim, Y. P., Lee, J. Y., Lee, E., and Kim, S.: NOx Dependent Formation Pathways of Particulate Organic Nitrogen Compounds in Urban Seoul, EGU General Assembly 2026, Vienna, Austria, 3–8 May 2026, EGU26-3249, https://doi.org/10.5194/egusphere-egu26-3249, 2026.

EGU26-4807 | ECS | Posters on site | AS3.2

Sensory-relevant organic pollutants and exposure-oriented odor assessment during waste treatment processes 

Hongyu Gong, Shuwen Han, Yifan Zhuo, Qingyang Dong, Xinwei Li, and Shuncheng Lee

Waste treatment processes emit complex mixtures of volatile organic compounds (VOCs) that frequently cause odor nuisance, public complaints, and growing concerns regarding human exposure and well-being. Persistent exposure to odors has been widely associated with psychological stress, annoyance, and a reduced quality of life, making odor pollution an increasingly relevant public health issue. However, conventional concentration-based indicators, such as total VOCs (TVOC), often fail to represent odor perception and exposure relevance, indicating that sensory response is dominated by a limited number of odor-active compounds rather than by overall chemical abundance.

In this study, VOC emission characteristics during typical waste treatment processes were systematically investigated to identify sensory-relevant organic pollutants and evaluate their implications for exposure-oriented assessment. VOC compositions were characterized using 2D gas chromatography–mass spectrometry (GC×GC–MS), enabling comprehensive profiling of both abundant compounds and low-concentration species with high odor activity. Odor concentration was determined by dynamic olfactometry, providing an independent sensory reference to confirm key odorants and to define control-relevant compounds based on their sensory contribution.

The results demonstrate that odor perception was governed by a small subset of sensory-active VOCs, mainly aldehydes and mercaptans, whose concentrations were relatively low but whose sensory impacts were disproportionately high. This reveals a pronounced mismatch between chemical abundance and sensory relevance, highlighting the limitations of concentration-based metrics for exposure characterization of organic air pollutants. Based on sensory evaluation, priority odor-active compounds were identified, offering a robust basis for targeted control strategies during waste treatment operations.

Furthermore, electronic nose measurements were applied to explore rapid, sensor-based prediction of odor concentration. Multivariate models linking electronic nose responses to olfactometric odor concentration showed good predictive performance, indicating that electronic noses can effectively capture sensory-relevant emission dynamics and support real-time exposure-oriented monitoring.

Overall, this study demonstrates that integrating chemical characterization, sensory assessment, and sensor-based prediction provides a more exposure-relevant framework for evaluating organic air pollutants from waste treatment processes, with implications for health-oriented air pollution assessment.

How to cite: Gong, H., Han, S., Zhuo, Y., Dong, Q., Li, X., and Lee, S.: Sensory-relevant organic pollutants and exposure-oriented odor assessment during waste treatment processes, EGU General Assembly 2026, Vienna, Austria, 3–8 May 2026, EGU26-4807, https://doi.org/10.5194/egusphere-egu26-4807, 2026.

EGU26-5473 | Posters on site | AS3.2

Combined heat and ozone stress impacts on SOA formation and OH reactivity from oak emissions 

Eva Y. Pfannerstill, Biplob Dey, Toke Due Sjøgren, Quanfu He, Michelle Färber, Yizhen Wu, Georgios I. Gkatzelis, Riikka Rinnan, Hendrik Fuchs, Anna Novelli, and Thorsten Hohaus

Secondary organic aerosol (SOA) impacts climate by interactions with radiation and clouds. A globally important source of SOA is the oxidation of biogenic volatile organic compounds (BVOCs) emitted from terrestrial plants. Climate change is intensifying the frequency and severity of heat waves, subjecting plants to unprecedented stress from elevated temperatures and atmospheric pollutants, particularly ozone. However, the consequences of such abiotic stress on forest-derived SOA formation remain poorly understood, as stress conditions can significantly alter BVOC emission composition.

Current research gaps include limited studies examining SOA formation from authentic, complex plant emissions under realistic multi-stressor conditions that reflect actual environmental scenarios. To address this, we conducted controlled experiments using the atmospheric simulation chamber SAPHIR coupled with a plant chamber system (PLUS). Six European oak trees (Quercus robur) were exposed to: (1) no stressor, (2) ozone stress alone, and (3) combined heat and ozone stress conditions. The oak emissions were transferred into SAPHIR for oxidation. Here, we present how environmental stress altered emitted BVOC mixtures, their atmospheric reactivity, and resulting SOA yields.

How to cite: Pfannerstill, E. Y., Dey, B., Sjøgren, T. D., He, Q., Färber, M., Wu, Y., Gkatzelis, G. I., Rinnan, R., Fuchs, H., Novelli, A., and Hohaus, T.: Combined heat and ozone stress impacts on SOA formation and OH reactivity from oak emissions, EGU General Assembly 2026, Vienna, Austria, 3–8 May 2026, EGU26-5473, https://doi.org/10.5194/egusphere-egu26-5473, 2026.

EGU26-6234 | ECS | Posters on site | AS3.2

Unexpected Gas-Phase Formation of Glycolic Acid Sulfate in the Atmosphere 

Haowei Sun, Yuliang Liu, Wei Nie, Yuanyuan Li, Dafeng Ge, Tao Xu, Junchao Yin, Chong Liu, Zihao Fu, Ximeng Qi, Tengyu Liu, Qiaozhi Zha, Chao Yan, Zhe Wang, Xuguang Chi, and Aijun Ding

Organosulfates (OSs) are ubiquitous in atmospheric particulate matter and serve as key tracers for secondary organic aerosols. Traditionally, OSs have been primarily linked to the particle phase, with their presence in the gas phase remaining largely undetected. This study provides compelling observational evidence of a continuously present gas-phase OS, glycolic acid sulfate (GAS), in the urban atmosphere using advanced mass spectrometry techniques. GAS concentrations exhibited distinct seasonal and diurnal patterns, peaking in summer with maximum levels of 4.6 × 104 cm-3 observed around midday, indicating a photochemical origin. Thermal desorption profile analysis revealed GAS as an extremely low-volatility organic compound, suggesting preferential aerosol partitioning. Remarkably, the observed gas-phase fraction of GAS exceeded predictions based on gas-particle equilibrium theory by 5~7 orders of magnitude, strongly suggesting the existence of a distinct source from gas-phase chemistry. We propose a potential formation mechanism involving the reaction between SO3 radical and glycolic acid, which correlates nearly linearly with GAS production rates, suggesting a near-collision-limited rate constant (kfield ≈ 2.2 × 10⁻¹⁰ cm3 s-1). This study fundamentally reshapes our understanding of OSs sources and underscores the potential involvement of SO3 in the formation of low-volatility organic compounds in the atmosphere.

How to cite: Sun, H., Liu, Y., Nie, W., Li, Y., Ge, D., Xu, T., Yin, J., Liu, C., Fu, Z., Qi, X., Liu, T., Zha, Q., Yan, C., Wang, Z., Chi, X., and Ding, A.: Unexpected Gas-Phase Formation of Glycolic Acid Sulfate in the Atmosphere, EGU General Assembly 2026, Vienna, Austria, 3–8 May 2026, EGU26-6234, https://doi.org/10.5194/egusphere-egu26-6234, 2026.

EGU26-7430 | Posters on site | AS3.2

Contribution of low-abundance terpenes to wintertime VOC reactivity in urban air in Helsinki, Finland 

Heidi Hellén, Toni Tykkä, Elli Suhonen, Kimmo Teinilä, Jarkko Niemi, Topi Rönkkö, Hilkka Timonen, and Arnaud P. Praplan

Recent studies suggest that terpenes in urban air may have substantial anthropogenic sources, yet distinguishing these from biogenic emissions remains challenging. In this study, we measured terpene concentrations in a street canyon in Helsinki during cold winter months (mean temperature < 0 °C), when biogenic emissions were expected to be minimal. Monoterpenes were observed at mean concentrations of ~160 ng m⁻³, more than an order of magnitude lower than the mixing ratios of aromatic hydrocarbons. Nevertheless, their high reactivity with hydroxyl radicals, nitrate radicals, and ozone led to a disproportionately large contribution to local atmospheric oxidation processes. This pronounced reactivity, combined with their high secondary organic aerosol (SOA) formation potential, indicated the important potential role of anthropogenic terpene emissions even in wintertime SOA formation.

How to cite: Hellén, H., Tykkä, T., Suhonen, E., Teinilä, K., Niemi, J., Rönkkö, T., Timonen, H., and Praplan, A. P.: Contribution of low-abundance terpenes to wintertime VOC reactivity in urban air in Helsinki, Finland, EGU General Assembly 2026, Vienna, Austria, 3–8 May 2026, EGU26-7430, https://doi.org/10.5194/egusphere-egu26-7430, 2026.

EGU26-7531 | ECS | Orals | AS3.2

The atmospheric formaldehyde budget and its modulation by methane and hydrogen 

Hannah Bryant and David Stevenson

Atmospheric formaldehyde is an air pollutant and a crucial component of the methane and hydrogen chemical budgets. Using simulations representative of the atmosphere between 2010 and 2019, we have analysed the global budget for formaldehyde and investigated the cause of changes during this period. Methane and hydrogen are both intricately coupled to the future energy pathway the global community takes. Currently, the anthropogenic emissions of methane and the emissions of hydrogen from production are rising, although efforts such as the Global Methane Pledge aim to counteract this. The complex balance of how these species evolve over the coming decades will influence formaldehyde. Sensitivity simulations using perturbations of methane and hydrogen have allowed the influence of these species on the budget of formaldehyde to be assessed. These simulations aim to elucidate these relationships, by unpicking how the fluxes of the reactions which control formaldehyde are changed when methane or hydrogen are perturbed. This will allow better prediction of the future evolution of formaldehyde. These simulations have been run using the atmosphere-only version of UKESM1.0, a global Earth System Model with the StratTrop chemical mechanism. This research contributes to both the “HYway: Climate Impacts of a Hydrogen Economy” project, and “VOCMIP: Volatile Organic Compound Model Intercomparison Project”.

How to cite: Bryant, H. and Stevenson, D.: The atmospheric formaldehyde budget and its modulation by methane and hydrogen, EGU General Assembly 2026, Vienna, Austria, 3–8 May 2026, EGU26-7531, https://doi.org/10.5194/egusphere-egu26-7531, 2026.

EGU26-7677 | ECS | Orals | AS3.2

Spatiotemporal Dynamics, Source Apportionment, and Stochastic Health Risk Assessment of Volatile Organic Compounds in Almaty, Kazakhstan 

Olga P. Ibragimova, Nassiba Baimatova, Anara Omarova, Kazbek Tursun, and Bauyrzhan Bukenov

Urban air pollution in Central Asia remains a critical challenge, with volatile organic compounds (VOCs) posing significant threats to public health and regional climate stability. This research integrates studies conducted in Almaty, Kazakhstan, between 2015-2023 to characterize VOC concentrations, identify emission sources, and quantify human health risks [1-4].

In Almaty, the COVID-19 lockdown period in 2020 provided a unique opportunity to observe air quality under traffic-free conditions. While traffic-related pollutants (CO and NO2) decreased by 49% and 35%, benzene and toluene levels remained 2–3 times higher than in the same seasons of 2015-2019. These results indicate that VOC pollution is dominated by non-traffic sources, such as coal-fired combined heat and power plants (CHPs) and residential heating systems. During the lockdown, people remained at home, potentially increasing coal combustion for private heating and public bathhouses (saunas) [1].

Throughout 2020, VOC concentrations in Almaty displayed significant seasonal and spatial variability. In total, 9 of 19 VOCs showed significant seasonal fluctuations, peaking during the winter heating season. Total VOC (TVOC) concentrations in January (233-420 µg/m3) weresubstantially higher than in summer. Spatially, TVOC levels correlated with Almaty’s northward-declining topography, increasing from southern upper to northern lower districts, closer to CHPs and characterized by stagnant conditions and persistent temperature inversions [2].

Consequently, a stochastic human health risk assessment for Almaty residents revealed concerning long-term implications. Median non-carcinogenic Hazard Indices (HI-s) were generally within acceptable limits (<1.0), but 95th percentile HIs exceeded 3–5 in winter, indicating exceeded exposure margins for a non-negligible population fraction. More critically, lifetime carcinogenic risk exceeded the 10-6 threshold in all scenarios. Median risks ranged from 10-5 to 10-4, while worst-case winter scenarios reached 10-3, indicating significant cancer risk primarily driven by benzene [3].

Following these assessments, a year-long study (2022–2023) utilized sorbent tubes for active 24-hour air sampling to characterize Almaty’s air quality. An annual average benzene concentration (8.25 µg/m3) exceeded European Union and Canadian standards by factors of 4.9 and 13.8. HYSPLIT backward trajectory modeling identified that stagnant winter conditions facilitate local VOC accumulation, while additional transboundary contributions from Kyrgyzstan and Uzbekistan. Reactivity analysis showed that xylenes, toluene, and pseudocumene contribute over 80% of ozone formation potential, highlighting their role in urban smog [4]. These findings highlight an urgent need for targeted regulatory interventions, including annual benzene limits, CHP infrastructure modernization, and transitioning to cleaner fuels to mitigate the air quality crisis in Central Asia.

Acknowledgments

This research was funded by the Science Committee of the Ministry of Higher Education and Science of the Republic of Kazakhstan (Grant No.AP22785481,2024-2026).

References

[1]A.Kerimray et al. Assessing air quality changes in large cities during COVID-19 lockdowns: The impacts of traffic-free urban conditions in Almaty, Kazakhstan. STOTEN (2020),730,139179.

[2]O.P.Ibragimova et al. Seasonal and Spatial Variation of VOCs in Ambient Air of Almaty City, Kazakhstan. Atmosphere, (2021),12(12),1592.

[3]A.Alibekov et al. Severe health risks from ambient VOCs in a Central Asian city: Source attribution and probabilistic risk assessment. Atmos.Environ.X (2025),28,100378.

[4]O.P.Ibragimova et al. Urban atmospheric volatile organic compounds pollution in Kazakhstan: Trends, sources identification, and health risk assessment. Atmos.Pollut.Res. (2025),102761.

How to cite: Ibragimova, O. P., Baimatova, N., Omarova, A., Tursun, K., and Bukenov, B.: Spatiotemporal Dynamics, Source Apportionment, and Stochastic Health Risk Assessment of Volatile Organic Compounds in Almaty, Kazakhstan, EGU General Assembly 2026, Vienna, Austria, 3–8 May 2026, EGU26-7677, https://doi.org/10.5194/egusphere-egu26-7677, 2026.

EGU26-7819 | ECS | Orals | AS3.2

Atmospheric transfer of emerging contaminants from wastewater aeration: real-time and offline characterization using a laboratory bubbling-bursting setup 

Estevan Moinard, Matthieu Riva, Sébastien Perrier, Hélène Fenet, and Geoffroy Duporté

Wastewater treatment plants (WWTPs) are increasingly recognized as significant, yet potentially underestimated, sources of emerging contaminants (ECs) released into the atmosphere.1-3 The activated sludge process is one of the most widely used technologies in WWTPs, where continuous aeration generates rising and bursting bubbles. This dynamic can lead to substantial particulate emissions through similar mechanisms to sea-spray aerosol formation. Recent field studies have reported the presence of pharmaceuticals and persistent organic pollutants in the air surrounding WWTPs at pg/m3 to ng/m3 levels.4-6 Theseemissions are attributed to both aerosolization and volatilization processes. This work aimed to experimentally characterize water-to-air transfer processes under controlled laboratory conditions using a bubbling-bursting setup.

The setup consisted of a glass reactor containing synthetic wastewater spiked with eleven ECs. Synthetic air was injected through a sintered filter to simulate aeration, with flow rates ranging from 0.5 to 4 L/min. A dual analytical strategy was employed: offline sampling using glass filters and polyurethane foams for targeted High-Performance Liquid Chromatography – High-Resolution Mass Spectrometry (HPLC-HRMS) analysis, and online monitoring for real-time aerosol characterization. Specifically, a Scanning Mobility Particle Sizer (SMPS) monitored aerosol size distributions, while a Bromine Chemical Ionization Mass Spectrometer (Br-CIMS) equipped with a thermal desorber provided high-frequency chemical analysis of the particulate phase. This setup enabled the evaluation of the effects of contaminant concentration, temperature, dissolved organic matter (DOM), surfactants, and aeration flow rate on emission dynamics.

The study demonstrated the emissions of both semi-volatile and low-volatility compounds. Clear and reproducible releases were observed for venlafaxine, the macrolide antibiotics erythromycin and clarithromycin, carbamazepine, and irbesartan. Macrolides showed the highest airborne concentrations , reaching 28–53 ng/m³ at a water concentration of 1 µg/L in water. Even compounds with extremely low vapour pressures were emitted, confirming that aeration-driven aerosolization can transfer substances unlikely to volatilize. Emission intensities increased with aqueous concentration and aeration flow rate and were significantly influenced by temperature, DOM, and surfactant content. No homogeneous emission pattern was observed across all compounds, highlighting the influence of their intrinsic physicochemical properties. Aerosols were predominantly in the ultrafine range, with a mean diameter of approximately 44 nm, while DOM and surfactants significantly enhanced both particle size and aerosol mass. For the first time, erythromycin, clarithromycin, and irbesartan were successfully detected in real-time using online Br-CIMS

These results demonstrated that aeration-driven aerosolization in WWTPs enabled the atmospheric emission of  low-volatility ECs, as confirmed by both offline and real-time particulate-phase measurements. Ongoing  work extends this approach to real wastewater matrices, with combined online monitoring of particulate and gas phases using non-target screening strategies.

Acknowledgement - The authors thank the ANR – FRANCE (French National Research Agency) for its financial support of the WECARE project n°ANR-23-CE01-0007.

(1) Wang et al., 2024 - The Innovation  https://doi.org/10.1016/j.xinn.2024.100612.

(2) Barroso et al,. 2019 - Environmental Science and Technology.https://doi.org/10.1080/10643389.2018.1540761.

(3) Ferrey et al,. 2018 - Science of The Total Environment https://doi.org/10.1016/j.scitotenv.2017.06.201.

(4) Lin et al,. 2020 - Water Research. https://doi.org/10.1016/j.watres.2020.115495.

(5) Shoeib et al,. 2016 - Environmental Pollution  https://doi.org/10.1016/j.envpol.2016.07.043.

(6) Sanli et al,. 2025 - Chemosphere  https://doi.org/10.1016/j.chemosphere.2024.144038.

How to cite: Moinard, E., Riva, M., Perrier, S., Fenet, H., and Duporté, G.: Atmospheric transfer of emerging contaminants from wastewater aeration: real-time and offline characterization using a laboratory bubbling-bursting setup, EGU General Assembly 2026, Vienna, Austria, 3–8 May 2026, EGU26-7819, https://doi.org/10.5194/egusphere-egu26-7819, 2026.

EGU26-8496 | Orals | AS3.2

  Evolution of Particle-Bound Reactive Oxygen Species (ROS) During Photochemical Aging of Biomass Burning Emissions 

Zoran Ristovski, Sahar Elkaee, Zijun Li, Branka Miljevic, Magdalena Okuljar, Yang Xiao, Shijie Han, and Hao Wang

 Understanding biomass burning emissions is critical because they represent a major source of atmospheric particulate matter, influencing air quality, climate, and public health. The chemical complexity and dynamic evolution of these particles during atmospheric aging pose significant challenges for predicting their environmental and health impacts. A key knowledge gap concerns the evolution of particle-bound reactive oxygen species (ROS) during aging, particularly short-lived ROS that are difficult to quantify using conventional offline methods.

In this study, we investigate the formation and transformation of particle-bound ROS in smoke generated from eucalyptus leaves under controlled photochemical aging. Atmospheric oxidation was simulated using a Rapid Aerosol Aging Device (RAAD), which enabled real-time monitoring of aerosol compositional changes and oxidative potential. A suite of instruments—including two Particle Into Nitroxide Quencher (PINQ) systems, a Scanning Mobility Particle Sizer (SMPS), gas monitors, Selected Ion Flow Tube mass spectrometry (SIFT), and a High-Resolution Aerosol Mass Spectrometer (HR-AMS)—was employed to characterize both physical and chemical transformations during aging. Relative humidity was maintained using an integrated humidification system, as it can significantly influence oxidation reactions and ROS formation.

Fresh smoke was first analyzed under dark, low-oxidant conditions to establish baseline properties. The aerosol was then subjected to RAAD-driven photochemical aging equivalent to 1–6 days of atmospheric OH exposure. The first PINQ measured initial particle-bound ROS levels, while the second PINQ quantified ROS after aging. SIFT provided measurements of key gas-phase species associated with oxidation chemistry, and HR-AMS supplied real-time information on chemical composition and mass-based size distribution. This integrated approach enabled continuous evaluation of ROS formation and transformation during simulated atmospheric aging, offering new insight into how biomass burning emissions develop enhanced oxidative potential over timescales of several days.

Dual-PINQ measurements revealed clear differences in particle-bound ROS before and after photochemical aging, demonstrating that aging processes substantially modify ROS levels compared to those measured immediately after burning. These findings highlight the importance of real-time techniques for detecting short-lived species that cannot be preserved through offline sampling. Overall, photochemical aging significantly increases the oxidative potential of biomass burning aerosols over short timescales, with implications for air quality assessment and human exposure during fire events.


How to cite: Ristovski, Z., Elkaee, S., Li, Z., Miljevic, B., Okuljar, M., Xiao, Y., Han, S., and Wang, H.:   Evolution of Particle-Bound Reactive Oxygen Species (ROS) During Photochemical Aging of Biomass Burning Emissions, EGU General Assembly 2026, Vienna, Austria, 3–8 May 2026, EGU26-8496, https://doi.org/10.5194/egusphere-egu26-8496, 2026.

EGU26-8564 | ECS | Orals | AS3.2

Atmospheric amines in urban Beijing: measurements, characteristics and potential sources 

Yiqi Zhao, Zhaojin An, Yuyang Li, Rujing Yin, Dandan Li, Dongbin Wang, Jun Zheng, and Jingkun Jiang

Amines are important alkaline gases in the atmosphere besides ammonia, profoundly influencing air quality, climate and human health through complex physicochemical processes. They facilitate new particle formation through acid-base nucleation process, with the resulting particles further growing into cloud condensation nuclei or contributing to secondary particulate pollution. They also participate in atmospheric oxidation process, yielding toxic gaseous pollutants such as aldehydes, nitramines, and nitrosamines. An increase in atmospheric amine abundance could lead to adverse effects to the environment. Vocus Proton-Transfer-Reaction Mass Spectrometry (Vocus-PTR) is an effective technique in volatile organic compounds (VOCs) detection. In this study, we optimized the condition of focusing ion-molecule reactor (FIMR) of Vocus-PTR to measure a wider variety of amines with lower concentrations, achieving good performance in the detection of both atmospheric amines and VOCs. Using the optimized Vocus-PTR, we conducted field measurement at a typical urban site in Beijing, China. C2-6-alkylamines, C1-6-amides and several emerging amines were identified and quantified. Their concentrations, atmospheric variations and potential sources are further investigated.

How to cite: Zhao, Y., An, Z., Li, Y., Yin, R., Li, D., Wang, D., Zheng, J., and Jiang, J.: Atmospheric amines in urban Beijing: measurements, characteristics and potential sources, EGU General Assembly 2026, Vienna, Austria, 3–8 May 2026, EGU26-8564, https://doi.org/10.5194/egusphere-egu26-8564, 2026.

EGU26-9003 | ECS | Posters on site | AS3.2

Characterization of Particulate Nitrosamines and Nitramines at Industrial and Background Sites in Korea: Field Observations and Laboratory Experiments 

Soorin Jeong, Mijung Song, Taehyoung Lee, Hye Jung Shin, Gook-Young Heo, and Na Rae Choi

Particulate N-nitrosamines and nitramines are potent organic carcinogens with significant public health implications. They are formed in the atmosphere through primary emissions from sources such as rubber and plastic combustion, and tobacco smoke, as well as secondary formation of gaseous and aqueous phase amine. This study quantifies seven nitrosamines and two nitramines in PM2.5 collected from summer 2024 to spring 2025 at Ansan (industrial) and Baengnyeong Island (background). The mean total concentration at Ansan (2.67 ± 1.87 ng m-3) was comparable at Baengnyeong (2.23 ± 1.45 ng m-3). Among the quantified species, N-nitrosodi-n-butylamine (NDBA) was generally the most abundant at both sites across most seasons. At Ansan, NDBA showed positive correlations with elemental carbon (EC) during autumn (r = 0.517, p < 0.01) and with SO₂ during summer (r = 0.488, p < 0.01); however, these correlations alone could not resolve the relative contributions of primary emissions versus secondary formation.

To better understand the role of aqueous-phase chemistry in NDBA formation, we conducted controlled batch reactor experiments simulating atmospheric aqueous aerosol reactions. The experiments systematically varied precursor (dibutylamine and nitrite) concentrations, pH, temperature, and reaction time to quantify NDBA formation rates in the homogeneous aqueous phase. Experimental results were integrated with field-based observations to investigate possible connections between environmental conditions such as pH levels and precursor availability and observed variations in ambient NDBA concentrations across different sites and seasons.

How to cite: Jeong, S., Song, M., Lee, T., Shin, H. J., Heo, G.-Y., and Choi, N. R.: Characterization of Particulate Nitrosamines and Nitramines at Industrial and Background Sites in Korea: Field Observations and Laboratory Experiments, EGU General Assembly 2026, Vienna, Austria, 3–8 May 2026, EGU26-9003, https://doi.org/10.5194/egusphere-egu26-9003, 2026.

EGU26-9235 | ECS | Orals | AS3.2

Temperature Affects Composition and Cloud Formation Activity of Secondary Organic Aerosol from β-Caryophyllene Ozonolysis 

Maria Angelaki, Clément Dubois, Eva Johanna Horchler, Katja Olsen Møller Åbom, Martine Rasmussen, Emil Mark Iversen, Merete Bilde, and Fabian Mahrt

Secondary organic aerosol (SOA) constitutes the most important type of ambient particles and strongly affects tropospheric chemistry and air quality. SOA also affects climate, directly by scattering light and indirectly by acting as cloud condensation nuclei (CCN). SOA mostly forms within the atmosphere by oxidation of volatile organic compounds (VOCs) with tropospheric oxidants, such as ozone (O3) and nitrate radicals (NO3). The most important classes of VOCs in the troposphere are monoterpenes and sesquiterpenes. Many previous studies have focused on SOA generated from oxidation of monoterpenes, such as α-pinene, and investigated SOA properties. In contrast, much less is known about SOA formed from oxidation of sesquiterpenes, denoting the second most important class of tropospheric VOCs. In addition, these previous studies were mostly performed at room temperature (T) and there have been very few studies at T < 293 K, despite tropospheric temperature typically ranging from 220 K to 300 K. Studies with realistic SOA formed at T < 293 K are urgently needed to confirm conclusions from previous work and to better understand SOA’s impact on tropospheric chemistry and climate.

Here, we studied SOA generated from oxidation of β-caryophyllene, the most abundant sesquiterpene in the troposphere. SOA was formed in the Aarhus University Research on Aerosol (AURA) atmospheric simulation chamber via dark ozonolysis of β-caryophyllene. Experiments were performed as a function of temperature between ~258 K to 297 K, covering common tropospheric conditions. Gas- and particle-phase chemical composition was monitored online, using high-resolution mass spectrometry, while simultaneously determining SOA’s phase state and CCN activity, using a printed optical particle and cloud condensation nuclei counter, respectively.

Our results demonstrate that the reaction of β-caryophyllene with O3 and the properties of the resulting aerosols are sensitive to the temperature at which SOA was formed. Temperature impacts the SOA composition and phase state. Interestingly, β-caryophyllene SOA formed at room T showed CCN-activity, while SOA formed at low T showed no CCN activity. We attribute this, at least in parts, to changes in SOA composition. However, changes in the phase state, observed during the experiments, of the SOA formed at different temperatures may help explain the observed changes in CCN activity. Overall, our results suggest that parameterizations based on room temperature SOA measurements frequently used to estimate SOA’s CCN ability in atmospheric models could be more uncertain than previously assumed, with possibly important implications for climate.

How to cite: Angelaki, M., Dubois, C., Horchler, E. J., Møller Åbom, K. O., Rasmussen, M., Iversen, E. M., Bilde, M., and Mahrt, F.: Temperature Affects Composition and Cloud Formation Activity of Secondary Organic Aerosol from β-Caryophyllene Ozonolysis, EGU General Assembly 2026, Vienna, Austria, 3–8 May 2026, EGU26-9235, https://doi.org/10.5194/egusphere-egu26-9235, 2026.

EGU26-9753 | ECS | Posters on site | AS3.2

Secondary organic aerosol from oxidation of camphene with ozone and OH radicals – kinetics, yields and molecular composition at 313 – 243K 

Uzoamaka virginia Ezenobi, Harald Saathoff, YanXia Li, and Thomas Leisner

Non-methane volatile organic compounds (NMVOCs) emissions are dominated by biogenic VOC (BVOC) primarily from vegetation emissions. Main compounds are isoprene and monoterpenes which are precursors to tropospheric ozone and secondary organic aerosols, leading to impacts on air quality, human health, visibility and climate change both directly and indirectly.

Camphene is an abundant monoterpene which has been understudied, particularly in terms of its kinetics, secondary organic aerosol (SOA) yields and molecular composition (Gaona-Colmán et al., 2017; Afreh et al., 2021; Li et al., 2022). Here, we present a systematic study of SOA formation from Camphene over a wider temperature range (243 K – 313K) by dedicated simulation chamber experiments. We used ozone concentrations of 2.18–3.72 ppm for camphene oxidation, representing a substantial excess of ozone, to a allow a significant chemical conversion at relative low reaction rates.

Based on PTR-MS (PTR-MS 4000, Ionicon Analytik GmbH) measurements of camphene and acetone concentrations as well as ozone measurements (Environment 0341M), the rate coefficients of the reaction of camphene with ozone and OH radicals were determined by fitting the results of a kinetic model to the observations. Particle size distributions and number concentrations were measured by a scanning mobility particle sizer (SMPS) utilizing a differential mobility analyser (DMA; 3071, TSI Inc.) coupled to a CPC (3772, TSI Inc.). Particle number concentrations were measured by two condensation particle counters (3022A and 3776, TSI Inc.). The particle number size distributions of the SMPS were corrected for the total number concentration measured by a calibrated CPC and used to calculate the SOA mass concentration by applying an effective particle density of 1.3 (Li et al., 2022). SOA mass concentrations were also measured with a HR-ToF-AMS (Aerodyne Inc.) SOA yields (YSOA) were calculated as YSOA = ΔMorg/ΔVOC, where ΔMorg is the SOA mass formed from the reacted mass of camphene (ΔVOC).

A chemical ionization mass spectrometer coupled with a filter inlet for gases and aerosols (FIGAERO-CIMS,  Aerodyne Inc) was used to measure both gas-phase and particle phase chemical composition employing iodide as reagent ion. Particles were collected on prebaked Teflon filters (1 µm, SKC Inc.) using a stainless-steel filter holder for offline analysis.

Major secondary organic aerosol products and different chemical components of the gas and particle phase present at all temperatures were resolved. The variation in the abundance of individual organic molecules during ozonolysis and OH radical initiated oxidation were resolved at four different temperatures: 243, 273, 298, 313 K. This presentation will discuss the main findings in the context of previous studies as well as its implications for the role of camphene in atmospheric aerosol chemistry.


Afreh et al., Atmos. Chem. Phys., 21, 11467–11487, 2021.

Gaona-Colmán et al., RSC Adv., 7, 2733-2744, 2017.

Li et al., Atmos. Chem. Phys., 22(5), 3131–3147, 2022

How to cite: Ezenobi, U. V., Saathoff, H., Li, Y., and Leisner, T.: Secondary organic aerosol from oxidation of camphene with ozone and OH radicals – kinetics, yields and molecular composition at 313 – 243K, EGU General Assembly 2026, Vienna, Austria, 3–8 May 2026, EGU26-9753, https://doi.org/10.5194/egusphere-egu26-9753, 2026.

EGU26-9861 | ECS | Orals | AS3.2

Urban VOC monitoring by VOCentinel at the Innsbruck Atmospheric Observatory (IAO) 

Arianna Peron, Martin Graus, Klaus Winkler, Markus Müller, Markus Leiminger, Tobias Reinecke, and Thomas Karl

Volatile Organic Compounds (VOCs), emitted by both biogenic and anthropogenic sources, play a crucial role in atmospheric processes and significantly affect air quality. Despite their importance, routine monitoring of VOCs poses challenges due to limitations in time-resolution, labor intensity, long-term stability, and compound-specific identification capabilities. Proton-transfer-reaction mass-spectrometry (PTR-MS) is widely used for detecting VOCs with high time-resolution and stability. However, as a soft chemical ionization method, it primarily identifies chemical compositions rather than specific compounds. Urban environments are especially challenging due to the release of thousands of VOCs from numerous sources, which can also necessitate additional corrections for possible interferences (Coggon et al., 2024; Peron et al., 2024). Acquiring additional chemical information through alternative ionization methods remains labor-intensive, making it impractical for long-term VOC monitoring.

The recently introduced VOCentinel (IONICON Analytik) leverages Selective-Reagent-Ion (SRI) PTR-MS combined with Automatic Measurement and Evaluation (AME), integrating recent technological advancements in PTR-MS, such as fast switching of reagent ions, extended volatility range (EVR, Piel et al., 2021) surface treatment, dynamic humidity control (Winkler et al., 2024), alongside IONICON's extensive experience in robust industrial monitoring. Essentially, five ionization modes sequentially ionize specific atmospheric VOCs within one minute, and the resulting mass spectra are immediately analyzed for chemical composition using a pattern matching algorithm.

The Innsbruck Atmospheric Observatory (IAO, Austria) is a well characterized urban field site (Karl et al., 2020) and hosts measurements within the Interreg Italy–Austria Breathing project, a collaboration between University of Innsbruck, ARPA Veneto, Ca’ Foscari University of Venice, and the Free University of Bolzano. A VOCentinel was installed in Summer 2025 at the Innsbruck Atmospheric Observatory (IAO, Austria) and has since then been monitoring urban VOC concentrations. In this presentation we will share first results from these multi-seasonal VOC measurements.

Coggon et al. (2024) Identifying and correcting interferences to PTR-ToF-MS measurements of isoprene and other urban volatile organic compounds, Atmos. Meas. Tech., 17, 801–825

Peron et al. (2024) Deciphering anthropogenic and biogenic contributions to selected non-methane volatile organic compound emissions in an urban area, Atmos. Chem. Phys., 24, 7063–7083

Piel et al. (2021) Introducing the extended volatility range proton-transfer-reaction mass spectrometer (EVR PTR-MS), Atmos. Meas. Tech., 14, 1355–1363.

Winkler et al. (2024) 100% humidity independent PTR-MS: Novel method and proof-of-concept, Phys. Scr. 99 121502

Karl et al. (2020) Studying Urban Climate and Air Quality in the Alps: The Innsbruck Atmospheric Observatory. Bull. Amer. Meteor. Soc., 101, E488–E507

How to cite: Peron, A., Graus, M., Winkler, K., Müller, M., Leiminger, M., Reinecke, T., and Karl, T.: Urban VOC monitoring by VOCentinel at the Innsbruck Atmospheric Observatory (IAO), EGU General Assembly 2026, Vienna, Austria, 3–8 May 2026, EGU26-9861, https://doi.org/10.5194/egusphere-egu26-9861, 2026.

EGU26-9889 | ECS | Posters on site | AS3.2

A versatile laminar-flow oxidation reactor for studying multiple-day oxidation of atmospheric organics 

Markus Sebastian Leiminger, Tobias Reinecke, Andreas Klinger, Martin Graus, and Markus Müller

Herein we introduce the fully automated Ionicon Laminar-flow Oxidation reactor (ILOx) for rapid photochemical oxidation of atmospheric organics, as a useful tool to mimic atmospheric processes of days within minutes. ILOx consists of a 110 cm long quartz glass tube with a total internal volume of 8 l that is irradiated by UVA and UVC LEDs. Oxidants can be introduced through multiple customizable inlet ports. To achieve laminar flow conditions, sample injection is CFD optimized to suppress any formation of injection jets. The outlet of ILOx allows for sampling both particles and VOCs simultaneously. A characterization of the particle transmission through the reactor with dried ammonium sulfate particles showed no significant change in the particle distribution before and after the reactor, proving the highly efficient particle transmission of the system. VOCs are coresampled to reduce wall interactions and potential formations of artifacts. In addition, all wetted surfaces are optimized for purest experiments providing fast response, even for reduced volatility gas-phase organics.

To experimentally confirm the oxidation potential of the reactor, air containing 2 ppbV of toluene is sampled through ILOx while VOCs are monitored by FUSION PTR-TOF 10 (IONICON Analytik, Austria). Just minutes after starting the UVA irradiation, 50% of toluene is oxidized, mimicking atmospheric aging in the range of 2 days. In addition, known toluene oxidation products like methyl glyoxal, cresols or dihydroxymethyl benzene are increasing. MCM 3.3.1 simulations of this experiment result in average OH concentrations of 3x108 cm-3, which equals to an OH exposure OHexp of 1011 cm-3s. 

To characterize the overall efficiency of the system, we study the secondary organic aerosol (SOA) mass-yield of two aerosol precursors, xylene and limonene, respectively. For these experiments, humidified zero air (50% RH, 25°C) containing ~2 ppmV of ozone from an external 185 nm UVC source is used as the carrier gas. ILOx’s integrated 275 nm UVC LED is activated to photolyze O3 to O2 and O(1D) to consequently form OH together with the carrier gas’ humidity. By adding xylene and limonene at atmospherically relevant concentrations of single-digit ppbVs we are able to identify a SOA mass-yield of 25.2 ± 2.7% for xylene and 36 ± 6.4%  for limonene.

Ultimately, we demonstrate the rapid oxidation of ambient air during a summer-time rush-hour event within ILOx. By intercomparison of FUSION PTR-TOF 10 mass spectra pre- and post-ILOx, with and without oxidation, we can quantitatively characterize the chemical compositions of ambient air and identify reacted and formed compounds. We can observe a clear change of chemical composition with a dominant reduction of aromatic and non-aromatic hydrocarbons (e.g. terpenoids) of higher volatility to a production of oxidized species of lower volatility.

How to cite: Leiminger, M. S., Reinecke, T., Klinger, A., Graus, M., and Müller, M.: A versatile laminar-flow oxidation reactor for studying multiple-day oxidation of atmospheric organics, EGU General Assembly 2026, Vienna, Austria, 3–8 May 2026, EGU26-9889, https://doi.org/10.5194/egusphere-egu26-9889, 2026.

EGU26-10449 | ECS | Posters on site | AS3.2

Simulation of aromatics in Fairbanks, Alaska during the wintertime ALPACA-2022 campaign 

Weihang Zhang, Natalie Brett, Kathy S. Law, Brice Temime-Roussel, Barbara D'Anna, Jean-Christophe Raut, Slimane Bekki, Brice Barret, Steve R. Arnold, Joel Savarino, Damien T. Ketcherside, Robert J. Yokelson, Lu Hu, Deanna Huff, Jingqiu Mao, James Campbell, Stefano Desecari, Gianluca Pappaccogli, Roman Pohorsky, and Julia Schmale

Benzene, toluene, ethylbenzene, and xylene (BTEX) are hazardous air pollutants with high toxicity and a strong potential for secondary pollutant formation. However, their occurrence and behavior in the Arctic remain poorly understood. During the Alaskan Layered Pollution and Chemical Analysis (ALPACA) field campaign in Fairbanks, Alaska in January-February 2022. Surface observations in downtown Fairbanks revealed two major pollution periods, with extremely cold (down to -35°C) and warmer temperatures (around 0°C), respectively. BTEX concentrations reached 4–12 times higher than those reported in the US and European countries under dark, cold Arctic winter conditions at breathing level, posing a significant health risk.

We simulated BTEX atmospheric distributions in the Fairbanks region using the FLEXible PARTicle-Weather Research and Forecasting (FLEXPART-WRF) Lagrangian particle dispersion model and anthropogenic emissions at the surface and aloft. Due to limited photochemical loss in to the dark polar winter conditions, we treat BTEX as an unreactive tracer in the model. The control run with the emission inventory developed by Alaska Department of Environmental Conservation (ADEC) substantially underestimates BTEX concentrations compared to observations during both polluted periods, indicating deficiencies in winter emissions and near-surface mixing. Enhancing cold-start gasoline vehicle emissions by a factor of 2 during very low-temperatures substantially improved model results during the cold polluted period, while introducing a relative humidity dependence for mobile emissions improved simulated BTEX during the warm, humid pollution period. Addition of emissions of residential heating oil aromatics, not taken into account in the ADEC inventory, also reduced normalized mean biases by 5-10%.

The improved model simulation was used to investigate contributing source sectors. While mobile traffic emissions were identified as the dominant source of BTEX across the Fairbanks North Star Borough, residential heating and non-point sources contributed substantially in downtown Fairbanks. Replacing residential wood burning in the inventory with oil heating during severe pollution periods, in line with air quality control guidelines, was found to effectively reduce BTEX concentrations, particularly benzene by up to 30%. While persistent surface-based temperature inversions largely confined BTEX below ~20 m, upward transport, induced by wind shear, during severe episodes, sometimes lofted near-surface pollutants to higher altitudes, potentially contributing to regional pollution and background Arctic haze.

The findings of this study emphasise the need to accurately account for temperature and humidity dependent vehicle emissions, residential oil heating emissions, and winter boundary-layer dynamics for improved simulations of air quality in cold wintertime environments, not only in the Arctic but also in mid-latitudes.

How to cite: Zhang, W., Brett, N., Law, K. S., Temime-Roussel, B., D'Anna, B., Raut, J.-C., Bekki, S., Barret, B., Arnold, S. R., Savarino, J., Ketcherside, D. T., Yokelson, R. J., Hu, L., Huff, D., Mao, J., Campbell, J., Desecari, S., Pappaccogli, G., Pohorsky, R., and Schmale, J.: Simulation of aromatics in Fairbanks, Alaska during the wintertime ALPACA-2022 campaign, EGU General Assembly 2026, Vienna, Austria, 3–8 May 2026, EGU26-10449, https://doi.org/10.5194/egusphere-egu26-10449, 2026.

EGU26-11269 | ECS | Posters on site | AS3.2

Resolving Isomer and Interference Biases in PTR-ToF-MS Measurements of Atmospheric VOCs and Photochemical Impacts 

Xin Feng, Lirong Hui, Yi Chen, Penggang Zheng, Yao Chen, Jiali Zhong, Yang Xu, Megan Clafin, Brian Lerner, and Zhe Wang

While proton-transfer-reaction time-of-flight mass spectrometry (PTR-ToF-MS) is widely used for ambient volatile organic compounds (VOCs) quantification, its accuracy is limited by isobaric interferences, fragmentation, and ionization byproducts. Here, a thermal desorption preconcentration gas chromatography (GC) coupled with Vocus PTR-ToF-MS was deployed at a suburban site in Hong Kong to resolve isomers and quantify interferences for ambient VOCs measurement. We identified and quantified 48 compounds using GC-PTR measurements and resolved their isomer profiles in real-time PTR data based on GC-derived fractions. Our analysis revealed that real-time (RT) PTR measurements substantially underestimate long-chain aldehydes (e.g., C5–C8 aldehydes) due to extensive fragmentation, while overestimating isoprene, benzene, styrene, and phenol by 14-60% because of interference from other species. These biases propagate into photochemical modeling, leading to overestimation of daytime ozone production by ~40% and of biogenic VOCs’ OH reactivity. Correcting isomer distributions and interference effects reduces modeled ozone production rates and alters precursor sensitivities, revealing a larger role for oxygenated VOCs in ozone formation than previously recognized. Our results highlight the necessity for isomer-resolved measurements and interference-aware calibration to improve VOC-based assessments of photochemical air pollution.

How to cite: Feng, X., Hui, L., Chen, Y., Zheng, P., Chen, Y., Zhong, J., Xu, Y., Clafin, M., Lerner, B., and Wang, Z.: Resolving Isomer and Interference Biases in PTR-ToF-MS Measurements of Atmospheric VOCs and Photochemical Impacts, EGU General Assembly 2026, Vienna, Austria, 3–8 May 2026, EGU26-11269, https://doi.org/10.5194/egusphere-egu26-11269, 2026.

EGU26-11380 | ECS | Posters on site | AS3.2

Role of H-bonding in Modulating Reactivity with Criegee Intermediates 

Saurabh Khodia, Maria de los Angeles Garavagno, Stephen J. Klippenstein, and Andrew J. Orr-Ewing

The bimolecular reaction of Criegee intermediates (CIs) with esters of varying chain length and α-substitution have been investigated under atmospherically relevant conditions using laser flash photolysis combined with cavity ring-down spectroscopy (CRDS). The bimolecular rate coefficient for propyl formate reaction with the simplest CI (formaldehyde oxide) is about 300 times larger than those for methyl formate, ethyl formate, methyl acetate, and propyl acetate. The only structural difference between propyl formate and the other formates is the length of the alkyl chain, implicating the propyl group as a key factor in the observed rate enhancement.

The enhanced reactivity of propyl formate suggests that its extended chain facilitates a more favorable transition state via hydrogen bonding. In contrast, α-substitution with a methyl group in propyl acetate leads to a marked decrease in reactivity, indicating steric hindrance limits the reactive pathway. Interestingly, methyl trifluoroacetate bearing an electron-withdrawing CF3 group exhibits a rate similar to propyl formate (~10-12 cm3 s-1), likely due to stabilization of the transition state through enhanced charge separation.1 Smaller esters such as methyl formate react more slowly (~10-15 cm3 s-1). These results reveal a subtle interplay of hydrogen-bonding and steric effects in the 1,3 cycloaddition reaction of CIs and underscore the potential role of such reactions in secondary organic aerosol (SOA) formation and growth,2 expanding our understanding of CI-driven oxidation processes in the troposphere.

Figure 1. Laboratory generation and detection of CIs for bimolecular reaction rate measurements.

References

1     R. Chhantyal-Pun, M. A. H. Khan, C. A. Taatjes, C. J. Percival, A. J. Orr-Ewing and D. E. Shallcross, Int. Rev. Phys. Chem., 2020, 39 (3), 385-424.

2     R. Chhantyal-Pun, B. Rotavera, M. R. McGillen, M. A. H. Khan, A. J. Eskola, R. L. Caravan, L. Blacker, D. P. Tew, D. L. Osborn, C. J. Percival, C. A. Taatjes, D. E. Shallcross and A. J. Orr-Ewing, ACS Earth Space Chem., 2018, 2 (8), 833-842.

How to cite: Khodia, S., Garavagno, M. D. L. A., Klippenstein, S. J., and Orr-Ewing, A. J.: Role of H-bonding in Modulating Reactivity with Criegee Intermediates, EGU General Assembly 2026, Vienna, Austria, 3–8 May 2026, EGU26-11380, https://doi.org/10.5194/egusphere-egu26-11380, 2026.

EGU26-11507 | ECS | Orals | AS3.2

Airborne transfer of per-and polyfluoroalkyl substances (PFAS) during hydrometallurgical leaching of electronic waste. 

Amoluck Eluri, Will Gates, Susanne Charlesworth, Damien L. Callahan, and Ivan Kourtchev

Per- and polyfluoroalkyl substances (PFAS) are synthetic chemicals widely used in electronics manufacturing. PFAS monitoring in aquatic systems and soil surrounding electronic-waste (e-waste) recycling plants has gained significant attention due to their toxicological effects on human health and the environment.  While previous studies have demonstrated the aqueous-to-air transport of PFAS (predominantly perfluorooctanoic acid) at low pH while measuring acid-dissociation constants, atmospheric PFAS emissions remain understudied and the combined effect of low pH and temperature, and the role of PFAS physicochemical properties in governing atmospheric transfer of neutral PFAS have not been systematically investigated. Therefore, the key conditions (pH and temperature) controlling the airborne release of ionic PFAS (including new generation and legacy substances) from acidic aqueous solutions were investigated by focusing on the representative e-waste leaching conditions. Additionally, airborne PFAS emissions were characterised during the hydrometallurgical leaching of shredded e-waste materials.

Airborne PFAS releases were quantified from acidified aqueous solutions (pH < 1) spiked with  EPA 533PAR native PFAS standard mixture, containing 25 ionic PFAS compounds. Subsequently, the studies were extended to leaching experiments using the shredded e-waste materials. All the leaching experiments were conducted in an enclosed chamber, with air drawn through the chamber at a low flow rate to capture airborne PFAS on sorbent tubes. Post-sampling analysis was performed using online solid-phase extraction coupled with high-resolution LC-MS, following the workflow reported by Kourtchev et al., (2022).

Up to 50% by mass of airborne PFAS transfer from acidic solutions was observed for selected compounds with an initial PFAS load of 2500 pg. It was found that pH, temperature, and solution composition influenced the amount of PFAS transfer. Additionally, airborne PFAS transfer was found to be related to its physicochemical properties (e.g., functional group). In summary, the work demonstrated aqueous to air transport of PFAS under acidic conditions, which is governed by pH and PFAS molecular structure (e.g., PFAS headgroup). The work also confirmed that airborne PFAS emissions can occur during the leaching of shredded e-waste materials, signifying the need for routine PFAS monitoring and appropriate control measures to avoid potential human exposure.

Reference: 

Kourtchev, I., Hellebust, S., Heffernan, E., Wenger, J., Towers, S., Diapouli, E., & Eleftheriadis, K. (2022). A new on-line SPE LC-HRMS method for the analysis of Perfluoroalkyl and Polyfluoroalkyl Substances (PFAS) in PM2.5 and its application for screening atmospheric particulates from Dublin and Enniscorthy, Ireland. Science of The Total Environment, 835, 155496. doi:https://doi.org/10.1016/j.scitotenv.2022.155496


How to cite: Eluri, A., Gates, W., Charlesworth, S., Callahan, D. L., and Kourtchev, I.: Airborne transfer of per-and polyfluoroalkyl substances (PFAS) during hydrometallurgical leaching of electronic waste., EGU General Assembly 2026, Vienna, Austria, 3–8 May 2026, EGU26-11507, https://doi.org/10.5194/egusphere-egu26-11507, 2026.

EGU26-11712 | Posters on site | AS3.2

Airtox: A Next-Generation PTR-Based Instrument for Autonomous Long-Term VOC Monitoring 

Veronika Pospisilova, Spiro Jorga, Maya Abou-Ghanem, and Abigail Koss

Volatile organic compounds (VOCs) play a central role in atmospheric chemistry and air quality yet their long-term, high time resolution measurements remain challenging to deploy at scale due to instrument complexity, maintenance requirements, and the need for expert-driven data processing. As monitoring networks continue to expand their observational capability across Europe, new instrumentation strategies are required. Here, we introduce the Airtox monitor, a new proton-transfer-reaction (PTR)-based instrument specifically designed for autonomous, long-term VOC monitoring in both stationary and mobile applications. The system features a vacuum ultraviolet (VUV) ionization source coupled to a high-resolution time-of-flight mass spectrometer, delivering broad chemical coverage with unprecedent stability. Integrated automation - including real-time background correction, online mass calibration, and scheduled gas-phase calibrations, enables fully unattended operation while providing continuous stream of reliable quantitative concentration data. We evaluate Airtox performance during month-long deployments at two ACTRIS sites: the Deutscher Wetterdienst (DWD) station in Germany and the high-altitude Jungfraujoch (JFJ) observatory in Switzerland. In both campaigns, the instrument operated continuously without human intervention, demonstrating exceptional robustness under varying environmental and logistical constraints. Automated workflows maintained stable instrument response and calibration, while real-time quality control verified proper system operation and ensuring reliability of the delivered concentration data. We compare these real-time concentration outputs to post processed datasets to assess the accuracy, identify where postprocessing remains beneficial and outline the remaining challenges for true real- time VOC monitoring. We show how the same system also supports mobile monitoring with rapid time response, enabling spatially resolved VOC mapping during on-road or near-source surveys. This versatility allows the same system to be deployed at a monitoring station for long-term observations or to be transferred into a mobile laboratory for targeted field campaigns, extending its utility across diverse research and regulatory applications. We demonstrate that Airtox provides a robust, autonomous VOC monitoring solution that lowers operational barriers and supports reliable, decision-ready data delivery. 

How to cite: Pospisilova, V., Jorga, S., Abou-Ghanem, M., and Koss, A.: Airtox: A Next-Generation PTR-Based Instrument for Autonomous Long-Term VOC Monitoring, EGU General Assembly 2026, Vienna, Austria, 3–8 May 2026, EGU26-11712, https://doi.org/10.5194/egusphere-egu26-11712, 2026.

EGU26-12680 | ECS | Posters on site | AS3.2

Emission of airborne contaminants of emerging concern from wastewater treatment processes 

Jishnu Pandamkulangara Kizhakkethil, Felipe Baglioli, Bárbara Zanicotti Leite, Gustavo Rafael Collere Possetti, Ricardo H. M. Godoi, and Ivan Kourtchev

Wastewater treatment plant (WWTP) influents and effluents are known to contain contaminants of emerging concerns (CECs), including surfactants, industrial chemicals, and pharmaceuticals (Freeling et al., 2019; Lenka et al., 2021). WWTP involve numerous steps, e.g., aeration, that may facilitate the transfer of these compounds to the atmosphere through aerosolisation or volatilisation. Understanding the fate of these pollutants during wastewater treatment is important, as it could inform emission pathways, atmospheric exposure, and potential environmental and human health impacts.

In this study, particulate matter (PM, total suspended particles) samples collected from the grit chamber, secondary settler, and a staff building at a WWTP in Brazil were analysed using high-resolution mass spectrometry (HRMS)-based targeted and non-targeted approaches. Targeted analysis demonstrated both legacy and new generation per and polyfluoroalkyl substances (PFAS) in PM samples, with perfluorooctanoic acid (PFOA) and perfluorooctanesulfonic acid (PFOS) dominating the PFAS profiles, indicating continued inputs of these compounds into wastewater cycles years after regulatory restrictions.

Non-targeted analysis (NTA) revealed the presence of a broad range of CECs, including nitroaromatics, insecticides, personal care products, and industrial intermediates. Semi-targeted analysis of the PM samples identified the highest abundance of 4-nitrophenol (a nitroaromatic compound with known adverse effects on climate and health) in the grit-chamber samples.

Overall, our results emphasise that WWT processes may represent a potential source of PFAS and other CECs to the atmosphere.


Reference:

Lenka, S. P., Kah, M., & Padhye, L. P. (2021). A review of the occurrence, transformation, and removal of poly- and perfluoroalkyl substances (PFAS) in wastewater treatment plants. Water Research, 199, 117187. https://doi.org/10.1016/j.watres.2021.117187

Freeling, F., Alygizakis, N. A., von der Ohe, P. C., Slobodnik, J., Oswald, P., Aalizadeh, R., Cirka, L., Thomaidis, N. S., & Scheurer, M. (2019). Occurrence and potential environmental risk of surfactants and their transformation products discharged by wastewater treatment plants. Science of The Total Environment, 681, 475-487. https://doi.org/10.1016/j.scitotenv.2019.04.445

How to cite: Pandamkulangara Kizhakkethil, J., Baglioli, F., Zanicotti Leite, B., Rafael Collere Possetti, G., H. M. Godoi, R., and Kourtchev, I.: Emission of airborne contaminants of emerging concern from wastewater treatment processes, EGU General Assembly 2026, Vienna, Austria, 3–8 May 2026, EGU26-12680, https://doi.org/10.5194/egusphere-egu26-12680, 2026.

EGU26-13050 | Orals | AS3.2

Where Urban and Marine Air Masses Converge: Water-Soluble Gas-Phase Carbon and Nitrogen in the NYC Region 

Annmarie Carlton, Madison Landi, Amir Gharehbagh, and Christopher Hennigan

Gas-phase polar compounds, including water-soluble nitrogen (WSNg), and water-soluble organic carbon (WSOCg) contribute to ambient fine particulate matter through partitioning into atmospheric waters and forming aqueous secondary organic aerosol (aqSOA), a substantial contributor to fine particulate matter (PM2.5). In this work, we make continuous gas-phase measurements of WSNg, WSOCg, and ammonia (NH3) at the Flax Pond Marine Laboratory, a Photochemical Air Monitoring Station (PAMS) on Long Island, during the Greater New York Oxidant Trace Gas Halogen and Aerosol Airborne Mission (GOTHAAM) field campaign from 14 July to 20 August, 2025. To the best of our knowledge, these are the first continuous atmospheric measurements of WSNg. We pair measurements with predictions from the U.S. EPA’s Community Multiscale Air Quality (CMAQ). Measured WSNg concentrations vary ranging from below detection limits to 33.4 ppb, averaging 5.71 ppb (n = 757, ±5.80 𝜎), and exhibit a distinct diurnal pattern with afternoon enhancements out of phase with oxides of nitrogen. The WSOCg average diurnal profile exhibit afternoon maxima consistent with secondary photochemistry from volatile organic compound (VOC) oxidation. CMAQ accurately reproduces average diurnal profiles of criteria pollutants O3 (r=0.97) and NO2 (r=0.86) but is out of phase for both WSNg or WSOCg. These findings suggest that CMAQ cannot accurately describe key aqSOA precursors.

How to cite: Carlton, A., Landi, M., Gharehbagh, A., and Hennigan, C.: Where Urban and Marine Air Masses Converge: Water-Soluble Gas-Phase Carbon and Nitrogen in the NYC Region, EGU General Assembly 2026, Vienna, Austria, 3–8 May 2026, EGU26-13050, https://doi.org/10.5194/egusphere-egu26-13050, 2026.

EGU26-13063 | Orals | AS3.2

Atmospheric oxygenated organic compounds and their impacts on photochemical air pollution 

Zhe Wang, Lirong Hui, Yang Xu, Yi Chen, Yao Chen, and Xin Feng

Oxygenated organic compounds are key reactive pollutants that significant impact air quality and human health. They play critical roles in tropospheric photochemistry and oxidation capacity, profoundly influencing radical cycling and O3 formation. Despite their importance, the precise quantification of these compounds remain a significant challenging. Here we present a comprehensive study of oxygenated volatile organic compounds (OVOCs) in coastal and urban air, employing a combination of real-time online mass spectrometry and offline sampling methods. The measurements revealed the substantial abundance of OVOCs and their significant contributions (~50%) to photochemical reactivity and O3 formation potential. Observation-based modeling analysis were performed to quantify the impacts of these reactive organic species on photochemistry and the formation of secondary pollutants. The results demonstrated that the OVOCs related reactions can contribute to 30-65% of peroxy radical formation and recycling, thereby enhancing daytime O3 formation. Model simulations without comprehensive consideration of OVOCs would significantly underestimate daytime production rates of O3 and ROx radicals by 41 %–48 %, and shift the diagnosis of O3 formation from a transition regime to a VOC-limited regime, leading to biased policy recommendations and potentially ineffective control strategies. These findings underscore the critical role of OVOCs in atmospheric photochemistry and highlight the urgent need for comprehensive OVOC quantification to accurately characterize O3-precursor relationships and for developing effective and sustainable strategies to mitigate regional photochemical air pollution.

How to cite: Wang, Z., Hui, L., Xu, Y., Chen, Y., Chen, Y., and Feng, X.: Atmospheric oxygenated organic compounds and their impacts on photochemical air pollution, EGU General Assembly 2026, Vienna, Austria, 3–8 May 2026, EGU26-13063, https://doi.org/10.5194/egusphere-egu26-13063, 2026.

EGU26-13507 | ECS | Posters on site | AS3.2

Ambient observations of chlorine-containing oxygenated organic molecules in summer Nanjing using ultrahigh-resolution Orbitrap mass spectrometry 

Ying Zhang, Wei Nie, Yuliang Liu, Chao Yan, Haowei Sun, Junchao Yin, Zhenning Wang, Men Xia, and Caijun Zhu

Chlorine radicals (Cl) formed from reactive chlorine compounds are highly efficient oxidants for volatile organic compounds (VOCs) in the atmosphere, both in marine influenced regions and polluted urban environments, owing to their exceptionally high reactivity. While the reaction kinetics of Cl with VOCs have been extensively investigated in laboratory studies, and several modeling and chamber studies have explored the impacts of Cl-initiated oxidation on secondary organic aerosol (SOA) formation and atmospheric composition, direct ambient observations of chlorine-containing oxygenated organic molecules (Cl-OOMs) remain extremely limited. In this study, we report comprehensive field observations of Cl-OOMs in the urban atmosphere of Nanjing during summer, using an ultrahigh-resolution Orbitrap mass spectrometer coupled with a nitrate (NO3-) chemical ionization source. More than 40 distinct Cl-OOMs were unambiguously identified, among which, chlorinated nitrophenol-related compounds exhibited the highest concentrations. The majority of Cl-OOMs showed pronounced daytime maxima, consistent with enhanced photochemical activity, although several species displayed elevated nighttime concentrations. These compounds are likely formed through atmospheric oxidation of VOCs involving Cl radicals, frequently in combination with other oxidants such as OH and NO3 radicals. In addition, regional transport and the oxidation of chlorinated VOC precursors by other oxidants may also contribute to the observed Cl-OOMs. This work provides rare ambient evidence for the existence and diversity of Cl-OOMs, bridging the gap between laboratory studies and real atmospheric conditions. The results offer new constraints for understanding Cl-initiated VOC oxidation pathways and their potential role in urban atmospheric chemistry.

How to cite: Zhang, Y., Nie, W., Liu, Y., Yan, C., Sun, H., Yin, J., Wang, Z., Xia, M., and Zhu, C.: Ambient observations of chlorine-containing oxygenated organic molecules in summer Nanjing using ultrahigh-resolution Orbitrap mass spectrometry, EGU General Assembly 2026, Vienna, Austria, 3–8 May 2026, EGU26-13507, https://doi.org/10.5194/egusphere-egu26-13507, 2026.

EGU26-13937 | Posters on site | AS3.2

BVOC measurements in the Amazon rainforest: Results from vertically resolved long term measurements 

Achim Edtbauer, Akima Ringsdorf, Eva Pfannerstill, Cléo Quaresma Dias Júnior, and Jonathan Williams

We report long-term, vertically resolved measurements of biogenic volatile organic compounds (BVOCs) above pristine Amazon rainforest. Since March 2018, air from 80, 150, and 325 m on the 325 m Amazon Tall Tower Observatory (ATTO; ~150 km NE of Manaus) has been sequentially sampled (5 min per level, ~4 cycles per hour per height) via insulated Teflon lines to a proton-transfer-reaction time-of-flight mass spectrometer (PTR-ToF-MS) at ground level. The site sits on a plateau within terra firme rainforest, with prevailing NE–E winds transporting air over >1000 km of intact forest to the site. The system quantifies a multitude of BVOCs at sub-ppb levels. The dataset allows to investigate the variability of these BVOCs as a function of height (80-325m), time (0-24h) and season (wet, dry, transition). The extreme drought in 2023, due to an El Nino event, left a clear mark in some BVOCs. This unique record enables analysis of long-term trends and interannual variability and provides a baseline for assessing future atmospheric change.

How to cite: Edtbauer, A., Ringsdorf, A., Pfannerstill, E., Quaresma Dias Júnior, C., and Williams, J.: BVOC measurements in the Amazon rainforest: Results from vertically resolved long term measurements, EGU General Assembly 2026, Vienna, Austria, 3–8 May 2026, EGU26-13937, https://doi.org/10.5194/egusphere-egu26-13937, 2026.

EGU26-14008 | ECS | Posters on site | AS3.2

Accretion product formation from acyl peroxy radicals 

Niklas Illmann, Nico Arnold, Vera Rösgen, and Iulia Patroescu-Klotz

Acyl peroxy radicals (RC(=O)O2) are a particular class of organic peroxy radicals formed in the troposphere predominantly by OH-initiated oxidation of aldehydes or the photolysis of ketones. One of the key features is the formation of acyl peroxy nitrates by reaction with NO2 which act as reservoir species for nitrogen oxides (NOx = NO + NO2) and enable the long-range transport of NOx. When NOx concentrations fall below critical levels, acyl peroxy radical chemistry exhibits substantially an increased complexity. Reactions with HO2 were shown to produce OH. Particularly for larger acyl peroxy radicals (> C4) unimolecular H shift reactions are rapid and yield the formation of highly oxygenated organic molecules (HOMs). More recently, it has been proposed that reactions of acyl peroxy radicals with unsaturated organics such as terpenes finally result in the formation of low-volatility vapours that act as aerosol precursors.

To further elucidate acyl peroxy radical chemistry at conditions where the peroxy radical loss is no longer dominated by reactions with NO we performed experiments in the QUAREC atmospheric simulation chamber (University of Wuppertal) using α,β-dicarbonyl photolysis as clean acyl peroxy radical sources. Based on the results of two methods (FTIR spectroscopy, NH4+-CIMS) we provide evidence for the formation of accretion products from acyl peroxy radical self- and cross-reactions.

How to cite: Illmann, N., Arnold, N., Rösgen, V., and Patroescu-Klotz, I.: Accretion product formation from acyl peroxy radicals, EGU General Assembly 2026, Vienna, Austria, 3–8 May 2026, EGU26-14008, https://doi.org/10.5194/egusphere-egu26-14008, 2026.

EGU26-14923 | Posters on site | AS3.2

Re-emissions of polycyclic aromatic compounds from land and sea surfaces in source and receptor areas 

Gerhard Lammel, Dominika Bezdeková, Pernilla Bohlin-Nizzetto, Anne Karina Halse, Minas Iakovides, Petr Kukučka, Ondrej Letocha, Jakub Martiník, Ludovic Mayer, John K. Mwangi, Barbora Palátová Nežiková, Petra Přibylová, Roman Prokeš, Euripides G. Stephanou, Manolis Tsapakis, Marco Wietzoreck, and Branislav Vrana

Many polycyclic aromatic hydrocarbons (PAHs), along with their nitrated and oxygenated derivatives (NPAHs and OPAHs), are known for their toxicity and ecotoxicity (Bandowe et al., 2014; Rengajaran et al., 2015; IARC, 2019; Nováková et al., 2020). These compounds are co-emitted with PAHs during fossil fuel and biomass combustion, or they form through photochemical and microbiological reactions involving PAHs in the atmosphere and soil (Tsapakis and Stephanou, 2007; Keyte et al., 2013; Bandowe et al., 2017; Wilcke et al., 2021).

While laboratory and field studies have explored the sources, photochemistry, and atmospheric occurrence of these pollutants, their large-scale atmospheric lifetimes and environmental fate remain poorly understood. As semivolatile compounds resistant to biodegradation in soils and surface waters, their potential for long-range transport is further amplified by the "grasshopper effect" (Keyte et al., 2013; Mulder et al., 2014).

We determined the concentration of 25 parent PAHs, 10 OPAHs and 17 NPAHs during summer in air and soils at a rural and near-coastal north European site (Birkenes, southern Norway), a north European forest site (Hyytiälä, southern Finland), a central European rural background site (Košetice, Czech Republic), and in air and surface seawater at two off-shore sites in the Aegean Sea and along transects across the Mediterranean Sea. Directions of diffusive air-soil and air-sea exchanges were derived from the fugacities.

In the source area (central Europe), the diffusive vertical fluxes of most 2-4 ring PAHs, 2-nitronaphthalene and a number of 3-4 ring OPAHs were upward and the carcinogen 1-nitropyrene was found close to phase equilibrium. In the receptor area (northern Europe), acenaphthylene, acenaphthene, benzo(a)anthracene, two 3-4 ring OPAHs, dibenzofuran and 6H-benzo(c)chromen-6-one, were found to volatilise, and 2-nitrofluoranthene close to phase equilibrium (Mwangi et al., 2024). In the Mediterranean Sea, phenanthrene, fluoranthene, pyrene, 2-nitronaphthalene and few 3-4 ring OPAHs were found to volatilise from the sea surface or being close to equilibrium. These findings suggest that land and sea areas even far from the primary sources may indeed act as secondary sources for PAHs, NPAHs and OPAHs in the atmosphere and enable global transport by multihopping.

Secondary emissions may include toxic species, such as e.g., the carcinogenic 1-nitropyrene. Because of neglected re-emissions (secondary sources), PAH emission inventories may be underestimated, in particular in receptor areas.


Acknowledgements: Czech Science Foundation (GAČR, grants 07117S, 17534S), the Max Planck Society, the European Commission – H2020, JERICO-S3 (871153), ACTRIS-CZ (LM2023030), RECETOX (LM2023069) financed by the Czech Ministry of Education, Youth and Sports (MŠMT).


References:

Bandowe, B.A.M. et al. (2017) Sci. Total Environ. 581-582, 237-257.

IARC (2019) IARC Monographs Eval. Carcinogenic Risks to Humans 92, 1–852

Keyte, I.J. et al., Chem. Soc. Rev. 42 (2013) 9333-9391.

Lammel, G. et al. (2025) Atmos. Poll. Res. 16, 102460.

Mulder, M.D. et al. (2914) Atmos. Chem. Phys. 14, 8905-8915.

Mwangi, J.K. et al. (2024) Sci. Total Environ. 921, 170495.

Nováková, J. et al. (2020) Environ. Int. 139, 105634.

Rengarajan, T. et al. (2015) Asian Pac. J. Trop. Biomed. 5, 182–189.

Tsapakis, M. and Stephanou, E.G. (2007) Environ. Sci. Technol., 41 (23), 8011-8017.

Wilcke, W. et al. (2021) J. Environ. Qual. 50, 717-729.

How to cite: Lammel, G., Bezdeková, D., Bohlin-Nizzetto, P., Halse, A. K., Iakovides, M., Kukučka, P., Letocha, O., Martiník, J., Mayer, L., Mwangi, J. K., Palátová Nežiková, B., Přibylová, P., Prokeš, R., Stephanou, E. G., Tsapakis, M., Wietzoreck, M., and Vrana, B.: Re-emissions of polycyclic aromatic compounds from land and sea surfaces in source and receptor areas, EGU General Assembly 2026, Vienna, Austria, 3–8 May 2026, EGU26-14923, https://doi.org/10.5194/egusphere-egu26-14923, 2026.

EGU26-15150 | Posters on site | AS3.2

Distinguishing Between Reactive and Non-reactive Condensation with a Fast-Switching Bipolar Mass Spectrometer 

Manjula Canagaratna, Jenna Devivo, Mitch Alton, Ali Stinchfield, Felipe Lopez-Hilfiker, Douglas Worsnop, and Neil Donahue

Here we present recent results from coupling the Filter Inlet for Gases and AEROsols (FIGAERO) to a Bipolar Time-of-Flight (BTOF) Chemical Ionization Mass Spectrometer. Fast switching-between positive and negative reagent ions addresses the need for instruments that can simultaneously characterize both precursors and oxidation products in ambient measurements. The FIGAERO inlet allows for measurements of gas and particle phase composition as well as thermal desorption profiles of particulate species. FIGAERO-BTOF measurements of laboratory standards and complex chamber mixtures are discussed. FIGAERO-BTOF thermal desorption profiles of inorganic and organic salts such as ammonium nitrate, ammonium sulfate and ammonium oxalate, show that the appearance of simultaneous high temperature desorption peaks in both acidic and basic moieties can be used to distinguish between reactive and non-reactive condensation processes. These observations indicate that previous unipolar (I- only) FIGAERO desorption measurements that assigned high temperature desorptions of small organic acids to thermal decomposition may underestimate the formation of low volatility species from reactions of small organic acids and bases in the atmosphere. Ambient measurements with the FIGAERO-BTOF are also discussed and compared/contrasted with the laboratory observations. The temporal evolution of the particle phase composition and comparisons with the gas phase measurements obtained over the same time periods are investigated.

How to cite: Canagaratna, M., Devivo, J., Alton, M., Stinchfield, A., Lopez-Hilfiker, F., Worsnop, D., and Donahue, N.: Distinguishing Between Reactive and Non-reactive Condensation with a Fast-Switching Bipolar Mass Spectrometer, EGU General Assembly 2026, Vienna, Austria, 3–8 May 2026, EGU26-15150, https://doi.org/10.5194/egusphere-egu26-15150, 2026.

EGU26-15276 | Posters on site | AS3.2

 Rapid Spontaneous Generation of Organosulfur from Inorganic Sulfur in Atmospheric Microdroplets 

Pingqing Fu, Huixia Han, and Dongmei Zhang

Organosulfur compounds are important constituents of atmospheric aerosols and have been extensively studied in previous field, laboratory, and modeling investigations. However, current mechanisms cannot fully account for their atmospheric abundance. Ubiquitous in the atmosphere, micrometer-sized droplets serve as distinctive microreactors and may provide an important medium for organosulfur formation. Here, we demonstrate that reaction of inorganic sulfur with oxygenated volatile organic compounds in microdroplets can spontaneously and rapidly produce sulfonates (C-SO3) and organosulfates (C-OSO3) within hundreds of microseconds (~220 μs), without any catalyst, external potential, or radiation. Furthermore, some organosulfur species identified in laboratory work were detected in ambient aerosols at an urban site and a high-altitude mountain station, confirming the environmental relevance of this pathway. This transformation is driven by the strong interfacial electric field of microdroplets, which promotes the loss of one electron from SO32- to form SO3-•. SO3-• subsequently undergoes nucleophilic addition and radical coupling with unsaturated oxygenated volatile organic compounds to generate organosulfur. Our findings offer a new perspective on atmospheric organosulfur formation and highlight the critical, yet previously overlooked, role of microdroplet interfaces in the formation of secondary organic aerosols.

How to cite: Fu, P., Han, H., and Zhang, D.:  Rapid Spontaneous Generation of Organosulfur from Inorganic Sulfur in Atmospheric Microdroplets, EGU General Assembly 2026, Vienna, Austria, 3–8 May 2026, EGU26-15276, https://doi.org/10.5194/egusphere-egu26-15276, 2026.

The Guangdong-Hong Kong-Macao Greater Bay Area (GBA), particularly Hong Kong, faces severe challenges regarding ozone (O3) pollution. As volatile organic compounds (VOCs) are primary precursors driving near-surface O3 formation, accurately assessing their contribution is essential for developing effective synergistic control strategies. In this study, high-resolution online observations of O3-sensitive VOCs were conducted at a coastal site in Hong Kong using Proton-Transfer-Reaction Mass Spectrometry (PTR-MS). We investigated emission characteristics, photochemical transformations, and the evolution of VOCs during regional transport.

Results indicate that Oxygenated VOCs (OVOCs) consistently exhibited higher concentrations during daytime. Methanol was the most abundant species (average 3.73 ppb), while concentrations of isoprene and methyl ethyl ketone (MEK) exceeded levels previously reported in coastal regions. Crucially, the Empirical Kinetic Modeling Approach (EKMA) confirmed a nonlinear relationship between O3, nitrogen oxides (NOX), and VOCs. The photochemical regime shifted from VOC-limited in the morning to a transition regime in the afternoon. Notably, by accounting for chemical loss, the calculated Photochemical Initial Concentration (PIC-VOC) was found to be 8.2 ppb higher than the observed concentration (OBS-VOC). This discrepancy highlights that neglecting photochemical consumption significantly leads to an underestimation of the local Ozone Formation Potential (OFP).

Source apportionment via Positive Matrix Factorization (PMF) revealed that the site was significantly influenced by urban plumes transported from the GBA (contributing 63.7%) and oceanic emissions (13.5%). During three identified high-O3 episodes (with a maximum peak of 382.65 µg/m3), backward trajectory analysis attributed the pollution to long-range transport (52%), short-range transport (28%), and local sources (20%). These findings demonstrate that elevated ozone levels in Hong Kong result from the synergistic effects of local photochemical production and regional pollutant transport, providing a critical scientific basis for refining regional air quality assessments.

How to cite: Tan, Y.: Synergistic Effects of Local Photochemistry and Regional Transport on Ozone Formation in Hong Kong, EGU General Assembly 2026, Vienna, Austria, 3–8 May 2026, EGU26-15501, https://doi.org/10.5194/egusphere-egu26-15501, 2026.

Ethanol is an abundant volatile organic compound with important atmospheric chemical implications, both through its direct oxidation (as a major contributor to urban OH reactivity) and as a precursor of acetaldehyde and in turn peroxyacetyl nitrate (PAN), by which it contributes to long-range transport of NOx and increased tropospheric ozone production. It is emitted both by plants and from anthropogenic activity (including industry, solvent use, fuel, and agriculture), but is chronically underestimated in atmospheric chemistry models. Here, we seek to mitigate this underestimate in GEOS-Chem, a global chemical transport model, by incorporating novel sources of ethanol and constraining their emissions using field observations collected across the United States in various recent field campaigns. We correlate measured ethanol concentrations to those of tracers with known emission profiles (e.g. nonanal from cooking, D5 siloxane from personal care products, etc.) using multivariate regression analysis to apportion ethanol to each tracer's individual source. We show that urban summertime ethanol has different dominant sources in the major US cities sampled across field campaigns -- e.g., agriculture in Chicago, volatile chemical products (VCPs) in Los Angeles, cooking in Las Vegas and Salt Lake City, and traffic in New York. These ethanol sources are poorly represented in the current version of GEOS-Chem, in which biogenic emissions dominate the global ethanol budget and VCP and cooking sources are omitted entirely. Based on our source apportionment from field data, we add ethanol emissions from agriculture, traffic, VCPs, and cooking to GEOS-Chem, along with additional species from each source (including updated mechanisms for newly added cooking and VCP tracers), and perform new simulations to compare with the field datasets. Incorporating these emissions into GEOS-Chem eliminates the model ethanol bias in US cities and improves model performance in simulating formaldehyde and PAN, though it results in overestimations of acetaldehyde. Finally, we assess the importance of ethanol to global budgets of PAN, ozone, and OH, and we extend our hybrid field/modeling analysis to other oxygenated volatile organic compounds typically underestimated by models, including methanol, acrolein, and ethylene glycol, and make recommendations for inclusion of their emissions and chemistry in GEOS-Chem.

How to cite: Bates, K., Odai, R., and Amiri, N.: Constraining anthropogenic emissions and impacts of ethanol and other oxygenated VOCs: a combined modeling and field observational approach, EGU General Assembly 2026, Vienna, Austria, 3–8 May 2026, EGU26-16066, https://doi.org/10.5194/egusphere-egu26-16066, 2026.

EGU26-16128 | ECS | Orals | AS3.2

Gas-phase products from nitrate radical oxidation of five monoterpenes: insights from free-jet flow-tube experiments 

Jiangyi Zhang, Yi Zhang, Hannu Koskenvaara, Jian Zhao, and Mikael Ehn

Secondary organic aerosol (SOA) is ubiquitous in the atmosphere and has been widely studied due to its effects on both climate and human health. SOA formation is attributed to the gas-particle transfer of various oxidized products, especially highly oxygenated organic molecules (HOMs), which are formed through autoxidation following the reaction of volatile organic compounds (VOCs) with atmospheric oxidants. Monoterpenes (MTs) are among the most important biogenic VOCs. While their oxidation by ozone and hydroxyl radicals has been extensively studied, the role of nitrate radicals (NO3) remains less understood, despite it being a crucial nighttime oxidant with non-negligible daytime contributions.

This study utilized a newly built free-jet flow-tube system (at effective reaction time of 8.8 s) and an Eisele-type chemical ionization mass spectrometer (in amine and nitrate modes), to directly investigate the NO3-initated oxidation of five MTs: α-pinene (AP), Δ-3-carene, limonene, β-pinene (BP), and β-myrcene. We successfully observed a wide range of peroxy radicals and closed-shell products from all five MTs. Product closure was reasonably reached for AP, limonene, and myrcene (estimated to 50%–70%), but the incomplete closure for carene and BP (20%–40%) suggests substantial formation of one-oxygen-containing products that are undetectable by our methods. We found that among the three MTs with an endocyclic double bond, AP and limonene had the dominant product C10H16O2 with molar yields exceeding 50%, while carene produced much less C10H16O2. For carene, we instead observed considerably higher amounts of the peroxy radical C10H16NO8, suggesting that ring-opening processes favoring autoxidation are more common for this MT. For BP, the major species was C20H32N2O8, following a quadratic trend with increasing NO3, suggesting very fast dimer-forming bimolecular reactions of the primary peroxy radical C10H16NO5. The acyclic structure and three double bonds of myrcene make ring closures (forming C–O–O–C groups) more efficient than in other MTs, resulting in the highest HOM yield out of the studied MTs. The distinct HOM yields further emphasize highly structure-dependent oxidation pathways: 6.5% (myrcene), 6.1% (carene), 1.8% (BP), 1.1% (limonene), and 0.8% (AP). Though the HOM yield from reaction with NO3 can differ significantly from the ozonolysis HOM yield for a given MT, the overall HOM yields of NO3 oxidation are comparable in magnitude to ozonolysis, falling in the range of 0–10%. Overall, benefiting from the short reaction times and near-wall-free conditions of the flow-tube, this study provides comprehensive and quantitative distributions of NO3 oxidation products for the five common MTs, providing important knowledge of their fast (aut)oxidation pathways.

How to cite: Zhang, J., Zhang, Y., Koskenvaara, H., Zhao, J., and Ehn, M.: Gas-phase products from nitrate radical oxidation of five monoterpenes: insights from free-jet flow-tube experiments, EGU General Assembly 2026, Vienna, Austria, 3–8 May 2026, EGU26-16128, https://doi.org/10.5194/egusphere-egu26-16128, 2026.

Nitrophenols are important contributors to light absorption and toxicity in atmospheric aerosols, yet their sources and formation pathways remain poorly constrained. In this study, we investigate the occurrence and formation mechanisms of 2-nitrophenol (2-NP) in PM2.5 at an urban site in Mumbai, India, using ultra-high performance liquid chromatography mass spectrometry coupled with Orbitrap detector (UHPLC–MS-O). The mean concentration of 2-NP was 22.03 ± 13.45 ng m-3. Concurrent measurements of major water-soluble inorganic ions, organic and elemental carbon fractions, and water-soluble organic carbon (WSOC) were employed to examine sources and atmospheric processing. 2-NP exhibited strong positive correlations with WSOC (r = 0.92), K+ (r = 0.73), organic carbon (r = 0.62), and NO3- (r = 0.61), while negative correlations were observed with Cl-. Principal component analysis indicates that 2-NP is predominantly associated with secondary organic aerosol formation under nitrate-rich conditions, with additional influence from biomass-burning emissions. The co-variation of 2-NP with WSOC, carbon fractions, NH4+, and SO42- further suggests that photochemical aging and multiphase processing of phenolic precursors under elevated oxidant and NOx levels are key drivers of its formation in fine particles. Together, these results provide molecular-level evidence that NOx-driven secondary processing is a dominant pathway for ambient nitrophenol formation in a humid, polluted urban environment. Our findings show that controlling NOx emissions can directly suppress the formation of toxic, light-absorbing nitro-aromatic aerosols, offering a targeted strategy for improving air quality and climate-relevant aerosol properties. 

How to cite: Pakki, J. and Chakraborty, A.: Drivers of Ambient Nitrophenol Formation and evolution in fine particulates: Influence of NOx, pH, and Relative Humidity, EGU General Assembly 2026, Vienna, Austria, 3–8 May 2026, EGU26-16460, https://doi.org/10.5194/egusphere-egu26-16460, 2026.

EGU26-16805 | Posters on site | AS3.2

A High-Resolution Multi-Pressure Chemical Ionization Platform for Comprehensive Monitoring of Atmospheric Organics 

Hj Jost, Aleksei Shcherbinin, Henning Finkenzeller, Fariba Partovi, Netta Vinkvist, Jussi Kontro, Matthew Boyer, Joona Mikkilä, Siddharth Iyer, Jyri Mikkilä, Paxton Juuti, Nina Sarnela, Juha Kangasluoma, and Matti Rissanen

Comprehensive detection of atmospheric organic compounds remains a key analytical challenge, particularly for highly oxygenated organic molecules (HOMs), semi-volatile species, and amines. These compounds play central roles in secondary aerosol formation and atmospheric reactivity, yet are often underrepresented in long-term datasets due to limitations in sensitivity, resolution, or chemical coverage.

We present a high-resolution multi-pressure chemical ionization mass spectrometry (HR-MPCIMS) system, integrating novel ionization schemes with a high resolution accurate  mass analyzer (>120,000 resolving power). Ionization is carried out at both ambient and low pressures using interchangeable solid-state reagent sources (nitrate, urea, and fluoranthene), enabling detection of a wide range of organics without the need for pressurized gas cylinders or vapor delivery of toxic substances.

The system allows rapid switching between ion chemistries and has demonstrated stable performance in both laboratory oxidation experiments and ambient air campaigns. Observations include VOCs, OVOCs, peroxides, HOMs, and amines, with sensitivities reaching the ppqv range. Time series of ambient amines highlight its applicability to nitrogen-containing organics. During a three-month deployment at the CLOUD experiment at CERN, the instrument achieved >99.9% uptime.
These results demonstrate the potential of HR-MPCIMS for wide coverage, high-resolution monitoring of gas-phase organics in both laboratory and field settings.

How to cite: Jost, H., Shcherbinin, A., Finkenzeller, H., Partovi, F., Vinkvist, N., Kontro, J., Boyer, M., Mikkilä, J., Iyer, S., Mikkilä, J., Juuti, P., Sarnela, N., Kangasluoma, J., and Rissanen, M.: A High-Resolution Multi-Pressure Chemical Ionization Platform for Comprehensive Monitoring of Atmospheric Organics, EGU General Assembly 2026, Vienna, Austria, 3–8 May 2026, EGU26-16805, https://doi.org/10.5194/egusphere-egu26-16805, 2026.

EGU26-16972 | ECS | Posters on site | AS3.2

PFAS in Cloud Water 

Michaela Porkert, Thomas Riedelberger, Nico Scherzer, Christine Hochwartner, Felix Happenhofer, Martin Gregori, Christian Maier, and Anne Kasper-Giebl

Per- and polyfluoroalkyl substances (PFAS) are a diverse group of anthropogenic chemicals that have attracted increasing attention due to their environmental persistence, long-range transport potential, and adverse effects on ecosystems and human health. While PFAS have been extensively studied in surface waters, precipitation, and aerosols, their occurrence and behaviour in cloud water remain poorly investigated. Clouds play a critical role in atmospheric chemistry and pollutant distribution, making them a potentially important but underexplored compartment for PFAS cycling in the atmosphere.

This study includes two cloud water sampling campaigns conducted at the Sonnblick Observatory (3106 m a.s.l.) in the Austrian Alps, an ideal site for investigating the remote atmosphere. Active cloud water sampling was carried out in August 2024 and May 2025, resulting in a total of 130 samples, with sampling times from 15 min to 10 h. All samples were analysed for 20 PFAS as well as additional contaminants. The analysis of PFAS in cloud water is of particular interest, as previous studies on PFAS in the atmosphere have mainly been focused on aerosols, the gas phase, and precipitation. Analyses were performed by High Performance Liquid Chromatography Tandem Mass Spectrometry (HPLC-MS/MS).

A total of 20 PFAS were identified as target analytes, including 10 perfluorocarboxylic acids and 10 perfluorosulfonic acids, as also mentioned in the EU Drinking Water Directive (EU) 2020/2184. The most abundant compounds were PFBA and PFPeA, followed by PFHxA and PFBS. Total concentrations (Σ20 PFAS) ranged from the LOD to 10 ngL⁻¹ in May and from 0.13 to 34 ngL⁻¹ in August. Data will be evaluated regarding the seasonal differences, meteorological conditions and the overall composition of cloud water samples. Additional analytes comprised selected carbohydrates, inorganic ions, and organic acids. During the two sampling campaigns, meteorological conditions were recorded and are compared with the obtained data, i.e. warm and mixed-phase clouds and a mineral dust event showed as an episode at the end of the August campaign

How to cite: Porkert, M., Riedelberger, T., Scherzer, N., Hochwartner, C., Happenhofer, F., Gregori, M., Maier, C., and Kasper-Giebl, A.: PFAS in Cloud Water, EGU General Assembly 2026, Vienna, Austria, 3–8 May 2026, EGU26-16972, https://doi.org/10.5194/egusphere-egu26-16972, 2026.

Per- and polyfluoroalkyl substances (PFASs) are a large class of synthetic chemicals that are globally distributed due to extensive industrial use, exceptional chemical stability, and long-range atmospheric transport. Many PFASs have been linked to adverse toxicological effects, including developmental, immunological, and endocrine disruption, raising concerns regarding chronic human and environmental exposure. Despite increasing regulatory attention, substantial knowledge gaps remain regarding the atmospheric occurrence, composition, and source influences of both legacy and emerging PFASs, highlighting the need for continuous monitoring.

This study investigates the atmospheric occurrence, distribution, and source-related characteristics of PFASs in the urban environment of Seoul, Korea, by integrating targeted quantification with non-targeted screening. A total of 21 ambient air samples were collected between February and June 2024 on the rooftop of the Korea Institute of Science and Technology (KIST) and analyzed using high-resolution Orbitrap mass spectrometry. Thirty-two ionic and neutral PFASs were quantified, with total concentrations ranging from 17.0 to 348 pg m⁻³. Short-chain perfluoroalkyl carboxylates and sulfonates, including perfluorobutanoic acid (PFBA) and perfluorobutanesulfonic acid (PFBS), were identified as dominant contributors, consistent with the increasing use of short-chain alternatives.

Gas–particle partitioning of PFASs was dominated by temperature effects. Across the campaign, TSP-normalized log Kp values spanned several orders of magnitude, indicating large compound-to-compound differences in aerosol affinity. For most measured PFASs. For most measured PFASs, log Kp was positively correlated with 1/T, indicating that increasing air temperature shifted gas–particle partitioning toward the gas phase. This temperature dependence was most evident for short- to mid-chain PFCAs (perfluoroalkyl carboxylic acids) and for several PFSAs (perfluoroalkyl sulfonic acids) and precursor compounds. By contrast, longer-chain homologues exhibited weak or nonsignificant temperature dependence, consistent with stronger particulate association. Relative humidity showed no statistically significant influence for most compounds; notably, perfluoroethoxyethanesulfonic acid (PFEESA) was the sole species with a strong positive association with humidity, indicating increased particle-phase partitioning at higher humidity. These results highlight temperature as the key meteorological variable to consider when interpreting and modeling PFAS phase partitioning in urban air.

Non-target screening conducted using the FluoroMatch Modular workflow revealed 43 additional PFAS-like features with annotation confidence levels of D - or higher, indicating the presence of a diverse set of previously uncharacterized compounds. To evaluate potential source influences, air-mass back trajectories were clustered into five distinct groups and further examined using partial least-squares discriminant analysis (PLS-DA). Each cluster exhibited a characteristic PFAS profile, reflecting differences in transport pathways and regional influences. Air masses associated with transport over the Yellow Sea (Clusters 2 and 3) showed the highest numbers of unidentified PFAS features (5 and 34, respectively), suggesting enhanced regional contamination or complex source contributions. Selected formulas, including C₃HF₅O₃ (Cluster 2, B–) and C₇H₈F₆N₂O₂ (Cluster 3, D), were identified as indicative features based on cluster specificity and annotation confidence rather than definitive source markers.

Overall, this trajectory-informed analytical framework improves the understanding of PFAS behavior in urban air and demonstrates the value of combining targeted and non-targeted approaches for identifying emerging PFASs and assessing their potential source regions.

How to cite: Do, M.-N., Sardar, S. W., and Kim, J.-T.: Atmospheric PFAS Partitioning and Source Attribution Using a Trajectory-Informed Targeted and Non-Targeted Approach: Insights from Seoul, EGU General Assembly 2026, Vienna, Austria, 3–8 May 2026, EGU26-17005, https://doi.org/10.5194/egusphere-egu26-17005, 2026.

EGU26-17885 | Posters on site | AS3.2

NO increases direct aerosol precursor yields from aromatic carbonyl compounds 

Matti Rissanen, Shawon Barua, Avinash Kumar, Prasenjit Seal, Mojtaba Bezaatpour, Sakshi Jha, Nanna Myllys, and Siddharth Iyer

Ambient oxidation of volatile organic compounds (VOCs) is the route to condensable oxygenated molecules that form ambient secondary organic aerosol (SOA). It is generally accepted that NOx (=NO and NO2) considerably hinders, even prevents, the formation of highly condensable products, and thus cuts short the SOA production. However, in certain chemical systems the involvement of NOx, or rather NO, can increase the yield of condensable chemicals by converting relatively unreactive peroxy radicals (RO2) into much more reactive alkoxy radicals (RO) that contrary to previous reports can propagate the oxidation sequence through mechanistic bottlenecks. In select oxidation systems this leads to remarkably enhanced generation of highly condensable matter, an observation which carries an important message to polluted air chemistry.

In this work we studied three aromatic carbonyl oxidation systems benzaldehyde, acetophenone and phenylacetaldehyde by a joint experimental-computational approach. In the lab the reactions were studied in flow reactor setups under variable short reaction times and NOx additions, and the products were quantified utilizing nitrate ion based chemical ionization mass spectrometry. Computations and kinetic modelling were performed to strengthen the hypotheses originating from the experimental work. We find significant differences between the systems, with 2/3 studied aromatics showing much pronounced condensable product generation upon addition of NO, and the remaining 1/3 channeling the yield into a single nitro hydroxy product channel. Importantly the results show that even unrealistically large NO addition of 1 ppm does not shut down the highly efficient oxidation cascade but instead leads to several condensable products in higher yields than in absence of NO. This is in stark contrast to insights from the frequent monoterpene chamber oxidation experiments, in which practically invariably NO has been implied to severely hinder SOA generation.

How to cite: Rissanen, M., Barua, S., Kumar, A., Seal, P., Bezaatpour, M., Jha, S., Myllys, N., and Iyer, S.: NO increases direct aerosol precursor yields from aromatic carbonyl compounds, EGU General Assembly 2026, Vienna, Austria, 3–8 May 2026, EGU26-17885, https://doi.org/10.5194/egusphere-egu26-17885, 2026.

EGU26-18053 | ECS | Posters on site | AS3.2

Factor analysis of long-term NO3- chemical ionization mass spectrometer (CIMS) dataset from Tvärminne coastal station 

Valter Mickwitz, Roseline Thakur, Maija Peltola, Kurt Spence, Frans Graeffe, Yuanyuan Luo, Joanna Norkko, Alf Norkko, Markku Kulmala, and Mikael Ehn

Atmospheric trace gases is a very wide term, which involves tens to hundreds of thousands of distinct chemical compounds. Not only does this pose significant challenges when attempting to measure these compounds but inferring the interconnections between individual species from such data is a monumental task. This is especially true for analyzing ambient data from a chemical ionization mass spectrometer from an entire year. Often some factorization method is applied to reduce the dimensions that must be considered when analyzing either gas or particle phase data and especially PMF has become a very popular tool for source apportionment of atmospheric mass spectral datasets. However, the computations required for PMF take a significant amount of time, and running the factorization for a full year of data would require a lot of time and resources. Therefore, this work focuses on using the faster Non-Negative Matrix Factorization (NNMF) algorithm to accomplish what PMF does, but in a fraction of the time. Specifically, bin-NNMF, a method analogous to the one described by Zhang et al. (2019), was used in this work. The key distinction between PMF and NNMF is that NNMF does not accept an error matrix, denoting the uncertainty of each separate data point in the input matrix. To still account for uncertainties, the rows and columns of the input matrix were instead weighted. Using this approach, which allows for faster experimenting with factorization outcomes and can handle the whole dataset without issue, the NO3-CIMS data for the entire year of 2024 was analyzed.

While work is still ongoing to further investigate the dataset, the analysis so far shows that the instrument has operated stably during the studied time-period. Several sets of NNMF runs with different weighting schemes, and between one and twelve output factors have been conducted. This would be extremely time consuming, or even impossible, using the PMF algorithm. The output factors all seem useful for further interpretation of the data, with slight variations based on the chosen weighting scheme. In general, the factors present distinct temporal patterns, and the spectral chemistry seems to make sense. Looking at the factors in connection to wind direction, many factors also exhibit clear directionality, as one might expect from a successful factor analysis. Especially for a coastal site the directional separation may be crucial for further data interpretation. For example, factors corresponding to organics from land or sea respectively were identified along with factors for sulfuric acid, iodic acid, and methanesulfonic acid, mostly originating from the sea. Therefore, NNMF seems to offer a viable alternative to the commonly used PMF analysis and provides a powerful tool for understanding long term mass spectral data.

How to cite: Mickwitz, V., Thakur, R., Peltola, M., Spence, K., Graeffe, F., Luo, Y., Norkko, J., Norkko, A., Kulmala, M., and Ehn, M.: Factor analysis of long-term NO3- chemical ionization mass spectrometer (CIMS) dataset from Tvärminne coastal station, EGU General Assembly 2026, Vienna, Austria, 3–8 May 2026, EGU26-18053, https://doi.org/10.5194/egusphere-egu26-18053, 2026.

Seasonal variations of VOC emissions and concentrations in a mixed temperate forest consisting of beech and Douglas fir

X. Shi1, H. Li1, Y. Li1, M. Menon1, A. Orphal1, U. Ezenobi1, T. Leisner1, H. Saathoff1

1Institute of Meteorology and Climate Research, Karlsruhe Institute of Technology, 76344 Eggenstein-Leopoldshafen, Germany

Biogenic volatile organic compounds (BVOCs) play a dominating role in the formation of secondary pollution due to their large emissions and high reactivity (Carslaw et al., 2010, Emanuelsson et al., 2013). Secondary organic aerosol (SOA) generated from oxidation of monoterpenes results in the formation of oxygenated volatile organic compounds (OVOC) with a wide range of volatility. Highly oxygenated organic molecules (HOMs) are a subset of OVOCs, which play an important role in new particle formation and the growth of newly formed particles to cloud condensation nuclei (CCN). Although forest vegetation is known to be a significant source of BVOCs, the role of soil and especially seasonal variations remains uncertain due to limited observations (Vermeul et al., 2023).

Therefore, we studied VOC levels and emissions in a healthy mixed temperate forest consisting of beech and Douglas fir on the slopes of the upper Rhine valley (476 m a.s.l.) in southwest Germany at two different seasons. The study in autumn lasted from September 6th to October 16th, 2024 and the study in summer from July 5th to August 29th 2025. VOC emissions were observed with a time resolution of 1.5h in autumn and 3 h in summer at 10 different individual beech leaves or bundles of fir needles within the canopy. Furthermore, VOC concentrations were measured at different heights between ground level and 46 m, which is about 18 m above the canopy top. The VOC were measured by proton-transfer-reaction mass spectrometry (PTR-MS 4000, IONICON) including also a fast GC to separate individual monoterpenes.

The primary objective of this experiment is to understand VOC emission seasonal patterns depending on tree species and environmental parameters. For example, we will show diurnal cycles of monoterpene emission at different seasons and for different tree types and positions. Overall, the monoterpene emission rates from Douglas fir needles were higher than those from beech leaves in summer but not in autumn. The monoterpene emission rates of Douglas fir in summer were much higher than those in autumn but this wasn’t the case for the beech. This indicates that the monoterpene emissions of Douglas fir show a higher temperature dependence.

In this contribution we will discuss the influence of tree type and environmental parameters on VOC emissions at individual leaves and the resulting vertical gradients.

This work was supported by the China Scholarship Council.

Carslaw et al., Atmos. Chem. Phys.,10(4): 1701-1737, 2010

Emanuelsson et al., Atmos. Chem. Phys., 13(5): 2837-2855, 2013

Vermeuel et al., Atmos. Chem. Phys., 23, 4123–4148, 2023

How to cite: Shi, X. and Saathoff, H.: Seasonal variations of VOC emissions and concentrations in a mixed temperate forest consisting of beech and Douglas fir , EGU General Assembly 2026, Vienna, Austria, 3–8 May 2026, EGU26-18101, https://doi.org/10.5194/egusphere-egu26-18101, 2026.

EGU26-18268 | ECS | Orals | AS3.2

Observing atmospheric isoprene over Amazon from hyperspectral infrared sounders onboard China’s FengYun-3 satellites 

Mengya Sheng, Zhao-Cheng Zeng, Lu Shen, and Zichong Chen

Isoprene is the most abundant non-methane volatile organic compound (VOC) emitted by terrestrial vegetation. Owing to its high reactivity, isoprene is rapidly removed through oxidation by the hydroxyl radical (OH), thereby playing a key role in modulating atmospheric composition, including secondary organic aerosol formation, tropospheric ozone production, and the lifetime of methane. However, due to sparse in-situ measurements in remote tropical regions and the limited early-afternoon overpass (~13:30 local time) of the Cross-track Infrared Sounder (CrIS), the diurnal variability of isoprene emissions is still poorly constrained. Fengyun-3E (FY-3E) is the world’s first civilian meteorological satellite operating in a dawn-dusk orbit and is equipped with the second-generation Hyperspectral Infrared Atmospheric Sounder (HIRAS-II). It enables retrievals of isoprene by capturing isoprene spectral signal and provides unique late-afternoon (~17:30 local time) overpass data, complementing existing early-afternoon measurement capabilities. Using spectral data from FY-3E/HIRAS-II and CrIS, this study employed a full-physics retrieval algorithm based on the optimal estimation method to derive isoprene column abundances over Amazon from 2023 to 2025. The resulting isoprene retrievals exhibit consistent spatiotemporal patterns between HIRAS-II and CrIS observations, and are further validated against previous CrIS retrievals, in situ measurements, and GEOS-Chem model. Sensitivity tests using model simulations were conducted to evaluate the roles of emission and chemical processes in controlling isoprene variability. Our results provide the first direct satellite-based characterization of daytime isoprene variations, offering new insights into the biosphere-atmosphere interactions and their implications for atmospheric chemistry-climate coupling in the Amazon region. 

How to cite: Sheng, M., Zeng, Z.-C., Shen, L., and Chen, Z.: Observing atmospheric isoprene over Amazon from hyperspectral infrared sounders onboard China’s FengYun-3 satellites, EGU General Assembly 2026, Vienna, Austria, 3–8 May 2026, EGU26-18268, https://doi.org/10.5194/egusphere-egu26-18268, 2026.

EGU26-18548 | ECS | Orals | AS3.2

Impact of Prolonged Elevated CO2 on the Emission of Reactive BVOCs from Mature Forest. 

Lara Dunn, W. Joe Acton, Roberto Sommariva, Sophie Walker, William Bloss, and Julia H. Lehman

Terpenoids are volatile organic compounds (VOCs) with chemical structures of C5nH8n. Models estimate that the biosphere directly emits approximately 600 Tg terpenoids into atmosphere annually.1 Once released, these compounds undergo oxidation reactions with O3 and OH; leading to the formation of secondary organic aerosols (SOA), which can impact cloud formation and Earth’s albedo.2


Whilst observations show that modelled future increases in atmospheric CO2 will suppress isoprene (C5H8) emissions, the impact on the emission of larger terpenoids such as monoterpenes (C10H16) and sesquiterpenes (C15H24) vary between studies.3 Furthermore, not only do larger compounds (particularly sesquiterpenes), often go unidentified in forest VOC studies,4 these compounds also have limited measurements for their reaction rate coefficients with OH and O3, adding uncertainty to the impact of these emissions on atmospheric oxidative capacity.5


We present a study carried out at a forested  Free Air Carbon Dioxide Enrichment  (FACE) site at the Birmingham Institute for Forest Research. Here, mature 150-year-old Quercus robur (pedunculate oak) trees have been exposed to elevated CO2 treatment at 150 ppm above ambient for a prolonged 8 year period.  We deployed a Proton-Transfer-Reaction Mass-Spectrometer (PTR-MS) to quantify biogenic VOCs emitted under both ambient and elevated CO2 (410 ± 10 and 560 ± 20 ppm CO2 respectively). Measurements of ozone reactivity (kO3) were also carried out using the homebuilt Total Ozone Reactivity System (TORS).6 Our results show a decrease in the emission of C5H8 under elevated CO2, but an increase in the emission of larger, more reactive C15H24 compounds; which drive a doubling in the kO3 measured. This is in contrast to some model assumptions that elevated CO2 will decrease all reactive VOC emissions.

How to cite: Dunn, L., Acton, W. J., Sommariva, R., Walker, S., Bloss, W., and Lehman, J. H.: Impact of Prolonged Elevated CO2 on the Emission of Reactive BVOCs from Mature Forest., EGU General Assembly 2026, Vienna, Austria, 3–8 May 2026, EGU26-18548, https://doi.org/10.5194/egusphere-egu26-18548, 2026.

EGU26-18768 | ECS | Posters on site | AS3.2

OH-initiated oxidation reactions of nitroaromatics 

Anni Savolainen and Siddharth Iyer

Nitroaromatics are an incredibly toxic group of volatile compounds. They are both primary emissions from industrial sources [1] and biomass burning [2], as well as secondary emissions forming from the reactions between phenols and NOx. Due to their toxicity and presence in the atmosphere, it is important to know their atmospheric fate. Nitrogen containing compounds have also been found to be abundant in organic aerosol [3], and thus nitroaromatics likely play a role in aerosol formation.  However, no mechanistic studies have been conducted on its gas-phase reactions under atmospheric conditions.

Most aromatics react in the atmosphere with the hydroxyl radical (OH) creating an alkyl radical that reacts with molecular oxygen producing a peroxy radical. This peroxy radical then undergoes subsequent unimolecular isomerization reactions and O2 addition reactions in an autoxidation chain. Similar reactions have been shown to happen to a multitude of substituted aromatics, but not for nitro-substituted aromatics.

In this study, the reactions between the hydroxyl radical and three simple nitroaromatics (nitrobenzene, nitrophenol and nitrocatechol), as well as further possible reactions leading to termination and autoxidation are studied computationally. The three chosen compounds are among the simplest nitroaromatics and offer a range in both the toxicity of the reactant as well as atmospheric abundance. This study offers new insights into the atmospheric processes of nitroaromatics and elucidates their possible gaseous reaction mechanisms, which in turn gives insight on the effects of nitroaromatics in aerosol formation.

[1] Ahmed, M., Rappenglueck, B., Ganranoo, L., & Dasgupta, P. K. (2023). Source apportionment of gaseous Nitrophenols and their contribution to HONO formation in an urban area. Chemosphere, 338, 139499.

[2] Wang, H., Gao, Y., Wang, S., Wu, X., Liu, Y., Li, X., ... & Zhang, X. (2020). Atmospheric processing of nitrophenols and nitrocresols from biomass burning emissions. Journal of Geophysical Research: Atmospheres, 125(22), e2020JD033401.

[3] Wang, X., Hayeck, N., Brüggemann, M., Yao, L., Chen, H., Zhang, C., ... & Wang, L. (2017). Chemical characteristics of organic aerosols in Shanghai: A study by ultrahigh‐performance liquid chromatography coupled with Orbitrap mass spectrometry. Journal of Geophysical Research: Atmospheres, 122(21), 11-703.

How to cite: Savolainen, A. and Iyer, S.: OH-initiated oxidation reactions of nitroaromatics, EGU General Assembly 2026, Vienna, Austria, 3–8 May 2026, EGU26-18768, https://doi.org/10.5194/egusphere-egu26-18768, 2026.

EGU26-18796 | ECS | Posters on site | AS3.2

Multigenerational oxidation of benzyl alcohol in the atmosphere 

Anna Kervinen and Siddharth Iyer

Volatile organic compounds (VOC) have significant impact on air quality as they oxidize and form condensable vapors, which are important sources of secondary organic aerosol (SOA). As vehicle emissions are becoming increasingly regulated, other sources of VOC are increasing in relevance. One of these sources are volatile chemical compounds (VCPs), which include cleaning agents, personal care products, pesticides and adhesives (McDonald et al., 2018).  However, quantifying the SOA yields from VCP emissions is challenging as the atmospheric chemistry of many of the compounds is still unclear.

In this work, we use quantum chemical calculations to study the multigenerational atmospheric oxidation of benzyl alcohol, an aromatic hydrocarbon often found in VCPs. Its sources include cosmetics, inks and dyes, pharmaceuticals and flowers. The atmospheric oxidation of benzyl alcohol produces SOA in high yields (Charan et al. 2020), but the formation mechanisms are largely unknown. Fast intra-molecular reactions are needed for condensable vapor formation, but the double-ringed intermediates, bicyclic peroxy radicals (BPRs), in aromatic oxidation make these reactions slow. However, recently ipso-BPR, where the OH radical has added to a substituted carbon, have been shown to be unstable, leading to ring-open products that rapidly form condensable vapors through intra-molecular reactions (Iyer et al., 2023). Furthermore, geminal diol BPRs, where OH has added to an OH substituted carbon, have been shown to be highly unstable as well, leading to condensable vapors (Ojala et al., 2025).

Based on our calculations, the high SOA yield measured from benzyl alcohol oxidation is likely in part due to the ipso-BPR of benzyl alcohol and geminal diol BPR from hydroxybenzyl alcohol, which is a first-generation phenolic product of benzyl alcohol. The oxidation products phenol and catechol also likely to contribute to the total SOA yield. Our results provide key insights into the multigenerational atmospheric oxidation of benzyl alcohol, showing the potential pathways to condensable vapors.

References

Charan, S. M. et al. (2020) Secondary organic aerosol yields from the oxidation of benzyl alcohol. Atmospheric chemistry and physics. 20 (21), 13167–13190.

Iyer, S. et al. (2023) Molecular rearrangement of bicyclic peroxy radicals is a key route to aerosol from aromatics. Nature communications. 14 (1), 4984.

McDonald, B. C. et al. (2018) Volatile chemical products emerging as largest petrochemical source of urban organic emissions. Science. 359 (6377), 760–764.

Ojala, A. et al. (2025) Secondary organic aerosol formation from sequential oxidation of toluene and cresols. [Preprint] Available from: https://doi.org/10.21203/rs.3.rs-7621262/v1

How to cite: Kervinen, A. and Iyer, S.: Multigenerational oxidation of benzyl alcohol in the atmosphere, EGU General Assembly 2026, Vienna, Austria, 3–8 May 2026, EGU26-18796, https://doi.org/10.5194/egusphere-egu26-18796, 2026.

EGU26-18874 | ECS | Posters on site | AS3.2

Development of a sampling system for organic aerosols (OAs) and volatile organic compounds (VOCs) in the stratosphere 

David Wasserzier and Thorsten Hoffmann

Volatile organic compounds (VOCs) can be processed in the atmosphere through chemical reactions which generates organic aerosols (OAs). These aerosols have a direct influence on climate and public health. Therefore, understanding the chemical composition of OAs and VOCs is essential for the identification of transformations and the sources of these components. (Leppla et al. 2026; Xie and Laskin 2024)

To achieve a measurement regarding the chemical composition of the organic aerosol fraction as well as the semi volatile fraction, an adequate sampler is needed. A piston pump is used to generate sufficient airflow through a filter onto which the aerosols are deposited. The sampler is self-developed to ensure an ideal flow as well as adequate weight. Therefore, a 3D-printed sampler was developed which is ideally suited for our requirements. On a second airstream a thermal adsorption tube is used to sample the volatile organics. The requirements for the sampling system are low weight and high performance due to the desired application on a weather balloon as well as on a drone which requires both low weight and high performance due to shorter sampling periods and limited carrying capabilities. For a possible weather balloon application. The aim is also to employ a variety of sensors to automate the sampling procedure based on pressure, temperature and height of the balloon or drone.

First field tests were performed to evaluate the capability of the sampling methods. The filters were extracted and analysed using high-performance liquid chromatography coupled with high-resolution mass spectrometry (HPLC-HRMS). The adsorption tubes were analysed using a thermal desorption gas chromatography high resolution mass spectrometer (TD-GC-HRMS). The Orbitrap as a HRMS is used to detect and characterise a wide range of organic compounds using a non-targeted approach. This study aims to achieve a detailed chemical profile of the organic aerosols as well as semi volatile organic species present.

This poster aims to provide an overview of the development process of this novel, lightweight, high-performance sampler, which is suitable for weather balloon measurements to enable sampling under the different and harsh conditions in the stratosphere.

Literaturverzeichnis

Leppla, Denis; Hildmann, Stefanie; Zannoni, Nora; Kremper, Leslie A.; Holanda, Bruna A.; Williams, Jonathan et al. (2026): Comprehensive non-targeted molecular characterization of organic aerosols in the Amazon rainforest. In: Atmos. Chem. Phys. 26 (1), S. 365–390. DOI: 10.5194/acp-26-365-2026.

Xie, Qiaorong; Laskin, Alexander (2024): Molecular characterization of atmospheric organic aerosols: Contemporary applications of high-resolution mass spectrometry. In: TrAC Trends in Analytical Chemistry 181, S. 117986. DOI: 10.1016/j.trac.2024.117986.

How to cite: Wasserzier, D. and Hoffmann, T.: Development of a sampling system for organic aerosols (OAs) and volatile organic compounds (VOCs) in the stratosphere, EGU General Assembly 2026, Vienna, Austria, 3–8 May 2026, EGU26-18874, https://doi.org/10.5194/egusphere-egu26-18874, 2026.

EGU26-19598 | ECS | Posters on site | AS3.2

Improving the monoterpene oxidation scheme in a global-scale model through neural network-based bias correction 

Antti Vartiainen, Pontus Roldin, Muhammed Irfan, August Thomasson, Harri Kokkola, and Taina Yli-Juuti

Monoterpenes emitted by vegetation, among other biogenic volatile organic compounds (BVOC), can play an important role in the formation of secondary organic aerosol (SOA). In reactions with atmospheric oxidants, monoterpenes can form products that condense into SOA. As the emissions of monoterpenes are temperature-dependent, a climate feedback is formed where rising temperatures increase biogenic SOA formation, which then cools the climate through aerosol-radiation interactions.

The accurate representation of this feedback mechanism would be important when modeling future climate. This necessitates a model of the underlying monoterpene oxidation chemistry to account for the volatilities of the oxidation products in varying conditions. Such models have been developed in recent years, one of which is the chamber chemistry model ADCHAM. ADCHAM is extended by the Peroxy Radical Autoxidation Mechanism to include monoterpene oxidation pathways, particularly for α-pinene. For climate applications, ADCHAM remains too complex without heavy simplification.

Our study aims to produce a parametrization of ADCHAM capable of predicting the volatility distribution of α-pinene oxidation products in simulations of the global atmosphere. To this end, we have trained a neural network (NN) to model the error between the current parametrization in the SALSA aerosol model and the more accurate ADCHAM in various conditions. We represent these conditions by eight input variables, including temperature and oxidant concentrations. The training data was generated by sampling points from the atmospheric ranges of the input variables in global reanalysis and climate model datasets, a subset of which were reserved for testing. For each point, ADCHAM was run for 7.5 minutes, corresponding to the timestep of our targeted climate model. The resulting compounds were aggregated into three bins based on their volatilities, according to the volatility basis set (VBS) representation used in SALSA. The differences between the VBS bin production rates (1/cm3s) from SALSA and ADCHAM constitute the training targets of the NN. For comparison, a linear regression model was also fitted.

We have tested the NN and linear model on the holdout set and found both to be successful in correcting the VBS concentrations produced by SALSA to match those from ADCHAM. Without correction, the SALSA representation generally resulted in higher production rates of the VBS bins compared to ADCHAM, in some cases by more than ten orders of magnitude (RMSE=5.03, i.e., five orders of magnitude). While the linear model corrects the overestimation and improves the fit (RMSE=1.97), errors as large as five orders of magnitude remain. Using the NN, such errors are eliminated – the NN-augmented SALSA corresponds remarkably well to ADCHAM (RMSE=0.28; R2=0.995). Additionally, the NN improved the modeled dependences between input variables and VBS bin production. The results are encouraging, suggesting that the dependence of condensable vapor production on ambient conditions in global models could be represented by augmenting simplified VBS schemes already in use with NNs.  While our NN is relatively small, further pruning seems possible without significantly affecting its accuracy. Before implementing the correction scheme into a global model, we will evaluate its ability to reproduce SOA yields in chamber simulations.

How to cite: Vartiainen, A., Roldin, P., Irfan, M., Thomasson, A., Kokkola, H., and Yli-Juuti, T.: Improving the monoterpene oxidation scheme in a global-scale model through neural network-based bias correction, EGU General Assembly 2026, Vienna, Austria, 3–8 May 2026, EGU26-19598, https://doi.org/10.5194/egusphere-egu26-19598, 2026.

EGU26-20043 | Orals | AS3.2

Volatile organic compounds emitted from the brakes of heavy and light duty vehicles 

Sarah Steimer, Wandera Kisimbiri, Romain Couval, Karine Elihn, Sophie Haslett, and Ulf Olofsson

Contributions of non-exhaust sources to urban particulate matter (PM) pollution now often exceed those from vehicle exhaust in many high-income countries. Brake wear is one major source of such non-exhaust emissions. Particulate brake wear emissions have therefore come under increasing scrutiny, and are now for the first time being regulated within the EU through the recently established Euro 7 emission regulations. In contrast, there is only limited information regarding any potential gaseous emissions from the braking process. However, several recent studies indicate that these gaseous emissions should not be neglected.

In this study, we employed a proton transfer reaction time-of-flight mass spectrometer (PTR-MS) in combination with a chemical ionization mass spectrometer (CIMS) with iodide as the reagent ion to characterize the emission of volatile and semi-volatile organic compounds from brake wear. In total, four different brake materials were studied: two for heavy duty vehicles (bus and truck), and two for light duty vehicles. All brake wear emissions were generated in the laboratory using a pin-on-disc tribometer under different user case scenarios.

The PTR-MS results show that all four brake materials emitted a variety of organic compounds, including nitrogen- and sulphur-containing organics, oxygenated hydrocarbons, siloxanes as well as pure hydrocarbons. Out of these different groups, the oxygenated hydrocarbons contributed most to the overall concentrations. The emitted concentrations varied with the harshness of braking and type of brake pad. As expected, total emissions increased with increasing harshness of braking. As a novel result, we found that light duty brake pads emitted higher concentrations than heavy duty brake pads under the same braking conditions. Determination of emission ratios and evaluation of the CIMS data are currently ongoing.

How to cite: Steimer, S., Kisimbiri, W., Couval, R., Elihn, K., Haslett, S., and Olofsson, U.: Volatile organic compounds emitted from the brakes of heavy and light duty vehicles, EGU General Assembly 2026, Vienna, Austria, 3–8 May 2026, EGU26-20043, https://doi.org/10.5194/egusphere-egu26-20043, 2026.

EGU26-20268 | Orals | AS3.2

New insights into urban isoprene oxidation chemistry and impacts on air quality 

Jacqui Hamilton, Mike Newland, Sainan Wang, Ping Lui, Daniel Bryant, Thomas Bannan, Carl Percival, Freya Squires, Xinming Wang, Xiang Ding, and Andrew Rickard

Isoprene is the dominant non-methane volatile organic compound (VOC) emitted into the atmosphere globally. Within urban areas, there can be significant emissions of isoprene due to urban green spaces and planting, which can have important atmospheric chemistry impacts on ozone and secondary organic aerosol. The main loss route of isoprene is reaction with OH radicals, which leads to the formation of a hydroxyperoxy radical intermediate (ISOPO2). In clean or “low NO” environments, ISOPO2 predominantly reacts with HO2 radicals to form isoprene hydroxyhydroperoxides (ISOPOOH), which can be further oxidized by OH radicals to produce isoprene epoxydiols (IEPOX), accompanied by OH recycling. In more polluted “high NO” environments, ISOPO2 can react with NO to form MACR and MVK as the main reaction products and isoprene hydroxynitrates (IHN) with a yield of 0.04-0.15.


During a period of field observations during summer 2017 in Beijing, China, we observed in-situ formation of gas- and aerosol-phase oxidation products that are usually associated with low-NO “rainforest-like” atmospheric oxidation pathways. IEPOX and ISOPOOH concentrations measured by I-CIMS peaked during the afternoon, with an associated increase in particulate methyltetrol organosulfates via heterogenous reaction of IEPOX with sulfate aerosol. High levels of ozone scavenged NO, with concentrations decreasing to less than 1 ppb in the afternoon, and less than 0.1 ppb on some days. Box model simulations, using the Master Chemical Mechanism, suggest that during the morning high-NO chemistry predominates (95 %) but in the afternoon low-NO chemistry plays a greater role (30 %) in VOC oxidation in Beijing, with implications for the formation of highly oxidised molecules and SOA. Additional measurements in other urban areas (Manchester, Guangzhou) indicate that low-NO isoprene oxidation products are often observed in more polluted environments. 


In addition, we combined quantum calculations and box model simulations, to determine that the oxidation of isoprene hydroxynitrates (IHN) can be an alternative, NO-driven pathway leading to the formation of IEPOX in urban areas. Theoretical calculations indicated that the currently acknowledged yield of IEPOX from the IHN reaction with OH might be underestimated. The updated chemistry was incorporated into a box model using the full isoprene oxidation scheme from the MCMv3.3.1. For a steady state concentration of 1 ppb isoprene, the cross-over point at which the IEPOX production from IHN equals that from ISOPOOH, occurs at NO ~1 ppb using the IEPOX yields from this work (varies with [HO2]). The model was then constrained to the measurements from Beijing to demonstrate the relative contributions of the IHN and ISOPOOH pathways to IEPOX formation. We show that the oxidation of IHN contributed to more than 50 % of IEPOX formation in the morning and early afternoon.


Our observations show that classifying specific isoprene oxidation products in both gas and particle phase as tracers for the NO regime needs to be carefully considered. The results improve our understanding of the NOx dependence of isoprene oxidation chemistry in polluted areas, where anthropogenic emissions can significantly impact biogenic SOA formation.


How to cite: Hamilton, J., Newland, M., Wang, S., Lui, P., Bryant, D., Bannan, T., Percival, C., Squires, F., Wang, X., Ding, X., and Rickard, A.: New insights into urban isoprene oxidation chemistry and impacts on air quality, EGU General Assembly 2026, Vienna, Austria, 3–8 May 2026, EGU26-20268, https://doi.org/10.5194/egusphere-egu26-20268, 2026.

EGU26-20415 | ECS | Posters on site | AS3.2

Evaluation of Our Understanding of Organic Carbon Evolution: Insights from Intensive Observations and Explicit Chemical Modelling 

Sindhu Sreenivas, Marie Camredon, Matthias Beekmann, Sébastien Dusanter, Guillaume Siour, Richard Valorso, Bernard Aumont, and the ACROSS Scientific Team

Organic compounds are key components to tropospheric reactivity, secondary pollutant formation, and air-climate interactions. Yet their sources and transformation pathways remain incompletely constrained, especially under warm, stagnant conditions such as polluted summers.  In this work, a regional dataset over (Western) Europe combining background, urban, suburban, and forest locations is used to characterize the variability of organic and inorganic species during summer 2022, a hot dry summer which is considered as a proxy of future climate over Western Europe. A large number of datasets from 2 major campaigns Atmospheric ChemistRy Of the Suburban forest (ACROSS) and European Monitoring and Evaluation Programme (EMEP) Intensive Measurement Campaign (EIMP) have been utilized for this work. ACROSS (13 June - 25 July 2022) is a comprehensive, multi-platform field measurement campaign mainly focused on the understanding of the interactions of urban air and biogenic organic compounds (Cantrell and Michoud, 2022). EIMP campaign for VOC was carried out linked to a European heat wave during 12- 19 July 2022 involving 27 European Sites (EMEP sites) (Solberg et al., 2024). A large suite of offline and online sampling methods have been incorporated during these two campaigns, yielding more than 100 different compounds. To interpret these observations, a set of zero-dimensional simulations was created and a highly detailed gas-phase chemical mechanism generated with the GECKO-A tool. A set of primary organic compounds including around 200 anthropogenic and 150 biogenic species have been input into GECKO-A. Then GECKO-A generates the explicit mechanism of about 2.5 millions of secondary organic species from the experimental kinetic laboratory data and structure activity relationships. The generated mechanism and the inorganic mechanism together goes as a input into the box model with the meteorological parameters, boundary conditions and emissions to represent daily mean scenarios of the species during the ACROSS and EIMP campaigns. Thus, the box model framework allows exploration of emission speciation from anthropogenic and biogenic sources and their major oxidation pathways at the molecular scale. Comparisons between explicit simulations and observations are used to identify systematic discrepancies in daily profiles and magnitudes of more than 100 organic and inorganic species concentrations. The results indicate differences between observed and modelled behavior of organic carbon and associated secondary pollutants. These results will be interpreted in order to improve emission representations and chemical schemes.  


Keywords: Organic Compounds, ACROSS campaign, EIMP campaign, GECKO-A tool, explicit modeling


References:

Cantrell, C., Michoud, V., 2022. An Experiment to Study Atmospheric Oxidation Chemistry and Physics of Mixed Anthropogenic–Biogenic Air Masses in the Greater Paris Area. Bull. Am. Meteorol. Soc. 103, 599–603. https://doi.org/10.1175/BAMS-D-21-0115.1

Sverre Solberg, Anja Claude, Stefan Reimann. EMEP_CCC Report_4_2024_VOC_measurements_2022.pdf. https://emep-ccc.nilu.no/static/reports/EMEP_CCC

How to cite: Sreenivas, S., Camredon, M., Beekmann, M., Dusanter, S., Siour, G., Valorso, R., Aumont, B., and Scientific Team, T. A.: Evaluation of Our Understanding of Organic Carbon Evolution: Insights from Intensive Observations and Explicit Chemical Modelling, EGU General Assembly 2026, Vienna, Austria, 3–8 May 2026, EGU26-20415, https://doi.org/10.5194/egusphere-egu26-20415, 2026.

EGU26-20530 | Orals | AS3.2

Multischeme Chemical Ionization Orbitrap Mass Spectrometry for Comprehensive Pesticide Detection 

Fariba Partovi, Joona Mikkilä, Siddharth Iyer, Jussi Kontro, Suvi Ojanperä, Aleksei Shcherbinin, Netta Vinkvist, and Matti Rissanen

The detection and screening of pesticide residues remain analytically challenging due to the wide chemical diversity of active substances and their occurrence in complex matrices. This study evaluates the performance of an ambient-pressure Multischeme Chemical Ionization inlet (MION) coupled to high-resolution Orbitrap mass spectrometry for comprehensive pesticide detection. The MION inlet enables rapid switching between multiple reagent ion chemistries and polarities, allowing complementary ionization pathways to be exploited within a single analytical platform.

Pesticide detection was investigated using four ionization schemes: bromide (Br⁻) and superoxide (O₂⁻) in negative polarity, and hydronium (H₃O⁺) and protonated acetone (C₃H₆OH⁺) in positive polarity. Measurements were performed using a thermal desorption unit coupled to the MION inlet (TD-MION-MS), enabling direct analysis of liquid samples without chromatographic separation. A total of 651 pesticide standards were analyzed across a range of concentrations, along with ten real fruit and vegetable extracts, and results were compared to validated reference methods.

The results demonstrate reagent-dependent selectivity, with individual ionization schemes detecting distinct subsets of pesticides. No single reagent ion could detect all compounds; however, combining results from multiple ionization schemes substantially increased detection coverage. At a concentration of 100 ng/mL, 447 pesticides were detected, while 218 and 136 compounds were detected at 20 ng/mL and 10 ng/mL, respectively. Protonated acetone ionization yielded the highest overall number of detections, while bromide ionization provided robust detection for compounds forming stable adducts. Measurements of fruit extracts showed detection performance comparable to conventional GC-MS/MS and LC-MS/MS methods.

Overall, this study highlights the versatility and effectiveness of multischeme chemical ionization combined with high-resolution mass spectrometry for rapid pesticide screening. The ability to seamlessly switch between reagent ions and polarities enables broader chemical coverage than single-ionization approaches, demonstrating the potential of the MION-Orbitrap methodology for comprehensive pesticide analysis in food and environmental applications. In the subsequent study, the TD-MION inlet was coupled to a high-resolution Orbitrap Exploris 120 mass spectrometer, representing an advancement compared to the LTQ Velos Pro used in earlier work. A systematic comparison of three reagent ion schemes, bromide (Br⁻), uronium ([(NH₂)₂COH]H⁺), and nitrate (NO₃⁻), was performed using X-ray ionization. The performance of these schemes was evaluated using five individual pesticides and comprehensive pesticide solutions comprising 651 compounds from the previous study. The expanded instrumental capability and additional ionization modes enabled a broader assessment of reagent-dependent pesticide detection.

How to cite: Partovi, F., Mikkilä, J., Iyer, S., Kontro, J., Ojanperä, S., Shcherbinin, A., Vinkvist, N., and Rissanen, M.: Multischeme Chemical Ionization Orbitrap Mass Spectrometry for Comprehensive Pesticide Detection, EGU General Assembly 2026, Vienna, Austria, 3–8 May 2026, EGU26-20530, https://doi.org/10.5194/egusphere-egu26-20530, 2026.

EGU26-20561 | ECS | Posters on site | AS3.2

Sources and vertical distribution of VOCs and their oxidized products across rural, suburban and industrial environments in the Western Mediterranean 

Isabel Díez-Palet, Clara Jaén, Esther Marco, Barend L. Van Drooge, Pilar Fernández, and Joan O. Grimalt

Volatile organic compounds (VOCs) play a central role in atmospheric chemistry, yet their vertical distribution and transformation in the lower troposphere remain insufficiently characterized. VOCs originate from diverse natural and anthropogenic sources, and their accumulation, dispersion, and photo‑oxidation are strongly influenced by meteorological conditions and boundary‑layer dynamics. Some VOCs are carcinogenic (e.g., benzene) and others are neurotoxic (e.g., toluene). In addition to their toxicological relevance, many VOCs act as key precursors of tropospheric ozone and secondary organic aerosol (SOA).

For organic contaminants, the air above the daytime mixing layer and within the nocturnal residual layer remain poorly characterized. The photolysis of VOCs can release radicals that promote ozone formation aloft, while their photooxidation and transformation into lower-volatility products may contribute to SOA. The accumulation of these secondary pollutants in the nocturnal residual layer can increase its oxidative capacity, and once vertical mixing resumes, they may contribute to photochemical reactions and to the secondary pollutant burden at the surface. Beyond evaluating the oxidative state of air aloft, an important question is whether oxidized compounds result from local emissions undergoing rapid transformations.

This work investigated the origins, composition, and vertical distribution of VOCs and its oxidized products across rural, suburban, and industrial environments in the Western Mediterranean. Active offline sampling of VOCs and total suspended particles was conducted using multiple sorbent cartridges and quartz filters, followed by GC‑MS and HPLC analysis. To resolve vertical gradients, ground‑level observations were complemented with tethered‑balloon measurements reaching 350 meters above ground level, which allowed sampling both within the surface layer and above the nocturnal residual layer.

The results obtained from the vertical profiles showed a consistent decrease in VOC concentrations with altitude due to dilution and oxidation. Primary VOCs concentration declined by roughly 30% at balloon height, while secondary VOCs showed a smaller decrease, and even some carbonyl species exhibited nearly uniform vertical distributions. Air masses aloft were found consistently more oxidized than those near the surface, particularly in winter under strong stratification, and they contained higher levels of long‑lived VOCs and secondary products, including SOA. Diagnostic ratios, such as benzene to toluene or SOA tracers to isoprene and α-pinene, confirmed that aged compounds predominated at higher altitudes. Multivariate analysis showed that local photooxidation of freshly emitted compounds contributed substantially to this ageing and accounted for up to 41% of aged VOCs aloft.

Overall, these findings highlight the importance of incorporating vertical pollutant gradients and source apportionment analysis to better understand the origin of compounds accumulated in the residual layer and tackle their influence on surface photochemical pollution the following day.

How to cite: Díez-Palet, I., Jaén, C., Marco, E., Van Drooge, B. L., Fernández, P., and O. Grimalt, J.: Sources and vertical distribution of VOCs and their oxidized products across rural, suburban and industrial environments in the Western Mediterranean, EGU General Assembly 2026, Vienna, Austria, 3–8 May 2026, EGU26-20561, https://doi.org/10.5194/egusphere-egu26-20561, 2026.

EGU26-20587 | Posters on site | AS3.2

A versatile fast polarity switching CIMS platform for studies of atmospheric composition 

Vasyl Yatsyna, Urs Rohner, Priyanka Bansal, Matthieu Riva, Michael Kamrath, and Felipe Lopez-Hilfiker

Chemical ionization mass spectrometry (CIMS) is a powerful analytical technique for the detection of trace gases in the atmosphere. It is uniquely suited for measuring temporal variations of trace volatile organic compounds (VOCs) as well as atmospheric oxidation products including extremely low volatility organic compounds that play a key role in secondary organic aerosol formation.

By choosing an appropriate reagent ion, CIMS enables highly sensitive, online detection of a broad range of chemical species. However, the combination of multiple reagent ions within a single measurement can be technically challenging, especially when both positive and negative ion chemistries are required. Here, we present a versatile fast polarity switching CI-TOFMS platform featuring millisecond transition times between positive and negative ions. This capability enables quasi-simultaneous measurements of diverse molecular families, making the system uniquely suited for comprehensive studies of atmospheric composition. In particular, we present how our novel VUV driven PTR reactor featuring traditional positive ion chemistries such as H3O+ and O2+ can be combined with negative ion chemistries, for example iodide or bromide adducts on a single high resolution instrument platform. We present the characterization of the new system in terms of sensitivities, dynamic range, time response, humidity dependence, as well as reagent ion switching timescales. We also present the first results from test ambient measurements performed in Thun, Switzerland.

How to cite: Yatsyna, V., Rohner, U., Bansal, P., Riva, M., Kamrath, M., and Lopez-Hilfiker, F.: A versatile fast polarity switching CIMS platform for studies of atmospheric composition, EGU General Assembly 2026, Vienna, Austria, 3–8 May 2026, EGU26-20587, https://doi.org/10.5194/egusphere-egu26-20587, 2026.

EGU26-20809 | ECS | Posters on site | AS3.2

Cloud Water Chemistry at Sonnblick Observatory with a Focus on Organic Acids 

Thomas Riedelberger, Nico Scherzer, Christine Hochwartner, Michaela Porkert, Christian Maier, Matthias Schittmayer, and Anne Kasper-Giebl

Organic acids are, besides inorganic constituents, important components of cloud water samples. Typical analytes include monocarboxylic, dicarboxylic, tricarboxylic, and aromatic carboxylic acids. They are either scavenged from the gas and aerosol phase or formed within cloud droplets via chemical reactions in the aqueous phase. Concentrations in cloud water depend on meteorological conditions, air mass origin, and cloud properties, including cloud type and liquid water content. Organic acids influence cloud chemistry, facilitate cloud droplet formation, and increasingly contribute to the acidity of cloud water.

We present the results of two cloud water sampling campaigns conducted in August 2024 and May 2025 at Sonnblick Observatory (3106 m a.s.l.) in the Austrian Alps. The sampling campaigns were conducted within the framework of ACTRIS activities. Depending on the season, sampling comprised warm clouds as well as mixed-phase clouds, including periods coinciding with mineral dust events. Chemical analyses of organic acids were performed using ion chromatography with conductivity and mass spectrometry detection. Further analyses included inorganic ions, pH, conductivity, and selected carbohydrates.

One part of the evaluations focuses on methodological topics, such as the comparison of different analytical set-ups used for the analysis of organic acids. The advantage of mass spectrometry detection is demonstrated by the analysis of several coeluting substances that cannot be resolved by routine gradient ion chromatography. Additionally, the ion concentrations of organic acids observed during the two sampling campaigns are shown and discussed with respect to the overall chemical composition and meteorological conditions. Finally, the contribution of organic acids to the overall acidity of cloud water is discussed and evaluated in comparison with earlier measurements from the 1990s conducted at Sonnblick Observatory.

How to cite: Riedelberger, T., Scherzer, N., Hochwartner, C., Porkert, M., Maier, C., Schittmayer, M., and Kasper-Giebl, A.: Cloud Water Chemistry at Sonnblick Observatory with a Focus on Organic Acids, EGU General Assembly 2026, Vienna, Austria, 3–8 May 2026, EGU26-20809, https://doi.org/10.5194/egusphere-egu26-20809, 2026.

EGU26-21132 | ECS | Posters on site | AS3.2

Molecular-level oxidation mechanisms and secondary pollution impact of volatile chemical products (VCPs) 

Zihao Fu, Song Guo, and Michael Boy

Volatile organic compounds (VOCs) play a central role in atmospheric oxidation chemistry and the formation of secondary air pollution. Through complex oxidation processes, VOCs generate secondary products with reduced volatility and enhanced toxicity, contributing to secondary organic aerosol (SOA) formation and chemical health risks. In recent years, increasingly stringent regulations on fossil fuel combustion from transportation and industry have substantially altered the composition of anthropogenic VOC emissions in urban atmospheres across the European Union. As traditional sources decline, volatile chemical products (VCPs)—including personal care products, coatings, rubber materials, adhesives, and pesticides—have emerged as a dominant and rapidly growing source of urban VOC emissions.
Despite their importance, VCPs have long been underrepresented in emission inventories, leading to significant uncertainties in current air quality models and an incomplete understanding of their atmospheric oxidation chemistry. In particular, the oxidation mechanisms and kinetics of high-emission VCP species remain poorly constrained, limiting robust assessment of their contributions to secondary pollution and chemical risk.
In recent studies, we investigate the molecular-level oxidation chemistry and environmental impacts of representative high-emission VCPs relevant to urban environments, such as (A) volatile methyl siloxanes (Fu, Z., et al., Environ. Sci. Technol., 2020, 54, 7136-7145), (B) organophosphate esters (Fu, Z., et al., Environ. Sci. Technol., 2022, 56, 6944-6955), (C) linalool (Fu, Z., et al., Environ. Health, 2024, 2, 486-498), and (D) limonene (Fu, Z., et al., Environ. Sci. Technol., 2024, 58, 19762-19773). Focusing on compounds from personal care, coating, and rubber-related products, we combine quantum chemical calculations, detailed kinetic and chemical mechanism modeling, and environmental chamber experiments. This integrated approach aims to (1) elucidate previously unexplored autoxidation and radical-driven reaction pathways, (2) quantify the formation potential of SOA precursors, and (3) assess the yields of toxic secondary oxidation products.
The results will improve mechanistic understanding of VCP atmospheric oxidation, reduce uncertainties in SOA and toxicity predictions, and support the refinement of chemical transport models. Ultimately, these works contribute to improved air quality assessment and chemical risk evaluation, aligning with EU priorities on clean air, chemical safety, and sustainable innovation.

How to cite: Fu, Z., Guo, S., and Boy, M.: Molecular-level oxidation mechanisms and secondary pollution impact of volatile chemical products (VCPs), EGU General Assembly 2026, Vienna, Austria, 3–8 May 2026, EGU26-21132, https://doi.org/10.5194/egusphere-egu26-21132, 2026.

EGU26-21320 | ECS | Orals | AS3.2

Enhanced Aromatic HOM Production at Low Temperatures Accelerates Particle Growth 

Boxing Yang, Mao Xiao, Mingyi Wang, Bernhard Mentler, Mario Simon, Dominik Stolzenburg, Lubna Dada, Jasper Kirkby, Urs Baltensperger, Neil Donahue, Josef Dommen, and Imad El Haddad

Aromatic volatile organic compounds are major anthropogenic precursors driving new particle growth in urban atmospheres. However, the influence of temperature on aromatic oxidation pathways and product condensation remains poorly understood. While colder winter temperatures reduce product volatility, they are also associated with lower OH levels, potentially suppressing multi-generation oxidation that forms low-volatility species. Moreover, temperature-dependent changes in following reaction branching ratios remain largely unknown. Here, we present a series of controlled chamber experiments at the CERN CLOUD facility examining the temperature dependence of aromatic oxidation and its contribution to particle growth. A representative aromatic mixture—toluene, 1,2,4-trimethylbenzene (TMB), and naphthalene—was oxidized at 5 and 20 °C, under varying NO and OH levels to simulate urban boundary-layer conditions. We find that lower temperatures enhance multi-generation OH oxidation, increasing the yield of highly oxygenated organic molecules (HOM) by ~60%. At the same time, the branching ratio of organonitrate formation from aromatic RO2 + NO reactions rise at low temperatures, leading to a ~20% greater fraction of organonitrates among HOM. Despite organonitrate typically higher volatility, the overall particle growth rates increased due to enhanced HOM production and a decrease in products volatility. These results reconcile the elevated wintertime organonitrate fractions observed in urban and highlight the pivotal role of temperature in controlling multi-generation aromatic oxidation and particle growth under anthropogenic environments.

How to cite: Yang, B., Xiao, M., Wang, M., Mentler, B., Simon, M., Stolzenburg, D., Dada, L., Kirkby, J., Baltensperger, U., Donahue, N., Dommen, J., and El Haddad, I.: Enhanced Aromatic HOM Production at Low Temperatures Accelerates Particle Growth, EGU General Assembly 2026, Vienna, Austria, 3–8 May 2026, EGU26-21320, https://doi.org/10.5194/egusphere-egu26-21320, 2026.

EGU26-22491 | Orals | AS3.2 | Highlight

Exposure concentrations of PAHs in firefighters during wildland fires, and neurotoxic effects in brain cells models 

Barend Leendert van Drooge, Carmen Bedia, Ana Sevilla, Jordina Gili, and Mar Viana

Wildland fires, including both wildfires and prescribed burns, emit large quantities of smoke containing hazardous air pollutants such as polycyclic aromatic hydrocarbons (PAHs). Understanding PAHs concentrations in these smoke-filled environments is key to developing effective mitigation strategies to protect public health and safety. However, conventional measurement strategies are not always feasible in the highly dynamic and logistically complex settings of wildfire events. As a result, alternative approaches are needed, such as the use of silicone wristbands (SWBs) as passive air samplers. PAHs were analyzed in SWBs worn by fire fighters with different occupational tasks during wildland fires. After deployment, extraction, and GC-MS/MS analysis, PAH air concentrations were calculated using a compound-specific a kinetic uptake model. Personal exposure to PAHs was task-specific and in relation to the distance of fire smoke exposure. PAH air concentrations measured in SWBs were compared with those obtained from PM filter of personal Black Carbon samplers, and with results from brain cell exposure samples.


Reference:
Gili et al. Passive sampling of atmospheric polycyclic aromatic hydrocarbons by silicone wristbands during wildland fires. Atmospheric Environment 362 (2025) 121564

How to cite: van Drooge, B. L., Bedia, C., Sevilla, A., Gili, J., and Viana, M.: Exposure concentrations of PAHs in firefighters during wildland fires, and neurotoxic effects in brain cells models, EGU General Assembly 2026, Vienna, Austria, 3–8 May 2026, EGU26-22491, https://doi.org/10.5194/egusphere-egu26-22491, 2026.

EGU26-22903 | Orals | AS3.2

Impact of the chirality on the formation of organic condensable vapors and particle formation from monoterpenes oxidation 

Matthieu Riva, Linyu Gao, Sébastien Perrier, Siddharth Iyer, Laurent Vanoye, Fabienne Fache, Megan Claflin, and Theo Kurtén

The majority of atmospheric fine particulate matter (PM₂.₅) by mass is typically organic, predominantly composed of secondary organic aerosol (SOA). SOA forms through the gas-phase oxidation of volatile organic compounds (VOCs), followed by the gas-to-particle conversion of oxidized products. Among these precursors, biogenic VOCs (BVOCs), such as isoprene and monoterpenes, are the most abundant, particularly in regions with dense vegetation. For instance, in boreal forests, α-pinene significantly contributes to SOA formation, primarily through the generation of highly oxygenated molecules (HOMs). These low-volatility compounds play a critical role in atmospheric new particle formation. Chirality, a fundamental molecular property, holds profound implications across chemistry, biology, and environmental sciences. While enantiomers exhibit identical physical and chemical properties under most conditions, they can interact distinctly with biological systems—a phenomenon known as enantioselectivity. In atmospheric chemistry, chirality introduces an additional layer of complexity, influencing VOC emissions, oxidation pathways, and the formation and composition of SOA. Despite the ubiquity of chiral VOCs in the atmosphere, their role in aerosol formation and potential health impacts remains poorly understood. This gap is partly due to the analytical challenges of distinguishing enantiomers in both gas and particle phases. Most monoterpenes have been studied without considering the impact of their specific enantiomeric structures. However, certain sources, such as anthropogenic emissions (e.g., limonene) or drought-stressed vegetation (e.g., α-pinene), release specific enantiomers into the atmosphere. Consequently, the formation of SOA from the oxidation of (+)- and (–)-enantiomers has been largely overlooked in experimental studies and atmospheric models. In this study, we investigated the O₃/OH-initiated oxidation of two common chiral monoterpenes ((+)- and (–)-limonene and (+)- and (–)-α-pinene) using a flow tube reactor and an atmospheric simulation chamber. We characterized gaseous and particle-phase products using online chemical ionization mass spectrometry. Our findings reveal that the chirality of the precursors (+)- vs. (–)-enantiomers significantly influences HOM formation, particle formation, and subsequent SOA aging. Overall, this work highlights the distinct particle formation potentials arising from the oxidation of chiral monoterpenes, offering novel insights into the formation of biogenic SOA.

How to cite: Riva, M., Gao, L., Perrier, S., Iyer, S., Vanoye, L., Fache, F., Claflin, M., and Kurtén, T.: Impact of the chirality on the formation of organic condensable vapors and particle formation from monoterpenes oxidation, EGU General Assembly 2026, Vienna, Austria, 3–8 May 2026, EGU26-22903, https://doi.org/10.5194/egusphere-egu26-22903, 2026.

EGU26-937 | ECS | Posters on site | AS3.3

Insights into Aerosol Composition, Source Signatures, Chemical Aging, and Transport Dynamics in Delhi–NCR from High-Resolution In-Situ Observations 

Vasu Singh, Dilip Ganguly, Jaswant Rathore, Shahzad Gani, and Sagnik Dey

Keywords: Source Apportionment, SOA, Biomass Burning, PMF, Aerosol Composition, Haze

This study investigates seasonal evolution of aerosol physicochemical properties and source influences in the upwind region of Delhi-NCR using a suite of state-of-the-art instruments deployed at Sonipat, Haryana, India (28.9° N, 77.1° E). Continuous measurements of non-refractory PM₂.₅ using a Time-of-Flight Aerosol Chemical Speciation Monitor (ToF-ACSM) and black carbon (BC) using an Aethalometer (AE-31) were conducted during the peak stubble-burning and Diwali period (25 Oct 2023 to 15 Nov 2023), a time characterized by strong episodic pollution events and regional transport influence. The observational period captured three contrasting regimes: (i) an initial non-haze phase (mean PM₂.₅: 218±90 ug/m3), (ii) an intense haze episode linked to crop-residue burning and meteorological stagnation (haze1: 507±217 ug/m3), followed by a rain-driven dilution event (non-haze2: 166 ±70 ug/m3), and (iii) a a subsequent Diwali-driven haze event (haze2: 311±140 ug/m3). Across all conditions, non-refractory PM₂.₅ was dominated by organic aerosols (OA: 66.9%), with secondary inorganic species such as nitrate (NO3: 8.4%), sulfate (SO42:4.7%), ammonium (NH4+:6.6%), and chloride (Cl:2.3%), contributing modest fractions. Positive Matrix Factorization (PMF) and Multilinear Engine (ME-2) analysis resolved five distinct OA sources: traffic-related hydrocarbon-like OA (HOA), biomass-burning OA (BBOA), solid fuel combustion OA (SFC-OA), two oxygenated OA components, less oxidized OA (LOOA) and more oxidized OA (MOOA) comprising 37.8% of total OA, indicative of extensive aging during transport. Among primary sources, SFC-OA (23%) and BBOA (11.2%) were most enhanced during pollution episodes, consistent with emissions from wood burning and post-harvest crop-residue fires. Aethalometer-derived BC source apportionment showed a relative decline in fossil–fuel BC during both haze phases, highlighting the strong episodic influence of biomass-burning plumes. Meteorological analysis indicates that the extreme haze1 event was amplified by a pronounced reduction in boundary-layer height and aerosol–radiation feedback, which suppressed vertical mixing and reinforced pollutant accumulation. Aerosols during haze1 exhibited high oxidation states and enhanced aging, pointing to prolonged atmospheric processing and regional transport from source regions upwind of Delhi–NCR. These findings provide a process-level understanding of aerosol evolution during high-pollution periods, illustrating the combined roles of emission variability, atmospheric aging, and meteorological feedback in shaping air quality over the Indo-Gangetic Plain.

How to cite: Singh, V., Ganguly, D., Rathore, J., Gani, S., and Dey, S.: Insights into Aerosol Composition, Source Signatures, Chemical Aging, and Transport Dynamics in Delhi–NCR from High-Resolution In-Situ Observations, EGU General Assembly 2026, Vienna, Austria, 3–8 May 2026, EGU26-937, https://doi.org/10.5194/egusphere-egu26-937, 2026.

EGU26-971 | ECS | Posters on site | AS3.3

Near-source emission profiling of post-monsoon crop residue fires in N-W India 

Anjanay Pandey, Vikram Singh, Umer Ali, Mohd Faisal, Ajit Kumar, Vikas Goel, Yufang Hao, Suman Mor, Khaiwal Ravindra, Kaspar Daellenbach, Andre Prevot, and Mayank Kumar

Open biomass burning across different regions of the world is a major source of gaseous and fine-mode particulate species emitted into the atmosphere. Post-monsoon crop residue fires of North-West (N-W) India continues to have significant contribution to global burned area estimates (GloCAB product – Hall et al., 2024) and air quality impact in downwind urban cities of Indo-Gangetic Plain (IGP) including megacity Delhi. Yet, detailed in-situ observations of the fire smoke’s evolution and emission characteristics near the source are lacking and largely remain uncertain. We conducted STUB-BURN (Stubble Burning emissions study) measurements characterizing speciated fine particulate matter and related gaseous species via a mobile research platform in rural Punjab from 27 Oct to 18 Nov 2023. We observed rapid oxidation of OA with more than half dominated by oxygenated form of OA even in near-source field sampling conditions. By combining organics, metals, and black carbon (BC) in source apportionment technique, roughly ~ 50% is attributed to ongoing crop residue burning. Further, varying contribution of primary and aged OA factors were found in identified nine individual plume events. However, the dilution corrected enhancement ratio of OA w.r.t CO shows no net increase or decrease in mass enhancement with increasing O:C values as an indicator of ageing. Emission factors (EFs) of 17 species are calculated and their variability with global averages used in global fire emission estimates for this region are highlighted. Broadly, obtained EFs under open field scale combustion conditions for major species are up to three-fold lower than average estimates from widely used fire emission inventories. Overall, this study reinforces the need to account for fire characteristics that govern subsequent emissions to represent regional contributions more accurately within global emission estimates.

How to cite: Pandey, A., Singh, V., Ali, U., Faisal, M., Kumar, A., Goel, V., Hao, Y., Mor, S., Ravindra, K., Daellenbach, K., Prevot, A., and Kumar, M.: Near-source emission profiling of post-monsoon crop residue fires in N-W India, EGU General Assembly 2026, Vienna, Austria, 3–8 May 2026, EGU26-971, https://doi.org/10.5194/egusphere-egu26-971, 2026.

EGU26-1761 | Orals | AS3.3

Effect of per and polyfluoroalkyl substances (PFAS) molecular properties on aerosolisation and size resolved distributions 

Ivan Kourtchev, Steve Coupe, Jishnu Pandamkulangara Kizhakkethil, Elena Gatta, Dario Massabò, Paolo Prati, Virginia Vernocchi, and Federico Mazzei

Per and polyfluoroalkyl substances (PFAS), a class of toxic compounds often referred to as “forever chemicals”, are increasingly detected in the atmosphere. Aerosolisation from contaminated aqueous reservoirs has been proposed as a pathway for atmospheric PFAS, drawing analogy to sea-spray processes and supported by their elevated concentrations reported near sewage treatment facilities (Kizhakkethil et al., 2025). However, aerosolisation and particle formation in anthropogenically impacted waters differ fundamentally from marine systems, and the physico chemical controls governing PFAS aerosolisation outside the marine context remain poorly understood.

The aim of this work was to investigate the effect of PFAS molecular properties, including carbon chain length and functional groups, on aerosolisation from contaminated aqueous solutions. Experiments were conducted in the Chamber for Aerosol Modelling and Bio-aerosol Research (ChAMBRe), Italy. Twenty five PFAS, covering short, medium and long chain perfluoroalkyl carboxylic acids, perfluoroalkane sulfonates, fluorotelomer sulfonates and emerging alternatives representative of wastewater impacted environments were investigated. The role of bioaerosol seed particles commonly present in such environments was also assessed, as they could act as sinks or carriers for highly surface active PFAS and thereby influence their aerosol phase distribution.

Aerosol mass size distributions revealed a strong dependence on molecular structure, indicating compound-specific particle-phase behaviour. The presence of biological particles did not systematically alter PFAS size-resolved distributions, suggesting that the studied PFAS exhibited limited interaction with bioaerosols and remained predominantly in the submicron size range under the investigated conditions, which may favour their atmospheric persistence and long-range transport.

Overall, these findings indicate that primary aerosol formation from contaminated aqueous systems represents a chemically selective pathway for introducing PFAS into the organic aerosol, with size-resolved characteristics governed primarily by molecular properties and aerosol formation processes.

Reference: Kizhakkethil, J. P., Shi, Z., Bogush, A., and Kourtchev, I.: Measurement report: Per- and polyfluoroalkyl substances (PFAS) in particulate matter (PM10) from activated sludge aeration, Atmos. Chem. Phys., 25, 5947–5958, https://doi.org/10.5194/acp-25-5947-2025, 2025.

How to cite: Kourtchev, I., Coupe, S., Pandamkulangara Kizhakkethil, J., Gatta, E., Massabò, D., Prati, P., Vernocchi, V., and Mazzei, F.: Effect of per and polyfluoroalkyl substances (PFAS) molecular properties on aerosolisation and size resolved distributions, EGU General Assembly 2026, Vienna, Austria, 3–8 May 2026, EGU26-1761, https://doi.org/10.5194/egusphere-egu26-1761, 2026.

EGU26-2513 | Orals | AS3.3

Wintertime Molecular and Optical Properties of Carbonaceous Aerosols in a Semi-Arid Environment 

Ashish Gupta, Anuj Shrivastava, and Deepika Bhattu

Key-words: Carbonaceous aerosol, WSOC, Molecular-level characterization, radiative-forcing, Semi-arid region

Carbonaceous aerosols are a major component of atmospheric fine particulate matter and play a crucial role in climate forcing due to their light-absorbing properties. Their influence on wintertime radiative forcing is particularly pronounced, while the source-specific absorption and molecular properties remain poorly understood in semi-arid regions1. To address this knowledge gap, we conducted a 24-hr three-week PM2.5 winter campaign in a semi-arid urban region of northwestern India. We performed measurement of BC concentration using multi-wavelength AE-33, filter-based elemental carbon-organic carbon (EC–OC) analysis, water-soluble organic carbon (WSOC) quantification and brown carbon (BrC) optical characterization, and molecular characterization of isolated HULIS fractions (HULIS-A at pH=2 and HULIS-N at pH=7) using UHPLC-ESI-ToF-MS.

eBC remained consistently elevated, with most daily mean values above 15 µg/m3 and episodic peaks exceeding 26 µg/m3, indicating sustained wintertime loading. Fossil-fuel derived BC (BCff) dominated throughout the day, with early-morning (12.61 µg/m3) and evening (15.52 µg/m3) peaks, 2.84–15.52 µg/m3, while biomass-burning BC (BCbb) showed characteristic morning and late-evening enhancements of 8–11 µg/m3, consistent with residential biomass or wood burning in colder periods. Further, we observed WSOC/OC ratio of 0.75–0.80 with average WSOC levels of 35 µg/m3. A strong near-UV absorption, with SUV254 (MAC254 ≈ 5.0–5.2 m2/g) and MAC254 > 5 m2/g, along with a high AAE (4.04) confirmed the presence of strongly light-absorbing BrC from biomass-burning precursors and secondary processing2,3.

The molecular characterization of HULIS showed that CHO- and CHON-rich ions were present not only in the semi-volatile oxygenated organic aerosol (SVOOA) domain but also in regions associated with biomass-burning organic aerosol (BBOA). This indicates the simultaneous presence of both primary BB products and secondarily aged organics. HULIS-A exhibited stronger near-UV absorption, confirming its dominant contribution to wintertime chromophores. In DBE–NC space, HULIS-A displayed a much broader distribution compared to HULIS-N, extending into regions characteristic of unsaturated aromatics, phenolic and nitro-aromatic BrC precursors, and cata-PAH-like structures, all of which are known carriers of strong near-UV absorption.

Together, the optical measurements (MAC spectra, UV–Vis absorption) and high-resolution molecular analysis indicate that wintertime WSOC at this semi-arid site is strongly enriched in both primary BBOA-linked chromophores and secondary OOA-derived oxygenated species. Among these, HULIS-A emerges as the principal carrier of light-absorbing organic matter, driving enhanced shortwave absorption during winter.

References:

(1)        Laskin, A.; Laskin, J.; Nizkorodov, S. A. Chemistry of Atmospheric Brown Carbon. Chem. Rev. 2015, 115 (10), 4335–4382. https://doi.org/10.1021/cr5006167.

(2)        Weishaar, J. L.; Aiken, G. R.; Bergamaschi, B. A.; Fram, M. S.; Fujii, R.; Mopper, K. Evaluation of Specific Ultraviolet Absorbance as an Indicator of the Chemical Composition and Reactivity of Dissolved Organic Carbon. Environ. Sci. Technol. 2003, 37 (20), 4702–4708. https://doi.org/10.1021/es030360x.

(3)        Hecobian, A.; Zhang, X.; Zheng, M.; Frank, N.; Edgerton, E. S.; Weber, R. J. Water-Soluble Organic Aerosol Material and the Light-Absorption Characteristics of Aqueous Extracts Measured over the Southeastern United States. Atmospheric Chem. Phys. 2010, 10 (13), 5965–5977. https://doi.org/10.5194/acp-10-5965-2010.

How to cite: Gupta, A., Shrivastava, A., and Bhattu, D.: Wintertime Molecular and Optical Properties of Carbonaceous Aerosols in a Semi-Arid Environment, EGU General Assembly 2026, Vienna, Austria, 3–8 May 2026, EGU26-2513, https://doi.org/10.5194/egusphere-egu26-2513, 2026.

EGU26-3629 | ECS | Posters on site | AS3.3

Correlation analysis between precursor gases and fine particles in agricultural area 

Jeongdeok Baek, Sung-Hyun Bae, and HungSoo Joo

Understanding the interactions between PM2.5 and its gaseous precursors in agricultural environments is essential for designing effective air quality control strategies. In this study, long-term observations were carried out at eight agricultural monitoring sites across South Korea to investigate the relationships among PM2.5, its major precursor gases (NH3, NO2, and SO2), and meteorological factors. Both concentration-based metrics and loading-rate approaches, which incorporate wind-driven transport, were applied for comparative analysis. The concentration-based analysis yielded generally weak and unstable correlations, largely attributable to atmospheric dispersion and dilution effects. In contrast, loading rates exhibited consistently strong and statistically significant associations among PM2.5 and precursor gases (R ≥ 0.816, p < 0.001), indicating their enhanced capability to represent emission–transport interactions. Clear seasonal and diurnal variations were observed for all pollutants, with summer showing distinctly different daily patterns compared to other seasons. Notably, loading-rate maxima systematically lagged behind meteorological peaks by approximately two hours. Ammonia displayed an earlier and more pronounced diurnal signal than other precursors, primarily driven by temperature-dependent volatilization associated with soil–air temperature gradients. Principal component analysis revealed that PM2.5 loading rates were closely aligned with SO2 and NO2, whereas NH3 formed a separate structure, reflecting its different emission timing. Multiple linear regression further identified SO2 as the dominant contributor to PM2.5 formation, followed by NO2, while NH3 exhibited a negative relationship due to its temporal offset from PM2.5 peaks. Overall, this study demonstrates that loading-rate-based analysis provides a more robust framework for elucidating PM2.5–precursor interactions in agricultural regions and offers improved scientific support for developing targeted mitigation strategies.

Acknowledgments

"This research was supported by Particulate Matter Management Specialized Graduate Program through the Korea Environmental Industry & Technology Institute(KEITI) funded by the Ministry of Environment(MOE)"

How to cite: Baek, J., Bae, S.-H., and Joo, H.: Correlation analysis between precursor gases and fine particles in agricultural area, EGU General Assembly 2026, Vienna, Austria, 3–8 May 2026, EGU26-3629, https://doi.org/10.5194/egusphere-egu26-3629, 2026.

EGU26-3908 | Orals | AS3.3

Nitrate- and ammonium ion vs. dicarboxylic acid diffusivity in viscous organic aerosol particles: implications for gas-particle partitioning 

Ulrich Krieger, Liviana Klein, Beiping Luo, Merete Bilde, and Thomas Peter

Considerable progress has been made in recent years in our understanding of the diffusivity of various species in viscous  aqueous organic aerosol. However, little is known about ion diffusivity in such matrices. Here, we use experimental evaporation rates of volatile ammonium nitrate in a levitated, viscous proxy organic aerosol droplet to deduce the diffusivities of the nitrate and ammonium ions. We compare the ion diffusivities with those of semi-volatile maleic and malonic acid in the same proxy organic aerosol droplet. In addition, we measured viscosity of the proxies. Our finding indicates significantly slower diffusion of the ions compared to those of the organic acids, although the viscosity of the mixed solutions is comparable. Overall, the effective diffusivity of the ions seems to follow the Stokes-Einstein relationship, whereas the small organic acids diffuse faster than predicted. These findings have implications for the gas-particle portioning of ammonium nitrate which may be stronger limited by kinetic mass transfer than previously thought.

How to cite: Krieger, U., Klein, L., Luo, B., Bilde, M., and Peter, T.: Nitrate- and ammonium ion vs. dicarboxylic acid diffusivity in viscous organic aerosol particles: implications for gas-particle partitioning, EGU General Assembly 2026, Vienna, Austria, 3–8 May 2026, EGU26-3908, https://doi.org/10.5194/egusphere-egu26-3908, 2026.

EGU26-4155 | ECS | Orals | AS3.3

Molecular Composition and Formation Mechanism of Benzene SOA under Diurnal Oxidation Conditions 

Hao Luo, Hongru Shen, Rongrong Wu, Quanfu He, Sören R Zorn, Hendrik Fuchs, Thomas. F Mentel, and Defeng Zhao

Aromatic hydrocarbon secondary organic aerosols (SOAs) derived from anthropogenic sources are a typical class of secondary organic aerosols that significantly impact global climate and human health. The composition and physicochemical properties of atmospheric aerosols are notably influenced by varying oxidation conditions during the day and night. Currently, the molecular composition and formation mechanism of SOAs generated from benzene under diurnal oxidation conditions remain unclear. This study focuses on the molecular composition and chemical formation mechanism of secondary organic aerosols (SOAs) derived from benzene. We utilized the SAPHIR smog chamber to simulate diurnal oxidation experiments of benzene. The molecular composition evolution of benzene SOAs was characterized in real-time online using an Extractive Electrospray Ionization Chemical Ionization Mass Spectrometer (EESI-CIMS). We compared the differences in SOA composition under different oxidation conditions during the day and night, identified key characteristic products, and ultimately proposed relevant mechanisms for SOA formation. This research not only enhances our understanding of the chemical formation mechanisms of SOAs but also provides a scientific basis for air pollution control and climate change assessment.

How to cite: Luo, H., Shen, H., Wu, R., He, Q., Zorn, S. R., Fuchs, H., Mentel, T. F., and Zhao, D.: Molecular Composition and Formation Mechanism of Benzene SOA under Diurnal Oxidation Conditions, EGU General Assembly 2026, Vienna, Austria, 3–8 May 2026, EGU26-4155, https://doi.org/10.5194/egusphere-egu26-4155, 2026.

EGU26-5958 | Orals | AS3.3

New particle formation in the Amazonian atmosphere and the role of organic compounds 

Paulo Artaxo, Bruno Meller, Luciana Rizzo, Luiz Machado, Rafael Valiati, and Christopher Pöhlker

Tropical forests are essential ecosystems for the global aerosol population [1]. The mechanisms behind new particle formation (NPF) in the Amazon have long remained elusive, with traditional “banana” events being rarely observed. Recent studies show that forest emissions of volatile organic compounds (VOCs) that are subsequently oxidized produce particles that can serve as Cloud Condensation Nuclei (CCN), which are critical for the tropical hydrological cycle. Several studies showed that new particle formation can occur at high altitudes (12-14 Km) [2]. Nanoparticles are also produced by different mechanisms at the canopy level, following oxidation by VOCs and downdrafts [3]. Another study showed that Quiet New Particle Formation also occurs in Amazonia and can be responsible for a significant fraction of the aerosol population [4]. These studies show a wide diversity of processes that produce nanoparticles, which adds to the population of primary biological particle emissions [1]. Ground-based long-term measurements were conducted at the Amazon Tall Tower Experiment (ATTO), integrating over 10 years of wet-season size-distribution measurements. Intensive aircraft campaigns conducted during the CAFÉ-Brazil experiment have identified the mechanisms underlying high-altitude particle production. We have also studied the role that deep convection and strong precipitation events play in modulating the particle population at the forest canopy level.

Of particular interest is the strong interaction between the plant metabolism and the climate they control, since aerosol particles influence the radiation balance, carbon cycling, and precipitation patterns. These natural wet-season processes compete with the dry-season biomass burning emissions, which strongly alter the particle population.

In this presentation, we will discuss the complex picture of particle production and development in Amazonia. This study sheds light on a previously unknown process of nucleation and growth occurring frequently in the Amazonian BL, distinct from the known intense particle bursts and growth associated with downdrafts.

[1] P. Artaxo, et al. Tellus Series B 24.1 (2022): 24–163.

[2] J. Curtius et al., Nature, 636 (2024) 124–130.

[3] L. A. T. Machado, et al., Atmos. Chem. Phys., 21.23 (2021) 18065–18086.

[4] B. B. Meller, et al., EGUsphere, 2025-4581 (2025).

How to cite: Artaxo, P., Meller, B., Rizzo, L., Machado, L., Valiati, R., and Pöhlker, C.: New particle formation in the Amazonian atmosphere and the role of organic compounds, EGU General Assembly 2026, Vienna, Austria, 3–8 May 2026, EGU26-5958, https://doi.org/10.5194/egusphere-egu26-5958, 2026.

Isoprene (ISO) is a key atmospheric biogenic volatile organic compound (BVOC) due to its high emissions and reactivity. While OH radical-initiated oxidation is the main ISO degradation pathway, ISO ozonolysis is also a non-negligible pathway. Moreover, ISO ozonolysis produces OH radicals, further enhancing ISO oxidation under low actinic flux conditions. More importantly, the stabilized Criegee intermediate (sCIs) generated from the ozonolysis of ISO is an underappreciated yet crucial atmospheric oxidant. It can undergo oxidation reactions similar to those of OH radicals and produce low-volatility organic acids and other carbonyl compounds, which act as precursors to secondary organic aerosols (SOA). Recently, monomers of CIs have been detected in SOA from tropical rainforests, suggesting that CIs can directly participate in SOA formation through 1,2-insertion reactions. In this work, we developed a new technique based on atmospheric pressure interface chemical ionization mass spectrometry (CI-API-CIMS) to conduct in-situ measurements of sCIs after chemical derivatization. The CI-API-CIMS was field tested in summer 2025 at a forest site in Chengdu, China. VOCs and particulate organic matter were concurrently measured by a PTR-MS and an HR-ToF-AMS. Observations revealed that suspected sCIs fragments were highly correlated with gaseous sCIs and organic acids. These observations were consistent with our existing understanding of sCIs, providing supporting evidence for the mechanism by which sCIs directly participate in SOA formation. A 0-D box model was also developed to verify these findings.

How to cite: Zheng, J.: Field observations of isoprene ozonolysis contributing to SOA formation, EGU General Assembly 2026, Vienna, Austria, 3–8 May 2026, EGU26-6104, https://doi.org/10.5194/egusphere-egu26-6104, 2026.

Knowledge of the molecular characteristics of organic aerosols is essential for evaluating their atmospheric processes and associated environmental and health effects. However, little is known regarding the molecular characteristics of organic aerosols in coal resource-based cities. Herein, the molecular characteristics of water-soluble organic matter (WSOM) in wintertime PM2.5 during haze and heavy haze days in a typical coal resource-based city (Taiyuan, China) were analyzed using Fourier-transform ion cyclotron resonance mass spectrometry. A total of 5106 CcHhOoNnSs formulas were assigned, with m/z values predominantly concentrated in the range of 150–400 Da. The proportion of CHOS is higher than that in other cities, and a series of C7H6(CH2)0–8O5S formulas exhibited high intensities, most of which could be traced to coal combustion sources. The relative abundance of sulfur-containing organic molecules increased significantly on heavy haze days compared to haze days (30.4% vs. 25.0%) and was much higher than that observed in other cities. Additionally, CHO, CHON, and CHOS formulas consistently exhibited higher oxygen content on heavy haze days, likely due to atmospheric oxidation processes. Moreover, oxygen addition, methylation, and carboxylic acid reactions were identified as the primary possible pathways driving the transformation of primary organic aerosol into secondary organic aerosol under both haze and heavy haze conditions. Meanwhile, a total of 263 organophosphorus (OP) formulas were identified, which were predominantly distributed within the 180–550 Da range. 41.9% of assigned OP formulas contain −OPO3 or −RPO3 groups, and most OP formulas were oxidation-available with high environmental stability. Correlation analyses indicated that urban atmospheric OP may be emitted from biological sources. These results highlight the significant and distinct roles of both sulfur- and phosphorus-containing compounds in the complex atmospheric chemistry of coal resource-based urban environments.

How to cite: Guo, Z., Zhang, C., Liu, F., Zhang, G., Wang, J., and Bi, X.: Molecular characteristics of water-soluble organic aerosols in a coal resource-based city revealed by FT-ICR MS: a significant role of sulfur- and phosphorus-containing compounds, EGU General Assembly 2026, Vienna, Austria, 3–8 May 2026, EGU26-7888, https://doi.org/10.5194/egusphere-egu26-7888, 2026.

EGU26-9852 | Posters on site | AS3.3

Quantifying the influence of IVOC and SVOC on ambient SOA formation 

Markus Müller, Tobias Reinecke, Markus Leiminger, and Martin Graus

Intermediate and semivolatile organic compounds (IVOC and SVOC) play a pivotal role in atmospheric secondary organic aerosol (SOA) formation, contributing substantially to fine particulate matter that impacts air quality, climate, and human health. Anthropogenic IVOC, such as hydrocarbons from diesel vehicle emissions, undergo rapid oxidation to yield low-volatility products that partition into aerosols. Similarly, also biogenic IVOC and SVOC like sesquiterpenes emitted from plants enhance SOA yields in forested regions. Quantifying their contributions to SOA formation remains challenging due to detection limitations, underscoring the need for advanced analytical methods. 

To elucidate the atmospheric fate of IVOC and SVOC, we herein combine a dynamic volatility separation technique with a novel flow-reactor for rapid photochemical oxidation and two FUSION PTR-TOF instruments (IONICON Analytik, Austria) for characterizing gas-phase and condensed organic compounds.

The gas-phase volatility separation technique was recently introduced by Morris et al. (2024). This method utilizes the well studied absorption processes of low volatiles onto polymer tubing to separate volatility classes. Hence, via dynamic addition and removal of absorbing polymer tubing, a defined fraction of SVOC and IVOC can be efficiently removed from complex mixtures as present in ambient air. We further improved this method by using an actively cooled conductive PTFE inlet as a volatility separator. Hence, the volatility cutoff to organic precursors can be precisely adjusted by temperature without the need to switch between different types of polymer.

To study the SOA formation potential with and without IVOC and SVOC, this optimized volatility separator is periodically added prior to injection of ambient air into the novel IONICON Laminar-flow Oxidation reactor (ILOx) for rapid photochemical ageing. ILOx’s design allows for transmitting particles, IVOC and even SVOC with lowermost losses. All wetted surfaces are passivated, providing best response times, even for reduced volatility gas-phase organics. 

The ambient air pre and post ILOx is analyzed by two FUSION PTR-TOF, one equipped with a CHARON particle inlet, and a SMPS system (Grimm Aerosol Technik, Germany). For gas-phase measurements, the instruments cover the volatility range from VOC to SVOC and offer limits of detection in the range of 100 ppqV. With the CHARON particle inlet also condensed organics are detected on a molecular composition level at highest analytical precision and lowermost limits of detection (~20 pg/m³).

In this presentation we will highlight the capabilities of this new method with an example of a morning rush-hour event in Innsbruck, Austria. Hydrocarbons and aromatic hydrocarbons emitted by vehicles are significantly elevated. Most of these traffic related volatile organics can be classified as volatile and only approximately 13% can be attributed to IVOC and SVOC. Our method allows us to precisely quantify the contribution of this relatively small fraction to the potential SOA formation, revealing an overproportional impact on the SOA yield.

Morris et al.: Absorption of volatile organic compounds (VOCs) by polymer tubing: implications for indoor air and use as a simple gas-phase volatility separation technique, Atmos. Meas. Tech., 17, 1545–1559, https://doi.org/10.5194/amt-17-1545-2024, 2024.

How to cite: Müller, M., Reinecke, T., Leiminger, M., and Graus, M.: Quantifying the influence of IVOC and SVOC on ambient SOA formation, EGU General Assembly 2026, Vienna, Austria, 3–8 May 2026, EGU26-9852, https://doi.org/10.5194/egusphere-egu26-9852, 2026.

EGU26-10305 | ECS | Posters on site | AS3.3

Qualitative and quantitative analysis of terpene-derived esters in laboratory-generated and ambient secondary organic aerosol (SOA) 

Piotr Jaworucki, Agata Błaziak, and Michał Michalak

Oligomeric esters, including ”dimer esters” (molecular weight 300-450 Da), are one of the components of secondary organic aerosol (SOA) and account for around 0.5-1.5 % of ambient SOA mass. Esters are low-volatile (LVOCs) or extremely low-volatile organic compounds (ELVOCs), built from derivatives of terpenoic acids. They are primarily concentrated in the particle phase.[1, 2] Oxidation via ozonolysis of monoterpenes (C10H16) at night is known as the primary source of esters in the atmosphere.[3] Additionally, esters play a crucial role in Cloud Condensation Nuclei (CCN) and have a significant impact on particle formation and growth. On the other hand, many compounds are not fully characterised or unreported, and an accurate surrogate standard has yet to be proposed.

Our research is focused on ester formation via ozonolysis and OH*-oxidation of α- and β-pinene in laboratory and ambient SOA. The aim is to identify and describe dimer esters in both analysed environments, with an emphasis on previously unknown substances. Also, the C19H30O6 ester will be studied as a surrogate standard. Laboratory-derived and ambient aerosol samples were collected from the aerosol chamber at the Leibniz Institute for Tropospheric Research in Leipzig (TROPOS) and during field campaigns at two forest sites in Poland: Kampinos National Park and Borecka Forest. Water was used as the solvent for the extraction of the aerosol sample. All analyses were performed using an ultra-high-performance liquid chromatograph coupled with a mass spectrometer (UHPLC-MS), with an ElectroSpray Ionisation (ESI) source and Quadrupole Time-of-Flight (QToF) detector.

Overall, during qualitative analysis, 39 esters were identified in laboratory-derived aerosol samples. For all compounds, chemical formulas were matched or established. For some compounds, new structures were predicted. Despite the complex nature of environmental aerosol, quantitative analysis (performed on 15 substances) reveals traces of esters in ambient SOA, where ester C19H28O7 was the most abundant, with a concentration of approximately 0.5 ng×m-3. However, larger amounts of different esters were detected in laboratory-derived SOA. Experiments in a laboratory environment have shown that C16H30O11, C15H30O10 and C19H28O7 are the most common, with amounts reaching 0.7 µg×m-3. Concentrations were established by using a calibration curve based on C19H30O6, providing results that matched well with the expected ester quantities in the SOA.


References:

[1] K. Kristensen et al., Environ. Sci. Technol. Lett., 2016, 3, 280−285

[2] C.M. Kenseth et al., Environ. Sci. Technol., 202054, 12829−12839

[3] C.M. Kenseth et al., Science, 2023, 382, 787-792

How to cite: Jaworucki, P., Błaziak, A., and Michalak, M.: Qualitative and quantitative analysis of terpene-derived esters in laboratory-generated and ambient secondary organic aerosol (SOA), EGU General Assembly 2026, Vienna, Austria, 3–8 May 2026, EGU26-10305, https://doi.org/10.5194/egusphere-egu26-10305, 2026.

EGU26-10531 | Orals | AS3.3

Organic matter in dust-dominated aerosols over Namibia influenced by biomass burning and marine emissions 

Alexander Zherebker, Clarissa Baldo, Paola Formenti, and Chiara Giorio and the Aerofog team

The southern African region, particularly the Atlantic coast of Namibia, is an ideal natural laboratory influenced by contrasting aerosol sources that represent endmembers of aerosol formation processes, including aged marine aerosols, mineral dust resuspension, and long-range transported biomass-burning aerosols (BBA), with only moderate local anthropogenic influence. This setting enables direct linkage between aerosol chemical composition and optical properties under near-pristine conditions, thereby improving the representation and projection of aerosol–radiation and aerosol–cloud interactions and associated climate feedbacks in close proximity to the highly sensitive southeastern Atlantic stratocumulus deck, one of the major regulators of planetary albedo.

Although organic matter (OM) typically accounts for only a minor fraction of aerosol mass, it demonstrates a disproportional contribution to optical properties, hygroscopicity and cloud-formation, especially in a dust-dominated environment. Here, we present a comprehensive characterization of OM with respect to its sources, molecular composition, aging processes, and relationships with aerosol optical properties. Organic aerosol (OA) was extracted from daily particulate matter (PM10) samples collected during a month-long field campaign at Gobabeb, Namibia, and analyzed using high-resolution mass spectrometry (HRMS), complemented by inorganic ion analysis, organic and elemental carbon quantification, and multivariate statistical methods. These approaches were used to distinguish three dominant aerosol regimes: dust-dominated, BBA-influenced, and marine-dominated periods.

Organic molecules associated with BBA events exhibited elevated O/C ratios and double-bond equivalent (DBE) values, consistent with enhanced light absorption in the UV–visible range. These molecular features show strong correlations with bulk aerosol extinction and scattering coefficients, highlighting the optical relevance of OM despite its limited mass contribution. To better constrain the contribution of dust-derived OM, laboratory resuspension experiments were conducted using local soils. Comparison of OM extracted from parent soils and resuspended aerosols revealed substantial compositional differences, indicating selective transfer of specific organic components into the aerosol phase. This selectivity allowed identification of soil-derived OM fractions that systematically contribute to atmospheric aerosols and their optical properties.

Finally, we applied a novel formula-difference approach to the HRMS data to resolve aerosol aging processes across the different aerosol regimes. By comparing molecular transformation patterns, we explored period-specific aging pathways reflected in characteristic gains and losses of functional groups and molecular connectivity. These chemical fingerprints indicate periods with higher influence of oxidation, condensation and aromatisation of OM, which provides additional insights into the fate of organic matter in mixed aerosol systems and its role in modifying aerosol optical properties during atmospheric aging.

How to cite: Zherebker, A., Baldo, C., Formenti, P., and Giorio, C. and the Aerofog team: Organic matter in dust-dominated aerosols over Namibia influenced by biomass burning and marine emissions, EGU General Assembly 2026, Vienna, Austria, 3–8 May 2026, EGU26-10531, https://doi.org/10.5194/egusphere-egu26-10531, 2026.

EGU26-10572 | ECS | Posters on site | AS3.3

Quantifying functional group abundances of ultrafine aerosol particles with a NEMS-FTIR system for source attribution studies 

Bernadette Czermak, Niklas Luhmann, Johannes Hiesberger, Thomas Riedelberger, Anneliese Kasper-Giebl, Josiane Lafleur, and Dominik Stolzenburg

The high abundance of ultrafine particles (PM0.1) in the atmosphere not only implies significant interaction with the already critical climate system, but is also associated with severe health risks. The chemical composition of ultrafine particles is not only decisive for their specific health effects but also carries information on the dominant sources of these particles. However, chemical composition analysis techniques of sub-100 nm particles are currently either complex or high-cost, limiting their applicability to large-scale environmental source attribution.
Nanoelectromechanical sensors coupled to a Fourier transform infrared spectrometer, short NEMS-FTIR, is a promising tool for large-scale chemical characterization of ultrafine aerosol particles. It provides a high sensitivity down to few picograms of sample coupled with easy-to-use sampling directly onto the sensor, and subsequent high throughput analysis at a centralized facility equipped with the IR-spectrometer. 
However, a fundamental step towards the quantification of the chemical composition of ultrafine aerosol samples and related source attribution is the calibration of the sampling system with known functional-group abundance such that IR signals can be translated into quantitative chemical composition data. Here we show the characterization of NEMS for the usage in the sub-100 nm range, enabling the quantification of functional group abundances in ultrafine aerosol samples. 
Using particle number measurements in a simple transmission experiment we show that the size-dependent particle collection efficiency of the NEMS-chips is in the order of around 50% in the sub-100 nm range. The collected ultrafine mass on the filters is verified through ion chromatography and then used to obtain functional group-specific calibration coefficients translating infrared absorbance units into abundance of functional groups. We find detection limits e.g., well below 1 ng of collected ammonium sulfate. 
The knowledge of the resulting calibration curves of individual organic and inorganic compounds will enable chemical composition analysis, which we showcase here with selected ambient air measurements from two very different environments: Vienna, Austria and the highly-polluted station in Sonipat, India, close to New Delhi. The long-term goal focuses on the application of functional group analysis on a bigger amount of ambient air samples covering a broad temporal range, which ultimately enables source apportionment through Positive Matrix Factorization.

How to cite: Czermak, B., Luhmann, N., Hiesberger, J., Riedelberger, T., Kasper-Giebl, A., Lafleur, J., and Stolzenburg, D.: Quantifying functional group abundances of ultrafine aerosol particles with a NEMS-FTIR system for source attribution studies, EGU General Assembly 2026, Vienna, Austria, 3–8 May 2026, EGU26-10572, https://doi.org/10.5194/egusphere-egu26-10572, 2026.

EGU26-10635 | ECS | Posters on site | AS3.3

Simulating secondary organic aerosol formation in a global aerosol-climate model  

Christof Beer, Johannes Hendricks, Mattia Righi, Kenneth Carslaw, and Daniel Grosvenor

Secondary organic aerosols (SOA), produced via the oxidation of gaseous precursor compounds in the atmosphere, contribute a substantial fraction of atmospheric airborne particles and affect both air quality and climate. Global aerosol-climate models often suffer from very simplified representations of atmospheric SOA formation or missing formation pathways, typically leading to underestimated SOA particle numbers and mass contributions in comparison to observational data. Here, we use the aerosol microphysics submodel MADE3 as part of the global chemistry-climate model EMAC and implement an improved scheme for SOA formation. While MADE3 in its previous version did not account for new particle formation from organic precursors, we included the nucleation parametrization for SOA particles from monoterpene precursors described in Riccobono et al. (2014), which depends on the concentration of sulfuric acid and oxidized organic molecules. Additionally, we consider isoprene as biogenic SOA precursor for the condensation on pre-existing particles, which has been neglected in the previous model version. In addition to biogenic precursors, we also consider anthropogenic precursors for SOA formation, e.g. benzene, toluene, and xylenes from anthropogenic activities like the combustion of fossil fuels. Particle nucleation from these anthropogenic precursors is parametrized similarly to the Riccobono et al. (2014) scheme. We show the effect on particle numbers and SOA mass fractions when using the new SOA scheme and evaluate our simulation results against various observational data sets. When the nucleation parameterization for monoterpene precursors is activated, the total near-surface number concentrations can increase regionally by up to one order of magnitude. With the new SOA scheme, the underestimation of particle numbers and SOA mass fractions in the lower troposphere is reduced and results show an improved agreement with observations.


References:

Francesco Riccobono et al., Oxidation Products of Biogenic Emissions Contribute to Nucleation of Atmospheric Particles. Science 344, 717 721 (2014). DOI: 10.1126/science.1243527

How to cite: Beer, C., Hendricks, J., Righi, M., Carslaw, K., and Grosvenor, D.: Simulating secondary organic aerosol formation in a global aerosol-climate model , EGU General Assembly 2026, Vienna, Austria, 3–8 May 2026, EGU26-10635, https://doi.org/10.5194/egusphere-egu26-10635, 2026.

EGU26-11007 | ECS | Orals | AS3.3

Global budgets of atmospheric primary and secondary organic aerosols based on the simulation for full-volatility-range organic precursors 

Ruqian Miao, Ruochong Xu, Shan Huang, Sihan Xiao, Hao Wang, Yan Zheng, Siyi Liu, Jingxian Li, Guannan Geng, Manish Shrivastava, Imad El Haddad, Vlassis A. Karydis, Alexandra P. Tsimpidi, Qiang Zhang, and Qi Chen

Organic aerosol (OA) is a major component of tropospheric submicron aerosols, influencing air pollution, human health, and climate change. Primary and secondary OA (POA and SOA) exhibit distinct physicochemical properties that lead to different health and climate impacts. Current chemical transport models (CTMs), however, have difficulties not only in capturing OA concentrations, especially in polluted regions, but also in reproducing the fraction of POA and SOA. Here, we develop an OA simulation framework for full-volatility-range organic precursors, with a particular focus on improving OA formation from semivolatile and low-volatility organic compounds (S/LVOC) and intermediate-volatility organic compounds (IVOC), based on the atmospheric chemical transport model GEOS-Chem. Cooperating with a newly developed bottom-up global anthropogenic emission inventory, MEIC-global-FVOC, the improved OA scheme shows a good model performance when evaluated against a comprehensive dataset of worldwide measurements for OC, POA, and SOA, driven by increased POA formation from S/LVOC and SOA formation from IVOC. The model indicates that several populated regions in Asia, Africa, America, and Europe suffer from high OA exposure with annual mean over 5 μg m-3, highlighting the importance of controlling OA pollution. In East Asia, South Asia, the northern part of Africa, and Europe, anthropogenic SOA and POA are the largest two contributors to OA pollution, suggesting the need for reducing residential combustion that contributes over half of anthropogenic S/LVOC and IVOC emissions. For other regions, most of OA is from natural sources, which may be easily affected by extreme events (e.g., wildfires) and the warming climate. The estimated global OA burden in 2018 is 2.50 Tg, with a fraction of 75% from SOA. The SOA burden is higher than previous estimates, resulting from increased formation of S/LVOC and IVOC, highlighting that the role of SOA should be given more attention in assessing aerosol climate impact. The estimation of OA burden is sensitive to pyrogenic emission estimates and wet deposition parameterization, which need more constraints in future studies.

How to cite: Miao, R., Xu, R., Huang, S., Xiao, S., Wang, H., Zheng, Y., Liu, S., Li, J., Geng, G., Shrivastava, M., Haddad, I. E., Karydis, V. A., Tsimpidi, A. P., Zhang, Q., and Chen, Q.: Global budgets of atmospheric primary and secondary organic aerosols based on the simulation for full-volatility-range organic precursors, EGU General Assembly 2026, Vienna, Austria, 3–8 May 2026, EGU26-11007, https://doi.org/10.5194/egusphere-egu26-11007, 2026.

EGU26-11220 | ECS | Posters on site | AS3.3

Tracing Photochemical Aging in Biomass Burning Aerosols Using Stable Carbon Isotopes 

Durre Nayab Habib, Andrius Garbaras, Ulrike Dusek, Harro Meijer, and Agne Masalaite

Carbonaceous aerosols from biomass burning emissions are major contributors to atmospheric particulate matter and play a critical role in air quality, climate, and human health. Stable carbon isotopic composition (δ¹³C) provides a powerful tool for identifying emission sources and evaluating the influence of atmospheric processing on source signatures. This study applies δ¹³C analysis of three-step OC to assess the impact of photochemical aging on biomass burning aerosol isotopic characteristics.

Aerosol samples (PM1) from the combustion of twenty different biomass fuels were collected during the biomass burning experiment. Of the twenty biomass burning samples, six were selected for photochemical aging experiments based on their organic carbon mass, which exceeded the minimum detection and precision requirements for δ¹³C analysis across all three thermal OC fractions. Samples with lower carbon mass were excluded from aging to avoid increased analytical uncertainty associated with low signal-to-noise ratios. The isotopic composition of total carbon and organic carbon before and after aging experiment will be presented.

The isotopic composition of aerosol particles produced during uncontrolled combustion exhibit a broad distribution across biomass species. The average δ13CTC of PM1 of hardwood emissions is –26.9 ± 1.3 ‰and PM1 from softwood burning is –25.2 ± 0.1 ‰. The provided dataset also reveals distinct patterns in isotopic fractionation and carbon emissions across different biomass fuels under controlled combustion conditions. The observed fractionation factor ε (‰) varies significantly among different biomass burning species. The average fractionation factor for all biomass species is 0.0 ±1.0 ‰  The measured δ¹³Coc of aged samples indicates isotopic fractionation of organic carbon induced by photochemical aging. OH-aged samples showed no significant isotopic shifts relative to un-aged samples, although minor variations in total carbon mass were observed at higher temperature fractions, likely related to filter loading heterogeneity. In contrast, UV-aged samples exhibited systematic depletion in ¹³C across three temperature steps (200 °C, 350 °C, and 650 °C). The 350 °C fraction generally displayed the highest δ¹³C values among UV-aged samples, indicating distinct isotopic fractionation during photochemical processing. For example, δ¹³COC values for wood pellet emissions changed from −25.6 ‰, −25.7 ‰, and −25.4 ‰ in un-aged samples to −25.3 ‰, −25.1 ‰, and −25.0 ‰ after UV aging at 200 °C, 350 °C, and 650 °C, respectively.

Photochemical aging (particularly UV exposure) reveals systematic modifications to biomass burning isotopic signatures. These findings support the use of stable carbon isotopes for robust source apportionment of carbonaceous aerosols and for interpreting atmospheric observations influenced by photochemical aging.

How to cite: Habib, D. N., Garbaras, A., Dusek, U., Meijer, H., and Masalaite, A.: Tracing Photochemical Aging in Biomass Burning Aerosols Using Stable Carbon Isotopes, EGU General Assembly 2026, Vienna, Austria, 3–8 May 2026, EGU26-11220, https://doi.org/10.5194/egusphere-egu26-11220, 2026.

EGU26-11668 | Posters on site | AS3.3

Organic nitrates in upper tropospheric aerosol: Results from airborne measurements over the Amazon 

Johannes Schneider, Katharina Kaiser, Philipp Joppe, Antonia Hartmann, and Yafang Cheng

We conducted aircraft-based aerosol composition measurements in the upper troposphere (UT) over the Amazonian rainforest using the HALO research aircraft during the CAFE-Brazil (Chemistry of the Atmosphere – Field Experiment in Brazil) mission. In December 2022 and January 2023, a compact time-of-flight aerosol mass spectrometer (C-ToF-AMS; Schulz et al., 2018) was operated on 22 flights (including test and ferry flights) at altitudes up to 14 km. The measurements show that organic compounds dominate the aerosol composition in the tropical UT, with a significant contribution from organic nitrates. Organic nitrates can form during secondary organic aerosol (SOA) production via reactions of volatile organic carbon (VOC) precursors (e.g., isoprene) with OH and/or O3 in the presence of NOx. NOx is observed to be abundant in the tropical UT (NO up to 300 pptv; Nussbaumer et al., 2024) with a major source of frequent lightning activity in convective thunderstorms, and the low temperatures aloft appear to favor organic nitrate formation (Curtius et al., 2024).

To distinguish inorganic from organic particulate nitrate, we use the NO2+ (m/z 46) and NO+ (m/z 30) ion ratio in the C-ToF-AMS mass spectra, which has been shown to indicate the presence of organic nitrates (e.g., Day et al., 2022). Inorganic ammonium nitrate, used for calibration, exhibits a markedly higher NO2+/NO+ ratio than organic nitrates. Our data show that in the UT, as sampled here at altitudes above 10 km, nitrate is predominately present as ammonium nitrate in the extratropics (> 23° N), whereas in the tropics (< 23° N), nitrate occurs mainly as organic nitrate. The ferry flights between Germany and Brazil clearly capture this transition when entering and leaving the tropical region.

Organic nitrates have also been identified as a key component in new particle formation from isoprene in the UT over the Amazon (Curtius et al., 2024; Shen et al., 2024; Russell et al., 2025). As the C-ToF-AMS detects particles larger than about 50 nm, our observations indicate that organic nitrates are essential not only for new particle formation but also for the subsequent particle growth in the tropical UT. They therefore represent a major source of cloud condensation nuclei for the middle and lower troposphere in tropical regions.


Curtius, J., et al.: Isoprene nitrates drive new particle formation in Amazon’s upper troposphere, Nature, 636, 124-130, 2024.

Day, D. A., et al.: A systematic re-evaluation of methods for quantification of bulk particle-phase organic nitrates using real-time aerosol mass spectrometry, Atmos. Meas. Tech., 15, 459–483, 2022.

Nussbaumer, C., et al.: Ozone Formation Sensitivity to Precursors and Lightning in the Tropical Troposphere Based on Airborne Observations, J. Geophys. Res., 129, e2024JD041168, 2024.

Russell, D. M., et al.: Isoprene chemistry under upper-tropospheric conditions, Nature Comm., 16, 8555, 2025.

Schulz, C., et al.: Aircraft-based observations of isoprene-epoxydiol-derived secondary organic aerosol (IEPOX-SOA) in the tropical upper troposphere over the Amazon region, Atmos. Chem. Phys., 18, 14979-15001, 2018.

Shen, J., et al.: New particle formation from isoprene under upper-tropospheric conditions, Nature, 636, 115-123, 2024.

How to cite: Schneider, J., Kaiser, K., Joppe, P., Hartmann, A., and Cheng, Y.: Organic nitrates in upper tropospheric aerosol: Results from airborne measurements over the Amazon, EGU General Assembly 2026, Vienna, Austria, 3–8 May 2026, EGU26-11668, https://doi.org/10.5194/egusphere-egu26-11668, 2026.

EGU26-12105 | ECS | Posters on site | AS3.3

The role of primary and secondary brown carbon in carbonaceous aerosol absorption: a global modelling study 

Georgia Methymaki, Héctor Navarro-Barboza, Dene Bowdalo, Camille Mouchel-Vallon, Vincenzo Obiso, Marco Pandolfi, Hervé Petetin, Guofeng Shen, and Oriol Jorba

Brown carbon (BrC) remains one of the most uncertain components in the aerosol–radiation interactions due to the uncertainties in its different sources, secondary formation pathways, chemical aging, and optical properties. In this study, we investigate the global contribution of the different primary and secondary BrC sources to the aerosol absorption for the year 2018 with the Multiscale Online Nonhydrostatic AtmospheRe CHemistry (MONARCH) chemistry-transport model at global scale. All significant primary and secondary BrC formation pathways have been implemented in MONARCH. Primary BrC emissions include particulate organic aerosol from biomass burning (BB), biofuel (BF), fossil fuel (FF), and shipping (SH) sources. BB emissions are generated online following Liu et al. (2013) and Saleh et al. (2014), while BF, FF, and SH emissions are sourced from the Global Emission Modeling System (GEMS) inventory (https://gems.pku.edu.cn). Primary BrC undergoes photochemical bleaching through oxidation by OH radicals. Secondary BrC formation is represented through the oxidation of aromatic and terpene volatile organic compounds by OH and NO₃ radicals, allowing for both daytime and nighttime darkening processes, with yields dependent on simulated NOₓ conditions. Secondary BrC is further aged through ozonolysis and OH oxidation. For the BrC absorption aerosol optical depth (AAOD) calculation, the species-specific imaginary refractive indices are assigned to account for the differences in absorptivity. Model results are evaluated against the GHOST dataset, which provides harmonized global observations of aerosol optical properties derived from AERONET. Observed AAOD at 440 nm is partitioned into BrC and black carbon contributions following Bahadur et al. (2012). Our results confirm the dominant role of BB in BrC absorption near source regions, while highlighting the significance of secondary BrC formation in urban and polluted environments. The simulations also demonstrate the importance of the hygroscopicity in the BrC absorption calculations, emphasizing its relevance for accurately representing the aerosol radiative effects in modelling studies.

How to cite: Methymaki, G., Navarro-Barboza, H., Bowdalo, D., Mouchel-Vallon, C., Obiso, V., Pandolfi, M., Petetin, H., Shen, G., and Jorba, O.: The role of primary and secondary brown carbon in carbonaceous aerosol absorption: a global modelling study, EGU General Assembly 2026, Vienna, Austria, 3–8 May 2026, EGU26-12105, https://doi.org/10.5194/egusphere-egu26-12105, 2026.

EGU26-14197 | Orals | AS3.3

Improving global simulations of biomass-burning SOA through IVOC-focused sensitivity studies 

Susanne M.C. Scholz, Peeyush Khare, Georgios I. Gkatzelis, Qi Chen, Vlassis A. Karydis, and Alexandra P. Tsimpidi

Biomass burning is a major contributor to the global burden of secondary organic aerosol (SOA), with significant impacts on air quality, public health, and the Earth’s radiation balance. Observations from laboratory experiments and field campaigns increasingly show that intermediate-volatility organic compounds (IVOCs) emitted from wood combustion dominate SOA formation, potentially accounting for more than half of biomass-burning SOA (1,2). However, IVOC emissions and their atmospheric evolution remain highly uncertain and are often substantially underestimated in global chemistry–climate models, limiting our ability to accurately simulate organic aerosol distributions and trends. In this study, we quantify the sensitivity of biomass-burning SOA formation to key assumptions related to IVOC emissions, oxidation chemistry, and volatility distributions. We implement recent literature-based developments into ORACLE, the organic aerosol chemistry submodule of the EMAC global chemistry–climate model. ORACLE represents primary and secondary organic aerosol using a volatility basis set (VBS) framework, accounting for gas–particle partitioning, chemical aging through multigenerational oxidation, and changes in volatility and molecular mass during atmospheric processing (3). This framework enables a process-based evaluation of how uncertainties in emissions and chemistry propagate to global SOA burdens.

We perform a comprehensive suite of global sensitivity simulations for the period 2012–2016, corresponding to the most recent fully published GFED biomass-burning emission inventory and providing broad observational coverage for model evaluation. The sensitivity experiments address three major sources of uncertainty. First, we investigate alternative IVOC emission scaling approaches, including scaling IVOC emissions relative to emitted organic carbon (OC), as commonly assumed in global models (4), and scaling relative to volatile organic compound (VOC) emissions (5,2). These methods reflect differing assumptions about the relationship between IVOCs and primary combustion emissions and lead to substantially different global IVOC source strengths. Second, we assess uncertainties in SOA formation efficiency and chemical processing. This includes exploring reported ranges in aerosol mass yields under different NOx regimes (2), as recent experiments indicate that NOx strongly modulates SOA formation from biomass-burning IVOCs. In addition, we examine the sensitivity of modelled SOA to uncertainties in the OH reaction rate of IVOCs, which controls their atmospheric lifetime and spatial distribution. Third, we evaluate the influence of alternative volatility distribution of the IVOC oxidation products across VBS bins. Previous studies propose contrasting assumptions regarding whether the dominant SOA yield is associated with lower- or higher-volatility oxidation products (4,5), which leads to implications for SOA formation, transport, and lifetime.

By systematically disentangling the influence of IVOC emissions, chemical processing, and volatility assumptions, this work aims to identify parameterizations that are both physically representative of diverse biomass-burning conditions and computationally feasible for global applications. The results provide new constraints on biomass-burning SOA formation and support ongoing efforts to improve organic aerosol representation in global chemistry–climate models, thereby reducing long-standing discrepancies between simulated and observed SOA burdens.


References

(1) Bruns et al., 2016; doi: 10.1038/srep27881

(2) Li et al., 2024; doi: 10.1093/nsr/nwae014

(3) Tsimpidi et al., 2016; doi: 10.5194/acp-16-8939-2016

(4) Ciarelli et al., 2017; doi: 10.5194/gmd-10-2303-2017

(5) Tilmes et al., 2019; doi: 10.1029/2019MS001827

How to cite: Scholz, S. M. C., Khare, P., Gkatzelis, G. I., Chen, Q., Karydis, V. A., and Tsimpidi, A. P.: Improving global simulations of biomass-burning SOA through IVOC-focused sensitivity studies, EGU General Assembly 2026, Vienna, Austria, 3–8 May 2026, EGU26-14197, https://doi.org/10.5194/egusphere-egu26-14197, 2026.

EGU26-14377 | ECS | Orals | AS3.3

Volatile chemical products as potential emerging drivers of urban new particle formation 

Rulan Verma, Markus Tischberger, Melanie Ellmauer, Hinrich Grothe, and dominik stolzenburg

New particle formation (NPF) proceeds efficiently in polluted urban areas, where oxygenated organic compounds are crucial for early particle growth. Their contribution to NPF depends on volatility distribution, described by the volatility basis set (VBS). Urban volatile organic compound (VOC) emissions have shifted significantly due to regulations and changing consumer habits. Volatile chemical products (VCPs) from cleaning agents, personal care products, and coatings, now rival or exceed combustion sources as primary urban VOC emitters. Though many VCP constituents are secondary organic aerosol (SOA) precursors, their oxidation pathways and NPF contributions remain poorly understood. Recent research highlights that assessing NPF potential requires knowing the full volatility range, including moderately oxygenated molecules (MOMs).

We investigate the full oxidation chain of selected VCP emissions, from VOC precursors to MOMs to highly oxygenated molecules (HOMs) and resulting particle yields. Oxidation occurs in a newly developed flow reactor designed to minimize wall losses and enable steady-state conditions. We employ multi-pressure chemical ionization mass spectrometry with an ultra-high-resolution Orbitrap mass spectrometer. By switching between low-pressure (<1 mbar) ionization for VOC detection using the internal fluoranthene (C16H10) ion source and two different atmospheric-pressure ionization schemes for MOMs (uronium, CH5N2O+) and HOMs (nitrate, NO3-), we capture the VBS across the full volatility range. New particle yields are quantified using a scanning mobility particle sizer (SMPS) and their chemical composition is evaluated using nanoelectromechanical sensors with Fourier transformation infrared spectroscopy (NEMS-FTIR).

We access household cleaning products as potential VCPs emitters. Method performance and consistency are evaluated using limonene oxidation as a reference system for NPF-relevant oxidation chemistry. The obtained VBS distributions can be compared to limonene ozonolysis, under the assumption that charging efficiencies might be well-related to compound volatility. This comparison enables an estimation of the relative NPF potential of different VCP emitters. We find significant variety in the NPF potential among cleaning products of different suppliers. While lemon-scented products resemble limonene (a major ingredient of these products) spectra, we can clearly demonstrate that the complex mixtures present in the cleaning products can enhance the NPF potential of certain products. Altogether, our results demonstrate that multi-pressure chemical ionization provides a powerful approach to link molecular composition, volatility, and NPF potential for emerging urban organic sources. Beyond advancing mechanistic understanding of urban aerosol formation, this framework enables identification of key VOC precursors in e.g. source apportionment approaches. In addition, our first results from different cleaning products show that through product reformulation new opportunities arise to mitigate air quality impacts associated with VCP emissions.

How to cite: Verma, R., Tischberger, M., Ellmauer, M., Grothe, H., and stolzenburg, D.: Volatile chemical products as potential emerging drivers of urban new particle formation, EGU General Assembly 2026, Vienna, Austria, 3–8 May 2026, EGU26-14377, https://doi.org/10.5194/egusphere-egu26-14377, 2026.

EGU26-14388 | ECS | Posters on site | AS3.3

Advancing oxidation flow reactor technology: Simulating atmospheric oxidation with UVC LEDs 

Markus Tischberger, Rulan Verma, Emese Papp, Hinrich Grothe, and Dominik Stolzenburg

Oxidation flow reactors (OFRs) are widely used in atmospheric chemistry research to investigate the oxidation of volatile organic compounds (VOCs) and the formation of secondary organic aerosol (SOA). By generating highly oxidizing environments, OFRs enable simulation of hours to days of atmospheric photochemical aging within minutes of real time. Traditionally, oxidants are produced via ozone photolysis using low-pressure mercury discharge lamps. While effective, these lamps present several drawbacks, such as mercury-related environmental, health, and disposal concerns, inefficient, non-directional radiation, significant heat generation, and limited operational lifetime.

Here, we present a novel OFR design employing UVC light-emitting diodes (LEDs) as the photolysis source. Four modules, each equipped with 12 LEDs emitting at 265 nm (Violumas, VC12X1C48LC-265), are mounted around a quartz glass tube with a conical stainless steel inlet and outlet. The minimized radiative heat input from UVC LEDs enables a larger reactor design with an internal volume of 20.5 L (glass tube: length = 40 cm, diameter = 20 cm) by reducing buoyancy-driven convection. Thereby, laminar flow conditions with a typical residence time of ~ 4 minutes (adjustable via input flows) can be achieved, and wall interactions are minimized. Humidified air (RH = 30 %), ozone, and the sample of interest are introduced into the OFR, where ozone photolysis generates OH radicals, confirmed through toluene oxidation experiments. Particle size distributions and ozone concentrations are monitored at the outlet, where particles are also collected on filters. Transmission efficiency was characterized using PSL particles (100, 300, 460 nm) and two CPCs, showing > 80 % transmission, with UVC irradiation and heat generation having no measurable impact.

A movable core-sampling tube is coupled to a multi-scheme chemical ionization (MION2) Orbitrap mass spectrometer, enabling ultra-high-resolution measurements of oxygenated molecules. Experiments on α-pinene and limonene ozonolysis, as well as VOCs from cleaning products and bitumen, demonstrate the versatility of the setup for studying the simulated atmospheric oxidation and new particle formation (NPF) potential of these substances - critical for understanding urban emissions of growing relevance.

With higher efficiency, directional light output, superior thermal management, extended operational lifetime, and enhanced usability compared to conventional mercury lamps, UVC LEDs represent a significant advancement toward safer, more sustainable, and more controllable OFR technology for atmospheric chemistry applications.

How to cite: Tischberger, M., Verma, R., Papp, E., Grothe, H., and Stolzenburg, D.: Advancing oxidation flow reactor technology: Simulating atmospheric oxidation with UVC LEDs, EGU General Assembly 2026, Vienna, Austria, 3–8 May 2026, EGU26-14388, https://doi.org/10.5194/egusphere-egu26-14388, 2026.

EGU26-15338 | Orals | AS3.3

Single-scattering albedo and iterated refractive indices of fresh and aged black and brown carbon particles emitted from burning peat and boreal forest floor surface in chamber experiments 

Aki Virkkula, Delun Li, Luis Barreira, Anni Hartikainen, Markus Somero, Tuukka Kokkola, Arya Mukherjee, Juho Karhu, and Olli Sippula

It has been predicted that boreal forest and peatland fires will increase in the future as the climate warms. It is important for climate models that the optical properties of the aerosols emitted during these fires are well described.  Laboratory experiments were carried out to study biomass burning (BB) aerosol emissions and their photochemical and dark aging to investigate (1) the emission factors of BrC (and BC) from different combustion processes, (2) chemical and optical properties of the emissions and (3) how different atmospheric aging conditions affect these properties. The experiments were performed at the ILMARI-facility of the UEF (www.uef.fi/ilmari) in November–December 2023. Details of the experiments were presented by Mukherjee et al. (2025) who also presented absorption properties of water-soluble and methanol-soluble organic carbon (WSOC and MSOC, respectively) analyzed from filter samples. In the present work we will present the optical properties of BB emissions from burning peat and dry and moist boreal forest floor surface (BFS) samples at high time resolution. Light scattering coefficient was measured with a 3-wl nephelometer, absorption with a 7-wl Aethalometer and a 3-wl photoacoustic spectrometer, and particle number size distributions (PNSD) with an SMPS. A Mie code was used for calculating scattering and absorption coefficients from the PNSDs by varying real and imaginary refractive indices (nr and ni, respectively), until the measured and modeled scattering and absorption agree within 1%. The flaming BB emissions were dark with single-scattering albedo (SSA) varying between 0.25 and 0.6. The darkest aerosols with SSA ≈ 0.30 ± 0.05 were measured from flaming dry BFS and the highest SSA > 0.95 from aged peat fires. Fitting lines with the nr vs SSA show that the real refractive indices can be estimated from a logarithmic function nr(450) = 0.191ln(SSA) + 1.792, r2 = 0.402; nr(525) = 0.218ln(SSA) + 1.773, r2 = 0.524; nr(635) = 0.295ln(SSA) + 1.862, r2 = 0.734 and the imaginary refractive indices from polynomials: ni(450) = -4.50SSA3 + 10.35SSA2 - 8.05SSA + 2.17, r2 = 0.97; ni(525) = -2.91SSA3 + 6.79SSA2 -  5.40SSA + 1.51, r2 = 0.98; ni (635) = -1.65SSA3 + 3.85SSA2 - 3.16SSA + 0.96, r2 = 0.98. The next steps are to calculate the mass absorption cross sections (MAC) of BC and BrC by combining the optical data with the soot particle aerosol mass  spectrometer (SP-AMS) data and the absorption coeffcients and refractive indices of WSOC measured with an online UV-IR spectrometer connected to a liquid-waveguide capillary cell (LWCC) and a particle-into-liquid sampler (PILS).

Reference

Mukherjee, A. et al.: Brown carbon emissions from laboratory combustion of Eurasian arctic-boreal and South African savanna biomass, Atmos. Chem. Phys., 25, 16747–16774, 2025

Acknowledgement

 This work was supported by the Research Council of Finland via the project “Black and Brown Carbon in the Atmosphere and the Cryosphere” (BBrCAC) (decision number 341271)

How to cite: Virkkula, A., Li, D., Barreira, L., Hartikainen, A., Somero, M., Kokkola, T., Mukherjee, A., Karhu, J., and Sippula, O.: Single-scattering albedo and iterated refractive indices of fresh and aged black and brown carbon particles emitted from burning peat and boreal forest floor surface in chamber experiments, EGU General Assembly 2026, Vienna, Austria, 3–8 May 2026, EGU26-15338, https://doi.org/10.5194/egusphere-egu26-15338, 2026.

EGU26-16379 | Orals | AS3.3

Comparison of mass spectrometric approaches for real-time characterization of organic aerosol 

Mikael Ehn, Valter Mickwitz, Yuanyuan Li, Lu Qi, Jiangyi Zhang, Mitch Alton, Manjula Canagaratna, Frans Graeffe, Aki Nissinen, Eka Pusfitasari, Siegfried Schobesberger, and Jian Zhao

Atmospheric organic aerosol (OA) contains a mixture of molecules from various sources, both primary and secondary, and with different levels of atmospheric aging and propensity for particle-phase reactions. This highlights the need for detailed characterization of OA composition to better understand its sources, atmospheric transformation, and resulting physicochemical properties. This characterization is also preferably conducted in real-time, to capture both sudden changes of airmasses as well as fast reactions within the particles. We performed an intercomparison at our field station in Hyytiälä in the Finnish boreal forest where we deployed four different mass spectrometers able to measure aerosol composition in real-time. The instruments included an Aerosol Chemical Speciation Monitor (ACSM) as the reference instrument as well as three chemical ionization mass spectrometers (CIMS): a Vaporization Inlet for Aerosols coupled with a nitrate CIMS (VIA-NO3-CIMS), an Extractive Electrospray Ionization TOF (EESI-TOF), and a Filter Inlet for Gases and AEROsols coupled with an iodide CIMS (FIGAERO-I-CIMS). We also performed a follow-up chamber study to complement some missing comparisons due to instrumental problems during the field campaign.

CIMS has become a key tool for probing gas-phase composition, and studies have demonstrated how different reagent ions are able to detect distinct molecule types. In addition, using different methods for transferring aerosol-phase molecules into the gas-phase for detection by CIMS will most likely also result in differences in detected molecules. This study aimed to evaluate differences in instrument sensitivity for different types of OA and assess the fraction of OA that could be measured with these state-of-the-art methods deployed together.

The campaign in Hyytiälä (Sept 2-25, 2024) provided several interesting results. The foremost finding was a very high correlation between that the organics measured by the ACSM and the VIA–NO3-CIMS (R2 = 0.90) and FIGAERO-I-CIMS (R2 = 0.88). Consequently, also the VIA and the FIGAERO correlated extremely well, which was unexpected given that iodide and nitrate CIMS instruments tend to show very few common signals in typical gas-phase measurements. Sulfate measured by the VIA–NO3-CIMS agreed almost perfectly with ACSM measurements (R2 = 0.97), further validating that the instrument was working well throughout the campaign. Due to technical issues, however, the EESI-TOF did not provide enough data during the Hyytiälä campaign, and therefore we instead compared the VIA and EESI instruments with an AMS during a later chamber campaign using different types of aerosol precursors. This data is currently being analyzed in more detail, but at least for monoterpene-derived OA, also the EESI shows good correlation with the VIA, though with a higher sensitivity for less-oxygenated molecules while the VIA had higher sensitivity for the most oxygenated compounds. I will present more in-depth comparison results at the conference, including key differences between the methods, but our comparison indicates that all three aerosol CIMS instruments are able to detect a large fraction of the OA, at least in regions dominated by biogenic secondary OA.

How to cite: Ehn, M., Mickwitz, V., Li, Y., Qi, L., Zhang, J., Alton, M., Canagaratna, M., Graeffe, F., Nissinen, A., Pusfitasari, E., Schobesberger, S., and Zhao, J.: Comparison of mass spectrometric approaches for real-time characterization of organic aerosol, EGU General Assembly 2026, Vienna, Austria, 3–8 May 2026, EGU26-16379, https://doi.org/10.5194/egusphere-egu26-16379, 2026.

EGU26-16772 | ECS | Orals | AS3.3

Organic aerosol volatility and its drivers in realistic urban air replicas 

Aki Nissinen, Angela Buchholz, Iida Pullinen, Eka Dian Pusfitasari, Lu Liu, Sebastien Perrier, Matthieu Riva, Milan Roska, Boxing Yang, Kelvin H. Bates, Matthew M. Coggon, Juliane L. Fry, Eva Y. Pfannerstill, Franz Rohrer, Chelsea Stockwell, Ralf Tillmann, Peeyush Khare, David Bell, Georgios I. Gkatzelis, and Siegfried Schobesberger and the SAPHIR CHANEL

An important property of the compounds comprising organic aerosol is volatility, typically described in terms of saturation vapor pressure or saturation concentration (measured in µg/m3). The volatility of aerosol constituents can be estimated based on their molecular formula using different parametrizations or measured experimentally by using a chemical ionization mass spectrometer (CIMS) coupled to a filter inlet for gases and aerosols (FIGAERO). In this technique, aerosol sample is collected semi-online and evaporated via gradually heated nitrogen flow desorbing organic constituents to be measured by CIMS. From the temperature at which detected chemical species reach their maximum signal, it is possible to determine the respective compositions’ volatility.

In 2024, the FIGAERO-CIMS was deployed at the CHANEL (household chemicals amplifying urban aerosol pollution) measurement campaign at the SAPHIR chamber at Jülich Research Centre, Germany. During the campaign, complex reactive mixtures representing urban air scenarios were injected into the chamber, and exposed to both day- and night-time oxidation via opening or closing the roof to natural sunlight. We developed a multi-peak fitting algorithm to fully fit each composition’s thermogram (signal vs. desorption temperature), resulting in multiple nominal saturation concentrations per detected composition. We interpret these as combinations of simple volatility-driven desorption and decomposition (typically at higher temperatures) of larger compounds, such as accretion products.

We tracked the chemical composition and volatility of secondary organic aerosol throughout its formation and subsequent aging in the chamber over several hours. The chemical composition measured by FIGAERO-CIMS was compared with other co-located online mass spectrometric techniques, e.g., CIMS following online aerosol evaporation by a heated sheath flow (WALL-E). Our initial results show how aerosol volatilities typically decreased with age, as more oxygen was incorporated. Further, night-time conditions resulted in both increased organonitrate formation and lower product volatility relative to day-time conditions.

How to cite: Nissinen, A., Buchholz, A., Pullinen, I., Pusfitasari, E. D., Liu, L., Perrier, S., Riva, M., Roska, M., Yang, B., Bates, K. H., Coggon, M. M., Fry, J. L., Pfannerstill, E. Y., Rohrer, F., Stockwell, C., Tillmann, R., Khare, P., Bell, D., Gkatzelis, G. I., and Schobesberger, S. and the SAPHIR CHANEL: Organic aerosol volatility and its drivers in realistic urban air replicas, EGU General Assembly 2026, Vienna, Austria, 3–8 May 2026, EGU26-16772, https://doi.org/10.5194/egusphere-egu26-16772, 2026.

EGU26-17292 | Orals | AS3.3 | Highlight

Sources of organic aerosol in polluted urban environments and the heatwave impacts 

Qi Chen, Yan Zheng, Theodore K. Koenig, Ruqian Miao, Xi Cheng, Qi Zhang, Hao Wang, and Yanli Ge

Secondary formation of OA in polluted urban environments involves diverse precursors and complex pathways. When the severity and frequency of heatwaves are expected to rise, little is about the heatwave impacts on the OA formation in such polluted environments. Here we deployed a long time-of-flight aerosol mass spectrometer (LTOF-AMS) to measure the real-time chemical composition of submicron aerosols along with advanced time-of-flight chemical ionization mass spectrometers (TOF-CIMS) to detect gaseous and particulate oxidation products in Beijing in recent years. Six process-level secondary OA (SOA) factors are resolved and unique molecular tracers for each of the six processes are identified. The six SOA factors can be explained by intensified photochemical and heterogeneous reactions with higher volatile organic compounds emissions and oxidant level, increased aerosol surface, stronger aerosol acidity, and higher ammonia concentration etc. The six-factor SOA seperation provides a machanistic understanding of the net enhancement of SOA during heatwave events, which have been observed in many places worldwide in summer. We further applied machine learning methods to identify the key drivers of the SOA enhancement and used the simulated key parameters from the GEOS-Chem model to perturb the SOA formation during the heatwave episode under clean air actions and climate change scenarios. Our results suggest that the SOA enhancement due to heatwave will be increasingly important in the future. This study underscores the urgency of validating temperature responses of organic aerosol in chemical transport models to facilitate air quality management in a warming world. 

How to cite: Chen, Q., Zheng, Y., Koenig, T. K., Miao, R., Cheng, X., Zhang, Q., Wang, H., and Ge, Y.: Sources of organic aerosol in polluted urban environments and the heatwave impacts, EGU General Assembly 2026, Vienna, Austria, 3–8 May 2026, EGU26-17292, https://doi.org/10.5194/egusphere-egu26-17292, 2026.

EGU26-18015 | Orals | AS3.3

The role of relative humidity for the formation of oxidized shells on aged wildfire particles 

Ralf Zimmermann, Iva Ellen Rosewig, Aleksandrs Kalamašņikovs, Haseeb Hakkim, Mika Ihalainen, Anni Hartikainen, Markus Somero, Pasi Yli-Pirilä, Olli Sippulä, Saara Peltokorpi, Angela Buchholz, Hao Liqing, Annele Virtanen, Ville Vakkari, Andreas Walte, and Johannes Passig

Wildfire smoke strongly affects air quality, human health, climate, and the Earth system. During atmospheric aging, wildfire aerosol particles undergo complex chemical and microphysical transformations that modify their optical properties, radiative effects, and cloud-forming ability. Of particular interest are organic surface coatings, which can enhance light absorption through lensing effects and increase particle hygroscopicity.

Here, we present single-particle mass spectrometry measurements from a boreal forest wildfire smoke experiment, resolving the coexistence of hydrophilic compounds and hydrophobic polycyclic aromatic hydrocarbons (brown carbon) within individual particles. We show that glyoxal and methylglyoxal are directly emitted during combustion, contributing to the initial hygroscopicity of freshly emitted particles. During photochemical aging, rapid oxalate formation is observed, accompanied by a moderate increase in hygroscopicity, while PAH signals decrease on a slower timescale. The decay rates of individual PAHs are similar but show a clear dependence on relative humidity, indicating that PAH degradation is controlled by viscosity-dependent radical diffusion into the particles. In contrast, highly oxidized products form on much shorter timescales, suggesting that these reactions are largely confined to the particle surface. At elevated relative humidity, surface oxidation continues, whereas it rapidly ceases under dry conditions. These observations highlight the central role of relative humidity in controlling the microphysical properties, optical effects, and cloud activation potential of aged wildfire smoke.

How to cite: Zimmermann, R., Rosewig, I. E., Kalamašņikovs, A., Hakkim, H., Ihalainen, M., Hartikainen, A., Somero, M., Yli-Pirilä, P., Sippulä, O., Peltokorpi, S., Buchholz, A., Liqing, H., Virtanen, A., Vakkari, V., Walte, A., and Passig, J.: The role of relative humidity for the formation of oxidized shells on aged wildfire particles, EGU General Assembly 2026, Vienna, Austria, 3–8 May 2026, EGU26-18015, https://doi.org/10.5194/egusphere-egu26-18015, 2026.

EGU26-18670 | Posters on site | AS3.3

 Molecular-level constraints on springtime urban new particle formation in Helsinki using Multi-Pressure Chemical Ionization Mass Spectrometry 

Aleksei Shcherbinin, Henning Finkenzeller, Hj Jost, Sebastian Holm, and Juha Kangasluoma

Secondary organic aerosols (SOA) and their precursor vapors comprise a major fraction of atmospheric particulate matter, yet the molecular pathways linking precursor oxidation, new particle formation (NPF), condensation, and particle growth remain insufficiently constrained in complex urban environments. We will investigate these processes during a spring 2026 field measurements campaign in Helsinki, Finland, deploying a new Orbion 120 platform with multi-pressure chemical ionization to obtain high time-resolution, molecular-level measurements of key nucleation- and growth-relevant species.

The instrument will operate with two complementary reagent-ionization schemes: isotopically labelled nitrate chemical ionization to target highly oxygenated organic molecules (HOMs) and strong acids, and uronium chemical ionization to target atmospheric bases and high-proton-affinity species that can stabilize acidic clusters and influence early particle growth. This dual-chemistry approach is designed to resolve co-variations between strong acids/HOMs and basic species under rapidly evolving springtime urban conditions, and to probe transformation processes (e.g., functionalization/aging and brown-carbon-relevant chemistry) alongside gas-to-particle partitioning prior to and during NPF events.

We will describe the field setup and operating strategy (inlet configuration, switching scheme, and overall analytical method design) and report the first campaign-derived observations, focusing on event-non-event contrasts and molecular fingerprints associated with NPF in spring-time Helsinki. These measurements aim to provide new ambient constraints on the coupled roles of oxidized organics/strong acids and atmospheric bases in urban springtime particle formation, supporting improved mechanistic understanding and model representation of SOA and NPF.

How to cite: Shcherbinin, A., Finkenzeller, H., Jost, H., Holm, S., and Kangasluoma, J.:  Molecular-level constraints on springtime urban new particle formation in Helsinki using Multi-Pressure Chemical Ionization Mass Spectrometry, EGU General Assembly 2026, Vienna, Austria, 3–8 May 2026, EGU26-18670, https://doi.org/10.5194/egusphere-egu26-18670, 2026.

EGU26-18839 | ECS | Posters on site | AS3.3

Aqueous OH kinetics of sugar acids: new rate coefficients and atmospheric lifetimes 

Vinh Nguyen, Thomas Schaefer, Bartłomiej Witkowski, Tomasz Gierczak, and Hartmut Herrmann

Sugar acids such as gluconic, glucuronic, and galacturonic acids are emitted directly by biomass burning, vegetation, and microbiota, and are formed through the oxidation of sugars and sugar alcohols. These compounds are commonly found in atmospheric particulate matter (PM), particularly in biomass burning and biogenic secondary organic aerosols. Hydroxyl radical (OH) is a major daytime atmospheric oxidant, formed by photolysis of ozone (gas phase) and by Fenton or Fenton-like reactions in water-containing particles, thereby dominating the oxidative capacity of the atmosphere. 
Due to their extremely low volatilities and high water solubility, the aqueous reaction with the OH radicals inside the different hydrometeors can contribute to the transformation and removal of saccharides. As such, aqueous OH radicals' reaction with polyols influences particle aging, secondary oxidation processes, and changes in aerosol chemical and optical properties relevant to regional climate. 
The values of bimolecular reaction rate coefficients (kOH, M-1s-1) for the atmospherically abundant, water-soluble organic compounds (WSOCs) are needed to estimate their atmospheric lifetimes and develop kinetic predictive models, particularly structure-activity relationships (SARs). Kinetic SARs are widely used in atmospheric chemistry to predict kOHaq for the atmospheric-abundant water-soluble organics; they are also frequently embedded in atmospheric models and automated mechanism generators. At the same time, the number of kOH values for many (poly)functional, highly polar organic compounds found in the atmospheric multiphase system remains limited.
In this work, kOH values for gluconic, glucuronic, and galacturonic acids were systematically measured at temperatures using a laser flash photolysis-laser long-path spectroscopy. Measurements were conducted over a temperature range 278 to 318K under acidic (pH=2) and neutral (pH=7) conditions. The kOH values were determined at five reactant concentrations, ranging from 5.0×10⁻⁵ to 2.0×10⁻⁴ M, using potassium thiocyanate (KSCN, 2×10⁻⁵M), as a kinetic reference compound. The resulting kOH values ranged from 108 to 109 M-1 s-1, consistent with available literature data for similar polyols. All three sugar acids exhibit a clear temperature dependence of the measured kOH values, following Arrhenius behavior. 
Arrhenius analysis yielded activation energies (EA, kJ mol-1), pre-exponential factors (A, M-1 s-1), activation enthalpies (∆H, kJ mol-1), activation entropies (∆S, J K-1 mol-1), and Gibbs free energies of activation (∆G, kJ mol-1). These results provide mechanistic insights into the OH reaction with sugar acids. Lastly, the performances of different kinetic SARs for highly oxygenated WSOCs were evaluated using the newly acquired data.

How to cite: Nguyen, V., Schaefer, T., Witkowski, B., Gierczak, T., and Herrmann, H.: Aqueous OH kinetics of sugar acids: new rate coefficients and atmospheric lifetimes, EGU General Assembly 2026, Vienna, Austria, 3–8 May 2026, EGU26-18839, https://doi.org/10.5194/egusphere-egu26-18839, 2026.

EGU26-19190 | ECS | Posters on site | AS3.3

Estimation of secondary organic aerosol from biomass burning using observations of formaldehyde, NO2 and AOD 

Fiona Román de Miguel, Betty Croft, Maria Gonçalves, Francesco Marangio, Jeffrey Pierce, Alexandra Tsimpidi, Twan van Noije, Ryan Vella, and Nick Schutgens

Wildfires are a major source of atmospheric organic aerosol (OA), emitting primary organic aerosol (POA) and volatile organic compounds that oxidize to form secondary organic aerosol (SOA). This oxidation also produces formaldehyde (HCHO), which is additionally emitted directly from fires alongside nitrogen dioxide (NO₂). Both HCHO and NO2 are detectable from space, offering the potential to observationally constrain organic aerosol formation during biomass burning. However, this potential remains poorly quantified.

Here, we evaluate whether satellite observations of HCHO and NO₂ can be used to estimate POA and SOA from biomass burning events. We compare simulations from four models with satellite measurements from OMI (HCHO, NO₂) and POLDER (AOD). All models reproduce correctly the observed spatial patterns of HCHO, NO2 and AOD, but they overestimate trace gas concentrations and slightly underestimate AOD. Despite differences in magnitude, models and observations show linear relationships between HCHO and AOD.

Building on these observed relationships, we develop a satellite-based methodology to estimate POA and SOA with minimal use of model assumptions. The observed HCHO-AOD correlation is combined with satellite-derived mass extinction coefficient to relate observed AOD to organic aerosol. In addition, the relationship between NO2 and POA fraction, derived from in-situ measurements, is used to separate the two types of organic aerosols. Together, these relationships allow the estimation of POA and SOA from HCHO and NO2 observations, and sensitivity analysis shows that the method is robust. Application to the Amazon and African savanna indicates that observation-based POA formation is 3.82 and 5.53 times higher, respectively, than modeled values, while SOA formation is higher by factors of 2.4 and 3.5, suggesting model underestimation of organic aerosol production from biomass burning. 

How to cite: Román de Miguel, F., Croft, B., Gonçalves, M., Marangio, F., Pierce, J., Tsimpidi, A., van Noije, T., Vella, R., and Schutgens, N.: Estimation of secondary organic aerosol from biomass burning using observations of formaldehyde, NO2 and AOD, EGU General Assembly 2026, Vienna, Austria, 3–8 May 2026, EGU26-19190, https://doi.org/10.5194/egusphere-egu26-19190, 2026.

EGU26-19660 | Orals | AS3.3

Interplay of phase state and multiphase chemistry in nanoparticle growth and evaporation of secondary organic aerosol 

Thomas Berkemeier, Hyun Gu Kang, Zhiqiang Zhang, Maja Radecka, Masayuki Takeuchi, Nga Lee Ng, and Ulrich Pöschl

Recent studies have shown that evaporation rates of secondary organic aerosol (SOA) particles may be slower than expected (Vaden et al. 2011; Berkemeier et al. 2020) and that growth rates of ambient SOA nanoparticles show surprisingly little dependency on condensable vapors in the gas phase (Kulmala et al., 2022). A large fraction of SOA may exist in oligomerized form, which might alter their condensation and evaporation. Additionally, SOA can be highly viscous, which leads to kinetic limitations in evaporation, slowing of particle-phase chemistry, and non-equilibrium partitioning. The effects of composition, oligomerization, and slow diffusion are inherently coupled, as high concentrations of low-volatility compounds or products of accretion reactions can cause high viscosity.

We use a kinetic multi-layer model to estimate the kinetic limitations affecting SOA formation and fate in laboratory experiments and the ambient atmosphere. The model explicitly considers gas- and particle-phase chemistry, kinetic gas-particle partitioning, and composition-dependent bulk diffusivity. We re-analyze data from laboratory chamber experiments with mixtures of terpenes as SOA precursors (Berkemeier et al. 2020) as well as published field and laboratory chamber data of nanoparticle growth (Stolzenburg et al., 2025) to find pronounced effects of multiphase chemistry and particle phase state under these conditions. Especially the partitioning of semi and low-volatile organic compounds (SVOC/LVOC) is strongly affected by these processes in the model, while the partitioning of extremely- and ultra-low volatility organic compounds (ELVOC/ULVOC) is less affected. We discuss the possible effect of growth limitation through bulk accommodation in models that follow monolayer adsorption schemes versus models that allow the “burying” of surface-adsorbed molecules through multi-layer adsorption.

The model predicts that, during particle evaporation, particles may be radially heterogeneous with respect to composition and diffusivity: higher volatility chemical species evaporate more quickly than oligomers or lower volatility species, leaving behind a near-surface layer crust of more viscous material that presents a barrier for further evaporation. The results highlight gaps in our knowledge about the physical and chemical properties of SOA and their interactions.

References

Berkemeier, T., Takeuchi, M., Eris, G., Ng, N. L. Atmos. Chem. Phys. 20, 15513-15535 (2020).
Kulmala, M., Cai, R., Stolzenburg, D., et al. Environ. Sci.: Atmos. 2, 352-361 (2022).
Stolzenburg, D., Sarnela, N., Bianchi, F. et al. npj Clim Atmos Sci 8, 75 (2025).
Vaden, T. D., Imre, D., Beranek, J., et al. P. Natl. Sci. Acad. USA 108, 2190–2195 (2011).

How to cite: Berkemeier, T., Kang, H. G., Zhang, Z., Radecka, M., Takeuchi, M., Ng, N. L., and Pöschl, U.: Interplay of phase state and multiphase chemistry in nanoparticle growth and evaporation of secondary organic aerosol, EGU General Assembly 2026, Vienna, Austria, 3–8 May 2026, EGU26-19660, https://doi.org/10.5194/egusphere-egu26-19660, 2026.

EGU26-19850 | ECS | Orals | AS3.3

Elucidating Mechanisms of Organic-Driven Nanoparticle Growth in China through Advanced Modeling 

Zeqi Li, Bin Zhao, Yicong He, Jiewen Shen, Dejia Yin, and Shuxiao Wang

Nanoparticle growth is a critical process determining whether newly formed nanoparticles can survive to cloud condensation nuclei (CCN) and haze sizes, thereby influencing climate and air quality. The growth is primarily driven by the condensation of low-volatility organic vapors. Therefore, comprehensive and accurate understanding of organic-driven particle growth processes is crucial for accurately assessing their environmental, climatic, and health impacts, and for developing targeted mitigation strategies. Three-dimensional models are essential tools for elucidating regional-scale particle evolution mechanisms. However, existing 3D atmospheric models fail to characterize the formation and condensation of low-volatility organics driving particle growth, which hinders accurate simulation and mechanistic understanding of growth processes.

Here, we develop an advanced 3D numerical modeling framework for organic gas-phase oxidation and particle growth by implementing the integrated two-dimensional volatility basis set (I2D-VBS) and a kinetic gas-particle partitioning model in WRF-Chem. This model accurately simulates organic oxidation products across the full volatility range and their condensation-driven nanoparticle growth processes. The model effectively reproduces process-level particle growth observed at different sites and seasons across China, reducing growth rate errors from orders of magnitude to reasonable ranges and significantly enhancing simulations of particle number size distributions.

Based on the improved model, we conduct a comprehensive analysis of organic-driven particle growth in China and identify the primary organic sources driving particle growth. Results show that particle growth rates in China are predominantly contributed by oxidation products of intermediate/semi-volatile organic compounds (I/SVOCs), accounting for >65% in winter and >59% in summer across key regions including Beijing-Tianjin-Hebei, Yangtze River Delta, and Pearl River Delta. Anthropogenic VOCs (AVOCs) rank second in contribution, though the contribution from biogenic VOCs (BVOCs) may exceed that from AVOCs in some southeastern regions during summer. Among precursor categories, aromatics and aliphatics are the most important, followed by oxygenated aromatics. Finally, we further elucidate the impacts of organic condensation-driven growth on particle and CCN number concentrations. This study fills critical knowledge gaps regarding particle growth mechanisms and their environmental impacts in China.

How to cite: Li, Z., Zhao, B., He, Y., Shen, J., Yin, D., and Wang, S.: Elucidating Mechanisms of Organic-Driven Nanoparticle Growth in China through Advanced Modeling, EGU General Assembly 2026, Vienna, Austria, 3–8 May 2026, EGU26-19850, https://doi.org/10.5194/egusphere-egu26-19850, 2026.

EGU26-19929 | ECS | Posters on site | AS3.3

Mechanisms of nitrogen-containing organic matter production in atmospheric aerosols in typical megacities in Myanmar: Coastal and Inland Cities of Yangon and Mandalay as an Example 

Ning Zhang, Ziyi Liu, Jialiang Feng, Yingge Ma, Xinlei Ge, Junfeng Wang, Piero Di Carlo, and Eleonora Aruffo

Nitrogen-containing organic compounds (NOCs) represent key light-absorbing components of atmospheric PM2.5, yet the sources and formation mechanisms of nitrophenolic species remain unclear. Thirty-six PM2.5 samples collected during winter and summer from Yangon and Mandalay, Myanmar, were analyzed using UHPLC-Orbitrap MS. A total of 562-1318 organic compounds (average 1064) were identified in the ESI- mode, with NOCs accounting for 14-21% of molecular numbers and 13-35% of total concentrations.

Nitrophenolic compounds, defined by O/N ≥ 3 and AI > 0.5, were mainly distributed in zones C, F, and G of the Van Krevelen diagram and dominated the aromatic NOC fraction. Two ubiquitous nitrophenols—nitrocatechol (C6H5NO4) and dimethylnitrocatechol (C8H9NO4)—were detected in all samples and exhibited strong positive correlations, suggesting similar sources and transformation pathways. Their relative abundances showed distinct humidity dependence, with C6H5NO4 favored under dry conditions (RH < 50%) and C8H9NO4 under humid conditions (RH > 60%).

These findings highlight the significant role of nitrophenolic compounds in brown carbon formation and secondary processes in tropical aerosols, providing key mechanistic insights for subsequent modeling of their humidity-dependent formation pathways.

How to cite: Zhang, N., Liu, Z., Feng, J., Ma, Y., Ge, X., Wang, J., Carlo, P. D., and Aruffo, E.: Mechanisms of nitrogen-containing organic matter production in atmospheric aerosols in typical megacities in Myanmar: Coastal and Inland Cities of Yangon and Mandalay as an Example, EGU General Assembly 2026, Vienna, Austria, 3–8 May 2026, EGU26-19929, https://doi.org/10.5194/egusphere-egu26-19929, 2026.

EGU26-19949 | ECS | Posters on site | AS3.3

The Journey from Forest Emissions to Clouds: Aerosol aging impact on cloud microphysics 

Léo Faivre, Radovan Krejci, Peter Tunved, Theodore Khadir, Paul Bowen, Daniel Partridge, and Liine Heikkinen

This study investigates how biogenic volatile organic compound (BVOC) emissions from boreal forests shape aerosol evolution and subsequent cloud formation, with a focus on the vertical pathway of air parcels and repeated cloud processing. Using long-term aerosol observations from SMEAR II (Finland), we characterize how aerosol size distribution and chemical composition evolve during atmospheric transport and aging. These observations are used to drive simulations with the PseudoAdiabatic bin-micRophySics University of Exeter Cloud parcel model (PARSEC) to assess impacts on cloud droplet activation, supersaturation, and cloud albedo.

We examine how forest emissions influence aerosol growth, composition, cloud condensation nuclei efficiency, and, therefore, cloud microphysics. Particular focus is placed on the role of vertical transport and precipitation processing in shaping aerosol–cloud interactions. The long-term observations reveal that the longer aerosols spend over forests, the more they grow and change in composition. Our simulation results then show that these changes in BVOC-driven aerosol properties impact droplet activation, cloud formation, and cloud microphysic highlighting how BVOC-emission and aerosol aging impact cloud responses.

These findings emphasise the need to represent not only surface emissions but also the full atmospheric processing pathway of aerosols in climate models, especially when assessing the climatic role of forested regions. This study will lead to a comparison between Tropical and Boreal ecosystems impact on aerosol aging and the difference in cloud responses. 

How to cite: Faivre, L., Krejci, R., Tunved, P., Khadir, T., Bowen, P., Partridge, D., and Heikkinen, L.: The Journey from Forest Emissions to Clouds: Aerosol aging impact on cloud microphysics, EGU General Assembly 2026, Vienna, Austria, 3–8 May 2026, EGU26-19949, https://doi.org/10.5194/egusphere-egu26-19949, 2026.

EGU26-21018 | ECS | Posters on site | AS3.3

Organic aerosol source characterization in Paris using an online chemical ionization mass spectrometer  

Imad Zgheib, Milan Roska, Francois Gaie-Levrel, Laurent Gauvin, Mendosa Rabort, Sebastien Perrier, Urs Rohner, Georgios Gkatzelis, Felipe Lopez-Hilfiker, and Matthieu Riva

Online chemical characterization of atmospheric particles is often challenged by thermal decomposition, fragmentation, wall losses, ionization selectivity, and rapid changes in particle concentration and composition. To resolve these current limitations, we developed the Wall-Free Particle Evaporator (WALL-E) coupled to a chemical ionization mass spectrometer - model Vocus B4 (Bansal et al., 2025). WALL-E enables continuous evaporation of particles to detectable vapors using flash evaporation utilizing a mixture of heated sheath flow as well as a compact thermal desorption region, aiming to preserve fast atmospheric variability while reducing artefacts and decomposition linked to surface interactions by minimizing residence time (Gao et al., 2025). In this work, we present the first ambient field deployment of the WALL-E - Vocus B4 chemical ionization mass spectrometer equipped with an Aim reactor (Riva et al., 2024). Field measurements were conducted from mid-September to mid-October 2025 at the AIRPARIF background supersite named Paris 1er – Les Halles in France.

Figure 1: Temporal evolution of the some of the trace gases

The campaign provides a real-world test of WALL-E performance under highly variable urban conditions. The resulting particle-phase molecular time series captures short-timescale variability alongside sustained background changes. To further identify the main aerosol sources, we applied matrix factorization to the WALL-E–Vocus B4 dataset to resolve distinct composition modes with characteristic temporal signatures. A key outcome is the prominent role of cooking-related emissions, which emerge as a robust factor with clear diurnal structure (enhanced during meal-time periods) and diagnostic molecular features in the particle-phase spectra. The analysis also separates recurring daily patterns from more persistent background/regional influences. Overall, this work provides a compact, interpretable description of urban particle-phase variability in central Paris based directly on online molecular composition.

This work was supported by the CLOUD-DOC project (Grant Agreement No. 101073026) under HORIZON-MSCA-2021-DN-01. This work was also supported by the European Research Council (ERC) under the European Union’s Horizon Europe research and innovation program through the Starting Grant CHANEL (Grant Agreement No. 101076276).

  • Bansal, P., et al. “Comprehensive airborne molecular contamination monitoring with single-digit parts-per-trillion sensitivity.” Journal of Micro/Nanopatterning, Materials, and Metrology 24(4), 044003 (30 December 2025). https://doi.org/10.1117/1.JMM.24.4.044003.
  • Gao, L., Zgheib, I., Stergiou, E., Carstens, C., Sari Doré, F., Dupanloup, M., Bourgain, F., Perrier, S., and Riva, M.: Characterization of the newly designed wall-free particle evaporator (WALL-E) for online measurements of atmospheric particles, Atmos. Meas. Tech., 18, 5087–5101, https://doi.org/10.5194/amt-18-5087-2025, 2025.
  • Riva, M., Pospisilova, V., Frege, C., Perrier, S., Bansal, P., Jorga, S., Sturm, P., Thornton, J. A., Rohner, U., and Lopez-Hilfiker, F.: Evaluation of a reduced-pressure chemical ion reactor utilizing adduct ionization for the detection of gaseous organic and inorganic species, Atmos. Meas. Tech., 17, 5887–5901, https://doi.org/10.5194/ , amt-17-5887-2024, 2024.

How to cite: Zgheib, I., Roska, M., Gaie-Levrel, F., Gauvin, L., Rabort, M., Perrier, S., Rohner, U., Gkatzelis, G., Lopez-Hilfiker, F., and Riva, M.: Organic aerosol source characterization in Paris using an online chemical ionization mass spectrometer , EGU General Assembly 2026, Vienna, Austria, 3–8 May 2026, EGU26-21018, https://doi.org/10.5194/egusphere-egu26-21018, 2026.

EGU26-21483 | Posters on site | AS3.3

Aerosol Formation by Multiphase Reactions of Peroxide and Carbonyl Compounds over Beijing 

Zhongming Chen and Yishuang Dai

The concentrations of peroxides and carbonyl compounds in the gas and aerosol phases were observed over urban Beijing in summer and winter 2022. Peroxide multiphase reactions were identified as dominant pathways for sulfate formation in fine particles (PM2.5), and carbonyl compound multiphase transformation significantly contributed to secondary organic aerosol (SOA) formation, with the oxidative pathway dominating (> 80%) over the non-oxidative pathway. We develop the parameterization formulas for SOA formation from carbonyl compounds, showing that the rising atmospheric H2O2 level in Beijing significantly increased SOA formation rate via carbonyl compound multiphase reactions both in summer and winter in recent years. The mechanisms by which multiphase transformation of peroxides and carbonyl compounds promote secondary aerosol formation are suggested.

How to cite: Chen, Z. and Dai, Y.: Aerosol Formation by Multiphase Reactions of Peroxide and Carbonyl Compounds over Beijing, EGU General Assembly 2026, Vienna, Austria, 3–8 May 2026, EGU26-21483, https://doi.org/10.5194/egusphere-egu26-21483, 2026.

EGU26-21608 | ECS | Orals | AS3.3

Formation and aging of biogenic secondary organic aerosol in aqueous aerosol particles containing reactive nitrogen  

Jinglan Fu, Willem Kroese, Laurie Novák, Hengjia Ou, Rupert Holzinger, Harald Saathoff, and Ulrike Dusek

Biogenic secondary organic aerosols (BSOA) are formed from oxidation of biogenic volatile organic compounds (BVOC). They are the main contributor to the global SOA fluxes with the values still remaining highly uncertain. The formation mechanism of BSOA has been studied extensively, however few studies up to date have been conducted at elevated relative humidity (85-95%) and in the presence of different aqueous inorganic seeds. These conditions are more realistic e.g., under night-time conditions or in coastal or tropical regions. As two typical and abundant BVOC, we focus on the SOA formation from isoprene and α-pinene. Experiments are conducted inside the AIDA aerosol and cloud simulation chamber under various humidities and the presence of different seed aerosols at atmospherically relevant conditions. During the campaign, NaCl, NH4NO3 or (NH4)2SO4 seed aerosol particles are introduced into the chamber, followed by the oxidation of isoprene or α-pinene. Formation and aging of oxidation products are measured in the gas and condensed phase in the dark and with simulated solar radiation.

Our results show that the SOA mass production is enhanced under higher relative humidities. High-resolution aerosol mass spectrometry data show a higher oxidation state of SOA formed under higher humidities, suggesting further oxidation of SOA products within the condensed phase. Further molecular analysis on the particle phase oxidation products with FIGAERO-CIMS suggests that the increased oxidation state can mainly be explained by the production of HOMs and low-molecular weight dicarboxylic acids during the aging process, especially under illumination. Our observations indicate the critical influence of relative humidity and pre-existing seed aerosol composition on different secondary organic aerosol formation mechanisms, particularly through potential aqueous-phase reaction pathways.

How to cite: Fu, J., Kroese, W., Novák, L., Ou, H., Holzinger, R., Saathoff, H., and Dusek, U.: Formation and aging of biogenic secondary organic aerosol in aqueous aerosol particles containing reactive nitrogen , EGU General Assembly 2026, Vienna, Austria, 3–8 May 2026, EGU26-21608, https://doi.org/10.5194/egusphere-egu26-21608, 2026.

EGU26-21813 | Orals | AS3.3

Nucleation and the Volatility Basis Set 

Neil M. Donahue

New particle formation occurs broadly via two processes. First, small clusters can be stabilized by a reaction between constituents, such as proton transfer in acid-base clusters like sulfuric acid and ammonia. Second, constituents can simply be sufficiently sticky to remain clustered until more constituents arrive to make the cluster grow. This is classical nucleation and it depends on high vapor saturation ratios (supersaturation). It can occur for argon under the right conditions, but in the atmosphere nucleation involving organics is most interesting. Organics add the feature that they are an incredibly rich mixture of constituents, generally highly oxygenated, each with many oxygenated functional groups. We can describe this rich mixture in terms of volatility using the volatility basis set (VBS), and it has been established that nucleation appears to be second order with respect to the concentration of the least volatile class in the VBS, the so-called Ultra Low Volatility Organic Compounds (ULVOCs). Here we present an analysis of the overall volatility distribution to determine the fraction of ULVOCs that govern nucleation in both neutral and ion-induced nucleation. This depends on overall saturation ratios as well as the overall volatility distribution. The framework successfully describes the temperature and concentration dependence of both neutral and ion-induced nucleation for the canonical alpha-pinene + ozone system measured at the CERN CLOUD experiment between 223 and 298 K. Ultimately there are two competing effects: volatility drops as temperature drops, increasing saturation ratios, but the peroxy radical autoxidation chemistry that creates the highly functionalized ULVOCs accelerates as temperature increases, increasing saturation ratios in the opposite sense. Both theory and observations show a minimum in nucleation rates between 263 and 278 K, with higher rates to either side.

How to cite: Donahue, N. M.: Nucleation and the Volatility Basis Set, EGU General Assembly 2026, Vienna, Austria, 3–8 May 2026, EGU26-21813, https://doi.org/10.5194/egusphere-egu26-21813, 2026.

EGU26-514 | ECS | Posters on site | AS3.4

Winter-haze mediated dispersal of urban airborne bacteria across the Indo-Gangetic Plain of India 

Antara Pramanick, Shahina Raushan Saikh, Md Abu Mushtaque, and Sanat Kumar Das

Winter haze across the Indo-Gangetic Plain (IGP) forms a dense, persistent atmospheric layer capable of transporting airborne bacteria over long distances, influencing human health, agricultural productivity, and climate dynamics. Present study investigates transports of bacterial communities through winter haze movement over IGP, analysing 20 airborne samples collected simultaneously in the winter of 2022-2023 from four urban cities along west-to-east traveling path from Delhi (28.49° N, 77.18° E) to Varanasi (25.26° N, 82.99° E) to Muzaffarpur (26.12° N, 85.39° E) and finally reaching to Ranchi (23.41° N, 85.44° E). Highest bacterial loading has been observed in Delhi, where the loading of bacterial ASV and genus reaches 71705 ± 4143 and 590 ± 70, respectively, representing a significantly higher loading (30%) of bacteria compared to the easternmost city of Ranchi. Venn diagram analysis confirmed widespread long-range transport, as demonstrated by a substantial overlap, where 500 bacterial genera were shared among all four geographically distinct sampling locations, accounting for approximately 50% of the total bacterial community that travelled along with winter haze movement. The health implications are underscored by the high prevalence of pathogenic ASVs, predominantly associated with respiratory and skin microbiomes, which ranged from 3,000 to over 5,000 ASVs per sample across the IGP, with Delhi and Muzaffarpur showing the highest concentration. Current result establishes that winter haze acts as an efficient vector for the high-load, long-distance transport of diverse bacterial communities, including potentially harmful human pathogens, across the most densely populated region in India.

How to cite: Pramanick, A., Saikh, S. R., Mushtaque, M. A., and Das, S. K.: Winter-haze mediated dispersal of urban airborne bacteria across the Indo-Gangetic Plain of India, EGU General Assembly 2026, Vienna, Austria, 3–8 May 2026, EGU26-514, https://doi.org/10.5194/egusphere-egu26-514, 2026.

EGU26-2898 | Posters on site | AS3.4

Seasonality of airborne bacterial population in South Korea 

So-Yeon Jeong and Tae Gwan Kim

Airborne bacteria are a critical yet highly dynamic component of atmospheric ecosystems, shaped by the interplay between local sources and long-range transport. Over a three-year monitoring period in Busan, South Korea, we quantified airborne bacterial populations using quantitative PCR and high-throughput sequencing. Bacterial concentrations fluctuated substantially (2.8–5.8 log10 copy·m-3), with pronounced peaks in spring and minima during summer. These fluctuations mirrored the temporal trends of both local PM10 and desert-derived PM10 transported from arid regions thousands of kilometers away. Time-series analyses further revealed robust, synchronized annual cycles for bacterial abundance, desert PM10, and local PM10 (P<0.05), with parametric modeling capturing a four-week lag between desert dust emissions and subsequent local microbial peaks. Structural equation modeling provided quantitative confirmation that both local generation and regional dispersal significantly influenced airborne bacterial dynamics (P<0.05), with regional dispersal predominating during peak spring dust storm periods. Together, our findings underscore the major role of transcontinental dust transport in shaping atmospheric bacterial communities, often surpassing local contributions.

How to cite: Jeong, S.-Y. and Kim, T. G.: Seasonality of airborne bacterial population in South Korea, EGU General Assembly 2026, Vienna, Austria, 3–8 May 2026, EGU26-2898, https://doi.org/10.5194/egusphere-egu26-2898, 2026.

Fungal spores are abundant bioaerosols with major impacts on respiratory health and crop protection, yet routine monitoring remains limited because reference methods are labour-intensive and typically only output results after substantial reporting lag. Met Éireann is establishing Ireland’s first national fungal spore monitoring network using co-located Hirst-type volumetric samplers and Swisens Poleno automatic bioaerosol sensors. This work describes the network design rationale, deployment progress to date, and a roadmap from pilot measurements to operational products.

By May 2026, six Poleno instruments (four Jupiter and two Mars) will be operational across an urban–rural transect in Ireland: Dublin, Cork, and Limerick cities (urban exposure and public-health relevance), Mullingar, Oak Park/Carlow and Claremorris/Mayo (rural, agricultural landscapes). Each Poleno is paired with a co-located Hirst sampler to provide a continuous reference dataset for validation and continuity with established aerobiological records. The same instruments, staff workflows, and training approaches are also used for pollen monitoring, enabling year-round multi-taxa surveillance and shared operational learning.

A core objective is to develop a reproducible training and validation pipeline for fungal spore classification from Poleno holographic imagery (and, for Jupiter, fluorescence-assisted measurements). We present an end-to-end workflow for generating labelled datasets: sourcing priority fungi, harvesting spores, controlled aerosolisation into a laboratory-based Poleno device, curation of particle image libraries, and iterative machine-learning model training before deployment to field units. Initial target taxa are selected to be those most readily identifiable to human analysts, allowing rapid iteration on training protocols before moving to all spore types. Once the workflow is robust, species selection will be expanded using a balanced prioritisation framework that weights both human health relevance and agricultural impact equally.

Preliminary outputs from the first operational year emphasise implementation and comparability. We summarise the siting and maintenance challenges encountered during deployment, including placing instruments in populated areas while avoiding local exhaust influences (e.g., rooftop fume hoods), coastal artefacts affecting Hirst tapes (salt deposition and particle overload during high-wind conditions), and biological interference in manual samplers (insects attracted to the adhesive/tape materials). We also outline harmonised quality assurance steps for co-located datasets, including the role of confidence thresholds, and the handling of non-biological interferents.

We will show first-year case studies for the first trained taxa (e.g., Alternaria), comparing daily Hirst counts with high-resolution Poleno output and describing how we calibrate and align the two methods.

Over the next 2–3 years our objectives are to: (1) build 12–24 month co-located Hirst reference datasets at each station; (2) expand the fungal spore training library to cover the most common and impactful taxa in Ireland; (3) produce annual spore calendars, trends, and meteorological drivers; and (4) eventually deliver near-real-time concentration products suitable for online dissemination.

How to cite: Hourihane Clancy, J. and Markey, E.: Rolling out Ireland’s real-time fungal spore monitoring network: co-located Hirst–Poleno observations, training workflows, and a pathway to operational forecasting, EGU General Assembly 2026, Vienna, Austria, 3–8 May 2026, EGU26-5688, https://doi.org/10.5194/egusphere-egu26-5688, 2026.

EGU26-6675 | Orals | AS3.4

Tracing biological, human, and inorganic sources of coarse aerosols via single-particle fluorescence and optical morphology 

Aiden Jönsson, Jinglan Fu, Gabriel Pereira Freitas, Ian Crawford, Pavla Dagsson-Waldhauserová, Radovan Krejci, Yutaka Tobo, Karl Espen Yttri, and Paul Zieger

Large aerosol particles within the coarse mode affect the environment, climate, and human health in ways that strongly depend on particle type. Although this size range is dominated by mineral dust and sea spray aerosol (SSA), less abundant biological particles can exert disproportionate effects, such as triggering ice formation at comparatively warm temperatures. Accurate, type-resolved characterization of coarse-mode aerosols is therefore critical for understanding their environmental and climatic roles. Here, we present a new laboratory-based reference dataset for common coarse-mode aerosol sources, including pollen, dust, bacteria, and microplastics, based on laboratory measurements of single-particle ultraviolet light-induced fluorescence (UV-LIF) spectroscopy and particle morphology. Comparison with existing datasets reveals source-specific fluorescence signatures, but also demonstrates substantial overlap between biological and non-biological particles, which can lead to misclassification when fluorescence information is used alone.

Building on this dataset, we introduce a new machine-learning classification framework that combines fluorescence and morphological features. The algorithm is trained using laboratory data and evaluated with field observations from Zeppelin Observatory, Svalbard. To improve discrimination of combustion-related particles and to better separate dust from SSA, we apply domain adaptation using in situ measurements. The updated classifier successfully reproduces the previously reported annual bioaerosol cycle, yields higher bioaerosol concentrations than a fluorescence-only method, and maintains similar correlations with established biological and combustion tracers. Our open-source code enables more robust quantification of bioaerosols across a range of environments, allows reassessment of prior observations, and can be further improved as new particle characterization data become available.

How to cite: Jönsson, A., Fu, J., Pereira Freitas, G., Crawford, I., Dagsson-Waldhauserová, P., Krejci, R., Tobo, Y., Yttri, K. E., and Zieger, P.: Tracing biological, human, and inorganic sources of coarse aerosols via single-particle fluorescence and optical morphology, EGU General Assembly 2026, Vienna, Austria, 3–8 May 2026, EGU26-6675, https://doi.org/10.5194/egusphere-egu26-6675, 2026.

EGU26-6911 | ECS | Orals | AS3.4

A Potential Bioaerosol Source from Sewer Vent and its Health Risk Assessment 

Yongjian Deng, Jianing Liu, and Ting Fang

Bioaerosols are ubiquitous and can affect both air quality and public health. While natural sources are well-studied, anthropogenic sources, particularly emissions from sewer vents (SV) connected to indoor sanitation pipelines, remain insufficiently characterized. Such vents may episodically release fecal-associated microorganisms into ambient air during toilet flushing, yet their emission characteristics and exposure risks are not well quantified. Here we assess SV as a potential urban bioaerosol source and quantify inhalation exposure risks across four representative buildings: university dormitory, nursing home, residential community, and inpatient building. We monitored real-time particle emissions and simultaneously collected culturable bacteria and fungi at each SV and in the corresponding pedestrian zones (PZ) using two Andersen six-stage impactors. Chronic non-carcinogenic inhalation hazard quotients (HQs) were calculated based on estimated exposures. Results showed that culturable bacterial concentrations were higher at SV than PZ (ranging from 1.80 to 9.21 times) except the inpatient building, while fungal concentrations were opposite. Size-resolved measurements indicated that SV bacteria were dominated in particles >2.1 μm, while PZ bacteria had a larger coarse fraction, with 38% at >7 μm. Fungal aerosols at both locations were mainly at 1.1–4.7 μm range. Consistent with these patterns, bacterial HQs were higher at SV (0.15 males; 0.13 females) than at PZ (0.04 for both sexes). Fungal HQs exceeded bacterial HQs at both locations (SV: 0.20 males, 0.18 females; PZ: 0.21 males, 0.18 females), yet all HQs remained below commonly used reference thresholds. Ongoing work will apply high-throughput sequencing and SourceTracker to resolve microbial community composition and apportion SV contributions to PZ bioaerosols, informing targeted mitigation (e.g., filtration and UV sterilization) and supporting integration of sewer infrastructure into urban bioaerosol monitoring frameworks.

Keywords: bioaerosols; sewer vent; particle size distribution; culturable microorganisms; health risk assessment

How to cite: Deng, Y., Liu, J., and Fang, T.: A Potential Bioaerosol Source from Sewer Vent and its Health Risk Assessment, EGU General Assembly 2026, Vienna, Austria, 3–8 May 2026, EGU26-6911, https://doi.org/10.5194/egusphere-egu26-6911, 2026.

EGU26-7886 | Orals | AS3.4

Mind the weather signal in the Seasonal birch Pollen Integral 

Willem W. Verstraeten, Nicolas Bruffaerts, Rostislav Kouznetsov, Mikhail Sofiev, and Andy W. Delcloo

Operational pollen forecast models are potentially powerful tools for patients with allergic rhinitis symptoms caused by airborne pollen. Such a warning system can inform people in a timely manner so preventive measures and adapted medication doses can be taken. In Belgium a birch pollen forecast framework has been established based on the pollen emission and transport model SILAM (System for Integrated modeLling of Atmospheric composition) using a bottom-up approach. This implies, however, that spatially distributed birch pollen emission sources should be assessed before the start of the pollen release season.

We hypothesize that pre-seasonal meteorological-based proxies can be used in combination with the observed Seasonal Pollen Integral (SPIn) for updating the birch pollen emission source map into SILAM prior to the start of the birch pollen season.

Here we analyze the correlations between these pre-seasonal proxies and SPIn observations of birch pollen at the aerobiological surveillance network of Belgium for the period 1987 to 2019. Based on the correlations, temporal scaling factors are derived for updating the main birch pollen emission source map for Belgium (with 2018 as reference year). We evaluate the updated SILAM runs driven by ECMWF ERA5 meteorology by comparing multi-seasonal (2013-2019) modelled levels with daily observed pollen data from the surveillance network.

Preliminary analysis indicates that implementing updated pollen emission source maps in SILAM runs increase the model performance indicator R² (correlation coefficient) by 24% for daily airborne birch pollen levels, and by 90% for the SPIn values at all measurement sites of the network. However, by identifying and adjusting the impact of the weather effect on the observed SPIn values during the pollen season, the correlations with the pre-seasonal meteorological-based proxies as well as the SILAM model performance increase drastically. The R² between modelled and observed SPIn increases from 0.37 without any scaling to 0.71 including scaling and to 0.83 including weather adjusted scaling.

This shows the high potential for improving the modelling and forecasting of the birch pollen levels if pre-seasonal environmental data are included to assess the state of the spatial distributed birch pollen emission sources prior to the start of the pollen release season.

How to cite: Verstraeten, W. W., Bruffaerts, N., Kouznetsov, R., Sofiev, M., and Delcloo, A. W.: Mind the weather signal in the Seasonal birch Pollen Integral, EGU General Assembly 2026, Vienna, Austria, 3–8 May 2026, EGU26-7886, https://doi.org/10.5194/egusphere-egu26-7886, 2026.

EGU26-9988 | Posters on site | AS3.4

Assessing heatwave impacts on fungal spore emissions with real-time detection and next generation sequencing technologies 

Ian Crawford, Philippa Douglas, and Emma Marczylo

Bioaerosols are ubiquitous airborne microorganisms comprised of bacteria, fungi, pollen, virus and their constituents. Fungi have been associated with negative health effects ranging in severity from allergic reactions to asthma and serious infection, where susceptible individuals are at greater risk of life-threatening health outcomes resulting from exposure. While airborne fungi are abundant, they are poorly characterized due to the low temporal resolution of traditional offline sampling methods, limiting our understanding of key emission drivers in critical micro-environments and their impacts on air quality.

There is a critical need to better characterize background fungal aerosol concentrations to build baselines to explore exposure assessment. Here we investigate the utility of emerging real-time detection methods in conjunction with offline sampling during a two-week pilot study to characterize the outdoor concentrations of key aeroallergenic fungi at high time resolution.

A Multiparameter Bioaerosol Spectrometer (MBS) was deployed at UKHSA Chilton alongside a Burkard sampler during summer 2022, capturing the extreme European-wide heatwave which occurred 9-15th of August; The MBS is a biofluorescence spectrometer that classifies and quantifies bioaerosols on a single particle basis via their autofluorescent signatures, allowing for fungal aerosol concentrations to be derived at 5-minute time resolution; Next Generation Sequencing (NGS) was performed on daily integrated Burkard samples to provide broader fungal compositional context. Meteorological data was also recorded.

Clear diurnal behaviour in Cladosporium- and Penicillium-like aerosol was observed with the MBS, with maximums occurring in the late afternoon and early morning respectively. These characteristic diurnal emission features would not be evident from sample integrations typical of offline sampling.

Splitting the MBS real-time data into pre-heatwave and heatwave periods revealed that during heatwave conditions the environment was too hot and dry for the typical day time sporulation and emission of Cladosporium to occur, where the emission was delayed until the early morning when temperatures dropped and subsequently critical humidity levels had recovered; The typical early morning release of Penicillium was largely unaffected by the heatwave, however, daytime concentrations dropped to zero during the hottest and driest periods.

Analysis of the daily NGS data showed that the abundance of key species such as Alternaria and Cladosporium were enhanced during the heatwave, while Aureobasidium and Epicoccum are suppressed by heatwave conditions in our observations.

We demonstrate the utility of a complimentary real-time and offline NGS dual approach to gain deeper insights into fungal spore emissions. This allowed us for the first time to investigate the impacts of heatwave conditions on the emissions of key aeroallergenic species, providing insight into how diurnal emissions may be impacted by a warming climate. We also suggest that this approach shows promise for routine fungi monitoring to assess impacts on public health.

How to cite: Crawford, I., Douglas, P., and Marczylo, E.: Assessing heatwave impacts on fungal spore emissions with real-time detection and next generation sequencing technologies, EGU General Assembly 2026, Vienna, Austria, 3–8 May 2026, EGU26-9988, https://doi.org/10.5194/egusphere-egu26-9988, 2026.

EGU26-10690 | Orals | AS3.4

Pollen fragments amplify cross-boundary impacts on air quality 

Hao Zhang, Teruya Maki, Congbo Song, Ian Crawford, Martin Gallagher, Makra Laszlo, Emma Marczylo, Zhonghua Zheng, and David Topping

Pollen grains are recognized drivers of respiratory diseases, yet their fragments pose an even greater public health risk. However, the persistence, variability, and sources of these fragments remain largely unknown, hindering effective risk mitigation. Here we integrate real-time bioaerosol observations, DNA sequencing, a new data-driven framework, and atmospheric transport modelling to provide the first evidence of sustained cross-boundary transport of pollen fragments from the Asian continent to Japan. Pollen fragments dominated local exposures, exceeding intact grains by over sixfold, with continental sources contributing more than 30% from February to April and surpassing 70% in February. Such unaccounted-for episodes persisted for months, revealing a hidden health burden that current pollen alert systems fail to capture. This blind spot undermines Japan’s pollen risk mitigation strategies and highlights parallel gaps in international policy frameworks. Ignoring pollen fragments leads to systematic underestimation of health burdens, underscoring the urgent need for next-generation monitoring and coordinated cross-boundary policies to address this overlooked dimension of atmospheric bioaerosols.

How to cite: Zhang, H., Maki, T., Song, C., Crawford, I., Gallagher, M., Laszlo, M., Marczylo, E., Zheng, Z., and Topping, D.: Pollen fragments amplify cross-boundary impacts on air quality, EGU General Assembly 2026, Vienna, Austria, 3–8 May 2026, EGU26-10690, https://doi.org/10.5194/egusphere-egu26-10690, 2026.

EGU26-10985 | Posters on site | AS3.4

Impact of Atmospheric Aging on the Lipidomic Profile of Olive Pollen (Olea europaea L.) 

Kalliopi Violaki, Carolina Molina, Ernest Abboud, Christos Kaltsounoudis, Christos Panagiotopoulos, and Athanasios Nenes

Atmospheric biological particles, including pollen and other plant-derived materials, constitute a substantial fraction of coarse particulate matter, particularly during flowering seasons. Olive trees represent one of the most widespread crops in southern Europe, and olive oil is a major economic resource for the region. Approximately 95% of global olive cultivation is concentrated in the Mediterranean basin (Sofiev et al., 2017). Pollen production from an area with complete olive coverage can reach up to 10¹⁰ pollen grains m⁻² season⁻¹, with an average grain diameter of 20.1 ± 4.0 μm. Olive pollen is considered among the most allergenic tree pollens in Europe, inducing respiratory symptoms such as rhinitis and asthma in humans (Liccardi et al., 1996), while also acting as a significant atmospheric source of organic matter and nutrients to terrestrial and aquatic ecosystems (Rösel et al., 2012; Violaki et al., 2021).

In this study, a series of chamber experiments was conducted to investigate the response of olive pollen to atmospheric stressors, with a particular focus on NOx pollution. Olive pollen (Olea europaea L.) was collected between 5 and 7 May 2024 from Puglia, southern Italy (https://www.bonapol.com/). Prior to chamber exposure, comprehensive lipidomic, biological, and chemical characterizations were performed, including analyses of metals, major ions, and carbon content.

A robust analytical workflow for pollen lipidomics was developed and applied before and after chamber aging. Using LC-Q-TOF/MS with ESI in both positive and negative ionization modes, approximately 480 lipid species spanning 41 lipid classes were identified. Phosphatidylcholines (PC) were the dominant class (66%), followed by diacylglyceryl carboxyhydroxymethylcholine (DGCC, 19%), and ether monogalactosyldiacylglycerols (MGDG, 8%). A significant decrease in major membrane lipids (PC, PG, SM, DGDG, and MGDG) was observed after aging, indicating lipid degradation processes. In contrast, oxidized lipid species, including oxidized triacylglycerols (OxTG), oxidized phosphatidylcholines (OxPC), and ether-linked lipids, showed a pronounced increase, highlighting oxidative transformations induced by atmospheric aging. Overall, these results highlight the sensitivity of lipids in pollen grains to atmospheric aging and emphasize the importance of considering oxidative processing when assessing the chemical evolution of primary biological aerosol particles.


References

Liccardi et al., Int Arch Allergy Immunol. Nov;111(3):210-7, 1996.

Rösel, et al., Aquatic Sciences, 74, 87–99, 2012.

Sofiev, et al., Atmos. Chem. Phys., 17, 12341–12360, 2017.

Violaki, et al., npj Clim Atmos Sci 4, 63, 2021.

How to cite: Violaki, K., Molina, C., Abboud, E., Kaltsounoudis, C., Panagiotopoulos, C., and Nenes, A.: Impact of Atmospheric Aging on the Lipidomic Profile of Olive Pollen (Olea europaea L.), EGU General Assembly 2026, Vienna, Austria, 3–8 May 2026, EGU26-10985, https://doi.org/10.5194/egusphere-egu26-10985, 2026.

EGU26-12046 | ECS | Posters on site | AS3.4

Co-located real-time bioaerosol monitoring and measurements of Ice Nucleating Particles (INP) at the rural background station Melpitz 

Markus Hartmann, Maximilian Bastl, Laurent Poulain, Jens Voigtländer, Heike Wex, and Susan Hartmann

Biological ice nucleating particles (bio-INPs), as a subset of the broader class of biological aerosol particles, are known to be the most efficient INPs at temperatures above -15°C, and several laboratory studies have identified and characterized specific biological ice nucleators (e.g., Hartmann et al., 2025; Wieland et al., 2025). However, in field studies, a clear correlation or even attribution of INPs to specific biological aerosol particles or bioaerosol in general often remains elusive. While several factors contribute to this, one aspect is the lack of measurement techniques that can comprehensively characterize the bioaerosol. In recent years, significant progress has been made in this regard. By combining laser-induced fluorescence (LIF) techniques (fluorescent aerosol particles have typically been used as a proxy for the bioaerosol) with imaging techniques (e.g. holography), we now have instruments capable of identifying and quantifying, for example, pollen and spores of different taxa in situ and in real time. This opens up new possibilities to study the relationship between bioaerosol and INP in the field.

During the 2024 pollen season, we deployed a SwisensPoleno Jupiter (hereafter Poleno) at the ACTRIS-station Melpitz, a rural background station about 40km northeast of Leipzig (Germany). The Poleno is one of the aforementioned instruments that combines UV-induced fluorescence spectroscopy with digital holography (Sauvageat et al. 2020), allowing not only the measurement of bioaerosol concentrations, but also the identification of various taxa (mainly pollen and fungal spores) through an AI-driven classification algorithm. In parallel, a Hirst-type pollen trap was operated and its samples were evaluated by manual pollen and spore counting. These measurements of the pollen trap samples will be used as a reference for the Poleno measurements, as there are few comparative studies in the literature using this relatively new state-of-the-art instrument. In parallel to these measurements, aerosol particles were collected on polycarbonate filters for subsequent off-line INP analysis using droplet freezing array techniques. The INP samples were also heat-treated to determine the fraction of heat-labile, proteinaceous INPs, which is typically used as a lower limit for the amount of bio-INP in a sample.

First results from the comparison of daily mean Pollen concentrations derived with the Poleno (default classification) and the manually evaluated Hirst trap samples show overall good agreement. However, the level of agreement varies depending on the species.
Preliminary results of the INP analysis show generally high INP concentrations (up to 10-2 #/L at -7.5°C) with indications towards a seasonality, with more ice active samples being more frequent in spring/summer. Correlations of INP concentration (and type) with different bioaerosols (pollen and spores) will be investigated. Additionally, we plan to evaluate the efficacy of short-chained saccharides as an easy-to-measure proxy for pollen concentrations.

Hartmann, S., et al. (2025) Env. Sci. & Tech.
Sauvageat, E., et al. (2020) Atmos. Meas. Tech., 13, 1539–1550
Wieland, F., et al. (2025) Biogeosciences, 22, 103–115

How to cite: Hartmann, M., Bastl, M., Poulain, L., Voigtländer, J., Wex, H., and Hartmann, S.: Co-located real-time bioaerosol monitoring and measurements of Ice Nucleating Particles (INP) at the rural background station Melpitz, EGU General Assembly 2026, Vienna, Austria, 3–8 May 2026, EGU26-12046, https://doi.org/10.5194/egusphere-egu26-12046, 2026.

EGU26-12331 | Posters on site | AS3.4

Multi-instrument characterization of distinct sequential aerosol patterns at Puy de Dôme Mountain observatory, France: outcomes from the RACLET field campaign 

Marceau Larouère, Pierre Amato, Jean-Luc Baray, Régis Dupuy, Antoine Canzi, Laurent Deguillaume, Agnès Borbon, Jean-Marc Pichon, Mickaël Ribeiro, and Evelyn Freney

Organic and biological aerosols represent an important fraction of atmospheric particles, with identified impacts on atmopsheric physics and cloud processes (e.g., ice nucleation, chemical reactivity) and air quality. The RACLET measurement campaign (Reactive gases, Aerosols and CLouds, Exploring organic matter Transformations) was led in April 2024 at Puy de Dôme Mountain’s observatory (1465 m asl, central France), in the frame of the European research network ACTRIS (Aerosols, Clouds and Trace Gases Research Infrastructure), and supported by the ATMO-ACCESS program. Thanks to its altitude above the surrounding landscape and its geographical localization, this observation site offers unique possibilities of observing a range of atmospheric conditions (free troposphere, boundary layer, clouds) and air masses of different origins and composition (continental, marine, anthropogenic and saharan).

A range of real-time instruments were combined for several weeks in order to characterize aerosols at high temporal resolution through their morphological, optical, chemical and physical properties (SMPS, ACSM, OPC…), including the specific monitoring of bioaerosol particles using fluorescence-based intruments (DMT WIBS neo, Swisens Poleno Jupiter). The data were associated with meteorological variables, remote sensing measurements (LIDAR) and backward air mass trajectory analyses (CAT ECMWF ERA5). The main goal was to evaluate the benefits of combining multiple measurements techniques in the characterization of ambient organic aerosols, their interactions with reactive gases and cloud processes, and in the study of the transport and transformations processes of aerosols in dry or wet conditions. During the timeframe of the campaign, several consecutive periods with distinct patterns of aerosol properties could be identified, including distant desert dust intrusions from the Sahara region, elevated concentrations of coarse biological material, and plumes of anthropogenic influence. Detailed description of the different situations will be presented, and the benefits and limits of such multi-instrumented approach in the characterization of aerosols will be discussed. Particular attention has also been paid to the behaviour of fluorescence measurements throughout these events, and on their potential ability to discriminate between biological and non-biological particles.

How to cite: Larouère, M., Amato, P., Baray, J.-L., Dupuy, R., Canzi, A., Deguillaume, L., Borbon, A., Pichon, J.-M., Ribeiro, M., and Freney, E.: Multi-instrument characterization of distinct sequential aerosol patterns at Puy de Dôme Mountain observatory, France: outcomes from the RACLET field campaign, EGU General Assembly 2026, Vienna, Austria, 3–8 May 2026, EGU26-12331, https://doi.org/10.5194/egusphere-egu26-12331, 2026.

EGU26-13320 | ECS | Orals | AS3.4

Characterization of the Atmospheric Microbiome at a high-altitude station in the eastern Mediterranean using Flow Cytometry during the fall season 

Ernest Abboud, Carolina Molina, Sofia Gkretsi, Pierre Rossi, Romanos Foskinis, Prodromos Fetfatzis, Konstantinos Granakis, Konstantinos Eleftheriadis, Athanasios Nenes, and Kalliopi Violaki

Airborne biological materials (bioaerosols) disperse across ecosystems as they are transported through the atmosphere. This dispersal makes their detailed taxonomical composition characterization essential for understanding their ecological roles and potential impacts on public health. Although metagenomic approaches improved their characterization, complementary tools are needed to better understand their properties. One such tool is flow cytometry (FCM), an established method for analyzing microorganisms, but rarely applied to atmospheric bioaerosol studies (Negron et al., 2020, Liang et al., 2022, Abboud et al., 2026). This study aims to characterize and quantify bioaerosols using FCM to understand population variation at the Helmos Hellenic Atmospheric Aerosol & Climate Change Station (HAC2; Peloponnese, Greece, 2’314m asl, 42°N 05′, 34°E 14′). The sampling area is a typical free-tropospheric background site, with minimal influence from surface-polluted layers. It lies at the intersection of different air masses e.g., continental, Saharan and long-range biomass burning.

Sample collection (n = 55) was performed using a Coriolis µ high-volume wet cyclone over a period of 7 weeks in autumn (6 October to 28 November 2024) as part of the CleanCloud Helmos OrograPhic sIte experimeNt campaign (CHOPIN; http://go.epfl.ch/chopin-campaign). Combining nucleic acids for FCM staining with a self-organising map-based clustering algorithm (FlowSOM, Bioconductor - FlowSOM) after acquisition allowed us to identify populations characterized by low  and high nucleic acid content (LNA and HNA, respectively) (Abboud et al., 2026). The analysis included meteorological parameters and atmospheric pollutants, providing a comprehensive overview of these populations. Meanwhile, Oxford Nanopore Technologies (ONT) sequencing was employed to achieve in-depth taxonomic resolution.

The results show that the average number of bioaerosols collected in the planetary boundary layer (PBL, n = 39) was 1.5 ± 3.3 × 10⁵ m⁻³, compared to 8.7 ± 7.9 × 10³ m⁻³ in the free tropospheric layer (FTL, n = 13)., a decrease of two orders of magnitude between the layers. The LNA population dominated the bioaerosol fraction in both layers, accounting for 79% and 85% of the detected bioaerosols in the PBL and FTL, respectively, while intact cells represented 92% and 100%, respectively. In both layers, LNA population was smaller than the HNA, with mean diameters of 2.4 ± 0.9 µm and 4.4 ± 3.4 µm in the PBL, and 2.5 ± 1.3 µm and 4.3 ± 2.6 µm in the FTL, respectively. The different populations were taxonomically identified using ONT sequencing.


This work was supported by the Swiss National Science Foundation project LIPIC-Air (project number 215416) and the CleanCloud project, funded by the European Commission's Horizon Europe call for proposals, "Improved knowledge of cloud-aerosol interactions" (HORIZON-CL5-2023-D1-01-04).

References

Abboud E., Rossi P., Crouzy B., Nenes A.,Violaki K., (2026). Characterization of the Atmospheric Microbiome in a Semi-Rural Area of Central Europe Using Flow Cytometry. Under review in ISME Communication.

Liang L et al. (2022). The characterization and quantification of viable and dead airborne biological particles using flow cytometry and double fluorescent staining. J Aerosol Sci, 165.

Negron, A., Deleon-Rodriguez, N., Waters, S. M., Ziemba, L. D., Anderson, B., Bergin, M., Konstantinidis, K. T., & Nenes, A. (2020) Atmospheric Chemistry and Physics, 20(3), 1817–1838

How to cite: Abboud, E., Molina, C., Gkretsi, S., Rossi, P., Foskinis, R., Fetfatzis, P., Granakis, K., Eleftheriadis, K., Nenes, A., and Violaki, K.: Characterization of the Atmospheric Microbiome at a high-altitude station in the eastern Mediterranean using Flow Cytometry during the fall season, EGU General Assembly 2026, Vienna, Austria, 3–8 May 2026, EGU26-13320, https://doi.org/10.5194/egusphere-egu26-13320, 2026.

EGU26-14687 | Orals | AS3.4 | Highlight

Towards operational processing centre of the European AutoPollen network for automatic bioaerosol monitoring 

Mikhail Sofiev and the SYLVA project consortium

Bioaerosols interact with society and environment in a multi-faceted way. Information about biological aerosols in the atmosphere is at high demand for medical practitioners and allergy sufferers, climate change researchers, agriculture and forestry industries, air quality forecasters, a variety of information added-value businesses, and many other stakeholders. However, the monitoring practices established over 70 years ago and barely changed since then are country-specific, with varying data availability and usage policy. These roadblocks slow down cross-disciplinary research and development of measures to understand and, upon necessity, control societal and environmental impacts of bioaerosols.

A series of technological breakthroughs during last 10 years introduced a variety of automatic particle counters capable of bioaerosol monitoring in real time. They paved the way to the volunteering consolidation of European aerobiologists to establish the EUMETNET AutoPollen Programme (www.autopollen.net), laid down the foundation for the bioaerosol monitoring infrastructure with the EU Horizon SYLVA project (A SYstem for reaL-time obserVation of Aeroallergens, https://sylva.bioaerosol.eu), initiated developments of European standards and guidelines for the automatic bioaerosol measurements with the EURAMET project BioAirMet, and started the European standardization effort with CEN WG 39.

The new technologies allow to observe bioaerosol concentration in real time, analyze vertical concentration profiles via remote-sensing, perform metagenomic analysis of bioaerosols with the 3rd generation DNA sequencing technique, and combine these observations with atmospheric composition models. Newly established regional networks have been connected to regional atmospheric composition models, which assimilate the real-time regional data to improve the forecasts. It changes the existing paradigm of bioaerosol observations as the new monitoring networks involve large-scale data handling infrastructure, which also includes numerical models as an interface between the different technologies and a bridge to users of information.

The new observations heavily rely on sophisticated technologies, such as high-resolution image analysis, holography, multi-band scatterometry and fluorescence spectrometry, lidar-based remote sensing, and nanotechnology for DNA sequencing. A particle recognition task, the key challenge for the new devices, is solved via machine learning approaches. Technological complexity of the new instruments and large amounts of raw data they produce have been recognized, and a European-scale solution has been proposed by AutoPollen/SYLVA. AutoPollen is being converted into a EUMETNET operational programme with the SYLVA infrastructure as its technological backbone. The programme, with support of Copernicus Atmosphere Monitoring Service (https://atmosphere.copernicus.eu), ACTRIS aerosol monitoring network, and other stakeholders, will become operational from 2027. The central processing system will be hosted by Finnish Meteorological Institute with support of MeteoSwiss, Technical University of Munich, and all SYLVA partners. The pre-operational work of AutoPollen/SYLVA started already in 2025, owing to the efforts of the SYLVA consortium, its sister projects and collaborators. The programme is open for all European (and from outside Europe) groups performing automatic bioaerosol monitoring. AutoPollen offers technological and organizational support, community-developed bioaerosol monitoring solutions, and a motivated team of experts advancing the relevant research and applications.

How to cite: Sofiev, M. and the SYLVA project consortium: Towards operational processing centre of the European AutoPollen network for automatic bioaerosol monitoring, EGU General Assembly 2026, Vienna, Austria, 3–8 May 2026, EGU26-14687, https://doi.org/10.5194/egusphere-egu26-14687, 2026.

EGU26-16549 | ECS | Posters on site | AS3.4

Comparative Characterization of Atmospheric Bioaerosols in the Yangtze River Delta and the Tibetan Plateau 

Baifeng Zhu, Peng Zhao, Andrew P. Morse, and Xie Jiajun

Bioaerosols are an important component of atmospheric particulate matter and include a wide range of biological materials such as bacteria, fungal spores, pollen, and biological fragments, originating from sources including vegetation, soil, water surfaces, and human activities. They play a key role in air quality, climate processes, and ecosystem functioning. While bioaerosol sources and properties are expected to differ markedly between polluted urban regions and remote background environments, direct comparative observational evidence remains limited.

In this study, we present a comparative characterization of bioaerosols under contrasting atmospheric conditions in eastern China and the Tibetan Plateau (TP), using real-time measurements from a Wideband Integrated Bioaerosol Sensor (WIBS). Field observations were conducted at an urban site in the Yangtze River Delta (YRD), strongly influenced by anthropogenic emissions, and at a high-altitude background site on the TP, representing a minimally disturbed environment. Particle-resolved fluorescence signals, optical size, and number concentrations were analyzed to examine regional differences in bioaerosol abundance and properties. In addition, unsupervised clustering methods were applied to classify bioaerosol particles based on their optical and fluorescence characteristics.

Clear contrasts in bioaerosol behavior were observed between the two regions. The YRD site exhibited substantially higher bioaerosol concentrations and pronounced diurnal variability, closely associated with pollution periods and urban atmospheric dynamics. In contrast, bioaerosols observed on the TP were characterized by lower concentrations and distinct size distributions, reflecting cleaner background conditions. Clustering results further indicate differences in dominant bioaerosol types: bioaerosols in the YRD were largely associated with anthropogenic-influenced biological particles, whereas the TP showed fluorescence types more closely linked to natural sources such as vegetation and long-range atmospheric transport.

Overall, this study demonstrates how environmental context strongly influences bioaerosol abundance, composition, and temporal behavior. By combining real-time fluorescence measurements with data-driven classification, this work provides a coherent framework for comparing bioaerosols across contrasting atmospheric environments and contributes to a broader understanding of bioaerosol variability within the Earth system.

How to cite: Zhu, B., Zhao, P., Morse, A. P., and Jiajun, X.: Comparative Characterization of Atmospheric Bioaerosols in the Yangtze River Delta and the Tibetan Plateau, EGU General Assembly 2026, Vienna, Austria, 3–8 May 2026, EGU26-16549, https://doi.org/10.5194/egusphere-egu26-16549, 2026.

EGU26-17844 | ECS | Orals | AS3.4

Ozone-free electrostatic collection of aerosolised microspheres 

Etelka Chung, Milad Heidari-Koochi, Lanka Weerasiri, Ian Johnston, Ian Munro, and Loic Coudron

The transmission of pathogenic bioaerosols poses a substantial risk not only to human health but also to animal welfare and agricultural productivity, where the spread of infections can lead to significant economic and public health system burdens. This underscores the importance of developing reliable aerosol sampling techniques that can capture airborne particles.

Electrostatic precipitation (ESP) is a promising method for aerosol collection1. However, its dependence on corona discharge to charge particles generates ozone byproducts. The presence of ozone can compromise the integrity of bioaerosols2. This is problematic in applications where preserving the viability of the collected bioaerosols is essential, such as those requiring cultivation. Therefore, to address this limitation whilst keeping the advantages of ESP-based techniques, ozone-free (i.e. corona discharge-free) electrostatic actuation was investigated as a potential alternative.

Indium tin oxide (ITO)-coated microscope slides (Diamond Coatings) were electrically connected to four different electrical conditions: negative, positive, grounded, and floating (no connection) in an 8 m3 aerosol test chamber. Voltages between -10kV to +10kV were applied. 1 µm diameter fluorescent polystyrene microspheres (PSL) were used as model aerosolised particles. Four optical particle counters (OPC-N3, Alphasense) were positioned in the vicinity of the slides to continuously monitor aerosol concentration. For each experiment, aerosols were nebulised for 15 minutes, followed by a 10-minute sampling period during which voltages were applied. Afterwards, the chamber was cleaned using an extraction system equipped with HEPA filter, and then the samples were retrieved for imaging using an EVOSM700 fluorescence microscope. Particle counts were obtained using Celeste 6 analysis software and normalised against the chamber concentration. To direct the particle flow towards the slide, aiming to enhance the collection efficiency, a fan-assisted collection device was constructed to direct airflow onto the slide (Fig 1a). Fan speed and spatial placement were varied to optimise collection efficiency.

Ozone-free electrostatic collection of PSL particles was successfully demonstrated, with both positive and negative biases collecting up to 17.0 and 8.5 times more PSL particles than the grounded and floating slides, respectively. A correlation was observed between applied voltage and collection performance, as higher voltages generated stronger electric fields, thereby enhancing the electrostatic force and particle capture. The simple fan-driven collection device achieved an initial collection efficiency of 31.5%. Investigation into fan speed and spatial positioning revealed that lower fan speeds and a closer fan-to-collection-medium distance performed better, with the highest collection efficiency at 59.1% at 10.9 L/min air flow rate (lower speed setting) (Fig 1b).

These findings demonstrate that ozone-free electrostatic collection is an effective alternative approach to the ESP-based method for aerosol collection, with the potential of maintaining bioaerosol viability, which will be tested in the near future to confirm. Overall, the results establish a foundation for advancing electrically actuated aerosol collection devices and highlight promising future applications in public health surveillance, environmental bioaerosol monitoring, and agricultural biosecurity.

This work was supported by Research England-funded Biodetection Technologies Hub and the Engineering and Physical Sciences Research Council [grant number EP/X017591/1].

References: [1] Foat et al. (2016), [2] Ouyang et al. (2023).

How to cite: Chung, E., Heidari-Koochi, M., Weerasiri, L., Johnston, I., Munro, I., and Coudron, L.: Ozone-free electrostatic collection of aerosolised microspheres, EGU General Assembly 2026, Vienna, Austria, 3–8 May 2026, EGU26-17844, https://doi.org/10.5194/egusphere-egu26-17844, 2026.

EGU26-18730 | ECS | Orals | AS3.4

Coupling aerosol hygroscopicity and fluorescence using lidar and in situ observations during the 2024–2025 CHOPIN campaign 

Marilena Gidarakou, Alexandros Papayannis, Romanos Foskinis, Olga Zografou, Julia Schmale, Maria I. Gini, Paul Zieger, Aiden Jönsson, Alkistis Papetta, Franco Marenco, Prodromos Fetfatzis, Konstantinos Granakis, Konstantinos Eleftheriadis, and Athanasios Nenes

Aerosol hygroscopicity play a fundamental role on cloud activation, radiative transfer, and particle–light interactions, yet its impact on fluorescence properties remains poorly understood. During the CleanCloud Helmos OrograPhic site experimeNt (CHOPIN) campaign at Mount Helmos, Greece (38.0°N, 22.2°E; 1700–2314 m a.s.l.), aerosol hygroscopicity and fluorescence were investigated across two periods: autumn (Oct–Nov 2024) and spring (Apr–May 2025). The high altitude and strategic location of the site allow the observation of a wide variety of aerosol types, including Saharan dust, biomass burning smoke, urban pollution, and biogenic particles.

A multi-wavelength elastic-Raman–fluorescence lidar (ATLAS-NEF) operating at 355, 387, 407 and 470 nm, provided vertically resolved aerosol optical properties (extinction, backscatter, lidar ratios) and water vapor mixing ratios, as well as fluorescence backscatter profiles.

Hygroscopic growth factors were derived from Raman-based backscatter following Hänel-type parameterizations, supported by measurements (pressure, temperature, and relative humidity) from radiosondes, a tethered helikite, and Unmanned Aerial Vehicles (UAVs). Fluorescence quenching was quantified as a function of relative humidity and compared to the optical growth exponent γ, while the Wideband Integrated Bioaerosol Sensor (WIBS) and Multiparameter Bioaerosol Sensor (MBS) provided information on bioaerosol concentrations and types.

Aerosol backscatter generally increased with relative humidity, while fluorescence decreased, indicating humidity-dependent quenching. Biogenic particles showed strong fluorescence but limited hygroscopic growth, whereas dust and urban aerosols were moderately hygroscopic with reduced fluorescence. Synergies with MBS and WIBS highlighted temporal variability in bioaerosol concentrations, linking lidar fluorescence changes to particle composition and aging. These results demonstrate that this synergistic approach provides a robust framework to assess humidity-driven changes in optical and microphysical properties, with implications for cloud formation and radiative forcing.

How to cite: Gidarakou, M., Papayannis, A., Foskinis, R., Zografou, O., Schmale, J., Gini, M. I., Zieger, P., Jönsson, A., Papetta, A., Marenco, F., Fetfatzis, P., Granakis, K., Eleftheriadis, K., and Nenes, A.: Coupling aerosol hygroscopicity and fluorescence using lidar and in situ observations during the 2024–2025 CHOPIN campaign, EGU General Assembly 2026, Vienna, Austria, 3–8 May 2026, EGU26-18730, https://doi.org/10.5194/egusphere-egu26-18730, 2026.

EGU26-18758 | Orals | AS3.4

Characterising respiratory aerosol emissions from speech and therapy activities using Wideband Integrated Bioaerosol Sensor (WIBS-NEO) 

Jianghan Tian, Alicja Szczepanska, Joshua Harrison, Justice Archer, Bryan Bzdek, Jonathan Reid, Ian Crawford, Maxamillian Moss, David Topping, Brian Saccente-Kennedy, Ruth Epstein, Declan Costello, James Calder, and Pallav Shah

Introduction

Respiratory aerosols are a major vector for the transmission of respiratory diseases such as COVID-19. Phonation and speech are known sources of respirable aerosol in humans. Previous studies have shown that intensified vocal activities can produce aerosol concentrations exceeding those from conversational speech by more than a factor of 10, and those from quiet breathing by up to a factor of 30.1,2 The number and mass concentrations of aerosols emitted during breathing, speaking, and singing, as well as their dependence on vocal loudness, are now relatively well characterised.3,4 However, a clear gap remains in time-resolved and single-particle measurements of respiratory aerosol composition, and in the application of instruments widely used in atmospheric bioaerosol research5,6 to clinical and voice-related settings. Addressing this gap is critical for improving our mechanistic understanding of respiratory aerosol generation and for informing safer clinical practice.

Method

The WIBS-NEO was deployed in a zero-background clinical setting, allowing aerosols to be directly attributed to specific vocalisations. 14 healthy participants performed a range of speech and voice activities, including humming (/m:/), sustained phonation (/a:/), fricatives (/ʒ/ pulses), projection (“Hey!”), and tongue trills, with breathing and speaking as reference measurements. The WIBS-NEO measured aerosol size (optical diameter, µm), shape (asymmetry factor, AF), number concentration (cm⁻³), and fluorescence intensity, while an Aerodynamic Particle Sizer (APS; TSI) was deployed concurrently to validate size distributions and concentrations.

Results

Several key findings emerge from this study. Figure 1 shows box-and-whisker plot of the total particle and fluorescent particle number concentrations measured by the WIBS-NEO across the different activities. Based on the mean values (rather than max/min), aerosol emissions increase in the following order: breathing (~0.1 particles/cm3), speaking, fricatives, projection, phonation, humming, and tongue trills (~0.5 particles/cm3), spanning about five orders of magnitudes across activities. Total particle number concentrations measured by the WIBS-NEO are comparable in magnitude to those obtained using the APS.

Fluorescent particles contribute approximately half of the total particle number concentration for most activities, indicating that 50% of emitted aerosols exhibit detectable fluorescence (60% for fricatives). This suggests that a substantial fraction of respiratory aerosols carry proteinaceous and other fluorescent compounds derived from human respiratory fluid.

Single-particle fluorescence analysis further shows that, among fluorescent particles, type A particles dominate (>90%), followed by type AB particles (~8%). This distribution indicates that respiratory aerosol fluorescence is primarily associated with fluorophores in the tryptophan- and albumin-dominated regions, with additional contributions from flavins (e.g., riboflavin). These findings are consistent with complementary bulk fluorescence spectroscopic measurements of human respiratory fluid samples.

Conclusion

This study demonstrates the suitability of the WIBS-NEO for characterising respiratory aerosols generated during human vocal activities in a clinical environment. Voice-related tasks produce elevated aerosol emissions relative to quiet breathing, with a substantial fraction exhibiting protein-associated fluorescence consistent with respiratory fluid. These fluorescent aerosols may serve as carriers of airborne pathogens and as potential markers for their detection. The WIBS-NEO’s ability to deliver time-resolved, single-particle fluorescence measurements supports its use for identifying higher-risk vocal tasks and informing evidence-based mitigation strategies in clinical practice.

How to cite: Tian, J., Szczepanska, A., Harrison, J., Archer, J., Bzdek, B., Reid, J., Crawford, I., Moss, M., Topping, D., Saccente-Kennedy, B., Epstein, R., Costello, D., Calder, J., and Shah, P.: Characterising respiratory aerosol emissions from speech and therapy activities using Wideband Integrated Bioaerosol Sensor (WIBS-NEO), EGU General Assembly 2026, Vienna, Austria, 3–8 May 2026, EGU26-18758, https://doi.org/10.5194/egusphere-egu26-18758, 2026.

EGU26-19276 | Posters on site | AS3.4

Advances in pollen forecast quality across CAMS regional models 

Yuliia Palamarchuk, Mikhail Sofiev, Rostislav Kouznetsov, and Michael Gauss

The allergenic pollen forecast has become a standard part of the daily air quality production chain of the regional CAMS (Copernicus Atmosphere Monitoring Service) models. The first operational European pollen forecasts started in 2013 based on the developments within MACC (Monitoring Atmospheric Composition and Climate, the predecessor of CAMS) and were released during its Interim Implementation phase (MACC-II). The four-day birch predictions were computed by seven regional models (CHIMERE, EMEP, EURAD-IM, LOTOS-EUROS, MATCH, MOCAGE, SILAM) and aggregated into a multi-model ENSEMBLE. The establishment of European pollen forecasts and their evaluation were supported by cooperation with the European Aeroallergen Network (EAN), which serves as the main provider of pollen observations in Europe. Over the years, the CAMS model cluster was expanded with four new independent models DEHM, GEMAQ, MINNI, MONARCH and the list of pollen forecasts was gradually extended with olive, alder, grass, ragweed, and mugwort species. Currently, the CAMS European pollen forecast is delivered by eleven state-of-the-art chemical transport models and their ENSEMBLE for six pollen species. Only recently has the systematic evaluation of CAMS pollen predictions developed into regular reports published at the end of the season.

Present work will demonstrate the progress in the model’s performance across 11 CAMS regional models and their ENSEMBLE, based on the evaluation of daily timeseries from first-day hourly model forecasts. The forecast accuracy will be assessed in terms of the model mean bias, temporal correlation coefficient, root mean square error, and shifts in the pollen season start and end of the aerobiological season.

The analysis shows that there is no ultimate ”best” model. Depending on the type of pollen and the evaluation score, the different models appear to be good. In 2024 the ENSEMBLE scores were among the best, sometimes outperforming all individual models. The median ENSEMBLE was, in most cases, capable of disregarding the outliers, still providing good forecasts. Exception was the alder forecast, where the majority of models were very low, and the resulting underestimation penetrated through the median, leading to a strongly low-biased ENSEMBLE. Practically all models showed some deviations from the main ENSEMBLE for individual pollen species.

How to cite: Palamarchuk, Y., Sofiev, M., Kouznetsov, R., and Gauss, M.: Advances in pollen forecast quality across CAMS regional models, EGU General Assembly 2026, Vienna, Austria, 3–8 May 2026, EGU26-19276, https://doi.org/10.5194/egusphere-egu26-19276, 2026.

EGU26-19329 | Posters on site | AS3.4

Concurrent SwisensPoleno Jupiter and WIBS-5 Measurements of Atmospheric Bioaerosols at the Sonnblick Observatory 

Julia Burkart, Tobias Könemann, Adrien Danner, Gerhard Schauer, Christian Maier, Thomas Bachleitner, Darrel Baumgardner, Dagen D. Hughes, and Elke Ludewig

We present concurrent measurements of atmospheric bioaerosols at the Sonnblick Observatory obtained with a SwisensPoleno Jupiter and a WIBS-5 from DROPLET ENVEA Group between August and November 2024. The observatory is located directly at the top of Mount “Hoher Sonnblick” (3106 m a.s.l.) and serves as an ACTRIS national facility for in-situ aerosol observations and as European Center for Cloud ambient INTercomparison (ECCINT). Because of its high altitude, the station is often immersed in clouds, making it suitable for studying aerosol–cloud interactions. Bioaerosols are known to act as ice-nucleating particles at relatively high temperatures, but their occurrence in the atmosphere is still poorly understood. Therefore, assessing the presence of bioaerosols at this high alpine site is of particular interest.

During the late summer 2024 ECCINT intercomparison campaign, the WIBS-5  was operated alongside the permanently installed SwisensPoleno Jupiter. Both instruments detect fluorescence signals of single particles, but exhibit differences in excitation sources and detection wavebands. Also, the SwisensPoleno Jupiter uses a particle concentrator to enhance the sampling of larger particles (≥10 µm) and additionally provides holographic images. In contrast, without a concentrator, the WIBS-5 primarily samples smaller particles down to 500 nm.

In this presentation, we first present data from both instruments independently and examine observed bioaerosol patterns in relation to other aerosol properties and meteorological conditions. For the WIBS-5, we apply the common classification scheme dividing particles into A, B, C classes and their combinations, while for the SwisensPoleno Jupiter we use a deterministic classification roughly separating particles into pollen-, spore-, plant-debris-, dust-like, and other fluorescent types.

In the second step, we compare data from the two instruments to illustrate how differences in size sensitivity and detection approach relate to observed bioaerosol patterns. We also discuss how the instruments can be used complementarily to provide a broader view of bioaerosol presence in the atmosphere.

How to cite: Burkart, J., Könemann, T., Danner, A., Schauer, G., Maier, C., Bachleitner, T., Baumgardner, D., D. Hughes, D., and Ludewig, E.: Concurrent SwisensPoleno Jupiter and WIBS-5 Measurements of Atmospheric Bioaerosols at the Sonnblick Observatory, EGU General Assembly 2026, Vienna, Austria, 3–8 May 2026, EGU26-19329, https://doi.org/10.5194/egusphere-egu26-19329, 2026.

EGU26-19416 | Posters on site | AS3.4

Phenological changes in Amaranthaceae pollen in south-eastern Spain (Mediterranean region) 

José María Moreno, Francisco Aznar Martínez, Luis Negral Alvarez, and Stella Moreno Grau

The Amaranthaceae family comprises approximately 173 genera and more than 2100 species, many of which are important from an ornamental, agronomic and clinical point of view due to the high prevalence of allergic sensitisation associated with their pollen. It has been suggested that species in this family could maintain or even increase their presence under changing climate scenarios, given their high tolerance to poor soils and prolonged arid conditions.

This study analyses aerobiological and phenological variables of Amaranthaceae pollen in three cities in south-eastern Spain (Cartagena, Murcia and Lorca; Region of Murcia) during the period 2010–2021. Data from the Aerobiological Network of the Region of Murcia (REAREMUR) were used, obtained using Hirst-type volumetric traps (VPPS 2000) and analysed following standardised methodologies (EN 16868:2019).

The results show two main pollen release seasons (MPS 1 and MPS 2), defined using the Nilsson and Persson (1981) method: a first peak in spring (April-June) and a second peak in summer (July-September). During MPS 1, the highest concentrations were recorded in Lorca, followed by Murcia and Cartagena, while in MPS 2 this pattern was reversed, with peaks in Cartagena. However, since 2017, a pronounced and sustained decline in concentrations during MPS 2 has been observed in Cartagena, a behaviour also described in other coastal cities in south-eastern Spain, such as Alicante and Almería.

Trend analysis using linear regression showed a significant increase in Seasonal Pollen Integral (SPIn) in Cartagena during MPS 1. In MPS 2, a significant advance in the start of the season, a delay in the end, and an increase in its duration were detected, along with a significant decrease in both the peak day concentration and the SPIn. In Lorca, MPS 1 showed an earlier start and longer duration, while in MPS 2, a prolongation of the period was also observed, associated with a delay in the end date. No statistically significant trends were identified in Murcia. These trends were re-evaluated using the non-parametric Mann-Kendall test and the Theil-Sen slope estimate, which confirmed these results, except in the case of the increase in SPIn in MPS 1 in Cartagena, which did not reach statistical significance. During MPS 1 in Lorca, no significant trends were found with this test either, although the results were replicated in MPS 2.

Overall, the results point to a phenological change in Amaranthaceae pollen in south-eastern Spain, with a significant decrease in the amount of pollen in the bioaerosol in MPS 2, raising concerns about a possible impact on plant biodiversity that should be addressed.

The result of this work is part of grant PID2024-157581OB-I00, funded by MICIU/AEI/10.13039/501100011033 and by the FSE+.

How to cite: Moreno, J. M., Aznar Martínez, F., Negral Alvarez, L., and Moreno Grau, S.: Phenological changes in Amaranthaceae pollen in south-eastern Spain (Mediterranean region), EGU General Assembly 2026, Vienna, Austria, 3–8 May 2026, EGU26-19416, https://doi.org/10.5194/egusphere-egu26-19416, 2026.

EGU26-19423 | Posters on site | AS3.4

Real-time pollen monitoring across Europe with the Swisens Poleno by a deep-learning classifier: laboratory and field validation 

Evgeny Kadantsev, Rostislav Kouznetsov, and Mikhail Sofiev

Real-time air-flow cytometry has been rapidly expanding as a method for monitoring airborne biological particles, providing continuous measurements with high temporal resolution. This is particularly relevant for pollen monitoring, where accurate and timely information is needed for health-related applications. In this study, we present results from measurements performed with the Swisens Poleno air-flow cytometer, an automated instrument combining light-scattering, holographic imagery, fluorescence excitation, and polarization measurements to detect and classify airborne bioaerosols.

For data analysis, a deep-learning pollen-recognition classifier was used to target the most common pollen taxa in Europe. The classifier was trained on pollen samples provided to the device under laboratory conditions and achieved an average classification accuracy above 90%, with most errors occurring between morphologically similar taxa. Performance in real atmospheric measurements was expectedly lower. To evaluate and correct this, classifier-processed Poleno measurements were compared with co-located measurements from manual Hirst-type traps across Europe. A transposed confusion-matrix correction was applied to account for systematic misclassifications, improving agreement with reference data. The resulting performance was further evaluated for Poleno measurements available through the EU Horizon SYLVA project.

These results demonstrate that combining real-time cytometry with machine-learning and correction techniques provides a reliable and effective approach for automated pollen monitoring, supporting the broader advancement of bioaerosol observation and health-related applications.

How to cite: Kadantsev, E., Kouznetsov, R., and Sofiev, M.: Real-time pollen monitoring across Europe with the Swisens Poleno by a deep-learning classifier: laboratory and field validation, EGU General Assembly 2026, Vienna, Austria, 3–8 May 2026, EGU26-19423, https://doi.org/10.5194/egusphere-egu26-19423, 2026.

EGU26-19530 | ECS | Posters on site | AS3.4

Fungal liquid jets as a source of sub- and supermicron particles 

Dennis Geis, Sebastian Brill, Stefanie Hildmann, Paulo Artaxo, Michał Chilinski, Wolfgang Elbert, Jana Englert, Ricardo Godoi, Thorsten Hoffmann, Jan Leitner, Thomas Rauch, Bruna Sebben, Eckhard Thines, Bettina Weber, Jens Weber, Markus Weigand, Bruno B. Meller, Ulrich Pöschl, and Christopher Pöhlker

Primary biological aerosols such as pollen, fungal spores, bacteria and plants debris have traditionally been associated with the coarse particle mode. In contrast, small organic particles in the submicron range have largely been attributed to secondary formation processes, as few primary biogenic sources were known [1-3]. Due to their hygroscopic properties, bioaerosols may act as cloud condensation nuclei (CCN) and ice nuclei (IN), potentially influencing cloud formation and precipitation [4]. In the Amazon rainforest, coarse particles are typically present at lower number concentrations, whereas fine organic particles are more abundant and thus are known to contribute significantly to cloud microphysics under certain conditions [1,5].

In this study, we investigate a previously overlooked primary biogenic source of organic aerosol droplets linked to spore release by many fungi and lichens, with measurements conducted at the Amazon Tall Tower Observatory (ATTO) site in Brazil [6]. Many lichenized and non-lichenized Ascomycota release spores actively, building pressure in their reproductive cells through osmolyte-driven water influx until the spores are suddenly expelled.

We combined controlled laboratory experiments with ambient field measurements to characterize particles emitted during this process. Particle size distributions were measured in isolated chamber experiments using two complementary particle sizers covering a broad size range, providing information on both particle size and emission strength. Field experiments gave insights into emission patterns and triggers under natural tropical forest conditions. Droplets were additionally collected by impaction for further microscopic and chemical analyses. The chemical composition was determined using scanning transmission X-ray microscopy with near-edge X-ray absorption and fine structure (STXM-NEXAFS) spectroscopy, as well as high performance liquid chromatography (HPLC) with electrospray ionisation ultra-high resolution orbitrap mass spectrometry (ESI-UHR-Orbitrap-MS).

This integrated approach allows us to assess the size, chemical composition, and emission strength of fungal aerosol emissions. The findings provide new insights into the contribution of sub- and supermicron fungal emissions to organic aerosol populations and their potential implications for atmospheric processes.

[1] Pöschl, U., et al. (2010). Rainforest aerosols as biogenic nuclei of clouds and precipitation in the Amazon. Science, 329, 1513–1516. https://doi.org/10.1126/science.1191056
[2] Barbosa, C. G. G., et al. (2022). Amazon rainforest aerosols: Characterization and implications for climate. npj Climate and Atmospheric Science, 5, 73. https://doi.org/10.1038/s41612-022-00294-y
[3] Graham, B., et al. (2003). Source attribution and seasonality of Amazon aerosol: Implications for cloud formation. Journal of Geophysical Research: Atmospheres, 108. https://doi.org/10.1029/2003JD004049
[4] Pöhlker, M. L., et al. (2023). Global organic and inorganic aerosol hygroscopicity and its effect on radiative forcing. Nature Communications, 14(1), 6139. https://doi.org/10.1038/s41467-023-41695-8
[5] Moran-Zuloaga, D., et al. (2018). Long-term study on coarse mode aerosols in the Amazon rainforest with frequent intrusion of Saharan dust plumes. Atmospheric Chemistry and Physics, 18(13), 10055–10088. https://doi.org/10.5194/acp-18-10055-2018
[6] Andreae, M. O., et al. (2015). The Amazon Tall Tower Observatory (ATTO): Overview of pilot measurements on ecosystem ecology, meteorology, trace gases, and aerosols. Atmospheric Chemistry and Physics, 15(18), 10723–10776. https://doi.org/10.5194/acp-15-10723-2015

How to cite: Geis, D., Brill, S., Hildmann, S., Artaxo, P., Chilinski, M., Elbert, W., Englert, J., Godoi, R., Hoffmann, T., Leitner, J., Rauch, T., Sebben, B., Thines, E., Weber, B., Weber, J., Weigand, M., Meller, B. B., Pöschl, U., and Pöhlker, C.: Fungal liquid jets as a source of sub- and supermicron particles, EGU General Assembly 2026, Vienna, Austria, 3–8 May 2026, EGU26-19530, https://doi.org/10.5194/egusphere-egu26-19530, 2026.

EGU26-21646 | ECS | Posters on site | AS3.4

Linking airborne pollen concentrations and meteorological conditions in Greece 

George Roditis, Elina Giannakaki, Ioanna Pyrri, and Iliana Koutsoupi

Atmospheric pollen concentrations exhibit strong temporal variability driven by plant
phenology and affected by meteorological conditions, yet the strength and consistency of
pollen-meteorology relations depend on region and pollen taxon. In this study, we examine
the relationships between daily airborne pollen concentrations and meteorological
parameters across three regions in Greece, i.e. Athens, Thessaloniki and Finokalia (Crete)
using multiple meteorological datasets and correlation metrics. Pollen observations were
obtained from aerobiological monitoring stations, while meteorological information was
derived from ERA5 reanalysis and nearby meteorological stations. Additionally, for Athens
and Thessaloniki, the Climpact dataset with meteorological parameters was used.
Correlation analyses were performed for selected pollen taxa, grouped pollen categories and
total pollen concentrations using Pearson, Spearman, and Kendall correlation coefficients.
Lagged correlations were also examined for delayed influences on pollen variability, and
analyses were conducted with both including and excluding zero-pollen days.
The results indicate marked regional and taxon-specific variability in pollen–meteorology
relationships. Temperature and relative humidity exhibit the strongest associations with
pollen concentrations, with correlation values ρ reaching -0,75 and 0,57 respectively. Non-
parametric Spearman correlation coefficient provides more stable relationships compared to
Pearson correlation, particularly for taxa with highly skewed distributions. Across data
sources (ERA5, station observations, and climpact datasets), correlation estimates are
generally comparable, suggesting that the pollen–meteorology relationships are robust to
the choice of meteorological dataset.
Overall, the results demonstrate that airborne pollen concentrations are systematically
related to meteorological conditions, with the strength and structure of correlations
depending primarily on region, pollen taxon, and the statistical approach applied.

How to cite: Roditis, G., Giannakaki, E., Pyrri, I., and Koutsoupi, I.: Linking airborne pollen concentrations and meteorological conditions in Greece, EGU General Assembly 2026, Vienna, Austria, 3–8 May 2026, EGU26-21646, https://doi.org/10.5194/egusphere-egu26-21646, 2026.

EGU26-23287 | Posters on site | AS3.4

Interpretable pollen classification using empirical feature filtering and random forest models on holographic airflow cytometry data 

Andreas Schwendimann, Kilian Koch, Yanick Zeder, Erny Niederberger, and Sophie Erb

Automatic pollen monitoring has become increasingly important for aerobiology, public health, and climate-related 
studies. Across Europe, manual Hirst-type traps are progressively complemented or fully replaced by automatic 
instruments that acquire particle-resolved measurements and apply machine-learning–based classification instead of 
manual light-microscopic identification. This transition enables real-time pollen information but introduces new 
challenges related to data quality, model interpretability, and computational efficiency. 


SwisensPoleno instruments are airflow cytometers that measure individual airborne particles in-flight. Each particle is 
characterized by an array of sensors, including two orthogonal digital holography images, from which morphological 
features are derived. Previous modelling approaches for pollen classification have largely relied on deep learning 
architectures leveraging the full images. While these methods can achieve high accuracy, they are computationally 
expensive to train and evaluate, are prone to overfit for the particular regions where training data was generated and 
exhibit a black-box nature that complicates error analysis and systematic performance improvements. Persistent offseason false positives have thus remained difficult to diagnose and mitigate. 


Here, we present a fast-feedback classification pipeline that combines manual prefiltering of datasets, automatic 
filtering of holography-derived features and a random forest classifier (Figure 1). Prior to model training, datasets are 
manually screened and particles are automatically filtered based on deviations from empirically derived feature 
distributions. This effectively cleans the training datasets and removes non-representative or artefactual samples. The 
resulting training-ready datasets are then used to train random forest models, providing both competitive classification 
performance and full interpretability at the feature level. 


This novel approach leads to significant performance gains compared to previous methods and successfully addresses 
long-standing off-season false-positive issues (Figure 2). Thanks to the reduced specificity when using random forest 
based models in comparison to deep-learning based models, the classification performance has proven to be robust 
comparing 6 different locations in Southern Europe over multiple years. The proposed methodology offers a transparent, 
computationally

How to cite: Schwendimann, A., Koch, K., Zeder, Y., Niederberger, E., and Erb, S.: Interpretable pollen classification using empirical feature filtering and random forest models on holographic airflow cytometry data, EGU General Assembly 2026, Vienna, Austria, 3–8 May 2026, EGU26-23287, https://doi.org/10.5194/egusphere-egu26-23287, 2026.

EGU26-192 | ECS | PICO | AS3.5

Evaluation of WRF-Chem aeolian dust emission and land surface models over the dust belt. 

Semontee Deb, Elena Louca, Angelos Violaris, Pantelis Kiriakidis, Yannis Proestos, and Theodoros Christoudias


Aeolian dust is a key component of the Earth system, influencing biogeochemical cycle, cloud microphysics, and the radiative energy budget and atmospheric dynamics, while also degrading air quality around major source regions. Large uncertainties persist in simulating atmospheric dust emission and transport, arising from the complex coupling between surface properties, boundary-layer processes, and atmospheric forcing. 

Previous efforts to evaluate the dust modelling performance of the Weather Research and Forecasting model coupled with Chemistry (WRF-Chem) have mostly relied on short-term or region-specific case studies, typically focused on individual dust outbreaks or restricted geographical domains.
In this study, we present a comprehensive, year-long evaluation of WRF-Chem (v4.7.1) over the dust belt spanning North Africa, the Middle East, and Central Asia. We evaluate an ensemble of six simulations using three widely applied dust emission schemes (GOCART, AFWA, and UoC) combined with two advanced land surface models (LSM): Noah-MP and CLM4. The ensemble model output is assessed against multiple observation and reanalysis datasets, including AERONET aerosol optical depth (AOD), the MODIS-derived MIDAS dust optical depth product, and ERA5-Land surface fields of soil moisture and wind speed, which control dust emission fluxes. 

Our analysis shows that land-surface representation exerts a strong influence on dust emission magnitude and spatial distribution, with Noah-MP yielding systematically higher agreement with observed meteorology and AOD. Among the dust emission schemes, AFWA performs most consistently, while UoC04 exhibits lower precision. Empirical scaling factors are derived for each dust emissions–LSM pairing.To our knowledge this is the first year-round, multi-scheme assessment of WRF-Chem dust performance, offering guidance for improved dust forecasting and climate applications. 


How to cite: Deb, S., Louca, E., Violaris, A., Kiriakidis, P., Proestos, Y., and Christoudias, T.: Evaluation of WRF-Chem aeolian dust emission and land surface models over the dust belt., EGU General Assembly 2026, Vienna, Austria, 3–8 May 2026, EGU26-192, https://doi.org/10.5194/egusphere-egu26-192, 2026.

Aerosols over the Indian region exhibi large spatial and seasonal Variation, however long-term ground-based Measurements that can consistently illustrate these variations are still limited. In this work, I utilize Level-2 AERONET data from selected locations in India to investigate how aerosol loading and optical attributes have changed during the last decade. The analysis centers chiefly on on Aerosol Optical Depth (AOD), Ångström exponent, and basic inversion products that help identify the dominant aerosol types.

The results indicate a clear seasonal variation at all stations. High AOD values appear during the pre-monsoon months, which is consistent with dust-laden air mass intrusion from arid regions, while winter months present increased fine-mode aerosols linked to vegetation fires and area-specific emission activities. Stations located in the Indo-Gangetic Plain exhibit the highest overall AOD levels, whereas coastal and semi-arid stations demonstrate lower values and more mixed aerosol regimes. Some sites indicate a gradual rise in fine-mode aerosol contribution, suggesting increasing anthropogenic influence, while others show small or no long-term trends.

These observations assist into better understand the aerosol environment over India and also furnish a reliable reference for measuring satellite retrievals. The study highlights how AERONET measurements can support regional climate and air-quality assessments by offering consistent, long-term optical property data that cannot be captured fully by satellites alone.

How to cite: Saxena, A.: Aerosol Characteristics over India Based on Long-Term AERONET Measurements, EGU General Assembly 2026, Vienna, Austria, 3–8 May 2026, EGU26-261, https://doi.org/10.5194/egusphere-egu26-261, 2026.

EGU26-943 | ECS | PICO | AS3.5

UAV observations to reveal new insights into dust particle morphology and orientation 

Kenneth M. Tschorn, Konrad Kandler, Frank Gunther Wienhold, Maria Kezoudi, Alkistis Papetta, Kostas Fragkos, Kilian Schneiders, Zuhir Bona, and Franco Marenco

Atmospheric dust affects the Earth’s radiation budget through scattering and absorption, processes governed by its optical properties linked to their microphysical characteristics (size, shape, refractive index, and orientation). While knowledge of dust particle size has progressed in the last few decades, dust morphology remains poorly constrained beyond the generic category of “irregular particles”. Although some studies suggest that dust particles can exhibit preferred orientations within the atmospheric column, most radiative-transfer models still represent dust as ensembles of randomly oriented spheres or spheroids. The limited availability of direct observational evidence limits our understanding of how dust’s non-sphericity and orientation influence remote-sensing retrievals, atmospheric processes, and aerosol radiative forcing. Given that mineral dust accounts for one of the largest global mass fluxes of primary aerosols, reducing these uncertainties is crucial to better constrain its overall radiative impact.


To address these gaps, we collect new UAV-based datasets on dust particle shape, internal structure, and orientation. In spring 2025, the Cyprus Institute conducted a two-month UAV campaign aiming for two goals: (1) to advance airborne dust-sampling methods, and (2) to investigate dust composition, size, shape, and orientation. Multiple UAV platforms were deployed during eight dust-affected flight days, guided by daily dust and weather forecasts. This strategy enabled sampling of diverse atmospheric conditions, including a strong dust event on 17/05/2025 with total AOD at 500- nm approaching the value of 1. Additional campaigns will further expand the dataset.


The UAV payloads included the Compact Optical Backscatter Aerosol Detector (COBALD) and Giant Particle Collectors (GPAC), supplemented by Optical Particle Counters (OPCs). To detect signatures of particle orientation two COBALD instruments, each operating at two wavelengths (455 and 940 nm), were deployed in a dual-field-of-view configuration pointing horizontally and vertically with two nearly orthogonal viewing directions. GPAC were adapted to carry TEM grids (small, ultra-thin mesh substrates used to collect particles for transmission electron microscopy) enabling airborne dust sampling suitable for high-resolution imaging and 3-D reconstruction of particle morphology. These combined measurements provided a unique dataset for assessing dust particle morphology, size, and potential orientation effects in the atmospheric column.

How to cite: Tschorn, K. M., Kandler, K., Wienhold, F. G., Kezoudi, M., Papetta, A., Fragkos, K., Schneiders, K., Bona, Z., and Marenco, F.: UAV observations to reveal new insights into dust particle morphology and orientation, EGU General Assembly 2026, Vienna, Austria, 3–8 May 2026, EGU26-943, https://doi.org/10.5194/egusphere-egu26-943, 2026.

EGU26-2760 | PICO | AS3.5

Tracing a Northern African Contribution to European Dust During the Last Glacial Maximum 

Denis-Didier Rousseau, Catherine Chauvel, Peter O Hopcroft, Pamela Gutiérrez, Ségolène Saulnier-Copard, Pierre Antoine, Markus Fuchs, and Alicja Ustrzycka

During the Last Glacial Maximum (LGM), global surface air temperatures were up to 6 °C lower than pre-industrial levels, and the mineral dust cycle intensified significantly, with global dust loading two to four times higher than during the Holocene. Loess deposits and Greenland ice cores record peak dust concentrations during this period. While Asian sources were traditionally considered the primary contributors to dust in Greenland, recent geochemical evidence indicates a mixture of Asian, North African, and European origins. Europe itself experienced heightened dust activity, predominantly attributed to local sources. Here, we present trace element data and Sr and Pb isotopic signatures from LGM-aged samples across 15 European sites, from a Western France to Ukraine longitudinal transect, revealing a notable contribution of fine dust from remote sources, particularly Northern Africa. These geochemical findings are corroborated by Earth System model simulations, which underscore Northern Africa's substantial role in dust deposition across the Northern Hemisphere during glacial periods.

Reference: Rousseau et al. (2025). A remote input of African dust to Last Glacial Europe. Comm. Earth & Environ., 6, 847. https://doi.org/10.1038/s43247-025-02888-9

How to cite: Rousseau, D.-D., Chauvel, C., Hopcroft, P. O., Gutiérrez, P., Saulnier-Copard, S., Antoine, P., Fuchs, M., and Ustrzycka, A.: Tracing a Northern African Contribution to European Dust During the Last Glacial Maximum, EGU General Assembly 2026, Vienna, Austria, 3–8 May 2026, EGU26-2760, https://doi.org/10.5194/egusphere-egu26-2760, 2026.

EGU26-3373 | ECS | PICO | AS3.5

New processes to counteract sedimentation of coarse dust particles are required for climate models to agree with observations 

Natalie Ratcliffe, Claire Ryder, Nicolas Bellouin, Martina Klose, Stephanie Woodward, Anthony Jones, Ben Johnson, Lisa-Maria Wieland, Andreas Baer, Josef Gasteiger, and Bernadett Weinzierl

Recent observations show that large mineral dust particles are more abundant in the atmosphere than expected and travel further than their mass and theoretical rapid deposition allow for. The presence of these large particles alters the impact of dust on Earth’s radiative budget, carbon and hydrological cycles, and human health. Research into the impacts of the mechanisms influencing large dust particle lifetime in models is vital in ascertaining how large dust particles travel thousands of kilometres further than expected. We employ a series of model simulations to better understand the long-range transport of large particles from the Sahara to the West Atlantic. We present results from two models—HadGEM3A and ICON-ART—which are run at differing resolutions and with different dust representations (size bins and lognormal modes). Observations are used to verify long-range transport in model simulations, including in-situ aircraft observations at the Sahara, Canary Islands, Cape Verde, and Caribbean. Coarse particle mass loading (validated against observations) is limited by excessively rapid deposition in both models, but is further limited in ICON-ART by a reduced size-range representation, with the coarsest mode having a mean diameter by mass of 14.2 µm, whereas the maximum dust size in HadGEM3A extends to 63.2 µm. The sensitivity of large particle long-range transport to sedimentation, convective and turbulent mixing, shortwave absorption, and impaction scavenging are tested in global HadGEM3A climate simulations. A reduction in sedimentation by 80% is required to bring the modelled large particle transport into agreement with aircraft observations. None of the other processes tested were able to make the multiple order of magnitude changes to long-range large particle concentration in the model required for agreement with the observations. Convective and turbulent mixing in the model have minimal impact on large particle long-range transport, but are key in controlling the vertical distribution in the Saharan air layer and marine boundary layer, respectively. This work adds to the growing body of evidence that points to processes involved in large mineral dust transport and deposition which are not represented accurately or at all in models, which counteract the sedimentation of large particles in the real-world.

How to cite: Ratcliffe, N., Ryder, C., Bellouin, N., Klose, M., Woodward, S., Jones, A., Johnson, B., Wieland, L.-M., Baer, A., Gasteiger, J., and Weinzierl, B.: New processes to counteract sedimentation of coarse dust particles are required for climate models to agree with observations, EGU General Assembly 2026, Vienna, Austria, 3–8 May 2026, EGU26-3373, https://doi.org/10.5194/egusphere-egu26-3373, 2026.

EGU26-3933 | ECS | PICO | AS3.5

Seasonal variability of mineral dust composition on an alpine snowpack in the Tateyama Mountains, Japan  

Pia Ataka, Ryo Sugiyama, Noboru Furukawa, and Nozomu Takeuchi

 Mineral dust deposited on snow surfaces plays an important role in snow and ice melting by reducing surface albedo and modifying surface energy balance. In addition to its direct radiative effects, mineral dust can indirectly enhance snow surface darkening by supplying nutrients that stimulate snow algal activity. Despite its importance, the sources and mineralogical characteristics of dust preserved in alpine snowpacks remain insufficiently constrained, particularly with respect to seasonal changes during the melt period.

 Most previous studies have interpreted mineral dust on snow as long-range transported material originating from continental desert regions. In alpine environments, however, progressive snow retreat during the melt season exposes surrounding ground surfaces and bedrock, potentially increasing contributions from locally derived mineral particles. How these local and remote dust sources vary seasonally, and how they are recorded in the mineralogical composition of snow-surface particles, remains poorly understood. This study aims to clarify the seasonal and spatial variability of mineral dust sources on alpine snow surfaces in the central Japanese mountains.

 We analyzed mineral particles deposited on snow surfaces in the Tateyama Mountains, central Japanese Alps. Surface snow samples collected during the melt season (May–July 2017) were compared with dust-layer samples from a snow pit excavated in April 2008, representing springtime deposition. Mineralogical analyses using X-ray diffraction and optical microscopy show that dust deposited in April and during the early melt season is dominated by quartz and feldspar, consistent with long-range transported mineral dust. As the melt season progressed, the relative abundances of Fe–Mg–bearing minerals, including chlorite, biotite, and amphibole, increased systematically. Spatial variations further reveal localized feldspar enrichment at specific sites, indicating increasing inputs from locally derived mineral particles sourced from surrounding bedrock.

 These results demonstrate a pronounced seasonal shift in mineral dust provenance on alpine snow surfaces, from dominantly long-range transported dust in spring to increasing local geological contributions during the melt season. Such changes in mineralogical composition may alter snow surface albedo and melt processes, highlighting the need to consider mineral dust composition, not only dust loading, when evaluating alpine snowmelt dynamics.


How to cite: Ataka, P., Sugiyama, R., Furukawa, N., and Takeuchi, N.: Seasonal variability of mineral dust composition on an alpine snowpack in the Tateyama Mountains, Japan , EGU General Assembly 2026, Vienna, Austria, 3–8 May 2026, EGU26-3933, https://doi.org/10.5194/egusphere-egu26-3933, 2026.

Sand and dust storms (SDS) are among the most impactful atmospheric hazards, affecting air quality, climate, ecosystems, and socio-economic activities across continents. East Asia is one of the world’s major dust source regions, and recent observations indicate a renewed increase in SDS frequency and intensity since the mid-2010s, with several extreme events occurring in 2021, 2023, and 2025. This contribution presents recent advances in SDS early warning and forecasting developed at the WMO Asian Sand and Dust Storm Warning Advisory and Assessment System (SDS-WAS) Regional Center, hosted by the China Meteorological Administration.


We highlight progress in multi-source monitoring, multi-model forecasting, and artificial intelligence (AI) applications for SDS prediction. Satellite-based minute-scale dust identification has been achieved through multi-sensor data fusion, enabling near-real-time monitoring of dust severity and three-dimensional vertical structure by integrating satellite, lidar, radar, and ground-based observations. On the forecasting side, operational multi-model ensemble systems provide regional dust concentration, optical depth, emission, and deposition products. A machine-learning-based ensemble correction approach further improves surface dust concentration forecasts by optimally combining multiple models based on their historical performance.


In addition, an AI-driven global coupled aerosol–meteorology forecasting system has been developed, delivering 5-day, high-resolution forecasts of dust optical depth and surface concentrations. Case studies demonstrate that this system captures long-range dust transport from both Asian and Saharan sources, including events affecting Europe, with forecast skill exceeding that of several regional numerical models.


As a WMO SDS-WAS Asian Regional Center, we emphasize the importance of strengthening collaboration with the WMO SDS-WAS program and other regional nodes. Enhanced data sharing, harmonized observational datasets, and coordinated multi-model and AI-based forecasting efforts are essential to improve global SDS early warning capabilities. The experience gained in Asia offers valuable insights for Europe and other downwind regions, supporting transboundary aerosol monitoring, risk assessment, and mitigation strategies at the global scale.

How to cite: An, L.: Developments in Monitoring and Multi-Model Applications of Dust Weather in SDS-WAS ASIAN REGIONAL CENTER, EGU General Assembly 2026, Vienna, Austria, 3–8 May 2026, EGU26-4602, https://doi.org/10.5194/egusphere-egu26-4602, 2026.

EGU26-4611 | ECS | PICO | AS3.5

Understanding Global Haboobs Using iDust 

Mei Chong and Xi Chen

Haboobs, dust storms triggered by convective cold pool outflows, contribute significantly to the global dust cycle and cause severe socioeconomic impacts through rapid visibility reduction and health hazards. However, haboob processes are inadequately represented in current reanalysis products (MERRA-2, EAC4) due to insufficient resolution to resolve mesoscale convection and hydrostatic dynamics that cannot properly describe the small-scale vertical motions. To date, haboobs have been studied primarily through individual cases and regional statistics, while systematic global-scale understanding remains lacking. This study investigates the global spatiotemporal patterns of haboobs and quantifies their contributions to dust emissions using the 12.5-km iDust model with analysis wind nudging. We perform multi-year global simulations, validate them against ground-based and satellite observations, and systematically identify and characterize haboob events worldwide. Our findings reveal global haboob patterns and their role in the dust cycle, advancing scientific understanding of convective dust processes.

How to cite: Chong, M. and Chen, X.: Understanding Global Haboobs Using iDust, EGU General Assembly 2026, Vienna, Austria, 3–8 May 2026, EGU26-4611, https://doi.org/10.5194/egusphere-egu26-4611, 2026.

The characteristics and potential influence of dust events under the background of Northeast China Cold Vortex (NCCV) have rarely been investigated. Based on meteorological observational data and ERA5 reanalysis data from 2015 to 2023, we examined the spatiotemporal and environmental characteristics of dust events under NCCV and non-NCCV conditions and explored the potential impacts of the NCCV on dust events. The results indicate that dust days in Northeast China exhibited a trend of first decreasing and then increasing during the study period, and severe dust events mainly occurred in central Inner Mongolia, a key dust source region in China. Dust days associated with the NCCV accounted for 32.7% of the total dust days, and their station-frequency ratio reached 43.7%. Dust events were predominantly concentrated in the southwest quadrant of the NCCV periphery (60.1%), mostly within a range of 1.0–2.6 times the NCCV radius. This distribution pattern can be attributed to the strong baroclinity often related to the low-level shear lines and dry ambient conditions in this region. Moreover, strong downward momentum transfer and weakly stable stratification within the planetary boundary layer under NCCV conditions also facilitated the formation of dust events. This study reveals the important impacts of the NCCV on dust events, thereby providing a scientific basis for further understanding the formation mechanisms of such events.

How to cite: Li, X. and Xu, S.: Characteristics and impacts of dust events under the background of Northeast China Cold Vortex (NCCV), EGU General Assembly 2026, Vienna, Austria, 3–8 May 2026, EGU26-5478, https://doi.org/10.5194/egusphere-egu26-5478, 2026.

EGU26-5689 | ECS | PICO | AS3.5

Re-evaluating Dust Emission Potential from Burned Surfaces on Vegetated Dunes in the Southwest Kalahari 

Rosemary Huck, Giles Wiggs, David Thomas, and Natasha Wallum

Sand dunes are not typically considered a major contributor to atmospheric dust loading due to coarse grain sizes and the infrequent observation of dust emission events. In vegetated dune systems, dust emission is less common as plant cover inhibits wind erosion. However, disturbances, such as fire, can rapidly remove protective vegetation cover which exposes resident fine sediments to wind erosion.

This study investigates dust emission potential following fire-induced de-vegetation in the driest region of the world’s largest sand sea, the southwest Kalahari. Adopting a hybrid approach, we combine remote sensing to characterise fire extent and timing and portable wind tunnel (PI-SWERL) experiments to quantify erosion potential.

A 24-year fire inventory reveals that burning is most frequent during or immediately after La Niña events, although anthropogenic land management significantly influences the spatial and temporal distribution of fires. The period for dust emission potential following fire is short, constrained by rapid vegetation recovery typically within 2 years. Grain size analyses indicate that dust-sized particles (<62.5 μm) are present in both burned and unburned dune surfaces; however, no significant depletion of fine particles from burned surfaces was observed, suggesting minimal loss through aeolian processes.

PI-SWERL experiments confirm that these fine particles can be entrained, yet higher threshold friction velocities are required for erosion at burned sites. The presence of biological soil crusts (biocrust) at all burned sites implies a stabilising influence on the erosion threshold. Where the surface had been disturbed, resulting in the removal of the typically present biocrust, our data suggest that dust emission fluxes are, on average, 8-13 times higher than those of unburned surfaces.

These findings indicate that currently there is little potential for dust emission in the post-fire de-vegetation period. This study provides new insights into the mechanisms controlling dust emissions in partially vegetated dune landscapes and highlights the importance of multiple, interacting, surface properties in governing aeolian processes.

How to cite: Huck, R., Wiggs, G., Thomas, D., and Wallum, N.: Re-evaluating Dust Emission Potential from Burned Surfaces on Vegetated Dunes in the Southwest Kalahari, EGU General Assembly 2026, Vienna, Austria, 3–8 May 2026, EGU26-5689, https://doi.org/10.5194/egusphere-egu26-5689, 2026.

EGU26-6290 | PICO | AS3.5

Aridity record from the western Australia across the Early-Middle Pleistocene Transition 

Terezia Kunkelova, Anna Arrigoni, and Gerald Auer

Australian aridity is primarily governed by large-scale atmospheric circulation and by the influence of the Australian-Indonesian monsoon (AIM). Regional climate variability is further modulated by coupled ocean-atmosphere modes, including the El Niño-Southern Oscillation (ENSO), the Indian Ocean Dipole (IOD), and the Southern Annular Mode (SAM), whose interactions regulate moisture supply and hydroclimatic variability across the Australian continent. Western Australia has experienced pronounced hydroclimatic variability through time, characterized by arid glacial intervals and more humid interglacials, highlighting a strong regional sensitivity to insolation forcing, large-scale atmospheric circulation, and changes in Indo-Pacific climate modes. However, Australian hydroclimate responses during intervals of major climatic reorganization, such as the Early-Middle Pleistocene Transition (EMPT), remain poorly constrained. The EMPT (~1.2-0.6 Ma) marks a fundamental reorganization of the climate system, characterized by intensified glacial-interglacial cycles and a shift toward a ~100-kyr periodicity.

Here, we present a grain size record from IODP Site U1460 spanning the EMPT, reflecting changes in aridity within western Australia. Using a grain-size end-member unmixing model, we aim to distinguish relative changes in the proportions of fine-grained material and coarser-grained sediment as proxies for shifts between humid and arid intervals. Furthermore, we are developing a specialized method to remove biogenic silica from marine sediment, as the site contains a high concentration of sponge spicules. These spicules are particularly challenging to remove due to their chemical resilience. This method is critical to prevent interference with sedimentological measurements and to ensure the accuracy of our grain size end-member modelling and hydroclimatic interpretations. Our grain size record will not only provide a refined biogenic silica removal method but also offer new insights into the evolution of Australian arid environments and the mechanisms linking regional hydroclimate to global climate reorganization during the Pleistocene. These findings will serve as critical analogues for understanding hydroclimatic sensitivity under sustained anthropogenic forcing.

How to cite: Kunkelova, T., Arrigoni, A., and Auer, G.: Aridity record from the western Australia across the Early-Middle Pleistocene Transition, EGU General Assembly 2026, Vienna, Austria, 3–8 May 2026, EGU26-6290, https://doi.org/10.5194/egusphere-egu26-6290, 2026.

EGU26-7253 | PICO | AS3.5

Towards Understanding the Climate Response to the Historical Dust Increase in ICON-XPP 

Claus Sarnighausen, Natalia Sudarchikova, and Stephanie Fiedler

Mineral dust aerosol shapes the global climate, mainly through interactions with radiation and clouds, and especially on the regional level close to major emission sources. However, the Coupled Model Intercomparison Project, phase six (CMIP6) models with coupled dust emission parameterization schemes fail to reproduce the 55 ± 30% increase in atmospheric dust concentration since 1850 (Kok et al. 2023). In the present study, we construct the historically changing monthly 'Dust Plumes' (DuPlumes) climatology (Sudarchikova et al. in prep.) and investigate implications of changing dust aerosol for the global climate in ICON-XPP, Germany's designated model for CMIP7. DuPlumes consists of a parameterized analytical framework, originally designed for anthropogenic aerosols (Stevens et al. 2017).  To create the representation of natural desert-dust aerosols, this study utilizes reanalysis data of dust optical depth, measurement data of scattering properties, and a marine-core-based reconstruction of the historical trend. To constrain the spatial pattern of present-day optical depth by observation, we use data of four reanalysis products (CAMS, MERRA2, JAero, and NAAPS), monthly averaged for the decade around the year 2010 (2004–2015). Plume functions related to ten dust plumes globally are fitted to the data using a gradient descent algorithm. The fit achieves a spatial correlation of r=0.98 with the data, with maximum deviations in summer of 0.08, or 2% of maximum aerosol optical depth, which is smaller than the uncertainty measured across the reanalysis ensemble. Compared to the currently implemented static ICON-XPP dust climatology, the reanalysis ensemble and, subsequently, dust plumes suggest considerably higher optical depth (~0.1) in the Eastern Asian Taklamakan and Gobi Desert regions. The vertical profile is informed by the 2007–2019 climatology derived from Cloud-Aerosol Lidar with Orthogonal Polarization (CALIOP) retrievals. We also include measurements of dust scattering properties from literature, including in-situ data and laboratory measurements. Ongoing work includes ICON-XPP experiments with dust optical properties represented by DuPlumes. These allow us to estimate the spatial pattern of effective radiative effects of the present-day natural dust relative to the pre-industrial levels.

---

Kok, J.F., Storelvmo, T., Karydis, V.A., Adebiyi, A.A., Mahowald, N.M., Evan, A.T., He, C., Leung, D.M.: Mineral dust aerosol impacts on global climate and climate change. Nat Rev Earth Environ. 4, 71–86 (2023). https://doi.org/10.1038/s43017-022-00379-5

Stevens, B., Fiedler, S., Kinne, S., Peters, K., Rast, S., Müsse, J., Smith, S.J., Mauritsen, T.: MACv2-SP: A parameterization of anthropogenic aerosol optical properties and an associated Twomey effect for use in CMIP6. Geoscientific Model Development. 10, 433–452 (2017). https://doi.org/10.5194/gmd-10-433-2017

How to cite: Sarnighausen, C., Sudarchikova, N., and Fiedler, S.: Towards Understanding the Climate Response to the Historical Dust Increase in ICON-XPP, EGU General Assembly 2026, Vienna, Austria, 3–8 May 2026, EGU26-7253, https://doi.org/10.5194/egusphere-egu26-7253, 2026.

EGU26-7557 | ECS | PICO | AS3.5

The impact of grid resolution on global dust emission potential 

Pascal Kunze, Bernd Heinold, and Ina Tegen

Due to its radiative effects, mineral dust constitutes a critical component in global aerosol climate models. However, the representation of dust emissions currently remains a substantial source of uncertainties in dust model simulations. Convective systems are major contributors to dust emission. Moist convection, however, is still a sub-grid scale process in most climate models, which has to be parameterized. Recent comparison studies between high-resolution, convection-resolving simulations and models with horizontal resolutions, that do not allow for considering moist convection explicitly, have revealed the model resolution as a key driver for the model uncertainties.  To further evaluate the impact of model resolution on dust emission, we conducted an analysis based on surface winds from two distinct modeling frameworks: (i) the coarse-resolution CMIP6 model ensemble, where convection is parameterized, and (ii) high-resolution ICON simulations from the DYAMOND (DYnamics of the Atmospheric general circulation Modeled On Non-hydrostatic Domains) project, which explicitly resolve moist convection. An indicator of dust emissions is the so-called dust emission potential, which is calculated offline for these different datasets and systematically evaluated for key global source regions. The analysis reveals pronounced regional and seasonal differences in the magnitude and characteristics of the modeled dust emission proxy. To investigate the origins of these uncertainties, we further compare the model outputs with high-resolution regridded data and analyze the diurnal cycle of dust emissions in selected source regions with a special focused investigation of the Central Asian dust sources. The results highlight the necessity of using high-resolution emission modeling in specific dust source regions to more accurately represent dust-generating processes and their climate impacts.

How to cite: Kunze, P., Heinold, B., and Tegen, I.: The impact of grid resolution on global dust emission potential, EGU General Assembly 2026, Vienna, Austria, 3–8 May 2026, EGU26-7557, https://doi.org/10.5194/egusphere-egu26-7557, 2026.

EGU26-7724 | PICO | AS3.5

Real-time analysis of trace metals in air by microwave induced plasma time-of-flight mass spectrometry (mipTOF) 

Martin Tanner, Alexander Gundlach-Graham, Martin Rittner, Lorenz Gfeller, Jay Slowik, Andre Prevot, Ed Fortner, and John Jayne

Keywords: Mass Spectrometry, Real-Time, Trace Elements, Source Apportionment, Mobile

Determination of the elemental composition of airborne nanoparticles and micro-particles is essential to understand the source(s) of these particles and also to predict potential health effects.1 The most common approach to measure the metal content of air is to collect samples on filters and then analyze digests by ICP-MS; however, this strategy offers poor time resolution (e.g. days) and only provides bulk element composition information. To understand the spatiotemporal characteristics of the emission of metal-containing aerosols, which is key to assessing exposure, real-time analysis strategies are essential. Here, we report on the development of a microwave induced plasma time-of-flight mass spectrometer (mipTOF) used for the direct analysis of metal-containing airborne particles.

The mipTOF is a field-deployable trace-element mass spectrometer. It uses a nitrogen-sustained high-power plasma (MICAP, Radom Instruments)2, 3 to quantitatively vaporize and atomize aerosols with sizes from the ultrafine to PM10. Singly charged atomic ions are generated in the plasma with high efficiency (up to 99%), and then extracted into the mass spectrometer, where they are sorted according to mass-to-charge ratio and recorded. Ambient air is sampled into the plasma via a concentric pneumatic nebulizer set up as a Venturi pump5 at flowrates from 100-200 cm3/min. With the mipTOF, concentration LODs range from 10 ng/m3 (potassium) to 0.05 ng/m3 (lead) with a time resolution of 10 seconds. The high-sensitivity, high-speed metal-aerosol measurements possible with mipTOF enable new research into real-time spatiotemporal analysis of metals in air. We will report on the use of the mipTOF in mobile lab measurements in Switzerland and Massachusetts, USA. In these measurements, we identified several unique sources of airborne metals, including emissions from automotive brake wear, trains, metal-plating industries, cement manufacturers, and light aircraft. In addition to presenting data from these campaigns, we will discuss aspects of instrument design and operation, including power and size requirements, calibration strategies, and instrumental figures of merit.

References:

(1) Daellenbach, K. R. et al. Nature 2020, 587 (7834), 414-419.

(2) Jevtic, J.; Menon, A.; Pikelja, V. PCT/US14/24306, 2015.

(3) Schild, M. et al.  Analytical Chemistry 2018, 90 (22), 13443-13450.

(4) Nishiguchi, K.; Utani, K.; Fujimori, E. J. Anal. Atom. Spec. 2008, 23 (8), 1125-1129.

How to cite: Tanner, M., Gundlach-Graham, A., Rittner, M., Gfeller, L., Slowik, J., Prevot, A., Fortner, E., and Jayne, J.: Real-time analysis of trace metals in air by microwave induced plasma time-of-flight mass spectrometry (mipTOF), EGU General Assembly 2026, Vienna, Austria, 3–8 May 2026, EGU26-7724, https://doi.org/10.5194/egusphere-egu26-7724, 2026.

Dust aerosols are a key component of the Earth's climate system. However, global climate models often depict mineral dust as a uniform aerosol. This simplification limits the physical realism of dust simulations, necessitating comparison with available observations to determine whether mineralogical variability is accurately represented when incorporated into a global climate-aerosol model.

In this study, we examine how well a mineralogical soil database translates into realistic mineral-resolved dust transport and deposition in the global climate model ICON coupled with the aerosol module HAM. This implementation is based on the mineralogical soil database of Journet et al. (2014), as modified by Goncalves-Ageitos et al. (2023), and it explicitly represents 12 individual minerals. Using multi-year global simulations, we evaluate the simulated mineralogical dust cycle with a focus on emission patterns, transport pathways, regional deposition, and the representation of seasonal and interannual variability. Model results are compared with available observations and datasets to assess the added value and limitations of mineral-resolved dust representation.

The evaluation demonstrates where mineralogical information helps to better constrain dust transport and deposition and identifies key uncertainties that remain. These results provide a basis for future work on mineral-specific dust deposition and its role in biogeochemical cycles.

How to cite: Hofmann, E., Wagner, R., and Schepanski, K.: How well does a mineralogical soil database translate into realistic mineral-resolved dust transport and deposition in a global climate model?, EGU General Assembly 2026, Vienna, Austria, 3–8 May 2026, EGU26-7789, https://doi.org/10.5194/egusphere-egu26-7789, 2026.

EGU26-9453 | PICO | AS3.5

Laboratory investigation of the radiative properties of mineral dust across the solar and terrestrial spectrum: key achievements and future directions 

Claudia Di Biagio, Pasquale Sellitto, Bénédicte Picquet-Varrault, Jean-François Doussin, and Paola Formenti

Coarse mineral dust aerosols originating from arid and semi-arid regions worldwide constitute one of the dominant tropospheric aerosol species by mass. Mineral dust both absorbs and scatters solar and terrestrial radiation, thereby influencing the radiance spectrum at the surface and at the top of the atmosphere, as well as the atmospheric heating rate. Dust is a key, yet still highly uncertain, contributor to both historical and contemporary climate change.

Modelling the interaction of dust with atmospheric radiation remains challenging because dust absorption and scattering properties, represented by the complex refractive index, depend on mineralogical composition – which varies with the emission source – and on particle size distribution, which evolves during transport. Climate models and remote-sensing retrievals therefore require accurate, regionally dependent information to improve dust representation and reduce uncertainties in radiative effect estimates.

Laboratory investigation has proven to be a powerful approach for unravelling the optical properties of mineral dust across the solar and terrestrial infrared spectrum. Original experiments based on realistic aerosols generated from natural soils have provided important new insights into the optical properties of global mineral dust in the solar and thermal infrared spectral ranges, as well as their variability with particle composition and during transport. These results have motivated the modelling and remote-sensing communities to revisit dust representation in models, leading to new evaluations of the dust direct radiative effect and its associated uncertainty, as well as to the development of innovative remote-sensing products. Current research is now extending the investigated spectral range toward the far infrared and to emerging source regions, for which knowledge of dust–radiation interactions remains very limited.

This presentation highlights key results and open scientific questions that have driven recent research on the radiative properties of mineral dust, and outlines perspectives for future studies.

How to cite: Di Biagio, C., Sellitto, P., Picquet-Varrault, B., Doussin, J.-F., and Formenti, P.: Laboratory investigation of the radiative properties of mineral dust across the solar and terrestrial spectrum: key achievements and future directions, EGU General Assembly 2026, Vienna, Austria, 3–8 May 2026, EGU26-9453, https://doi.org/10.5194/egusphere-egu26-9453, 2026.

EGU26-10457 | ECS | PICO | AS3.5

Tracing the provenance and evolution of Asian dust fluxes during the Holocene: A geochemical study of sediment archives from Adak Island, Alaska 

Rakesh Kumar Rout, Tolulope Joseph Ayodeji, Nicolas Waldmann, and Daniel Palchan

Asian dust plumes export micronutrients eastward to the Pacific Ocean and are substantial for regulating the marine biogeochemical cycles and productivity. Previous studies from the Gulf of Alaska (a high-nutrient and low-chlorophyll zone) revealed that the dominant nutrient supply during the last deglaciation was primarily sourced from iceberg meltwater instead of local Alaskan dust fluxes. However, attention to distal dust sources from Asia was limited, possibly due to resolution constraints. To address this, we consider here two chronologically well-constrained (by tephrochronology and radiocarbon dating) sedimentary archives from Adak Island (Andrew and Heart lakes), in the central Aleutian Islands, Alaska. These records preserve a high-resolution environmental and climatic history for the last ~10 ka and might also include a continuous record of Asian dust plume sources. Terrigenous materials in these sediments originate from either local weathered basalt units and volcanic ash or from distal Asian dust, comprising erosional products of the granitoid terrane. We studied the siliciclastic fraction of the sediments recovered from both lakes and employed elemental analyses along with radiogenic isotopes (Sr, Nd and Pb) to identify and quantify possible allochthonous dust sources. Our preliminary observations from major and trace elemental ratios and statistical analyses (PCA and factor loadings) suggest that, indeed, there are two dominant sources for terrigenous sediments. The enriched LREE and flat HREE pattern, together with a positive Eu anomaly, further support the mixed source (mafic to felsic) of the sediment supply to the lakes. Additionally, the Chemical Index of Alteration (CIA) and other elemental ratios in both lakes suggest a sharp decreasing trend ca. 4 ka followed by an increasing trend ca. 3.5 ka, which is asynchronous with the increased input of Asian dust and the neoglacial cooling event during this interval. The isotopic and other geochemical studies are in progress, which will further validate these findings.

How to cite: Rout, R. K., Ayodeji, T. J., Waldmann, N., and Palchan, D.: Tracing the provenance and evolution of Asian dust fluxes during the Holocene: A geochemical study of sediment archives from Adak Island, Alaska, EGU General Assembly 2026, Vienna, Austria, 3–8 May 2026, EGU26-10457, https://doi.org/10.5194/egusphere-egu26-10457, 2026.

EGU26-10511 | PICO | AS3.5

Resolving regional controls on dust flux: High-resolution chronostratigraphy of Carpathian loess 

Zoran Perić, Slobodan Marković, Petar Krsmanović, Helena Alexanderson, and Milica Bosnić

Loess-palaeosol sequences (LPS) are vital among terrestrial archives for reconstructing Quaternary palaeoclimates and environmental change. Their extensive distribution across continental mid-latitudes and high sensitivity to atmospheric and surface processes make them indispensable records of past dust cycles, wind regimes, and regional ecosystem dynamics. However, the reliability of these reconstructions, particularly quantitative measures of dust flux variability, is intrinsically limited by the resolution and accuracy of the underlying geochronological framework. Our research directly addresses this chronometric challenge by applying refined luminescence dating techniques and Bayesian age-depth modelling to loess profiles across the Carpathian and Wallachian Basins. This methodological approach enables the construction of high-resolution, probabilistic chronologies that are essential for robust palaeoenvironmental interpretation. The central outcome of this work is a significantly improved, regional reconstruction of dust flux variability. Our integrated analysis demonstrates that dust mass accumulation rates (MARs) across the basins do not conform to a simplified model of peak deposition solely during glacial maxima (MIS 2). This pattern indicates that dust influx was not driven exclusively by global ice volume but was significantly intensified during specific phases of regional climatic amelioration. These findings compel a reinterpretation of regional atmospheric and sediment dynamics. The high dust fluxes during MIS 3 highlight the critical influence of regional controls, such as changes in palaeowind intensity and pathways, episodic sediment supply from major river systems, and the variable dust-trapping efficiency of sparsely vegetated, dynamic landscapes. This underscores the necessity of disentangling the effects of global climate drivers from those of local environmental and geomorphic settings when interpreting the LPS record. The broader objective of this synthesis is to establish a robust, integrated stratigraphic and chronological framework that enables detailed correlation and comparison of loess-derived palaeoenvironmental proxies across the Carpathian and Wallachian Basins. By doing so, we provide new insights into the timing, magnitude, and climatic forcing of past atmospheric dust activity, challenging purely glacially-driven models and contributing to a more nuanced understanding of Quaternary environmental dynamics in Central and Eastern Europe.

How to cite: Perić, Z., Marković, S., Krsmanović, P., Alexanderson, H., and Bosnić, M.: Resolving regional controls on dust flux: High-resolution chronostratigraphy of Carpathian loess, EGU General Assembly 2026, Vienna, Austria, 3–8 May 2026, EGU26-10511, https://doi.org/10.5194/egusphere-egu26-10511, 2026.

EGU26-10600 | ECS | PICO | AS3.5

Improving dust emission in WRF-Chem GOCART scheme using a high-resolution erodibility dataset 

Leandro Segado-Moreno, Juan Pedro Montávez, Eloisa Raluy-López, Ginés Garnés-Morales, Alejandro Cordero, and Pedro Jiménez-Guerrero

Mineral dust is a major atmospheric aerosol, affecting climate, air quality, and human health through radiative and microphysical processes. The Iberian Peninsula is frequently impacted by dust intrusions from North Africa, leading to episodic exceedances of PM10 concentrations that challenge operational air quality forecasts. Accurate simulation of dust emission and transport remains difficult due to uncertainties in soil erodibility, land surface characteristics, and meteorological drivers.

In this study, we assess the impact of two newly developed high-resolution soil erodibility datasets on regional dust simulations using WRF-Chem with the GOCART scheme. The first dataset, EROD, improves dust source representation by integrating fine-resolution topography (GMTED2010), achieving 0.0625° (≈5 km) resolution globally and 1 km locally for the Iberian Peninsula. The second dataset, SOILHD, further refines dust source characterization by incorporating local-scale soil composition (sand, silt, clay fractions) and removing areas erroneously classified as bare soil, reaching 1 km resolution globally. These datasets aim to capture the spatial heterogeneity of dust sources, which is critical in semi-arid regions with sparse vegetation and variable soil properties.

We conduct WRF-Chem simulations for five periods between 2022 and 2025, representing a range of dust episodes with local and long-range transport. Model performance is evaluated against PM10 measurements from the SINQLAIR network across coastal and inland stations in the Region of Murcia. Results indicate that the high-resolution datasets substantially improve the spatial and temporal representation of dust emissions. Inland and low-anthropogenic-influence stations show better agreement with observed PM10 peaks in both magnitude and timing compared to simulations using standard coarse-resolution erodibility fields. At coastal and industrially influenced sites, improvements are more limited due to missing anthropogenic emissions and additional aerosol components, but statistical metrics such as correlation, Mean Bias Error (MBE), and Root Mean Square Error (RMSE) still indicate significant enhancement.

Overall, the results demonstrate that high-resolution, type–aware soil erodibility datasets significantly enhance the skill of dust simulations in WRF-Chem, reducing biases and capturing observed variability more accurately. These findings underscore the importance of detailed soil and topographic information for regional dust modeling and highlight the potential benefits of incorporating such datasets into operational dust forecasting systems.

How to cite: Segado-Moreno, L., Montávez, J. P., Raluy-López, E., Garnés-Morales, G., Cordero, A., and Jiménez-Guerrero, P.: Improving dust emission in WRF-Chem GOCART scheme using a high-resolution erodibility dataset, EGU General Assembly 2026, Vienna, Austria, 3–8 May 2026, EGU26-10600, https://doi.org/10.5194/egusphere-egu26-10600, 2026.

EGU26-11564 | PICO | AS3.5

Dust-driven droplet freezing explains cloud-top phase in the northern extratropics. 

Diego Villanueva, Martin Stengel, Corinna Hoose, Kai Jeggle, Olimpia Bruno, Albert Ansmann, and Ulrike Lohmann

Clouds with temperatures between −39° and 0 °C can be capped by either a liquid or an ice layer, strongly influencing their radiative forcing and precipitation. The cloud-top ice-to-total frequency (ITF) quantifies the occurrence of clouds with ice tops relative to all clouds, yet the processes controlling ITF remain poorly understood. Using 35 years of satellite observations (Cloud_cci v3) and dust reanalysis (MERRA2), we show that in the Northern Hemisphere, at temperatures between −15° and −30 °C, ITF is strongly correlated with dust aerosol variability in both time and space. Moreover, we find that the sensitivities of ITF to temperature and dust occur in a ratio consistent with laboratory measurements of immersion droplet freezing, indicating that dust aerosols impose a logarithmic control on cloud-top phase.

How to cite: Villanueva, D., Stengel, M., Hoose, C., Jeggle, K., Bruno, O., Ansmann, A., and Lohmann, U.: Dust-driven droplet freezing explains cloud-top phase in the northern extratropics., EGU General Assembly 2026, Vienna, Austria, 3–8 May 2026, EGU26-11564, https://doi.org/10.5194/egusphere-egu26-11564, 2026.

EGU26-12006 | PICO | AS3.5

 Dust source transfer from North Africa to the Amazon Basin: geochemical constraints on their long-term sources and composition  

Damien Guinoiseau, Christopher Pöhlker, Anna Kral, Jorge Saturno, Florian Ditas, Paulo Artaxo, Meinrat O. Andreae, and Stephen J.G. Galer

At a global scale, dust can serve as a vector for transferring elements from nutrient-rich soils to nutrient-depleted ecosystems, acting as a natural fertilizer [1]. The Amazonian rainforest, which is partly developed over nutrient-poor lateritic soils, illustrates this concept by receiving annually 8.5 Tg of dust from North African regions [2]. This phenomenon is well-documented and captured by both satellite-derived and in situ observations; however, the documentation of the long-term dust sources in North Africa and their associated chemical composition remains debated today [3,4]. This study presents two chronicles of dust collected at the Atmospheric Tall Tower Observatory (ATTO) during the dust-active season (February to April) in 2016 and 2017. Following a chemical extraction procedure already reported elsewhere [5], the chemical compositions and Sr-Nd-Pb isotope signatures of samples collected during low-dust conditions and dust outbreak events have been analyzed.

Following a statistical ACP and clustering analysis, the extracted water-soluble, acid-soluble, and residual fractions show that dust loading is the main driver of aerosol composition. Carbonated minerals do not survive efficiently in the atmospheric conditions encountered during transatlantic transport within the Saharan Air Layer and are readily solubilized. Most of the silicates and oxides are resistant to atmospheric chemical weathering, with the exception of poorly crystallized Al-Fe oxides. Finally, the geochemical signals of trace metals, potassium, and phosphorus can be complicated by anthropogenic particles or emitted bioaerosols, in addition to dust.

Predominant north African dust sources are identified by combining rare earth element patterns with Sr-Nd-Pb radiogenic isotopes, both of which are clearly diagnostic. A Bayesian mixing model (MixSIAR) is also used to quantify the long-term proportion of each source, while satellite products (CALIPSO, MERRA-2) and back trajectory analyses (HYSPLIT) are used to confirm our observations. Western African soils characterized by alluvial deposits in wadis developed over Phanerozoic terrains are the dominant dust sources (55-90%), while soils associated with Precambrian cratonic areas can act sporadically during significant dust events. As already postulated using a satellite-derived model [3], the Bodélé Depression’s impact on dust reaching the Amazon Basin is negligible, despite its status as the dustiest place on Earth. These results are consistent with conclusions drawn for the Northern Hemisphere, particularly for the Caribbean [5], although dust transport and atmospheric conditions over North Africa differ seasonally (between boreal winter and boreal summer). Finally, the chemical composition of the dust measured for all dust events reaching ATTO in 2016 and 2017 is remarkably uniform and consistent with 2024 and 2025 collected samples from French Guiana and ATTO (Collignon et al., in prep.), allowing for a preliminary estimate of a long-term “averaged North African dust” composition reaching the Amazon Basin.

[1] Reicholf (1986), SNFE, 21, 251-255.

[2] Kok et al. (2021), ACP, 21, 8169-8193.

[3] Yu et al. (2020), GRL, e2020GL088020.

[4] Barkley et al. (2022), GRL, e2021GL097344.

[5] Kumar et al. (2018), EPSL, 487, 94-105.

How to cite: Guinoiseau, D., Pöhlker, C., Kral, A., Saturno, J., Ditas, F., Artaxo, P., Andreae, M. O., and Galer, S. J. G.:  Dust source transfer from North Africa to the Amazon Basin: geochemical constraints on their long-term sources and composition , EGU General Assembly 2026, Vienna, Austria, 3–8 May 2026, EGU26-12006, https://doi.org/10.5194/egusphere-egu26-12006, 2026.

EGU26-12288 | ECS | PICO | AS3.5

The chemical and mineralogical composition of southern African dust aerosols 

Clarissa Baldo, Sophie Nowak, Servanne Chevaillier, Gael Noyalet, Silvia Becagli, Akinori Ito, Sandra Lafon, Claudia Di Biagio, Karine Desboeufs, Remi Stanus, Nadine Mattielli, Heleen C. Vos, Gregory S. Okin, James S. King, Amelie Chaput, Brigitte Language, Stuart Piketh, and Paola Formenti

Southern Africa (SAf) is a key region for dust emissions, characterised by a wide variety of natural and anthropogenic sources, but also a critical knowledge gap in the mineral dust budget of the Southern Hemisphere. Projected climate warming is expected to lead to an increase in mineral dust emissions, which are increasingly linked to human activity. Although the transport and deposition pathways of SAf dust suggest that it can directly affect the regional climate and nearby marine ecosystems through dust-aerosol interaction and indirectly through aerosol-cloud/ice interaction and nutrient deposition, the extent of this impact is highly uncertain due to significant uncertainties in atmospheric loads and climate-relevant properties.

This study provides the first comprehensive characterisation of the chemical and mineralogical composition of SAf dust aerosols. Aerosol samples were laboratory-generated using soils collected from key dust sources in southern Africa, including the Namib gravel plain, coastal ephemeral riverbeds, the Etosha salt pan, the Kalahari Desert, and anthropogenic sources such as agricultural soils from the Free State, savannah soils from the Kruger National Park, and a copper mine in Namibia.

A geographical distribution of the chemical and mineralogical properties of SAf dust was identified based on the elemental ratios Si/Al, (Ca + Mg)/Al, and K/Al. This is influenced by both the regional geology and rainfall distribution, which shows an increase in the Si/Al ratio and a decrease in the (Ca + Mg)/Al and K/Al ratios, in areas with higher rainfall inland compared to the arid coast, while the salt pans exhibit unique features with significantly higher (Ca+Mg)/Al and Si/Al ratios.

The SAf dust appears to be more enriched in Ca, Mg, and K than other dust sources in the Southern Hemisphere and northern African dust. Although Fe, a key micronutrient, occurs at similar levels in dust from both hemispheres, SAf dust contains more P, highlighting its potential significance in biogeochemical cycling. Despite limited mineralogical observations in the Southern Hemisphere, our results indicate that SAf dust contains more feldspar minerals than northern African dust, and may strongly influence the load of ice-nucleating particles over the Southern Ocean and, in turn, the regional radiative budget.

How to cite: Baldo, C., Nowak, S., Chevaillier, S., Noyalet, G., Becagli, S., Ito, A., Lafon, S., Di Biagio, C., Desboeufs, K., Stanus, R., Mattielli, N., Vos, H. C., Okin, G. S., King, J. S., Chaput, A., Language, B., Piketh, S., and Formenti, P.: The chemical and mineralogical composition of southern African dust aerosols, EGU General Assembly 2026, Vienna, Austria, 3–8 May 2026, EGU26-12288, https://doi.org/10.5194/egusphere-egu26-12288, 2026.

In the temperature range between 0 °C and −39 °C, clouds may exist in the liquid phase, the ice phase, or as a mixture of both. Cloud glaciation, defined as the transition from liquid to ice, can be driven by multiple processes. On the one hand, enhanced glaciation may result from secondary ice production. On the other hand, atmospheric aerosols can act as ice-nucleating particles (INPs) and initiate ice crystal formation. Previous studies have highlighted the role of mineral dust as the dominant INP source for cloud glaciation at temperatures below −15 °C.

Although recent findings indicate a correlation between aerosol concentration and cloud glaciation, quantifying aerosol–cloud interactions remains challenging. To better characterize and disentangle the natural spatial and temporal variability of relevant observables governing this relationship, this study combines data from multiple satellite instruments (MSG SEVIRI, MODIS, and IASI). In addition, these observations are compared to ICON model outputs and CAMS reanalysis data. The objective is to provide an assessment of the sensitivity of cloud phase to dust aerosol concentration for given temperatures and synoptic conditions across different datasets.

We primarily investigate the influence of the dust aerosol optical depth (DAOD) in the region between the equator and the subtropical dust belt (0–30° N/S). Our findings highlight the relationship between DAOD and cloud glaciation, characterized by a particularly strong increase in glaciation at high DAOD values. The analysis further includes stratification by large-scale synoptic conditions and cloud type, allowing us to narrow down potential differences between convective and stratiform clouds.

Finally, we examine how the integration of vertical profiles from EarthCARE may facilitate the detection of not only horizontally but also vertically collocated cloud and aerosol layers, thereby improving statistical estimates of aerosol–cloud interactions.

How to cite: Brüning, S., Stengel, M., and Robbins, D.: Investigating dust aerosol effects on mixed-phase cloud glaciation based on an intercomparison of satellite observations, EGU General Assembly 2026, Vienna, Austria, 3–8 May 2026, EGU26-12744, https://doi.org/10.5194/egusphere-egu26-12744, 2026.

EGU26-13178 | ECS | PICO | AS3.5

Impact of iron-containing dust on atmospheric oxidation processes 

Simon Rosanka, Klaus Klingmüller, Rolf Sander, Andrea Pozzer, Jos Lelieveld, and Domenico Taraborrelli

In the atmosphere, organic and inorganic compounds can partition into clouds, fog, raindrops, and aqueous aerosols, where they undergo rapid chemical oxidation, yielding secondary aerosols. This process is governed by the availability of radicals such as hydroxyl (OH) and nitrate (NO3) radicals in the liquid phase. The presence of dissolved iron can boost the OH reactivity via Fenton reactions. Dust is a major source of iron in the atmosphere, occurring primarily in the crystalline lattices of aluminosilicates or as iron oxides. Following its emission, iron tends to be mostly insoluble but can be converted into soluble forms when inorganic acids decrease the pH, and organic ligands create iron complexes during atmospheric transport. In this study, we address the importance of iron in global atmospheric oxidation processes by mechanistically modelling the related chemical processes in the gas and liquid phases within clouds, fog, rain droplets, and, for the first time, aqueous aerosols. We employ the atmospheric chemistry MESSy model infrastructure, coupled to the global general circulation model ECHAM5 (EMAC). We represent three mechanisms of iron dissolution into aerosol water, driven by aerosol acidity, irradiation, and the presence of oxalate in the solution, which acts as an organic ligand. In the atmosphere, oxalate is the dominant dicarboxylic acid, mainly formed via aqueous-phase oxidation of glyoxal and other organic compounds. Our new approach is to explicitly account for oxalate-related aqueous-phase chemistry. Through a series of sensitivity simulations, with and without soluble iron, we address the global impact of iron on aqueous-phase oxidation capacity. We find that iron uptake into aerosol water enhances OH reactivity, particularly in cloud droplets, thereby increasing the aqueous oxidation of isoprene oxidation products and influencing secondary organic aerosol formation.

How to cite: Rosanka, S., Klingmüller, K., Sander, R., Pozzer, A., Lelieveld, J., and Taraborrelli, D.: Impact of iron-containing dust on atmospheric oxidation processes, EGU General Assembly 2026, Vienna, Austria, 3–8 May 2026, EGU26-13178, https://doi.org/10.5194/egusphere-egu26-13178, 2026.

EGU26-13316 | PICO | AS3.5

Transported African Dust in the Lower Marine Atmospheric Boundary Layer is Internally Mixed with Sea Salt Contributing to Increased Hygroscopicity and a Lower Lidar Depolarization Ratio 

Cassandra Gaston, Sujan Shrestha, Robert Holz, Willem Marais, Zachary Buckholtz, Ilya Razenkov, Edwin Eloranta, Jeffrey Reid, Hope Elliott, Nurun Nahar Lata, Zezhen Cheng, Swarup China, Edmund Blades, Albert Ortiz, Rebecca Chewitt-Lucas, Alyson Allen, Devon Blades, Ria Agrawal, Elizabeth Reid, and Jesus Ruiz-Plancarte and the Ragged Point MAGPIE Team

Saharan dust is frequently transported across the Atlantic, yet the chemical, physical, and morphological transformations dust undergoes within the marine atmospheric boundary layer (MABL) remain poorly understood. These transformations are critical for understanding dust’s radiative and geochemical impacts, it’s representation in atmospheric models, and detection via remote sensing. Here, we present coordinated observations from the Office of Naval Research’s Moisture and Aerosol Gradients/Physics of Inversion Evolution (MAGPIE) August 2023 campaign at Ragged Point, Barbados. These include vertically resolved single-particle analyses, mass concentrations of dust and sea spray, and High Spectral Resolution Lidar (HSRL) retrievals. Single-particle data show that dust within the Saharan Air Layer (SAL) remains externally mixed, with a corresponding high HSRL-derived linear depolarization ratio (LDR) at 532 nm of ~0.3. However, at lower altitudes, dust becomes internally mixed with sea spray, and under the high humidity (>80%) of the MABL undergoes hygroscopic growth, yielding more spherical particles, suppressing the LDR to <0.1; even in the presence of  high dust loadings (e.g., ~120 µg/m3). This low depolarization in the MABL is likely due to a combination of the differences between the single scattering properties of dust and spherical particles, and the potential modification of the dust optical properties from an increased hygroscopicity of dust caused by the mixing with sea salt in the humid MABL. These results highlight the importance of the aerosol particle mixing state when interpreting LDR-derived dust retrievals and estimating surface dust concentrations in satellite products and atmospheric models.

How to cite: Gaston, C., Shrestha, S., Holz, R., Marais, W., Buckholtz, Z., Razenkov, I., Eloranta, E., Reid, J., Elliott, H., Lata, N. N., Cheng, Z., China, S., Blades, E., Ortiz, A., Chewitt-Lucas, R., Allen, A., Blades, D., Agrawal, R., Reid, E., and Ruiz-Plancarte, J. and the Ragged Point MAGPIE Team: Transported African Dust in the Lower Marine Atmospheric Boundary Layer is Internally Mixed with Sea Salt Contributing to Increased Hygroscopicity and a Lower Lidar Depolarization Ratio, EGU General Assembly 2026, Vienna, Austria, 3–8 May 2026, EGU26-13316, https://doi.org/10.5194/egusphere-egu26-13316, 2026.

EGU26-13474 | ECS | PICO | AS3.5

Unraveling the geochemical signals from major episodes of Saharan dust at two different locations in the Amazon basin. 

Lea Collignon, Damien Guinoiseau, Kathy Panechou, Cassandra J. Gaston, Sebastian Brill, Stephen J.G. Galer, Suresh Karunanithi, Christopher Pohlker, and Cecile Quantin

Desert dust is the most abundant aerosol by mass in Earth’s atmosphere (global dust loading of 22-29 Tg; [1]). One key region of interest is the Amazon Basin, which acts as a major sink for mineral dust transported from North Africa (deposition flux of ∼10 Tg.yr-1; [1]), impacting the nutrient supply to this rainforest ecosystem [2]. Currently, Western African sources are expected to be the predominant dust source based on previous geochemical studies [3] and atmospheric modeling [4], while the contribution of the Bodélé region is highly debated [4]. However, further constraints are still needed to elucidate the nutrient bioavailability associated with dust and other aerosol types, as well as how chemical transformations may affect the dust geochemical signal during transport and continentalization.

This study focuses on simultaneous high-resolution records of North African dust episodes reaching two different South American locations from January to March 2025. The first location is a coastal observatory in French Guiana (ATMO), while the second is located in the central Amazon forest, in Brazil (ATTO). Although these observatories are separated by more than 1,000 km, they are both influenced by similar transatlantic air mass trajectories, enabling an assessment of the impact of air mass continentalization on the chemical and physical characteristics of the aerosol particles. Aerosol samples have been chemically characterized using a recently developed selective extraction protocol [3], which segregates particles into water-soluble, acid-soluble, and residual material, including the silicate fraction of dust [5].

A 65 % dust loading reduction is observed between ATMO and ATTO sites, accompanied by a decrease in the soluble fraction from 20–50 %, dominated by sea salt at ATMO, to less than 10 % at ATTO. Other constituents originate from the dissolution of carbonates (Ca, Mg) due to atmospheric processes, from the leaching of soot particles or the emission of bioaerosols (K, P), and from the partial dissolution of poorly crystallized oxides (Al, Fe).  

The silicate fraction, which dominates the aerosol mass (50-98%), reveals a remarkable stability in the elemental composition of dust, irrespective of the observatory location, the position within the dust event (onset, peak, or decay), or the meteorological conditions. This compositional consistency exhibits a highly coherent signal when compared with previous dust episodes observed in 2016, 2017, and 2024 [3]. Furthermore, isotopic signatures of Sr, Nd, and Pb, known as efficient proxies for dust sources, are in strong agreement with those measured during these earlier episodes, confirming the dominant role of the West African dust source and the negligible contribution of the Bodélé Depression. Overall, these findings underscore the robust stability of the geochemical signal carried by dust, thereby enhancing our understanding of the average dust composition that reaches the Amazon Basin. In contrast, the focus on more labile components is strategic since these elements are preferentially redistributed into the water- and acid-soluble fractions.


[1] Kok et al. (2021), https://doi.org/10.5194/acp-21-8169-2021

[2] Swap et al. (1992), https://doi.org/10.1034/j.1600-0889.1992.t01-1-00005.x

[3] Collignon et al., submitted.

[4] Yu et al. (2020), https://doi.org/10.1029/2020GL088020

[5] Kumar et al. (2018), https://doi.org/10.1016/j.epsl.2018.01.025


How to cite: Collignon, L., Guinoiseau, D., Panechou, K., Gaston, C. J., Brill, S., Galer, S. J. G., Karunanithi, S., Pohlker, C., and Quantin, C.: Unraveling the geochemical signals from major episodes of Saharan dust at two different locations in the Amazon basin., EGU General Assembly 2026, Vienna, Austria, 3–8 May 2026, EGU26-13474, https://doi.org/10.5194/egusphere-egu26-13474, 2026.

EGU26-14556 | ECS | PICO | AS3.5

Loess deposits record stable Mid-Pleistocene hydroclimate during phases of human occupation of Central Asia 

Ramona Schneider, Ekaterina Kulakova, Daniel Topal, Bjarne Almqvist, Jan-Pieter Buylaert, Farhad Khormali, Mads Faurschou Knudsen, Rezhep Kurbanov, Aske Lohse Sørensen, Gábor Újvári, David Keith Wright, Qiuzhen Yin, and Thomas Stevens

Palaeolithic tools preserved in the loess-palaeosol sections of southern Tajikistan as early as ~800 ka evidence the episodic presence of ancient hominins across major Quaternary climate shifts, such as the Mid-Pleistocene and Mid-Brunhes Transitions (MBT). The richest assemblage of lithic tools found in the region, the Karatau Culture, is found mainly in palaeosols associated with Marine Isotope Stages (MIS) 15, 13, and 11, with intervening glacial periods as well as previous and subsequent interglacial periods characterised by a near absence of tools, except for MIS 14 which contains a smaller number of artefacts. Curiously, the disappearance of the Karatau culture coincides with an abrupt increase in magnetic susceptibility in the palaeosol units. Currently, the cause of the alternating phases of occupation and their possible connection to wider-scale climate remain unclear.

The Khovaling Loess Plateau loess-palaeosol sequences provide an opportunity to understand the climatic and environmental context of the appearance and disappearance of early hominins. Since the Khovaling Loess Plateau is located in a transitional zone between climate systems (Mid-Latitude Westerlies, Siberian High and Indian Monsoon) regional climate may be sensitive to global climate reorganisations within the Quaternary. Based on the observed abrupt increase in magnetic susceptibility following MIS 11, it has been hypothesized that monsoon incursions may have occurred during some interglacials, and that these incursions may have ceased after MIS 11, coinciding with the disappearance of the Karatau culture. However, evidence for potential monsoon incursions is highly debated, and the cause for the change in the magnetic susceptibility record remains unclear. In this study, we apply a novel multi-frequency magnetic susceptibility approach, complemented by elemental composition data from XRF and XRD, and by paleoclimate simulations, to investigate possible variations of the hydroclimate in Central Asia. The simulations, performed with the fully-coupled HadCM3 global climate model, allow us to assess the relative and combined effects of orbital, greenhouse gas and ice sheet forcings on the hydroclimate variability including possible moisture transport pathway changes in Central Asia around MIS 13 and 11.

Based on the combined evidence, we argue that the abrupt increase in bulk magnetic susceptibility after MIS 11, observed across different sites in southern Tajikistan, is best explained by a sediment provenance change. It appears to be unrelated to any change in rainfall seasonality, and to a lesser degree, intensity. We demonstrate that relative frequency dependence of magnetic susceptibility (χFD %) is the most suitable proxy for calculating quantitative palaeoprecipitation estimates in this region. Our magnetic susceptibility results, calibrated against a modern-analogue based transfer function, indicate that the demise of the Karatau culture coincides with an approximate +25% increase in regional annual mean precipitation. Combined with the other proxy data, this result indicates a relatively stable regional climate across periods of hominin occupation and the MBT.

How to cite: Schneider, R., Kulakova, E., Topal, D., Almqvist, B., Buylaert, J.-P., Khormali, F., Faurschou Knudsen, M., Kurbanov, R., Sørensen, A. L., Újvári, G., Wright, D. K., Yin, Q., and Stevens, T.: Loess deposits record stable Mid-Pleistocene hydroclimate during phases of human occupation of Central Asia, EGU General Assembly 2026, Vienna, Austria, 3–8 May 2026, EGU26-14556, https://doi.org/10.5194/egusphere-egu26-14556, 2026.

EGU26-14701 | PICO | AS3.5

Trace metal-containing aerosols in the atmosphere of the Indian Ocean 

Johannes Passig, Aleksandrs Kalamašņikovs, Haseeb Hakkim, Robert Irsig, Sven Ehlert, Andreas Walte, Eric Achterberg, and Ralf Zimmermann

Atmospheric deposition of aerosols constitutes a major source of iron and other micronutrients to remote ocean regions, where nutrient limitation constrains primary productivity and carbon sequestration. However, large uncertainties persist due to sparse observational data and the lack of sensitive techniques capable of resolving metal solubility at low aerosol loadings. Here we present first results from a shipborne campaign conducted aboard R/V Sonne across the Indian Ocean in late 2024 within the framework of the GEOTRACES program.

Aerosol particles were characterized using a novel single-particle mass spectrometer (SPMS) employing resonant laser ionization, enabling the analysis of the chemical composition of several hundred thousand individual particles. While sea spray aerosols dominated the overall particle population, thousands of iron-containing particles were detected, primarily associated with long-range transported mineral dust. Notably, a subset of sea spray aerosol particles exhibited detectable iron signals, suggesting in-cloud mixing or surface re-emission processes as potential sources.

For mineral dust particles, nitrate represented the dominant secondary component even in air masses without continental influence for more than ten days. Elevated iron contents within dust particles frequently coincided with the presence of dicarboxylic acids, whereas Mg/Ca-rich particles were preferentially associated with sulfate, indicating distinct atmospheric processing pathways, transport histories, and likely differences in iron solubility. By resolving such internal mixtures at the single-particle level, the SPMS provides a powerful approach for source attribution and for assessing the potential bioavailability of aerosol-derived metals. These observations reveal an unexpectedly high abundance and chemical diversity of iron-containing aerosols over the Indian Ocean, underscoring their importance for ocean biogeochemistry and nutrient cycling in this understudied region.

How to cite: Passig, J., Kalamašņikovs, A., Hakkim, H., Irsig, R., Ehlert, S., Walte, A., Achterberg, E., and Zimmermann, R.: Trace metal-containing aerosols in the atmosphere of the Indian Ocean, EGU General Assembly 2026, Vienna, Austria, 3–8 May 2026, EGU26-14701, https://doi.org/10.5194/egusphere-egu26-14701, 2026.

EGU26-16641 | ECS | PICO | AS3.5

Size-resolved mineralogy and grain size-shape analysis of airborne and deposited mineral dust in northern China 

Katja Bohm, Hui Tang, Bin Wang, Sergio Andò, Anu Kaakinen, Thomas Stevens, Johanna Salminen, Ove Haugvaldstad, Eduardo Garzanti, and Jianrong Bi

The chemical and physical properties of atmospheric mineral dust play a key role in determining its climatic and environmental effects. These properties also vary globally, highlighting the importance of observational studies and regional investigations in enhancing global models. One of the major global dusty regions is Central-East Asia, where severe dust events occur frequently. It also hosts the largest terrestrial mineral dust record on Earth, the Chinese Loess Plateau (CLP), where dust has been deposited over the past 2.6 million years and beyond. The CLP region thus offers a globally unique archive to investigate the role of dust in both past and present climate states.

In this ongoing project, dust was collected in 2019–2021 by passive and active dust samplers from a total of six locations across the CLP region. Active collectors were placed at the Lanzhou University Semi-Arid Climate and Environment Observatory (SACOL; Gansu) and in the Shapotou District of Zhongwei (Ningxia) in the southeastern margin of the Tengger Desert. Passive samplers were placed at SACOL, Lingtai (Gansu), Yinchuan (Ningxia), Luochuan (Shaanxi), and Fugu (Shaanxi).

Grain size distributions and grain shape parameters (e.g., circularity, convexity, elongation) were measured simultaneously by Dynamic Image Analysis (DIA), while magnetic susceptibility measurements were also applied to the samples. The mineralogy of different size fractions was analysed using a single grain approach by Raman spectroscopy in the 2–10, 10–20, 20–63, and >63 µm grain size windows. Future investigations will include X-ray diffraction mineralogical analysis of the <2 µm fraction.

Temporal variations with up to daily resolution of the above-mentioned dust properties were studied from the Shapotou site, and initial magnetic susceptibility analyses suggest a change in the iron oxide composition and/or grain size during a severe dust storm event in March 2021. Future analyses will combine dust source contribution modelling and sedimentological dust provenance studies to better understand the dust cycle in Central-East Asia and its driving forces. We will also use the information on the modern dust properties and provenance to enhance understanding of the past Central-East Asian dust cycle during varying global climate states in Earth’s history and during the formation of the CLP. These include periods of warmer global climates that can be considered analogous to future conditions on our planet.

How to cite: Bohm, K., Tang, H., Wang, B., Andò, S., Kaakinen, A., Stevens, T., Salminen, J., Haugvaldstad, O., Garzanti, E., and Bi, J.: Size-resolved mineralogy and grain size-shape analysis of airborne and deposited mineral dust in northern China, EGU General Assembly 2026, Vienna, Austria, 3–8 May 2026, EGU26-16641, https://doi.org/10.5194/egusphere-egu26-16641, 2026.

EGU26-17511 | ECS | PICO | AS3.5

Late Pleistocene dust imprint in coastal dune archives spanning from the Canary to the Tyrrhenian Basin - Preliminary results 

Carsten Marburg, Andreas Gärtner, Heino Schäfer, Anja Maria Schleicher, Dominik Faust, and Christopher-Bastian Roettig

Saharan dust input is a well-known phenomenon worldwide but especially concerning landscapes around the Mediterranean Sea and on the Canary Islands since the largest dust source areas on earth are located in the Northern African continent. This dust transport is not just a recent process but has also been going on for the last glacial period with changing intensities. The availability of dust depends mainly on the vegetation cover in the source areas as well as changing wind strengths/pathways and is therefore a function of changing climate. Its effects have been imprinted in several geoarchives and are also well known from aeolianites. These coastal dune archives typically form in dependence of changes in sea level and are comprised of pale coloured carbonate sands, intercalated by reddish silty layers. The reddish silty layers are heavily influenced by dust imprint from the Northern African continent. The presented research project hence focuses on conducting detailed analyses on those layers to reconstruct the local and supraregional environmental conditions during the last glacial.
Our sites on the eastern Canary Islands (Lanzarote, Fuerteventura), SE-Spain, Balearic Islands (Formentera, Eivissa) and Sardinia offer best conditions to
(i) Analyse site-specific characteristics of the dust enriched layers and the stored information about the local environmental conditions,
(ii) Look for differences or systematical similarities in terms of quantities and admixture of dust material when comparing the different silty layers within a single site/profile,
(iii) Identify distinct source areas of dust as well as dominating dust pathways and
(iv) Correlate the different sites from the Canary to the Tyrrhenian basin and deduce supraregional patterns.
So far we conducted extensive fieldwork at all sites and realised a variety of laboratory analyses on samples from the Balearic Islands, for example grain-size specific heavy mineral, XRF-, XRD- and grain-size analysis. With our first results we identified dust enriched layers and utilised analysis of heavy mineral compositions as an additional method to trace possible dust source areas. With this we hope to contribute to the understanding of the large-scale development in the Western Mediterranean region and the Canary Islands during the last glacial.

How to cite: Marburg, C., Gärtner, A., Schäfer, H., Schleicher, A. M., Faust, D., and Roettig, C.-B.: Late Pleistocene dust imprint in coastal dune archives spanning from the Canary to the Tyrrhenian Basin - Preliminary results, EGU General Assembly 2026, Vienna, Austria, 3–8 May 2026, EGU26-17511, https://doi.org/10.5194/egusphere-egu26-17511, 2026.

EGU26-18628 | ECS | PICO | AS3.5

How well do climate models represent dust events over the Mediterranean, North Africa, and the Middle East? 

Faidon Mavroudis, Antonis Gkikas, Donifan Barahona, Marı́a Gonçalves Ageitos, Danny Leung, Carlos Pérez Garcı́a-Pando, Ove Westermoen Haugvaldstad, and Georgia Sotiropoulou

Dust aerosols constitute a key component of the Earth–atmosphere system, affecting the radiation budget, the microphysical and optical properties of clouds, air quality, terrestrial and aquatic processes, and human health. Dust-related impacts are critically governed by the atmospheric load of mineral particles and are amplified when the dust burden substantially exceeds background levels. Such conditions, commonly referred to as episodes or events, are exceptional and characterized by pronounced spatiotemporal heterogeneity.

In this study, we present an intercomparison of three state-of-the-art climate models (EC-Earth3, CESM2, and NorESM2) and the GiOcean Reanalysis in representing dust events over the Mediterranean, North Africa, and the Middle East during the period 2003–2018. A percentile-based threshold methodology is applied to  daily dust optical depth (DOD) and aerosol optical depth (AOD) values, at both the grid-cell and regional scales, to identify three intensity-based episode categories: weak, moderate and extreme.  In addition, the satellite-based MIDAS dataset, which provides columnar DOD at 550 nm, is used as a reference for model evaluation.

The primary objective of this study is to assess inter-model differences in the representation of dust episode frequency of occurrence and intensity across multiple spatiotemporal scales, considering both free-running and nudged model configurations. Our working framework enables a comprehensive analysis by: (i) evaluating the ability of state-of-the-art climate models to represent different dust episode regimes, and (ii) investigating how threshold definitions influence the resulting spatiotemporal patterns of dust episodes. Finally, the outcomes of this study are expected to substantially enhance understanding of the strengths and limitations of climate models in depicting dust episode characteristics, thereby supporting improved projections under different climate scenarios throughout the 21st century.

How to cite: Mavroudis, F., Gkikas, A., Barahona, D., Gonçalves Ageitos, M., Leung, D., Garcı́a-Pando, C. P., Haugvaldstad, O. W., and Sotiropoulou, G.: How well do climate models represent dust events over the Mediterranean, North Africa, and the Middle East?, EGU General Assembly 2026, Vienna, Austria, 3–8 May 2026, EGU26-18628, https://doi.org/10.5194/egusphere-egu26-18628, 2026.

EGU26-18712 | ECS | PICO | AS3.5

A sink-to-source reverse approach to identify dust source regions within the Sahara based on PM₁₀ levels measured on the West African coast 

Marie Madeleine Atome Bassene, Aloys Bory, Moctar Camara, Yevgeny Derimian, Jean-Eudes Petit, Jean-Louis Rajot, Beatrice Marticorena, Laurine Verfaille, Dioncounda Yock, Fode Sambou, Thierno Mamadou Ndiaye, Aboubacry Diallo, and Viviane Roumazeilles

West Africa is a key region for the transport and deposition of Saharan mineral dust, with major impacts on air quality, climate, and ecosystems. Dust sources are numerous within the Sahara and their spatial extent remains poorly constrained, as do their granulometric, mineralogical, and chemical characteristics, which however control their impacts. Moreover, emission maps available in the literature do not allow the relative contribution of different source regions to a given impacted area to be assessed.

This study proposes a sink-to-source reverse approach aimed at improving the characterization of dust emission areas affecting the coastal West Africa. It is based on a three-year time series of PM₁₀ concentrations measured in Casamance, southern Senegal, a region under the influence of easterly winds (Harmattan) responsible for the transport of Saharan dust in the lower troposphere during the dry season. The measurements were conducted at a rural site (Pointe Saint Georges), minimally influenced by local and anthropogenic emissions.

PM₁₀ concentrations were coupled with air mass back-trajectories calculated using the HYSPLIT model and analyzed with the ZeFir software in order to identify potential source regions. Preliminary results suggest that, during high PM₁₀ concentration events observed along the West African coast, dust derived from two dominant sectors : one to the north-east including areas in Mauritania and across the Algerian-Mali border, and one to the east across the Sahelian region, confirming earlier findings (Le Quilleuc et al., 2021, JGR, doi.org/10.1029/2021JD035030). These results will be discussed in the light of emission areas provided by the satellite-based IDDI (Infrared Difference Dust Index) product as well as data on dust sources from the literature.

The results that will be presented highlight the potential of this sink-to-source approach for identifying mineral dust source areas based on airborne concentrations. This methodology, relying on low-cost sensors, is reproducible and applicable to any site located downwind of desert regions.

Keywords : PM₁₀, Saharan dust, Casamance, Senegal, air mass back-trajectories, HYSPLIT, ZeFir software, IDDI, sources

How to cite: Bassene, M. M. A., Bory, A., Camara, M., Derimian, Y., Petit, J.-E., Rajot, J.-L., Marticorena, B., Verfaille, L., Yock, D., Sambou, F., Ndiaye, T. M., Diallo, A., and Roumazeilles, V.: A sink-to-source reverse approach to identify dust source regions within the Sahara based on PM₁₀ levels measured on the West African coast, EGU General Assembly 2026, Vienna, Austria, 3–8 May 2026, EGU26-18712, https://doi.org/10.5194/egusphere-egu26-18712, 2026.

EGU26-19014 | ECS | PICO | AS3.5

Fewer Dust Storms, Greater Dust Concentration in the Air 

Alaa Mhawish, Udaya Bhaskar Gunturu, Saud Alamoudi, Sultan Alduaji, and Jumaan Alqahtani

Recent observations over the Arabian Peninsula reveal an apparent paradox: while the frequency of synoptically forced dust storms has declined since the late 1990s, mean near-surface dust concentrations, poor-visibility events, and chronic air-quality degradation have increased. This contrast is often attributed to changes in emissions or land use. Here, we propose instead that the paradox reflects an abrupt dynamical regime shift in large-scale circulation and boundary-layer ventilation. The Arabian Peninsula is strongly influenced by baroclinic disturbances generated by short-wavelength Rossby waves radiated from the subtropical jet stream (STJ). These disturbances drive deep vertical coupling, strong surface winds, and efficient ventilation of the boundary layer. Multiple independent diagnostics indicate that the regional circulation underwent an abrupt transition in the late 1990s, marked by increased static stability, increased pressure depth of the troposphere, a reduction in the squared meridional temperature gradient, and a corresponding decline in mean available potential energy. These changes are consistent with weakened Rossby wave radiation and reduced baroclinic activity downstream of the STJ.

The consequences of this transition are twofold. First, reduced baroclinic activity suppresses deep convection, strong downdrafts, and synoptically driven high-wind events, leading to a decline in dust storm frequency. Second, and critically, weakened ageostrophic flow at the top of the boundary layer reduces shear-driven turbulence generation, particularly under stable boundary-layer conditions. The resulting collapse of vertical mixing limits ventilation and increases the residence time of dust near the surface, leading to higher mean surface concentrations despite fewer extreme dust events.

This framework extends a dynamical theory previously developed to explain abrupt increases in fog under weakened baroclinic forcing to mineral dust and air quality. The results demonstrate that reduced ventilation alone is sufficient to reconcile declining dust storm frequency with increasing surface dust loading, highlighting the nonlinear sensitivity of boundary-layer processes to large-scale circulation changes. The findings underscore the importance of regime shifts in atmospheric dynamics for understanding long-term changes in dust, pollution, and visibility in arid regions.

How to cite: Mhawish, A., Gunturu, U. B., Alamoudi, S., Alduaji, S., and Alqahtani, J.: Fewer Dust Storms, Greater Dust Concentration in the Air, EGU General Assembly 2026, Vienna, Austria, 3–8 May 2026, EGU26-19014, https://doi.org/10.5194/egusphere-egu26-19014, 2026.

EGU26-19098 | ECS | PICO | AS3.5

Source-Limited Dust Emission in the Tarim Basin, China: Landform-Specific Parameterisation and Wind-Flux Hysteresis 

Yin Guo, Xin Gao, Jiaqiang Lei, and Wim Cornelis

Abstract: Dust emissions from the Tarim Basin, China, are governed by strong surface heterogeneity and finite sediment supply, two pivotal controls that can induce source depletion and wind-flux hysteresis during dust events. In this study, we adopt the source-limited dust emission (SLDE) scheme proposed by Shao (2025) and develop a landform-specific parameterization that couples remotely sensed surface units with field-measured particle-size data. Specifically, we generate a mutually exclusive seven-class geomorphology map in Google Earth Engine via a hierarchical decision tree, which integrates multi-source datasets including topography (MERIT DEM), vegetation coverage (MODIS NDVI), surface water occurrence (JRC Global Surface Water), and Sentinel-1 backscatter texture characteristics. The resultant geomorphological units comprise mobile dunes, vegetated hummock dunes, fixed/semi-fixed sandy lands, interdune areas, gobi/deflation surfaces, fluvial-lacustrine sediments, and mountain/loess terrains. For each unit, class-specific particle-size distributions are compiled from in-situ measurements and converted into discretized lookup tables, which serve as static input parameters for the SLDE scheme. Initial diagnostic experiments at both column and point scales, driven by hourly 10-m wind data from ERA5-Land (for the April 2020 case study), reveal distinct dust emission regimes across different landform types. On supply-limited surfaces-notably gobi/deflation and fluvial-lacustrine units-our simulations demonstrate that dust flux declines markedly under sustained high-wind conditions as the near-surface sediment reservoir becomes depleted, leading to pronounced hysteresis in the wind-flux relationship. The effective emission efficiency decreases from nearly unity at the onset of dust events to ~0.1 by the late stages, even when wind speeds remain above the threshold friction velocity for dust emission. In contrast, transport-limited behavior dominates in regions with ample sediment supply. These findings establish a physically interpretable framework for deriving SLDE parameters from geomorphological classifications and particle-size properties. Ongoing gridded simulations will quantify the extent to which sediment depletion reshapes the spatial contribution of key deflation zones, as well as the event-integrated dust emission budget, relative to results derived under conventional transport-limited assumptions.

Keywords: Source-limited dust emission; Source depletion; Wind-Flux Hysteresis; Particle size distribution

How to cite: Guo, Y., Gao, X., Lei, J., and Cornelis, W.: Source-Limited Dust Emission in the Tarim Basin, China: Landform-Specific Parameterisation and Wind-Flux Hysteresis, EGU General Assembly 2026, Vienna, Austria, 3–8 May 2026, EGU26-19098, https://doi.org/10.5194/egusphere-egu26-19098, 2026.

EGU26-19364 | ECS | PICO | AS3.5 | Highlight

Experimental Characterisation of the Electric and Magnetic Fields Generated by Dust Devils  

David Reid, Karen Aplin, and Nick Teanby

Lofted particulate in dust devils becomes charged through triboelectrification, that is, the exchange of charge in collision between grains. Electric fields from charged dust were first detected in the mid 17th century, with quantitative measurements recording in the region of kilovolts per metre. Magnetic field observations of dust devils are much less common, with the only published terrestrial measurement from 2001 in Arizona. The most complete magnetic field dataset associated with dust devils comes from NASA’s InSight mission to Mars, with 1200 sols of near-continuous observation, and over 15000 convective events detected, likely to be dust devils.  

To better understand the expected electric and magnetic fields generated by these aeolian features, a new apparatus was developed, building upon previous experimental work. The Terrestrial Experimental appaRatus for Investigating the Electric and magnetic fields of dust devils (TERIE) consists of a multi-instrumented 1000 mm diameter, 1200 mm tall tank, lined externally with grounded aluminium foil to act as a Faraday cage, and internally with sand to reduce the impact of tribocharging from particle-wall collisions. 

The apparatus records electric field strength at 4 vertical positions, and the (vector) magnetic field at 3 vertical positions. Through photodiodes, the optical thickness of the dust devil column can be evaluated, and offline sampling of the suspended particles can be used to understand the distribution through the profile of the simulated event. By incorporation of different mast positions, the radial profile of the generated field can also be investigated. 

Initial results from the new experimental apparatus show electric fields exceeding 40~kVm-1 were generated by the rotation of sand, with the distribution of the field broadly matching that expected from simulation. Some low frequency, sub-nanotesla variations in magnetic field were detected in the presence of rotating charged sand, consistent with expectations from models and previous experiments.  

How to cite: Reid, D., Aplin, K., and Teanby, N.: Experimental Characterisation of the Electric and Magnetic Fields Generated by Dust Devils , EGU General Assembly 2026, Vienna, Austria, 3–8 May 2026, EGU26-19364, https://doi.org/10.5194/egusphere-egu26-19364, 2026.

EGU26-19688 | ECS | PICO | AS3.5

The Pb, Nd, and Sr isotopic characterisation of dust sources in North Africa and Western Asia. 

Daniel Howcroft, Anya Crocker, Rex Taylor, Agnes Michalik, J. Andy Milton, Nick Drake, Paul Breeze, Derek Keir, Michael Petraglia, Jaafar Jotheri, Deepak Jha, and Paul Wilson

Mineral dust is a key component of Earth’s climate system; it influences the global radiation budget, fertilises ecosystems, and constitutes a threat to human health. Accumulation of windblown dust in marine archives provides a means to assess past change in Earth’s continental hydroclimate. However, interpretations of these records are often undermined by an attribution problem: the uncertainty of provenance. Here we report new radiogenic isotope data (Sr, Nd, and Pb) from unconsolidated surface sediments sampled from active dust sources and integrate them with published geochemical and satellite-derived datasets (such as dust source activation frequency (DSAF)) to define preferential source areas (PSAs) across the Northern Hemisphere dust belt. Our analysis shows that pairing Pb with Nd or Sr isotope data allows clearer discrimination between source regions that overlap in Nd-Sr space. We also show that Pb data are particularly helpful to discriminate between sources when presented as D207Pb/204Pb and D208Pb/204Pb: deviations of Pb from the Northern Hemisphere Reference Line (NHRL) that defines the Pb isotopic evolution of the Northern Hemisphere’s mantle. Comparison with published Pb isotope data reveals major limitations in spatial coverage and suggests that application of more consistent cleaning protocols is merited including removal of anthropogenic Pb. Nevertheless, our new data help to discriminate among the dust sources of East Africa and Western Asia more clearly than before, improving our ability to interpret past continental hydroclimate change recorded in marine sediment cores from the northern Indian Ocean.

How to cite: Howcroft, D., Crocker, A., Taylor, R., Michalik, A., Milton, J. A., Drake, N., Breeze, P., Keir, D., Petraglia, M., Jotheri, J., Jha, D., and Wilson, P.: The Pb, Nd, and Sr isotopic characterisation of dust sources in North Africa and Western Asia., EGU General Assembly 2026, Vienna, Austria, 3–8 May 2026, EGU26-19688, https://doi.org/10.5194/egusphere-egu26-19688, 2026.

EGU26-20205 | PICO | AS3.5

Selected Mineral Dust Events at the Sonnblick Observatory in 2024: Identification and Characterization Using In-Situ Data, PMF analysis and Atmospheric Transport Modelling 

Gerhard Schauer, Barbara Scherllin Pirscher, Alicja Skiba, Thomas Bachleitner, Kathrin Baumann-Stanzer, Anne Kasper-Giebl, and Julia Burkart

Mineral dust, emitted from soils in arid regions by wind erosion, represents one of the largest fractions of atmospheric aerosol by mass. Once airborne, dust can travel thousands of kilometers, influencing the atmosphere through scattering and absorption of sunlight, acting as ice-nucleating particles, and depositing on the ground where it reduces snow albedo and delivers nutrients to remote regions. High-altitude mountain stations provide a unique opportunity to study dust in the free troposphere and its long-range transport.

The Sonnblick Observatory (3106 m a.s.l.), located on the main ridge of the Austrian Alps, receives dust, particularly from Northern Africa, throughout the year. In this study, we focus on selected dust events during 2024, a year of particular interest due to one of the most intense events (aerosol mass above 700 µg/m3, 30 min averages) detected at the observatory. The observatory is a Global Atmosphere Watch (GAW) station, an Aerosol, Clouds, and Trace Gases Research Infrastructure (ACTRIS) aerosol in situ national facility and hosts a variety of aerosol, cloud and meteorological measurements.

Saharan dust events (SDEs) are initially identified using the “Saharan Dust Event Index,” routinely derived from in-situ optical measurements (nephelometer and aethalometer) at the station (Schauer et al. 2016). In addition, positive matrix factorization (PMF) of in-situ aerosol data is applied, with one significant factor interpreted as mineral dust and used for a second, independent event identification. PMF highlights events that may not be captured by the Saharan Dust Index, illustrating its potential as a complementary approach for dust detection. Individual events are further characterized using the full suite of in-situ measurements and weekly offline chemical composition analyses (inorganic ions, selected elements and carbohydrates as well as elemental and organic carbon) of PM10 filter samples, again combined with PMF analysis to identify major aerosol sources. Particle size distributions up to 100 µm during SDEs are retrieved from multiple instruments, including a mobility spectrometer, optical particle counter, and holographic measurements (SwisensPoleno Jupiter). Average size distributions are calculated for each event. Meteorological and atmospheric conditions are analyzed in relation to particle size distributions and optical properties. Particular attention is given to events identified solely by PMF.

Typical transport pathways are investigated using FLEXPART, and dust concentrations are simulated with WRF-Chem (Weather Research and Forecasting (WRF) model coupled with Chemistry) and compared with in-situ observations. The WRF-Chem simulation considers only dust emissions, generated by the AFWA (Air Force Weather Agency) dust emission scheme. Hourly-resolved surface dust concentration, vertically resolved dust concentration profiles, and dust load are available on a 0.2° x 0.2° latitude-longitude grid. The data also contribute to the Sand and Dust Storms Warning Advisory and Assessment System (SDS-WAS) model ensemble.

We summarize a full season of observed dust events, identify their characteristic features and develop a data analysis strategy applicable to longer time periods. In particular, we examine PMF analysis as a potential tool for SDE detection.

Schauer, G., Kasper-Giebl, A. and Mocnik, G. (2016); https://doi.org/10.4209/aaqr.2015.05.0337

Acknowledgements
The participation of A. Skiba was supported by the program “Excellence Initiative – Research University” for the AGH University of Krakow (ID:13958).

How to cite: Schauer, G., Scherllin Pirscher, B., Skiba, A., Bachleitner, T., Baumann-Stanzer, K., Kasper-Giebl, A., and Burkart, J.: Selected Mineral Dust Events at the Sonnblick Observatory in 2024: Identification and Characterization Using In-Situ Data, PMF analysis and Atmospheric Transport Modelling, EGU General Assembly 2026, Vienna, Austria, 3–8 May 2026, EGU26-20205, https://doi.org/10.5194/egusphere-egu26-20205, 2026.

EGU26-21358 | PICO | AS3.5

The A-LIFE aircraft field experiment in the Eastern Mediterranean: what have we learned about mineral dust mixtures? 

Bernadett Weinzierl, Maximilian Dollner, Josef Gasteiger, Marilena Teri, Manuel Schöberl, Katharina Heimerl, Anne Tipka, Petra Seibert, Heidi Huntrieser, Robert Wagner, Konrad Kandler, Aryasree Sudharaj, Thomas Müller, Sophia Brilke, Nikolaus Fölker, Daniel Sauer, Oliver Reitebuch, Silke Groß, Volker Freudenthaler, and Carlos Toledano and the A-LIFE Science Team

Mineral dust is a key component of the globally-emitted aerosol mass. Although, mineral dust mixes with anthropogenic pollution during its atmospheric lifetime, data on polluted mineral dust layers have been scarce.

In April 2017, the A-LIFE aircraft field experiment (www.a-life.at) was carried out in the Eastern Mediterranean. A-LIFE combined ground-based, airborne, satellite, and modelling efforts to characterize mineral dust mixtures with unprecedented detail. In 22 research flights (~80 flight hours), outbreaks of Saharan and Arabian dust, as well as pollution, biomass burning, and dust-impacted clouds were studied, and a unique aerosol and cloud data set was collected. Aerosol source apportionment was achieved with the Lagrangian transport and dispersion model FLEXPART version 8.2. Based on FLEXPART model results and aerosol measurements, the observations were classified into 12 aerosol types consisting of four main aerosol types (Saharan dust, Arabian dust, mixtures with and without coarse mode). Each of the four main aerosol types was further separated into three sub-classes (clean, moderately-polluted and polluted). For each of the 12 aerosol classes, microphysical and optical aerosol properties were derived.

For the first time, the effect of pollution on the microphysical and optical properties of Saharan and Arabian dust was investigated systematically, revealing significant changes as a function of pollution content. The particle size distribution changes as a function of pollution content with effective diameters systematically decreasing for increasing pollution content. The collected data also provide new insights into the impact of Saharan and Arabian dust on cloud evolution processes, atmospheric radiation budget, and local meteorology. One outstanding finding of A-LIFE is that scattering properties of polluted dust mixtures do not show the typical dust signature, but rather show a wavelength-dependency of the scattering coefficient which is typical for pollution. This means that optical properties of mineral mixtures are frequently dominated by the pollution.

In this presentation, we will show the results of the A-LIFE project including its mission objectives, experimental design, and meteorological conditions; highlight major A-LIFE findings; and feature the available data products on the optical, microphysical, and hygroscopic properties of pure and polluted mineral dust.

How to cite: Weinzierl, B., Dollner, M., Gasteiger, J., Teri, M., Schöberl, M., Heimerl, K., Tipka, A., Seibert, P., Huntrieser, H., Wagner, R., Kandler, K., Sudharaj, A., Müller, T., Brilke, S., Fölker, N., Sauer, D., Reitebuch, O., Groß, S., Freudenthaler, V., and Toledano, C. and the A-LIFE Science Team: The A-LIFE aircraft field experiment in the Eastern Mediterranean: what have we learned about mineral dust mixtures?, EGU General Assembly 2026, Vienna, Austria, 3–8 May 2026, EGU26-21358, https://doi.org/10.5194/egusphere-egu26-21358, 2026.

EGU26-589 | ECS | Orals | AS3.6

Enhancement of Cloud Condensation Nuclei during NPF events over a location in Eastern Himalayan Foothills   

Barlin Das, Binita Pathak, Uday Bhattacharjee, Arundhati Kundu, Shyam S. Kundu, Mukunda M. Gogoi, Arup Borgohain, and Pradip K. Bhuyan

The contribution of newly formed aerosol particles to cloud condensation nuclei (CCN) via gas-to-particle (GTP) conversion is highly uncertain. Here, we present results from a one-month simultaneous measurement of aerosol number concentration (N10-299.6) and CCN concentrations (NCCN) over a seemingly unpolluted location, Dibrugarh, in the Eastern Himalayan Foothills, during the winter of 2023. The average diurnal variation of NCCN at different supersaturations is in line with the scanning mobility particle sizer (SMPS)-measured N10-299.6 with a systematic diurnal variation of highest (lowest) concentrations during nighttime (daytime) under the influence of planetary boundary layer (PBL) dynamics. We have identified four new particle formation (NPF) events during the study period, with a frequency of ~13% of the study days. The distinct mode of average PNSD at the lower size regime (<25 nm) determines the NPF burst. Later, they continue to grow through coagulation and condensation processes with a growth rate ranging from 4.5 to 7.2 nm h−1. The growth process begins with coagulation, followed by condensation, which becomes the dominant mechanism in the formation of CCN. Moreover, the enhancement factor of CCN due to NPF (E_NCCN) was estimated to examine the aerosol-CCN interaction and was found to vary between 2.32 to 7.74 for all four NPF events at the supersaturation range of 0.2-1%. These values are in line with many urban places across the globe. However, state-of-the-art instruments and longer temporal analyses of CCN concentrations, as well as NPF precursor dynamics, are required to evaluate the seasonality and in-depth understanding of the processes.


How to cite: Das, B., Pathak, B., Bhattacharjee, U., Kundu, A., Kundu, S. S., Gogoi, M. M., Borgohain, A., and Bhuyan, P. K.: Enhancement of Cloud Condensation Nuclei during NPF events over a location in Eastern Himalayan Foothills  , EGU General Assembly 2026, Vienna, Austria, 3–8 May 2026, EGU26-589, https://doi.org/10.5194/egusphere-egu26-589, 2026.

EGU26-1744 | ECS | Posters on site | AS3.6

Global distributions of Ice-nucleating particles using  ICON-ART 

Jennifer Winstone, Noel Chawang, Martina Klose, Gholamali Hoshyaripour, and Corinna Hoose

Ice nucleating particles (INPs) are aerosols that lower the energy barrier for ice formation in mixed phase clouds, and therefore impact the liquid water fraction in these clouds. Hence, the prevalence of INPs affects the radiative properties of the cloud, as well as the precipitation formation.  In addition, the liquid water fraction of clouds is one factor thought to be contributing to the consistent Southern Ocean radiation bias found across CMIP6 models.  Cloud-aerosol interactions remain a major area of uncertainty in climate modelling, and non-aerosol-aware models use INP parameterisations that are purely temperature dependent and do not take into account the regional variation in aerosol concentration and type.

 Here, we will present modelled global distributions of mineral dust and marine organic INPs – and their relative contributions to the total INP – calculated from simulations with the Aerosol and Reactive Trace (ART) gases module of the ICOsahedral Nonhydrostatic NWP model (ICON).  The INPs are calculated offline using the Ice-nucleating active site (INAS) densities for immersion freezing provided by Ullrich et al 2014 for dust INP and McCluskey et al 2018 for marine INP. The simulations run for one year at 80km horizontal grid spacing.  A comparison to the temperature-only parameterisations and observations of INPs is made, with a particular focus on Antarctica (data from Wex et al 2025) and the Southern Ocean (Antarctic Circumnavigation Expedition ship campaign).

Furthermore, we calculate INPs using a preliminary version of the seamless ICON-ART (ICON-SmART) model and evaluate this. Ultimately, the aim is to improve online INP modelling in ICON-SmART, in part to address the Southern Ocean radiation bias found in seasonal to decadal simulations.

How to cite: Winstone, J., Chawang, N., Klose, M., Hoshyaripour, G., and Hoose, C.: Global distributions of Ice-nucleating particles using  ICON-ART, EGU General Assembly 2026, Vienna, Austria, 3–8 May 2026, EGU26-1744, https://doi.org/10.5194/egusphere-egu26-1744, 2026.

EGU26-2579 | Posters on site | AS3.6

Hail suppression effectiveness for different populations of cloud condensation nuclei 

Nemanja Kovačević and Lazar Filipović

A cloud-resolving model with a two-moment bulk microphysical scheme was used to investigate the indirect impact of three cloud condensation nuclei (CCN) parameters – the mean radius (rm), the standard deviation of the CCN spectrum (lnσ), and their solubility in water (εm)—on surface hail accumulation under various aerosol conditions. A sensitivity study was conducted using numerical simulations. Different combinations of these three CCN parameters were tested in continental and maritime environments for both unseeded (control) and seeded cases. The spatial distributions of surface rain and hail were analysed. Continental conditions characterised by extremely low CCN solubility in water were not suitable for hail suppression. Hail suppression was favourable (–26.2% and –8.7%) over continents with typical CCN concentrations (100–1000 cm–3). A highly polluted continental environment showed the greatest reduction in surface hail due to cloud seeding (–84.7%). Over maritime areas, a surplus of rain was observed in all seeded simulations. The effectiveness of hail prevention was discouraging (136.3%) under certain maritime conditions (εm = 1; lnσ = 1; rm = 0.1 μm). An extreme maritime condition resulted in very little hail suppression (–0.3%). It can be concluded that different CCN characteristics strongly affect surface amounts of rain and hail, as well as operational decisions on whether to conduct cloud seeding to prevent damaging hail on the ground.

Acknowledgement: This research was supported by the Science Fund of the Republic of Serbia, No. 7389, Project: "Extreme weather events in Serbia - analysis, modelling and impacts” - EXTREMES and by the Ministry of Science, Technological Development and Innovations of Serbia under Grant No. 451-03-136/2025-03/200162.


How to cite: Kovačević, N. and Filipović, L.: Hail suppression effectiveness for different populations of cloud condensation nuclei, EGU General Assembly 2026, Vienna, Austria, 3–8 May 2026, EGU26-2579, https://doi.org/10.5194/egusphere-egu26-2579, 2026.

EGU26-3153 | ECS | Posters on site | AS3.6

Dust effects on cloud properties in dust-infused baroclinic storm (DIBS) over East Asia 

Yi Zeng, Minghuai Wang, Yannian Zhu, and Kang-En Huang

Dust particles impose significant effects on the microphysics of mixed-phase and ice clouds. Previous studies mainly focused on dust-cloud interaction at the scale of convection, lacking the investigation of dust’s indirect effect in extratropical cyclone (EC) systems. In this study, we investigate dust effect on cloud properties by examining a decade (2016–2025) of Mongolian cyclones, which are primary drivers of East Asian dust-infused baroclinic storms (DIBS). Using automated tracking, satellite observations, and reanalysis data, we compare cloud properties under various dust conditions during DIBS events. Increasing dust loading enhances ice cloud fraction but reduces ice effective radius in both mixed-phase and ice regime in DIBS. This indicates that ice formation in East Asian DIBS ice clouds is dominated by heterogeneous rather than homogeneous nucleation. These results establish the significant role of dust in modulating the cloud phase partitioning and microphysical properties within ECs.

How to cite: Zeng, Y., Wang, M., Zhu, Y., and Huang, K.-E.: Dust effects on cloud properties in dust-infused baroclinic storm (DIBS) over East Asia, EGU General Assembly 2026, Vienna, Austria, 3–8 May 2026, EGU26-3153, https://doi.org/10.5194/egusphere-egu26-3153, 2026.

Aerosol particles play a critical role as cloud condensation nuclei (CCN) in the atmosphere. The capacity of aerosol particles to activate into cloud droplets is measured experimentally using CCN counters (CCNCs). Recent findings suggest that the co-condensation effect of semi-volatiles can enhance aerosol particle growth and cloud droplet activation. Conventional CCNCs, such as the streamwise CCNC, heat particles (>30°C) as they transit the CCNC column and may inadvertently not capture the co-condensation effect, leading to an underestimate in CCN concentrations. Additionally, streamwise CCNCs struggle to achieve supersaturations (SS) below 0.13%. In pristine marine environments like the Southern Ocean, where particles are highly hygroscopic (κ≈0.9), getting reliable activation (i.e., critical supersaturation) of particles above 120 nm (i.e., the accumulation mode) could be challenging. This could result in 'activation blindness,' preventing precise CCN characterization of these climatically relevant particles.

To address these limitations, we developed the Horizontal CCNC (HCCNC), which can generate SS at temperatures down to 4 °C and SS level to 0.05%. This capability provides researchers with a unique platform to investigate the co-condensation effect, enabling studies that test the hypothesis that preserving semi-volatile fractions at atmospherically relevant temperatures may significantly enhance droplet activation. Furthermore, the ability to achieve stable SS down to 0.05% extends the observational window to include larger CCN (200 nm for pure ammonium sulfate) and highly hygroscopic particles characteristic of pristine marine environments like the Southern Ocean, as well as those used in weather modification and cloud seeding. The HCCNC also addresses operational inefficiencies inherent in current technology: streamwise CCNCs suffer from thermal inertia, requiring minutes to stabilize new SS setpoints, resulting in measurement dead time and data loss. In contrast, the HCCNC demonstrates rapid thermal response, enabling a “Flash Scan” capability that spans 0.05% to 0.8% SS in under one minute, combined with a modular, user-friendly design.

This study presents the development of the HCCNC, providing a detailed technical description of its 3D geometry, computational fluid dynamics simulations, and the key components that demonstrate its performance. Sampling and humidity generation followed the principle of the previously used continuous-flow thermal-gradient diffusion chambers. The instrument’s performance is validated by conducting laboratory tests using ammonium sulfate ((NH₄)₂SO₄) particles in the size range between 50 and 200 nm and for temperatures between 30 and 8 °C. To ensure these advancements are accessible to the wider scientific community, the HCCNC technology has been patent-filed, and commercialization efforts are currently underway to allow researchers to fully leverage its potential.

How to cite: Sapkal, M. G., Rösch, M., and Kanji, Z. A.: Development of the Horizontal Cloud Condensation Nuclei Counter (HCCNC) to Detect Particle Activation Down to 4 °C Temperature and 0.05% Supersaturation, EGU General Assembly 2026, Vienna, Austria, 3–8 May 2026, EGU26-3295, https://doi.org/10.5194/egusphere-egu26-3295, 2026.

EGU26-5683 | Orals | AS3.6

Incidental Ice: Why purified water freezes and pollen macromolecules nucleate ice 

Thomas F. Whale, Ziad Fakhoury, Martin I. Daily, Nina L. H. Kinney, and Gabriele Sosso

Predicting when water freezes, in the lab or in clouds, hinges on heterogeneous nucleation events that remain difficult to describe across scales. A synthesis of recent “purified” water experiments shows that droplets larger than ~10 nL almost always freeze at temperatures warmer than homogeneous nucleation allows, with the median freezing temperature increasing linearly with log(volume)—as found by Bigg (1953). Our compilation of recent results produces a trend line that closely matches that reported by Langham and Mason (1958). This empirical trend lacks a satisfactory theoretical basis. We advance a “chance nucleator” hypothesis: any somewhat disordered material in contact with supercooled water can, by combinatorial chance, present nanoscale patches that achieve a low effective contact angle with ice and trigger freezing. A simple classical nucleation theory (CNT) treatment captures much of the observed trend and predicts pronounced flattening at larger volumes, implying that carefully isolated millilitre- to litre-scale water volumes might supercool to lower temperatures than is reported in most of the literature.

We then apply the chance nucleator framework to interpret recent results on the nature of ice‑nucleating macromolecules (INMs) produced by pollen (Kinney et al., 2024). In this view, a statistical, non‑adaptive origin naturally explains why ice‑nucleation activity (INA) shows high interspecific variability and no consistent correlation with phylogeny, growth biome, seasonality, or pollination mode, yet still permits exceptional nucleators in which macromolecular composition or aggregation fortuitously produces rare, low‑contact‑angle patches. Thus, pollen INMs can be widespread and diverse despite the lack of an evolutionary driver for ice‑nucleation ability.


References
Bigg, E. K.: The supercooling of water, Proceedings of the Physical Society. Section B, 66, 688, 10.1088/0370-1301/66/8/309, 1953.
Kinney, N. L. H., Hepburn, C. A., Gibson, M. I., Ballesteros, D., and Whale, T. F.: High interspecific variability in ice nucleation activity suggests pollen ice nucleators are incidental, Biogeosciences, 21, 3201–3214, 10.5194/bg-21-3201-2024, 2024.
Langham, E. J. and Mason, B. J.: The Heterogeneous and Homogeneous Nucleation of Supercooled Water, Proceedings of the Royal Society of London Series A-Mathematical and Physical Sciences, 247, 493-&, 10.1098/rspa.1958.0207, 1958.

How to cite: Whale, T. F., Fakhoury, Z., Daily, M. I., Kinney, N. L. H., and Sosso, G.: Incidental Ice: Why purified water freezes and pollen macromolecules nucleate ice, EGU General Assembly 2026, Vienna, Austria, 3–8 May 2026, EGU26-5683, https://doi.org/10.5194/egusphere-egu26-5683, 2026.

EGU26-5955 | ECS | Posters on site | AS3.6

Influence of granulometry on the ice-nucleating efficiency of alkali feldspars 

Júlia Canet, Laura Rodriguez, Galit Renzer, Pura Alfonso, Mischa Bonn, Konrad Meister, Maite Garcia-Valles, and Albert Verdaguer

Mixed-phase clouds represent a major source of uncertainty in the representation of cloud microphysical processes in climate models. These clouds, consisting of supercooled liquid droplets and ice crystals, strongly influence precipitation formation and cloud radiative properties. Ice formation in mixed-phase clouds occurs predominantly via heterogeneous ice nucleation, enabling freezing at temperatures well above the homogeneous freezing limit of pure water [1].

Aerosol particles suspended in clouds can act as ice-nucleating particles (INPs), promoting heterogeneous ice formation through interactions between water molecules and particle surfaces. Numerous studies have shown that ice-nucleating (IN) activity [2] is governed by surface properties that influence the structure of interfacial water. Among atmospheric INPs, feldspars have received particular attention due to their high IN efficiency relative to other mineral dust components, especially alkali feldspars [3]. This efficiency has been linked to feldspar surface properties such as surface chemistry, crystallographic structure, and morphology [4].

Feldspar IN activity is not static but evolves in response to environmental and physicochemical processing. Here, we investigate the effect of mechanical comminution on the immersion freezing behavior of feldspars. Powdered feldspar samples were ground using different mortars and grinding durations, producing particle populations with distinct size distributions and specific surface areas. Our results demonstrate that changes in granulometry significantly affect ice-nucleating activity, indicating that particle size and surface state play an important role in controlling ice nucleation.


[1] Burrows, S. M., McCluskey, C. S., Cornwell, G., Steinke, I., Zhang, K., Zhao, B., Zawadowicz, M., Raman, A., Kulkarni, G., China, S., Zelenyuk, A., and DeMott, P. J.: Ice-Nucleating Particles That Impact Clouds and Climate: Observational and Modeling Research Needs, Rev. Geophys., 60, e2021RG000745, https://doi.org/10.1029/2021RG000745, 2022.

[2] Shimizu, T. K., Maier, S., Verdaguer, A., Velasco-Velez, J. J., and Salmeron, M.: Water at surfaces and interfaces: From molecules to ice and bulk liquid, Prog. Surf. Sci., 93, 87-107, https://doi.org/10.1016/j.progsurf.2018.09.004, 2018.

[3] Canet, J., Rodríguez, L., Renzer, G., Alfonso, P., Bonn, M., Meister, K., Garcia-Valles, M., Verdaguer, A.: Measurement report: Ice nucleation ability of perthite feldspar powder, EGU [preprint], https://doi.org/10.5194/egusphere-2025-5014, December 2025.

[4] Pach, E. and Verdaguer, A.: Pores Dominate Ice Nucleation on Feldspars, J. Phys. Chem. C, 123, 20998-21004, https://doi.org/10.1021/acs.jpcc.9b05845, 2019.


How to cite: Canet, J., Rodriguez, L., Renzer, G., Alfonso, P., Bonn, M., Meister, K., Garcia-Valles, M., and Verdaguer, A.: Influence of granulometry on the ice-nucleating efficiency of alkali feldspars, EGU General Assembly 2026, Vienna, Austria, 3–8 May 2026, EGU26-5955, https://doi.org/10.5194/egusphere-egu26-5955, 2026.

EGU26-6441 | ECS | Posters on site | AS3.6

MSA and sulfuric acid as important components of particle composition in the tropical upper troposphere of the Indo-Pacific 

Hannah Klebach, Martin Heinritzi, Lisa Beck, Katharina Kaiser, Philipp Joppe, Johannes Schneider, Peter Lloyd, Mira Pöhlker, Sarah Richter, Manuel Granzin, Timo Keber, Marcel Zauner-Wieczorek, Douglas Russell, Nirvan Bhattacharyya, Lucía Caudillo-Plath, and Joachim Curtius

Aircraft campaigns have shown high concentrations of ultrafine particles related to tropical convective outflow (Andreae et al. 2018; Williamson et al., 2019; Curtius et al., 2024). In the marine environment, dimethylsulfide (DMS) is a likely precursor for aerosols. It is a major sulfur source to the atmosphere and can be oxidised to sulfuric acid (SA) and methanesulfonic acid (MSA), which play important roles in the formation and growth of aerosol particles in the boundary layer (Kirkby et al., 2011; Hodshire et al., 2019; Shen et al., 2022). However, direct observations of the particle compositions at high altitudes and their connection to convection are sparse.

The CAFE-Pacific (Chemistry of the Atmosphere Field Experiment - Pacific) campaign provided valuable insights into the chemical composition of the tropical troposphere over Australia and the Indo-Pacific region around North-Eastern Australia. Seventeen research flights from Cairns were conducted with the HALO (High Altitude and LOng range) aircraft, ranging from the boundary layer up to 14 km altitude. With our nitrate CI-APi-TOF specially adapted for aircraft operation, we measured MSA and SA, among other species. Due to adiabatic heating in our inlet and subsequent evaporation of particles our instrument responds also to the particle phase composition in addition to the gas phase concentration. This evaporation effect is largest at high altitudes, where a large fraction of the total signal can be attributed to particle phase mass. It enables us to derive the composition of particles smaller than the aerosol size cut-off diameter of the AMS, which was also part of the HALO payload.

We find high concentrations of MSA throughout the entire measurement region. While SA is more variable, MSA is usually the dominant acid and mainly responsible for the particle mass, often exceeding SA by more than a factor of 10. Using our measurements in combination with HYSPLIT back trajectories and satellite data, we were able to trace back most of our data points to deep convective events in the past five days and thereby identify transport and oxidation of DMS as a source for ultrafine particles in the upper troposphere. The highest values of both acids are detected 15–20 hours after contact with a convective system, aligning well with the DMS lifetime.

Due to the large spatial extent and high frequency of convection around the marine ITCZ, this process represents most likely a substantial production mechanism of high-altitude aerosols which is not yet properly represented in most current models.

Andreae, M. O. et al. (2018), Atmospheric Chemistry and Physics 18, 921–961.

Curtius, J. et al. (2024), Nature, 636, 124–130.

Hodshire, A.L. et al. (2019), Atmospheric Chemistry and Physics 19, 3137-3160.

Kirkby, J. et al. (2011), Nature 218, 429-433.

Shen et al. (2022), Environ. Sci. Technol. 56, 13931–13944.

Williamson, C. J. et al. (2019), Nature 574, 399-403.

How to cite: Klebach, H., Heinritzi, M., Beck, L., Kaiser, K., Joppe, P., Schneider, J., Lloyd, P., Pöhlker, M., Richter, S., Granzin, M., Keber, T., Zauner-Wieczorek, M., Russell, D., Bhattacharyya, N., Caudillo-Plath, L., and Curtius, J.: MSA and sulfuric acid as important components of particle composition in the tropical upper troposphere of the Indo-Pacific, EGU General Assembly 2026, Vienna, Austria, 3–8 May 2026, EGU26-6441, https://doi.org/10.5194/egusphere-egu26-6441, 2026.

EGU26-9745 | Orals | AS3.6

Protein Adsorption on Clay Minerals: Implications for Ice Nucleation 

Thomas Krautwig and Claudia Marcolli

Ice-nucleating particles (INPs) play a critical role in cloud microphysics by initiating ice formation in mixed-phase clouds. Ice nucleation (IN) on mineral dust, which is the most abundant atmospheric INP type, is controlled by rare surface sites that may not represent the average mineral surface. Soil dusts containing biogenic material have shown to contribute to IN at even higher temperatures than pure mineral dusts. The question therefore arises how interactions between minerals and organic macromolecules, such as proteins, modify the IN ability of either. To date, the potential of proteins to directly adsorb onto mineral surfaces and contribute to IN remain largely unknown.

Using an experimental bottom-up approach, we investigate protein adsorption on a clay mineral and its implications for immersion freezing with the Super DRoplet Ice Nuclei Counter Zurich (S-DRINCZ) offering the option of parallel cooling several well plates. The clay mineral kaolinite (0.1–0.01 wt%), which exhibits a median freezing temperature T(50) of −7.5 °C at a concentration of 0.1 wt% was mixed with the protein ferritin (0.1–0.0025 wt%), which shows a slightly higher T(50) of −6.9 °C at the same concentration in its pure form, and the mixtures were analyzed with respect to their IN ability. Complementary UV/VIS spectroscopy is employed to determine the adsorption capacity onto kaolinite, while transmission electron microscopy (TEM) combined with EDX spectroscopy is used to localize ferritin on mineral surfaces to identify preferential adsorption sites via the iron- rich core of the protein. These results provide new insights into how mineral–protein interactions modify IN in atmospheric dust particles.

How to cite: Krautwig, T. and Marcolli, C.: Protein Adsorption on Clay Minerals: Implications for Ice Nucleation, EGU General Assembly 2026, Vienna, Austria, 3–8 May 2026, EGU26-9745, https://doi.org/10.5194/egusphere-egu26-9745, 2026.

EGU26-10330 | ECS | Posters on site | AS3.6

Ice-Nucleating Activation Capacity of Natural-Origin Aerosols in Sierra Nevada National Park (Spain) 

Olga Ruiz-Galera, Elena Bazo, Juan Andrés Casquero-Vera, Inés Zabala, Paloma Cariñanos, Francisco José Olmo, Lucas Alados-Arboledas, Gloria Titos, and Alberto Cazorla

Aerosol particles capable of acting as ice-nucleating particles (INPs) play a key role in Earth’s radiative forcing by controlling ice crystal formation and, consequently, the microphysical and optical properties of clouds. At high-mountain sites characterized by near-pristine conditions, natural aerosols become particularly important and may dominate key atmospheric processes. Among these, pollen particles have been shown to exert a non-negligible regional impact on ice nucleation (Prenni et al., 2009), together with re-suspended local soil dust, which often exhibits higher activity than transported mineral dust (O’Sullivan et al., 2014). Wind-blown snow particles represent an additional natural aerosol in high-mountain environments during the snow season, increasingly affected by the production of artificial snow (Baloh et al., 2019). The present study focuses on the characterization of regional natural INPs in the Sierra Nevada environment.

Dominant pollen types in the region are Olea, Pinus, Cupressaceae and Quercus (Cariñanos et al., 2025). Pollen samples collected directly from the vegetation, together with soil samples collected at different elevations in the Sierra Nevada slope - to account for the influence of wind-driven aerosol transport - and snow samples were analysed for their INP ability. Ice-nucleating activity was analysed using GRAINS (Bazo et al., 2025), an immersion droplet freezing array with 100 µL droplets. To assess the contribution of heat-labile components to ice nucleation, all samples were subjected to heat treatment at 95 °C for 30 minutes and subsequently reanalyzed.

Figure 1 shows the INP spectra of Pinus pollen suspension prepared at a concentration of 1 mg mL⁻¹. The suspension was obtained by dispersing 20 mg of sieved (2 mm) pollen in 20 mL of ultrapure water, followed by agitation, filtration with a 0.45 µm syringe filter, and a resting period of 1 h at 4 °C. The sample was then divided into two laboratory tubes, one analysed directly and the other analysed after heat treatment. The Pinus suspension activates at approximately −12 °C, a temperature influenced by the intrinsic ice-nucleating activity of the sample and experimental factors (droplet volume and suspension concentration). A reduction in activity is observed from −17.5 °C onward after heat treatment, likely associated with the removal of heat-labile compounds. This behavior is consistent with previous studies (Duan et al., 2023), although comparison across the literature remains challenging due to differences in methodology.

Figure 1: INP spectra (normalized by droplet volume) of Pinus.

In this study we will jointly present the overall impact of natural-origin particles in high-mountain sites, that highlight the ice-nucleating relevance of local natural aerosols and provide insight into the role of heat-sensitive components in their activity. This is particularly relevant for disentangling the respective influences of natural and anthropogenic aerosols on aerosol–cloud interaction (ACI) processes.

This work was supported by MIXDUST project (PID2024.160280NB.I00) and NUCLEUS project (PID2021-128757OB-I00) funded by MCIU/ AEI/10.13039/501100011033 and "ERDF/EU".

Prenni et al. (2009), Nat. Geosci., 2

O’Sullivan et al. (2014), Atmos. Chem. Phys., 14

Cariñanos et al. (2025), Atmos. Environ., 340

Bazo et al. (2025), EGUsphere

Duan et al. (2023), Atmos. Res., 285

How to cite: Ruiz-Galera, O., Bazo, E., Casquero-Vera, J. A., Zabala, I., Cariñanos, P., Olmo, F. J., Alados-Arboledas, L., Titos, G., and Cazorla, A.: Ice-Nucleating Activation Capacity of Natural-Origin Aerosols in Sierra Nevada National Park (Spain), EGU General Assembly 2026, Vienna, Austria, 3–8 May 2026, EGU26-10330, https://doi.org/10.5194/egusphere-egu26-10330, 2026.

EGU26-10431 | ECS | Orals | AS3.6

Estimating cloud condensation nuclei from aerosol optical properties across diverse environments: observations, models, and prediction approaches 

Inés Zabala, Juan Andrés Casquero-Vera, Elisabeth Andrews, and Gloria Titos

Aerosol-cloud interactions (ACI) remain among the largest sources of uncertainty in assessing anthropogenic impacts on climate (IPCC, 2023), largely due to limited understanding of aerosol sources and their evolution into cloud condensation nuclei (CCN). Reducing this uncertainty requires improved characterization of CCN concentrations and their spatiotemporal variability.

Although CCN measurements are increasingly available at ground-based station, long-term and spatially extensive datasets remain scarce. Harmonized CCN datasets such as those by Schmale et al. (2017) and Andrews et al. (2025) provide quality-assured observations across multiple stations and environments.

To extend CCN information beyond direct measurements, several approaches have been proposed to predict CCN concentrations from more routinely measured aerosol properties, such as aerosol optical properties (AOPs). Using the harmonized Andrews et al. (2025) dataset, Zabala et al. (2025) developed two AOP-based approaches: (i) an empirical parameterization and (ii) a Random Forest (RF) method, based on observations from nine stations (blue in Figure 1). Both methods demonstrate significant potential to extend CCN estimates across space and time.

Harmonized CCN observations have also enabled model evaluation studies. Fanourgakis et al. (2019) evaluated 14 general circulation models against CCN observations from nine stations (orange in Figure 1) over 2011–2015, showing systematic underestimation and substantial variability across environments.

Figure 1. Map of the sites considered in this work.

Motivated by the skill of AOP-based CCN prediction methods, this study applies the two approaches proposed by Zabala et al. (2025) to additional stations with available measurements. The predicted CCN values are evaluated against independent harmonized CCN observations from Schmale et al. (2017) and compared with multimodel CCN estimates reported by Fanourgakis et al. (2019), enabling a consistent assessment across diverse environments.

As an example, Figure 2 shows monthly median CCN concentrations (NCCN) at 0.5% supersaturation (SS) for the SMEAR (SMR, 61°51'N, 24°17'E, 181 m) station in Finland, including observations, AOP-based predictions and CAM5-MAM3 model simulations. The empirical parameterization and the model generally underestimate NCCN (median relative biases of -30% and -14%), whereas the RF approach overestimates observations (MRB=75%). Both prediction approaches capture the seasonal cycle, with larger amplitude in the RF estimates. This behavior is consistent across all tested SS.

Figure 2. Monthly median NCCN (SS=0.5%) at the SMR station from observations, AOP-based predictions, and the CAM5–MAM3 model; shaded area shows the interquartile model range.

Overall, this work demonstrates that AOP-based CCN prediction approaches can reliably extend CCN information beyond observational gaps when evaluated across multiple environments and benchmarked against observations and models. These approaches provide a pathway to improve global CCN datasets, support model evaluation, and reduce uncertainties in ACI in climate models.

This work was supported by the US Department of Energy (DE-SC0022886), the University of Granada (UCE-PP2017-02), and the NUCLEUS (PID2021-128757OB-I00) and MIXDUST (PID2024-160280NB-I00) projects funded by MICIU/AEI, EU NextGenerationEU/PRTR, and FEDER. We acknowledge EBAS (NILU) for the observational data.

References

  • Andrews et al. (2025). Sci. Data. 12, 937. Dataset.
  • Fanourgakis et al. (2019). Atmos. Chem. Phys., 19, 8591–8617.
  • IPCC (2023). Cambridge Uni. Press., Cambridge.
  • Schmale et al. (2017). Sci. Data. 4, 937. 170003.
  • Zabala et al. (2025). EGUsphere [preprint].

How to cite: Zabala, I., Casquero-Vera, J. A., Andrews, E., and Titos, G.: Estimating cloud condensation nuclei from aerosol optical properties across diverse environments: observations, models, and prediction approaches, EGU General Assembly 2026, Vienna, Austria, 3–8 May 2026, EGU26-10431, https://doi.org/10.5194/egusphere-egu26-10431, 2026.

EGU26-10720 | ECS | Orals | AS3.6

Turbulence effects on Secondary Ice Production: Insights from Point-Particle Direct Numerical Simulations 

Florian Le Roy De Bonneville, Markus Uhlmann, and Corinna Hoose

Ice formation in clouds has long been studied through field measurements and also in laboratories under controlled conditions in cloud chambers. It has been frequently observed that ice particle concentration exceeds those of ice-nucleating particles by several orders of magnitude. This discrepancy suggests the involvement of Secondary Ice Production (SIP) via different mechanisms which remain only partially understood. Consequently, ice multiplication is only very crudely included in cloud models. Another fundamental characteristic of clouds is their turbulent nature. It is already known that turbulence plays a major role in the droplets growth but it could also be important for SIP-mechanisms as it affects the hydrometeors dynamics. In this work, we focus on SIP-mechanisms that involve collisions between particles. Using Direct Numerical Simulations (DNS) of homogeneous-isotropic turbulence at low Reynolds numbers with Lagrangian point-particle tracking allows us to study the influence of turbulence on the collision rate between particles and to compare it with the gravitational collision rate traditionally used in cloud modelling simulations. Furthermore, a model simulating the emission of secondary ice fragments when a collision is detected has been implemented in the code. This enables the analysis of how ice particle population evolves across different scenarios, helping to identify which parameters play a significant role and under which conditions a significant increase in ice concentration occurs. Preliminary results show that it is indeed possible to reproduce an ice explosion phenomenon and its magnitude and triggering moment depend on the initial concentration of ice particles and the turbulent Reynolds number.

How to cite: Le Roy De Bonneville, F., Uhlmann, M., and Hoose, C.: Turbulence effects on Secondary Ice Production: Insights from Point-Particle Direct Numerical Simulations, EGU General Assembly 2026, Vienna, Austria, 3–8 May 2026, EGU26-10720, https://doi.org/10.5194/egusphere-egu26-10720, 2026.

EGU26-11661 | ECS | Posters on site | AS3.6

Aerosol and Cloud Residual Particle Measurements during HALO-South 2025: Overview and first Results 

Antonia Veronika Hartmann, Katharina Kaiser, Philipp Joppe, Hans-Christian Clemen, Jonas Schaefer, Bruno Wetzel, Stephan Mertes, Johannes Schneider, and Yafang Cheng

Aerosol-cloud-radiation interactions remain one of the largest sources of uncertainty in climate projections. The Southern Ocean is one of the cloudiest regions on Earth and among the most pristine atmospheric environments. It is characterized by persistent low-level stratocumulus clouds that frequently occur in mixed-phase state, owing to exceptionally low concentrations of cloud condensation nuclei and, in particular, ice-nucleating particles. This combination makes the Southern Ocean a unique natural laboratory for investigating the coupling between aerosols, cloud microphysics, and radiation.

Understanding the formation and persistence of mixed-phase clouds in this region critically depends on the availability and chemical nature of aerosol particles acting as cloud condensation nuclei and ice-nucleating particles. Here, we present measurements of aerosol chemical composition in the Southern Ocean obtained during the HALO-South aircraft campaign (https://halo-research.de/sience/previous-missions/halo-south). The HALO-South campaign took place in September and October 2025 with the HALO aircraft operating from Christchurch, New Zealand, and comprised 19 research flights over the Southern Ocean and 8 transfer flights from and to Germany (spanning the globe).

Combined with observations of cloud and radiation properties, we aim to identify particle sources and investigate how aerosol chemistry influences cloud microphysics.

During the campaign we operated a compact time-of-flight aerosol mass spectrometer (C-ToF-AMS, Schulz et al., 2018) to measure the composition of the non-refractory aerosol particles (organics, nitrate and sulphate) in a size range of 40-800 nm. The C-ToF-AMS was operated behind the HALO aerosol sampling inlet HASI and the cloud residual inlet HALO-CVI (Counterflow Virtual Impactor). The measurement altitudes ranged between 150 m to 12.4 km, thus including liquid, mixed-phase and ice cloud conditions.

First results indicate that residues from ice clouds contain more organic compounds, while liquid cloud residuals contain mainly sulphate and nitrate. The aerosol mass concentrations in the troposphere over the Southern Ocean were generally low, however we observed occasionally aerosol layers from biomass burning over Australia, from volcanic plumes, and from long-range transport.


Schulz, C., et al.: Aircraft-based observations of isoprene-epoxydiol-derived secondary organic aerosol (IEPOX-SOA) in the tropical upper troposphere over the Amazon region, Atmos. Chem. Phys., 18, 14979-15001, 2018.

How to cite: Hartmann, A. V., Kaiser, K., Joppe, P., Clemen, H.-C., Schaefer, J., Wetzel, B., Mertes, S., Schneider, J., and Cheng, Y.: Aerosol and Cloud Residual Particle Measurements during HALO-South 2025: Overview and first Results, EGU General Assembly 2026, Vienna, Austria, 3–8 May 2026, EGU26-11661, https://doi.org/10.5194/egusphere-egu26-11661, 2026.

EGU26-11960 | ECS | Orals | AS3.6

Sources and variability of ice-nucleating particles in the Southern Ocean region measured with PINEair on board the HALO aircraft 

Pia Bogert, Larissa Lacher, Hannah Klebach, Jens Nadolny, Sarah Richter, Douglas Russell, Joachim Curtius, and Ottmar Möhler

Ice Nucleating Particles (INPs) are a minor, strongly temperature-dependent subset of atmospheric aerosol particles that initiate primary ice formation (e.g., Forster et al., 2021). In cirrus and mixed-phase clouds (MPCs), they have an influence on the Earth’s radiative budget, and in MPCs, ice crystals often initiate the formation of precipitation. Over the past decades, various measurements were performed at boundary layer field sites to measure the INP concentration at mixed-phase cloud conditions (e.g., data compiled in Kanji et al., 2017). However, there is a lack of INP measurements in the free troposphere, as they can only be conducted by aircraft-based measurements or at high altitude mountain stations. In order to better understand and predict the formation of MPC and cirrus clouds, as well as their role in the climate system, direct INP measurements at different altitudes are required.

The HALO-South campaign, which investigated the interplay of clouds, aerosols and radiation above the Southern Ocean, took place in New Zealand in September/October 2025. For the first time, our newly developed INP instrument, PINEair (Portable Ice Nucleation Experiment airborne; Bogert, 2024), was on board the HALO aircraft. The instrument is a further development of the expansion-type cloud chamber design of PINE (Möhler et al., 2021). PINEair can measure INPs in an automated way at both mixed-phase cloud and cirrus cloud temperatures down to -60 °C with a time resolution of about 2min.

In this contribution, we present first results of the INP concentration measured at different temperatures during various flights, ranging from very clean air masses originating from Antarctica to more polluted ones from Australia. The PINEair measurements were successfully performed over a wide altitude range, covering the boundary layer up to the free troposphere.


References

Bogert, P. Ice-nucleating particles in the free troposphere: long-term observation and first measurements at cirrus formation temperatures using the novel Portable Ice Nucleation Experiment PINEair, Ph.D. thesis, Karlsruhe Institute of Technology, https://doi.org/10.5445/IR/1000174265, 2024.

Kanji, Z., et al. Ice formation and evaluation in clouds and precipitation: Measurement and modeling challenges, Meteorological Monographs, 58, 2017.

Möhler, O., et al. The Portable Ice Nucleation Experiment (PINE): a new online instrument for laboratory studies and automated long-term field observations of ice-nucleating particles, Atmospheric Measurement Techniques, 14, 1143–1166, 2021.

Forster, P., T. Storelvmo, K. Armour, et al. The Earth’s Energy Budget, Climate Feedbacks, and Climate Sensitivity, In Climate Change 2021: The Physical Science Basis. Contribution of Working Group I to the Sixth Assessment Report of the Intergovernmental Panel on Climate Change, Cambridge University Press, Cambridge, United Kingdom and New York, NY, USA, pp. 923–1054, doi:10.1017/9781009157896.009, 2021.

How to cite: Bogert, P., Lacher, L., Klebach, H., Nadolny, J., Richter, S., Russell, D., Curtius, J., and Möhler, O.: Sources and variability of ice-nucleating particles in the Southern Ocean region measured with PINEair on board the HALO aircraft, EGU General Assembly 2026, Vienna, Austria, 3–8 May 2026, EGU26-11960, https://doi.org/10.5194/egusphere-egu26-11960, 2026.

EGU26-12119 | ECS | Orals | AS3.6

Modelling a Global Distribution of Ice Nucleating Particles using Machine Learning 

Gabriella Wallentin and the Modelling INPs Team

Cloud ice forms primarily through immersion freezing in the mixed-phase regime between 0°C and -38°C. Immersion freezing is the nucleation of a liquid cloud droplet with an immersed ice nucleating particle (INP), which reduces the energy barrier for cloud ice formation. INPs are rare aerosols, and due to measurement challenges and limitations in instrument capabilities, the availability of atmospheric observations of INPs remains scarce. Thus, obtaining a global distribution of INPs using observations has so far been challenging.

Here, we will show that, through the use of the gradient boosting machine learning algorithm XGBoost, we can predict a realistic global distribution of INPs based on temperature and Copernicus Atmosphere Monitoring Service (CAMS) reanalysis aerosols. The aerosols included are three modes of dust and sea salt, sulfate, and anthropogenic black and organic carbon, both hydrophilic and hydrophobic components. We further add a land mask, a binary identifier to contrast the oceans from land. Aerosols are collocated with about 40 observed INP datasets, sparsely distributed across the globe. Approximately 85% of the data are land-based locations.

The XGBoost model performs well. Predicted regional INP spectra with temperature using CAMS four-year climatology show a good agreement with the observations, with values within one order of magnitude for most regions. Antarctica is an outlier, and a large model bias is obtained. Spatially, the XGBoost predicts a realistic pattern with peaks over deserts and lower values across the oceans. Model sensitivity to hyperparameters reveals large variations in predicted INPs over the Arabian Peninsula and North Africa, followed by Antarctica. The presented approach can act as a cost-effective immersion freezing parameterisation in global and regional weather and climate models. To this end, some preliminary results using the ICOsahedral Non-hydrostatic (ICON) model with this new parameterisation will be shown.

How to cite: Wallentin, G. and the Modelling INPs Team: Modelling a Global Distribution of Ice Nucleating Particles using Machine Learning, EGU General Assembly 2026, Vienna, Austria, 3–8 May 2026, EGU26-12119, https://doi.org/10.5194/egusphere-egu26-12119, 2026.

EGU26-12512 | ECS | Orals | AS3.6

Secondary ice production in summer deep convective clouds over New Mexico during the DCMEX campaign 

Bowen Portman, Paul Connolly, Alan Blyth, and Huihui Wu
Aircraft observations frequently report ice particle concentrations in deep convective clouds that cannot be explained by primary ice nucleation alone. This discrepancy is commonly attributed to secondary ice production (SIP), yet the dominant mechanisms remain poorly constrained. This study examines deep convective clouds observed during the July–August 2022 DCMEX field campaign using in situ aircraft measurements. We use the University of Manchester bin microphysics parcel model to simulate the development of SIP within these convective systems, and analyse parameterised SIP production rates derived from in situ ice particle measurements. Four SIP mechanisms are systematically analysed: rime splintering, ice–ice collisional breakup, spherical freezing fragmentation of drops (mode 1), and fragmentation during collisions between supercooled droplets and more massive ice particles (mode 2).
 
Our results suggest that the two modes of freezing fragmentation of drops are key to explaining the high ice particle concentrations observed in summer deep convective systems over New Mexico. In contrast, rime splintering appears to be largely inactive across all simulations. We also find that external aerosol entrainment accelerates collision–coalescence under homogeneous mixing, leading to earlier ice enhancement, while having little impact under inhomogeneous mixing. Droplet-dependent SIP mechanisms such as mode 2 show strong sensitivity to entrainment assumptions, underscoring the need for accurate entrainment representation when including SIP processes in large-scale models.

How to cite: Portman, B., Connolly, P., Blyth, A., and Wu, H.: Secondary ice production in summer deep convective clouds over New Mexico during the DCMEX campaign, EGU General Assembly 2026, Vienna, Austria, 3–8 May 2026, EGU26-12512, https://doi.org/10.5194/egusphere-egu26-12512, 2026.

EGU26-12977 | Orals | AS3.6

New insights on Secondary Ice Production during Riming 

Susan Hartmann, Mareike Reiser, Peter Lloyd, Johanna Seidel, Alexei Kiselev, Dennis Niedermeier, Thomas Leisner, and Mira Pöhlker

The radiative budget, atmospheric charging and the ability of mixed-phase clouds to form precipitation strongly depends on the presence of ice crystals. Observations indicate that secondary ice formation processes play an important role in increasing ice crystal number concentration in mixed-phase clouds. We focus on secondary ice formation during riming, which is also knows as rime-splintering (RS) or Hallett-Mossop process. Most knowledge about RS is based on old laboratory experiments with quantitatively inconsistent results and lacks a fundamental mechanistic understanding.

To overcome this knowledge gap, we developed an experimental set-up IDEFIX (Ice Droplets splintering on FreezIng eXperiment) to study RS using high-speed video microscopy, thermography system and custom-built ice counter to detect secondary ice particles. In contrast to earlier studies - no efficient secondary ice formation was observed under near-atmospheric conditions. This fundamentally questions the RS process and motivates further laboratory investigations in a broader parameter range to elucidate under which conditions RS is existing. Recent insights on the dependence of RS efficiency on ice surface roughness and the role of small riming droplets will be presented.

Our study will contribute to the development of new parameterizations of secondary ice formation for cloud microphysics-resolving models.

How to cite: Hartmann, S., Reiser, M., Lloyd, P., Seidel, J., Kiselev, A., Niedermeier, D., Leisner, T., and Pöhlker, M.: New insights on Secondary Ice Production during Riming, EGU General Assembly 2026, Vienna, Austria, 3–8 May 2026, EGU26-12977, https://doi.org/10.5194/egusphere-egu26-12977, 2026.

EGU26-15523 | ECS | Posters on site | AS3.6

Peeking Beneath Clouds: An Investigation of Aerosol-Cloud Interactions over the Southeast Atlantic 

Emily Lenhardt, Jens Redemann, Lan Gao, Siddhant Gupta, Greg McFarquhar, Feng Xu, Brian Cairns, Richard Ferrare, and Chris Hostetler

The contribution to effective radiative forcing (ERF) of climate due to interactions between clouds and atmospheric aerosols remains highly uncertain after decades of research. One key piece of information needed to reduce this uncertainty and better understand such aerosol-cloud interactions (ACI) is knowledge about the vertical distribution of cloud condensation nuclei (CCN), or the subset of aerosols that activate into cloud droplets and directly impact cloud microphysical properties. Recently, many studies have taken advantage of lidar observations to glean information about the vertical distribution of aerosols and CCN. Specifically, Redemann & Gao (2024) developed a machine learning (ML) technique that uses lidar observables to predict CCN concentration (NCCN) with mean relative errors of about 15% for the most complete sets of lidar observables.

In this study, we take advantage of the high vertical resolution of this ML-derived NCCN dataset to investigate ACI over the Southeast Atlantic (SEA), where a seasonal biomass burning aerosol plume resides atop a semi-permanent deck of marine stratocumulus clouds. We assess the simultaneous impact of above- and below-cloud NCCN on cloud top microphysical properties via clear-sky, cloud-adjacent lidar profiles and collocated polarimetric retrievals of cloud properties. Through this method we observe a decrease in cloud droplet effective radius (Reff) and an increase in cloud droplet number concentration (Nd) associated with an increase in above-cloud NCCN concentration within 100 m of the cloud top, which aligns well with previous in situ-based results. We find that the relationship between below-cloud NCCN and cloud top microphysical properties is weaker than those with above-cloud NCCN. Additionally, we find that the magnitude of these ACI are strongly dependent on lower tropospheric stability (LTS), with ACIREFF = -∂ln(Reff)/∂ln(NCCN) and ACICDNC = dln(Nd)/dln(NCCN) both decreasing by approximately 74% as LTS increases from 10 to 22 K. These findings demonstrate the importance of vertically resolved NCCN in ACI studies and establish a remote sensing-based analysis method which future satellite-based studies can employ to investigate ACI.

How to cite: Lenhardt, E., Redemann, J., Gao, L., Gupta, S., McFarquhar, G., Xu, F., Cairns, B., Ferrare, R., and Hostetler, C.: Peeking Beneath Clouds: An Investigation of Aerosol-Cloud Interactions over the Southeast Atlantic, EGU General Assembly 2026, Vienna, Austria, 3–8 May 2026, EGU26-15523, https://doi.org/10.5194/egusphere-egu26-15523, 2026.

EGU26-16134 | Orals | AS3.6

Modelling the impacts of secondary ice production in Arctic mixed-phase clouds 

Tomi Raatikainen, Silvia Calderón, Emma Järvinen, and Sami Romakkaniemi

Several observational studies show that ice crystal number concentrations in relatively warm (temperatures above -10 °C) Arctic mixed-phase clouds can exceed 1 L-1 while concentrations of ice-nucleating particles (INPs), which produce primary ice by initiating cloud droplet freezing, are several orders of magnitude lower. The difference is often explained by secondary ice production (SIP). The three most common SIP mechanics are Hallet-Mossop process also called as rime splintering (RS), ice-ice collisional breakup (IIBR), and droplet shattering during freezing (DS). Our large-eddy simulation (LES) model called UCLALES-SALSA accounts for these processes in addition to aerosol-cloud interactions and different primary freezing processes. In our recent study (Raatikainen et al., EGUsphere [preprint], https://doi.org/10.5194/egusphere-2025-4470, 2025) we used observations from the ACLOUD (Arctic CLoud Observations Using airborne measurements during polar Day) campaign to derive setups for LES simulations which aim at reproducing the observed ice crystal number concentrations exceeding 1 L-1 at about -5 °C cloud top temperatures. At this temperature, INP concentrations are about three orders of magnitude lower than the observed ice concentration, so secondary ice production is likely occurring. The first simulations showed that rime splintering is the most effective SIP process while IIBR and DS have negligible impact. However, RS cannot produce enough secondary ice to match the observations. The observed ice concentrations can be reached by artificially increasing the efficiency of RS SIP. When ice concentration becomes high enough, SIP starts to maintain itself so that primary cloud droplet freezing is not needed at all. Additional sensitivity tests showed that the same result can be obtained by using different model parameterizations (e.g., mass-dimension-fall velocity or the temperature-dependent efficiency of the RS parameterization) or slightly cooler cloud temperatures. Overall, these results show that rime splintering can explain the observed high ice concentrations in such relatively warm and shallow mixed-phase clouds, but the process is also sensitive to model parameterizations and cloud temperatures.

How to cite: Raatikainen, T., Calderón, S., Järvinen, E., and Romakkaniemi, S.: Modelling the impacts of secondary ice production in Arctic mixed-phase clouds, EGU General Assembly 2026, Vienna, Austria, 3–8 May 2026, EGU26-16134, https://doi.org/10.5194/egusphere-egu26-16134, 2026.

EGU26-16802 * | Orals | AS3.6 | Highlight

The interplay of Clouds, Aerosols, and Radiation above the Southern Ocean 

Mira L. Pöhlker, Adrian McDonald, Yafang Chang, Guy Coulson, Joachim Curtius, André Ehrlich, Hamish Gordon, Silvia Henning, Heike Kalesse-Los, Ottmar Möhler, Stephan Mertes, Christopher Pöhlker, Ulrich Pöschl, Daniel Sauer, Johannes Schneider, Patric Seifert, Frank Stratmann, Christiane Voigt, Manfred Wendisch, and Helmut Ziereis

The Southern Ocean (SO) is one of the cloudiest regions on Earth. However, cloud radiative effects are not well represented over the SO in atmospheric models, which is mainly due to an underestimation of aerosols. To address this and other fundamental and pressing open questions on the interaction of atmospheric radiation, aerosol nucleation and growth, cloud formation and impacts over the SOI, the HALO-South aircraft mission was conducted in September and October 2025 based in Christchurch, Aotearoa New Zealand. HALO stands for High Altitude and Long Range Research Aircraft. HALO-South covered the full cycle of processes from aerosol formation, cloud evolution, and radiative interaction with a special focus on the characteristics and effects of mixed-phase clouds. The instrumental payload of HALO included a unique and comprehensive in-situ and remote sensing suite of instruments. It was designed to collect data to improve our understanding of fundamental atmospheric processes and to extrapolate and upscale the results using satellite data and global climate models in order to resolve long-standing measurement-modelling discrepancies. In addition, the ground-based stations in Tāwhaki and Invercargill with remote sensing and in-situ long term measurements will extend the data to a larger scale in time. The first analysis of the campaign shows promising insights into cloud and aerosol processes over the SO, which will be presented and discussed.

Acknowledgments: This work was supported by the DFG (Deutsche Forschungsgemeinschaft, German Research Foundation) Priority Program SPP 1294, the Max Planck Society, Priority Program SPP 1294, the German Aerospace Center (DLR)

How to cite: Pöhlker, M. L., McDonald, A., Chang, Y., Coulson, G., Curtius, J., Ehrlich, A., Gordon, H., Henning, S., Kalesse-Los, H., Möhler, O., Mertes, S., Pöhlker, C., Pöschl, U., Sauer, D., Schneider, J., Seifert, P., Stratmann, F., Voigt, C., Wendisch, M., and Ziereis, H.: The interplay of Clouds, Aerosols, and Radiation above the Southern Ocean, EGU General Assembly 2026, Vienna, Austria, 3–8 May 2026, EGU26-16802, https://doi.org/10.5194/egusphere-egu26-16802, 2026.

EGU26-17256 | ECS | Orals | AS3.6

Interacting effects of aerosols and ice formation processes on mixed-phase cold-air outbreak clouds  

Xinyi Huang, Paul Field, Ross Herbert, Benjamin Murray, Daniel Grosvenor, Floortje Van Den Heuvel, and Kenneth Carslaw

Mixed-phase clouds associated with cold-air outbreak (CAO) events are natural laboratories to study mixed-phase cloud processes which are important for our estimation of cloud-phase feedback. These CAO clouds have also been shown vital to the radiative bias over the Southern Ocean. Recent studies show that CAO clouds are sensitive to aerosols including cloud condensation nuclei (CCN) and ice-nucleating particles (INPs), as well as secondary ice production (SIP). Therefore, it is vital to understand how these processes affect the radiative properties of CAO clouds and their roles in the cloud-phase feedback mechanism. However, many modelling studies have investigated the effects of these processes by perturbing model parameters individually, limiting the investigation of joint effects from multiple processes on cloud properties.  

Here we investigated how six cloud microphysics parameters jointly affect CAO cloud properties by building model emulators trained on output from perturbed parameter ensembles (PPEs) of a high-resolution regional model. The selected CAO case was on 24 October 2022 over the Labrador Sea, which coincided with the M-Phase aircraft campaign. The parameters are cloud droplet number concentration (Nd), ice-nucleating particle concentration (NINP), efficiencies of three SIP processes including the rime-splintering, ice-ice collisional breakup and droplet shattering, as well as the mixed-phase overlap factor (mpof) which controls the spatial overlap between liquid and ice clouds within model grid cells. The perturbed ranges of these parameters either match the observed ranges when available or were chosen based on uncertainty ranges suggested by previous studies.  

For the CAO case studied, Nd and NINP most strongly control the cloud radiative properties in the stratocumulus region; whereas in the cumulus region, Nd and mpof are the most important parameters. Variations of SIP efficiencies have stronger effects in the cumulus region compared to their effects in the stratocumulus region, but their effects on radiative properties are generally weaker compared to the other three parameters (NdNINP and mpof).  

Our results show that these parameters have non-linear joint effects such that the magnitude and even sign of cloud responses to a parameter are highly dependent on the values of other parameters. For example, the sensitivity of cloud albedo to increases in NINP varies between near zero and strongly negative across the sampled parameter space. Therefore, perturbing parameters individually is an inadequate method for determining the cloud responses to model parameters and can potentially lead to misleading conclusions.  

This work illustrates the power of using PPEs and model emulation for systematically quantifying the sensitivities of CAO cloud properties to important cloud microphysics parameters and identifying the interactions among model parameters. Exploration of the entire parameter space is compulsory to fully understand the influences on CAO clouds from these parameters, and to constrain the uncertainties from mixed-phase cloud processes on cloud-phase feedback mechanism. 

How to cite: Huang, X., Field, P., Herbert, R., Murray, B., Grosvenor, D., Van Den Heuvel, F., and Carslaw, K.: Interacting effects of aerosols and ice formation processes on mixed-phase cold-air outbreak clouds , EGU General Assembly 2026, Vienna, Austria, 3–8 May 2026, EGU26-17256, https://doi.org/10.5194/egusphere-egu26-17256, 2026.

EGU26-17587 | Orals | AS3.6

The Role of Secondary Ice Production in Shaping Mixed-Phase Clouds in EC-Earth4 

Montserrat Costa-Surós, Marios Chatziparaschos, María Gonçalves Ageitos, Simone Vacondio, Tommi Bergman, Paraskevi Georgakaki, Eemeli Holopainen, Vincent Huijnen, Harri Kokkola, Anton Laakso, Philippe Le Sager, Athanasios Nenes, Twan van Noije, Lianghai Wu, and Carlos Pérez García-Pando

Secondary ice production (SIP) is increasingly recognized as a key regulator of ice crystal number concentrations and cloud phase in mixed-phase clouds (MPCs). In the EC-Earth3-AerChem model, we recently showed that SIP, implemented via a machine-learning-based parameterization, may strongly amplify ice crystal numbers in MPCs, particularly in regions with weak primary ice nucleation such as the Southern Ocean, and can substantially modify cloud phase partitioning and radiative effects. However, those findings were obtained within a model configuration with known limitations in cloud microphysics and supersaturation treatment, motivating their re-examination in the next generation of EC-Earth.

Here we present the implementation of SIP in EC-Earth4, using its new atmospheric core OIFS48r1, which features major updates to mixed-phase cloud microphysics. Building on the EC-Earth3 framework, we implemented in OIFS48r1 aerosol-aware immersion freezing with a machine-learning-based SIP parameterization (RaFSIP), allowing ice multiplication to respond dynamically to cloud thermodynamic and microphysical conditions. This configuration provides, for the first time in EC-Earth4, a physically consistent link between aerosol-controlled primary ice formation and secondary ice amplification.

The model is evaluated against satellite-derived cloud properties from MODIS and CALIPSO, and radiative fluxes from CERES-EBAF. The experimental design enables us to quantify how SIP modifies ice crystal number concentrations and liquid–ice phase partitioning relative to both temperature-based and aerosol-aware primary ice nucleation. Before introducing aerosol-driven ice nucleation and SIP, OIFS48r1 already shows substantial baseline improvements relative to EC-Earth3, including reduced biases in liquid and ice water paths across latitudes. These improvements provide a more robust framework for isolating the climatic role of SIP in a next-generation model.

By extending the SIP analysis from EC-Earth3 to EC-Earth4, this work establishes a consistent modelling framework to assess how secondary ice production interacts with aerosol-controlled primary ice formation, paving the way for more reliable projections of mixed-phase cloud feedbacks in future climate simulations.

How to cite: Costa-Surós, M., Chatziparaschos, M., Gonçalves Ageitos, M., Vacondio, S., Bergman, T., Georgakaki, P., Holopainen, E., Huijnen, V., Kokkola, H., Laakso, A., Le Sager, P., Nenes, A., van Noije, T., Wu, L., and Pérez García-Pando, C.: The Role of Secondary Ice Production in Shaping Mixed-Phase Clouds in EC-Earth4, EGU General Assembly 2026, Vienna, Austria, 3–8 May 2026, EGU26-17587, https://doi.org/10.5194/egusphere-egu26-17587, 2026.

EGU26-17610 | ECS | Posters on site | AS3.6

Ice nucleation ability of different desert dusts during PIANO chamber campaigns 

Christos Mitsios, Carolina Molina, Georgios Theodoropoulos, Romanos Foskinis, Jun Zhang, Sofia Gkretsi, Maria I. Gini, Konstantinos Eleftheriadis, Eva Johanna Horchler, Merete Bilde, Thomas Krautwig, Kunfeng Gao, Zamin A. Kanji, Xavier Querol, Carlos Pérez, Spyros N. Pandis, and Athanasios Nenes

Ice nucleating particles (INPs) are a minor subset of atmospheric aerosols that can influence clouds, precipitation and climate by promoting the formation of ice at warm temperatures. Mineral dust is a dominant source of INPs in the atmosphere because of its relatively high ice nucleating efficiency and abundance. Despite its importance, there are considerable uncertainties about the impacts of atmospheric processing (chemical "aging") on the INP activity of dust - especially on the role of species that acidify (like sulfuric acid and nitric acid) upon condensation onto INPs.

Motivated by the above uncertainties, we carry out the CleanCloud PIANO campaigns - which involve laboratory studies of the INP activity of dust generated from soils originating from Iceland, Morocco, and Chile. We study the properties of freshly generated dust, as well as dust that has been exposed to acidic species (HNO3 and H2SO4) using the FORTH/ICEHT environmental chamber facility in Patras, Greece. Dust was generated two ways - using a cyclone generator in the case of fresh dust, or mixed with sea salt using the AEGOR sea spray simulation chamber.

INP activity was measured online with a Portable Ice Nucleation Experiment (PINE) and offline using a cold-plate droplet freezing assay on dust samples collected from the chamber using an impinger. Size-resolved INP was also characterized using an Aerodynamic Aerosol Classifier (AAC) to select dust particles below a defined size cut prior to entering the PINE instrument.

Our results show that aging by acidification can strongly suppress the ice nucleation efficiency of mineral dust. In particular, aging reduced mass-normalized INP concentrations by a median of 86.3% for Icelandic dust, 77.2% for Moroccan dust, and 84.7% for Chilean dust across the investigated temperature range, demonstrating that chemical processing during atmospheric transport can substantially weaken the ability of desert dust particles to act as INPs.


How to cite: Mitsios, C., Molina, C., Theodoropoulos, G., Foskinis, R., Zhang, J., Gkretsi, S., Gini, M. I., Eleftheriadis, K., Horchler, E. J., Bilde, M., Krautwig, T., Gao, K., Kanji, Z. A., Querol, X., Pérez, C., Pandis, S. N., and Nenes, A.: Ice nucleation ability of different desert dusts during PIANO chamber campaigns, EGU General Assembly 2026, Vienna, Austria, 3–8 May 2026, EGU26-17610, https://doi.org/10.5194/egusphere-egu26-17610, 2026.

EGU26-18212 | ECS | Posters on site | AS3.6

Secondary ice production - A cellular automaton approach 

Moritz Hey and Peter Spichtinger

Clouds play a key role in the hydrological cycle and the Earth’s radiation budget. Their macroscopic properties are strongly influenced by the size, number, and phase of suspended particles. Understanding the evolution of these microphysical properties is therefore essential for weather prediction and for quantifying the impact of clouds on the Earth’s climate. In mixed-phase clouds, one process that can strongly modify the ice particle population is secondary ice production (SIP), which encompasses all mechanisms that increase the number of ice particles from pre-existing ice. While numerous SIP pathways have been proposed, no consensus has been reached about their relative importance and quantitative contributions, since observational studies often yield contradictory results.


In this work, a two-dimensional model of SIP is introduced which utilizes a combination of a cellular automaton approach pioneered by Clifford A. Reiter (Reiter, 2004) and a finite elements stress solver as well as concepts from graphs theory. The model represents the temporal evolution of the growth and
sublimation of an ensemble of ice crystals, their shape, and the formation of new crystals through SIP. Secondary ice production in the model is governed by two simplified mechanisms: shear-force induced breakup and fragmentation during sublimation.


A qualitative analysis of the model results shows that this reduced approach, which does not explicitly represent all known SIP pathways, is nevertheless able to reproduce key features of secondary ice production.

References
Reiter, Clifford A. "A local cellular model for snow crystal growth." Chaos, Solitons & Fractals 23.4 (2005): 1111-1119.

How to cite: Hey, M. and Spichtinger, P.: Secondary ice production - A cellular automaton approach, EGU General Assembly 2026, Vienna, Austria, 3–8 May 2026, EGU26-18212, https://doi.org/10.5194/egusphere-egu26-18212, 2026.

EGU26-18230 | ECS | Orals | AS3.6

Methanesulfonic acid revealed as major driver of particle formation over polar regions and the Southern Ocean: a global EMAC study 

Samuel Ruhl, Matthias Kohl, Christos Xenofontos, Rima Baalbaki, Ryan Vella, Holger Tost, Theodoros Christoudias, Rolf Sander, and Andrea Pozzer

Methanesulfonic acid (MSA) has recently been identified as an efficient driver of new particle formation and growth under cold atmospheric conditions, exhibiting ultra low volatility the same way sulfuric acid (SA) does. Both MSA and SA originate from the oxidation of volatile methylated sulfur compounds (VMS), particularly dimethyl sulfide (DMS) and methyl mercaptan (MeSH), with MeSH acting as a significant but previously overlooked source of these compounds, which constitute a major natural source of atmospheric sulfur. In cold regions, oxidation pathways favour MSA over SA production, leading to elevated MSA-to-SA ratios over the polar regions and the Southern Ocean.

In this study, the representation of marine sulfur was revised in the global chemistry–climate model EMAC by updating DMS emissions, explicitly including MeSH, and extending the associated gas-phase, multiphase, and aerosol chemistry of SA and MSA. The model is evaluated against observations from four ship campaigns and nine ground-based stations in oceanic regions, spanning four years and covering diverse latitudes and longitudes. MSA condensation onto particles, its aqueous-phase processing in aerosols and clouds, and its contribution to particle growth are treated explicitly. A volatility-dependent MSA nucleation parameterization is implemented to capture efficient particle formation in cold, MSA-rich environments.

Including MSA-driven particle formation and growth in EMAC leads to an increase of at least 50% in cloud condensation nuclei (CCN) concentrations over the Antarctic and Southern Ocean. This demonstrates that MSA is a major driver of particle formation and growth in these climate-critical regions, which have traditionally been associated with large uncertainties in CCN abundance and associated aerosol–cloud–climate interactions in global climate models.

How to cite: Ruhl, S., Kohl, M., Xenofontos, C., Baalbaki, R., Vella, R., Tost, H., Christoudias, T., Sander, R., and Pozzer, A.: Methanesulfonic acid revealed as major driver of particle formation over polar regions and the Southern Ocean: a global EMAC study, EGU General Assembly 2026, Vienna, Austria, 3–8 May 2026, EGU26-18230, https://doi.org/10.5194/egusphere-egu26-18230, 2026.

EGU26-18672 | Posters on site | AS3.6

Ice nucleating properties of glaciogenic cloud seeding (GCS) material 

Alexei A. Kiselev, Laura Arnold, Alexander Böhmländer, Arnaldo Bartoli, Larissa Lacher, Ottmar Möhler, Josef Mündler, Franz Mossbacher, Erwin Zinser, and Satyanarayana Tani

Hailstorms regularly damage assets, destroy crops, and harm people. A single hailstorm can cause more than USD $1b in damage, and hail is a significant contributor to insured losses in many areas. For decades, glaciogenic cloud seeding (GCS) has been applied in an attempt to reduce hail damage, and yet there are important gaps in our understanding of how hailstorms are affected by release of highly efficient ice-nucleating particles into developing convective cells. While careful cloud-resolving modeling based on in-situ and remote observations before and after the hailstone event is critical for estimating the potential effect of GCS, some microphysics parameters and mechanisms are insufficiently understood or completely missing.

To partly fill these gaps, we have conducted measurements of the ice-nucleating efficiency of GCS particles emitted by the generator built by the hail prevention cooperative "Steirische Hagelabwehr Genossenschaft eGen" based in Graz, Austria [1]. The generator, normally mounted on an aircraft, is designed to deploy steady flux of sub-micrometer AgI-containing particles into the area of the strongest updraft beneath a developing thunderstorm cell. The IN efficiency of fresh and aged GCS particles has been measured with the Portable Ice Nucleation Experiment (PINE) setup [2] and by sampling the GCS particles on Nuclepore® membrane filters for further analysis. The IN material has been washed from the filters and studied with the Ice Nucleation Spectrometer of the KIT (INSEKT) at IMKAAF. Additionally, the morphology and chemical composition of GCS particles have been analyzed with nanometer-scale resolution using scanning electron microscopy (SEM), providing detailed insights into the mechanism of ice nucleation by AgI-containing particles. The preliminary results of this study, as well as their implications for the GCS approach, will be presented in this contribution.

References:

[1] Steirische Hagelabwehrgenossenschaft eGen (https://hagelabwehr.at/)

[2] Möhler, O., et al.: The Portable Ice Nucleation Experiment (PINE): a new online instrument for laboratory studies and automated long-term field observations of ice-nucleating particles, AMT, https://doi.org/10.5194/amt-14-1143-2021, 2021.

How to cite: Kiselev, A. A., Arnold, L., Böhmländer, A., Bartoli, A., Lacher, L., Möhler, O., Mündler, J., Mossbacher, F., Zinser, E., and Tani, S.: Ice nucleating properties of glaciogenic cloud seeding (GCS) material, EGU General Assembly 2026, Vienna, Austria, 3–8 May 2026, EGU26-18672, https://doi.org/10.5194/egusphere-egu26-18672, 2026.

EGU26-19492 | ECS | Posters on site | AS3.6

In situ X-ray diffraction during ice formation on alkali feldspar 

Johanna S. Seidel, Alexei A. Kiselev, Bärbel Krause, Michal Kaminski, David Heuser, Elena Petrishcheva, and Rainer Abart

Alkali feldspar is the most effective ice nucleating particle in airborne mineral dust and can initiate heterogeneous cloud ice formation at high temperatures [1]. It may thus influence precipitation formation and the Earth's radiation budget. The particularly high ice nucleation ability of microcline within the group of alkali feldspars was attributed to its complex perthitic microstructure in the form of Na-rich and K-rich exsolution lamellae [2], which naturally result from phase transformations during the cooling process after the magmatic and metamorphic crystallization, and defects like step edges, cracks, pores or cavities [2,3]. The lamellae and surface features are usually aligned with the non-rational Murchison plane with Miller indices between (-601) and (-801), subparallel to the direction where the elastic energy associated with exsolution is minimized [4]. Those features were hypothesized to expose small facets of particularly highly ice-nucleation active, but non-cleavable surfaces with the crystallographic (100) orientation [3]. This would explain the epitaxial relationship between feldspar (100) and the primary prismatic crystal planes of macroscopic ice crystals, observed in microscopic freezing experiments [3,5,6,7], but an understanding of this epitaxial relationship on the molecular level is still missing.

We study ice formation from the vapor phase on (001) and (010) cleavage plates of gem quality (featureless reference), gem quality with chemically induced fractures along the Murchison plane, and natural perthitic alkali feldspar under atmospheric pressure using a newly developed in situ X-ray diffraction setup and synchrotron radiation. The high-resolution information allows us to quantify the average ice crystal orientation with respect to the crystallographic domains of feldspar and complement previous electron microscope experiments. For the first time, we confirm the epitaxial relationship between ice and feldspar on defect-rich samples under atmospheric-relevant conditions, as observed in our experiments through a narrow orientation distribution in reciprocal space. The highest fraction of oriented ice crystals is found on natural perthite surfaces of (010) orientation, while ice grows rather randomly on the gem quality reference. In addition, we always detect the XRD-signal of oriented ice well before the XRD-signal of the ice fraction growing with random orientation.

[1] Atkinson et al., Nature (2013) 498(7454), 355-358, doi:10.1038/nature12278

[2] Whale et al. Phys. Chem. Chem. Phys. (2017) 19, 31186—31193, doi:10.1039/c7cp04898j

[3] Kiselev et al., Science (2017) 355, 367-371, doi:10.1126/science.aai8034

[4] Petrishcheva et al., Contrib. Mineral. Petrol. (2023) 178, 77, doi:10.1007/s00410-023-02059-z

[5] Pach and Verdaguer, J. Phys. Chem. C (2019) 123, 34, 20998–21004, doi:10.1021/acs.jpcc.9b05845

[6] Kiselev et al., Atmos. Chem. Phys. (2021) 21, 11801-11814, doi:10.5194/acp-21-11801-2021

[7] Keinert et al., Faraday Discussions (2022) 235, 148-161, doi:10.1039/d1fd00115a

How to cite: Seidel, J. S., Kiselev, A. A., Krause, B., Kaminski, M., Heuser, D., Petrishcheva, E., and Abart, R.: In situ X-ray diffraction during ice formation on alkali feldspar, EGU General Assembly 2026, Vienna, Austria, 3–8 May 2026, EGU26-19492, https://doi.org/10.5194/egusphere-egu26-19492, 2026.

EGU26-19575 | ECS | Orals | AS3.6

The role of microfeatures, Al-Si-ordering and surface topography on the ice nucleation activity of alkali feldspars 

David Andreas Heuser, Michael Hagn, Johanna Seidel, Alexei Kiselev, Elena Petrishcheva, and Rainer Abart

Alkali feldspars have been identified as the most efficient ice-nucleating particles in airborne mineral dust [1, 2]. However, alkali feldspars exhibit large mineralogical variations which is also reflected in substantial differences in their ice-nucleating efficiency [2,3,4]. Identifying the mineralogical or surface characteristics responsible for the high ice-nucleation activity of certain alkali feldspars could advance our understanding of ice nucleation in mixed-phase clouds.

For this study, seven natural alkali feldspars, ranging from homogeneous gem-quality sanidines to hydrothermally altered, micropore-rich perthitic microclines were characterized with petrographic microscopy, electron probe micro analysis (EPMA) and powder X-ray diffraction (pXRD). The ice nucleation efficiency was investigated by means of cooling ramp experiments conducted at a cooling rate of 2 K min-1 on a cold stage, using (001) and (010) cleavage plates as well as 1 wt% suspensions of 2–8 µm powder from each sample. For two gem-quality samples and one perthitic microcline, additional experiments were performed using 0.05 wt% suspensions of 2–8 µm powder as well as 0.5–2 µm powder to assess the influence of particle surface area and grain size. In these experiments, 7 nl droplets of the suspension were dispensed on Si-wafers, while for cleavage plate experiments, 7 nl droplets of nanopure water were dispensed onto the samples. Droplet freezing events were detected using an infrared camera.

Hydrothermally altered perthitic microclines exhibit the highest ice nucleation activity in both cleavage plate and suspension experiments. The lowest ice-nucleation activity was observed for gem-quality sanidine in suspension experiments and for (001) cleavage plates of gem-quality orthoclase. For microcline, and more prominently for orthoclase (both perthitic and gem-quality), (010) cleavage plates showed higher freezing temperatures than (001) plates. The freezing sequence of droplets on cleavage plates was more strongly influenced by surface topography in gem-quality samples than in perthites, indicating that freezing in perthites is predominantly controlled by mineralogical features.

The ice-nucleation activity of gem-quality samples was more sensitive to particle surface area than that of perthitic samples, showing a stronger decrease in freezing temperatures at lower suspension concentrations and a more pronounced increase with decreasing particle size.

We conclude that features related to perthitic exsolution, a high degree of Al-Si-ordering and - for orthoclase and microcline - the crystallography of (010) surfaces are key factors for the high ice-nucleating activity of alkali feldspars.


[1] Atkinson et al., Nature (2013) 498(7454), 355-358, doi:10.1038/nature12278

[2] Whale et al. Phys. Chem. Chem. Phys. (2017) 19, 31186—31193, doi:10.1039/c7cp04898j

[3] Harrison et al., Atmos. Chem. Phys. (2016), 16, 10927–10940, doi:10.5194/acp-16-10927-2016

[4] Welti et al., Atmos. Chem. Phys. (2019), 19, 10901–10918, doi:10.5194/acp-19-10901-2019

How to cite: Heuser, D. A., Hagn, M., Seidel, J., Kiselev, A., Petrishcheva, E., and Abart, R.: The role of microfeatures, Al-Si-ordering and surface topography on the ice nucleation activity of alkali feldspars, EGU General Assembly 2026, Vienna, Austria, 3–8 May 2026, EGU26-19575, https://doi.org/10.5194/egusphere-egu26-19575, 2026.

EGU26-19894 | Posters on site | AS3.6

Convection permitting simulations of mixed-phase clouds over the Southern Ocean 

Daniel Smith, Ian Renfrew, Floortje van den Heuvel, Tom Lachlan-Cope, Ian Crawford, Keith Bower, Micheal Flynn, Matthew Evans, Steven Abel, and Paul Field

Atmospheric and climate models exhibit large radiative flux biases over the Southern Ocean, largely due to deficiencies in representing supercooled liquid and mixed-phase low-level clouds. These biases propagate into errors in sea surface temperature, sea ice, and large-scale circulation. We evaluate a convection-permitting configuration of the Met Office Unified Model using aircraft and satellite observations in February 2023 and aircraft, ship-borne and satellite observations in November 2024 collected during the two Southern Ocean Clouds field campaigns.


From the first campaign the analysis focuses on three mixed-phase cloud properties: ice nucleating particle (INP) concentrations, droplet number concentration, and the spatial mixing of liquid and ice. Using lower temperature-dependent INP concentrations, that are consistent with observations, reduces ice mass and number, increases cloud liquid water, and decreases the net surface cloud radiative effect by up to 14 W m⁻². Reducing droplet number concentrations to observed campaign averages produces a comparable but oppositely signed radiative impact (up to 22 W m⁻²), indicating compensating errors. Changes in phase partitioning also strongly affect radiation, with impacts of up to 31 W m⁻². These results demonstrate that all three of these mixed-phase processes are critical for accurately simulating Southern Ocean clouds and their radiative effects.


We also present analysis from the second field campaign, providing an independent evaluation of the Met Office Unified Model and assessing its sensitivity to aerosol-aware parameterisations and secondary ice processes.

How to cite: Smith, D., Renfrew, I., van den Heuvel, F., Lachlan-Cope, T., Crawford, I., Bower, K., Flynn, M., Evans, M., Abel, S., and Field, P.: Convection permitting simulations of mixed-phase clouds over the Southern Ocean, EGU General Assembly 2026, Vienna, Austria, 3–8 May 2026, EGU26-19894, https://doi.org/10.5194/egusphere-egu26-19894, 2026.

EGU26-19921 | Orals | AS3.6

The goSouth-2 campaign in Invercargill, New Zealand:First insights into heterogeneous ice formation and the effects of Australian aerosols on clouds at the edge of the Southern Ocean 

Patric Seifert, Martin Radenz, Tom Gaudek, Pieper Lukas, George McCosh, Kevin Ohneiser, Ronny Engelmann, Holger Baars, Annett Skupin, Silvia Henning, Birgit Wehner, Mira Pöhlker, Ulla Wandinger, Albert Ansmann, Kevin Alder, Heike Kalesse-Los, Adrian McDonald, and Guy Coulson

The region of the Southern Ocean (SO) is a current hot-spot of research related to aerosol-cloud interactions. On the one hand, detailed observations of aerosols and clouds and their interactions are required to explain the shortwave radiation bias in model simulations. On the other hand, the clean environment of the SO atmosphere allows the study of the impact of even slight variabilities in the aerosol load on cloud and precipitation processes and on the radiation budget of the atmosphere.

The goSouth-2 project led by Leibniz Institute for Tropospheric Research (TROPOS) contributes with a unique long-term dataset of remote-sensing and in-situ measurements of cloud-relevant aerosol properties and associated cloud properties for the northern edge of the SO. The core facility of goSouth-2 is the ACTRIS station LACROS (Leipzig Aerosol and Cloud Remote Observations System) which has been deployed on the premises of the New Zealand MetService in Invercargill (46.4173 °S, 168.3307 °E, 3 m a.s.l., https://cloudnet.fmi.fi/site/invercargill) at the southern tip of the New Zealand’s South Island. The characterization of aerosol optical properties is observed by a newly-built  PollyXT lidar. This system yields backscatter coefficient and depolarization ratios at 355, 532, and 1064 nm. Extinction coefficients are derived from Raman scattering at 387 and 607 nm. Raman scattering by water vapour at 407 nm yields observations of the water vapour mixing ratio. In addition, it is the first PollyXT lidar which includes a 460-nm fluorescence channel enabling a more refined discrimination between smoke, biological aerosols, and other types of pollution. Cloud properties are covered by 94- and 35-GHz cloud radar observations, of which the latter provides RHI and PPI scans for characterization of hydrometeor shapes and the horizontal wind field.  Surface in-situ observations of the aerosol size distribution, cloud condensation nuclei concentrations, and off-line characterization of ice nucleating particle (INP) concentrations are performed. goSouth-2 is involved in the project ACADIA jointly run by Leipzig University and TROPOS, the HALO-South aircraft campaign, ongoing EarthCARE Cal/Val activities, and is conducted in close collaboration with partners from University of Canterbury, Earth Sciences New Zealand, and MetService, NZ. The latter contributes 2 radiosonde launches per day and weather radar observations.

First conclusions drawn from the dataset to date are that aerosol in the cloud-free troposphere is rare. If present, it can mostly be assigned to wildfires or dust from Africa or Australia. In SO air masses ice formation in clouds warmer than -4°C is frequently absent, confirming the lack of efficient INPs. The majority of stratiform precipitation systems is found to be embedded in Australian air masses. A remarkable feature is that enhanced loads of Australian aerosols (dust, smoke) are frequently associated with enhanced turbulence in the affected cloud systems, similar to the dusty-cirrus phenomenon. Observations of the lowest 3 km of marine atmosphere, show a complex aerosol structure containing multiple embedded sub-layers of differing aerosol properties, whose effects on cloud formation remain to be identified. We use co-located observations from goSouth-2, the HALO-South aircraft campaign, and EarthCARE to characterize the observed scenarios.  

How to cite: Seifert, P., Radenz, M., Gaudek, T., Lukas, P., McCosh, G., Ohneiser, K., Engelmann, R., Baars, H., Skupin, A., Henning, S., Wehner, B., Pöhlker, M., Wandinger, U., Ansmann, A., Alder, K., Kalesse-Los, H., McDonald, A., and Coulson, G.: The goSouth-2 campaign in Invercargill, New Zealand:First insights into heterogeneous ice formation and the effects of Australian aerosols on clouds at the edge of the Southern Ocean, EGU General Assembly 2026, Vienna, Austria, 3–8 May 2026, EGU26-19921, https://doi.org/10.5194/egusphere-egu26-19921, 2026.

EGU26-20050 | ECS | Posters on site | AS3.6

Cloud Particle Habits over the Southern Ocean during the HALO-South Aircraft Campaign 

Peter Lloyd, Ahmed Abdelmonem, Deniz Menekay, Franziska Nehlert, Susan Hartmann, Thomas Klimach, Christopher Pöhlker, Dennis Niedermeier, Thomas Leisner, and Mira Pöhlker

The interactions and effects of aerosols and clouds are significant uncertainties in assessing and modeling climate change. Remote regions on earth with frequent pristine aerosol conditions, where the effect of aerosols on clouds are largest, are becoming increasingly rare due to human influence. Understanding climate and global environmental changes makes these locations of particular scientific interest. The Southern Ocean (SO), is one of the cloudiest regions on earth with a high cloud radiative effect and a high bias in atmospheric models due to an underestimation of aerosols. To address this, the HALO-South aircraft campaign, conducted in September and October 2025, aimed to investigate the interplay between aerosols, clouds, and radiation in this region. Within this framework, cloud particle habit – encompassing particle shape, complexity, phase, size and number concentrationis a key microphysical property linking atmospheric thermodynamics to cloud optical properties and precipitation processes.

The optical sensor PHIPS-HALO was employed to produce images of individual cloud particles allowing to analyse microphysical characteristics in great detail. We present an overview of cloud particle habits observed in the SO during the HALO-South campaign, providing insight into the evolution of cloud types and relating observed particle characteristics to established temperature and saturation regimes.


Acknowledgments: This work was supported by the DFG (Deutsche Forschungsgemeinschaft, German Research Foundation), Priority Program SPP 1294, the Max Planck Society, the German Aerospace Center (DLR) and the Leibniz Institute for Tropospheric Research (TROPOS).

How to cite: Lloyd, P., Abdelmonem, A., Menekay, D., Nehlert, F., Hartmann, S., Klimach, T., Pöhlker, C., Niedermeier, D., Leisner, T., and Pöhlker, M.: Cloud Particle Habits over the Southern Ocean during the HALO-South Aircraft Campaign, EGU General Assembly 2026, Vienna, Austria, 3–8 May 2026, EGU26-20050, https://doi.org/10.5194/egusphere-egu26-20050, 2026.

EGU26-20422 | ECS | Posters on site | AS3.6

New particle formation and growth to CCN sizes at a coastal site in the Netherlands: insights from the CAINA campaign 

Marije van den Born, Jan Mulder, Spyros Bezantakos, Mona Kellermann, Xinya Liu, Birgit Wehner, George Biskos, and Ulrike Dusek

New particle formation (NPF) and subsequent growth are key processes controlling cloud condensation nuclei (CCN) number concentrations, as newly formed particles can grow into the CCN size range and thereby influence cloud properties and climate. In this study, we investigate particle number size distributions, CCN activity, and hygroscopicity during the Cloud–Aerosol Interactions in a Nitrogen Dominated Atmosphere (CAINA) campaign conducted in spring 2025 at a coastal site in the northern Netherlands, using a combination of a Scanning Mobility Particle Sizer (SMPS), a Particle Size Magnifier (PSM), and size-resolved CCN measurements. SMPS measurements covering the size range 6.7–969 nm were conducted between 29 March and 13 May 2025, while PSM measurements (1.19–12.0 nm) were available from 4 April to 9 May 2025. Based on visual classification of particle size distribution evolution, 19 NPF events were identified during the 46-day period (41%), 5 days were classified as undefined (11%), and the remaining 22 days as non-event days (48%). In addition, size-resolved CCN measurements were performed between 12 and 23 April 2025 to investigate in more detail the processes governing new particle formation and their growth towards CCN-relevant sizes. The measurements were carried out using a CCN counter operating at supersaturations (SS) of 0.3% and 1% downstream of a Differential Mobility Analyzer (DMA), covering particle diameters between 40 and 140 nm. The data were used to derive CCN activation fractions, characteristic activation diameters (D50), and the apparent hygroscopicity parameter kappa for the two different supersaturations. Our results show a clear size dependence of particle hygroscopicity, with particles activated at 0.3% SS generally exhibiting higher kappa values than particles activated at 1% SS. Average kappa values are around 0.1–0.2 for larger particles and 0.3–0.4 for smaller particles. A detailed case study of a NPF event shows a higher particle hygroscopocity before and during the start of the event, while the hygroscopicity decreases when the particles grow. These findings provide new insights into the link between NPF, particle chemical properties, and their ability to act as CCN.

How to cite: van den Born, M., Mulder, J., Bezantakos, S., Kellermann, M., Liu, X., Wehner, B., Biskos, G., and Dusek, U.: New particle formation and growth to CCN sizes at a coastal site in the Netherlands: insights from the CAINA campaign, EGU General Assembly 2026, Vienna, Austria, 3–8 May 2026, EGU26-20422, https://doi.org/10.5194/egusphere-egu26-20422, 2026.

EGU26-20619 | Orals | AS3.6

Higher than expected ice-nucleating particle concentrations in the Southern Ocean: Preliminary findings from the SOC 2024 cruise 

Mark Tarn, Imogen Wadlow, Joseph Robinson, Ross Herbert, Amélie Kirchgaessner, Thomas Lachlan-Cope, and Benjamin Murray

Biases in surface radiation and sea surface temperature in climate models are larger over the Southern Ocean than anywhere else in the world, severely impacting on our ability to predict global climate. These biases are thought to be caused by the poor representation of mixed-phase clouds in the region, including aerosol-cloud interactions such as the role of atmospheric ice-nucleating particles (INPs). INPs can trigger the freezing of supercooled liquid cloud droplets, greatly influencing the lifetime and radiative properties of mixed-phase clouds. To better understand the role of INPs in the Southern Ocean, it is crucial to know their sources and concentrations, but there are relatively few INP measurements from the region, particularly around the Antarctic Peninsula. Further, discrepancies have been noted between INP measurements from traditional polycarbonate filter analysis techniques and other methodologies during recent field campaigns

We have collected the first ever set of combined real-time and offline measurements of INPs around the Antarctic Peninsula, South Sandwich Islands, and South Georgia during the Southern Ocean Clouds (SOC) research cruise during the austral summer of 2024. The cruise took place aboard the RRS Sir David Attenborough over a period of 5 weeks in November/December, and covered an area from 50° S to 67° S and 70° W to 25° W. Online INP measurements were collected every 6 min using a Portable Ice Nucleation Experiment (PINE) chamber, which uses adiabatic expansion to generate a cloud and then detects the INP concentrations within the cloud. Even with such a short time resolution, INP concentrations >0.5 INP L−1 were measured throughout the cruise at temperatures of −25 to −28 °C.

These measurements were supported by offline filter measurements, with INP concentrations measured using a traditional droplet freezing assay. Importantly, two types of filter were used to collect and analyse the samples: polycarbonate filters prepared using a traditional “wash off” procedure, and Teflon filters using a “drop on” droplet freezing technique. The traditional polycarbonate method yielded very low INP concentrations, consistent with recent literature data for the Southern Ocean region, while the Teflon filters showed much higher concentrations, including when the two filter types were run side-by-side. This suggests, in line with our recent lab-based studies, that the traditional polycarbonate washing technique employed in INP analysis may be missing a fraction of INPs during measurements, and that INP concentrations may be undercounted in some scenarios including in the Southern Ocean

Here, we present initial findings of the INP concentrations collected throughout the SOC cruise, including discussion of the inconsistencies between filter techniques.

How to cite: Tarn, M., Wadlow, I., Robinson, J., Herbert, R., Kirchgaessner, A., Lachlan-Cope, T., and Murray, B.: Higher than expected ice-nucleating particle concentrations in the Southern Ocean: Preliminary findings from the SOC 2024 cruise, EGU General Assembly 2026, Vienna, Austria, 3–8 May 2026, EGU26-20619, https://doi.org/10.5194/egusphere-egu26-20619, 2026.

EGU26-21597 | ECS | Posters on site | AS3.6

Aerosol effects on deep convective cloud microphysics and anvil lifecycle during TRACER using ICON HAM-lite 

Maor Sela, Mathilde Ritman, Sadhitro De, and Philip Stier

The radiative response of deep convective anvil clouds to anthropogenic aerosols is a major source of uncertainty. While aerosol-cloud interactions (ACI) in the convective core have been extensively studied, the microphysical mechanisms governing the full anvil lifecycle, from detrainment to dissipation, remain poorly constrained.
This study examines the Cloud Radiative Effect (CRE) of deep convection through a microphysical process-rate lens. We perform three regional simulations with interactive aerosol using ICON-HAM-lite, comprising baseline, clean, and polluted runs. The simulations follow the TRACER-MIP protocol for a sea-breeze event over Houston, Texas. Using Lagrangian tracking with the tobac cloud tracking algorithm, we isolate individual convective cells and track their evolution from convective onset to the detrainment and dissipation of the resulting anvils. We then assess aerosol-cloud interactions over the lifecycle of the tracked cells by aligning their evolution with the onset of freezing, to ensure a consistent lifecycle comparison.
Our results show that a 9-fold increase in aerosol concentration leads to a 2.5-fold increase in cloud droplet number concentration (CDNC). This suppresses warm-rain processes and enhances upward mass flux above the melting layer. As a result, it also lofts higher droplet concentrations, which can shape anvil characteristics by modulating the total ice surface area available for deposition and the net cross-section for riming. This creates a competition between enhanced riming, which promotes mass fallout, and increased vapour deposition, which sustains smaller ice crystals aloft. We conclude by investigating how these competing factors change the lifetime of the anvil and its net CRE.

How to cite: Sela, M., Ritman, M., De, S., and Stier, P.: Aerosol effects on deep convective cloud microphysics and anvil lifecycle during TRACER using ICON HAM-lite, EGU General Assembly 2026, Vienna, Austria, 3–8 May 2026, EGU26-21597, https://doi.org/10.5194/egusphere-egu26-21597, 2026.

EGU26-22655 | Posters on site | AS3.6

Investigating properties of synthetic analogues for ice nucleating particles 

Isabelle Steinke, Rolf Hut, and Georgios Kelesidis

Atmospheric aerosol particles have been known for the large variability in their ice nucleating propensities as well as their physico-chemical properties. This complexity creates challenges in linking observed particle properties with their ice nucleating activity. In this study, we present results for simple synthetic particle analogues and contrast them with more complex ambient samples that consistently show higher ice nucleation activities. In particular, we focus on analogues for carbonaceous particles and dust. Soot particles have been known to show only limited ice nucleation activity in immersion freezing mode. In this study, we use carbonaceous particles as an experimental platform to explore which surface modifications can lead to a substantial change in ice nucleation propensities. Additionally, we contrast these results with binary systems that mimic the properties of ambient dust particles.

How to cite: Steinke, I., Hut, R., and Kelesidis, G.: Investigating properties of synthetic analogues for ice nucleating particles, EGU General Assembly 2026, Vienna, Austria, 3–8 May 2026, EGU26-22655, https://doi.org/10.5194/egusphere-egu26-22655, 2026.

EGU26-336 | ECS | Orals | AS3.7

Effects of CCN Regeneration on Cumulus Cloud Microphysics and Aerosol Distribution 

Yael Arieli, Alexander Khain, Ehud Gavze, Orit Altaratz, Eshkol Eytan, and Ilan Koren

Cloud–aerosol interactions are central to understanding the coupling between microphysical and dynamical cloud processes and precipitation. Our study focuses on shallow cumulus clouds, employing a high-resolution (10 m) large-eddy simulation using the System for Atmospheric Modeling (SAM) coupled with a Spectral Bin Microphysics (SBM) scheme. The model explicitly tracks aerosol evolution both in the air and within droplets, including activation, transport, growth through coalescence, and release back to the atmosphere via droplet evaporation, which is called the aerosol regeneration process.

Simulations of single clouds, under clean and polluted background conditions, show that droplet evaporation efficiently returns large CCN to the atmosphere, demonstrating that shallow convective clouds are an efficient source of these particles in the lower and middle atmosphere. Regeneration significantly modifies the aerosol size distribution and its vertical profile in the atmosphere, and also alters droplet number and size distributions, particularly in diluted cloud regions. Under clean conditions, including the regeneration process reduces surface precipitation by approximately 50%, highlighting a strong microphysical effect.

These findings underscore the importance of accurately representing aerosol regeneration in models to better quantify aerosol–cloud–precipitation interactions and their influence on the Earth’s radiation and water budgets.

How to cite: Arieli, Y., Khain, A., Gavze, E., Altaratz, O., Eytan, E., and Koren, I.: Effects of CCN Regeneration on Cumulus Cloud Microphysics and Aerosol Distribution, EGU General Assembly 2026, Vienna, Austria, 3–8 May 2026, EGU26-336, https://doi.org/10.5194/egusphere-egu26-336, 2026.

EGU26-1755 | ECS | Orals | AS3.7

Sensitivity of mixed-phase cloud properties to ice-nucleating particles and model resolution 

Ryan Vella, Sylvaine Ferrachat, Ulrike Lohmann, and Diego Villanueva

Mixed-phase cloud thinning (MCT) is an emerging climate intervention strategy that targets supercooled liquid clouds in polar regions during winter. In the absence of sunlight, these clouds exert a net warming effect by trapping outgoing longwave radiation. Seeding polar mixed-phase clouds with ice-nucleating particles (INPs) initiates glaciation, converting persistent, non-precipitating clouds into precipitating ones and reducing their optical thickness. This process enhances the emission of longwave radiation to space, leading to a net cooling of the polar atmosphere. By promoting this radiative cooling, MCT may help restore sea ice and counteract some of the expected warming over polar oceans due to climate change. Initial results suggest that MCT can offset roughly 25% of the expected increase in polar sea-surface temperature from a doubling of CO2. In this work, we apply different resolutions in ICON-HAM, recognising that model resolution is critical for realistically capturing mixed-phase clouds and their inherent phase heterogeneity. We show how the microphysical properties of mixed-phase clouds respond to varying INP concentrations, showing that their sensitivity is strongly resolution-dependent and highlighting the critical role of model scale in assessing the potential efficacy of MCT.

How to cite: Vella, R., Ferrachat, S., Lohmann, U., and Villanueva, D.: Sensitivity of mixed-phase cloud properties to ice-nucleating particles and model resolution, EGU General Assembly 2026, Vienna, Austria, 3–8 May 2026, EGU26-1755, https://doi.org/10.5194/egusphere-egu26-1755, 2026.

EGU26-1915 | Orals | AS3.7

Advancements in ARM User Facility Products and Tools using Machine Learning to Support Atmospheric Research 

Israel Silber, Jennifer M. Comstock, John E. Shilling, Jingjing Tian, Damao Zhang, Donna M. Flynn, and Erol L. Cromwell

New observational datasets of atmospheric state and key atmospheric processes and quantifying observational uncertainties are essential to better understand different feedback mechanisms and increase the fidelity of models at different scales. The U.S. Department of Energy Atmospheric Radiation Measurement (ARM) User Facility aims to alleviate these and other deficiencies and needs by providing tools and comprehensive suites of advanced in-situ and remote-sensing ground-based and airborne observations. Here, we present new and updated retrievals and high-level data products developed at ARM, leveraging machine learning (ML) and other advanced techniques. These ML-augmented multi-instrument retrievals provide useful microphysical quantities, accompanied by uncertainty estimates, including ice precipitation microphysical properties in sub-cloud profiles, hydrometeor phase classification profiles, all-sky imager pixel segmentation, and aerosol size distributions spanning an extensive size spectrum. Finally, we also present a set of ARM-supported tools to bridge between ARM observations and model simulations, such as the Earth Model Column Collaboratory (EMC²).

How to cite: Silber, I., Comstock, J. M., Shilling, J. E., Tian, J., Zhang, D., Flynn, D. M., and Cromwell, E. L.: Advancements in ARM User Facility Products and Tools using Machine Learning to Support Atmospheric Research, EGU General Assembly 2026, Vienna, Austria, 3–8 May 2026, EGU26-1915, https://doi.org/10.5194/egusphere-egu26-1915, 2026.

EGU26-2177 | Posters on site | AS3.7

Observing Changes in Cloud Base Height Using a Ceilometer in Guyuan City 

Zhuolin Chang, Yang Cui, and Lei Tian

Clouds exert first-order controls on Earth’s radiation budget and hydrological cycle, and cloud-base height (CBH) is a key parameter for climate modeling and aviation applications. Using a ceilometer (measurement range 15 m to 12 000 m) deployed in Guyuan, China (35°29′40″ N, 106°18′31″ E; 1984.2 m a.s.l.), we investigated CBH variability from 2020 to 2023. The cloud occurrence frequency was lowest in winter (62.5%), followed by spring (70.4%), summer (71.2%), and autumn (72.4%). Single-layer clouds dominated all year round (∼50%), whereas multilayer clouds were more frequent in summer. A pronounced diurnal cycle was observed in all seasons: daytime cloud occurrence exceeded nighttime values except in spring, where the difference was small. CBH showed distinct seasonal behavior: daytime CBH was lower than nighttime in all seasons; mean CBH was lowest in autumn with the smallest diurnal amplitude, and highest in spring with the largest amplitude, with daily minima at 14:00 in spring and at 11:00 and 12:00 in winter and summer, respectively. Layered statistical data indicated a persistent multilayer cloud structure over the study region. After classifying clouds by CBH, low-level clouds and mid-level clouds comprised the majority of occurrences. Histograms using 500-m bins revealed that low clouds below 500 m were most common in autumn; over the full year, clouds with CBH < 2000 m occurred far more frequently than those with CBH between 2000 and 6000 m, whereas CBH > 7000 m clouds were rare. In spring, high-level clouds (> 7000 m) exhibited a clear diurnal cycle with a midday minimum. Both spring and winter displayed a bimodal distribution of CBH. These results provided an observational baseline for the Guyuan region and offer actionable information for weather forecasting, climate model evaluation, and photovoltaic nowcasting and operations.

How to cite: Chang, Z., Cui, Y., and Tian, L.: Observing Changes in Cloud Base Height Using a Ceilometer in Guyuan City, EGU General Assembly 2026, Vienna, Austria, 3–8 May 2026, EGU26-2177, https://doi.org/10.5194/egusphere-egu26-2177, 2026.

EGU26-2224 | ECS | Orals | AS3.7

Constraining Satellite Estimates of Aerosol–Cloud Interactions via the Droplet–Aerosol Trends Discrepancy  

Hengqi Wang, Husi Letu, Yiran Peng, Hailing Jia, and Johannes Quaas

Aerosol–cloud interactions (ACI), which substantially offset anthropogenic greenhouse warming, remain a major source of uncertainty in current climate assessments. Satellite-based estimates of ACI radiative forcing (RFaci) serve as a key benchmark for climate predictions and for evaluating improvements in climate models. However, these estimates remain poorly constrained. A critical limitation is that satellite assessments typically rely on column-integral aerosol proxies (e.g., AOD, AODf, AI, etc.), which may not accurately represent cloud-base cloud condensation nuclei (CCN)—the particles that actually form cloud droplets. This limitation has given rise to a puzzling phenomenon: over the Southern Hemisphere, cloud droplet concentrations have declined despite increases in column-integral aerosol proxies. While some previous studies have noted this droplet–aerosol trends discrepancy, they often relied on limited datasets and single aerosol proxies, without providing systematic validation, causal analysis, or quantification of its implications for RFaci. This gap has been a significant obstacle to reducing uncertainties in ACI forcing.

To address this challenge, we first combined multi-source observations to provide robust, quantitative evidence of the droplet–aerosol trends discrepancy across the Southern Hemisphere from 2003 to 2020. We then used a source–sink framework to explore the underlying physical mechanisms, finding that the discrepancy arises from elevated cloud bases systematically reducing CCN availability, while enhanced precipitation accelerates droplet removal. By explicitly accounting for these processes, this study provides a physically grounded estimate of aerosol–cloud radiative forcing, constraining RFaci to −1.37 W m⁻². Previous global assessments relying on column-integral variables are therefore biased by –35% to +26%, with discrepancies reaching +42% over the Southern Hemisphere.

This work reconciles a long-standing discrepancy between observed droplet and column-integral aerosol trends, highlighting the critical importance of considering cloud-base CCN in future ACI radiative forcing estimations. It provides a physically grounded constraint on aerosol forcing based on cloud-base CCN, supporting more precise estimates of climate sensitivity and guiding model development.

How to cite: Wang, H., Letu, H., Peng, Y., Jia, H., and Quaas, J.: Constraining Satellite Estimates of Aerosol–Cloud Interactions via the Droplet–Aerosol Trends Discrepancy , EGU General Assembly 2026, Vienna, Austria, 3–8 May 2026, EGU26-2224, https://doi.org/10.5194/egusphere-egu26-2224, 2026.

EGU26-2302 | ECS | Posters on site | AS3.7

Ice-nucleating particle depletion in the wintertime boundary layer in the pre-Alpine region during stratus cloud conditions 

Kevin Ohneiser, Markus Hartmann, Heike Wex, Patric Seifert, Anja Hardt, Anna Miller, Katharina Baudrexl, Werner Thomas, Veronika Ettrichrätz, Maximilian Maahn, Tom Gaudek, Willi Schimmel, Fabian Senf, Hannes Griesche, Martin Radenz, and Jan Henneberger

The remote-sensing equipment of LACROS (Leipzig Aerosol and Cloud Remote Observations System) was installed in Eriswil, Switzerland during the winter campaign of 2023 / 2024. We utilize a big dataset of in situ (especially ice-nucleating particle (INP) sampler; low volume sampler) and remote-sensing (especially cloud radar and Raman lidar) equipment. In addition, INP measurements were available as well in Hohenpeißenberg, Germany and Melpitz, Germany.

We evaluate the regional variability of the number concentration of INPs between the two pre-Alpine central-European sites of Eriswil and Hohenpeißenberg, supported by INP measurements from Melpitz during the winter months of 2024. The aim of the study is to spatially and temporally evaluate INP availability and removal within the planetary boundary layer (PBL) during Bise situations because reasons for the lack of ice and precipitation in the supercooled clouds observed over the Swiss Plateau remain unclear and may be caused by the lack of INPs. Target scenario of the study were situations when northeasterly winds (so-called Bise winds) prevailed and layers of stratus clouds formed at the top of the PBL at temperatures down to −10 °C. In these situations, it is expected that INPs are depleted along the transport path.

We will present our main insights from our measurements:

1) During the cold-Bise (cloud minimum temperatures as low as −10 °C) and warm-Bise (cloud minimum temperatures above 0 °C), almost no INP contrast was found between Hohenpeißenberg and Eriswil if both were within the PBL. Also, the INP concentration was overall found to be much lower during the cold-Bise than during the later warm-Bise situation.

2) When the Hohenpeißenberg site was located in the free troposphere during the cold-Bise situation, INP concentrations were much higher compared to Eriswil (still within the PBL) but similar to cloud-free Melpitz. These observations led to the conclusion that during cold-Bise situations the INP reservoir within the PBL is depleted, likely by the presence of supercooled stratus. The inversion-capped wintertime PBL, especially during periods of widespread snow cover, is apparently not capable to replenish the INP reservoir from the free troposphere.

3) INP observations of around 10^−3 L^−1 at Hohenpeißenberg, when this site was above the PBL were on a similar order as the ice crystal number concentrations (ICNC) observed during the same period at Eriswil. This supports the hypothesis that INPs are entrained from the free troposphere via turbulence and afterwards immediately removed as they interact with the Bise cloud layer, leading to reduced availability of INPs downwind. It must be noted that an ICNC concentration which is higher than the observed INP concentration can in principle also be a result of secondary ice formation processes. Nevertheless, secondary ice formation processes generally lead to orders of magnitudes of increase in ICNC, which was, besides occasional peaks in the ICNC, not observed in the average ICNC values during the investigated time periods.

How to cite: Ohneiser, K., Hartmann, M., Wex, H., Seifert, P., Hardt, A., Miller, A., Baudrexl, K., Thomas, W., Ettrichrätz, V., Maahn, M., Gaudek, T., Schimmel, W., Senf, F., Griesche, H., Radenz, M., and Henneberger, J.: Ice-nucleating particle depletion in the wintertime boundary layer in the pre-Alpine region during stratus cloud conditions, EGU General Assembly 2026, Vienna, Austria, 3–8 May 2026, EGU26-2302, https://doi.org/10.5194/egusphere-egu26-2302, 2026.

EGU26-2330 | ECS | Posters on site | AS3.7

Instantaneous radiative forcings due to the first indirect effect of aerosols linked to warm clouds in the Amazon 

Andre Cezar Pugliesi Silva, Alexandre Lima Correia, and Micael Amore Cecchini

Instantaneous Radiative Forcings due to Aerosol-Cloud Interactions (IRFaci) occur due to anthropogenic aerosols' first indirect effect on the global radiative balance. These forcings represent a significant source of uncertainty regarding human impact on climate, mainly when warm clouds act as the mediating element [1]. Studies quantifying IRFaci have focused primarily on stratiform clouds over the oceans (e.g. [2]). It is particularly noteworthy the lack of studies about the first indirect effect (i.e., Twomey effect) over the Amazon. This study uses datasets from the GoAmazon2014/5 campaign (collected both in situ and via ground-based remote sensing) to configure warm cloud models that serve as inputs to a radiative transfer code (libRadtran). This allows the calculation of daily values of ascending irradiance at the Top of Atmosphere (TOA) for 2014 and 2015. Given that a detailed evaluation of aerosol conditions in the reference atmosphere can reduce the uncertainties associated with RFaci estimates [3], the IRFaci values were calculated based on two clean atmospheric reference states. The annual distributions of IRFaci derived from these references show interannual variation, with the 2014 forcings being more negative than in 2015. The average IRFaci values (and the average values of the 25th and 75th percentiles in the brackets) for the entire duration of the GoAmazon2014/5 campaign relative to the two reference states were -11.8 [-23.0; -2.4] W/m² and -1.3 [-5.8; 0.3] W/m², respectively. These values align with the maximum IRFaci amounts per aerosol optical depth (AOD) unit documented in the literature [4] for the Amazon region. The value obtained for the second reference state corresponds to the most recent estimate provided by the IPCC, which is -0.7 ± 0.5 W/m² on a global scale. Sensitivity tests of IRFaci revealed a strong dependence on aerosol load for clean background conditions. Further increases in aerosol load reduced the sensitivity. The techniques and results presented here offer a unique approach to calculating indirect radiative forcings related to the Twomey effect of warm clouds over the Amazon, contributing to a better understanding of human impact on the region's climate.


[1] Mülmenstädt, J. and Feingold, G.: The Radiative Forcing of Aerosol–Cloud Interactions in Liquid Clouds: Wrestling and Embracing Uncertainty, Curr Clim Change Rep, 4, 23–40, https://doi.org/10.1007/s40641-018-0089-y, 2018. 

[2] Wall, C. J., Storelvmo, T., and Possner, A.: Global observations of aerosol indirect effects from marine liquid clouds, Atmospheric Chemistry and Physics, 23, 13125–13141, https://doi.org/10.5194/acp-23-13125-2023, 2023. 

[3] Gryspeerdt, E., Povey, A. C., Grainger, R. G., Hasekamp, O., Hsu, N. C., Mulcahy, J. P., Sayer, A. M., and Sorooshian, A.: Uncertainty in aerosol–cloud radiative forcing is driven by clean conditions, Atmospheric Chemistry and Physics, 23, 4115–4122, https://doi.org/10.5194/acp-23-4115-2023, 2023. 

[4] Herbert, R. and Stier, P.: Satellite observations of smoke–cloud–radiation interactions over the Amazon rainforest, Atmospheric Chemistry and Physics, 23, 4595–4616, https://doi.org/10.5194/acp-23-4595-2023, 2023.

How to cite: Pugliesi Silva, A. C., Correia, A. L., and Cecchini, M. A.: Instantaneous radiative forcings due to the first indirect effect of aerosols linked to warm clouds in the Amazon, EGU General Assembly 2026, Vienna, Austria, 3–8 May 2026, EGU26-2330, https://doi.org/10.5194/egusphere-egu26-2330, 2026.

Previous studies have demonstrated that the susceptibility of clouds to aerosol loading, quantified by the aerosol–cloud interactions (ACI) index, is strongly modulated by environmental conditions. The South China Sea (SCS), alternately influenced by the southwest and northeast monsoons, provides a unique natural laboratory for examining ACI under contrasting thermodynamic and moisture conditions. Using long-term satellite observations and reanalysis datasets, we investigate ACI over the SCS with a focus on non-precipitating warm liquid clouds. Based on large-scale circulation patterns and moisture conditions, the SCS monsoon system is classified into three distinct phases: the southwest monsoon wet period (SWMW), the northeast monsoon wet period (NEMW), and the northeast monsoon dry period (NEMD). The robust Twomey effect was observed across all three periods. The ACI intensity strengthens progressively from SWMW to NEMW and further to NEMD, corresponding to the transition from moist, convectively active conditions to dry, stably stratified environments. This transition is governed by variations in water-vapor availability and lower-tropospheric stability (LTS), where stable conditions may enhance ACI through aerosol accumulation, while moist environments are likely to weaken it via enhanced condensational and coalescence growth.These findings demonstrate that thermodynamic stability and moisture availability play central roles in regulating ACI over the SCS.The coupled effects of aerosols, humidity, and atmospheric stability control marine warm-cloud microphysical processes in tropical monsoon regions, providing robust observational constraints for improving ACI parameterizations in climate models.

How to cite: Liu, Y., Jia, H., and Han, Y.: Contrasting Monsoon-Driven Susceptibility of Marine Warm Clouds to Aerosols over the South China Sea, EGU General Assembly 2026, Vienna, Austria, 3–8 May 2026, EGU26-2720, https://doi.org/10.5194/egusphere-egu26-2720, 2026.

EGU26-3155 | ECS | Posters on site | AS3.7

The optimal size distribution of seeding aerosol for marine cloud brightening: insights from emulating a Lagrangian cloud model 

Zachary Christopher Rowland, Fabian Hoffmann, Franziska Glassmeier, Isabelle Steinke, and Herman Russchenberg
To effectively implement marine cloud brightening (MCB) we need to know both the most suitable conditions under which to spray and the sprayed sea salt size distributions which produce the most effective brightening. This requires understanding in detail the effect of each sprayed distribution on the cloud microphysics across a wide range of meteorological conditions.
 
To address this, we developed a fast approximation of a Lagrangian cloud model capable of emulating MCB-relevant prognostic variables for a wide range of spraying scenarios and salt size distributions. We run this model on a large dataset of conditions sourced from ERA5 and CAMS reanalysis and filtered for target stratocumulus clouds. Our analysis yields insights for estimation of the potential brightening efficiency of stratocumulus for different sprayed aerosol distributions and spray rates, depending on background meteorological conditions.

How to cite: Rowland, Z. C., Hoffmann, F., Glassmeier, F., Steinke, I., and Russchenberg, H.: The optimal size distribution of seeding aerosol for marine cloud brightening: insights from emulating a Lagrangian cloud model, EGU General Assembly 2026, Vienna, Austria, 3–8 May 2026, EGU26-3155, https://doi.org/10.5194/egusphere-egu26-3155, 2026.

Climate change responds to, and in turn modifies, trends in the Earth’s top-of-atmosphere albedo.

These trends are caused by anthropogenic aerosol–radiation and aerosol–cloud interactions, as well as by non-aerosol feedbacks involving cloudiness and surface albedo.

To separate those contributions, we identify periods of higher and lower albedo and aerosol optical depth in CERES and MODIS satellite retrievals from 2002–2020 over Europe, Eastern North America, Northeastern Asia, and India. Albedo and aerosol optical depth decrease over 2002--2020 in all regions except India, where both increase. We then apply a Gradient Boosting regression to retrieval differences between periods to decompose regional albedo trends into aerosol, aerosol–cloud, and non-aerosol contributions. According to this regression, these trends are explained by changes in cloud fraction (partially aerosol-related), cloud droplet number, aerosol optical depth, and surface albedo, and by climate feedbacks as well. We also calculate sensitivities of top-of-atmosphere albedo to aerosol optical depth, cloud fraction, liquid water path, droplet number, surface albedo, and surface temperature regionally and seasonally. These sensitivities are compared to those obtained from the same Gradient Boosting regression applied to CMIP6 simulations highlighting limitations in aerosol-cloud representation in some CMIP6 models

How to cite: Clement, N.: Aerosol and Non-Aerosol Drivers of Regional Trends in Top-of-Atmosphere Albedo over 2002–2020 in Satellite Observations and Climate Models, EGU General Assembly 2026, Vienna, Austria, 3–8 May 2026, EGU26-3756, https://doi.org/10.5194/egusphere-egu26-3756, 2026.

EGU26-4029 | ECS | Posters on site | AS3.7

Investigating Aerosol-Cloud-Interactions Radiative Impacts combining a New Global Satellite Joint-Dataset and Radiative Transfer Model. 

Elise Devigne, Odran Sourdeval, Fabien Waquet, Martin De Graaf, and Hailing Jia

Aerosol-Cloud Interactions (ACIs) remain one of the largest sources of uncertainty in climate projections. Satellite observations provide essential constraints to estimate ACI-induced radiative forcing (e.g., Twomey, 1974; Albrecht, 1989), yet large discrepancies among studies persist due to measurement limitations. Passive sensors such as the Moderate Resolution Imaging Spectroradiometer (MODIS) cannot simultaneously retrieve aerosol and cloud properties, leading to biases when absorbing aerosols above clouds (AACs) alter cloud optical retrievals. These biases become particularly pronounced during extreme aerosol events - such as wildfires, dust outbreaks, or volcanic eruptions - when AACs distort satellite-derived cloud effective radius (CER) and cloud optical thickness (COT). Previous studies over the Southeast Atlantic and Saharan regions have shown that AACs can lead to underestimated COT and either over- or underestimated CER (Haywood et al., 2004; Alfaros and Contreras, 2013; Costantino and Bréon, 2010, 2013).

   To address these issues, we develop a new methodology combining data from MODIS (and VIIRS) with TROPOMI to construct a high-resolution aerosol–cloud joint dataset. This synergy enables separation of distinct aerosol–cloud configurations - (i) aerosol below cloud top (BCT), (ii) aerosol above cloud and attached (ACTa), and (iii) aerosol above cloud top and separated (ACTs) - facilitating a clearer quantification of their respective influences on cloud properties hence, radiative forcing. The dataset provides global coverage from 2019 to the present, and is applied here to three case studies: the 2019/2020 Australian fires, the 2020 California fires, and the recurrent Namibia/Angola fire season (July-October).

    Our results highlight that accounting for aerosol-cloud vertical configuration substantially improves the quantitative evaluation of ACIs, with cloud droplet number concentration (Nd) exhibiting distinct responses across scenarios. Additionally, we use the Successive Order of Scattering (SOS) radiative transfer model (Lenoble et al., 2007) to simulate aerosol-cloud radiative effects, generate lookup tables (LUTs) to correct cloud retrieval biases in MODIS and other passive sensors and generate aerosol index to better understand its dependency on aerosol layer height and cloud cover.

How to cite: Devigne, E., Sourdeval, O., Waquet, F., De Graaf, M., and Jia, H.: Investigating Aerosol-Cloud-Interactions Radiative Impacts combining a New Global Satellite Joint-Dataset and Radiative Transfer Model., EGU General Assembly 2026, Vienna, Austria, 3–8 May 2026, EGU26-4029, https://doi.org/10.5194/egusphere-egu26-4029, 2026.

Aerosols affect radiation, cloud properties, convection, air temperature, and large-scale circulation, yet their influence on precipitation distribution over the Maritime Continent (MC), a complex tropical region composed of islands interspersed with shallow seas, remains poorly understood. Using high-resolution cloud-system resolving model simulations, satellite observations, and reanalysis data, we demonstrate that rising aerosol concentrations amplify oceanic precipitation more than they suppress land precipitation, thereby increasing the sea-to-land precipitation ratio over the MC. This shift is supported by observations and contrasts with the land-enhanced precipitation distribution seen in pristine simulations or those without aerosol radiative effects. Our results underscore that aerosol-induced radiative cooling stabilizes the lower troposphere more over land than over the ocean, enhancing low-level convergence and convection over the sea. Moreover, high aerosol concentrations delay the diurnal precipitation peak over land from late afternoon to midnight, driven by diminished daytime heating and subsequent nighttime increases in moist static energy—an interesting pattern evident in some observed high-aerosol days.

How to cite: Seo, K.-H.: Aerosol effects on Maritime Continent precipitation: Oceanic intensification and land diurnal cycle delay, EGU General Assembly 2026, Vienna, Austria, 3–8 May 2026, EGU26-4658, https://doi.org/10.5194/egusphere-egu26-4658, 2026.

EGU26-4732 | ECS | Posters on site | AS3.7

Microphysical complexity of black carbon particles restricts their warming potential 

Yan Peng, Xiao-Feng Huang, Jing Wei, Jianfei Peng, Ling-Yan He, John H. Seinfeld, and Yuan Wang

Black carbon (BC) strongly absorbs solar radiation, while its warming effect on climate is poorly quantified. A key challenge is to accurately assess BC light absorption after being mixed with non-BC components. However, there has consistently been a large observation-modeling gap in BC light absorption estimation, reflecting the insufficient understanding of realistic BC complexity. Here we conduct comprehensive in-situ measurements of BC single-particle microphysics, e.g., size, coating amounts, density, and shape, along with optical closure calculation. Specifically, the observed particle-to-particle heterogeneities in size and coating, and the non-spherical BC shape only explain the lower observed BC absorption by ~20% and ~30%, respectively. A remaining gap for fully aged spherical BC-containing particles is related to the off-center BC core position. The global climate model assessment shows that fully accounting for the observed BC complexity in the aerosol microphysical representation reduces the global BC direct radiative forcing by up to 23%.

How to cite: Peng, Y., Huang, X.-F., Wei, J., Peng, J., He, L.-Y., Seinfeld, J. H., and Wang, Y.: Microphysical complexity of black carbon particles restricts their warming potential, EGU General Assembly 2026, Vienna, Austria, 3–8 May 2026, EGU26-4732, https://doi.org/10.5194/egusphere-egu26-4732, 2026.

EGU26-5642 | Posters on site | AS3.7

Assessing Aerosol-Cloud Interactions Using Ground- and Space-Based Observations: Insights from Northern France 

Suzanne Crumeyrolle, Quentin Coopman, Eric Bourrianne, Clara Lapointe, Eloise Delbarre, Elise Devigne, Olivier Pujol, and Timothy Garrett

Aerosol-cloud interactions (ACI) remain a major source of uncertainty in anthropogenic radiative forcing, primarily due to the challenge of simultaneously observing aerosols acting as cloud condensation nuclei (CCN) and their impact on cloud microphysics. This study leverages the synergy between ground-based measurements at the ATOLL peri-urban site (Lille, Northern France) and satellite observations (CLAAS-3 SEVIRI) to quantify how variations in boundary-layer aerosol loading influence cloud droplet number concentration (nd) and effective radius (re).

For the period between 2020 and 2024, collocated datasets of space- and ground-based instruments, in-situ and remote sensing, were analyzed under different conditions: filters have been applied to isolate CCN-relevant aerosols, low-level clouds, and stable atmospheric layers. Results reveal a relationship between aerosol scattering coefficient (σsp) related to aerosol concentration and cloud microphysical properties: nd increases with σsp, while re decreases, in line with CCN impact on liquid clouds. The aerosol-cloud interaction indices related to nd and re range from 0.11 to 0.36 and 0.07 to 0.13, respectively, depending on liquid water path (LWP) bins. These values align with previous field and satellite studies but are slightly lower, likely due to the coarse spatial resolution of SEVIRI and the predominance of winter conditions in the dataset.

This work highlights the measurable sensitivity of stratiform clouds to boundary-layer aerosol loadings in northern France and underscores the value of combining ground- and space-based observations. Future research will expand this methodology to sites with contrasting aerosol regimes and incorporate aerosol chemical composition data to further disentangle the influence of hygroscopicity and mixing state on cloud microphysical responses.

How to cite: Crumeyrolle, S., Coopman, Q., Bourrianne, E., Lapointe, C., Delbarre, E., Devigne, E., Pujol, O., and Garrett, T.: Assessing Aerosol-Cloud Interactions Using Ground- and Space-Based Observations: Insights from Northern France, EGU General Assembly 2026, Vienna, Austria, 3–8 May 2026, EGU26-5642, https://doi.org/10.5194/egusphere-egu26-5642, 2026.

EGU26-7158 | ECS | Posters on site | AS3.7

Evaluation of aerosol representation in TM5 using a one-at-a-time sensitivity analysis constrained by aerosol optical depth  

Meryem Bouchahmoud, Tommi Bergman, Risto Makkonen, Arundathi Chandrasekharan, Krista Luoma, Simo Tukiainen, Harri Kokkola, and Christina Williamson

Aerosol parametric uncertainty in global climate models can be as large as intermodal uncertainty, posing a significant challenge for reliable climate projections. This study investigates the magnitude and drivers of aerosol-related uncertainty in the TM5 chemical transport model (CTM), the atmospheric chemistry and transport component of the EC-Earth3 Earth System Model (ESM), and a contributor to the Coupled Model Intercomparison Project (CMIP).

Aerosol parameters in TM5 describe characteristics of emissions, removal, transformations, physical, chemical, and optical properties. To assess aerosol representation in TM5, we have performed one-at-a-time sensitivity studies, where individual aerosol parameters were perturbed to the minimum and maximum of their respective uncertainty ranges. The resulting impacts were evaluated using climate-relevant outputs, cloud condensation nuclei number (CCN) concentrations at supersaturations of 0.2% and 1% averaged over the lowest five model levels, and aerosol optical depth (AOD) at 550 nm. Model responses were analyzed on seasonal timescales over a two-year period (2017–2018).

The results indicate that sea-salt and dimethyl sulfide (DMS) emissions, particle size of biomass-burning emissions, and dry-deposition rates exert the strongest influence on CCN number concentrations and aerosol optical depth (AOD).  Simulated AOD from each sensitivity experiment was constrained using the AOD merged product for 2017 by Sogacheva et al. (2020). Seasonal comparisons were performed for 2017 across four regions: West Asia and North Africa (WANA), India and South Asia (ISA), Southern Africa (SA), and Mexico to Colombia (MC). Across all seasons, high AOD regions, TM5 exhibits minimal sensitivity to the perturbed simulations and accurately captures high AOD values. In contrast, the model shows more variation in low AOD values than the observations, where sensitivity to parameter perturbations, particularly emission-related parameters, is most pronounced. Increased dry deposition and reduced SO₂ emissions consistently improve low-AOD predictions with respect to the satellite product, especially in WANA and ISA, while the default setup performs best in South Asia and during JJA.

These findings identify the aerosol parameters that contribute most significantly to uncertainty in TM5 and highlight the key sensitivities that will inform future work involving emulated perturbed-parameter ensemble (PPE) experiments. The PPEs will vary these parameters over their uncertainty range simultaneously to study their combined effect on TM5.

How to cite: Bouchahmoud, M., Bergman, T., Makkonen, R., Chandrasekharan, A., Luoma, K., Tukiainen, S., Kokkola, H., and Williamson, C.: Evaluation of aerosol representation in TM5 using a one-at-a-time sensitivity analysis constrained by aerosol optical depth , EGU General Assembly 2026, Vienna, Austria, 3–8 May 2026, EGU26-7158, https://doi.org/10.5194/egusphere-egu26-7158, 2026.

EGU26-7461 | ECS | Posters on site | AS3.7

Interactive aerosol effects during an extreme biomass burning episode over South America simulated with WRF-Chem 

Douglas Lima de Bem, Vagner Anabor, Franciano Scremin Puhales, Luiz Angelo Steffenel, Leonardo Brenner, Mauro Morichetti, Fabio Grasso, and Umberto Rizza

Large-scale biomass burning (BB) events in South America constitute a major source of atmospheric aerosols, with profound implications for regional radiative budgets, cloud microphysics, and precipitation processes. However, most operational and regional weather prediction models still neglect interactive atmospheric chemistry, limiting their ability to realistically represent aerosol radiative effects and associated feedbacks on clouds and precipitation during extreme BB episodes. Despite extensive observational evidence, the representation of aerosol–meteorology interactions linked to intense biomass burning remains a major source of uncertainty in regional climate and weather simulations.

In this study, we investigate the atmospheric impacts of an intense and persistent BB episode that affected South America during September 2022, using the fully coupled Weather Research and Forecasting model with online chemistry (WRF-Chem). The event was identified based on active fire detections from the FIRMS web-portal, consistently observed through enhanced Aerosol Optical Depth (AOD) from MODIS and elevated carbon monoxide (CO) columns retrieved from IASI. Model simulations were conducted for the period from 25 August to 12 September 2022, employing the MOZCART chemical/aerosol mechanism (MOZART and GOCART), Morrison double-moment microphysics, and the RRTMG radiation scheme. To isolate aerosol-driven perturbations from the large-scale meteorological forcing, a control experiment without interactive chemistry was performed and used as a baseline. The analysis focuses on aerosol-induced modifications to cloud microphysical properties and precipitation, evaluated over four distinct geographical subregions representative of the most affected areas.

Model performance was assessed through a comprehensive comparison with observations. The chemical component was evaluated by analyzing the spatial and temporal evolution of simulated AOD and CO against MODIS and IASI satellite products. The meteorological consistency of the simulations was independently verified using surface observations, with statistical metrics computed for near-surface temperature, wind speed, and relative humidity across the domain. The results highlight the critical role of interactive aerosol–radiation and aerosol–cloud processes in shaping the atmospheric response to extreme biomass burning events. This study demonstrates the added value of fully coupled chemistry–meteorology modeling and spatially resolved diagnostics for improving the representation of biomass burning impacts in regional weather and climate simulations over South America.

How to cite: de Bem, D. L., Anabor, V., Puhales, F. S., Steffenel, L. A., Brenner, L., Morichetti, M., Grasso, F., and Rizza, U.: Interactive aerosol effects during an extreme biomass burning episode over South America simulated with WRF-Chem, EGU General Assembly 2026, Vienna, Austria, 3–8 May 2026, EGU26-7461, https://doi.org/10.5194/egusphere-egu26-7461, 2026.

EGU26-7967 | Orals | AS3.7

A Ternary Framework for Marine Stratocumulus Morphology and Cloud Susceptibility 

Tom Goren, Goutam Choudhury, and Graham Feingold

We introduce a new framework for defining marine stratocumulus cloud morphologies using a ternary diagram. The method is applied to one year of satellite observations of stratocumulus clouds and reveals the frequency of occurrence of different morphologies across the ternary space. Large-eddy simulations complement the satellite analysis and show that cloud evolution tends to follow preferred pathways across the ternary space, explaining why observations are concentrated within a limited range of morphologies. We further investigate the susceptibility of cloud liquid water path (LWP) and cloud albedo to variations in droplet number concentration, conditioned on cloud morphology. For the most frequently observed morphologies, LWP and cloud albedo susceptibilities largely offset each other, resulting in a net in-cloud albedo response close to zero. These findings have important implications for marine cloud brightening, whose effectiveness should be evaluated in a morphology-dependent framework, as well as for estimates of cloud radiative forcing due to aerosol–cloud interactions, which should be based on morphology-weighted averages.

How to cite: Goren, T., Choudhury, G., and Feingold, G.: A Ternary Framework for Marine Stratocumulus Morphology and Cloud Susceptibility, EGU General Assembly 2026, Vienna, Austria, 3–8 May 2026, EGU26-7967, https://doi.org/10.5194/egusphere-egu26-7967, 2026.

EGU26-8400 | Orals | AS3.7

Balloon-borne measurements and off-line analyses to improve constraints on ice nucleating particles in the cirrus regime.  

Joshua Schwarz, Thomas Whale, Elizabeth Asher, Alexandre Baron, Sebastian Eastham, Eric jensen, Nina Kinney, Benjamin Murray, andrew rollins, karen rosenlof, katie smith, and Troy Thornberry

Measurements of ambient ice nucleating particle (INP) composition, concentration, and ice activation properties in the cirrus regime are extremely sparse. However, such measurements are fundamental to advancing understanding of cirrus extent and sensitivities to varied sources, as well as the impacts from perturbations of natural and/or anthropogenic origin. Here we present a potential approach to providing cirrus-relevant INP observations in both fast-response and systematic measurement scenarios. We will leverage experience with an existing upper-tropospheric sampling network relying on small weather balloons to enable collection of INP for off-line analysis. We will present an overview of our scheme, provide status of new instrumentation, and identify the significant technical challenges to be overcome. Finally, we will discuss how we plan to use these measurements to improve cirrus modeling, including better capturing the effects of anthropogenic aerosols on cirrus properties, distribution, and overall radiative effect.

How to cite: Schwarz, J., Whale, T., Asher, E., Baron, A., Eastham, S., jensen, E., Kinney, N., Murray, B., rollins, A., rosenlof, K., smith, K., and Thornberry, T.: Balloon-borne measurements and off-line analyses to improve constraints on ice nucleating particles in the cirrus regime. , EGU General Assembly 2026, Vienna, Austria, 3–8 May 2026, EGU26-8400, https://doi.org/10.5194/egusphere-egu26-8400, 2026.

EGU26-8424 | ECS | Orals | AS3.7

What observations do we need to better constrain ERFaci in Earth system models? 

Jacqueline Nugent and Daniel McCoy

The effective radiative forcing from aerosol-cloud interactions (ERFaci) remains one of the most uncertain aspects of our understanding of the Earth’s sensitivity to greenhouse gases. This uncertainty is largely due to the uncertainties in the parameterizations used to represent subgrid-scale processes in global Earth system models (ESMs). Perturbed parameter ensembles (PPEs), which vary the values of multiple parameters simultaneously, can help address this parametric uncertainty; however, ERFaci estimates are also impacted by structural uncertainties in the design choices of different ESMs. An accurate estimate of ERFaci also hinges on the availability of observations that we can use to assess the fidelity of ESMs in simulating plausible aerosol-cloud interactions.


Here, we focus on a PPE run in the E3SMv3 model, where 25 parameters related to aerosols and microphysics are perturbed across an ensemble of 250 nudged two-year simulations with both preindustrial and present-day aerosol forcings. In the E3SMv3 PPE, we examine which variables and which locations around the globe have the strongest correlations with the global ERFaci response to determine which measurements would be the most useful in constraining ERFaci. We also consider structural uncertainty in ERFaci by examining an opportunistic multi-model PPE consisting of a set of preindustrial and present-day PPE simulations run in different ESMs. Using the multi-model PPE, we identify the regions with the greatest disagreement between ESMs, which indicate where there are large structural uncertainties in the simulation of aerosol-cloud interactions. Together, these results highlight which regions and variables are subject to the greatest parametric and structural uncertainty related to simulating ERFaci. We argue that additional observations of key variables from these regions would have the greatest impact on reducing uncertainty in ERFaci and thus would help narrow our estimates of future projected temperature changes. This work provides a starting point for a new deployment planning framework using PPEs as part of an observing system simulation experiment (OSSE) to help improve our process understanding and simulation of aerosol-cloud interactions simultaneously.

How to cite: Nugent, J. and McCoy, D.: What observations do we need to better constrain ERFaci in Earth system models?, EGU General Assembly 2026, Vienna, Austria, 3–8 May 2026, EGU26-8424, https://doi.org/10.5194/egusphere-egu26-8424, 2026.

EGU26-8699 | ECS | Orals | AS3.7

Aerosols in the Andes: Microphysical Properties and Long-Term Variability 

Diego Aliaga, Fernando Velarde, Marcos Andrade, Paolo Laj, Gaëlle Uzu, Kay Weinhold, Alfred Wiedensohler, Ilona Riipinen, and Radovan Krejci

Aerosol properties, loading, trends, and variability in the upper troposphere are key to understanding the evolving state of the atmosphere and the role of aerosols in climate and cloud processes. However, long-term in-situ aerosol observations at high altitudes remain scarce worldwide, particularly in the Global South. This observational gap limits our ability to develop a global perspective on aerosol sources, processes, and impacts within the climate system.

Here we present 13 years (2012–2024) of continuous aerosol-related measurements conducted at the world’s highest Global Atmosphere Watch (GAW) station, located on Mount Chacaltaya (CHC) in the central Andes of Bolivia at an elevation of 5.2 km a.s.l. This dataset is one of the longest in existence on the South American continent and therefore provides a unique opportunity to evaluate trends in aerosol concentrations and properties. These trends and properties are influenced by, for example, biomass burning in the Amazon, the transport of pollution from the conurbation of La Paz and El Alto, located 18 km to the south, and the subsidence of air masses from the upper troposphere.

We focus on particle number size distributions (PNSD), equivalent black carbon (eBC), and related meteorological and chemical tracers, including water vapor mixing ratio (WVMR) and carbon monoxide (CO). We characterize aerosol properties and loading by combining traditional time-series analysis (e.g., separation by hour of day, season, and year) with an unsupervised k-means clustering approach that disentangles the dominant atmospheric regimes influencing aerosol properties at CHC. The clustering uses PNSD, eBC, and WVMR as input variables and identifies seven distinct categories of days, hereafter referred to as atmospheric regimes, which represent significantly different source regions and aerosol processing pathways (e.g., cloud processing, wet deposition, and new particle formation). The performance of the clustering is evaluated using independent tracers, namely CO concentrations and HYSPLIT back trajectories. For each regime, the individual days grouped within it exhibit internally consistent CO levels and air-mass provenance that are clearly distinct from those of other regimes. This result is particularly encouraging given that neither CO nor back trajectories were included as inputs to the clustering algorithm.

One regime is particularly noteworthy, representing a persistent free-tropospheric state characterized by extremely low WVMR, CO, and eBC, along with signatures of early-morning new particle formation. We find that the concentration of particles in this regime has significantly decreased over the 13-year period which indicates a declining upper-tropospheric particle concentration. A second notable regime is associated with biomass burning. We find that its occurrence has increased over time, from ~10% of days during the biomass-burning season (August–November) in the first years to ~50% in the last years. This suggests an increment on the number of biomass burning episodes measured at the station. Additional categories capture aerosol–cloud processing during Amazonian boundary-layer uplift, local eBC influence from the La Paz–El Alto metropolitan area, and strong nucleation under dry, coastal/Altiplano air masses. Overall, these results emphasize a region in rapid change and the importance and utility of long-term measurements in under sampled areas.

How to cite: Aliaga, D., Velarde, F., Andrade, M., Laj, P., Uzu, G., Weinhold, K., Wiedensohler, A., Riipinen, I., and Krejci, R.: Aerosols in the Andes: Microphysical Properties and Long-Term Variability, EGU General Assembly 2026, Vienna, Austria, 3–8 May 2026, EGU26-8699, https://doi.org/10.5194/egusphere-egu26-8699, 2026.

EGU26-9044 | ECS | Orals | AS3.7

Opposite but comparable effects of fine and coarse aerosols on lifecycle properties of deep convective clouds 

Zengxin Pan, Jianhua Yin, Fan Liu, Lin Zang, Feiyue Mao, and Daniel Rosenfeld

Deep convective clouds (DCCs) are crucial in the hydrological cycle and Earth’s energy budget. However, even with same meteorological conditions, continental DCC remains more, higher, and stronger than that over ocean. Here, through nine years of full-cycle tracking on tropical DCCs, the land-ocean different effect of aerosols on DCC is quantified. our observations discovered that both fine aerosols (FA, radius<1 μm) and coarse sea salt aerosols (CSA, radius>1 μm) play significant but opposing roles in the DCC development. Adding fine aerosols significantly invigorate the DCC through delaying the rain formation, increasing in total area and rainfall amount of DCC by up to 5 times at the optimal concentration of 5 µg/cm3. The fine aerosol effect contributes to the intensive DCC, frequent lightning and heavy rain event over land. In contrast, adding coarse sea salt aerosol weakens the cloud vigor and lightning by producing fewer but larger cloud drops, which accelerate warm rain at the expense of mixed-phase precipitation. Adding CSS weaken the DCC, but expanded its area by 4 times. Corresponsdingly, the lightning density is reduced by up to 90% due to the additional CSS-enhanced warm rain process. The CSS effect contributes the moderate DCC, few lightning and expansive rain event over ocean. These findings indicate that the different aerosol effects on DCC explain the land-ocean contrast on intensity and frequency of DCC.

How to cite: Pan, Z., Yin, J., Liu, F., Zang, L., Mao, F., and Rosenfeld, D.: Opposite but comparable effects of fine and coarse aerosols on lifecycle properties of deep convective clouds, EGU General Assembly 2026, Vienna, Austria, 3–8 May 2026, EGU26-9044, https://doi.org/10.5194/egusphere-egu26-9044, 2026.

EGU26-9201 | Posters on site | AS3.7

Aerosol-cloud interactions over the high Arctic: CLeancloud Arctic VIllum ExpeRiment (CLAVIER) overview 

Ulas Im, Alexis Berne, Radiance F. A. Calmer, Lionel Favre, Romanos Foskinis, Andreas H. Massling, Athanasios Nenes, Alexandros Papayannis, Julia Schmale, Lu Zhang, Michael H. Boy, Komal V. Navale, Carl A. Svenhag, Bernadette Rosati, Robin W. de Jonge, Jenni Koyyka, Zihui Teng, Nikolaos Evangeliou, Henning Dorff, and Henrik Skov and the CLAVIER Team

The Arctic is warming up to 4 times faster than the global average, leading to rapid ice melting and consequently, a drastic change of the sources and processing of aerosols and their impact on clouds. Monitoring of these changes over the Arctic is extremely sparse, especially in the most remote regions where harsh conditions make it difficult to carry out even simple measurements. To address these knowledge gaps and develop better and new methods of remote sensing of aerosols and clouds, the CleanCloud project carried out the field campaign CLeancloud Arctic VIllum ExpeRiment (CLAVIER) at Villum Research Station (VRS) in northeast Greenland to study aerosol-cloud interaction (ACI) using in-situ surface and remote sensing as well as airborne measurements.

CLAVIER covered two phase; spring  (April) and summer (July/August) 2024, each lasting for one month. We have employed the existing in-situ surface aerosol monitoring at VRS, which includes a Scanning Mobility Particle Sizer (SMPS), a Cloud Condensation Nuclei Counter (CCNC), a High-Volume Sampler (HVS), a Nephelometer, an Aethalometer, a Neutral cluster and Air Ion Spectrometer (NAIS), a wind lidar and a ceilometer. During CLAVIER, the site was additionally equipped with a AeRosol aerosol-cloud lIdar System (ARIS lidar) and a Wideband Integrated Bioaerosol Sensor (WIBS-5/NEO) to provide realtime measurement of aerosols and fluorescent particles to infer the presence of bioaerosols and their potential contribution to Ice Nucelating Particles (INP). In addition, a W-band Cloud Doppler Radar (WProf) and a tethered balloon (Helikite) was operated during the spring phase. The helikite was equipped with aerosol and cloud instrumentation, including a Portable Optical Particle Spectrometer (POPS), a Miniaturized Scanning Electrical Mobility Sizer (mSEMS), a Single-channel tricolor absorption photometer (STAP) and a miniaturized Cloud Droplet Analyzer (miniCDA), and a filter sampler with the new nano-electromechanical membrane FTIR (NEMS-FTIR) technique. A second tethered balloon was also employed for meteorological and flux measurements. In the summer phase, a Proton-Transfer-Reaction Mass Spectrometry (PTR-MS) was used to measure VOCs online and cartridge sampling was performed for offline sampling of VOCs, as well as a WELAS (white-light aerosol spectrometer) for size distribution of larger sizes and the newest aethalometer AE36s. Finally, summertime measurements were also coordinated with the NASA ARCSIX aircraft mission for clousure experiments. 

In order to get a better understanding of the processes related to aerosol-cloud interactions, several modelling activities were and are being carried out for the CLAVIER period. These include the Flexible Particle Dispersion Model (FLEXPART), the WRF-SIP model to study in detail the secondary ice production in clouds, OpenIFSv48 global model to simulate the aerosol composition and forcing during the campaign, and finally, the FLEXPART-SOSAA framework and the ADCHEM model to study in detail the aerosol chemistry and impacts on CCN.

This presentation will provide an overview of these activities and some preliminary results.

How to cite: Im, U., Berne, A., Calmer, R. F. A., Favre, L., Foskinis, R., Massling, A. H., Nenes, A., Papayannis, A., Schmale, J., Zhang, L., Boy, M. H., Navale, K. V., Svenhag, C. A., Rosati, B., de Jonge, R. W., Koyyka, J., Teng, Z., Evangeliou, N., Dorff, H., and Skov, H. and the CLAVIER Team: Aerosol-cloud interactions over the high Arctic: CLeancloud Arctic VIllum ExpeRiment (CLAVIER) overview, EGU General Assembly 2026, Vienna, Austria, 3–8 May 2026, EGU26-9201, https://doi.org/10.5194/egusphere-egu26-9201, 2026.

It is well known that aerosols can increase the number of droplets in clouds. Increased droplet numbers have been observed over oceans as ship tracks , and more recently over continents as industry tracks (Toll et al 2019 Nature https://doi.org/10.1038/s41586-019-1423-9). However, it is expected that the influence of aerosols on cloud properties is broader and exists in many more cases than those with high-contrast visible cloud tracks.

To gain a better understanding of the pollution's effect on clouds, we analyzed cloud properties around hundreds of industrial sites over a 20-year period using MODIS satellite data. We simulated aerosol dispersion using the HYSPLIT model and reanalysis winds, and compared the properties of aerosol-polluted cloud areas to the properties of nearby unpolluted clouds. Importantly, we conducted several null experiments to rule out that systematic differences between polluted and unpolluted areas arise from differences in orography or land cover, prevailing weather patterns, or other surrounding pollution sources.

Preliminary results suggest that aerosol-dispersion modelling allows to successfully identify anthropogenic aerosol point sources that lead to increased cloud droplet numbers

How to cite: Luhamaa, A., Aun, M., Keernik, H., and Toll, V.: Anthropogenic aerosol point sources exposed through satellite-based identification of polluted cloudsLong-term impact of industrial pollution sources on cloud properties, EGU General Assembly 2026, Vienna, Austria, 3–8 May 2026, EGU26-9322, https://doi.org/10.5194/egusphere-egu26-9322, 2026.

EGU26-9487 | Posters on site | AS3.7

A new droplet parameterization for ICON-AES physics 

Karoline Block

Running climate simulations with ICON (Sapphire configuration) using the 1-moment microphysical scheme so far relied on very simplistic assumptions about cloud droplet number concentrations (CDNC) profiles, which do not evolve in time and space. This has direct implications for cloud radiative effects and precipitation rates. Recent developments in km-scale modeling within the WarmWorld project, however, have introduced important advances in this area.

In this presentation, I introduce a new droplet parameterization developed for ICON-AES physics. It makes use of cloud condensation nuclei (CCN) derived from Copernicus Atmosphere Monitoring Service reanalysis (CAMSRA; Block et al., ESSD, 2024). This approach provides observationally constrained input for computing CDNC fields without the need to couple ICON to a full aerosol model.

This new module is currently implemented for the 1-moment scheme, in which cloud water mass is predicted while CDNC are prescribed as time-dependent boundary conditions. CDNC are computed using a diagnostic, fitted droplet parameterization that depends on CCN and vertical velocity, adapted from Kuba and Fujiyoshi (ACP, 2006). This scheme is therefore computationally efficient and well suited for non-hydrostatic models. To fully exploit this parameterization, a CCN-supersaturation spectrum is constructed using an adaptation of Twomey’s power law when reading CCN of reduced complexity into ICON. This ensures computational efficiency and helps to correct biases recently identified in CCN evaluations.

I will discuss the scientific features of this scheme, its computational feasability, and present preliminary results.

How to cite: Block, K.: A new droplet parameterization for ICON-AES physics, EGU General Assembly 2026, Vienna, Austria, 3–8 May 2026, EGU26-9487, https://doi.org/10.5194/egusphere-egu26-9487, 2026.

EGU26-9541 | Posters on site | AS3.7

Ensemble Modeling of Cloud Seeding with Multiple Microphysics Schemes 

Jiangshan Zhu

To quantify microphysics-related uncertainties in cloud seeding modeling, parameterizations of silver iodide ice nucleation were implemented as a standalone physics module in the Weather Research and Forecasting (WRF) model. The module is compatible with most bulk microphysics schemes, enabling ensemble cloud seeding simulations using multiple microphysics schemes. Twin ensemble forecast experiments—a control (unseeded) and a seeded ensemble—were conducted for a post-frontal stratiform snowfall event in central China. The control ensemble reproduced the observed precipitation pattern, while the seeded ensemble predicted predominantly positive precipitation enhancement over the target area.

Both ensembles employed multiple initial and lateral boundary conditions (IC/LBCs) and microphysics schemes to assess their respective contributions to uncertainties. For the control ensemble, IC/LBCs and microphysics schemes exerted comparable overall influences on the variability of supercooled liquid water and precipitation. IC/LBCs primarily affected the spatial distribution of precipitation, whereas microphysics schemes had a stronger influence on intensity. For the seeded ensemble, microphysics schemes dominated the uncertainty in cloud-seeding-induced changes in microphysical properties and precipitation. These results underscore the importance of incorporating multiple microphysics schemes in ensemble cloud seeding modeling to robustly represent uncertainty.

How to cite: Zhu, J.: Ensemble Modeling of Cloud Seeding with Multiple Microphysics Schemes, EGU General Assembly 2026, Vienna, Austria, 3–8 May 2026, EGU26-9541, https://doi.org/10.5194/egusphere-egu26-9541, 2026.

EGU26-9881 | ECS | Posters on site | AS3.7

EarthCARE Reveals Rain as Dominant Factor in Closed-to-Open Cell Transitions in Marine Stratocumulus 

Johanna Mayer, Blanka Piskala Gvozdikova, Edward Malina, Daniele Gasbarra, and Shannon Mason

Marine stratocumulus clouds play a pivotal role in Earth’s climate system, reflecting much of the incoming solar radiation back to space. One important aspect of stratocumulus clouds is their mesoscale organization, e.g. closed or open cell structures. A transition from closed to open cells usually leads to a drop in cloud albedo and consequently the clouds’ cooling effect. It is therefore important to understand when and why transitions between these cloud structures happen.

The EarthCARE satellite enables for the first time simultaneous spaceborne measurement of cloud mesoscale structure, and detailed observations below cloud top. EarthCARE’s active sensors (ATLID and CPR) can resolve the vertical profiles of marine stratocumulus, overcoming previous CloudSat limitations caused by ground clutter, and allow observations of microphysics, such as precipitation, liquid water content and droplet size. The multi-spectral imager (MSI) adds spatial context, capturing the mesoscale structure of clouds.

We use a convolutional neural network (CNN) with MSI data to identify cloud structures and analyze their microphysics using EarthCARE’s active sensors. Initial analysis shows open and closed cells have similar vertical extents and surface coupling, but open cells produce heavier and more frequent rain.

To understand the drivers for transitions from closed to open cells, we use data from the geostationary GOES-19 satellite and ERA5 wind trajectories to track the clouds measured by EarthCARE over time. This enables us to determine whether clouds observed by EarthCARE will transition to a different structure, and the timing of this transition. Combining this information with EarthCARE, we present how microphysics changes around transitions from closed to open cells. Our findings suggest that these transitions are mainly driven by rain: before transitioning, closed cells show increased rain but no significant changes in other cloud properties, like cloud top height or surface decoupling.

This study offers important insights into the cloud processes responsible for transitions between different cloud structures. A comprehensive understanding of these mechanisms is essential for assessing how the cooling effects of clouds may change in response to our changing climate.

How to cite: Mayer, J., Piskala Gvozdikova, B., Malina, E., Gasbarra, D., and Mason, S.: EarthCARE Reveals Rain as Dominant Factor in Closed-to-Open Cell Transitions in Marine Stratocumulus, EGU General Assembly 2026, Vienna, Austria, 3–8 May 2026, EGU26-9881, https://doi.org/10.5194/egusphere-egu26-9881, 2026.

EGU26-10052 | Orals | AS3.7

Observational constraints on aerosol–cloud interactions in liquid clouds from geostationary satellite observations. 

Marta Luffarelli, Analy Baltodano Martinez, Nicolas Misk, Michael Schulz, Ove Haugvalstad, and Michael Eisinger

Aerosol–cloud interactions (ACI) remain a major source of uncertainty in understanding the cloud microphysical and macrophysical responses to aerosol perturbations, with important implications for cloud evolution and climate processes. Within the Satellite observations to improve our understanding of aerosol-cloud interactions (SATACI) framework, we exploit synergistic satellite observations to derive robust observational constraints on aerosol effects on liquid clouds.

This study focuses on using high-frequency geostationary observations, relying on the heritage of the ESA aerosol and cloud CCI projects. Aerosol and cloud properties are collocated at the pixel level and harmonized in space and time to characterize aerosol loading, cloud droplet number concentration (CDNC), cloud fraction (CF), and cloud phase under controlled meteorological stratifications. The geostationary perspective enables systematic investigation of temporal offsets between aerosol and cloud observations, allowing assessment of time-lagged aerosol–cloud responses that are not accessible from polar-orbiting sensors alone.

We quantify CDNC and CF sensitivities to aerosol perturbations using large-sample, stratified analyses that explicitly account for spatial aggregation, aerosol loading regimes, surface type, and temporal co-variability. Aerosol loading is analysed using stepwise binning approaches to separate distinct loading regimes and to identify changes in aerosol–cloud sensitivities that are not well represented by a single linear relationship. Separate analyses over land and ocean reveal distinct sensitivity patterns in both magnitude and variability, highlighting the non-uniform nature of ACI across environments. The robustness of derived sensitivities is assessed across multiple aerosol proxies and independent cloud datasets, and uncertainty information is propagated throughout the analysis to support quantitative interpretation.

Additional stratifications are used to assess the influence of environmental factors such as relative humidity and precipitation occurrence on inferred ACI metrics. Comparisons with climate model simulations from NorESM, performed under matched spatial and temporal stratifications, provide a consistency check on observed aerosol–cloud sensitivities and support interpretation of the observational diagnostics.

The analysis underscores the importance of high-frequency observations, regime-aware stratification, and uncertainty-aware methodologies for constraining aerosol effects on liquid clouds. By providing statistically robust, observation-based diagnostics of aerosol–cloud interactions, SATACI contributes to the efforts of the ACI cluster (involving CERTAINTY, CleanCloud and AirSense) to improve process understanding and reduce observational uncertainty in aerosol–cloud studies.


How to cite: Luffarelli, M., Baltodano Martinez, A., Misk, N., Schulz, M., Haugvalstad, O., and Eisinger, M.: Observational constraints on aerosol–cloud interactions in liquid clouds from geostationary satellite observations., EGU General Assembly 2026, Vienna, Austria, 3–8 May 2026, EGU26-10052, https://doi.org/10.5194/egusphere-egu26-10052, 2026.

EGU26-10079 | Orals | AS3.7

Strong increases in cloud water path and cloud fraction downwind of anthropogenic aerosol hotspots 

Velle Toll, Hannes Keernik, Timo Virtanen, Andres Luhamaa, Noora Hyttinen, Margit Aun, Harri Kokkola, and Antti Arola

The impact of anthropogenic aerosols on clouds remains the most uncertain driver of climate change, largely owing to the noise induced by the meteorological covariability between aerosols and clouds. Natural experiments of aerosol-cloud interactions at anthropogenic aerosol hot spots have recently emerged as a great possibility to overcome the noise of meteorological covariability and to quantify causal impacts of aerosols on clouds. Here, we present observational evidence for increases in cloud water path and coverage downwind of anthropogenic aerosol hot spots. Analysis of the temporal evolution of properties of liquid-water clouds in MODIS satellite data reveals gradual increases in cloud water path and coverage in response to increased cloud droplet numbers in precipitating cloud decks. 

Importantly, we also identify a near-instantaneous decrease in cloud water path, which seems to be unphysical and is likely explained by satellite retrieval error. Such a satellite retrieval error has previously likely led to an underestimation of the average increase in cloud water path in response to aerosols and the associated climate cooling effect (e.g. in Toll et al 2019 Nature https://doi.org/10.1038/s41586-019-1423-9). Additionally, we find a stronger decrease in cloud water path downwind of industrial aerosol sources when liquid-water clouds are supercooled below -10 °C, suggesting a potential influence of ice-nucleating particles, consistent with recently discovered glaciation events at anthropogenic aerosol hot spots (Toll et al 2024 Science https://doi.org/10.1126/science.adl0303).

How to cite: Toll, V., Keernik, H., Virtanen, T., Luhamaa, A., Hyttinen, N., Aun, M., Kokkola, H., and Arola, A.: Strong increases in cloud water path and cloud fraction downwind of anthropogenic aerosol hotspots, EGU General Assembly 2026, Vienna, Austria, 3–8 May 2026, EGU26-10079, https://doi.org/10.5194/egusphere-egu26-10079, 2026.

EGU26-10331 | Posters on site | AS3.7

CloudTracker Observatory: analysing a large number of aerosol-polluted cloud tracks in the AWS compute cloud 

Hannes Keernik, Andres Luhamaa, Margit Aun, and Velle Toll

One of the biggest challenges in working with satellite data is the vast volume of data. It makes downloading larger chunks slow, and keeping a local copy for infrequent analysis is often impractical. This is a well-known issue, and several institutions are creating cloud-based solutions. In addition to moving data to the cloud, new file formats and processing tools are emerging. However, there are data which are stored in the cloud in non-cloud-friendly file formats. For example, MODIS cloud optical properties are stored in HDF4 file format in the AWS cloud, but effective software tools for processing such data in the compute cloud are limited.

In this presentation, we discuss planned workflows within CloudTracker Observatory for efficient processing of MODIS data in HDF4 format in the AWS cloud. We use detection and analysis of ship-track-like aerosol-polluted cloud tracks (Toll et al 2019 Nature https://doi.org/10.1038/s41586-019-1423-9) as the main use case. We study both strong visible tracks and weak tracks invisible to the naked eye in the satellite images. We analyse existing software tools and how they could be improved, together with available architectural options in the AWS compute cloud. The Observatory is planned within an ERC-funded project CloudTracker - Tracking Polluted Clouds: the Plausibility of a Strong Aerosol Cooling Effect on Earth’s Climate. Shared cloud-based workflows close to the used satellite data that can be easily extended by any interested research group are likely to foster international collaboration.

How to cite: Keernik, H., Luhamaa, A., Aun, M., and Toll, V.: CloudTracker Observatory: analysing a large number of aerosol-polluted cloud tracks in the AWS compute cloud, EGU General Assembly 2026, Vienna, Austria, 3–8 May 2026, EGU26-10331, https://doi.org/10.5194/egusphere-egu26-10331, 2026.

EGU26-10359 | ECS | Orals | AS3.7

Do 1D and 3D radiative transfer estimates of aerosol direct radiative effects differ? A sensitivity study using realistic cloudy EarthCARE scenes 

Kyriakoula Papachristopoulou, Alexandra Tsekeri, Dimitra Kouklaki, Anna Gialitaki, Claudia Emde, Bernard Mayer, Howard W. Barker, Jason N.S. Cole, Zhipeng Qu, Meriem Kacimi, Vassilis Amiridis, Eleni Marinou, and Stelios Kazadzis

Aerosols and clouds play key roles in climate through their direct radiative effects (DREs) by modulating the Earth-atmosphere radiative energy budget. Satellite-based retrievals of DREs are essential for quantifying Earth’s radiative energy budget. They are, however, subject to much uncertainty due to difficulties in characterizing the spatiotemporal variability of aerosols and clouds and their optical properties. In addition, DRE quantification relies predominantly on one-dimensional (1D) radiative transfer (RT) simulations. According to Cole et al. (2023), differences between 1D and three-dimensional (3D) RT calculations of upwelling shortwave fluxes at 20 km altitude are expected to exceed EarthCARE’s scientific goal (differences between predicted and “observed” fluxes of less than ±10 W m⁻²) in at least 50% of cases. While several studies have quantified differences in cloud DREs between 1D and 3D RT simulations, to our knowledge no such studies exist for aerosol DREs.

The EarthCARE (EC) mission aims to improve our understanding of how aerosols and clouds modify radiative fluxes by providing collocated observations of aerosols, clouds, precipitation, and radiation, enabling a three-dimensional representation of the atmosphere. In this study, we use these novel datasets to quantify differences in aerosol shortwave DREs between 1D and 3D RT simulations under clear- and cloudy-sky conditions. Aerosol DREs are calculated using1D and 3D RT solvers from the libRadtran package (Mayer & Kylling, 2005; Emde et al., 2016; Mayer 2009) for selected scenes from pre-operational EC test frames. The scenes are chosen to represent a range of aerosol types and cloud conditions. The sensitivity of the 3D effect (defined as the difference between 3D and 1D calculations of the DRE) is investigated as a function of aerosol optical depth and solar zenith angle. To assess the influence of the relative vertical positioning of aerosols and clouds on 3D effects, artificial aerosol layers placed above and below cloud layers are examined.  Overall, our analysis provides insights into how more realistic 3D representations of atmospheric constituents can improve understanding of the role of aerosols in modifying Earth’s radiative energy fluxes.  


Acknowledgements:

This research was financially supported by the CERTAINTY (Cloud aERosol inTeractions & their impActs IN The earth sYstem ) project funded from Horizon Europe programme under Grant Agreement No 101137680, the project RACE-ECV, (SBFI-633.4-2021-2024/PMOD - EarthCARE 202/2) supported by SBFI (State Secretariat of Research and Innovation Switzerland),  and the Obs3RvE (Optimising 3D RT EarthCARE product using geostationary observations and AI) project, funded from the European Space Agency under Contract No. 4000147848/25/I/AG. We would like also to acknowledge the COST Action HARMONIA, CA21119.


References:

Cole, J. N. S. et al, (2023) Broadband radiative quantities for the EarthCARE mission: the ACM-COM and ACM-RT products, Atmos. Meas. Tech., 16, 4271–4288.

Emde, C. et al, (2016) The libRadtran software package for radiative transfer calculations (version 2.0.1), Geoscientific Model Development, 9(5), 1647–1672.

Mayer, B., A. Kylling, (2005) Technical note: The libRadtran software package for radiative transfer calculations - description and examples of use. Atmos. Chem. Phys., 5(7), 1855–1877.

Mayer, B. (2009) Radiative transfer in the cloudy atmosphere, in: EPJ Web of Conferences, 75–99.

How to cite: Papachristopoulou, K., Tsekeri, A., Kouklaki, D., Gialitaki, A., Emde, C., Mayer, B., Barker, H. W., Cole, J. N. S., Qu, Z., Kacimi, M., Amiridis, V., Marinou, E., and Kazadzis, S.: Do 1D and 3D radiative transfer estimates of aerosol direct radiative effects differ? A sensitivity study using realistic cloudy EarthCARE scenes, EGU General Assembly 2026, Vienna, Austria, 3–8 May 2026, EGU26-10359, https://doi.org/10.5194/egusphere-egu26-10359, 2026.

Understanding Aerosol-Cloud Interactions (ACI) is today at the heart of our ability to accurately model the current and future states of Earth’s climate. High levels of aerosols lead to bright clouds with high albedo, effectively enhancing the overall cooling radiative forcing of aerosols up to –1.3 W.m⁻², rivalling the warming radiative forcing from greenhouse gases (+3.2 W.m⁻²) according to IPCC (2023). These interactions could be altered in unforeseen ways by changes in the global aerosol mix, either human-made or natural, with unforeseen consequences for climate. Improving our understanding of ACI is also the key to more accurate short-term weather predictions and severe weather alerts, such as hurricane events. Today, there is still no consensus on how aerosols radiative and microphysical effects impact the variations in precipitations, intensity, and structure of tropical cyclones. A good understanding of the properties and concentrations of aerosols that act as cloud condensation nuclei (CCN) and ice nucleating particles (INP) is required to better model and predict those extreme events. 

We will present our investigation of ACIs in a case study: the intense tropical cyclone Humberto (category 5 at maximum intensity) that occurred in September 2025 in the Atlantic Ocean. During its cyclogenesis and intensification period, a layer of Saharan dust aerosols was transported to the cyclone, representing a meteorological system where multiple and specific ACIs occur. The study is based on vertically-resolved optical measurements from the ATLID space lidar aboard the ESA-JAXA satellite EarthCARE, from which the nature and properties of cloud-relevant particles are retrieved. The POLIPHON method is applied to estimate CCN and INP concentrations from level 2 lidar products as a function of aerosol subtypes and relative humidity of the atmosphere. In parallel, we will show results from the simulation of the Humberto cyclone using the Meso-NH mesoscale atmospheric model, which numerically integrates the chemical and microphysical processes of aerosols. With a horizontal resolution of the simulation below 5 km, the model explicitly resolves atmospheric dynamics such as convection. By combining observations with modeling, we will describe how interactions between clouds and aerosols affect the lifetime and properties of the Humberto cyclone, which interacts mainly with Saharan dust and marine aerosols. 

How to cite: Fourmi, G. and Noël, V.: Investigation of aerosol-cloud interactions during Hurricane Humberto: a case study with EarthCARE ATLID data and MesoNH simulations., EGU General Assembly 2026, Vienna, Austria, 3–8 May 2026, EGU26-10953, https://doi.org/10.5194/egusphere-egu26-10953, 2026.

EGU26-10969 | ECS | Posters on site | AS3.7

Towards the Emulation of Aerosol Effects in Convective Precipitation in a General Circulation Model 

Felix Dehnen and Corinna Hoose

While aerosol-cloud interactions (ACI) are represented with a high degree of detail in small-scale high-resolution models (high-res), they are not taken into account in the parameterization of convection, which means that there is no representation of the aerosol load in e.g. the Tiedtke-Bechtold convection scheme. The aim of this study is to use the results of high-res experiments as input data for the training of an emulator predicting the ACI under different environmental conditions. This emulator will be embedded in the convection parameterization of the ICON model configured as general circulation model (GCM).
We will present the creation of the training data set as well as the emulator itself. The training data set consists of 206 experiments in the high-res setting of ICON (300 m grid spacing, torus grid, two-moment cloud scheme, 3D turbulence). An adaptation of idealized Weisman-Klemp profiles representing the environmental conditions of convective cells in several GCM experiments was used as input data, combined with perturbations in various input variables. The emulator is trained on the CCN-sensitivity for precipitation. In order to calculate these sensitivities, every experiment is run twice: once with a specific amount of aerosol and a second time with half the amount of aerosols. The training inputs are derived features like CAPE, relative humidity and mean updraft speed, which can also be extracted from the GCM setting later on. As validation we will present R2 scores, RMSE and SHAP values. Due to the high variability of the investigated convective systems, the sensitivities to CCN, which contributes only to a small part of the total variability, is very hard to predict and varies a lot – even under very similar environmental conditions. Therefore, a positive correlation of R2 ~ 0.4 (depending on the configuration) is seen as a success.
A first version of the emulator embedded in the convective scheme of the GCM will also be presented.

How to cite: Dehnen, F. and Hoose, C.: Towards the Emulation of Aerosol Effects in Convective Precipitation in a General Circulation Model, EGU General Assembly 2026, Vienna, Austria, 3–8 May 2026, EGU26-10969, https://doi.org/10.5194/egusphere-egu26-10969, 2026.

EGU26-11162 | Posters on site | AS3.7

Trends and sensitivities of low-cloud cover and top height from CALIPSO observations 

Hendrik Andersen, Matthias Tesche, Tom Goren, and Goutam Choudhury

In this contribution, we analyze 14 years of global spaceborne lidar observations for trends in the occurrence of low-level clouds and their cloud-top height, and derive their sensitivities to controlling factors.

Low clouds play an important role in the Earth's energy budget because of their capability of reflecting large amounts of incoming sunlight. However, there is some ambiguity in the detection of low-level clouds in satellite observations which are mostly performed with passive sensors. Only active remote sensing with spaceborne lidar or radar can provide direct measurements of cloud-top height and, thus, lead to straightforward detection of low-level clouds. Here, we analyze 14 years of spaceborne lidar observations for trends in the occurrence of low-level clouds and their cloud-top height. We find that spatial trend patterns in low-level cloud cover and low-level cloud top height are negatively correlated, i.e., regions with a decrease in low-cloud cover tend to show an increase in cloud-top height. We find that spatial trend patterns of both parameters can be well explained by sea-surface temperature and estimated inversion strength trends. Low-level clouds in climatological stratocumulus regions are particularly sensitive to changes in sea-surface temperature (-3.4 to -3.7% K-1 in cloud cover and 48.8-52.3mK-1 in cloud-top height) and estimated inversion strength (3.3%K-1 in cloud cover and from -69.3 to -69.6mK-1 in cloud-top height).

How to cite: Andersen, H., Tesche, M., Goren, T., and Choudhury, G.: Trends and sensitivities of low-cloud cover and top height from CALIPSO observations, EGU General Assembly 2026, Vienna, Austria, 3–8 May 2026, EGU26-11162, https://doi.org/10.5194/egusphere-egu26-11162, 2026.

EGU26-11879 | ECS | Posters on site | AS3.7

Evaluating LES models across aerosol- and updraft-limited susceptibility regimes  

Irene Elisa Bellagente, Ilona Riipinen, Paul Zieger, Liine Heikkinen, Sara Blichner, Annica M. L. Ekman, Lea Haberstock, Julia Kojoj, Stefano Decesari, and Olivier Magand

Aerosols play an important role in cloud formation, radiative forcing and precipitation formation. However, the representation of aerosol-cloud interactions in climate models still causes one of the largest uncertainties in future climate projections. Large Eddy Simulation (LES) models have become useful tools for bridging our understanding of small-scale processes with parametrization development for Earth System Models (ESMs). Previous studies have exposed substantial inter-model variability in reproducing the susceptibility of cloud droplet number concentrations (CDNC) to cloud condensation nuclei (CCN) concentrations across aerosol- and updraft-limited regimes. Our work will ultimately contribute to the development of ESMs for reliable future projections under scenarios of changing aerosol emissions. We present preliminary results from the evaluation of LES model output against in-situ observations of aerosol and clouds microphysics and chemistry, from observation sites representing different ranges within the aerosol- and updraft-limited susceptibility regimes. To develop new process-based constraints for LES models, we will utilize data collected during the ARTofMELT expedition in the Arctic, the FAIRARI campaign in the Po Valley and the NOMODODO campaign at the Maïdo Observatory in La Réunion. The diverse settings of the observations give the chance of investigating case studies with varying aerosol loadings and land-atmosphere interactions. As we are interested in cloud susceptibility regimes and aerosol indirect effects on clouds, we mainly focus on liquid-phase processes. We analyze liquid water content, CDNC, CCN concentrations, and aerosol chemical composition. We also examine the shape of the aerosol and cloud droplet size distributions. This study serves as a benchmark to build more consistent representations of aerosol-cloud interactions in numerical models. Our results will be used to inform further research on the sensitivity of cloud properties to aerosol and cloud microphysical processes.

How to cite: Bellagente, I. E., Riipinen, I., Zieger, P., Heikkinen, L., Blichner, S., Ekman, A. M. L., Haberstock, L., Kojoj, J., Decesari, S., and Magand, O.: Evaluating LES models across aerosol- and updraft-limited susceptibility regimes , EGU General Assembly 2026, Vienna, Austria, 3–8 May 2026, EGU26-11879, https://doi.org/10.5194/egusphere-egu26-11879, 2026.

EGU26-12095 | ECS | Posters on site | AS3.7

From Fossil to Clean: Aerosol–Cloud Radiative Forcing in Transition 

Roxana Cremer and Ina Tegen

Aerosol–cloud interactions (ACI) remain a major source of uncertainty in climate projections. Within the CleanCloud Project, we quantify present-day ACI radiative forcing and its evolution toward a post-fossil energy regime, including associated variability and rapid adjustments. Using improved Earth System Models (EC-Earth and ICON-HAM), updated with refined parameterizations for mineral dust emissions, wildfire smoke, and Arctic marine aerosols, we perform 30-year fixed-SST simulations to assess the radiative impacts of both anthropogenic and natural aerosol sources. Our results provide key insights into the role of ACI in climate feedbacks and establish a baseline for near-term projections of high-impact weather events, improving the reliability of climate model predictions under changing emission scenarios.

How to cite: Cremer, R. and Tegen, I.: From Fossil to Clean: Aerosol–Cloud Radiative Forcing in Transition, EGU General Assembly 2026, Vienna, Austria, 3–8 May 2026, EGU26-12095, https://doi.org/10.5194/egusphere-egu26-12095, 2026.

EGU26-12128 | Orals | AS3.7

Exploiting visible reflectances for estimating cloud parameters and aerosols 

Tobias Necker, Samuel Quesada Ruiz, Cristina Lupu, Volkan Firat, and Angela Benedetti

Clouds and aerosols remain major sources of uncertainty in numerical weather prediction and climate applications. Reducing these uncertainties requires better observational constraints on key state variables. Visible satellite observations contain rich information on cloud and aerosol properties, yet they are still only marginally exploited in data assimilation systems due to complex and expensive radiative transfer simulations. This study explores the potential of visible reflectances to estimate and constrain cloud and aerosol parameters within the Integrated Forecasting System (IFS) using direct all-sky assimilation in a 4D-Var framework. We demonstrate the assimilation of visible imager observations from various satellite platforms. For clouds, the approach is close to operational readiness. For aerosols, we conducted a proof-of-concept study directly assimilating visible reflectances in cloud-cleared scenes within the IFS-COMPO configuration. We evaluate the impact of visible assimilation on cloud liquid water and ice, as well as on thermodynamic fields. The experiments indicate an improved fit of analyses and short-range forecasts to observed reflectances, several-percent changes in cloud water and ice path, and measurable impacts on temperature and humidity. A case studies of low-level maritime stratus highlight that visible observations can effectively constrain low-level clouds and correct model biases where information from other satellite observations is sparse. The analysis and forecast departures in reflectance space further reveal systematic model biases, offering diagnostic insight into deficiencies in current cloud and aerosol representations. These results represent one of the first demonstrations of direct visible reflectance assimilation in a global 4D-Var system for both clouds and aerosols. At this stage, clouds and aerosols are treated separately, providing an initial step toward broader exploitation of visible observations. Beyond forecasting, the approach offers strong potential for future reanalysis by improving the consistency and realism of long-term cloud records.

How to cite: Necker, T., Quesada Ruiz, S., Lupu, C., Firat, V., and Benedetti, A.: Exploiting visible reflectances for estimating cloud parameters and aerosols, EGU General Assembly 2026, Vienna, Austria, 3–8 May 2026, EGU26-12128, https://doi.org/10.5194/egusphere-egu26-12128, 2026.

EGU26-12130 | Posters on site | AS3.7

The quantification of large-scale cloud radiative effects across the Atlantic ITCZ 

Anna Luebke, André Ehrlich, Sophie Rosenburg, and Manfred Wendisch

The clouds of the Intertropical Convergence Zone (ITCZ), particularly deep convective clouds, play a pivotal role in the atmospheric circulation of energy and moisture as well as associated feedback processes. The Persistent EarthCARE underflight studies of the ITCZ and organized convection (PERCUSION) airborne campaign in 2024 sought to investigate the organization of convection in the ITCZ region across the Atlantic Ocean. The flight strategy of PERCUSION enabled the characterization of the cloud field across the northern and southern boundaries of the ITCZ as well as the eastern and western ends of the Atlantic basin, each of which is distinct in its aerosol and dynamic conditions.

The asymmetric and dynamic structure of the ITCZ implies differences in cloudiness and cloud properties at the northern and southern boundaries of the ITCZ. To assess the impacts that these differences have on the radiative energy budget of the Tropics, we provide a statistical characterization of the radiative effects (CRE) of these clouds. Airborne irradiance observations at flight altitude from the Broadband AirCrAft RaDiometer Instrumentation (BACARDI) on the research aircraft HALO are used to calculate the CRE, which is separated into its solar and thermal infrared components. To assess the representativeness of the airborne observations, satellite observations (e.g. GOES, EarthCARE) and reanalysis data from the same period and beyond will be used.

Additionally, the synergy of these datasets allows for the characterization of the CRE drivers, e.g. macro- or microphysical cloud properties. Observations during the 2020 Elucidating the Role of Cloud-Circulation Coupling and Climate (EUREC4A) campaign already demonstrated that the macrophysical properties of shallow cumulus clouds were the main driver of the solar and thermal-infrared CRE when cloud fractions were low, while microphysical properties became more relevant at higher cloud fractions. The PERCUSION campaign provides the opportunity to extend these results to deeper convection and more complex cloud systems.

How to cite: Luebke, A., Ehrlich, A., Rosenburg, S., and Wendisch, M.: The quantification of large-scale cloud radiative effects across the Atlantic ITCZ, EGU General Assembly 2026, Vienna, Austria, 3–8 May 2026, EGU26-12130, https://doi.org/10.5194/egusphere-egu26-12130, 2026.

EGU26-12328 | ECS | Orals | AS3.7

Isolating aerosol impacts on cloud properties and the surface radiative budget during an extreme Arctic warm air mass intrusion 

Ruth Price, Louis Marelle, Lucas Bastien, Rémy Lapere, Julia Schmale, Benjamin Heutte, and Jennie Thomas

Arctic warm air mass intrusions, events characterised by the transport of strong heat and moisture anomalies from the mid-latitudes into the Arctic, have received increasing attention in recent years because of their pronounced impacts on the Arctic regional climate. However, the influence of anthropogenic aerosols transported within these intrusions on cloud properties and the Arctic radiative budget remains poorly constrained. In this study, we investigate a well-characterised warm air mass intrusion with exceptionally high aerosol loading observed during the MOSAiC expedition in spring 2020. Using the WRF-Chem-Polar model, we simulate the April 2020 event both with and without the observed anthropogenic aerosol transport, in order to isolate and quantify the aerosol impacts relative to those of the warm air mass itself.


We analyse the effects of the anthropogenic aerosols on simulated cloud microphysical and macrophysical properties, including cloud fraction, cloud droplet number concentration, droplet size, and cloud liquid water content, as well as the resulting cloud radiative effects at the surface. The presence of anthropogenic aerosols leads to enhanced cloud droplet formation within the plume, smaller droplet sizes, and suppressed precipitation. These changes produce a net surface cooling effect, most pronounced over dark, open ocean surfaces where shortwave radiative impacts dominate. Over ice-covered regions, however, the radiative response is substantially weaker, reflecting the high surface albedo and reduced sensitivity of the surface energy budget. We find that aerosol-driven longwave warming is small and generally offset by shortwave cooling. Furthermore, the aerosol-driven shortwave cooling associated with enhanced droplet numbers is spatially heterogeneous and confined to limited regions. The broader implications of these findings for the role of aerosol-cloud interactions in Arctic regional climate are discussed.

How to cite: Price, R., Marelle, L., Bastien, L., Lapere, R., Schmale, J., Heutte, B., and Thomas, J.: Isolating aerosol impacts on cloud properties and the surface radiative budget during an extreme Arctic warm air mass intrusion, EGU General Assembly 2026, Vienna, Austria, 3–8 May 2026, EGU26-12328, https://doi.org/10.5194/egusphere-egu26-12328, 2026.

EGU26-12731 | ECS | Posters on site | AS3.7

Regional modelling of aerosol-cloud interactions (ACI) in extreme precipitation events: the Emilia-Romagna May 2023 floods case study 

Ludovico Di Antonio, Louis Marelle, Silvio Davolio, Anastasiia Chyhareva, Giancarlo Ciarelli, Svitlana Krakovska, Rémy Lapere, Annalina Lombardi, Mario Montopoli, Larysa Pysarenko, Mykhailo Savenets, Guillaume Siour, Barbara Tomassetti, Paolo Tuccella, Harri Kokkola, Jennie Thomas, and Jean-Christophe Raut

Aerosol–cloud interactions (ACI) represent the main source of uncertainty in estimating global radiative forcing, and the processes driving these interactions are still poorly understood. This is particularly relevant in the context of extreme precipitation events, where ACI can have a decisive impact, especially over polluted regions. 

The Po Valley is one of the most polluted regions in Europe, due to its intense anthropogenic emissions combined with unique topography (flat terrain enclosed by the Alps and Apennines mountain chains), which promotes aerosol accumulation due to low dispersion capabilities.

In May 2023, Northern Italy experienced two extreme precipitation events, occurring in close succession, both characterized by exceptionally heavy precipitation exceeding 200 mm within 48 hours over the Apennines slopes. More than 21 rivers flooded in the Po Valley, causing over €8.5 billion in damages and widespread landslides and flooding, resulting in several deaths. The present work seeks to estimate the role of aerosols in this extreme precipitation event. 

In this study, we have performed high-resolution regional chemical transport model simulations with the WRF-CHIMERE model to evaluate the impact of ACI during the 2–3 May 2023 and 16–17 May 2023 precipitation events. Both events were characterized by strong water vapour advection from the southern Mediterranean, North Africa and the Adriatic Sea, increasing moisture availability over the region. Simulations including online ACI were conducted to assess the aerosol impact on precipitation. Precipitation patterns were then compared to rain gauges, radar, and satellite observations to accurately evaluate the simulated spatial variability and intensity during the events. Sensitivity tests reveal that ACI from anthropogenic emissions resulted in significant reductions in precipitation of up to 30–40 mm locally, and 10 mm regionally, accompanied by a temporal shift of the precipitation peak by approximately 3 hours.

This work demonstrates that aerosols can play an important role in extreme precipitation events, and need to be taken into account to better forecast the intensity and timing of such events.

Keywords: aerosol-cloud interactions, anthropogenic aerosols, regional modelling

How to cite: Di Antonio, L., Marelle, L., Davolio, S., Chyhareva, A., Ciarelli, G., Krakovska, S., Lapere, R., Lombardi, A., Montopoli, M., Pysarenko, L., Savenets, M., Siour, G., Tomassetti, B., Tuccella, P., Kokkola, H., Thomas, J., and Raut, J.-C.: Regional modelling of aerosol-cloud interactions (ACI) in extreme precipitation events: the Emilia-Romagna May 2023 floods case study, EGU General Assembly 2026, Vienna, Austria, 3–8 May 2026, EGU26-12731, https://doi.org/10.5194/egusphere-egu26-12731, 2026.

EGU26-12941 | ECS | Posters on site | AS3.7

Understanding aerosol–cloud interactions in tropical anvil clouds with cloud-resolving simulations 

Ci Song, Casey Wall, Blaž Gasparini, and Nicholas Lutsko

Anvil clouds form when ice particles detrained from deep convective updrafts spread horizontally near the tropopause, covering areas far larger than their parent convective cores and thereby strongly influencing the tropical cloud radiative effect. Atmospheric aerosol particles can modify anvil cloud development through their impacts on cloud microphysical and macrophysical processes and associated latent and radiative heating. As a result, aerosol effects on anvil clouds may have important implications for Earth’s radiation budget and radiative forcing. However, quantifying aerosol effects on anvil clouds remains challenging due to limited understanding of the processes that control anvil cloud extent.

Here, we use a cloud-resolving System for Atmospheric Modeling (SAM) to investigate how aerosol perturbations affect anvil cloud evolution. A series of warm-bubble–triggered isolated convection simulations is performed to capture the full life cycle of anvil clouds. Aerosol perturbations are represented through prescribed cloud droplet number concentrations, following the RCEMIP aerosol–cloud interaction protocol (Dagan et al., 2025). To quantify anvil evolution, we apply a passive tracer diagnostic that approximates cloud age after detrainment, enabling the examination of cloud properties as a function of time since convective origin (Gasparini et al., 2025). Our results provide new insight into how aerosol pollution influences anvil cloud evolution, persistence, and associated radiative effects, with implications for representing aerosol–cloud–radiation interactions in climate models.

How to cite: Song, C., Wall, C., Gasparini, B., and Lutsko, N.: Understanding aerosol–cloud interactions in tropical anvil clouds with cloud-resolving simulations, EGU General Assembly 2026, Vienna, Austria, 3–8 May 2026, EGU26-12941, https://doi.org/10.5194/egusphere-egu26-12941, 2026.

EGU26-13147 | ECS | Posters on site | AS3.7

Cloud microphysical properties over the Southern Ocean: First results from the HALO-South airborne campaign 

Deniz Menekay, Simon Kirschler, Christiane Voigt, Ziming Wang, Mira Pöhlker, Isabel Hanstein, Timo Kleinbek, Daniel Sauer, Elena De La Torre Castro, Tina Jurkat-Witschas, and Armin Afchine

Extensive cloud cover over the Southern Ocean is a key contributor to global cloud radiative forcing. The region hosts some of the most pristine clouds on Earth, as its air masses originate largely over the open ocean and Antarctica with minimal influence from continental emissions. This provides an opportunity to investigate aerosol–cloud interactions under near-preindustrial aerosol conditions. However, the scarcity of in-situ measurements in this region leads to a misrepresentation of the Southern Ocean cloud properties in climate models, resulting in biases of simulated shortwave radiation and near-surface temperatures. To address these points, the HALO-South airborne campaign was conducted in September and October 2025, based out of Christchurch, New Zealand. Using DLR’s High Altitude and Long Range Research Aircraft (HALO), 20 research flights were carried out over the Southern Ocean in the vicinity of New Zealand, extending into the Antarctic marginal sea ice zone. The campaign targeted a broad suite of cloud regimes, from boundary-layer clouds to multilayer mixed-phase systems and high-level cirrus clouds. In addition, the flights sampled clouds embedded in a variety of synoptic weather systems, including cold-air outbreaks and convective systems. Flights were planned in synergy with satellite overpasses and with support from weather prediction models to ensure coverage of representative conditions. Here, we present a statistical overview of over 20 hours of cloud dataset collected by underwing probes during the HALO-South campaign, including cloud microphysical properties such as particle number concentration, liquid and ice water content, and particle size distributions. This dataset enables a deeper understanding of aerosol–cloud interactions, mixed-phase processes, and cloud radiative effects in the Southern Ocean. It provides critical observational constraints for evaluating satellite retrievals, assessing weather and climate model performance, and informing model development aimed at reducing long-standing regional radiation biases. Comparisons with Northern Hemisphere field campaigns further highlight hemispheric contrasts in cloud–aerosol coupling, offering new opportunities to investigate how differing aerosol environments shape cloud properties and climate feedbacks.

How to cite: Menekay, D., Kirschler, S., Voigt, C., Wang, Z., Pöhlker, M., Hanstein, I., Kleinbek, T., Sauer, D., De La Torre Castro, E., Jurkat-Witschas, T., and Afchine, A.: Cloud microphysical properties over the Southern Ocean: First results from the HALO-South airborne campaign, EGU General Assembly 2026, Vienna, Austria, 3–8 May 2026, EGU26-13147, https://doi.org/10.5194/egusphere-egu26-13147, 2026.

EGU26-13184 | ECS | Orals | AS3.7

Anthropogenic aerosol effects on extreme precipitation in the tropics in ICON HAM-lite global km-scale simulations 

Ellen Berntell, Philipp Weiss, Frida Bender, and Thorsten Mauritsen

Natural and anthropogenic aerosols influence Earth’s climate through many different radiative and cloud microphysical processes; directly by scattering and absorbing radiation and indirectly by serving as cloud condensation and ice nuclei. They are thought to influence precipitation on global to local scale, but the mechanisms governing their effects and their relative importance remain highly uncertain, lowering the confidence in future projections on smaller scales. Understanding how aerosols affect extreme precipitation is especially important, given its potential large societal impacts, but while many Earth system models include complex aerosol-radiation-cloud processes and feedbacks, smaller scale processes are not explicitly resolved and instead parameterized. However, the newer generation of km-scale cloud-resolving Earth system models allow for these processes to be studied in much greater detail.

In this study we analyze results from 1-year global km-scale simulations run using ICON coupled to HAM-lite, a one-moment aerosol module derived from the two-moment module HAM. The simulations are run with prescribed pre-industrial and present-day aerosol emissions, allowing us to investigate the impacts of anthropogenic aerosols on extreme precipitation. Preliminary results indicate a strengthening of extreme precipitation rates in the tropics in the present-day simulation compared to the pre-industrial control, with regional differences that will be explored further to distinguish between large-scale dynamical changes and local convective changes.

How to cite: Berntell, E., Weiss, P., Bender, F., and Mauritsen, T.: Anthropogenic aerosol effects on extreme precipitation in the tropics in ICON HAM-lite global km-scale simulations, EGU General Assembly 2026, Vienna, Austria, 3–8 May 2026, EGU26-13184, https://doi.org/10.5194/egusphere-egu26-13184, 2026.

EGU26-13677 | ECS | Posters on site | AS3.7

Analyzing radiative effect of dust and its impact on energy budget and cloudiness over Cabo Verde 

Suelly Katiza Lopes Mendes Goncalves, Geet George, and Herman Russchenberg

Dust is a dominant aerosol type over Cabo Verde, sourced via long-range transport from Sahara and Sahel. Understanding the effects of the dust on surface energy balance, and thus temperature and precipitation has important implications for predicting the weather and climate in the region. Although such studies have been conducted over west Africa, their findings cannot be applied to Cabo Verde, where the meteorological regime is dominated by the Atlantic Ocean, with local effects of island topography and a distinct interaction between ITCZ migration and large-scale dust transport compared to that over continental Africa.  Here, we analyze how the interaction between dust and radiation influences the radiative energy at the Top of Atmosphere (TOA) and at the surface, and how it affects cloudiness over Cabo Verde from 2018 to 2022. The Aerosol Optical Depth (AOD) data are from a ground-based sunphotometer AERONET and from the spaceborne CERES instruments. Saharan dust loading peaks in the Summer. June shows the highest AOD values with monthly mean reaching 1.4. Direct radiative effect (DRE) and indirect radiative effect (IRE) are calculated from CERES CRS1deg-Hour Ed4A, which includes clear sky, pristine and all sky conditions. Results showed that DRE in all seasons presents a net cooling at surface and at the TOA. The IRE shows net cooling on the surface and warming at the TOA. We also investigate how dust events are associated with the mean temperature (reanalysis data), liquid water path, precipitable water and the cloud amount (all three datasets are from CERES and geostationary satellite) combined with the height at which the dust is present (vertical profiles from spaceborne lidar). Further research aims to understand the changes in precipitation over Cabo Verde associated with large-scale dust transport.

How to cite: Lopes Mendes Goncalves, S. K., George, G., and Russchenberg, H.: Analyzing radiative effect of dust and its impact on energy budget and cloudiness over Cabo Verde, EGU General Assembly 2026, Vienna, Austria, 3–8 May 2026, EGU26-13677, https://doi.org/10.5194/egusphere-egu26-13677, 2026.

EGU26-13798 | ECS | Orals | AS3.7

Structural inconsistency in cloud microphysics limits emergent constraints on aerosol-cloud radiative forcing 

Kunal Ghosh, Leighton A. Regayre, Lea M. C. Prévost, Jill S. Johnson, Jonathan Owen, Iain Webb, Jeremy Oakley, and Ken S. Carslaw

The magnitude of aerosol–cloud radiative forcing remains one of the dominant uncertainties in climate projections. Emergent constraints are increasingly used to reduce this uncertainty by linking observable cloud properties to modelled aerosol–cloud interactions. Their physical validity, however, depends critically on whether models reproduce the same cloud–aerosol coupling mechanisms as the real atmosphere. Here we show that current Earth system models exhibit a systematic structural inconsistency in cloud microphysics that undermines the physical interpretability of emergent constraints on aerosol–cloud radiative forcing (ΔFaci).

Using perturbed-parameter ensembles (PPEs) of UKESM1, we analyse observed and modelled relationships between cloud droplet number concentration (Nd), liquid water path (LWP), and aerosol perturbations across key marine stratocumulus regimes. We show that the Nd–LWP sensitivity, which controls how strongly clouds brighten in response to aerosol, varies by a factor of ∼4 across model parameterisations but is tightly constrained by observations. As a result, models that reproduce present-day mean cloud properties can require physically implausible Nd–LWP responses to generate their aerosol forcing, leading to equally plausible yet physically incompatible ΔFaci estimates.

This structural degeneracy implies that conventional emergent constraints targeting mean cloud states cannot uniquely constrain aerosol forcing. Instead, physically meaningful constraints must explicitly account for the microphysical response pathways linking aerosols, cloud water, and radiation. Our results reveal a previously under-recognised structural source of uncertainty in aerosol–cloud interactions and provide a new physically grounded diagnostic for evaluating and constraining modelled aerosol–cloud radiative forcing.

How to cite: Ghosh, K., Regayre, L. A., Prévost, L. M. C., Johnson, J. S., Owen, J., Webb, I., Oakley, J., and Carslaw, K. S.: Structural inconsistency in cloud microphysics limits emergent constraints on aerosol-cloud radiative forcing, EGU General Assembly 2026, Vienna, Austria, 3–8 May 2026, EGU26-13798, https://doi.org/10.5194/egusphere-egu26-13798, 2026.

EGU26-13818 | ECS | Orals | AS3.7

Towards an improved understanding of cloud microphysics via data-driven process-rate diagnostics 

Miriam Simm, Tom Beucler, and Corinna Hoose

Small-scale microphysical processes describe the interactions of cloud particles and the phase transitions of condensed water in the atmosphere. In numerical weather prediction and climate models, they are represented empirically by a parametrization scheme, which describes their impact on and coupling to the resolved scale. Incomplete process-level understanding of cloud microphysics contributes to the significant model uncertainties linked to the parameterization of sub-grid scale processes. However, progress in reducing these uncertainties is hindered by the lack of microphysical process rate data. Within the parameterization, microphysical process rates are computed at interim steps to update the prognostic cloud variables. Yet, despite their informative value, they are usually not included in the output of km-scale simulations due to resource limitations.

For this purpose, we developed PRecover (microphysical Process Rate recovery), a data-driven post-processing method to recover microphysical process rates in a two-moment microphysics scheme from high-resolution simulation output of the ICOsahedral Nonhydrostatic (ICON) model. Based on machine learning, PRecover emulates the computation of multiple warm-rain and ice microphysical process rates efficiently and flexibly, using a two-step classification-regression approach. Here, we use PRecover for a systematic evaluation of cloud microphysical processes. With a focus on instantaneous process rates, we demonstrate the functionality of PRecover. Additionally, we study the relevance of different microphysical processes and quantify their relative contribution to pathways of precipitation formation, e.g. the relative contributions of autoconversion and accretion to warm rain formation in different cloud regimes. In contrast to previous studies, which were often limited to idealized simulations, we are able to analyze the output of extensive high-resolution simulations in a regional and global configuration.

How to cite: Simm, M., Beucler, T., and Hoose, C.: Towards an improved understanding of cloud microphysics via data-driven process-rate diagnostics, EGU General Assembly 2026, Vienna, Austria, 3–8 May 2026, EGU26-13818, https://doi.org/10.5194/egusphere-egu26-13818, 2026.

Marine cold-air outbreaks (MCAO) strongly impact the radiative effects of clouds, playing a crucial role in the high-latitude climate system.  MCAO clouds initially begin as shallow stratiform cloud streets near the ice edge and evolve into broken cellular convection farther downstream. Although these clouds undergo substantial changes in both macro- and microphysical properties during their evolution, a comprehensive understanding of their relationship with cloud dynamics has been limited by observational constraints. The recent launch of the EarthCARE satellite on May 28, 2024, carrying the first-ever spaceborne Doppler radar (Cloud Profiling Radar, CPR), provides unprecedented opportunities to investigate vertical motion within clouds from
space. Here, we analyze the Lagrangian trajectories of cold air outbreaks since the time they leave the Arctic sea ice edge and observe MCAO clouds with the EarthCARE CPR as they form over the Norwegian and Barents Seas from December 2024 to May 2025 at 0.25 by 0.25 resolution.  We show that the CPR observations successfully capture the distinct developmental stages of MCAO clouds.  Notably, despite the inherent observational challenges from satellite platforms, we identify enhanced riming signatures associated with strong updrafts and abundant supercooled liquid water, which increases ice particle sedimentation velocities. Our results provide the first comprehensive view of the evolution of cloud structure, microphysical processes, and dynamic features in MCAO clouds over extended spatial and temporal scales. These insights advance our understanding of MCAO cloud processes and can inform future improvements in numerical climate models.

How to cite: Tan, I., Kim, J., Kollias, P., and Puigdomènech Treserras, B.: First-Light Observations from EarthCARE’s Cloud Profiling Radar Reveal Insights intoMicrophysics-Dynamics Coupling of Marine Cold-Air Outbreaks Clouds, EGU General Assembly 2026, Vienna, Austria, 3–8 May 2026, EGU26-13918, https://doi.org/10.5194/egusphere-egu26-13918, 2026.

EGU26-14149 | ECS | Orals | AS3.7

New aerosol and cloud satellite observations from PACE and EarthCARE consistently constrain model uncertainties 

Yusuf Bhatti, Leighton Regayre, Hailing Jia, Duncan Watson-Parris, Ulas Im, Nick Schutgens, Athanasios Nenes, Bastiaan van Diedenhoven, Ardit Arifi, Guangliang Fu, Xuemei Wang, Gerd-Jan van Zadelhoff, and Otto Hasekamp

NASA and ESA launched the PACE and Earthcare satellites in 2024 to provide unique aerosol and cloud measurements. We use these measurements to constrain model uncertainty on aerosol Effective Radiative Forcing (ERF). Perturbed Parameter Ensembles (PPEs) are extremely powerful tools that offer an effective approach to evaluate and constrain the model uncertainty of aerosol using observations.

We create a PPE for  July 2024-August 2025 based on 250 simulations by the aerosol -climate model ECHAM-HAM and co-locate the 3-hourly output with aerosol and cloud products from PACE and Earthcare. We define regional monthly mean observations for 19 regions of fine- and coarse Aerosol Optical Depth (AOD), Aerosol Index (AI), Single Scattering Albedo (SSA), cloud droplet number concentration (Nd), Cloud Effective Radius (CER), and fraction of extinction below 2km altitude, resulting in almost 1600 observations. An emulator is used to extend the PPE to simulate these observations to 2 million PPE members and constrain the PPE by applying least-squares minimization. resulting in 0.2% of accepted ensemble members.

Both PACE and EarthCARE independently and consistently constrain several model parameters that affect ERFaci and RFari. These observations fundamentally and consistently change where and how ERF uncertainty is controlled and alter the global spatial ERF distribution. The constrained ensemble indicates a stronger negative global aerosol ERF than previous mean estimates, alongside a more positive forcing over Central Africa. The observations suggest a reduction of emission of DMS, Organic, and Black Carbon (anthropogenic and biomass burning), and accumulation mode sea salt.  Also, the absorption capability (imaginary refractive index) of different aerosol species is reduced.  Cloud observations constrain ‘activation’ and ‘vertical velocity’ parameters, resulting in smaller aerosol-Nd susceptibility. However, some parameter uncertainties, such as biomass burning emission particle size, remain mostly unchanged. These results demonstrate that new satellite observations can robustly and consistently constrain aerosol ERF uncertainty, while also identifying key processes where additional or complementary observations are required.

How to cite: Bhatti, Y., Regayre, L., Jia, H., Watson-Parris, D., Im, U., Schutgens, N., Nenes, A., van Diedenhoven, B., Arifi, A., Fu, G., Wang, X., van Zadelhoff, G.-J., and Hasekamp, O.: New aerosol and cloud satellite observations from PACE and EarthCARE consistently constrain model uncertainties, EGU General Assembly 2026, Vienna, Austria, 3–8 May 2026, EGU26-14149, https://doi.org/10.5194/egusphere-egu26-14149, 2026.

EGU26-14180 | ECS | Posters on site | AS3.7

From Atmosphere to River Catchment: Modeled Global River Runoff Responses to Anthropogenic Aerosol Forcing 

Nelly Pomnitz and Johannes Quaas

Changes in atmospheric aerosol concentrations have the potential to reorganize global precipitation patterns, yet the downstream implications for river systems are not fully understood. This study examines the sensitivity of global river runoff and discharge to anthropogenic aerosol forcing, asking how hydrological regimes differ in an atmosphere with reduced aerosol burdens compared to historical conditions.

We analyze multi-model simulations from the CMIP6 Detection and Attribution Model Intercomparison Project (DAMIP). The analysis focuses on the 1950–1980 era, a period of substantial aerosol emissions, to maximize the potential detection of aerosol-driven hydrological changes. Total runoff outputs from simulations, including and excluding anthropogenic aerosols, are used to force the TRIPpy river-routing model. This offline routing approach allows for a spatially consistent assessment of discharge variability across major global river basins, independent of the coarse resolution of GCM native routing.

We present the study design and preliminary insights into the spatial heterogeneity of aerosol impacts. By isolating the aerosol signature in river discharge, this research contributes to a more integrated understanding of the interplay of aerosol, climate, and hydrology. 

How to cite: Pomnitz, N. and Quaas, J.: From Atmosphere to River Catchment: Modeled Global River Runoff Responses to Anthropogenic Aerosol Forcing, EGU General Assembly 2026, Vienna, Austria, 3–8 May 2026, EGU26-14180, https://doi.org/10.5194/egusphere-egu26-14180, 2026.

EGU26-14543 | Orals | AS3.7

Latent Heat Release Drives the Vertical Evolution of Seeded Ice Plumes in Supercooled Stratus Clouds 

Chia Rui Ong, Huiying Zhang, Anurag Dipankar, Ulrike Lohmann, and Jan Henneberger

The interactions among aerosol perturbations, cloud droplet freezing, and atmospheric dynamics are a critical source of uncertainty in our understanding of mixed-phase clouds. In the context of glaciogenic cloud seeding, for example, it is unclear whether the vertical transport of newly nucleated ice crystals is passively controlled by pre-existing turbulent flow or actively controlled by latent heat release associated with ice crystal growth. To address this question, we present a comprehensive analysis that bridges the gap between Eulerian field observations and Lagrangian process understanding. We use high-resolution large-eddy simulations coupled with the habit-resolving bin microphysics scheme SCALE-AMPS. These simulations are constrained by in situ measurements from a targeted seeding experiment in supercooled stratus during the CLOUDLAB campaign in Switzerland.

Our sensitivity analysis, which systematically varies the vertical wind conditions at the time of seeding, reveals a fundamental decoupling between the initial vertical wind speed and long-term plume evolution. Although the ambient vertical velocity determines the trajectory of the ice plume during the initial minutes, we identify a "crossover point" at which latent heat release begins to dominate. The growth of the seeded crystals through vigorous vapor deposition releases substantial latent heat, generating a localized buoyancy flux. This thermal perturbation is strong enough to terminate and eventually reverse the descent of plumes that form in downdrafts. Plumes seeded into updrafts rise rapidly, yet they are stopped vertically as they reach the cloud-top inversion layer. Conversely, plumes initiated in downdrafts undergo a delayed, buoyancy-driven ascent, resulting in a deeper vertical spread and enhanced mixing. Although downdraft plumes temporarily lose liquid water when approaching the drier cloud base, they recover and persist within the mixed-phase layer due to self-generated lift.

These results demonstrate that seeded ice plumes actively influence their development and always rise in our simulations independent from the vertical velocity within the cloud. This provides new constraints for modeling aerosol-cloud interactions in weakly forced stratiform systems.

How to cite: Ong, C. R., Zhang, H., Dipankar, A., Lohmann, U., and Henneberger, J.: Latent Heat Release Drives the Vertical Evolution of Seeded Ice Plumes in Supercooled Stratus Clouds, EGU General Assembly 2026, Vienna, Austria, 3–8 May 2026, EGU26-14543, https://doi.org/10.5194/egusphere-egu26-14543, 2026.

EGU26-14651 | Orals | AS3.7

Evaluating representation of marine aerosols in Norwegian Earth System Model 

Arti Jadav, Gurmanjot Singh, Taina Yli-juuti, Sara Blichner, and Moa Sporre

Oceans contribute to atmospheric aerosol concentration by directly emitting particles and releasing aerosol precursor gases which later reacts and condenses to form secondary aerosols. Marine aerosols modulate the Earth’s radiative budget by scattering and absorbing radiation and influencing the cloud microphysics. Aerosol–cloud interactions are one of the largest sources of uncertainty in climate projections, and understanding the natural, pre-industrial aerosol background is essential for constraining anthropogenic influences. Marine aerosols constitute a substantial fraction of this natural aerosol burden.
In this study, we assess the marine aerosols predictions and their effects on climate using the Norwegian Earth System Model version 2 (NorESM2). NorESM2 uses OsloAero6, a production tagged aerosol module to simulate aerosol size distribution, aerosol mass, detailed aerosol physical, chemical and optical properties. OsloAero6 includes marine aerosols as sea salt emissions driven by wind speed and sea surface temperature (SST), primary organic aerosols (POA) emissions linked to wind speed, SST and chlorophyll concentrations, secondary organic (SOA) and sulphate aerosols formed from the oxidation of dimethyl sulphide (DMS).
Ten-year simulations from 2009-2019, nudged to ERA-Interim reanalysis data are analyzed. Predicted total aerosol number concentration (Ntotal) and the number concentration of particles larger than 100 nm (N100) are evaluated against long-term surface observations from four marine sites: Ascension Island, Zeppelin, Graciosa Island, and La Réunion.
At Ascension Island, the model overestimates Ntotal by up to 500% and N100 by up to 200% compared to observation, largely due to long-range transport of aerosols from African continent. At Zeppelin, N100 is underestimated by up to 200% and Ntotal by up to 100% compared to observation, maybe due to underestimated long-range transport, missing aerosol sources, or an underrepresented condensation sink that limits particle growth. At Graciosa Island and La Réunion, predicted aerosol number concentrations agree with observations within 30%. Overall, predicted Ntotal agrees reasonably well with observations across sites but underestimates N100, while capturing the observed seasonal variability.
To quantify radiative impacts, sensitivity simulations were performed by removing marine aerosol sources to study the direct radiative effect (DRE) and aerosol indirect effect (AIE). The removal of sea salt results in a warmer climate, with decrease in the magnitude of globally averaged DRE and AIE by 0.013 Wm−2 and 0.003 Wm−2, respectively, relative to the control simulation. This demonstrates the net cooling effect of sea salt through radiative scattering and cloud interactions. Removing POA and DMS also leads to warming driven by decrease in the magnitude of AIE, with negligible changes in DRE, consistent with their weaker direct radiative influence. These results highlight the importance of prediction of marine aerosol size and composition, and their role in regulating Earth’s radiative balance and cloud properties.

Acknowledgements. We acknowledge the U.S. DOE ARM user facility for providing data from the Graciosa (ENA) and Ascension Island (ASI) sites. We also thank the NILU EBAS database and the contributing networks (ACTRIS, GAW-WDCA, EMEP) for the chemical composition, size distribution, and meteorological data from the Zeppelin (Ny-Ålesund) and Maïdo (La Réunion) observatories.

How to cite: Jadav, A., Singh, G., Yli-juuti, T., Blichner, S., and Sporre, M.: Evaluating representation of marine aerosols in Norwegian Earth System Model, EGU General Assembly 2026, Vienna, Austria, 3–8 May 2026, EGU26-14651, https://doi.org/10.5194/egusphere-egu26-14651, 2026.

EGU26-14943 | Orals | AS3.7

Is it cake (or a cloud)? Using time evolution and natural experiments to uncover aerosol impacts on cloud processes  

Edward Gryspeerdt, Oliver Driver, Sajedeh Marjani, Vishnu Nair, Geoffrey Pugsley, and Anna Tippett

With improvements to the global observational networks and model fidelity, climate models are getting increasingly good at producing an accurate cloud climatology. However, there is still significant variation in the response of their clouds to aerosol perturbations. This variation is magnified when considering intentional perturbations to clouds (such as marine cloud brightening), where a model not only needs to get aerosol-cloud interactions right 'on average', but in specific conditions. A similar challenge exists in developing observational constraints for models, where aerosol-cloud susceptibilities (relationships determined from temporal variability over long timescales) are harder to use to assess specific conditions. We need observations that can help constrain cloud processes, ensuring that a simulated cloud is 'right for the right reasons'. 

While a simulated cloud might appear similar to an observed one, an external perturbation provides a unique opportunity to uncover the processes that have set the cloud properties. By 'poking' a cloud, they allow us to see if the cloud behaves like a real one, or it is just superficially similar (like a cake). 

Here we show how the time evolution of clouds following inadvertent perturbations (so-called 'natural experiments') can be used to identify the role of different processes in setting cloud properties. The cloud response following these experiments can be used to identify model biases, improving the accuracy of aerosol-cloud processes. We link these natural experiments to the response in large-scale temporal cloud variation, highlighting how this can be used to isolate causal aerosol impacts on clouds and providing process-level constraints on climate model behaviour. 

How to cite: Gryspeerdt, E., Driver, O., Marjani, S., Nair, V., Pugsley, G., and Tippett, A.: Is it cake (or a cloud)? Using time evolution and natural experiments to uncover aerosol impacts on cloud processes , EGU General Assembly 2026, Vienna, Austria, 3–8 May 2026, EGU26-14943, https://doi.org/10.5194/egusphere-egu26-14943, 2026.

EGU26-15006 | Posters on site | AS3.7

Using Himiwari-9 cloud tracking to support the analysis of measurements from the ACADIA and HALO-South field campaigns 

Adrian McDonald, Heike Kalesse-Los, Patric Seifert, Alex Schuddeboom, and Daniel Morrish

The large horizontal grid size of current atmospheric models means that subgrid  heterogeneity in cloud properties must be parameterised. A number of studies have suggested that this heterogeneity may have significant negative consequences for the representation of mixed phase clouds, marine boundary layer clouds and stratocumulus cloud decks in models. This study details work which uses high temporal (10 minute) and spatial resolution (4 km) Advanced Himawari Imager data collected by the Himawari-9 geostationary satellite to identify and track coherent cloud objects. In particular, we track cloud data in the South West Pacific centred on New Zealand during the HALO-South and ACADIA field campaigns. HALO-South is an airborne campaign using the HALO research aircraft deployed from New Zealand in September to October 2025 to study Southern Ocean clouds and aerosol-cloud interactions, while the ACADIA campaign is a longer term deployment of ground-based remote sensing instrumentation to sample the cloud and aerosol environment at two sites in New Zealand.

This work details the derivation of coherent cloud objects by identifying features using cloud top temperatures and the application of a watershedding segmentation scheme to identify coherent regions. These coherent cloud objects are then tracked between individual images using the “tobac” tracking scheme.  The tracked Himiwari-9 cloud information is then used to examine the heterogeneity of cloud properties, particularly cloud phase, inside and across these coherent cloud objects in the South West Pacific. With a normalised version of the largest length of conistent cloud properties within a coherent cloud object being used as our measure of spatial heterogenity. Results of cloud tracking are also used in an effort to analyse heterogeneity as a function of cloud lifetime by associating cloud properties with individual coherent cloud objects across their evolution. Coherent cloud objects identified from Himawari-9 satellite imagery are then compared with remotely sensed cloud data at the ACADIA field sites to examine the spatial and temporal consistency between ground-based and satellite-based remote sensing perspectives. We also examine the potential to identify coherent cloud regions along flight transects completed during the HALO-South campaign.

How to cite: McDonald, A., Kalesse-Los, H., Seifert, P., Schuddeboom, A., and Morrish, D.: Using Himiwari-9 cloud tracking to support the analysis of measurements from the ACADIA and HALO-South field campaigns, EGU General Assembly 2026, Vienna, Austria, 3–8 May 2026, EGU26-15006, https://doi.org/10.5194/egusphere-egu26-15006, 2026.

EGU26-15116 | ECS | Posters on site | AS3.7

Linking observed aerosol–cloud processes and kilometer-scale cloud-resolving simulations over the Amazon rainforest 

Alice Henkes, Johannes Quaas, Baseerat Romshoo, Mira Pöhlker, Philipp Weiss, Bernd Heinold, Sadhitro De, Anne Kubin, Luiz Augusto Toledo Machado, Christopher Pöhlker, Philip Stier, Peter Lloyd, Jan Kretzschmar, Hailing Jia, Fabian Senf, and Ina Tegen

At kilometer-scale resolution, convective systems start to be explicitly resolved in atmospheric models, albeit coarsely. This allows a more process-based analysis of certain aspects of aerosol–cloud interactions in tropical regions. Convective clouds are a ubiquitous feature above the Amazon rainforest and develop under strongly contrasting aerosol conditions, with particle number concentrations during the dry season often exceeding those in the wet season by an order of magnitude.

In this context, we explore aerosol and convective cloud processes over the Amazon rainforest by analyzing case studies that combine observations and km-scale cloud-resolving simulations with interactive aerosols in a limited-area configuration. Regional simulations are performed at approximately 1.6 km horizontal resolution using the Icosahedral Nonhydrostatic (ICON) model coupled to the one-moment aerosol scheme HAM-lite. The realism of the simulations is evaluated through comparison with a combination of ground-based, satellite, and aircraft observations.

For the wet season, we analyze a case study based on flight RF15, conducted with the German research aircraft HALO during the CAFE-Brazil (Chemistry of the Atmosphere: Field Experiment in Brazil; CAFE-BR) campaign in 2022–2023. Three simulations are presented for this case: a best-estimate factual simulation and two counterfactual sensitivity experiments representing background “green ocean” conditions and heavy aerosol loading associated with biomass burning during dry season periods.  

For the dry season, we also revisit two research flights from the ACRIDICON-CHUVA 2014 campaign, representing one clean and one polluted case, to further assess the representation of aerosol–cloud processes under different convective regimes. Combining these cases, we discuss the impact of changing aerosol environments on convective systems and draw conclusions relevant to a transition toward a post-fossil aerosol regime.

How to cite: Henkes, A., Quaas, J., Romshoo, B., Pöhlker, M., Weiss, P., Heinold, B., De, S., Kubin, A., Toledo Machado, L. A., Pöhlker, C., Stier, P., Lloyd, P., Kretzschmar, J., Jia, H., Senf, F., and Tegen, I.: Linking observed aerosol–cloud processes and kilometer-scale cloud-resolving simulations over the Amazon rainforest, EGU General Assembly 2026, Vienna, Austria, 3–8 May 2026, EGU26-15116, https://doi.org/10.5194/egusphere-egu26-15116, 2026.

EGU26-15214 | ECS | Posters on site | AS3.7

A baseline cloud climatology for Aotearoa New Zealand and the Southwest Pacific region  

Daniel Morrish, Adrian McDonald, Alex Schuddeboom, Abhi Venugopal, Marwan Katurji, and Guy Coulson

This study presents a cloud climatology over Aotearoa New Zealand and the surrounding Southwest Pacific Ocean region (140-210°E, 10-70°S) using satellite observations, ground measurements and reanalysis data. Three cloud satellite datasets alongside a network of ceilometers operated by the New Zealand Metservice are used to observe cloud properties.  

Sixteen ceilometer sites, nine sites in the North Island, six sites in the South Island and one on Chatham Island, makes up the ground measurement network with data from 2021 to 2023. Cloud occurrence data at each site are compared with the ERA5, MERRA-2 and JRA55 reanalyses using a ground-based instrument simulator. Initial results show that both cloud occurrence is better represented in the models at east coast sites, with ERA5 performing the best of the three reanalyses. 

Satellite datasets include MODIS Aqua/Terra cloud properties (2003–2025), Himawari-9 Advanced Himawari Imager cloud products (2023–2025), and observations from Cloudsat/CALIOP (2007–2010). We compare cloud fraction data from these satellite datasets with ERA5 reanalyses processed using the COSP instrument simulator to aid comparability. We then compare cloud top pressure/cloud top height/cloud top temperature distributions from the MODIS and Himawari-9 datasets with vertical profiles of cloud occurrence statistics from the CloudSat/CALIOP 2BCL5 dataset and from ERA5.  

Cloud regimes are identified using MODIS cloud-top pressure–optical depth histograms, and their occurrence statistics are compared with CloudSat/CALIOP 2B-CLDCL5 cloud-type classifications.  

Synoptic drivers for cloud fraction and other cloud properties are also examined via comparison with the Kidson weather types, a set of 12 objectively classified daily weather patterns centred over New Zealand, derived from cluster analysis of 1000 hPa geopotential height fields to form a synoptic climatology. 

How to cite: Morrish, D., McDonald, A., Schuddeboom, A., Venugopal, A., Katurji, M., and Coulson, G.: A baseline cloud climatology for Aotearoa New Zealand and the Southwest Pacific region , EGU General Assembly 2026, Vienna, Austria, 3–8 May 2026, EGU26-15214, https://doi.org/10.5194/egusphere-egu26-15214, 2026.

EGU26-15233 | Posters on site | AS3.7

Quantum Algorithm for Two-Dimensional Radiative Transfer in a Cloudy Atmosphere 

Kazumasa Ueno and Hiroaki Miura

Radiative transfer (RT) calculations are essential in climate and weather models. At high spatial resolution, three-dimensional (3D) radiative effects can no longer be neglected, but multi-dimensional RT is computationally expensive. One of the direct deterministic ways to treat the radiance field is to use the discrete ordinates method (DOM), which reduces RT to a large linear system. However, extending such deterministic solvers to fully 3D RT is computationally prohibitive, making the approach impractical for current models. Here we explore an approach based on quantum computing, which is expected to outperform classical computers for certain problems by exploiting quantum properties.

As the first step, we study stationary radiative transfer in a two-dimensional cloudy atmosphere and discretize the boundary-value problem with DOM. We design a quantum algorithm that combines a block-encoding of the DOM coefficient matrix and quantum singular value transformation (QSVT). This approach enables implementation of the inverse operation that is required to solve the linear system under the fault-tolerant quantum computation. We encode a group of wavelengths in a superposition state to process them in parallel. By targeting integrated quantities such as heating rates, we avoid reconstructing full radiance-field while still keeping the advantages of this wavelength-level parallelism.

We estimate the quantum resources required for our quantum algorithm and examine their dependence on the number of spatial grid points N, the number of discrete angles Nang, and the number of wavelength bins Nλ. We count the number of quantum gates to measure the computational cost. The gate count increases with the condition number of the DOM coefficient matrix, which increases roughly linearly with N. The gate count also increases with the block-encoding overhead, which increases roughly quadratically with Nang. On the other hand, the dependence on Nλ can be kept nearly constant under a low-parameter approximation of the scattering phase function. Our results suggest that quantum computing is a promising approach for the DOM-based radiative transfer in a cloudy atmosphere, especially in fully 3D settings.

How to cite: Ueno, K. and Miura, H.: Quantum Algorithm for Two-Dimensional Radiative Transfer in a Cloudy Atmosphere, EGU General Assembly 2026, Vienna, Austria, 3–8 May 2026, EGU26-15233, https://doi.org/10.5194/egusphere-egu26-15233, 2026.

EGU26-15430 | ECS | Orals | AS3.7

Evaluating the precipitation impact on particle number size distribution in climate models based on correlation analysis 

Sara Marie Blichner, Theodore Khadir, Sini Talvinen, Paulo Artaxo, Liine Heikkinen, Harri Kokkola, Radovan Krejci, Muhammed Irfan, Twan van Noije, Tuukka Petäjä, Christopher Pöhlker, Øyvind Seland, Carl Svenhag, Antti Vartiainen, and Ilona Riipinen

For models to reliably predict future climate and air-quality scenarios, an accurate representation of the cloud condensation nuclei (CCN) budget is key. In this regard, the effect of precipitation on the particle number size distribution (PNSD) is important in at least two ways: 1) wet deposition, generally considered a dominant sink of CCN, and 2) CCN replenishing, which has been shown to frequently follow precipitation via the process of formation and growth of new particles, thereby buffering the loss process. Together, these effects illustrate the complexity of precipitation–PNSD interactions.

In this study, we use correlations between measured PNSD at three stations and precipitation rates along back trajectories to evaluate precipitation-PNSD interactions in three general circulation models (GCMs; NorESM, EC-Earth and ECHAM-SALSA). This approach allows us to focus on the size- and time-resolved effects of precipitation on the CCN budget. The long-term measurement sites used in the study are Zeppelin (Arctic), Hyytiälä. (boreal forest), and ATTO (Amazon rainforest). To investigate potential confounding factors, we further apply eXtreme Gradient Boosting (XGBoost) and build a separate regression model for each site and data source using a minimal set of physically relevant predictors.

For CCN replenishment following precipitation, the models tend to underestimate new particle formation (NPF) and particle growth to CCN sizes at the two high-latitude stations. In the Amazon (ATTO), by contrast, two models simulate an immediate CCN source after rainfall, whereas observations show a weaker response that takes time to grow to CCN sizes, indicating overly rapid aerosol growth in the models. Finally, observations suggest weaker wet deposition during cold periods than warm periods, likely due to phase dependency. The models are in general better at reproducing patterns during warm periods, while in cold periods one model (EC-Earth) has too strong positive correlations with precipitation, while another has strongly negative correlations (ECHAM-SALSA).

The XGBoost analysis largely confirms the key findings from the correlation evaluation, but also uncovers likely confounding influences, such as the correlation between emission regions and regions with strong precipitation. For example, a feature that appears as a precipitation-driven source of large particles in correlation analyses is instead attributed by the machine-learning model to shifts in air-mass origin. This approach shows potential for disentangling spurious correlations and controlling for confounding factors in model evaluation.

Overall, evaluating the size-resolved impacts of precipitation on particle number highlights model shortcomings in new particle formation and growth, and underscores the importance of disentangling these processes from the direct deposition effect of precipitation when improving models.

How to cite: Blichner, S. M., Khadir, T., Talvinen, S., Artaxo, P., Heikkinen, L., Kokkola, H., Krejci, R., Irfan, M., van Noije, T., Petäjä, T., Pöhlker, C., Seland, Ø., Svenhag, C., Vartiainen, A., and Riipinen, I.: Evaluating the precipitation impact on particle number size distribution in climate models based on correlation analysis, EGU General Assembly 2026, Vienna, Austria, 3–8 May 2026, EGU26-15430, https://doi.org/10.5194/egusphere-egu26-15430, 2026.

EGU26-15832 | Posters on site | AS3.7

Enhancing Cloud Droplet Number Concentration Representation in Global Climate Simulations 

Noah Asch, Paul Field, Pratapaditya Ghosh, Salil Mahajan, Wei Zhang, Hyun-Gyu Kang, Min Xu, Katherine J. Evans, and Hamish Gordon

Aerosol-cloud interactions are currently the largest uncertainty in climate simulations of how Earth's radiation budget is changing. Consequently, significant effort has gone into improving the representation of these interactions in weather and climate models alike. One of the most critical controlling variables for aerosol-cloud interactions is cloud droplet number concentration (CDNC). Here we develop the representation of CDNC in the UK Met Office Unified Model (UM) global model and explore how simulated CDNC should be evaluated using satellite retrievals.

In unified weather and climate prediction systems, it is desirable to represent cloud microphysics using consistent code across scales. Consequently, we implement the UM’s regional double-moment microphysics scheme into the global model, which by default uses a single-moment scheme. Although this increases computational cost, the double-moment scheme can be evaluated more precisely against pixel-level satellite retrievals in high-resolution regional simulations, and it enables a more robust treatment of cloud droplets. Therefore, we describe how we develop and assess it in the global UM.

However, the evaluation of cloud droplets in a global model is difficult as comparisons must be made with satellite-derived, and typically masked, cloud top CDNC. We address this issue through the analysis of various masking strategies, along with evaluating the performance of the Cloud Feedback Model Intercomparison Project (CFMIP) Observation Simulator Package (COSP) satellite simulator as implemented in the UM. In doing so, we improve protocols for global model-satellite comparisons of CDNC.

Through the implementation of double-moment cloud microphysics into the UM’s global model, we find systematic improvements in simulated cloud droplet representation. The annual root mean squared error (RMSE) decreases by 4 cm-3 globally, with a substantially larger reduction of 16 cm-3 in the tropics, as the enhanced representation of microphysical processes (e.g., accretion and autoconversion) is particularly beneficial for convective systems. Outside of the tropics, a low droplet bias exists regardless of the microphysics scheme. We find this bias is partially explained by a ~ 50% underprediction of simulated aerosol concentration when compared with in situ measurements from the NASA Atmospheric Tomography (ATom) Mission. Applying an aerosol scaling factor reduces this droplet bias by half, showing that errors in aerosol and activation are comparable.

We further find that COSP improves model agreement with remotely sensed cloud optical depth (τc) and effective radius (re). However, COSP-derived CDNC has an RMSE 16 cm-3 higher than that of CDNC calculated directly from the microphysics scheme, as biases in τc and re propagate through the simulator. Overall, we expect that our improvements to the representation of CDNC in the UM’s global model can meaningfully reduce the uncertainty in simulated aerosol-cloud interactions, and by extension, improve radiative forcing estimates.

How to cite: Asch, N., Field, P., Ghosh, P., Mahajan, S., Zhang, W., Kang, H.-G., Xu, M., Evans, K. J., and Gordon, H.: Enhancing Cloud Droplet Number Concentration Representation in Global Climate Simulations, EGU General Assembly 2026, Vienna, Austria, 3–8 May 2026, EGU26-15832, https://doi.org/10.5194/egusphere-egu26-15832, 2026.

EGU26-15937 | ECS | Posters on site | AS3.7

Quantifying Susceptibility in aerosol and updraft limited regimes for Warm and Mixed-Phase Clouds Using LES 

Gaurav Dogra, Olivier Boucher, and Nicolas Bellouin

Clouds cover a large fraction of the Earth’s surface and play a central role in regulating Earth’s radiative balance, precipitation, and the global water cycle. Aerosols influence cloud formation by acting as cloud condensation nuclei (CCN), thereby modifying cloud microphysical and dynamical processes. However, the extent to which aerosol perturbations and dynamical factors influence cloud susceptibility (β = ∂lnNd/∂lnNa , where Nd is cloud droplet number concentration and Na is aerosol number concentration) across different cloud types remains uncertain. In this study, we employ Large Eddy Simulations (LES) to quantify aerosol susceptibility in marine liquid phase stratocumulus and mixed-phase clouds. Two sets of simulations are performed: (i) simulations with increasing aerosol number concentrations (65, 100, 500, 1000, and 10 000 cm⁻³) as reference case, and (ii) simulations with enhanced updraft velocities for the same range of aerosol concentrations. For liquid-phase clouds, the susceptibility decreases from 1 to 0.78, 0.69, and 0.2 with increasing aerosol concentration, indicating a transition from an aerosol-limited to an updraft-limited regime. For enhanced updraft cases, the susceptibility decreases from 1, 0.84, 0.71, and 0.34. Increasing the updraft velocity enhances supersaturation, leading to increased activation of aerosols into cloud droplets compared to the reference case. As a result, at higher aerosol concentrations, the susceptibility is higher than in the reference case. Thus, the comparison between the reference and enhanced-updraft simulations indicates a transition from updraft-limited to aerosol-limited behaviour at high aerosol concentrations. Ongoing simulations of mixed-phase clouds also aim to quantify aerosol susceptibility in different dynamical regimes and assess how cloud phase influences aerosol-cloud interactions.

How to cite: Dogra, G., Boucher, O., and Bellouin, N.: Quantifying Susceptibility in aerosol and updraft limited regimes for Warm and Mixed-Phase Clouds Using LES, EGU General Assembly 2026, Vienna, Austria, 3–8 May 2026, EGU26-15937, https://doi.org/10.5194/egusphere-egu26-15937, 2026.

EGU26-16046 | Posters on site | AS3.7

Optimal choice of proxy for cloud condensation nuclei reduces uncertainty in aerosol–cloud–climate forcing 

Hailing Jia, Johannes Quaas, Willem Kroese, Bastiaan van Diedenhoven, Edward Gryspeerdt, Christoph Böhm, Karoline Block, and Otto Hasekamp

Aerosol–cloud interactions (ACI) remain the largest uncertainty in anthropogenic climate forcings. Observation-based estimates of instantaneous radiative forcing from ACI (RFaci; the Twomey effect) rely on the choice of aerosol quantities as proxies for cloud condensation nuclei (CCN) concentrations, which differ in their ability to represent cloud-base CCN and data accuracy. Using diverse observations and aerosol–climate models, we evaluate the utility of different proxies with two independent approaches. Both approaches reveal that surface CCN exhibits the smallest bias in predicting RFaci (+5 %), followed by aerosol index, surface sulfate and column CCN with similar biases of +25 %, while aerosol optical depth and column sulfate show the largest biases (–60 % and +92 %). Constraining RFaci with the optimal proxy reduces uncertainty from 66 % to 43 %, yielding a less negative RFaci (–1.0 W m−2) than the unconstrained case (–1.2 W m−2). Our findings highlight the crucial role of proxy constraint in reconciling and improving RFaci estimates.

How to cite: Jia, H., Quaas, J., Kroese, W., van Diedenhoven, B., Gryspeerdt, E., Böhm, C., Block, K., and Hasekamp, O.: Optimal choice of proxy for cloud condensation nuclei reduces uncertainty in aerosol–cloud–climate forcing, EGU General Assembly 2026, Vienna, Austria, 3–8 May 2026, EGU26-16046, https://doi.org/10.5194/egusphere-egu26-16046, 2026.

EGU26-16768 | Orals | AS3.7

UCLALES-based cloud base updraft emulator for global models 

Noora Hyttinen, Silvia M. Calderón, Eemeli Holopainen, Tomi Raatikainen, Tero Mielonen, Sami Romakkaniemi, and Harri Kokkola

Climate models cannot afford the computational cost of the meter-scale resolution needed to accurately resolve turbulence and convection in the boundary layer. Machine learning based Gaussian process emulators (GPEs) have been recently presented as an alternative to close the gap between meter-scale and kilometer-scale resolutions (Ahola et al., 2022, https://doi.org/10.5194/acp-22-4523-2022). An emulator offers an improved alternative for climate models to include turbulence effects in the boundary layer on the formation of stratocumulus clouds. Here we have trained a GPE using vertical winds from the large-eddy model UCLALES following the approach of Ahola et al. (2022). The training data of our updraft emulator includes a wide range of stratocumulus conditions both over land and sea. The predicted standard deviation of cloud base vertical wind can be used directly in the activation calculation of global models. We have additionally implemented our emulator to the OpenIFS global climate model. In this study, we present a comparison of different parametrizations for updraft velocities, including our emulator, and how these affect cloud droplet number concentration and aerosol radiative forcing in the global scale.

This project has received funding from Horizon Europe programme under Grant Agreement No 101137680 via project CERTAINTY (Cloud-aERosol inTeractions & their impActs IN The earth sYstem).

How to cite: Hyttinen, N., Calderón, S. M., Holopainen, E., Raatikainen, T., Mielonen, T., Romakkaniemi, S., and Kokkola, H.: UCLALES-based cloud base updraft emulator for global models, EGU General Assembly 2026, Vienna, Austria, 3–8 May 2026, EGU26-16768, https://doi.org/10.5194/egusphere-egu26-16768, 2026.

EGU26-17155 | ECS | Orals | AS3.7

How sensitive are clouds to biogenic aerosols? Insights from satellite observations and model simulations  

Kanika Taneja, Silvia M. Calderon, Sami Romakkaniemi, Antti Arola, Antti Lipponen, Harri Kokkola, Taina Yli-Juuti, Seethala Chellappan, and Tero Mielonen

One of the largest uncertainties in estimating the anthropogenic radiative forcing is related to the impact of atmospheric aerosols on cloud properties. The estimates of radiative forcing due to changes in cloud properties vary significantly between different global climate models, highlighting the need for constraining this forcing by using observations. Currently, one of the least well-understood aerosol components is secondary organic aerosols, most of which are of natural origin, i.e., biogenic SOA (BSOA). Here, we aim to quantify the effects of BSOA on cloud properties by combining field observations of aerosol concentrations and satellite observations of cloud properties. The aerosol particles were measured with a Scanning-Mobility Particle Sizer (SMPS) in Hyytiälä, Finland for the summers 2012-2023. Particles with diameter larger than 100 nm (N100) were considered as a proxy for cloud condensation nuclei. Cloud microphysical properties were obtained from the MODIS Collection 6 Level-2 cloud product (MYD06_L2) at 1 km resolution and averaged over a 1° × 1° region surrounding the site. Based on sensitivity tests and previous studies, the cloud droplet number concentration (CDNC) was derived for only low-level liquid warm clouds over the study region based on the retrieved cloud effective radius (CER) and cloud optical thickness (COT) values. The impact of different linear regression methods, measurement uncertainties, and sampling criteria on cloud susceptibility estimates was thoroughly analyzed. Based on meteorological conditions and aerosol size distributions observed in Hyytiälä, cloud parcel model simulations were performed for comparison. The simulated CDNC–aerosol susceptibility was found to be 0.68, while the observed value was somewhat smaller, 0.37. Using the observed temperature dependence of N100 and CDNC-aerosol susceptibility, we estimated temperature-driven cloud albedo feedback to be −0.68 W m⁻² °C⁻¹ (95 % confidence interval: −0.87 to −0.50 W m⁻² °C⁻¹). The magnitude of this feedback is approximately twice as large as reported in an earlier study which utilized MODIS Level-3 data. This difference highlights the strong sensitivity of estimated cloud susceptibility to satellite data sampling and filtering choices.

How to cite: Taneja, K., Calderon, S. M., Romakkaniemi, S., Arola, A., Lipponen, A., Kokkola, H., Yli-Juuti, T., Chellappan, S., and Mielonen, T.: How sensitive are clouds to biogenic aerosols? Insights from satellite observations and model simulations , EGU General Assembly 2026, Vienna, Austria, 3–8 May 2026, EGU26-17155, https://doi.org/10.5194/egusphere-egu26-17155, 2026.

EGU26-17400 | Posters on site | AS3.7

The Characterization of the Cloud-Aerosol Transition Zone Using Ground-Based and Spaceborne LiDAR 

Jaume Ruiz de Morales, Josep Calbó, Josep-Abel González, Hendrik Andersen, Jan Cermak, Julia Fuchs, Yolanda Sola, and José-Luis Gómez

Aerosol-Cloud Interactions (ACI) contribution to the Earth’s radiative budget remains as a major uncertainty in future climate projections. Clouds constantly interact with the surrounding non-saturated environment, forming cloud-aerosol transition zones (TZs). These suspensions are not fully assessed by cloud-cloudless distinction methodologies and have a non-negligible role in the radiative budget, making the lack of large-scale TZ observations a challenge for full comprehension of the climate system.

In this study, two complementary ground-based and spaceborne lidar TZ observation techniques are integrated to enhance knowledge on TZ conditions, including their detection occurrence, distribution, and optical characteristics, while highlighting the advantages and limitations of each methodology used. Ground-based Automatic Low-Power Lidars and Ceilometers (ALC) located at Burjassot (Spain), Gruenow (Germany), Girona (Spain) and the Cloudnet network are used, along with CALIOP observations over the region between coordinates 30º–80ºN and 7ºW–35ºE, covering Europe. The ALC method relies on varying the set of thresholds for cloud detection of the Cloudnetpy algorithm from ACTRIS Cloudnet. In contrast, the method for the CALIOP data applies several filters to avoid artifacts, and uses the CAD score values to identify clouds, aerosols, and TZ conditions.

Results show that the transition from cloud to cloud-free is gradual, and cloud detection depends on the thresholds used in the methods, as well as the local climatology. To properly assess the synergy between the methods, case studies of coincidental observations are presented, where the distance between the CALIOP overpass and the ALC site is less than 4 km. These cases represent various atmospheric patterns, such as cloud-free and boundary layer aerosols, Cirrus, low-level clouds, dense tropospheric clouds, and multi-layer cloud structures. Overall, ground-based ALC provide high temporal and vertical resolution, and are particularly effective at detecting TZ at low altitudes. In contrast, CALIOP offers global coverage and is especially useful for detecting TZ located at high altitudes. Although each approach has individual limitations, integrating spaceborne downward-looking and ground-based upward-looking lidar observations can provide a more comprehensive characterization of cloud-TZ-aerosol distribution.

How to cite: Ruiz de Morales, J., Calbó, J., González, J.-A., Andersen, H., Cermak, J., Fuchs, J., Sola, Y., and Gómez, J.-L.: The Characterization of the Cloud-Aerosol Transition Zone Using Ground-Based and Spaceborne LiDAR, EGU General Assembly 2026, Vienna, Austria, 3–8 May 2026, EGU26-17400, https://doi.org/10.5194/egusphere-egu26-17400, 2026.

Subgrid-scale vertical velocity variability (σw) plays a key role in aerosol activation, cloud droplet number concentration (CDNC), and cloud microphysical evolution. Despite its importance, σw remains one of the highly uncertain parameters in climate models, particularly under extreme atmospheric conditions. Recently developed machine-learning turbulence parameterizations, trained on global high-resolution climate model simulations, offer a promising alternative to traditional schemes. However, their ability to apply and generalize to real atmospheric conditions and to regimes that differ substantially from those represented in the training simulations and the resulting implications for cloud processes remain largely untested.

Here, we evaluate the deep-learning based σw parameterization, Wnet across two physically contrasting observational regimes that are highly relevant for aerosol–cloud interactions: (i) the ultra-stable Arctic boundary layer observed during the CLAVIER campaign at the Villum Research Station, and (ii) strong orographic turbulence associated with cloud formation during the CHOPIN campaign at Mt. Helmos in the Mediterranean. Using high-frequency observations, we drive Wnet in offline mode and compare its σw estimates against observed vertical-velocity variability, with a focus on conditions controlling cloud activation. We further assess the robustness of Wnet by diagnosing out-of-distribution (OOD) atmospheric states relative to its global training space and examining how such states are associated with systematic σw errors. This framework enables identification of distinct ML failure modes under different atmospheric conditions, thereby elucidating the physical boundaries of applicability of ML-based Wnet turbulence scheme. Finally, we investigate when and where σw errors translate into meaningful biases in cloud-relevant quantities, particularly CDNC, by linking σw discrepancies to observed cloud properties and activation regimes. By explicitly connecting ML-driven turbulence errors to cloud microphysical impacts, this study provides a physically grounded evaluation of ML turbulence parameterizations in regimes critical for aerosol–cloud interactions.

The results will inform the safe and interpretable use of ML-based σw schemes in Earth-system models and highlight key challenges for their application in extreme atmospheric environments.


How to cite: Irfan, M., Barahona, D., Holopainen, E., and Nenes, A.: A Deep-Learning Parameterization of Vertical Velocity Variability (Wnet) Tested Across Contrasting Atmospheric Regimes: From the Arctic to the Mediterranean, EGU General Assembly 2026, Vienna, Austria, 3–8 May 2026, EGU26-17471, https://doi.org/10.5194/egusphere-egu26-17471, 2026.

The few studies that considered aerosol scattering in the long-wave (LW) typically relied on using simple corrective factors instead of including it in the radiative code. To analyse the climatic effects of physically accounting for this process, simulations have been performed with the ARPEGE-Climat atmospheric global climate model over the 1985–2014 period using the ecRad radiation scheme and updated optical properties of coarse aerosols, particularly dust. The evaluation of the model coarse-aerosol optical depth (AOD) against AERONET data over North Africa and the Arabian Peninsula shows the ability of ARPEGE-Climat to capture spatio-temporal variations in coarse AOD despite regional biases. The comparison of simulations with and without LW aerosol scattering shows that this process leads to a significant increase in downwelling surface LW radiation in dust-emitting regions, correlated with the largest coarse AOD. This increase results in a rise in minimum near-surface temperatures of up to +1 °C. It is also associated with an outgoing LW radiation decrease at the top of the atmosphere (TOA). However, during certain months and in certain regions, near-surface temperatures can be significantly reduced due to short-wave surface radiation decreases related to increases in low-level clouds. A precipitation increase over Sahel during September, linked to wetter atmospheric layers, is also simulated. Neglecting LW aerosol scattering in climate simulations therefore has significant impacts on climate, notably in dust-emitting regions. Globally, the LW aerosol-scattering contribution to radiation is 0.4 W m−2 at both the surface and TOA.

How to cite: Druge, T.: Radiative and climate effects of aerosol scattering in long-wave radiation based on global climate modeling, EGU General Assembly 2026, Vienna, Austria, 3–8 May 2026, EGU26-18112, https://doi.org/10.5194/egusphere-egu26-18112, 2026.

EGU26-18231 | ECS | Posters on site | AS3.7

3D reconstruction of cloud fields using cloud resolving modelling 

Preethi Sradha Krishnan and Vera Schemann

The three-dimensional nature of clouds modifies incoming radiation and the representation of cloud-radiative effects is simplified in climate models. Radiative transfer thus assumes clouds to be plane-parallel and homogeneous, commonly known in the community as the independent column approximation method. Studies have shown that neglecting the 3D radiative transport effect can introduce substantial biases in simulated mean radiation fields. The C3SAR (Cloud Structure & Climate – Closing the 3D Gap) research unit was established, bringing together advanced remote sensing techniques and high-resolution modeling to investigate the 3D radiative effects of clouds. In our subproject, we use hectometer-scale simulations which are essential for resolving clouds, to investigate biases in 3D cloud-radiative effects.

To realize 3D cloud observations and make them available for different cloud scenarios is essential for our studies. We use the hectometer-scale simulations as a virtual testbed to test and evaluate potential 3D reconstruction algorithms, which could then be applied to satellite and ground-based products. While 3D reconstruction from observational data faces many challenges, these simulations provide a consistent framework to evaluate and estimate potential uncertainties.

For our simulations we apply the ICON model centered around Lindenberg, Germany, with a starting resolution of 600 m and a 100 km domain. The resolution is refined through several nests—potentially up to 75 m—forced by operational weather forecasts at 2.2 km resolution. We will show first case study results of the application of 3D cloud reconstruction within our virtual testbed by applying instrument simulators.

How to cite: Krishnan, P. S. and Schemann, V.: 3D reconstruction of cloud fields using cloud resolving modelling, EGU General Assembly 2026, Vienna, Austria, 3–8 May 2026, EGU26-18231, https://doi.org/10.5194/egusphere-egu26-18231, 2026.

EGU26-18629 | Orals | AS3.7

Resolving cloud microphysical heterogeneity with Sentinel-2: implications for aerosol-cloud interaction studies 

Barbara Bertozzi, Jacqueline Campbell, Paul Borne--Pons, Mikolaj Czerkawski, and Alistair Francis

Cloud radiative effects depend critically on microphysical properties, that in turn are influenced by aerosol-cloud interactions, which remain the dominant source of uncertainty in anthropogenic radiative forcing estimates. Cloud droplet number concentration, Nd, is a key parameter for constraining these phenomena using satellite observations. However, current satellite-based Nd retrievals suffer from substantial biases in comparison with in-situ measurements. A fundamental limitation is that even specialized satellites, such as MODIS, typically observe at scales of hundreds of meters to kilometers. At these resolutions, retrievals necessarily average over fine-scale cloud variability associated with differing cloud life-cycle stages, spatially varying dynamical forcing, and heterogeneity in aerosol conditions at cloud base. Averaging this sub-pixel heterogeneity limits our ability to understand aerosol-cloud interactions or to evaluate high-resolution cloud models.

The Clouds Decoded project, funded by the Advanced Research + Invention Agency (ARIA), retrieves cloud properties from Sentinel-2 (S2) imagery at ~60 m resolution. This resolution captures spatial structures at scales where key microphysical processes operate: cloud edges, gradients in optical depth and effective radius, and spatial heterogeneity patterns that inform sub-grid parameterizations in climate models. These high-resolution observations can also complement ground-based and aircraft measurements when S2 overpasses are available.

In this contribution, we present case studies demonstrating how S2 observations can characterize cloud heterogeneity at scales previously invisible to satellite sensors. Can observations at this spatial resolution help resolve discrepancies in satellite-derived aerosol-cloud relationships and reduce uncertainties in aerosol-cloud interaction estimates?

How to cite: Bertozzi, B., Campbell, J., Borne--Pons, P., Czerkawski, M., and Francis, A.: Resolving cloud microphysical heterogeneity with Sentinel-2: implications for aerosol-cloud interaction studies, EGU General Assembly 2026, Vienna, Austria, 3–8 May 2026, EGU26-18629, https://doi.org/10.5194/egusphere-egu26-18629, 2026.

EGU26-18898 | ECS | Posters on site | AS3.7

Uncertainties of human SYNOP cloud classifications 

Markus Rosenberger, Manfred Dorninger, and Martin Weissmann

Automatized image analysis with a broad spectrum of different approaches, e.g. pixel-wise statistical evaluation or machine learning methods, is ever more emerging to deal with a growing amount of data or to assist humans in classifying images. Due to high monetary and personnel expenses some of these automatized methods are even supposed to replace human annotators. Fields where such methods can be utilized are for example medical image analysis or the classification of clouds in the sky. Many studies introducing methods for automatized image analysis use human annotations as ground truth. However, assessments of the reliability and accuracy of those are rare. 

In our work, we investigate the agreement of human cloud classifications conducted according to the WMO SYNOP coding scheme for operational cloud type observations where clouds are classified at every instance into one out of ten classes in each of three altitude levels. We base our analysis on three experiments, where we compare: a) non-simultaneous observations of seven observers at the same weather station in Vienna, b) simultaneous observations at three close together stations over the course of more than 50 years, and c) independent reports of five meteorologists, who classified clouds from over 350 ground-based RGB images. Experiments a) and b) are designed to find systematical biases in operational on-site observations of single observers or weather stations and experiment c) directly targets the subjectivity of human cloud classifications. Results indicate, that human cloud observations of both single observers at the same station and also at different stations are biased towards specific cloud types, which can only partly be assigned to environmental or meteorological influence. Even for classifications based on the exact same information, i.e. an identical set of images in experiment c), disagreement could be found. The accuracy of single observers is around 55 – 65% when their reports are compared with a gold standard ground truth and inter-observer agreement shows similar values. An accuracy of close to 70% can be reached if the reports of four observers are combined via a majority voting approach and similar cloud categories are merged during post-processing. It can thus be hypothesized that a fraction of false classifications is due to the confusion of visually similar categories, which is a consequence of the very complex WMO SYNOP classification scheme. On the other hand, with respect to operational human on-site observations, the annotation of all-sky images was correct in only 30–40% of cases. Therefore, the accuracy of image classifications with respect to the ground truth is highly dependent on the used data set. 

Although the WMO classification scheme is well-defined, it can be summarized that cloud classification is subjective to some extent because of e.g. the occurrence of clouds in transitional stages. Also, if the quality of the ground truth is not assessed in future studies a reliable determination of the accuracy of a newly presented automatized method would be impossible since both the new method but also the ground truth could be erroneous.

How to cite: Rosenberger, M., Dorninger, M., and Weissmann, M.: Uncertainties of human SYNOP cloud classifications, EGU General Assembly 2026, Vienna, Austria, 3–8 May 2026, EGU26-18898, https://doi.org/10.5194/egusphere-egu26-18898, 2026.

EGU26-19092 | ECS | Orals | AS3.7

Understanding Cloud Formation in Eastern Mediterranean Mountainous Environments 

Olga Zografou, Romanos Foskinis, Maria I. Gini, Prodromos Fetfatzis, Konstantinos Granakis, Christos Mitsios, Carolina Molina, Mikka Kommpula, Alexandros Papayannis, Konstantinos Eleftheriadis, and Athanasios Nenes

Understanding aerosol properties is essential for assessing their impacts on clouds, precipitation and climate. These interactions depend strongly on the aerosol levels present as well as the dynamical forcing (vertical velocity) that drive supersaturation development and droplet formation. Datasets that span the wide range of conditions found throughout the atmosphere are much needed to help constrain models and to characterize cloud susceptibility to aerosol.


High-altitude mountain stations, offer an exciting opportunity to study aerosol-cloud interactions because clouds often form at their peaks. The aerosol that acts as precursors of droplet formation can originate from near ground (i.e., within the planetary boundary layer) or long-range sources (i.e., through free-tropospheric transport). Being able to unravel the periods during which clouds are influenced by each air type can vastly expand the scientific value and relevance of aerosol-cloud studies at mountain tops.


The Demokritos Helmos Hellenic Atmospheric Aerosol and Climate Change ((HAC)²) station in Greece (2314 m a.s.l.) is the only high-altitude station in the eastern Mediterranean, a region highly sensitive to climate change. It is located at the crossroads of different air masses and is therefore very well-suited for aerosol-cloud interaction studies. To enhance understanding of the processes driving the formation and evolution of warm and mixed-phase clouds, the CALISHTO (Cloud-Aerosol InteractionS in the Helmos Background TropOsphere) and CHOPIN (Cleancloud Helmos OrograPhic sIte experiment) campaigns were conducted at Mount Helmos during the autumn-winter periods of 2021–2022 and 2024–2025, respectively. During these campaigns, in-situ and remote sensing measurements at a number of sites, located at the Kalavrita Ski Center and the (HAC)2 station, were used to characterize the influence of the PBL at the (HAC)2 and also the concentration of cloud droplets when a cloud forms at the station. We use these measurements, together with a state-of-the-art cloud droplet formation parameterization to predict the concentrations of CCN, and cloud droplet number that form throughout the year at the (HAC)2. Using established metrics, we separate the periods of BL and FT influence and thus determine the susceptibility of clouds to aerosol in each airmass type and class. The calculations are also confirmed using in-situ measurements of cloud droplet number obtained through a PVM-100.

How to cite: Zografou, O., Foskinis, R., Gini, M. I., Fetfatzis, P., Granakis, K., Mitsios, C., Molina, C., Kommpula, M., Papayannis, A., Eleftheriadis, K., and Nenes, A.: Understanding Cloud Formation in Eastern Mediterranean Mountainous Environments, EGU General Assembly 2026, Vienna, Austria, 3–8 May 2026, EGU26-19092, https://doi.org/10.5194/egusphere-egu26-19092, 2026.

EGU26-19095 | ECS | Orals | AS3.7

Assessment and correction of retrieval biases in ship tracks 

Iarla Boyce, Alice Cicirello, and Edward Gryspeerdt

Ship tracks serve as “natural laboratories” for investigating aerosol-cloud interactions, one of the largest sources of
uncertainty in climate change research. Observing ship tracks can help constrain the effect of anthropogenic aerosols on
cloud brightness and water content. The validity of these constraints relies, in part, on the accuracy of satellite retrieval
algorithms used to measure cloud properties. A known source of uncertainty in these algorithms is the representation of
the droplet size distribution. Standard operational retrievals (e.g. MODIS) assume a fixed effective variance (veff) for the
modified gamma distribution used to model cloud droplet dispersion. The introduction of aerosols into clouds produces not
only smaller droplets but also a narrower size distribution, contradicting this fixed assumption.


This study utilises a synthetic retrieval experiment to quantify the impact of this assumption. Top-of-atmosphere radiances
are forward-modelled for synthetic ship track scenes, ranging from clean to polluted regimes. These are then inverted using
standard retrieval logic, allowing us to compare retrieved products against a known “truth”, isolating the bias caused solely
by the fixed veff assumption.


Our results indicate that the fixed veff assumption causes a systemic overestimation of effective radius (r𝑒) of 3.31% in the
polluted regime, while optical depth (𝜏) is virtually unaffected. Consequently, liquid water path (LWP) is robustly retrieved
with a small bias of 2.85%, which is expected due to the linear dependence of LWP on r𝑒 and 𝜏. Cloud droplet number
concentration (N𝑑 ), however, suffers from a much larger overestimation of 23.92% in polluted clouds. This large error
arises due to the sensitivity of N𝑑  to the spectral width parameter 𝑘, which is a function of veff. This inflation of droplet
number in ship tracks may exaggerate cloud microphysical sensitivity to aerosols, potentially overstating the Twomey effect
in models constrained by observed N𝑑 and the efficacy of marine cloud brightening if monitored by satellite.


To address this, we introduce a physics-informed deep residual network (ResNet) correction model. This model does not
require prior knowledge of the true veff, and is trained on synthetic retrievals to map observable parameters to the underlying
bias. By leveraging the sensitivity of multi-angle scattering information implicit in the features, the network learns to
predict the veff and resulting correction factor. We demonstrate that the correction framework reduces the error in N𝑑 in
our synthetic retrieval experiment to less than 1% while preserving the accuracy of LWP.

How to cite: Boyce, I., Cicirello, A., and Gryspeerdt, E.: Assessment and correction of retrieval biases in ship tracks, EGU General Assembly 2026, Vienna, Austria, 3–8 May 2026, EGU26-19095, https://doi.org/10.5194/egusphere-egu26-19095, 2026.

EGU26-19555 | ECS | Orals | AS3.7

Linking Dust Mineralogy and Ice Nucleation in Mixed-Phase Clouds in EC-Earth4 

Marios Chatziparaschos, Montserrat Costa-Surós, María Gonçalves Ageitos, Simone Vacondio, Tommi Bergman, Eemeli Holopainen, Vincent Huijnen, Harri Kokkola, Anton Laakso, Philippe Le Sager, Twan van Noije, Lianghai Wu, and Carlos Pérez García-Pando

Aerosols play a central role in regulating cloud microphysical processes and climate through their ability to act as ice-nucleating particles (INPs). Mineral dust is a dominant global INP source, with laboratory and field studies demonstrating that specific mineral phases—most notably K-feldspar and quartz—control ice formation in mixed-phase clouds. This motivates their explicit representation in Earth system models seeking to reduce uncertainties in aerosol–cloud interactions.

Building on the fundamental aerosol–cloud interaction framework implemented in EC-Earth3, we present recent advances in the representation of mineral dust emissions and heterogeneous ice nucleation in the OpenIFS 48r1 atmospheric model, as part of the development pathway towards EC-Earth4. We introduce a new mineral dust emission scheme that explicitly resolves dust mineralogy using global mineralogical atlases. The scheme calculates the atmospheric abundance of individual dust minerals and incorporates key land surface controls—vegetation, soil type, and potential sources—allowing more realistic dust simulations and hence potentially improving projections of future climate impacts.

The model allows flexible selection among state-of-the-art mineralogical datasets, including the new NASA EMIT mineral map, which enables sensitivity studies of mineral-specific INP activity. Model performance is evaluated and calibrated against long-term dust surface concentration measurements from global and regional observational networks, while simulated aerosol optical depth is compared with observations from dust-dominated ground-based stations to constrain dust loading and transport.

INP concentrations are further evaluated by applying mineral-specific laboratory-based ice-nucleation parameterizations to the simulated mineral dust fields over a range of temperatures. This enables direct assessment of how different mineral phases contribute to INP concentrations and provides a benchmark for future fully coupled aerosol–cloud simulations.

Together, these developments establish a more physically consistent and mineralogy-aware representation of dust–cloud interactions in EC-Earth4, supporting improved quantification of aerosol-driven uncertainties in cloud feedbacks and climate sensitivity.

How to cite: Chatziparaschos, M., Costa-Surós, M., Gonçalves Ageitos, M., Vacondio, S., Bergman, T., Holopainen, E., Huijnen, V., Kokkola, H., Laakso, A., Le Sager, P., van Noije, T., Wu, L., and Pérez García-Pando, C.: Linking Dust Mineralogy and Ice Nucleation in Mixed-Phase Clouds in EC-Earth4, EGU General Assembly 2026, Vienna, Austria, 3–8 May 2026, EGU26-19555, https://doi.org/10.5194/egusphere-egu26-19555, 2026.

EGU26-19943 | ECS | Orals | AS3.7

Mesoscale aerosol variability dominates stratocumulus-climate interactions 

Benjamin Hernandez and Franziska Glassmeier

Stratocumulus clouds cover large parts of the subtropical oceans, and they dominate the net cooling effect of clouds in the Earth’s energy balance. Their non-linear response to anthropogenic aerosol forcings makes them a major source of uncertainty for climate projections. Part of this sensitivity arises from transitions between the two distinct states of stratocumulus (closed and open cells), which are associated with abrupt changes in the cloud’s radiative properties. These transitions can occur locally (pockets of open cells), or as a result of advection with the prevailing winds (stratocumulus-to-cumulus transition by drizzle). Here, we investigate the interaction of such transitions with aerosol perturbations and identify the perturbations that most strongly influence stratocumulus radiative properties.

The mesoscale evolution of stratocumulus decks is modeled using a data-driven, physics-informed stochastic dynamical system with time-dependent parameters. This description encapsulates the scales of cloud formation, mesoscale self-organization, and large-scale conditions through fluctuations, deterministic evolution, and slowly varying parameters, respectively. For relevant parameter conditions, the system features bistability, showcasing the coexistence of open and closed cells. This approach allows us to replicate previous LES results while efficiently extrapolating to a much wider range of parameters and initial conditions, enabling the study of regimes and transitions that LES cannot practically sample.

We find that aerosol-related processes, like rain-formation-washout feedback in open cells and slow aerosol accumulation in closed cells, lead to a lack of timescale separation. As a result, the system’s state is not equilibrated to the steady state prescribed by the large-scale parameters but instead strongly depends on its history. Combined with the system’s bistability, this results in mesoscale pollution plumes dominating the radiative response of stratocumulus, outweighing the effects of background aerosol forcing, cloud feedback, and small-scale fluctuations. It can also lead to delayed radiative responses to intermittent perturbations, such as ship-tracks. This strong mesoscale memory can complicate process attribution from satellite snapshot observations.

Our results highlight that mesoscale cloud organization needs to be considered in numerical modeling as well as in interpreting observations if we are to accurately constrain the response of stratocumulus to aerosol perturbations.

How to cite: Hernandez, B. and Glassmeier, F.: Mesoscale aerosol variability dominates stratocumulus-climate interactions, EGU General Assembly 2026, Vienna, Austria, 3–8 May 2026, EGU26-19943, https://doi.org/10.5194/egusphere-egu26-19943, 2026.

EGU26-20984 | Orals | AS3.7

Aerosol-cloud Interactions: Overcoming a Barrier to Projecting Near-term Climate Evolution and Risk 

Athanasios Nenes, Ulas Im, Bjørn H. Samset, Jennie L. Thomas, Harri Kokkola, Oleg Dubovik, Ralph A. Kahn, Trude Storelvmo, and Kostas Tsigaridis and the EC/ESA ACI Cluster

Aerosol–cloud interactions (ACI) are a major source of uncertainty in climate science, critically affecting our ability to project near-term climate evolution and assess societal risks. ACI influence effective radiative forcing, cloud dynamics, and precipitation patterns, yet remain insufficiently constrained due to limitations in observations, modeling, and process understanding. Uncertainty from ACI hampers robust policy advice across multiple domains—from estimating remaining carbon budgets and climate sensitivity, to anticipating regional extreme events and evaluating climate interventions such as solar radiation modification. Despite these important issues, ACI is often underappreciated or excluded from decision-making frameworks due to its complexity and lack of quantification.

This talk outlines a path forward to overcome these barriers by leveraging emerging opportunities in satellite remote sensing, ground-based and airborne observations, high resolution climate modeling, and machine learning. We identify key areas where rapid progress is feasible, including improved retrievals of cloud microphysical properties, better representation of natural aerosols in a warming world, and enhanced integration of observational and modeling communities. Even as anthropogenic aerosol and its impacts on clouds is reducing owing to emissions controls, addressing ACI uncertainties remains essential for refining climate projections, supporting effective mitigation and adaptation strategies, and delivering actionable science to policymakers in a rapidly changing climate system.

How to cite: Nenes, A., Im, U., Samset, B. H., Thomas, J. L., Kokkola, H., Dubovik, O., Kahn, R. A., Storelvmo, T., and Tsigaridis, K. and the EC/ESA ACI Cluster: Aerosol-cloud Interactions: Overcoming a Barrier to Projecting Near-term Climate Evolution and Risk, EGU General Assembly 2026, Vienna, Austria, 3–8 May 2026, EGU26-20984, https://doi.org/10.5194/egusphere-egu26-20984, 2026.

EGU26-23162 | Orals | AS3.7

Anthropogenic perturbations to anvil cloud radiative effects?  

Philip Stier, William Jones, Mathilde Ritman, Maor Sela, and Sadhitro De

The top-of-atmosphere net radiative effect of convective anvils is estimated to be close to zero and arises from a balance of significant short-wave cooling and long-wave warming over a complex diurnal cycle. When anvils are optically thick, the cooling due to daytime scattering of shortwave solar radiation dominates. In contrast, optically thin anvils have weaker scattering of solar radiation, so longwave warming becomes the dominant effect. Hence, it is essential to understand the controls of anvil radiative properties over the convective lifecycle, which arises from a complex interplay of convective cloud dynamics and microphysics. The convective mass flux modulates anvil extent, and changes in ice crystal size and morphology affect anvil lifetime and radiative properties. Convective anvils have been proposed to respond to global warming (cloud feedbacks) and anthropogenic aerosols (aerosol-cloud interactions). However, the associated uncertainties remain large and key relevant processes are not represented in the current generation of climate models. Emerging kilometre-scale climate models present new opportunities to examine these effects at the process level.

In this work we bring together multiple research strands to quantify the controls of convective anvil clouds and associated radiative effects over the convective lifecycle towards understanding its sensitivity to climate and air pollution changes. We use the tobac cloud tracking framework to track convective cores and associated anvils in 4D across regional and global km-scale ICON model simulations which allows us to quantify the link between convective mass flux, anvil extent and anvil radiative properties. We apply this framework to regional high-resolution simulation of ICON coupled to HAM-lite, our reduced complexity aerosol model derived from the microphysical aerosol scheme HAM [Weiss et al., GMD, 2025], to explore the sensitivity of anvils and their radiative effects to aerosol perturbations in the context of the ORCHESTRA/EarthCARE Model Intercomparison Project (ECOMIP) as well as the TRACER campaign MIP. We find that an increase in aerosol increases cloud droplet numbers, suppresses warm rain formation, increases convective mass flux and thereby upper tropospheric ice water content and will discuss how these changes translate into anvil cloud radiative effects. Prototype next generation km-scale climate models are implicitly already including such anvil radiative effects; however, these currently remain unconstrained by observations. We develop novel observational constraints on the convective anvil cloud lifecycle through consistent tracking of convection using the tobac-flow cloud tracking framework [Jones et al., 2024] between MSG SEVIRI observations and forward simulated geostationary satellite radiances from ICON model output.  This reveals that deep convective systems in ICON grow too fast and show a faster dissipation of thick to thin anvils than observations, which affects their radiative effects. 

Our work provides novel approaches to improve our understanding of aerosol effects on convective clouds and climate. 

How to cite: Stier, P., Jones, W., Ritman, M., Sela, M., and De, S.: Anthropogenic perturbations to anvil cloud radiative effects? , EGU General Assembly 2026, Vienna, Austria, 3–8 May 2026, EGU26-23162, https://doi.org/10.5194/egusphere-egu26-23162, 2026.

EGU26-552 | ECS | Orals | AS3.8

Contributions of local and long-range sources to the annual cycle of Arctic ice nucleating particles 

Megan Malpas, Markus Frey, Floortje van den Heuvel, and Xin Yang

Understanding ice nucleating particle (INP) concentrations, activation temperatures, and sources in the Arctic is necessary for constraining their contribution to Arctic amplification, due to their influence on the optical properties and lifetime of clouds. Despite this, Central Arctic INP observation studies are limited, and the relative contributions of local and long-range sources of INPs are not yet well understood. In this work, we present a dataset of year-round INP concentrations at 2-day resolution from aerosol filter samples taken during the 2019-20 MOSAiC (Multidisciplinary drifting Observatory for the Study of Arctic Climate) campaign, analysed using an immersion-mode droplet technique. We investigate the influence of long-range transportation events and local wind-blown sources on INP freezing spectra through comparisons with INPs measured from snow samples, major ions detected using ion chromatography, and aerosol concentrations in the diameter size range of 0.5–20 μm. We further constrain the impact of potential aerosol sources on total INP concentrations using a dilution series and background comparison method.

Our results show the presence of a distinct seasonal cycle, in agreement with previously reported observations. Warm-temperature INPs peak during summer, with INP concentrations at -15°C increasing to an average of 0.53 L-1  from 0.01 L-1 during the rest of the year. We also observe a period of low INP activity during November and December, ending with the onset of Arctic haze, and characterised by many samples being indistinguishable from background levels.

We observe a correlation between aerosol concentration and median INP activation temperature (R2 = 0.412). Our results show shifts to warmer activation temperatures on the order of 1 – 4 °C during aerosol peaks  of more than 10 cm-3 above background associated with both blowing snow, and long-range transportation events. We use this to highlight the influence of total INP concentration on freezing spectra observed from droplet freezing experiments. To further constrain the impact of blowing snow events and long-range transportation on INP populations, we present a collection of case studies that have been analysed using a series of targeted dilutions and comparisons with background INP spectra.

How to cite: Malpas, M., Frey, M., van den Heuvel, F., and Yang, X.: Contributions of local and long-range sources to the annual cycle of Arctic ice nucleating particles, EGU General Assembly 2026, Vienna, Austria, 3–8 May 2026, EGU26-552, https://doi.org/10.5194/egusphere-egu26-552, 2026.

EGU26-2568 | Posters on site | AS3.8

Marine carbohydrates in Arctic aerosol particles – connections to oceanic emissions and in-situ processing 

Manuela van Pinxteren, Sebastian Zeppenfeld, Jessie Creamean, Markus Frey, Julia Schmale, Benjamin Heutte, Manuel Dall´Osto, Clara Hoppe, Heike Wex, and Hartmut Herrmann

Carbohydrates are important components of marine organic aerosol particles and may influence Arctic cloud formation and properties, yet their sources and atmospheric fate remain poorly understood. We present the first year-round measurements of combined and dissolved carbohydrates (CCHOaer; DFCHOaer) in aerosol particles collected throughout the annual cycle of the MOSAiC expedition in 2019-2020. CCHOaer were detected in all seasons (0.5-17 ng m⁻³), and contributed between 0.03 and 2.2% (mean 0.3%) to the particulate mass. Their molecular composition was relatively stable and dominated by glucose, xylose, and galactose, with additional presence of uronic acids in summer. Both, CCHOaer and DFCHOaer showed pronounced summer maxima and seasonal variability that partially aligned with chlorophyll-a, nanophytoplankton, and heterotrophic microorganisms, indicating enhanced biological contributions after sea ice melt. The summer increase in DFCHOaer also coincided with warmer temperatures and higher humidity. In winter, the presence of carbohydrates may be sustained by microbial degradation or viral lysis of organic material in under-ice environments. CCHOaer and DFCHOaer concentrations showed no direct correlation to wind speed or air mass origins instead displaying a high variability in summer. The seasonal behavior of CCHOaer in Arctic aerosol particles differed from primary marine tracers like sodium that was associated with direct oceanic sources in summer and blowing snow in winter. This contrast suggests that carbohydrates, while possibly originated from marine biological sources, undergo significant atmospheric modification that overlay direct source signatures. Strong correlations between CCHOaer and low-molecular-weight organic acids further point to photochemical oxidation as an additional driver of secondary carbohydrate processing. CCHOaer displayed seasonal trends similar to warm-temperature ice-nucleating particles and hyper-fluorescent aerosol particles, supporting their role within a broader Arctic bioaerosol particle population. Overall, our results indicate that marine ecosystems provide a continuous source of atmospheric carbohydrates, but their composition is strongly modified by both biotic and abiotic processes, particularly in summer.

Acknowledgement: This work was supported by the DFG funded Transregio-project TRR 172 “Arctic Amplification (AC)3“.

How to cite: van Pinxteren, M., Zeppenfeld, S., Creamean, J., Frey, M., Schmale, J., Heutte, B., Dall´Osto, M., Hoppe, C., Wex, H., and Herrmann, H.: Marine carbohydrates in Arctic aerosol particles – connections to oceanic emissions and in-situ processing, EGU General Assembly 2026, Vienna, Austria, 3–8 May 2026, EGU26-2568, https://doi.org/10.5194/egusphere-egu26-2568, 2026.

EGU26-3336 | ECS | Orals | AS3.8

Impact of air parcel history on Arctic cloud glaciation: a large-scale back trajectory analysis 

Louis Castin, Quentin Coopman, and Jérôme Riedi

The Arctic is warming at unprecedented rates, yet climate models struggle to accurately represent key processes such as aerosol–cloud interactions in polar regions. The coexistence and interactions of liquid droplets and ice crystals within clouds, and the influence of aerosols acting as ice-nucleating particles or condensation nuclei, remain poorly understood because of the complexity of the microphysical processes involved. Previous studies have primarily focused on the relationship between cloud phase and instantaneous aerosol properties, often neglecting the physico-chemical evolution of air parcels during long-range transport.

To address this gap, we introduce the ARctic Clouds History and ThermodYnamic PhasE dataset (ARCHTYPE), which leverages DARDAR-MASKv2 retrieval products. These products combine data from the Cloud-Aerosol Lidar with Orthogonal Polarization (CALIOP) and the CloudSat Cloud Profiling Radar (CPR), both part of the A-Train constellation. In DARDAR-MASKv2, each atmospheric pixel (60 m vertical resolution, 1.7 km along-track) is classified into specific categories, for example, warm rain, clear sky, or ice cloud. Using a cloud detection algorithm, we extract cloud positions and parameters, including ice fraction and the spatial distribution of ice and liquid pockets within mixed-phase clouds.

For each identified cloud, we compute 96-hour back trajectories initialised at the top layer of the cloud using NOAA’s Hybrid Single-Particle Lagrangian Integrated Trajectory model (HYSPLIT) with the European Centre for Medium-Range Weather Forecasts Reanalysis v5 (ERA5) reanalysis as input meteorological data. We then co-locate along the back trajectories several environmental parameters: sea ice concentration from the Advanced Microwave Scanning Radiometer satellite observations (AMSR2), meteorological parameters from ERA5 and aerosol mixing ratios from the Modern-Era Retrospective analysis for Research and Applications, v2 (MERRA-2). The final ARCHTYPE product comprises millions of co-located back trajectories, offering a statistically robust dataset to investigate how air parcel history influences the thermodynamic phase of Arctic clouds.

In this presentation, we showcase the first results derived from this dataset, covering the period from 2006 to 2011. Preliminary analysis focusing on sea salt and dust aerosols indicates that cloud homogeneity increases with dust and decreases with sea salt. It also shows that, at low cloud top temperatures, ice fraction increases with dust content.

Beyond examining the general impact of air parcel history on cloud thermodynamic phases, we explore specific research questions: Are there regions that consistently receive aerosols from distant sources, and how do these transport patterns vary across the Arctic? What is the effect of sea ice variations on biogenic compound concentrations and sea spray aerosol production, and how does this influence low-level cloud formation? Finally, which aerosol ageing processes dominate during the long-range transport of air masses contributing to Arctic cloud formation?

How to cite: Castin, L., Coopman, Q., and Riedi, J.: Impact of air parcel history on Arctic cloud glaciation: a large-scale back trajectory analysis, EGU General Assembly 2026, Vienna, Austria, 3–8 May 2026, EGU26-3336, https://doi.org/10.5194/egusphere-egu26-3336, 2026.

This study investigates aerosol–cloud–radiation interactions over the Arctic using the Weather Research and Forecasting model coupled with chemistry (WRF-Chem) together with an aerosol-aware microphysics scheme. In the atmosphere, aerosols directly affect the radiation budget by absorbing and scattering solar radiation (Jin et al., 2014), and indirectly by modifying cloud albedo and lifetime (Li et al., 2018). Aerosols also act as nuclei for heterogeneous condensation and promote cloud droplet formation; therefore, changes in aerosol number concentration are expected to alter cloud droplet number and size distributions and, in turn, cloud properties (Ramanathan et al., 2001). Also, Aerosol size distribution can play an important role under high aerosol loadings, whereas aerosol composition tends to be much less important, except perhaps under very polluted conditions and low updraught velocities (McFiggans et al., 2006).

More recently, dust sources in the northern high latitudes have received increased attention (Meinander et al., 2022). high-latitude dust is defined as dust emitted from regions north of 50°N (Bullard et al., 2016). Observations and modeling studies suggest that high-latitude dust can act as an efficient ice-nucleating particle (INP), promoting the conversion of cloud droplets to ice crystals. This can strongly reduce the cloud’s liquid water content, lower its albedo, and make the underlying surface more exposed.

Aerosol size distribution strongly controls how many particles can activate as cloud condensation nuclei (CCN) and also affects aerosol optical properties. Therefore, changing particle size, even if all other model settings are kept the same, can change the CCN-active particle population. In mixed-phase clouds, ice formation depends on ice-nucleating particles, and mineral dust is an important source of these particles.  To isolate the role of particle size from confounding influences, we conduct one control simulation and a suite of sensitivity experiments in which dust mass is redistributed toward finer versus coarser size bins within a sectional (size-bin) aerosol representation, while keeping the remaining model configuration fixed. Preliminary analyses suggest that changing particle size alone leads to only small changes in cloud properties and radiation, likely because the results are mainly controlled by meteorology (e.g., vertical motion, moisture, and stability) or because the microphysics scheme does not strongly transfer aerosol changes into cloud optical properties and radiative fluxes. Accordingly, we advance a more targeted experimental methodology that explicitly separates CCN and INP pathways. The first step applies direct, controlled perturbations to CCN-relevant aerosol number to generate clean-to-polluted contrasts; the second step independently varies dust INP activity to isolate ice-nucleation pathways; and the framework is configured to distinguish direct radiative effects from indirect (microphysical) effects.

Finally, diagnostics are performed in a regime-based case by stratifying clouds by thermodynamic phase (liquid-dominated versus mixed-phase clouds) and by large-scale forcing (regions of ascent and moisture-flux convergence versus moisture divergence and subsidence). This approach is intended to identify conditions under which aerosol sensitivity is expected to be maximized and to facilitate evaluation against observational and satellite-derived products.

How to cite: Fattahi Masrour, P. and Coopman, Q.: Aerosol–cloud interactions in Arctic mixed-phase clouds under dust size perturbations in a regional chemical weather modeling system (WRF-Chem) , EGU General Assembly 2026, Vienna, Austria, 3–8 May 2026, EGU26-3401, https://doi.org/10.5194/egusphere-egu26-3401, 2026.

EGU26-5075 | Posters on site | AS3.8

Future Directions for Aerosol-Cloud-Precipitation Interaction Research in the Arctic from the QuIESCENT 2024 Workshop 

Quentin Coopman, Lauren Zamora, Gijs de Boer, Radiance Calmer, Imogen Wadlow, Georgia Sotiropoulou, and Edward Gryspeerdt

Aerosol-cloud interactions in the Arctic, especially with mixed-phase clouds, remain one of the largest sources of uncertainty in climate projections. The 2024 QuIESCENT workshop, held in Lausanne, Switzerland, gathered researchers from around the world to tackle these challenges and define a collaborative roadmap for future research.

This poster explores the workshop’s central themes, emphasizing the urgent need for continuous, long-term observations of cloud condensation nuclei and ice-nucleating particles, as well as the importance of advanced vertical profiling techniques using cutting-edge platforms like uncrewed aerial systems and tethered balloon systems. The poster highlights how emerging technologies, such as artificial intelligence, machine learning, and next-generation remote sensing tools like the EarthCARE satellite, are revolutionizing our ability to collect and analyze data in this remote and rapidly changing environment.

A key focus will be on the evolving sources of Arctic aerosols, including shipping emissions, wildfires, and microplastics, and their complex impacts on cloud formation and climate feedbacks. The poster will also address the critical role of international collaboration and the inclusion of understudied regions.

By synthesizing the workshop’s outcomes, this poster aims to highlight how these insights can inform upcoming global initiatives, such as the International Polar Year 2032-33, and foster coordinated efforts to reduce uncertainties in Arctic climate projections. Join us to discuss how the scientific community can collectively advance our understanding of Arctic aerosol-cloud interactions and their global climate impacts.

Keywords: Arctic, aerosol-cloud interactions, mixed-phase clouds, field campaigns, remote sensing

How to cite: Coopman, Q., Zamora, L., de Boer, G., Calmer, R., Wadlow, I., Sotiropoulou, G., and Gryspeerdt, E.: Future Directions for Aerosol-Cloud-Precipitation Interaction Research in the Arctic from the QuIESCENT 2024 Workshop, EGU General Assembly 2026, Vienna, Austria, 3–8 May 2026, EGU26-5075, https://doi.org/10.5194/egusphere-egu26-5075, 2026.

EGU26-6049 | Orals | AS3.8

Antarctic Continental Outflow as a Transport Pathway for Elevated Gaseous MSA and Biogenically Dominated Cloud Condensation Nuclei: Insights from the MISO Voyage 

Branka Miljevic, Joel Alroe, Marc D. Mallet, Abithaswathi Muniraj Saraswathy, Alain Protat, Gerald G. Mace, Kelsey Barber, Sreenath Avaronthan Veettil, Tahereh Alinejadtabrizi, Ruhi S. Humphries, and Sally Taylor

Global climate models perform particularly poorly over the Southern Ocean, resulting in persistent cloud and radiation biases. This is in part driven by incomplete understanding of the aerosol formation and transformations over the Southern Ocean and their influence cloud formation and properties. Oxidation of volatile sulfur compounds, in particular dimethyl sulfide (DMS), and the subsequent secondary particle formation, is an important source of aerosols in the Southern Ocean atmosphere (and in marine environments in general). This presentation will focus on terminal oxidation products of volatile sulfur compounds, namely sulfuric acid (SA) and methanesulfonic acid (MSA), in both gas and particle phase observed during the 2024 Multidisciplinary Investigations of the Southern Ocean (MISO) voyage (Jan – March 2024) aboard the Australian Research Vessel Investigator and covering the western Pacific sector of the Southern Ocean (110o – 150o E). These species are investigated and will be presented in the context of air mass origin and synoptic meteorology.

A notable feature of the voyage were periods of elevated gaseous MSA south of ~62o S, coinciding with increased particulate sulfate and MSA, as well as enhanced cloud condensation nuclei (CCN) concentrations. These periods were found to be associated with Antarctic continental outflow and the air masses to have free tropospheric origin. By using E-AIM thermodynamic modelling we show that aerosol particles during MISO voyage were highly acidic (pH < -1) and that the elevated gaseous MSA is a result of evaporation from these highly acidic particles. Evaporation of MSA from highly acidic aerosols during Antarctic continental outflow has already been reported for the 2018 CAPRICORN-2 voyage which covered a very similar geographical region (Miljevic et al., 2025). The recent MISO voyage further highlights long range transport as an important pathway for biogenically dominated CCN and brings into focus MSA gas-particle partitioning as a relevant process in the marine sulfur cycle.

Reference:

Miljevic, B., Mallet, M. D., Osuagwu, C. G., Ristovski, Z. D., Humphries, R. S., Selleck, P., Taylor, S., & Keywood, M. D. (2025). Aerosol acidity controls methanesulfonic acid evaporation from aerosols during Antarctic katabatic outflow. Communications Earth & Environment, 6(1), 1057. https://doi.org/10.1038/s43247-025-03041-2

How to cite: Miljevic, B., Alroe, J., Mallet, M. D., Muniraj Saraswathy, A., Protat, A., Mace, G. G., Barber, K., Avaronthan Veettil, S., Alinejadtabrizi, T., Humphries, R. S., and Taylor, S.: Antarctic Continental Outflow as a Transport Pathway for Elevated Gaseous MSA and Biogenically Dominated Cloud Condensation Nuclei: Insights from the MISO Voyage, EGU General Assembly 2026, Vienna, Austria, 3–8 May 2026, EGU26-6049, https://doi.org/10.5194/egusphere-egu26-6049, 2026.

Sea ice and snow are key interfaces linking the ocean and atmosphere in polar regions, yet their role in driving biogeochemical coupling among halogens, aerosols, and clouds remains incompletely understood. Here, we show that ice-mediated chemical reactions provide an efficient pathway connecting sea ice and snowpack chemistry to atmospheric halogen activation, aerosol formation, and climate-relevant processes in polar environments.

Freezing processes induce strong solute enrichment, pH shifts, and microstructural heterogeneity within sea ice and snow, creating reactive interfacial environments that promote redox and photochemical transformations of iodine and bromine species. Laboratory experiments demonstrate that iodate, bromate, and halide species undergo accelerated reactions in ice involving natural organic matter, iron oxides, and nitrogen oxides, leading to the production of molecular halogens, reactive halogen intermediates, and organohalogen compounds. These ice-phase reactions are substantially enhanced relative to liquid systems and are further amplified under polar irradiation conditions.

Field observations reveal inorganic halogen speciation patterns in snow and sea-ice-influenced environments that are inconsistent with passive deposition alone, supporting the occurrence of active in-ice chemical processing. The resulting release of reactive halogen species facilitates air–ice exchange, contributes to boundary-layer halogen activation, and influences aerosol oxidation pathways, with potential impacts on cloud condensation nuclei and polar cloud formation.

Our findings highlight sea ice and snow as active biogeochemical reactors that couple oceanic halogen reservoirs to the atmosphere. As climate-driven changes in sea ice extent, snow cover, and freeze–thaw dynamics continue, ice-driven halogen chemistry is expected to modulate aerosol–cloud–ocean–sea ice interactions in polar regions, representing a previously underappreciated feedback in the polar climate system.

How to cite: Kim, K.: Freeze-Induced Halogen Redox Chemistry in Sea Ice and Snow Linking Oceanic Sources to Polar Aerosols, EGU General Assembly 2026, Vienna, Austria, 3–8 May 2026, EGU26-6143, https://doi.org/10.5194/egusphere-egu26-6143, 2026.

EGU26-6826 | Orals | AS3.8

Biogeochemical aerosol processes in Southern Greenlandic fjord systems 

Julia Schmale, Joanna Alden, Nora Bergner, and Mihnea Surdu and the GreenFjord Project Team

Greenlandic fjord ecosystems undergo accelerated change as they are at the nexus of the pressures from the ocean, ice, land and atmosphere. The Swiss Polar Institute Flagship program GreenFjord (Greenlandic fjord ecosystems in a changing climate: socio-cultural and environmental interactions) investigated biogeochemical aerosol processes in two contrasting fjords in southern Greenland between 2022 and 2025. One fjord represented a system, where glaciers still terminate in the ocean (marine-terminating fjord), while another represented a system, where only streams from land-terminating glaciers (land-terming fjord) enter the ocean. The two ways of adding fresh-water result in very different fjord dynamics of water and nutrient movement, and therefore in different microbial productivity. In addition, the land surface types surrounding the fjords are also distinct.

From an ocean perspective and to understand if these differences impact atmospheric chemical composition, we performed measurements of new particle formation, volatile organic compounds and aerosol chemical composition, and find indeed different processes across the fjords with impacts on the cloud condensation nuclei (CCN) budget. From a land perspective, in a land-terminating system, glacial outwash plains typically form and constitute potentially large sources of ice nucleating particles (INP). We investigated the freezing spectra and atmospheric contribution of glacial dust to the aerosol population.

This presentation will provide an overview of the GreenFjord project and delves into the natural contribution of CCN and INP from fjord systems.

How to cite: Schmale, J., Alden, J., Bergner, N., and Surdu, M. and the GreenFjord Project Team: Biogeochemical aerosol processes in Southern Greenlandic fjord systems, EGU General Assembly 2026, Vienna, Austria, 3–8 May 2026, EGU26-6826, https://doi.org/10.5194/egusphere-egu26-6826, 2026.

EGU26-8139 | Orals | AS3.8

What Controls the Macrophysical and Microphysical Properties of Arctic Clouds during Cold Air Outbreaks: Results from CAESAR 

Greg McFarquhar, Zeqian Xia, Yongjie Huang, Nick Amundsen, Bart Geerts, Holger Vomel, Zhien Wang, and Paquita Zuidema

There is a strong need to determine how boundary cloud properties vary with surface, environmental and aerosol conditions in high latitudes during cold air outbreaks (CAOs) to determine processes controlling the evolution of these clouds. In-situ cloud microphysical, thermodynamic, and remote sensing measurements made on a C130 aircraft during the 2024 CAO Experiment in the Sub-Arctic Region (CAESAR) field campaign over the Norwegian and Greenland Sea are used to quantify how vertical cloud and thermodynamic profiles vary with environmental conditions, and how they transform downstream from the ice edge to warmer oceans. The majority of clouds sampled were either liquid- or mixed-phase, with few entirely ice-phase clouds. Ramped ascents and descents through cloud are used to determine how vertical profiles of total number concentration, liquid water content, ice crystal concentration, ice mass content, liquid and ice effective radius, and median volume diameter as functions of normalized altitude (zn, where zn=0 at cloud base and zn=1 at cloud top) vary with environmental conditions. Results show considerable variability, but profiles exhibit clear dependence on estimated inversion strength (EIS), with higher cloud droplet number concentrations, lower effective radii for liquid and ice particles, and lower large ice crystal number concentration and water content for higher EIS. Dependence on other environmental conditions will also be shown. Data from the 16 March 2024 flight when 36 dropsondes were released, are then used to determine how cloud and environmental properties vary across five distinct zones: the sea ice zone, zone near the edge of the sea ice with shallow cumulus clouds, zone characterized by well-organized cloud streets, zone featuring disorganized cloud streets on northern side of a polar low, and the polar low zone. Environmental parameters, including the M index, LTS (lower tropospheric stability), EIS, boundary layer (BL) height, and the vertical distribution of temperature and humidity within the BL, vary across these five zones. Additionally, cloud macrophysical properties such as cloud top and base heights and temperature, cloud cell width, number within a 50-km observation window, and cloud albedo, along with microphysical properties including liquid water content and liquid water fraction (LWF), also change across zones. These variations highlight the spatial, macro- and micro-physical, and thermodynamic gradients as CAO air moves downstream. To uncover mechanisms driving differences in zone properties, simulations conducted with the Weather Research and Forecasting (WRF) model shown to reproduce observed cloud patterns and vertical structures, are utilized. WRF simulations reveal that mixed-phase shallow cumulus located near the sea ice edge contained a supercooled liquid layer near their tops. These clouds had higher LWF near cloud top compared to both well-organized and disorganized cloud streets. Additionally, polar low clouds primarily consisted of ice. A Random Forest model, utilizing WRF output, shows LTS was the most important factor in predicting the number of cloud cells. In contrast, relative humidity (RH) between 0 and 2 km had the greatest influence on cloud cell width and cloud base height, while RH between 2 and 4 km was most critical for predicting cloud base heights.

How to cite: McFarquhar, G., Xia, Z., Huang, Y., Amundsen, N., Geerts, B., Vomel, H., Wang, Z., and Zuidema, P.: What Controls the Macrophysical and Microphysical Properties of Arctic Clouds during Cold Air Outbreaks: Results from CAESAR, EGU General Assembly 2026, Vienna, Austria, 3–8 May 2026, EGU26-8139, https://doi.org/10.5194/egusphere-egu26-8139, 2026.

EGU26-8683 | ECS | Posters on site | AS3.8

Shipborne Measurements of Mineral Dust and Black Carbon Aerosols over the Southern Ocean in the Austral Summer 

Atsushi Yoshida, Yutaka Tobo, Hiroshi Kobayashi, Kouji Adachi, Nobuhiro Moteki, and Jun Inoue

Atmospheric mineral dust and black carbon (BC) aerosols play important roles in the Earth’s climate system, yet direct observations over the Southern Ocean (SO) are scarce. In this study, we present the characteristics of airborne water-insoluble particles collected during a cruise of the R/V Shirase in the Australian and Indian sectors of the SO from December 2022 to March 2023. Using a complex amplitude sensor, we measured complex scattering amplitude of individual water-insoluble particles. Based on the measured complex scattering amplitude, which depends on particle composition, size, and shape, we classified into dust-like (0.50–5.0 µm in diameter) and BC-like (0.15–0.50 µm in diameter) particles. The number (mass) concentrations of dust-like and BC-like aerosols were 0.013–9.2 L-1 (0.52–32 ng m-3) and 5.4–2.3×10² L-1 (0.065–2.1 ng m-3), respectively. For dust-like aerosols, the highest concentration was observed in a region closest to Australia in this cruise, indicating strong influence of the emission from mid-latitude continents. Furthermore, a sample collected nearest to the Antarctic coast exhibited relatively high dust-like aerosol concentrations than that collected in most offshore regions away from both mid-latitude and Antarctic continents, suggesting that the Antarctic continent might be a potential source of dust aerosols. For BC-like aerosols, their concentration showed a clear latitudinal gradient, decreasing with distance from mid-latitude sources even close to the Antarctic coast.

How to cite: Yoshida, A., Tobo, Y., Kobayashi, H., Adachi, K., Moteki, N., and Inoue, J.: Shipborne Measurements of Mineral Dust and Black Carbon Aerosols over the Southern Ocean in the Austral Summer, EGU General Assembly 2026, Vienna, Austria, 3–8 May 2026, EGU26-8683, https://doi.org/10.5194/egusphere-egu26-8683, 2026.

EGU26-10880 | Orals | AS3.8

Insights into Cloud Processes from In Situ UAV-Based Cloud Observations and Aerosol-Aware Numerical Simulations 

Sami Romakkaniemi, Ari Leskinen, Silvia Calderon, Noora Hyttinen, Uula Isopahkala, Konstantinos Doulgeris, Ville Kaikkonen, Eero Molkoselkä, Anssi Mäkynen, Dmitri Moisseev, Mika Komppula, and David Brus

Understanding the complex interactions between aerosols, cloud microphysics, and dynamics is essential for accurately predicting cloud behavior and its impacts on the climate system. One of the key open questions concerns how cloud liquid water path responds to changes in cloud droplet number concentration. Turbulent mixing, initiated by radiative cooling near the cloud top, plays a central role in this feedback by modifying cloud microphysical properties. This mechanism has been suggested as a primary explanation for the observed reduction in cloud liquid water content with increasing aerosol concentration over the global oceans.

In this study, we provide new insights based on observations of subarctic low-level clouds combined with model-assisted analysis of the coupling between boundary-layer dynamics and cloud microphysical processes. The work benefits from unique measurement capabilities at Pallas, Finland, where unmanned aerial vehicle (UAV) systems can be operated up to 2000 m agl and beyond the visual line of sight, supported by ACTRIS cloud and aerosol measurement facilities. We present high-frequency surface-based and airborne in situ datasets collected using multiple cloud droplet sensors and compare them with surface-based remote sensing products. In addition, we employ UCLALES-SALSA, a large-eddy simulation model with sectional aerosol–cloud–precipitation microphysics, to investigate the processes controlling both mean cloud properties and the spatial variability of cloud droplet size distributions in relation to cloud dynamics. This combined observational and modeling approach improves our understanding of differences between surface-based and airborne in situ observations and provides high-quality reference data for the validation of remote sensing products.

How to cite: Romakkaniemi, S., Leskinen, A., Calderon, S., Hyttinen, N., Isopahkala, U., Doulgeris, K., Kaikkonen, V., Molkoselkä, E., Mäkynen, A., Moisseev, D., Komppula, M., and Brus, D.: Insights into Cloud Processes from In Situ UAV-Based Cloud Observations and Aerosol-Aware Numerical Simulations, EGU General Assembly 2026, Vienna, Austria, 3–8 May 2026, EGU26-10880, https://doi.org/10.5194/egusphere-egu26-10880, 2026.

Using model output from the Radiative Forcing Model Intercomparison Project (RFMIP), endorsed by the sixth Coupled Model Intercomparison Project 6 (CMIP6), we investigated the impact of aerosols on the Arctic climate (averaged over the region north of 66°N) during winter. The average of these models shows that the present-day aerosols (as of the year 2014) result in a positive aerosol effective radiative forcing (ERFaer) of approximately 0.14 W m–2 in the Arctic during winter, relative to pre-industrial conditions defined as those of the year 1850. This positive ERFaer is associated with enhanced aerosol loading through strong transport from Eurasia and adjoining regions, causing the Arctic region to warm by up to 1 K in the present-day compared to the pre-industrial conditions. The Arctic warming attributed to aerosols also significantly affects climate variability, particularly the Arctic Oscillation (AO). Present-day aerosols resulted in a positively skewed distribution of the Arctic Oscillation index (AOI) compared to the control simulation, reflecting a shift toward more frequent positive AO phases associated with negative sea level pressure (SLP) anomalies across the northern Atlantic, Pacific, and Eurasian regions, and positive SLP anomalies over northern North America. Additionally, the transient experiment, which includes time-varying aerosol emissions, is used to investigate the sensitivity of Arctic winter climate to the aerosol enhancement, based on low and high aerosol scenarios. During the high aerosol scenario, warming in near-surface air temperature (SAT) is concentrated over the Arctic region, reaching approximately 1 K, while less warming is simulated in the low aerosol scenario. The AOI distribution is positively skewed in both aerosol scenarios, indicating that changes in aerosol concentrations influence the AO. However, the skewness is weaker under the high aerosol scenario compared to the low aerosol case, suggesting that stronger aerosol forcing tends to stabilize the AO and limit its variability. Nevertheless, increased sensitivity of the AO to aerosol can lead to extreme weather, particularly warmer winters in the Arctic, in contrast to most of the Northern Hemisphere, regardless of the AO phase. Our analysis also suggests that aerosol enhancement contributes to a shift in the jet stream’s position. Furthermore, the lapse rate feedback (LRF), a contributor to the Arctic amplification, also shows an increase due to aerosol enhancement. This indicates that both the strength and magnitude of the LRF are sensitive to aerosol concentrations, which may further intensify Arctic warming/amplification.

The results have been published:
Al Hajjar, K., Dipu, S., Quaas, J., Linke, O. and Haustein, K. (2025) ‘Exploring the Sensitivity of Arctic Winter Climate to Aerosol Loading as Simulated in CMIP6’, Tellus B: Chemical and Physical Meteorology, 77(1), p. 20–40. Available at: https://doi.org/10.16993/tellusb.1885.

How to cite: Al Hajjar, K.: Exploring the Sensitivity of Arctic Winter Climate to Aerosol Loading as Simulated in CMIP6, EGU General Assembly 2026, Vienna, Austria, 3–8 May 2026, EGU26-11218, https://doi.org/10.5194/egusphere-egu26-11218, 2026.

EGU26-11848 | Posters on site | AS3.8

Modeling impacts of surface-active organics on CCN activation 

Guangxing Lin

Atmospheric aerosols often contain surface‐active organics, which reduce surface tension and
enhance cloud droplets activation. This effect is often neglected in the application of Köhler theory where a
constant surface tension equivalent to pure water is assumed. Using a cloud parcel model, we evaluated the
impact of four representative surface‐active organics, humic‐like substances (HULIS), sodium dodecyl sulfate
(SDS), cis‐pinonic acid, and dicarboxylic acids, on cloud condensation nuclei (CCN) activation under varied
atmospheric conditions. Our results indicate that HULIS significantly enhance CCN activation, particularly at
high aerosol concentrations, low updraft velocities, and small particle sizes. SDS, cis‐pinonic acid, and
dicarboxylic acids also increase activation but to a lesser degree. The surface activity of HULIS has a stronger
influence on CCN activation than its hygroscopicity, with particle size being the most sensitive parameter. This
study emphasizes the need to incorporate surface‐active organics into climate models to improve the prediction
of aerosol‐cloud interactions.

How to cite: Lin, G.: Modeling impacts of surface-active organics on CCN activation, EGU General Assembly 2026, Vienna, Austria, 3–8 May 2026, EGU26-11848, https://doi.org/10.5194/egusphere-egu26-11848, 2026.

EGU26-12350 | ECS | Orals | AS3.8

Observational constraints on Arctic radiative forcing due to aerosol-cloud interactions 

Oscar O'Flanagan and Edward Gryspeerdt

Anthropogenic aerosols can have a significant impact on the Earth’s radiation budget through their interactions with clouds. The effective radiative forcing due to aerosol-cloud interactions (ERFaci) is believed to be negative globally, albeit with significant uncertainty. Despite the region experiencing rapid climate change, climate models have so far failed to constrain the sign of ERFaci in the Arctic, while observation-based estimates of ERFaci in the polar regions are challenging due to a relative lack of ground-based observatories and uncertainties in satellite retrievals.  

Here we provide an observation-based estimate of the top-of-atmosphere radiative forcing due to aerosol-cloud interactions in the Arctic using passive remote sensing satellite data and aerosol reanalyses. To address potential satellite retrieval errors over sea ice and at high latitudes, we use observed cloud optical thickness from the Cloud-Aerosol Lidar with Orthogonal Polarization (CALIOP) to measure the accuracy of passive retrievals of cloud properties from the Moderate Resolution Imaging Spectrometer (MODIS). We find strong agreement on cloud detection for optically thicker clouds, which represent the large majority of the clouds used in this study. 

The effective radiative forcing from adjustments in cloud fraction and cloud water path are calculated using droplet number concentration as a mediating variable. The ERFaci in liquid clouds over the Arctic ocean and sea ice is found to be negative on average, with a stronger forcing over the ocean. Negative forcings from instantaneous changes in cloud droplet number concentration and subsequent cloud fraction adjustments are partially offset by a positive forcing caused by apparent decreases in cloud water path. The data suggests that the overall ERFaci in the Arctic is more likely negative compared to previous estimates from model outputs, but smaller in magnitude compared to lower latitudes due to reduced insolation and higher surface albedo. As anthropogenic aerosol emissions in the Arctic are expected to increase in the coming decades, a stronger ERFaci could follow and partially offset other positive forcings. These results for the present-day forcing could constrain model outputs of future Arctic radiative forcing, reducing the contribution of aerosol-cloud processes to the overall uncertainty.

How to cite: O'Flanagan, O. and Gryspeerdt, E.: Observational constraints on Arctic radiative forcing due to aerosol-cloud interactions, EGU General Assembly 2026, Vienna, Austria, 3–8 May 2026, EGU26-12350, https://doi.org/10.5194/egusphere-egu26-12350, 2026.

EGU26-13131 | Posters on site | AS3.8

Ice Nuclei properties in seawater, sea ice and brine from the Southern Ocean, Weddell Sea and Antarctic Peninsula: on the potential anti-freezing properties of polar microbiota 

Evelyn Freney, Karine Sellegri, Odile Crabeck, Arianna Rocchi, Bruno Delille, Laetitica Bouvier, Elisa Bardet, Manuel Dall'Osto, and Rafel Simo

Early studies from the 90’s on INPs in the Southern Ocean (SO) have already revealed lower INP concentrations in the SO region than in other marine regions. This feature was confirmed in recent measurements and modeling exercises, with implications on our ability to model the cloud persistence in the Southern Ocean. The INP populations found in these regions were commonly organic and heat-stable, which contradicts the hypothesis of microorganism promoting ice nuclei formation. Here we present results from the POLARCHANGE ship campaign where samples of Southern Ocean seawater were taken and analyzed across a latitudinal gradient down to the vicinity of sea ice formed in the Weddell Sea. In addition, samples of Sea Ice cores were collected and ice nuclei particle (INP) concentrations were analyzed at various depths of the Sea Ice cores, and within brine samples. The comparison between Sea Ice, brine and Seawater INP concentrations latitudinal gradient, in relation with the biogeochemical properties of these different compartments provides insight into processes that could explain the very low INP concentrations in the SO and polar atmosphere. 

How to cite: Freney, E., Sellegri, K., Crabeck, O., Rocchi, A., Delille, B., Bouvier, L., Bardet, E., Dall'Osto, M., and Simo, R.: Ice Nuclei properties in seawater, sea ice and brine from the Southern Ocean, Weddell Sea and Antarctic Peninsula: on the potential anti-freezing properties of polar microbiota, EGU General Assembly 2026, Vienna, Austria, 3–8 May 2026, EGU26-13131, https://doi.org/10.5194/egusphere-egu26-13131, 2026.

EGU26-13579 | ECS | Posters on site | AS3.8

Using uncrewed aerial systems at the sub-arctic site Pallas to study aerosol–cloud interactions 

Anna Voss, Konrad Bärfuss, David Brus, Konstantinos-Matthaios Doulgeris, Malte Schuchard, Sebastian Düsing, Andreas Schlerf, Birgit Wehner, and Astrid Lampert

Low-level clouds play a crucial role in the Arctic climate system, for example by contributing to surface warming. Although many efforts have been made to investigate low-level clouds, there is still a significant in-situ data gap within the atmospheric boundary layer (ABL) and the lower troposphere. While long-term ground-based observatories provide valuable continuous measurements, they cannot resolve the vertical structure of aerosols and clouds.

To address this data gap, five uncrewed aerial systems (UAS) were deployed during two intensive measurement campaigns at the Pallas Atmosphere-Ecosystem Supersite in northern Finland in spring (4–12 April 2025) and autumn (16–30 September 2025). Fixed-wing, vertical take-off and landing (VTOL), and multirotor platforms were operated jointly by the Finnish Meteorological Institute (FMI) and the Technische Universität Braunschweig. In total, 246 measurement flights were conducted, reaching altitudes of up to 2 km above ground level and conducting over 80 hours of in-situ sampling.

The UAS were equipped with different sensors to measure aerosols, including two condensation particle counters with different cut-offs to measure the aerosol particle number concentration, a Partector 2 Pro to measure the size distribution between 10 and 300 nm and a POPS to measure the size distribution between 115 and 3370 nm. In addition meteorological parameters, and cloud droplet properties were also measured.  This enables a detailed characterization of the vertical distribution of aerosols and their interaction with the ABL and low-level clouds. These measurements were compared to long-term observations from the nearby ground-based observatory Sammaltunturi. This study demonstrates the value of combining ground-based measurements with UAS profiling when investigating aerosol-cloud interactions.

Preliminary results indicate pronounced seasonal differences. Spring conditions were dominated by new particle formation events associated with long-range air mass transport from the central Arctic. In contrast, autumn measurements were strongly influenced by low-level cloud formation and local aerosol sources. Overall, this campaign demonstrates the added value of UAS observations in improving the understanding of aerosol-cloud interactions in the sub-Arctic and enhancing the interpretability of existing ground-based datasets.

How to cite: Voss, A., Bärfuss, K., Brus, D., Doulgeris, K.-M., Schuchard, M., Düsing, S., Schlerf, A., Wehner, B., and Lampert, A.: Using uncrewed aerial systems at the sub-arctic site Pallas to study aerosol–cloud interactions, EGU General Assembly 2026, Vienna, Austria, 3–8 May 2026, EGU26-13579, https://doi.org/10.5194/egusphere-egu26-13579, 2026.

EGU26-13679 | Posters on site | AS3.8

Spatial patterns and long-term trends of primary marine organic aerosol in the Arctic 

Bernd Heinold, Anisbel Leon-Macros, Manuela van Pinxteren, Sebastian Zeppenfeld, Moritz Zeising, and Astrid Bracher

Primary marine organic aerosol (PMOA) constitutes an important fraction of the aerosol population over remote oceanic regions and plays a relevant role in aerosol–cloud–climate interactions. In the Arctic, ongoing sea-ice retreat and intensified summer ice loss are expected to enhance marine aerosol emissions. Here, we employ an extended version of the aerosol–climate model ECHAM6.3-HAM2.3 to examine the spatial distribution and long-term temporal evolution of PMOA emissions and transport in the Arctic for the period 1990–2019, accounting for changing climatic and sea-ice conditions. Marine biogeochemical fields are provided by the offline model FESOM2.1-REcoM3, from which three aerosol-relevant biomolecular species groups - polysaccharides (PCHO), amino acids (DCAA), and polar lipids (PL) - are represented. Their transfer from the ocean to the atmosphere is parameterized using OCEANFILMS, recently implemented in ECHAM6.3-HAM2.3 to enhance the marine emission scheme.

The model results indicate that PMOA emission fluxes are primarily controlled by marine biological activity and sea-salt production, the latter mainly depending on near-surface winds. Biomolecular concentrations show limited variability in equatorial regions but pronounced seasonal cycles toward high latitudes. In seawater, PCHO dominates the simulated organic pool, followed by DCAA and PL. In contrast, PL contributes the largest fraction to aerosol-phase organic matter due to the comparatively strong air-seawater affinity of lipids. Arctic PMOA emissions and atmospheric transport peak between May and September, coinciding with the phytoplankton bloom and the seasonal sea-ice minimum. Substantial regional differences are evident in the timing of biomolecule production and aerosol emissions across the Arctic. Simulated PMOA seasonality agrees reasonably well with available ground-based observations, given the uncertainties in both measurements and model assumptions.

Over the 30-year period, accumulated Arctic aerosol emissions and burdens increased by at least 7% and 4%, respectively, when comparing the first and second halves of the study period. Summer (June–August) trend analyses reveal a pronounced decline in sea ice that is associated with increasing concentrations of organic biomolecules in inner Arctic waters. Positive PMOA emission anomalies have become more frequent over the past 15 years, indicating a sustained upward trend. On average, PMOA production has increased by 0.8% per year since 1990, with changes varying among biomolecular groups and Arctic subregions.

How to cite: Heinold, B., Leon-Macros, A., van Pinxteren, M., Zeppenfeld, S., Zeising, M., and Bracher, A.: Spatial patterns and long-term trends of primary marine organic aerosol in the Arctic, EGU General Assembly 2026, Vienna, Austria, 3–8 May 2026, EGU26-13679, https://doi.org/10.5194/egusphere-egu26-13679, 2026.

Marine cold-air outbreaks (MCAOs) in the Arctic lead to the formation of mixed-phase clouds that downwind from the sea ice edge transition from stratocumulus clouds organized as convective rolls to open convective cells. Results from modelling studies of MCAOs suggest that increases in ice nucleating particles (INP), ice crystal number concentrations (Ni) and frozen hydrometeors in general, cause a decrease in cloud water, which can accelerate the cloud transition. In this study, we make use of observations conducted during MCAOs characterized by both high INP concentrations, potentially linked to long-range transport, and low INP concentrations, most likely associated with local sources. We perform quasi-Lagrangian large-eddy simulations of two MCAOs in the Arctic with distinctly different meteorological conditions and investigate the impact of differences in the aerosol and INP concentrations and origin. We examine how perturbations in aerosols, INPs and the predicted cloud ice in the model affect the evolution of the mixed-phased clouds, aerosol processing, and the cloud radiative feedback during these cold air outbreaks.

How to cite: Baró Pérez, A., Plach, A., and Ekman, A.:  Comparing large-eddy simulations of marine cold-air outbreaks in the Arctic under contrasting aerosol and ice nucleating particle concentrations and origins., EGU General Assembly 2026, Vienna, Austria, 3–8 May 2026, EGU26-14231, https://doi.org/10.5194/egusphere-egu26-14231, 2026.

EGU26-14390 | Posters on site | AS3.8

Exploring the Molecular Landscape of Organic Compounds in Aerosols and Seawater in the Arctic during spring and summer 

Marianne Glasius and the The Organic Compounds in Aerosols and Seawater in the Arctic Team

The sensitive Arctic environment is affected by rapid climate change. Melting of glaciers and permafrost drives large changes in the transport of organic matter to the ocean, affecting e.g. macroalgae and phytoplankton. This also affects levels and chemical composition of atmospheric organic aerosols through formation of sea spray aerosols, as well as exchange across the sea-air interface of reactive volatile organic compounds, which are photochemically oxidized, forming products contributing to formation and growth of atmospheric aerosols. Aerosols influence climate through direct interaction with radiation and by affecting the formation and lifetime of clouds. Cloud feedbacks have both warming and cooling effects on the climate, however climate models for the Arctic region largely disagree about the direction of this feedback.

The presentation will provide an overview of our recent investigations of organic compounds in Arctic aerosols and dissolved organic matter (DOM) in Arctic seawater. 

Aerosols and seawater samples were collected in the Fram Strait during the ”Atmospheric rivers and the onset of Arctic melt” (ARTofMELT 2023) and at Disko Bay, Greenland (69°2'N, 53°3'W) during spring and summer 2023. Furthermore, aerosol samples were obtained from Villum Research Station (81.6oN, 16.7oW). After sample preparation, both aerosol and water samples were analysed using ultra-high-performance liquid chromatography coupled to high-resolution Orbitrap mass spectrometry (UHPLC-Orbitrap MS). 

Molecular tracers of biogenic secondary organic aerosols (BSOA) derived from isoprene and monoterpenes were quantified using authentic standards in all aerosol samples. The levels and composition of BSOA tracers provide insight into the origin of Arctic organic aerosols, from both regional sources and long-range transport. In one aerosol sample from Disko Bay, the concentration of BSOA was highly elevated due to long-range transport of air masses from the boreal zone. A series of dicarboxylic acids were also quantified in both aerosol and DOM to investigate the marine origin of these compounds. Furthermore, non-targeted analysis was employed to provide broader insight into the overall organic composition of both aerosols and DOM.

This work was supported by the Novo Nordisk Foundation, the Swedish Polar Research Secretariat, the Swedish Research Council (VR), the Knut and Alice Wallenberg Foundation, the Carlsberg Foundation, and the Danish National Research Foundation (DNRF 172) through the Center of Excellence for Chemistry of Clouds.

How to cite: Glasius, M. and the The Organic Compounds in Aerosols and Seawater in the Arctic Team: Exploring the Molecular Landscape of Organic Compounds in Aerosols and Seawater in the Arctic during spring and summer, EGU General Assembly 2026, Vienna, Austria, 3–8 May 2026, EGU26-14390, https://doi.org/10.5194/egusphere-egu26-14390, 2026.

EGU26-14782 | ECS | Posters on site | AS3.8

Arctic Haze and New Particle Formation Influences on Enhanced Riming Processes in Mixed-Phase Stratiform 

Shyheim Afanador and Kyle Fitch

Mixed-phase clouds on the Northern Slope of Alaska are critical for radiative balance but seem to exist in a delicate balance—often persisting for several days, despite their inherent instability, followed by a sudden dissipation (Morrison et al., 2011). Riming is a highly efficient process for removal of cloud mass and is surprisingly common in the Arctic despite frequent low levels of liquid water path (LWP< 50 g m-2; Fitch & Garrett, 2022). In this work, we evaluate such “enhanced riming” cases in the context of two competing hypotheses: 1) “clean” clouds, with relatively few, larger cloud droplets—leading to a higher riming efficiency (e.g, Tridon et al., 2022); and 2) “polluted” clouds, where a larger number of smaller droplets leads to amplified cloud-top radiative cooling—in turn leading to more intense cloud-scale circulations and lofting of riming particles. We analyze these hypotheses using ground-based Multi-Angle Snowflake Camera (MASC) data coupled with aerosol and LWP measurements at Utqiagvik, Alaska. At cloud level, we use cloud and aerosol measurements from the Chemistry in the Arctic: Clouds, Halogens, and Aerosols (CHACHA) Field Campaign (Fuentes et al., 2025). We first show results from the CHACHA period, 21 February to 16 April of 2022, during which time there was a transition from low-level, long-range transport of “Arctic haze” particles to a more photochemical-dominant new particle formation regime. Beyond the CHACHA period, we also show results from surface-based measurements only for 2021-2024 at Utqiagvik and 2016-2018 at Oliktok Point, Alaska. Initial results suggest that enhanced riming is more common for the polluted clouds cases of the second hypothesis. Additional analysis will help to shed more light on a poorly understood yet important microphysical process that needs more accurate representation in numerical climate and weather models. 

How to cite: Afanador, S. and Fitch, K.: Arctic Haze and New Particle Formation Influences on Enhanced Riming Processes in Mixed-Phase Stratiform, EGU General Assembly 2026, Vienna, Austria, 3–8 May 2026, EGU26-14782, https://doi.org/10.5194/egusphere-egu26-14782, 2026.

EGU26-15746 | Posters on site | AS3.8

Characterizing the contribution of summer aerosol to cloud formation in the Canadian Arctic 

Rachel Chang, Phillipe Gauvin-Bourdon, Andy Vicente-Luis, Pierre Fogal, Sangeeta Sharma, Tak Chan, Kimberly Strong, and Patrick Hayes

Arctic aerosols undergo a strong seasonal cycle, with higher aerosol mass in the winter and spring from pollution transported from southerly latitudes, and much lower aerosol mass in the summer when wet deposition removes these aerosols from the atmosphere before they can reach the Arctic. The radiation budget in the summer is extremely important since it contributes to surface warming, so the effect of aerosols on cloud properties in summer must be characterized. The clean periods in the summer can affect radiation in two ways: they can lead to new particle formation (NPF) events, followed by particle growth that allow the particles to become active as cloud condensation nuclei (CCN) at moderate supersaturations (<0.3%); and they can lead to CCN-limited periods, when not enough aerosol particles are present to allow clouds to form. This study characterizes the frequency of occurrence of these two regimes to better understand the contributions of aerosols on clouds, and ultimately radiation, in the Canadian Arctic. To accomplish this, aerosol size distributions measured by a scanning mobility particle sizer (10 – 500 nm) were analyzed from the Polar Environment Atmospheric Research Laboratory (PEARL) at Eureka, Nunavut on Ellesmere Island (80N, 86.5W) in the Canadian Arctic Archipelago from 2015 – 2023. Monthly frequency occurrence of days classified as NPF and CCN-limited will be presented, as well as related meteorological conditions (e.g. temperature, relative humidity, boundary layer height). These findings provide an understanding of the importance of these two unique aerosol regimes in the Arctic summer and their potential impact on clouds and radiation.

How to cite: Chang, R., Gauvin-Bourdon, P., Vicente-Luis, A., Fogal, P., Sharma, S., Chan, T., Strong, K., and Hayes, P.: Characterizing the contribution of summer aerosol to cloud formation in the Canadian Arctic, EGU General Assembly 2026, Vienna, Austria, 3–8 May 2026, EGU26-15746, https://doi.org/10.5194/egusphere-egu26-15746, 2026.

EGU26-16271 | Orals | AS3.8

NASA’s Arctic Radiation-Cloud-Aerosol-Surface-Interaction Experiment (ARCSIX) – Mission Overview and First Results 

Sebastian Schmidt, Patrick Taylor, and Linette Boisvert

The NASA Arctic Radiation-Cloud-Aerosol-Surface-Interaction Experiment (ARCSIX) was an extensive aircraft mission in the Spring and Summer of 2024 that was designed to characterize the connections between radiation, the atmosphere, and the cryosphere over the course of a melt season in the Arctic Ocean North of Greenland and Canada. It tracked the evolution of multi-year and seasonal sea ice in response to varying cloud, aerosol and surface conditions while simultaneously probing the life cycle of clouds – especially for thin low-level mixed-phase boundary layer systems, which were encountered frequently and often persisted for multiple days. These clouds likely contribute to the Spring surface melt to a greater extent than previously known, and yet they are often difficult to even detect with satellite imagers in low Earth orbit.

Up to three aircraft with a payload comprising remote sensing, radiation, cloud and aerosol microphysics and composition, and thermodynamic measurements, were strategically collocated to observe different aspects of co-evolving cloud-aerosol systems in the vertical, horizontal, and temporal dimension. In some cases, airmasses were tracked over 2-3 days. ARCSIX reached deep into the Arctic and provides a wealth of statistics on interconnected cloud, aerosol, and surface properties. It captured a broad range of surface and thermodynamic states and even tracked an anomalous sea ice melt event – a harbinger of what is to come in a seasonally ice-free Arctic.

We will provide an overview of the mission and present first results, some of which are challenging the current understanding of a region that is undergoing the most rapid climate-driven changes of the globe. Drawing on ARCSIX data, we will convey some new ideas about the maintenance of mysteriously long-lived warm boundary layer Arctic clouds, with the goal of engaging a broader community in the analysis of the ARCSIX data set.

How to cite: Schmidt, S., Taylor, P., and Boisvert, L.: NASA’s Arctic Radiation-Cloud-Aerosol-Surface-Interaction Experiment (ARCSIX) – Mission Overview and First Results, EGU General Assembly 2026, Vienna, Austria, 3–8 May 2026, EGU26-16271, https://doi.org/10.5194/egusphere-egu26-16271, 2026.

EGU26-17708 | ECS | Posters on site | AS3.8

Long-term trend of elemental carbon in the high Arctic and its potential drivers 

Lu Zhang, Henrik Skov, Andreas Massling, Manuel Dall’Osto, Nickolaos Evangeliou, Haochi Che, Bjarne Jensen, and Ulas Im

The Arctic is warming at more than twice the global average rate, a phenomenon known as Arctic amplification (Rantanen et al., 2022). In addition to greenhouse gases, short-lived climate forcers play a critical role in modulating Arctic climate through their impacts on radiation, cloud properties, and the surface energy balance (e.g. AMAP, 2015, 2021). Among these forcers, elemental carbon (EC) is of particular importance due to its strong light-absorbing properties and its ability to reduce surface albedo when deposited on snow and ice. Furthermore, aged EC particles transported to the Arctic can act as cloud condensation nuclei, influencing cloud microphysical processes and thereby modifying Arctic radiative forcing and climate feedbacks.

In this study, we investigate long-term trends in EC concentrations and their potential drivers in the high Arctic using 16 years of continuous EC measurements from the Villum Research Station in northeast Greenland. We combine in situ observations with Lagrangian transport modelling and back-trajectory analyses to assess the relative contributions of changes in source-region emissions, transport pathway variability, and wet scavenging processes to the observed EC trends. Robust non-parametric statistical methods are applied to assess monotonic trends over the full observational period and before 2020, enabling a systematic comparison between the declining and stagnating phases. This integrated observational–modelling framework provides new constraints on the processes controlling EC variability in the Arctic and advances our understanding of how anthropogenic emission reductions are reflected in Arctic atmospheric composition under a rapidly evolving climate.

How to cite: Zhang, L., Skov, H., Massling, A., Dall’Osto, M., Evangeliou, N., Che, H., Jensen, B., and Im, U.: Long-term trend of elemental carbon in the high Arctic and its potential drivers, EGU General Assembly 2026, Vienna, Austria, 3–8 May 2026, EGU26-17708, https://doi.org/10.5194/egusphere-egu26-17708, 2026.

EGU26-18175 | ECS | Posters on site | AS3.8

 Warm–Moist Intrusions as a Key Regulator of Arctic Aerosols, Clouds, and Precipitation 

Berkay Dönmez, Jakob Boyd Pernov, Romanos Foskinis, Radiance Calmer, Paraskevi Georgakaki, Hélène Angot, Eija Asmi, John Backman, Tak Chan, Radovan Krejci, Andreas Massling, Henrik Skov, Peter Tunved, Alfred Wiedensohler, Kay Weinhold, Athanasios Nenes, and Julia Schmale

Recent studies show that warm and moist air intrusions are major sources of aerosol particles in the Arctic, affecting local radiative impacts by supplying Cloud Condensation Nuclei (CCN). However, their influence on aerosol size modes, CCN, and cloud droplet number concentrations remains poorly constrained. Here, we use long-term aerosol observations from five Arctic observatories to quantify intrusion impacts. We find that intrusions strongly perturb Arctic CCN, especially in summer, when accumulation-mode and CCN concentrations increase markedly at all sites. In winter and spring, two regimes emerge: intrusions reduce number concentrations at sites near 0° longitude (Zeppelin, Villum, Alert) but enhance them near 180° (Tiksi, Utqiaġvik/Barrow), consistent with competing effects of pollution sources and wet scavenging along trajectories. Intrusions also systematically modify cloud droplet number concentration (Nd): Nd increases at all sites in summer, while in winter it increases at Tiksi and Utqiaġvik/Barrow but decreases at Zeppelin, Villum, and Alert. Overall, intrusions are a key regulator of Arctic aerosol and cloud properties and an important component of the evolving Arctic climate system.

Beyond aerosol–cloud number effects, it is unclear how intrusion events modulate cloud optical depth, liquid water content, and precipitation across Arctic sites and seasons. To address this, we will combine cloud and precipitation observations from the year-long Multidisciplinary drifting Observatory for the Study of Arctic Climate (MOSAiC) expedition with reanalysis data to quantify systematic intrusion-driven changes in liquid water content and precipitation occurrence. Finally, we will use the non-hydrostatic mesoscale Weather Research and Forecasting (WRF) model to examine the sensitivity of mixed-phase cloud lifetime and associated precipitation to intrusion occurrence, providing process-level constraints on how intrusions shape Arctic mixed-phase cloud persistence and hydrometeor production.

How to cite: Dönmez, B., Boyd Pernov, J., Foskinis, R., Calmer, R., Georgakaki, P., Angot, H., Asmi, E., Backman, J., Chan, T., Krejci, R., Massling, A., Skov, H., Tunved, P., Wiedensohler, A., Weinhold, K., Nenes, A., and Schmale, J.:  Warm–Moist Intrusions as a Key Regulator of Arctic Aerosols, Clouds, and Precipitation, EGU General Assembly 2026, Vienna, Austria, 3–8 May 2026, EGU26-18175, https://doi.org/10.5194/egusphere-egu26-18175, 2026.

EGU26-18302 | ECS | Posters on site | AS3.8

A regional aerosol growth event during the onset of sea ice melt 

Julia Kojoj, Cort Zang, Diego Fellin, Lea Haberstock, Lotte D. Thomsen, Jennie S. Schmidt, Anderson Da Silva, Remy Lapere, Ben Kopec, Jeffrey M. Welker, Marianne Glasius, Stefania Gilardoni, Tina Santl-Temkiv, Megan Willis, Radovan Krejci, and Paul Zieger and the Villum Research Station science team

Aerosol particles are a key player in the Arctic climate as they act as a surface for cloud droplet condensation and ice nucleation, subsequently affecting the radiative properties of clouds. In the Arctic, interactions between the ocean, sea ice, and atmosphere strongly influence the production and transformation of aerosol particles, but the mechanisms controlling particle number concentrations and size distributions are still poorly constrained. Marine organic gas-phase compounds are known to play an important role in initiating new particle formation and sustaining particle growth to climatically relevant sizes with e.g. potential to serve as cloud condensation nuclei. However, substantial knowledge gaps remain in our understanding of their sources and processes, and quantifying the role of secondary aerosol formation and growth in shaping cloud-active aerosol populations remains a challenge.

Spring and the important start of the melt period is a particularly under-sampled season over the Arctic pack ice, due to difficult ice conditions leading to logistic challenges. In 2023, the ARTofMELT (Atmospheric rivers and the onset of sea ice melt) expedition on board the Swedish icebreaker Oden set out to cover this crucial time period, when the aerosol population transitions from haze conditions dominated by long-range transport to being characterized by local sources and corresponding processes.

Here, we present measurements of a large-scale aerosol growth event over the Arctic pack ice, in the middle of the seasonal transition into summer. The growth event was preceded by a storm, followed by long-lasting fog, and sustained over several days and across hundreds of kilometers. By combining the broad range of aerosol instrumentation onboard with data from nearby monitoring stations at Villum (North Greenland) and Zeppelin (Svalbard) observatories, trace gas measurements, air source analysis (ie. water vapor isotopes and air parcel modeling), and regional model simulations, we investigate factors defining the origin of the event and its potential impact.

How to cite: Kojoj, J., Zang, C., Fellin, D., Haberstock, L., Thomsen, L. D., Schmidt, J. S., Da Silva, A., Lapere, R., Kopec, B., Welker, J. M., Glasius, M., Gilardoni, S., Santl-Temkiv, T., Willis, M., Krejci, R., and Zieger, P. and the Villum Research Station science team: A regional aerosol growth event during the onset of sea ice melt, EGU General Assembly 2026, Vienna, Austria, 3–8 May 2026, EGU26-18302, https://doi.org/10.5194/egusphere-egu26-18302, 2026.

EGU26-18722 | ECS | Orals | AS3.8

Aerosol composition shifts in the High Arctic during the sea ice melt onset (ARTofMELT2023) 

Diego Fellin, Liine Heikkinen, Fredrik Mattsson, Julia Kojoj, Lea Haberstock, Cort Zang, Lotte Thomsen, Claudia Mohr, Ilona Riipinen, Luisa Ickes, Megan Willis, Marianne Glasius, Elena Barbaro, Andrea Gambaro, Paul Zieger, and Stefania Gilardoni

During the ARTofMELT 2023 expedition (8 May–14 June) aboard the icebreaker Oden, we investigated the High Arctic aerosol system across the transition from late spring into sea-ice melt onset. Submicron aerosol properties were characterized using high-resolution soot particle aerosol mass spectrometry (SP-AMS; chemical composition, organic fingerprints and elemental ratios), complemented by measurements of equivalent black carbon (eBC), particle size distributions, back-trajectory analysis, and size-segregated offline analyses by means of ion chromatography and total carbon analysis. We identified nine regimes, spanning Arctic-confined conditions, warm-air intrusions, and fog sampling.

Campaign-average submicron particulate matter (PM1) was sulfate-dominated (66% sulfate, 29% organic aerosol OA, minor nitrate, ammonium and chloride; eBC ~1%), but approaching the melt onset variability shifted from accumulation-mode, sulfate-rich background conditions to Aitken-mode dominated aerosols with higher relative contribution from OA. The analysis of the OA fragmentation patterns showed a persistently oxidized background, repeatedly perturbed by transport and fog, with coherent shifts toward fresher material (lower f44 and O:C, higher H:C) coinciding with Aitken-mode dominance. Size-resolved total carbon (TC) measurements (<4 µm) indicate that TC was concentrated at diameters below ~0.15 µm, and its loading increased in air masses that travelled over open water. Toward melt onset, we observed increases in methanesulfonic acid (MSA) concentration and non-sea-salt sulfate, consistent with a stronger relative contribution from marine/organosulfur compounds. Overall, the depletion of accumulation mode particles during the early melt season favors CCN-relevant Aitken-mode carbon in the High Arctic.

How to cite: Fellin, D., Heikkinen, L., Mattsson, F., Kojoj, J., Haberstock, L., Zang, C., Thomsen, L., Mohr, C., Riipinen, I., Ickes, L., Willis, M., Glasius, M., Barbaro, E., Gambaro, A., Zieger, P., and Gilardoni, S.: Aerosol composition shifts in the High Arctic during the sea ice melt onset (ARTofMELT2023), EGU General Assembly 2026, Vienna, Austria, 3–8 May 2026, EGU26-18722, https://doi.org/10.5194/egusphere-egu26-18722, 2026.

Aerosols serve as ice nucleating particles (INPs) and play a critical role in the formation of mixed-phase clouds. These clouds are prevalent in the lower and middle troposphere of the Arctic and exert a strong influence on both regional and global climate. However, limited understanding of INP sources and their temperature-dependent behavior has hindered accurate predictions ofaerosol-cloud interactions in the Arctic. In this study, we investigate the sources, spatial distributions, seasonal variations, and long-term changes of INPs in the Arctic using a global climate-aerosol model that explicitly represents INPs from three Arctic aerosol species: mineral dust, marine organic aerosols (MOA), and bioaerosols. Simulations covering the period 1981–2020 show that Arctic-sourced INPs account for more than 70% of total INPs in the Arctic lower troposphere. Dust is the largest contributor (36%), followed by bioaerosols (28%) and MOA (9%). They exhibit distinct spatial and seasonal patterns, underscoring the importance of representing multiple INP species and applying appropriate parameterizations for each when modeling INPs and mixed-phase clouds in the Arctic. Over the past four decades, Arctic warming increases local emissions of all three aerosol species by 4.7–18% because of the retreat of snow and sea ice. Nevertheless, INP concentrations in the Arctic lower troposphere decline by 19–29%, primarily because the INPs per unit aerosol mass decrease with increasing temperature. This indicates that the temperature-driven reduction of ice nucleating efficiency outweighs the emission-driven increase of INP abundance, except in regions with substantial local increases of emissions.

How to cite: Ren, Z., Kawai, K., Liu, M., and Matsui, H.: Impacts of Arctic warming on ice nucleating particles from 1981 to 2020: Distributions and contributions of dust, marine organic aerosols, and bioaerosols, EGU General Assembly 2026, Vienna, Austria, 3–8 May 2026, EGU26-23242, https://doi.org/10.5194/egusphere-egu26-23242, 2026.

In this investigation, we analyze the long-term determinants of aerosol pollution utilizing nationally accessible data from Pakistan on a provincial scale, spanning the years 2000 to 2022. This study employs aerosol optical depth (AOD) data derived from the Moderate Resolution Imaging Spectroradiometer (MODIS) as a proxy indicator for particulate matter present in the atmosphere. It integrates satellite-derived environmental data with socio-economic and meteorological variables, including GDP per capita, levels of industrialization, population density, temperature, precipitation, and wind direction, to furnish a comprehensive assessment of both anthropogenic and natural influences on aerosol dispersion. Furthermore, the CS-ARDL model, accompanied by tests for cross-sectional dependence, slope heterogeneity, and cointegration, is utilized within the analysis. Additionally, it elucidates both long-term and short-term relationships among the variables under consideration. The findings of this research reveal that AOD is significantly influenced by economic growth, industrial output, and population density. This underscores the detrimental implications of Pakistan's developmental trajectory on environmental quality. Nevertheless, there exists a mitigating effect of variables such as precipitation and temperature, which serve as significant meteorological determinants of aerosol concentration. Conversely, wind direction emerges as a prominent spatial factor, potentially attributable to the translocation of pollutants across various regions. Furthermore, resistance analyses conducted on generalized method of moments (GMM) regression reveal that the findings exhibit a remarkable degree of consistency. This research addresses a notable deficiency in the empirical literature concerning the correlation between environmental degradation in developing nations and remote sensing data through the application of econometric modeling. Additionally, the study offers pertinent policy recommendations for decision-makers, as it underscores the imperative for regionally adaptive, seasonally responsive, and environmentally sustainable development and planning practices. In this context, it provides an evidence-based foundation for the formulation of substantiated air quality management strategies and sustainable development measures to be implemented throughout Pakistan.

How to cite: Imran, A.: Analyzing Temporal Aerosol Distribution over Pakistan Using MODIS Data and Their Socio-Economic Impacts, EGU General Assembly 2026, Vienna, Austria, 3–8 May 2026, EGU26-90, https://doi.org/10.5194/egusphere-egu26-90, 2026.

EGU26-764 | ECS | Posters on site | AS3.9

Spatial Shift of Heatwave Hotspots in India: Unraveling the Roles of Aerosols 

Shravani banerjee and Burrala Padmakumari

It is crucial to understand the drivers of extreme heat in India, as heatwave intensifies under a warming climate. This study examines the spatiotemporal evolution of heatwave hotspots across India and evaluates how aerosols and atmospheric dynamics loading influence their formation. A long-term archive of heatwave events from 1981 to 2020 is constructed using reanalysis-based daily maximum temperatures (Tmax). The results indicate a substantial rise in Tmax, with all-India warming of ~0.8 ± 0.30 °C between 1981–2000 and 2001–2020. We further examine how different large-scale conditions shape hotspot evolution by comparing periods with El Niño and non-El Niño periods. El Niño contributed to the rise of +0.68 °C in average Tmax, compared to +0.18 °C in non-El Niño years. Furthermore, heatwaves are identified using a percentile-based framework. A Heatwave Hotspot Index (HHI) is developed to quantify regional variations in heatwave-prone zones by integrating five key attributes: heatwave frequency, duration, intensity, Tmax anomaly, and number of hot days. Decadal assessments reveal a marked expansion and intensification of hotspots, especially in western, central and Peninsular India, suggesting an emerging southward shift in recent decades. Further, to assess aerosol influences, we analyze MODIS AOD, CALIPSO aerosol extinction profiles and aerosol types, and CERES radiative fluxes (2008–2020). The findings underscore contrasting aerosol–radiation interactions. Enhanced AOD and increased absorbing aerosol loading intensify surface warming across western and central India. In contrast, regions exhibiting relative cooling show elevated aerosol layers that enhance atmospheric absorption while reducing the amount of solar radiation reaching the surface. During heatwaves, large-scale phenomena like El Niño, along with aerosol radiative forcing patterns, explain how the aerosol buildup during extreme heat events exacerbates atmospheric heating. These findings show the importance of aerosol-radiation interaction in determining the severity and spatial patterns of heat extremes in India.

How to cite: banerjee, S. and Padmakumari, B.: Spatial Shift of Heatwave Hotspots in India: Unraveling the Roles of Aerosols, EGU General Assembly 2026, Vienna, Austria, 3–8 May 2026, EGU26-764, https://doi.org/10.5194/egusphere-egu26-764, 2026.

Black carbon (BC) aerosols can affect both local and remote long-term climate, but whether they can induce remote changes at short-term timescales is unclear. Through analyses of observations and time-slice model simulations, this study shows that South Asian autumn BC aerosols can cause instant and delayed responses of surface air temperature over the Arctic and Eurasia. In autumn, higher BC loading over South Asia leads to decreased rainfall and tropospheric diabatic cooling there. This cooling can remotely excite an anomalous anticyclone over Europe that transports warm and moist air into the Arctic to precondition sea ice melting over the Barents-Kara Seas (BKS). The consequent decrease of sea ice cover (SIC) causes BKS warming through increased surface exchange fluxes, and the concurring anomalous anticyclone near the Ural Mountains induces surface cooling over Eurasia. This temperature anomaly pattern can persist into the ensuing winter due to the continued SIC decrease across seasons.

How to cite: Deng, J.: Instant and Delayed Effects of Autumn Black Carbon Aerosols Over South Asia on Arctic and Eurasian Surface Air Temperature, EGU General Assembly 2026, Vienna, Austria, 3–8 May 2026, EGU26-1989, https://doi.org/10.5194/egusphere-egu26-1989, 2026.

Rising global temperatures have intensified warm-season climate extremes over China in recent decades. This study examines changes in extreme temperature and precipitation during May–September and their links to greenhouse gas (GHG) increases and aerosol reductions, using observations, reanalysis data, and climate model simulations. During 2011–2023, daily maximum temperature (TXx), heatwave frequency, and heatwave mean duration show significant upward trends of 0.70 °C per decade, 3.77 days per decade, and 0.31 days per event per decade, respectively. Attribution analysis indicates that rising CO₂ concentrations contribute 43% ± 3% of the TXx increase, while declining aerosol optical depth, decreasing at 0.054 per decade due to improved air quality, accounts for 27% ± 3%. In eastern China, where aerosol reductions are strongest, aerosol decline explains up to 79% ± 10% of the TXx increase, amplifying heatwave intensity and persistence.

Extreme precipitation has also become more intense and frequent. A marked acceleration occurred around 2010, with the trend in accumulated extreme precipitation (R95pTOT) increasing from 2.88 mm per decade during 2000–2010 to 22.88 mm per decade during 2010–2023. This acceleration is largely driven by the reversal of aerosol trends associated with China’s clean air actions, which affect cloud microphysics and atmospheric dynamics and account for roughly half of the change in R95pTOT trends. Model projections suggest that continued aerosol reductions under carbon neutrality pathways will further intensify extreme precipitation, outweighing the effect of GHG forcing alone. These results highlight the critical role of both GHGs and aerosols in shaping recent and future warm-season climate extremes over China.

How to cite: Yang, Y.: Increasing weather extremes in China attributed to rising greenhouse gases and declining aerosols, EGU General Assembly 2026, Vienna, Austria, 3–8 May 2026, EGU26-2042, https://doi.org/10.5194/egusphere-egu26-2042, 2026.

Synoptic fronts are most active in the mid-latitudes and are often associated with abrupt temperature changes and heavy precipitation. Over China, frontal activities play a crucial role in springtime rainfall, accounting for more than 40% of total precipitation in southern China. While previous studies have mainly focused on the influences of natural forcing and long-term climate change on frontal systems, the role of anthropogenic aerosols and their rapid impacts remain poorly understood. In this study, we investigate the fast response of frontal activity and associated precipitation over China to variations in anthropogenic aerosols. Observational analyses reveal that, concurrent with China’s sharp decline in anthropogenic emissions over the past two decades, frontal precipitation (FP) in spring has significantly increased over southern China, accompanied by a weak decrease in northern China. Simulations using the Community Earth System Model (CESM) indicate that the past anthropogenic aerosols reductions in China could lead to the similar dipole variation in FP, along with a general consistent change in front frequency and precipitation intensity. The changes in frontal activity are a result of the modified horizontal wet-bulb potential temperature gradient, which strengthens in the south whereas weakens in the north. Further analysis indicates that aerosol reductions lead to an immediate increase in surface solar radiation, disturbing near-surface temperature and its meridional gradient. The resulting circulation anomalies enhance convergence updraft over southern China, thus enhancing atmospheric moisture and favoring FP formation. Under China’s carbon neutrality target by 2060, continued aerosol mitigation is expected to further amplify the meridional displacement of FP, with opposing variations in front frequency and precipitation intensity between southern and northern China. Our results highlight the importance of anthropogenic aerosols in modulating synoptic-scale weather processes and provide new insights into intraseasonal precipitation variability under ongoing climate change and emission mitigation.

How to cite: Zhu, L. and Xue, L.: Enhanced Springtime Frontal Precipitation in Southern China Induced by Anthropogenic Aerosol Mitigation, EGU General Assembly 2026, Vienna, Austria, 3–8 May 2026, EGU26-2945, https://doi.org/10.5194/egusphere-egu26-2945, 2026.

EGU26-3371 | Posters on site | AS3.9

From muted to rapid surface warming over India under changing aerosol emissions 

Camilla Weum Stjern, Bjørn H. Samset, Laura J. Wilcox, Sourangsu Chowdhury, and Ankit Bhandekar

 Indian surface temperature has increased more slowly since 1970 than for most land regions at similar latitudes. Air pollution, which reflects sunlight and cools the surface, is widely considered a key contributor, yet the relative roles of aerosol emissions, natural variability, and other forcings remain uncertain, reducing confidence in projections of warming in India. Here, we combine observational temperature records with a new multi-model, multi-ensemble dataset from the Regional Aerosol Model Intercomparison Project (RAMIP) to isolate and quantify the influence of local and remote anthropogenic aerosol emissions on India’s past and future climate. We find that a cleanup of air pollution, necessary for health reasons, would likely turn India from a historical “warming hole” to a future “hotspot” where regional warming exceeds the global mean. This enhanced warming will substantially strengthen heat extremes. By linking climate projections with health impact assessments, however, we show that while aerosol mitigation would intensify heat-related risks, the net health benefits of cleaner air remain strongly positive. 

How to cite: Stjern, C. W., Samset, B. H., Wilcox, L. J., Chowdhury, S., and Bhandekar, A.: From muted to rapid surface warming over India under changing aerosol emissions, EGU General Assembly 2026, Vienna, Austria, 3–8 May 2026, EGU26-3371, https://doi.org/10.5194/egusphere-egu26-3371, 2026.

EGU26-3599 | Orals | AS3.9

Extensive Decline of Reflective Clouds over the North Atlantic and Northeast Pacific from Aerosol Reductions 

Knut von Salzen, Ayodeji Akingunola, Jason Cole, Ruth Digby, Sarah Doherty, Luke Fraser-Leach, Edward Gryspeerdt, Michael Sigmond, and Robert Wood

Over the past several decades, the proportion of solar radiation reflected back into space has declined, accelerating the accumulation of heat within the Earth system. Satellite observations provide compelling evidence for the loss of reflective marine clouds and rising sea surface temperatures in the Northern Hemisphere. Natural climate variability is unlikely to be the primary cause of this cloud reflectivity decrease, which is poorly understood. Here we show that the marine cloud reflectivity, as measured by the shortwave cloud radiative effect, decreased on average by 2.8 +/- 1.2% per decade in the combined North Atlantic and Northeast Pacific regions between 2003 and 2022. The majority of the Earth System Models we analyzed simulated a cloud reflectivity decrease that is significantly less than observed in these regions. Our simulations using an updated aerosol-climate model show that reductions in sulfur dioxide and other air pollutants accounted for 69% (range 55 to 85%) of the decrease through aerosol-cloud interactions, consistent with the observed aerosol optical depth and cloud droplet number trends. These emission reductions are projected to persist over the next few decades, which raises the prospect of a continuing cloud reflectivity decrease and warming enhancement in these regions and globally.

How to cite: von Salzen, K., Akingunola, A., Cole, J., Digby, R., Doherty, S., Fraser-Leach, L., Gryspeerdt, E., Sigmond, M., and Wood, R.: Extensive Decline of Reflective Clouds over the North Atlantic and Northeast Pacific from Aerosol Reductions, EGU General Assembly 2026, Vienna, Austria, 3–8 May 2026, EGU26-3599, https://doi.org/10.5194/egusphere-egu26-3599, 2026.

EGU26-3770 | ECS | Posters on site | AS3.9

The Variable Impact of Aerosol Reduction on Tropical Cyclone Precipitation 

Ho Yi Lydia Mak and Xiaoming Shi

Prior research has established that higher aerosol concentrations can influence both precipitation formation and tropical cyclone intensity. As climate mitigation efforts advance, however, anthropogenic aerosol levels are projected to decline. This study investigates how such a decrease in aerosol concentration may alter tropical cyclone precipitation patterns, using Typhoons Haikui and Koinu as case studies. Simulations were conducted with the Weather Research and Forecasting (WRF) model employing the Thompson aerosol-aware microphysics scheme, in which water-friendly aerosol concentrations were reduced by two orders of magnitude. Results show that lower aerosol concentrations consistently expand the area of precipitation in both cyclones by enhancing the warm-rain process. Nevertheless, total precipitation amounts respond differently: they increase for Haikui but decrease for Koinu. This divergence is attributed to the relative dominance of warm-rain versus ice-phase microphysical processes and associated changes in upper-level convection.

How to cite: Mak, H. Y. L. and Shi, X.: The Variable Impact of Aerosol Reduction on Tropical Cyclone Precipitation, EGU General Assembly 2026, Vienna, Austria, 3–8 May 2026, EGU26-3770, https://doi.org/10.5194/egusphere-egu26-3770, 2026.

EGU26-4112 | ECS | Orals | AS3.9

Long-Term Variability of Southern African Hydroclimate Strongly Modulated by Asian Anthropogenic Aerosols, with Implications for Regional Ecosystems 

Bosi Sheng, Massimo Bollasina, Alexandre Gagnon, Laura Wilcox, Thomas Reynolds, Christopher Beckett, and Qingxiang Li

Observations show a significant increase in austral summer (December–February, DJF) precipitation over Madagascar and a dipole over southern Africa since the mid-twentieth century, with implications for unique and biodiversity-rich ecosystems in a recognized global biodiversity hotspot. Yet the physical drivers of these long-term changes remain unclear. Over the same period, rapidly increasing anthropogenic aerosol emissions from Asia substantially altered hemispheric energy distributions and are known to influence remote hydroclimate through large-scale atmospheric circulation adjustments. However, their impacts on African rainfall have not been systematically assessed. We addressed this knowledge gap using historical simulations from Coupled Model Intercomparison Project phase 6 (CMIP6) models and idealized single-forcing experiments from the Precipitation Driver Response Model Intercomparison Project (PDRMIP). Our results suggest that Asian anthropogenic aerosol emissions played a key role in the observed increase in austral summer precipitation over Madagascar and southern Africa from 1930 to 2000 alongside the influence of internal variability. Increased sulfate aerosol emissions over Asia led to regional surface cooling and strengthened interhemispheric temperature and sea-level pressure gradients. This caused a southward shift of the Intertropical Convergence Zone (ITCZ) and the associated Hadley circulation, which resulted in enhanced moisture convergence and increased precipitation over Madagascar. In contrast, after 2000, rapid reductions in Asian aerosol emissions reversed the circulation response and contributed to declining precipitation over Madagascar and southern Africa. Applying this physical framework to near-future scenarios from the Regional Aerosol Model Intercomparison Project (RAMIP) further indicates that aerosol emission reductions will continue to drive substantial hydroclimatic adjustments. These precipitation changes from 2000 to 2020 are accompanied by increased vapor pressure deficit (VPD) and reduced leaf area index (LAI) over Madagascar and southern Africa, consistent with increased vegetation water stress. Taken together, our findings highlight how remote anthropogenic aerosol forcing can influence southern African hydroclimate and moisture-sensitive forests, underscoring the broader current and near-future implications for forests and terrestrial ecosystems in the region.

How to cite: Sheng, B., Bollasina, M., Gagnon, A., Wilcox, L., Reynolds, T., Beckett, C., and Li, Q.: Long-Term Variability of Southern African Hydroclimate Strongly Modulated by Asian Anthropogenic Aerosols, with Implications for Regional Ecosystems, EGU General Assembly 2026, Vienna, Austria, 3–8 May 2026, EGU26-4112, https://doi.org/10.5194/egusphere-egu26-4112, 2026.

EGU26-5555 | ECS | Orals | AS3.9 | Highlight

Nuclear Conflict in Eastern Europe: Climate Disruption & Radiological Fallout 

Ananth Ranjithkumar, Nathan Mayne, Anthony C. Jones, and Jim M. Haywood

Geopolitical tensions in Eastern Europe underscores the urgency of addressing the climatic and radiological consequences of a regional nuclear conflict. Using an Earth System Model, we explore the fallout from a hypothetical frontline conflict involving air- and surface-burst detonations near the Ukraine-Russia border, releasing substantial amounts of aerosol particles (Black Carbon (BC)) and radionuclides into the stratosphere. The extended stratospheric lifetime of BC induces hemispheric climate disruption: the Northern Hemisphere cools by ~1 °C in year-1, with anomalies of −5 °C in Russia and −4 °C in the United States; surface solar radiation declines by ~30 W m⁻² over the US; and precipitation decreases by ~40% across mid-latitude croplands. Stratospheric warming alters subtropical and polar jets, displacing the Intertropical Convergence Zone ~2–6° southward, delaying climate recovery. To contrast the impacts of a high- versus low-latitude nuclear conflict, we compare the hypothetical Ukraine-Russia conflict with the India-Pakistan case, the latter being the most extensively studied regional nuclear conflict in past literature. We examine its impacts on global and regional climate, the trajectory of long-term climate recovery, and both short- and long-term radiological fallout. These findings underscore the importance of nuclear-risk reduction and provide a robust benchmark for food-security and humanitarian-impact assessments.

How to cite: Ranjithkumar, A., Mayne, N., C. Jones, A., and M. Haywood, J.: Nuclear Conflict in Eastern Europe: Climate Disruption & Radiological Fallout, EGU General Assembly 2026, Vienna, Austria, 3–8 May 2026, EGU26-5555, https://doi.org/10.5194/egusphere-egu26-5555, 2026.

EGU26-6034 | Posters on site | AS3.9

New evidence on the impact of ship emission in central Mediterranean Sea as a consequence of the sulfur reduction in heavy fuel oil 

Silvia Becagli, Alcide di Sarra, Tatiana Di Iorio, Daniela Meloni, Francesco Monteleone, Giulia Quarratesi, Mirko Severi, Damiano Sferlazzo, and Rita Traversi

Several papers in the last decades demonstrate the strong impact of aerosol emitted by ships in harbors, coastal regions, and also in the central Mediterranean Sea (e.g. Viana et al., 2014; Becagli et al., 2017).

The ship aerosol is characterized by high concentrations of sulphate and metals (V and Ni) and has been shown to affect the radiation field and to produce adverse health effects.

In the Mediterranean region, high sulphate levels (often exceeding 10 µg/m3), allowed to characterize this region as one of the areas worldwide strongly influenced by the negative radiative forcing induced by the sulphate.

A review of five ship aerosol modeling studies finds a mean radiative forcing at the top of the atmosphere of +0.12±0.03 W/m2 (Gettelman et al., 2024), essentially induced by changes in the cloud properties. Although the estimated radiative forcing expected from changes in ship aerosol is not large, its effect is highly nonlinear (i.e., if aerosols emitted into polluted air have much less effect on clouds than aerosols emitted into a pristine atmosphere), and the decreased ship emissions may have a large effect on Earth’s albedo.

This works aims to investigate the effect of the implementation of the International Maritime Organization (IMO) 2020 regulation leading to a decrease of sulfur concentration in the marine fuels down to 0.5%, on PM10 composition in central Mediterranean Sea. PM10 was sampled at Lampedusa by sequential aerosol sampler (Gemini Dadolab srl) equipped with PM10 and PTS sampling heads. PM10 was measured by gravimetry and analyzed for ions and metals content as reported in Becagli et al. (2012 and 2017). Several interesting conclusions cand be drawn from the comparison of sulphate, V, and Ni concentrations obtained before and after 2020.

The sulphate concentration has been observed to decrease by factor 2 in summer. The decrease is smaller than that observed in the eastern Mediterranean, where it was reduced by almost a factor of 4 since 90’s (Urdiales-Flores et al., 2023). This significant decrease in sulphate is considered as one of the main drivers of the rapid warming of the Mediterranean compared to the rest of the world (Urdiales-Flores et al., 2023).

A remarkably higher reduction in concentration is observed for V and Ni. The concentration of these metals decreases by a factor of about 5. Moreover, V ad Ni solubility shows a strong reduction with respect to data prior to 2020, becoming similar to that measured on crustal samples. Also, the V/Ni ratio of ship aerosol (soluble fraction) becomes close to 2, a value similar to that of mineral aerosol.

In previous studies (e.g., Becagli et al., 2012) values of V>8 ng/m3 coupled with the value of V/Ni ratio in the range 3-3.5 were used as a tracers for identifying ship-emitted particles.  The present analysis shows that these criteria, are no more valid for present day measurements.

Viana et al. 2014. DOI: 10.1016/j.atmosenv.2014.03.046

Becagli et al. 2017. DOI: 10.5194/acp-17-2067-2017

Gettelman et al., 2024. DOI: 10.1029/2024gl109077.

Becagli et al. 2012. DOI: 10.5194/acp-12-3479-2012

Urdiales-Flores et al. 2023. DOI: 10.1038/s41612-023-00423-1

How to cite: Becagli, S., di Sarra, A., Di Iorio, T., Meloni, D., Monteleone, F., Quarratesi, G., Severi, M., Sferlazzo, D., and Traversi, R.: New evidence on the impact of ship emission in central Mediterranean Sea as a consequence of the sulfur reduction in heavy fuel oil, EGU General Assembly 2026, Vienna, Austria, 3–8 May 2026, EGU26-6034, https://doi.org/10.5194/egusphere-egu26-6034, 2026.

EGU26-6556 | Posters on site | AS3.9

Carbonaceous Aerosol Deposition over the Northern Indian Ocean: Agricultural Burning, Shipping, and Sustainability Challenges 

Krishnakant Babanrao Budhavant, Sreedharan Krishnakumari Satheesh, and Örjan Gustafsson

Carbonaceous aerosols play a crucial role in climate forcing and the dynamics of the South Asian monsoon; however, their sources and deposition processes remain insufficiently understood. In this study, we used dual carbon isotopes (Δ¹⁴C, δ¹³C) to accurately trace water-insoluble carbon in rainwater samples collected from the Maldives Climate Observatory–Hanimaadhoo over four years, from 2019 to 2023.

Carbonaceous species in the rainwater exhibited pronounced seasonal contrasts. On average, black carbon concentrations were about five times higher in the winter monsoon than in the summer monsoon. In comparison, water-insoluble organic carbon was roughly twice as high in winter as in the summer monsoon.  In our dataset, black carbon varied from 1.7 to 76.3 µg L⁻¹ during the winter monsoon, from 0.8 to 20.1 µg L⁻¹ during the summer monsoon, and from 1.0 to 29.0 µg L⁻¹ during the transitional periods. Water-insoluble organic carbon dominated the insoluble carbon pool, consistent with the notion that black carbon typically has a lower wet scavenging efficiency compared to more hydrophilic organic carbon fractions. Radiocarbon analysis indicated that biogenic sources, especially from biomass burning, are the primary contributors to water-insoluble carbon, accounting for approximately 59 ± 13% of the total. Notably, C3  plants alone contributed about 87% of this biomass signal. We observed distinct seasonal variations in these contributions; during the winter monsoon, we recorded higher biomass fractions, correlating with agricultural residue burning in the Indo-Gangetic Plain. In contrast, the summer monsoon saw an increase in fossil-fuel contributions, coinciding with heightened shipping activity and fossil-fuel combustion in the region.

The acidity of the rainwater (pH ranging from 4.2 to 6.9) varied with the origin of the air masses, underscoring the significant impact of anthropogenic activities during continental outflows. These findings provide valuable insights into the complex interactions between aerosols and monsoon systems, highlighting that deposition patterns are closely tied to local agricultural practices and energy consumption. Addressing the issues stemming from residue burning and shipping emissions could offer a sustainable pathway with potential co-benefits for climate resilience, ecosystems, and food security throughout the Indian Ocean region.

How to cite: Budhavant, K. B., Satheesh, S. K., and Gustafsson, Ö.: Carbonaceous Aerosol Deposition over the Northern Indian Ocean: Agricultural Burning, Shipping, and Sustainability Challenges, EGU General Assembly 2026, Vienna, Austria, 3–8 May 2026, EGU26-6556, https://doi.org/10.5194/egusphere-egu26-6556, 2026.

EGU26-6629 | Posters on site | AS3.9

Rapid adjustments to black carbon cause precipitation invigoration in monsoon regions 

Bjorn H. Samset, Manoj Joshi, Ane H. Johansen, Zosia Staniaszek, Robert J. Allen, Camilla W. Stjern, and Laura J. Wilcox

Atmospheric black carbon (BC) is known to strongly affect precipitation, primarily through rapid adjustments to emissions changes. Globally, studies have found a strong, negative correlation between BC induced atmospheric absorption and precipitation, meaning that the overall effect of BC emissions is a drying. A primary thermodynamic mechanism is that heating aloft, induced by shortwave absorption, competes with latent heat release from condensation, inhibiting droplet formation.

In some regions, however, the modelled precipitation response to an increase in BC emissions is positive. Previous studies indicate that this is a local effect, occurring in tropical regions and close to the source, but as yet there is no full mechanistic explanation.

Using a range of recent BC emission perturbation simulations from global climate models, we show that BC precipitation invigoration primarily occurs in monsoon regions, and is due to a dynamical "chimney effect", or elevated heat pump, overcoming the thermodynamic inhibition. This has previously been discussed for absorbing aerosols over India, but we find similar results across most monsoon regions. Here, there is a clear positive correlation between BC atmospheric absorption and precipitation change, that persists from rapid adjustments through to the full climate response to BC emissions. We also find a shift in precipitation patterns through the monsoon season, with monsoon onset on average coming earlier and becoming more intense.

These results have clear implications for the precipitation related climate hazards arising from BC emission changes, and therefore also for science based policy advice on BC mitigation measures.

How to cite: Samset, B. H., Joshi, M., Johansen, A. H., Staniaszek, Z., Allen, R. J., Stjern, C. W., and Wilcox, L. J.: Rapid adjustments to black carbon cause precipitation invigoration in monsoon regions, EGU General Assembly 2026, Vienna, Austria, 3–8 May 2026, EGU26-6629, https://doi.org/10.5194/egusphere-egu26-6629, 2026.

EGU26-8817 | Orals | AS3.9

Role of anthropogenic aerosols in modulating wet and dry extremes of Indian summer monsoon rainfall 

Chandra Venkataraman, Ribu Cherian, Aaqib Gulzar, Anwesa Bhattacharya, and Arpita Mondal

Extreme rainfall events in India, causing floods and droughts, damage lives and livelihoods and thereby significantly impact agriculture production, natural and constructed landscapes, water resources, and the economy. This part of the world is also a global hotspot for air pollution due to the increase of anthropogenic aerosols since the late 20th century. Aerosols influence the radiation budget and cloud microphysical and dynamical processes, thus influencing monsoon rainfall patterns and trends. However, temporal modulations in monsoon rainfall over the Indian subcontinent, characterized by wet and dry spells, are yet to be understood in the context of the role of enhanced anthropogenic aerosol emissions. To address this gap, in this study, we examine the link between increased aerosol levels and dry and wet spell characteristics of the Indian summer monsoon of the recent era (2001-2025), using observations and model simulations (ECHAM-HAM), made with a regionally representative Indian emission inventory.

We find aerosol-induced drying of both wet and dry rainfall extremes, in the recent period, over the Indian core monsoon region, using Indian Meteorological Department (IMD)’s rainfall and satellite-derived Moderate Resolution Imaging Spectroradiometer (MODIS) aerosol optical depth (AOD) datasets. In the recent era, aerosol enhancements correlate with increasing dry spells but decreasing wet spells, as well as, decreasing rainfall intensity in both wet and dry spells. Model simulations reveal aerosol-induced stabilization and reduction in convective potential energy, inhibiting upward moisture transport. There is also a cloud microphysical effect, reducing cloud drop size and inhibiting rainout. This study illustrates how high aerosol pollution levels over India can lead to rainfall deficits, affecting the region's water supplies and exacerbating climate risks.

How to cite: Venkataraman, C., Cherian, R., Gulzar, A., Bhattacharya, A., and Mondal, A.: Role of anthropogenic aerosols in modulating wet and dry extremes of Indian summer monsoon rainfall, EGU General Assembly 2026, Vienna, Austria, 3–8 May 2026, EGU26-8817, https://doi.org/10.5194/egusphere-egu26-8817, 2026.

EGU26-11733 | ECS | Orals | AS3.9

Synoptic circulation control on aerosol loading over the Indo-Gangetic Plain: Implications for regional air quality 

Ankit Bhandekar, Laura Wilcox, Bryan Lawrence, Nathan Luke Abraham, and Fiona O'Connor

The Indo-Gangetic Plain (IGP), home to over 900 million people, experiences some of the world's worst air pollution, with PM2.5 concentrations routinely exceeding WHO guidelines by factors of 5-10. While seasonal patterns of aerosol loading are well documented, driven by monsoon rainfall cycles and emission variations, the synoptic meteorological controls governing day-to-day pollution extremes remain poorly understood. This limits our ability to project future air quality under changing atmospheric circulation patterns and to evaluate whether climate models accurately represent the circulation-aerosol coupling essential for reliable near-term climate projections over South Asia.

We identify and characterise distinct synoptic circulation regimes over the IGP and quantify their control on aerosol loading and air quality. Using circulation classification applied to reanalysis data combined with satellite-derived aerosol observations and pollution measurements, we isolate how atmospheric circulation variability modulates PM2.5 and aerosol optical depth independently of emission changes. Given the IGP's unique valley topography, we find air quality shows distinct responses to meteorological variability across seasons, with implications for both climate model evaluation and future projections. We extend this analysis to the UK Earth System Model to assess whether current generation climate models capture the observed sensitivity of aerosol loading to circulation patterns. This is critical because future air quality depends on both emission pathways and changes to circulation regime frequency under climate change.

This work has important implications for climate risk assessment in South Asia. As the monsoon system responds to global warming, shifts in circulation patterns could amplify or offset emission-driven air quality trends, creating pollution hotspots even under declining emissions, or provide ventilation that moderates pollution despite stable emissions. The results could inform emission reduction strategies by clarifying when and how meteorological conditions determine pollution outcomes, and establish process based constraints for models projecting future climate risks in South Asia.

How to cite: Bhandekar, A., Wilcox, L., Lawrence, B., Abraham, N. L., and O'Connor, F.: Synoptic circulation control on aerosol loading over the Indo-Gangetic Plain: Implications for regional air quality, EGU General Assembly 2026, Vienna, Austria, 3–8 May 2026, EGU26-11733, https://doi.org/10.5194/egusphere-egu26-11733, 2026.

EGU26-12557 | Posters on site | AS3.9

Strengthening of the East Asian Summer Monsoon in response to local and remote reductions in anthropogenic aerosol 

Laura Wilcox, Ankit Bhandekar, Feifei Luo, Massimo Bollasina, Tianhui Zhou, Bjørn Samset, and Robert Allen and the The RAMIP modelling team

The East Asian Summer Monsoon (EASM) has been shown to be sensitive to changes in local and remote aerosol emissions in multiple generations of climate models. Global increases in anthropogenic aerosol cause cooling, especially over Northern Hemisphere land, leading to a southward shift in the ITCZ, a weakened land-sea temperature gradient, and a weakened EASM. Local cooling from local aerosol increases act to weaken the land-sea temperature contrast, and thus the EASM, while the advection of cold air and circulation adjustments resulting from increases in European aerosol increases ultimately have the same effect. While increasing greenhouse gas emissions act to strengthen the EASM via enhanced moisture transport, the two effects do not cancel each other out. The predominantly dynamical response to aerosol increases resulted in a weakening of the EASM in the late 20th century, and determined the spatial pattern of the observed precipitation anomalies, with flooding in southern China and drying in the north.


Concerns about air quality have resulted in large, rapid reductions in aerosol emissions over East Asia since 2010. Similar reductions may occur in other regions in the near future. Here, we use data from 10 models that participated in the Regional Aerosol Model Intercomparison Project (RAMIP) to quantify the EASM response to recent reductions in aerosol emissions over East Asia, continuing reductions over North America and Europe, and potential future reductions over South Asia and Africa and the Middle East. In addition to considering seasonal mean changes, we show the impact of regional aerosol reductions on temperature and precipitation extremes. We present an analysis of the mechanisms for the response of the EASM to both local and remote aerosol changes, assessing the relative roles of thermodynamic and dynamic changes, and show a moisture budget decomposition. The RAMIP dataset includes 10 models, and 10-member ensembles for all experiments, which enables us to identify robust physical responses to aerosol emission changes, and to identify where structural differences between the participating models lead to differences in near-future projections. The EASM strengthens in response to all aerosol reductions, although it is most strongly influenced by local aerosol changes. 

How to cite: Wilcox, L., Bhandekar, A., Luo, F., Bollasina, M., Zhou, T., Samset, B., and Allen, R. and the The RAMIP modelling team: Strengthening of the East Asian Summer Monsoon in response to local and remote reductions in anthropogenic aerosol, EGU General Assembly 2026, Vienna, Austria, 3–8 May 2026, EGU26-12557, https://doi.org/10.5194/egusphere-egu26-12557, 2026.

EGU26-14479 | Orals | AS3.9

Observational Constraints on Atmospheric Black Carbon in the Climate System 

Örjan Gustafsson, Krishnakant Budhavant, Navinya Chimurkar, Sean Clarke, Gabrielle Dreyfus, Xin Gong, Zbigniew Klimont, Klaus Klingmüller, Sang-Woo Kim, Jos Lelieveld, Gunnar Myhre, Hari Nair, Jianfei Peng, Veerabhadran Ramanathan, Archita Rana, Manoj Remani, Sk Satheesh, Chandra Venkataraman, and Qiang Zhang

Black Carbon (BC) aerosols are short-lived climate pollutants with uncertain climate impacts. Growing observational records over the past two decades increasingly constrain the dynamics of atmospheric BC. This assessment also utilized the expanding in situ observational records to compare and evaluate emission inventories and global model estimates of BC sources, atmospheric burdens, lifetimes with respect to deposition, solar absorption and radiative effects.

Isotopic fingerprinting of atmospheric BC reveals significant regional differences between biomass and fossil fuel combustion sources, with Sub-Saharan Africa (fbiomass-burning 93±3%), South Asia (56±7%) and East Asia (28±5%). These are broadly consistent with a set of commonly used emission inventories.

Emissions and columnar measurements indicate recent BC declines in South America and East Asia, continued moderate reductions in Europe and North America, and recent stabilization in Africa and South Asia. 

The global mean mass absorption coefficient (MAC550) of atmospheric BC is 12.3±5.8 m2/g (151 datasets) and highest in Africa, Europe and South Asia. This is higher than in earlier assessments that focused on near-source measurements. The enhancement (E-MAC550) during long-range transport (ageing) is similar across regions (1.6±0.4).

Long-term observations show that models overestimate BC deposition fluxes while underestimating both concentrations and sunlight absorption in high-pollution regions. This has implications for humidity, clouds, precipitation and climate forcing.  Model simulations of aerosol absorption optical depth and the direct radiative forcing ratio between surface and top of atmosphere still underestimate observations by factors of 2 and 1.5, respectively.

Further progress in understanding BC’s role in the climate system will require more extensive intercomparisons between observations, emission inventories, and climate models. Such advances will also strengthen the scientific basis for mitigation policies.

How to cite: Gustafsson, Ö., Budhavant, K., Chimurkar, N., Clarke, S., Dreyfus, G., Gong, X., Klimont, Z., Klingmüller, K., Kim, S.-W., Lelieveld, J., Myhre, G., Nair, H., Peng, J., Ramanathan, V., Rana, A., Remani, M., Satheesh, S., Venkataraman, C., and Zhang, Q.: Observational Constraints on Atmospheric Black Carbon in the Climate System, EGU General Assembly 2026, Vienna, Austria, 3–8 May 2026, EGU26-14479, https://doi.org/10.5194/egusphere-egu26-14479, 2026.

EGU26-15915 | ECS | Orals | AS3.9

Aerosol Emissions Drive Observed and Modeled Hydrological Trends in Arid and Semiarid Regions  

Yanda zhang, Bjørn Samset, Ruby Leung, Laura Wilcox, and Daniel Westervelt

Arid and semi-arid regions are highly sensitive to hydroclimate changes. In recent decades, precipitation and evapotranspiration have declined across vast global drylands, posing critical challenges to water security and fragile ecosystems. However, these drying trends remain poorly understood and inadequately represented in climate models. Here, using observations and CMIP6 multi-model simulations, we interpret hydroclimatic changes in (semi-)arid regions and associated model biases by presenting a theoretical framework. From an energetic perspective, precipitation and evapotranspiration changes are directly linked to climate forcings through variations in atmospheric diabatic cooling (δQ), which is primarily governed by the response of surface sensible heat flux (δSHdown) to surface shortwave radiation changes (δDSSR). Reanalysis and single-forcing simulations reveal that aerosol surface shortwave radiative effects—rather than greenhouse gases—dominate hydrological changes in dry regions, particularly in the Northern Hemisphere. Since the 1970s, aerosol emissions have increased δDSSR and reduced δSHdown, with the consequent decreases in δQ driving the observed drying trends. In CMIP6 simulations, the substantial underestimation of aerosol-induced solar brightening contributes to pronounced discrepancies with observations. By highlighting the critical role of aerosol effects, this work provides an effective approach for understanding and projecting dryland hydroclimatic responses to shortwave radiative forcings under broader scenarios.

How to cite: zhang, Y., Samset, B., Leung, R., Wilcox, L., and Westervelt, D.: Aerosol Emissions Drive Observed and Modeled Hydrological Trends in Arid and Semiarid Regions , EGU General Assembly 2026, Vienna, Austria, 3–8 May 2026, EGU26-15915, https://doi.org/10.5194/egusphere-egu26-15915, 2026.

EGU26-17612 | ECS | Posters on site | AS3.9

Airborne characterization of black carbon properties in fresh and aged wildfire plumes over southern France 

Alejandra Velazquez-Garcia, Antoine Hubans, Ronan Paugam, Sophie Pelletier, Quentin Rodier, Quentin Libois, Agnès Borbon, Isabelle Chiapello, Jean-Baptiste Filippi, Gilles Parent, Pamela Dominutti, Julien Ruffault, Jean-christophe Canonici, Damien Boulanger, and Cyrielle Denjean

Black carbon (BC) is a significant short-lived climate forcer due to its strong absorption of solar radiation. Quantifying its radiative effects is challenging due to the ageing-induced evolution of BC mixing state and its impact on BC light absorption. Open biomass burning in the form of wildfires is the dominant global source of BC. In the summer of 2025, Europe experienced record-high wildfire emissions, while Canada faced its second-highest annual total carbon emissions. During this period, southern France was impacted by both several major local wildfire outbreaks and long-range transport (LRT) of dense smoke plumes from Canadian wildfires. Our study assesses the BC properties measured in different plumes, allowing their characterization in both relatively fresh emissions from southern France and aged air masses transported from Canada. Observations were conducted using the Safire ATR42 research aircraft during SILEX, the first campaign of the European project EUBURN. A total of 15 flights were performed with simultaneous measurements of BC mass concentration using a Single Particle Soot-Photometer (SP2), CO, CO2 and CH4 concentration using a PICARRO gas analyser, and aerosol optical properties with a modified dual-wavelength airborne CAPS-PMSSA monitor and a Nephelometer. Additionally, geostationary satellite products and chemical-transport-model simulations performed using the FLEXPART and MOCAGE models were used as auxiliary data to support the aircraft measurements. Interestingly, within the wildfire plumes, aerosol particle number concentrations reached up to 17,040 #/cm3, accompanied by extinction coefficients at 520 nm as high as 275 Mm-1, highlighting the high aerosol load and pronounced aerosols-radiation interactions, potentially impacting the local to global radiative balance. The average values of the combustion source indicator (ΔBC/ΔCO) reflected a common signature attributed to biomass burning emissions (~7). Furthermore, the ATR42 in situ data with fuel type assessments revealed the dominance of flaming combustion, with modified combustion efficiency (ΔCO2/ΔCO2+ΔCO) values exceeding 0.9. The BC core size distribution exhibited a unimodal pattern, with peak diameters typically ranging between 184 to 210 nm. Ongoing analyses aim to examine the diversity of BC mixing states and the associated absorption enhancement in both local wildfire plumes from southern France and long-range transported from Canada.

How to cite: Velazquez-Garcia, A., Hubans, A., Paugam, R., Pelletier, S., Rodier, Q., Libois, Q., Borbon, A., Chiapello, I., Filippi, J.-B., Parent, G., Dominutti, P., Ruffault, J., Canonici, J., Boulanger, D., and Denjean, C.: Airborne characterization of black carbon properties in fresh and aged wildfire plumes over southern France, EGU General Assembly 2026, Vienna, Austria, 3–8 May 2026, EGU26-17612, https://doi.org/10.5194/egusphere-egu26-17612, 2026.

EGU26-17775 | ECS | Posters on site | AS3.9

Multi-decadal source apportionment of South Asia wintertime and summertime sulfate using δ³⁴S–SO₄²⁻ and emission-inventory-based model estimates 

Sean Clarke, Manoj Remani, Katerina Rodiouchina, Henry Holmstrand, Krishnakant Budhavant, Joakim Romson, Sophie Haslett, and Örjan Gustafsson

Sulfate aerosols exert a strong negative effective radiative forcing and remain a major source of uncertainty in regional climate projections. In South Asia, sustained elevated sulfate loadings are subject to intensified mitigation efforts. Such legislation could result in uncertain intensification of near-term warming through unmasking of net cooling aerosols. Robust source attribution is therefore needed to interpret past variability and to evaluate emission inventories used in climate and air-quality assessments.

In this study, we quantify anthropogenic versus natural contributions using the stable sulfur isotope composition (δ³⁴S) of aerosol sulfate (SO₄²⁻) measured at the Maldives Climate Observatory Hanimaadhoo (MCOH), a receptor site for the South Asian outflow. The analysis targets winter and summer monsoon air masses over 2006–2025 to sample contrasting transport regimes influencing MCOH.

Initial δ³⁴S-constrained apportionment indicates that wintertime sulfate is consistently dominated by anthropogenic sources (≈90–99%), whereas the summer monsoon shows a substantially larger spread in anthropogenic influence (≈47–88%). Ongoing work couples the isotopic constraints with FLEXPART transport footprints and state-of-the-art regionally-tuned emission inventories to resolve dominant upwind source regions and diagnose as well as improve agreement between inventory-based bottom-up estimates and in situ top-down observations. As the record is extended toward multi-decadal coverage, it will provide improved observational constraints on sulfate sources in the South Asian outflow and support evaluation and improvement of emission inventories, intrinsic to effective climate policy.

How to cite: Clarke, S., Remani, M., Rodiouchina, K., Holmstrand, H., Budhavant, K., Romson, J., Haslett, S., and Gustafsson, Ö.: Multi-decadal source apportionment of South Asia wintertime and summertime sulfate using δ³⁴S–SO₄²⁻ and emission-inventory-based model estimates, EGU General Assembly 2026, Vienna, Austria, 3–8 May 2026, EGU26-17775, https://doi.org/10.5194/egusphere-egu26-17775, 2026.

EGU26-20632 | ECS | Posters on site | AS3.9

Advancing Carbonaceous Aerosol Characterization in India to Improve Regional Climate Risk Assessment  

Taveen Singh Kapoor, Chimurkar Navinya, Harish C. Phuleria, Chandra Venkataraman, and Rajan K. Chakrabarty

Aerosol-induced changes to the surface and atmospheric energy balance are crucial for understanding regional climate change, particularly in the Indian subcontinent, where carbonaceous aerosols contribute to atmospheric warming. However, our understanding of aerosol impacts lags that of greenhouse gases, partially due to a lack of primary observations regarding aerosol optical properties. This presentation synthesizes regional-scale and localized measurements of strongly absorbing carbonaceous aerosols to help constrain these gaps and identify key directions for future research. Analysis from the PAN-India COALESCE network, spanning nine regional sites, revealed significant spatiotemporal heterogeneity in aerosol absorption. Spectral measurements showed that brown carbon (BrC) contributes between 21% and 68% to near-UV absorption nationally. Despite this significant contribution, absorption by BrC particles is not routinely integrated into most climate models. While these national trends highlight a widespread underestimation of absorption, they also underscore the need for a more granular understanding of optical properties. Further intensive measurements were conducted at Rohtak, India, a representative urban-regional site in the highly polluted Indo-Gangetic Plain. Measurements revealed extreme aerosol loading (PM2.5 ~ 163 µ/m3) and strong absorption, with a single-scatter albedo (at 550 nm) of 0.7. Using a Mie inversion technique, we estimated the imaginary refractive index (a measure of aerosol absorption strength) to be between 0.076 and 0.145—values residing at the upper end of reported urban ranges globally. This high imaginary refractive index is attributed to black carbon and strongly absorbing BrC (mass absorption cross-sections at 550 nm of 1.9 m2 g-1) from primary combustion sources. Notably, the persistence of this absorption was linked to a dominance of low-volatility organic carbon fractions—termed dark brown carbon—that resists photo-bleaching. These particles exhibit absorption extending to longer, near-infrared wavelengths, warranting further investigation and inclusion in climate models. A systematic review of existing literature suggests that the detection method for BrC absorption significantly influences the reported magnitude and may potentially bias spectral signals, thereby complicating current model constraints. 

These findings have direct implications for regional climate risk. The measured single-scatter albedo values are lower than those utilized in current climate simulations over South Asia. This systematic underestimation of absorption likely leads to biased projections of regional radiative forcing, surface dimming, and atmospheric heating rates. Such discrepancies could result in significant uncertainties regarding downstream meteorological extremes and climate risks. These risks can only be mitigated through improved measurements with more extensive spatiotemporal coverage to provide the constraints necessary for robust climate projections.

How to cite: Kapoor, T. S., Navinya, C., Phuleria, H. C., Venkataraman, C., and Chakrabarty, R. K.: Advancing Carbonaceous Aerosol Characterization in India to Improve Regional Climate Risk Assessment , EGU General Assembly 2026, Vienna, Austria, 3–8 May 2026, EGU26-20632, https://doi.org/10.5194/egusphere-egu26-20632, 2026.

EGU26-21786 | ECS | Orals | AS3.9

Absorbing aerosols and rising dry–moist heat extremes over India: Evidence of a strengthening air pollution–climate nexus 

Angshuman Modak, Dewashish Tiwari, Arpita Mondal, and Chandra Venkataraman

India has witnessed a significant rise in surface temperature during the pre-monsoon season, driving more intense, frequent, and prolonged heatwaves, particularly over the northwest and central regions of the country. While there is a clear consensus on the role of greenhouse gases driving global warming, the role of anthropogenic aerosols, particularly absorbing ones such as black carbon, brown carbon, and dust, on regional warming remains uncertain and is less understood. While scattering aerosols dominate in many regions, India exhibits a high loading of absorbing aerosols, mainly mineral dust and black carbon from natural transport and combustion sources. These absorbing aerosols can offset aerosol-induced cooling and amplify regional near-surface warming. These absorbing aerosols trap solar radiation, heat the atmosphere, and stabilize the atmospheric boundary layer, further amplifying the heatwave conditions by offsetting surface cooling. Studies through observations and model simulations have linked the possible links between the elevated absorbing aerosols and heat extremes through strong radiative forcing and an increase in shortwave energy to the surface layer. However, long-term observational evidence quantifying the relationships between absorbing aerosols and temperature extremes (for both dry and moist heat) over India is yet to be established, motivating this study.

For this, we obtained the pre-monsoon season (March–June; MAMJ) absorbing aerosol and extreme heat data over India (66.5°- 100.5°E; 6.5°-36.5°N) for 1980-2024. The Absorbing Aerosol Index (AAI) is used as a qualitative measure of UV‐absorbing aerosols, obtained from the TOMS satellite record (1980–2004) and the OMI instrument (2005–2024). For extreme heat, we used daily maximum temperature (Tmax) obtained from the Indian Meteorological Department (IMD) to characterize dry heat, while we calculated wet bulb temperature (WBT) by combining Tmax from IMD and relative humidity from ERA5 datasets to define moist heat. We further computed the temporal season mean trends of variables along with their statistical significance at a 95% confidence level. We selected 3 boxes based on significant trends and reported heatwave-prone regions over northwest, eastern, and southern India to analyze the co-evolution of AAI and extreme heat variables.

We found substantial positive trends in season mean AAI and temperature variables across India, with an approximate rate of 0.25 units per decade, ~0.20°C per decade (dry heat), and ~0.2-0.4°C per decade (moist heat), respectively. The increase is highly significant in north-central India in the case of Tmax and AAI, while Central and eastern India show significance for moist heat. The consistent elevated summer temperatures in north-central India are in agreement with scientifically recognized meteorological conditions such as North Atlantic blocking creating high-pressure systems aiding the role of absorbing aerosols in amplifying heat stress. Meanwhile, moist heat increases are linked to rises in pre-monsoon humidity, which are associated with increases in irrigation and sea-surface temperature across India. The current findings have significant implications for coordinated climate and air-quality action to reduce aerosol-driven climate risks associated with extreme heat at regional scales.


How to cite: Modak, A., Tiwari, D., Mondal, A., and Venkataraman, C.: Absorbing aerosols and rising dry–moist heat extremes over India: Evidence of a strengthening air pollution–climate nexus, EGU General Assembly 2026, Vienna, Austria, 3–8 May 2026, EGU26-21786, https://doi.org/10.5194/egusphere-egu26-21786, 2026.

To reveal the patterns and causes of ozone (O₃) suppression under extreme high temperatures in the North China Plain (NCP), this study utilized O₃ observation data, surface meteorological observation data, and ERA5 reanalysis data from 2014 to 2023. The Z-test method was employed to define the critical temperature (Tx) for ozone suppression, and the spatio-temporal characteristics of this phenomenon as well as the influencing mechanisms of atmospheric circulation were analyzed. The results indicate that ozone suppression in the NCP is concentrated in five cities, including Beijing, located along the Yanshan Mountains and Northern Taihang Mountains. The critical temperature Tx ranges from 33 to 35°C. May, June, and July are the months when ozone suppression is most likely to occur in major cities of the region; Tx values are relatively higher in June and July (34-37°C) and lower in May and September. In terms of interannual variation, the maximum Tx value of 37.6°C was recorded in 2023, which is positively correlated with the frequency of extreme high temperatures in summer. Atmospheric circulation analysis shows that the geopotential height negative anomaly occurs over Northeast Asia during the occurrence of ozone suppression, the NCP region is affected by northwest winds which facilitates pollutant diffusion. Meanwhile, the region is controlled by a high-pressure warm ridge, promoting subsidence and warming. These two factors result in a negative correlation between high temperatures and O₃ concentrations. A case study in July 2023 verified that the subsidence motion dominated by upper-tropospheric northwest winds not only drives temperature rise but also improves diffusion conditions, serving as the key meteorological cause of ozone suppression. This study provides scientific support for the precise prevention and control of ozone pollution and the optimization of climate models in the NCP.

How to cite: Qiu, Y.: Spatio-temporal Characteristics of Ozone Suppression and Its Response to Atmospheric Circulation Under High-Temperature Conditions in the North China Plain, EGU General Assembly 2026, Vienna, Austria, 3–8 May 2026, EGU26-2427, https://doi.org/10.5194/egusphere-egu26-2427, 2026.

EGU26-4735 | ECS | Orals | AS3.10

Comparative Study of Parameterization Schemes for Aerosol Indirect Effects in East Asia Based on RegCM4 

Runqi Zhao, Bingliang Zhuang, Min Xie, and Tijian Wang

Cloud droplet nucleation, effective radius and cloud–water autoconversion rate (P) parameterization schemes are included in the fourth version of the Regional Climate Model (RegCM4). For cloud droplet nucleation, an empirical scheme (GI99), a semiempirical scheme (GH93), and a scheme based on aerosol activation theory (AG00) are involved. For P, a scheme dependent only on the cloud water mixing rate (Default), a scheme involving the droplet growth rate (BR67), a scheme highly correlated with aerosol components (BH94), a scheme weakly dependent on the components (TC80), a scheme involving the droplet size (LB95) and a scheme that derives a formula mathematically (IBS2) are adopted and tested. Dispersion (ε) is important when calculating the effective radius. Effective radius schemes with/without ε effects are further compared. An optimal combination of schemes is proposed. For cloud droplet nucleation, GH93 and AG00 are better. For P, LB95, BH94, and Default schemes could better simulate precipitation. Considering the ε effect would improve simulation accuracy. Overall, the AG00, BH94 and two-parameter-ε schemes are recommended for improving model simulations of precipitation in East Asia. The P schemes are compared when the aerosol 2nd indirect effects are investigated in East Asia. The change of net radiative flux at the top of the atmosphere from the schemes is -3.63 ± 4.05 W∙m-2 in central to eastern China. The aerosol 2nd indirect effect is the most significant in the BH94 scheme, with average changes in cloud optical depth, net radiative flux, and precipitation of 1.63, -10.58 W∙m-2, and -0.01 mm∙d-1, respectively.

How to cite: Zhao, R., Zhuang, B., Xie, M., and Wang, T.: Comparative Study of Parameterization Schemes for Aerosol Indirect Effects in East Asia Based on RegCM4, EGU General Assembly 2026, Vienna, Austria, 3–8 May 2026, EGU26-4735, https://doi.org/10.5194/egusphere-egu26-4735, 2026.

Extreme heat and surface ozone pollution frequently co-occur during summer and pose a growing risk to human health under climate warming. This co-occurrence is expected to intensify in the future, as global climate change is projected to increase the frequency, intensity, and duration of heatwaves. At the same time, ozone remains a major air quality concern in Europe despite substantial reductions in precursor emissions, and its health impacts are well documented even at concentrations below current regulatory standards.

Previous studies have shown that temperature is a key meteorological driver of high ozone episodes, particularly in summer when photochemical activity is strongest. However, recent work on compound climate extremes has demonstrated that univariate or linear approaches can substantially underestimate risk when extremes occur simultaneously, highlighting the need for multivariate extreme-value methods.

Moreover, spatial heterogeneity related to urbanization, land use, topography, and local meteorological conditions is often acknowledged but rarely examined in terms of how it modifies the occurrence and strength of heat–ozone extremes at the local scale. Ozone formation is governed by complex, nonlinear interactions between temperature, emissions, boundary-layer processes, and deposition, making its response highly variable in space and time. As a result, simple correlation-based analyses may underestimate the true influence of temperature on ozone, particularly under extreme conditions and in heterogeneous environments.

Previous studies in Germany and Bavaria have linked ozone and temperature observations using either nearest station matching or reanalysis products such as ERA5, often assuming limited influence of urban heat island effects on daily maximum temperature. While this approach reflects established practice in regional air-quality studies, it may introduce uncertainty in spatially heterogeneous environments, particularly for local-scale compound extremes. Matching based solely on proximity or large-scale fields may not fully capture the influence of land use and station setting. To address this methodological challenge, the present study adopts a land-use–informed, multi-scale matching perspective to evaluate the sensitivity of compound heat–ozone dependence to spatial scale.

This study aims to quantify compound heat–ozone extremes in Bavaria using multivariate analysis, with a focus on (i) how urban–rural setting and local spatial context shape compound risk, and (ii) how dependence strengthens during heatwave extremes and multi-day heatwave conditions.

By bridging statistical extreme-value analysis with atmospheric chemistry interpretation, this work provides a physically consistent and regionally relevant assessment of heat–ozone risks in southern Germany.

How to cite: Forghanifar, M. and Lu, M.: Spatial Heterogeneity of Compound Heat and Ozone Extremes: A Multivariate Extreme Value Perspective in Southern Germany, EGU General Assembly 2026, Vienna, Austria, 3–8 May 2026, EGU26-6640, https://doi.org/10.5194/egusphere-egu26-6640, 2026.

EGU26-8777 | ECS | Orals | AS3.10

Interactions between Meteorological Conditions and Surface Ozone in Urban, Industrial, and Rural Environments 

Tsai-Jung Yen, Yen-Ping Peng, and Sheng-Hsiang Wang

Ozone has emerged as a critical air quality challenge in many regions, with its formation and accumulation controlled not only by precursor emissions but also by meteorological conditions and boundary-layer dynamics. This study investigates ozone pollution across three representative regional types: a densely populated urban area, an industrial-port region, and a rural background site characterized by relatively limited anthropogenic emissions. The aim is to elucidate the dominant controlling processes under different emission and meteorological regimes. Long-term air quality observations were combined with UAV-based vertical measurements and backward trajectory analysis to characterize the spatiotemporal variability of ozone across these regional settings. Long-term trend analyses reveal pronounced seasonal variability in surface ozone levels across all three regions, with no evident long-term decreasing trend, despite overall reductions in ozone precursor emissions. In contrast, PM2.5 concentrations show a consistent decline, highlighting differences in the governing mechanisms of gaseous and particulate air pollutants. Precursor concentrations remain notably higher in the industrial–port region compared with urban and rural areas, reflecting the influence of emission structure on ozone formation potential. Correlation analyses show generally weak to moderate relationships between surface ozone and meteorological variables, with weak winds and synoptic-scale atmospheric stability favoring ozone accumulation. UAV-based vertical observations further reveal frequent nighttime formation of stable boundary layers and elevated residual ozone layers across seasons, suggesting that vertical carryover processes play an important role in modulating next-day surface ozone. Backward trajectory analyses demonstrate that high-ozone episodes are primarily associated with regional stagnation and short-range transport rather than long-range transport. Overall, this study highlights the critical role of boundary-layer dynamics, vertical ozone structures, and regional meteorological conditions in influencing ozone pollution across various regional typologies. These findings provide transferable insights for the development of effective ozone mitigation strategies and air quality management in coastal and industrialized regions.

How to cite: Yen, T.-J., Peng, Y.-P., and Wang, S.-H.: Interactions between Meteorological Conditions and Surface Ozone in Urban, Industrial, and Rural Environments, EGU General Assembly 2026, Vienna, Austria, 3–8 May 2026, EGU26-8777, https://doi.org/10.5194/egusphere-egu26-8777, 2026.

Urban coastal environments exhibit spatial heterogeneity in air pollutant distributions due to complex built environments and diverse emission sources. In these regions, land-sea breeze circulations transport ozone precursors and modulate near-surface ozone (O3) variability. However, the limited spatial coverage in conventional air quality monitoring networks constrains the ability to resolve these coupled advection-chemistry interactions.

In this study, we conducted spatially dense, multi-point measurements of CO, NO, NO2, O3, PM10, and PM2.5 using a network of cost-effective air quality sensors in Ulsan, a highly industrialized coastal city in South Korea. Sensors were deployed across industrial, residential, forested, and urban background environments. Two-week intensive campaigns in both summer and winter during 2023–2025 enabled characterization of the seasonal and diurnal variability of pollutant distributions.

Pollutant concentrations and diurnal patterns differed distinctly among emission environments. CO and NO concentrations were highest at industrial and residential sites and peaked during morning and evening commuting hours, whereas PM exhibited a more spatially homogeneous distribution. In contrast, surface O3 decreased with increasing NOx levels, reflecting enhanced O3 loss via NO titration during periods of elevated traffic and industrial emissions.

During sea-breeze events. The inland-bound transport of O3-rich marine air led to pronounced spatial gradients in surface ozone. Ozone levels decreased over industrial and residential areas due to strong NO titration and subsequently increased farther inland in forested regions where NOx concentrations remained lower. Using these spatial O3 gradients, we estimated O3 advection rates and outlined an observationally constrained approach for evaluating the surface O3 chemical budget. This study are expected to advance the understanding of sea-breeze-driven surface O3 variability in coastal cities and provide observational constraints for interpreting surface O3 budgets.

How to cite: Han, S., Park, Y., and Choi, W.: Air Pollutant Variability in a Coastal Urban Environment: Measurement-Based Estimation of Ozone Advection Rates from Spatial Gradients During Sea-Breeze Periods, EGU General Assembly 2026, Vienna, Austria, 3–8 May 2026, EGU26-8905, https://doi.org/10.5194/egusphere-egu26-8905, 2026.

In the context of China’s “dual carbon” goal, emissions of air pollutants are expected to significantly decrease in the future. Thus, the direct climate effects of black carbon (BC) aerosols in East Asia are investigated under this goal using an updated regional climate and chemistry model. The simulated annual average BC concentration over East Asia is approximately 1.29 μg/m3 in the last decade. Compared to those in 2010–2020, both the BC column burden and instantaneous direct radiative forcing in East Asia decrease by more than 55% and 80%, respectively, in the carbon peak year (2030s) and the carbon neutrality year (2060s). Conversely, the BC effective radiative forcing (ERF) and regional climate responses to BC exhibit substantial nonlinearity to emission reduction, possibly resulting from different adjustments of thermal-dynamic fields and clouds from BC-radiation interactions. The regional mean BC ERF at the tropopause over East Asia is approximately +1.11 W/m2 in 2010–2020 while negative in the 2060s. BC-radiation interactions in the present-day impose a significant annual mean cooling of -0.2 to -0.5 K in central China but warming +0.3 K in the Tibetan Plateau. As China’s BC emissions decline, surface temperature responses show a mixed picture compared to 2010–2020, with more cooling in eastern China and Tibet of -0.2 to -0.3 K in the 2030s, but more warming in central China of approximately +0.3 K by the 2060s. The Indian BC might play a more important role in East Asian climate with reduction of BC emissions in China.

How to cite: Gao, P. and Zhuang, B.: Changes in the direct climate effect of black carbon aerosols in East Asia under the “dual carbon” goal of China, EGU General Assembly 2026, Vienna, Austria, 3–8 May 2026, EGU26-8924, https://doi.org/10.5194/egusphere-egu26-8924, 2026.

EGU26-8944 | Posters on site | AS3.10

Nonstationary Summer Ozone-Temperature Climate Penalty over East Asia: Decadal Trends and Regional Variability 

Jaein Jeong, Rokjin Park, Sang-Wook Yeh, and Seungun Lee

The sensitivity of surface ozone (O3) to temperature, often termed the climate penalty factor (CPF), quantifies the increase in O3 per unit temperature rise. While previous studies have characterized CPF under present-day conditions, its temporal evolution over multi-decadal timescales remains poorly understood. This study investigates long-term changes in summer (JJA) CPF across East Asia from 1980 to 2024 using GEOS-Chem simulations driven by MERRA-2 reanalysis. Anthropogenic emissions are held constant to isolate meteorology-driven changes, whereas biogenic emissions are allowed to respond to meteorological conditions. Using a regression-based decomposition approach, we separate the contributions of direct temperature effects from indirect effects mediated by co-varying meteorological conditions. Preliminary results reveal that CPF has increased in most East Asian regions over the past four decades, with distinct spatial patterns. Northern regions exhibit CPF changes primarily driven by direct temperature effects, while southern coastal regions show dominant contributions from indirect effects. These findings suggest that the mechanisms underlying O3-temperature sensitivity differ regionally and have evolved over time. Our results demonstrate the nonstationary nature of CPF and its regional heterogeneity, with implications for projecting future air quality and designing region-specific control strategies in a warming climate.

How to cite: Jeong, J., Park, R., Yeh, S.-W., and Lee, S.: Nonstationary Summer Ozone-Temperature Climate Penalty over East Asia: Decadal Trends and Regional Variability, EGU General Assembly 2026, Vienna, Austria, 3–8 May 2026, EGU26-8944, https://doi.org/10.5194/egusphere-egu26-8944, 2026.

EGU26-8950 | ECS | Orals | AS3.10

Impacts of Urbanization on Meteorological Dynamics in Megacities 

Aasif Ahmad Wagay, Ashish Uikey, Krishna AchutaRao, Pauli Paasonen, Tuukka Petäjä, Victoria Sinclair, Shahzad Gani, and Sarath Guttikunda

Urbanization substantially alters surface energy fluxes, boundary-layer structure and urban ventilation, with direct consequences for local climate and air quality. While numerous modelling studies have examined individual cities, a globally consistent framework to compare urban meteorological impacts across megacities is still lacking. Here, we develop a unified WRF-based diagnostic framework, built around radial urban-rural analysis, to quantify urban-induced meteorological modifications in a global catalogue of megacities using month-long simulations for May and October 2024. The set spans a wide range of climatic and geographic settings, including inland megacities (e.g. Delhi, Beijing, Paris, Cairo, Mexico City, Moscow, Dhaka, Tehran, Johannesburg) and coastal megacities (e.g. New York, Barcelona, Tokyo, Shanghai, Lagos, Los Angeles, Mumbai, Istanbul, São Paulo).

The methodology aggregates key meteorological variables such as 2-m air temperature (T2m), 10-m wind speed (WS10) and planetary boundary-layer height (PBLH), into concentric 5-km rings from 0 to 60 km around each city centre. This radial design explicitly tracks how these meteorological fields evolve from rural surroundings towards the urban core. Urban effects are then expressed as inner-outer ring contrasts relative to a rural baseline, providing a simple, reproducible “urban-effect intensity” metric that is directly comparable across cities, seasons and model configurations.

Across the 14 megacities analysed so far, the urban core (0-15 km) is consistently warmer, more deeply mixed and less windy than the rural ring (45-60 km), with a much stronger signal over non-coastal cities. Averaged over inland sites, near-surface temperature is enhanced by ~1.8 °C during the day and ~3.6 °C at night (~12-28 % above rural), compared with only ~1.1-1.4 °C (5-8 %) over coastal cities. Daytime PBLH in non-coastal urban cores is ~230 m higher than in rural surroundings (~30 % increase), and nocturnal PBLH can be nearly doubled (~80 %), whereas coastal cities exhibit more modest enhancements (~50-90 m; ~13-18 %).

At the individual-city scale, Delhi and Moscow show the clearest extremes: daytime PBLH enhancement reaches ~526 m in Delhi and ~441 m in Moscow, with nocturnal PBLH nearly tripled (~274 %) and more than doubled (~206 %), respectively. Night-time T2m difference is also strongest in Delhi (~6 °C), followed by Beijing, Mexico City and Moscow (>3-4 °C, >30 % above rural), while all cities show similar urban wind slow-downs of ~0.7-0.9 m s⁻¹ (~15-20 %).

Considered jointly, the temperature, PBLH and wind-speed diagnostics reveal a consistent urban signal of sustained warming, enhanced mixing depths and reduced low-level winds in urban cores, strongest in large inland megacities and muted but still evident in coastal cities. These meteorological changes are expected to strongly influence urban air quality, which we will investigate explicitly in future work.

Keywords: Megacity, Urbanisation, Meteorology, UHI and WRF

How to cite: Wagay, A. A., Uikey, A., AchutaRao, K., Paasonen, P., Petäjä, T., Sinclair, V., Gani, S., and Guttikunda, S.: Impacts of Urbanization on Meteorological Dynamics in Megacities, EGU General Assembly 2026, Vienna, Austria, 3–8 May 2026, EGU26-8950, https://doi.org/10.5194/egusphere-egu26-8950, 2026.

EGU26-9071 | Posters on site | AS3.10

Statistical Forecasting of Ozone in Beijing: Evaluating Multiple Time Series Models and the Impact of Meteorological Factors 

Yingruo Li, Weiwei Pu, Xiaowan Zhu, Junxia Wang, Weijun Quan, and Nannan Zhang

Ozone pollution has emerged as a critical air quality concern in China, especially in megacity area such as Beijing in recent years. Characterized by its complex, nonlinear interactions among precursor pollutants and significant spatiotemporal variations, ozone poses challenges for numerical models in terms of forecasting accuracy. In contrast, statistical forecasting models offer several advantages, including reduced data requirements, lower computational costs, and enhanced predictive accuracy, making them a viable option for practical ozone forecasting applications.  In this study, we evaluate multiple time series models (such as ARIMA, NNAR, STLF, ETS etc.) for ozone concentration forecasts in Beijing. During the ozone pollution season, ARIMA and NNAR achieved correlation coefficients of approximately 0.65 between predicted and observed values. The ensemble model outperformed these, with a correlation coefficient of around 0.7 and an RMSE of about 45 µg m⁻³. For clear-day pollution events, after accounting for rainfall influence, the ensemble model's correlation coefficient reached approximately 0.9, with an RMSE reduced to about 40 µg m⁻³. The results demonstrate that time series models are effective for both mid-term and short-term ozone forecasting, while the ensemble model based on multiple time series approaches further enhances performance, offering high accuracy, temporal resolution, and spatial universality, particularly during severe pollution episodes. Daily maximum temperature, radiation precipitation are key meteorological factors that significantly influence ozone concentration. Incorporating maximum temperature into a dynamic ARIMA model significantly improved ozone forecasts, raising the correlation coefficient to about 0.75 and reducing RMSE. Future improvements could integrate more meteorological covariates to improve the performance of ozone forecasting models.

How to cite: Li, Y., Pu, W., Zhu, X., Wang, J., Quan, W., and Zhang, N.: Statistical Forecasting of Ozone in Beijing: Evaluating Multiple Time Series Models and the Impact of Meteorological Factors, EGU General Assembly 2026, Vienna, Austria, 3–8 May 2026, EGU26-9071, https://doi.org/10.5194/egusphere-egu26-9071, 2026.

EGU26-13549 | Orals | AS3.10

Influence of synoptic and local circulations on high ozone concentration episode 

Flavia Ribeiro and Natasha Valdambrini

Poor air quality is the cause of 8,1 millions deaths annually. The Metropolitan Area of São Paulo is home to more than 20 million people and frequently presents poor air quality, creating a concerning public health issue. Its location presents some unique features: 1) despite being 700 meters above sea level, it is frequently influenced by the sea breeze circulation that comes up the coastal escarpment and the predominant wind direction in Sao Paulo, influenced by the sea breeze, is from southeast; 2) considering a southeast-northewest direction, the sea breze circulation comes from a coastal area (in the city of Cubatao) that contains an industrial complex and the largest harbor in Latin America (in the city of Santos), passes through Sao Paulo and eventually reaches another metropolitan area, centered in the city of Campinas, that also has relevant industrial activities; 3) the three metropolitan areas also form a very active economic axes that presents an intense road traffic among the 3 areas and combine approximately 25 million inhabitants. The present work analyses the influence of synoptic and mesoscale atmospheric circulations, such as sea breeze, urban heat island, cold fronts, and topographic influences, on the air quality of the Cubatão-São Paulo-Campinas region, focusing on an acute ozone pollution episode. We use the WRF model with the Single Layer Urban Canopy Model for the meteorological simulations. Air pollutant emissions were simulated using the EDGAR global dataset and MEGAN for biogenic emissions. Traffic emissions were then adjusted using local inventories. Air quality was simulated with CMAQ. The chosen episode was from 3rd to 6th October 2019, during the austral spring, when the pollutant exceeded local air quality standards. Considering NOX, sea breeze helps decrease the concentrations near the surface because of transport and dispersion due to the increased wind speed, but also because sea breeze creates an internal boundary layer. The returning branch of the sea breeze transports polluted air back to the ocean above the internal boundary layer. During pre-frontal conditions, wind is mainly from the northwest, transporting pollutants to the coast, increasing air temperature, and favoring a deeper boundary layer and vertical dispersion. These patterns also delay sea breeze propagation over the plateau and are crucial to a steep increase in ozone concentration. The front passage changes wind direction and increases its velocity, favoring transport from the coast to the continent, augmenting atmospheric instability and vertical dispersion of pollutants. A better understanding of the mechanisms that cause high ozone concentrations is key to forecasting these occurrences and choosing effective measures to prevent them.

How to cite: Ribeiro, F. and Valdambrini, N.: Influence of synoptic and local circulations on high ozone concentration episode, EGU General Assembly 2026, Vienna, Austria, 3–8 May 2026, EGU26-13549, https://doi.org/10.5194/egusphere-egu26-13549, 2026.

Electricity is an indispensable resource for human activity. Despite its importance, power generation imposes a significant environmental burden by contributing to air pollution and climate change. Meteorological and climatic conditions, geographic terrain, industrial characteristics, and human activities further influence air pollution. To quantitatively investigate these influences, this study conducts a time–frequency analysis of particulate matter (PM). The study areas were selected based on the locations of coal-fired power plants in Taiwan, including Linkou, Shalu, Qiaotou, and Xiaogang, enabling the investigation of regionally distinct air pollution characteristics.

Building on our previous study, which identified pronounced regional heterogeneity in PM behavior across these four monitoring stations, this work further explores the scale-dependent and time-lagged dynamics underlying such differences. Time-Dependent Intrinsic Cross-Correlation (TDICC) is applied to examine the scale-dependent and time-lagged coupling relationships between PM and meteorological and gaseous pollutant factors. This analysis reveals delayed PM responses associated with meteorological conditions and gaseous pollutants, providing complementary insights beyond conventional correlation analyses.

By integrating all correlation analysis results, this study develops an integrated heat risk map to illustrate how different factors influence PM at multiple time scales at each station. The resulting heat risk map highlights distinct spatial patterns and regional heterogeneity in PM-related risk, offering a comprehensive understanding of the spatiotemporal characteristics and potential source contributions of PM. This integrated framework provides practical insights for identifying high-risk areas and dominant influencing factors, supporting more targeted air pollution management and mitigation strategies under varying meteorological conditions.


Keywords: Power Plants; Air pollution; Particulate Matter; Meteorological influences; Time–frequency analysis; Time-lag effects; Heat risk map analysis

How to cite: Yao, S. T. and Tsai, C. W.: Spatial-Temporal Variations of Particulate Matter Influenced by Hydro-Meteorological and Gaseous Pollutants Factors: A Case Study of Taiwan Coal-Fired Power Plants, EGU General Assembly 2026, Vienna, Austria, 3–8 May 2026, EGU26-16253, https://doi.org/10.5194/egusphere-egu26-16253, 2026.

EGU26-20295 | Posters on site | AS3.10

Seasonal Urban Air Quality Characterization in Rome Using Integrated Satellite, Meteorological and Demographic Data  

Cristiana Bassani, Valentina Terenzi, Flaminia Fois, Patrizio Tratzi, Ludovica Perilli, Marcello Petitta, and Valerio Paolini

Urban air quality monitoring is essential due to the high concentration of anthropogenic pollution sources in cities. While regulations such as the 2030 EU air quality targets emphasize the need to reduce harmful pollutants, conventional ground-based networks often lack sufficient coverage and spatial detail. Satellite observations offer a powerful complement, providing continuous, high-resolution data to capture urban-scale variability and identify localized pollution hotspots. 

This study focuses on analyzing seasonal air pollution patterns across the municipality of Rome by integrating multi-source datasets, including satellite measurements, ground-based observations, meteorology, land cover, and population distribution. Sentinel-5P TROPOMI data (2018–2024) were used to track the spatiotemporal variability of key trace gases such as NO₂, HCHO, CO, and CH₄. Daily measurements were processed into seasonally aggregated Level-3 products through the Products Algorithm Laboratory (PAL), with quality assurance filtering applied to ensure reliability. These data allowed the identification of emission hotspots and seasonal trends in precursor gases that drive secondary PM₂.₅ formation. 

Aerosol optical depth (AOD) derived from MODIS Terra and Aqua observations using the MAIAC algorithm provided complementary information on aerosol  distribution. Monthly AOD datasets were analyzed after reprojection to a consistent WGS84 grid, enabling direct comparison with TROPOMI-derived trace gas concentrations.  

PM₂.₅ data were collected from the Regional Agency for Environmental Protection (ARPA) ground-based network. Hourly measurements from different ground-based stations were used to analyze the seasonal trend of PM₂.₅ across the city.  This combination allowed for the evaluation of seasonal coupling between gaseous precursors, aerosols, and particulate matter, highlighting periods of increased secondary aerosol formation. 

Meteorological factors were incorporated using ERA5 reanalysis data, providing hourly fields for wind, temperature, precipitation, radiation, and boundary layer dynamics. These variables helped interpret observed seasonal patterns by linking atmospheric transport, mixing, and photochemical activity to pollutant distributions. 

Population dynamics, derived from high-resolution WorldPop datasets, were integrated to assess human exposure and explore how population density interacts with pollution patterns. By combining satellite, ground-based, meteorological, and demographic data, the study delivers a detailed, seasonally resolved understanding of air quality across Rome. This framework supports targeted interventions, prioritization of mitigation measures, and evidence-based planning for urban air quality management. 

How to cite: Bassani, C., Terenzi, V., Fois, F., Tratzi, P., Perilli, L., Petitta, M., and Paolini, V.: Seasonal Urban Air Quality Characterization in Rome Using Integrated Satellite, Meteorological and Demographic Data , EGU General Assembly 2026, Vienna, Austria, 3–8 May 2026, EGU26-20295, https://doi.org/10.5194/egusphere-egu26-20295, 2026.

Mobile monitoring platforms equipped with low-cost sensors (LCS) are increasingly used to enhance the spatial coverage of air quality monitoring networks. In this study, we systematically evaluated the performance of ATMOS sensors for measuring PM₂.₅ by assessing their accuracy, precision and agreement with a reference-grade Beta Attenuation Monitor (BAM). Six identical ATMOS units were co-located and operated continuously for 27 days during the winter season at a Continuous Ambient Air Quality Monitoring Station (CAAQMS) situated at an urban background site within the IIT Bombay campus. The site is influenced by nearby traffic emissions and a lake, representing complex urban micro-environment. This study investigated the role of meteorological conditions in modulating PM₂.₅ concentration and its measurement by LCS relative to BAM observations. Diurnal variations in temperature and relative humidity recorded by ATMOS sensors showed strong agreement with BAM, yielding Pearson correlation coefficients of 0.89 and 0.96, respectively. In contrast, PM₂.₅ measurements from the LCS exhibited systematic biases with temperature–humidity regimes and between daytime (06:00–18:00 local time) and nighttime (18:00–06:00 local time). During daytime conditions characterized by relative humidity ≤70% and temperatures >20°C, the LCS consistently underestimated PM₂.₅ concentrations compared to BAM. Conversely, nighttime conditions with elevated relative humidity (>70%) and lower temperatures (<20°C) led to overestimation by the LCS. Optimal agreement between the LCS and BAM was observed within a temperature range and relative humidity range of 15–25°C and 30%–60%,respectively, indicating favorable operating conditions for the sensors. Hourly PM₂.₅ distributions from LCS revealed enhanced particulates (100–130 µg/m³) during daytime hours at certain days, coinciding with high relative humidity (>80%). These observations underscore the influence of humidity on PM₂.₅ measurements relative to temperature, likely through hygroscopic particle growth. Overall, the findings demonstrate that low-cost PM₂.₅ sensors can provide robust and consistent measurements under a range of meteorological conditions when their environmental sensitivities are explicitly characterized. These results support the application of LCS for air quality monitoring and exposure assessment, particularly when combined with regime-specific corrections or calibration strategies.

How to cite: Pathak, M. and C. Phuleria, H.: Meteorological Modulation of Diurnal PM2.5 Variability: Performance of Low-Cost Sensors at an Urban Background Site in Mumbai, EGU General Assembly 2026, Vienna, Austria, 3–8 May 2026, EGU26-20864, https://doi.org/10.5194/egusphere-egu26-20864, 2026.

While overall the global warming with the causes and global processes connected to well-mixed CO2, and its impacts on global to continental scales are well understood with a high level of confidence, there are knowledge gaps concerning the impact of many other non-CO2 radiative forcers leading to low confidence in the conclusions. This relates mainly to specific anthropogenic and natural precursor emissions of short-lived GHGs and aerosols and their precursors. The anthropogenic origin is connected to large extent with the urban environment. These gaps and uncertainties also exist in their subsequent effects on atmospheric chemistry and climate, through direct emissions dependent on changes in e.g., agriculture production and technologies based on scenarios for future development as well as feedbacks of global warming on emissions, e.g., permafrost thaw.

The main goal of the EC Horizon Europe project FOCI, is to assess the impact of key radiative forcers, where and how they arise, the processes of their impact on the climate system, to find and test an efficient implementation of these processes into global Earth System Models and into Regional Climate Models coupled with CTMs, and finally to use the tools developed to investigate mitigation and/or adaptation policies incorporated in selected scenarios of future development targeted at Europe and other regions of the world, with final emphasis to selected cities environment in convection permitting scale. We will develop new regionally tuned scenarios based on improved emissions to assess the effects of non-CO2 forcers. Mutual interactions of the results and climate services producers and other end-users will provide feedbacks for the specific scenarios optimization and potential application to support the decision making, including climate policy.

Overall introduction to coupled RCM-CTM modelling experiment strategies and preliminary results will be presented in addition to the contemporary status of the project. Historical simulations results are validated against reanalyses data and the assessment of impact of chemistry involvement is shown. Preliminary results of future scenarios will be presented as well.

How to cite: Halenka, T., Sokhi, R., Finardi, S., and Machado-Crespo, N.: Project FOCI - Non-CO2 Forcers and Their Climate, Weather, Air Quality and Health Impacts: Modelling of Chemistry-Climate Interactions over Scales, EGU General Assembly 2026, Vienna, Austria, 3–8 May 2026, EGU26-21716, https://doi.org/10.5194/egusphere-egu26-21716, 2026.

EGU26-1565 | Orals | AS3.11

Evaluating dust storms modeled at kilometer-scale resolution in the ECOMIP initiative 

Martina Klose, Andreas Baer, Rumeng Li, Noel M. Chawang, Natalie Ratcliffe, and Sebastian Vergara Palacio

Advanced kilometer-scale resolution modeling offers unprecedented detail of atmospheric processes and properties, including of mineral dust. At kilometer-scale model resolutions, deep moist convective processes do not have to be parameterized any more, but can be represented explicitly at the grid resolution. These processes are very effective in transporting heat, moisture, and energy within the atmosphere and therefore have strong impacts on weather phenomena, such as wind storms. Mineral dust emission is a threshold process that depends non-linearly upon surface wind intensity, which means that the accuracy at which models represent surface winds, together with land-surface properties, is key to estimating dust emissions. A spectacular and intense type of dust storm, i.e. haboob dust storms, is caused by the cold pool outflow of moist convection. We therefore expect that the explicit representation of moist convection in kilometer-scale simulations is particularly beneficial for dust modeling. Determining whether kilometer-scale models can meet this expectation, demands in-depth evaluation against observations. This evaluation is now enabled through novel satellite missions, such as the Earth Cloud Aerosol and Radiation Explorer (EarthCARE). Here we present results of kilometer-scale simulations conducted with two models, ICON-ART and ICON-HAM-lite, both including an interactive dust representation. We investigate, for example, evaporative cooling and vertical velocities associated with moist convection as drivers of dust emission. We compare our results against observations from EarthCARE and ORCESTRA (Organized Convection and EarthCARE Studies over the Tropical Atlantic), and against results from other models in the framework of the EarthCARE-ORCESTRA Model Intercomparison Project (ECOMIP). Our results show fascinating detail of mineral dust processes, enabling novel insights into the mineral dust cycle, for example, a globally consistent characterization of haboob properties and impacts.

How to cite: Klose, M., Baer, A., Li, R., Chawang, N. M., Ratcliffe, N., and Vergara Palacio, S.: Evaluating dust storms modeled at kilometer-scale resolution in the ECOMIP initiative, EGU General Assembly 2026, Vienna, Austria, 3–8 May 2026, EGU26-1565, https://doi.org/10.5194/egusphere-egu26-1565, 2026.

EGU26-1791 | Posters on site | AS3.11

Assessing aerosol impacts on EarthCARE radiative closure using spectral radiation observations 

Stelios Kazadzis and the RACE ECV Thessaloniki Campaign Team

Satellite-based radiation retrievals are essential for quantifying the Earth’s radiative energy budget and for climate-related studies. The EarthCARE (EC) mission aims to improve our understanding of how aerosols and clouds modify radiative fluxes by providing collocated radiation observations and products based on a three-dimensional representation of atmospheric constituents. The evaluation of these products is therefore crucial for accurately estimating aerosol and cloud radiative effects.

In this study, we assess EC radiation products and their associated aerosol and cloud inputs by conducting radiative closure experiments using ground-based spectral radiation and aerosol measurements acquired during the RACE-ECV (Radiation Closure Experiments for EarthCARE Validation) field campaign.

The RACE-ECV campaign was coordinated by PMOD/WRC — the world reference institute for solar measurements and aerosol optical depth as designated by the World Meteorological Organization (WMO) — with the participation of multiple institutions. Its primary objective was the validation of EarthCARE products through high-accuracy measurements of solar radiation and aerosols. The campaign was conducted in spring 2025 (April 22–May 22) at three coordinated sites in Thessaloniki area, aligned with EC satellite overpasses. High-accuracy sun photometers were deployed in synergy with other ground-based remote-sensing instruments, comprehensive observations of aerosols, clouds, and surface solar spectral radiation.

The radiative closure at the surface was assessed through an intercomparison between measured broadband and spectral solar fluxes and radiative transfer (RT) simulations driven by both ground-based and EC atmospheric inputs. In particular, EarthCARE reconstructed three-dimensional atmospheric fields were used as input to the 3D/1D MYSTIC code (Mayer, 2009) to assess the accuracy of surface radiation products, while simultaneously quantifying the contribution of individual input parameters (focusing on aerosols) to the observed discrepancies. In addition, simulated fluxes at the top of the atmosphere (TOA) were intercompared with EC Broadband Radiometer (BBR) observations.

This study provides insights into the use of EarthCARE observations for improving our understanding of the role of aerosols and clouds in modifying the Earth’s radiative energy fluxes. 

 References:

Emde, C., et al.: The libRadtran software package for radiative transfer calculations (version 2.0.1), Geosci. Model Dev., 9, 1647–1672, https://doi.org/10.5194/gmd-9-1647-2016, 2016

Mayer, B. (2009) Radiative transfer in the cloudy atmosphere, in: EPJ Web of Conferences, 75–99.

Mayer B. and Kylling A., Technical note: The libRadtran software package for radiative transfer calculations - description and examples of use. Atmos. Chem. Phys., 5: 1855-1877, 2005

Acknowledgements:

The authors acknowledge the project RACE-ECV, (SBFI-633.4-2021-2024/PMOD - EarthCARE 202/2) supported by SBFI, the the Horizon Europe European Research Council (grant no. 101137680, Cloud–aERosol inTeractions & their impActs IN The earth sYstem, CERTAINTY) and the Obs3RvE (Optimising 3D RT EarthCARE product using geostationary observations and AI) project, funded from the European Space Agency under Contract No. 4000147848/25/I/AG.

How to cite: Kazadzis, S. and the RACE ECV Thessaloniki Campaign Team: Assessing aerosol impacts on EarthCARE radiative closure using spectral radiation observations, EGU General Assembly 2026, Vienna, Austria, 3–8 May 2026, EGU26-1791, https://doi.org/10.5194/egusphere-egu26-1791, 2026.

EGU26-3759 | ECS | Posters on site | AS3.11

Validation of the EarthCARE ACM_RT product using surface solar irradiance measurements from BSRN stations and modeled values from CAMS. 

Yannis Gschwind, Kyriakoula Papachristopoulou, and Stelios Kazadzis

The EarthCARE (ECA) satellite is currently in its second year in orbit, collecting new data every
day that could play a crucial role in advancing climate science. However, due to the advanced
technologies and retrieval approaches used in EarthCARE, the credibility of each instrument and
of their synergetic products must be verified. Significant effort has been devoted to this topic
both currently and in the past. Nevertheless, a substantial amount of publicly available data
that could improve validation has not yet been used. In this study, we use the ground-based
radiation measurements from the Baseline Surface Radiation Network (BSRN) to validate
1D surface solar radiation estimates from the EarthCARE ACM_RT product. Cloud effects are
analyzed separately using the cloud modification factor approach. Values from BSRN stations
are used if the station has less than 50 km distance to the satellite ground track. In addition,
an intercomparison with Copernicus Atmospheric Monitoring Service (CAMS) satellite based
surface solar radiation estimations has been performed. For the comparison with CAMS,
ECA values are averaged over time to obtain collocated grid cells. Due to limited gridded data
availability of the CAMS radiation service, this comparison is restricted to September-December
2024.

The ECA surface solar irradiance exhibits a Mean Bias Error (MBE) of −10.4 Wm-2 and a
Root Mean Square Error (RMSE) of 191.7 Wm-2 against ground based (BSRN) measurements.
Relative to CAMS, ECA surface solar irradiance exhibits a MBE of −23.3 Wm-2 and a RMSE
of 103.3 Wm-2. While some parts of South America, Northern Africa and Western Asia tend to
have higher EarthCARE irradiance, most of the available regions show higher CAMS irradiance.
This is especially the case in Oceania, middle part of Africa and Europe. Approximately 69%
of the difference between EarthCARE and CAMS can be contributed to differences in cloud
estimation, while 31% can be contributed to differences in clear-sky irradiance.

Future data releases from BSRN and CAMS are expected to enable a more robust assessment.
This analysis offers valuable insights relevant to the solar energy community.

Acknowledgements:

The authors acknowledge the project RACE-ECV (SBFI-633.4-2021-2024/PMOD - EarthCARE 202/2), supported by SBFI, the project Observe: Optimising 3D RT Earthcare product using geostationary observations and AI,  ESA Contract No. 4000147848/25/I/AG and the CERTAINTY (Cloud aERosol inTeractions & their impActs IN The earth sYstem) project funded from the Horizon Europe programme under Grant Agreement No 101137680

How to cite: Gschwind, Y., Papachristopoulou, K., and Kazadzis, S.: Validation of the EarthCARE ACM_RT product using surface solar irradiance measurements from BSRN stations and modeled values from CAMS., EGU General Assembly 2026, Vienna, Austria, 3–8 May 2026, EGU26-3759, https://doi.org/10.5194/egusphere-egu26-3759, 2026.

EGU26-8723 | ECS | Posters on site | AS3.11

Comparison of spaceborne retrieved vertical velocity and latent heating profiles using the EarthCARE–GPM coincidence dataset 

Shunsuke Aoki, Takuji Kubota, and Shoichi Shige

Latent heat (LH) released by precipitating cloud systems is a primary driver of vertical air motion (Vair) within clouds and plays a crucial role in transporting energy from the Earth’s surface to the atmosphere. In the Tropical Rainfall Measuring Mission (TRMM) and its successor, the Global Precipitation Measurement (GPM) mission, LH profiles associated with condensation and evaporation processes have been estimated using precipitation observations from spaceborne Ku-band radars. In contrast, Doppler radar measurements from the Cloud Profiling Radar (CPR) onboard the Earth Cloud Aerosol and Radiation Explorer (EarthCARE) enable global observations of vertical motions within clouds. Vair is retrieved by subtracting estimated hydrometeor fall speeds, inferred from radar reflectivity together with collocated atmospheric lidar and multispectral imager observations, from the measured Doppler velocities. With these complementary observations, we investigated how consistent the GPM-derived LH profiles are with the EarthCARE-derived Vair profiles.

We have developed the EarthCARE–GPM coincidence dataset, which compiles cases in which the ground tracks of the two satellites intersect. The dataset extracts data from coincident segments while preserving the original structure of all Level-2 standard products from the four EarthCARE sensors, namely the cloud radar, lidar, imager, and broad-band radiometer, as well as the two GPM sensors, namely the precipitation radar and microwave radiometer. Using this dataset, we directly compared Vair derived from EarthCARE Doppler measurements, including both the JAXA’s standard product and an alternative retrieval based on the method introduced in Aoki et al. (2026), with LH profiles from the GPM Spectral Latent Heating product. Analyses classified by precipitation type reveal physically consistent relationships. Convective precipitation exhibits deep tropospheric heating accompanied by upward motions throughout the column. In contrast, stratiform precipitation shows top-heavy heating above the melting layer with corresponding upper-level ascent, while both LH and Vair are close to zero in the lower troposphere. Nevertheless, substantial uncertainties remain in the estimation of each product, and continued intercomparison between these complementary observations remains important for assessing and improving the reliability of both estimates.

How to cite: Aoki, S., Kubota, T., and Shige, S.: Comparison of spaceborne retrieved vertical velocity and latent heating profiles using the EarthCARE–GPM coincidence dataset, EGU General Assembly 2026, Vienna, Austria, 3–8 May 2026, EGU26-8723, https://doi.org/10.5194/egusphere-egu26-8723, 2026.

EGU26-10155 | Orals | AS3.11

Advancing Ocean and Land Surface Remote Sensing with EarthCARE’s lidar ATLID 

Gerd-Jan van Zadelhoff, John Smith, Brian Collister, Dave Donovan, Diko Hemminga, Jonathan Hair, Chris Hostetler, and Taylor Shingler

The ESA-JAXA EarthCARE mission delivers cutting‑edge measurements of clouds, aerosols, and Earth’s radiation budget, quantifying the coupled interactions among the three. A key instrument on the mission is the high‑spectral‑resolution lidar (ATLID), which produces data useful beyond its primary role in atmospheric science. Although developed for atmospheric observations, ATLID’s ability to quantify the near-surface ocean backscatter also supports ocean‑optical applications, including examining how subsurface lidar signal attenuation is influenced by optical constituents such as phytoplankton and colored dissolved organic matter.

The co‑polar Mie surface return from ATLID provides estimates of aerosol and cloud optical depth, which are essential for calibrating the near-surface ocean Rayleigh signal. Once corrected for atmospheric attenuation, the isolated Rayleigh component can be used to infer chlorophyll concentrations using established bio-optical models. The surface depolarization ratio from ATLID also enables reliable discrimination between ocean and sea ice, ensuring chlorophyll retrievals are limited to open-water areas. The methodology’s validation includes using NASA HSRL2 data from the NightBLUE campaign to corroborate ocean subsurface retrievals.

The global performance of ATLID-derived chlorophyll retrievals is validated through comparisons with established satellite data from PACE-OCI, Aqua-MODIS and Sentinel-3 OLCI, as well as reanalysis products from the Copernicus Marine Environment Monitoring Service (CMEMS). Initial findings show strong agreement, with ATLID successfully capturing large-scale chlorophyll gradients, particularly in open-ocean areas. ATLID’s ability to operate in high latitudes and night-time conditions, where passive sensors face limitations, represents an important step forward. These capabilities show promise in extending the temporal and spatial coverage of ocean-color data. The retrieved chlorophyll concentrations may be used to help refine estimates of ocean albedo within EarthCARE’s Level 2 radiative‑closure studies.

Additionally, over land ATLID surface depolarization ratios correlates well with the Normalized Difference Vegetation Index (NDVI) and, over desert surfaces, also shows a relationship with the TROPOMI Lambertian Equivalent Reflectance (LER). This demonstrates ATLID’s ability to characterize surface-atmosphere interactions and reinforces its relevance across both ocean and land domains.

In summary, EarthCARE ATLID’s surface return, corrected for aerosol attenuation using the co-polar Mie surface returns, introduces a novel and unique method for global chlorophyll retrievals. This first demonstration showcases how atmospheric lidar can complement existing remote sensing products like MODIS, OLCI, and CMEMS, while offering valuable contributions to both ocean and land classification, such as desert albedo and NDVI analysis.

How to cite: van Zadelhoff, G.-J., Smith, J., Collister, B., Donovan, D., Hemminga, D., Hair, J., Hostetler, C., and Shingler, T.: Advancing Ocean and Land Surface Remote Sensing with EarthCARE’s lidar ATLID, EGU General Assembly 2026, Vienna, Austria, 3–8 May 2026, EGU26-10155, https://doi.org/10.5194/egusphere-egu26-10155, 2026.

EGU26-10702 | ECS | Orals | AS3.11

Combining the German national radar network with EarthCARE's Cloud Profiling Radar 

Christian Stefan Heske, Florian Ewald, and Silke Groß

The understanding of microphysical properties and processes in clouds plays a substantial role in the improvement of existing numerical weather models and forecasting. To gain access to these quantities deep within clouds, microphysical retrievals based on radar measurements are indispensable tools. Single-wavelength radar measurements, however, are not enough to properly constrain the microphysical properties of hydrometeors like size and shape alone and therefore need to be paired with other measurement techniques like multi-wavelength or polarimetric quantities. While polarimetric quantities are mainly useful from an oblique perspective, multi-wavelength or Doppler fall-speed observations are best made vertically. 

To tackle this observational dilemma, we combine data provided by the vertically pointing W-band Cloud Profiling Radar (CPR) carried on EarthCARE with data generated by the national German radar network operated by the Deutscher Wetterdienst (DWD) which consists of 17 polarization Doppler weather radars in the C-band covering whole Germany together. Vertical profiles from operational scans in range of EarthCare's overpasses are extracted at the position of the footprint of CPR following the recently developed Beam-aware Columnar Vertical Profile (BA-CVP) method. This measurement geometry grants the opportunity to combine multi-wavelength radar observations with Doppler fall-speed measurements and side-looking polarimetry for the possibility of constraining existing ambiguities concerning the microphysical properties of ice hydrometeors. 

The findings of this study in form of more accurate information about ice hydrometeors based on polarimetric multi-frequency radar measurements can ultimately be used to improve existing numerical weather models with regards to ice growth processes and their representation within the models. Naturally, similar studies can be done for any other operational radar network overflown by EarthCARE by adapting the BA-CVP method, opening the door for quasi-global dual-wavelength radar observations on an operational scale.

How to cite: Heske, C. S., Ewald, F., and Groß, S.: Combining the German national radar network with EarthCARE's Cloud Profiling Radar, EGU General Assembly 2026, Vienna, Austria, 3–8 May 2026, EGU26-10702, https://doi.org/10.5194/egusphere-egu26-10702, 2026.

EGU26-12433 | Orals | AS3.11

EarthCARE observes the life cycle of a stratospheric smoke plume  

Holger Baars, Moritz Haarig, Leonard König, Dave Donovan, Albert Ansmann, Sergey Khaykin, Romain Ceolato, Jason Cole, Benedikt Gast, Athena Augusta Floutsi, Valentin Jakob Heckmann, Robin Hogan, Annabel Chantry, Fabien Marnas, Gerd-Jan Zadelhoff van, and Ulla Wandinger

At the end of May 2025, extremely strong wildfires in Canada produced several pyrocumulonimbus clouds which lifted wildfire smoke particles up to the lower stratosphere (> 10 km height). A dense stratospheric smoke plume developed which reached stratospheric aerosol optical depths up to 3.2 which is comparable with a moderate volcanic eruption. EarthCARE’s lidar ATLID captured this event and enabled us to study stratospheric smoke shortly after emission and to track a single smoke plume on its transport way towards Europe.
The spaceborne lidar allowed to precisely study the maximum plume height and revealed a lofting of the smoke plume top height from 13.6 km above Canada to 17.4 km above Europe and a further slight ascent during the transport towards Asia. The self-lofting of dense smoke plumes can be explained by the absorption of solar radiation which heats the ambient air and creates buoyancy. The self-lofting is strongest for optically thick smoke plumes close to the source region and gets weaker when the plume is horizontally more spread and thus optically thinner.
ATLID detected an enhanced depolarization ratio of 0.26±0.02 which indicates non-spherical smoke particles in the stratosphere. This finding is in line with previous observations of stratospheric smoke layers, but clearly demonstrates a difference to tropospheric observations of Canadian smoke in Europe, which are characterized by a low depolarization ratio and hence a spherical shape (Haarig et al., 2018).
The novel high-spectral-resolution lidar (HSRL) capability of ATLID allowed us for the first time to study the evolution of the lidar ratio of a stratospheric smoke layer during long-range transport. Higher values around 70 sr were observed shortly after emission, which decreased during the first days of transport to values of 49±7 sr.
As another highlight, EarthCARE observed a significant downmixing of stratospheric smoke at a strong tropopause fold over the Mediterranean and North Africa (Haarig et al., 2025). These observations directly show a pathway of removal of the stratospheric smoke and closes the life cycle from injection to removal. Additionally, the synergistic EarthCARE observations will be used to estimate the radiative impact of this strong stratospheric smoke event.

References

Haarig, M., et al. (2018), Depolarization and lidar ratios at 355, 532, and 1064 nm and microphysical properties of aged tropospheric and stratospheric Canadian wildfire smoke. Atmospheric Chemistry and Physics, 18 (16), 11847–11861.

Haarig, M. et al. The life cycle of a stratospheric smoke plume as seen from EarthCARE - tracking a plume from Canada to Europe. ESS Open Archive. October 22, 2025.

How to cite: Baars, H., Haarig, M., König, L., Donovan, D., Ansmann, A., Khaykin, S., Ceolato, R., Cole, J., Gast, B., Floutsi, A. A., Heckmann, V. J., Hogan, R., Chantry, A., Marnas, F., Zadelhoff van, G.-J., and Wandinger, U.: EarthCARE observes the life cycle of a stratospheric smoke plume , EGU General Assembly 2026, Vienna, Austria, 3–8 May 2026, EGU26-12433, https://doi.org/10.5194/egusphere-egu26-12433, 2026.

EGU26-13319 | ECS | Posters on site | AS3.11

Validation of EarthCARE-Derived Planetary Boundary Layer Height Using the E-Profile Ceilometer Network and Radiosondes  

Onel Rodríguez-Navarro, Jorge Muñiz-Rosado, Alexander Haefele, Eric Sauvageat, Arlett Díaz-Zurita, Víctor Manuel Naval-Hernández, Alberto Cazorla, Daniel Pérez-Ramírez, Lucas Alados-Arboledas, and Francisco Navas-Guzmán

The Earth Clouds, Aerosol and Radiation Explorer (EarthCARE), launched in May 2024 as a joint ESA–JAXA mission, provides vertically resolved observations of aerosols and clouds with unprecedented sensitivity from space. In this study, we exploit measurements from the Atmospheric Lidar (ATLID), a high-spectral-resolution lidar operating at 355 nm, whose enhanced signal-to-noise ratio and capability to separate molecular and particulate backscatter enable detailed characterization of the lower troposphere (Wehr et al., 2023). These features make ATLID particularly suitable for deriving the planetary boundary layer height (PBLH) at the global scale.

The PBL is the atmospheric layer most strongly influenced by surface forcing through turbulent exchanges of heat, moisture and momentum. Accurate estimates of PBLH are therefore essential for weather forecasting, climate modelling and air quality studies. Previous spaceborne lidar missions, notably CALIPSO, demonstrated the feasibility of PBLH retrievals from aerosol backscatter profiles, although with limitations related to signal attenuation, cloud contamination and retrieval robustness (McGrath-Spangler and Denning, 2012). EarthCARE’s ATLID offers enhanced capabilities to address these challenges.

We validate ATLID-derived PBLH using independent ground-based observations from the E-Profile network, comprising over 400 ceilometers across Europe, along with collocated radiosonde measurements from the University of Wyoming Upper Air Soundings database. A continental-scale reference dataset was generated by applying the STRATfinder algorithm to ceilometer aerosol backscatter profiles. Planetary boundary layer heights from radiosondes were independently estimated using several thermodynamic and dynamical approaches, including the bulk Richardson number, the parcel method, and gradient-based criteria applied to temperature and humidity profiles. Only radiosonde launches collocated with E-Profile stations were considered, ensuring spatial consistency among the reference datasets. The analysis includes 580 collocated cases, defined as EarthCARE overpasses within 20 km of a ground-based station, from which 25 correspond to radiosonde observation, covering the period from August 2024 to August 2025.

Two complementary approaches were assessed to retrieve PBLH from ATLID Level-2 BA baseline products. The first approach used the operational A-ALD product, which includes PBLH as a retrieved variable. The product showed limitations, with misidentification of cloud layers as the PBL and a lack of retrievals under favourable conditions. These results underline current shortcomings of A-ALD for PBL detection, while indicating potential for future algorithm improvements.

The second approach applied combined variance–gradient methods to attenuated backscatter profiles from the A-EBD product, supported by cloud screening using the A-FM product. This strategy allowed more robust and physically consistent PBLH estimates. The comparison with ground-based ceilometer references resulted in a standard deviation of 343 m and a mean bias of 101 m. The nearly symmetric uncertainty distribution highlights the reliability of this approach. Radiosonde-based results showed a clear dependence on the retrieval method, with the best performance obtained for gradient-based approaches, although their statistical representativeness is limited by the small number of available cases.

These findings highlight the capability of EarthCARE’s ATLID to capture the PBL from space for climatological and modeling applications. The validation also emphasizes the importance of networks such as E-Profile, which provide the necessary reference data to evaluate satellite-derived boundary layer products on a continental scale.

How to cite: Rodríguez-Navarro, O., Muñiz-Rosado, J., Haefele, A., Sauvageat, E., Díaz-Zurita, A., Naval-Hernández, V. M., Cazorla, A., Pérez-Ramírez, D., Alados-Arboledas, L., and Navas-Guzmán, F.: Validation of EarthCARE-Derived Planetary Boundary Layer Height Using the E-Profile Ceilometer Network and Radiosondes , EGU General Assembly 2026, Vienna, Austria, 3–8 May 2026, EGU26-13319, https://doi.org/10.5194/egusphere-egu26-13319, 2026.

EGU26-14141 | Orals | AS3.11

Global Retrievals of Cloud Condensation Nuclei and Aerosol Absorption based on the first year of EarthCARE ATLID observations 

Jens Redemann, Lan Gao, Bradley Lamkin, Philip Stier, Dave Donovan, Gerd-Jan van Zadelhoff, Silke Gross, and Martin Wirth

Studies of aerosol-cloud interactions and estimates of the effective aerosol radiative forcing (ERF) of climate depend crucially on the vertical distribution of aerosol microphysical and radiative properties, but few reliable observations of such properties exist on a global scale. The 2024 launch of the EarthCARE mission provides new observations of aerosol extinction from the ATMospheric LIDar (ATLID) system. These observations are proving to be superior to past satellite-based lidar observations of aerosol extinction in accuracy because of the use of the high-spectral resolution lidar (HSRL) technique. These high-accuracy lidar observations can be used as input to machine-learning (ML) models to estimate cloud condensation nuclei (CCN at 0.4% supersaturation) and aerosol absorption (ABS at 532nm).

We present novel ML-based CCN and ABS retrievals using the first full year of ATLID observations (September 2024 to August 2025) of aerosol backscatter, extinction, and depolarization as predictors. These higher-level aerosol properties are compared to retrievals of the same quantities derived from airborne HSRL observations by the WALES system (derived from WAter vapor Lidar Experiment in Space) during the ORCESTRA (ORganized Convection and EarthCARE STudies over the Tropical Atlantic) PERCUSION (Persistent EarthCARE Underflight Studies of the ITCZ and Organized Convection) campaign in the summer of 2024. We provide validation results of the ML-based CCN and ABS retrievals against ground-based in situ observations, which indicate relative errors less than 30% for all but the cleanest aerosol loading conditions. Based on the first year of ATLID observations, we present global maps of ML-derived CCN and ABS and suggestions for improvements in the ATLID observations. Finally, we discuss opportunities to study aerosol-cloud-climate interactions facilitated by these new retrievals and climatologies.

How to cite: Redemann, J., Gao, L., Lamkin, B., Stier, P., Donovan, D., van Zadelhoff, G.-J., Gross, S., and Wirth, M.: Global Retrievals of Cloud Condensation Nuclei and Aerosol Absorption based on the first year of EarthCARE ATLID observations, EGU General Assembly 2026, Vienna, Austria, 3–8 May 2026, EGU26-14141, https://doi.org/10.5194/egusphere-egu26-14141, 2026.

EGU26-16100 | ECS | Orals | AS3.11

Evaluation of Doppler Velocity in a GSRM Using the EarthCARE Satellite with Implications for Improving Model Cloud Microphysics 

Shuhei Matsugishi, Yuhi Nakamura, Tatusya Seiki, Woosub Roh, Kentaroh Suzuki, and Masaki Satoh

Conventional climate and numerical weather prediction models have long relied on empirical parameterizations of hydrometeor fall speeds, which have not been comprehensively validated on the global scale due to a lack of their global observations. Nevertheless, fall-speed parameters strongly influence model performance and are often subject to tuning. For example, Takasuka et al. (2024) showed that modifying the fall speeds of snow and rain improves the representation of both climate-scale statistics and intraseasonal variability. However, such tuning is not directly constrained by observations; instead, parameter values are selected to best reproduce large-scale climate fields and disturbances.

Notable in this regard is the recent emergence of the EarthCARE satellite, launched in late May of 2024, which provides the first-ever global observations of the vertical motion of hydrometeors from space. In this study, we compare representative fall-speed parameter settings in the Nonhydrostatic Icosahedral Atmospheric Model (NICAM) against EarthCARE observations. We use a single-moment cloud microphysics scheme (Tomita, 2008; Roh and Satoh, 2014) with two configurations. One employs the tuned fall-speed parameters proposed by Takasuka et al. (2024), while the other follows the original parameterization used in Kodama et al. (2021). The Takasuka et al. (2024) configuration prescribes slower fall speeds for both snow and rain than the Kodama et al. (2021) setting. To enable a consistent comparison with EarthCARE, EarthCARE-like observables are generated using the Joint Simulator for Satellite Sensors (Hashino et al., 2013) and evaluated against satellite measurements.

The results show that the Takasuka et al. (2024) configuration produces snow and rainfall fall speeds that are closer to EarthCARE observations than those obtained with the Kodama et al. (2021) setting, although it tends to overestimate radar reflectivity. In addition, the Takasuka configuration is confirmed to better reproduce deep convective characteristics. Our analysis also identifies several issues that require further refinement of the cloud microphysics scheme, including the representation of weak precipitation and the temperature dependence of snowfall terminal velocity. These results highlight an added value of unprecedented measurement information from EarthCARE Doppler capability that points to a possible area of further improvement of model microphysics in GSRMs at a process level.


How to cite: Matsugishi, S., Nakamura, Y., Seiki, T., Roh, W., Suzuki, K., and Satoh, M.: Evaluation of Doppler Velocity in a GSRM Using the EarthCARE Satellite with Implications for Improving Model Cloud Microphysics, EGU General Assembly 2026, Vienna, Austria, 3–8 May 2026, EGU26-16100, https://doi.org/10.5194/egusphere-egu26-16100, 2026.

EGU26-16130 | Posters on site | AS3.11

A new OT detection approach over East Asia and its validation using EarthCARE data 

Jinyeong Kim, Myoung-Hwan Ahn, and Myoung-Seok Suh

Overshooting tops (OTs) are key indicators of severe weather events associated with deep convection, and geostationary satellite observations play a critical role in monitoring OTs with high spatiotemporal resolution. The infrared window texture (IRW-texture) algorithm (Bedka et al., 2010) identifies OTs as localized cold spots relative to the surrounding anvil. This approach overcomes the limitations of traditional brightness temperature difference methods, which tend to overestimate anvil regions as OTs. However, the IRW-texture algorithm involves uncertainties due to its reliance on model-based tropopause information and fixed detection thresholds. To address these limitations, this study proposes a regionally adapted OT detection algorithm for East Asia by incorporating satellite-derived tropopause information from the GK-2A/AMI atmospheric profile product and optimizing key detection thresholds for the target region. The improved algorithm was validated using the Cloud Profiling Radar (CPR) onboard the EarthCARE satellite. The CPR provides enhanced sensitivity and Doppler velocity measurements compared to previous spaceborne radars, enabling precise characterization of the vertical structure of overshooting convection. Taking advantage of these capabilities, we conducted a detailed physical validation of the detected OTs. The results show that the OTs detected by the algorithm align closely with the vertical updrafts captured by the CPR, validating its reliability in identifying active overshooting convection. Although constrained by a limited number of cases, this pioneering validation using EarthCARE observations demonstrates the importance of physically consistent, region-specific adaptations. These results suggest a promising pathway for enhancing next-generation global convection monitoring capabilities.

How to cite: Kim, J., Ahn, M.-H., and Suh, M.-S.: A new OT detection approach over East Asia and its validation using EarthCARE data, EGU General Assembly 2026, Vienna, Austria, 3–8 May 2026, EGU26-16130, https://doi.org/10.5194/egusphere-egu26-16130, 2026.

EGU26-16799 | ECS | Posters on site | AS3.11

Quantifying three-dimensional radiative transfer effects of clouds using EarthCARE observations and collocated airborne data 

Dimitra Kouklaki, Alexandra Tsekeri, Anna Gialitaki, Bernhard Mayer, Silke Groß, Martin Wirth, Claudia Emde, Eleni Marinou, Stelios Kazadzis, and Vassilis Amiridis

The effect of clouds on radiation remains a critical source of uncertainty in climate and weather prediction models. Moreover, the 3D structure of the clouds, including horizontal heterogeneity along with cloud vertical placement, further affects the radiation fields. Herein we utilize the 3D cloud scenes provided by EarthCARE to quantify the effect of the cloud 3D structure on radiation. Monte Carlo radiative transfer (RT) simulations from the MYSTIC/libRadtran model are employed to calculate the 1D vs 3D radiation fields. Airborne observations are also utilized, acquired during the ORCESTRA/PERCUSION EarthCARE Cal/Val campaign in the tropical Atlantic.

Simulated top-of-atmosphere 1D and 3D radiances and irradiances are compared with EarthCARE Broadband Radiometer (BBR) observations, along with collocated radiation observations from the Munich Aerosol Cloud Scanner (specMACS) onboard the HALO aircraft during the ORCESTRA/PERCUSION campaign. The 1D vs 3D RT simulations are performed to investigate the importance of the 3D cloud structure on the cloud radiation fields, for different types of clouds.

This analysis is part of the Obs3RvE EarthCARE+ project, which aims to develop new realistic 3D cloud scenes, combining EarthCARE and Meteosat Third Generation (MTG) observations, employing machine learning tools. These new 3D cloud scenes are expected to improve estimates of the cloud radiative effect from EarthCARE, as well as extend its suite of products to solar energy applications.


Acknowledgements:

This work has been financially supported by the Obs3RvE (Optimising 3D RT Earthcare product using geostationary observations and AI) project, funded from the European Space Agency under Contract No. 4000147848/25/I/AG, the PANGEA4CalVal project (Grant Agreement 101079201) funded by the European Union , the CERTAINTY project (Grant Agreement 101137680) funded by Horizon Europe program, the EarthCARE DISC project, funded by the European Space Agency under Contract No. 4000144997/24/I-NS and the AIRSENSE (Aerosol and aerosol cloud Interaction from Remote SENSing Enhancement) project, funded from the European Space Agency under Contract No. 4000142902/23/I-NS. It is also based upon work from COST Action EARLICOST, CA24135, supported by COST (European Cooperation in Science and Technology). DK, ΑΤ and SK would like to acknowledge COST Action HARMONIA (International network for harmonization of atmospheric aerosol retrievals from ground-based photometers), CA21119, supported by COST (European Cooperation in Science and Technology). 

How to cite: Kouklaki, D., Tsekeri, A., Gialitaki, A., Mayer, B., Groß, S., Wirth, M., Emde, C., Marinou, E., Kazadzis, S., and Amiridis, V.: Quantifying three-dimensional radiative transfer effects of clouds using EarthCARE observations and collocated airborne data, EGU General Assembly 2026, Vienna, Austria, 3–8 May 2026, EGU26-16799, https://doi.org/10.5194/egusphere-egu26-16799, 2026.

EGU26-18995 | Orals | AS3.11

EarthCARE Campaigns Status 

Jonas von Bismarck, Robert Koopman, Alex Hoffmann, Stephanie Rusli, Montserrat Pinol Sole, Malcolm Davidson, Vasileios Tzallas, Bjoern Frommknecht, and Timon Hummel

Assuring the data quality of the ESA’s EarthCARE science products is a comprehensive collaborative effort. It is being realised by contributions from the independent EarthCARE validation team (ECVT) as well as monitoring-, calibration- and airborne campaign activities performed under ESA (co-)management or coordinated with ESA.

Airborne and other field campaigns with EarthCARE-like as well complementary in-situ have payloads have played and continue to play an essential role in stabilizing and improving the quality of the of the EarthCARE’s user products.

EarthCARE is ESA’s most complex Earth Explorer mission to date, in collaboration with JAXA. For the sake of validating the various single and multi-sensor products from the lidar, radar, imager and radiometer,  the number of airborne underflights achieved during EarthCARE’s first 2 years in orbit significantly exceeds those typical for EO missions and is complemented by comparisons with a multitude of ground-based and shipborne instruments worldwide, intercomparisons with other satellites, and analysis involving numerical weather and air quality models. The success of these activities enabled the swift improvement and public release of all scientific EarthCARE products within a year after commissioning.

The presentation will provide the status of EarthCARE campaigns by giving an overview of the activities and selected key findings during its first 2 years in orbit as well as an outlook of what is planned.

How to cite: von Bismarck, J., Koopman, R., Hoffmann, A., Rusli, S., Pinol Sole, M., Davidson, M., Tzallas, V., Frommknecht, B., and Hummel, T.: EarthCARE Campaigns Status, EGU General Assembly 2026, Vienna, Austria, 3–8 May 2026, EGU26-18995, https://doi.org/10.5194/egusphere-egu26-18995, 2026.

EGU26-20361 | Posters on site | AS3.11

Building a long-term cloud record from spaceborne lidars: merging CALIOP with ATLID 

Artem Feofilov, Karim Slimani, Hélène Chepfer, and Vincent Noël
Clouds exert multifaceted radiative effects on Earth's energy budget, acting as both insulators and reflectors that profoundly influence regional and global climate dynamics. Since 2006, spaceborne active sounders have monitored clouds with unprecedented vertical and horizontal resolution. Yet comparing cloud data from different lidars remains problematic - variations in wavelength, pulse energy, detector type, and observation times create discontinuities that complicate our understanding of long-term cloud behavior.
This study presents a methodology to reconcile cloud observations from multiple spaceborne lidar platforms: CALIPSO (2006–2023), ALADIN/Aeolus (2018–2023), IceSat-2 (2018–present), ACDL/Daqi-1 (2022–present), and ATLID/EarthCARE (2024–present). We have already demonstrated this approach works for CALIOP and ALADIN (Feofilov et al., 2024); here we apply it to bridge CALIOP and ATLID.
 
The approach
We use the Scattering Ratio at 532 nm (SR532) as our common language across all lidars. For measurements at other wavelengths, we convert the retrieved optical properties to SR532 and ATB532 (Attenuated Total Backscatter at 532 nm), enabling direct comparison. Since different signal-to-noise ratios between instruments can affect cloud detection near the detection threshold, we pay close attention to these differences.
When satellites don't share the same viewing times - even with nearly identical equator crossings - we apply a diurnal cycle correction using climatology derived from CATS measurements as in (Feofilov and Stubenrauch, 2019; Feofilov et al., 2014). Since the satellites fly in opposite directions, they observe extratropical zones at different local times, and we must account for this.
For missions that overlap in time, we fine-tune our cloud detection parameters until the datasets transition seamlessly. We then scrutinize collocated data across latitudes, altitudes, and seasons, hunting for differences and correcting for them where we find instrument sensitivity or noise effects.
When instruments don't overlap that is the case for CALIOP and ATLID, we use a different strategy: we identify geographical zones characterized by minimal interannual variability and trends. These "stable" zones become our reference for intercalibration, allowing us to anchor ATLID to CALIOP without a shared observational period.
What we get
We take ATLID's complete baseline, apply the wavelength conversion, perform diurnal cycle corrections, run our detection algorithm with the thresholds we've defined, generate global cloud distributions for the entire mission, and discuss its key properties with respect to CALIOP. 
 
References:
Feofilov, A. G. and Stubenrauch, C. J.: Diurnal variation of high-level clouds from the synergy of AIRS and IASI space-borne infrared sounders, Atmos. Chem. Phys., 19, 13957–13972, https://doi.org/10.5194/acp-19-13957-2019, 2019.
Feofilov, A., Chepfer, H., Noël, V., and Hajiaghazadeh-Roodsari, M.: Towards Establishing a Long-Term Cloud Record from Space-Borne Lidar Observations, Springer aerospace technology, 57–72, https://doi.org/10.1007/978-3-031-53618-2_6, 2024.

How to cite: Feofilov, A., Slimani, K., Chepfer, H., and Noël, V.: Building a long-term cloud record from spaceborne lidars: merging CALIOP with ATLID, EGU General Assembly 2026, Vienna, Austria, 3–8 May 2026, EGU26-20361, https://doi.org/10.5194/egusphere-egu26-20361, 2026.

EGU26-20488 | ECS | Orals | AS3.11

Cloud characteristics and 3D radiative effects in EarthCARE MSI and synergy retrievals 

Gregor Walter, Anja Hünerbein, Sebastian Bley, and Nils Madenach

Imaging spectrometers, such as the multispectral imager (MSI) onboard EarthCARE, are used to derive cloud properties from backscattered solar radiation. The retrievals rely on the independent column approximation and the assumption of vertically and horizontally homogeneous clouds. These 1D simplificatopns neglect the impact of cloud structure on 3D radiative transfer, leading to biases, e.g., in the derived effective radius or cloud water path of the MSI cloud produt (M-COP).

While MSI provides information on the horizontal cloud field and cloud-top structure from brightness temperatures (BTs), the active instruments of EarthCARE, the cloud profiling radar (CPR) and the atmospheric lidar (ATLID), provide vertical cloud profiles along the satellite track. In the synergy product (ACM-CAP), CPR and ATLID are combined with nadir pixels of MSI to derive best estimates of vertical atmospheric profiles, which serve as a basis for radiative transfer simulations for closure studies in the ESA EarthCARE retrieval chain. As in the single-instrument retrieval, MSI contributes to ACM-CAP under the assumption of independent columns.

In this study, cloud properties from M-COP and ACM-CAP are analyzed while accounting for cloud structure information, including cloud fraction, standard deviations, and BT gradients, which are used to identify whether a pixel is located on the sunlit or shadowy side of a cloud. By comparing sunlit and shadowy pixels, we show that 3D radiative effects introduce systematic biases in both products, with e.g., cloud water path values being higher on the sunlit side. In ACM-CAP, the magnitude of these biases depends on the relative contribution of MSI radiances to each atmospheric column and varies with cloud type and surface conditions.

Cloud properties from M-COP are compared to ACM-CAP to identify patterns of agreement and deviation, with focus on pixels for which we assume low estimated 3D bias in ACM-CAP. Radiative transfer simulations based on ACM-CAP are performed using the MYSTIC Monte Carlo solver, showing aggreement to the observations and demonstrating that the inclusion of MSI radiances in the synergy product introduces 1D/3D inconsistencies that can affect radiative closure studies.

How to cite: Walter, G., Hünerbein, A., Bley, S., and Madenach, N.: Cloud characteristics and 3D radiative effects in EarthCARE MSI and synergy retrievals, EGU General Assembly 2026, Vienna, Austria, 3–8 May 2026, EGU26-20488, https://doi.org/10.5194/egusphere-egu26-20488, 2026.

EGU26-21727 | ECS | Orals | AS3.11

Global Riming Signatures from EarthCARE CPR Doppler velocity measurements 

Jiseob Kim, Pavlos Kollias, Bernat Puigdomènech Treserras, and Alessandro Battaglia

Riming, the growth of ice particles by accretion of supercooled liquid droplets, is a key microphysical pathway in mixed-phase clouds, strongly influencing precipitation formation and cloud radiative effects. However, its global occurrence and variability have remained poorly constrained by observations, as riming is typically inferred indirectly at the global scale, while more direct evidence has been obtained primarily from limited regions or specific field campaigns. The Earth Cloud, Aerosol and Radiation Explorer (EarthCARE), launched in May 2024, carries the first spaceborne Doppler Cloud Profiling Radar (CPR), enabling near-global measurements of vertical motions within clouds. In this study, we exploit EarthCARE CPR Doppler observations to investigate microphysical signatures embedded in retrieved ice sedimentation velocity, with a particular focus on vertical gradients as an indicator of riming. The physical basis is that rimed ice particles often undergo rapid mass growth over short vertical distances, leading to corresponding changes in fall speed and producing localized acceleration patterns in sedimentation velocity profiles. We develop a gradient-based riming detection algorithm to derive riming probability at near-global scale and present the first maps of its spatial distribution and seasonal variability. The resulting climatology reveals where riming is most prevalent and how its occurrence shifts with season, providing observational constraints that were previously inaccessible from space. Because riming remains a major source of uncertainty in weather and climate model microphysics, these global statistics offer a new benchmark for evaluating and improving riming parameterizations in numerical models, including emerging km-scale modeling efforts.

How to cite: Kim, J., Kollias, P., Puigdomènech Treserras, B., and Battaglia, A.: Global Riming Signatures from EarthCARE CPR Doppler velocity measurements, EGU General Assembly 2026, Vienna, Austria, 3–8 May 2026, EGU26-21727, https://doi.org/10.5194/egusphere-egu26-21727, 2026.

EGU26-22091 * | Orals | AS3.11 | Highlight

EarthCARE Mission Status 

Bjoern Frommknecht and the EarthCARE Mission Team

The Earth Cloud Aerosol and Radiation Explorer (EarthCARE) mission, a collaborative effort between the European Space Agency (ESA) and the Japan Aerospace Exploration Agency (JAXA), aims to address critical uncertainties in climate predictions related to cloud-aerosol interactions and their effects on solar and thermal radiation.

Launched in May 2024, EarthCARE has been in orbit for almost two years, providing invaluable data to the scientific community. EarthCARE's payload includes two active instruments, the cloud-aerosol lidar (ATLID) and the cloud Doppler radar (CPR), along with the passive multispectral imager (MSI) and broad-band radiometer (BBR). These instruments work synergistically to deliver vertical profiles of cloud ice and liquid water, aerosol types, precipitation, and heating rates. Additionally, they measure solar and thermal top-of-atmosphere radiances, aiming to reconstruct top-of-the-atmosphere short- and longwave fluxes with an accuracy of 10 Wm-2 on a 10 km x 10 km scene. The mission has successfully developed and disseminated data products through a coordinated approach between ESA and JAXA, ensuring continuous information exchange between European and Japanese algorithm and science teams. EarthCARE data is freely available to the scientific community, with all products available to the public, including three- and four-sensor Level-2b synergistic data.

This presentation gives the EarthCARE mission status after almost 2 years in orbit. It will cover the status of all mission elements, including instruments, platform and ground segments. In addition highlight results from the mission will be shown, together with an outlook on future activities.

How to cite: Frommknecht, B. and the EarthCARE Mission Team: EarthCARE Mission Status, EGU General Assembly 2026, Vienna, Austria, 3–8 May 2026, EGU26-22091, https://doi.org/10.5194/egusphere-egu26-22091, 2026.

EGU26-1132 | ECS | Posters on site | AS3.12

Understanding and Correcting Biases in INSAT 3D Cloud Fraction Using High-Resolution Satellite Data 

Aiswarya Ramachandran and Sagnik Dey

Clouds play a crucial role in the Earth’s energy balance, thereby influencing its climate system.  Cloud fraction (CF) is one of the important Essential Climate Variables. The discrepancies among satellite CF products are due to four effects: the Resolution effect, the View angle effect, the ability of the sensor to detect clouds, and the difference in satellite overpass time. Additionally, the reanalysis data is not a direct observation but rather depends on the model parameters. To understand the diurnal variation of CF, we need to use data from a geostationary satellite after bias correction, if any. To understand the cloud processes that are inevitable in the climate system, we need to compare and study existing cloud products and understand the CF data and biases.  

This study leverages INSAT 3D geostationary satellite data to monitor cloud fraction changes over the Indian region from 2014 to 2024, providing high temporal and spatial resolution insights. We examine diurnal and seasonal patterns in CF and compare them against bias-corrected MODIS, MISR data, and study diurnal variation using ERA5 reanalysis datasets. Preliminary analysis reveals systematic biases in INSAT-3D CF, with differences in amplitude and phase relative to ERA5. Unless the biases in INSAT 3D are quantified and corrected, the diurnal pattern in CF cannot be understood robustly over the Indian region.  

To overcome the Resolution effect, we employ a pattern recognition technique having feature vector to correct the CF bias in the INSAT 3D data using the CF from high spatial resolution satellites such as Sentinel 2 (QA60 cloud mask band). The optimized feature vector includes - Ae (standard method estimate of CF), Aedge (fraction of cloudy pixels that border a clear pixel on at least 1 of their eight sides or vertices), the first moment invariant (Hu moment), Mean, Variance and entropy of the grey levels in the scene, which makes it a six dimensional vector. The radiance from the thermal band of Landsat 8/9 can be used as an extra dimension during nighttime. The cloud masks that have similar spatial features will have similar true CFs and the degree of correction depends upon ratio of cloud size to pixel size and distribution of true cloud area. 

How to cite: Ramachandran, A. and Dey, S.: Understanding and Correcting Biases in INSAT 3D Cloud Fraction Using High-Resolution Satellite Data, EGU General Assembly 2026, Vienna, Austria, 3–8 May 2026, EGU26-1132, https://doi.org/10.5194/egusphere-egu26-1132, 2026.

EGU26-1631 | Orals | AS3.12

A sky camera network (SKYCAM) for the validation of the remote sensing of clouds from Sentinel 2/3 

Eric Vermote, Andres Santamaria Artigas, and Sergii Skakun

In this work, we describe a newly established network of fisheyes sky cameras (SKYCAM) at a dozen of locations worldwide for continuous cloud monitoring. Each location is equipped with two cameras at about a 100m distance from each other. This dual view enables the retrieval of the altitude of the cloud base.  The cameras acquire a picture (1000 x 2000) of the sky every minute in three different wavelength (Red, Green and Blue) and the data are directly sent to a central facility for processing.

The data are calibrated both for precise geometry (using a variety of techniques including systematic observation of the sun) and radiometry (using Radiative transfer and aerosol information). Using the cloud base information derived from stereo, calibrated radiances and radiative transfer, additional properties of the cloud can be derived (cloud thickness and top height) that can be used to re-construct observations from satellite data. We apply this technique to validate cloud observations from Sentinel 2 /3. This method enables an objective analysis of the remotely sensed cloud mask performances and possible improvements by providing  a large range of surface conditions (vegetation, snow, bright surfaces, urban area) and seasons as the system operates continuously.

At some locations, this system is complemented by surface reflectance measurements over a 100m x 200m area performed from a multispectral camera (CAMSIS) mounted a high tower and/or measurements from AERONET which enable the development/validation of more advanced products (aerosol spatialization, incoming shortwave and photosynthetically active radiation, satellite derived surface reflectance).

How to cite: Vermote, E., Santamaria Artigas, A., and Skakun, S.: A sky camera network (SKYCAM) for the validation of the remote sensing of clouds from Sentinel 2/3, EGU General Assembly 2026, Vienna, Austria, 3–8 May 2026, EGU26-1631, https://doi.org/10.5194/egusphere-egu26-1631, 2026.

EGU26-2438 | ECS | Posters on site | AS3.12

Aerosol Remote Sensing in Pakistan: Current Status, Challenges, and Future Directions 

Muhammad Umar Aslam

Aerosols play a critical role in Pakistan’s atmospheric environment by influencing air quality, public health, weather systems, and regional climate dynamics. Given the country’s diverse geography ranging from arid deserts and fertile plains to high-altitude mountainous regions. Pakistan experiences complex aerosol compositions arising from both natural sources (desert dust, sea salt, biogenic particles) and anthropogenic activities (industrial emissions, vehicular exhaust, biomass burning, and urban pollution). This review synthesizes the current state of aerosol remote sensing research in Pakistan, with a particular focus on satellite-based observations, ground-based networks, and integrated modeling approaches. We examine the application of major remote sensing platforms and products for retrieving aerosol optical depth, aerosol type, spatial–temporal variability, and long-term trends across key regions such as the Indo-Gangetic Plain, major urban centers, and transboundary dust corridors. The review highlights how aerosol remote sensing has advanced understanding of seasonal pollution episodes, dust transport mechanisms, monsoon–aerosol interactions, and aerosol radiative effects in Pakistan. Despite notable progress, significant challenges remain, including limited ground validation, data gaps in mountainous and rural areas, uncertainties in aerosol characterization, and insufficient integration with health and climate impact assessments. The paper concludes by outlining future research priorities, emphasizing the need for enhanced ground-based monitoring, high-resolution satellite data assimilation, and interdisciplinary frameworks to support evidence-based air quality management and climate policy in Pakistan.

How to cite: Aslam, M. U.: Aerosol Remote Sensing in Pakistan: Current Status, Challenges, and Future Directions, EGU General Assembly 2026, Vienna, Austria, 3–8 May 2026, EGU26-2438, https://doi.org/10.5194/egusphere-egu26-2438, 2026.

EGU26-3546 | ECS | Posters on site | AS3.12

Can we relate high resolution satellite-based aerosol optical depth (AOD) measurements to instantaneous evaporation rates in complex Dead Sea environs? 

Lee Sever, Jutta Vullers, Ulrich Corsmeier, Pinhas Alpert, and Alexandra Chudnovsky

The Dead Sea, a hypersaline terminal lake at the lowest place on Earth, has undergone significant environmental changes in recent decades, most notably is the reduction to the lake.  In this work, we investigate the factors influencing evaporation in this rapidly changing hydrological system. We combine in-situ eddy-covariance evaporation measurements from Ein Gedi (2014-2017; DESERVE data) with Multi-Angle Implementation of Atmospheric Correction (MAIAC) aerosol optical depth (AOD satellite-based retrievals and local meteorology to quantify diurnal, seasonal, and aerosol-related variability. Despite an expected diurnal cycle, our analysis shows that in most months no statistically significant difference exists between morning (10:30 local time Terra overpass) and noon (13:30 for Aqua) evaporation, with January and March being the only exceptions (p < 0.01). Seasonal patterns are more pronounced, with maximum evaporation in spring and summer and minimum rates in winter. Our results identified several high-evaporation outlier clusters which coincided with extreme weather, particularly heavy rainfall events (e.g., January 2015; March 2014). These events occur during or immediately after synoptic disturbances, suggesting that non-typical meteorology can temporarily enhance evaporation via changes in salinity, vapor pressure deficit, and surface-atmosphere interactions. Analysis of the evaporation-AOD relationship shows a weak but statistically significant negative correlation in summer morning (Terra) measurements (r = 0.255, p = 0.0007), the season with the most stable atmospheric conditions. Multiple regression indicates that temperature is the dominant predictor of evaporation in all models, while wind speed, wind direction, and upwelling longwave radiation are significant only during morning overpasses. Notably, the region has complex pollution regimes, as is reflected by the relationship between both parameters, whereby a dust player can impact the interaction.  Meaning that dust events may suppress evaporation by reducing incoming solar radiation and altering the surface energy balance. These results provide the first quantitative evidence of aerosol-evaporation interactions at the Dead Sea using co-located in situ and satellite datasets.


How to cite: Sever, L., Vullers, J., Corsmeier, U., Alpert, P., and Chudnovsky, A.: Can we relate high resolution satellite-based aerosol optical depth (AOD) measurements to instantaneous evaporation rates in complex Dead Sea environs?, EGU General Assembly 2026, Vienna, Austria, 3–8 May 2026, EGU26-3546, https://doi.org/10.5194/egusphere-egu26-3546, 2026.

EGU26-4795 | ECS | Orals | AS3.12

Aerosol Composition Retrieval from a combination of three satellite based instruments 

Ulrike Stöffelmair, Thomas Popp, Marco Vountas, and Hartmut Bösch

As different aerosol components have different effects on the climate, it is important to retrieve their global distribution over the longest feasible period. For this reason, we develop an aerosol composition retrieval based on a combination of three different satellite-based instruments which cover with their precursor and planned successor instruments the time from 1995 until 2030. The current algorithm is working with SLSTR (Sea and Land Surface Temperature Radiometer) aboard Sentinel 3A and 3B, the Infrared Atmospheric Sounding Interferometer (IASI), and the Global Ozone Monitoring Experiment-2 (GOME-2), both on METOP A/B/C. These instruments provide complementary information content due to combining measurements in the UV and VIS from GOME-2 with measurements in the TIR from IASI and the added value of the second viewing direction from the dual-view of SLSTR.

The new retrieval algorithm ROCAS (Retrieval Of Composition of Aerosols from Satellite) will be presented. ROCAS combines the preprocessed Level 1 data form the three instruments in so called super-pixels and performs an Optimal Estimation based retrieval after cloud masking and spectral consistency filtering. Retrieved parameters are the surface albedo at different wavelengths, the surface temperature, atmospheric column relative humidity, aerosol optical depth (AOD) and the individual AOD contributions for five aerosol components (black carbon, organic carbon, sulphate, sea salt and mineral dust).

With ROCAS, we can observe the expected patterns of the individual aerosol components, such as mineral dust over the deserts and their outflow regions, and black and organic carbon where smoke by large fires is transported. We can also observe sulphate over industrial regions in India, the USA and Europe.

ROCAS has the potential to quantitatively monitor aerosol composition and with this additional information to refine our understanding of their climate impact. In this study we show initial retrieval results for the individual aerosol components including a case study, a first validation and a comparison to other datasets including retrieval results from active instruments (EarthCare) and model data. The presentation will conclude with a discussion of the unique capabilities / additional information content for aerosol composition monitoring and remaining limitations of ROCAS.

How to cite: Stöffelmair, U., Popp, T., Vountas, M., and Bösch, H.: Aerosol Composition Retrieval from a combination of three satellite based instruments, EGU General Assembly 2026, Vienna, Austria, 3–8 May 2026, EGU26-4795, https://doi.org/10.5194/egusphere-egu26-4795, 2026.

EGU26-5597 | ECS | Posters on site | AS3.12

Cloud condensation nuclei concentrations derived from GRASP synergetic aerosol products for Sentinel-3/OLCI and Sentinel-5P/TROPOMI  

Xinyue Wang, Pavel Litvinov, Anton Lopatin, Masahiro Momoi, and Oleg Dubovik

Cloud condensation nuclei (CCN) concentrations indicate the ability of aerosols to activate into cloud droplets and therefore play an important role in aerosol–cloud interactions and their associated radiative forcings. Reliable observational constraints on CCN are essential for improving the representation of aerosol–cloud processes in climate models, yet remain challenging to obtain at adequate spatial and temporal scales.

The GRASP synergetic retrieval framework is designed to integrate complementary information from multiple satellite sensors, i.e., Sentinel-3/OLCI and Sentinel-5P/TROPOMI, enabling the retrieval of aerosol microphysical properties with enhanced spatial resolution and temporal coverage. In this study, we derived total CCN, as well as the CCN of each aerosol species, from the GRASP retrieved aerosol microphysical properties by defining CCN as the number of dry aerosol particles with radii exceeding 0.12 µm.  

Using data over 2022, we focus on Europe – the Mediterranean – Western Asia – Northern Africa as a testbed region characterized by diverse CCN distributions over both land and ocean. The obtained CCN values are evaluated against a CAMS reanalysis-derived CCN dataset (Block et al., 2024), and compared to the MODIS cloud droplet number concentration for a consistency check. The results show a robust agreement in both spatial patterns and magnitudes, particularly for biomass-burning and sulfate-dominated CCN over oceanic regions, which are especially relevant for aerosol–cloud interaction studies.

Our generated CCN dataset has been realistically applied to a case study of marine cloud perturbations associated with the 2018 Kīlauea volcanic eruption. The analysis demonstrates the capability of the dataset to capture coherent variability among sulfate aerosols, CCN, and low-level marine clouds in response to volcanic degassing, highlighting its potential for applications such as Marine Cloud Brightening research and broader evaluation and constraint of aerosol–cloud interactions in regional and global atmospheric models.

How to cite: Wang, X., Litvinov, P., Lopatin, A., Momoi, M., and Dubovik, O.: Cloud condensation nuclei concentrations derived from GRASP synergetic aerosol products for Sentinel-3/OLCI and Sentinel-5P/TROPOMI , EGU General Assembly 2026, Vienna, Austria, 3–8 May 2026, EGU26-5597, https://doi.org/10.5194/egusphere-egu26-5597, 2026.

EGU26-6993 | Posters on site | AS3.12

Hotspots of Aerosol Pollution Identified in Satellite Climatologies of Clouds 

Margit Aun, Andres Luhamaa, Hannes Keernik, and Velle Toll

Anthropogenic aerosols offset a poorly quantified fraction of greenhouse gas warming. Moreover, poorly understood aerosol impacts on clouds limit our ability to better constrain the sensitivity of Earth’s climate to anthropogenic radiative forcing. Recently, natural experiments have become a state-of-the-art approach for studying the causal impacts of aerosols on clouds. Here, we identify localised anomalies in cloud properties as recorded in long-term satellite climatologies from MODIS, AVHRR and SEVIRI satellite instruments. We identify aerosol-impacted cloud areas around megacities, near volcanoes and near shipping corridors as regions with reduced cloud droplet size in satellite climatologies of liquid-water clouds. The contrast in cloud properties between the polluted hot spot and the nearby unpolluted area depends on the horizontal resolution of a cloud climatology. Such resolution-dependence highlights the need to analyse localised cloud property anomalies in high-resolution climatologies of clouds. The natural experiments of aerosol impacts on clouds documented here can be used to better understand cloud responses to aerosols.

How to cite: Aun, M., Luhamaa, A., Keernik, H., and Toll, V.: Hotspots of Aerosol Pollution Identified in Satellite Climatologies of Clouds, EGU General Assembly 2026, Vienna, Austria, 3–8 May 2026, EGU26-6993, https://doi.org/10.5194/egusphere-egu26-6993, 2026.

EGU26-8022 | Posters on site | AS3.12

Characterizing Aerosol-Cloud Interactions during Nitrogen-Dominated Episodes over the Netherlands 

Namita Sinha, Herman Russchenberg, Isabelle Steinke, Nina Maherndl, George Biskos, Farhan R. Nursanto, and Ulrike Dusek

Aerosol-cloud interactions (ACI) are a significant source of uncertainty in climate projections. Nitrogen-dominated aerosol episodes are emerging over the Netherlands, strongly influencing local air quality and climate, but our understanding of aerosol-cloud interactions under these nitrogen-dominated conditions is still not well quantified. Ground-based remote-sensing instruments like cloud radars can provide us high temporal and spatial resolution data for cloud microphysics, like cloud droplet number concentration, and aerosol properties can be obtained using lidar measurements. In this study, we quantify how these aerosol particles in nitrogen-polluted episodes affect low-level clouds by combining remote-sensing observations with aerosol speciation measurements at the Ruisdael Observatory in the Netherlands.

Generally, column aerosol optical depth (AOD) from sun photometers and vertically resolved attenuated backscatter (ATB) from ceilometers are used as aerosol proxies. A key difference is that AOD represents extinction integrated over the full atmospheric column, whereas ATB is a vertically resolved backscatter profile, and ATB must therefore be vertically integrated for a meaningful comparison. However, both respond differently to meteorological parameters, aerosol loadings, and the instrument’s configurations. Therefore, understanding the variation of ATB and AOD in response to meteorology is essential. Overall, our framework will provide consistent conditions under which ceilometer ATB can be used as an aerosol proxy along with the column AOD during nitrogen-dominated episodes.

Here, we use a Mie model framework to investigate how ATB and AOD behave under different aerosol compositions, loadings, and meteorological conditions. Further, using a long-term observation from Cabauw (the Netherlands) as a case site, we focus on periods when nitrate clearly dominates the aerosol composition. Surface data from aerosol mass spectrometry and size-distribution measurements are combined with ceilometer profiles, sun-photometer retrievals, and meteorological data. Together, these measurements allow nitrogen-dominated episodes to be grouped by composition, relative humidity, and boundary-layer conditions, providing a consistent way to quantify aerosol-cloud interactions.

Our initial results indicate that, during nitrate-dominated episodes, hygroscopic aerosol particles build up in the boundary layer and strongly enhance light extinction. Extinction, backscatter, and other related aerosol optical properties respond strongly to RH-driven particle growth, making the growth factor a key control on the observed signals. We will investigate these relationships in more detail using measurements from both the RITA-2021 and the CAINA-2025 campaign datasets. These nitrate-rich aerosols act as cloud condensation nuclei (CCN), and they are expected to increase cloud droplet number concentration with more but smaller cloud droplets, which can be detected by ground-based cloud radar observations.

The resulting framework provides insight into how nitrogen-rich aerosol pollution affects clouds' microphysical properties and strengthens the understanding of aerosol-cloud interactions in nitrate-dominated environments.

How to cite: Sinha, N., Russchenberg, H., Steinke, I., Maherndl, N., Biskos, G., R. Nursanto, F., and Dusek, U.: Characterizing Aerosol-Cloud Interactions during Nitrogen-Dominated Episodes over the Netherlands, EGU General Assembly 2026, Vienna, Austria, 3–8 May 2026, EGU26-8022, https://doi.org/10.5194/egusphere-egu26-8022, 2026.

EGU26-8266 | Orals | AS3.12

Synergistic lidar and modelling frameworks for pollution monitoring: assessing model reliability between diverse urban sites 

Alexandra Chudnovsky, Kevin Ohneiser, Albert Ansmann, David Avisar, Sigalit Berkovic, Fima Roter, and Dorita Rostkier-Edelstein

Characterizing aerosol dynamics in coastal urban areas remains a challenge due to the interplay between complex topography and diverse emission sources. This study presents a framework integrating ground-based lidar observations with high-resolution Weather Research and Forecasting (WRF) simulations to resolve the three-dimensional structure of the Eastern Mediterranean (EM) boundary layer. We validate a high-resolution WRF model using diverse ground-based measurements. By evaluating distinct synoptic regimes such as long-range dust transport and complex multi-source pollution layering, we demonstrate how numerical modelling complements lidar-derived profiles of aerosols, humidity, and thermodynamics. A key finding of this integrated approach is the WRF capacity to provide relatively high accuracy estimates during daytime periods when solar background noise typically limits lidar signal, enabling continuous, 24-hour characterization of complex urban vertical profile. In particular, the WRF model successfully simulated key atmospheric features observed by lidar, supporting its application as a validated, complementary tool for refining urban air quality representation, especially during periods when continuous observational data are limited or unavailable. Our analysis also shows that surface-level monitoring largely underestimates the vertical complexity of pollution transport in regions like Haifa and Tel Aviv. This study presents a transferable methodology for refining aerosol and moisture distribution assessments in urban areas, where pollution layering conditions are difficult to predict.

How to cite: Chudnovsky, A., Ohneiser, K., Ansmann, A., Avisar, D., Berkovic, S., Roter, F., and Rostkier-Edelstein, D.: Synergistic lidar and modelling frameworks for pollution monitoring: assessing model reliability between diverse urban sites, EGU General Assembly 2026, Vienna, Austria, 3–8 May 2026, EGU26-8266, https://doi.org/10.5194/egusphere-egu26-8266, 2026.

EGU26-9705 | ECS | Posters on site | AS3.12

Multi-frame cloud prediction from all-sky images: RGB vs segmented masks 

Javier Gatón, Roberto Román, Cesar Guzman, Daniel González-Fernández, Bruno Longarela, Celia Herrero del Barrio, Sara Herrero-Anta, Ramiro González, and Carlos Toledano

Short-term forecasting of cloud position is essential for improving solar irradiance nowcasting, the management of photovoltaic systems, and atmospheric monitoring. In this work, we evaluate the impact of replacing RGB all-sky images with semantically segmented sky masks as an input representation for multi-frame cloud motion prediction, assuming the availability of a sky segmentation model. To this end, we have adapted a ConvLSTM (Shi et al., 2015) backbone to operate on five-class segmentation masks (cloud-free, cloud, thin cloud, sun, other), enabling a controlled comparison with an RGB-based ConvLSTM. The training and evaluation are performed using the SKIPP’D dataset (Nie et al.,2023): around 58,000 videos with 1-min resolution. To ensure consistent evaluation, all predictions and ground-truth frames are processed through a common segmentation model. Thus, model performance is evaluated in the segmentation label space, using segmenter-derived masks as a proxy reference rather than physical ground truth.

Operating on the semantic mask space improves temporal stability and agreement with reference masks across standard segmentation metrics. On average, it increases the Intersection over Union by 0.49%, and the Dice coefficient by 0.94%, relatively to the RGB baseline. Improvements are most notable for the dominant classes cloud and cloud-free, while performance on thin-cloud and sun pixels remains limited, due to their lower frequency, intrinsic semantic ambiguity, and the reduced spatial resolution of the dataset. The results also show a trade-off between recall reduction and precision improvement.

These results indicate that introducing semantic information as an intermediate representation simplifies the prediction task and strengthens the model’s ability to capture cloud evolution patterns within a segmentation-based evaluation framework. While the present study does not provide end-to-end validation against irradiance measurements, it highlights the potential of segmentation-based approaches for future cloud nowcasting systems and motivates further work at higher spatial resolutions, with direct radiative validation, and with different network architectures.


This work was supported by the Ministerio de Ciencia e Innovación (MICINN), with the grant no. PID2024-157697OB-I00 and TED2021-131211BI00375. Financial support of the Department of Education, Junta de Castilla y León, and FEDER Funds is acknowledged (CLU-2023-1-05). This work was funded by European Comision through the EUBURNRISK project (INTERREG-SUDOE; S2/2.4/F0327). The authors acknowledge the support of COST Action CA21119 HARMONIA and the Spanish Ministry for Science and Innovation to ACTRIS ERIC


Shi, Z. Chen, H. Wang, D.-Y. Yeung, W. kin Wong, W. chun Woo, Convolutional LSTM Network: A machine learning approach for precipitation nowcasting (2015). arXiv: 1506.04214

Nie, X. Li, A. Scott, Y. Sun, V. Venugopal, A. Brandt, Skipp’d: A sky images and photovoltaic power generation dataset for short-term solar forecasting, Solar Energy 255 (2023) 171–179.

How to cite: Gatón, J., Román, R., Guzman, C., González-Fernández, D., Longarela, B., Herrero del Barrio, C., Herrero-Anta, S., González, R., and Toledano, C.: Multi-frame cloud prediction from all-sky images: RGB vs segmented masks, EGU General Assembly 2026, Vienna, Austria, 3–8 May 2026, EGU26-9705, https://doi.org/10.5194/egusphere-egu26-9705, 2026.

EGU26-10005 | Posters on site | AS3.12

Integrated Water Vapor retrieval under cloudy sky conditions from SWIR satellite measurements in the context of C3IEL space mission project. 

Guillaume Penide, Raphaël Peroni, Céline Cornet, Alexis Zemb, Olivier Pujol, and Clémence Pierangelo

We present a retrieval algorithm based on the optimal estimation method for estimating the integrated water vapor above clouds using shortwave infrared radiance observations (Peroni et al., 2025). Water vapor plays a crucial role in cloud formation and evolution, particularly in convective systems where exchanges between clouds and their surrounding environment strongly modulate the local variability of atmospheric humidity. Improved knowledge of the water vapor distribution above and around clouds is therefore essential for better understanding cloud/water vapor interactions and for constraining Large-Eddy Simulations and weather prediction models.

The retrieval algorithm is developed in the framework of the Cluster for Cloud evolution, ClImatE and Lightning (C3IEL) space mission, scheduled for launch in 2028. C3IEL aims to advance our understanding of convective cloud dynamics by providing observations of three-dimensional cloud development velocities, electrical activity, and the water vapor distribution above and around clouds.

Results obtained for idealized atmospheric conditions with vertically homogeneous cloud profiles demonstrate the feasibility of retrieving the integrated water vapor above clouds from three shortwave infrared radiances. Absolute retrieval errors are found to be below 2 kg.m⁻² for optically thick clouds or for integrated water vapor contents below 20 kg.m⁻², and below 1 kg m⁻² for very thick clouds (COT > 150). For more realistic cases, from the ECMWF-IFS dataset, the retrieval performs well for water clouds, with RMSE generally below 1 kg.m⁻². Retrieval accuracy is found to mainly depend on cloud vertical penetration, with degraded performance for optically thin and low-level clouds (COT < 50 and cloud top height < 2 km).

For very low water vapor contents encountered mainly above high deep convective clouds, the algorithm tends to systematically overestimate the retrieved values due to an overestimation of the cloud extinction profile in the upper cloud layers within the inversion model. These results demonstrate the strong potential of shortwave infrared observations for retrieving integrated water vapor above clouds and provide guidance for further improvements of the retrieval algorithm in preparation for the C3IEL mission.

How to cite: Penide, G., Peroni, R., Cornet, C., Zemb, A., Pujol, O., and Pierangelo, C.: Integrated Water Vapor retrieval under cloudy sky conditions from SWIR satellite measurements in the context of C3IEL space mission project., EGU General Assembly 2026, Vienna, Austria, 3–8 May 2026, EGU26-10005, https://doi.org/10.5194/egusphere-egu26-10005, 2026.

EGU26-10085 | ECS | Posters on site | AS3.12

Marine-to-Inland Aerosol Vertical Structure over Taiwan during the 2024 ASIA-AQ and KPEx: Synergistic Observations from Ground-based MPL and NASA G-III Airborne HRSL-2 

Yueh-Chen Wang, Sheng-Hsiang Wang, Chuan-Chi Tu, Hsin-Chih Lai, Wei-Kuo Soong, and Neng-Huei Lin

Aerosol vertical structure across marine-to-inland transition regions is influenced by the interaction of synoptic forcing, mesoscale circulation, and boundary-layer processes, yet remains insufficiently documented in subtropical island environments. During February–March 2024, coordinated airborne and ground-based remote sensing observations were conducted over southern Taiwan as part of the NASA ASIA-AQ/Kao–Ping Experiment (KPEx-2024), focusing on a compact coastal–inland transition affected by complex terrain and episodic continental outflow. This study examines the vertical structure of aerosols along the marine–coastal–inland pathway using synergistic ground-based Micro Pulse Lidar (MPL) and NASA G-III airborne High Spectral Resolution Lidar (HRSL-2) observations, which provide complementary temporal continuity and three-dimensional spatial coverage. Two contrasting pollution episodes were selected to examine the vertical characteristics of aerosols under different dynamical conditions, including a locally influenced event under weak synoptic forcing and a long-range transport event associated with persistent northeasterly flow. The observations reveal notable differences in aerosol vertical distributions and layering between the two regimes, reflecting the combined influence of local accumulation processes and background-flow-driven transport. These results point to how synergistic multi-platform lidar observations can provide new insight into aerosol vertical structure and transport behavior across complex coastal transition regions.

How to cite: Wang, Y.-C., Wang, S.-H., Tu, C.-C., Lai, H.-C., Soong, W.-K., and Lin, N.-H.: Marine-to-Inland Aerosol Vertical Structure over Taiwan during the 2024 ASIA-AQ and KPEx: Synergistic Observations from Ground-based MPL and NASA G-III Airborne HRSL-2, EGU General Assembly 2026, Vienna, Austria, 3–8 May 2026, EGU26-10085, https://doi.org/10.5194/egusphere-egu26-10085, 2026.

EGU26-10287 | Posters on site | AS3.12

The 3DREAMS project: A study of the effect of 3D surface heterogeneity on aerosol retrieval based on synthetic images 

Vincent Leroy, Masahiro Momoi, Siyao Zhai, Nicolae Marton, Marta Luffarelli, Yves Govaerts, and Pavel Litvinov

To this date, most of the algorithms used to retrieve aerosol properties from multi-angular satellite images use a forward radiative transfer model with a baked-in 1D assumption. Among other things, this means neglecting the effects of surface heterogeneity, such as adjacency (the fact that neighbouring surface reflection properties perturb the diffuse component of incident radiation) and topography (the fact that the surface is not smooth and flat). This introduces bias in the radiative transfer simulation, and thus in the retrieved aerosol properties.

This project aims to investigate the impact of neglecting these heterogeneities on aerosol and surface retrievals from multi-angular satellite observations. For that purpose, a series of benchmarking cases was designed to assess the performance of the GRASP retrieval algorithm (currently state-of-the-art for the processing of EPS-SG/3MI observations) against a known reference created using Eradiate (an accurate 3D radiative transfer model). Benchmarking cases range from simple 1D setups aimed at verifying the alignment of the GRASP forward model and Eradiate, to complex, plausible 3D scenes generated after actual locations on Earth. All assume a 1D atmosphere to focus on the effects of surface heterogeneity.

The complex scenes incorporate topography and land cover information, with varied dominant land cover setups: agricultural, urban, coastal, mountain, in-land water (lake). Locations are situated near key AERONET stations, and the simulated instrument is derived from actual satellite specifications (i.e. geometries, wavelengths) based on PARASOL/POLDER.

In this presentation, we introduce our approach and discuss our conclusions on both the benchmarking approach and the results.

How to cite: Leroy, V., Momoi, M., Zhai, S., Marton, N., Luffarelli, M., Govaerts, Y., and Litvinov, P.: The 3DREAMS project: A study of the effect of 3D surface heterogeneity on aerosol retrieval based on synthetic images, EGU General Assembly 2026, Vienna, Austria, 3–8 May 2026, EGU26-10287, https://doi.org/10.5194/egusphere-egu26-10287, 2026.

EGU26-10719 | ECS | Posters on site | AS3.12

Cloud-height mapping from all-sky camera network  

Celia Herrero del Barrio, Roberto Román, Sara Herrero-Anta, Daniel González-Fernández, Rogelio Carracedo, Ramiro González, Bruno Longarela, Javier Gatón, David Mateos, Abel Calle, Carlos Toledano, Victoria Cachorro, and Ángel de Frutos

Clouds play a key role in the Earth’s radiative balance and atmospheric dynamics, yet large uncertainties persist in their representation in weather and climate models. These uncertainties are partly related to the limited availability of continuous, high-resolution observations of cloud geometry. In this context, ground-based imaging networks provide a valuable opportunity to observe cloud fields with high temporal and spatial detail. In this work, we present a general framework for cloud detection and cloud-height retrieval using a network of 25 all-sky cameras distributed across the city of Valladolid (Spain) and its surrounding areas.

All instruments are identical OMEA-3C all-sky cameras operated and geometrically calibrated within the GOA-SCAN infrastructure of the Group of Atmospheric Optics. The proposed methodology combines image preprocessing, cloud-pixel segmentation, identification of matching cloud pixels, and stereoscopic reconstruction to derive instantaneous cloud-height fields. Cloud heights are retrieved through stereoscopic triangulation from planar-projected image pairs (Nguyen and Kleissl, 2014; Beekmans et al., 2016; Blum et al., 2021). The system provides continuous observations every five minutes, allowing the monitoring of cloud spatial structure and short-term evolution.

For each acquisition time, every camera is paired with all other cameras in the network, producing multiple independent cloud-height estimates based on row-wise correlation techniques. These estimates are filtered using geometric constraints, correlation quality metrics, and physical plausibility criteria. The use of multiple camera distances enables sensitivity to different cloud layers and ensures a spatially consistent coverage of the urban area and its surroundings.

A key component of this study is the validation of the retrieved cloud heights using independent ground-based observations. Cloud-base heights derived from the all-sky camera network are compared with measurements from a co-located ceilometer, allowing an objective assessment of the retrieval accuracy under different cloud conditions. This comparison provides insight into the performance of the stereoscopic approach and its limitations, particularly for low and multi-layer cloud scenes.

The presented framework establishes a robust basis for future developments, including extended validation with additional remote-sensing instruments and satellite products, as well as improvements in retrieval accuracy and operational applicability.


This work was supported by the Ministerio de Ciencia e Innovación (MICINN), with the grant no. PID2024-157697OB-I00. This work is part of the project TED2021-131211B-I00375 funded by MCIN/AEI/10.13039/501100011033 and European Union, “NextGenerationEU”/PRTR and is based on work from COST Action CA21119 HARMONIA. Financial support of the Department of Education, Junta de Castilla y León, and FEDER Funds is gratefully acknowledged (Reference: CLU-2023-1-05). This work was funded by European Comision through the EUBURN-RISK project (INTERREG-SUDOE; S2/2.4/F0327). The authors acknowledge the support of the Spanish Ministry for Science and Innovation to ACTRIS ERIC and the Marie Sklodowska-Curie Staff Exchange Actions with the project GRASP-SYNERGY (grant no. 10 101131631).


Beekmans, C., Schneider, J., Läbe, T., Lennefer, M., Stachniss, C., and Simmer, C. (2016) Atmospheric Chemistry and Physics, 16, 14231–14248.

Blum, N. B., Nouri, B., Wilbert, S., Schmidt, T., Lünsdorf, O., Stührenberg, J., Heinemann, D., Kazantzidis, A., and Pitz-Paal, R. (2021) Atmospheric Measurement Techniques, 14, 5199–5224.

Nguyen, D. A. and Kleissl, J. (2014) Solar Energy, 107, 495–509.

How to cite: Herrero del Barrio, C., Román, R., Herrero-Anta, S., González-Fernández, D., Carracedo, R., González, R., Longarela, B., Gatón, J., Mateos, D., Calle, A., Toledano, C., Cachorro, V., and de Frutos, Á.: Cloud-height mapping from all-sky camera network , EGU General Assembly 2026, Vienna, Austria, 3–8 May 2026, EGU26-10719, https://doi.org/10.5194/egusphere-egu26-10719, 2026.

EGU26-11277 | Orals | AS3.12

New developments on SPEXone aerosol products on the NASA PACE mission 

Guangliang Fu, Sha Lu, Meng Gao, Jeroen Rietjens, and Otto Hasekamp

We present the latest developments in SPEXone aerosol products. Firstly, the RemoTAP-Hybrid algorithm is developed, combining Multiple Collaborated Neural Networks (MCNN) with a full physics inversion. RemoTAP-Hybrid improves SPEXone global aerosol retrievals regarding accuracy and speed. Secondly, following an analysis on AERONET data, we extend the aerosol description to a parametric 4 mode by adding a fine non-spherical mode, in addition to a fine spherical, coarse non-spherical, and coarse spherical mode. The new aerosol description extends retrieval capability for scenes dominated with non-spherical fine particles. Thirdly, higher level products are developed for aerosol composition (black carbon, brown carbon, dust, fine/coarse water/non-absorbing components, fine non-spherical non-absorbing component) based on the retrieved complex refractive index and aerosol volume per mode. We will present the global and seasonal distribution of chemical composition and aerosol microphysics retrieved from SPEXone.

We validate the retrieved aerosol properties with AERONET data for AOD, Angstrom Exponent, absorption AOD, and SSA, showing unprecedented accuracy. The RMSE for AOD is 0.051 (0.037) over land (ocean), and 78.3% (80.8%) of the AOD retrievals are within the Global Climate Observing System (GCOS) requirement. The RMSE for Angstrom Exponent is 0.186 (0.207), for absorption AOD is 0.023 (0.014), and for SSA is 0.038 (0.044) over land (ocean). Finally, we present our latest results on aerosol retrievals above cloud from SPEXone.

How to cite: Fu, G., Lu, S., Gao, M., Rietjens, J., and Hasekamp, O.: New developments on SPEXone aerosol products on the NASA PACE mission, EGU General Assembly 2026, Vienna, Austria, 3–8 May 2026, EGU26-11277, https://doi.org/10.5194/egusphere-egu26-11277, 2026.

EGU26-11749 | Posters on site | AS3.12

Synergetic retrieval of altitude-dependent cloud cover from ceilometers and infrared camera 

Rolf Rüfenacht, Maxime Hervo, Nicolas Hartmann, Przemysław Juda, Loris Foresti, Frédéric P. A. Vogt, Julian Gröbner, and Alexander Haefele

Total and altitude-dependent cloud cover are important characteristics of the present weather and used in nowcasting, numerical weather prediction and climate applications as well as for scientific studies. While cloud cover is still widely observed by humans, MeteoSwiss is in the process to automate the procedure using a variety of sensors. In this effort, the estimation of the cloud amount per cloud layer appeared to be particularly challenging as algorithms based exclusively on ceilometers could not satisfy all quality requirements. The main shortcomings are limitations in the representativity and the long integration time of 15 minutes, which prevents the delivery of timely and accurate values for the present weather.

In this context, we investigate how a well-calibrated hemispheric infrared camera combined with the ceilometer cloud base measurements can improve the cloud information. In the different investigated synergetic algorithms the ceilometer is the predominant source of cloud height information whereas the infrared camera provides information on the cloud amount. The more basic algorithm uses a threshold on the infrared brightness temperatures to distinguish cloudy from clear-sky pixels. A more elaborate algorithm matches cloud-base hits of the ceilometers with infrared camera pixels to produce cloud cover estimates for each cloud layer. This approach does not require a clear sky reference and is to a large extent insensitive to calibration inaccuracies. It further allows us to exploit the infrared image at high airmasses, i.e. far down towards the horizon, what in turn further improves spatial representativity. In this work, we evaluate both algorithms with respect to human observations and the reference algorithm based on ceilometers only.

How to cite: Rüfenacht, R., Hervo, M., Hartmann, N., Juda, P., Foresti, L., Vogt, F. P. A., Gröbner, J., and Haefele, A.: Synergetic retrieval of altitude-dependent cloud cover from ceilometers and infrared camera, EGU General Assembly 2026, Vienna, Austria, 3–8 May 2026, EGU26-11749, https://doi.org/10.5194/egusphere-egu26-11749, 2026.

EGU26-11824 | Posters on site | AS3.12

Quality Assessment of the Sentinel-3 Land Surface Reflectivity (LSR) Auxiliary Product from OLCI and SLSTR for Improved Aerosol and Cloud Retrievals 

Zhen Liu, Pavel Lytvynov, Christian Matar, Siyao Zhai, Smita Panda, David Fuertes, Anton Lopatin, Oleg Dubovik, Alexander Kokhanovsky, Grit Kirches, Carsten Brockmann, Verena Lanzinger, Arthur Lehner, and Julien Chimot

The Copernicus Sentinel-3 mission, carrying the Ocean and Land Colour Instrument (OLCI) and the Sea and Land Surface Temperature Radiometer (SLSTR), provides critical observations for monitoring atmospheric composition. Operational Level-2 algorithms for aerosol and cloud retrievals rely on accurate information from the Sentinel-3 Land Surface Reflectivity (LSR) Auxiliary Product to stabilize the inversion process. To address this requirement, this static LSR product is being developed at 1–2 km spatial resolution using a hybrid GRASP retrieval approach.

The hybrid GRASP approach is designed to provide stable full BRDF retrievals by reducing the number of parameters to be inverted. In this framework, aerosol properties at coarse resolution are not retrieved but are instead reused from existing multi-year datasets, such as PARASOL/GRASP and VIIRS. Furthermore, coarse-resolution surface products from the PARASOL/POLDER-3 satellite are utilized as a priori information for the high-resolution retrieval. Within this framework, OLCI benefits from its dense spectral sampling in the visible to near-infrared range, which is well suited for characterizing surface reflectance and BRDF spectral dependence. SLSTR complements this capability through its dual-viewing geometry, which provides additional constraints on surface anisotropy and helps reduce ambiguities between atmospheric and surface contributions. In addition, SLSTR’s short-wave and thermal infrared bands enhance cloud and snow screening and support more robust atmospheric correction.

In this work, we evaluate the generated LSR auxiliary product derived from Sentinel-3 OLCI and SLSTR measurements. The assessment follows a hierarchical strategy: first, the impact of the generated LSR is demonstrated by validating retrieved aerosol properties (AOD, Ångström exponent) globally against AERONET ground observations. Second, the retrieved surface BRDF is validated regionally against the GROSAT reference dataset, which provides synergetic AERONET and OLCI-A/B retrievals. Third, the products are compared with MODIS MCD43A3 surface albedo at the global scale, demonstrating strong spatial and radiometric consistency. The impact of the generated LSR dataset on aerosol property retrievals, aerosol layer height (ALH), water vapor (WV) and cloud properties is also discussed.

How to cite: Liu, Z., Lytvynov, P., Matar, C., Zhai, S., Panda, S., Fuertes, D., Lopatin, A., Dubovik, O., Kokhanovsky, A., Kirches, G., Brockmann, C., Lanzinger, V., Lehner, A., and Chimot, J.: Quality Assessment of the Sentinel-3 Land Surface Reflectivity (LSR) Auxiliary Product from OLCI and SLSTR for Improved Aerosol and Cloud Retrievals, EGU General Assembly 2026, Vienna, Austria, 3–8 May 2026, EGU26-11824, https://doi.org/10.5194/egusphere-egu26-11824, 2026.

EGU26-14047 | ECS | Orals | AS3.12

Estimation of Cloud Condensation Nuclei (CCN) from SPEXone on PACE using a neural network retrieval algorithm: Comparison to AERONET and ATLID/EarthCARE 

Neranga Hannadige, Guangliang Fu, Bastiaan van Diedenhoven, Hailing Jia, Zihao Yuan, and Otto Hasekamp

Cloud condensation nuclei (CCN) play a critical role in aerosol–cloud interactions (ACI).  It has been shown that the column number of aerosol particles exceeding a predetermined threshold radius (NCCN) is a suitable CCN proxy. Previously this CCN proxy has been estimated from PARASOL using Level-2 aerosol microphysical and/or optical property retrievals. With the launch of SPEXone on Plankton, Aerosol, Cloud, ocean Ecosystem (PACE) mission, further improvements in NCCN retrievals can be achieved. In particular, retrieved refractive index can enable estimation of the volume fraction of aerosol-water, facilitating the derivation of dry aerosol size distibution and correspondingly dry CCN. In addition, retrieved aerosol layer height (ALH) can be used to estimate the boundary layer (BL) contribution of NCCN (NCCN(BL)).

We developed a deep neural network (NN) algorithm as an extension of  the Remote sensing of Trace gas and Aerosol Products (RemoTAP)-NN framework to directly retrieve dry NCCN, and NCCN(BL) from SPEXone measurements. The algorithm was trained on synthetic SPEXone measurements generated from a three-mode aerosol representation including fine mode, insoluble coarse/dust mode, and soluble coarse mode. Initial validation was performed using  independent synthetic measurements, based on the ECHAM-HAM global aerosol-climate model.

For validating NCCN from real SPEXone observations, we use collocated AERONET data, for which both dry and ambient NCCN are computed. On the log base 10 scale, the NN algorithm achieved RMSDs of 0.33 (dry) and 0.21 (ambient) over land, and 0.21 (dry) and 0.20 (ambient) over ocean. The slightly higher RMSD for dry NCCN is attributed to the cases in which the AERONET derived refractive index reaches its upper limit of 1.6. In comparison, CCN proxies derived using the classical RemoTAP algorithm exhibited RMSDs approximately 20% higher. 

Ongoing work focuses on validating the retrieved fraction of aerosols within the boundary layer using EarthCARE ATLID Level-2 observations.

How to cite: Hannadige, N., Fu, G., van Diedenhoven, B., Jia, H., Yuan, Z., and Hasekamp, O.: Estimation of Cloud Condensation Nuclei (CCN) from SPEXone on PACE using a neural network retrieval algorithm: Comparison to AERONET and ATLID/EarthCARE, EGU General Assembly 2026, Vienna, Austria, 3–8 May 2026, EGU26-14047, https://doi.org/10.5194/egusphere-egu26-14047, 2026.

EGU26-15306 | Orals | AS3.12

The Canadian High altitude Aerosol Water vapour and Cloud (HAWC) Mission 

Doug Degenstein, Adam Bourassa, Kaley Walker, Yi Huang, and Jean-Pierre Blanchet

Tha Canadian High altitude Aerosol Water vapour and Cloud (HAWC) mission is built upon innovative Canadian optical remote sensing technology and will provide important information related to water vapour, aerosols and cloud microphysics in the upper troposphere and lower stratopshere. HAWC is made up of three Canadian passive optical instruments, the Spatial Hetrodyne Observations of Water (SHOW), the Aerosol Limb Imager (ALI) and the Thin Ice Cloud and Far infraRed Emissions (TICFIRE) where the first two look at scattered sunlight in the atmospheric limb from low earth orbit and the latter instrument measures thermal emission in the nadir, also from low earth orbit. This presentation will outline the technology, the measurements and the expected scientific return of the HAWC mission that is expected to launch in the first part of the next decade.

How to cite: Degenstein, D., Bourassa, A., Walker, K., Huang, Y., and Blanchet, J.-P.: The Canadian High altitude Aerosol Water vapour and Cloud (HAWC) Mission, EGU General Assembly 2026, Vienna, Austria, 3–8 May 2026, EGU26-15306, https://doi.org/10.5194/egusphere-egu26-15306, 2026.

EGU26-17952 | ECS | Posters on site | AS3.12

A Deep Learning–Based Automated Cloud Amount Estimation Method Using Sky Imager Images 

MinJi Park, SunJu Park, Dahee Jeong, Chang Ki Kim, and Yun Gon Lee

Cloud amount is a key meteorological variable that directly affects surface solar radiation and precipitation variability. However, cloud amount observations from the Korea Meteorological Administration’s Automated Surface Observing System (ASOS) rely on subjective judgments by human observers and suffer from low temporal resolution. Satellite-based cloud products also face limitations in adequately capturing point-scale cloud variability due to spatial resolution constraints.
To address these limitations, this study developed an automated cloud amount estimation system by integrating a sky imager with deep learning techniques. A dataset was constructed using sky imager images collected from January 2020 to July 2025 and corresponding concurrent ASOS cloud amount observations. A CNN-based classification model and a U-Net–based segmentation model were independently developed. The CNN model estimates cloud amount at the image level, while the U-Net model performs pixel-level cloud segmentation using cloud masks generated by a normalized Red–Blue Ratio (nRBR) algorithm as ground truth data.
Validation results show that the CNN model achieved a correlation coefficient (R) of 0.95 and an RMSE of 1.27 when compared with ASOS observations, while the U-Net model achieved a cloud detection accuracy of approximately 0.97, demonstrating stable reproduction of cloud distributions. The proposed system enables rapid cloud amount estimation from high–temporal-resolution continuous observations and suggests its potential applicability to photovoltaic power forecasting as well as agricultural and meteorological applications.

How to cite: Park, M., Park, S., Jeong, D., Kim, C. K., and Lee, Y. G.: A Deep Learning–Based Automated Cloud Amount Estimation Method Using Sky Imager Images, EGU General Assembly 2026, Vienna, Austria, 3–8 May 2026, EGU26-17952, https://doi.org/10.5194/egusphere-egu26-17952, 2026.

EGU26-17960 | ECS | Posters on site | AS3.12

Adaptation of OCA Algorithm for GK2A/AMI: Sensor-Specific Look-Up Table Regeneration 

Jongwon Yu and Yun Gon Lee

The Optimal Cloud Analysis (OCA) algorithm developed by EUMETSAT retrieves cloud optical thickness (COT), cloud effective radius (CRE), and cloud-top pressure (CTP) at pixel level using optimal estimation techniques with pre-computed Look-Up Tables (LUTs). Current operational CTP products from GK2A tend to underestimate cloud-top height when validated against CALIPSO, with larger errors observed in lower atmospheric layers and ice cloud regions. To address these limitations, we adapt the OCA algorithm for the Advanced Meteorological Imager (AMI) aboard the Korean geostationary satellite GEO-KOMPSAT-2A (GK2A). Since OCA was originally designed for the Spinning Enhanced Visible and Infrared Imager (SEVIRI) aboard Meteosat Second Generation, direct application is limited due to differences in spectral response functions (SRFs) between sensors. In this study, we regenerate sensor-specific LUTs for 11 channels covering visible to thermal infrared wavelengths (VI006, VI008, NR016, SW038, WV063, WV073, IR087, IR096, IR105, IR112, IR133) using the libRadtran radiative transfer model. Radiative transfer calculations employ the DISORT solver with Mie scattering for liquid water clouds and parameterized ice crystal optical properties, covering comprehensive ranges of cloud optical thickness, effective radius, and viewing geometries. A total of eight radiative parameters (Rbd, Rd, Rfd, Tb, Td, Tfbd, Tfd, Em) for both solar and thermal channels are recalculated with GK2A/AMI SRFs. Comparison between original EUMETSAT LUTs and newly generated GK2A LUTs reveals systematic differences across all channels, demonstrating the necessity of sensor-specific LUT adaptation rather than direct algorithm porting. The adapted algorithm will be validated against CALIPSO products over the East Asian region.

Acknowledgements: This work was funded by the Korea Meteorological Administration Research and Development Program under Grant (RS-2025-02221093).


How to cite: Yu, J. and Lee, Y. G.: Adaptation of OCA Algorithm for GK2A/AMI: Sensor-Specific Look-Up Table Regeneration, EGU General Assembly 2026, Vienna, Austria, 3–8 May 2026, EGU26-17960, https://doi.org/10.5194/egusphere-egu26-17960, 2026.

EGU26-18395 | Posters on site | AS3.12

Evaluating of passive cloud-type classification using active-passive EarthCARE measurements 

Anja Hünerbein, Annika Burzik, Sebastian Bley, Nils Madenach, and Gregor Walter

Observations from CloudSat and CALIPSO have demonstrated that the interpretation of cloud radiances derived from passive measurements must be reconsidered in light of vertically resolved profile information. The ESA Cloud, Aerosol and Radiation Explorer (EarthCARE) mission provides a unique opportunity to continue this reinterpretation by combining active and passive measurements from a single satellite platform, enabling a direct linkage between nadir profiling observations and swath-based imagery.

EarthCARE carries an active backscatter lidar (ATLID) and a cloud profiling radar (CPR), which provide high–spatial-resolution vertical profiles of cloud and aerosol properties along the satellite track. These active instruments operate in nadir view, while the passive multispectral imager (MSI) observes a 150 km wide swath with a spatial resolution of 500 m. In combination with the broadband radiometer (BBR), the passive MSI measurements enable the assessment of cloud radiative impacts and cloud feedbacks through their influence on radiative fluxes at the top of the atmosphere. The active radar–lidar synergy provides complementary information on cloud vertical structure, including cloud base altitude and estimates of liquid and ice water content, thereby contributing to the characterization of vertical profiles of cloud changes. To quantify the representation of cloud types from passive observations, the cloud classification framework introduced by the International Satellite Cloud Climatology Project (ISCCP) is applied. Cloud types are characterized using radiometric brightness temperature, interpreted as cloud-top height, and visible reflectance, interpreted as optical thickness, as retrieved from MSI. This cloud type histogram is analysed using vertically resolved cloud information from active measurements. The availability of active profile measurements makes it possible to augment the traditional two-dimensional ISCCP cloud-type histograms with vertically resolved cloud information. This combined perspective allows a more detailed understanding of how specific cloud types and regimes contribute to radiative fluxes at the top of the atmosphere and how changes in cloud vertical structure influence cloud feedbacks.

How to cite: Hünerbein, A., Burzik, A., Bley, S., Madenach, N., and Walter, G.: Evaluating of passive cloud-type classification using active-passive EarthCARE measurements, EGU General Assembly 2026, Vienna, Austria, 3–8 May 2026, EGU26-18395, https://doi.org/10.5194/egusphere-egu26-18395, 2026.

EGU26-18813 | ECS | Posters on site | AS3.12

Development of an Inversion Method based on Convolutional Neural Networks for the retrieval of integrated water vapor above clouds in the context of the C3IEL mission. 

Alexis Zemb, Guillaume Penide, Céline Cornet, Nicolas Thuylie, François Thieuleux, Jérôme Riedi, and Elise Devigne

Despite recent advances, modeling convective clouds remains an important source of uncertainties in climate and weather modeling. Their development is largely dependent on the amount of water vapor available in the atmosphere, which will increase with global warming. It is therefore necessary to better understand the spatial and temporal variability of water vapor in the atmosphere to improve our understanding of the interaction between this gas and clouds. To address this need, the C3IEL (Cluster for Cloud Evolution, Climate and Lightning) mission, a joint effort between CNES and ISA is developed and scheduled for 2028. This mission will use the differential absorption of water vapor in three Short-Wave infrared (SWIR) channels to retrieve the amount of integrated water vapor above and around convective clouds at a high spatial resolution of about 100 m. Recent studies have demonstrated the feasibility of using the optimal estimation method to perform such retrieval, based on the assumption of a plane-parallel cloud. However, despite accurate retrievals with RMSE less than 1kg /m², this method is computationally expensive and does not take into account the spatial context of the scene (pixel wise retrievals). This work presents another method based on convolutional neural networks – a computer vision deep learning architecture – to retrieve integrated water vapor above clouds and in clear sky areas. An attention mechanism and physical constraints are implemented to ensure the physical accuracy of the retrievals. The training of the presented model is based on synthetic C3IEL observations generated using the Meso-NH numerical atmospheric model and the ARTDECO 1D radiative transfer model. The first results are encouraging, with very fast retrievals inferior than 0.9 kg/m² RMSE on synthetic data and a real improvement brought by the attention mechanism and physical constraints. However, available training data are still limited due to computational costs of generating new cloudy scenes and new radiative transfer simulations, and current work aims to provide more diversity in training examples to really demonstrate the ability of the algorithm to generalize to new cases.

How to cite: Zemb, A., Penide, G., Cornet, C., Thuylie, N., Thieuleux, F., Riedi, J., and Devigne, E.: Development of an Inversion Method based on Convolutional Neural Networks for the retrieval of integrated water vapor above clouds in the context of the C3IEL mission., EGU General Assembly 2026, Vienna, Austria, 3–8 May 2026, EGU26-18813, https://doi.org/10.5194/egusphere-egu26-18813, 2026.

EGU26-19138 | Orals | AS3.12

Clouds Decoded: High Resolution Cloud Property Retrievals in Sentinel-2 

Alistair Francis, Barbara Bertozzi, Paul Borne--Pons, Jacqueline Campbell, and Mikolaj Czerkawski

Observational data for cloud processes are captured at a huge range of spatial resolutions, from particle processes resolved in micrometres, to mesoscale systems measured with horizontal sampling distances of kilometres. However, between these resolution ranges, at the scale of tens of metres, few observational constraints exist. Nevertheless, there is an increasing understanding that processes (e.g. phase heterogeneity) are occurring at scales which fall between the observable length-scales of current sensing paradigms, and can drastically alter cloud evolution and their resulting radiative effects.

Motivated by this relative lack of observational data, we have developed and deployed a suite of physical property retrieval tools for Sentinel-2 imagery, a 10 m/pixel multispectral satellite, as part of the Clouds Decoded project (funded by the UK’s Advanced Research and Invention Agency). In this presentation, we will provide a tour of the algorithms and techniques developed---and released open-source---for cloud type classification, cloud height, optical depth, ice/liquid phase, and particle effective radius. These involve a mix of radiative transfer modelling and inversion, computer vision techniques, and machine learning, and are validated against ground-based measurements from ACTRIS sites. In addition to describing the methods themselves, we will also provide an overview of the large, open dataset we have produced, which comes as both individual products and in a regridded, parameterised format, and which will also be made open to the community. We will highlight the potential uses of this data and hope to encourage the community to adopt it as a source of high-resolution information about clouds that can complement and enhance existing data sources and modelling efforts.

How to cite: Francis, A., Bertozzi, B., Borne--Pons, P., Campbell, J., and Czerkawski, M.: Clouds Decoded: High Resolution Cloud Property Retrievals in Sentinel-2, EGU General Assembly 2026, Vienna, Austria, 3–8 May 2026, EGU26-19138, https://doi.org/10.5194/egusphere-egu26-19138, 2026.

EGU26-19383 | Posters on site | AS3.12

Advancing GRASP Aerosol Chemical Component approach using AERONET measurements 

Liudmyla Berdina, Pavel Lytvynov, Milagros E. Herrera, Abhinna K. Behera, Oleg Dubovik, Tatyana Lapyonok, and Victor Tishkovets

Understanding aerosol chemical composition is essential for quantifying aerosol impacts on climate, air quality, and human health, as well as for improving the representation of aerosols in chemical transport and climate models. The chemical composition of aerosols directly determines their optical, microphysical, hygroscopic properties. The aim of this study is to investigate how different assumptions regarding aerosol chemical composition  and size distribution and, employed within  GRASP Chemical Component approach, affect the accuracy and consistency of retrieved aerosol optical properties.

In this approach, aerosols are represented as internal mixtures of predefined chemical species based on Maxwell–Garnett or linear volume mixing rules, instead of retrieving flexible, spectrally varying complex refractive indices. Aerosol size distributions are parameterized using lognormal functions with 5 to 9 bins. The baseline retrieval configuration assumes a Maxwell–Garnett mixture with aerosol components distributed between two modes: a fine mode consisting of Black Carbon, Brown Carbon, and Quartz mixed with water and soluble species, and a coarse mode composed of Iron Oxide and Quartz with water and soluble species, using a five-bin lognormal size distribution. A series of validation experiments was conducted to assess the impact of alternative modeling assumptions, including increasing the number of size bins, incorporating organic matter into the coarse mode, separating Sea Salt and Dust into two distinct coarse modes, and replacing Brown Carbon refractive indices with CAMS values.

GRASP Chemical Component approach were applied to ground-based AERONET observations of direct Sun radiance and sky-scanning diffuse radiation at wavelengths primarily between 440 and 1020 nm for different aerosol types (UV and SWIR channels for several sites), and were validated against standard AERONET products (AE, SSA, refractive index, and size distribution). The results demonstrate good agreement between retrieved AE and AERONET reference products for both dust- and smoke-dominated sites. The assumptions regarding brown carbon refractive indices improve the spectral dependence of SSA, particularly during biomass-burning events. Furthermore, separating sea salt and dust into distinct coarse modes yields a more physically realistic representation of aerosol chemical composition across different AERONET sites. Overall, the proposed configuration changes have the potential to improve the interpretation of aerosol type and enhance the consistency between remote sensing data and chemical composition models of aerosols. For a more qualitative assessment, it is planned to use extensive statistical information with a larger volume of AERONET measurements.

How to cite: Berdina, L., Lytvynov, P., Herrera, M. E., Behera, A. K., Dubovik, O., Lapyonok, T., and Tishkovets, V.: Advancing GRASP Aerosol Chemical Component approach using AERONET measurements, EGU General Assembly 2026, Vienna, Austria, 3–8 May 2026, EGU26-19383, https://doi.org/10.5194/egusphere-egu26-19383, 2026.

EGU26-19437 | ECS | Posters on site | AS3.12

Optimizing GRASP retrieval configurations for space-borne multi-angular polarimetric measurements 

Milagros Herrera, Pavel Litvinov, Abhinna Behera, Liudmyla Berdina, Oleg Dubovik, Christian Matar, and Tatyana Lapyonok

Harmonising aerosol approaches between global atmospheric models and satellite remote sensing retrievals is essential for improving the consistency and reliability of aerosol products. Within the CAMEO framework, this study investigates the impact of aerosol chemical composition and size distribution (SD) parameterisation on satellite aerosol retrievals using POLDER/PARASOL polarimetric observations, with validation against AERONET measurements over the full 2008 year. The baseline retrieval configuration consists of five lognormal size bins and a predefined aerosol chemical composition model (Fine mode: Black Carbon, Brown Carbon, Quartz and soluble species and Coarse mode: Iron Oxide, Quartz and soluble species). While this configuration provides robust performance for aerosol optical depth (AOD) and Ångström exponent, limitations remain in reproducing spectral single scattering albedo (SSA) and detailed SD structure.

To address these issues, a series of sensitivity experiments were conducted. These include harmonising the complex refractive index with CAMS aerosol chemistry, incorporating CAMS organic matter in both fine and coarse modes, increasing SD flexibility through an eight-bin representation, and adjusting inversion constraints under different aerosol loading conditions. Results demonstrate that harmonisation between CAMS and satellite retrieval assumptions improves agreement with AERONET, particularly for SSA, highlighting the mutual advantages of harmonisation.

The analysis shows that increasing SD complexity beyond five bins has only a minor impact on retrieved optical properties from PARASOL. This indicates that the information content of PARASOL measurements does not fully support highly complex SD characterisations, and that retrieval model complexity should be adapted to sensor capabilities. Similarly, including coarse-mode dust produces limited changes in optical retrievals, suggesting a reduced sensitivity of PARASOL to coarse aerosol properties.

These findings highlight that future multi-angle polarimetric sensors, such as 3MI, with extended spectral coverage from the visible to shortwave infrared, are expected to provide stronger sensitivity to coarse particles and improved aerosol characterisation. Overall, this study provides evidence that harmonisation between CAMS and remote sensing approaches strengthens the consistency of aerosol retrievals, while emphasizing the need to balance model complexity with observational information content.

How to cite: Herrera, M., Litvinov, P., Behera, A., Berdina, L., Dubovik, O., Matar, C., and Lapyonok, T.: Optimizing GRASP retrieval configurations for space-borne multi-angular polarimetric measurements, EGU General Assembly 2026, Vienna, Austria, 3–8 May 2026, EGU26-19437, https://doi.org/10.5194/egusphere-egu26-19437, 2026.

EGU26-19785 | ECS | Posters on site | AS3.12

Aerosol-Cloud Interaction over the Mediterranean using Active Remote Sensing 

Iliana Koutsoupi, Eleni Giannakaki, Eleni Marinou, Alessandro Battaglia, Pavlos Kollias, and Vassilis Amiridis

The Mediterranean basin is recognized as a climate change hotspot, characterized by strong variability in clouds and aerosols driven by its special location, the combination of land-sea surfaces and the convergence of air masses of different origin. Aerosol-cloud interactions (ACI) in this region remain poorly investigated, thus they represent a major source of uncertainty in regional climate models. Spaceborne active remote sensing provides the capability to simultaneously observe the vertical structure of clouds and aerosols, enabling the study of their physical properties and interactions.

In this work, observations from CloudSat’s Cloud Profiling Radar (CPR) and the CALIPSO Lidar are used to investigate aerosol-cloud interactions over the Mediterranean. As a first step, an 11-year CloudSat dataset (2007-2017) is analyzed in order to comprehend the climatology of the Mediterranean cloud properties. Characteristics such as cloud occurrence, cloud types, seasonality, thermodynamic phase and cloud-top and cloud-base heights are examined to provide a foundation for subsequent ACI research.

A synergistic analysis of CloudSat and CALIPSO observations for the period 2007-2009 is conducted to investigate aerosol-cloud interactions. Specific filtering criteria are applied to ensure that selected cloud layers are influenced by distinct aerosol types, allowing a meaningful correlation between them. Particular emphasis is placed on mineral dust, a dominant aerosol species in the Mediterranean, frequently transported from lower latitudes and affecting both land and sea regions.

The spatial distributions of aerosols and clouds are analyzed and intercompared to identify coherent patterns that indicate their interaction. Results show a pronounced association between pure dust layers and high-level cloud types, particularly cirrus and altostratus, which present higher frequency of occurrence over land compared to marine regions. These findings suggest a link between dust presence and the formation or modification of ice and mixed-phase clouds in the Mediterranean region.

This work explores the potential to describe aerosol-cloud interactions through mathematical relationships, aiming to contribute toward a more quantitative representation of ACI in regional studies. The results highlight the value of active remote sensing for understanding aerosol-cloud processes in a climatically sensitive region such as the Mediterranean.

How to cite: Koutsoupi, I., Giannakaki, E., Marinou, E., Battaglia, A., Kollias, P., and Amiridis, V.: Aerosol-Cloud Interaction over the Mediterranean using Active Remote Sensing, EGU General Assembly 2026, Vienna, Austria, 3–8 May 2026, EGU26-19785, https://doi.org/10.5194/egusphere-egu26-19785, 2026.

EGU26-20103 | ECS | Posters on site | AS3.12

Advancing RemoTAP: A Deep Learning Framework for Predictive Dynamic Quality Assessment in Multi-Angle Polarimetry 

Piyushkumar Patel, Bastiaan van Diedenhoven, Otto Hasekamp, and Guangliang Fu

The accurate retrieval of aerosol properties from space is a cornerstone of our ability to quantify climate forcing and monitor global air quality. Multi-angle polarimeters (MAPs), such as PARASOL-POLDER and the recently launched PACE-SPEXone and Metop-SG-3MI, offer unprecedented information content, disentangling complex aerosol microphysics from surface scattering. However, the efficacy of retrieval algorithms, such as RemoTAP, is often constrained by post-processing quality controls. Traditional methods rely on static goodness-of-fit thresholds or "one-size-fits-all" post-processing filters (e.g., Χ2 < 5), which enforce a rigid trade-off between data coverage and accuracy. Our recent analysis reveals that such static thresholds often fail to account for systematic biases over complex surfaces, leading to unnecessary data loss or effectively allowing high-error retrievals to silently contaminate climate records. In this work, we present a paradigm shift in quality assessment: a Predictive Dynamic Quality Filter powered by a Physics-Aware Deep Learning Framework. Unlike generic "black-box" approaches, our architecture is designed to explicitly decouple the competing influence of atmospheric state variables from complex surface reflectance signatures. By processing these distinct physical signals alongside a rich set of spectral multi-directional total and polarized reflection signatures of the surface, the model dynamically constructs a pixel-level error profile that adapts to the underlying scene, robustly handling diverse conditions ranging from bright surfaces to the intricate directional reflectance of heterogenous vegetation. This Surface-Aware framework effectively learns to identify the "trustworthiness" of a retrieval based on its physical context, rather than a fixed goodness-of-fit cost. Here we present results applying this framework to POLDER RemoTAP retrievals. To ensure robust generalization and address potential overfitting, we employed a rigorous validation strategy using a comprehensive dataset from 477 global AERONET sites spanning four years (2006-2009). The model was trained on a strategically stratified subset of these observations while its performance was evaluated against a strictly independent, hold-out validations group. Unlike static filtering, our dynamics framework adapts to local conditions, substantially increasing the volume of valid observations data while simultaneously driving a significant reduction in error. By optimizing the selection of high-quality retrievals without discarding valuable data, this method significantly refines the inputs available for climate models. The primary outcome of this framework is the ability to predict pixel-level compliance with Global Climate Observing System (GCOS) standards, offering a metric directly applicable to climate studies. This "Predictive Dynamic Quality Filter" transforms aerosol retrieval quality filtering from a passive estimation task into an active, self-assessing framework. By unlocking the full statistical potential of the RemoTAP algorithm, we provide a robust pathway for generating climate-quality datasets from historical POLDER archives, current instruments as SPEXone and 3MI and future missions like and CO2M, significantly refining our constraints on aerosol-cloud interactions and radiative forcing.

How to cite: Patel, P., Diedenhoven, B. V., Hasekamp, O., and Fu, G.: Advancing RemoTAP: A Deep Learning Framework for Predictive Dynamic Quality Assessment in Multi-Angle Polarimetry, EGU General Assembly 2026, Vienna, Austria, 3–8 May 2026, EGU26-20103, https://doi.org/10.5194/egusphere-egu26-20103, 2026.

EGU26-20255 | ECS | Orals | AS3.12

Investigating the Shipping Effect on Marine Clouds Using Satellite Observations and Vessel Density 

Athina Argyrouli, Pascal Hedelt, Sora Seo, Ronny Lutz, Dmitry Efremenko, Johannes Quaas, Hao Luo, Eleni Marinou, Kalliopi Artemis Voudouri, Maria Tsichla, and Vassilis Amiridis

Shipping activities emit aerosols that can modify the microphysical and optical properties of low-level marine clouds. In the framework of the ESA ACtIon4Cooling (Aerosol Cloud Interactions for Cooling) project, marine clouds influenced by ship-track emissions are investigated as natural analogues to assess the monitoring capabilities of various Solar Radiation Modification (SRM) approaches, including Marine Cloud Brightening (MCB).

In this study, we combine high-resolution satellite observations from SUOMI-NPP/VIIRS (Visible Infrared Imaging Radiometer Suite) and Sentinel-5p/TROPOMI (TROPOspheric Monitoring Instrument) with vessel density data from EMODNET (European Marine Observation and Data Network) to detect cloud anomalies in the shipping corridors and quantify the ship-relevant cloud perturbations. VIIRS-derived cloud variables include cloud top height, cloud top emissivity, effective radius, liquid water path, and optical depth, while TROPOMI provides similar cloud information in the Oxygen A-band. Additional TROPOMI L2 products such as the absorbing aerosol index, aerosol type, and tropospheric NO₂ columns can also provide suitable proxies for ship emissions. The detection of the ship-tracks can be further improved when actual AIS (Automatic Identification System) data are used instead of the monthly aggregated EMODNET vessel density maps.

Cargo and tanker ships dominate the upper range of ship lengths, often between 150 and 300 meters, with some exceeding 400 meters, while passenger ships also include very large vessels over 200 meters, corresponding to cruise liners. Since ship length serves as a proxy for vessel capacity and engine power, larger ships generally consume more fuel and emit greater amounts of aerosol precursors. As a result, cargo, tanker, and passenger ships are more important for atmospheric emissions and ship track formation, even though smaller vessels might be more numerous.

Perturbations of the cloud parameters due to ship emissions are detected using machine learning classifiers with Logistic Regression being the baseline and more advanced models like Random Forest Regressor and Gradient Boosting (XGBoost). To quantify the ship-relevant cloud perturbations, the detected perturbations are fed directly to the Radiative Transfer Model pyDOME, which returns the full radiance field together with TOA (top-of-the atmosphere) forcing, surface irradiance and heating‑rate profiles for every perturbation. In order to synthesize the observations-based results and to explore the large-scale implications of the perturbations in marine low-level clouds, simulations are conducted with the state-of-the-art atmospheric general circulation model ICON (the ICOsahedral Non-hydrostatic model).

How to cite: Argyrouli, A., Hedelt, P., Seo, S., Lutz, R., Efremenko, D., Quaas, J., Luo, H., Marinou, E., Voudouri, K. A., Tsichla, M., and Amiridis, V.: Investigating the Shipping Effect on Marine Clouds Using Satellite Observations and Vessel Density, EGU General Assembly 2026, Vienna, Austria, 3–8 May 2026, EGU26-20255, https://doi.org/10.5194/egusphere-egu26-20255, 2026.

EGU26-20661 | Posters on site | AS3.12

Developments of NRT Level-2 Cloud products in Copernicus Sentinel-3 

Edouard Martins, Julien Chimot, Loredana Spezzi, Alessio Bozzo, Jerome Riedi, Kevin Barbieux, and Bertrand Fougnie

Entrusted by both the European Commission (EC), and Member states, EUMETSAT is on the verge of implementing the comprehensive portfolio of operational Near Real Time (NRT) L2 cloud products for the Copernicus Sentinel-3 mission.

To that end, several preparatory studies were conducted in the last years to assess the scientific feasibility and potential expected quality. These include: i.e., Cloud Top Pressure (CTP) from the OLCI O2 spectral bands, Synergy Cloud Mask and obstruction (from both OLCI & SLSTR). Additionally, besides the already-existing cloud-related algorithms (e.g., the Basic Cloud Mask and Bayesian Cloud Mask in L1 SLSTR, the IdePix algorithm among which for OLCI data, etc.), EUMETSAT has also developed two operational NRT L2-related processors for cloud masking and cloud tracking applications:

  • The SLSTR Naïve Probabilistic Cloud and Aerosol detection algorithm (initiated in 2022), tailored for enhanced cloud and aerosol discrimination, and preserving pixels contaminated by dust / ashes / smoke. It is now running within the S3 NRT AOD processor.
  • The SLSTR Atmospheric Motion Vectors (AMVs), which are mesoscale estimations of the wind (speed, direction and height), obtained by tracking cloud features across sequences of images.

EUMETSAT is now preparing the phase 2 of Sentinel-3 NRT L2 cloud products and application developments. These will be summarised in this presentation, notably:

  • A cloud mask validation framework of the Naïve Probabilistic Cloud and Aerosol detection algorithm, relying on the comparison of S3 LEO products vs. GEO products (e.g., from MTG/FCI) and machine learning techniques to improve tests, thresholds and decision trees, in partnership with the Laboratoire d’Optique Appliqu
  • The extension of the Naïve Probabilistic Cloud and Aerosol detection algorithm to future NRT L2 aerosol processors, such as the S3 NRT Aerosol Layer Height (ALH). Additionally, thanks to the current internal development of a SLSTR/OLCI L1 synergy product, .
  • And the development of operational NRT cloud products suite that could support not only operational meteorological agencies but also the Sentinel-3 AMV processor, in a similar way as done for the operational AMV products on GEO sensors (MSG/SEVIRI and MTG-I/FCI).

How to cite: Martins, E., Chimot, J., Spezzi, L., Bozzo, A., Riedi, J., Barbieux, K., and Fougnie, B.: Developments of NRT Level-2 Cloud products in Copernicus Sentinel-3, EGU General Assembly 2026, Vienna, Austria, 3–8 May 2026, EGU26-20661, https://doi.org/10.5194/egusphere-egu26-20661, 2026.

EGU26-20674 | Orals | AS3.12

Overview of first images of the EPS-SG/3MI Polarimeter Instrument and Level-1 Performances  

Henda Guermazi, Margarita Vazquez-Navarro, Bertrand Fougnie, Maurizio De Bartolomei, Lucas Landier, and Amandine Ouvrard

3MI is a new mission launched in August 2025 on board of the EPS-SG A satellite. The purpose of 3MI is to provide multi-spectral, multi-polarisation, and multi-angular images of the Earth TOA outgoing radiance to characterise the microphysical properties of the atmosphere.

The design consists of two detectors (SWIR and VNIR) and a rotating filter and polariser wheel. The instrument acquires images under 12 spectral bands ranging from 410 nm to 2130 nm. Nine of the bands acquire polarised images at 60°, 0° and -60°. The multi-view is achieved by several successive overlapping acquisitions of the same Earth-Atmosphere target under 14 different angles, thanks to the large FOV of 3MI.

At L1, 3MI provides two different products to users: L1B, which represent the acquisitions as the satellite orbits the Earth; and L1C, which contain, for each point on the surface, the multiple angles under which it is observed.

After a successful SIOV, the instrument is undergoing the commissioning phase. Here we will present the first assessment of the 3MI performance at L1 in both the radiometric and geometric aspects, the lessons learned with respect to the ground calibration and, briefly, the potential for the L2 aerosol and cloud products.


How to cite: Guermazi, H., Vazquez-Navarro, M., Fougnie, B., De Bartolomei, M., Landier, L., and Ouvrard, A.: Overview of first images of the EPS-SG/3MI Polarimeter Instrument and Level-1 Performances , EGU General Assembly 2026, Vienna, Austria, 3–8 May 2026, EGU26-20674, https://doi.org/10.5194/egusphere-egu26-20674, 2026.

EGU26-20899 | Posters on site | AS3.12

Polar Vortex Dynamics and Stratospheric Aerosol Evolution: Observations with a Novel Frequency-Scanning Lidar 

Ronald Eixmann, Gerd Baumgarten, Frederik Ernst, Jan Froh, Josef Höffner, Christian Löns, Thorben H. Lüke-Mense, Alsu Mauer, and Pablo Saavedra Garfias

The dynamics of the polar vortex in the Northern Hemisphere play a crucial role in shaping the composition and distribution of stratospheric aerosols. This study investigates the temporal evolution of the Junge layer within the vortex, emphasizing its interaction with aerosol characteristics. Utilizing a novel frequency-scanning lidar system, high-resolution vertical profiles of stratospheric aerosols (15–30 km) were obtained in February 2023. The ground-based lidar measurements were also validated with satellite data. These observations captured a significant polar stratospheric cloud (PSC) event on February 11, 2023, at Kühlungsborn (54°, 11°) at an altitude of 22 km, providing insight into the relationship between aerosol distribution and vortex stability.

How to cite: Eixmann, R., Baumgarten, G., Ernst, F., Froh, J., Höffner, J., Löns, C., Lüke-Mense, T. H., Mauer, A., and Saavedra Garfias, P.: Polar Vortex Dynamics and Stratospheric Aerosol Evolution: Observations with a Novel Frequency-Scanning Lidar, EGU General Assembly 2026, Vienna, Austria, 3–8 May 2026, EGU26-20899, https://doi.org/10.5194/egusphere-egu26-20899, 2026.

EGU26-20926 | Posters on site | AS3.12

Characterization of Arctic aerosol and optically-thin clouds from the middle troposphere to the lower stratosphere by means of lidar backscatter and depolarization ratio 

Pablo Saavedra Garfias, Anne-Claire Billault-Roux, Josef Höffner, Jan Froh, Frederik Ernst, Gerd Baumgarten, Alsu Mauer, Thorben Lüke-Mense, Rolf Rüfenacht, Michael Strotkamp, and Martin Flügge

Aerosols and high altitude clouds in the Arctic have an important role in the radiative energy budget by influencing the net gain or loss of radiative heat.  Similarly, aerosols are the main nucleation source for the formation of high altitude clouds and responsible to alter cloud properties. Ground-based lidar systems are well-suited for the investigation of aerosol and optically-thin clouds due to their temporal scales and high vertically-resolved information. In remote locations with challenging environments like the Arctic, however,  ground-based lidars are scarce mainly due to their typical high maintenance requirements. To overcome this limitation, a compact mobile Rayleigh-Mie-Resonance lidar has been recently developed as part of the European Lidar Array for Atmospheric Climate Monitoring (EULIAA) project. The EULIAA-IR1 is a Doppler infrared (770 nm wavelength) mobile, compact (1 m3) and highly autonomous lidar. The EULIAA-IR1 lidar senses the atmosphere by three line of sights and is capable to cover the atmosphere from 4 km to at least 50 km.  The lidar’s high resolution Doppler spectra at three field of views has been conceived to allow the retrieval profiles of the wind components, particle (Mie scattering) and molecular (Rayleigh scattering) unattenuated backscatter coefficient, with depolarization capabilities for zenith observations, as well as stratospheric temperature profiles.

The EULIAA-IR1 system has been deployed to the first of a series of field campaigns ranging from high latitudes to the tropics within the framework of the EULIAA project. The high latitude campaign is taken place at the Arctic Lidar Observatory for Middle Atmosphere Research (ALOMAR) located at 69.3° North and 16.0° East on top of the Ranman montain (379 m.a.s.l.) at Andøya, Norway. The EULIAA-IR1 lidar started operation at ALOMAR since end of October 2025, where persistent aerosol layers up to about 20 km and optically thin clouds up to 10 km have been systematically observed. The EULIAA-IR1 observations of aerosols and thin clouds are here presented to assess thresholds of backscatter coefficient and depolarization ratio (δ) to characterize and distinguish aerosols and thin clouds which have been previously reported by other lidar systems. We use the lidar slant observations to extend the characterization of the aerosol layers and their dynamics based on the meridional and zonal wind components obtained by the lidar. Moreover, we show how the EULIAA-IR1’s retrieved vertical wind component provides an insight on the interaction at the cloud mixing layer (top and bottom edges), where the complex interplay between aerosols and clouds takes place.

With this contribution we demonstrate the EULIAA-IR1system data pipeline to provide near-real-time retrieval products to different data dissemination platforms and meteorological agencies for data assimilation purposes, which is one of the goals of the EULIAA project.

How to cite: Saavedra Garfias, P., Billault-Roux, A.-C., Höffner, J., Froh, J., Ernst, F., Baumgarten, G., Mauer, A., Lüke-Mense, T., Rüfenacht, R., Strotkamp, M., and Flügge, M.: Characterization of Arctic aerosol and optically-thin clouds from the middle troposphere to the lower stratosphere by means of lidar backscatter and depolarization ratio, EGU General Assembly 2026, Vienna, Austria, 3–8 May 2026, EGU26-20926, https://doi.org/10.5194/egusphere-egu26-20926, 2026.

EGU26-21193 | Posters on site | AS3.12

Global assessment of cloud geometrical thickness from TROPOMI on Sentinel 5P 

Luca Lelli, Andrew Sayer, Klaus Bramstedt, Marco Vountas, Víctor Molina García, Athina Argyrouli, and Diego Loyola

The retrieval of cloud properties from satellite measurements has wide-ranging applications, including light path correction for atmospheric composition, assessment of Earth's radiation budget, studies of aerosol-cloud interactions, and meteorology. One parameter that has received relatively little attention to date is the height of the cloud base and the derived geometrical thickness. This is largely due to the significant attenuation of light when tropospheric clouds are highly opaque at optical wavelengths. After briefly presenting a solution to the radiative transfer problem in the molecular oxygen absorption band measured by the TROPOMI instrument aboard the Sentinel-5P satellite, this study applies three independent algorithms to the same set of measurements and derives one year of global cloud base altitude, from which the geometrical thickness can be inferred. The validation of the derived cloud parameters, including top and bottom altitude, cloud phase, and optical thickness, sets the stage for the potential creation of a long-term data record for climate research, considering that future missions such as Sentinel-4 on MTG and Sentinel-5 on EPS-SG will provide similar spectral coverage.

How to cite: Lelli, L., Sayer, A., Bramstedt, K., Vountas, M., Molina García, V., Argyrouli, A., and Loyola, D.: Global assessment of cloud geometrical thickness from TROPOMI on Sentinel 5P, EGU General Assembly 2026, Vienna, Austria, 3–8 May 2026, EGU26-21193, https://doi.org/10.5194/egusphere-egu26-21193, 2026.

EGU26-21195 | ECS | Orals | AS3.12

Remote Sensing of Aerosol Water: First Look at a Climatology on Water Uptake 

Jasper Mens, Bastiaan van Diedenhoven, and Otto Hasekamp

Aerosols play an important role in governing the Earth's radiation budget. In addition to scattering and absorbing radiation themselves, they affect the formation and properties of clouds. In both of these processes, and especially in the latter, are affected by the uptake of water. Nevertheless, the particulars of the uptake of water by aerosols remain poorly understood. The efficiency of water uptake (i.e., hygroscopicity) for a given aerosol is highly sensitive to its composition, history, and mixing state, making it a difficult property to model or predict. This leads to stark disagreements between models using different aerosol prescriptions, which greatly contributes to the large uncertainties in the resulting radiative forcing estimates. A better understanding of aerosol water uptake is therefore crucial for accurate warming predictions.

This understanding is currently held back by a lack of data. In most cases, in-situ measurements of aerosol properties are preceded by a drying step that removes any information about water content, so hygroscopicity data is only available for the small subset of studies where it is explicitly targeted. As such the spatial and temporal coverage of these data are very limited. To properly inform and constrain model choices, then, a satellite dataset would be incredibly valuable.

While the aerosol water uptake is a difficult property to measure from space, the rich information content of multi-angle polarimeter (MAP) nstruments such as POLDER-PARASOL and SPEXone-PACE presents new opportunities. We aim to use these instruments to produce a satellite dataset of the aerosol water content, and use it to assemble a first-of-its-kind global climatology on aerosol hygroscopicity. To retrieve a volume water fraction we compare the retrieved real component of the refractive index to an average refractive index for dry material and the known refractive index of pure water, assuming a linear scaling with the volume fraction. Here, refractive indices are retrieved from MAP measurements using the RemoTAP algorithm. The resulting water content measurements can then be used in combination with ambient relative humidity data from reanalysis products to estimate the hygroscopicity.

Recent years have seen efforts to validate these volume water fraction retrievals using both airborne (campaign) and ground-based in-situ measurements, with promising results. We now feel sufficiently confident to begin assembling the data into a global climatology, beginning with the POLDER era. We investigate regional and seasonal trends in the data, and compare them to the corresponding average relative humidities from ERA5 reanalysis to get an indication of hygroscopicity. Initial findings include a clear land/ocean divide, as well as a north-south contrast consistent with pollution patterns. Regions known for biomass burning are additionally investigated for seasonal patterns.

We briefly review the results of the aforementioned validation process, and present a first look at a global climatology on water uptake for the years 2006 through 2009.

How to cite: Mens, J., van Diedenhoven, B., and Hasekamp, O.: Remote Sensing of Aerosol Water: First Look at a Climatology on Water Uptake, EGU General Assembly 2026, Vienna, Austria, 3–8 May 2026, EGU26-21195, https://doi.org/10.5194/egusphere-egu26-21195, 2026.

EGU26-21270 | Orals | AS3.12

Global analysis of vertical motion and cloud properties by using EarthCARE 

Hajime Okamoto, Kaori Sato, Tomoaki Nishizawa, Yoshitaka Jin, Hengheng Zhang, and Allabakash Shaik

Doppler velocity inside clouds is measured from space for the first time by Cloud Profiling Radar (CPR) onboard Earth Clouds, Aerosols and Radiation Explorer (EarthCARE). The EarthCARE JAXA Level 2 cloud products are derived from CPR, 355-nm high-spectral-resolution lidar (ATLID) and Multi-Spectral Imager (MSI). The CPR standalone cloud product (CPR_CLP) and the CPR-ATLID synergy product (AC_CLP) were released to the public in March 2025. Version up of these two products as well as CPR-ATLID-MSI synergy product (ACM_CLP) were released in December 2025. These products include cloud mask, height resolved cloud particle types, cloud particle habits, cloud/precipitation microphysics, terminal velocity of cloud and precipitation particles and vertical air motion.

This paper presents global analysis of cloud microphysics and vertical velocity by using EarthCARE data. We demonstrate how such information is used to enhance our understanding of cloud formation. Comparisons with existing global products were also conducted. The retrieved cloud and vertical motion were also used to evaluate high resolution numerical models.

How to cite: Okamoto, H., Sato, K., Nishizawa, T., Jin, Y., Zhang, H., and Shaik, A.: Global analysis of vertical motion and cloud properties by using EarthCARE, EGU General Assembly 2026, Vienna, Austria, 3–8 May 2026, EGU26-21270, https://doi.org/10.5194/egusphere-egu26-21270, 2026.

EGU26-21346 | Orals | AS3.12

Overview of EarthCARE JAXA Level 2 Cloud-Precipitation Products 

Kaori Sato, Hajime Okamoto, Tomoaki Nishizawa, and Jin Yoshitaka

The Earth Cloud, Aerosol and Radiation Explorer (EarthCARE) is providing dense global observation of vertical air motion and aerosol-cloud-precipitation properties at 100m vertical resolution. This study introduces the Level 2 cloud-precipitaion microphysics products of the Japanese Aerospace Exploration Agency (JAXA). Several versions of the JAXA Level 2 standard cloud-precipitation and air-motion products were released in 2025. Further update of these radar-only (CPR_CLP), radar-lidar (AC_CLP), and radar- lidar-imager synergy (ACM_CLP) products, as well as the release of JAXA L2 precipitation rate products (CPR_RAS, AC_RAS, ACM_RAS ) are planned at the beginning of 2026 for better understanding of the cloud-precipitation processes.

How to cite: Sato, K., Okamoto, H., Nishizawa, T., and Yoshitaka, J.: Overview of EarthCARE JAXA Level 2 Cloud-Precipitation Products, EGU General Assembly 2026, Vienna, Austria, 3–8 May 2026, EGU26-21346, https://doi.org/10.5194/egusphere-egu26-21346, 2026.

EGU26-21882 | Orals | AS3.12

Towards retrieval of vertical cloud profiles from synergistic use of multi-angle, mult-ispectral, multi-polarimetric and multi-resolution observations of the 3MI and MetImage. 

Jérôme Riedi, Souichiro Hioki, Mathieu Compiegne, Laurent Labonnote, Nicolas Henriot, François Thieuleux, Nicolas Ferlay, Amaury Truffier, Guillaume Penide, and Céline Cornet

The Multi-Viewing Multi-Channel Multi-Polarisation Imager (3MI) on the METOP-SG A platform is a 2D wide field of view radiometer dedicated to aerosol and cloud observation for atmospheric composition, air quality, numerical weather prediction and climate monitoring. Leveraging on three missions of its precursor instrument POLDER, the 3MI will provide multi-spectral (from 410 to 2130 nm), multi-polarisation (-60°, 0°, and +60°), and multi-angular (10 to 14 views) observation of the Earth reflectance. Although primarily dedicated to aerosol monitoring, the multiangle and polarisation 3MI observation will provide advanced capabilities for monitoring of cloud properties and water vapour from an operational meteorological mission. In particular, 3MI will allow for detailed observation of cloud parameters that are crucial in understanding the complex interactions between aerosols and clouds, sources of large discrepancies among climate models.

Among other objectives, 3MI will enable better characterisation of cloud microphysics (phase, particle size distribution) and provide access to cloud vertical extent (geometrical thickness), all of which being provided in near-real time by so-called Day-1 algorithm.

In addition of the EUMETSAT official Day-1 clouds product, an optimal-estimation-based algorithm that makes use of the high information content of 3MI observations is being developped to retrieve vertical profile of cloud properties (LWC, extinction coefficient). While the retrieval is performed assuming an idealized but physically based distribution of LWC/IWC and extinction coefficient, the major challenge in this approach remains the computational burden involved by the iterative optimization.

To partly overcome this problem, we take advantage of the higher spatial resolution provided by the MetImage, also aboard METOP-SG A, and propose a synergistic approach based on statistical learning to improve the a priori and initial state vectors used by the optimal-estimation-based algorithm.

We will describe here the status and recent progress made for the development of the research cloud products leveraging the synergy of 3MI and MetImage observation.

How to cite: Riedi, J., Hioki, S., Compiegne, M., Labonnote, L., Henriot, N., Thieuleux, F., Ferlay, N., Truffier, A., Penide, G., and Cornet, C.: Towards retrieval of vertical cloud profiles from synergistic use of multi-angle, mult-ispectral, multi-polarimetric and multi-resolution observations of the 3MI and MetImage., EGU General Assembly 2026, Vienna, Austria, 3–8 May 2026, EGU26-21882, https://doi.org/10.5194/egusphere-egu26-21882, 2026.

EGU26-21973 | Posters on site | AS3.12

Dual-Wavelength Scanning LiDAR for Fire Smoke and Aerosol Monitoring in Industrial Areas 

Kwanchul Kim, Seong-Min Kim, Sung-Jo Kim, Sae-ho Oh, Min-kyung Sung, and Jeong-Min Park

Early identification of fires and reliable monitoring of particulate matter in industrial areas are challenging due to complex emission sources and the limitations of passive optical sensors. We present a dual-wavelength (532/1064 nm) scanning LiDAR system designed for simultaneous fire smoke detection and particulate monitoring in industrial environments. The system operates horizontally at approximately 55 m above ground level, with full azimuthal scanning and kilometer-scale range coverage, enabling near-source observation of aerosol plumes at stack height. Elastic backscatter signals at both wavelengths are used to retrieve aerosol extinction coefficients, from which the Ångström exponent (AE) is derived to characterize particle size. In parallel, polarization-resolved measurements provide the linear depolarization ratio (δ), indicating particle shape and non-sphericity. By jointly analyzing extinction (α), AE, and δ, the system discriminates between fine soot-dominated combustion aerosols, ash-laden near-source smoke, and non-combustion industrial particulates in real time. Field deployment in the Siheung Industrial Complex (Republic of Korea) captured an actual fire event on 22 July 2024. During the early combustion phase, the smoke plume exhibited moderate AE and elevated depolarization, consistent with coarse, irregular ash particles. As the fire stabilized, the aerosol signature transitioned to higher AE and low depolarization, indicating fine soot-dominated smoke. Additional observations revealed clear contrasts between daytime and after-hours particulate regimes, with nighttime conditions showing expanded hotspots associated with higher extinction and coarser particle characteristics. These results demonstrate that horizontally scanning, dual-wavelength polarization LiDAR provides a robust and practical approach for integrated fire detection and particulate monitoring in complex industrial environments, offering enhanced situational awareness for air-quality management and early fire warning.

Acknowledgements

This work was supported by the Ministry of the Interior and Safety (MOIS), Republic of Korea, through the Joint Cooperation R&D Program (Project No. 2023-MOIS-20024324), and by the Advanced Institute of Convergence Technology (AICT), Seoul National University.


How to cite: Kim, K., Kim, S.-M., Kim, S.-J., Oh, S., Sung, M., and Park, J.-M.: Dual-Wavelength Scanning LiDAR for Fire Smoke and Aerosol Monitoring in Industrial Areas, EGU General Assembly 2026, Vienna, Austria, 3–8 May 2026, EGU26-21973, https://doi.org/10.5194/egusphere-egu26-21973, 2026.

EGU26-22012 | Posters on site | AS3.12

Versatile Aerosol and Cloud Obstruction Mask (ACOM) for Diverse Remote Sensing Applications 

Christian Matar, Pavel Litvinov, Cheng Chen, Masahiro Momoi, Juan Gomez, Zhen Liu, Oleg Dubovik, and Philippe Goryl

Clouds and aerosols can obstruct the solar radiation propagating through the atmosphere before it reaches the Earth's surface due to the scattering and absorption processes. The impact of this obstruction on Earth observation is related to the degree of obstruction along the optical path, and the remote sensing application in question. Usually, such obstruction is accounted for by applying cloud and shadow masking for the observed pixels or by performing simultaneous atmosphere/surface retrieval. Estimation of the atmospheric signal (clouds and aerosol obstructions) from the top of atmosphere measurements can be used to identify clouds, cloud shadows or the presence of aerosol in the atmosphere. In ACOM this is done by extracting surface signal from atmospheric one and then separating clouds and aerosol features from each other using multi-dimensional spectral thresholds and spatial variability tests.

The concept applied in ACOM allows a quantitative estimation of the atmospheric obstruction which results in the distinction of different clouds and aerosol classes varying from low to high levels of aerosol and cloud loading in addition to cloud vicinity, cloud shadow and aerosol plumes shadow classes. ACOM shows robust results with ENVISAT/MERIS and Sentinel-3/OLCI and the algorithm can be easily extended to any other optical instruments with spectral channels in the blue and infrared ranges.

How to cite: Matar, C., Litvinov, P., Chen, C., Momoi, M., Gomez, J., Liu, Z., Dubovik, O., and Goryl, P.: Versatile Aerosol and Cloud Obstruction Mask (ACOM) for Diverse Remote Sensing Applications, EGU General Assembly 2026, Vienna, Austria, 3–8 May 2026, EGU26-22012, https://doi.org/10.5194/egusphere-egu26-22012, 2026.

EGU26-65 | ECS | Posters on site | AS3.13

Vertical Profile Corrections Explain Satellite-Inventory Ammonia Discrepancies and Reveal Concentrated Agricultural Sources in China 

Yilin Chen, Qiming Liu, Peng Xu, Huizhong Shen, Zelin Mai, Ruixin Zhang, Peng Guo, Zhiyu Zheng, Tiancheng Luan, and Shu Tao

Persistent discrepancies exist between bottom-up inventories and satellite-based ammonia (NH3) emission estimates, with satellites typically reporting values one-third higher. These discrepancies prevent accurate targeting of NH3 control policies for reducing air pollution and ecosystem nitrogen deposition. Here we demonstrate that systematic biases in satellite vertical profile assumptions substantially explain these long-standing discrepancies. By replacing default vertical profile in satellite retrievals with spatially and temporally resolved atmospheric profiles, we reduced satellite-model discrepancies from 71% to 18%. Our hybrid inversion analysis across China reveals that baseline satellite retrievals overestimated growing season emissions by up to 44% due to systematic overestimation of near-surface NH3 concentrations, while our corrected estimates show close agreement with bottom-up inventories (7.9% difference). Critically, our analysis reveals that China’s NH3 emissions are more spatially concentrated than the a priori inventory indicates, with the top 10% of high-emitting areas contributing 54-56% of national emissions. This concentration reflects agricultural intensification patterns inadequately captured by bottom-up inventories. Independent validation confirms improved accuracy with 1-27% error reductions across all months. These findings provide essential insights for targeted emission control policies in the most concentrated agricultural regions while resolving methodological uncertainties that have long complicated NH3 management strategies.

How to cite: Chen, Y., Liu, Q., Xu, P., Shen, H., Mai, Z., Zhang, R., Guo, P., Zheng, Z., Luan, T., and Tao, S.: Vertical Profile Corrections Explain Satellite-Inventory Ammonia Discrepancies and Reveal Concentrated Agricultural Sources in China, EGU General Assembly 2026, Vienna, Austria, 3–8 May 2026, EGU26-65, https://doi.org/10.5194/egusphere-egu26-65, 2026.

EGU26-310 | ECS | Orals | AS3.13 | Highlight

Reconciling Top-Down and Bottom-Up Ammonia Emission Estimates over Queensland Sugarcane 

Zhonghua Ma, Baobao Pan, Ben Parkes, Alexis Pang, Timothy Foster, and Shu Kee Lam

Quantifying ammonia (NH3) volatilization in intensive agriculture remains challenging due to the high spatiotemporal variability of emissions. A key difficulty is to reconcile field-scale processes with the coarser resolution of satellite retrievals. To address this issue, this study proposes a robust framework to bridge the gap between top-down (TD) satellite constraints and bottom-up (BU) process estimates of NH3 volatilization, and demonstrates its application to Queensland sugarcane belt over seven cropping seasons (2017–2023).

BU estimates were simulated using the NH3 module of DNDC process-based model, driven by Sentinel-2 leaf area index (LAI) to infer fertiliser application timing, ERA5 meteorology data, and local agronomic nitrogen rate guidelines (the ‘Six Easy Steps’ program). TD emissions were derived from IASI v4 NH3 concentrations using an upwind-ring background subtraction method and a steady-state mass-balance operator, with the lifetime diagnosed from regional GEOS-Chem simulations. Initial comparisons revealed significant discrepancies between these two estimates, with the original TD estimates exceeding BU estimates by 3.7 times (mean bias = 36 kg N ha-1).

To reconcile these differences, we developed a bridging model that links TD and BU estimates as a function of meteorological conditions (temperature, ventilation) and fractional cane cover. These predictors act as a multiplicative correction and can effectively capture sub-grid source mixing and meteorological biases inherent in the satellite operators. Robust regression of the TD/BU ratio on these variables provides a statistically valid correction. Applying this adjustment reduced the normalized mean bias from 380% to 27%. The harmonized estimates are consistent with an independent estimate of regional NH₃ emissions of approximately 3.3 kt NH3 yr-1, confirming the dominance of diffuse agricultural sources in the region.

This framework yields more coherent NH3 emission estimates for Queensland sugarcane and could in principle be adapted to other cropping systems where ground measurement data are sparse and satellite constraints are essential.

How to cite: Ma, Z., Pan, B., Parkes, B., Pang, A., Foster, T., and Lam, S. K.: Reconciling Top-Down and Bottom-Up Ammonia Emission Estimates over Queensland Sugarcane, EGU General Assembly 2026, Vienna, Austria, 3–8 May 2026, EGU26-310, https://doi.org/10.5194/egusphere-egu26-310, 2026.

EGU26-426 | ECS | Posters on site | AS3.13

Short- and long-term impacts of the Russian–Ukrainian War on atmospheric pollution from satellite and ground observations 

Maryna Rudas, Mykhailo Savenets, Liudmyla Nadtochii, Liudmyla Malytska, Daria Hrama, Tetiana Kozlenko, Kateryna Komisar, Antonina Umanets, and Natalia Zhemera

The Russian–Ukrainian war has become the most devastating military conflict in Europe since World War II in terms of human losses, infrastructure damage, and environmental consequences. Atmospheric air, being the most dynamic environmental domain, is particularly challenging for tracking war-related impacts, yet it is continuously affected by both acute pollutant emissions and long-term shifts in emission patterns. Using Sentinel-5 Precursor data together with ground-based air-quality observations, we analyzed the first three years (2022–2024) of the Russian–Ukrainian war to assess its influence on atmospheric pollution.

Changes in landscape fires have become one of the main environmental fingerprints of the war. During the baseline period (2019–2021), thousands of fires occurred across the entire territory of Ukraine, mostly associated with seasonal burning of plant residues in agricultural fields. In contrast, the full-scale war period has been characterized by severe wildfires concentrated along the frontline, while the number of fires in the rest of the country has decreased significantly due to stricter legislative restrictions. As a result, biomass-burning emissions have been redistributed – substantially higher than pre-war levels along the frontline, but noticeably lower across the remaining territory.

Fragmented ground-based air-quality monitoring data, as well as the destruction of monitoring sites near the frontline, failed to capture the overwhelming majority of the impacts following thousands of explosions and missile strikes. Nevertheless, 255 cases were identified during the first three years of the full-scale war (2022–2024) in which missile or drone attacks on cities were confirmed by subsequent increases in air pollution at monitoring stations. Detecting short-term air-pollution impacts with remote sensing also remains challenging, mainly due to the time gap between emission events and satellite overpasses. Most short-lived pollution episodes are therefore missed; however, it has become possible to detect air-quality impacts from landscape fires near the frontline and from some missile strikes on industrial facilities.

In contrast to short-term impacts, long-term consequences are becoming more clearly visible. At the regional scale, Sentinel-5 Precursor observations reveal a 10–30% reduction in NO2 over major cities due to the destruction of industrial facilities. Despite increased pollutant emissions from landscape fires along the frontline, the effect of large-scale destruction of cities prevails, resulting in lower NO2 levels than before the war. CO concentrations were 2–4% lower regionally compared with the 2019–2021 baseline, while severe damage in Mariupol led to a long-term CO decrease of about 10% over the city. CH2O and SO2 also showed decreases in several regions, although poor signal-to-noise ratios limit the ability to determine the underlying causes.

Compared with columnar satellite data, ground-based observations show more diverse long-term trends within individual cities. In many urban areas close to the frontline, TSP increased, and SO2 rose due to the use of lower-quality fuels and diesel generators during power outages. In contrast, NO2 and CO predominantly decreased, consistent with the broader regional patterns detected by remote sensing.

How to cite: Rudas, M., Savenets, M., Nadtochii, L., Malytska, L., Hrama, D., Kozlenko, T., Komisar, K., Umanets, A., and Zhemera, N.: Short- and long-term impacts of the Russian–Ukrainian War on atmospheric pollution from satellite and ground observations, EGU General Assembly 2026, Vienna, Austria, 3–8 May 2026, EGU26-426, https://doi.org/10.5194/egusphere-egu26-426, 2026.

EGU26-640 | ECS | Orals | AS3.13

Assesssement of Trace Gases Variability and Satellite Retrieval Accuracy using Pandora Observations in the Central Himalayas 

Mukesh Kumar, Manish Naja, Prajjwal Rawat, Priyanka Srivastava, Hiroshi Tanimoto, and Jim Crawford

For the first time, a Pandora spectrometer has been deployed in the central Himalayan region as part of the Pandora Global Network (PGN), at ARIES, Nainital (29.36°N, 79.36°E; 1970 m a.s.l.), a high-altitude remote site in South Asia where Pandora coverage has been negligible; however, pollutant concentrations across South Asia remain very high. Although the site is elevated, it is located adjacent to the Indo-Gangetic Plains (IGP) and is therefore affected by the transport of pollutants from the IGP.

The instrument retrieves column densities of key trace gases, ozone (O3), nitrogen dioxide (NO2), and formaldehyde (HCHO), including their total column (TO3, TNO2, THCHO) and lower-tropospheric column (LTrNO2, LTrHCHO) amounts, suitable for validation of satellite observations in this complex mountain topology. Analysis of observations from January 2024 to June 2025 shows clear seasonality, with elevated springtime columns (TNO2: 4-5 × 10¹⁵ molecules cm⁻²; LTrNO2: 1 ± 0.1 × 10¹⁵ molecules cm⁻²; LTrHCHO: 0.8 ± 0.1 × 10¹⁶ molecules cm⁻²) and reduced values in the summer–monsoon period (LTrNO2: ~0.3 ± 0.05 × 10¹⁵ molecules cm⁻²; LTrHCHO: ~0.2 × 10¹⁶ molecules cm⁻²). The seasonal cycle of column NO2 agrees with surface in-situ NOy, though their diurnal patterns differ: column NO₂ increasing steadily from morning until the evening period, while surface NOy peaks around midday and column HCHO shows maximum value during daytime (12-13 hours IST), followed by a decline toward evening.

Pandora observations were also used to evaluate the performance of GEMS and TROPOMI satellite products for O3 and NO2 over a complex mountainous environment. For total column ozone, both GEMS and TROPOMI capture the day-to-day variability (R² = 0.98 for both satellites against Pandora). However, GEMS exhibits a systematic underestimation of about 15 ± 5 DU, while TROPOMI shows good agreement during the spring season but overestimates ozone by approximately 10 DU in other seasons. Similarly, both satellites represent the daily variability of TNO2 reasonably well (R² = 0.71 for GEMS and 0.78 for TROPOMI). However, both instruments generally overestimate TNO2. In contrast, the performance for LTrNO2 is considerably poorer, with R² values of only 0.17 (GEMS) and 0.28 (TROPOMI). Thus, showing low sensitivity of satellite retrievals for NO2 in the lower troposphere.  These results highlight the crucial role of high-quality ground-based measurements such as Pandora in validating satellite retrievals and advancing our understanding of trace gas behaviour in complex terrain.

How to cite: Kumar, M., Naja, M., Rawat, P., Srivastava, P., Tanimoto, H., and Crawford, J.: Assesssement of Trace Gases Variability and Satellite Retrieval Accuracy using Pandora Observations in the Central Himalayas, EGU General Assembly 2026, Vienna, Austria, 3–8 May 2026, EGU26-640, https://doi.org/10.5194/egusphere-egu26-640, 2026.

EGU26-946 | ECS | Orals | AS3.13

Chemical Signatures and Sensitivity of Ozone and Particulate Nitrate from Multi-Satellite and Ground Observations over Northern India 

Vikrant Tomar, Manish Naja, Prajjwal Rawat, Kang Sun, Rajesh Kumar, and Upendra Kumar

Ozone and particulate nitrate, a key component of PM2.5, form through non-linear chemical interactions, with ozone formation governed by nitrogen oxides (NOx) and volatile organic compounds (VOCs), and particulate nitrate involving NOx (forming HNO3) and ammonia (NH3). This study utilise a multi-satellite observational approach to understand the formation response of ozone and particulate nitrate to their precursors over Delhi, world’s most polluted capital. We utilize Level-2 satellite data for NO2 and HCHO from TROPOMI (Sentinel-5P) and GEMS and NH3 from IASI (MetOp-B) over the spatial domain of 28°-29°N and 76.5°-77.8°E for 2023. Surface observations of ozone and PM2.5 were obtained from CPCB monitoring stations across Delhi after applying multi-level filtration. High resolution maps (1km × 1km) of NO2, HCHO, and NH3 along with their ratios (HCHO/NO2 and NH3/NO2) were generated, and their time series were extracted around each site locations (<10 km radius) to examine spatio-temporal patterns. Strong spatial and seasonal variability, with NO2 columns peaking at ~0.5 DU in winter and HCHO reaching up to ~0.85 DU in autumn is observed. HCHO/NO2 ratio shows VOC-limited and transitional ozone regimes during winter, which evolve into predominantly NOx-limited regimes during spring, summer-monsoon, and autumn. During spring, ozone concentrations peaks, ranging from 30–75 ppb, reflecting intense photochemical ozone production while time series of NO2 and HCHO columns around 0.2-0.3 DU, and 0.6-0.7 DU respectively. Ozone exceedance days (MDA > 50 ppbv) during spring shows elevated NO2 (~0.1 DU) and HCHO (~0.2 DU) levels, confirming photochemical production. Diurnal variation in NO2 and HCHO from GEMS, highlights seasonal and meteorological influence, with HCHO bias indicating a predominantly VOC limited regime.  The spatial gradient of NO2 (NO2/distance) highlights strong sinks in hotspot regions, particularly in winter and spring. A notable decline of 10-60% in ozone concentrations from spring to winter in these sink areas suggests substantial NOx-driven titration under low sunlight conditions. Site classification into urban, rural, and highway-proximal (within 500 m) categories shows consistently higher NO2 and HCHO levels in urban areas across all seasons, followed by highway sites. For particulate pollution, particulate nitrate, a secondary inorganic aerosol was found to significantly contribute to PM2.5 across seasons. PM2.5 levels peaked in autumn at all sites, followed by winter. Binned HCHO averages were higher in autumn, aligning with PM2.5 peaks and suggesting a biogenic contribution during extreme pollution events. Conversely, elevated NO2 during winter points towards a dominant inorganic and anthropogenic influence on PM2.5 enhancement in form of particulate nitrate.

How to cite: Tomar, V., Naja, M., Rawat, P., Sun, K., Kumar, R., and Kumar, U.: Chemical Signatures and Sensitivity of Ozone and Particulate Nitrate from Multi-Satellite and Ground Observations over Northern India, EGU General Assembly 2026, Vienna, Austria, 3–8 May 2026, EGU26-946, https://doi.org/10.5194/egusphere-egu26-946, 2026.

EGU26-1616 | ECS | Posters on site | AS3.13

Using Google Earth Engine Annual Embeddings to Characterize Urban NO₂: First Results from Ecuador and Germany 

Cesar Alvarez, Michael Wurm, and Philipp Schneider

The AlphaEarth Foundations model, recently released in Google Earth Engine as annual satellite embeddings, provides a new way to work with multi-sensor Earth observation data. Each 10-m pixel is summarized as a 64-dimensional vector that captures the yearly trajectory of surface conditions using information learned from optical, radar, LiDAR, and other datasets, including climatic model outputs and digital terrain data. Rather than representing physical measurements directly, these embeddings condense complex spatial and temporal patterns into compact descriptors that can be used as inputs for machine-learning regression models. This allows researchers to explore environmental patterns—such as air quality—that are influenced by geographical, environmental, and meteorological conditions in cities.
In this study, we evaluate whether these annual embeddings, represented as 64 bands (A00–A63), can describe spatial patterns of urban NO₂ without explicitly supplying additional land-use, meteorological, or emission datasets. We present first results from two contrasting environments: Quito, a high-altitude Andean basin in Ecuador, and Essen, a dense urban–industrial region in western Germany. Models trained only with the embedding bands and ground-based NO₂ observations reproduce meaningful spatial gradients in both cities, suggesting that the embeddings encode attributes relevant to emission intensity, urban structure, and pollutant dispersion.
These early results highlight the potential of foundation-model satellite embeddings as lightweight, scalable predictors for urban air-quality analyses. They also show how these embeddings can be combined with advanced AI-based regression models, offering a new option for studying air pollution patterns in cities where data availability is often limited by the small number of air-quality monitoring stations.

How to cite: Alvarez, C., Wurm, M., and Schneider, P.: Using Google Earth Engine Annual Embeddings to Characterize Urban NO₂: First Results from Ecuador and Germany, EGU General Assembly 2026, Vienna, Austria, 3–8 May 2026, EGU26-1616, https://doi.org/10.5194/egusphere-egu26-1616, 2026.

EGU26-2653 | Orals | AS3.13

Steps towards fast, fine, reliable satellite-based multi-species emission constraint 

Jintai Lin, Hao Kong, Sijie Wang, Wanshan Tan, Mengying Wang, Chenghao Xu, Yuhang Zhang, Yiwen Hu, and Lu Shen and the Atmospheric Chemistry & Modeling (ACM)

Human activities and climate change have profoundly changed emissions of air pollutants and greenhouse gases into the atmosphere. As countries move towards carbon neutrality and clean air, targeted emission control has become more important than ever to ensure rapid, deep and cost-effective emission mitigation. This ambition requires timely, high-resolution and accurate emission tracking, raising an unprecedented challenge to conventional emission inventories based on socioeconomic statistics and observation-based emission constraints that are subject to the resolution and coverage of observation data. In the advent of multi-satellite, multi-instrument, multi-species measurements of atmospheric constituents, together with rapid advancement of big Earth data and artificial intelligence techniques, a new paradigm of observation-based emission inversion becomes possible by strategically combining these sets of knowledge to guide a physics-based model framework in a computationally light manner. In this talk, starting from nitrogen oxides, we will present several scientific and methodological progresses to illustrate the emerging opportunity of this new paradigm for fast, fine, reliable satellite-based multi-species emission constraint, aiming to establish a comprehensive dataset to timely and accurately track air pollutants and greenhouse gases at fine scales.

How to cite: Lin, J., Kong, H., Wang, S., Tan, W., Wang, M., Xu, C., Zhang, Y., Hu, Y., and Shen, L. and the Atmospheric Chemistry & Modeling (ACM): Steps towards fast, fine, reliable satellite-based multi-species emission constraint, EGU General Assembly 2026, Vienna, Austria, 3–8 May 2026, EGU26-2653, https://doi.org/10.5194/egusphere-egu26-2653, 2026.

EGU26-2768 | Orals | AS3.13

Global VOC emissions quantified from inversion of TROPOMI formaldehyde and glyoxal data 

Trissevgeni Stavrakou, Yasmine Sfendla, Jean-François Müller, Glenn-Michael Oomen, Beata Opacka, Isabelle De Smedt, and Thomas Danckaert

Volatile organic compounds (VOCs) are key precursors of tropospheric ozone and secondary organic aerosols, a major component of PM2.5, and several aromatic VOCs are toxic. Glyoxal is a short-lived oxidation product of many VOCs, yet global models consistently underestimate its abundance, indicating a substantial missing source. Here, we derive improved estimates of global biogenic, pyrogenic, and anthropogenic VOC emissions and new constraints on the atmospheric glyoxal budget, based on the first joint inversion of TROPOMI formaldehyde and glyoxal columns using the adjoint of the MAGRITTEv1.2 chemical transport model. The global NMVOC flux is estimated at 1070 Tg for 2021, 19% above bottom-up estimates, partitioned into 749 Tg from vegetation, 102 Tg from biomass burning, and 219 Tg from anthropogenic activity. Emissions of anthropogenic glyoxal precursors are 43% higher globally when constrained by satellite data compared with inventory-based simulations, with large underestimations in India, China, and Africa. The total glyoxal source is estimated at 100 Tg/yr, of which 41% originates from unidentified VOCs, predominantly biogenic and concentrated in the Tropics. Likely contributors include poorly represented formation pathway in isoprene oxidation under low-NOx conditions and an underestimated contribution of monoterpenes. Validation against Pandonia Global Network, in situ, and MAX-DOAS datasets confirms improved agreement of the satellite-constrained model relative to the model based on inventory data alone.

How to cite: Stavrakou, T., Sfendla, Y., Müller, J.-F., Oomen, G.-M., Opacka, B., De Smedt, I., and Danckaert, T.: Global VOC emissions quantified from inversion of TROPOMI formaldehyde and glyoxal data, EGU General Assembly 2026, Vienna, Austria, 3–8 May 2026, EGU26-2768, https://doi.org/10.5194/egusphere-egu26-2768, 2026.

EGU26-2785 | ECS | Posters on site | AS3.13

Assessing lightweight satellite inversion methods for industrial NOx emissions in Spain 

Andres Yarce Botero, Guillaume Monteil, Jeronimo Escribano, Emanuele Emili, Angie S. Albarracin Melo, and Marc Guevara

Accurate monitoring and estimation of pollutant emissions are essential for achieving global emission reduction commitments. High-point-source Nitrogen Oxides (NOx) primarily arise from combustion in power plants, cement facilities, petrochemical complexes, steel mills, and refineries. Traditional satellite-based top-down emission estimates rely on computationally intensive inversions using Chemical Transport Models (CTMs) that assimilate atmospheric composition data. However, recent lightweight inversion approaches provide an alternative that resolves emissions from individual sources with markedly reduced computational demand. In this study, we combine tropospheric NO₂ columns from the TROPOMI instrument on Sentinel-5 Precursor satellite with ERA5 wind fields over Spain with the open-source Python library ddeq v1.0 to estimate NOx emissions in 2021 from twenty large industrial sources at daily resolution. According to the Spain ministry inventory for 2021, recently developed from the HERMESΔ model, these twenty sites represent the strongest NOx industrial emitters in the Spanish peninsular and insular domain. We assess five lightweight point-source inversion techniques: Gaussian Plume (GP), Integrated Mass Enhancement (IME), Cross-Sectional Flux (CSF), Lightweight Cross-Sectional Flux (LCSF) and Flux Divergence (FD). Emission estimates are compared against the HERMESΔ emission model using metrics such as mean fractional bias and relative difference. Additionally, we have incorporated time-varying NOx lifetimes, derived from the CAMS EAC4 reanalysis to improve the accuracy of the emission estimates and, proposed and applied, explicit criteria for detecting scenes where the plumes can provide useful information to the inversions. For sources in the Canary Island, the lightweight inversions reproduce HERMESΔ emissions with smaller relative differences and tighter agreement than for mainland sources, which experience more complex flow and source interference. The results delineate the range of conditions where lightweight inversions deliver robust constraints on industrial NOx emissions in a low-to-moderate emission regime and they outline residual biases that motivate further development of lifetime parametrizations, plume detection criteria and inventory–satellite comparison strategies.

How to cite: Yarce Botero, A., Monteil, G., Escribano, J., Emili, E., Albarracin Melo, A. S., and Guevara, M.: Assessing lightweight satellite inversion methods for industrial NOx emissions in Spain, EGU General Assembly 2026, Vienna, Austria, 3–8 May 2026, EGU26-2785, https://doi.org/10.5194/egusphere-egu26-2785, 2026.

Atmospheric SO2 plays an important role in air quality and climate. Satellite remote sensing enables continuous monitoring of SO2 from volcanic and anthropogenic sources. The Ozone Monitoring Suite (OMS) onboard the Chinese FY-3F satellite, launched in August 2023, is a new hyperspectral UV–VIS instrument designed for atmospheric trace gas observations. Here we present the global retrieval of SO2 columns from FY-3F/OMS nadir measurements using a Differential Optical Absorption Spectroscopy (DOAS) approach. Instrument-specific processing schemes, including solar spectrum selection, spectral soft calibration, and background offset correction, were developed to mitigate along-track striping and across-track asymmetry in the initial retrievals. The FY-3F/OMS SO2 products are evaluated against TROPOMI SO2 retrievals over clean oceanic regions, volcanic plumes, and anthropogenic emission areas. The results demonstrate good stability over clean regions (precision ~0.15 DU) and a clear capability to detect both volcanic and anthropogenic SO2 enhancements. Remaining uncertainties are mainly related to detector non-uniformity and AMF. These results provide a first assessment of the FY-3F/OMS capability for global SO2 monitoring.

How to cite: yan, H.: Retrieval of SO2 columns from FY-3F/OMS instrument observations, EGU General Assembly 2026, Vienna, Austria, 3–8 May 2026, EGU26-2882, https://doi.org/10.5194/egusphere-egu26-2882, 2026.

EGU26-2996 | Posters on site | AS3.13

NOx emissions derived from space 

Steffen Beirle and Thomas Wagner

Satellite measurements provide information of atmospheric column densities of several trace gases, e.g. NO2.
This allows to infer the respective emissions by various approaches. 
Here we focus on two empirical approaches that do not involve chemical models: 
- from the decay patterns downwind from regions of large emissions, like megacities or industrial areas, the NOx lifetime and the respective emissions can be derived simultaneously.
- from the divergence, i.e. the spatial derivative of the horizontal flux, point sources can clearly be identified due to the strong local gradients, 
and their emissions can be quantified.

We discuss the potential and limitations of these methods and present recent improvements. 
In particular, in addition to annual and monthly means, we investigate how far emissions can be derived for individual orbits.
Also potential applications to other species like SO2, CO, or CH4 are discussed.  
The resulting NOx emissions from point sources, megacities, and ship tracks are presented, which were compiled within ESA's World Emission project.

How to cite: Beirle, S. and Wagner, T.: NOx emissions derived from space, EGU General Assembly 2026, Vienna, Austria, 3–8 May 2026, EGU26-2996, https://doi.org/10.5194/egusphere-egu26-2996, 2026.

EGU26-3284 | ECS | Posters on site | AS3.13

Satellite Retrieval of Tropospheric NO2 under Fire Conditions 

Mengying Wang, Jintai Lin, Yuhang Zhang, and Xiaomeng Jin

Tropospheric nitrogen oxides (NOx = NO + NO2) are key atmospheric pollutants with adverse impacts on human health and environmental quality. In the atmosphere, nitric oxide (NO) is rapidly oxidized to nitrogen dioxide (NO2), making satellite observations of NO2 an effective proxy for monitoring tropospheric NOx distributions. Open fires, such as wildfires, emit large amounts of NOx into the atmosphere, and their impacts are becoming increasingly severe under climate change. Satellite-based NO2 observations provide broad spatial coverage and continuous monitoring capabilities for assessing NO2 under fire conditions. However, due to the lack of explicit consideration of fire-related priori information in current satellite NO2 retrieval algorithms, the resulting data products exhibit large uncertainties under fire conditions. Therefore, we use the Peking University OMI NO2 (POMINO) retrieval algorithm to investigate the impact of including fire-related priori information on the retrieval of tropospheric NO2 vertical column densities (VCDs). We conduct sensitivity experiments by including and excluding fire-related priori information in the retrieval of tropospheric NO2 VCDs from TROPOMI observations. These experiments focus on the western United States during September 2020, a period of intense wildfire activity. To provide priori information for these retrievals, we use GEOS-Chem simulations with and without fire emissions, as well as with different fire emission injection heights. In addition, GEOS-CF is employed for a comprehensive comparative analysis. Our results show that including fire-related priori information in the retrieval significantly increases tropospheric NO2 VCDs. Tropospheric NO2 VCDs increase by up to 100% in regions heavily impacted by fires and by about 80% in surrounding areas. Differences in fire emission injection height lead to approximately 30% variations in the retrieved VCDs, indicating a secondary but non-negligible effect. Validation against EPA surface NO2 measurements shows improved agreement when fire-related priori information is included, particularly in fire-affected regions. These results highlight the importance of incorporating fire-related priori information in satellite NO2 retrievals to obtain more accurate NO2 data and to better support air quality assessments under fire conditions.

How to cite: Wang, M., Lin, J., Zhang, Y., and Jin, X.: Satellite Retrieval of Tropospheric NO2 under Fire Conditions, EGU General Assembly 2026, Vienna, Austria, 3–8 May 2026, EGU26-3284, https://doi.org/10.5194/egusphere-egu26-3284, 2026.

Atmospheric nitrogen oxides (NOₓ) are key precursors of nitrate aerosols and tropospheric ozone, and East Asia remains one of the largest contributors to the global NOₓ budget. In this study, we derived and evaluated top-down NOₓ emission estimates over East Asia using two mass-balance-based approaches constrained by TROPOMI tropospheric NO₂ column observations. The first approach follows Han et al. (2020), which explicitly accounts for the lifetime of column-integrated NOₓ and grid-scale inflow and outflow of NOₓ molecules within a refined mass balance framework. The second approach is based on the widely used Finite Difference Mass Balance Approach (FDMA). Three-dimensional air quality simulations were conducted using the CMAQ model for representative periods in July and October 2022 and January and April 2023, with each episode simulated for seven consecutive days. The two independently derived top-down NOₓ emission datasets were implemented in the model and compared against simulations driven by conventional bottom-up inventories. For all seasons, CMAQ simulations using both top-down emissions reproduced the spatial and temporal variability of TROPOMI-observed NO₂ columns more accurately than those using bottom-up emissions alone. Although regional discrepancies were found among South Korea (SK), Central East China (CEC), and the entire modeling domain, the Han et al. (2020)-based method generally exhibited higher agreement and stronger correlations with satellite observations than the FDMA-based approach. The derived top-down emissions showed substantial deviations from bottom-up estimates, with region- and season-dependent increases or decreases. For example, monthly NOₓ emissions over China ranged from approximately 695–808 GgN month⁻¹ in bottom-up inventories, while the Han et al. (2020) and FDMA approaches yielded values up to ~746–859 GgN month⁻¹ and ~820–1041 GgN month⁻¹, respectively. Similar seasonal contrasts were identified over the Korean Peninsula and Japan. Further evaluation of the top-down NOₓ emissions will be conducted using independent surface observations to provide additional constraints on their reliability and applicability for air quality management.

How to cite: Han, K. M.: Comparison of two top-down NOx emission estimates over East Asia using TROPOMI observation, EGU General Assembly 2026, Vienna, Austria, 3–8 May 2026, EGU26-3691, https://doi.org/10.5194/egusphere-egu26-3691, 2026.

EGU26-4415 | Orals | AS3.13

Global atmospheric methanol emissions inferred from satellite IASI measurements and aircraft data 

Jean-François Muller, Jenny Stavrakou, Bruno Franco, Lieven Clarisse, Crist Amelynck, Niels Schoon, Bert Verreyken, Corinne Vigouroux, Emmanuel Mahieu, Maria Makarova, and Kimberly Strong

We employ an updated retrieval of space-based methanol (CH3OH) column measurements from the Infrared Atmospheric Sounding Interferometer (IASI) and an emission optimisation framework built on the adjoint of the MAGRITTE chemical transport model to assess terrestrial emissions of methanol to the atmosphere between 2008 and 2019. We first carry out a IASI CH3OH validation study based on concentration measurements from three airborne campaigns over the U.S. in 2012-2013, using the model and the IASI averaging kernels to compute aircraft-based vertical columns directly comparable to IASI data.IASI is found to underestimate high columns and overestimate low columns in the considered region. A linear regression gives ΩIASI = 0.46 Ωairc + 10.6 · 1015 molec.cm-2 , with ΩIASI and Ωairc the IASI and aircraft-derived vertical columns, respectively. Inverse modelling of terrestrial methanol emissions with the MAGRITTE model based on IASI columns corrected for biases using the above relationship leads to much-improved agreement over most regions against in situ observations from aircraft and surface measurement campaigns as well as column data at eight FTIR stations. The optimized global biogenic methanol emissions (160 Tg yr-1 ) are 22-60% higher than previous top-down estimates, due to (1) column enhancements caused by the IASI bias-correction over source regions and (2) higher dry deposition velocities in the model over land, compared to previous model studies, based on a parametrisation constrained by field data from 13 campaign studies. The inversion results are less reliable over boreal forests due to shortcomings of both the bias-correction and the dry deposition scheme over these regions. The optimisation suggests large changes in the distribution and seasonality of biogenic emissions, such as enhanced emissions during warm and sunny periods over tropical ecosystems. In these regions, radiation and temperature seem to exert a stronger control on biogenic emissions than is currently accounted for in the MEGAN emission model, possibly due to leaf age effects currently not well accounted for in emission models.

How to cite: Muller, J.-F., Stavrakou, J., Franco, B., Clarisse, L., Amelynck, C., Schoon, N., Verreyken, B., Vigouroux, C., Mahieu, E., Makarova, M., and Strong, K.: Global atmospheric methanol emissions inferred from satellite IASI measurements and aircraft data, EGU General Assembly 2026, Vienna, Austria, 3–8 May 2026, EGU26-4415, https://doi.org/10.5194/egusphere-egu26-4415, 2026.

EGU26-4421 | ECS | Orals | AS3.13 | Highlight

Estimating street-scale NO2 surface concentrations from TROPOMI observations and high-resolution geographic data 

Leon Kuhn, Thomas Wagner, and Steffen Beirle

Satellite instruments such as TROPOMI are widely used for comprehensive global monitoring of nitrogen dioxide (NO2). However, existing satellite retrievals only provide column densities (integrated trace gas concentrations) rather than surface concentrations, which limits their direct applicability for human-health studies

Over recent years, numerous machine learning models for the estimation of surface NO2 have been developed. Such models use NO2 vertical column densities (VCDs) from TROPOMI and ancillary input variables, such as meteorological data or bottom-up emission inventories, to predict surface NO2 concentrations learned from in situ measurements. A consistent finding across studied is that land-use data and road networks are particularly helpful predictors, as they are available at street-scale resolutions and strongly linked to local NO2 levels. However, their high spatial resolution introduces a major technical challenge: Representing square-kilometer-scale areas requires thousands of input data points, rendering many otherwise suitable neural network architectures, such as multilayer perceptrons, impractical to train. Consequently, previous approaches have relied on spatial aggregation methods, for example by computing coarse metrics such as road density at resolutions of 100 m × 100 m or coarser.

We develop a new methodology that processes such high-resolution ancillary data as images at street-scale resolution (~ 10 m × 10 m or finer), including road networks and building footprints from OpenStreetMap, detailed land-use information from the OSM Land-Use catalogue, and NOx point sources from the European Release and Transfer Register (E-PRTR). A convolutional neural network is used to encode these high-resolution data into latent features. Combined with the TROPOMI NO2 VCD and other low-resolution inputs, these are then used to estimate surface NO2 concentrations via a multiplayer perceptron.

This approach is expected to

  • improve predictive accuracy compared to models that rely on aggregation
  • enable substantially higher horizontal output resolution down to the street scale
  • provide a general framework for estimating surface concentrations of pollutants other than NO2, as well as full diurnal concentration cycles

How to cite: Kuhn, L., Wagner, T., and Beirle, S.: Estimating street-scale NO2 surface concentrations from TROPOMI observations and high-resolution geographic data, EGU General Assembly 2026, Vienna, Austria, 3–8 May 2026, EGU26-4421, https://doi.org/10.5194/egusphere-egu26-4421, 2026.

EGU26-4529 | ECS | Posters on site | AS3.13

Assessing High-Resolution NO2 Retrievals from EMIT over the Middle East 

Christian Borger, Steffen Beirle, and Thomas Wagner

Nitrogen dioxide (NO2) is a key pollutant in the troposphere that alters atmospheric composition and poses a significant risk to human health. Therefore, continuous monitoring of NO2 is essential for air quality assessment and environmental decision making.

Satellite observations of NO2 have advanced substantially over the past three decades, with major developments from early missions such as GOME to current sensors like TROPOMI. In addition, geostationary missions including GEMS, TEMPO, and Sentinel-4 now provide hourly observations, enabling detailed analyses of temporal variability. While these advances have improved the monitoring of localized emissions and regional pollution patterns, the achievable spatial resolution remains limited to the kilometer scale.

Recently, low spectral resolution hyperspectral imagers with bandwidths of about 5 to 10 nm have emerged, offering contiguous spectral coverage combined with meter-scale spatial sampling. Although primarily designed for surface applications, these instruments have demonstrated potential for trace gas retrievals, including NO2, as shown for the EnMAP mission (e.g., Borger et al., 2025). However, EnMAP's sparse spatial coverage limits its applicability for broader, systematic analyses.

An instrument with similar characteristics to EnMAP is the Earth Surface Mineral Dust Source Investigation (EMIT) mission. Installed aboard the International Space Station, EMIT provides continuous global coverage and repeated observations with a ground pixel size of 60 x 60 m2.

Here, we build on the previous EnMAP study and assess the potential of NO2 retrievals from EMIT. For our investigations, we select the Middle East, where observation conditions are favorable due to high surface albedo and strong emission sources. In particular, we focus on megacities, many of which act as so-called "area sources" and are located in coastal regions. Both cases pose distinct challenges, with current spatial resolution often limiting detailed emission monitoring and source localization.


References:
Borger et al.: High-resolution observations of NO2 and CO2 emission plumes from EnMAP satellite measurements, Environ. Res. Lett., 20, 044034, https://doi.org/10.1088/1748-9326/adc0b1, 2025.

How to cite: Borger, C., Beirle, S., and Wagner, T.: Assessing High-Resolution NO2 Retrievals from EMIT over the Middle East, EGU General Assembly 2026, Vienna, Austria, 3–8 May 2026, EGU26-4529, https://doi.org/10.5194/egusphere-egu26-4529, 2026.

EGU26-5047 | ECS | Posters on site | AS3.13

Ammonia emissions over the Benelux and neighboring regions: seasonal insights from WRF-Chem and IASI 

Antoine Pasternak, Marco Hufnagel, Jean-François Müller, Martin Van Damme, Trissevgeni Stavrakou, and Hugo Denier van der Gon

Ammonia (NH₃) plays a key role in air quality and ecosystem impacts through its contribution to particulate matter formation and nitrogen deposition. We investigate the spatial heterogeneity and seasonality of NH₃ over Western Europe, with a focus on Benelux and neighboring regions, by combining regional chemical transport modeling, high-resolution anthropogenic emission inventories, and in situ and satellite observations.

We use the WRF-Chem model at 15 km horizontal resolution over Western Europe, with a 5 km nested domain over Belgium, to simulate two periods in 2022 representative of high agricultural activity, in spring and in summer. Anthropogenic NH₃ emissions are prescribed using high-resolution (1 km) inventories, including TNO for Europe and VMM for Flanders.

Model results are evaluated against surface measurements and satellite retrievals from the Infrared Atmospheric Sounding Interferometer (IASI), with a focus on the complex chemistry of NH₃ and related species across both seasons. An iterative mass-balance approach is implemented to adjust NH₃ emissions where discrepancies between modeled and observed NH₃ column concentrations are identified. We highlight and discuss the resulting changes in emission magnitude and the spatial distribution of NH₃ hotspots.

How to cite: Pasternak, A., Hufnagel, M., Müller, J.-F., Van Damme, M., Stavrakou, T., and Denier van der Gon, H.: Ammonia emissions over the Benelux and neighboring regions: seasonal insights from WRF-Chem and IASI, EGU General Assembly 2026, Vienna, Austria, 3–8 May 2026, EGU26-5047, https://doi.org/10.5194/egusphere-egu26-5047, 2026.

EGU26-5503 | Posters on site | AS3.13

Representativeness of atmospheric ammonia surface observations in support of satellite data exploitation 

Camille Viatte, Causse Antoine, Lecluse Vincent, Chatain Mélodie, Mathilde Bourlon, Marion Delidais, Angel Luque-Lazaro, Jérôme Le-Paih, Julie Cozic, and Guillaume Salque-Moreton

Atmospheric ammonia (NH₃) is a major precursor of secondary fine particulate matter, significantly affecting air quality and public health. Emissions are predominantly agricultural, making their mitigation critical, particularly in France, one of the Europe’s largest NH₃ emitter. In line with European targets requiring a 13% reduction in NH₃ emissions by 2030 relative to 2005, a directive adopted in December 2024 mandates NH₃ concentration monitoring at rural sites and urban supersites.

Evaluating ammonia emission trends and regulatory compliance is hindered by substantial uncertainties in current emission inventories. While chemistry–transport models and satellite observations offer valuable information on atmospheric NH₃, their reliability depends on validation against robust reference measurements. However, ground-based NH₃ observations in France remain limited and are subject to uncertainties related to measurement artefacts and spatial representativeness.

In this context, the ROSAS project (funded by The French Agency for Ecological Transition ADEME) investigates the representativity of surface NH₃ measurements in support of satellite data analysis. A one-year measurement campaign (June 2024–June 2025) was conducted across three regions of interest—Brittany, Grand Est, and Auvergne–Rhône-Alpes—which together account for approximately 44% of French NH₃ emissions. In each region, seven NH₃ instruments (Radiello passive samplers and Picarro analyzers) were deployed. Spatial differences in NH₃ concentrations are examined in relation to local emission sources and meteorological conditions to characterize ground-based observational footprints. The representativity of surface measurements relative to satellite observations is further evaluated by analyzing correlations between IASI (Infrared Atmospheric Sounding Interferometer) NH₃ total columns and ground-based data under varying spatiotemporal coincidence criteria. The results are expected to inform the deployment of atmospheric ammonia measurements network and to improve the effective use of satellite observations.

How to cite: Viatte, C., Antoine, C., Vincent, L., Mélodie, C., Bourlon, M., Delidais, M., Luque-Lazaro, A., Le-Paih, J., Cozic, J., and Salque-Moreton, G.: Representativeness of atmospheric ammonia surface observations in support of satellite data exploitation, EGU General Assembly 2026, Vienna, Austria, 3–8 May 2026, EGU26-5503, https://doi.org/10.5194/egusphere-egu26-5503, 2026.

EGU26-5560 | ECS | Orals | AS3.13

Understanding NOx emission changes from 2019 to 2021 in the EMME region through variational inversions and satellite data 

Rimal Abeed, Audrey Fortems-Cheiney, Grégoire Broquet, Isabelle Pison, Antoine Berchet, Elise Potier, Alexandre Héraud, Anthony Rey-Pommier, Jean Sciare, and Philippe Ciais

The Eastern Mediterranean and Middle East (EMME) is one of the most vulnerable regions to climate change globally and is becoming one of the world leading emitters of green-house gas (GHG) and air pollutants. Among these, nitrogen oxides NOx (=NO+NO2) are crucial to tropospheric chemistry, due to their role in the formation of tropospheric ozone O3 and Particulate Matter (PM); both of which are harmful to human health and the ecosystem. NOx are primarily emitted from the combustion of fossil fuels, which occurs in several sectors including transportation, energy production, industrial activities, residential heating, and agriculture. In spite of the direct and indirect threats of NOx emissions, Saudi Arabia and the United Arab Emirates (UAE) continue expanding their fossil fuel production, with Saudi Arabia aiming to boost oil capacity to 13 million barrels per day by 2027, undermining its own 2060 net-zero pledge under the Saudi Green Initiative. The EMME region remains under studied regarding anthropogenic emissions, which highlights the need for accurate emission estimates to inform policy decisions.

In this work, we estimate NOx emissions in the EMME region at a horizontal resolution of 0.5°, for the period 2019 to 2021. We employ the Community Inversion Framework (CIF) model, coupled to the CHIMERE chemistry transport model (CTM) and its adjoint, using a variational inversion method to construct NOx emissions. We assimilate nitrogen dioxide (NO2) observations from the TROPOspheric Monitoring Instrument (TROPOMI) on board the Copernicus Sentinel-5 Precursor (S-5P) satellite, and both anthropogenic and biogenic NOx estimates from the Copernicus Atmosphere Monitoring Service (CAMS). Our emission data are close to those provided by other inventories. We examine key emitters in the EMME region, including countries that are affected by economic changes and/or political instabilities; such as Palestine, Israel, Lebanon, Iraq, Iran, Qatar, the UAE, and Saudi Arabia, among others. Our results show that, from 2019 to 2021, NOx emissions exhibit a positive trend in most of the studied regions, except in Tehran (Iran) and Jeddah (Saudi Arabia), where we observe a decrease of NOx emissions by -27% and -12% respectively. In the UAE, however, emissions increased by +17%, and in Yanbu (Saudi Arabia) by +24%, in 2021 compared to 2019. In Lebanon, a rise in NOx emissions can be attributed to the country's economic crisis and shortages in national electricity supply, which led to a rapid increase in privately operated diesel-fueled energy producers. Our NOx emissions data are expected to help policy makers monitor emissions in the EMME, at regional and national scales, to better tackle challenges specific to this region.

How to cite: Abeed, R., Fortems-Cheiney, A., Broquet, G., Pison, I., Berchet, A., Potier, E., Héraud, A., Rey-Pommier, A., Sciare, J., and Ciais, P.: Understanding NOx emission changes from 2019 to 2021 in the EMME region through variational inversions and satellite data, EGU General Assembly 2026, Vienna, Austria, 3–8 May 2026, EGU26-5560, https://doi.org/10.5194/egusphere-egu26-5560, 2026.

EGU26-5664 | ECS | Orals | AS3.13

Satellite based inversion with NOx derived priors uncovers underestimated SO2 emissions over coal-based regions of China 

Lingxiao Lu, Kai Qin, Jason Blake Cohen, Simone Lolli, and Pravash Tiwari

The relocation of coal production has driven the expansion of the coal chemical industry and associated pollutant emissions in northwestern China, a region with sparse ground-based monitoring. Although data assimilation frameworks combining TROPOMI observations and chemical transport models are widely applied to infer NOx and SO2 emissions, their ability to resolve spatiotemporal variability is limited by smoothed priors and parameterized uncertainties, particularly where prior emissions are weak. Divergence-based approaches are computationally efficient but typically assume fixed lifetimes, failing to capture the pronounced variability of SO2 lifetimes under changing atmospheric conditions. In this study, we employ a light weight method based on a model free mass conserving estimates (MCMFE) framework to quantify co-emitted NOx and SO2 emissions from four coal-based regions in northwest China for the period 2019 to 2020. The MCMFE-NOx emission estimates including inclusion of explicit observational uncertainty, have been extensively evaluated and demonstrated to be robust in previous studies. Building upon this foundation, the present study improves the framework by introducing an iterative training strategy (IT-NOx). IT-NOx increases the number of valid grids by approximately 13.5%, corrects about 4.2% of grids with more physically reasonable estimates, and resolves severe underestimation in roughly 0.23% of grids. For SO2, the approach is newly formulated around a five-term equation that integrates TROPOMI SO2 observations with ERA5 wind fields, allowing the derivation of dynamic driving factors of SO2 emissions, including lifetimes, transport distances, and diffusion rates. Rather than relying solely on “bottom-up” inventories to provide the SO2 a priori, pseudo-priors for SO2 used in this study are constructed by multiplying MEIC-derived SO2/NOx ratios with IT-NOx emissions. Compared with directly using inventories as a priori, the daily pseudo-SO2 framework based on IT-NOx better captures realistic spatial variability of key driving factors and reduce the occurrence of extreme diffusion rates. The 20th to 80th percentile ranges of inferred lifetimes span from 5.2 hours to 14.8 hours, revealing seasonal region-specific energy-use patterns. Distinct weekday/weekend contrasts linked to two different emission sectors (transportation with residential activities, and coal plants) are also exhibited. Approximately half of coal-plant-dominated grids show modest lifetime differences, consistent with continuous operations, while transportation and residential dominated grids generally decline during weekends, due to increased private travel and tourism. Compared with the MEIC inventory, 84% of NOx grids and 92% of SO2 grids show higher emissions, with regional means of 0.82 ± 0.02 µg/m2/s and 0.52 ± 0.15 µg/m2/s, respectively. It is hoped that these findings will drive a new approach to SO2 emissions estimation, one in which emissions are based consistently on remotely sensed measurements and associated uncertainties, especially in rapidly developing coal-based regions in northwest China.

How to cite: Lu, L., Qin, K., Cohen, J. B., Lolli, S., and Tiwari, P.: Satellite based inversion with NOx derived priors uncovers underestimated SO2 emissions over coal-based regions of China, EGU General Assembly 2026, Vienna, Austria, 3–8 May 2026, EGU26-5664, https://doi.org/10.5194/egusphere-egu26-5664, 2026.

EGU26-6019 | ECS | Orals | AS3.13

Characterizing uncertainty in TROPOMI NO2 retrievals across Europe with ground-based measurements and high-resolution modeling 

Felipe Cifuentes, Henk Eskes, Ankie Piters, Julian Gomez, John Douros, Gaia Pinardi, Martina Friedrich, Enrico Dammers, Manuel Gebetsberger, and Folkert Boersma

Satellite observations of NO2 play a central role in air quality and climate research; however, their quantitative interpretation is limited by uncertainties arising from retrieval algorithms, instrumental characteristics, and spatial representativeness. Robust interpretation of tropospheric NO2 columns, therefore, depends on a comprehensive assessment of these uncertainty sources. Here, we investigate the primary contributors to uncertainty in TROPOMI NO2 retrievals by examining individual retrieval steps and validating TROPOMI observations against independent Pandora and MAX-DOAS measurements. High-resolution chemical transport model simulations over Europe and the Netherlands are used to support and contextualize the analysis. Systematic biases are found in the stratosphere–troposphere separation of NO2 in TROPOMI retrievals, with wintertime stratospheric columns overestimated by up to 0.15 Pmolec/cm2 at high northern latitudes. These biases propagate into the tropospheric product, producing errors of up to 1.5 Pmolec/cm2, primarily associated with limitations in the TM5-MP assimilation and further enhanced by large air-mass factor ratios under winter conditions. High-resolution LOTOS-EUROS simulations are used to evaluate representation errors associated with sub-pixel horizontal NO2 gradients in satellite–ground-based comparisons, resulting in uncertainty estimates of approximately 6% at polluted sites. Differences in vertical sensitivity between TROPOMI and MAX-DOAS are shown to introduce substantial smoothing errors, reaching up to 20%. Comparisons between TROPOMI and Pandora direct-sun measurements reveal good seasonal agreement. Nonetheless, TROPOMI exhibits a negative bias relative to Pandora direct-sun measurements when using the default TM5-MP a-priori profiles. This bias is partially reduced by adopting higher-resolution CAMS-European a-priori profiles and further reduced when kilometre-scale simulations over the Netherlands are applied. These results highlight the critical importance of the spatial resolution of a-priori information in satellite–ground-based comparisons. Noticeable differences in both magnitude and seasonal variability are observed between MAX-DOAS, Pandora direct-sun, and Pandora sky-scan measurements, highlighting substantial intrinsic uncertainties within ground-based remote sensing products. Finally, uncertainty estimates derived from the distribution of differences between TROPOMI and ground-based observations generally exceed expectations based on the combination of individual uncertainty contributions, suggesting that current uncertainty estimates remain optimistic.

How to cite: Cifuentes, F., Eskes, H., Piters, A., Gomez, J., Douros, J., Pinardi, G., Friedrich, M., Dammers, E., Gebetsberger, M., and Boersma, F.: Characterizing uncertainty in TROPOMI NO2 retrievals across Europe with ground-based measurements and high-resolution modeling, EGU General Assembly 2026, Vienna, Austria, 3–8 May 2026, EGU26-6019, https://doi.org/10.5194/egusphere-egu26-6019, 2026.

EGU26-6251 | ECS | Posters on site | AS3.13

Incorporating a new biogenic flux estimate of carbon monoxide into the TM5 atmospheric chemistry model   

Asta Laasonen, Joram Hooghiem, Anne-Wil van den Berg, Firmin Stroo, Wouter Peters, and Ivan Mammarella

Carbon monoxide (CO) plays an important role in tropospheric chemistry by reacting with hydroxyl radicals (OH) and thereby influencing the atmospheric oxidative capacity. While primary CO sources include fossil fuel combustion, biomass burning, and hydrocarbon oxidation, terrestrial ecosystems can also emit and consume CO through a range of biotic and abiotic processes. Traditionally, atmospheric models assume ecosystems as net CO sinks. However, this assumption is challenged by limited field measurements, outdated dry deposition schemes, and poor quantification of biogenic emissions, leading to uncertainties in the CO budget.  

We present the implementation of a new eddy covariance-based biogenic CO flux estimate in the TM5 atmospheric chemistry model. Two forward model simulations were performed for the period 2015–2020, using a traditional resistance-based dry deposition scheme and a new bottom-up estimate of biogenic CO fluxes derived from eddy covariance measurements. Simulated CO concentrations from both runs are evaluated against NOAA surface observations and TROPOMI satellite observations to assess whether the new biogenic CO flux representation improves TM5 model performance, particularly in capturing spatial and temporal variability and in representing spatial gradients in atmospheric CO.  

Preliminary results indicate an overall change of 195 Tg CO yr⁻¹ in prior global fluxes between the two forward runs. This change results from a reduced soil sink when the traditional dry deposition scheme is not applied, together with increased biogenic surface emissions in the eddy covariance–based prior estimate. The modified prior estimate increases surface CO concentrations over land by 7.0 ppb in the Northern Hemisphere (30°N–90°N) and 8.0 ppb in the tropics (30°S–30°N), while decreasing them by 1.1 ppb in the Southern Hemisphere (30°S–90°S). Further analysis is ongoing to quantify the potential improvement in model performance. 

How to cite: Laasonen, A., Hooghiem, J., van den Berg, A.-W., Stroo, F., Peters, W., and Mammarella, I.: Incorporating a new biogenic flux estimate of carbon monoxide into the TM5 atmospheric chemistry model  , EGU General Assembly 2026, Vienna, Austria, 3–8 May 2026, EGU26-6251, https://doi.org/10.5194/egusphere-egu26-6251, 2026.

EGU26-6367 | ECS | Orals | AS3.13

Observed decadal variations of ammonium sulfate aerosols over northern China using the Infrared Atmospheric Sounding Interferometer (IASI) 

Yingjun Zheng, Zhao-Cheng Zeng, Lieven Clarisse, and Cathy Clerbaux

Ammonium sulfate is a key component of secondary inorganic aerosols in northern China and contributes significantly to PM2.5 pollution. Through hygroscopic growth and enhanced light extinction, it also impacts atmospheric visibility and the regional radiative balance. In recent years, China’s clean air initiatives have significantly reduced surface PM2.5 concentrations. However, a decrease in total PM2.5 or bulk aerosol optical depth (AOD) does not necessarily imply a proportional, synchronised decline in ammonium sulfate. The lack of a long-term, interannually comparable record of ammonium sulfate aerosols hinders our ability to quantitatively understand the long-term changes in ammonium sulphate on a regional scale. Hyperspectral thermal infrared remote sensing offers a unique advantage in identifying the composition of aerosols. Ammonium sulfate exhibits resolvable absorption structures in the thermal infrared atmospheric window region, with a diagnostic spectral feature near 1115 cm⁻¹, which provides a physical basis for retrieving ammonium sulfate AOD.

In this study, we use long-term hyperspectral infrared measurements from the Infrared Atmospheric Sounding Interferometer (IASI) to construct an ammonium sulfate AOD time series for the North China Plain (NCP) from 2008 to 2025, and to characterise its spatial distribution, interannual variability and multi-year trends. Our focus is on the summer months, as ammonium sulfate over the NCP typically exhibits higher and more spatially continuous regional enhancement during this period. Additionally, infrared observations are sensitive to thermal conditions, and summer daytime provides more favourable conditions for achieving stable, interannually comparable results.

We use an optimal-estimation–based retrieval algorithm to retrieve ammonium sulfate AOD for clear sky observations. The state vector also includes interfering trace gases and surface temperature. The results show a significant decreasing trend in ammonium sulfate AOD over NCP during 2008–2025, with distinct spatial patterns and pronounced interannual variability. Furthermore, the retrieval results are compared with CAMS simulation products and long-term ground-based records of sulfate and  chemical composition. Overall, this work provides a satellite-based constraint on the long-term evolution of secondary inorganic aerosols over NCP. This offers new evidence with which to evaluate the effectiveness of mitigation measures and advance our mechanistic understanding of air pollution.

How to cite: Zheng, Y., Zeng, Z.-C., Clarisse, L., and Clerbaux, C.: Observed decadal variations of ammonium sulfate aerosols over northern China using the Infrared Atmospheric Sounding Interferometer (IASI), EGU General Assembly 2026, Vienna, Austria, 3–8 May 2026, EGU26-6367, https://doi.org/10.5194/egusphere-egu26-6367, 2026.

EGU26-6426 | Posters on site | AS3.13

Temporal variability of NH3 in European hot spots based on satellite and in-situ observations 

Karol Przeździecki, Dipson Bhandari, Ainur Nagmarova, Jacek Kamiński, Aleksandra Satrzomska, and Joanna Strużewska

Ammonia (NH₃) is primarily emitted from agricultural sources, including livestock farming and fertilizer application. Animal farms are significant contributors to ammonia emissions, particularly under low rainfall, as rainfall typically leads to nitrogen leaching and ammonia removal from the soil. In addition to agricultural activities, combustion-related NH₃ emissions, primarily from fossil fuel burning and biomass combustion, also contribute to atmospheric ammonia; however, these sources remain poorly understood. Ammonia emissions mainly arise from the volatilization of NH₃ from NH₄⁺-containing substrates, such as fertilized soils, animal waste, and nitrogen-polluted water, as well as from combustion-related processes, including coal combustion, vehicle exhaust, and biomass burning.

Ammonia significantly impacts air quality as a precursor to fine particulate matter (PM2.5), which has considerable health implications. A study by Vieno et al. (2016) (https://acp.copernicus.org/articles/23/15253/2023/)  demonstrated that reducing NH₃ emissions in the United Kingdom could lower PM2.5 levels. Despite this recognized impact, NH₃ monitoring networks are inconsistently implemented across Europe, with only a few countries, such as the Netherlands, the UK, and Belgium, maintaining dedicated NH₃ monitoring systems. Projections indicate that NH₃ emissions are likely to increase due to rising global temperatures and the growing demand for animal products, emphasizing the need for accurate, traceable, and routine NH₃ monitoring to better understand the complexities of ammonia in the atmosphere.

This study aims to identify NH₃ hot-spot regions in Europe based on satellite data from METOP IASI for 2019 to 2022 and compare these findings while accounting for surface variability and reported emission sources. Furthermore, we explore NH₃ CAMS profile analysis and NH₃ observations from the EBAS database of atmospheric measurements.

How to cite: Przeździecki, K., Bhandari, D., Nagmarova, A., Kamiński, J., Satrzomska, A., and Strużewska, J.: Temporal variability of NH3 in European hot spots based on satellite and in-situ observations, EGU General Assembly 2026, Vienna, Austria, 3–8 May 2026, EGU26-6426, https://doi.org/10.5194/egusphere-egu26-6426, 2026.

EGU26-6451 | Posters on site | AS3.13

Improved detection of global NO₂ signals from shipping using TROPOMI observations: advanced filtering and comparison with CAMS 

Miriam Latsch, Andreas Richter, John P. Burrows, and Hartmut Bösch

Shipping is an important source of atmospheric NOx worldwide, negatively affecting marine environments and human health. For decades, some of the busiest shipping lanes have been tracked by satellites from space. With TROPOMI aboard the Sentinel 5-Precursor (S5P), the potential for detecting ship emissions has increased due to its low noise and high spatial resolution of 5.5 x 3.5 km2. Previous studies have demonstrated that even individual ship plumes can be identified from TROPOMI data.

In this study, we use TROPOMI tropospheric NO2 slant columns (tSCDs) to qualitatively identify global shipping routes. Advanced preprocessing techniques, including iterative high-pass and Fourier filtering, markedly improve the detection of shipping lanes, revealing many previously undetectable routes. The impact of high-pass filter box sizes is analyzed, demonstrating that smaller sizes enhance the visibility of narrow shipping features, whereas larger box sizes increase overall NO2 signals. In addition, various flagging criteria are investigated that affect the distribution of the NO2 signal, highlighting the critical importance of careful selection for accurate emission monitoring. The filtered TROPOMI NO2 tSCDs over oceans show a strong correlation with shipping activities, as confirmed by comparison with the CAMS-GLOB-SHIP inventory, and reveal unknown shipping routes. TROPOMI also effectively captures NO2 signals from offshore oil and gas platforms. In the next step, filtered TROPOMI tropospheric NO2 vertical columns are compared with those from the CAMS global model. While both datasets show consistent NO2 enhancements along major shipping lanes, the CAMS NO2 values are systematically higher than the TROPOMI measurements.

This study demonstrates the potential of advanced filtering techniques applied to TROPOMI observations to detect as many global NO signals from shipping as possible. It contributes to the ongoing progress of satellite remote sensing of ship emissions.

How to cite: Latsch, M., Richter, A., Burrows, J. P., and Bösch, H.: Improved detection of global NO₂ signals from shipping using TROPOMI observations: advanced filtering and comparison with CAMS, EGU General Assembly 2026, Vienna, Austria, 3–8 May 2026, EGU26-6451, https://doi.org/10.5194/egusphere-egu26-6451, 2026.

Super-resolution (SR) is the reconstruction of a higher resolution (HR) image from one or more low resolution (LR) images. In remote sensing, SR is particularly useful because it lets us enhance spatial detail beyond what is provided by satellite sensors originally. Satellite-based air quality monitoring plays a crucial role in evaluating and managing human-induced emissions. Sentinel-5P has provides data related to atmospheric pollutant measurements with a spatial resolution of 3.5x5.5km2. It is one of the best available spatial resolution however it is limited in detecting fine-scale sources of NOx emissions, particularly in densely populated urban regions and maritime corridors. This study highlights the relatively underexplored class of super-resolution frameworks that employ deep learning techniques to enhance the spatial resolution of Sentinel-5P radiance data. The deep learning based method developed specifically for enhancing the spatial resolution of Sentinel-5P radiance data are outperforming in super-resolution of Sentinel-5P NO2 data. The state of the art approaches integrated a physical degradation model based on the point spread function (PSF) using an anisotropic Gaussian kernel and a modified lightweight U-net to reconstruct high resolution outputs. With this setting, the models were able to achieve the best performance according to the evaluation metrices. Such a deep learning super-resolution techniques offer an advantage for further detailed analysis of Sentinel-5P data by enhancing its spatial resolution. The effectiveness of the super-resolution depends heavily on accurately modeling the sensor-specific degradation process and it needs fine-tuning for robutness. Deep neural networks requires substantial computational resources for training and inference, which limits their deployment in real-time or resource constrained environments. Although the model accounts for sensor degradation, it still faces challenges when dealing with unforeseen real-world artifacts such as atmospheric interference, measurement noise, and other distortions not captured by the model. A significant limitation found was lack of higher resolution benchmark in the current state of research in this field. Large scale super-resolved dataset would be useful for local analysis such emissions from ships. These findings highlight the need for broader participation from the research community to validate, extend, and independently assess the proposed methods. Future experiments will include comparisons against advance GANs and other transformer-based models, and cross-validation with CAMS reanalysis data and ground-based stations.

How to cite: Jamal, S. A. and Batista, T.: Methodological Trends and Challenges in Deep Learning based Super-Resolution for Sentinel-5P Data, EGU General Assembly 2026, Vienna, Austria, 3–8 May 2026, EGU26-7372, https://doi.org/10.5194/egusphere-egu26-7372, 2026.

EGU26-7474 | ECS | Posters on site | AS3.13

Assessing the Impact of Air Mass Factor on Satellite-Based Surface NO2 Concentration Estimates over India 

Ardra Divakaran and Sajeev Philip

Satellite retrievals of nitrogen dioxide (NO2) vertical column density (VCD) are widely used to estimate human exposure to ambient NO2 and related health impacts. The satellite retrieval of NO2 VCD involves calculating the Air Mass Factor (AMF) to convert slant column densities into VCD. The AMF calculation requires a priori assumption of the vertical distribution of the species, which can be provided from a global or regional chemical transport model (CTM). The vertical profile of NO2 simulated using a CTM can then be used to derive surface NO2 concentrations. Previous studies have identified ​​AMF calculation as a significant source of uncertainty in NO2 VCD retrievals, suggesting that AMF recalculation using high-resolution CTM simulations can improve both satellite-derived VCDs and surface NO2 estimates. In this study, we assess the impact of AMF on satellite-based column and surface NO2 estimation over a particular country, India. This region is significant, as satellite-based surface NO2 concentration estimates over India are typically underestimated compared to regional in situ observations. Here, we use the TROPOspheric Monitoring Instrument (TROPOMI) retrievals and the GEOS-Chem global and nested regional CTM simulations to explore the impact of AMF on NO2 VCD and surface data. We perform multiple model experiments using prior NO2 vertical profiles derived from different spatial resolution CTM simulations (2° × 2.5°, 0.25° × 0.3125°, and 0.125° × 0.15625° latitude × longitude) and by varying the meteorological and emissions inputs in the model. The recalculated AMFs, using different NO2 vertical profiles from various model experiments, are then applied to generate VCD and surface NO2 estimates and validated against available in situ measurements across India. Our preliminary results indicate that modified surface NO2 concentration estimates generally show better agreement with in situ observations compared to those estimated using the standard TROPOMI VCD product. This study highlights the importance of regional-scale AMF recalculation in enhancing the accuracy of TROPOMI-derived NO2 retrievals and providing a reliable representation of surface NO2 over India.

How to cite: Divakaran, A. and Philip, S.: Assessing the Impact of Air Mass Factor on Satellite-Based Surface NO2 Concentration Estimates over India, EGU General Assembly 2026, Vienna, Austria, 3–8 May 2026, EGU26-7474, https://doi.org/10.5194/egusphere-egu26-7474, 2026.

EGU26-7549 | ECS | Posters on site | AS3.13

Investigation of European atmospheric ammonia using modelling and satellite data 

Matthew Alexander, Wuhu Feng, Richard Pope, and Martyn Chipperfield

Air pollution contributes to an estimated 8.34 million premature deaths annually, primarily due to exposure to fine particulate matter (PM) and ground-level ozone. PM consists of solid and liquid aerosols suspended in the air, with PM₂.₅ (particles less than 2.5 microns in diameter) being especially harmful due to its ability to enter the lungs and bloodstream.

Ammonia (NH₃), primarily from livestock emissions, significantly impacts air quality by contributing to the formation of secondary inorganic aerosols (SIAs), including ammonium nitrate and ammonium sulfate (key components of PM₂.₅). NH₃ has a short atmospheric lifetime (~15 hours) and can react rapidly with gases like nitric and sulfuric acid.

Historically, sulfur dioxide (SO₂) emissions led to the formation of ammonium sulfate, but a sharp decline in SO₂ levels since 1990 (mainly due to reduced use of coal and oil) has shifted the chemical balance toward increased ammonium nitrate formation, driven by the relative abundance of nitrogen oxides (NOₓ).

The short lifetime and consequent large spatiotemporal variability of NH₃ provides challenges in validating emission inventories with solely ground-based observations due to the sparsely distributed measurement network. Satellites help overcome this limitation by providing consistent observations with extensive spatial and temporal coverage.

This project uses observations from IASI (Infrared Atmospheric Sounding Interferometer) and CrIS (Cross-track Infrared Sounder) to assess total column NH₃ concentrations over the UK and Europe. Observations are interpreted using the TOMCAT global chemical transport model and its nested grid version, ZOOMCAT, to evaluate the spatial and temporal variability of NH₃ and its contribution to PM₂.₅.

We aim to constrain bottom-up NH₃ inventories, such as the National Atmospheric Emissions Inventory (NAEI), using top-down satellite-derived estimates, assessing long-term trends and emission sources. Initial comparisons between TOMCAT and retrievals from IASI and CrIS are presented.

How to cite: Alexander, M., Feng, W., Pope, R., and Chipperfield, M.: Investigation of European atmospheric ammonia using modelling and satellite data, EGU General Assembly 2026, Vienna, Austria, 3–8 May 2026, EGU26-7549, https://doi.org/10.5194/egusphere-egu26-7549, 2026.

EGU26-7690 | ECS | Posters on site | AS3.13

Validation of the IUP Bremen TROPOMI tropospheric VC NO2 product and comparison to the operational TROPOMI product  

Thomas Visarius, Andreas Richter, Heinrich Bovensmann, and Hartmut Bösch

As part of the German integrated greenhouse gas monitoring project (ITMS), an improved TROPOMI NO2 product has been created, called the IUP Bremen TROPOMI product. TROPOMI NO2 slant column data and recalculated air mass factor (AMF) are used to derive tropospheric NO2 vertical columns over Europe. The recalculated AMF uses temporally and spatially higher resolved a priori NO2 profiles, obtained from the regional CAMS ensemble, and surface reflectances from the moderate-resolution Imaging Spectroradiometer (MODIS) database, using the bi-directional reflectance distribution function (BRDF) data. In this study, the newly calculated tropospheric NO2 vertical columns are compared to the operational TROPOMI product and to retrievals using other a priori profiles and surface reflectance data. In a next step, a validation of the IUP Bremen TROPOMI data product using MAX-DOAS data from the FRM4DOAS project is conducted. The validation shows improved statistics, finding a slope of 0.90, which is a 50% increase compared to the operational product and a reduced scatter of the data. In a last step, the influence of the near-real-time cloud data compared to the reprocessed cloud data on the retrieval is investigated. 


Acknowledgements:

We acknowledge the use of FRM4DOAS MAX-DOAS data produced at BIRA using data from instruments operated by the BIRA, KNMI, University of Bremen, University of Heidelberg, University of Thessaloniki, MPIC and CNR.

How to cite: Visarius, T., Richter, A., Bovensmann, H., and Bösch, H.: Validation of the IUP Bremen TROPOMI tropospheric VC NO2 product and comparison to the operational TROPOMI product , EGU General Assembly 2026, Vienna, Austria, 3–8 May 2026, EGU26-7690, https://doi.org/10.5194/egusphere-egu26-7690, 2026.

EGU26-8371 | Orals | AS3.13

TEMPO Science and Applications 

Shobha Kondragunta

The first ever Geostationary Earth Orbit satellite air quality instrument over the Western Hemisphere,
Tropospheric Emissions: Monitoring of Pollution (TEMPO), has been scanning North America since August
2023 and providing the scientific community with hourly air quality observations. Algorithm science developed
for similar heritage instruments in Low Earth Orbit over the last two decades helped in the rapid development
and validation of key TEMPO products, such as nitrogen dioxide, formaldehyde, aerosol layer height, total
ozone, etc. Analyzing and demonstrating enhanced capabilities offered by TEMPO hourly observations rests
with the scientific community and the newly formed TEMPO science team. NOAA has been conducting scientific
work with TEMPO air quality products combined with NOAA operational GOES-19 Advanced Baseline Imager
air quality products to demonstrate their value for hazards monitoring and forecasting. This presentation will
showcase how NOAA is developing capabilities to verify emissions inventories in urban areas using TEMPO
nitrogen dioxide diurnal profiles, analyzing geography dependent pollutant exposure, and assessing how
pollution exposures at different times of day impact human health. NOAA’s goal is to use TEMPO data
operationally and help state and local agencies adapt to a new way of using satellite air quality data in their dayto-
day decision making processes.

How to cite: Kondragunta, S.: TEMPO Science and Applications, EGU General Assembly 2026, Vienna, Austria, 3–8 May 2026, EGU26-8371, https://doi.org/10.5194/egusphere-egu26-8371, 2026.

EGU26-9530 | ECS | Orals | AS3.13

Enhanced SO2 plume height retrievals from TROPOMI band 2 using a look-up-table COBRA approach over the full 2018–2025 timeframe 

Lorenzo Fabris, Nicolas Theys, Lieven Clarisse, Bruno Franco, Jonas Vlietinck, Huan Yu, Hugues Brenot, Thomas Danckaert, and Michel Van Roozendael

Knowledge of the sulfur dioxide (SO2) layer height (LH) is crucial to improve our understanding of volcanic events, and their atmospheric and climatic impacts. It is also essential to better constrain SO2 emissions and ensure aviation safety. While SO2 vertical column density (VCD) retrievals from UV nadir satellite observations are well established for decades, accurate determination of the SO2 LH remains a major challenge. Existing spectral fitting algorithms are either time-consuming or lack precision and sensitivity, particularly for low SO2 amounts in the upper troposphere–lower stratosphere.

Here, we present a new Level-2 product of SO2 LH and VCD derived from the second UV spectral band (BD2) of the TROPOspheric Monitoring Instrument (TROPOMI) onboard the Sentinel-5 Precursor platform. The BD2 covers shorter UV wavelengths than the commonly used third UV band (BD3), providing stronger SO2 absorption features that enhance the sensitivity of the retrievals, despite higher noise levels. These retrievals were performed using the Look-Up Table Covariance-Based Retrieval Algorithm (LUT-COBRA, [1]), which has been further developed and optimized for computational efficiency [2]. This algorithm was applied to the complete TROPOMI BD2 dataset spanning 2018–2025.

We analyzed both global and regional SO2 variability, including specific volcanic events and degassing case studies. Compared to BD3, our approach demonstrates an improved sensitivity, precision, and accuracy, outperforming the current operational TROPOMI SO2 product. In addition, validation with IASI thermal infrared measurements shows a relatively good agreement, confirming the reliability of the results. Our BD2 SO2 product provides an unprecedented opportunity to monitor volcanic SO2 emissions and their impacts over the past eight years.


[1] Theys et al., Atmospheric Measurement Techniques, 15(16):4801–4817, 2022.
[2] Fabris et al., Atmospheric Measurement Techniques, 2025. doi: 10.5194/egusphere-2025-4026.

How to cite: Fabris, L., Theys, N., Clarisse, L., Franco, B., Vlietinck, J., Yu, H., Brenot, H., Danckaert, T., and Van Roozendael, M.: Enhanced SO2 plume height retrievals from TROPOMI band 2 using a look-up-table COBRA approach over the full 2018–2025 timeframe, EGU General Assembly 2026, Vienna, Austria, 3–8 May 2026, EGU26-9530, https://doi.org/10.5194/egusphere-egu26-9530, 2026.

EGU26-9700 | ECS | Posters on site | AS3.13

Analyzing sector resolved sulfur dioxide emission source strengths and evaluation of TROPOMI identified point sources using the chemistry-climate model MECO(n) in the Middle East 

Niclas Maier, Eric Förster, Halima Al Hinaai, Heidi Huntrieser, Falk Pätzold, Lutz Bretschneider, Astrid Lampert, Anna Götz, Anna Lanteri, Mariano Mertens, Anke Roiger, and Anja Schmidt

Sulfur dioxide (SO2) is a toxic air pollutant with far-reaching consequences for the environment and climate. Stricter regulations and technical developments reduced anthropogenic SO2 emissions in parts of the world such as Europe. However, emission inventories show a stagnation and disagreement in emission strengths in the Middle East in recent years. Additionally, many point sources in this region are attributed to the production of oil and gas, which now exceeds the SO2 emissions from the shipping sector after the introduction of the IMO2020 regulation in 2020.

In this study, we use data from the TROPOMI instrument on the Sentinel-5P satellite and the chemistry-climate model MECO(n) to localize strong SO2 point sources and to investigate the influence of different SO2 emission sectors like the shipping, oil and gas as well as the energy sector to the SO2 burden in this region. MECO(n) consists of the global chemistry-climate model EMAC (ECHAM5/MESSy) which is coupled online to one (or more) high-resolved COSMO (COSMO-CLM/MESSy) instances. EMAC is run with a horizontal resolution of ~120 km and 90 verticals levels reaching the mesosphere, while COSMO has a resolution of 25 km above the Middle East. The simulation period of 2017 to 2023 includes the introduction of IMO2020 and the COVID lockdown in 2020.    

First, a meteorological evaluation is performed against reanalysis data such as ERA5 and in situ observations from a helicopter-borne campaign conducted by us in the southern Arabian Peninsula in 2023. In addition, TROPOMI data from the years 2018 to 2023 are analyzed for seasonal changes in the SO2 point source magnitudes in the Middle East and compared to the simulated SO2 column densities from MECO(n) using the provided averaging kernels from TROPOMI. Additionally, a chemical evaluation is performed against available ground-based and in situ measurement data in this region. It was found that TROPOMI-identified SO2 point sources exhibit a huge seasonal variability notably in the Arabian Gulf, which has to be investigated and understood in more detail in the future. Furthermore, first results from our model simulations indicate that MECO(n) reflects the meteorological conditions reasonably well in the Middle East.

How to cite: Maier, N., Förster, E., Al Hinaai, H., Huntrieser, H., Pätzold, F., Bretschneider, L., Lampert, A., Götz, A., Lanteri, A., Mertens, M., Roiger, A., and Schmidt, A.: Analyzing sector resolved sulfur dioxide emission source strengths and evaluation of TROPOMI identified point sources using the chemistry-climate model MECO(n) in the Middle East, EGU General Assembly 2026, Vienna, Austria, 3–8 May 2026, EGU26-9700, https://doi.org/10.5194/egusphere-egu26-9700, 2026.

EGU26-9711 | Orals | AS3.13

Routine estimate of global 10-day mean maps of the anthropogenic NOx, SO2 and NH3 emissions over land since 2019 based on satellite observations  

Fangzhou Li, Pramod Kumar, Grégoire Broquet, Didier Hauglustaine, Maureen Beaudor, Lieven Clarisse, Martin Van Damme, Pierre Coheur, Anne Cozic, Bo Zheng, Hui Li, Jiayu Xu, Nicolas Theys, Beatriz Revilla Romero, Antony Delavois, and Philippe Ciais

Ammonia (NH3), nitrogen oxides (NOx) and sulfur dioxide (SO2) are key precursors of secondary inorganic aerosols and strongly influence air quality, nitrogen deposition and ecosystem health. Yet bottom-up emission inventories and the temporal profiles for these species remain highly uncertain and often inconsistent across regions and sectors. Here we present a global dataset of anthropogenic NOx, SO2 and NH3 emissions over land, providing estimates of the daily 10-day mean emission fields since 2019 at 1.27° × 2.5° resolution. Emissions are derived from an atmospheric transport and chemistry inverse modelling system based on the global chemistry transport model LMDZ-INCA and a finite-difference mass-balance (FDMB) inversion approach. We account for satellite retrieval operators by consistently applying averaging kernels to the modeled NO2, SO2 and NH3 fields prior to model–observation comparison and emissions inversion. For NOx and SO2, we assimilate tropospheric NO2 columns from TROPOMI, with OMI-based NOx inversions used for consistency checks. For NH3, we use IASI total columns. The TROPOMI- and OMI-based NOx inversions show similar large-scale spatial patterns but differ regionally in magnitude, and generally indicate higher NOx emissions than bottom-up inventories over major source regions such as China and India. The TROPOMI-based SO2 inversions suggest lower anthropogenic SO2 emissions than bottom-up inventories at the global scale and across most major source regions, with global totals remaining relatively stable over 2019–2023. For NH3, the IASI-based inversion reveals persistent hotspots over South and East Asia—especially India and China—where inferred emissions exceed estimates from inventories, with pronounced seasonal peaks in high-emitting regions. Our dataset provides retrieval-consistent, time-resolved constraints on major aerosol precursors and implies systematic discrepancies between bottom-up inventories and satellite-constrained emissions over major source regions. The presentation details the methodological choices ensuring the routine estimates of such global maps of emissions, the relevance of their relatively high resolution, and investigations for a joint inversion of the three species to strengthen the consistency of the overall dataset.

How to cite: Li, F., Kumar, P., Broquet, G., Hauglustaine, D., Beaudor, M., Clarisse, L., Van Damme, M., Coheur, P., Cozic, A., Zheng, B., Li, H., Xu, J., Theys, N., Romero, B. R., Delavois, A., and Ciais, P.: Routine estimate of global 10-day mean maps of the anthropogenic NOx, SO2 and NH3 emissions over land since 2019 based on satellite observations , EGU General Assembly 2026, Vienna, Austria, 3–8 May 2026, EGU26-9711, https://doi.org/10.5194/egusphere-egu26-9711, 2026.

EGU26-9929 | Orals | AS3.13

A Review on Chinese Fengyun Meteorological Satellites in Atmosphere Composition Monitoring 

Ling Gao, Qianqian Zhang, Yapeng Wang, Qian Wang, Lu Zhang, Yanmeng Bi, and Xingying Zhang

Air pollution and climate change are two major global challenges that threaten sustainable development, and the tracking and mapping of atmospheric pollutants and greenhouse gases help to keep these two problems in check. Benefiting from its wide spatial-temporal coverage, satellite remote sensing is indispensable in the earth observation systems to provide measurements of atmospheric chemical species for decades.

Since 2008, when the Chinese second-generation polar-orbiting meteorological satellite Fengyun-3A(FY-3A) was launched, China has developed the capability to acquire the global atmospheric chemical components data from the space on daily basis. The three instruments aboard the FY-3A/3B/3C satellites, the Medium Resolution Spectral Imager (MERSI), Total Ozone Unit (TOU) and Solar Backscatter Ultraviolet Sounder (SBUS), enable the retrieval of aerosol optical depth (AOD), ozone total column and ozone vertical profile. Together with the subsequently launched FY-3D, FY-3F and FY-3H, they have established a global atmospheric composition dataset over fifteen years. The Hyperspectral Infrared Atmospheric Sounder (HIRAS) carried by FY-3D, FY-3E, FY-3F, FY-3H has been successfully used to retrieve the vertical profile of ozone and other trace gases during both day and night. Meanwhile, the Greenhouse-gases Absorption Spectrometer (GAS) onboard FY-3D and FY-3H realizes global carbon dioxide (CO2) monitoring. The Nadir-viewing and Limb-viewing Ozone Monitoring Suite (OMS-N and OMS-L) aboard FY-3F detect stratospheric and tropospheric trace gases with higher quality. The Advanced Geostationary Radiation Imager (AGRI), embarked on the new generation geostationary satellites FY-4A, FY-4B and FY-4C, realizes the continuous measurement of aerosols since 2016. In addition, the Geostationary Interferometric Infrared Sounder (GIIRS), as the world’s first thermal infrared hyperspectral detector in geostationary orbit, is used to monitor trace gases with high temporal and spatial resolution, such as ozone, CO,NH3, and HCOOH.

How to cite: Gao, L., Zhang, Q., Wang, Y., Wang, Q., Zhang, L., Bi, Y., and Zhang, X.: A Review on Chinese Fengyun Meteorological Satellites in Atmosphere Composition Monitoring, EGU General Assembly 2026, Vienna, Austria, 3–8 May 2026, EGU26-9929, https://doi.org/10.5194/egusphere-egu26-9929, 2026.

EGU26-10014 | Posters on site | AS3.13

 Emission and deposition products from Agricultural Atmospheric Emissions (AGATE)  

Jieying Ding, Ronald van der A, Lefteris Ioannidis, Mengyao Liu, Michiel van Weele, Felix Deutsch, Hans Hooyberghs, Ahmed Alreweny, Lisa Blyth, and Antony Delavois

Regions with intensive agriculture, e.g. India, Belgium, Netherlands, and the Po-Valley, often suffer from air pollution and acidification/nitrification of the soil. In addition, these regions are often responsible for the release of methane emissions. Methane (CH4), the second most important greenhouse gas (GHG) after carbon dioxide (CO2), is emitted from cattle farms, rice paddies and the use of manure. Excessive anthropogenic emissions of nitrogen compounds to the environment have a major effect on the biogeochemical nitrogen cycle. Agricultural activities produce noteworthy ammonia (NH3) and nitrogen oxides (NOx) emissions. NH3 is mainly emitted from stables and via the spreading of manure and use of fertilizers. NOx emissions mainly stem from fossil fuel combustion, while soil emissions are dominant in remote areas. The role of soil NOx emissions on air quality is usually underestimated. Current methods for estimating emissions of those gases are based on the collection of activity data with associated emission factors having large uncertainties.

The AGATE project of ESA aims to provide and improve agricultural emissions of CH4, NH3, and NOx independently by using satellite observations, i.e. without relying on the reported information or a-priori information.  Satellite-derived emission estimates are calculated for targeted agricultural regions in Europe and South(east) Asia. The derived emissions are downscaled and validated to provide high-resolution emissions for specific subsectors (crops and livestock) and agricultural hotspots. In addtion, nitrogen deposition modelling is conducted to assess the impact of nitrogen deposition on natural areas within the European regions under study.

How to cite: Ding, J., van der A, R., Ioannidis, L., Liu, M., van Weele, M., Deutsch, F., Hooyberghs, H., Alreweny, A., Blyth, L., and Delavois, A.:  Emission and deposition products from Agricultural Atmospheric Emissions (AGATE) , EGU General Assembly 2026, Vienna, Austria, 3–8 May 2026, EGU26-10014, https://doi.org/10.5194/egusphere-egu26-10014, 2026.

In recent years, a constellation of hyperspectral infrared sounders has been successfully launched into LEO and GEO orbits on board China’s FengYun meteorological satellites. The Geostationary Interferometric Infrared Sounder (GIIRS) on board the FengYun-4 (FY-4) satellites scans the East Asian region every two hours. The Hyperspectral Infrared Atmospheric Sounder (HIRAS) on board the FengYun-3 (FY-3) series of satellites forms a constellation in dawn-dusk, mid-morning and afternoon sun-synchronous orbits. This provides six global thermal infrared observations per day, with equatorial overpass times of 5:30 am/pm (FY-3E), 10:00 am/pm (FY-3F) and 2:00 am/pm (FY-3H) respectively.

In the first half of this presentation, we will introduce the ozone products (total columns and profiles) from GIIRS which are retrieved from the 9.6 μm absorption band via optimal estimation algorithm. These retrievals have been rigorously validated against ground-based measurements, multi-satellite retrievals, and reanalysis datasets. Importantly, GIIRS exhibits peak vertical sensitivity in the upper troposphere/lower stratosphere (UTLS) region, providing unique capabilities for investigating stratosphere-troposphere transport (STT). In theory, FY-4B/GIIRS's 2-hourly ozone data can provide detailed information about ozone changes during STT events, enabling STT's impact on tropospheric ozone to be measured more accurately.

In the second half of this presentation, we will introduce the ammonia (NH3) retrieval data products from FY-3E, the world's first operational meteorological satellite in a dawn-dusk orbit for civil use. FY-3E provides global observations twice daily, at around 05:30 and 17:30 local solar time. Using the optimal estimation method, we have retrieved daily global NH₃ maps from January 2023 to the present. Our retrievals reveal significantly elevated total columns of NH₃ during dawn and dusk in several major source regions. These regions exhibit spatial patterns and seasonal variability that are similar to those observed by IASI and CrIS. Notably, higher total columns are retrieved at dusk over some important source regions compared with mid-morning and afternoon observations, potentially due to more intense emissions and diurnal temperature variations. Combining these observations with data from mid-morning (e.g. IASI) and afternoon (e.g. CrIS) satellites will significantly enhance our understanding of the nitrogen cycle.

How to cite: Zeng, Z.-C.: Atmospheric composition observed from a constellation of LEO and GEO hyperspectral infrared sounders onboard FengYun satellites, EGU General Assembly 2026, Vienna, Austria, 3–8 May 2026, EGU26-10065, https://doi.org/10.5194/egusphere-egu26-10065, 2026.

EGU26-10642 | Orals | AS3.13

TROPOMI-Derived NOx Emissions from Sea Shipping: Estimates Along Major Lanes and for Individual Vessels 

Mouhamadou Makhtar Ndiaga Diouf, Hugo Vignesoult, Audrey Fortems-Cheiney, Frédéric Chevallier, Alexandre Héraud, Steffen Beirle, Jukka-Pekka Jalkanen, Androniki Maragkidou, Filipe Girbal Brandão, Rossana Gini, Dhritiraj Sengupta, João Vitorino, Antony Delavois, and Grégoire Broquet

Maritime transport is a pillar of the global economy, accounting for 75% of the European Union (EU) external trade, for example. It also has considerable environmental impacts. In terms of atmospheric pollution, shipping was responsible for about 39% of transport-related nitrogen oxide (NOx) emissions in the EU in 2022. 

The ESA-funded Earth Observation for Ship Emission Monitoring project (EO4SEM) aims to provide shipping greenhouse gas and atmospheric pollutant emissions estimates that can support EU emission regulations. Specifically, it explores the potential of satellite-based Earth Observation to complement the bottom-up inventories that are driven by the automatic ship-tracking system called Automatic Identification System (AIS). Within this project, we have been developing atmospheric inverse modeling methods to derive estimates of NOx emissions from sea shipping by processing Sentinel-5P/TROPOMI NO2 images over European seas for the period 2019–2023. Different scales have been targeted and are discussed in this presentation. First, a sophisticated Bayesian atmospheric 3D chemistry and transport inverse modelling approach allows us to derive emission budgets for large sea areas. Second, lighter data-driven techniques derive emissions along individual shipping lanes on the one hand and instant estimates for individual large ships on the other hand. The AIS-driven bottom-up estimation model STEAM from the Finnish Meteorological Institute is used to support the analysis and then as a reference for the evaluation of the results.

Monthly NOx emission maps at 0.5° resolution and corresponding budgets were derived over large sea regions defined by adapted International Hydrographic Organization (IHO) boundaries, using an inverse modeling approach based on the assimilation of TROPOMI NO2 observations into the CIF-CHIMERE model.

The derivation of emission estimates along shipping lanes relies on the “divergence method”. This method is applied to individual TROPOMI images at the instrumental ground pixel scale. It derives corresponding NOx emission maps. Accounting for the temporally-varying spatial coverage and noise of the quality-filtered retrievals from TROPOMI, we aggregate the results as monthly-mean NOx lineic emissions (in kg/km/month). First comparisons between monthly-mean TROPOMI-based and STEAM lineic emissions estimates show a strong consistency for isolated, high-traffic lanes. However, the quantification remains challenging in complex areas characterized by high lane-intersection density.

Our estimates of instant emissions from individual large vessels are based on two types of approaches. Both involve the detection and inversion of the NOx enhancement plumes downwind the moving vessels. The plume-detection algorithm is cross-referenced with the AIS information from STEAM to ensure that the high-concentration patterns identified in the TROPOMI images correspond to large ships, and to infer the trajectory of the latter. We use traditional point-source data-driven quantification methods: the cross-sectional flux and local divergence methods, that we adapted to account for the motion of the ship. The resulting estimates are confronted to the STEAM continuous estimates for individual ships, showing good consistency on average, but high uncertainty for the individual TROPOMI-based results.

How to cite: Diouf, M. M. N., Vignesoult, H., Fortems-Cheiney, A., Chevallier, F., Héraud, A., Beirle, S., Jalkanen, J.-P., Maragkidou, A., Brandão, F. G., Gini, R., Sengupta, D., Vitorino, J., Delavois, A., and Broquet, G.: TROPOMI-Derived NOx Emissions from Sea Shipping: Estimates Along Major Lanes and for Individual Vessels, EGU General Assembly 2026, Vienna, Austria, 3–8 May 2026, EGU26-10642, https://doi.org/10.5194/egusphere-egu26-10642, 2026.

The cloud-slicing retrieval technique has yielded new datasets of atmospheric composition in the free troposphere from satellite observations. The retrieval involves isolating clusters of satellite pixels above optically thick clouds from single overpasses or scans before regressing total column densities against corresponding cloud top heights to obtain a regression slope that is then converted to a single mixing ratio value representative of the average concentration of a target compound within the range of cloud top heights sampled. Recent datasets obtained with cloud-slicing include vertically-resolved concentrations of NO2 and O3 for multiple free tropospheric layers from TROPOMI and single-layer free tropospheric concentrations of NO2 from TEMPO. Cloud-slicing for both NO2 and O3 suffers substantial data loss, as many clusters with non-uniform overlying stratosphere need to be discarded, due to the contribution of stratospheric variability to the regression slope. Cloud-slicing is yet to be tested on compounds sufficiently abundant in the free troposphere and without contamination from the stratosphere, namely formaldehyde (HCHO) and carbon monoxide (CO). Here, GEOS-Chem is used to generate pseudo-observations of HCHO and CO over target domains with distinct characteristics. Specifically, the remote troposphere (Pacific Ocean), and regions influenced by biomass burning (southern Africa) and anthropogenic pollution (South Asia). Cloud-slicing is applied to these pseudo-observations to tailor the retrieval steps to yield cloud-sliced mixing ratios that are consistent with the “true” mixing ratios as simulated by the model. According to preliminary data so far obtained for southern Africa in June-August, the peak of the burning season, lack of stratospheric contribution and greater data retention from cloud-slicing HCHO and CO total columns reduces noise in the cloud-sliced data, resulting in seasonal means that are more consistent with the "truth" than was possible with NO2 and O3. Cloud-sliced seasonal mean mixing ratios of HCHO and CO are typically within 5-10% of the “true” simulated mixing ratios and also achieve spatial consistency (R > 0.7). Though, cloud-sliced mixing ratios do underestimate large enhancements in HCHO and CO over the most intense biomass burning gridboxes. Work is underway to determine the cause for the bias over large sources, apply cloud-slicing to the other domains, explore the added value of free tropospheric HCHO and CO for understanding the oxidative capacity of the atmosphere, and quantify error contributions, including the representation error induced by sampling very cloudy scenes. Following this cloud-slicing characterisation, the algorithm developed with synthetic experiments will be applied to TROPOMI HCHO and CO data products to further extend the utility of Earth observations.

How to cite: Marais, E.: Using GEOS-Chem to design a cloud-slicing retrieval algorithm for application to TROPOMI formaldehyde and carbon monoxide, EGU General Assembly 2026, Vienna, Austria, 3–8 May 2026, EGU26-10717, https://doi.org/10.5194/egusphere-egu26-10717, 2026.

EGU26-11068 | Posters on site | AS3.13

Near-Real Time NOx emissions derived from observations of Sentinel missions 

Ronald van der A, Jieying Ding, Robert van Versendaal, Henk Eskes, Benjamin Leune, Lefteris Ioannidis, Michiel van Weele, Antony Delavois, and Daniele Gasbarra

In the ESA project of DECSO-NRT-Europe, an operational system has been set up to derive daily NOx emissions in near-real time (NRT) for Europe based on observations of Sentinel 5P based on the offline inversion algorithm DECSO v6.5. This system has been developed to an NRT version for emissions on a spatial resolution of 0.1 x 0.1 degree (about 10x10 km). 

 The inversion algorithm DECSO has been developed at KNMI for the purpose of deriving emissions for short-lived gases. It is using a Kalman Filter implementation for assimilating satellite column observations, optimising the emissions. DECSO is built on top of the regional chemistry-transport model (CTM) CHIMERE, which converts the analysed emissions into 3D concentration fields. The emission forecast model is based on persistency, predicting that the emissions remain constant since the previous analysis. This has the important advantage that the derived NOx emissions do not depend on a-priori (bottom-up) information on the expected locations and source strengths. Only a single CTM forward run is needed which makes the system computationally efficient.  

In the operational system of DECSO-NRT, each day the European NOX emissions are automatically derived and visualized, while on the third of each month the monthly emissions are calculated for the previous month and available on the data portal of DECSO-NRT. An archive of NOx emissions is available from the year 2019 till last month, consisting of NOx emissions for the anthropogenic, agricultural soil and forest soil emission sectors. 

When Sentinel 4 observations of NO2 become available, the service will be extended with hourly NRT NOx emissions during daytime. 


How to cite: van der A, R., Ding, J., van Versendaal, R., Eskes, H., Leune, B., Ioannidis, L., van Weele, M., Delavois, A., and Gasbarra, D.: Near-Real Time NOx emissions derived from observations of Sentinel missions, EGU General Assembly 2026, Vienna, Austria, 3–8 May 2026, EGU26-11068, https://doi.org/10.5194/egusphere-egu26-11068, 2026.

EGU26-11178 | Orals | AS3.13

Synergistic Use of CO2 and NO2 for Emission Characterization: A Study Using TANGO Mission Simulations and ENMAP Data 

Tobias Borsdorff, Maarten Krol, Pepijn Veefkind, and Jochen Landgraf

The Twin Anthropogenic Greenhouse Gas Observers (TANGO) mission is an ESA Scout initiative scheduled for launch in 2028, designed to monitor anthropogenic and natural greenhouse gas emissions from point sources at high spatial resolution. The mission consists of two 16U CubeSat platforms flying in tandem with a temporal separation of less than one minute, each carrying a pushbroom imaging spectrometer.  The first satellite is dedicated to the measurement of atmospheric CO2 and CH4 in the 1.6 μm spectral region, while the second satellite is optimized for the detection of NO2 in the visible spectral range. Both instruments provide observations over a 30 × 30 km2 swath with a ground spatial sampling of 300 × 300 m2. TANGO is designed to survey more than 10,000 emission sources per year with a nominal revisit time of four days, focusing on emissions from sources with annual fluxes ≥ 2.5 Mt CO2 and ≥ 5 kt CH4.

In this study, we investigate the synergistic exploitation of collocated CO2 and NO2 observations to achieve an improved characterization of atmospheric emissions. The primary objective is to quantify the source emission ratio CO2/NO2 and to derive diagnostic parameters that elucidate an effective reaction rate associated with the transformation NO + O3 → NO2 + O2. The tandem configuration of TANGO facilitates quasi-simultaneous measurements of both trace gases, thereby minimizing temporal variability in ambient atmospheric conditions between individual observations.

We evaluate the proposed methodology using dedicated microHH large-eddy simulations that incorporate realistic operational scenarios, including variable source strengths, temporal offsets between the two satellite overpasses, and heterogeneous spatial discretizations for CO2 and NO2. These simulations enable a quantitative assessment of the feasibility and accuracy of retrieving emission ratios and chemical parameters under conditions representative of actual measurement configurations. Subsequently, we validate the approach by applying it to ENMAP (Environmental Mapping and Analysis Program) satellite observations, thereby demonstrating its practical suitability for prospective TANGO measurements. The results underscore the potential of synergistically exploiting multispecies trace gas measurements to enhance emission quantification and to advance the characterization of atmospheric chemical processes.

The TANGO mission is a small satellite mission to be launched in 2028, under the ESA Scout Programme tapping into NewSpace to quickly deliver affordable and innovative science, as part of ESA’s FutureEO Programme, within a budget of 35M€ and a schedule of three years from mission kick-off to launch.

How to cite: Borsdorff, T., Krol, M., Veefkind, P., and Landgraf, J.: Synergistic Use of CO2 and NO2 for Emission Characterization: A Study Using TANGO Mission Simulations and ENMAP Data, EGU General Assembly 2026, Vienna, Austria, 3–8 May 2026, EGU26-11178, https://doi.org/10.5194/egusphere-egu26-11178, 2026.

EGU26-11650 | ECS | Orals | AS3.13

A Deep Learning Retrieval for Tropospheric Ozone Profiles from High-Resolution Satellite Data 

‪Noam Ginio‬‏, Thomas Wagner, Steffen Beirle, Leon Kuhn, and Yinon Rudich

Tropospheric ozone is an important atmospheric trace gas that affects air quality, human health, and climate. However, its accurate retrieval from satellite observations remains challenging while in situ vertical profile measurements are sparse. The retrieval of tropospheric ozone is impeded by its weak signal compared to the dominant stratospheric ozone column, and current full physics retrievals often suffer from limited vertical resolution and show insufficient agreement to in situ observations. Recent advances in satellite instrumentation and machine learning provide an opportunity to overcome these limitations. In particular, the Tropospheric Monitoring Instrument (TROPOMI) offers high spatial resolution and signal-to-noise ratio, enabling more detailed daily observations of atmospheric ozone variability with global coverage.

We explore the feasibility of a deep-learning-based technique for retrieving high-resolution tropospheric ozone profiles from TROPOMI spectral measurements combined with auxiliary meteorological information, while avoiding some of the simplifying assumptions made in existing full physics retrieval approaches. Artificial neural networks are well-suited for this task, as they can learn complex, nonlinear relationships between ozone absorption features, surface and cloud properties, observation geometry, and atmospheric state variables.

The proposed methodology integrates TROPOMI spectral radiance/irradiance data (L1B) and the satellite position with meteorological information from ERA5 reanalysis data. The meteorological data includes boundary layer height and dissipation and surface pressure alongside temperature, humidity and wind speed profiles. The ground truth for the supervised training is comprised of co-located ozone profile measurements from ozone sondes (TOAR), aircraft measurements (IAGOS), lidar observations (TOLNet), and satellite microwave limb sounder (MLS).

Initial retrieval model is based on feed-forward fully connected neural network (multilayer perceptron), with planned extensions to convolutional architectures and dimensionality-reduction techniques. Using data from 2021 alone (approximately 1.2×10⁴ independent ozone profiles corresponding to ~1.5×10⁷ concentration measurements) our preliminary results demonstrate strong performance. The model’s ozone profile predictions are evaluated against the ground truth observations on an independent test set (including unseen time periods and locations). In this preliminary evaluation, the model achieves a coefficient of determination (R²) of 0.841 between retrieved and observed ozone concentrations, indicating the model’s ability to capture both vertical ozone structure and spatial ozone variability.

How to cite: Ginio‬‏, ‪., Wagner, T., Beirle, S., Kuhn, L., and Rudich, Y.: A Deep Learning Retrieval for Tropospheric Ozone Profiles from High-Resolution Satellite Data, EGU General Assembly 2026, Vienna, Austria, 3–8 May 2026, EGU26-11650, https://doi.org/10.5194/egusphere-egu26-11650, 2026.

EGU26-11864 | ECS | Orals | AS3.13

Major systematic contribution of fine aerosols over southern Africa from rivers of smoke depicted from spaceborne multiyear observations 

Oscar Guillemant, Juan Cuesta, Marco Gaetani, Benjamin Pohl, Cyrille Flamant, Oleg Dubovik, and Paola Formenti

Southern Africa is a climate-vulnerable region affected by biomass burning aerosols (BBA) emitted seasonally in central Africa, the primary source globally. By absorbing radiation and by deposition, these BBA have the potential of affecting in a very significant way both the regional radiative budget, the local meteorology and biogeochemistry, henceforth the regional climate. These impacts are governed by the high variability inherent to the fires and the short-lived atmospheric species.

In this study, we use satellite measurement of total column CO from three IASI instruments and the aerosol optical depth (AOD) by MODIS from 2007 to 2023, to investigate the climatology of transported BBA across the subcontinent at a daily timescale. We identify the seasonality, pathways and contribution of a meteorological phenomenon of the “rivers of smoke”, where the BBA plume is embedded in synoptic system, transporting high concentration of aerosol in the mid latitudes.

This intermittent transport happens seasonally, primarily above the continent, with a frequent second pathway along the western coast. The African regime, characterized by systematic fire and intermittent mid-latitude transport, contrasts with other important sources of tropical fire in the Amazon and southeast Asia. Our analysis reveals a maximum of contribution to the CO by the river of smoke in the southern Indian Ocean at 40°S. This pathway accounts for 25 to 30% of the regional CO concentration and peaks in September. In addition, the BBA, which are known to be in the fine mode, form plumes that contributes up to 60% of the fine mode fraction of AOD retrieved from MODIS in Namibia and South Africa, while the peak of contribution is in August, closer to the peak fire activity in July.

The river of smoke database from satellite observations established in this work provides a robust framework to tackle the variability of BBA.

How to cite: Guillemant, O., Cuesta, J., Gaetani, M., Pohl, B., Flamant, C., Dubovik, O., and Formenti, P.: Major systematic contribution of fine aerosols over southern Africa from rivers of smoke depicted from spaceborne multiyear observations, EGU General Assembly 2026, Vienna, Austria, 3–8 May 2026, EGU26-11864, https://doi.org/10.5194/egusphere-egu26-11864, 2026.

EGU26-12084 | ECS | Posters on site | AS3.13

Refining NOₓ Emissions using Satellite Observations: Inverse Modeling through DART–CHIMERE Data Assimilation of S5P/TROPOMI NO₂ Retrievals 

Giorgia De Moliner, Gaëlle Dufour, Gaël Descombes, Alessandro D'Ausilio, Adriana Coman, Guillaume Siour, Arineh Cholakian, and Giovanni Lonati

Emission inventories data used in chemical transport models (CTMs) are subject to uncertainties that propagate into air quality simulations. Air quality data from satellite observations can provide additional constraints on emissions, enabling a top-down approach that complements conventional bottom-up inventories. 

In this work, we performed an inverse modeling within the framework of the DART–CHIMERE data assimilation system. A state vector augmentation method is applied to NOₓ emission fields, allowing emissions to be adjusted along with initial chemical concentrations. This approach aims to mitigate the limited persistence of corrections obtained through initial-condition-only assimilation, which are often damped by CTM dynamics.

The methodology is tested over the European domain for S5P/TROPOMI NO₂ total column retrievals, and the impact of emission adjustments is evaluated using independent surface NO₂ measurements from ground-based monitoring stations. First results based on a test case are presented to illustrate the potential of the approach. While the approach does not aim to replace established bottom-up inventories, the results indicate that satellite-informed emission corrections can provide additional, dynamically consistent constraints, supporting their use as a complementary component in CTM-based air quality analyses. 

How to cite: De Moliner, G., Dufour, G., Descombes, G., D'Ausilio, A., Coman, A., Siour, G., Cholakian, A., and Lonati, G.: Refining NOₓ Emissions using Satellite Observations: Inverse Modeling through DART–CHIMERE Data Assimilation of S5P/TROPOMI NO₂ Retrievals, EGU General Assembly 2026, Vienna, Austria, 3–8 May 2026, EGU26-12084, https://doi.org/10.5194/egusphere-egu26-12084, 2026.

EGU26-12640 | ECS | Posters on site | AS3.13

Estimating the air pollutant-attributable health burden of the oil and gas sector in Mexico using a TROPOMI flux-divergence approach 

Omar Nawaz, Karla Cervantes, Marlene Cortez Lugo, Horacio Riojas Rodriguez, and Veronica Southerland

Background: Mexico's oil and gas (O&G) sector is a source of health relevant nitrogen dioxide (NO2) and fine particulate matter (PM2.5) emissions, yet the health impacts of these emissions remain unquantified. Understanding sector-specific health impacts is critical for informing methane and air quality mitigation strategies that maximize health benefits for affected communities. In this study, we conduct a full-chain health risk assessment to estimate O&G-attributable air pollution concentrations and health impacts in Mexico by leveraging satellite observations.

Methods: We derive total NOx emissions through a flux divergence calculation that applies TROPOMI remote sensing NO2 and ERA5 advection. Emissions specific to O&G were isolated through a land-use apportionment that integrates fine-resolution O&G infrastructure data from the Oil and Gas Infrastructure Mapping (OGIM) database. The GEOS-Chem High Performance (GCHP) model was used to perform a stretched-grid simulation over Mexico using these updated emissions to simulate the impact on NO2 and PM2.5 concentrations. These simulated NO2 are further downscaled using satellite-derived estimates. Population-weighted exposure was then modeled by combining downscaled pollution concentrations with municipal and AGEB-level population data.

Results: Our methodology estimates the O&G sector contributions to ambient NO2 and PM2.5 concentrations across Mexico at sub-national resolution. The integration of satellite remote sensing, chemical transport modeling, and satellite-based downscaling overcomes limitations of sparse ground monitoring and enables spatially resolved exposure assessment. We find modest improvements in normalized mean bias (NMB=-4.6%) and R2 value (R2=0.84) and increased surface-level NO2 concentrations exceeding +25% in some regions of Mexico.

Conclusions: This work demonstrates a strategy for attributing sector-specific air pollution and quantifying associated health impacts in data-limited settings. By integrating satellite observations, chemical transport modeling, and epidemiological methods, we provide evidence of the public health consequences of Mexico's O&G sector.

How to cite: Nawaz, O., Cervantes, K., Cortez Lugo, M., Riojas Rodriguez, H., and Southerland, V.: Estimating the air pollutant-attributable health burden of the oil and gas sector in Mexico using a TROPOMI flux-divergence approach, EGU General Assembly 2026, Vienna, Austria, 3–8 May 2026, EGU26-12640, https://doi.org/10.5194/egusphere-egu26-12640, 2026.

EGU26-14807 | ECS | Orals | AS3.13

Assessing the sources of discrepancies in top-down CO emission estimates from wildfires 

Harshil Neeraj, Dylan Jones, Sina Voshtani, Debra Wunch, and Erik Lutsch

Emissions from wildfires have a large impact on the carbon cycle and air quality. Robust estimates of these emissions are important as they inform policy decisions. Bottom-up or top-down approaches are commonly used to estimate these emissions. Bottom-up inventories represent emissions as a product of a biome-specific emission factor and the amount of fuel burned. Top-down estimates utilize observations of trace gas from satellites or ground-based sensors to estimate emissions through an inverse modeling approach. A chemical transport model is used in conjunction with observations and a prior estimate (from a bottom-up inventory) to provide constraints on the emission sources. Bottom-up inventories typically have large uncertainties arising from variations in emission factors and discrepancies in the estimated mass of burned vegetation. While top-down estimates have the potential to mitigate these errors and provide more constrained emissions data, they still possess large biases and uncertainties. Atmospheric carbon monoxide (CO) is widely used as a tracer of wildfire emissions, and although various CO inversion studies have been conducted over the past two decades, there are still large discrepancies in reported top-down CO emission estimates. Here, we conduct a series of CO inversion analyses, focusing on the 2023 wildfires, to quantify the impact on the inferred CO emissions of the choice of data assimilation scheme employed, the specific observations being assimilated, the prior emissions inventory used, as well as the assumptions about the modeled chemical processes. Specifically, we compare the impact on the top-down emission estimates of using an ensemble Kalman filter and a four-dimensional variational data assimilation scheme to conduct the inversion. We also compare the impact of observations from the TROPOspheric Monitoring Instrument (TROPOMI) and the Measurement Of Pollution In The Troposphere (MOPITT) instrument, prior biomass burning emissions from the Global Fire Assimilation System (GFAS) and the Quick Fire Emissions Dataset (QFED), and examine the influence of the distribution of the modeled OH fields on the CO wildfire emission estimates. 

How to cite: Neeraj, H., Jones, D., Voshtani, S., Wunch, D., and Lutsch, E.: Assessing the sources of discrepancies in top-down CO emission estimates from wildfires, EGU General Assembly 2026, Vienna, Austria, 3–8 May 2026, EGU26-14807, https://doi.org/10.5194/egusphere-egu26-14807, 2026.

EGU26-15434 | Posters on site | AS3.13

Improved IASI Ozone Profile Retrievals Using a Tropopause-Based Ozone Climatology 

Chiyoung Kim, Anne Boynard, Cathy Clerbaux, Daniel Hurtmans, Pierre-François Coheur, Joowan Kim, Ja-Ho Koo, Juseon Bak, Jae-Heung Park, Kyung-Hwan Kwak, and Sang Seo Park

The choice of a priori ozone profile is a key factor in IASI ozone profile retrievals. In the operational FORLI algorithm, a single fixed a priori profile from the McPeters/Labow/Logan climatology (McPeters et al., 2007) is used globally (Hurtmans et al., 2012). Previous work has shown that a tropopause-based ozone profile climatology can provide a more appropriate constraint near the tropopause and improve retrieval performance (Bak et al., 2013). However, the use of dynamic-dependent priors complicates pixel-to-pixel global intercomparisons. Here, we quantify the sensitivity of IASI ozone profile retrievals to the a priori choice over East Asia, leveraging intensive ozonesonde observations in Korea. Using the research retrieval framework Atmosphit, we conduct controlled sensitivity experiments in which only the a priori ozone climatology is changed. We first reproduce the FORLI-type configuration by adopting the McPeters/Labow/Logan climatology within Atmosphit and then construct and apply an alternative tropopause-based (TB) ozone climatology following Bak et al. (2013). Retrieved profiles are evaluated against continuous ozonesonde profiles from Anmyeondo during Pre-ACCLIP (2021) and ACCLIP (2022). Compared with the fixed climatological prior, the TB a priori improves retrieval consistency in the UTLS. Improvements are also found for tropospheric ozone consistency and total column ozone (TCO). These results support the use of tropopause-based ozone climatologies to enhance IASI ozone profile retrieval quality and provide practical guidance for research retrieval configurations targeting UTLS processes.


Financial support

This work was funded by the Korea Meteorological Administration Research and Development Program under Grant (RS-2025-02219688).


References

1. Bak, J., Liu, X., Wei, J. C., Pan, L. L., Chance, K., & Kim, J. H. (2013). Improvement of OMI ozone profile retrievals in the upper troposphere and lower stratosphere by the use of a tropopause-based ozone profile climatology. Atmospheric Measurement Techniques, 6(9), 2239-2254. https://doi.org/10.5194/amt-6-2239-2013

2. Hurtmans, D., Coheur, P. F., Wespes, C., Clarisse, L., Scharf, O., Clerbaux, C., Hadji-Lazaro, J., George, M., & Turquety, S. (2012). FORLI radiative transfer and retrieval code for IASI. Journal of Quantitative Spectroscopy and Radiative Transfer, 113(11), 1391-1408. https://doi.org/https://doi.org/10.1016/j.jqsrt.2012.02.036

3. McPeters, R. D., Labow, G. J., & Logan, J. A. (2007). Ozone climatological profiles for satellite retrieval algorithms. Journal of Geophysical Research: Atmospheres, 112(D5). https://doi.org/https://doi.org/10.1029/2005JD006823 

How to cite: Kim, C., Boynard, A., Clerbaux, C., Hurtmans, D., Coheur, P.-F., Kim, J., Koo, J.-H., Bak, J., Park, J.-H., Kwak, K.-H., and Park, S. S.: Improved IASI Ozone Profile Retrievals Using a Tropopause-Based Ozone Climatology, EGU General Assembly 2026, Vienna, Austria, 3–8 May 2026, EGU26-15434, https://doi.org/10.5194/egusphere-egu26-15434, 2026.

Reliable surface monitoring of airborne particulate matter with an aerodynamic diameter smaller than 2.5 μm (PM₂.₅) remains limited in many regions around the world. In many countries, particularly developing regions, air-quality assessment relies on sparse or low-cost sensor networks with limited unit or data quality, or is even absent due to the high costs of installation and maintenance. Therefore, satellite observations are often proposed as an alternative option or complementary source for PM₂.₅ information. However, the extent to which satellite-based estimates can reliably represent surface PM₂.₅ concentrations relative to regulatory-grade ground-based measurements remains insufficiently quantified.

This study addresses this gap by evaluating satellite- and model-based PM₂.₅ estimates by comparing them with high-quality ground observations in the Kansai region of Japan. Kansai has a dense network of approximately 270 regulatory-grade PM2.5 monitoring stations, operated under Japan’s Air Pollution Control Act, in combination with urban, coastal, and topographic environments. That is why it is an ideal location and benchmark for conducting this study. Monthly PM₂.₅ observations for 2025 were used as reference data. This study utilizes model-based PM₂.₅ fields from the Copernicus Atmosphere Monitoring Service (CAMS) reanalysis. At the same time, satellite-derived aerosol information was retrieved from the Moderate Resolution Imaging Spectroradiometer (MODIS) Multi-Angle Implementation of Atmospheric Correction (MAIAC) aerosol optical depth (AOD) at 550 nm. The satellite- and model-based products were evaluated using the Pearson correlation coefficient, mean bias, and root mean square error (RMSE).

The results show that after quality control, 2,146 station–month pairs were available for evaluation. CAMS PM₂.₅ product shows only moderate agreement with ground-based measurements with Pearson r at 0.36. It shows a tendency to overestimate surface PM₂.₅ with a positive mean bias of 4.8 µg m⁻³ and an RMSE of 6.7 µg m⁻³. This result shows that CAMS captures large-scale variability, but does not fully represent local PM₂.₅ conditions at monitoring locations. By comparison, MODIS MAIAC AOD has a stronger correlation with observed PM₂.₅ (r = 0.56). This result indicates that changes in satellite-observed aerosol loading are more closely linked to variations in surface PM₂.₅. Using a simple linear model, AOD was able to explain about 31% of the monthly PM₂.₅ variability and substantially improved prediction accuracy, reducing the RMSE to 2.2 µg m⁻³. Seasonal analysis of the MODIS MAIAC AOD also reveals that there is a higher correlation with observed PM₂.₅ during winter and spring, with an r value of around 0.6–0.7. This is due to more stable atmospheric conditions and a lower boundary-layer height, allowing surface particles and atmospheric aerosols to be more closely linked. Meanwhile, in summer, the relationship weakened (r < 0.4), likely because a higher boundary layer and increased humidity reduce the direct connection between column aerosol measurements and surface PM₂.₅. Overall, these results provide quantitative evidence on the strengths and limitations of satellite and reanalysis products as alternative sources of air-quality information, particularly for regions with sparse or no surface monitoring.

How to cite: Handayani, A. and Higuchi, T.: Evaluation of Satellite and Reanalysis Products for Surface PM₂.₅ Using Regulatory-Grade Observations in the Kansai Region of Japan, EGU General Assembly 2026, Vienna, Austria, 3–8 May 2026, EGU26-16129, https://doi.org/10.5194/egusphere-egu26-16129, 2026.

EGU26-16526 | ECS | Orals | AS3.13

Constraining ammonia emissions and deposition through joint NH3-NO2 satellite data assimilation in LOTOS-EUROS 

Tyler Wizenberg, Enrico Dammers, Arjo Segers, Beatriz Herrera Gutierrez, Martijn Schaap, Mark Shephard, Pierre Coheur, Martin Van Damme, Henk Eskes, Roy Wichink Kruit, and Shelley van der Graaf

Ammonia (NH3) and nitrogen dioxide (NO2) are key components of reactive nitrogen, with strong impacts on air quality, ecosystems, and nitrogen deposition. Long-term constraints on ammonia emissions and deposition remain uncertain due to sparse in situ measurements and limitations of individual satellite products. Here, we jointly assimilate five years (2018-2022) of NH3 and NO2 satellite observations over the Netherlands to improve constraints on reactive nitrogen concentrations, emissions, and deposition.

NH3 retrievals from the Infrared Atmospheric Sounding Interferometer (IASI) and Cross-track Infrared Sounder (CrIS) are assimilated along with NO2 observations from the TROPOspheric Monitoring Instrument (TROPOMI) within the Long Term Ozone Simulation-EURopean Operational Smog (LOTOS-EUROS) chemical transport model using a Local Ensemble Transform Kalman Filter (LETKF). The co-assimilation produces consistent year-to-year adjustments in modeled NH3 concentrations, emissions, and deposition, reflecting the chemically linked nature of reduced and oxidized nitrogen. Our model results are evaluated against independent surface observations from the Dutch National Air Quality Monitoring Network (LML), showing reduced surface biases, improved correlations, and a clearer representation of diurnal variability. Sensitivity experiments demonstrate that including TROPOMI NO2 alongside NH3 observations leads to the lowest NH3 surface biases, highlighting the added value of jointly assimilating chemically coupled species. Comparisons with the Dutch Measurements of Ammonia in Nature (MAN) network data show improved temporal correlations but persistent spatial biases related to representativeness differences, while MAN sensors co-located with LML stations exhibit consistent improvements.

In addition, synthetic NH3 observations from the geostationary Meteosat Third Generation Infrared Sounder (MTG-IRS) are assimilated in a separate experiment to assess the potential of future high-temporal-resolution measurements. These experiments indicate that MTG-IRS will provide substantial added value for constraining ammonia emissions and deposition at diurnal scales. Our results demonstrate that co-assimilation of NH3 and NO2 satellite observations provides a robust pathway toward improved monitoring of reactive nitrogen and supports the design and exploitation of next-generation atmospheric composition missions.

How to cite: Wizenberg, T., Dammers, E., Segers, A., Herrera Gutierrez, B., Schaap, M., Shephard, M., Coheur, P., Van Damme, M., Eskes, H., Wichink Kruit, R., and van der Graaf, S.: Constraining ammonia emissions and deposition through joint NH3-NO2 satellite data assimilation in LOTOS-EUROS, EGU General Assembly 2026, Vienna, Austria, 3–8 May 2026, EGU26-16526, https://doi.org/10.5194/egusphere-egu26-16526, 2026.

EGU26-16714 | ECS | Posters on site | AS3.13

Deep Learning-Enabled Spatiotemporal Monitoring of Global Air Pollutants Using Remote Sensing: Insights into Data-Scarce Regions  

Shahadat Baser, Bassam S. Tawabini, Muhammad Bilal, and Ardiansyah Koeshidayatullah

Nitrogen dioxide (NO₂) and Sulfur dioxide (SO₂) are important targets for monitoring atmospheric quality. Accurate ground concentration measurements are fundamental steps in pollution prevention and risk reduction. The scenario poses significant challenges for air quality monitoring in arid environments, particularly in the Middle East and North Africa (MENA) region, due to rapid urbanization and the scarcity of ground-based sensor networks. While satellite remote sensing, such as the Sentinel-5P TROPOMI mission, provides synoptic global coverage, its usefulness for assessing public health is limited by the difference between column densities and surface-level concentrations. This paper presents a novel hybrid AI framework that combines spatiotemporal inversion with deep learning-based forecasting to address this gap, particularly in ground data-scarce regions. Our approach follows a thorough three-phase framework. First, we created the Dynamic Urban-Met Integration (DUMI) database. This cohesive spatiotemporal tensor integrates trace gas data from Sentinel-5P/TROPOMI (NO2, SO2), MERRA-2 meteorological reanalysis data, and urban growth statistics from the UN World Urbanization Prospects (WUP) 2025. To overcome the resolution difference between satellite (~5.5 km) and meteorological (~50 km) data, we employed a zonal spatial aggregation algorithm, implemented within the Google Earth Engine (GEE), to synchronize multi-resolution sources within a standardized 30 km urban airshed for 100 global cities spanning from 2019 - 2025. Second, we employed a Homogeneous Domain Adaptation approach to address the challenge of insufficient local ground-truth data. In particular, we trained an Extreme Gradient Boosting (XGBoost) regressor using data from a "Source Domain" comprising 20 data-rich U.S. cities, selected as climatic analogs with urban typologies similar to data-scarce regions, including industrial congestion, traffic patterns, desert dynamics, and other urban features. This method facilitated the approximation of the nonlinear physical transfer function (Csurf = f(Ncol, PBLH, Wind)), which is influenced by wind dynamics and the Planetary Boundary Layer Height (PBLH). Lastly, we used a 12-month sliding window to train a stacked deep learning forecasting model, such as a Long Short-Term Memory (LSTM) network, using the rebuilt "Synthetic History." With this configuration, the model can anticipate future trajectories under the urban growth scenarios of those cities from 2026 – 2030 and incorporate seasonal volatility. Preliminary validation against held-out US EPA ground station measurements (2019-2025) shows that the inversion model successfully captures the physics of atmosphere dilution, with (R2) values of 0.998 for NO2 and 0.992 for SO2 using monthly mean data. SHAP (SHapley Additive exPlanations) analysis provides additional evidence of the model's physical consistency by revealing that the AI autonomously learned the strong inverse relationship between PBLH and surface concentrations (the "Lid Effect"), validating its transferability to new regions. Preliminary testing in Los Angeles and Seoul indicates that the LSTM can sufficiently generalize to predict seasonal volatility and pollution spikes, with an (R2) value of 0.84 & 0.82, respectively. This approach provides a scalable "Virtual Station" infrastructure that gives policymakers a quantitative tool to assess the environmental effects of rapid urbanization in data-poor dry regions.

Keywords: GeoAI, Nitrogen dioxide (NO2) & Sulfur dioxide (SO2), Inversion, Remote Sensing, XGBoost, Sentinel-5P, Deep Learning, LSTM, SHAP, Saudi Arabia.

How to cite: Baser, S., Tawabini, B. S., Bilal, M., and Koeshidayatullah, A.: Deep Learning-Enabled Spatiotemporal Monitoring of Global Air Pollutants Using Remote Sensing: Insights into Data-Scarce Regions , EGU General Assembly 2026, Vienna, Austria, 3–8 May 2026, EGU26-16714, https://doi.org/10.5194/egusphere-egu26-16714, 2026.

EGU26-16860 | ECS | Posters on site | AS3.13

SICMA: a simplified isoprene oxidation chemistry for the MAGRITTE chemistry transport model with application to source inversion 

Glenn-Michael Oomen, Trissevgeni Stavrakou, Jean-François Müller, Vincent Huijnen, Flora Kluge, Antje Inness, and Isabelle De Smedt

Accurate representation of volatile organic compound (VOC) chemistry remains a major challenge due to its complexity, particularly for isoprene oxidation, which strongly controls tropospheric formaldehyde (HCHO) and oxidant budgets. Full chemical mechanisms are computationally expensive, which limits their applicability in long simulations and inverse modeling frameworks. In this work, we present the Simplified Isoprene Chemistry for MAGRITTE (SICMA), a newly developed simplified chemical mechanism designed to efficiently represent isoprene oxidation while preserving key features of HCHO production and HOx recycling.
The SICMA isoprene chemistry scheme consists of 4 lumped reactions involving 4 organic species with parametrized yield coefficients and reaction rates, enabling a compact yet physically consistent representation of the dominant isoprene oxidation pathways. The coefficients and rates are optimized through box-model experiments constrained by the MAGRITTEv1.2 chemistry scheme. The SICMA chemistry is implemented within the MAGRITTEv1.2 chemistry-transport model and is evaluated using global simulations against the full chemical mechanism.
The simplified chemistry reproduces the main spatial patterns and seasonal variability of HCHO with good agreement relative to the full mechanism, while significantly reducing computational cost. The SICMA scheme also provides a good match for isoprene, HOx, and NOx. Our results demonstrate that SICMA provides a robust compromise between chemical realism and computational efficiency. The scheme is well suited for large-scale applications such as data assimilation, emission inversion, and sensitivity studies, where traditional full chemistry approaches are often prohibitive. SICMA thus offers a practical pathway towards improved exploitation of satellite HCHO observations for constraining isoprene emissions and understanding tropospheric oxidation chemistry. SICMA chemistry has been developed as part of the EU Horizon Europe CAMEO project with application to the IFS-COMPO model. 

How to cite: Oomen, G.-M., Stavrakou, T., Müller, J.-F., Huijnen, V., Kluge, F., Inness, A., and De Smedt, I.: SICMA: a simplified isoprene oxidation chemistry for the MAGRITTE chemistry transport model with application to source inversion, EGU General Assembly 2026, Vienna, Austria, 3–8 May 2026, EGU26-16860, https://doi.org/10.5194/egusphere-egu26-16860, 2026.

EGU26-17953 | ECS | Posters on site | AS3.13

Improving NO₂ Episode Detection with TROPOMI: A Decomposition Approach Across Diverse Orography 

Cristina Campos, jan M.Armengol, Yolanda Sola, Mireia Udina, and Joan Bech

Air pollution remains a critical environmental challenge for human health and ecosystems, requiring improved monitoring beyond traditional ground-based networks. The EU Directive 2024/2881 enforces stricter NO₂ limits by 2030, making advanced modeling essential, particularly in sensor-scarce regions. Satellite remote sensing has emerged as a key complement, with recent studies [1–4]  examining links between satellite-derived NO₂ columns and surface concentrations. However, these studies rely on simple temporal averages, removing short-term structures relevant for identifying pollution episodes and do not address the possible influence of orography.

This study introduces a fluctuation-aware decomposition framework to enhance NO₂ pollution episode detection using the Tropospheric Monitoring Instrument (TROPOMI) aboard Sentinel 5 Precursor (Sentinel-5P) satellite. The method isolates trend, seasonal, and fluctuation components. Explicitly, fluctuations are modeled to retain short-term variability associated with NO₂ events, enhancing the signal-to-noise ratio. This approach was applied to TROPOMI NO₂ vertical tropospheric column density (TrC-NO2) data and surface-level NO₂ concentration measurements (OBS-NO2) from 150 stations across northeastern Spain, Andorra, and southern France, including the Pyrenees, spanning May 2018 to December 2023, and accounting for varying terrain complexity and different NO₂ dynamics.

Performance was assessed via Pearson correlation and alarm rates (True Positive Rate, TPR; False Alarm Rate, FAR) across event intensities. Results show that our models outperform raw data for episodes lasting 3 days, reducing error and improving correlation in ≥98% of stations, regardless of terrain complexity. To our knowledge, this is the first study to assess terrain effects on TROPOMI NO₂ retrievals and to demonstrate their reliability in mountainous regions. These findings provide a robust framework for integrating satellite data into air quality monitoring and compliance strategies under the EU Directive, especially where ground networks are sparse.

References

1. Cersosimo A, Serio C, Masiello G. TROPOMI NO2 Tropospheric Column Data: Regridding to 1 km Grid-Resolution and Assessment of their Consistency with In Situ Surface Observations. Remote Sens. 2020 Jan;12(14):2212. 

2. Jeong U, Hong H. Assessment of Tropospheric Concentrations of NO2 from the TROPOMI/Sentinel-5 Precursor for the Estimation of Long-Term Exposure to Surface NO2 over South Korea. Remote Sens. 2021 Jan;13(10):1877. 

3. Petetin H, Guevara M, Compernolle S, Bowdalo D, Bretonnière PA, Enciso S, et al. Potential of TROPOMI for understanding spatio-temporal variations in surface NO2 and their dependencies upon land use over the Iberian Peninsula. Atmospheric Chem Phys. 2023 Apr 3;23(7):3905–35. 

4. Morillas C, Alvarez S, Serio C, Masiello G, Martinez S. TROPOMI NO2 Sentinel-5P data in the Community of Madrid: A detailed consistency analysis with in situ surface observations. Remote Sens Appl Soc Environ. 2024 Jan 1;33:101083. 

How to cite: Campos, C., M.Armengol, J., Sola, Y., Udina, M., and Bech, J.: Improving NO₂ Episode Detection with TROPOMI: A Decomposition Approach Across Diverse Orography, EGU General Assembly 2026, Vienna, Austria, 3–8 May 2026, EGU26-17953, https://doi.org/10.5194/egusphere-egu26-17953, 2026.

EGU26-18003 | ECS | Orals | AS3.13

Quantification and evaluation of carbon monoxide emissions for high-emitting point sources using earth observation and bottom-up estimates  

Claire Michaud van der Wal, Hugo Denier van der Gon, Gijs Leguijt, Marc Guevara Vilardell, and Stijn Dellaert

Carbon monoxide (CO) is an important air pollutant and precursor of ozone, plays an important role in atmospheric chemistry. Large quantities of carbon monoxide are emitted in coal-fired iron and steel  production processes, causing iron and steel plants to be the globally highest emitting point sources of CO. From the CORSO bottom-up global point source dataset, we select iron and steel plants thought to emit over 100 kt CO per year in 2021. For these plants, we obtain satellite-based emission estimates of carbon monoxide, applying the Cross-Sectional-Flux (CSF) method to TROPOMI for the period 2019-2021. We retain a global set of iron and steel plant yearly emission estimates of CO with satellite quantifications of 100 kt.yr-1 and up. Previous research on European iron and steel plants  showed good agreement between bottom-up inventories, resource-intensive inversions and the low-cost CSF method. When we apply the CSF method outside of Europe we find substantial discrepancies between the bottom-up and top-down estimates, with large variations between regions. We examine potential sources of satellite under- or overestimation of the bottom-up inventory.

How to cite: Michaud van der Wal, C., Denier van der Gon, H., Leguijt, G., Guevara Vilardell, M., and Dellaert, S.: Quantification and evaluation of carbon monoxide emissions for high-emitting point sources using earth observation and bottom-up estimates , EGU General Assembly 2026, Vienna, Austria, 3–8 May 2026, EGU26-18003, https://doi.org/10.5194/egusphere-egu26-18003, 2026.

EGU26-18777 | Posters on site | AS3.13

Total Column Water Vapor for Sentinel-4, 5 and 5p Towards a Climate Data Record 

Luca Lelli, Suryakiran Maruvada, Ka Lok Chan, Pieter Valks, and Diego Loyola

Gaseous water exhibits significantly greater spatiotemporal variability than other major greenhouse gases, such as carbon dioxide and methane. Consequently, satellite-based global monitoring of atmospheric water vapour is an essential methodology for elucidating its climate impacts at regional and global scales over timescales ranging from short to multidecadal. To track water vapour, total column measurements are derived from satellite observations of reflected solar radiation within the UV-VIS spectral region centred at 440 nm. This water vapour absorption band is an alternative to the conventional NIR band centred at 648 nm. The advantage of this band is that it is detectable across all European Sentinel platforms and their predecessor instruments, such as GOME on ERS-2, SCIAMACHY on Envisat and GOME-2 on MetOp-A/B/C, as well as future instruments, e.g. CO2M.
This work presents recent advancements in the application of differential optical absorption spectroscopy (DOAS) to geostationary Sentinel-4 and polar-orbiting Sentinel-5P observations. This work serves as preparatory research for future implementations with the polar-orbiting Sentinel-5 mission.
The retrieval methodology has several advantages over existing sensing techniques: (1) optimal sensitivity and coverage characteristics across both terrestrial and oceanic domains; (2) enhanced spatial resolution and temporal sampling frequency, particularly for European observations via Sentinel-4, which improves weather forecasting, scientific product development, air quality assessment and environmental policy applications; and (3) the continuous extension of long-term datasets starting with GOME-type sensors, which is crucial for regional and global climate modelling. This naturally introduces the possibility of creating a homogeneous climate data record since 1995.

How to cite: Lelli, L., Maruvada, S., Chan, K. L., Valks, P., and Loyola, D.: Total Column Water Vapor for Sentinel-4, 5 and 5p Towards a Climate Data Record, EGU General Assembly 2026, Vienna, Austria, 3–8 May 2026, EGU26-18777, https://doi.org/10.5194/egusphere-egu26-18777, 2026.

The regional CAMS (Copernicus Atmosphere Monitoring Service) analyses mainly profit from the assimilation of data from ground-based monitoring stations to obtain the best representation of the atmospheric state over Europe. Modern satellite missions such as Sentinel-5P and Sentinel-4, now provide high-resolution retrievals of atmospheric trace-gas columns. In order to assimilate such retrievals in EURAD-IM (European Air pollution Dispersion – Inverse Model), an observation operator is developed and tested. The challenge lies in the degrees of freedom how to distribute column values vertically across the different model levels. Furthermore, the assimilation of noise in the retrieval data poses risks to a meaningful representation of air pollutants in the model analysis. In this study, we assimilate nitrogen dioxide and sulphur dioxide TROPOMI retrievals in EURAD-IM, both with and without observations from the European ground-based monitoring network. The three-dimensional variational data assimilation technique is applied. Additionally, we test the potential of assessing emission with four-dimensional variational data assimilation. We compare and evaluate the simulation experiments using ground-based and airborne data. This demonstrates the added value of the satellite data assimilation. In this way, the EURAD-IM assimilation system is prepared for the upcoming hourly data of Sentinel-4.

How to cite: Lange, A. C., Franke, P., and Friese, E.: Benefits and challenges of assimilating Sentinel-5P TROPOMI retrievals into the regional CAMS analysis with EURAD-IM, EGU General Assembly 2026, Vienna, Austria, 3–8 May 2026, EGU26-19407, https://doi.org/10.5194/egusphere-egu26-19407, 2026.

EGU26-19812 | Orals | AS3.13

Bridging temporal gaps: AI-based temporal downscaling of biweekly NH3 to daily scale with spatial transferability 

Eunjin Kang, Saman Malik, Yoojin Kang, and Jungho Im

Ammonia (NH₃) is an important atmospheric pollutant with environmental and public health impacts. In recent decades, NH₃ concentrations have increased due to intensified agricultural activities and industrial development, underscoring the need for high-resolution monitoring. However, sparse biweekly ground-based observations from the Ammonia Monitoring Network (AMoN) remain a major limitation for comprehensive spatiotemporal analysis. The United States (US) is a region where NH₃ monitoring is particularly important due to its extensive agricultural activities. In this study, we developed machine learning–based frameworks, including a deep neural network (DNN), random forest, and light gradient boosting machine, to estimate nationwide biweekly NH₃ concentrations and temporally downscale them to daily values across the contiguous US from 2017 to 2022. The models incorporate satellite-derived NH₃ column measurements, meteorological variables, land cover characteristics, livestock density, and AMoN ground-based observations. Among the tested approaches, the DNN demonstrated the strongest performance under both spatial cross-validation and independent testing, achieving a correlation coefficient of 0.79, a root mean square error of 0.98 µg m⁻³, and an index of agreement of 0.83. The model effectively reproduced fine-scale spatial variability in daily NH₃ concentrations at a 9 km resolution. Shapley additive explanations further revealed that temporally varying predictors—such as day of year and meteorological conditions—played a dominant role, alongside land cover and cattle density, supporting robust temporal downscaling from biweekly to daily scales. To assess spatial transferability, the framework was additionally applied to ground-based monitoring stations in the United Kingdom, where daily NH₃ observations are available, using leave-one-station-out and leave-one-year-out cross-validation schemes. Overall, our results demonstrate the potential of machine learning approaches to bridge temporal gaps in NH₃ observations and to generate high-resolution daily concentration estimates.

How to cite: Kang, E., Malik, S., Kang, Y., and Im, J.: Bridging temporal gaps: AI-based temporal downscaling of biweekly NH3 to daily scale with spatial transferability, EGU General Assembly 2026, Vienna, Austria, 3–8 May 2026, EGU26-19812, https://doi.org/10.5194/egusphere-egu26-19812, 2026.

EGU26-19961 | Posters on site | AS3.13

Trends and degradation in long-term TROPOMI L1 radiance signal 

Emiel van der Plas, Deborah Stein Zweers, Pepijn Veefkind, Edward van Amelrooy, Nico Rozemijer, Mirna van Hoek, and Antje Ludewig

The TROPOMI instrument on board of Sentinel 5P has been measuring radiance and irradiance data in an operational schedule since April 2018. When we compare the absorbing aerosol index (AAI) derived from TROPOMI data to that of OMI, we notice that TROPOMI shows a downward trend that is not in the OMI signal. We know that the TROPOMI instrument is suffering from degradation in various parts of the lightpath. The degradation has been divided into several contributions that are attributed to different parts of the instrument. Especially for the radiance signal it is challenging to discriminate between a possible instrument-related trend or possible long-term atmospheric changes. Radiance monitor data is used to see if there are patterns in these changes. Using on-ground measurements we can assess the absolute radiance calibration of the TROPOMI instrument. This is part of the on-going effort to monitor and improve the L1b data quality.

How to cite: van der Plas, E., Stein Zweers, D., Veefkind, P., van Amelrooy, E., Rozemijer, N., van Hoek, M., and Ludewig, A.: Trends and degradation in long-term TROPOMI L1 radiance signal, EGU General Assembly 2026, Vienna, Austria, 3–8 May 2026, EGU26-19961, https://doi.org/10.5194/egusphere-egu26-19961, 2026.

Hyperspectral observations from geostationary satellites provide detailed spectral information that is highly valuable for air quality monitoring, enabling improved characterization of aerosols and trace gases through their distinct spectral signatures. The Geostationary Environment Monitoring Spectrometer (GEMS) offers continuous hyperspectral measurements with high temporal resolution over the Asia–Pacific region, making it well suited for monitoring diurnal variations in atmospheric composition. However, the relatively coarse spatial resolution of hyperspectral geostationary sensors limits their ability to resolve fine-scale spatial heterogeneity in air pollution, especially in urban regions. This trade-off between spectral fidelity and spatial resolution remains a fundamental limitation of single-sensor satellite-based air quality monitoring. To address this challenge, this study develops a deep learning–based fusion framework that integrates hyperspectral radiance from GEMS with high-spatial-resolution multispectral observations from the Geostationary Ocean Color Imager-II (GOCI-II). A self-supervised learning strategy is used to improve the spatial resolution of GEMS Level-1C (L1C) radiance by using spatial patterns from GOCI-II. This makes hyperspectral super-resolution possible without needing high-resolution hyperspectral ground truth data. Validation against the original GEMS L1C data shows that the super-resolved radiance is very consistent in both space and time, with correlation coefficients (R) over 0.95 and normalized root mean square error (nRMSE) under 10%. The resulting super-resolved radiance preserves spectral information while providing substantially finer spatial detail than existing satellite products. Furthermore, the enhanced hyperspectral radiance is linked to surface-level air pollutant (e.g., PM10, PM2.5, and NO2) concentrations through artificial intelligence-based models, demonstrating its applicability for high-resolution air quality monitoring. The proposed multi-satellite fusion framework highlights the value of integrating complementary satellite observations with data-driven approaches for urban-scale air quality analysis.

How to cite: Choi, H., Lee, S., Kim, Y., and Im, J.: Deep learning-based super-resolution of GEMS hyperspectral data using GOCI-II fusion: Advancing high-resolution air quality monitoring, EGU General Assembly 2026, Vienna, Austria, 3–8 May 2026, EGU26-20990, https://doi.org/10.5194/egusphere-egu26-20990, 2026.

EGU26-21165 | ECS | Posters on site | AS3.13

Towards robust global CH₄ emission inversions: Insights into the impact of parametric weighting of TROPOMI observations 

Santiago Parraguez Cerda, Johann Rasmus Nüß, Nikos Daskalakis, Arjo Segers, Oliver Schneising, Michael Buchwitz, Mihalis Vrekoussis, and Maria Kanakidou

Satellite observations are critical for global monitoring of trace gases like methane (CH₄), a potent greenhouse gas, but challenges remain in assimilating dense satellite data alongside sparser in situ measurements within inverse modelling systems. Here, we present a parametric regularisation method that computes observation-specific weights based on the spatial and temporal coverage of satellite data, enabling balanced assimilation across densely and sparsely observed regions. This approach is implemented as a preprocessing step, preserving computational efficiency by maintaining a fixed covariance matrix, and is adaptable for use with multiple satellite products in combined inversions.

Applied to global methane inversions using the TM5-MP/4DVAR system at 1° × 1° resolution for 2019 with TROPOMI observations, our method reduces grid cell weight variability by approximately 20% compared to a constant weighting approach. This adaptation effectively increases the influence of observations from regions with sparse satellite coverage, such as high latitudes and oceans, while reducing over-representation from densely sampled areas. The redistributed weights lead to localised but notable changes in optimised methane fluxes, especially in regions like Southeast Asia and South America, but the global posterior budget remains consistent with the latest Global Methane Budget estimates.

Comparison against independent TCCON and NOAA measurements confirms the robustness of the parametric weighting. Overall, the proposed methodology offers a robust, efficient, and easily generalizable framework for assimilating satellite observations, improving constraints on methane emissions globally, and providing a foundation for future multi-product inversions.

How to cite: Parraguez Cerda, S., Nüß, J. R., Daskalakis, N., Segers, A., Schneising, O., Buchwitz, M., Vrekoussis, M., and Kanakidou, M.: Towards robust global CH₄ emission inversions: Insights into the impact of parametric weighting of TROPOMI observations, EGU General Assembly 2026, Vienna, Austria, 3–8 May 2026, EGU26-21165, https://doi.org/10.5194/egusphere-egu26-21165, 2026.

EGU26-21286 | Posters on site | AS3.13

Analysis of PM2.5 precursors by satellite products over Lazio region 

Flaminia Fois, Valentina Terenzi, Patrizio Tratzi, Valerio Paolini, and Cristiana Bassani

Fine particulate matter with an aerodynamic diameter below 2.5µm (PM2.5) is widely recognized as one of the most harmful air pollutants due to the impact on human health, ecosystems, and climate. The importance of controlling PM2.5 concentrations has been reinforced by the European Air Quality Directive 2024, which aligns particulate matter standards more closely with World Health Organization guidelines. PM2.5 originates from both direct emissions and secondary formation processes involving gaseous precursors such as nitrogen dioxide (NO2) and volatile organic compounds (VOCs). Secondary aerosols often dominate PM2.5 mass in urban and regional environments, making the characterization of the spatial and seasonal variability of these precursors essential for understanding formation pathways and supporting season-specific air quality management strategies.

Tropospheric vertical column densities (VCDs) of NO2 and HCHO (used as a proxy for VOCs) were retrieved from the TROPOspheric Monitoring Instrument (TROPOMI) onboard Sentinel-5P. The results reveal pronounced seasonal variations in precursor concentrations. NO2 spatial distributions closely follow urban centers and major road networks, with higher winter concentrations driven by stable atmospheric conditions and increased emissions from heating and traffic, and lower summer levels reflecting enhanced photochemical processing and atmospheric mixing. In contrast, HCHO shows a more widespread seasonal pattern, with higher summer concentrations largely driven by intensified photochemical activity and biogenic emissions, with isoprene acting as a key local precursor. These seasonal dynamics are consistent with established atmospheric chemistry and emission patterns.

The application of k-means clustering enabled the identification of regions of interest, distinguishing highly polluted areas from cleaner backgrounds and highlighting urban and agricultural hotspots such as Rome, the Sacco Valley, and the Tiber Valley. Comparison with land cover data indicates that elevated pollution levels are associated with urban, industrial, and transportation-related emissions, while areas with natural vegetation exhibit greater mitigation capacity.

Aerosol optical depth (AOD) derived from the MAIAC algorithm applied to MODIS data from the AQUA and TERRA satellites was employed to investigate the relationship between gaseous precursors and particulate matter formation. The results indicate a distinct seasonal coupling between precursor gases and AOD. During winter, NO2 shows stronger associations with AOD, highlighting the dominant role of inorganic secondary aerosol formation. During summer, HCHO exhibits a closer relationship with AOD, pointing to the increased importance of photochemically driven secondary organic aerosol production.

Overall, satellite-based Earth observation provides a powerful complement to ground-based monitoring for investigating PM2.5 precursors and demonstrates strong potential to support the implementation of the 2024 European Air Quality Directive. By identifying spatial hotspots and seasonal drivers of precursor gases, this analysis supports the development of effective, season-specific emission reduction strategies and improves understanding of the atmospheric processes controlling air quality in the Lazio region.

How to cite: Fois, F., Terenzi, V., Tratzi, P., Paolini, V., and Bassani, C.: Analysis of PM2.5 precursors by satellite products over Lazio region, EGU General Assembly 2026, Vienna, Austria, 3–8 May 2026, EGU26-21286, https://doi.org/10.5194/egusphere-egu26-21286, 2026.

EGU26-4460 | Posters on site | AS3.14

Overview of remote sensing multi-instrument synergy retrieval realized using GRASP retrieval platform   

Oleg Dubovik, Pavel Litvinov, David Fuertes, Tatyana Lapyonok, Anton Lopatin, Masahiro Momoi, Marcos Herreras Gerada, Siyao Zhai, Chong Li, Mialgros Herrera, Christian Matar, Juan Carlos Antuña-Sánchez, Yevgeny Derimian, Benjamin Torres, Zhen Liu, Yuheng Zhang, Wushao Lin, Alexander Sinuyk, and Elena Lind

Generalized Retrieval of Atmosphere and Surface Properties (GRASP) is an algorithm provided as open-source software for remote sensing observations (Dubovik et al., 2021). The algorithm is designed for the interpretation of diverse remote sensing observations and is suitable for realizing synergetic processing using observations from multiple sensors. GRASP is based on several fundamental principles. It utilizes complete and rigorous modeling of atmospheric radiation applicable for simulating a variety of observations. The numerical inversion is implemented as an elaborated, statistically optimized fitting following the Multi-Term Least Square (MTLS) minimization concept, which serves as the basis for the efficient combination of different observations. For example, this concept allows for the use of multiple a priori constraints, which are essential when retrieving a large number of parameters of different types (e.g., describing properties of aerosols, gases, surface reflectance, etc.). This concept is also applied in “multi-pixel retrieval” scenarios, where the retrieval is implemented simultaneously for a large group of coordinated observations (such as observations in different satellite pixels). By processing these observations together, the retrieval incorporates prior knowledge regarding the temporal and spatial variability of the retrieved parameters. For instance, land surface reflectance tends to remain stable over weeks, while aerosols can change within hours or days. Similarly, aerosol properties typically vary minimally across several kilometers, whereas the land surface can exhibit high spatial heterogeneity. The algorithm’s design for interpreting diverse remote sensing data makes it ideal for the synergetic processing of observations from multiple sensors. This approach enables efficient synergy even for observations that are not fully coincident or co-located.

At present, GRASP has been used to develop a number of synergy retrievals. This presentation overviews and discusses the following key GRASP applications:

- Ground-based remote sensing synergies:

- Sun/sky-radiometer + lidar;

- Sun/sky-radiometer + Pandora spectrometer;

- Sun/sky-radiometer + Pandora spectrometer + lidar;

- Satellite remote sensing synergies:

- combining the same platform instruments with different capabilities (e.g. radiometers + spectrometers measuring;  radiometers + lidars; combining   UV, VIS, SWIR and TIR measurements, etc.);

- multi-platform LEO + LEO observations;

- multi-platform LEO + GEO observations;

- Satellite + ground-based remote sensing synergies:

-retrieval both atmospheric and surface reflectance properties from co-located ground-based and satellite observations.

The discussed developments are realized using observations from Copernicus Sentinel-2, -3, -5P, MTG, EPS-SG, and EarthCARE, and are implemented within the frameworks of the EU PANORAMA, ESA AIRSENSE, EarthCARE+, and other projects.

Dubovik, O., D. Fuertes, P. Litvinov, et al. , “A Comprehensive Description of Multi- Term LSM for Applying Multiple a Priori Constraints in Problems of Atmospheric Remote Sensing: GRASP Algorithm, Concept, and Ap-plications”, Front. Remote Sens. 2:706851. doi: 10.3389/frsen.2021.706851, 2021.


How to cite: Dubovik, O., Litvinov, P., Fuertes, D., Lapyonok, T., Lopatin, A., Momoi, M., Herreras Gerada, M., Zhai, S., Li, C., Herrera, M., Matar, C., Antuña-Sánchez, J. C., Derimian, Y., Torres, B., Liu, Z., Zhang, Y., Lin, W., Sinuyk, A., and Lind, E.: Overview of remote sensing multi-instrument synergy retrieval realized using GRASP retrieval platform  , EGU General Assembly 2026, Vienna, Austria, 3–8 May 2026, EGU26-4460, https://doi.org/10.5194/egusphere-egu26-4460, 2026.

EGU26-5660 | Orals | AS3.14

Advanced retrieval of aerosol vertical profiles using synergy of EarthCARE ATLID and various passive spaceborne observations 

Anton Lopatin, Anna Gialitaki, Chong Li, Dimitra Karkani, Alexandra Tsekeri, Alejandro García-Gómez, Thanasis Georgiou, Oleg Dubovik, and Edward Malina

We present the efforts in frame of ESA “EarthCARE ATLID and MSI Instruments Synergy for Advanced Retrieval of Aerosol Vertical Profiles” (ECAMS) and “Geostationary and Lidar space-borne Aerosol 4-Dimensional Synergy” (GLADIS) projects, which aim to enhance the integration of passive and active observations by combining Level 1 (L1) data from ATLIDD/EarthCARE lidar and various geostationary (GEO) and polar orbiting imagers. ECAMS focuses on aerosol retrieval from coinsident L1 observations from ATLID and MSI/EArthCARE and HARP-2/PACE imagers, while GLADIS pursues to extend these developments to non-coincident L1 retrievals of FCI/MTG-I, ATLID/EarthCARE, TROPOMI/S5p and HARP-2/PACE.

Global quantification of aerosol properties relies heavily on space-based measurements, yet distinct limitations exist for individual sensor types. Passive remote sensing, which utilizes spectral observations of top-of-atmosphere reflectance, provides sensitivity to aerosol load, particle size, and morphology but offers limited information regarding vertical distribution. Conversely, active lidar observations excel at resolving vertical structure but require prior assumptions regarding aerosol microphysics for stand-alone retrievals. While the synergy of collocated radiometric and lidar measurements allows for comprehensive interpretation, such approaches are traditionally constrained by the limited spatio-temporal overlap of orbital platforms. This restriction significantly reduces the data volume available for constraining global transport models.

In this context, geostationary observations, such as those from MTG-I or Sentinel-4, provide extensive coverage within the observed Earth disk. However, the information content of single-view GEO instruments is limited compared to that of Multi-Angle Polarimeters (MAPs) and is insufficient for constraining aerosol type. Consequently, effective synergy between ATLID and GEO instrumentation necessitates the additional inclusion of non-coincident MAP or spectrometric observations from polar-orbiting platforms. Furthermore, the incorporation of non-coincident data significantly increases the volume of observations available for processing, thereby potentially enhancing retrieval accuracy. This approach is particularly advantageous for synergies involving multiple satellite platforms, as it substantial increases the number of usable overpasses. As a result, both the information content and the spatio-temporal coverage of the retrievals are improved, augmenting the overall quality and scientific utility of the synergistic products.

Prevalent strategies for synergistic aerosol retrieval focus primarily on ground-based active and passive observations, often underutilizing recent advancements in lidar technology, such as High Spectral Resolution Lidars (HSRLs). Furthermore, existing frameworks lack the architectural flexibility to integrate diverse lidar configurations with passive measurements for space-borne applications. We address these limitations by developing new methods for generating global aerosol vertical distribution products with improved accuracy and coverage, using highly optimized forward models (including aerosol and surface reflectance) and the statistical estimation framework of the open-source GRASP (Generalized Retrieval of Atmosphere and Surface Properties) software. This framework is designed for adaptability, enabling the synergistic processing of various active and passive satellite observations across different spatial, vertical, and spectral resolutions. Crucially, it supports the fusion of both coincident measurements and asynchronous observations acquired from non-aligned orbital overpasses.

These studies support and complement synergy developments of ESA AIRSENSE project and its studies on aerosol-cloud interactions, in collaboration with the EC CleanCloud and CERTAINTY projects. Ongoing developments, results and findings will be presented and discussed.

How to cite: Lopatin, A., Gialitaki, A., Li, C., Karkani, D., Tsekeri, A., García-Gómez, A., Georgiou, T., Dubovik, O., and Malina, E.: Advanced retrieval of aerosol vertical profiles using synergy of EarthCARE ATLID and various passive spaceborne observations, EGU General Assembly 2026, Vienna, Austria, 3–8 May 2026, EGU26-5660, https://doi.org/10.5194/egusphere-egu26-5660, 2026.

Absorbing aerosols in industrial regions exhibit rapidly evolving particle size distributions and mixing states that are poorly represented by common fixed-parameter assumptions, introducing coupled uncertainties in both aerosol radiative forcing and shortwave infrared trace-gas retrievals, particularly for methane (CH4) in the 2.3-2.4 μm window. Here we develop a multi-constraint framework that combines column optical observations (multi-band AOD and SSA) with in situ size-resolved measurements and multi-wavelength black carbon mass to jointly constrain aerosol microphysics and optical behavior. A physically constrained core-shell Mie model is used to generate microphysically plausible solution ensembles, filtered by multi-waveband optical consistency and probability-density overlap with observed size spectra, thereby reducing inversion non-uniqueness and suppressing biases toward coarse-mode dominance and overly strong internal mixing.

The resulting constrained aerosol optical properties are propagated through radiative transfer modeling to quantify top-of-atmosphere and atmospheric forcing sensitivities to microphysical variability in industrial environments. Finally, the same observation-constrained absorption spectra are extended across 0.25-4 μm (with enhanced spectral resolution in methane-sensitive bands similar to TROPOMI) to diagnose wavelength-dependent aerosol-CH4 spectral coupling: we show that even when absolute SWIR absorption is modest, aerosol-induced transmittance perturbations can partially overlap CH4 absorption troughs and destabilize continuum/baseline fitting, such that broadband retrieval windows may accumulate small spectral mismatches into substantial interference. This behavior is further amplified by time-varying spectral slopes (e.g., non-stationary AAE), implying that fixed aerosol parameterizations are insufficient for robust CH4 retrieval correction in complex emission regions. We note that we have direct radiative forcings ranging from -4 to -33 W/m2, which at the lower end of the range may allow a way to bias-correct retrievals of CH4, while at the higher end of the range implies that any signals retrieved for CH4 are significantly caused by BC. Overall, this integrated approach provides a transferable pathway to simultaneously improve absorbing-aerosol forcing estimates and reduce aerosol-induced biases in satellite methane retrievals via band-optimized, aerosol-aware retrieval strategies.

How to cite: Guan, L., Cohen, J., Wang, S., TIwari, P., and Qin, K.: A Multi Constraint Absorbing Aerosol Microphysics and Optics Framework for Radiative Forcing Uncertainty and Methane Retrieval Biases in Industrial Regions, EGU General Assembly 2026, Vienna, Austria, 3–8 May 2026, EGU26-7230, https://doi.org/10.5194/egusphere-egu26-7230, 2026.

EGU26-7739 | ECS | Posters on site | AS3.14

Synergistic Retrieval of aerosol and surface properties from PACE polarimetric and spectrometric observations using GRASP algorithm  

Chong Li, Oleg Dubovik, Anin Puthukkudy, Anton Lopatin, Pavel Litvinov, Vanderlei Martins, David Fuertes, Juan Gómez López, Alejandro Gomez, Juan-Carlos Antuña-Sánchez, and Christian Matar

NASA's PACE (Plankton, Aerosol, Clouds, and ocean Ecosystem) mission was successfully launched on February 8, 2024. PACE provided coordinated complementary observations from three key instruments: HARP2, SPEXone and OCI. Both HARP2 and SPEXone are advanced multi-angular polarimeters that measure both the intensity and polarization of reflected solar light, providing high sensitivity to aerosol characteristics such as particle size, type, and absorption etc. OCI, on the other hand, is a hyperspectral radiometer designed to measure ocean color and atmospheric properties across the UV to SWIR, providing high resolution data for ocean and atmospheric applications.

This study exploits the complementarity of all three PACE instruments to develop advanced aerosol and surface synergy products using the GRASP algorithm. As a first step, we demonstrated the correctness and robustness of GRASP for each instrument individually by designing and implementing technical and methodological developments, including harmonization of data format, accuracy specifications of each instrument, selection of channels for spectrometric observations, corrections for gaseous absorption, etc. Validation of aerosol and surface properties retrievals from each sensor have shown encouraging performance, highlighting the strong potential of PACE/GRASP products for accurate aerosol and surface characterization.

Building on these results, we implemented a synergistic retrieval combining all 3 sensors to maximize information content and improve the retrieval coverage and accuracy. HARP2 provides up to 60 viewing angles at 4 wavelengths with two-day global coverage, its high information content is crucial for determining aerosol particle size and shape; SPEXone, provides continuous spectral measurements from 385 to 770 nm, which are particularly valuable for constraining aerosol absorption; OCI provides wide global coverage and broad spectral coverage from 340 to 890 nm continuously with discrete bands in the near-infrared. Synergy strategies were developed following the experience from the SYREMIS project, accounting for differences in information content and calibration accuracy among the instruments and weighting the measurements accordingly. Overall, the results demonstrate that combining measurements from all three PACE instruments significantly improves the retrieval of aerosol properties and surface BRDF compared to single-instrument approach.

How to cite: Li, C., Dubovik, O., Puthukkudy, A., Lopatin, A., Litvinov, P., Martins, V., Fuertes, D., Gómez López, J., Gomez, A., Antuña-Sánchez, J.-C., and Matar, C.: Synergistic Retrieval of aerosol and surface properties from PACE polarimetric and spectrometric observations using GRASP algorithm , EGU General Assembly 2026, Vienna, Austria, 3–8 May 2026, EGU26-7739, https://doi.org/10.5194/egusphere-egu26-7739, 2026.

EGU26-7893 | ECS | Posters on site | AS3.14

Quantification of aerosol type vertical profiles from real airborne multiwavelength lidar observations using the AEROTYPro/GRASP approach 

Fazzal Qayyum, Juan Cuesta, Abou Bakr Merdji, Anton Lopatin, Oleg Dubovik, Richard Ferrare, and Sharon P. Burton

Aerosols are solid and liquid particles present in the atmosphere and play a crucial role in atmospheric composition. They are emitted from natural sources, such as mineral dust, sea spray, biogenic emissions, and volcanic eruptions, as well as anthropogenic sources, including traffic, industrial processes, and biomass burning. The presence of aerosols in the atmosphere can have detrimental effects on air quality, and thereby, human health; however, accurately quantifying these effects remains challenging due to the complexity of the processes involved in the interaction between aerosols and clouds. To better understand and simplify the complexity of aerosol composition, it is necessary to discriminate them into distinct types.

Recent spaceborne lidar, called Cloud-Aerosol Lidar with Orthogonal Polarization (CALIOP) onboard the Cloud-Aerosol Lidar and Infrared Pathfinder Satellite Observations (CALIPSO) platform, provided profiles of qualitative identification of the main aerosol type on a global scale. To address these limitations and to provide more insights, we have developed an innovative retrieval approach called AEROTYPro/GRASP (Aerosol Type Profiling/Generalized Retrieval of Atmosphere and Surface Properties) to discriminate the fractions of five types, such as Smoke, Continental, Oceanic, Dust, and Urban Polluted, using three wavelengths (355 nm, 532 nm, and 1064 nm).

In this study, we apply the AEROTYPro/GRASP retrieval approach to discriminate the aerosol concentration vertical profiles for Smoke, Continental, Oceanic, Dust, and Urban polluted using the real airborne lidar measurements, such as backscatter, extinction, and depolarization, obtained from the second-generation NASA Langley Research Center (LaRC), High Spectral Resolution Lidar-2 (HSRL-2) lidar. In addition, the AEROTYPro/GRASP retrieval approach provides the bulk optical and microphysical properties, including aerosol optical depth, single scattering albedo, lidar ratio, absorbing aerosol optical depth, and effective radius. We further evaluated the retrieval approach on several airborne lidar flight transects.

How to cite: Qayyum, F., Cuesta, J., Merdji, A. B., Lopatin, A., Dubovik, O., Ferrare, R., and P. Burton, S.: Quantification of aerosol type vertical profiles from real airborne multiwavelength lidar observations using the AEROTYPro/GRASP approach, EGU General Assembly 2026, Vienna, Austria, 3–8 May 2026, EGU26-7893, https://doi.org/10.5194/egusphere-egu26-7893, 2026.

EGU26-8032 | ECS | Orals | AS3.14

Synergistic Retrieval of Aerosol Chemical Composition Profiles from Airborne Multiwavelength Lidar and Polarimeter Observations  

Abou Bakr Merdji, Juan Cuesta, Fazzal Qayyum, Anton Lopatin, Oleg Dubovik, Alaa Mhawish, Richard Ferrare, and Sharon Burton

Understanding the vertical distribution of aerosol chemical species is vital for assessing their impact on climate, air quality, and human health. Airborne measurements, providing high-resolution vertical profiles, capture local and regional variability, which is often missed by ground-based or satellite observations. Such measurements are essential for validating retrieval methodologies and improving chemistry–transport models. Specifically, airborne campaigns equipped with lidars and polarimeters offer unique observational constraints on aerosol optical, microphysical, and chemical properties, supporting the refinement of advanced retrieval algorithms.

In this context, we have developed a new synergistic approach for retrieving vertically resolved aerosol chemical species simultaneously present in the atmospheric column by jointly exploiting lidar and polarimeter measurements. This method, termed Aerosol Chemical Profiling (AEROCHEMPro) is implemented within the GRASP (Generalized Retrieval of Atmosphere and Surface Properties) inversion framework. While AEROCHEMPro has previously been evaluated using synthetic lidar–polarimeter observations, the present study reports its first application to real airborne measurements. The AEROCHEMPro retrieval exploits multispectral lidar capabilities to discriminate aerosol modes and their associated chemical composition: a fine mode containing black carbon, brown carbon, inorganic salts, and aerosol water content; a coarse desert dust mode composed of iron oxide and quartz; and a second coarse mode consisting of sea salt and aerosol water content. By providing a statistically optimized estimate within a continuous solution space, the method delivers detailed vertical distributions of aerosol species, strengthening the link between remote sensing observations and aerosol chemical composition. This capability is critical for understanding aerosol chemical evolution and for evaluating numerical simulations produced by chemistry–transport models.

In this work, the AEROCHEMPro methodology is applied to airborne measurements acquired by two advanced instruments operated onboard the same aircraft: the second-generation High Spectral Resolution Lidar-2 (HSRL-2) and the Research Scanning Polarimeter (RSP). HSRL-2 provides high-accuracy active remote sensing of aerosol at 3 wavelengths, with high-spectral and depolarization capabilities, while RSP, a passive multi-angular polarimeter, measures radiance and linear polarization across nine spectral bands from the visible/near-infrared to the shortwave infrared. The combined use of these complementary datasets demonstrates the capability of AEROCHEMPro to retrieve vertically resolved concentrations of multiple aerosol chemical species, as well as type-specific aerosol chemical, optical, and microphysical properties from airborne observations, highlighting its potential for broader application to future multi-sensor remote-sensing studies.

How to cite: Merdji, A. B., Cuesta, J., Qayyum, F., Lopatin, A., Dubovik, O., Mhawish, A., Ferrare, R., and Burton, S.: Synergistic Retrieval of Aerosol Chemical Composition Profiles from Airborne Multiwavelength Lidar and Polarimeter Observations , EGU General Assembly 2026, Vienna, Austria, 3–8 May 2026, EGU26-8032, https://doi.org/10.5194/egusphere-egu26-8032, 2026.

EGU26-8557 | ECS | Orals | AS3.14

Coarse-Mode Aerosols over Bright Surfaces: Challenges and Uncertainties 

Cheng Chen, Pavel Litvinov, Oleg Dubovik, Thomas F. Eck, Elena S. Lind, Gerrit de Leeuw, and Zhengqiang Li

Satellite remote sensing has greatly advanced our understanding of global aerosol distributions, yet substantial uncertainties persist over dryland regions where coarse-mode aerosols and bright heterogeneous surfaces remain particularly challenging for current retrieval algorithms. Validation frameworks that rely heavily on AERONET are spatially imbalanced, with drylands markedly underrepresented, leading to systematic biases and overly optimistic global performance assessments. Our analysis shows that disagreement between major satellite aerosol optical depth products is disproportionately concentrated in drylands with low Ångström Exponent values, highlighting coarse-mode dominant regions as a critical blind spot in global aerosol monitoring. We discuss key retrieval challenges and outline priorities for algorithm development, expanded observations, and stratified validation strategies to better constrain aerosol radiative effects and climate impacts over drylands.

How to cite: Chen, C., Litvinov, P., Dubovik, O., Eck, T. F., Lind, E. S., de Leeuw, G., and Li, Z.: Coarse-Mode Aerosols over Bright Surfaces: Challenges and Uncertainties, EGU General Assembly 2026, Vienna, Austria, 3–8 May 2026, EGU26-8557, https://doi.org/10.5194/egusphere-egu26-8557, 2026.

EGU26-9030 | Orals | AS3.14

Synergistic Multi-instrument Remote Sensing for Greenhouse Gas Monitoring 

Zhengqiang Li, Cheng Fan, Yuanyuan Gao, Yingqian Zhao, and Xu Liu

Greenhouse gases (CO₂ and CH₄) are key drivers of climate change, and the accuracy of their emission inventories directly determines the credibility of carbon-peaking and carbon-neutralization pathways. Traditional bottom-up methods suffer from coarse spatiotemporal resolution and often miss abrupt releases, urgently calling for multi-scale, high-timeliness observation-inversion systems. Focusing on CO₂ and CH₄, this study: (1) builds a payload-level end-to-end simulation platform for the DQ-2 wide-swath imager and BK-1 high-resolution point-source monitoring satellites to evaluate their capability to detect greenhouse-gas emission hotspots; (2) employs large-eddy simulation to generate high-fidelity plume scenarios over key regions and tests satellite monitoring performance; and (3) combines multi-sensor international data (TROPOMI, EMIT, etc.) with a Gaussian plume inversion model to estimate point-source emissions and compare them with inventory data. The results demonstrate that multi-sensor, multi-scale synergy can significantly reduce facility-level emission biases, providing timely and accurate emission information for China’s carbon-peaking actions.

How to cite: Li, Z., Fan, C., Gao, Y., Zhao, Y., and Liu, X.: Synergistic Multi-instrument Remote Sensing for Greenhouse Gas Monitoring, EGU General Assembly 2026, Vienna, Austria, 3–8 May 2026, EGU26-9030, https://doi.org/10.5194/egusphere-egu26-9030, 2026.

EGU26-9522 | Posters on site | AS3.14

Variability of aerosols over Changchun, Northeast China, based on new AERONET site observations 

Wei Han, Yuliia Yukhymchuk, Gennadi Milinevsky, and Peng Chen

We study the seasonal variability of aerosols over Changchun, Northeast China, using ground-based observations from the recently established AERONET Changchun_JLU site. A sun-lunar-sky photometer was installed in the city in October 2024. The seasonal variability of key aerosol optical properties, including aerosol optical depth and the Ångström exponent, is analyzed, along with the influence of extreme events such as biomass burning and mineral dust transport. Aerosol types are first examined using the traditional AOD–AE classification scheme, which is commonly applied for broad aerosol type identification. In addition, a more advanced aerosol classification is performed using a hybrid approach that combines clustering centroids derived from global AERONET data with a Nearest-Center Matching (NCM) algorithm. This method uses data on the Single Scattering Albedo at 440 nm and the Extinction Ångström Exponent at 440-870 nm. The analysis focuses on how aerosol types vary seasonally over Changchun and evaluates the effectiveness of the clustering-centroid combined with the NCM approach in a cold urban environment. The results highlight the influence of human activities, including residential heating, waste burning, and biomass burning, as well as regional transport processes, particularly mineral dust transport from the Taklamakan and Gobi deserts, on the seasonal distribution of aerosols.

How to cite: Han, W., Yukhymchuk, Y., Milinevsky, G., and Chen, P.: Variability of aerosols over Changchun, Northeast China, based on new AERONET site observations, EGU General Assembly 2026, Vienna, Austria, 3–8 May 2026, EGU26-9522, https://doi.org/10.5194/egusphere-egu26-9522, 2026.

EGU26-9623 | Posters on site | AS3.14

Aerosol profiling through bottom-to-top atmosphere from the synergetic observations of sun-sky photometer, spectrometer and lidar 

Masahiro Momoi, Anton Lopatin, Marie Stöckhardt, Elena Lind, Manuel Veloso, Dominika Szczepanik, Oleg Dubovik, Marcos Herreras-Giralda, Benjamin Torres, Tatyana Lapyonok, Axel Kreuter, Alexander Cede, Lucja Janicka, and Iwona Stachlewska

Aerosols play an important role in atmospheric chemistry and physics. They also negatively affect human and ecosystem health. Although the aerosol in lower atmosphere is essentially important, accurately characterizing their vertical distribution in the lower troposphere remains challenging due to the "overlap" limitations of ground-based lidars. Aerosol vertical distribution in the lower troposphere (below 3 km) is often monitored using MAX-DOAS (Multi-AXis Differential Optical Absorption Spectroscopy) technique of absorption induced by oxygen collision complex (O2O2). The missing Information about columnar aerosol properties is typically taken, with some simplification, from the closest AERONET sun-sky photometer measurements.

This study investigates the possibility of aerosol profile retrievals from synergetic ground-based observations by AERONET sun-sky photometer, Pandonia Global Network spectrometer and lidar/ceilometer system. We consider standard AERONET sun-sky photometer measurements at 440, 675, 870, and 1020 nm, as well as, available additional observations at 340, 380, 500, and 1640 nm.

We use GRASP (Generalized Retrieval of Atmosphere and Surface Properties, Dubovik et al., 2021) to implement the retrieval of vertical aerosol properties from multi-axis differential slant column densities of O2O2, lidar signal (i.e., ceilometer, EALINET, ADNET, etc.), and radiance measurements (almucantar/hybrid scanning). This presentation demonstrates the developed approach applied for several collocated sites (i.e., Rotterdam de Slufter, Warsaw, etc) and discusses potential advantages of retrieval of aerosol vertical profiles from synergy of the MAX-DOAS, AERONET, and lidar.


Reference:

Dubovik, O., D. Fuertes, P. Litvinov, et al., “A Comprehensive Description of Multi- Term LSM for Applying Multiple a Priori Constraints in Problems of Atmospheric Remote Sensing: GRASP Algorithm, Concept, and Applications”, Front. Remote Sens. 2:706851. doi: 10.3389/frsen.2021.706851, 2021.

How to cite: Momoi, M., Lopatin, A., Stöckhardt, M., Lind, E., Veloso, M., Szczepanik, D., Dubovik, O., Herreras-Giralda, M., Torres, B., Lapyonok, T., Kreuter, A., Cede, A., Janicka, L., and Stachlewska, I.: Aerosol profiling through bottom-to-top atmosphere from the synergetic observations of sun-sky photometer, spectrometer and lidar, EGU General Assembly 2026, Vienna, Austria, 3–8 May 2026, EGU26-9623, https://doi.org/10.5194/egusphere-egu26-9623, 2026.

EGU26-9644 | ECS | Orals | AS3.14

Dust storm events in Northeast China region by ground-based data and GEOS-Chem modeling 

Xuanyi Wei, Gennadi Milinevsky, and Yuliia Yukhymchuk

Northeast China is often affected by dust episodes, primarily driven by long-range transport from the Gobi and Taklamakan deserts. This study systematically investigates the behavior and impacts of dust aerosols over Northeast China from 2015 to 2025 through a multi-platform approach that integrates ground-based measurements (AERONET, SONET, and PM monitors), satellite observations ( VIIRS), and model simulations (GEOS-Chem and HYSPLIT). The region is divided into five sub-regions to analyze distinct spatial and seasonal patterns of dust distribution and transport pathways. Results reveal that dust transport markedly degrades air quality across the region, with the western part of Northeast China exhibiting the highest dust concentrations. During dust events, aerosol optical depth (AOD) notably increases while the Ångström exponent decreases, consistently indicating the dominance of coarse-mode particles. Cluster analysis effectively discriminates dust episodes from other aerosol types. Model simulations and back-trajectory analysis confirm the northwestern origin of dust and delineate major transport routes. This comprehensive assessment provides detailed insight into the regional dust dynamics and offers a scientific basis for refined air quality forecasting and management strategies in Northeast China.

How to cite: Wei, X., Milinevsky, G., and Yukhymchuk, Y.: Dust storm events in Northeast China region by ground-based data and GEOS-Chem modeling, EGU General Assembly 2026, Vienna, Austria, 3–8 May 2026, EGU26-9644, https://doi.org/10.5194/egusphere-egu26-9644, 2026.

EGU26-10594 | ECS | Posters on site | AS3.14

 Simultaneous Retrieval of Dust Mineralogy and Trace Gases from the Synergetic Observations in Solar and Thermal Infrared Spectral Bands using GRASP Algorithm 

Yuheng Zhang, Marcos Herreras-Giralda, Juan Cuesta, Maxim Eremenko, Clerance Gomes, Wushao Lin, Masahiro Momoi, Alejandro Gomez, and Oleg Dubovik

This study explores the synergetic combined retrieval of remote sensing measurements in the solar and thermal infrared (TIR) spectral ranges from ground based and satellite sensors to provide a simultaneous gas-aerosol retrieval and an extended characterization of dust mineralogical composition. The Generalized Retrieval of Atmosphere and Surface Properties (GRASP) (Dubovik et al., 2021) is employed to jointly retrieve basic aerosol properties and selected dust mineralogical indicators—specifically the quartz–clay contrast and iron oxide fraction—together with representative trace gases, including ozone and water vapor. The new approach exploits complementary satellite and ground-based measurements, using IASI (Infrared Atmospheric Sounding Interferometer) (Cuesta et al., 2015) for TIR and 3MI (Fougnie et al., 2018) for solar spectral band, together with ground-based data from CLIMAT TIR radiometer (Brogniez et al., 2003) and CIMEL sunphotometer. Synthetic retrieval tests are conducted for both TIR–solar measurement combinations, using data from ground-based and spaceborne observations. The synthetic analysis shows good consistency under realistic noise and uncertainty conditions, demonstrating the robustness of the proposed scheme. This integrated approach shows strong potential to improve synergistic dust–gas retrievals in the TIR by reducing the required retrieval a priori and improving the accuracy of the retrieved products.

References

Brogniez, G., Pietras, C., Legrand, M., Dubuisson, P., & Haeffelin, M. (2003). A high-accuracy multiwavelength radiometer for in situ measurements in the thermal infrared. Part II: Behavior in field experiments. Journal of Atmospheric and Oceanic Technology, 20(7), 1023-1033. https://doi.org/10.1175/1520-0426(2003)20<1023:AHMRFI>2.0.CO;2

Cuesta, J., Eremenko, M., Flamant, C., Dufour, G., Laurent, B., Bergametti, G., ... & Zhou, D. (2015). Three‐dimensional distribution of a major desert dust outbreak over East Asia in March 2008 derived from IASI satellite observations. Journal of Geophysical Research: Atmospheres, 120(14), 7099-7127. https://doi.org/10.1002/2014JD022406

Dubovik, O., Fuertes, D., Litvinov, P., Lopatin, A., Lapyonok, T., Doubovik, I., ... & Federspiel, C. (2021). A comprehensive description of multi-term LSM for applying multiple a priori constraints in problems of atmospheric remote sensing: GRASP algorithm, concept, and applications. Frontiers in Remote Sensing, 2, 706851. https://doi.org/10.3389/frsen.2021.706851, 2021

Fougnie, B., Marbach, T., Lacan, A., Lang, R., Schlüssel, P., Poli, G., ... & Couto, A. B. (2018). The multi-viewing multi-channel multi-polarisation imager–Overview of the 3MI polarimetric mission for aerosol and cloud characterization. Journal of Quantitative Spectroscopy and Radiative Transfer, 219, 23-32. https://doi.org/10.1016/j.jqsrt.2018.07.008

How to cite: Zhang, Y., Herreras-Giralda, M., Cuesta, J., Eremenko, M., Gomes, C., Lin, W., Momoi, M., Gomez, A., and Dubovik, O.:  Simultaneous Retrieval of Dust Mineralogy and Trace Gases from the Synergetic Observations in Solar and Thermal Infrared Spectral Bands using GRASP Algorithm, EGU General Assembly 2026, Vienna, Austria, 3–8 May 2026, EGU26-10594, https://doi.org/10.5194/egusphere-egu26-10594, 2026.

EGU26-10639 | ECS | Orals | AS3.14

Advances in China’s Ground-based Remote Sensing Vertical Profiling System 

Ziqiang Zhu, Fa Tao, Jiajia Mao, Hong Liang, Shuzhen Hu, Yaru Dai, Xinrui Yang, Chengli Ji, Haowen Luo, Peitao Zhao, Qiyun Guo, Peng Zhang, and Xuefen Zhang

The ground-based profiling observations are essential to improve the understanding of specific weather process. Continuous efforts have been made in China on the ground-based remote sensing vertical profiling system, which consists of five instruments: microwave radiometer, millimeter-wave cloud radar, Global Navigation Satellite System/Meteorology (GNSS/MET), wind profiling radar and aerosol lidar. As part of World Meteorological Organization (WMO) global basic observing network (GBON), this system can provide the detailed profiling information of temperature, water vapor, wind, hydrometeors and aerosols.

A wide range of products have been developed not only from each instrument itself but also the synthetic uses of multi-source observations. Cloud radar plays a key role in the identification of hydrometeors, precipitation and snowfall. Microwave radiometer brightness temperatures are used to retrieve the temperature and humidity profiles under the clear and cloudy atmosphere. Lidar can character the aerosols with their extinction coefficients, backscatter coefficients and depolarization ratio, which are useful to identify the particle size to distinguish different air pollution, such as haze and sandstorms. GNSS/MET can provide relatively reliable estimates of the integration of water vapor and its vertical distribution. Wind profiling radar can provide the wind estimates including the valuable vertical velocity of atmospheric motions. Besides, the multi-element observations are also utilized to generate the weather signal warning products, such as the precipitation potential and several kinds of indices. Some of these products, such as the radiometer temperature profiles, have also been assessed using the Global Climate Observing System (GCOS) Reference Upper-Air Network (GRUAN) dataset in Xilinhot, China.

The system is preferred to deploy at the operational in-situ sounding stations, generating the complementary datasets for the sparse temporal samplings of in-situ sounding observations. Owing to its high temporal and vertical spatial resolution, the relatively complete weather processes can be monitored for further analyses and research, such as the low-level jet stream, advection, precipitation, snowfall, etc. For instance, a heavy snowfall process in Beijing on February 20, 2024 and a hail process in Beijing on April 28, 2023 were well captured by this system.

Quality control is another essential part to support the better performances of this system. For example, the co-located sounding profiles are used to evaluate the data quality and equipment stability of microwave radiometer. To support the synthetic applications of the spaceborne and ground-based radiometers, an advanced doubling and adding radiative transfer model based on the discrete ordinate method is developed for integrated satellite-ground forward simulations, to avoid the systematic errors resulting from two different ground-based and spaceborne solvers. It can be used to perform the assessments on brightness temperature observations and analyze the potential connections between the upwelling and downwelling brightness temperature observations from the spaceborne and ground-based radiometers. In the future, the instrument calibration and the synthetic uses of their base products can be priorities, to improve and promote this new profiling system.

How to cite: Zhu, Z., Tao, F., Mao, J., Liang, H., Hu, S., Dai, Y., Yang, X., Ji, C., Luo, H., Zhao, P., Guo, Q., Zhang, P., and Zhang, X.: Advances in China’s Ground-based Remote Sensing Vertical Profiling System, EGU General Assembly 2026, Vienna, Austria, 3–8 May 2026, EGU26-10639, https://doi.org/10.5194/egusphere-egu26-10639, 2026.

EGU26-12101 | ECS | Posters on site | AS3.14

Unified Satellite Observation of Thermal Infrared-Absorbing Aerosol Composition 

Clerance Gomes, Juan Cuesta, Maxim Eremenko, Marcos Herreras, Yuheng Zhang, Masahiro Momoi, Alejandro Garcia, Wushao Lin, and Oleg Dubovik

Aerosol composition plays a key role in quantifying its impacts on climate and human health, as well as in understanding aerosol sources, transport, and evolution. Using the high spectral resolution of thermal infrared radiances measured by the spaceborne IASI sensor, the AEROIASI approach has been developed to quantify aerosol species that significantly absorb in the thermal infrared spectral domain (Cuesta et al., 2015; Guermazi et al., 2021; Kutzner et al., 2021). To date, this approach has been applied using dedicated configurations that allow the retrieval of only one aerosol species at a time. These species include desert dust, sulfuric acid, and ammonium sulfate.

In this work, we present a new unified retrieval framework capable of simultaneously quantifying these three aerosol species and their respective fractions when they coexist in the atmosphere. This is achieved by exploiting the Generalized Retrieval of Atmosphere and Surface Properties (GRASP) methodology (Dubovik et al., 2021), newly adapted to thermal infrared observations in the framework of the PANORAMA European Horizon 2020 project. The initial results establish a premise of the ability of the proposed approach to analyze mixed aerosol events over Europe using IASI measurements.

This GRASP-based method represents a first step toward a multispectral synergistic retrieval exploiting IASI-like thermal infrared measurements from IASI-NG together with observations from the multi-angular polarimeter 3MI, both onboard the MetOp-SG satellite since 2025. Such synergism is expected to significantly enhance aerosol speciation capabilities, including the characterization of fine-mode aerosol species primarily constrained by polarimetric measurements.

How to cite: Gomes, C., Cuesta, J., Eremenko, M., Herreras, M., Zhang, Y., Momoi, M., Garcia, A., Lin, W., and Dubovik, O.: Unified Satellite Observation of Thermal Infrared-Absorbing Aerosol Composition, EGU General Assembly 2026, Vienna, Austria, 3–8 May 2026, EGU26-12101, https://doi.org/10.5194/egusphere-egu26-12101, 2026.

EGU26-12308 | ECS | Orals | AS3.14

TANGO and the Synergistic Exploitation of Data using Polarimetric Observations 

Peter Sterk, Sha Lu, Otto Hasekamp, Raul Laasner, Tobias Borsdorff, and Jochen Landgraf

TANGO (Twin Anthropogenic Greenhouse gas Observers) is a CubeSat mission within the ESA SCOUT programme, scheduled for launch in 2028. The mission comprises two CubeSats flying in close formation—TANGO-Carbon and TANGO-Nitro. TANGO-Carbon is dedicated to quantifying anthropogenic greenhouse gas emissions of carbon dioxide (CO₂) and methane (CH₄), whereas TANGO-Nitro performs measurements of nitrogen dioxide (NO₂) to support the detection and delineation of emission plumes. Owing to highly agile attitude control and a ground sampling distance of approximately 300 × 300 m², the satellites are capable of resolving and characterizing individual emission sources. The TANGO mission will retrieve the dry-air column-averaged mole fractions of carbon dioxide (XCO₂) and methane (XCH₄) using the proxy retrieval methodology described in Frankenberg (2005). In this approach, a known column abundance of a proxy gas species (e.g. CH₄) is used to infer the total light-path modification, which is subsequently employed to correct a non-scattering retrieval of the mixing ratio of the target gas (e.g. CO₂). The primary scientific objective of TANGO is the accurate quantification of emissions in situations where the proxy gas is not co-emitted with the target gas, a condition that is characteristic of most anthropogenic emissions from the energy sector.


In the present study, we assess the feasibility of implementing a full-physics retrieval framework that synergistically combines TANGO observations with collocated aerosol measurements, with the objective of disentangling and independently constraining the information content on CO₂ and CH₄ for optimized data exploitation. Specifically, we analyse a sequential data-processing strategy in which aerosol properties are first retrieved from measurements of a multi-angle polarimeter and then assimilated as prior information into a TANGO full-physics retrieval scheme. The TANGO satellites will exhibit overlapping spatial coverage with the 3MI instrument onboard MetOp-SG and with CO2M. The nominal local overpass times are 09:30 for 3MI, 11:00 for TANGO, and 12:00 for CO2M, providing aerosol observations with an approximate one-hour temporal offset relative to TANGO. This orbital configuration enables synergistic exploitation of data from the three missions. Although CO2M and 3MI provide measurements at a substantially coarser spatial resolution of approximately 4 km², the proposed sequential approach is expected to yield aerosol constraints of sufficient accuracy to mitigate aerosol-induced errors in TANGO data products. Furthermore, the synergy among the missions has the potential to lower the detection limits of all three systems by improving the precision of XCH₄ and XCO₂ retrievals and may facilitate observations over complex source regions with mixed emission types, such as large industrial agglomerations. To demonstrate the viability of the proposed approach, we will quantify the performance gains for the TANGO products in the joint retrieval of CO₂, CH₄, and aerosol properties from collocated CO2M and TANGO observations for individual overpasses over TANGO target areas, explicitly accounting for the differing spatial resolutions of the two missions.

How to cite: Sterk, P., Lu, S., Hasekamp, O., Laasner, R., Borsdorff, T., and Landgraf, J.: TANGO and the Synergistic Exploitation of Data using Polarimetric Observations, EGU General Assembly 2026, Vienna, Austria, 3–8 May 2026, EGU26-12308, https://doi.org/10.5194/egusphere-egu26-12308, 2026.

EGU26-12442 | Orals | AS3.14

Community Tool Development for Tables of Aerosol and Cloud Optics 

Yevgeny Derimian, Gregory Schuster, Fabrice Ducos, Philippe Lesueur, Susan Mathai, and Masanori Saito

This project develops a relational database and interactive web system to organize and share aerosol and cloud optical and microphysical data from the Tables of Aerosol and Cloud Optics (TACO) that is part of the MIRA working group. The TACO project is an extension of historical efforts (e.g., Shettle and Fenn, 1979; d’Almeida et al., 1991; Koepke et al., 1997; Hess et al., 1998) on providing libraries of aerosol and cloud characteristics for applications in global chemical transport modeling and remote sensing. The optical and microphysical properties of aerosols and clouds are classified according to their origin, type, geographic region, wavelengths set etc. The combination of these characteristics, along with anticipated evolution, the open access and interactive principles of TACO, suggests that the data set structure becomes increasingly complex. We therefore suggest using specialized computer science techniques for the TACO data organization and management. To this end, we employ the relational database that consists in the data structuring in multiple tables with indexation relating the entities and their values in unique or multiple connections. The project will enable uploading the TACO data into the format of relational database and creation of a web interface for an efficient and interactive communication with the community. The presentation is expected to gather valuable feedback from modelers, in-situ and remote sensing experts on the data needs, exchange formats and potential applications.

How to cite: Derimian, Y., Schuster, G., Ducos, F., Lesueur, P., Mathai, S., and Saito, M.: Community Tool Development for Tables of Aerosol and Cloud Optics, EGU General Assembly 2026, Vienna, Austria, 3–8 May 2026, EGU26-12442, https://doi.org/10.5194/egusphere-egu26-12442, 2026.

EGU26-13100 | Orals | AS3.14

OMI, TROPOMI, and EarthCare: data synergy to further characterize global trends, transport pathways, and radiative impacts of UV-absorbing aerosols  

Deborah Claire Stein Zweers, Martin de Graaf, Annabel Chantry, Maarten Sneep, Gerd-Jan van Zadelhoff, and Emiel van der Plas

The instruments on board the EarthCARE mission reveal the vertical structure of complex aerosol and cloud layers in stunning detail and are lending new insights for better characterization of both composition and the radiative impact of aerosol plumes. The Tropospheric Monitoring Instrument (TROPOMI) on board ESA’s Sentinel 5-Precursor (S5P) satellite has, since its launch in 2017, delivered the highest spatial resolution of daily global measurements for a suite of trace gases together with information about the presence and height of UV-absorbing aerosols at 3.5 x 5 km. This work primarily utilizes the Aerosol Index (AER_AI) data which is well-suited to provide information about the horizontal extent ultraviolet (UV) absorbing aerosol plumes including desert dust, biomass burning smoke, and volcanic ash. Together with its predecessor the Ozone Monitoring Instrument (OMI), the readily combined OMI-TROPOMI AER_AI datasets provide an invaluable temporal extension to the 7-year TROPOMI data record extending back more than twenty-one years covering 2004 to present. Despite a lower spatial resolution (13 x 24 km), OMI data linked with TROPOMI provides valuable information about seasonal and interannual cycling of global and regional amounts of UV-absorbing aerosols, particularly those arising from desert dust and biomass burning smoke emission. In this work we present the OMI-TROPOMI data record as well as some case study examples with collocated EarthCARE vertical cross sections. The case studies focus on known global aerosol emission and plume transport regions including Saharan dust outflow over the Atlantic and biomass burning smoke over southern hemispheric ocean basins as zoom-in examples of how well the ATLID derived EarthCARE data about aerosol optical properties can be applied to the horizontal plume extent as identified by OMI and TROPOMI. Lastly, the recently improved Aerosol Height Layer (AER_LH) data from TROPOMI will be shown in conjunction over these regions of interest to test the synergetic added-value of applying EarthCARE identified optical properties and layer height information to the OMI-TROPOMI UV Absorbing Aerosol Index data. Finally, a brief summary will be given to show how TROPOMI aerosol data fits together with the planned data products from recently launched Sentinel-4 and Sentinel-5 missions.

How to cite: Stein Zweers, D. C., de Graaf, M., Chantry, A., Sneep, M., van Zadelhoff, G.-J., and van der Plas, E.: OMI, TROPOMI, and EarthCare: data synergy to further characterize global trends, transport pathways, and radiative impacts of UV-absorbing aerosols , EGU General Assembly 2026, Vienna, Austria, 3–8 May 2026, EGU26-13100, https://doi.org/10.5194/egusphere-egu26-13100, 2026.

EGU26-13421 | ECS | Posters on site | AS3.14

Optimal use of AERONET measurements in UV-SWIR for the development and validation of satellite aerosol products 

Manuel Veloso Varela, Benjamin Torres, Masahiro Momoi, Christian Matar, Oleg Dubovik, David Fuertes, Philippe Goloub, Anton Lopatin, Elena Lind, Carlos Toledano, Ilya Slutsker, and Sohelia Jafariserajehlou

This study focuses on the use of state-of-the-art ground-based Earth observation measurements, primarily from the AERONET network, to support the development and validation of new aerosol retrieval approaches for current and future multi-platform satellite missions operated by EUMETSAT and Copernicus, such as EPS-SG (Metop-SG), Sentinel-3, Sentinel-5P, CO2M, the geostationary MTG, etc. These missions provide complementary photometric, polarimetric and spectrometric observations covering a broad spectral range from the ultraviolet (UV) to the short-wave infrared (SWIR) and thermal infrared (TIR).


A central objective of this work is to extend AERONET-based aerosol retrievals beyond their standard operational spectral range (440–1020 nm) towards both the UV and the SWIR. Recent developments allow the use of measurements from 340 nm in the UV to 1640 nm, and potentially up to 2200 nm, enabling a more consistent validation of satellite aerosol products across the full spectral domain. Many AERONET sites already provide long-term observations at 380–1640 nm, and a subset also includes measurements at 340 nm, forming a unique reference dataset for this purpose. AERONET-like retrievals at these extended wavelengths enable the evaluation of satellite-derived aerosol properties such as spectral refractive index, single-scattering albedo and size distributions, including fine-mode and super-coarse particles. These products are also essential for improving the treatment of aerosols in trace- and greenhouse- gases retrievals (e.g. NO₂ from UV,  CO₂ and CH₄ from SWIR).


The study presents the first aerosol inversions performed with the GRASP algorithm using this extended spectral range and describes the associated processing chain, including aerosol optical depth (AOD) and sky-radiance preparation, surface reflectance treatment, and inversion metadata. The preliminary results on the data collected at Rotterdam de Slufter during CINDI-3 campaign shows the good agreement in the data preparation and the inversion results derived from developed processing chain with the one from AERONET. This study found the importance of the treatment of the instrumental features such as spectral filter response. The results demonstrate the potential of long-term multi-spectral AERONET observations to strengthen the validation and development of next-generation satellite aerosol and trace- and greenhouse-gas retrievals.

How to cite: Veloso Varela, M., Torres, B., Momoi, M., Matar, C., Dubovik, O., Fuertes, D., Goloub, P., Lopatin, A., Lind, E., Toledano, C., Slutsker, I., and Jafariserajehlou, S.: Optimal use of AERONET measurements in UV-SWIR for the development and validation of satellite aerosol products, EGU General Assembly 2026, Vienna, Austria, 3–8 May 2026, EGU26-13421, https://doi.org/10.5194/egusphere-egu26-13421, 2026.

EGU26-13678 | ECS | Posters on site | AS3.14

 Optical and Compositional Biases in ECMWF/CAMS and POLDER/GRASP: Lessons from Aerosol Products Comparison  

Abhinna Behera, Pavel Litvinov, Milagros Herrera, Liudmyla Berdina, Oleg Dubovik, Christian Matar, Tatyana Lapyonok, Fabrice Ducos, David Fuertes, and Victor Tishkovets

As the MODIS era concludes, new missions like 3MI/EPS-SG and PACE/NASA are now delivering extensive multi-angular, multi-viewing polarimetric data on aerosols. This shift necessitates an evolution in chemistry-transport models (CTMs). Specifically, the successful assimilation of sophisticated aerosol optical properties into the European Centre for Medium-Range Weather Forecasts (ECMWF) CAMS model depends on precise microphysical definitions. This study addresses the existing microphysical inconsistencies that currently prevent the seamless assimilation of remote sensing observations into CTMs.

We compare two generations of the CAMS model using observations from 2008. The first is the Cy42R1 Reanalysis, which incorporates MODIS Aerosol Optical Depth (AOD) at 550 nm through assimilation. The second is the Cy49R2 Forecast, an unconstrained forward simulation. Our analysis uses aerosol properties retrieved from both POLDER measurements and AERONET ground-based data, employing the GRASP algorithm. To ensure a consistent and fair comparison with CAMS assumptions, we adopt a chemical component approach. This involves decomposing the total aerosol loading into its specific components—Black Carbon (BC), Organic Matter (OM), Dust (DU), Sulphate (SU), and Sea Salt (SS)—and fixing their refractive indices and size parameters during the retrieval process.

The CAMS model consistently underestimates AOD compared to both POLDER/GRASP and AERONET, a negative bias present in both its reanalysis and forecast products. Analysis of the Ångström Exponent indicates that the model frequently miscategorizes fine and coarse mode particles. This confusion results in a significant negative bias in CAMS's coarse mode AOD. Additionally, the Single Scattering Albedo (SSA) in CAMS lacks the spectral and spatial variability evident in the POLDER/GRASP retrievals. Further analysis reveals that optical discrepancies in the model's performance are rooted in chemical component-specific errors. The model significantly underrepresents the total column volume concentrations of fine-mode aerosols, especially BC and OM. Furthermore, modeled volume concentrations of SU and SS are negligibly low compared to observational data. For DU, a distinct shift in model strategy is apparent: the older Cy42R1 version underestimates DU volume concentration, while the newer Cy49R2 overestimates it, indicating a transition towards modeling coarser particle emissions. Validation against AERONET data confirms that POLDER/GRASP retrievals offer a reliable benchmark for these comparative assessments.

Current CTMs and retrieval algorithms evidently operate under differing microphysical assumptions. This strongly implies underlying inaccuracies in the assumed aerosol size distributions and refractive indices within these models. The improved DU representation in Cy49R2 is a step forward, but the persistent underestimation of other components limits the model's application for radiative forcing calculations. The subsequent essential step involves harmonization. It is necessary that ECMWF update CAMS aerosol microphysics to incorporate effective radii, size distribution, and refractive indices consistent with state-of-the-art polarimetric retrievals. Establishing a unified definition for aerosol components will enable the next generation of CAMS reanalysis to effectively assimilate data from 3MI and PACE, consequently mitigating uncertainties in global aerosol forcing.

How to cite: Behera, A., Litvinov, P., Herrera, M., Berdina, L., Dubovik, O., Matar, C., Lapyonok, T., Ducos, F., Fuertes, D., and Tishkovets, V.:  Optical and Compositional Biases in ECMWF/CAMS and POLDER/GRASP: Lessons from Aerosol Products Comparison , EGU General Assembly 2026, Vienna, Austria, 3–8 May 2026, EGU26-13678, https://doi.org/10.5194/egusphere-egu26-13678, 2026.

EGU26-14291 | Orals | AS3.14

Multi-Mission Synergetic Retrieval for Enhanced Aerosol and Surface Characterization: Physical Basis and Concept 

Pavel Litvinov, Siyao Zhai, Oleg Dubovik, Cheng Chen, Christian Matar, Smita Panda, Chong Li, Anton Lopatin, David Fuertes, Tatsiana Lapionak, Manuel Dornacher, Arthur Lehner, Christian Retscher, Silvia Scifoni, and Philippe Goryl

Atmospheric aerosols have strong impact on climate, environment, and health. To account correctly for such impact, extended aerosol characterization, including spectral Aerosol Optical Depth (AOD), Angstrom Exponent (AE), spectral Single Scattering Albedo (SSA) etc., are required to be derived globally from space-borne observations. Together with the aerosol, the Earth’s surfaces are an important component of climate system, reflecting and absorbing solar and atmospheric radiation and being sources of emission of different natural aerosol, for example, sea-salt, mineral dust or organic aerosol.

The global information about aerosol and surfaces can be obtained from space-borne measurements only. At present time there are a number of different satellites on Earth orbit dedicated to aerosol and surface studies. Nevertheless, the role of space-borne measurements is essentially limited by satellite swath and instrument information content. In general, no single instrument satisfies all requirements which are necessary for global, high-temporal extended aerosol and surface characterization. One of the promising solutions of this problem originates from the idea of the synergetic aerosol and surface characterization from multi-mission instruments. Since a long time, the realization of this idea has always been related to number of instrumental and algorithmic problems.

In the frame of ESA GROSAT and SYREMIS projects, the synergetic approach was implemented in GRASP algorithm in different synergetic instrument constellations: (i) synergy of satellite and ground-based measurements (GROSAT/GRASP synergy); (ii) synergy of Low Earth polar-Orbiting (LEO+LEO), and (iii) LEO and geostationary (LEO+GEO) satellites. On one hand such synergy constellations extend the spectral range of the measurements. On another hand they provide unprecedented global spatial coverage with several measurements per day which is crucial for global climate studies and air-quality monitoring.

In the GROSAT/GRASP approach, both ground-based (AERONET) and satellite measurements are merged together, and then the synergetic aerosol and surface retrieval is performed on the combined measurements. The main information about aerosol in such synergy comes from AERONET direct sun and diffuse sky-radiance measurements, whereas the information about surface reflection properties originates from satellite observations. The GROSAT/GRASP approach is generalized in such a robust way that it can be applied to any AERONET + Satellite combination. In this regard, it can be used for surface reference generation at any spatial resolution and at any spectral channels measured by satellites in worldwide locations.

The SYREMIS/GRASP LEO+LEO synergy was globally evaluated on Sentinel-5p/TROPOMI, Sentinel-3A, -3B/OLCI instruments. The LEO+GEO synergy was extended with HIMAWARI/AHI sensors. In such synergy the information from the instruments with richest information content transfer to the instruments with lower one. In combination with and proper constraining spectral, spatial and temporal aerosol/surface variability, this results in increased performance of AOD, aerosol size and absorption properties retrieval and more consistent surface BRDF characterization.

In this talk we will discuss physical basis and main principle of passive multi-sensor synergy for advancing aerosol and surface characterisation, which can be applied to diverse synergetic satellite constellations. 

How to cite: Litvinov, P., Zhai, S., Dubovik, O., Chen, C., Matar, C., Panda, S., Li, C., Lopatin, A., Fuertes, D., Lapionak, T., Dornacher, M., Lehner, A., Retscher, C., Scifoni, S., and Goryl, P.: Multi-Mission Synergetic Retrieval for Enhanced Aerosol and Surface Characterization: Physical Basis and Concept, EGU General Assembly 2026, Vienna, Austria, 3–8 May 2026, EGU26-14291, https://doi.org/10.5194/egusphere-egu26-14291, 2026.

Satellite remote sensing provides powerful constraints on atmospheric composition and emissions, yet traditional inversions often rely on single species or instruments and offer limited insight into sector-specific contributions, activity rates, and emission factors needed to inform bottom-up inventories. Here, we develop a sector-based 4D-Var inversion framework that exploits the synergy of multi-instrument, multi-constituent satellite observations to improve atmospheric characterization and emission attribution. By jointly assimilating NO2, SO2, and CO observations and leveraging their distinct emission ratios, the framework disentangles contributions from major source sectors, including transportation, industry, residential, aviation, shipping, energy production, biomass burning, soil, and lightning. We assimilate TEMPO NO2, TROPOMI NO2 and SO2, and MOPITT CO observations into the GEOS-Chem adjoint model at 0.25° × 0.3125° resolution over North America. Differences between observations and simulations drive the inversion to optimize sectoral activity rates. Our results reveal large adjustments in lightning and soil NOx, emphasizing the increasing importance of accurately characterizing background NO2 to improve air quality simulations. The inversion identifies the transportation sector as the primary contributor to emission adjustments, with top-down transportation emissions 30-60% higher than those in the bottom-up EQUATES inventory along coastal regions and in major urban centers, including Los Angeles, San Francisco, Seattle, Portland, Boston, New York City, and Chicago. These results suggest that recent reductions in transportation emissions may be overestimated in the bottom-up inventory. While TROPOMI and TEMPO NO2 observations provide consistent constraints on anthropogenic emissions, larger discrepancies are found for natural NOₓ sources, underscoring the importance of synergistic observations for characterizing background atmospheric composition. The framework also enables estimation of sectoral CO2 emissions using air pollutant observations, extending beyond traditional NOₓ-proxy approaches by capturing industrial and residential emission adjustments through combined SO2 and CO constraints.

How to cite: Qu, Z.: A sector-based inversion synergizing NO2, SO2, and CO observations to improve sectoral activity rates and anthropogenic CO2 emissions, EGU General Assembly 2026, Vienna, Austria, 3–8 May 2026, EGU26-14371, https://doi.org/10.5194/egusphere-egu26-14371, 2026.

EGU26-14777 | ECS | Posters on site | AS3.14

GROSAT-GLOB: Synergetic Ground-Based and Satellite Retrievals for Global Surface Characterization and Validation 

Smita Panda, Pavel Litvinov, Christian Matar, Siyao Zhai, Juan Gómez, Zhen Liu, Juan Carlos Antuña-Sánchez, Anton Lopatin, David Fuertes, Oleg Dubovik, Tatsiana Lapionak, Benjamin Torres, Christian Retscher, Silvia Scifoni, and Philippe Goryl

Accurate characterization of land surface reflectance remains a fundamental challenge in satellite remote sensing, particularly over heterogeneous and bright surfaces where surface and atmospheric contributions are strongly coupled. Ground-based AERONET direct-sun and sky-radiance observations provide robust constraints on aerosol optical and microphysical properties, while satellite measurements provide spatially resolved information on surface reflection. In the GROSAT-GLOB approach, these complementary measurement types are combined to enable a more reliable separation of surface and atmospheric signals for surface characterization.

The GROSAT-GLOB approach implements a synergetic retrieval framework based on the GRASP inversion algorithm, integrating ground-based AERONET observations with collocated satellite radiance measurements. Aerosol optical and microphysical properties are primarily constrained by AERONET direct-sun and sky-radiance data, while satellite observations are used to retrieve surface reflectance. To ensure robustness and computational efficiency at the global scale, a two-step retrieval strategy is employed: aerosol microphysical properties are first retrieved by combining spatially aggregated (10–30 km) satellite observations with temporally collocated AERONET almucantar and direct-sun measurements, and are subsequently introduced as constrained a priori information to retrieve surface reflectance at the native satellite resolution using satellite radiances and direct-sun AOD measurements only.

The GROSAT-GLOB retrieval framework has been applied to multiple satellite sensors, including Sentinel-3 OLCI-A/B, Sentinel-5P/TROPOMI, PACE/HARP2, and MTG-FCI, demonstrating its general applicability across instruments with differing spatial resolutions, spectral coverage, and viewing geometries. The retrieved surface reflectance products are validated against independent reference datasets, including MODIS white-sky albedo, HYPERNET reflectance, and RadCalNet bottom-of-atmosphere reflectance, while aerosol retrievals are assessed against AERONET products. These intercomparisons provide a quantitative assessment of retrieval consistency and stability, supporting the use of GROSAT-GLOB products as a surface reference dataset for cross-sensor harmonization and satellite surface reflectance validation.

How to cite: Panda, S., Litvinov, P., Matar, C., Zhai, S., Gómez, J., Liu, Z., Antuña-Sánchez, J. C., Lopatin, A., Fuertes, D., Dubovik, O., Lapionak, T., Torres, B., Retscher, C., Scifoni, S., and Goryl, P.: GROSAT-GLOB: Synergetic Ground-Based and Satellite Retrievals for Global Surface Characterization and Validation, EGU General Assembly 2026, Vienna, Austria, 3–8 May 2026, EGU26-14777, https://doi.org/10.5194/egusphere-egu26-14777, 2026.

EGU26-15063 | Orals | AS3.14

Aerosol optical properties and composition retrieved from NASA PACE polarimetric measurements using FastMAPOL algorithm 

Kamal Aryal, Meng Gao, Pengwang Zhai, Bryan Franz, Kirk Knobelspiesse, Jeremy Werdell, Vanderlei Martins, and Otto Hasekamp

NASA’s Plankton, Aerosol, Cloud, ocean Ecosystem (PACE) mission, launched in February 2024, carries two multiangle polarimeters (MAPs): the UMBC Hyper-Angular Rainbow Polarimeter (HARP2) and SRON Spectropolarimeter for Planetary Exploration One (SPEXone). The two instruments provide complementary measurement capabilities, with HARP2 observing a wide swath at many viewing angles and four key wavelengths, while SPEXone collects hyperspectral data over a wider spectral range including UV wavelengths, but for a narrow swath at five key viewing geometries. Synergistic MAP measurements with rich information on aerosol microphysics provide unprecedented opportunities to advance aerosol studies and access their impacts on global climate.

The first part of this presentation will include overview of the operational aerosol retrievals over global ocean from PACE MAP measurements using FastMAPOL (Fast Multi-Angular Polarimetric Ocean color) joint retrieval algorithm highlighting several aspects of global aerosol distribution for the first two years of PACE launch. The second part will include the results from the research version of FastMAPOL with improved aerosol representation based on aerosol components called FastMAPOL/component. The representation includes Black Carbon, Brown carbon, non-absorbing insoluble and non-absorbing soluble in the fine mode and Sea Salt and non-spherical dust are in the coarse mode. The aerosol components with known size distribution and refractive index spectra are mixed externally with retrievable volume fraction of each component along with total aerosol loadings. The retrieval algorithm can be applied to measurements in several configurations of MAPs such as HARP2-only, SPEXone-only, and combined HARP2+SPEXone observations. Several validation and cross comparison results will be discussed:

  • Retrieved aerosol optical properties validated against the measurements from several AERONET-OC stations across the globe.
  • The qualitative verification of aerosol components retrieved in biomass burning, desert dust, and industrial aerosol dominated regions and their intercomparison with the Modern-Era Retrospective Analysis for Research and Applications, version 2 (MERRA-2) assimilated aerosol components.
  • Case studies including aerosol components retrieved in the vicinity of Los Angeles wildfire and volcano Gubbi in the Ethiopia's Afar region.
  • Cross comparisons of the wind speed retrievals with MERRA-2 reanalysis data.

References:

  • Gao, M., Franz, B. A., Zhai, P. W., Knobelspiesse, K., Sayer, A. M., Xu, X., ... & Werdell, P. J. (2023). Simultaneous retrieval of aerosol and ocean properties from PACE HARP2 with uncertainty assessment using cascading neural network radiative transfer models. Atmospheric Measurement Techniques16(23), 5863-5881.
  • Aryal, K., Zhai, P. W., Gao, M., Franz, B. A., Knobelspiesse, K., & Hu, Y. (2024). Machine learning based aerosol and ocean color joint retrieval algorithm for multiangle polarimeters over coastal waters. Optics Express32(17), 29921-29942.

How to cite: Aryal, K., Gao, M., Zhai, P., Franz, B., Knobelspiesse, K., Werdell, J., Martins, V., and Hasekamp, O.: Aerosol optical properties and composition retrieved from NASA PACE polarimetric measurements using FastMAPOL algorithm, EGU General Assembly 2026, Vienna, Austria, 3–8 May 2026, EGU26-15063, https://doi.org/10.5194/egusphere-egu26-15063, 2026.

EGU26-16314 | ECS | Posters on site | AS3.14

A Synergistic Framework for Black Carbon Emission Estimation via Satellite–Ground Retrievals and Particle-Conserving Methods 

Jian Liu, Jason Cohen, Steve Yim, and Kai Qin

We present a two-step framework for estimating black carbon (BC) emissions by integrating satellite remote sensing, ground-based observations, and physically grounded algorithms. First, BC mass and number column densities are retrieved using OMI satellite and AERONET sun photometer data, based on a Mie theory–driven core–shell model that accounts for particle microphysics. This integration of complementary platforms improves the sensitivity and spatial coverage of retrievals. Second, BC emissions are estimated from the retrieved columns using both mass- and number-conservative methods, allowing comparison of results under different assumptions about particle behavior and size distribution.

Applied over South, Southeast, and East Asia in 2016, the framework reveals emissions in regions such as Myanmar, Laos, northern Thailand, and Vietnam that exceed reported values in current inventories (e.g., FINN and EDGAR-HTAP) by more than an order of magnitude during high-intensity events. These emissions, concentrated between March and May, suggest a longer biomass burning season than typically captured by satellite NO2 observations. Day-to-day estimates show substantial temporal variability, with emission uncertainties reaching up to 82% using the mass-conservative method and 75% using the number-based approach. Notably, the number-conservative method yields 20–43% higher emissions in biomass burning and urban areas, highlighting the limitations of mass-only assumptions that do not account for particle number sensitivity.

This framework also enables comparison between different emission estimation strategies, and reveals structural discrepancies linked to underlying particle representations. The number-based approach may offer a more complete picture of episodic BC emissions, especially in regions with high particle number concentrations or coarse assumptions in current inventories. While this study focuses on 2016 events, the methodology is flexible and compatible with upcoming satellite missions such as EarthCARE, supporting potential extensions to finer spatiotemporal scales. By embedding particle-level physics into a multi-instrument observational framework, this approach contributes to improved BC emission estimates in data-sparse and dynamic environments, providing a practical alternative to bottom-up inventories under high-impact conditions.

How to cite: Liu, J., Cohen, J., Yim, S., and Qin, K.: A Synergistic Framework for Black Carbon Emission Estimation via Satellite–Ground Retrievals and Particle-Conserving Methods, EGU General Assembly 2026, Vienna, Austria, 3–8 May 2026, EGU26-16314, https://doi.org/10.5194/egusphere-egu26-16314, 2026.

This work presents a new integrated framework that uses multi-scale observations to constrain the microphysics, emissions, and radiative forcing of black carbon (BC). It demonstrates that BC's climate impact is far more complex, variable, and non-linear than the common assumption of a uniformly absorbing, always-warming aerosol. The framework employs a physically consistent perspective, tracking BC from emission as a particle size distribution, through atmospheric processing and mixing with co-pollutants, to its ultimate radiative interaction and removal.

We first show that realistic emission size distributions and evolving particle mixing states - driven by in-situ and column observations - frequently cause substantial non-linear variations in key optical properties (single scatter albedo and asymmetry parameter). These variations are more complex than Ångström-exponent-based approaches can capture. Second, we use multi-wavelength observations of aerosol optical depth (AOD) and aerosol absorption optical depth (AAOD) to constrain atmospheric column number loadings, total BC mass, and associated scattering aerosol mass. This yields high-resolution minute-scale results in selected areas, daily regional analyses at 5-kilometer scale, and global daily perspectives at 50-kilometer scale, using a suite of remotely sensed products (e.g., AERONET, OMI, TROPOMI, MODIS).

These observationally constrained solutions are used to explore impacts on radiative forcing at the top of the atmosphere (TOA) and within the atmosphere (ATM), effects on greenhouse gas retrievals, and improvements to BC emission source attribution. Analyses span global environments from moderate to extreme pollution, including urban, industrial, fire, and long-range transport scenarios.

Key findings summarize that: (1) BC radiative forcing depends nonlinearly on both per-particle properties and total column loading; (2) while emissions are dominant, particle aging often plays a substantial role over wider areas; (3) BC frequently exerts a net cooling effect at TOA, contradicting most climate models, though it can switch to warming over other areas; (4) BC's atmospheric heating and surface cooling are generally larger than models account for, and can exceed those of CO₂ and CH₄ in heavily industrial areas, implying greater importance for both local and global climate mitigation; (5) significant BC emission sources are missing in space and time from current inventories; (6) global and regional BC atmospheric loadings are often misestimated by models and reanalyses, suggesting a substantial free tropospheric reservoir and highlighting non-linear in-situ processing not captured by current parameterizations; and (7) BC absorption sometimes has a substantial impact on existing satellite retrievals of CH4 and CO2, calling into question how existing methods separate these when and where they are co-emitted.

How to cite: Cohen, J., Tiwari, P., Liu, Z., Guan, L., Wang, S., and Liu, J.: An Integrated Framework Using Observationally Constrained Black Carbon Microphysics, Emissions, and Radiative Forcing: From Regional to Global Perspectives, EGU General Assembly 2026, Vienna, Austria, 3–8 May 2026, EGU26-16514, https://doi.org/10.5194/egusphere-egu26-16514, 2026.

EGU26-17068 | Orals | AS3.14

Revealing the three-dimensional structure and composition of atmospheric aerosols from space 

Juan Cuesta, Maxim Eremenko, Claudia Di Biagio, Paola Formenti, Gaëlle Dufour, Pasquale Sellitto, Prem Maheshwarkar, Farouk Lemmouchi, Rebecca Kutzner, and Henda Guermazi

Air pollution is a major global challenge, responsible for more than 4 million premature deaths worldwide each year. Because aerosols are transported over long distances, often far beyond national borders, effective air quality and climate mitigation strategies critically rely on our ability to identify source regions and characterize atmospheric transport pathways. Satellite observations are indispensable for this purpose, providing global and continuous monitoring capabilities. However, until recently, spaceborne observations of aerosols were largely limited to horizontal distributions, typically expressed as aerosol optical depth, or to sparse vertical information restricted to narrow orbital tracks from active lidar instruments.

In this presentation, we will demonstrate how recent advances in multi-hyperspectral satellite remote sensing have led to a major observational breakthrough: the first-ever observation of the three-dimensional (3D) distribution of aerosols from space using passive satellite measurements. By exploiting the complementary information content of hyperspectral observations across different spectral domains, two innovative approaches have been developed. The AEROIASI method uses hyperspectral thermal infrared measurements from the IASI instrument to retrieve vertical profiles of aerosol species that significantly absorb in the thermal infrared, including coarse desert dust (Cuesta et al., 2015; 2020) as well as finer particles such as sulfuric acid (Guermazi et al., 2021) and ammonium sulfate (Kutzner et al., 2021). Complementarily, the AEROS5P approach employs hyperspectral visible and near-infrared measurements from TROPOMI to provide, for the first time, vertically resolved observations of fine aerosols emitted by wildfires and anthropogenic sources (Lemmouchi et al., 2022; Maheshwarkar et al., 2024). Together, these methods show that passive satellite sensors can now resolve not only the horizontal extent of aerosol plumes, but also their vertical structure, composition, and transport pathways throughout the troposphere.

Looking ahead, this innovative methodology will be unified into a joint approach based on the new MeOp-SG mission. Within the framework of the European PANORAMA project, a synergetic approach combining these two methods with polarimetric satellite measurements will aim to achieve an extended aerosol speciation in 3D, with far-reaching implications for air quality and climate assessment.

How to cite: Cuesta, J., Eremenko, M., Di Biagio, C., Formenti, P., Dufour, G., Sellitto, P., Maheshwarkar, P., Lemmouchi, F., Kutzner, R., and Guermazi, H.: Revealing the three-dimensional structure and composition of atmospheric aerosols from space, EGU General Assembly 2026, Vienna, Austria, 3–8 May 2026, EGU26-17068, https://doi.org/10.5194/egusphere-egu26-17068, 2026.

EGU26-18466 | ECS | Posters on site | AS3.14

Joint retrieval of aerosols, XCO2, and XCH4 from polarimetric and spectrometric data using GRASP 

Fernando Rejano, Marcos Herreras-Giralda, Masahiro Momoi, Wushao Lin, Alejandro García-Gómez, Andrew Barr, Jochen Landgraf, Fiona Lippert, Pavel Litvinov, Oleg Dubovik, David Fuertes, Daniele Gasbarra, Ben Veihelmann, and Edward Malina

Accurately characterizing atmospheric aerosols remains a primary challenge in achieving high precision in satellite retrievals of XCO2 and XCH4. While Shortwave Infrared (SWIR) spectral bands provide optimal sensitivity to greenhouse gas concentrations, Multi-Angular Polarimetric (MAP) measurements represent the most advanced approach for constraining aerosol and surface properties. Consequently, upcoming Copernicus missions, such as CO2M and MetOp-SG (hosting Sentinel-5/UVNS spectrometer and 3MI polarimeter), are equipped to exploit the synergy between these measurement types.

In this context, we present  an open-source, full-physics retrieval algorithm for GHG retrievals  to demonstrate its capabilities through the synergistic inversion of SWIR spectrometric (i.e., S5-UVNS and CO2M/CO2I spectrometers) and multi-angle polarimetric data (3MI and CO2M/MAP). The core of this retrieval approach is the Generalized Retrieval of Atmosphere and Surface Properties (GRASP) algorithm (Dubovik et al., 2021). GRASP relies on rigorous radiative transfer modeling and statistically optimized fitting (Multi-Term Least Squares) to process a wide range of optical instruments. While originally designed for MAP applications (e.g., POLDER, 3MI; Li et al., 2019; Chen et al., 2020), the approach has been extended to combine MAP and SWIR spectrometric measurements, accounting for gas absorption, offering a simultaneous retrieval of detailed aerosol microphysics and surface properties alongside with columnar XCO2 and XCH4.

In this work the GRASP algorithm has been successfully adapted to perform gas retrievals, allowing for the robust simultaneous inversion of aerosol properties and XCO2 and XCH4. We demonstrate the capabilities of this new GRASP inversion scheme through synthetic datasets representing the Sentinel-5+3MI and CO2M synergies. These synthetic experiments highlight that incorporating MAP measurements yields significantly improved accuracy for XCO2 and XCH4 compared to standalone spectrometer retrievals. This project has been funded through the OPERA-S5 project (OPEn platform for the Retrieval of Aerosol and CO2 from S5), an ESA-funded initiative developed by GRASP SAS company and SRON. This development lays the groundwork for the operational processing of future multi-sensor satellite missions, offering a powerful tool for enhanced global monitoring of greenhouse gases and aerosol interactions.


References

Chen, C., Dubovik, O., Fuertes, D., Litvinov, P., Lapyonok, T., Lopatin, A., ... & Federspiel, C. (2020). Validation of GRASP algorithm product from POLDER/PARASOL data and assessment of multi-angular polarimetry potential for aerosol monitoring. Earth System Science Data Discussions, 2020, 1-108.

Dubovik, O., D. Fuertes, P. Litvinov, et al., “A Comprehensive Description of Multi- Term LSM for Applying Multiple a Priori Constraints in Problems of Atmospheric Remote Sensing: GRASP Algorithm, Concept, and Ap-plications”, Front. Remote Sens. 2:706851. doi: 10.3389/frsen.2021.706851, 2021.

Li, Lei; Derimian, Yevgeny; Chen, Cheng; Zhang, Xindan; Che, Huizheng; Schuster, Gregory L.; Fuertes, David; Litvinov, Pavel; Lapyonok, Tatyana; Lopatin, Anton; Matar, Christian; Ducos, Fabrice; Karol, Yana; Torres, Benjamin; Gui, Ke; Zheng, Yu; Liang, Yuanxin; Lei, Yadong; Zhu, Jibiao; Zhang, Lei; Zhong, Junting; Zhang, Xiaoye; Dubovik, Oleg Climatology of aerosol component concentrations derived from multi-angular polarimetric POLDER-3 observations using GRASP algorithm. Earth Syst. Sci. Data, vol. 14, no. 7, pp. 3439–3469, 2022, ISSN: 1866-3516.

How to cite: Rejano, F., Herreras-Giralda, M., Momoi, M., Lin, W., García-Gómez, A., Barr, A., Landgraf, J., Lippert, F., Litvinov, P., Dubovik, O., Fuertes, D., Gasbarra, D., Veihelmann, B., and Malina, E.: Joint retrieval of aerosols, XCO2, and XCH4 from polarimetric and spectrometric data using GRASP, EGU General Assembly 2026, Vienna, Austria, 3–8 May 2026, EGU26-18466, https://doi.org/10.5194/egusphere-egu26-18466, 2026.

EGU26-18704 | ECS | Posters on site | AS3.14

Non-parametric optimised spatiotemporal data co-location using mutual information 

Andrew Martin, Heather Guy, Michael Gallagher, and Ryan Neely III

There are a myriad of methods for matching data between satellites and surface-based observations (co-location), and no singular way to objectively compare the quality of the matching between methods. This work proposes a framework that allows for an optimised choice of co-location to be evaluated, and shows that this framework selects co-location schemes that demonstrably produce better output data than other typically used choices of co-location scheme.


Matching data described on different spatial and temporal coordinates and retrieved from different sources – spatiotemporal co-location – is an important step in any analysis utilising multiple sources of Earth observation data. For example, validating satellite data against surface-based remote sensing data often requires that the satellite data be spatially aggregated over its field of view near the surface-based observatory, and the surface-based data is temporally aggregated around the time of the satellite overpass. A good data co-location permits sufficient data such that subsequent analyses are viable, whilst limiting the mismatch error induced by comparing data between sources with larger spatiotemporal separations. The schemes by which data are co-located are often parameterised by a few variables that can be arbitrarily selected (for example, the maximum distance between a surface-based observatory and the footprint of a satellite obervation). The choice of these co-location parameters directly impacts all subsequent analyses, and there is no single correct method for selecting a parametrisation.


We describe a data-driven approach for selecting an optimised co-location parametrisation that is domain- and data-agnostic. The mutual information between data sources describes the amount of variability within the data coming from one source that can be described by variability in data from another source. The presented approach selects the co-location parameters such that the data co-location maximises the mutual information between the data sources. The output is paired data between the sources that is as close as possible to being described by a one-to-one relationship, given the input data and co-location scheme.


We apply this method of co-locating data to a validation of the cloud layer height retrievals in the ICESat-2 ATL09 data product against surface-based Cloudnet retrievals. Our method finds location-specific distances within which ICESat-2 data should be compared against data from a given Cloudnet observatory, and that a one-size-fits-all approach to selecting the co-location parameterisation degrades the quality of the resulting matched data through different failure modes, depending on the location. The comparison between vertical cloud fraction profiles between ATL09 and Cloudnet data are demonstrably better when using optimised co-location parameters as opposed to other choices.


As well as improving the quality of data provided to satellite validation studies, this method can be used across many contexts. It may be possible to improve multi-sensor synthesis of data through weighting of the contributions of different data products to the synthesis as a function of the mutual information between the input data products. The method can also be used to programmatically generate labelled training pairs of related data for deep learning models that best encode the relationship between the data sources.

How to cite: Martin, A., Guy, H., Gallagher, M., and Neely III, R.: Non-parametric optimised spatiotemporal data co-location using mutual information, EGU General Assembly 2026, Vienna, Austria, 3–8 May 2026, EGU26-18704, https://doi.org/10.5194/egusphere-egu26-18704, 2026.

EGU26-18998 | Orals | AS3.14

An improved characterization of aerosols using new space-borne remote sensing capabilities based on Multi-Angle Polarimetry 

Soheila Jafariserajehlou, Bertrand Fougnie, David Huerta Valcarce, and Samuel Rémy

Detailed knowledge of the optical and microphysical properties of aerosols plays a significant role in reducing one of the major sources of uncertainties in climate and air quality assessments. In recent years, the importance of exploiting the rich measurements from satellite observations for improved aerosol characterization has been widely recognized, prompting significant efforts to increase the information content of retrieval algorithms through synergies among measurements from single or multiple instruments.
The recent launch of EPS-SG (August 2025) with cutting-edge onboard instruments marks the beginning of new generation of exceptionally rich satellite observations. Notably, the Multi-View, Multi-Channel, Multi-Polarisation Imager (3MI) onboard  Metop-SG A1 has the core mission for aerosol characterization. The multi-angle polarimetric data acquisition implemented in 3MI builds on a long heritage, demonstrated since 1996 by POLDER and PARASOL (Polarization and Anisotropy of Reflectances for Atmospheric Science coupled with Observations from a Lidar). Compared to the POLDER/PARASOL era, new advances in 3MI instrument (e.g. broader spectral range), along with significant improvements in retrieval algorithms, have enabled the characterization of aerosols with additional optical, microphysical, and chemical properties beyond classical approaches and products. In addition, recent efforts to harmonize chemical component definitions in 3MI aerosol retrieval algorithm with those adopted by the broader scientific community and operational users have enhanced our understanding and stimulated new discussions on aerosol modelling.
This presentation focuses on the latest improvements in chemical component representation within the 3MI GRASP retrieval and its integration into the operational processor to meet near real time user needs. Validation results from real observations (PARASOL and AERONET) and comparison to models demonstrate improved aerosol characterization and the added value of new polarimetry products in building a bridge between satellite and modelling community. The validation also emphasizes the need for new in-situ measurements, both to support algorithmic assumptions and to strengthen product validation. Finally, the high potential of synergistic use of Metop-SG A1 sensors to address remaining gaps in characterization of aerosols and more specifically chemical components will be discussed, pointing towards a more comprehensive approach to operational aerosol monitoring.

How to cite: Jafariserajehlou, S., Fougnie, B., Huerta Valcarce, D., and Rémy, S.: An improved characterization of aerosols using new space-borne remote sensing capabilities based on Multi-Angle Polarimetry, EGU General Assembly 2026, Vienna, Austria, 3–8 May 2026, EGU26-18998, https://doi.org/10.5194/egusphere-egu26-18998, 2026.

EGU26-19553 | Posters on site | AS3.14

TARSA: Transport Modeling for Remote Sensing Applications and Volcanic Emission Retrieval 

Konstantin Kuznetsov, Oleg Dubovik, Pavel Litvinov, Smita Panda, and Abhinna Behera

We present TARSA  (Transport Aerosol model for Remote Sensing Applications), a lightweight three-dimensional Eulerian transport model designed for regional studies and tight integration with atmospheric remote-sensing frameworks. TARSA solves a linear conservation equation for generic tracers expressed as mass mixing ratios, including advection by prescribed winds, turbulence-driven vertical diffusion, gravitational settling, and parameterised dry and wet deposition. Nonlinear aerosol microphysics and radiative feedbacks are excluded from the prognostic core, so that all active processes can be written as linear operators acting on a common state vector. The model employs a finite-volume discretisation with first-order upwind advection and implicit time stepping on a structured grid, driven by meteorological fields from the ERA5 reanalysis. All tracers share the same numerical infrastructure, and physical processes can be switched on or off on a per-tracer basis.


We verify and validate TARSA using a hierarchy of experiments. An idealised manufactured Gaussian plume test in a uniform flow demonstrates accurate reproduction of the analytical reference over many orders of magnitude in concentration and confirms near machine-precision mass conservation. A real-world simulation of the ETEX-1 field tracer experiment shows that TARSA captures the large-scale trajectory and arrival sequence of an inert gas over Europe, while reproducing station-wise peak concentrations and dosages within the range reported for established Eulerian models. A short-range consistency experiment against Copernicus Atmosphere Monitoring Service (CAMS) reanalysis fields for carbon monoxide and several aerosol species shows that, when initialised and bounded by reanalysis mixing ratios without additional emissions, TARSA preserves the main spatial patterns and vertical structures of realistic tracers over a synoptic (2–3 day) time scale.


Finally, we demonstrate TARSA’s suitability for satellite-constrained inverse problems with a proof-of-concept retrieval of volcanic sulfur dioxide emissions. Using column SO₂ observations from a polar-orbiting sensor and a linear emission-rate parameterisation, we estimate time-varying source strength by minimising the mismatch between observed and simulated columns under Gaussian observation errors. The inferred emissions reproduce the observed plume timing and downwind structure and provide an end-to-end example of TARSA as a transparent, efficient forward operator for source inversion. Owing to its linear formulation, sparse implicit solver, and modest computational cost, TARSA is well suited for inverse problems and multi-sensor data assimilation; a companion study will describe the corresponding inverse framework in detail.

How to cite: Kuznetsov, K., Dubovik, O., Litvinov, P., Panda, S., and Behera, A.: TARSA: Transport Modeling for Remote Sensing Applications and Volcanic Emission Retrieval, EGU General Assembly 2026, Vienna, Austria, 3–8 May 2026, EGU26-19553, https://doi.org/10.5194/egusphere-egu26-19553, 2026.

EGU26-20297 | ECS | Posters on site | AS3.14

Automatic Ship-Based Photometers for Enhanced Aerosol Characterization Over the Open Ocean: Towards a Global Network 

Maria Fernanda Sanchez Barrero, Benjamin Torres, Luc Blarel, Gaël Dubois, Antoine Canon, Philippe Goloub, Fabrice Maupin, Jean Marc Metzger, Pierre Tulet, Ilya Slutsker, Thierry Marbach, Gabriele Brizzi, Gian Luigi Liberti, Leonardo Langone, Ramiro Gonzalez, Carlos Toledano, Jean Louis Etienne, Gregory Leclout, Ann Mari Fjæraa, and Pierre Franqois Jaccard and the co-authors

Oceans remain severely under-sampled in aerosol optical properties, limiting our ability to assess marine aerosol–climate feedbacks, long-range transport and to validate satellite products over two-thirds of Earth’s surface. The Sun–sky–lunar photometer CIMEL CE318-T has been successfully adapted for autonomous shipborne operation through the PHOTONS Observation Service (ACTRIS, Univ. Lille, CNRS) in collaboration with CIMEL and within ACTRIS-CARS activities. The system is fully compatible with AERONET processing. Here we summarize recent developments and multi-year results supporting the deployment of a global network of automatic ship-based photometers.

Since 2021, a CE318-T has operated continuously on the research vessel (R.V.) Marion Dufresne under the framework of MAP-IO program. Between July 2021 and June 2024, it collected >25,000 Level 1.5 measurements in the southwestern Indian Ocean, with mean AOD (Aerosol Optical Depth) of 0.09 ± 0.07 (440 nm) and 0.05 ± 0.03 (870 nm), and EAE (Extinction Angstrom Exponent) of 0.7 ± 0.4, typical of clean marine conditions. A biomass-burning aerosol (BBA) event allowed retrieval of microphysical properties (size distribution, refractive index), showing the capability of the system under real ship-motion.

During TRANSAMA campaign (La Réunion–Barbados, Apr–May 2023), two CE318-T photometers combined with a micropulse lidar aboard R.V. Marion Dufresne provided complementary column and vertical information. Despite low AOD (0.08 ± 0.04 at 440 nm) in the remote South Atlantic, the lidar detected transported continental layers not evident from column-integrated data alone. Photometer intercomparison showed excellent agreement (R > 0.96; RMSE = 0.005–0.008). Motion-induced degradation on data quality highlighted the need for the ongoing instrumental tests, using a motion-simulation hexapode platform.

A second permanent site aboard the R.V. Gaia Blu (CNR, Italy) has collected >20,000 measurements mainly in the Mediterranean since Feb 2024. Mean AOD (0.19 ± 0.14 at 440 nm) and EAE (1 ± 0.4) reflect more variable aerosol regimes, including BBA and Saharan dust. Comparisons with nearby AERONET ground-based stations validated retrieval quality. In addition, the installation of a 3D scanning lidar (Sep 2025) further enhances observations of aerosol vertical structure and air–sea interactions.

These first results demonstrate the capability of ship-based photometers, and their synergy with lidar, to fill critical observational gaps over the oceans. Improved data acquisition strategies addressing vessel structure and motion are ongoing. To date, five ship-photometers operate across major maritime regions: R.V. Marion Dufresne-France (Indian Ocean), R.V. Gaia Blu-Italy (Mediterranean Sea), R.V. Sarmiento de Gamboa-Spain (Atlantic Ocean), R.V. Perseverance-France (currently Pacific Ocean), and MS Richard With-Norway (Arctic/Norwegian coast). These installations represent a major European step toward the first global network of automatic shipborne photometers to improve aerosol characterization over remote oceans and support satellite CAL/VAL.

How to cite: Sanchez Barrero, M. F., Torres, B., Blarel, L., Dubois, G., Canon, A., Goloub, P., Maupin, F., Metzger, J. M., Tulet, P., Slutsker, I., Marbach, T., Brizzi, G., Liberti, G. L., Langone, L., Gonzalez, R., Toledano, C., Etienne, J. L., Leclout, G., Fjæraa, A. M., and Jaccard, P. F. and the co-authors: Automatic Ship-Based Photometers for Enhanced Aerosol Characterization Over the Open Ocean: Towards a Global Network, EGU General Assembly 2026, Vienna, Austria, 3–8 May 2026, EGU26-20297, https://doi.org/10.5194/egusphere-egu26-20297, 2026.

EGU26-20545 | Orals | AS3.14

Towards Advanced Sentinel-3 Near Real Time (NRT) L2 synergy capabilities for enhanced atmospheric imagery characterisation 

Julien Chimot, Edouard Martins, Daria Malik, Johan Strandgren, Bertrand Fougnie, and Bojan Bojkov

As an operational user-driven Earth observation satellite agency, EUMETSAT is the reference European provider of Near Real Time (NRT - < 3h from the sensing time) Level 2 (L2) atmospheric imagery satellite observations from a constellation combining both Low Earth Orbit (LEO), with Metop / Sentinel-3 and EPS-SG, and GEOstationary (MSG & MTG). Primary users are operational air quality, meteorology and climate services from the Copernicus program and its own member states.

Notably, for several years, EUMETSAT has closely interacted with the Copernicus Atmospheric Monitoring Service (CAMS) and provided expertise to support the uptake of all its observations into the modelling and assimilation processes.

With two multi-spectral optical sensors and observations acquired at a high spatial resolution at 10:00, Sentinel-3 is the main Copernicus mission entrusted to EUMETSAT by the European Commission to provide a high quality of L2 NRT aerosols, fires, water vapour and cloud products at global coverage during morning overpass time for the long future. Current (pre)-existing operational processors are for now solely based on one of the optical sensors. For example:

  • The L2 NRT Aerosol Optical Depth (AOD) and Fire Radiative Power (FRP) are retrieved from the Sea and Land Surface Temperature Radiometer (SLSTR) sensor.
  • The L2 Total Column Water Vapour, Cloud Top pressure (CTP), and Aerosol Layer Heigh (ALH) are retrieved from the Ocean and Land Colour Imager (OLCI) sensor.

Based on lessons learned, EUMETSAT is now leading a major set of activities to extend the current S3 L2 NRT atmosphere portfolio towards atmospheric imagery with enhanced information and characterization of our atmosphere by combining the measurements from these two optical sensors in an optimal way, accounting for both the operational timeliness requirements and the gridding needs for L2. Such a fundamental work relies on multi-optical spectral synergy and redesign of the L2 operational algorithms. Expected benefits are multiple, such as:

  • enhanced aerosol typing (via Fine Mode retrieval, and dust & Single Scattering Albedo determination).
  • improved water vapour estimation over both lands and aquatic surfaces.
  • more accurate cloud detection, cloud and aerosol discrimination, and cloud obstruction estimation of Top Of Atmosphere (TOA) per spectral channel.

In this presentation, EUMETSAT will summarise the status of all S3 L2 NRT atmosphere products, and illustrate the preliminary progress of the corresponding L2 synergy developments in progress for the purpose of enhanced atmospheric imagery characterisation. Also, the expectations in terms of bridging closer air quality models and observations will be illustrated in the case of aerosol components, early fire warning & impact on smoke forecast, and assimilation.

How to cite: Chimot, J., Martins, E., Malik, D., Strandgren, J., Fougnie, B., and Bojkov, B.: Towards Advanced Sentinel-3 Near Real Time (NRT) L2 synergy capabilities for enhanced atmospheric imagery characterisation, EGU General Assembly 2026, Vienna, Austria, 3–8 May 2026, EGU26-20545, https://doi.org/10.5194/egusphere-egu26-20545, 2026.

EGU26-21808 | Orals | AS3.14

The Copernicus anthropogenic CO2 Monitoring (CO2M) mission – three instruments, three platforms – one goal 

Ruediger Lang, Maurizio de Bartolomei, Helmut Bauch, Bojan Bojkov, Leonid Butenko, Hannah Clarke, Paola Colagrande, Josef Gasteiger, Catherine Hayer, Andriy Holdak, Eduardo Valido Cabrera, Bernd Husemann, Antoine Lacan, Fabrizio Di Loreto, Thierry Marbach, Pepe Phillips, Rassulzhan Poltayev, Cosimo Putignano, Vincenzo Santacesaria, and Sruthy Sasi

As part of the Copernicus component of the EU Space Programme, the European Commission and the European Space Agency (ESA), are expanding the Copernicus Space Infrastructure and are implementing satellite remote measurements to support anthropogenic CO2 emission monitoring. In support of well-informed policy decisions and to assess the effectiveness of strategies for CO2 (and methane (CH4)) emission reduction, uncertainties associated with current anthropogenic emission estimates at national and regional scales need to be improved. Satellite measurements of atmospheric CO2 and CH4, complemented by in-situ measurements and bottom-up inventories will be elaborated in an advanced (inverse) modelling scheme to provide a transparent and consistent quantitative assessment of their emissions and their trends at the scale of megacities, regions, countries, and at global scale.


The European Organization for the Exploitation of Meteorological Satellites (EUMETSAT) is responsible for the development of the operational ground segment (with contributions from ESA) and the CO2M system operations during commissioning and the routine phase. This presentation will provide an overview of the mission and instrument development status at ESA and will present first results from the CO2M operational processing system developments ongoing at EUMETSAT. The latter will include first simulations for the dedicated CO2M aerosol, cloud, and NO2 products, as well as from the innovative approach to exploit three retrieval algorithms for greenhouse gases (GHG), i.e. XCH4, XCO2.


Here we show how the measurements from the three instruments on-board CO2M (the CO2/NO2 push-broom grating spectrometer (CO2I/NO2I), the Multi Angle Polarimeter (MAP), and the Cloud Imager (CLIM)) are combined into one “hyper-instrument” processing system. This includes the centralized and harmonized provision of auxiliary and a priori information to all level-2 processors and for all satellite platforms, in order to ensure maximum consistency between the parts of the system. The results are based on realistic simulations of orbits for a constellation of three satellite platforms, including one which is continuously following the sun-glint spot instead of looking in the nadir direction.


CO2M level-2 products from all platforms of the constellation will be operationally assimilated in the Copernicus GHG Monitoring and Verification Support Capacity (MVS) of the European Commission developed by the Copernicus Atmosphere Monitoring Service (CAMS) at the European Centre for Medium-Range Weather Forecast (ECMWF). The MVS will provide CO2 and Methane emission inventories at a regional, national, and global scale to users and stakeholders. The simultaneous assimilation of the same data-products from multiple platforms requires, next to the centralized “hyper-instrument” processing strategy the stringent intra- and inter-platform instrument calibration with strict requirements on instrument co-registration per platform and between platforms. To achieve and maintain high level of consistency during the full mission lifetime EUMETSAT will use a number of on-board and external calibration reference source, including the sun, the moon, and on-board light sources, as well as stable on-ground reference targets, which will routinely be used for monitoring and re-calibration activities in EUMETSAT. 

How to cite: Lang, R., de Bartolomei, M., Bauch, H., Bojkov, B., Butenko, L., Clarke, H., Colagrande, P., Gasteiger, J., Hayer, C., Holdak, A., Valido Cabrera, E., Husemann, B., Lacan, A., Di Loreto, F., Marbach, T., Phillips, P., Poltayev, R., Putignano, C., Santacesaria, V., and Sasi, S.: The Copernicus anthropogenic CO2 Monitoring (CO2M) mission – three instruments, three platforms – one goal, EGU General Assembly 2026, Vienna, Austria, 3–8 May 2026, EGU26-21808, https://doi.org/10.5194/egusphere-egu26-21808, 2026.

Aerosols affect climate and air quality, but it remains challenging to simultaneously quantify their optical properties, vertical distribution, chemical components, and associated direct radiative effects using any single observing system. Here, we present a ground-based synergy retrieval study in Central China (Wuhan University; 30°32ʹN, 114°21ʹE) combining a CE-318T sun photometer, a 532-nm Mie lidar, and surface black-carbon measurements (AE-31) from July 2021 to August 2022, using the GRASP/GARRLiC framework with a component-based aerosol model (BC, BrC, dust, iron oxide, water-soluble salts, and aerosol water). The joint retrieval captures strong seasonality: winter shows the highest aerosol loading (AOD ~0.7 at 440 nm) with enhanced absorption (SSA <0.92) and elevated near-surface BC, while spring is strongly influenced by transported dust with a characteristic extinction peak near ~2.5 km and relatively high SSA; summer and autumn feature lower mean AOD but episodic enhancements consistent with regional transport/biomass burning. Retrieved annual column mass concentrations indicate low BC burden (2.49 mg m⁻²) yet disproportionate warming, with BC contributing +9.27 W m⁻² to shortwave DARE at the top of atmosphere (BrC: +0.10 W m⁻²), whereas total aerosols cool the system overall (−12.28 W m⁻² at TOA; −39.33 W m⁻² at the surface). Incorporating lidar-constrained vertical structure also improves agreement of retrieved surface BC versus measurements (R = 0.56), highlighting the value of synergy observations for component-aware radiative impact assessments and for complementing reanalysis products.

How to cite: Ma, Y. and Jin, S.: Characterizing Aerosol Optical Properties and DirectRadiative Effects From the Perspective of Components: A Synergy Retrieval Study Based on Sun Photometer andLidar in Central China, EGU General Assembly 2026, Vienna, Austria, 3–8 May 2026, EGU26-21950, https://doi.org/10.5194/egusphere-egu26-21950, 2026.

EGU26-16 | Posters on site | CL2.1

The secret history of Earth's radiation budget 

Miklos Zagoni

The modern history of reliable Earth radiation budgets starts with the satellite era, notably be the iconic KT97 energy flow distribution. One of the cornerstone greenhouse data (“Back Radiation”, 324 Wm-2) was immediately challenged by Wild et al. (1998; 344 Wm-2). After a short interlude (TFK 2009), the magnitudes occupied their positions as we know them today in 2012. One of the pivotal studies (Stephens et al. 2012) displays both clear-sky and all-sky data in the longwave part. Today, in possession of the governing relationships (four Schwarzschild-type radiative transfer constraint equations) and their solution (as small integer ratios), we are able to reconstruct some moments in their build-up. In that work, first the exact integer positions at top-of-atmosphere (TOA) for clear-sky and all-sky outgoing LW radiation (OLR) were established: using the defined value of “Longwave cloud effect” (26.7±4 Wm-2) as the unit flux, “Clear-sky emission” was defined as 10 units (267.0 Wm-2), and “Outgoing longwave radiation” as 9 units (240.3 Wm-2). Then, a TOA imbalance of 0.6 Wm-2 was introduced; and, a reduction in OLR by the value of TOA imbalance was applied, to have the displayed values of clear-sky OLR as 266.4 Wm-2 and all-sky OLR as 239.7 Wm-2

Wild (2020) implicitly contains the complete set of integer ratios, including the accurate albedo and greenhouse factor.

The same technique was used in the most recent comprehensive global energy budget depiction (Stephens et al. 2023, BAMS) based on 30 years of Gewex data. First, an accurate value for the longwave cloud radiative effect (LWCRE) was defined as 1 unit (26.682 Wm-2), then the exact integer positions for “Outgoing LW” (9 units, 240.14 Wm-2) and "Surface emission" (15 units, 400.24 Wm-2) were determined. Introducing an EEI of 0.54±0.3 Wm-2, a reduction in OLR and an increase in Surface emission by EEI was applied to get the displayed values of 239.5 Wm-2 and 400.7 Wm-2. TOA data were accurately tuned to the prescribed integer position of the albedo ("Reflected Solar"/"Incoming Solar" = 15/51 = 0.2941; 100.2/340.2 = 0.2945). Equation (3) [the all-sky version of the direct Schwarzschild-relationship Eq. (1), see Goody (1989), Stephens (1994) or Ramanathan (1995), for the net radiation at the surface RN(clear) = OLR(clear)/2 in the form of RN(all-sky) = (OLR(all-sky) – LWCRE)/2] is set to be valid with a difference of 0.1 Wm-2. Even the components of the convective flux (Sensible heat and Evaporation) were placed into integer multiple positions separately (compare to the ±9 Wm-2 noted ranges of uncertainty). Similarly, equation (4) for the total (SW+LW) absorbed radiation at the surface [which is the all-sky version of RT(clear)=2OLR(clear)] is valid again with the same difference (0.1 Wm-2). This required an accurate adjustment of its components. No reference to GHGs; the only numerical input parameter is Incoming Solar. This is our recent understanding of Earth's radiation budget.

The secret history of Earth radiation budget
Part 1: Data; Part 2: Theory

https://earthenergyflows.com/Secret_Data.mp4

https://earthenergyflows.com/Secret_Theory.mp4

https://ams.confex.com/ams/106ANNUAL/meetingapp.cgi/Paper/463675

AGU_GEWEX https://agu24.ipostersessions.com/default.aspx?s=26-E4-91-65-AE-83-5C-5E-2E-69-99-D2-1E-33-D1-A3&guestview=true

https://agu24.ipostersessions.com/default.aspx?s=68-C6-67-87-C2-9A-1F-66-64-57-17-86-DA-0F-9D-DC&guestview=true

https://agu25.ipostersessions.com/default.aspx?s=16-B9-40-EF-DB-A7-2A-53-AB-DC-27-A3-75-E9-A7-A3&guestview=true

https://agu25.ipostersessions.com/default.aspx?s=DE-FC-A0-F8-24-C6-C7-36-C9-6E-D9-82-42-3A-47-D1&guestview=true

https://ceres.larc.nasa.gov/documents/STM/2025-05/MP4files/30_Zagoni_EBAF-Thoery.mp4

https://earthenergyflows.com/Zagoni-EGU2024-Trenberths-Greenhouse-Geometry_Full-v03-480.mp4 (2:28:28)

https://ams.confex.com/ams/105ANNUAL/meetingapp.cgi/Paper/445222

https://ams.confex.com/ams/105ANNUAL/meetingapp.cgi/Paper/446389

How to cite: Zagoni, M.: The secret history of Earth's radiation budget, EGU General Assembly 2026, Vienna, Austria, 3–8 May 2026, EGU26-16, https://doi.org/10.5194/egusphere-egu26-16, 2026.

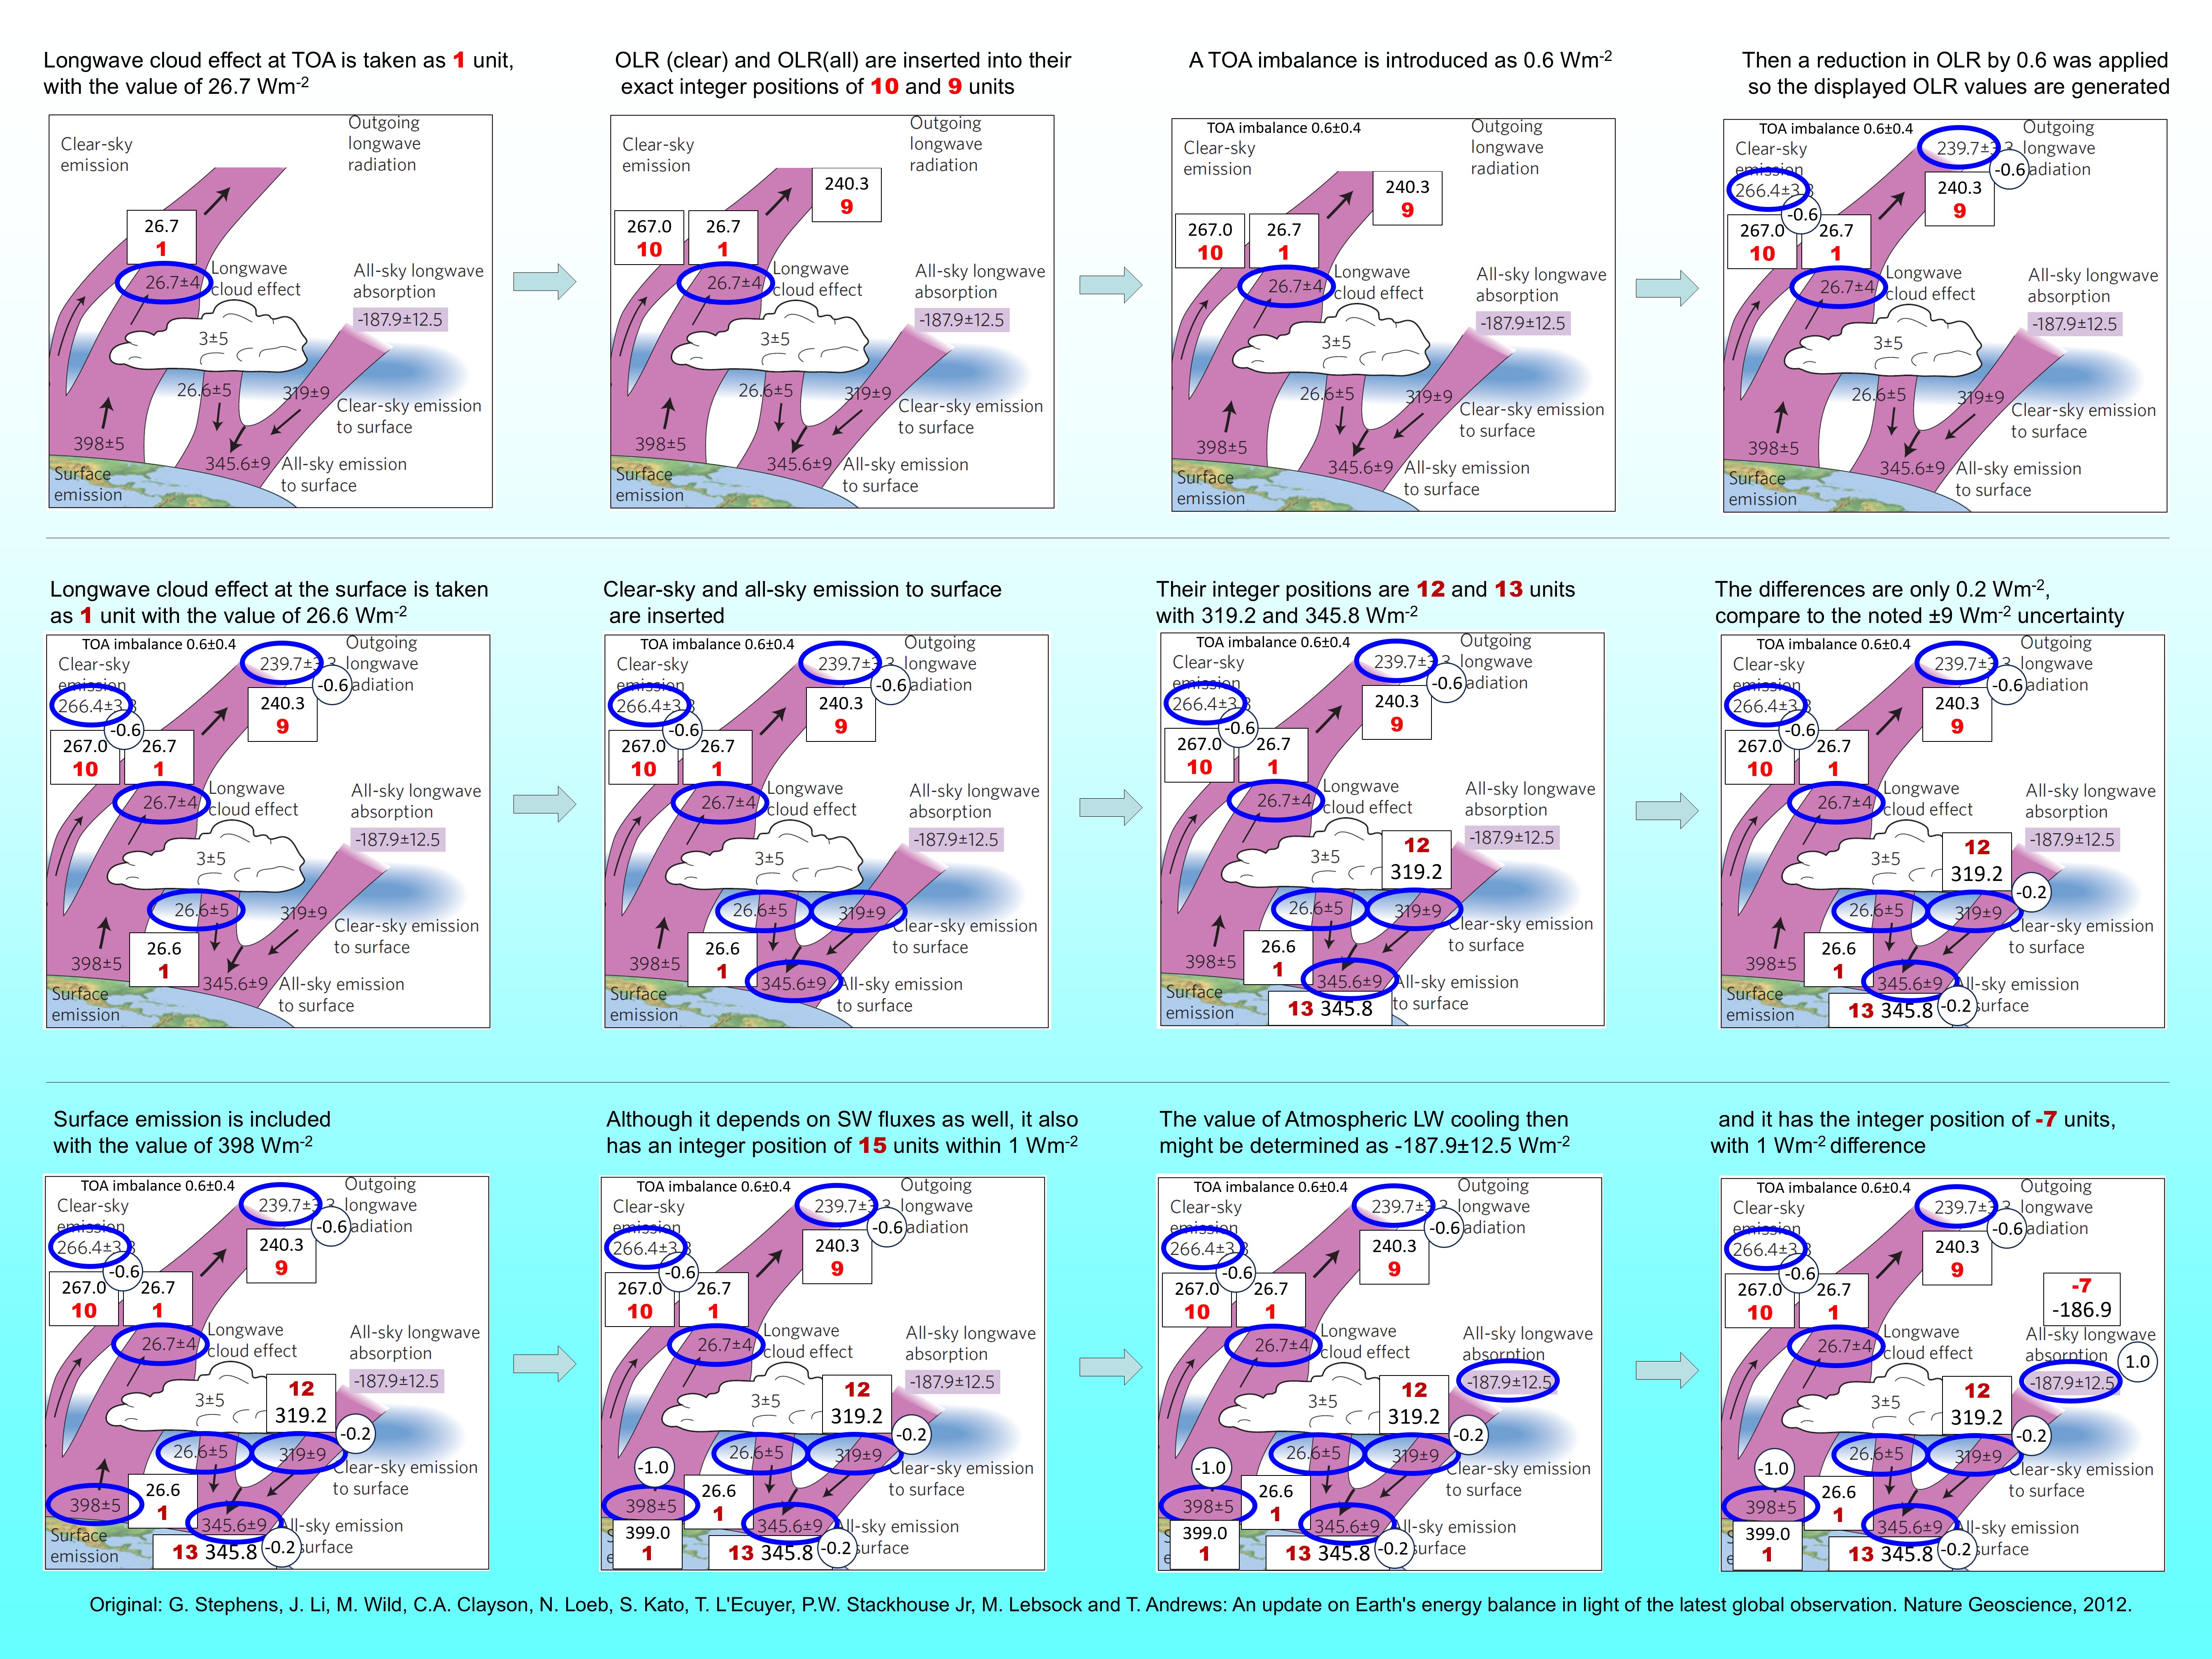
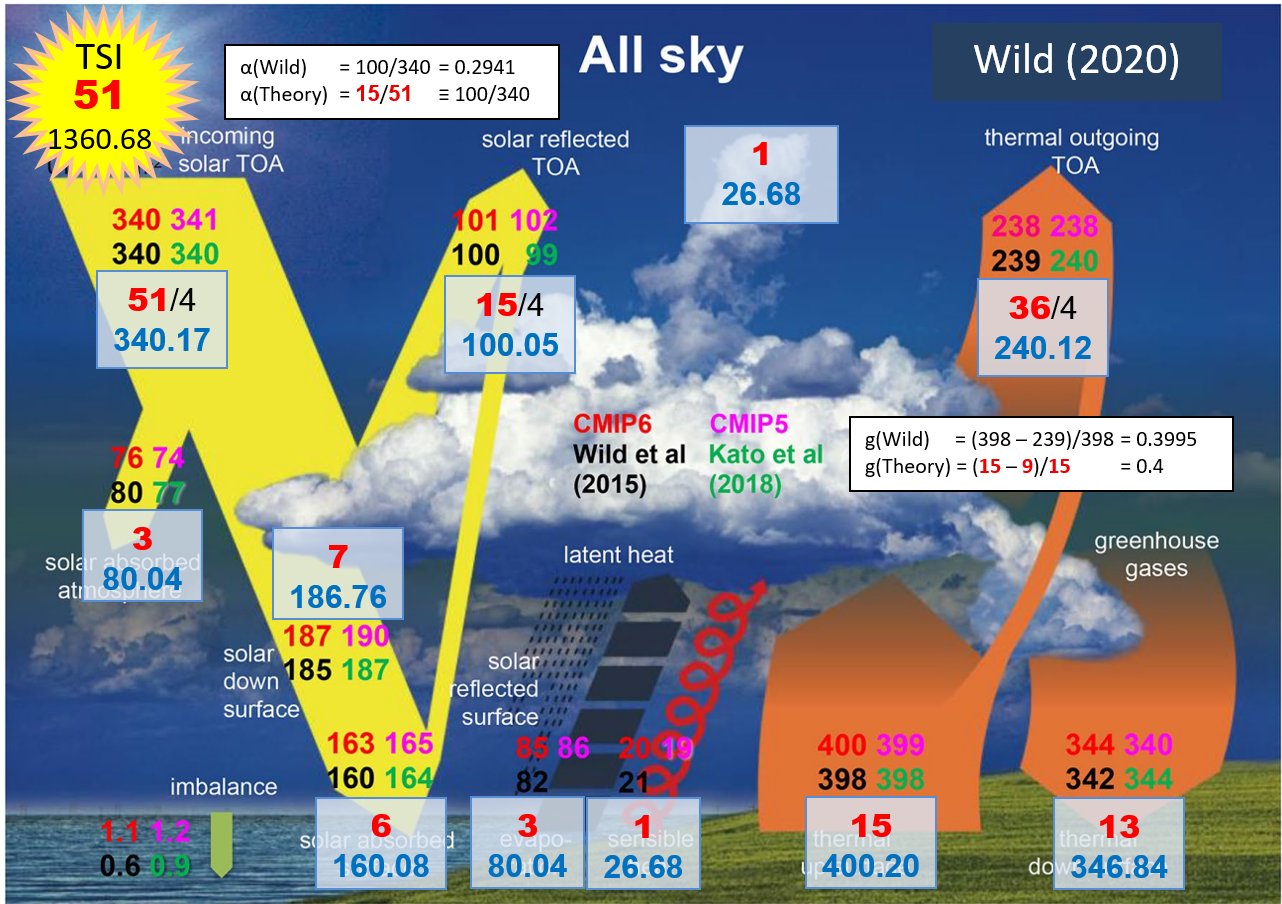
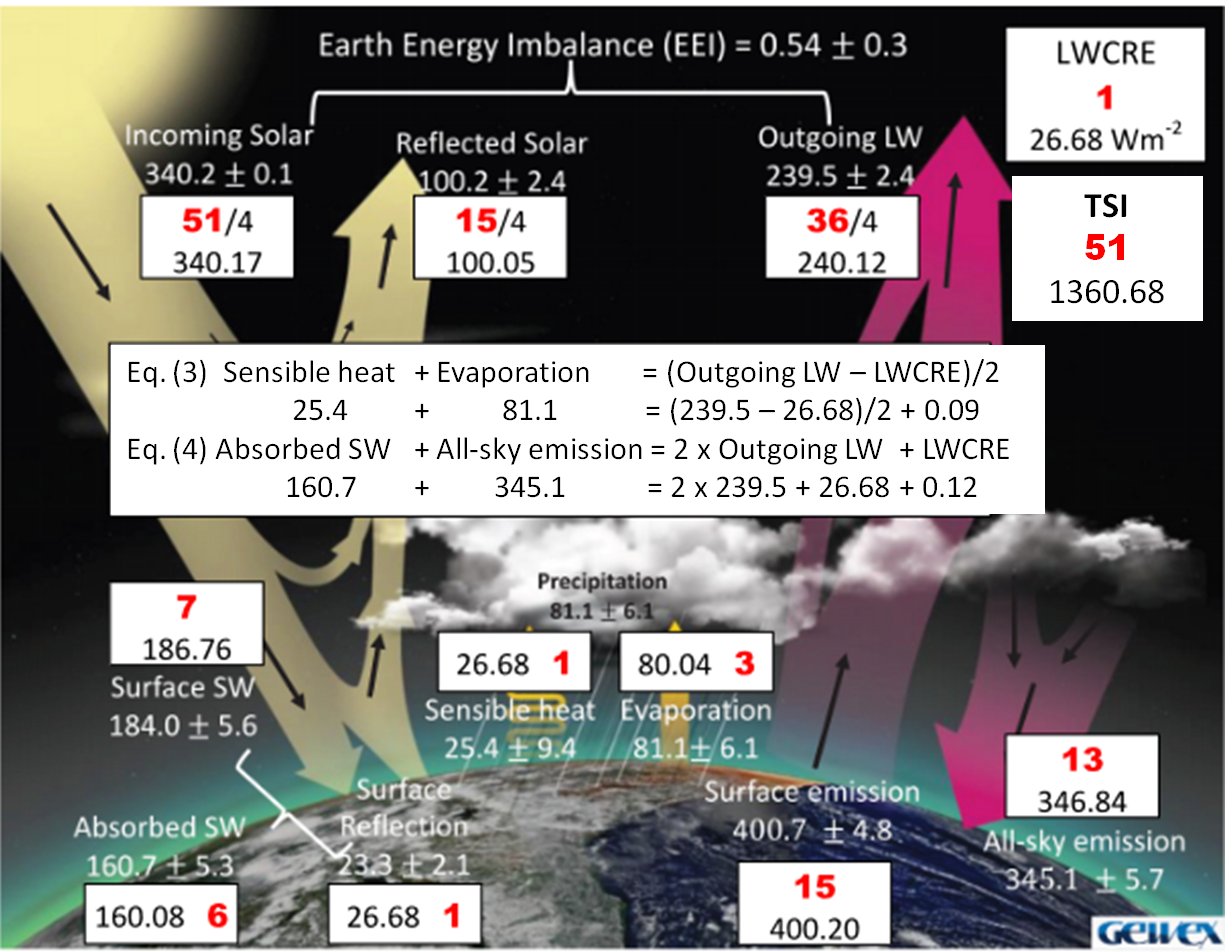
EGU26-382 | ECS | Orals | CL2.1

Assessment of forcing changes across CMIP eras using reduced-complexity climate models 

Magali Verkerk, Thomas Aubry, Chris Smith, Vaishali Naik, Paul Durack, and Chris Wells and the CMIP Climate forcings Task Team

Previous studies showed that historical forcing changes can partly explain differences between climate model simulations of phases 5 and 6 of the Coupled Model Intercomparison Project (CMIP). With the new CMIP7 historical forcings now delivered, we investigate how forcings have changed from the CMIP5 to CMIP7 generations, and use the FaIR reduced-complexity climate model to quantify the impacts for simulated 1850-2100 global mean surface temperature.

First, we perform historical simulations using CMIP5, AR5, CMIP6, AR6, and CMIP7 forcing datasets using FaIR’s IPCC 6th Assessment Report (AR6) calibration. To quantify the impact of individual forcing change on the simulated temperatures, we run simulation ensembles changing individual forcings (CO2, CH4, N2O, other greenhouse gases, aerosol-radiation interactions, aerosol-cloud interactions, solar, volcanic, ozone, and land use forcings) for each CMIP and AR era. In particular, we show three major changes in CMIP7 relative to CMIP6: i) 1850-1900 is 0.1 K colder, largely driven by changes in stratospheric aerosol forcing; ii) 1960-1980 is 0.07 K warmer, largely driven by changes in stratospheric aerosol forcing; iii) over the 20th century, the smaller aerosol-cloud interaction forcing translates into a temperature increase of 0.04 K, whereas the solar forcing change drives colder temperatures by 0.02 K.

Second, to qualitatively assess potential impact of forcing changes on climate model tuning, we recalibrate FaIR using the different CMIP era forcings. In particular, we quantify how forcing dataset choice affects the estimates of key climate metrics (e.g. Equilibrium Climate Sensitivity or Transient Climate Response) and the distribution of FaIR parameters (e.g. carbon cycle parameters or shallow and deep ocean heat capacities). We also compare ensembles of future projections produced using the new calibrations. We show that forcing changes result in relatively small impacts on emergent parameters, e.g. ECS and TCR are up to 2.5 % higher in CMIP6 calibration compared to CMIP7. These translate in simulated temperature estimates for 2100 colder by up to 0.2 K across various SSP scenarios when using the CMIP7 calibration instead of the CMIP6 one.

Overall, our results provide a comprehensive assessment of forcing changes across CMIP eras, in particular for the new CMIP7 datasets, and their implications for simulating historical and future climate. We discuss the value of reduced-complexity models for fast sensitivity testing of new forcings datasets and establish a workflow to test future updates of inputs4MIPs forcings.

How to cite: Verkerk, M., Aubry, T., Smith, C., Naik, V., Durack, P., and Wells, C. and the CMIP Climate forcings Task Team: Assessment of forcing changes across CMIP eras using reduced-complexity climate models, EGU General Assembly 2026, Vienna, Austria, 3–8 May 2026, EGU26-382, https://doi.org/10.5194/egusphere-egu26-382, 2026.

Brown carbon (BrC) is a major organic carbonaceous aerosol fraction distinguished by its light absorption attribute, which potentially alters Earth’s radiative budget. Dark brown carbon, commonly referred to as Tar Balls (TBs), exhibits markedly stronger light absorption compared to other BrC fractions. TBs are well recognized in wildfire emissions, but their occurrence remains inadequately explored and characterized from other emission sources. This work examines the presence of strongly light-attenuating TBs in the Indo-Gangetic Plain (IGP), a globally identified air-pollution hotspot heavily influenced by biomass burning, particularly crop-residue fires post harvest.

The study encompasses three strategically selected sites across the Western, Central, and Eastern IGP, where simultaneous sampling was conducted during the early post-monsoon period. This was followed by further examination of  the prevalence and occurrence patterns of TB particles, and the associated morphological and physicochemical traits using Scanning electron microscopy (SEM) and Transmission Electron Microscopy (TEM), alongside assessing the sources of PM2.5 pollution at each site using PMF model.

The TB-to-soot aggregate ratio, representing TB number concentration, increased from 0.85 in the Western IGP to 1.35 in the Central IGP. The results underscore that distinct regional particle profiles are consistent with prevailing primary and secondary pollution sources at the two sites, respectively. TB particles were scarcely detected at the Eastern IGP site, dominated by urban emissions during the study period, suggesting that their origin is primarily linked to biomass-burning. Overall, the TB number fraction in this study at Western and Central IGP, which is potentially driven by crop residue burning, was 15 times lower than previously reported for wildfire-derived TBs. TB chemistry varied spatially, with fresh biomass-derived TB particles at the Western IGP showing a higher C/O ratio of 3.60, while aged ones at the Central IGP exhibited a lower C/O ratio of 2.59. This study reported a notably lower C/O ratio and higher Nitrogen concentrations for the TBs as compared to extensively studied wildfire-derived TBs documented in past, with the ratio reaching values as high as 20–25.

The findings indicate pronounced variability in TB traits based on emission source, emphasizing the necessity of comprehensive, source-specific TB assessments across all potential origins accompanied by a thorough characterization of optical parameters to reduce uncertainties in radiative forcing effect estimates.

How to cite: Thapliyal, P. and Gupta, T.: Dark Brown Carbon over the Indo-Gangetic Plain: An Overlooked Yet Major Driver of Regional Radiative Forcing, EGU General Assembly 2026, Vienna, Austria, 3–8 May 2026, EGU26-409, https://doi.org/10.5194/egusphere-egu26-409, 2026.

EGU26-1543 | ECS | Orals | CL2.1

How cloud geometry and solar zenith angle control 3D radiative effects 

Margaret Powell, Chiel van Heerwaarden, Pierre Gentine, and Robert Pincus

Most atmospheric models treat radiation as a 1D process, creating biases called 3D radiative effects. Modeled shortwave 3D radiative effects are positive with the sun overhead (1D surface flux is artificially dim) and negative when the sun is near the horizon. Using a comprehensive sample of 3D radiative effects from shallow cumulus, deep convection, and stratocumulus LES cloud scenes, we decompose the 1D to 3D change in surface flux by cause: changes due to the amount of intercepted direct radiation and scattered light produced (cloud cover), changes due to the fate of scattered light (transmissivity), and changes due to their covariance. The decomposition reveals that cloud cover is the primary driver for how 3D cloud radiative effects change as the sun lowers. Using this framework, we develop a simple, quantitative model and find that the sign change is an inevitability: across all clouds scenes and the broader parameter space explored, 3D radiative effects always change from positive to negative as the sun lowers. The sign change occurs because transmissivity enhancement remains roughly constant with solar zenith angle while cloud cover expands super-linearly, causing diminishing positive effects to eventually be outpaced by growing negative effects. Higher cloud aspect ratios (defined height-to-width) accelerate this transition; higher initial coverage delays it due to cloud overlap. The model improves process-level understanding, revealing the importance of accurately representing how clouds interact with the direct beam.

How to cite: Powell, M., van Heerwaarden, C., Gentine, P., and Pincus, R.: How cloud geometry and solar zenith angle control 3D radiative effects, EGU General Assembly 2026, Vienna, Austria, 3–8 May 2026, EGU26-1543, https://doi.org/10.5194/egusphere-egu26-1543, 2026.

EGU26-1554 | ECS | Orals | CL2.1

Ground heat flux at daily scale? Estimates from machine learning models and Earth observation products 

Francisco José Cuesta-Valero, Peter Naylor, Almduena García-García, and Jian Peng

Energy exchanges between the lower atmosphere and the shallow subsurface are fundamental to understand and quantify processes relevant to the society and ecosystems, such as extreme events, the hydrological cycle, the land carbon cycle, and the Earth heat inventory. Among these energy fluxes, Ground Heat Flux (GHF) corresponds to the conduction of heat through the subsurface. GHF is used for estimating evapotranspiration in order to ensure the conservation of energy in the applied models. Ground heat storage in the continental subsurface is estimated from GHF data, constituting the second largest term of the Earth heat inventory after the ocean. Furthermore, the increase in GHF in recent times is warming permafrost soils in the Arctic, thus enabling the thawing of permafrost and the release of additional carbon into the atmosphere.

Nevertheless, ground heat flux is the term of the surface energy balance with less measurements around the world, hindering the analysis of those processes. There are around 60 Eddy-covariance towers measuring GHF globally, with most sites containing less than a decade of records. Because of this limitation, geothermal data has been used to obtain long-term estimates of GHF. However, these estimates are only able to retrieve long-term changes in surface conditions with decadal to centennial periods, and there are not enough sampling sites to retrieve a global average after the year 2000. Although satellite observations have been recently used to bridge the gap in the heat storage evolution between 2000 and 2020 at the annual scale, data at daily and weekly temporal scales are still necessary in order to analyze the role of GHF on short-term processes such as evapotranspiration and extreme events.

Here, we develop a framework, based on machine learning models and Earth observation products, capable of estimating GHF at daily resolution across several land covers and climate zones. Our framework predicts GHF with a Root Mean Squared Error (RMSE) of 4.79 W m-2 and a Pearson’s correlation coefficient (R) of 0.65 at the global scale. The performance of the framework improves when predicting 8-day periods, achieving a RMSE of 3.31 W m-2 and a R of 0.77. A hybrid approach is also evaluated. This method predicts ground surface temperatures and uses them as forcing for a physical model that yields GHF values. Nevertheless, the performance of this hybrid method is lower than the direct approach. We identify several physical processes as the leading features driving the model performance. Given its capability to estimate GHF across several land covers and climate zones, the framework provides the basis for developing a global GHF product, thereby filling a critical gap in the datasets available to study the surface energy balance. Furthermore, this product would enable the characterization of the spatial structure of GHF, contribute directly to monitoring the land component of the Earth heat inventory, and provide a crucial observational reference for developing the land components of global climate models.

How to cite: Cuesta-Valero, F. J., Naylor, P., García-García, A., and Peng, J.: Ground heat flux at daily scale? Estimates from machine learning models and Earth observation products, EGU General Assembly 2026, Vienna, Austria, 3–8 May 2026, EGU26-1554, https://doi.org/10.5194/egusphere-egu26-1554, 2026.

EGU26-2195 | Posters on site | CL2.1

Changes in Photosynthetically Active Radiation in Ukraine during 1961–2020 in the Context of Surface Radiation Budget Variability 

Svitlana Savchuk, Liudmyla Rybchenko, Svitlana Krakovska, Tetiana Shpytal, Anastasiia Chyhareva, Lidiia Kryshtop, and Vira Balabukh

Photosynthetically active radiation (PAR), the solar radiation absorbed by plants in the 380–710 nm wavelength range, represents a key component of the surface radiation budget and plays a central role in terrestrial carbon assimilation. Understanding long-term PAR variability is increasingly important in the context of regional climate change and shifts in radiative forcing that influence surface energy fluxes.

In Ukraine, routine PAR measurements are not performed due to the absence of standard instrumentation. Therefore, the quantification of PAR and the assessment of its multi-decadal variability require indirect reconstruction methods. This study develops a long-term PAR database for the warm season (April–October) using actinometric observations and the components of the surface radiation balance. Direct, diffuse, and total PAR were calculated using established conversion coefficients applied to measured shortwave radiation components. Spatial and temporal patterns were analysed using statistical and cartographic methods.

The primary study period is 1961–2020, complemented by several shorter sub-periods (1961–1990, 1991–2020, 1991–2000, 2001–2010, and 2011–2020) analysed comparatively to identify decadal and multi-decadal shifts in PAR components. Since the 1980s–1990s, consistent with global warming trends and associated radiative perturbations, the redistribution of solar radiation reaching the surface has been observed. These changes are linked to factors such as aerosol loadings, cloudiness variability, and large-scale circulation patterns, all of which affect the surface radiation budget.

Results indicate that direct, diffuse, and total PAR exhibit pronounced spatial gradients, increasing from western and northwestern regions, including the Ukrainian Carpathians, toward the Southern Steppe and Crimea. An increase in direct solar radiation during 2001–2010 relative to 1991–2000, and again in 2011–2020 relative to 1991–2000, resulted in marked increases in direct PAR. Conversely, declines in diffuse solar radiation resulted in reduced diffuse PAR, while heterogeneous changes in total shortwave radiation produced corresponding fluctuations in total PAR.

These findings highlight the sensitivity of PAR to long-term changes in the surface radiation budget and contribute to understanding how regional climate change is modifying the radiative environment that underpins terrestrial productivity.

How to cite: Savchuk, S., Rybchenko, L., Krakovska, S., Shpytal, T., Chyhareva, A., Kryshtop, L., and Balabukh, V.: Changes in Photosynthetically Active Radiation in Ukraine during 1961–2020 in the Context of Surface Radiation Budget Variability, EGU General Assembly 2026, Vienna, Austria, 3–8 May 2026, EGU26-2195, https://doi.org/10.5194/egusphere-egu26-2195, 2026.

EGU26-2407 | ECS | Orals | CL2.1

Integrating Topographic Effects into Global Downward Shortwave Radiation 

Yichuan Ma, Shunlin Liang, and Tao He

Downward shortwave radiation (DSR) is the primary energy source driving Earth’s climate, hydrological, and ecological processes. While mountains occupy approximately 24% of the global land surface and exhibit complex radiative transfer processes, current global climate models and satellite products predominantly rely on plane-parallel assumptions, thereby neglecting topographic effects such as shadowing and terrain-reflected radiation.

To quantify these impacts, we developed a hybrid physical and data-driven method to generate the global, daily DSR product at 0.05° resolution, incorporating topographic effects, spanning from 2003 to 2024. By integrating a mountainous radiative transfer scheme with machine learning, we successfully captured the spatiotemporal heterogeneity of DSR over rugged terrain. Our analysis reveals that ignoring topographic effects results in substantial uncertainties across scales (from daily to annually and grid to global scales). In rough terrain hotspots, such as High Mountain Asia, the annual mean bias exceeds 30 W/m² (>20%). The slope-dependent uncertainties in the original DSR product were substantially reduced in the new DSR product with topographic considerations, i.e., the RMSE decreased globally from 21.7 to 2.2 W/m² in areas with slopes exceeding 25°. The topographically corrected DSR better explains the spatial heterogeneity of land surface temperature variations across the terrains.

These findings suggest that topography acts as a critical modulator of the Earth system's energy flow. The uncertainties of DSR in mountainous areas imply propagated biases in simulations of the cryosphere (snowmelt), carbon cycle (gross primary productivity), and hydrological processes. We underscore the necessity of integrating topographic considerations to improve the understanding of climate mechanisms in vulnerable mountain ecosystems.

How to cite: Ma, Y., Liang, S., and He, T.: Integrating Topographic Effects into Global Downward Shortwave Radiation, EGU General Assembly 2026, Vienna, Austria, 3–8 May 2026, EGU26-2407, https://doi.org/10.5194/egusphere-egu26-2407, 2026.

EGU26-2707 | ECS | Orals | CL2.1

Evolution of land surface temperature in Beijing and its multi-source driving mechanisms 

Mengyao Zhou, Yiben Cheng, and Lixia Chu

Rapid urbanization and climate change have markedly shifted Beijing’s climate in recent decades from cold–dry toward warm–humid conditions, raising urgent questions about the dominant controls of its surface thermal environment. Using MODIS land surface temperature (LST) observations from 2000–2024, combined with NDVI, nighttime lights, the Human Footprint index, ERA5-Land meteorology, and surface albedo, we investigate the spatiotemporal evolution of LST and quantitatively attribute its drivers across spatial scales.

Long-term LST trends were robustly identified using Theil–Sen slopes and the Mann–Kendall test, while the relative contributions of natural and anthropogenic factors were quantified through ensemble machine-learning models (Random Forest and XGBoost) coupled with SHAP-based interpretability. This integrated framework enables a scale-aware attribution of LST dynamics rather than simple correlation analysis.

Pronounced urban heat island patterns are observed in Beijing’s core districts (Dongcheng, Xicheng, Haidian, Chaoyang, Fengtai, and Shijingshan), gradually weakening toward suburban areas. Between 2000 and 2024, LST increased significantly or highly significantly across 34.67% of the city—mainly in the urban core and southeastern districts (Daxing and Tongzhou)—while 63.52% experienced cooling, particularly around the Miyun Reservoir and along the Guishui River in Yanqing. Attribution results reveal that Human Footprint intensity and nighttime light activity exert the strongest warming effects, whereas vegetation greenness (NDVI), relative humidity, and soil moisture consistently mitigate LST. The maximum cooling rate is associated with NDVI values between 0.25 and 0.55. SHAP rankings identify Human Footprint, air temperature, NDVI, and nighttime lights as the dominant drivers at the metropolitan scale, while surface albedo plays a more prominent role within the urban core.

These findings provide a quantitative and interpretable assessment of the scale-dependent drivers shaping Beijing’s surface thermal environment and offer actionable insights for urban climate adaptation, including optimized green-space allocation, high-albedo surface renovation, and land-use planning.

How to cite: Zhou, M., Cheng, Y., and Chu, L.: Evolution of land surface temperature in Beijing and its multi-source driving mechanisms, EGU General Assembly 2026, Vienna, Austria, 3–8 May 2026, EGU26-2707, https://doi.org/10.5194/egusphere-egu26-2707, 2026.

EGU26-3342 | Posters on site | CL2.1

Towards Reassessing the Cryosphere Contribution to Earth’s Energy Imbalance 

Harry Zekollari, Lander Van Tricht, and Karina von Schuckmann

The Earth’s Energy Imbalance (EEI) provides a measure of net energy accumulation in the climate system driven by human emissions. The cryosphere plays an important role by absorbing energy primarily through phase change associated with the melt of glaciers, ice sheets, and sea ice. Land-based ice melt is, together with thermal expansion, the major contributor to global mean sea level rise. Recent Earth Heat Inventory estimates suggest that the cryosphere contributed to approximately 4% of total heat uptake over the period 1960-2020, mostly via latent heat of fusion required to convert ice to water.

However, the total heat uptake from the cryosphere term remains uncertain due to heterogeneous data coverage, methodological inconsistencies, and incomplete accounting of some cryospheric processes. In particular, observational constraints differ strongly between glaciers, ice sheets, and sea ice, and not all relevant energy pathways have been consistently quantified in previous efforts. These current limitations hamper robust annual updates needed for operational climate indicator efforts such as the Indicators of Global Climate Change and will likely become increasingly relevant for future assessments (e.g., for upcoming IPCC AR7).

Here, we outline a framework to update the cryospheric heat uptake by compiling and harmonizing the latest observational datasets on cryosphere change, converting mass and volume losses into energetic equivalents, and assessing uncertainty propagation and methodological sensitivity. Additionally, we also explore how cryosphere heat uptake may change in the future. As such, this work aims to refine the cryospheric contribution to the EEI, clarify its temporal evolution, and improve consistency between observational and model-based global energy budget estimates.

How to cite: Zekollari, H., Van Tricht, L., and von Schuckmann, K.: Towards Reassessing the Cryosphere Contribution to Earth’s Energy Imbalance, EGU General Assembly 2026, Vienna, Austria, 3–8 May 2026, EGU26-3342, https://doi.org/10.5194/egusphere-egu26-3342, 2026.

The radiative forcing of CO2, which measures its impact on surface warming, is found to vary with background climate state, a phenomenon known as state dependence. Recent studies have suggested the state dependence of radiative forcing in explaining the changes in equilibrium climate sensitivity, primarily due to enhancement of instantaneous forcing in climate states of higher CO2 concentrations. However, the role of atmospheric adjustment in shaping the overall forcing and its state dependence remains vague. Here we focus on stratospheric temperature adjustment, a dominant component of atmospheric adjustment affecting the magnitude of CO2 radiative forcing. Using CMIP6 data and a radiative transfer model, we find that forcing associated with stratospheric temperature adjustment decreases in higher CO2 climate states, offsetting the increase in instantaneous forcing and leading to a smaller overall forcing change with the climate state. To elucidate the mechanisms underlying this decrease, we decompose the forcing adjustment into three multiplicative components of TOA radiative kernel, layerwise temperature Jacobian and instantaneous heating rate perturbation. We find that changes in the kernel and Jacobian contribute weakly, whereas the instantaneous heating rate response dominates the reduction in adjustment. Using a cooling-to-space approximation, we further demonstrate that the combined effects of reduced emission and increased optical depth in a higher CO₂ climate state lead to weaker stratospheric temperature adjustment and thus forcing adjustment.

How to cite: He, R. and Huang, Y.: Stratospheric Temperature Adjustment Damps the State Dependence of CO2 Radiative Forcing, EGU General Assembly 2026, Vienna, Austria, 3–8 May 2026, EGU26-3513, https://doi.org/10.5194/egusphere-egu26-3513, 2026.

EGU26-4028 * | Orals | CL2.1 | Highlight

The Atmosphere’s Substantial Role in Interannual Variability of Earth’s Energy Imbalance 

Michael Mayer, Norman G. Loeb, John M. Lyman, Gregory C. Johnson, Susanna Winkelbauer, and Leopold Haimberger

Earth’s Energy Imbalance (EEI) is a key metric to quantify climate change. In the long-term mean, most of this excess heat is absorbed by the ocean due to its large thermal capacity.  A comparatively small fraction warms the land, melts ice and warms and moistens the atmosphere. However, this contribution shows that atmospheric storage plays a non-trivial role on shorter timescales.  We investigate the balance among variations in the global flux at the top of the atmosphere (TOA), the rate of oceanic warming, and storage variations in atmosphere, land, and sea ice from year to year over 2005-2024. We find that changes in ocean warming lead the net energy flux at TOA by 2 months, and these two time-series are fairly well correlated on these interannual time scales, but the sum of atmospheric and oceanic rates of energy uptake are better correlated with a maximum correspondence at zero time lag. Further improvements of the correlation are modest when also including energy storage variations in land and sea ice. Hence the atmosphere generally plays an important role in buffering and redistributing year-to-year energy uptake by the climate system, most notably during El Niño and La Niña events. Atmospheric heat uptake played a particularly strong role in 2023, when surface temperatures increased remarkably and the global net TOA flux reach a new record high, but ocean heat uptake showed a less extreme anomaly. These results demonstrate the need to monitor energy storage variations in all compartments of the climate system to better understand variations in EEI.

How to cite: Mayer, M., Loeb, N. G., Lyman, J. M., Johnson, G. C., Winkelbauer, S., and Haimberger, L.: The Atmosphere’s Substantial Role in Interannual Variability of Earth’s Energy Imbalance, EGU General Assembly 2026, Vienna, Austria, 3–8 May 2026, EGU26-4028, https://doi.org/10.5194/egusphere-egu26-4028, 2026.

The global hydrologic cycle is a fundamental physical constraint on the atmospheric energy budget. On global scales, the net radiative cooling of the atmosphere (Ratm) must be balanced by the sum of latent heating by precipitation (P) and sensible heat flux (H), yielding the constraint: Ratm​≈P+H. Despite the theoretical robustness of this equation, independent observations have historically failed to achieve exact closure, revealing a persistent residual imbalance that complicates the diagnostic use of the budget equation in physical studies.

To investigate this energy closure problem, we analyze three successive versions of the Global Precipitation Climatology Project (GPCP Versions 2.3, 3.2, and 3.3) in conjunction with the CERES data record for Ratm​ and the ERA5 Reanalysis for H. Although GPCP products were not developed with the explicit goal of energy budget closure, our findings reveal an unintended improvement in mean annual energy closure across these updates. The residual imbalance significantly decreases from v2.3 to v3.3, with the newest GPCP v3.3 product achieving the best mean closure, reconciling the budget to within 98%. This represents a substantial 10% improvement over the past two generations of precipitation products. Crucially, however, this improvement in the mean state is accompanied by a marked increase in the interannual variability of the residual anomalies. We hypothesize that this heightened anomaly variance is directly linked to localized adjustments in v3.3, specifically the enhanced precipitation magnitudes over the highly variable tropical Western Pacific oceanic region.

The finding that newer precipitation datasets unintentionally improve mean closure while simultaneously introducing variability in the temporal anomalies, presents a unique opportunity for physical diagnosis. This result necessitates a careful reassessment of how these global data products are utilized, particularly for studies of variability. This work provides critical observational context for understanding the partitioning of the global energy budget and highlights the imperative for continued efforts to reconcile independent satellite measurements of the Earth's energy and water cycles.

How to cite: Matus, A.: Understanding the Atmospheric Energy Budget using Global Precipitation Observations, EGU General Assembly 2026, Vienna, Austria, 3–8 May 2026, EGU26-4554, https://doi.org/10.5194/egusphere-egu26-4554, 2026.

EGU26-4639 | ECS | Orals | CL2.1

Observation-constrained estimates and diagnostic insights into black carbon radiative forcing across contrasting urban environments from multi-platform remote sensing 

Pravash Tiwari, Jason Blake Cohen, Hongrui Gao, Luoyao Guan, Zhewen Liu, Lingxiao Lu, Shuo Wang, Shahid Uz Zaman, and Kai Qin

Black carbon (BC) aerosols are commonly treated as a uniformly warming climate forcer, yet its radiative impact depends sensitively on particle microphysics, column loading, and vertical energy redistribution. Here, we present an observation-constrained assessment of BC radiative forcing over two contrasting Asian urban agglomerations-Dhaka (Bangladesh) and Xuzhou (China), using a multi-platform remote sensing framework that integrates multi-waveband satellite and ground-based observations as constraints. Multi-waveband single-scattering albedo (SSA) from TROPOMI and AERONET/SONET is used to constrain physically admissible BC core-shell size and mixing-state ensembles, which are further filtered using aerosol optical depth (AOD) to enforce column-integrated optical feasibility. The resulting microphysical ensembles and their associated optical properties are coupled with radiative transfer simulations to quantify clear-sky atmospheric (ATM), surface (SFC), and top-of-atmosphere (TOA) forcing at high spatial and temporal resolution.

We find that BC radiative forcing exhibits pronounced regional heterogeneity and a strong vertical redistribution of energy within the atmospheric column. Contrary to the canonical assumption of BC as a strictly warming TOA agent, weighted climatological means reveal substantial net TOA cooling over both regions (-15.0 ± 1.2 Wm-2 over Dhaka and -17.4 ± 2.6 Wm-2 over Xuzhou), with occasional episodic warming events. In contrast, atmospheric absorption is markedly stronger (18.2 ± 1.3 Wm-2 and 15.5 ± 1.9 Wm-2, respectively), corresponding to localized heating rates approaching ~0.3 K day-1, while surface cooling frequently exceeds -30 Wm-2. These results indicate that BC plays a larger role in regulating boundary-layer stability and regional energy balance than implied by TOA forcing alone.

Diagnostic analysis using multivariate decomposition reveals that BC radiative impacts are organized into a limited number of physically coherent pathways. In Dhaka, forcing variability is dominated by emission-driven column loading, producing tightly coupled atmospheric heating and TOA cooling, whereas in Xuzhou, variability is primarily regulated by column-integrated optical efficiency associated with particle aging and mixing state. Local forcing extremes frequently exceed the global mean effective radiative forcing of long-lived greenhouse gases by more than an order of magnitude, underscoring the inadequacy of coarse-scale or globally averaged frameworks for assessing BC-climate interactions. Together, these findings demonstrate that regional climate responses to BC are governed by microphysically mediated energy redistribution, highlighting the need for observation-constrained, high-resolution approaches to inform mitigation strategies in polluted environments.

How to cite: Tiwari, P., Cohen, J. B., Gao, H., Guan, L., Liu, Z., Lu, L., Wang, S., Zaman, S. U., and Qin, K.: Observation-constrained estimates and diagnostic insights into black carbon radiative forcing across contrasting urban environments from multi-platform remote sensing, EGU General Assembly 2026, Vienna, Austria, 3–8 May 2026, EGU26-4639, https://doi.org/10.5194/egusphere-egu26-4639, 2026.

EGU26-4877 | ECS | Orals | CL2.1

Attribution of Land Surface Albedo Changes in China over the Last 40 Years 

Jingping Wang, Xiaojuan Huang, Hanlin Niu, Shupeng Zhang, and Wenping Yuan

Surface albedo plays a key role in regulating land-atmosphere energy exchange, yet its spatiotemporal variability and underlying driving mechanisms remain inadequately quantified. This study first developed a machine learning model to reconstruct land surface albedo across China from 1980 to 2020, and conducted model experiments to separate the contributions of three primary drivers (i.e., land cover change, vegetation dynamics, and climate change) to albedo variations. Results show that the machine learning model can reproduce surface albedo with high accuracy. Over the past four decades, the mean albedo across the study area decreased by 0.0101, corresponding to a linear trend of -0.0003 yr-1. Attribution analysis indicates that climate change was the dominant driver over 55.30% of the land area, followed by vegetation dynamics (24.26%) and land cover change (20.44%). Climate forcing, through its control over snow cover, temperature, precipitation, and soil moisture, primarily governed both interannual fluctuations and long-term trends in albedo. In contrast, large-scale afforestation and ecological restoration led to substantial albedo decreases, particularly in southern and southwestern China. Sensitivity analysis further reveals strong spatial heterogeneity in albedo responses to leaf area index (LAI), with pronounced negative sensitivities in arid regions and weak or even positive effects in humid zones. Our findings highlight the dominant role of climate variability in shaping albedo dynamics, while demonstrating how large-scale ecological restoration and vegetation greening modulate surface energy balance under ongoing climate change.

How to cite: Wang, J., Huang, X., Niu, H., Zhang, S., and Yuan, W.: Attribution of Land Surface Albedo Changes in China over the Last 40 Years, EGU General Assembly 2026, Vienna, Austria, 3–8 May 2026, EGU26-4877, https://doi.org/10.5194/egusphere-egu26-4877, 2026.

EGU26-5470 | Posters on site | CL2.1

Current status of the Global Energy Balance Archive (GEBA) 

Martin Wild, Pascalle Smith, Jan Sedlacek, Jörg Trentmann, and Uwe Pfeifroth

The Global Energy Balance Archive (GEBA) is an international data center for worldwide measurements of energy fluxes at the Earth’s surface, maintained at ETH Zurich (https://geba.ethz.ch). The mission of GEBA is to compile all accessible sources of directly measured surface energy fluxes into a central data archive. GEBA has been continuously expanded and updated and currently contains around 700,000 monthly mean records of various surface energy balance components measured at approximately 2,700 locations worldwide. By far the most widely represented quantity is surface shortwave irradiance, also known as global radiation. Many of the historical records of this quantity stored in GEBA extend over multiple decades, with the longest record (Stockholm) dating back to 1927.

For nearly 35 years, since its opening to the internet in the early 1990s, GEBA has served the international scientific community and is well established as a major data source for measured surface energy fluxes. GEBA data have been used in numerous publications in leading peer-reviewed journals, including Nature and Science. GEBA has played a key role in a wide range of research applications, for example in quantifying the global energy balance as presented in the 5th and 6th IPCC Assessment Reports, and in the detection of pronounced multi-decadal variations in surface solar radiation, known as “global dimming” and “brightening”. GEBA is also widely used as a reference for the evaluation of climate models, reanalyses, and satellite-derived products. On a more applied level, GEBA data are becoming increasingly important for the planning and management of solar power capacities in support of the net-zero emissions target for 2050.

Beyond regular data updates and the acquisition of new datasets, current developments focus on the introduction of a versioning system to enable a traceable documentation of the GEBA data status, as well as on the application of quality-control procedures developed at DWD/CMSAF. In particular, homogeneity tests are foreseen to detect outliers, inhomogeneities and breakpoints in the GEBA station time series data based on comparisons with multiple independent satellite-derived and reanalysis estimates (e.g., SARAH-3, CLARA-A3, and ERA5).

Since 2019, GEBA has been co-funded by the Federal Office of Meteorology and Climatology MeteoSwiss within the framework of GCOS Switzerland.

How to cite: Wild, M., Smith, P., Sedlacek, J., Trentmann, J., and Pfeifroth, U.: Current status of the Global Energy Balance Archive (GEBA), EGU General Assembly 2026, Vienna, Austria, 3–8 May 2026, EGU26-5470, https://doi.org/10.5194/egusphere-egu26-5470, 2026.

Climate forcing due to increases in well-mixed greenhouse gases (e.g., CO2 and methane) and the radiative response to the forcing have led to an imbalance between how much solar radiant energy is absorbed by Earth and how much thermal infrared radiation is emitted to space. Presently, Earth is absorbing »1 Wm-2 more energy from the sun than it is emitting to space as infrared radiation. A positive Earth energy imbalance (EEI) is concerning as it leads to increases in global mean temperature, sea level, heat accumulation within the ocean, and melting of snow and sea ice. Satellite and in-situ measurements indicate that EEI has more than doubled since 2000, increasing at a rate of 0.43±0.17 Wm-2 per decade. To put this into context, the cumulative planetary heating since 2000 associated with EEI is a factor of 26 larger than the global direct primary energy consumption for the same period. In this presentation, I will discuss the observations used to track changes in EEI and summarize our current understanding of the factors driving the observed changes. Of particular interest are recent EEI changes: EEI anomalies relative to the long-term average have subsided appreciably owing to an unprecedented and prolonged increase in outgoing longwave radiation. The underlying causes for this will be discussed.

How to cite: Loeb, N.:  Earth’s Energy Imbalance: A Satellite Perspective, EGU General Assembly 2026, Vienna, Austria, 3–8 May 2026, EGU26-5505, https://doi.org/10.5194/egusphere-egu26-5505, 2026.

EGU26-6044 | Orals | CL2.1

Progress and Application of Outgoing Longwave Radiation Dataset from Fengyun Satellites 

Wanchun Zhang, Jian Liu, Ling Sun, Lin Chen, and Na Xu

Outgoing longwave radiation (OLR) at the top of the atmosphere (TOA) is a crucial parameter for understanding and interpreting the interactions between clouds, radiation, and climate. It has been one of the operational products of the Fengyun (FY) meteorological satellites. The accuracy of OLR has gradually improved due to advancements in satellite payload performance and the OLR retrieval algorithm. The Fengyun-3 (FY-3) satellite represents China's second generation of polar-orbiting meteorological satellites. Since the operational release of the OLR product from the FY-3A satellite in 2008, more than 17 years have passed. Throughout this time, the operational calibration and product retrieval algorithms have been continuously updated, resulting in variations in the accuracy of the operational products over different periods.

To address these inconsistencies, we conducted calibration consistency processing on the historical data from the Fengyun satellites and implemented a unified retrieval algorithm to reprocess the OLR products. This effort has led to the creation of a long-term dataset of outgoing longwave radiation from the top of the atmosphere for Fengyun satellites, covering the period from 2011 to the present. The dataset builds upon the original operational products and achieves multi-satellite consistency through the development of bias correction algorithms for inter-satellite discrepancies, as well as for correcting data biases caused by current orbital drifts. This dataset provides stable long-term support for climate services and scientific research, making it suitable for climate change monitoring and analysis. Furthermore, applications in monitoring climate events such as the Madden-Julian Oscillation (MJO) and the El Niño-Southern Oscillation (ENSO) are also explored.

How to cite: Zhang, W., Liu, J., Sun, L., Chen, L., and Xu, N.: Progress and Application of Outgoing Longwave Radiation Dataset from Fengyun Satellites, EGU General Assembly 2026, Vienna, Austria, 3–8 May 2026, EGU26-6044, https://doi.org/10.5194/egusphere-egu26-6044, 2026.

The Second-generation Global Imager (SGLI) onboard the Global Change Observation Mission–Climate (GCOM-C) is a polar-orbiting satellite launched by Japan Aerospace Exploration Agency (JAXA) on 23 December 2017. SGLI is a multi-wavelength optical radiometer with 19 spectral bands ranging from the near-ultraviolet to the thermal infrared. It provides unique observation capabilities, including polarization, multi-directional, and near-ultraviolet measurements, with a spatial resolution of up to 250 m and a swath width exceeding 1,000 km.

Assessing the climate influence of wildfires requires continuous observation of aerosols released by biomass burning, as well as quantitative evaluation of their optical characteristics and radiative impacts. In this work, we investigated large wildfire events occurring since 2018 across multiple regions, including Brazil, Angola, Australia, California, Siberia, and Southeast Asia. Based on observations from SGLI, we examined temporal variations in key aerosol optical parameters—namely aerosol optical thickness (AOT), Ångström exponent (AE), and single scattering albedo (SSA)—supplemented by complementary satellite and ground-based measurements.

Examination of the relationships between SSA and AE suggests that aerosol optical behavior is strongly influenced by ambient relative humidity and the dominant vegetation types involved in combustion, in agreement with earlier findings. In addition, variations in net incoming radiation at the top of the atmosphere were evaluated during periods of intense fire activity to quantify the direct radiative effects of biomass-burning aerosols. The analysis indicates pronounced negative radiative forcing, corresponding to a cooling effect, over oceanic areas, reaching −78 W m⁻² for Australia and −96 W m⁻² for California. In contrast, radiative forcing over land remains comparatively small, with values on the order of −10 W m⁻² across all examined regions.

These findings highlight the necessity of accounting for regional differences in aerosol optical properties and surface reflectance when estimating wildfire-related radiative forcing and when evaluating the future climatic implications of this short-lived climate forcer.

How to cite: Tanada, K., Murakami, H., and Shimada, R.: The GCOM-C Mission and Eight Years of Continuous Global Observations with the SGLI: Estimation of Aerosol Optical Properties and Radiative Forcing from Large-Scale Wildfires, EGU General Assembly 2026, Vienna, Austria, 3–8 May 2026, EGU26-6960, https://doi.org/10.5194/egusphere-egu26-6960, 2026.

EGU26-7093 | ECS | Posters on site | CL2.1

Contrasting Energy And Water Balance Regimes Between A Rewetted Peatland And An Abandoned Peat Extraction Area In Estonia 

Kadir Yıldız, Tianxin Wang, Mihkel Pindus, and Kuno Kasak

Peatland restoration has emerged as a key climate mitigation strategy due to its potential to reduce greenhouse gas emissions and improve ecosystem functioning. Beyond carbon cycling, restoration fundamentally alters surface energy partitioning and hydrological processes by modifying vegetation structure, water table dynamics, and surface-atmosphere exchanges. However, the extent to which rewetted peatlands in abandoned peat extraction areas differ from drained systems in terms of coupled energy and water balance dynamics remains poorly quantified, particularly under similar climatic forcing. Understanding these differences is essential for assessing the broader climatic and ecohydrological implications of peatland restoration. In this study, we compared the surface energy balance, water balance, and hydroclimatic controls at two contrasting peatlands in Estonia: Lavassaare, an abandoned drained peat extraction area, and Ess-soo, a recently rewetted site. Half-hourly radiation and turbulent flux measurements from 2024 were used to derive net radiation (Rn), sensible (H) and latent heat fluxes (LE), ground heat flux (G), evapotranspiration (ET), and potential evapotranspiration (PET). Monthly energy balance components exhibited strong seasonality at both sites, with LE dominating during the summer, while H increased during transitional dry periods. Annual ET totals were comparable between sites (449 mm at Ess-soo vs. 455 mm at Lavassaare), despite higher annual precipitation at Ess-soo (630 mm compared to 563 mm). As a result, Ess-soo exhibited a larger annual water surplus (P-ET = +181 mm), whereas Lavassaare operated closer to zero balance during the growing season. Hydroclimatic indices further revealed distinct functional regimes. Lavassaare showed consistently higher monthly dryness ratios (ET/P), reaching values near or above 1 during late spring, indicating temporary water limitation. In contrast, Ess-soo maintained lower ET/P values and a stronger water surplus throughout the year. Budyko analysis confirmed these patterns: Ess-soo occupied a more water-limited position (Φ = PET/P = 2.78; EI = ET/P = 0.71), whereas Lavassaare (Φ = 1.71; EI = 0.81) was closer to the energy-limited region of Budyko space. Together, these results demonstrate that the rewetted Ess-soo peatland maintains higher hydrological buffering capacity, while the abandoned Lavassaare site experiences stronger atmospheric demand relative to available water. The combined energy-water framework highlights the sensitivity of peatland surface-atmosphere exchanges to restoration status and provides a basis for understanding future ecosystem responses under changing climatic conditions.

How to cite: Yıldız, K., Wang, T., Pindus, M., and Kasak, K.: Contrasting Energy And Water Balance Regimes Between A Rewetted Peatland And An Abandoned Peat Extraction Area In Estonia, EGU General Assembly 2026, Vienna, Austria, 3–8 May 2026, EGU26-7093, https://doi.org/10.5194/egusphere-egu26-7093, 2026.

The radiative fluxes at the surface and at the top-of-the-atmosphere are key components of the Earth energy budget. In addition, the surface fluxes, in particular the surface solar radiation fluxes, are of high relevance for practical applications., e.g., for the planning and the monitoring of solar power systems. Data records often were designed for a certain application area like climate analyses or renewable energy, but their successful usage in a wide range of application and research areas underline their various benefits. 

Three satellite-based radiation data records are available from the CM SAF: CLARA, SARAH, and HANNA. These data records provide global daily information of the surface and the top-of-the-atmosphere radiation (CLARA-A3) as well as regional high resolution (space and time) data of the surface radiation (SARAH-3, HANNA) serving climate, solar energy, and other applications.

Here we will present the three CM SAF data records and compare their suitability for certain applications. While the global CLARA data record allows the assessment of larger-scale / global phenomena incl. the surface and the top-of-the-atmosphere radiation, the SARAH and the HANNA data records allows analysis of surface irradiance at smaller spatial and temporal scales.

How to cite: Trentmann, J. and Pfeifroth, U.: Assessing changes and variability of surface and top-of-the-atmosphere shortwave and longwave radiation with satellite data, EGU General Assembly 2026, Vienna, Austria, 3–8 May 2026, EGU26-7194, https://doi.org/10.5194/egusphere-egu26-7194, 2026.

EGU26-7437 | Orals | CL2.1

First preliminary demonstration of a new climate indicator “aerosol and cloud cooling” 

Thomas Popp, Ulrike Stöffelmair, Alexander Schall, Stefan Kinne, Marta Luffarelli, and Michael Eisinger

Since pre-industrial times anthropogenic aerosols counteract the climate warming attributed to anthropogenic greenhouse gases through direct and indirect effects. . Within the ESA CLIMATE-SPACE cross-ECV project SATACI (SATellite observations to improve our understanding of Aerosol-Cloud Interactions), a feasibility study is conducted to demonstrate the use of global, long-term satellite data records to derive a new climate indicator for the monitoring of the cooling offset due to anthropogenic aerosols and aerosol modified clouds. This new climate indicator intends to complement the existing tableau of WMO climate indicators (e.g. surface temperature, atmospheric CO2 concentrations).

The new indicator is based on off-line (dual call) two-stream radiative transfer simulations. Baseline optical aerosol properties are taken from the MACv3 aerosol climatology, which is tied to multi-annual ground-based statistics from sun-/sky photometry and derived aerosol type contributions. Aerosol indirect effects are included based on statistical associations between relevant aerosol and cloud properties. In a stepwise approach, key aerosol properties (i.e. AOD, fine mode fraction, Dust AOD, absorbing AOD) and key aerosol/ cloud associations (i.e. fine mode AOD vs cloud droplet number concentrations, low level cloud cover) will be replaced with CCI / Copernicus Climate Change Service (C3S) (and other, such as CM-SAF) satellite retrievals. Outputs are global monthly maps and time series of aerosol impact associated radiative effects at the top of the atmosphere (TOA).

Uncertainties and diversity between different satellite datasets and aerosol cloud associations will be assessed by using different satellite data records for each variable and through uncertainty propagation of those satellite inputs through the radiative transfer code following the FIDUCEO principles. This feasibility study aims at providing an initial demonstration of a cooling indicator, assessing its potential, by exploiting the value of global, consistent, multidecadal satellite records, and identifying its limitations, such as diversity and uncertainties. To ease communication, a simple parameterization (similar to the last IPCC report) to convert TOA radiative effect changes to an equivalent surface temperature change (0.7W/m2 ~ 1 Celsius) will be applied.

This paper will discuss the methodology, the uncertainty propagation strategy and initial demonstrations of the climate indicator using MODIS aerosol retrievals between 2000 – 2021 as well as four different C3S dual view records (1996 – 2012 and 2017 – 2025) of AOD and Fine Mode AOD.

How to cite: Popp, T., Stöffelmair, U., Schall, A., Kinne, S., Luffarelli, M., and Eisinger, M.: First preliminary demonstration of a new climate indicator “aerosol and cloud cooling”, EGU General Assembly 2026, Vienna, Austria, 3–8 May 2026, EGU26-7437, https://doi.org/10.5194/egusphere-egu26-7437, 2026.

EGU26-8007 | Orals | CL2.1

The Radiative Forcing Model Intercomparison Project for CMIP7 

Chris Smith, Ryan Kramer, and Timothy Andrews

Reducing uncertainties in future climate projections requires improved understanding of both the effective radiative forcing (ERF) and the climate response. The Radiative Forcing Model Intercomparison Project (RFMIP) for CMIP7 proposes a set of diagnostic experiments in global climate models to evaluate ERF in these models.

Experiments in RFMIP are run with a pre-industrial climatology of sea surface temperatures (labelled piClim) to minimize the influence of surface temperature change on the top-of-atmosphere energy budget. With an atmosphere-only configuration, as there is no slow ocean response, models equilibrate quickly to a change in forcing and do not require long run times. We use 30-year “time slice” experiments to diagnose ERF to steady-state changes to different combinations of forcing agents. We also propose a set of 251-year (1850-2100) “transient” experiments where forcings are prescribed following historical and future trajectories. 

Diagnosing radiative forcing is a core model property, and therefore three previous RFMIP experiments have been selected to be included in the CMIP7 DECK:

  • piClim-control (timeslice; baseline comparison for other experiments)
  • piClim-4xCO2 (timeslice; quadrupling of pre-industrial CO2 concentrations)
  • piClim-anthro (timeslice; present-day anthropogenic forcers)

Furthermore a set of RFMIP experiments are identified as highly societally relevant and have been included in the CMIP7 Assessment Fast Track (AFT): 

  • piClim-aer (timeslice; present-day aerosols)
  • piClim-histaer (transient; historical and future aerosols)
  • piClim-histall (transient; historical and future all forcings)

Outside of DECK and AFT, we organise RFMIP experiments into three tiers by priority and the likelihood of modelling centers’ ability to run them. All CMIP6 RFMIP experiments are present in Tiers 1 and 2. We propose novel extensions in Tier 3, including fixing land as well as sea surface temperatures (piClim-FixedTL) in order to more accurately estimate the ERF; evaluating CO2 ERF at different concentrations other than a quadrupling to assess deviation from logarithmic behaviour; changing the climatic baseline to investigate surface temperature effects; and including biogeochemically and radiatively decoupled analogues of piClim-4xCO2.

How to cite: Smith, C., Kramer, R., and Andrews, T.: The Radiative Forcing Model Intercomparison Project for CMIP7, EGU General Assembly 2026, Vienna, Austria, 3–8 May 2026, EGU26-8007, https://doi.org/10.5194/egusphere-egu26-8007, 2026.

EGU26-8279 | ECS | Posters on site | CL2.1

What is the net radiative forcing resulting from the impoundment of a hydroelectric reservoir in the boreal region? A case study of the Romaine Complex. 

Deirdre Spearns, Antoine Thiboult, Murray MacKay, François Anctil, and Daniel Nadeau

Globally, hydropower is a leading source of renewable energy, however the hydroclimatic impact of the creation of hydroelectric reservoirs in northern regions is not well understood. The impoundment of hydroelectric reservoirs modifies the surface properties and the energy exchange between the earth’s surface and the atmosphere. In warm regions, due to the low albedo of water, most of the solar radiation is absorbed, and impoundment results in a positive radiative forcing. However, in cold regions, due to the presence of ice cover during several months of the year and the high albedos of snow and thick ice, the net annual radiative forcing may be negative. The magnitude of the negative radiative forcing depends on the pre-impoundment environment, as the vegetation type influences the albedo increase due to snow cover over terrestrial environments. A case study of the Romaine hydroelectric complex in Côte-Nord, Quebec (~51°N, ~63°W) is used to evaluate the net radiative forcing resulting from reservoir impoundment in the boreal region. Four-component radiometers are deployed during the open water periods on the Romaine-2 reservoir (2018-present) and year-round at two sites typical of the pre-impoundment environment, Lac Bernard (2022-present) and a forested site (2018-present). First, the radiative forcing is investigated through comparisons of in situ albedo measurements using the natural lake, Lac Bernard, and the primarily black spruce boreal forest site as proxies for post and pre-impoundment conditions. Preliminary results indicate an annual negative radiative forcing due to increased reflection during the ice cover period, as the seasonal variation of the midday albedo of the lake (~0.02 to ~0.8) is greater than that of the forest (~0.08 to ~0.2). The lake’s increased longwave emissions during the later part of the open water period also contributes to the negative radiative forcing. Second, the Canadian Small Lake Model, a 1D dynamic lake model, will be used to spatialize the analysis to the scale of the Romaine-2 reservoir and simulate the radiative forcing resulting from the impoundment under future climate conditions.

How to cite: Spearns, D., Thiboult, A., MacKay, M., Anctil, F., and Nadeau, D.: What is the net radiative forcing resulting from the impoundment of a hydroelectric reservoir in the boreal region? A case study of the Romaine Complex., EGU General Assembly 2026, Vienna, Austria, 3–8 May 2026, EGU26-8279, https://doi.org/10.5194/egusphere-egu26-8279, 2026.

EGU26-8351 | ECS | Orals | CL2.1

The energetic expression of monthly atmospheric heat transport variability 

Hamish Prince, Aaron Donohoe, and Tristan L'Ecuyer

The poleward transport of energy through the atmosphere is a fundamental characteristic of Earth’s climate system, being consistent with both the dynamic movement of moist static energy and the atmospheric energy budget. The variability of the atmospheric energy budget must therefore be consistent with atmospheric dynamics, but to what extent the relationship holds, the relative importance of the energy budget terms, and the similarity between hemispheres remains unexamined. Here, we examine the monthly relationship between the zonal mean atmospheric heat transport (AHT) and the atmospheric energy budget across the entire globe. We find that for an AHT anomaly across a given latitude, the energetic response is limited to a ±15° latitude band. In other words, enhanced heat transport across 30°N is only associated with atmospheric energy budget anomalies between 15°N and 45°N. Furthermore, enhanced monthly poleward AHT is typically associated with anomalous latent heating on the equatorward side and increased losses of energy through radiative cooling on the poleward side. In fact, gains of energy through radiative heating is only very weakly correlated with enhanced monthly poleward AHT, demonstrating the importance of atmospheric heating from the surface turbulent heat fluxes on monthly AHT anomlies. These conclusions are consistent in both reanalysis and observationally derived data products. This research refines our understanding of monthly AHT anomalies and their connection to the local energy budget, providing a unique, robust benchmark for the representation of Earth’s energy budget within climate models.

How to cite: Prince, H., Donohoe, A., and L'Ecuyer, T.: The energetic expression of monthly atmospheric heat transport variability, EGU General Assembly 2026, Vienna, Austria, 3–8 May 2026, EGU26-8351, https://doi.org/10.5194/egusphere-egu26-8351, 2026.

The Arctic region is experiencing the most rapid warming on earth, significantly perturbing its surface ecosystems and energy balance. Accurately quantifying the Arctic surface radiation budget, particularly the shortwave component, is critical for understanding both regional climate change and the global energy budget. Despite ongoing advances in observational technologies and analytical methods, uncertainty in cloud fraction (CF) exerts a dominant control on the accuracy of surface shortwave radiation (SW) estimation. Existing studies indicate that Arctic clouds are dominated by low-level ice-phase and mixed-phase clouds. Daytime cloud fraction peaks in September and reaches a minimum in April, and is generally higher over ocean than over land. Most datasets suggest an overall increase in total Arctic cloudiness. However, substantial disagreements persist regarding trend magnitude, seasonal dependence, and contributions from different vertical layers, leading to SW differences of approximately 20–70 W m⁻². These discrepancies primarily arise from inconsistent CF definitions and spatiotemporal scales, sensors and sampling geometry differences, cross-calibration and processing biases, cloud detection and phase- discrimination errors over bright surfaces and during polar night, and valuation uncertainty arising from sparse and non-uniform ground-based references. Consequently, existing Arctic SW products still fall short of the requirements for energy-budget closure and climatological applications. This study synthesizes recent advances in understanding Arctic cloud fraction and its critical impact on surface SW, highlights the principal challenges, and outlines promising future research avenues. This endeavor aims to furnish a clearer scientific foundation for improving predictions of polar and global radiative energy dynamics and climate change.

How to cite: Liu, X. and He, T.: Understanding the Impact of Arctic Cloud Fraction on Surface Shortwave Radiation: Recent Progress, EGU General Assembly 2026, Vienna, Austria, 3–8 May 2026, EGU26-8776, https://doi.org/10.5194/egusphere-egu26-8776, 2026.

EGU26-9120 | ECS | Orals | CL2.1

The impact of vegetation response to CO2 on energy fluxes at Earth's surface and top of atmosphere 

Niels Behr, Markus Reichstein, and Alexander J. Winkler

Increasing concentrations of atmospheric CO2 alter the Earth's energy budget not only by interaction with radiation, but also through adjustments of the climate state. One set of such adjustments is mediated by the response of vegetation to an increase in CO2: Changes in vegetation cover and leaf area index (LAI) as well as CO2-induced plant stomatal closure alter surface fluxes of radiation, heat, and water. These changes in surface fluxes in turn affect atmospheric temperature, water vapor, and cloud cover, further affecting the Earth's energy balance. Past studies have shown that stomatal closure leads to a positive radiative forcing at the top of atmosphere (TOA), largely caused by adjustments of clouds to reduced transpiration. However, the full set of adjustments including the role of LAI changes and the surface energy balance have not been considered in investigations of the Earth's energy budget.

We aim to provide a detailed analysis of energy budget changes at the land surface and TOA by utilizing idealized simulations performed with the Max-Planck-Institute Earth System Model, and place these results in the context of a larger ensemble by analysing transient C4MIP simulations with a similar coupling. In our simulations we prescribe an abrupt doubling of CO2 concentration only seen by the land model, while its atmospheric counterpart continues to experience pre-industrial conditions. This isolates the response of vegetation and changes to the climate system resulting from it, by omitting the direct response of the atmosphere and radiation to increased CO2. To estimate which changes originate from an increase in LAI, an additional experiment is run with prescribed LAI per vegetated area.

Preliminary results show persistent decreases in near-surface relative humidity and low cloud cover over land, especially pronounced in the extra-tropics. As a result, incident shortwave radiation at the land surface increases by 0.85 Wm-2 in the global average. Together with a decreased latent heat flux, this is compensated by a greater sensible heat flux and moderate temperature increase, causing more longwave emission. Accordingly, the outgoing radiation at the TOA shows a decrease in the shortwave component, but an increase in longwave radiation. The simulation with prescribed LAI shows a much higher radiative forcing of 0.33 Wm-2 compared to 0.13 Wm-2 in the experiment with dynamically evolving LAI, suggesting that adjustments in LAI could compensate significant parts of the forcing through CO2-induced stomatal closure. However, this signal is less robust compared to the persistent changes and will require additional, dedicated experiments to be investigated thoroughly. These findings show a long term effect of stomatal closure on surface energy fluxes and suggest that considering LAI response to increased CO2 could alter estimates of radiative forcing, highlighting the need for further study.

How to cite: Behr, N., Reichstein, M., and Winkler, A. J.: The impact of vegetation response to CO2 on energy fluxes at Earth's surface and top of atmosphere, EGU General Assembly 2026, Vienna, Austria, 3–8 May 2026, EGU26-9120, https://doi.org/10.5194/egusphere-egu26-9120, 2026.

The Antarctic Peninsula has undergone exceptional warming, triggering major changes in sea ice extent in the Bellingshausen and Weddell Seas and modifying the regional radiation and atmospheric energy balance. Understanding and representing air-sea-ice interaction processes remains a fundamental requirement for reliably projecting future climate change in the ice-covered Southern Ocean and its implications beyond the polar regions. As part of the SURFEIT (Surface Fluxes in Antarctica) project, airborne observations of turbulent fluxes, long and shortwave radiation, and surface characteristics are analysed to assess the role of sea ice, leads, and coastal polynyas in shaping the Antarctic atmospheric boundary layer and its radiation and energy balance. The analysis shows that variations in sea ice parameters, including albedo, temperature, and ice concentration, significantly influence both the surface energy budget and atmospheric boundary layer development. In austral summer conditions, radiative terms dominate the surface energy balance in sea-ice-covered regions, with turbulent sensible and latent heat fluxes playing a secondary role. Under warm air advection and Föhn events in the Weddell Sea, leads and polynyas exhibit an oasis effect marked by a negative Bowen ratio, consistent with enhanced snow and ice melting. Conversely, cold air advection results in positive Bowen ratio and sea ice production. The sum of sensible and latent heat fluxes (compensation fluxes) alternates between positive and negative values. In cold-air situations, variability in net radiation is compensated by turbulent fluxes, revealing a negative feedback mechanism, while such compensation breaks down under warm-air conditions. Using the observational data, we evaluated parameterizations of energy budget components and surface albedo, deriving effective atmospheric parameters needed for bulk-flux parameterisations in numerical models and for the validation of satellite and model outputs.

How to cite: Weiss, A.: The radiation and energy budget over Antarctic Sea Ice: Insights from the SURFEIT Project, EGU General Assembly 2026, Vienna, Austria, 3–8 May 2026, EGU26-9729, https://doi.org/10.5194/egusphere-egu26-9729, 2026.

EGU26-10955 | ECS | Posters on site | CL2.1

Assessing the impact of 3d cloud structures on broadband fluxes derived from synthetic satellite radiances 

Teresa Kunkel, Martin Stengel, Jan Kolja Wagner, Fabian Senf, and Bernhard Mayer

The Earth’s energy budget heavily depends on the cloud radiative effect (CRE). A common approach to determine the top-of-atmosphere broadband radiative fluxes in cloudy conditions is their calculation from derived cloud properties, primarily optical thickness (COT) and effective radius (CER), which can be retrieved from passive satellite observations. In many operational retrieval algorithms simplifying 1d assumptions such as the independent pixel approximation are applied. However, accounting for 3d cloud effects is important for correctly determining the CRE and thus the Earth’s energy budget.

In our project we use the 3d Monte Carlo radiative transfer model MYSTIC in order to compare synthetic satellite radiances based on 1d or full 3d calculations. We present results for three case studies with different cloud types for which we derive COT and CER from these synthetic satellite radiances and then derive the corresponding broadband fluxes. Evaluating the derived cloud properties and broadband fluxes allows for estimating for which cloud types and viewing/illumination conditions 3d effects are more relevant and thus pose more problems for satellite-based estimates of the CRE when following the given approach. This will help us in developing strategies to better account for 3d effects and thus to potentially improve the determination of the CRE using satellite data. Our preliminary results indicate that the differences between 1d and 3d radiances and thus cloud properties and broadband fluxes are larger for cumulus clouds than for low, stratiform clouds, i.e., 3d effects are more relevant for these cases.

This work is part of the Research Unit named C3SAR (Cloud 3D Structure and Radiation, www.c3sar.de) funded by the Deutsche Forschungsgemeinschaft (DFG, German Research Foundation), in which cloud modelling, radiative transfer as well as ground and satellite observations are complementary components for assessing the role of 3d cloud variability in estimating the Earth’s energy budget. 

How to cite: Kunkel, T., Stengel, M., Wagner, J. K., Senf, F., and Mayer, B.: Assessing the impact of 3d cloud structures on broadband fluxes derived from synthetic satellite radiances, EGU General Assembly 2026, Vienna, Austria, 3–8 May 2026, EGU26-10955, https://doi.org/10.5194/egusphere-egu26-10955, 2026.

EGU26-13181 | ECS | Posters on site | CL2.1

Spatial solar irradiance emulation of Monte Carlo ray tracing with multi-view all-sky imagery 

Max Aragon Cerecedes, Yves-Marie Saint-Drenan, Yehia Eissa, Philippe Blanc, Menno Veerman, Chiel van Heerwaarden, and Thomas Schmidt

Explicit 3D radiative transfer captures the complex spatial variability of global horizontal irradiance (GHI) under shallow cumulus clouds, but is computationally prohibitive for real-time operational use. We address this by introducing a simulation-to-reality framework that emulates 3D radiative transfer via a neural network trained on synthetic data to translate multi-view all-sky imagery into 2D GHI maps. To produce the training data, we ran large eddy simulations at 50 m horizontal resolution for 10 selected cloud dynamic days (April to July 2022) over a 14 km x 14 km domain. The resulting cloud fields were coupled with Monte Carlo ray tracing to render synthetic all-sky images from virtual camera locations matching the Eye2Sky camera network and to compute the corresponding GHI maps. Two datasets are generated, (1) raw synthetic renderings and (2) enhanced renderings with camera-specific characteristics from the real-world. Identical image-to-image neural networks are trained on these datasets and applied to real Eye2Sky imagery, with predicted GHI maps validated against co-located pyranometers. By incorporating sensor-specific characteristics, we quantify the benefit of reducing the simulation-to-reality gap and assess whether synthetic pre-training using neural network emulations can support operational solar irradiance mapping as an alternative to computationally expensive physical simulations.

How to cite: Aragon Cerecedes, M., Saint-Drenan, Y.-M., Eissa, Y., Blanc, P., Veerman, M., van Heerwaarden, C., and Schmidt, T.: Spatial solar irradiance emulation of Monte Carlo ray tracing with multi-view all-sky imagery, EGU General Assembly 2026, Vienna, Austria, 3–8 May 2026, EGU26-13181, https://doi.org/10.5194/egusphere-egu26-13181, 2026.

EGU26-13929 | ECS | Posters on site | CL2.1

Quantifying radiative effects of the cloud–clear-sky transition using ground-based infrared imagery 

Elion Hack, Jair Max Furtunato Maia, Dimitri Klebe, Rodrigo Augusto Ferreira de Souza, Jaidete Monteiro de Souza, Kemely Araújo Pereira, Cauã Medeiros de Oliveira, and Theotonio Pauliquevis

Clouds exert a fundamental control over the Earth’s radiative balance by modulating both incoming shortwave solar radiation and outgoing longwave terrestrial radiation, resulting in a net radiative cooling of approximately 19 Wm-2. In contrast to well-mixed greenhouse gases such as CO2 and methane, the radiative impact of clouds exhibits strong spatial and temporal variability, making it intrinsically difficult to quantify and one of the dominant sources of uncertainty in contemporary climate models.

This study addresses a complementary and often overlooked aspect of this problem: the cloud–clear-sky interface, characterized by a continuous transition between cloudy and cloud-free conditions. Due to this gradual transition, defining the boundaries of a cloud region is not straightforward and depends strongly on the observational context. In numerical models, clouds are typically defined using relative humidity thresholds, whereas satellite-based cloud detection relies on radiance thresholds that vary across spectral bands.

Here, we analyze ground-based thermal infrared imagery (10–12 µm) by comparing observations with modeled clear-sky radiances. Using radiance exceedances relative to clear-sky emission, we quantify the radiative effect associated with the cloud–clear-sky transition. A preliminary analysis based on a limited subset of the available dataset indicates that the selection of cloud spectral radiance thresholds can lead to differences of approximately 0.4 Wm-2µm-1 when compared with definitions that classify clouds only under high-confidence conditions. A comprehensive analysis will be completed prior to the conference.

The data were collected at four distinct sites: the Atmospheric Radiation Measurement (ARM) Southern Great Plains (SGP) observatory in Oklahoma, USA; the Federal University of São Paulo (UNIFESP), Diadema campus, located in the metropolitan region of São Paulo, Brazil; and two sites in the Amazon region—Amazonas State University (UEA), Escola Normal Superior, near downtown Manaus, Brazil, and Embrapa Amazônia Ocidental, situated in a rural area of Manaus. Measurements conducted in the Amazon region are part of the project “Measurements of cloud properties relevant to improving the prediction of intense rainfall in Manaus”, funded by Fundação de Amparo à Pesquisa do Estado do Amazonas (FAPEAM).

How to cite: Hack, E., Max Furtunato Maia, J., Klebe, D., Augusto Ferreira de Souza, R., Monteiro de Souza, J., Araújo Pereira, K., Medeiros de Oliveira, C., and Pauliquevis, T.: Quantifying radiative effects of the cloud–clear-sky transition using ground-based infrared imagery, EGU General Assembly 2026, Vienna, Austria, 3–8 May 2026, EGU26-13929, https://doi.org/10.5194/egusphere-egu26-13929, 2026.

EGU26-14365 | ECS | Orals | CL2.1

Biases in Historical SSTs Propagate to Key Metrics of Radiative Balance and Global Change 

Nathan Lenssen, Duo Chan, Yue Dong, Adam Phillips, and Clara Deser

Recent work has shown that many observational products of sea surface temperature (SST) contain substantial biases in the early 20th century. Historical SST data is critical for estimating many key properties of the global climate system through its role in modulating global and regional temperature variability and change. The global and regional responses of the atmospheric and land surface are quantified using atmosphere-only GCMs (AGCMs) forced with historical SSTs. Here, we investigate how SST biases affect  atmospheric variability and trends using  an AGCM ensemble forced with SSTs from the infilledDynamically Consistent ENsemble of Temperature (DCENT-I), a recently published surface temperature product that better accounts for such biases. We compare this ensemble with an identically configured AGCM ensemble forced with ERSSTv5, a SST product with substantial early 20th-century biases. We find that DCENT-I SSTs produce more realistic terrestrial temperature trends. In addition, we explore the consequences of this updated SST dataset for estimates of climate sensitivity and pattern effects. Together, we demonstrate the critical need for accurate estimates of historical SST for understanding both the forced response and internal variability.

How to cite: Lenssen, N., Chan, D., Dong, Y., Phillips, A., and Deser, C.: Biases in Historical SSTs Propagate to Key Metrics of Radiative Balance and Global Change, EGU General Assembly 2026, Vienna, Austria, 3–8 May 2026, EGU26-14365, https://doi.org/10.5194/egusphere-egu26-14365, 2026.

EGU26-14671 | Posters on site | CL2.1

Deriving Hourly Synoptic FLASHFlux High-Resolution Low-Latency Global Radiative Fluxes Using NASA Langley SatCORPS Global Cloud Composite Data 

Fu-Lung Chang, Paul Stackhouse, Parnchai Sawaengphokhai, Arun Gopalan, William Smith, David Doelling, and Baojuan Shan

NASA’s Fast Longwave And SHortwave radiative Flux (FLASHFlux) project aims to generate low-latency operational global surface and top-of-atmosphere radiative flux data within one week of initial satellite measurements. The surface radiation budget is crucial for modulating and improving our understanding of many atmospheric, oceanic and land surface processes within the Earth system. The top-of-atmosphere (TOA) radiation budget is a key radiative forcing in the climate system. NASA’s Clouds and Earth's Radiant Energy System (CERES) is currently producing global radiation data using world-class satellite measurements. While CERES’s radiative flux products are of extremely high quality and accuracy, extensive data processing and months of validation are required to ensure their high accuracy before releasing climate-quality data. CERES data is typically released ~3 months after measurement acquisition. However, many users desire access to CERES data on a near real-time basis.

The FLASHFlux project provides a valuable resource for users who require near real-time global and regional radiative flux data. To improve efficiency, FLASHFlux has demonstrated its ability to generate high-quality radiative fluxes within a week of initial measurements while maintaining a certain level of accuracy using a simplified temporal extrapolation for CERES instrument calibration. FLASHFlux data provides daily average fluxes originally using both Terra and Aqua MODIS imagers and CERES measures.  However, now FLASHFlux only uses measurements from NOAA-20 satellite VIIRS and MODIS instruments. FLASHFlux’s existing algorithms utilize meteorological and surface data from the Goddard Earth Observing System Instrument Team reanalysis (GEOS-IT), a parameterized radiative algorithm for inferring surface radiative fluxes, and a diurnal variation model for temporal interpolation to compute estimates of the daily averaged radiative fluxes gridded to 1x1 degrees. To increase the diurnal sampling of clouds and improve the flux products, FLASHFlux data will leverage NASA Langley’s SatCORPS (Satellite ClOud and Radiation retrieval System) hourly Global Cloud Composite (GCC) data. SatCORPS GCC is a comprehensive algorithm designed to obtain high spatiotemporal resolution global cloud information fusing imagery data from operational geostationary and polar-orbiting meteorological satellites. Cloud, atmospheric and surface data are integrated into the NASA Langley CERES version of radiative transfer model to calculate radiative fluxes at the surface and TOA. FLASHFlux will generate a global hourly gridded radiative flux product with an initial resolution of 1°x1°, which will be increased to 0.5°x0.5° in future versions to meet the needs of users requiring near-real-time radiative flux data. An overview of progress towards promoting this new operation system and the resulting radiative fluxes are described.  Comparisons against formal CERES Ed4.2 SYN1Deg data products, current FLASHFlux products and limited sets of surface observations are presented where possible.

How to cite: Chang, F.-L., Stackhouse, P., Sawaengphokhai, P., Gopalan, A., Smith, W., Doelling, D., and Shan, B.: Deriving Hourly Synoptic FLASHFlux High-Resolution Low-Latency Global Radiative Fluxes Using NASA Langley SatCORPS Global Cloud Composite Data, EGU General Assembly 2026, Vienna, Austria, 3–8 May 2026, EGU26-14671, https://doi.org/10.5194/egusphere-egu26-14671, 2026.

EGU26-15081 | ECS | Orals | CL2.1

Two decades of AERONET analysis of fine and coarse-mode aerosols impacts on radiative forcing 

Pedro Tavares, Marco Franco, Fernando Morais, and Paulo Artaxo

The Amazon rainforest offers a unique experimental framework to assess aerosol effects on the radiative balance, given the interplay between a low-concentration, biogenically dominated background state and episodic, high-concentration anthropogenic perturbations or Saharan dust and smoke plume intrusions within a spatiotemporally varied aerosol population. Whereas previous studies have characterized the seasonal dynamics of the optical properties of these particles, disentangling the radiative effects of different-sized aerosols remains challenging. Our study focused on distinguishing the contributions of fine- and coarse-mode aerosols to top-of-atmosphere (TOA) radiative forcing (RF) and on evaluating a comprehensive suite of aerosol optical properties across six AERONET sites in the Amazon over 2 decades (2000-2024). This was performed by assigning labels to each data point based on the daily average of fine- and coarse-mode aerosol optical depths (AODs), using thresholds to categorize aerosol conditions as “low” (below 25th percentile) or “high” (above 75th percentile), and then evaluating each kind of event. For every site, events of low fine-mode and low coarse-mode (LL), and low fine-mode and high coarse-mode (LH) conditions usually occur during the wet season and the transition from wet to dry season. Conversely, events of high fine-mode and low coarse-mode (HL) and high fine-mode and high coarse-mode (HH) conditions usually occur during the dry season. Across all sites, under low fine-mode conditions, the AOD shows a strong dependence on the coarse-mode, with increases of approximately 131% from LL to LH. However, under high fine-mode conditions, the AOD shows a weaker dependence on the coarse-mode, with increases of approximately 12% from HL to HH. Regarding TOA RF, sites in the deforestation arc show a weak dependence on coarse-mode under both low and high fine-mode conditions (RFLL = -3.15 W/m² to RFLH = -3.05 W/m² and RFHL = -31.3 W/m² to RFHH = -33.4 W/m²). In contrast, sites in the central-north region show a stronger dependence on coarse-mode (RFLL = -4.40 W/m² to RFLH = -11.1 W/m² and RFHL = -20.0 W/m² to RFHH = -29.1 W/m²). For a multilinear regression model in the form RF = cFM AODFM + cCM AODCM, where cFM and cCM are the RF efficiencies of fine- and coarse-mode per unit of their respective AODs, we obtained cFM = -25 W/m² and cCM = -95 W/m² for the deforestation arc sites, and cFM = -39 W/m² cCM = -66 W/m² for the central-north Amazon ones. In conclusion, we have shown that coarse-mode aerosols contribute significantly to all the optical properties analyzed, particularly by increasing AOD during low fine-mode conditions and by enhancing (in magnitude) radiative forcing at sites in the central-north Amazon. Moreover, as all RF efficiencies are negative, the predominant aerosol effect in the Amazon atmosphere is always cooling, and the coarse-mode efficiency is consistently greater than the fine-mode efficiency at all sites. 

How to cite: Tavares, P., Franco, M., Morais, F., and Artaxo, P.: Two decades of AERONET analysis of fine and coarse-mode aerosols impacts on radiative forcing, EGU General Assembly 2026, Vienna, Austria, 3–8 May 2026, EGU26-15081, https://doi.org/10.5194/egusphere-egu26-15081, 2026.

EGU26-16894 | Orals | CL2.1

The Earth Climate Observatory space mission concept for the monitoring of the Earth Energy Imbalance 

Steven Dewitte, Thorsten Mauritsen, Benoit Meyssignac, and Thomas August and the ECO Science Team

Monitoring the Earth Energy Imbalance (EEI) is of prime importance for a predictive understanding of climate change. Furthermore, monitoring of the EEI gives an early indication on how well mankind is doing in implementing the Paris Climate Agreement. EEI is defined as the small difference between the incoming energy the Earth receives from the Sun and the outgoing energy lost by Earth to space. The EEI is cumulated in the Earth climate system, particularly in the oceans, due to their substantial heat capacity, and results in global temperature rise. Currently the best estimates of the absolute value of the EEI, and of its long term variation are obtained from in situ observations, with a dominant contribution of the time derivative of the Ocean Heat Content (OHC). These in situ EEI observations can only be made over long time periods, typically a decade or longer. In contrast, with direct observations of the EEI from space, the EEI can be measured at the annual mean time scale. However, the EEI is currently poorly measured from space, due to two fundamental challenges. The first fundamental challenge is that the EEI is the difference between two opposing terms of nearly equal amplitude. Currently, the incoming solar radiation and outgoing terrestrial radiation are measured with separate instruments, which means that their calibration errors are added and overwhelm the signal to be measured. To make significant progress in this challenge, a differential measurement using identical intercalibrated instruments to measure both the incoming solar radiation and the outgoing terrestrial radiation is needed. The second fundamental challenge is that the outgoing terrestrial radiation has a systematic diurnal cycle. Currently, the outgoing terrestrial radiation is sampled from the so-called morning and afternoon Sun-synchronous orbits, complemented by narrow band geostationary imagers. Recently the sampling from the morning orbit was abandoned. The sampling of the diurnal cycle can be improved, for example, by using two orthogonal 82° inclined orbits which give both global coverage, and a statistical sampling of the full diurnal cycle at subseasonal time scale. For understanding the radiative forcing – e.g. aerosol radiative forcing - and climate feedback – e.g. ice albedo feedback - mechanisms underlying changes in the EEI, and for climate model validation, it is necessary to separate the Total Outgoing Radiation (TOR) spectrally into the two components of the Earth Radiation Budget (ERB), namely the Reflected Solar radiation (RSR) and Outgoing Longwave Radiation (OLR) and to map them at relatively high spatial resolution. The Earth Climate Observatory (ECO) mission concept was selected in 2024 by the European Space Agency as one of the 4 candidate Phase 0 Earth Explorer 12 (EE12) missions. The current presentation provides a broad overview of the ECO mission objectives, the mission requirements, the key elements of a baseline mission concept, and the demonstration of the mission feasibility. Following an EE12 Phase 0 User Consultation Meeting (UCM), to be held in June 2026, 2 out of the 4 EE12 candidate missions will be selected for further Phase A study.

How to cite: Dewitte, S., Mauritsen, T., Meyssignac, B., and August, T. and the ECO Science Team: The Earth Climate Observatory space mission concept for the monitoring of the Earth Energy Imbalance, EGU General Assembly 2026, Vienna, Austria, 3–8 May 2026, EGU26-16894, https://doi.org/10.5194/egusphere-egu26-16894, 2026.

EGU26-17301 | ECS | Orals | CL2.1

Attributing temperature trends across altitudes using a surface energy balance approach 

Saurabh Shukla and Axel Kleidon

Understanding why temperature trends differ across altitudes remains challenging, particularly in mountainous regions where local feedbacks and limited long-term observations make attribution difficult. Here, we analyze long-term (1940–2025) time series of surface energy balance components from ERA5 reanalysis to identify trends in surface temperature and to attribute these to trends in radiative fluxes. We then assess the robustness of these relationships using observations from Baseline Surface Radiation Network (BSRN) stations spanning different altitudes. Our results show a consistent increase in surface temperature across altitudes. While trends in absorbed solar radiation exhibit significant variability, downwelling longwave radiation increases systematically. This confirms its key role in driving surface warming. We then apply a framework that decomposes longwave radiation using the semi-empirical formulation of Brutsaert (1975), combined with thermodynamic constraints from the maximum power principle applied to the surface energy balance. This enables us to investigate the conditions under which enhanced climate sensitivity at higher altitudes may arise. This approach links observed trends in reanalysis data to a thermodynamically constrained surface energy balance, providing a basis for diagnosing the role of atmospheric emissivity and moisture changes in shaping temperature trends at different altitudes. Future work will extend this framework to higher spatial resolutions to better capture the sensitivity of surface temperature to atmospheric emissivity across complex terrain and at different altitudinal settings.

How to cite: Shukla, S. and Kleidon, A.: Attributing temperature trends across altitudes using a surface energy balance approach, EGU General Assembly 2026, Vienna, Austria, 3–8 May 2026, EGU26-17301, https://doi.org/10.5194/egusphere-egu26-17301, 2026.

EGU26-17419 | ECS | Posters on site | CL2.1

Sampling the Earth's energy imbalance with the Earth Climate Observatory (ECO) constellation - insights regarding shortwave anisotropy 

Thomas Hocking, Linda Megner, Maria Z. Hakuba, Thorsten Mauritsen, and Björn Linder

The Earth’s energy imbalance (EEI), i.e. the difference between incoming solar radiation and outgoing reflected and emitted radiation, is the one quantity that ultimately controls the evolution of our climate system. Despite its importance, the exact magnitude of the energy imbalance is not well known, and because it is a small net difference of about 1 Wm−2 between two large fluxes (approximately 340 Wm−2), it is difficult to measure directly. There has recently been a renewed interest in using wide-field-of-view radiometers on board satellites to measure the outgoing radiation and hence deduce the global annual mean energy imbalance, for example as part of the EE12 candidate Earth Climate Observatory (ECO) mission.

A potential issue with wide-field-of-view radiometers, which has been the source of some concern, is the effect of anisotropic radiation, particularly anisotropic surface reflection of incoming sunlight. A wide-field-of-view radiometer does not distinguish the direction of incoming radiation, and earlier results have indicated that shortwave anisotropy could lead to substantial systematic biases in the global mean.

We simulate wide-field-of-view satellite measurements from satellites in polar, sun-synchronous and precessing orbits, as well as constellations of these orbits, and investigate how such measurements can be used to correctly determine the global annual mean imbalance. We present the results of ongoing work concerning different orbits, and how they affect the estimated global annual mean EEI, with a focus on e.g. the shortwave component and a comparison between isotropic and anisotropic shortwave reflection.

How to cite: Hocking, T., Megner, L., Hakuba, M. Z., Mauritsen, T., and Linder, B.: Sampling the Earth's energy imbalance with the Earth Climate Observatory (ECO) constellation - insights regarding shortwave anisotropy, EGU General Assembly 2026, Vienna, Austria, 3–8 May 2026, EGU26-17419, https://doi.org/10.5194/egusphere-egu26-17419, 2026.

EGU26-17592 | ECS | Posters on site | CL2.1

Simple functional representations of gas absorption for efficient climate model radiation schemes 

Ravikiran Hegde and Stefan Alexander Buehler

Understanding climate-relevant radiative processes requires radiation-transfer tools that balance physical fidelity, computational efficiency, and interpretability. Existing approaches span a broad but sparse hierarchy: idealized models miss key radiative processes, operational schemes trade physical tractability for accuracy and efficiency, and although line-by-line models are physically accurate, their computational cost prohibits direct coupling to Earth system models. This leaves a critical gap for models that are physically tractable, asymptotically convergent, and efficient.

We investigate alternative representations of gas absorption, a key component for clear-sky radiation transfer. Using simple functional forms per frequency, we represent the pressure–temperature scaling of absorption. Absorption cross sections, radiative fluxes, and heating rates are evaluated for representative atmospheric profiles and compared against a benchmark line-by-line reference model. We show that these functional forms can reproduce  the pressure–temperature dependence of gas absorption, thus replacing large multidimensional lookup tables. Combined with monochromatic spectral quadrature points (Czarnecki et al., 2023), this approach will enable highly efficient, physically tractable gas absorption calculations in climate models.

How to cite: Hegde, R. and Buehler, S. A.: Simple functional representations of gas absorption for efficient climate model radiation schemes, EGU General Assembly 2026, Vienna, Austria, 3–8 May 2026, EGU26-17592, https://doi.org/10.5194/egusphere-egu26-17592, 2026.

EGU26-17875 | ECS | Orals | CL2.1

From dusk till dawn: the role of the atmospheric limb in observations of Earth’s energy imbalance 

Björn Linder, Thomas Hocking, Linda Megner, Thorsten Mauritsen, Daniel Zawada, and Adam Bourassa

The global mean outgoing radiation from the Earth system is typically visualised as a flow of energy in the radial direction. In the context of satellite-based observations, the picture is more complex, as each element in the field of view contributes with radiance through its own characteristic angular distribution. For instruments in low Earth orbit that are designed to observe Earth’s energy imbalance (EEI), such as the wide field-of-view cameras and radiometer onboard the proposed Earth Climate Observatory (ECO) mission, fluxes of the order of 0.1 W/m2 are significant. Under such strict requirements, it is essential to capture the complete angular distribution of the radiation that leaves each element to prevent systematic errors in the estimated imbalance. In particular, a significant portion of the outgoing irradiance leaves the Earth's atmosphere above the horizon via the atmospheric limb. In this presentation, we explore the magnitude and characteristics of the limb radiance and investigate its dependence on solar conditions, surface properties, and stratospheric aerosols by using the radiative transfer model SASKTRAN. We show that the total irradiance contribution from the atmospheric limb can reach up to 2 W/m2 and that significant signal may originate from above 30 km tangent altitude. We further investigate the influence of upper atmospheric levels to the full irradiance measurement at satellite altitude and demonstrate that contributions from the upper stratosphere may be significant for EEI monitoring. 

How to cite: Linder, B., Hocking, T., Megner, L., Mauritsen, T., Zawada, D., and Bourassa, A.: From dusk till dawn: the role of the atmospheric limb in observations of Earth’s energy imbalance, EGU General Assembly 2026, Vienna, Austria, 3–8 May 2026, EGU26-17875, https://doi.org/10.5194/egusphere-egu26-17875, 2026.

EGU26-19013 | ECS | Orals | CL2.1

Intercomparison of the spectrally-resolved clear-sky outgoing longwave radiation estimates from multiple climate models 

Félix Schmitt, Quentin Libois, and Romain Roehrig

The outgoing longwave radiation (OLR), which results from the combination of thermal radiation emitted by the Earth surface and each layer of the atmosphere, is of critical importance for the Earth radiative budget. Climate models are generally tuned to match the space-borne reference values of the broadband OLR derived from e.g. the CERES mission. Yet a significant inter-model spread remains, originating from differences in the simulated climate system mean state and variability, especially in terms of atmospheric water vapor and temperature, surface temperature, aerosols and clouds. Spectrally-resolved OLR observations, as derived from infrared hyperspectral sounders such as IASI (and in the near future FORUM, to be launched in 2027, which will measure for the first time the far-infrared (FIR) region (100–667 cm-1) at high spectral resolution), provide access to the spectral signature of individual climate processes and are thus valuable to identify biases in the geophysical variables of climate models. For instance, it can unveil spectral error compensations between distinct spectral ranges, beyond an apparent good match between simulated and observed broadband OLR. The present work investigates the inter-model spread of clear-sky broadband OLR of 9 CMIP6 climate models which reaches 5.6 W.m-2. To that end, clear-sky FORUM-like spectra are simulated using the fast radiative transfer solver RTTOV and atmospheric profiles and surface properties of historical amip simulations (1979–2014 period). Spectra climatologies of the ERA5 reanalysis are also computed. Significant brightness temperature (BT) and radiance discrepancies between models arise across the OLR spectrum as a consequence of differences in simulated geophysical variables. For instance, the CO2 band displays BT differences up to 16 K, which are directly linked to differences in the upper troposphere and lower stratosphere temperature. Differences as large as 3 K are also reported in the FIR H2O absorption band (100–600 cm-1) for the global annual mean BT, that can be even larger for specific latitudes. We show that the FIR H2O region accounts for half of the inter-model broadband OLR variability and is strongly correlated to differences in mid-latitude and tropical upper-tropospheric relative humidity. This suggests that upper-tropospheric relative humidity is a key driver of the radiative budget in climate models. This work also highlights that FORUM observations shall provide a strong constrain on the climate models’ spectral signatures and thus help contribute to their improvement.

How to cite: Schmitt, F., Libois, Q., and Roehrig, R.: Intercomparison of the spectrally-resolved clear-sky outgoing longwave radiation estimates from multiple climate models, EGU General Assembly 2026, Vienna, Austria, 3–8 May 2026, EGU26-19013, https://doi.org/10.5194/egusphere-egu26-19013, 2026.

EGU26-19321 | ECS | Orals | CL2.1

Anthropogenic Aerosol Forcing for CMIP7 

Alon Azoulay and Stephanie Fiedler

We present the historical anthropogenic aerosol dataset SPv2.1, produced using the Simple Plumes (SP) aerosol module (Stevens et al., 2017), for use in the Coupled Model Intercomparison Project Phase 7 (CMIP7). The dataset covers the period from 1850 to 2023 inclusive and provides updated and extended estimates of anthropogenic aerosol optical properties and their effects on clouds by incorporating the latest emission inventory and extending the temporal coverage beyond earlier versions. The SP module induces anthropogenic aerosol effects in a simplified but physically plausible way, linking emissions from major industrial and urban regions to global model grids using nine predefined plumes around the world. Present-day monthly plume profiles of anthropogenic aerosol extinction are scaled with historical time series of SO₂ and NH₃ emissions to reproduce monthly changing spatial patterns of anthropogenic aerosol forcing. Compared to the earlier CMIP6 dataset, SPv2.1 shows moderate differences. The most pronounced differences occur over Africa between approximately 1940 and 1990, where SPv2.1 exhibits higher aerosol optical depth and increased cloud droplet number concentrations. These differences arise from updates in the underlying emission inventory. Additionally, SPv2.1 extends the historical period by nine years relative to CMIP6, which ended in 2014, thereby providing a more recent representation of present-day anthropogenic aerosol forcing. The SPv2.1 dataset supports a wide range of applications related to anthropogenic aerosol effects on radiation, clouds, and atmospheric composition across multiple models and modeling centers. It is publicly available for use in CMIP7 and other applications (Fiedler and Azoulay, 2025). Ongoing work now extends the SPv2.1 dataset to future anthropogenic aerosol scenarios from ScenarioMIP for CMIP7. The SPv2.1 scenarios will be derived from seven future emission pathways, spanning from high to very low anthropogenic emissions of SO₂ and NH₃ until 2125. In addition, climate model simulations with ICON-XPP are being performed to assess the aerosol radiative forcing for both the historical period and future scenarios.

How to cite: Azoulay, A. and Fiedler, S.: Anthropogenic Aerosol Forcing for CMIP7, EGU General Assembly 2026, Vienna, Austria, 3–8 May 2026, EGU26-19321, https://doi.org/10.5194/egusphere-egu26-19321, 2026.

EGU26-19460 | ECS | Orals | CL2.1

Machine learning eliminates near-surface warm bias in reanalysis  and reveals weaker winter surface cooling over Arctic sea ice 

Akil Hossain, Paul Keil, Harsh Grover, Ian Brooks, Christopher J. Cox, Michael R. Gallagher, Mats A. Granskog, Heather Guy, Stephen R. Hudson, P. Ola G. Persson, Matthew D. Shupe, Michael Tjernström, Jutta Vüllers, Von P. Walden, and Felix Pithan

The surface energy budget of the Arctic Ocean governs sea ice growth in winter and melt in summer. Understanding the surface energy budget and 2m temperature and correctly representing them in models is a key condition for understanding and projecting Arctic climate change. Direct observations of surface fluxes are scarce, and widely used reanalysis datasets suffer from systematic biases. Here, we train a neural network with observational data to bias-correct ERA5 reanalysis surface fluxes. We achieve substantial reductions in RMSE for hourly values of net shortwave radiation (~40%), downward longwave radiation (~16%) and the total surface energy budget (~55%) as well as 2m temperature (~34%). Our bias-correction eliminates the wintertime warm bias of about 4K in ERA5, reduces wintertime surface cooling by about 50% and dampens summertime surface heating. This revised surface cooling estimate is consistent with independent satellite-observed sea ice growth rates. In contrast to ERA5 fluxes, our bias-corrected data capture the observed clear and cloudy states of the Arctic winter boundary layer and the associated bimodal distribution of net longwave radiation. The bias-corrected data provide an improved baseline for climate model evaluation, climatological and case studies and forcing to drive stand-alone sea ice and ocean models. 

How to cite: Hossain, A., Keil, P., Grover, H., Brooks, I., Cox, C. J., Gallagher, M. R., Granskog, M. A., Guy, H., Hudson, S. R., Persson, P. O. G., Shupe, M. D., Tjernström, M., Vüllers, J., Walden, V. P., and Pithan, F.: Machine learning eliminates near-surface warm bias in reanalysis  and reveals weaker winter surface cooling over Arctic sea ice, EGU General Assembly 2026, Vienna, Austria, 3–8 May 2026, EGU26-19460, https://doi.org/10.5194/egusphere-egu26-19460, 2026.

EGU26-20034 | ECS | Orals | CL2.1

An Inverse Approach for Ocean Heat Content Estimation Using Altimetry, Gravimetry, and In-situ Data 

Thomas Duvignacq, Sebastien Fourest, Benoit Meyssignac, Valentin Oncle, and Sara Armaut

The ocean, thanks to its vast heat capacity, plays a central role in the Earth’s climate system by absorbing most of the radiative imbalance caused by anthropogenic emissions. Over the past decades, more than 90% of the excess energy has been stored in the ocean, thereby moderating surface warming and influencing the global radiation budget. Understanding Ocean Heat Content (OHC), its temporal variability, and spatial distribution is essential for projecting climate evolution and associated impacts, notably sea-level rise.

Traditionally, OHC has been estimated from in-situ measurements, particularly through the ARGO network, which provides temperature and salinity profiles down to 2000 m. ARGO still suffers from incomplete spatial and temporal coverage, especially under sea ice, in marginal seas, and in the deep ocean. Algorithms have been developed to address these gaps, but they introduce significant uncertainties, particularly in dynamically active regions.

To overcome these limitations, satellite observations are used. Hybrid methods combine altimetry and in-situ data, leveraging correlations between sea surface height and OHC to improve sampling. Other approaches, referred to as geodetic methods, such as this work, combine altimetry and gravimetry to estimate thermosteric sea level and derive OHC. Here,   for the first time, we combine in-situ, altimetric, and gravimetric data through an inverse approach. 

Residuals between in-situ OHC and geodetic OHC are optimised and interpolated using an objective mapping algorithm to produce OHC fields along with their associated uncertainties. 

The OHC product is validated in a leave-one-out approach against non-used in-situ measurements. The uncertainty of the OHC is derived from the leave-one-out approach and a synthetic data approach. In addition, we derive the Ocean Heat Uptake (OHU) by computing the tendency of the OHC and we  compare it with an independent estimate computed as the radiation budget measured by CERES corrected from the atmospheric divergence (ERA5). With this comparison,  we assess the capacity of the OHC product to close the Earth’s energy budget over the ocean. The OHU  estimate closes the budget at the ±0.5 W/m² level on a yearly basis. This level allows tracking energy transfer at the surface of the ocean, which occurs at interannual timescales due to phenomena such as El Niño and La Niña events. 

How to cite: Duvignacq, T., Fourest, S., Meyssignac, B., Oncle, V., and Armaut, S.: An Inverse Approach for Ocean Heat Content Estimation Using Altimetry, Gravimetry, and In-situ Data, EGU General Assembly 2026, Vienna, Austria, 3–8 May 2026, EGU26-20034, https://doi.org/10.5194/egusphere-egu26-20034, 2026.

EGU26-20364 | ECS | Orals | CL2.1

Assessing the MTG Flexible Combined Imager Outgoing Longwave Radiation Product Using GERB and CERES Observations 

Michaela Flegrova, Jacqui Russell, and Helen Brindley

Outgoing longwave radiation (OLR) at the top of the atmosphere is a fundamental component of the Earth’s radiation budget and a key observable for monitoring climate variability and change. The Meteosat Third Generation (MTG) Flexible Combined Imager (FCI) introduces a new geostationary OLR product derived from narrowband thermal infrared radiances using scene-dependent regressions. Ensuring the continuity, stability and scientific usability of this product relative to heritage datasets is therefore essential. Here we present an evaluation of the MTG FCI OLR product using comparisons with the Geostationary Earth Radiation Budget (GERB) thermal fluxes on Meteosat Second Generation (MSG) and with CERES OLR products.

The comparisons against GERB exploit the co-location of MSG and MTG to enable a detailed intercomparison between MTG FCI OLR and GERB thermal fluxes over several months spanning different seasons. Broadscale and regional differences are analysed as a function of viewing geometry, time of day and surface type, and cloud cover, and are interpreted in the context of known limitations in the GERB radiance-to-flux conversion and the MTG OLR retrieval methodology, including the use of scene-dependent regressions and plane-parallel assumptions.

Further comparisons against the CERES SYN GEO hourly and monthly mean fluxes, together with associated cloud information, provide an additional independent benchmark and allow the investigation of cloud-dependent and diurnal characteristics of the MTG OLR product. Together, these results provide a comprehensive assessment of the performance, stability and limitations of the MTG FCI OLR product and offer guidance for its application in studies of the Earth’s radiation budget and climate variability, as well as a roadmap for future product improvements.

How to cite: Flegrova, M., Russell, J., and Brindley, H.: Assessing the MTG Flexible Combined Imager Outgoing Longwave Radiation Product Using GERB and CERES Observations, EGU General Assembly 2026, Vienna, Austria, 3–8 May 2026, EGU26-20364, https://doi.org/10.5194/egusphere-egu26-20364, 2026.

EGU26-20760 | ECS | Orals | CL2.1

Towards ground-to-space spectral radiative closure in the thermal infrared with PREFIRE 

Benedict Pery, Helen Brindley, Jonathan Murray, Tristan L'Ecuyer, Tim Michaels, Sanjeevani Panditharatne, Sophie Mosselmans, and Robin Hogan

Despite containing up to half of the Earth’s thermal emission to space, the far-infrared spectral region (FIR, defined here as 100–667cm-1 or 15–100µm) has rarely been observed from satellites. Spectrally-resolved measurements, which offer a deeper understanding of the observed physical processes, have been limited to a 9-month dataset from 1970. This has led to substantial uncertainties in the spectroscopy of water vapour, radiative properties of clouds, and the surface spectral emissivity; these in turn limit confidence in modelled FIR energy flows.

With the advent of the Polar Radiant Energy in the Far-InfraRed Experiment (PREFIRE), we have made a step towards the return of spectral measurements of the Earth in the FIR. Launched as a NASA Earth Venture mission in 2024, it consists of two polar-orbiting CubeSats equipped with uncooled grating spectrometers. The instruments offer a new perspective of the Earth with a moderate spectral resolution. However, there remains some uncertainty regarding their calibration.

To this end, we attempt to assess the accuracy of PREFIRE spectral measurements by way of a ‘ground-to-space’ closure experiment. Using zenith-viewing observations from the ground-based Far INfrarEd Spectrometer for Surface Emissivity (FINESSE), for which uncertainties have been thoroughly characterised, we gauge the representativity of atmospheric data from radiosonde launches and reanalysis. Using these data, we simulate PREFIRE measured radiances for an overflight of the field site and compare to the observations.

At the surface, simulations of the FINESSE instrument’s output are in very good agreement with observations. Observations from the PREFIRE instrument indicate some persistent biases. In the atmospheric window, a rigorous diagnosis of these biases is impeded somewhat by uncertainty in surface conditions, while instrument noise strongly impacts measurements in the FIR. By quantifying the dominant sources of uncertainty, we highlight proposed techniques for future similar experiments to aid the evaluation of satellite radiances.

How to cite: Pery, B., Brindley, H., Murray, J., L'Ecuyer, T., Michaels, T., Panditharatne, S., Mosselmans, S., and Hogan, R.: Towards ground-to-space spectral radiative closure in the thermal infrared with PREFIRE, EGU General Assembly 2026, Vienna, Austria, 3–8 May 2026, EGU26-20760, https://doi.org/10.5194/egusphere-egu26-20760, 2026.

EGU26-21756 | ECS | Posters on site | CL2.1

Decadal-Scale Observations of the Impact of South Asian Pollution Outflow on the Radiation over the Northern Indian Ocean 

Manoj Remani, Sean Clarke, Hari Nair, Krishnakant Budhavant, Satheesh Krishnakumari, and Örjan Gustafsson

This study examines long-term trends in aerosol loading, chemical composition, and radiative effects over the northern Indian Ocean using the Maldives Climate Observatory at Hanimaadhoo (MCOH) as a receptor site for South Asian outflow. Nearly two decades (2004–2025) of in situ measurements, satellite observations, and reanalysis products are combined to assess changes in aerosol optical depth (AOD), surface solar radiation, sulfate aerosol concentrations, and associated climate-relevant feedback. AERONET observations at MCOH show a mean AOD of 0.30 ± 0.09 with a near-zero long-term trend (0.0017 ± 0.01 decade⁻¹), consistent with MODIS satellite estimates. Seasonal AOD exhibits modest increases during winter, pre-monsoon, and post-monsoon periods, and a slight decline during the monsoon. Clear-sky pyranometer measurements indicate a weak but persistent decline in surface-reaching global shortwave radiation (−3.0 ± 2.3 W m⁻²; −1.4%), consistent with regional dimming trends from MERRA-2 reanalysis (−1.6 ± 0.7 W m⁻² decade⁻¹), with the strongest dimming occurring during the pre-monsoon season. Concurrently, column-integrated water vapour increases significantly (+0.19 ± 0.07 cm decade⁻¹), suggesting potential feedback that may enhance atmospheric warming. Filter-based chemical analyses from 2006 to 2025 reveal a persistent long-term increase in sulfate aerosols concentrations (0.25 ± 0.05 µg m⁻³ yr⁻¹).  Sulfate aerosols a major secondary pollutant derived from SO₂ emissions play an important role in climate-cooling agent through the scattering of solar radiation. Despite rapid socio-economic development across South Asia, emission control measures have been effective over the long term in reducing the magnitude of the increasing trend to about half of that observed in the first decade. Together, these results highlight the complexity of aerosol–radiation–water vapour interactions and emphasize the need for both sustained long-term observations and improved modelling to better constrain climate impacts of air pollution in the South Asian region.

How to cite: Remani, M., Clarke, S., Nair, H., Budhavant, K., Krishnakumari, S., and Gustafsson, Ö.: Decadal-Scale Observations of the Impact of South Asian Pollution Outflow on the Radiation over the Northern Indian Ocean, EGU General Assembly 2026, Vienna, Austria, 3–8 May 2026, EGU26-21756, https://doi.org/10.5194/egusphere-egu26-21756, 2026.

EGU26-728 | ECS | Posters on site | AS3.16

Understanding Global CO₂ Fluxes and Concentrations using Multi-Model Simulations and Satellite Observations 

Aparna Aparajita, Ravi Kumar Kunchala, Prabir K. Patra, and Naveen Chandra

Accurate quantification of the global carbon cycle is essential for projecting future climate change, yet significant uncertainties remain in partitioning regional land and ocean CO2 fluxes. This study presents a comprehensive evaluation of XCO₂ retrievals from four major satellite missions, such as GOSAT, GOSAT-2, OCO-2 (v11), and OCO-3 (v11), against four Global Carbon Project (GCP) atmospheric transport models (MIROC4-ACTM, COLA, NISMON, and GCASv2). We employ a harmonised approach utilising averaging kernel convolution and data-driven bias correction for the year 2020 to facilitate a consistent model-satellite inter-comparison. Our results demonstrate that while the transport models generally reproduce global and seasonal CO₂ distributions, significant regional biases persist, notably over boreal and tropical land areas where discrepancies often exceed ±2 ppm. We identify that structural differences between satellite observations are primarily attributed to distinct sampling patterns. Specifically, comparisons between the sun-synchronous OCO-2 and the ISS-mounted OCO-3 reveal systematic differences driven by OCO-3's wider range of Local Solar Hour (LSH) sampling. This sampling captures diurnal CO₂ variability that is not fully resolved by current transport models, particularly in regions with strong diurnal cycling. Furthermore, multi-model flux analyses for the 2016–2019 period highlight that the largest uncertainties in surface fluxes occur over the high-latitude oceans and tropical land regions. These flux uncertainties correlate strongly with the observed model-satellite mismatches, underscoring the need for improved representation of diurnal cycles, vertical transport, and surface exchanges in atmospheric inversion systems. This integrated assessment provides crucial diagnostics for advancing the fidelity of global carbon cycle monitoring and modelling.

How to cite: Aparajita, A., Kunchala, R. K., Patra, P. K., and Chandra, N.: Understanding Global CO₂ Fluxes and Concentrations using Multi-Model Simulations and Satellite Observations, EGU General Assembly 2026, Vienna, Austria, 3–8 May 2026, EGU26-728, https://doi.org/10.5194/egusphere-egu26-728, 2026.

EGU26-1861 | ECS | Orals | AS3.16

Importance of subpixel Earth surface reflectance and altitude for atmospheric trace gas retrievals from nadir satellite instruments 

Michael Weimer, Max Reuter, Michael Hilker, Stefan Noël, Michael Buchwitz, Yasjka Meijer, Rüdiger Lang, Julia Marshall, Heinrich Bovensmann, John P. Burrows, and Hartmut Bösch

Satellite retrievals of atmospheric greenhouse gas concentrations are used to obtain information on their sources and sinks via inverse modelling. Such an application requires very high accuracy as even small biases of the retrieved concentrations may result in large errors of the inferred emissions or sink strength. For example, for the upcoming Copernicus satellite mission dedicated to carbon dioxide monitoring (CO2M) the accuracy of the dry-air column-averaged CO2 mole fraction (XCO2) is required to be better than 0.5 ppm. Here we investigate a potentially important systematic error source, namely XCO2 biases due to sub-pixel variability of surface reflectivity (albedo) and altitude. We show that the XCO2 bias can exceed the accuracy requirements up to three times over low-mountain ranges in Germany especially if surface albedo and altitude are spatially correlated within single ground pixels. To minimize this error source we motivate that the use of albedo-weighted surface altitude better represents the satellite’s spatial sample than the unweighted average. We use Copernicus Sentinel-2 data combined with Copernicus Digital Elevation Model (DEM) data and the Fast atmOspheric traCe gAs retrievaL (FOCAL) algorithm and create a variety of self-consistent experiments to confirm this theory. First we conduct experiments with defined conditions and second we apply the methodology to some examples with real topography and surface albedo. In all these examples, we find that using the albedo-weighted average of the surface altitude is needed to reduce biases at locations with heterogeneous surface structure to values below the requirements for future satellite missions. We show that the use of the albedo-weighted surface altitude in the retrieval process results in significant reduction of the XCO2 bias compared to the use of the unweighted mean altitude, as currently used in most retrieval schemes.

This work is funded by the ESA CO2M Science Study under contract no. 4000138164/22/NL/SD and by the German Federal Ministry of Research, Technology and Space (BMFTR) project "Integrated Greenhouse Gas Monitoring System for Germany – Observations (ITMS-B)" under grant number 01LK2103A .

How to cite: Weimer, M., Reuter, M., Hilker, M., Noël, S., Buchwitz, M., Meijer, Y., Lang, R., Marshall, J., Bovensmann, H., Burrows, J. P., and Bösch, H.: Importance of subpixel Earth surface reflectance and altitude for atmospheric trace gas retrievals from nadir satellite instruments, EGU General Assembly 2026, Vienna, Austria, 3–8 May 2026, EGU26-1861, https://doi.org/10.5194/egusphere-egu26-1861, 2026.

EGU26-2069 | ECS | Orals | AS3.16

Inventory-Free Inversion of Urban ffCO₂ Emissions Using Combined Observations from Sentinel-5P and DQ-1 

Jinchun Yi, Yiyang Huang, Ge Han, Hongyuan Zhang, Zhipeng Pei, Tianqi Shi, Siwei Li, and Wei Gong

The intensification of global climate change has created an urgent need for high-precision monitoring of fossil fuel carbon dioxide (ffCO₂) emissions. The Paris Agreement emphasizes that countries must be able to rapidly and accurately track changes in carbon emissions to support effective policymaking and implementation. Achieving this goal depends on building accurate and verifiable carbon accounting systems. Precise estimation of ffCO₂ emissions is essential for climate prediction and the formulation of mitigation strategies. Here, we present a city-scale ffCO₂ inversion framework that integrates active and passive satellite observations to improve emission quantification. Using satellite-derived NO₂ data and CO₂–NOₓ emission ratios, we first constructed spatial maps of urban ffCO₂ emissions. We then incorporated XCO₂ observations from the DQ-1 satellite’s ACDL instrument to estimate monthly ffCO₂ emissions for several major cities worldwide. Unlike conventional top-down methods that rely heavily on prior emission inventories, our approach derives emission information directly from satellite observations. This innovation substantially reduces uncertainties caused by the temporal delays and spatial biases inherent in traditional bottom-up inventories, offering a more reliable and timely means of monitoring fossil fuel CO₂ emissions.

The framework combines high-resolution NO₂ column observations from Sentinel-5P/TROPOMI with column-averaged CO₂ (XCO₂) measurements from the world’s first spaceborne CO₂ lidar, the DQ-1 Atmospheric CO₂ Differential Absorption Lidar (ACDL). TROPOMI NO₂ data are first used to derive gridded urban NOₓ emissions through a mass-balance approach that explicitly accounts for wind divergence, chemical lifetime, and vertical distribution. These NOₓ emissions are then converted into prior ffCO₂ distributions using city-specific CO₂-to-NOₓ emission ratios. Subsequently, DQ-1 XCO₂ along-track observations are assimilated within a Bayesian inversion framework driven by high-resolution WRF-STILT simulations to constrain total urban ffCO₂ emissions.

This study demonstrates the unique value of combining active CO₂ lidar and passive NO₂ observations for rapid, observation-driven verification of urban anthropogenic CO₂ emissions, and provides a unified framework for city-scale carbon monitoring under limited or uncertain inventory conditions.

How to cite: Yi, J., Huang, Y., Han, G., Zhang, H., Pei, Z., Shi, T., Li, S., and Gong, W.: Inventory-Free Inversion of Urban ffCO₂ Emissions Using Combined Observations from Sentinel-5P and DQ-1, EGU General Assembly 2026, Vienna, Austria, 3–8 May 2026, EGU26-2069, https://doi.org/10.5194/egusphere-egu26-2069, 2026.

EGU26-2722 | ECS | Orals | AS3.16

Preliminary Top-Down Remote Sensing-Based Modeling of Facility-Level Methane Emission Attribution in the Oil and Gas Sector 

Yiyang Huang, Jinchun Yi, Ge Han, Yichi Zhang, Hongyuan Zhang, Tianqi Shi, Zhipeng Pei, and Wei Gong

Industrial parks are major GHG sources and key actors in mitigation. Although satellite remote sensing has advanced since 2020—driven by initiatives like the Global Methane Pledge—it still excels mainly at isolated, strong methane point sources and struggles with dense source clusters, making facility-level attribution difficult. Two issues dominate: (1) the spectral–spatial trade-off—together with limited spectral resolution and SNR of current hyperspectral sensors—constrains XCH4 precision, pushing weak-source enhancements below retrieval noise; and (2) spatial overlap in large parks masks weak signals with nearby strong emitters. Even so, long-term matched-filter time series retain valuable, if hard-to-quantify, information.

We introduce an adaptive framework to apportion sub-source contributions within complex parks. The approach fuses sensors across scales: Sentinel-5P/TROPOMI constrains park-level totals, then time-series AHSI observations attribute emissions to individual facilities. This satellite-based method enables transparent, accurate facility-scale GHG reporting for industrial parks, supporting mitigation planning and the energy transition.

How to cite: Huang, Y., Yi, J., Han, G., Zhang, Y., Zhang, H., Shi, T., Pei, Z., and Gong, W.: Preliminary Top-Down Remote Sensing-Based Modeling of Facility-Level Methane Emission Attribution in the Oil and Gas Sector, EGU General Assembly 2026, Vienna, Austria, 3–8 May 2026, EGU26-2722, https://doi.org/10.5194/egusphere-egu26-2722, 2026.

EGU26-6176 | Orals | AS3.16

Long-Range Transport of Coal Mine Methane Emissions Causes Source Mis-Attribution: A Satellite-Based Estimation Approach Incorporating Data Uncertainty 

Bo Zheng, Jason Blake Cohen, Kai Qin, Wei Hu, Lingxiao Lu, Yanqiu Liu, Pravash Tiwari, Simone Lolli, Andrea Garzelli, and Hui Su

Accurately estimating and attributing methane (CH4) emissions is critical for climate change analysis and mitigation policy, but complex meteorology and terrain and incomplete knowledge of source geospatial distrubiton challenges current satellite-based and transport model-based methods. One of the largest coal mining regions by density is found in the high-elevation and mountainous regions of Shanxi China, and represents an ideal laboratory to quantify how emitted CH4 from such regions transports into the free troposphere and is subsequently mis-attributed downwind. We employ Empirical Orthogonal Function (EOF) analysis on five years of daily TROPOMI satellite observations, and WRF-STILT simulation to reveal the most important spatial-temporal causes of changes in methane concentration in the areas overlapping with the high coal mine methane in Shanxi and subsequent urban and agricultural downwind regions in Henan. Then we use ground observation data as physical constraints to construct a physics-based lightweight methane emission method to estimate methane emissions, while explicitly considering the impact of satellite data uncertainty on the emission results.

This work found that the contribution of the global background methane concentration to the methane in this region is approximately 40% and matches well with the upward trend modulated by seasonal cycles. Next this work identified a local mode on 5.3% of days that reveals a slow build-up and rapid release of CH4 from mining areas to middle-tropospheric loadings over downwind agricultural areas. During the 32 days of most substantial atmospheric transport, 0.064Mt of coal mine methane emissions slowly built up over basins in Shanxi and were transported over agricultural areas of Henan, accounting for over two thirds of the net 0.10Mt downwind increase. Applying our light-weight physically constrained emissions framework properly identifies the sources in these regions and effectively filters these observed long-range transported events, enabling more reliable emission estimates from existing satellite data. Failure to filter these events will lead to a substantial underestimation of fossil-fuel methane sources, since current isotopic constraint approaches do not sample middle tropospheric air.

How to cite: Zheng, B., Cohen, J. B., Qin, K., Hu, W., Lu, L., Liu, Y., Tiwari, P., Lolli, S., Garzelli, A., and Su, H.: Long-Range Transport of Coal Mine Methane Emissions Causes Source Mis-Attribution: A Satellite-Based Estimation Approach Incorporating Data Uncertainty, EGU General Assembly 2026, Vienna, Austria, 3–8 May 2026, EGU26-6176, https://doi.org/10.5194/egusphere-egu26-6176, 2026.

EGU26-6537 | ECS | Posters on site | AS3.16

Investigating the Impact of Modern Absorption Cross-Section Databases on CO2 Retrievals  

Lennart Thiemann, Moritz M. Sindram, Tobias D. Schmitt, Manfred Birk, Christian Röske, Georg Wagner, and André Butz

Current spectrometers provide high-quality absorption spectra from both ground-based direct sun measurements and spaceborne backscatter measurements. Accurate retrievals of atmospheric CO2 concentrations from these measured spectra are fundamental for modelling large-scale atmosphere-surface exchange fluxes. When retrieving CO2 concentrations from measured spectra, high-quality spectroscopic reference data are essential to drive radiative transfer simulations and to enable accurate retrievals. Here, we investigate how various modern molecular absorption cross-section datasets affect CO2 retrievals in the 1.6 μm and 2 μm wavelength regions. This includes recent parameter sets derived from laboratory measurements at the German Aerospace Center (DLR e.V.) for line-mixing parameterizations (Birk et al., 2024) with separate continuum data. We compare these new data to those from HITRAN 2020 (Gordon et al., 2022) with and without speed-dependent Voigt profile extension as well as to the ABSCO tables (Benner et al., 2016), (Devi et al., 2016).

To evaluate the quality of the spectroscopic databases, we submit high-resolution direct-sun spectra collected by the TCCON (Total Carbon Column Observing Network) spectrometer at Karlsruhe to our RemoTeC retrieval algorithm under variation of the driving spectroscopic parameters. We evaluate systematic spectral residuals as well as spurious dependencies of the retrieved CO2 columns on slant airmass. We further retrieve CO2 separately from the P- and R-branches within a spectral window to assess potential mismatches. In addition, we use one year of GOSAT satellite measurements to investigate whether and how differences in CO2 concentrations retrieved under variation of the spectroscopic parameters show dependencies on geophysical parameters such as latitude, season or surface type. Our analyses show that the DLR cross-sections lead to noticeable improvements in spectral line modelling in the strong 2 µm band, which in turn reduces airmass dependencies. Including the CO2 continuum from the DLR dataset further reduces airmass-dependent biases, although this improvement is not reflected in the spectral residuals. Using the ABSCO tables results in residuals comparable to those using the HITRAN 2020 cross-sections. However, the airmass bias is low and comparable to the DLR cross-sections. In the weaker 1.6 µm bands, fit quality is comparable across all datasets, with small differences in airmass dependence. For the 2 μm band, the comparison of P- and R-branch retrievals reveals differences of up to 0.2 % and a pronounced airmass-dependent bias in the HITRAN 2020 R-branch. This inter-branch difference vanishes in the 1.6 μm bands when using DLR cross-sections but persists for HITRAN. Furthermore, retrievals with DLR cross-sections show significantly improved agreement between the 2 µm and 1.6 μm bands compared to HITRAN. In the GOSAT analysis, in addition to airmass-dependent effects leading to latitudinal and seasonal biases, we found surface albedo to strongly correlate with differences in retrieved CO2 concentrations.

Benner et al., 2016: https://doi.org/10.1016/j.jms.2016.02.012

Devi et al., 2016: https://doi.org/10.1016/j.jqsrt.2015.12.020

Birk et al., 2024: https://elib.dlr.de/208834/

Gordon et al., 2022: https://doi.org/10.1016/j.jqsrt.2021.107949

How to cite: Thiemann, L., Sindram, M. M., Schmitt, T. D., Birk, M., Röske, C., Wagner, G., and Butz, A.: Investigating the Impact of Modern Absorption Cross-Section Databases on CO2 Retrievals , EGU General Assembly 2026, Vienna, Austria, 3–8 May 2026, EGU26-6537, https://doi.org/10.5194/egusphere-egu26-6537, 2026.

EGU26-6699 | ECS | Posters on site | AS3.16

Satellite-based global monitoring of urban-scale methane emissions using TROPOMI 

Huihui Long, Grant Allen, Maria Tsivlidou, and Hugo Ricketts

Quantifying and understanding methane emissions of cities are of great importance since cities are a key focus of current and future mitigation efforts to combat climate change. However, it remains challenging to routinely characterize and verify city scale emission inventories.  Previous studies of urban methane emissions have employed a range of flux quantification methods, leading to inconsistent estimates and different associated uncertainties. As a result, a robust and widely applicable framework for quantifying urban emissions remains lacking. In this study, we have developed and tested an advanced emissions calculation method that uses mass balance accounting and satellite observations from TROPOMI to estimate net bulk (city-level) methane emissions and corresponding emissions uncertainties due to the method. We test and validate the method and demonstrate that the novel integration of boundary layer height and hourly-resolved wind data enables a more robust assessment of methane emissions from urban areas compared with methods that do not take such factors into account. Initial assessments with this approach were tested for three megacities (London, Los Angeles and New York) from 2021 to 2023. Our results suggest that emission inventories generally underestimate methane emissions, but by widely varying proportions, and with substantial differences year-to-year. The estimates range from 0.3 to 9.2 times higher than spatially gridded bottom-up inventories. For example, in New York city in 2021, the estimated CH4 emission rate is 43.54 ± 17.77 t h-1, compared with the reported inventory value of 7.18 t h-1 from the U.S. Environmental Protection Agency. In London, the emission estimate is only slightly higher than the NAEI inventory. We also find generally lower but overall consistent emissions when compared with previous top-down studies that use different quantification methods. Our results provide evidence that satellites can serve as a promising technology for ongoing city emissions monitoring, reconciliation and reporting through long-term monitoring across the globe, which can be used to help build methane emission characteristics and track whether stated emission targets are being met.

How to cite: Long, H., Allen, G., Tsivlidou, M., and Ricketts, H.: Satellite-based global monitoring of urban-scale methane emissions using TROPOMI, EGU General Assembly 2026, Vienna, Austria, 3–8 May 2026, EGU26-6699, https://doi.org/10.5194/egusphere-egu26-6699, 2026.

EGU26-8675 | Posters on site | AS3.16

Tropical wetland methane emissions and trends (2004–2023) inferred from Landsat-based inundated vegetation data 

Zichong Chen, Daniel Jacob, Haipeng Lin, Nicholas Balasus, Sarah Hancock, Lucas Estrada, James East, Yuzhong Zhang, Xiaolin Wang, Megan He, Mengyao Liu, and Daniel Varon

The role of tropical wetlands in the rise of atmospheric methane over the past two decades remains unclear. Current models define wetlands by surface water coverage, not making the distinction between high-emitting inundated vegetation and much weaker-emitting open water areas of wetlands. Here we use 30-m Landsat satellite data to identify tropical inundated vegetation, and combine it with chamber- and flux tower-derived emission intensities per unit wetland area to produce a Wetland Methane Emission Inventory (WMEI) at 0.1o ×0.1o spatial resolution and quarterly temporal resolution for 2004-2023. We find that tropical wetland emissions increased steadily by 16.3 Tg a-1 or 18% over the 2004-2023 period, with contributions from Africa (11.3 Tg a-1) and Asia (5.0 Tg a-1) and no net increase from South America. Tropical wetlands thus account for 21% of the global methane rise over that period though they do not appear to have contributed significantly to the 2020-2022 methane surge. The long-term trend and interannual variability of wetland emissions correlates strongly with vegetation activity as measured by solar-induced fluorescence (SIF) but not with temperature or precipitation.

How to cite: Chen, Z., Jacob, D., Lin, H., Balasus, N., Hancock, S., Estrada, L., East, J., Zhang, Y., Wang, X., He, M., Liu, M., and Varon, D.: Tropical wetland methane emissions and trends (2004–2023) inferred from Landsat-based inundated vegetation data, EGU General Assembly 2026, Vienna, Austria, 3–8 May 2026, EGU26-8675, https://doi.org/10.5194/egusphere-egu26-8675, 2026.

As the dominant greenhouse gas, the spatiotemporal distribution of carbon dioxide (CO2) concentration is a key parameter in global climate change research. Satellite remote sensing has become a crucial means for detecting CO2 on a global scale. The infrared laser occultation technology employed by Low-Earth Orbit (LEO) satellites offers a novel technical approach for obtaining vertical profiles of atmospheric CO2, capitalizing on its advantages of high vertical resolution, high precision, and strong global coverage capability. This paper systematically investigates the CO2 retrieval method for this technology. The core principle involves a transmission-reception mode based on a LEO-LEO dual-satellite constellation. An infrared laser source onboard the transmitting satellite emits laser pulses at specific wavenumbers, which traverse the atmosphere and are captured by the receiving satellite. Leveraging the selective absorption characteristics of CO2 in specific infrared bands and the principle of differential absorption, concentration retrieval is achieved. Firstly, an infrared laser occultation signal link model is constructed to optimize the selection of detection wavenumbers. Through simulation analysis of the sensitivity of CO2 detection precision at different wavenumbers, an optimal wavenumber pair is determined. This wavenumber pair effectively mitigates interference from other atmospheric components, ensuring the specificity of the CO2 absorption signal. Secondly, a complete retrieval calculation procedure is established. The dual-wavelength transmittance is calculated from the ratio of transmitted power to received signal strength, subsequently enabling the solution of the differential optical depth along the entire optical path. Utilizing the Abel integral transform, the differential optical depth is converted into the CO2 differential absorption coefficient at the atmospheric path tangent point. Combined with the ideal gas law and the atmospheric quasi-static equation, concentration conversion is performed, ultimately yielding the vertical CO2 concentration profile. The retrieval method proposed in this study effectively addresses the issues of low vertical resolution and uneven regional coverage inherent in traditional satellite remote sensing for CO2 profile detection. It provides core algorithmic support for the engineering implementation of spaceborne infrared laser occultation CO2 detection systems. The high-precision global CO2 concentration data obtained can offer significant scientific data support for carbon source/sink assessment, climate change prediction, and related policy formulation.

How to cite: Zong, X., Wang, X., and Zhang, Z.: Retrieval Method for Carbon Dioxide Using Infrared Laser Occultation from Low-Earth Orbit Satellites, EGU General Assembly 2026, Vienna, Austria, 3–8 May 2026, EGU26-9413, https://doi.org/10.5194/egusphere-egu26-9413, 2026.

EGU26-9561 | ECS | Orals | AS3.16

Facility-scale greenhouse gas emission quantification at the Bremen steelworks using ground-based remote sensing 

Lukas Grosch, Michael Brink, André Butz, Lena Feld, Frank Hase, Benedikt Löw, Jan-Hendrik Ohlendorf, Andreas Richter, Thomas Visarius, and Thorsten Warneke

The Integrated Greenhouse Gas Monitoring System (ITMS) aims to establish an operational top-down monitoring framework for greenhouse gases (GHG) in Germany by combining atmospheric in situ and remote-sensing observations with atmospheric transport modelling and inverse estimation techniques. Power plants and large industrial facilities account for more than half of global anthropogenic CO₂ emissions and are therefore key targets. However, the limited temporal and spatial resolution of satellite GHG observations makes complementary ground-based measurements necessary for robust emission quantification at the facility scale.

This work contributes to ITMS by assessing the capability and uncertainties of quantifying GHG emissions from a major point source using ground-based observations and atmospheric transport modelling. The study focuses on the Bremen steelworks, comprising two blast furnaces and a blast-furnace-gas-fired power plant, emitting approximately 5 Mt CO2 yr⁻¹ and accounting for nearly half of the city’s total emissions.

The campaign measurements conducted between April and June 2024 and 2025 targeted the plumes of the steelworks: Two portable Bruker EM27/SUN FTIR spectrometers measured column-averaged abundances of CO2, CO and CH4, while background values were provided by the Bruker 125HR FTIR spectrometer at the University of Bremen. Mobile zenith-sky DOAS observations of co-emitted NO2 constrained plume width and trajectory, surface CO2 concentrations were measured in situ, and wind profiles were obtained from a Doppler wind lidar. Plume transport was simulated with a Gaussian plume model and combined with excess CO and CO2 measurements in an inversion framework to derive emission ratios and emission estimates.

The derived CO/CO2 emission ratio is 3.46% ± 0.85%, consistent with emission inventories (3.33%, Umweltbundesamt). Constraining the model with real-time DOAS plume observations yielded preliminary emission estimates ranging from 40% to 179% of inventory values, with an average of 79% ± 49%. These results highlight both the promise and current limitations of ground-based remote sensing in reducing uncertainties of facility-level emission quantification.

How to cite: Grosch, L., Brink, M., Butz, A., Feld, L., Hase, F., Löw, B., Ohlendorf, J.-H., Richter, A., Visarius, T., and Warneke, T.: Facility-scale greenhouse gas emission quantification at the Bremen steelworks using ground-based remote sensing, EGU General Assembly 2026, Vienna, Austria, 3–8 May 2026, EGU26-9561, https://doi.org/10.5194/egusphere-egu26-9561, 2026.

EGU26-10102 | ECS | Posters on site | AS3.16

GOSAT and in-situ based inversion of North American CO2 fluxes using FLEXPART  

Sarah Grandke, Pernilla Kühn, Eva-Marie Metz, Christopher Lüken-Winkels, Sourish Basu, André Butz, and Sanam N. Vardag

Temperate North America (TNA) consists of moisture-limited ecosystems in the west and mainly forests and croplands in the east, each exhibiting distinct responses of net ecosystem exchange (NEE) to climate variability. A dense in-situ network exists over TNA and is complemented with satellite XCO2 measurements providing strong constraints on sub-continental flux variability, but NEE response to environmental drivers remains poorly understood (Byrne et al., 2020).  

In this work, we develop a regional inversion systems that can fully exploit the available observational density to better understand NEE response to climate anomalies on high spatial resolution.  

We combine in-situ observations with column-averaged CO2 (XCO2) from the Greenhouse Gases Observing Satellite (GOSAT) for a full year. For each observation we compute source-receptor relationships using the Lagrangian Particle Dispersion Model FLEXPART. These footprints serve as the forward model to link surface fluxes to atmospheric measurements. We optimize weekly total surface fluxes on a 2° × 2° grid across TNA and derive NEE by subtracting contributions from fossil fuel emissions, biomass burning, and ocean fluxes.  

We assess the sensitivity of inferred NEE to key methodological choices, including model data mismatch errors, assumed spatial and temporal error correlations and the representation of the diurnal cycle in biospheric exchange. For a preferred configuration, we discuss the spatial patterns of NEE in TNA. We also compare the resulting NEE fluxes to those from the global TM5-4DVar inversion and find good agreement in both spatial patterns and temporal variability, while our regional system provides enhanced spatial detail. We conclude by outlining next steps for improvements and discuss opportunities enabled by the high-resolution inversion for diagnosing TNA's carbon–climate processes. 

How to cite: Grandke, S., Kühn, P., Metz, E.-M., Lüken-Winkels, C., Basu, S., Butz, A., and Vardag, S. N.: GOSAT and in-situ based inversion of North American CO2 fluxes using FLEXPART , EGU General Assembly 2026, Vienna, Austria, 3–8 May 2026, EGU26-10102, https://doi.org/10.5194/egusphere-egu26-10102, 2026.

EGU26-10453 | ECS | Orals | AS3.16

Expanding high-latitude satellite methane data using a genetic algorithm optimisation technique.  

Lakshmi Bharathan, Robert Parker, Michael Cartwright, Dan Orr, Antonio Di Noia, Peter Somkuti, Alex Webb, and Hartmut B Boesch

Atmospheric methane climate data sets are crucial for monitoring and mitigating global warming and associated climate change impacts. The Greenhouse Observing Satellite (GOSAT) has been monitoring atmospheric methane since 2009 with near-surface sensitivity and forms a robust long-term climate data record that is essential for tracking global emission trends and understanding methane budget. University of Leicester has developed an operational global methane dataset from level 1 GOSAT data using a proxy retrieval method that is advantageous in mitigating the effects of aerosol scattering and instrumental errors. Year-round monitoring of atmospheric methane at high-latitudes is important in the context of Arctic amplification due to excessive warming that can trigger several climate feedbacks loops such as, thawing permafrost-carbon release feedback and snow - albedo feedback. However, data acquisition over high-latitudes is limited by challenging due to frequent cloud cover and low solar illumination resulting in a significant data deficit during winter season. As an attempt to resolve this limitation, this study has used a Non-dominated Sorting Genetic Algorithm II (NSGA II) approach to optimise the post-retrieval quality filters of University of Leicester GOSAT Proxy methane datasets to increase the data volume with least impact on the data quality compared to the ground-observations. If we loosen the QA filters to capture data under challenging conditions, data quality will naturally deteriorate due to introduction of noisy measurements. NSGA method is specifically suited for addressing problems with inherently conflicting objectives like in this case. In our problem fitness of each solution is evaluated based on a combination of the number of valid GOSAT observations obtained at high latitudes and the Root Mean Square Error (RMSE) between collocated GOSAT retrievals and ground-based data from the Total Carbon Column Observing Network (TCCON) network. Results suggest GA-optimized QA filters lead to an approximately 20% increase in valid satellite soundings over high latitudes with less than 1 ppb increase in RMSE between GOSAT and TCCON soundings. The optimised data set has significant data gain over the high-latitudes with more than double gain during winter. This work demonstrates the potential of GAs for improving greenhouse gas measurement coverage and volume in challenging high-latitude regions while maintaining while maintaining the accuracy of the data.

How to cite: Bharathan, L., Parker, R., Cartwright, M., Orr, D., Di Noia, A., Somkuti, P., Webb, A., and Boesch, H. B.: Expanding high-latitude satellite methane data using a genetic algorithm optimisation technique. , EGU General Assembly 2026, Vienna, Austria, 3–8 May 2026, EGU26-10453, https://doi.org/10.5194/egusphere-egu26-10453, 2026.

EGU26-10829 | ECS | Orals | AS3.16

Global anthropogenic XCO2 enhancements response to temperature changes with country-specific adaptability and sensitivity 

Lixing Wang, Tao Li, Xuanren Song, Xinyu Dou, Yuhan Yu, and Zhu Liu

Human heating- and cooling-induced CO2 emissions exhibit substantially different responses to extreme temperatures across countries, leading to satellite-detectable enhancements in atmospheric concentration. Quantifying this relationship is crucial for understanding human-climate interactions and informing targeted carbon mitigation policies. However, a global, systematic assessment has been hindered by the lack of timely, reliable, high-resolution carbon monitoring data. Satellite observations of the column-averaged dry-air mole fraction of CO2 (XCO2) always suffer from cloud-induced data gaps and overwhelming interference from natural fluxes, impeding anthropogenic signal extraction. Here, we integrate OCO-2/3 XCO2 and TROPOMI NO2 observations via machine learning to reconstruct global daily 0.1° XCO2 fields (2021-2023), and use local Moran’s I statistics to isolate anthropogenic XCO2 enhancements (XCO2en). The resulting XCO2en data exhibit distinct seasonal cycles across the world’s top-emitting regions, characterized by elevated levels in summer and winter. SHapley Additive exPlanations (SHAP) analysis reveals a consistent V-shaped relationship globally between temperature and its contribution to XCO2, indicating that both high and low temperature extremes elevate the SHAP value, with an optimal temperature (To) yielding the minimum value. Notably, despite vast differences in national temperature distributions, the To across countries converges around 21°C, suggesting a common human thermal adaptation threshold. Moreover, the slope of the V-shaped curve, representing the sensitivity of the XCO2en response to temperature, exhibits a significant positive correlation with national GDP per capita (R=0.50, p<0.01) and a negative correlation with the share of renewable energy consumption (R=-0.34, p<0.05). Our model effectively delineates the spatiotemporal patterns of anthropogenic XCO2en by leveraging carbon-nitrogen synergy, providing critical insights for decarbonization strategies and renewable energy transitions in diverse economies under carbon neutrality goals.

How to cite: Wang, L., Li, T., Song, X., Dou, X., Yu, Y., and Liu, Z.: Global anthropogenic XCO2 enhancements response to temperature changes with country-specific adaptability and sensitivity, EGU General Assembly 2026, Vienna, Austria, 3–8 May 2026, EGU26-10829, https://doi.org/10.5194/egusphere-egu26-10829, 2026.

EGU26-10846 | ECS | Orals | AS3.16

Quantifying spatiotemporal CO2 trends in surface fluxes over Iceland using OCO-2 XCO2 retrievals 

Chloé Delbet, Philip Ringrose, and Jo Eidsvik

Iceland represents one of the few emerged portions of the Mid-Atlantic-Ridge, a 16,000 km-long tectonic boundary separating the North American and Eurasian plates. This unique position gives rise to Iceland’s characteristic geothermal manifestations and volcanic complexes (Figure 1). Here, CO2 from volcanic sources is released alongside other natural and anthropogenic emissions, as part of the global carbon cycle.

Figure 1. Map of Iceland with distribution of averaged NDVI from NASA’s Moderate Resolution Imaging Spectroradiometer (MODIS) for June 2018. The red triangles show locations of volcanoes and fumaroles and the grey squares represent pixels where OCO-2 XCO2 retrievals are available.

The quantification of these fluxes in relation to the plate tectonic system provides valuable insights into the nature of long-term CO2 migration and retention, which, in turn, can help assess the potential for leakage and migration pathways in the context of geological storage of CO2. However, volcanogenic sources of CO2 remain poorly quantified, partly because such studies rely on ground-based measurements or airborne remote sensing, which can be challenging and hazardous during periods of volcanic unrest.

NASA’s Orbiting Carbon Observatory-2 (OCO-2), launched in 2014, has been proven to be capable of observing localised point source signals thanks to its unprecedented instrument precision and resolution. In this study, we explore the use of OCO-2’s column-averaged dry-air mole fractions of CO2 (XCO2) retrievals to assess the onshore CO2 fluxes in Iceland.

Because volcanogenic sources of CO2 typically exhibit small enhancements above background concentrations, a robust quantification of the influence of non-volcanic CO2 contributors on OCO-2 retrievals is needed. Therefore, we analysed nearly a decade of OCO-2 data to reveal the long-term anthropogenic emissions trends and the seasonal variations due to biogenic fluxes. We observe a steady increase of ~2 ppm per year in average atmospheric CO2 concentrations (Figure 2a), attributed to anthropogenic emissions, and an inverse trend between monthly XCO2 averages and the Normalised Difference Vegetation Index (NDVI) (Figure 2b), reflecting seasonal vegetation growth as a carbon sink. However, due to severe weather conditions and prolonged winter darkness at high latitudes, no data was available from October to March, limiting our window of observation.

Figure 2. a) Evolution of OCO-2 XCO2 observations over Iceland since 2015 with yearly means in red squares.
b) Evolution of mean OCO-2 XCO2 observations and NDVI values over Iceland in 2018.

The observed trends provide the reference framework required for isolating volcanogenic CO2 contributions and are informative for understanding the carbon cycle in this region. Despite observational challenges posed by Iceland’s location in the high North, our analysis of these OCO-2 retrievals brings important insights into resolving spatiotemporal CO2 patterns from space over volcanically active regions. The ensuing step will be to quantify the relative contribution of known volcanogenic CO2 sources (e.g., volcanos, fumaroles, and diffuse soil degassing, etc.) to OCO-2 retrievals.

How to cite: Delbet, C., Ringrose, P., and Eidsvik, J.: Quantifying spatiotemporal CO2 trends in surface fluxes over Iceland using OCO-2 XCO2 retrievals, EGU General Assembly 2026, Vienna, Austria, 3–8 May 2026, EGU26-10846, https://doi.org/10.5194/egusphere-egu26-10846, 2026.

EGU26-11266 | Orals | AS3.16

The ITMS-FTIR network for Germany: Second year of consistent XCO2, XCH4 and XCO data for satellite and model validation on the urban, regional and national scale 

Benedikt Löw, Lena Feld, Lukas Grosch, Friedrich Klappenbach, Ralph Kleinschek, Andreas Luther, Moritz Oliveira Makowski, Josef Stauber, Jia Chen, Frank Hase, Thorsten Warneke, and André Butz

Top-down estimation of greenhouse gas emissions requires the combination of reliable atmospheric concentration measurements with atmospheric inversions. The German Integrated Greenhouse Gas Monitoring System (ITMS) combines atmospheric in situ, remote sensing and satellite measurements, transport modelling, and inverse estimation techniques, aiming at an operational top-down monitoring of greenhouse gas emissions. We contribute to this effort by establishing highly consistent and accurate observations of column-average mole fractions of carbon dioxide (XCO2), methane (XCH4) and carbon monoxide (XCO) using eight COCCON (EM27/SUN) and two TCCON FTIR instruments across Germany.

We operate Collaborative Carbon Column Observing Network (COCCON, EM27/SUN) and Total Column Carbon Observing Network (TCCON) spectrometers located such that the measurements cover spatial gradients on the urban, regional and national scale. We ensure excellent consistency among all stations by operating an additional EM27/SUN as travel standard, performing regular side-by-side measurements with all network instruments. As such, we calibrate all instruments to a common scale and, via TCCON, tie them to the World Meteorological Organization (WMO) scale. These measurements provide the means to validate both satellite observations and modelling results on the spatial scales relevant for future emission inversions. 

After the second year of operation, we present the extended dataset, as well as our solidified uncertainty analysis based on the continued side-by-side measurements throughout the years 2024 and 2025. Additionally, we present our approach to better quantify residual systematic uncertainty contributions by employing an Acetylene absorption cell during regular atmospheric measurements.

How to cite: Löw, B., Feld, L., Grosch, L., Klappenbach, F., Kleinschek, R., Luther, A., Oliveira Makowski, M., Stauber, J., Chen, J., Hase, F., Warneke, T., and Butz, A.: The ITMS-FTIR network for Germany: Second year of consistent XCO2, XCH4 and XCO data for satellite and model validation on the urban, regional and national scale, EGU General Assembly 2026, Vienna, Austria, 3–8 May 2026, EGU26-11266, https://doi.org/10.5194/egusphere-egu26-11266, 2026.

EGU26-11354 | Posters on site | AS3.16

A divergence method approach utilizing gaussian processes for carbon dioxide emission estimation 

Anssi Koskinen, Janne Nurmela, Teemu Härkönen, and Johanna Tamminen

With ongoing climate change and rising global temperatures, monitoring and quantifying anthropogenic greenhouse gas (GHG) emissions has become increasingly critical. One of the recent activities responding to the needs of accessing the effectiveness of strategies for Carbon Dioxide (CO2) emission reduction is the upcoming Copernicus CO2 Monitoring mission (CO2M), scheduled to launch in 2027. 

To support the CO2M, the data-driven emission quantification (ddeq) - Python library was developed as a shared library of various lightweight approaches focusing on quantifying CO2 and NOx emissions from synthetic CO2M data. One of these lightweight approaches is the divergence method, which was originally used for estimating NOx emissions from TROPOMI NO2 retrievals and later applied also for CO2. The divergence method is based on the continuity equation in steady state and requires computing the flux using differentiation. However, unlike the other methods in the ddeq, the divergence method requires temporal averaging to mitigate the noise gained from the numerical differentiation over a noisy data. Unfortunately this makes cross-validation between the divergence and the other methods in the ddeq a challenge.

In the divergence method, it suffices to compute the quantity called advection defined as a dot product between the wind vector and the spatial gradient of the total vertical column density (TVCD).

Traditionally, the gradient is computed using some numerical differentiation scheme, such as a finite difference, but they often unable to produce reasonable estimates for the derivatives in a noisy environment. To solve this issue, we utilized a Gaussian process (GP) to estimate flux of the TVCD. Due to the properties of the GP, the partial derivatives can be computed analytically based on the optimized GP and the chosen kernel function.

Given a noisy measurement z of our signal f at locations s*, we can model the signal f as a zero-mean GP with a covariance kernel K. We require that the kernel function defining the positive definite kernel matrix is (at least) twice differentiable and that the noise is i.i.d. Gaussian with mean and variance . Mathematically, this can be expressed as

Our objective is to study a linear transformation of the signal, where is some linear operator. Due to properties of Gaussian processes, is also a Gaussian process. As a consequence, the mean and the covariance matrix of the transformed signal conditionally to the observed data can be computed analytically.

Assuming that the observations of the TVCD near a source are prominent enough, we are able to optimize hyper parameters of a GP. This GP can then used to estimate the advection which should be elevated at the immediate proximity of the source. As per Gauss' divergence theorem, the emission rate of a source can be computed by integrating the advection field over the vicinity of the point source.

How to cite: Koskinen, A., Nurmela, J., Härkönen, T., and Tamminen, J.: A divergence method approach utilizing gaussian processes for carbon dioxide emission estimation, EGU General Assembly 2026, Vienna, Austria, 3–8 May 2026, EGU26-11354, https://doi.org/10.5194/egusphere-egu26-11354, 2026.

EGU26-11360 | ECS | Posters on site | AS3.16

A New NDACC- and TCCON-Compliant FTIR Observatory in Bologna (Italy) for Greenhouse Gas and Trace Gas Measurements 

Enzo Papandrea, Elisa Castelli, Paolo Pettinari, André Achilli, and Francescopiero Calzolari

High-resolution ground-based Fourier Transform InfraRed (FTIR) spectroscopy is a key technique for monitoring atmospheric composition, in particular, greenhouse gases, providing vertically integrated information essential for climate studies, emission estimates, and satellite data validation. Within the framework of the PNRR EMM and ITINERIS projects, two new ground-based FTIR spectrometers have been installed at the CNR research area in Bologna, Italy, significantly enhancing the national observational capability in these fields.

The first instrument, a Bruker IFS 125HR, operates in the infrared spectral range from approximately 850 to 9000 cm⁻¹, with a spectral resolution of about 0.0036 cm⁻¹, enabling the retrieval of a wide set of atmospheric trace gases and minor atmospheric constituents, including CO₂, CH₄, N₂O, CO, O₃, HNO₃, HCl, HF, C₂H₆, HCN, and HDO. These measurements are crucial for investigating changes in atmospheric composition and their impact on the Earth’s radiative balance, as well as for deriving greenhouse gas emissions and trends.

The second instrument is a Bruker EM27/SUN, which operates in the NIR range from 4000 to 12000 cm⁻¹, thus allowing the retrieval of CO2, CH4, CO, and H2O. Being part of the COCCON network, its data are analyzed on a daily basis, and the resulting GEOMS files are regularly delivered to the network for public distribution.

The FTIR spectrometers are located in the Po Valley, one of the most polluted regions in Europe, offering a unique opportunity to observe greenhouse gases and air pollutants under conditions of strong anthropogenic influence. The IFS 125HR is fully compliant with the NDACC and TCCON network requirements, ensuring standardized data acquisition, calibration, and processing procedures and thereby allowing direct comparison with other ground-based FTIR sites worldwide and with satellite observations. This installation represents the first FTIR facility of its kind in Italy and the central Mediterranean region, providing significant scientific value at both national and international levels.

How to cite: Papandrea, E., Castelli, E., Pettinari, P., Achilli, A., and Calzolari, F.: A New NDACC- and TCCON-Compliant FTIR Observatory in Bologna (Italy) for Greenhouse Gas and Trace Gas Measurements, EGU General Assembly 2026, Vienna, Austria, 3–8 May 2026, EGU26-11360, https://doi.org/10.5194/egusphere-egu26-11360, 2026.

In the support of the Copernicus Anthropogenic Carbon Dioxide Monitoring (CO2M) mission, Space Research Organization Netherlands (SRON) developed the Remote sensing of Trace gas and Aerosol Product (RemoTAP) algorithm. RemoTAP is the only algorithm with the capability to simultaneously retrieve trace gases and aerosol using measurements from the Multi-Angle Polarimeter (MAP) and CO2I Instrument. At the same time, it has the capability to perform the retrieval of trace gas from only CO2I measurements.

This study evaluates the performance of RemoTAP for combined CO2I-MAP and CO2I-only retrievals, respectively. We base our evaluation on synthetic CO2M measurements simulated for realistic atmospheric (aerosol, cirrus), surface, geometry conditions. CO2I-MAP retrieval method can reduce the regional bias in column-averaged dry-air mole fraction of CO2 (XCO2) by a factor of 3 for both land and ocean. It shows that only by the inclusion of MAP measurements, the large aerosol-induced biases can be mitigated, resulting in the retrievals that meet the mission requirement (precision <0.7 ppm and bias <0.5 ppm).

To further improve the accuracy of trace-gas retrievals, we develop a Neural Network (NN) approach to provide an accurate first guess of aerosol and surface parameters. We also develop a bias correction and quality filtering using an NN approach. 

How to cite: Lu, S., Fu, G., and Hasekamp, O.: Retrieving XCO2 from the CO2M mission: Joint use of Multi-Angle Polarimeter and spectrometer measurements, EGU General Assembly 2026, Vienna, Austria, 3–8 May 2026, EGU26-11587, https://doi.org/10.5194/egusphere-egu26-11587, 2026.

EGU26-11856 | Orals | AS3.16

Monitoring Persistent Methane Emissions from the Secunda CTL Synthetic Fuel Plant using Satellite Observations 

Iolanda Ialongo, Henrik Virta, Janne Hakkarainen, Johanna Tamminen, Marianne Girard, Berend Schuit, and Joannes Maasakkers

Reducing global methane emissions is vital in combating climate change. Satellite-based instruments provide a way to independently monitor methane emissions from various sources at different scales, helping to assess the progress toward emission reduction targets. In this study, we apply several data-driven methods to estimate methane emissions from the Secunda CTL (coal-to-liquids) synthetic fuel plant in South Africa, utilizing satellite observations from the TROPOspheric Monitoring Instrument (TROPOMI) aboard the Sentinel-5 Precursor (S5P) satellite, and the GHGSat fleet of high-resolution commercial satellites. We find annual mean emissions of about 13-22 t/h based on S5P/TROPOMI observations. These results are consistent with estimates from an automated TROPOMI methane plume detection and quantification method. Estimates based on GHGSat observations from individual sources within the plant sum to about 6 t/h on average. For comparison, Sasol, the operator of the Secunda CTL facility, reported methane emissions of 11.5 t/h for the period July 2023-June 2024, a value that falls between the TROPOMI- and GHGSat-based estimates. Our results highlight the value of satellite observations as a useful audit complementing reported emissions and demonstrate the importance of combining coarse- and fine-resolution data to monitor methane emissions at plant and intra-facility level in complex sources. This research is part of the activities carried out at the Finnish Meteorological Institute for the development of the Emission Observatory platform (https://www.emissionobservatory.org) and within the METSA (METhane emissions from South Africa's Secunda synthetic fuel plant) ESA Third Party Mission project. Most of the results of the project are included in the journal article by Virta et al. (Environ. Sci. Technol. Lett., 2026).

How to cite: Ialongo, I., Virta, H., Hakkarainen, J., Tamminen, J., Girard, M., Schuit, B., and Maasakkers, J.: Monitoring Persistent Methane Emissions from the Secunda CTL Synthetic Fuel Plant using Satellite Observations, EGU General Assembly 2026, Vienna, Austria, 3–8 May 2026, EGU26-11856, https://doi.org/10.5194/egusphere-egu26-11856, 2026.

EGU26-12809 | ECS | Orals | AS3.16

Estimation of CO2 total columns from synthetic MicroCarb spectral images using machine learning 

Laure Corazza, Cyril Crevoisier, Raymond Armante, and Virginie Capelle

Following the Paris Agreement, there has been an increasing need to better understand the global sources and sinks of greenhouse gases (GHG). Most previous space missions aiming to measure GHG concentrations did so using point-based observations of the solar radiation reflected by Earth’s surface (corresponding to the short-wave infrared domain). These measurements – with resolutions in the tens of kilometers – allowed to estimate column average of CO2 and CH4 through the inversion of the radiative transfer equation.

This discrete measurement method presents nonetheless the disadvantage of being limited in spatial coverage and resolution, which entails that the satellite can miss important emission zones such as large cities or power plants. New GHG observation missions therefore use spectro-imagers to provide surface-based measurements: this is the case of the new GOSAT-GW satellite, as well as the exploratory mode (called city mode) of the new MicroCarb satellite. Both were launched in the summer of 2025 and have similar measurement techniques as the upcoming CO2M mission. They will allow to cover large areas of tens of kilometers consistently and with a kilometer-scale precision.

However, analysing such images with the traditionnal method based on optimal estimation is doomed to be too computationally expensive, and there is a need to develop a faster retrieval technique which would allow to reach the same precision level while keeping into consideration constraints such as instrumental noise and limited spectral bands.

The use of machine learning seems to present a convenient solution to this problem: by training neural networks with known atmospheric datasets, the machine learning model can learn to extract the column average of the gases with an inversion of the radiative transfer. This presentation thus aims to present a retrieval method based on a neural network designed using the radiative transfer model 4A/OP and the spectroscopic database GEISA, as well as atmospheric and surface variables and their effect on spectroscopy. The combination with a Bayesian approach will provide an uncertainty for the retrievals through the use of a Bayesian neural network. Exploiting the spatial information contained in the spectral images could further improve the retrieval process.

The method will be applied to two synthetic spectral images which could be observed by the MicroCarb city mode, representing emission plumes of a power plant near Berlin and a factory near Reims, and the performance of the retrieval process will be assessed using both systematic and random estimation errors. A perspective on future missions will also be presented.

How to cite: Corazza, L., Crevoisier, C., Armante, R., and Capelle, V.: Estimation of CO2 total columns from synthetic MicroCarb spectral images using machine learning, EGU General Assembly 2026, Vienna, Austria, 3–8 May 2026, EGU26-12809, https://doi.org/10.5194/egusphere-egu26-12809, 2026.

EGU26-12839 | ECS | Orals | AS3.16

Daily High-Resolution CO₂ Mapping over European Urban Areas from Targeted Satellite Observations Using Machine Learning 

Ayah Abu-Hani, Jia Chen, Vigneshkumar Balamurugan, Gregory Osterman, and Matthäus Kiel

Urban regions are major contributors to anthropogenic CO₂ emissions, yet satellite-based observations of column-averaged CO₂ remain spatially and temporally sparse, limiting high-resolution urban monitoring. This study presents a machine-learning framework for predicting daily CO₂ over European urban areas at a spatial resolution of 0.02°, integrating satellite NO₂ observations, reanalysis meteorological variables, and surface data. High-density OCO-2 target-mode observations are used as ground truth, enabling robust learning of the relationships between CO₂ and its atmospheric and surface drivers.

Two predictive scenarios are evaluated. The first, a sample-based prediction designed primarily for spatial gap filling, achieves an R² of 0.98 ± 0.00 and an RMSE of 0.60 ± 0.02 ppm using 10-fold cross-validation. The second scenario assesses spatiotemporal generalization, yielding an average R² of 0.91 ± 0.02 and RMSE of 1.17 ± 0.14 ppm for temporal transfer, and R² of 0.85 ± 0.09 with RMSE of 1.25 ± 0.20 ppm for spatial transfer across European regions. Independent validation against ground-based CO₂ measurements from the Munich Urban Carbon Column network (MUCCnet) shows strong agreement, with R² values between 0.95 and 0.97 and RMSE ranging from 0.50 to 0.72 ppm.

The results demonstrate the potential of the proposed framework to fill observational gaps and generate reliable, high-resolution CO₂ fields over urban environments and their surroundings, supporting improved monitoring of anthropogenic CO₂ emissions where accurate information is most critical.

How to cite: Abu-Hani, A., Chen, J., Balamurugan, V., Osterman, G., and Kiel, M.: Daily High-Resolution CO₂ Mapping over European Urban Areas from Targeted Satellite Observations Using Machine Learning, EGU General Assembly 2026, Vienna, Austria, 3–8 May 2026, EGU26-12839, https://doi.org/10.5194/egusphere-egu26-12839, 2026.

Satellite remote sensing of global greenhouse gas (GHG) concentrations provides invaluable information about GHG sources and sinks, supporting efficient climate mitigation policies. Recently, the accuracy targets of upcoming GHG satellite missions have become increasingly stringent (±2 ppb for CH4; ±1 ppm for CO2).

Up to now, calibration and traceability of satellite GHG observations relies on two networks of ground-based remote sensing stations: the Total Carbon Column Observing Network (TCCON) and the COllaborative Carbon Column Observing Network (COCCON). Both networks are able to observe the same quantity as the satellite instruments: column-averaged dry-air mole fraction of CO2 and CH4. They also observe N2O, which will likely become another key GHG to be monitored in the future. For traceability, both networks rely on regular aircraft and balloon measurements with in-situ instruments that are traceable to the WMO scale for GHGs.

In 2025, the new project 24GRD06 MetCTG was started to improve the traceability of remote-sensing observations of atmospheric greenhouse gases, both from the ground as well as from satellites. This will be achieved by greatly improving the accuracy of the underlying spectral line parameters through theoretical work as well as in the lab. Methods will be established to make these improved parameters SI-traceable from end to end. The results will be validated in the field with in situ and ground-based observations. This will establish an alternative traceability chain to SI for ground-based and satellite retrievals. In the long term, the work should improve the consistency among ground-based sites and reduce the need for costly aircraft calibrations. Satellite GHG missions, which rely on these ground-based observations for calibration and validation, will benefit from an improved data comparability across missions and products.

More information about the 24GRD06 MetCTG project is available at https://www.metctg.ptb.de/.

Acknowledgments: The project 24GRD06 MetCTG receives funding from the European Partnership on Metrology, co-financed from the European Union’s Horizon Europe Research and Innovation Programme and by the Participating States.

How to cite: Feist, D. G. and the MetCTG Team: A new way to implement SI-traceability in greenhouse gas remote-sensing observations: the Metrology for Comparable and Trustworthy Greenhouse gas remote sensing datasets (24GRD06 MetCTG) project, EGU General Assembly 2026, Vienna, Austria, 3–8 May 2026, EGU26-14207, https://doi.org/10.5194/egusphere-egu26-14207, 2026.

EGU26-14237 | Posters on site | AS3.16

Inverse Modeling of CO2 Emissions from Point Sources using Large-Eddy Simulations with Observations from Uncrewed Aerial Vehicles 

Zixuan Xiao, Dylan Jones, Benoit Blanco, Sepehr Fathi, and Alexandre Quettier

There is increasing interest in using uncrewed aerial vehicles (UAVs) to make measurements of atmospheric trace gases. However, integrating these observations with atmospheric models is challenging because of the often high spatial and temporal resolution of the UAV observations and the relatively coarse resolution of atmospheric models. This scale mismatch is particularly challenging for inverse modeling of surface emissions of environmentally important trace gases, such as carbon dioxide (CO2), when using these data. Consequently, studies estimating CO2 emissions from UAV observations typically use a mass balance or Gaussian plume inverse modeling approach. Here we quantify CO2 emissions based on UAV observations from an offshore oil and gas facility by explicitly modeling atmospheric transport processes using a large-eddy simulation (LES) with the Weather Research and Forecasting (WRF) model. In situ CO2 observations were made by the Airborne Ultralight Spectrometer for Environmental Application (AUSEA) sensor on a UAV and the data were incorporated into a Bayesian inversion approach with WRF-LES simulations at a spatial resolution of 10 m. The reported emissions from the facility at the time of the UAV measurements were 42–48 tCO2/h. Starting from prior estimates that ranged from 30 ± 20 tCO2/h to 60 ± 40 tCO2/h, the inversion results suggested posterior emission estimates from 35.6 ± 5.8 tCO2/h to 43.7 ± 7 tCO2/h, respectively, which is a range that is consistent with the reported emissions. We also used the mass balance method and estimated emissions of 38.4 ± 14.4 tCO2/h, which are in agreement with the Bayesian inversion results as well as the reported emission estimates. Our results demonstrate the potential utility of high-resolution modeling in the context of the Bayesian inversion analysis to estimate point source emissions using UAV observations.

How to cite: Xiao, Z., Jones, D., Blanco, B., Fathi, S., and Quettier, A.: Inverse Modeling of CO2 Emissions from Point Sources using Large-Eddy Simulations with Observations from Uncrewed Aerial Vehicles, EGU General Assembly 2026, Vienna, Austria, 3–8 May 2026, EGU26-14237, https://doi.org/10.5194/egusphere-egu26-14237, 2026.

EGU26-14349 | Posters on site | AS3.16

Greenhouse Gas Emission Monitoring with the GHGSat Constellation: Advancing High-Resolution Methane Monitoring  

Mathias Strupler, Ariane Deslieres, Marianne Girard, Dylan Jervis, Jean-Philippe W MacLean, David Marshall, Jason Mckeever, Antoine Ramier, and Ewan Tarrant

As of late 2025, the GHGSat constellation has expanded to 14 high-resolution (~25 m GSD) methane-sensitive satellites capable of detecting, attributing, and quantifying emissions down to ~100 kg/hr. To enhance the actionable value of these observations, current research focuses on refining source rate quantification and deepening the understanding of the parameters that dictate detection limits in diverse environments. 

We are characterizing the influence of observation geometry, wind speed, and retrieval noise on the probability of detection (PoD) for specific source rates. By isolating these factors, we aim to provide more site-specific performance metrics across the global constellation. Simultaneously, to improve quantification accuracy, we are investigating how wind field variability, local elevation, and source geometry (e.g., point vs. area sources) affect plume transport and subsequent flux estimates. This integrated approach is particularly critical for characterizing emissions in complex industrial environments like landfills. 

Finally, we provide a status update on the GHGSat fleet, including our dedicated CO₂ sensor and an overview of upcoming satellite launches. 

How to cite: Strupler, M., Deslieres, A., Girard, M., Jervis, D., MacLean, J.-P. W., Marshall, D., Mckeever, J., Ramier, A., and Tarrant, E.: Greenhouse Gas Emission Monitoring with the GHGSat Constellation: Advancing High-Resolution Methane Monitoring , EGU General Assembly 2026, Vienna, Austria, 3–8 May 2026, EGU26-14349, https://doi.org/10.5194/egusphere-egu26-14349, 2026.

Was There a Tropical Land Carbon Sink During 2015-2023? Results from an Ensemble of Global
Inversion Models Constrained by OCO-2 Version 11 and the Global In Situ Network.

The lack of sufficient in situ observations over the Tropics makes the carbon balance and seasonality for
critical terrestrial regions such as the Amazon, the tropical rain forests in central Africa, and Tropical Asia
difficult to constrain with confidence. In some years the carbon budget is dominated by biomass burning,
while in other years, the dominant factors seem to be driven by climate forcing due to the El Niño Southern
Oscillation (ENSO). Previous studies using OCO-2 and the global in situ network (Liu et al, 2017; Palmer et
al, 2017; Crowell et al, 2019; Peiro et al, 2022; Byrne et al, 2024) have shown a more dynamic tropical
carbon cycle than what was understood previously. The duration and quality of the satellite XCO2 record is
now sufficient to begin investigating interannual variability in regional terrestrial carbon fluxes in the Tropics
as well as how the carbon fluxes respond to environmental and climatic drivers like temperature,
precipitation, vapor pressure deficit, and fire.


In this work, we will present preliminary results from the OCO-2 model intercomparison project (OCO-2
MIP) that estimates fluxes from numerous independent models using different data assimilation schemes
using surface and airborne in situ data as well as OCO-2 Version 11 retrievals. As noted in the past, the
strong El Niño of 2015-2016 resulted in strong tropical efflux in all tropical regions. The results also continue
to suggest that in the last decade, the Tropics have been net-zero or small source of carbon rather than being a
carbon sink. In this presentation, we will also discuss the causes of uncertainty associated with these
estimates, including the significant uncertainty due to modeled transport errors.

How to cite: Crowell, S.: Was There a Tropical Land Carbon Sink During 2015-2023? Results from an Ensemble of Global Inversion Models Constrained by OCO-2 Version 11 and the Global In Situ Network., EGU General Assembly 2026, Vienna, Austria, 3–8 May 2026, EGU26-14356, https://doi.org/10.5194/egusphere-egu26-14356, 2026.

EGU26-15573 | ECS | Posters on site | AS3.16

Using Satellite and Lagrangian Modeling to Estimate Urban CO2 Emissions in Hongkong 

Yue Zhou and Hui Su

Using Satellite and Lagrangian Modeling to Estimate Urban CO2 Emissions in HongkongYue Zhou and Hui SuUrban areas are responsible for emitting more than 70% of global fossil fuel carbon dioxide (CO2) emissions. Hongkong is one of the most world’s populated cities and accurate inversion of CO2 emissions using satellite form this region remains high uncertainty. However, urban CO₂ emissions are mainly derived from satellite using simple statistical methods, and there is less research to link between upwind emission sources and downwind CO₂ enhancements using models.To better understand of urban emission estimation from space, we use X-Stochastic Time-Inverted Lagrangian Transport model (“X-STILT”) (Wu et al., 2018) to simulate XCO2 enhancements in the summer of 2024 based on the Open-source Data Inventory for Anthropogenic CO2 (ODIAC) emission inventory for Hongkong. Independent satellite observations from NASA’s Orbiting Carbon Observatory‐3 (OCO‐3) satellite can provide wide area column average dry air mole fraction of carbon dioxide (XCO2) of entire urban areas. Furthermore, we perform a CarbonTracker-Lagrange inverse model to compare XCO2 simulations with observations. We found X-STILT model is able to reproduce most XCO2 enhancement observations. This study provides valuable insights into both urban emissions quantifying and mitigation decision making.References: Wu et al.,: A Lagrangian approach towards extracting signals of urban CO2  emissions from satellite observations of atmospheric column CO2  (XCO2): X-Stochastic Time-Inverted Lagrangian
 Transport model  (“X-STILT v1”)

How to cite: Zhou, Y. and Su, H.: Using Satellite and Lagrangian Modeling to Estimate Urban CO2 Emissions in Hongkong, EGU General Assembly 2026, Vienna, Austria, 3–8 May 2026, EGU26-15573, https://doi.org/10.5194/egusphere-egu26-15573, 2026.

The world invests significant resources every year on remote sensing platforms that aim to quantify the carbon cycle, whether through measurements of atmospheric composition or the land surface. Composition measurements – such as CO₂ and CH₄ – cannot be used directly but must be interpreted through inverse models of different complexity to estimate surface sinks and emissions, from global to urban scales. Flux inversion models aim to quantify the upwind fluxes associated with the downwind concentrations using knowledge of the atmospheric transport between. Therefore, inverse models and their associated inferred flux estimates are critically dependent upon an assumed transport operator.

We use multiple lines of evidence to explore the variability in the global transport of long-lived trace gases like CO2 and SF6. We present results from the CATRINE and OCO-2 SF6 Model Intercomparison Projects (MIPs) which explore the variability in the transport of long lived gases across Chemical Transport Models and their high-resolution General Circulation Model parent models. Additionally, we use the first dual transport atmospheric inversion framework, WOMBATv3, to further explore the relationship between inferred fluxes of CO2 and inversion model transport assumptions, e.g. GEOS-Chem and TM5.

How to cite: Schuh, A.: Evaluating Transport Model Uncertainty on Atmospheric Flux Inversions of CO2, EGU General Assembly 2026, Vienna, Austria, 3–8 May 2026, EGU26-15598, https://doi.org/10.5194/egusphere-egu26-15598, 2026.

EGU26-16229 | ECS | Posters on site | AS3.16

Ground-Based FTIR Observations of XCO2 and XCH4 during the ASIA-AQ Campaign in Seoul, South Korea 

Minju Kang, Myoung-Hwan Ahn, Sumin Kim, Young-Seok Oh, and Jeongsoon Lee

During the ASIA-AQ international field campaign in February 2024, ground-based greenhouse gas observations were conducted at urban and background sites in South Korea. Portable Fourier Transform Infrared (FTIR) spectrometers, EM27/SUN, as a component of the COllaborative Carbon Column Observing Network (COCCON), were deployed at Ewha Womans University and Olympic Park in Seoul to measure column-averaged dry-air mole fractions of carbon dioxide (XCO2) and methane (XCH4). In parallel, a high-resolution stationary FTIR spectrometer, the IFS125HR, operated as a reference instrument of the Total Carbon Column Observing Network (TCCON), conducted background observations at Anmyeondo. Prior to the campaign, a side-by-side intercomparison involving two EM27/SUN instruments and the IFS125HR was carried out at Anmyeondo to assess instrument consistency. The results showed that temporal concentration variability and short-term enhancement events were consistently captured by all three instruments, although systematic biases were identified among them. To align the EM27/SUN measurements with the TCCON reference scale, calibration factors for both EM27/SUN instruments were derived based on comparisons with the IFS125HR and subsequently applied to the measurements acquired during the campaign period. During the campaign, three days of coincident observations among the three instruments were obtained. Analysis of these data revealed that both XCO2 and XCH4 exhibited the highest concentrations at Ewha Womans University, followed by Olympic Park and Anmyeondo. In addition, daily variability of greenhouse gas concentrations differed by site and varied from day to day. Following the campaign, extended EM27/SUN observations were conducted at Ewha Womans University through May 2024 and were used to evaluate consistency with satellite retrievals. Comparisons with S5P TROPOMI showed that XCH4 agreed within approximately 2% and exhibited a correlation coefficient of 0.68. This study shows that ground-based XCO2 and XCH4 observations obtained during the study period are meaningful for intercomparison among ground-based sites and comparison with satellite observations.

How to cite: Kang, M., Ahn, M.-H., Kim, S., Oh, Y.-S., and Lee, J.: Ground-Based FTIR Observations of XCO2 and XCH4 during the ASIA-AQ Campaign in Seoul, South Korea, EGU General Assembly 2026, Vienna, Austria, 3–8 May 2026, EGU26-16229, https://doi.org/10.5194/egusphere-egu26-16229, 2026.

EGU26-17022 | ECS | Posters on site | AS3.16

Joint Retrieval of CO₂ and CH₄ Concentrations for the Multi‑Spectral Imaging Carbon Observatory (MUSICO) 

Fei Pan, Chengxing Zhai, and Hui Su

A joint retrieval algorithm for CO₂ and CH₄ concentrations is presented for the Multi‑spectral Imaging Carbon Observatory (MUSICO). This instrument is based on a Fabry‑Pérot (FP) imaging spectrometer to be deployed on the Chinese Space Station in 2026, and is designed to quantify facility‑scale emissions at 100 m spatial resolution. MUSICO acquires high‑resolution spectra in the CO₂ (1595–1620 nm) and CH₄ (1630–1655 nm) bands.

A central challenge for point-source imaging is systematic bias from atmospheric aerosol scattering, which perturbs top-of-atmosphere radiance and degrades gas retrievals. We address this within an optimal-estimation framework that integrates aerosol correction by combining multi-angle observations, enabled by steerable pointing, with auxiliary channels (O₂ near 765 nm and aerosol-sensitive bands at 440, 685, and 865 nm). This synergy improves the separation of aerosol-induced radiance perturbations from true gas absorption.

The forward model is based on MODTRAN and includes spectrally resolved gas absorption, surface reflectance, and multiple scattering. End-to-end simulations show that the integrated methodology effectively mitigates aerosol-induced biases and enables the mission to meet its accuracy targets for monitoring anthropogenic point sources.

How to cite: Pan, F., Zhai, C., and Su, H.: Joint Retrieval of CO₂ and CH₄ Concentrations for the Multi‑Spectral Imaging Carbon Observatory (MUSICO), EGU General Assembly 2026, Vienna, Austria, 3–8 May 2026, EGU26-17022, https://doi.org/10.5194/egusphere-egu26-17022, 2026.

EGU26-17726 | ECS | Orals | AS3.16

A new Copernicus Atmosphere Monitoring Service for methane emissions at facility scale using atmospheric Copernicus Contributing Missions data. 

Arthur Daniel Bosman, Jurriaan van 't Hoff, Xin Zhang, Joannes D. Maasakkers, Ivar R. van der Velde, Stijn Dellaert, Hugo Denier van der Gon, Panagiotis Kountouris, Sebastian Steinig, and Ilse Aben

The mitigation of methane emissions is one of the prime targets of global climate policy due to methane’s large contribution to global warming. Satellite instruments have proven to be very effective in mapping and tracking methane super-emitters. There are several new Copernicus Contributing Missions (CCMs) that are able to provide high resolution (~ 25m) methane abundance data that enables detection of emissions from individual facilities. We introduce a new Copernicus Atmosphere Monitoring Service (CAMS) service where we will use these CCMs to pinpoint individual methane sources all around the world to provide insights on emissions in support of mitigation efforts. The service will start with GHGSat data and aims to incorporate GEISAT and GESat data later. We will obtain observations over hundreds of methane hot spots and sites of interest around the world in support of climate policy. We process the satellite data starting from the methane abundance data provided by the CCMs using the SRON-developed HyperGas package. The data are standardized and potential methane plumes in the abundance field are automatically masked. Multiple expert operators then determine and agree on which masked features are true methane plumes. The automatically generated masks are then used for emission rate estimation using the integrated mass enhancement (IME) method. This methodology is calibrated using instrument-specific synthetic observations and will be evaluated using observations of controlled releases. Our semi-supervised approach allows for a consistent quantification of plumes over the full range of observations. Our processing is done independently from the analysis done by the CCMs themselves and thus serves as an evaluation. We also compare our results with bottom-up emission estimates such as included in the “TNO Emission Atlas”.  This way, our work can provide a crucial link between satellite methane observations and facility level bottom-up inventories.  We present our approach in consistently handling this large volume of data as well as initial results and interesting cases.

How to cite: Bosman, A. D., van 't Hoff, J., Zhang, X., Maasakkers, J. D., van der Velde, I. R., Dellaert, S., Denier van der Gon, H., Kountouris, P., Steinig, S., and Aben, I.: A new Copernicus Atmosphere Monitoring Service for methane emissions at facility scale using atmospheric Copernicus Contributing Missions data., EGU General Assembly 2026, Vienna, Austria, 3–8 May 2026, EGU26-17726, https://doi.org/10.5194/egusphere-egu26-17726, 2026.

EGU26-18371 | Orals | AS3.16

TANGO The Twin Anthropogenic Greenhouse Gas Observers Mission 

Jochen Landgraf, Pepijn Veefkind, Antje Ludewig, Benjamin Leune, Edward van Amelrooy, Mirna van Hoek, Tobias Borsdorff, Raul Laasner, Richard van Hees, Ryan Cooney, Karin Louzada, Nurcan Alpay Koc, Bryan de Grooij, Stijn Dellaert, Hugo Denier van der Gon, Jean-Pascal Lejault, Massimiliano Pastena, Bram Sanders, Zeger de Groot, and Cecilia Marasini

The Twin Anthropogenic Greenhouse Gas Observers (TANGO) mission is a small satellite mission to be launched in 2028, under the ESA Scout Programme tapping into NewSpace to quickly deliver affordable and innovative science, as part of ESA’s FutureEO Programme a schedule of three years from mission kick-off to launch. Designed to complement the Copernicus atmospheric monitoring missions Sentinel-5 Precursor, Sentinel‑4/5, and the CO2M carbon dioxide monitoring mission, TANGO will observe carbon dioxide and methane emissions from human activities to support verification of the Paris Agreement. The mission is anticipated to generate >10,000 emission estimates per year for major industrial facilities and power plants. The scientific community will be able to propose specific observation targets, which will be incorporated into mission planning alongside routine observations aimed at enhancing current state-of-the-art point-source emission inventories.


Two agile CubeSat-class satellite buses, each carrying an imaging spectrometer, will operate in close formation with a temporal separation of less than 1 minute, enabling near-sequential observations of the same target area. Platform agility is ensured by three-axis stabilized reaction wheel control, which permits flexible spectrometer pointing with a roll capability of ±30° and forward motion compensation. This forward motion compensation increases the effective integration time by up to a factor of five, thereby enhancing spatial coverage and improving the precision of the retrieved geophysical quantities. As part of the mission implementation, a dedicated ground segment will be established to provide the scientific user community with open and freely accessible data products. These will include calibrated top-of-atmosphere radiance measurements (Level-1b), column-averaged dry air mole fractions of CO2 (XCO2) and CH4 (XCH4), as well as tropospheric NO2 column densities (Level-2), and corresponding emission estimates for CO2, CH4, and NO2 (Level-4). TANGO’s first satellite, TANGO-Carbon, will measure solar-reflected radiances in the 1.6 µm spectral region with a spectral resolution of 0.45 nm, enabling the detection of moderate to strong CH4 emissions (≥ 5 kt yr⁻¹) and CO2 emissions (≥ 2.5 Mt yr⁻¹). The TANGO-Nitro instrument will provide collocated NO2 observations derived from radiance measurements in the visible spectral range with a spectral resolution ≤ 0.6 nm, facilitating plume detection and the use of the CO2/NO2 ratio for improved source characterization and emission quantification.  In this contribution, we describe the status of the TANGO mission, the planned data products, the associated scientific opportunities, and the mechanisms for engagement of the scientific community in data exploitation.

How to cite: Landgraf, J., Veefkind, P., Ludewig, A., Leune, B., van Amelrooy, E., van Hoek, M., Borsdorff, T., Laasner, R., van Hees, R., Cooney, R., Louzada, K., Alpay Koc, N., de Grooij, B., Dellaert, S., Denier van der Gon, H., Lejault, J.-P., Pastena, M., Sanders, B., de Groot, Z., and Marasini, C.: TANGO The Twin Anthropogenic Greenhouse Gas Observers Mission, EGU General Assembly 2026, Vienna, Austria, 3–8 May 2026, EGU26-18371, https://doi.org/10.5194/egusphere-egu26-18371, 2026.

EGU26-18382 | Posters on site | AS3.16

GEMINI-UK: Towards improved carbon flux estimates for the UK using a national network of ground-based greenhouse gas observing spectrometers 

Neil Humpage, Paul Palmer, Alex Kurganskiy, Liang Feng, Jerome Woodwark, Will Morrison, Stamatia Doniki, Damien Weidmann, Robert Parker, and Lakshmi Bharathan

The UK has a long-term goal in place to achieve net-zero greenhouse gas (GHG) emissions by 2050. As part of the UK Greenhouse gas Emissions Measurement Modelling Advancement programme (GEMMA), which aims to provide regular, timely, data-driven emissions estimates for the UK at a regional scale, scientists from the National Centre for Earth Observation have set up a network of ground-based shortwave infrared spectrometers around the UK. This network, called GEMINI-UK (Greenhouse gas Emissions Monitoring network to Inform Net-zero Initiatives for the UK), will provide continuous observations of the column concentrations of carbon dioxide and methane during cloud-free conditions from locations around the country.

Through the GEMMA programme data from GEMINI-UK will be used in a Bayesian inversion framework, along with other sources of GHG concentration data in the UK, to constrain regional flux estimates of carbon dioxide and methane. We have designed GEMINI-UK to deliver the biggest uncertainty reductions in carbon dioxide flux estimates, working closely with host partners that include UK universities, a research institute and a secondary school to promote the open access and transparency of the collected data. The network comprises ten new Bruker EM27/SUN spectrometers, which we operate in automated weatherproof enclosures using a design developed by University of Edinburgh researchers, allowing year-round autonomous observations across multiple sites.

In this presentation we describe the status, network design, first data, and longer-term goals of GEMINI-UK, including an ongoing evaluation of the GEMINI-UK station located alongside the high resolution TCCON (Total Carbon Column Observing Network) spectrometer at the Rutherford Appleton Laboratory in Harwell, Oxfordshire. In addition, we show the potential for GEMINI-UK data to constrain carbon dioxide and methane fluxes for the UK using a regional Bayesian inversion framework, and demonstrate the opportunities that GEMINI-UK provides for regional scale validation of existing and future greenhouse gas observing satellite missions.

How to cite: Humpage, N., Palmer, P., Kurganskiy, A., Feng, L., Woodwark, J., Morrison, W., Doniki, S., Weidmann, D., Parker, R., and Bharathan, L.: GEMINI-UK: Towards improved carbon flux estimates for the UK using a national network of ground-based greenhouse gas observing spectrometers, EGU General Assembly 2026, Vienna, Austria, 3–8 May 2026, EGU26-18382, https://doi.org/10.5194/egusphere-egu26-18382, 2026.

EGU26-19155 | ECS | Posters on site | AS3.16

Monitoring CH4 in high latitudes: gaps and future needs identified through the Arctic Methane and Permafrost Challenge 

Martijn Pallandt and the Arctic Methane and Permafrost Challenge team

The rapidly warming Arctic is expected to experience significant carbon release as permafrost thaws, yet large uncertainties remain regarding both the rate  and the carbon species released (e.g. CO2 versus CH4). As part of the Arctic Methane and Permafrost Challenge, co-led by the European and North American Space Agencies, we present an analysis of current monitoring gaps and future needs, alongside a case study evaluating the capability of existing and future top-down observing systems (including passive and active satellites and atmospheric towers )to detect local changes in CH4 emissions.

This presentation focuses on the top down observing systems, as well as the infrastructure and models required to support them. Currently, XCH4 satellite observations in high latitudes lack coverage during wintertime, nighttime, overcast conditions, and over most ocean regions. While future missions such as MERLIN may alleviate some of these limitations, high-latitude-specific challenges such as large observational angles combined with darkness and snow or ice reflectance are expected to persist for most platforms. Although many years of data are already available from a wide range of observing systems, with a substantial increase anticipated in the near future, the community is not yet prepared to fully utilise these data.

First, we lack data standards that allow both direct CH4 observations and auxiliary variables to be combined optimally, particularly across disciplinary boundaries. To address this, we propose a high-latitude data and model intercomparison experiment. A second major challenge is the sheer volume of data being produced, which will require dedicated infrastructure and enhanced modelling capabilities for effective ingestion and analysis, particularly given the current difficulties in fully utilizing TROPOMI data. Despite significant efforts, major gaps remain in ground-based observations, which are essential for the validation and calibration of satellite and airborne systems.

Translating observations into pan-Arctic methane budgets necessarily involves modelling. In this context, missing information on soil and wetland related characteristics emerges as a key limitation. In addition, the freeze-thaw cycle closely linked to microbial activity and soil moisture remains inadequately monitored. Finally, disturbances are both difficult to observe and predict, yet play a critical role in present-day and future Arctic CH4 emissions.

Overall, we present a roadmap for the research priorities and infrastructure investments required to reliably quantify an integrated Arctic methane budget.

How to cite: Pallandt, M. and the Arctic Methane and Permafrost Challenge team: Monitoring CH4 in high latitudes: gaps and future needs identified through the Arctic Methane and Permafrost Challenge, EGU General Assembly 2026, Vienna, Austria, 3–8 May 2026, EGU26-19155, https://doi.org/10.5194/egusphere-egu26-19155, 2026.

EGU26-20749 | Posters on site | AS3.16

Satellite-derived XCO2 and XCH4 climate data records generated with the latest version of the EnseMble Median Algorithm (EMMA) 

Maximilian Reuter, Blanca Fuentes Andrade, Michael Buchwitz, Stefan Noël, Michael Hilker, Oliver Schneising, Heinrich Bovensmann, and Hartmut Bösch

Carbon dioxide (CO₂) and methane (CH₄) are the two most important anthropogenic greenhouse gases and are the primary drivers of ongoing climate change. Satellite-based remote sensing of their column-average dry-air mole fractions (XCO2 and XCH4) contributes to an improved understanding of the climate system and natural carbon fluxes, enables the quantification of anthropogenic emissions, and supports the monitoring of emission reduction measures. Many of these applications have demanding requirements on the accuracy of the underlying satellite data. In particular, climate studies benefit from long-term climate data records with high inter-sensor consistency.

For decades, climate modellers use ensemble approaches to calculate the ensemble median and to estimate uncertainties of climate projections where no ground-truth is available. Following this concept, the EnseMble Median Algorithm (EMMA) enables the combination of multiple XCO2 and XCH4 data sets from different satellite instruments into a single, consistent data product with high accuracy and quantified uncertainties. Since 2016, EMMA-based XCO2 and XCH₄ climate data records have been generated and made publicly available within the framework of the Copernicus Climate Change Service (C3S).

The latest EMMA version, v5.1, represents a significant update of the algorithm. It enables, for the first time, the meaningful integration of very large data sets, such as those from Sentinel-5P, and allows the generation of data products suitable also for the analysis of small-scale emission sources. Our presentation, will introduce the updated algorithm, the generated XCO2 and XCH4 climate data records, and present validation results.

How to cite: Reuter, M., Fuentes Andrade, B., Buchwitz, M., Noël, S., Hilker, M., Schneising, O., Bovensmann, H., and Bösch, H.: Satellite-derived XCO2 and XCH4 climate data records generated with the latest version of the EnseMble Median Algorithm (EMMA), EGU General Assembly 2026, Vienna, Austria, 3–8 May 2026, EGU26-20749, https://doi.org/10.5194/egusphere-egu26-20749, 2026.

EGU26-20751 | Orals | AS3.16

From Snapshots to Fluxes: Independent Wind Retrieval Algorithms for Next-Generation Multi-image Greenhouse Gas Satellites via Deep Learning 

Bastiaan van Diedenhoven, Piyushkumar Patel, Koen Reerink, Tobias Borsdorff, and Jochen Landgraf

As the international community moves towards the second Global Stocktake under the Paris Agreement, the demand for independent, transparent, and verifiable greenhouse gas (GHG) emission estimates has never been more critical. While satellite-based monitoring offers a powerful verification tool, the uncertainty of top-down flux estimates is currently dominated by substantial uncertainties in local wind speed input, which typically relies on coarse meteorological reanalysis models. This dependency introduces potential biases and correlated errors that undermine the scientific integrity required for high-stakes climate policy. Addressing this bottleneck, we present a comprehensive science study dedicated to developing an independent, data-driven in-plume wind retrieval framework designed specifically for potential future satellite missions equipped with multi-angle or multi-platform observations. By simulating the data products of such missions using high-resolution Large-Eddy Simulations (LES), we generated a robust dataset of realistic plume dynamics to develop and validate our algorithms. Exploring the temporal information embedded across consecutive plume images, we propose and evaluate two distinct, complementary methodologies for deriving wind velocity fields directly from plume imagery. First, we apply an Multi-Image Correlation Image Velocimetry (CIV) algorithm, optimized to dynamically correct temporal centering errors by averaging correlation surfaces across the observations sequence. Second, we introduce CVision-CIV, a novel deep learning approach based on the UnLiteFlowNet-PIV architecture, which utilizes Convolutional Neural Networks (CNNs) to extract morphological flow features directly from noisy imagery sets. Through an application on simulated CO2 emission plumes, we  demonstrate that while physical CIV methods provide robust baselines, the CVision-CIV model exhibits superior stability in low signal-to-noise regimes, effectively suppressing sensor noise where traditional correlation breaks down. By validating these parallel pathways on LES-generated observations, this work establishes a comprehensive algorithmic foundation for defining observational requirements for future missions aiming to replace reanalysis proxies with precise, observation-based wind products for improved GHG monitoring. We will discuss the methods’ sensitivity to observational noise, number of images, time-difference between images and resolution.

How to cite: van Diedenhoven, B., Patel, P., Reerink, K., Borsdorff, T., and Landgraf, J.: From Snapshots to Fluxes: Independent Wind Retrieval Algorithms for Next-Generation Multi-image Greenhouse Gas Satellites via Deep Learning, EGU General Assembly 2026, Vienna, Austria, 3–8 May 2026, EGU26-20751, https://doi.org/10.5194/egusphere-egu26-20751, 2026.

EGU26-21363 | Posters on site | AS3.16

Tango mission NO2 End-to-end simulator 

Mirna van Hoek, Pepijn Veefkind, Jochen Landgraf, Antje Ludewig, Benjamin Leune, Edward van Amelrooy, Tobias Borsdorff, Raul Laasner, Richard van Hees, Ryan Cooney, Karin Louzada, Nurcan Alpay Koc, Bryan de Groejj, Hugo Denier van der Gron, Zeger de Groot, and Cecilla Marasini

Tango consists of two CubeSat platforms, Tango-Carbon and Tango-Nitro, flying in formation.

NO2, while not a greenhouse gas itself, can serve as a constraint on CO2 emissions, because both NO2 and CO2 are frequently co-emitted from similar combustion processes. Due to the low atmospheric background concentration of NO2 better detection of CO2 emission plumes is possible.
Analysis of NO2 levels provides additional information about the magnitude of CO2 emissions.

Detector requirements of the Nitro and Carbon instruments are analyzed using The Tango End-to-end simulator. It consists of a suite of modules that address all aspects of the mission data flow.

In this contribution we will describe the NO2 branch of the simulator.

How to cite: van Hoek, M., Veefkind, P., Landgraf, J., Ludewig, A., Leune, B., van Amelrooy, E., Borsdorff, T., Laasner, R., van Hees, R., Cooney, R., Louzada, K., Alpay Koc, N., de Groejj, B., van der Gron, H. D., de Groot, Z., and Marasini, C.: Tango mission NO2 End-to-end simulator, EGU General Assembly 2026, Vienna, Austria, 3–8 May 2026, EGU26-21363, https://doi.org/10.5194/egusphere-egu26-21363, 2026.

EGU26-21524 | ECS | Orals | AS3.16

Modelling Atmospheric CO2 in Denmark for Remote Sensing applications 

Niels S Hvidberg, Hoyeon Shi, Anne Sofie Lansø, Jesper Heile Christensen, Jacob Høyer, and Carsten Ambelas Skjoth

The Copernicus sentinel expansion missions include the first European CO2 measuring satellite, CO2M, scheduled to be launched in late 2027. To utilize the CO2M satellite data, it requires a good knowledge of the variation in anthropogenic and natural sources of CO2 from models and observations. In this project, we present new modelling results of the temporal and spatial variation in atmospheric CO2 across Denmark. This is done by employing an updated version of the DEHM-SPA-CO2 model system, being developed.

The DEHM-SPA-CO2 model system consists of the Danish Eulerian Hemispheric Model (DEHM) adapted for CO2 and coupled to the mechanistic biosphere flux model Soil-Plant-Atmosphere (SPA). The model has been updated with a new high-resolution emissions dataset for Denmark, as well as simulated traffic activity from COMPASS, following different experimental policies for impacting emissions. The model system is evaluated against the ICOS station network, and preliminary results show good agreement.

Additionally, data from a new urban observation site in Copenhagen are used together with satellite data from OCO-2 and GOSAT-2 to evaluate the modelling results. GOSAT-1 was also considered but only few observations are available for Denmark. The Urban CO2 station is located on top of a building in Copenhagen and will be used to evaluate the model representation of Traffic emissions. The OCO-2 and GOSAT-2 data are used to fit a seasonal variation for Denmark.

Lastly, we present a discussion of the possibility of doing mass flux estimates for emissions from Copenhagen using OCO-2 overpasses in optimal wind conditions. This, however, still faces the challenge of a low signal-to-noise ratio. While it is typically manageable for point sources, the more diffuse emissions from a city such as Copenhagen result in a lower ratio, complicating the inference of CO2 signals.

How to cite: Hvidberg, N. S., Shi, H., Lansø, A. S., Christensen, J. H., Høyer, J., and Skjoth, C. A.: Modelling Atmospheric CO2 in Denmark for Remote Sensing applications, EGU General Assembly 2026, Vienna, Austria, 3–8 May 2026, EGU26-21524, https://doi.org/10.5194/egusphere-egu26-21524, 2026.

EGU26-22834 | Posters on site | AS3.16

Advancements in Satellite-Based CO2 Monitoring: OCO-2 and OCO-3 Observations and Their Role in Urban Emission Quantification 

Matthäus Kiel, Abhishek Chatterjee, Doyeon Ahn, John Lin, Dustin Roten, and Vivienne Payne

Recent advancements in satellite-based CO₂ observations have significantly improved our ability to quantify local and urban emissions. In recent years, methodological advancements have included linking total column CO₂ (XCO2) observations to emission sources, deriving emission estimates that are less dependent on prior inventories, using solar-induced fluorescence (SIF) to distinguish between biospheric and anthropogenic fluxes in cities, and resolving fine-scale urban CO₂ gradients to attribute emissions to specific sectors. Together, these developments lead to more accurate and reliable emission estimates from space in urban areas.

Long term OCO-2 and OCO-3 XCO2 measurements have been particularly valuable in advancing urban CO₂ studies. Further, OCO-3’s Snapshot Area Mapping (SAM) observations provide high-density CO₂ measurements over targeted areas, improving our understanding of emissions from entire cities down to individual point sources. Techniques such as Gaussian plume modeling, cross-sectional flux methods, and integrated mass enhancement allow to analyze these measurements in great detail. Additionally, using multi-species approaches and combining SAM data with collocated observations of nitrogen dioxide (NO2), carbon monoxide (CO), and other atmospheric gases from space- and ground-based sensors have the potential to provide insights into combustion efficiencies, sector-specific emissions, and more.

This presentation will cover recent advances and studies in urban CO₂ monitoring, focusing on how OCO-2 and OCO-3 observations and current methods are contributing to the development of independent satellite-based greenhouse gas measurement, reporting, and verification (MRV) systems, and discussing the limitations of current systems.

How to cite: Kiel, M., Chatterjee, A., Ahn, D., Lin, J., Roten, D., and Payne, V.: Advancements in Satellite-Based CO2 Monitoring: OCO-2 and OCO-3 Observations and Their Role in Urban Emission Quantification, EGU General Assembly 2026, Vienna, Austria, 3–8 May 2026, EGU26-22834, https://doi.org/10.5194/egusphere-egu26-22834, 2026.

EGU26-22948 | Orals | AS3.16

Progress of CO2M implementation, the Copernicus mission for monitoring anthropogenic carbon dioxide from space 

Yannig Durand, Hana Ouslimani, Gregory Bazalgette, Monica Martinez Fernandez, Terry Bastirmaci, Angela Birtwhistle, Yasjka Meijer, and Valerie Fernandez

The European Space Agency (ESA), in collaboration with the European Commission (EC) and EUMETSAT, is developing as part of the EC’s Copernicus Sentinel expansion programme, a space-borne observing system for quantification of the emissions of the main greenhouse gases: anthropogenic carbon dioxide (CO2) and methane (CH4). The anthropogenic CO2 monitoring (CO2M) mission will be implemented as a constellation of three identical LEO satellites, to be operated over a period of at least 7 years and measuring CO2 concentration in terms of column-averaged dry air mole fraction (denoted as XCO2). Each satellite will continuously image XCO2 along the satellite track on the sun-illuminated part of the orbit, with a swath width of 250 km. Observations will be provided at a spatial resolution better than 2 x 2 km2, with high precision (<0.7 ppm) and accuracy (bias <0.5 ppm), which are required to resolve the small atmospheric gradients in XCO2 originating from anthropogenic activities.

The demanding mission requirements necessitate a payload composed of four instruments, which simultaneously perform co-located measurements. The main instrument, called CO2I, consists of a push-broom imaging spectrometer which will perform co-located measurements of top-of-atmosphere radiances in the Near Infrared (NIR) and Short-Wave Infrared (SWIR) at high to moderate spectral resolution (NIR: 747- 773nm @0.1nm, SWIR-1: 1595-1675nm @0.3nm, SWIR-2: 1990-2095nm @0.35nm) for retrieving XCO2 and XCH4. These observations are complemented by a second instrument called NO2I in the same spectrometer acquiring measurements in the visible spectral range (405-490 nm @0.6nm), providing vertical column measurements of nitrogen dioxide (NO2) that serve as a tracer to high temperature combustion of fossil-fuel and related emission plumes. High quality retrievals of XCO2 will be ensured even in the presence of aerosol loading, thanks to co-located measurements of aerosol properties resulting from a third instrument called Multiple Angle Polarimeter (MAP). Polarimetric measurements are performed over 40 angular views and in six spectral channels in the range 410 nm to 865 nm. A fourth instrument is a three-band Cloud Imager (CLIM) that will provide the required capacity to detect small tropospheric clouds and cirrus cover with an accuracy of 1% to 5% and a sampling better than 400 m. Indeed, cloud contamination has a strong impact on the XCO2 retrieval.

Starting by a summary of the main scientific drivers, this paper will provide an overview of the progress of the space segment development: platform, payload as well as the end-to-end simulator. CO2M is now in phase D, with manufacturing, integration and testing of the first two flight models (PFM and FM2) on-going.

How to cite: Durand, Y., Ouslimani, H., Bazalgette, G., Martinez Fernandez, M., Bastirmaci, T., Birtwhistle, A., Meijer, Y., and Fernandez, V.: Progress of CO2M implementation, the Copernicus mission for monitoring anthropogenic carbon dioxide from space, EGU General Assembly 2026, Vienna, Austria, 3–8 May 2026, EGU26-22948, https://doi.org/10.5194/egusphere-egu26-22948, 2026.

China, holding the world’s largest shale gas reserves, lacks precise data on methane emissions from its rapidly expanding production. We introduce a two-tiered mobile measurement approach, using a mobile laboratory to measure methane concentrations across 125 well pads (approximately 750 wells) distributed among four major production blocks (Changning, Weiyuan, Fuling, and Luzhou). These blocks contributed 84% of China’s total shale gas production in 2023, providing the first comprehensive ground-level measurements. Stationary downwind monitoring of well pads revealed emission rates from 0.002 to 98.86 kg/h, validated through mobile observations of methane concentrations across the region. Notably, 10% of well pads were responsible for 89% of total emissions. The extrapolation revealed that methane emissions from shale gas production in China for 2023 were estimated at 16,842 t (6,444–29,991 t, 95% CI). The methane leakage rate was 0.10% (0.04%–0.17%, 95% CI), lower than major U.S. fields, and similar to that of U.S. dry gas fields. Our research identifies gas lift venting, incomplete combustion from compressors, and process venting as significant sources of super-emissions in China’s shale gas upstream production chain. The methodology employed, based on comprehensive and targeted field measurements, demonstrates its effectiveness in providing a scientific basis for formulating precise and effective regulatory policies on methane emissions.

How to cite: Guo, M. and Hong, P.: Assessing Methane Emissions from Shale Gas Production in China: A Two-tiered Mobile Measurement Approach, EGU General Assembly 2026, Vienna, Austria, 3–8 May 2026, EGU26-120, https://doi.org/10.5194/egusphere-egu26-120, 2026.

EGU26-1937 | ECS | Posters on site | AS3.17

Towards high-resolution CH4 simulations for tropical South America: a preparatory study for the CoMet 3.0 mission using ICON-ART 

Nicolò De Santis, David Ho, Michał Gałkowski, Santiago Botía, and Christoph Gerbig

Methane (CH4) is a key greenhouse gas contributing to global warming, therefore a comprehensive understanding of its sources, sinks, and feedback mechanisms is essential for budgeting of emissions. However accurate methane apportionment, especially for emissions form natural sources (e.g. wetlands) remains a challenge, particularly in tropical regions where emissions from wetlands are highly uncertain. Contributions from human activities are generally better understood, however there are still areas where additional information or methodology improvements would be relevant.

The upcoming CoMet 3.0 Tropics mission (July-August 2026) aims to reduce these uncertainties through intensive airborne measurements of CH4 and CO2 aboard HALO (High Altitude and LOng range research aircraft) over Brazil, targeting tropical wetlands and anthropogenic hotspots.

To support mission planning and interpretation, a regional modeling framework based on ICON-ART is developed, configured in limited-area mode (LAM) over Brazil at ~6.5 km resolution (R03B08 grid). The model is driven by ERA5 meteorology and CAMS inversion-optimized CH4 fields (v22r2), with anthropogenic emissions from EDGAR v8.0 and wetland emissions from WetCharts v1.3.3.

Here, we present a simulation for August 2022 serving as a methodological testbed for the modeling system. This work demonstrates the feasibility of high-resolution CH4 simulations in tropical South America using ICON-ART and provides a foundation for future analysis of the results from CoMet 3.0 Tropics mission.

How to cite: De Santis, N., Ho, D., Gałkowski, M., Botía, S., and Gerbig, C.: Towards high-resolution CH4 simulations for tropical South America: a preparatory study for the CoMet 3.0 mission using ICON-ART, EGU General Assembly 2026, Vienna, Austria, 3–8 May 2026, EGU26-1937, https://doi.org/10.5194/egusphere-egu26-1937, 2026.

EGU26-2697 | Posters on site | AS3.17

Methane measurements at 90 abandoned, cut & buried onshore wells in Germany 

Martin Blumenberg, Sebastian Jordan, Martin Krüger, and Stefan Schloemer

Abandoned oil and gas wells can be significant sources of methane emissions into the atmosphere. However, the extent of these potential emissions is often unclear, and mitigation requires detailed knowledge of the location of emitters. In Germany, the Federal Institute for Geosciences and Natural Resources has investigated a selection of wells of the in total ~25.000 onshore oil and gas wells for the first time. One challenge in investigating these wells is the mandatory decommissioning process, i.e. plugging, cutting and burying. For such soil buried wells, a measurement strategy was developed in which emissions were measured in an area of 30 x 30 m around the well and, for comparison, in a nearby reference area to record the natural background (Jordan et al., 2025). Between 2022 and 2025, nearly 90 wells of varying ages were investigated in northern Germany, where most of Germany's current and historical oil and gas production has taken place. In addition to investigating potential methane and CO2 emissions, soil gas compositions and stable carbon isotopes (and occasionally also hydrogen isotopes) in the soil gas methane were measured at each study site. In analogy to the reference areas and as is typical for forest, arable, and meadow soils, most well sites acted as methane sinks. Abnormalities compared to the reference areas were only determined at a few wells. For instance, a maximum of ~40 mg h-1 methane emissions were detected at one well, where small amounts of crude oil also appear to be escaping. However, covering the wells with soil offer an advantage here, as the gas and oil composition geochemically indicates a strong and depth-increasing influence of hydrocarbon-degrading microorganisms (Blumenberg et al., 2025). Final evaluations have not yet been completed, but for Germany, our results indicate that methane emissions from old oil and gas wells are relatively low. Open questions that are currently being addressed include the temporal variability of methane emissions, but also the importance of e.g., seasonal factors on the effectiveness of the microbial filter.

How to cite: Blumenberg, M., Jordan, S., Krüger, M., and Schloemer, S.: Methane measurements at 90 abandoned, cut & buried onshore wells in Germany, EGU General Assembly 2026, Vienna, Austria, 3–8 May 2026, EGU26-2697, https://doi.org/10.5194/egusphere-egu26-2697, 2026.

EGU26-2794 | Posters on site | AS3.17

Top-Down Estimates of Methane Emissions in Romania Using Multiple TROPOMI CH₄ Products in ICON-ART CIF Inversions 

Christoph Riess, Michael Steiner, Joël Thanwerdas, Lukas Emmenegger, and Dominik Brunner

Methane (CH₄) is a potent greenhouse gas, and its emission mitigation plays a crucial role in efforts to combat climate change. The oil and gas (O&G) sector in Romania is a major CH₄ emitter, and the ROMEO campaign in 2019 found O&G emissions to be much higher than previously assumed.

We estimate Romania’s CH₄ emissions for 2019 using three TROPOMI CH₄ products - the operational SRON retrieval, the blended (TROPOMI+GOSAT) product from Harvard University, and the WFM-DOAS retrieval from University of Bremen - combined with the ICON-ART model and an Ensemble Square Root Filter in the Community Inversion Framework (CIF). Additionally, we perform an inversion using the operational TROPOMI retrieval for 2021.

Inversions for 2019 reveal noticeable spatial and temporal inconsistencies across the satellite products, indicating that a posteriori distributions at fine scales should be interpreted with caution. Despite these differences, the country-total emissions agree within the expected range, suggesting robustness at aggregated scales. Applying the system to the operational TROPOMI product for 2021 shows a reduction of 20% in corresponding posterior emissions compared to 2019, with stronger reductions of 30% over a region dominated by oil and gas infrastructure. This decrease is consistent with previous independent findings, namely results from a 2021 aircraft campaign over Romanian O&G infrastructure reporting a 20%-60% reduction in methane emissions.

Our study highlights the limitations of current TROPOMI CH₄ products for estimating regional emission patterns and emphasizes the need for further investigation into the significant discrepancies between them. Nevertheless, trends derived consistently from a single product appear robust and align with independent findings, making them valuable for assessing long-term emission changes in regions with sparse in-situ monitoring.

How to cite: Riess, C., Steiner, M., Thanwerdas, J., Emmenegger, L., and Brunner, D.: Top-Down Estimates of Methane Emissions in Romania Using Multiple TROPOMI CH₄ Products in ICON-ART CIF Inversions, EGU General Assembly 2026, Vienna, Austria, 3–8 May 2026, EGU26-2794, https://doi.org/10.5194/egusphere-egu26-2794, 2026.

EGU26-3435 | ECS | Posters on site | AS3.17

Development and application of regional inversion systems for China’s methane emission tracking and mitigation 

Yifan Li, Bo Zheng, Drew Pendergrass, Daniel Jacob, Yunxiao Tang, and Jiaxin Qiu

Methane (CH4) emission mitigation has become the critical and urgent strategy for controlling near-term climate change. Identifying key emitting regions, quantifying their contributions, and elucidating the underlying drivers have become pressing needs. However, regional CH4 emissions remain constrained by diffuse emission sources, limited monitoring capacity, and complex inversion frameworks. To address these challenges, we developed two independent regional inversion systems and applied them to deliver multi-year CH4 emissions estimates for China, the world’s largest anthropogenic CH4 emitter.

Given the difficulty in attributing observations to specific source regions and the scarcity of surface monitoring stations, we presented an innovative regional CH4 inversion system integrating satellite-based carbon monoxide (CO) observations with ground-based CH4-to-CO flux ratios. Our study estimates China’s CH4 fluxes between 2000 and 2021, revealing an average of 48.4 ± 13.8 Tg yr−1 and a significant increasing trend of 1.1 ± 0.2 Tg yr−2. Socioeconomic development drove a 92.1 Tg cumulative increase over this period, partially offset by a 78.1 Tg reduction due to declining emission intensity; however, this mitigating effect weakened after 2015. The approach is validated against independent estimates and supported by comprehensive sensitivity and uncertainty analyses. It demonstrates the feasibility of deriving reliable emission estimates for large-scale regions from single‑site measurements, offering an affordable and practical tool that integrates air-pollution data into regional greenhouse-gas quantification and mitigation.

To obtain higher temporal resolution and enable spatial and sectoral attribution of emissions, we further built a regional atmospheric inversion framework based on the Local Ensemble Transform Kalman Filter (LETKF) algorithm and constrained by TROPOMI satellite data. Built on the global GEOS-Chem CHEmistry and Emissions REanalysis Interface with Observations (CHEEREIO) tool, our study supports high-resolution regional inversion. Applied to East Asia at 0.5° × 0.625° resolution, this system produces weekly CH4 fluxes for China during 2019–2024. We show that China’s CH4 emissions increased from 61.1 (56.2–66.7) Tg in 2019 to 66.8 (61.5–73.0) Tg in 2024. The livestock sector contributed nearly half of the growth, while rising waste and oil-gas emissions and northward expansion of rice cultivation shifted China’s emissions growth to previously low-emitting Northwest and Northeast regions. This framework demonstrates the feasibility of near-real-time, regional-scale emissions monitoring, offering a transferable tool for other high-emitting countries for long-term emission monitoring. In summary, these two inversion systems advance the capability to track and attribute regional CH4 emissions, provide scalable, cost‑effective, and policy‑relevant tools for clarifying emission patterns, tracking mitigation progress, and supporting national and global climate action.

How to cite: Li, Y., Zheng, B., Pendergrass, D., Jacob, D., Tang, Y., and Qiu, J.: Development and application of regional inversion systems for China’s methane emission tracking and mitigation, EGU General Assembly 2026, Vienna, Austria, 3–8 May 2026, EGU26-3435, https://doi.org/10.5194/egusphere-egu26-3435, 2026.

EGU26-4102 | Posters on site | AS3.17

Development Plan for Best Practices for Remote Sensing of Methane Plumes from Space 

Annmarie Eldering, Paul Green, and Yasjka Meijer

There has been explosive growth in the field of remote sensing of methane plume from aircraft and satellite. The global reach and inherent spatial sampling capabilities of on-orbit instruments make them uniquely suited for consistent, repeatable surveys across regions and borders. These measurements have primarily been applied to the fossil energy and waste sectors (Cusworth et al., 2022; Thorpe et al., 2023), with current satellites typically detecting emissions exceeding ≈100 kg CH₄ per hour, while airborne platforms can observe sources as small as ≈10 kg CH₄ per hour.

Despite the rapid growth in observational capacity, challenges remain. Divergent emissions estimates, opaque methodologies, and inconsistent validation approaches can erode confidence in remote sensing-based emissions data. The emergence of non-public-sector missions using proprietary methods—often without full transparency across the data chain—further highlights the need for community-accepted practices to ensure traceability, comparability, and scientific credibility.

To address this need, the greenhouse gas (GHG) community—through the Committee on Earth Observation Satellites (CEOS) and National Metrology Institutes (NMIs)— developed a document in 2025 to articulate commonly accepted approaches for quantifying methane emissions based on observed plumes (Worden et al., 2025). It provides guidance spanning from Level 0/1 radiance, to Level 2 concentration, to Level 4 emissions, and includes current practices for validation and quality assessment. The focus is on emissions derived from discrete plumes, rather than from spatially diffuse sources.

 In this poster, we will discuss some key points of the current practices report as well as plans for next steps to perform intercomparisons and work towards a Best Practices document. This work has shifted from NIST to the Climate Data Collaborative of the Data Foundation in the US, and will be performed in collaboration with researchers and agencies across the US and Europe in 2026 including CEOS, CGMS, NPL, LLBL, UKSA, ESA, and the MEDUSA project.

References:

Cusworth, D. H., Thorpe, A. K., Ayasse, A. K., Stepp, D., Heckler, J., Asner, G. P., et al. (2022). Strong methane point sources contribute a disproportionate fraction of total emissions across multiple basins in the United States. Proceedings of the National Academy of Sciences, 119(38), e2202338119. https://doi.org/10.1073/pnas.2202338119

Thorpe, A. K., Frankenberg, C., Thompson, D. R., Duren, R. M., Aubrey, A. D., Bue, B. D., ... & Dennison, P. E. (2017). Airborne DOAS retrievals of methane, carbon dioxide, and water vapor concentrations at high spatial resolution: application to AVIRIS-NG. Atmospheric Measurement Techniques10(10), 3833-3850.

Worden, J.R., Green, P., Eldering, A., Sherwin, E., 2025, Common Practices for Quantifying Methane Emissions from Plumes Detected by Remote Sensing, https://zenodo.org/records/17047789

How to cite: Eldering, A., Green, P., and Meijer, Y.: Development Plan for Best Practices for Remote Sensing of Methane Plumes from Space, EGU General Assembly 2026, Vienna, Austria, 3–8 May 2026, EGU26-4102, https://doi.org/10.5194/egusphere-egu26-4102, 2026.

EGU26-4106 | ECS | Posters on site | AS3.17

Partitioning Canadian Oil and Gas Methane Emissions with TCCON and Aircraft Ethane Measurements 

Jon-Paul Mastrogiacomo, Christian DiMaria, Dylan Jones, and Debra Wunch

Ethane (C2H6) is co-emitted with methane (CH4) during fossil fuel extraction, processing, and transport, but has few natural sources. Measurements of C2H6 can therefore be used to partition fossil fuel CH4 emission sources. The Total Carbon Column Observing Network (TCCON) site at East Trout Lake, located in Boreal Canada, is equipped with both InGaAs and InSb detectors which enable simultaneous total column remote sensing measurements of CH4 and C2H6 among many other species. East Trout Lake also hosts routine low-altitude NOAA aircraft in situ profile measurements of CH4 and C2H6. We combine these data with in situ CH4 measurements from the Environment and Climate Change Canada tower network in a top-down hierarchical Bayesian inverse model to infer both fossil fuel CH4 fluxes and C2H6:CH4 emission ratios in two of Canada’s major oil producing provinces: Alberta and Saskatchewan.

How to cite: Mastrogiacomo, J.-P., DiMaria, C., Jones, D., and Wunch, D.: Partitioning Canadian Oil and Gas Methane Emissions with TCCON and Aircraft Ethane Measurements, EGU General Assembly 2026, Vienna, Austria, 3–8 May 2026, EGU26-4106, https://doi.org/10.5194/egusphere-egu26-4106, 2026.

EGU26-4259 | ECS | Posters on site | AS3.17

Global Anthropogenic Methane Emission Source Attribution with Multimodal AI 

Jiahao Li and Xiaomeng Huang

Methane (CH₄) ranks as the second most potent anthropogenic greenhouse gas (GHG), driving roughly one-third of contemporary global warming. Beyond its direct role in amplifying climate change, this trace gas acts as a key precursor to tropospheric ozone formation, with cascading indirect impacts on human health, agricultural productivity, and ecosystem integrity. Unlike long-lived GHGs such as CO₂, rapid and sustained curtailment of methane emissions offers the potential to decelerate global warming rates within decades, while delivering co-benefits that span public health protection, food security enhancement, and biodiversity conservation. Pinpointing the spatial distribution of methane emission sources is a cornerstone of effective global mitigation strategies and climate governance. Methane emissions exhibit extreme spatial heterogeneity: a small subset of super-emitters disproportionately contribute to global anthropogenic fluxes. The precise identification and geolocation of these hotspots are therefore pivotal to optimizing the cost-efficiency of mitigation interventions. For regulatory bodies and industrial operators alike, robust source characterization enables the rapid detection of anomalous releases, equipment malfunctions, or operational inefficiencies, facilitating timely remediation and the reduction of chronic unintentional emissions. Remote sensing technologies have revolutionized the detection, spatial mapping, and quantification of near-surface methane plumes, providing unprecedented coverage of global emissions. Yet while elevated methane concentrations can be reliably identified from orbital or airborne sensors, linking these atmospheric anomalies to specific ground-based anthropogenic sources remains a major bottleneck. This task typically relies on labor-intensive manual interpretation of large-scale, multi-temporal imagery datasets—a process that is not only slow and costly but also prone to inter-observer subjectivity. In the absence of accurate source localization, bottom-up emission inventories (compiled from activity data and emission factors) and top-down estimates (derived from atmospheric observations) often diverge by 50% or more, undermining the credibility of climate policies and mitigation targets. As such, the translation of remotely sensed methane hotspots into actionable source locations remains an essential yet elusive goal. Advancing source localization from the regional to the facility scale, and ultimately to individual equipment level, represents a transformative leap in methane monitoring—shifting the paradigm from qualitative detection to quantitative source attribution. To address these interconnected challenges, we introduce a novel Multimodal AI framework designed to integrate and interpret heterogeneous remote sensing datasets. Leveraging the power of multimodal AI for advanced image understanding, this framework enables the automated identification of anthropogenic methane emission sources on a global scale. Using this approach, we have constructed a high-resolution, top-down emission source dataset that catalogs the precise geographic coordinates of key methane-emitting sectors. These include open-pit coal mines and their downstream processing facilities, solid waste landfills, wastewater treatment plants, oil and LNG terminals, and oil and gas extraction areas. Beyond resolving critical discrepancies between top-down and bottom-up emission estimates, our innovative Multimodal AI approach serves as a foundational resource for policymakers, industry stakeholders, and the scientific community to devise targeted, evidence-based methane mitigation strategies.

How to cite: Li, J. and Huang, X.: Global Anthropogenic Methane Emission Source Attribution with Multimodal AI, EGU General Assembly 2026, Vienna, Austria, 3–8 May 2026, EGU26-4259, https://doi.org/10.5194/egusphere-egu26-4259, 2026.

EGU26-4277 | ECS | Posters on site | AS3.17

Quantifying methane emissions from orphan oil and gas wells in Canada 

Zachary Mailhot, Gloria Ding, Paola Prado, and Mary Kang

Non-producing oil and gas wells are a source of fugitive methane emissions. In Canada, methane regulations for the oil and gas sector are pushing the industry to achieve a 72% reduction in methane emissions by 2030 compared to 2012 levels. To reach this goal, effective monitoring and remediation of non-producing wells is important, as there are >400,000 non-producing wells in the country and they account for 13% of methane emissions from the oil and gas sector. Orphan wells are a subset of non-producing wells that have no responsible party, as such the cost of clean-up falls on the public. Thus far, there have been no quantification studies on methane emissions from orphan wells in Canada, leading to knowledge gaps for policy development and contributes to uncertainties in methane emissions from the broader category of non-producing wells.

To fill this gap, we performed an orphan well specific methane measurement campaign in Western Canada during the summer of 2025. We followed a static chamber methodology paired with laser-based methane sensors with detection capabilities in the ppb scale, an approach that was previously deployed at 561 non-orphan wells across Canada. This method allowed for direct component-specific methane flow rate measurements with detection as low as 10-3 mg/hr. We measured methane emissions from 143 individual orphan wells across 16 different counties in two Western Canadian provinces where 75% of non-producing and 65% of orphaned wells in Canada are located (Alberta and British Columbia).

Previous literature showed that a small subset of wells dominates emissions, highlighting the need for a faster, larger-scale detection method. While the static chamber approach provides direct component-specific measurements, it is time- and labor-intensive and limited to wells where site-access is possible. To address this, we deployed a helicopter-mounted light detection and ranging (LiDAR) system enabling rapid identification of high-emitting orphan wells. With this method, we surveyed 180 orphan wells, including those in extremely remote locations that are inaccessible by ground vehicle, or limited to winter-only access.

By integrating both ground- and helicopter-measurements, we aim to improve quantification of methane emissions from orphan wells in Canada and deliver a roadmap for prioritizing remediation efforts to effectively reduce national methane emissions.

How to cite: Mailhot, Z., Ding, G., Prado, P., and Kang, M.: Quantifying methane emissions from orphan oil and gas wells in Canada, EGU General Assembly 2026, Vienna, Austria, 3–8 May 2026, EGU26-4277, https://doi.org/10.5194/egusphere-egu26-4277, 2026.

EGU26-5713 | Posters on site | AS3.17

Emissions and trends from the Marcellus and Denver/Juelsberg oil and gas fields 

Russell Dickerson, Dale Allen, Timothy Canty, Hao he, Allison Ring, Joel Dreessen, Xinrong Ren, Alan Fried, Hannah Daley, and Ben Hmiel

The Marcellus and Denver/Juelsberg fields, among the most productive sources of oil and gas in the US, have been frequent targets for measurement campaigns.  Here we describe use of mobile platforms (surface and aircraft), remote sensing (lidar), and numerical simulation to quantify the emissions from these fields.  Fossil sources are often co-located with other sources such as concentrated animal feeding operations (CAFOs), wetlands, abandoned coal mines, and landfills.  To isolate the emissions from oil and gas, we employ tracers including ethane (C2H6), methane 13C isotopes, and acetic acid, H3CCOOH.  The use of surface-based mobile lidar greatly enhances measurement uncertainty for corrections due to convergence over the domain.  Improvements in engineering have greatly reduced emissions intensity over the past 10 years. 

How to cite: Dickerson, R., Allen, D., Canty, T., he, H., Ring, A., Dreessen, J., Ren, X., Fried, A., Daley, H., and Hmiel, B.: Emissions and trends from the Marcellus and Denver/Juelsberg oil and gas fields, EGU General Assembly 2026, Vienna, Austria, 3–8 May 2026, EGU26-5713, https://doi.org/10.5194/egusphere-egu26-5713, 2026.

EGU26-5831 | Orals | AS3.17

Methane super-emitter intensities across global oil&gas basins 

Daniel Cusworth, Bradley Conrad, Alana Ayasse, Daniel Bon, Tia Scarpelli, James East, and Riley Duren

Super-emitting (>100 kg/h) methane sources contribute significantly to total emissions across several oil&gas basins, but the robust quantification and characterization of these sources remains uncertain in the absence of routine, transparent, and robust measurements. Quantification is further complicated by the intermittent nature of many oil&gas emission sources. Solving this quantification gap is particularly important given international regulations and initiatives that require low methane intensities, the ratio of methane emitted to energy produced, across the oil&gas supply chain by country and operator. The Tanager-1 satellite (launched August 2024) has shown capability of detection and quantification of the vast majority of methane super-emitters given adequate observing conditions and spatiotemporal coverage. Here, we show Carbon Mapper’s progress in mapping global super-emitter intensities through intensive tasking of the Tanager-1 satellite of the majority of oil&gas infrastructure across key oil&gas producing basins. We present a hierarchical Bayesian model to address issues of intermittency and detection limit when calculating super-emitter intensities across distinct geographic regions. With 30-m spatial resolution of Tanager-1, we attribute each detection to facility and equipment type, allowing for better understanding of drivers of intensities and how those drivers vary across basins. Building a more complete global picture of super-emitters with attribution to infrastructure will aid in constructing mitigation roadmaps for lower-intensity energy.

How to cite: Cusworth, D., Conrad, B., Ayasse, A., Bon, D., Scarpelli, T., East, J., and Duren, R.: Methane super-emitter intensities across global oil&gas basins, EGU General Assembly 2026, Vienna, Austria, 3–8 May 2026, EGU26-5831, https://doi.org/10.5194/egusphere-egu26-5831, 2026.

EGU26-5917 | ECS | Posters on site | AS3.17

Source category attribution of urban methane emissions using Positive MatrixFactorization (PMF) with long-term trace gas measurements 

Zhenyu Xing, Chris Hugenholtz, Thomas Barchyn, Tyler Gough, and Coleman vollrath

Cities emit methane (CH4) and have a role to play in mitigating the climate impacts of their emissions. Research suggests that CH4 emissions from most cities have large contributions from natural gas distribution and end use. In this work, we examine long-term measurements of CH4, CO, NOx, and VOCs from an urban air monitoring station in CalgaryCanada to resolve key contributors to CH4 enhancements. Using Positive Matrix Factorization (PMF), we identified four primary CH4 emissions source categories: natural gas – fugitivesnatural gas – incomplete combustionwaste/biogenic, and petroleum product processing. Results from PMF modeling indicate that the bulk of CH4 emissions in Calgary are from natural gas fugitives and incomplete combustion (81% ± 35%)This is much higher than the proportion derived from available emissions inventories. The CH4 emissions from natural gas sources increase in winter and may be related to increased natural gas use for heating; results further supported by a land-use analysis. Emissions from waste/biogenic sources were the next largest contributor, which doubled in warmer months, consistent with temperature-driven microbial activity. Overall, these findings underscore the need for targeted mitigation strategies focused on the natural gas supply chain, while also highlighting the influence of seasonal dynamics on urban CH4 emissions. 

How to cite: Xing, Z., Hugenholtz, C., Barchyn, T., Gough, T., and vollrath, C.: Source category attribution of urban methane emissions using Positive MatrixFactorization (PMF) with long-term trace gas measurements, EGU General Assembly 2026, Vienna, Austria, 3–8 May 2026, EGU26-5917, https://doi.org/10.5194/egusphere-egu26-5917, 2026.

EGU26-6047 | Posters on site | AS3.17

Increasing Coal-Related Methane Emissions in Southeast Asia During 2010–2021: A Multi-Model Inverse Analysis 

Fenjuan Wang, Shamil Maksyutov, Rajesh Janardanan, Dmitry A. Belikov, Prabir K. Patra, Ruosi Liang, Yuzhong Zhang, Ge Ren, Hong Lin, Nicole Montenegro, Antoine Berchet, Marielle Saunois, Adrien Martinez, Sara Hyvärinen, Aki Tsuruta, Samuel Takele Kenea, Tazu Saeki, and Tsuneo Matsunaga

This study presents top-down estimates of coal-related methane emissions in Southeast Asia derived from a multi-model ensemble within the Methane Inversion Inter-Comparison for Asia (MICA) project. Using seven atmospheric inversion systems, we applied a standardized protocol featuring consistent prior emission inventories and a comprehensive suite of atmospheric constraints. These observations integrate GOSAT satellite retrievals, the NOAA ObsPack CH₄ dataset, and additional in situ measurements from Asian monitoring sites. Monthly sectoral emission fluxes from both in-situ-based and GOSAT-based inversion simulations were aggregated to characterize regional and national-level contributions and trends.

Total regional coal-related methane emissions are estimated at 7.90 Tg yr⁻¹ (range: 5.129.21 Tg yr⁻¹; median, min-max) for 2019-2021, with Indonesia identified as the dominant source, contributing 7.10 Tg yr⁻¹ (4.508.29 Tg yr⁻¹). Indonesia accounts for approximately 90 % of coal production in the region and remains a major global exporter, followed by Vietnam as the second-largest producer and consumer. In Indonesia, coal-related emissions exhibit a statistically significant increasing trend based on the Mann–Kendall trend test (p < 0.05), with mean posterior emissions rising nearly fourfold from 2.02 to 8.47 Tg yr⁻¹ between 2010 and 2021. Notably, Indonesia’s most recent National Greenhouse Gas Inventory (NGHGI) reports energy-sector (including coal) methane emissions of 0.784 Tg yr⁻¹ for 2019 , nearly an order of magnitude lower than our estimates. Emissions from Vietnam are estimated at 0.66 Tg yr⁻¹ (0.470.74 Tg yr⁻¹) for 2019-2021; while no significant trend was detected over the full study period, a statistically significant increase was observed during 2017–2021.

The rapid growth of coal-related methane emissions poses a critical challenge to Southeast Asia’s climate targets and decarbonization pathways. Our fingdings reveal a substantial discrepancy between top-down estimates and national inventories, identifying a vital opportunity for high-impact mitigation. Prioritizing the recovery of coal mine methane (CMM) is therefore essential; it transforms a significant environmental liability into a valuable energy resource while simultaneously enhancing operational safety. Given the nearly fourfold increase in emissions detected since 2010, aggressive mitigation of the coal sector is imperative if regional climate commitments are to be achieved.

How to cite: Wang, F., Maksyutov, S., Janardanan, R., Belikov, D. A., Patra, P. K., Liang, R., Zhang, Y., Ren, G., Lin, H., Montenegro, N., Berchet, A., Saunois, M., Martinez, A., Hyvärinen, S., Tsuruta, A., Kenea, S. T., Saeki, T., and Matsunaga, T.: Increasing Coal-Related Methane Emissions in Southeast Asia During 2010–2021: A Multi-Model Inverse Analysis, EGU General Assembly 2026, Vienna, Austria, 3–8 May 2026, EGU26-6047, https://doi.org/10.5194/egusphere-egu26-6047, 2026.

EGU26-6803 | Posters on site | AS3.17

Monitoring Compliance of EU Methane Regulation using High-Resolution Satellite Observations: a case study in Poland 

Adomas Liepa, Sabina Assan, Rebekah Horner, and Jaroslaw Necki

Methane (CH4) is an important but often overlooked greenhouse gas contributing to climate change as a short term climate forcer. Coal remains the largest source of CH4 emissions in the EU energy sector. Accurate attribution of methane emissions to responsible coal mining infrastructure is critical under the EU Methane Regulation (EU-MER), which entered into force in 2025. The EU-MER prohibits routine operational venting of CH4 from coal mine drainage systems, requiring capture or flaring with a minimum destruction efficiency of 99%. Despite the existence of methane regulation, robust methodologies for accurately attributing spaceborne detected methane emissions to coal mine facilities remain insufficient. 

This study presents a satellite-based approach for attributing methane emissions to coal mine facilities in Poland, with a focus on drainage stations. We utilised high resolution methane plume observations from high resolution point source imagers acquired between January and November 2025 together with coal mine infrastructure data. 

The attribution methodology incorporates spatial proximity analysis based on geolocation accuracy with atmospheric transport data (wind speed and direction) at the time of acquisition to determine the most plausible facility responsible for the methane emissions. A qualitative confidence level was assigned to each attribution considering local knowledge on emission patterns, plume morphology and proximity to other mining infrastructure. The results show that 12 methane emission events were captured and attributed to drainage systems in Poland, of which 8 were classified as being attributed with high-confidence. 5 out of 22 investigated drainage systems seemed to vent methane with an average emission flux of approximately 1200 kg/h.

This research demonstrates that reliable compliance monitoring under emerging methane regulations is technically feasible by combining high resolution satellite observations with coal mine facility data. Moreover, the integration of meteorological information and local, expert knowledge substantially improves attribution confidence, demonstrating the value of hybrid quantitative approaches for effective policy enforcement and methane regulation compliance monitoring.

How to cite: Liepa, A., Assan, S., Horner, R., and Necki, J.: Monitoring Compliance of EU Methane Regulation using High-Resolution Satellite Observations: a case study in Poland, EGU General Assembly 2026, Vienna, Austria, 3–8 May 2026, EGU26-6803, https://doi.org/10.5194/egusphere-egu26-6803, 2026.

EGU26-7912 | Posters on site | AS3.17

A novel approach to infer regional emissions from airborne methane measurements 

Ronald Hutjes, Wietse Franssen, Bart Kruijt, and Hong Zhao

Airborne trace gas concentration measurements can be used to infer regional emissions. Foregoing full 3D transport inversion methods, emissions are generally estimated using bulk methods. Measuring concentrations across the upwind and downwind wall of the area of interest, at different altitudes in the boundary layer, allows to specify trace gas inflow and outflow and from the difference to estimate the surface flux.

Here we propose a novel alternative method. We fly parallel tracks over the region of interest at low altitude (200ft), aligned with the wind. The resulting trace gas signal typically can be viewed as a series of concentration peaks superimposed on a linear gradient. We interpret this as that the positive (or negative) gradient is the result of diffuse sources (or sinks) in the landscape. The concentration peaks we interpret as the resulting from point sources, i.e. gaussian plumes intersected by the flight track.

We demonstrate promising results using methane concentrations obtained over a rural landscape in the Netherlands dominated by dairy farms on (drained) organic soils. In this setting we interpret diffuse sources of methane to originate  from the very wet parts of the landscape, i.e. ditches and (near) inundated parcels. The concentration peaks we trace back to cattle herds of (small clusters of) individual farms. We will show more details of methodology and results. Finally, we  discuss uncertainties and compare obtained emissions  with bottom-up estimates in National Inventory Reports and other statistics, as well as recent inversion studies. With the latter we concur that the Netherlands maybe under-reporting its rural methane emissions.

How to cite: Hutjes, R., Franssen, W., Kruijt, B., and Zhao, H.: A novel approach to infer regional emissions from airborne methane measurements, EGU General Assembly 2026, Vienna, Austria, 3–8 May 2026, EGU26-7912, https://doi.org/10.5194/egusphere-egu26-7912, 2026.

EGU26-8094 | ECS | Orals | AS3.17

Urban Natural Gas Seasonality is Associated with Commercial Areas in Berkeley, California 

Haley M. Byrne, Erin F. Katz, Samuel J. Cliff, Robert J. Weber, Daphne J. Szutu, Joseph G. Verfaille, Dennis Baldocchi, Allen H. Goldstein, and Joshua Apte

Recent measurement studies have found that urban natural gas (NG) emissions are 3.9× larger than bottom-up inventory estimates, on average, across various North American cities.1 Several studies have proposed that post-meter emissions may be a substantial missing source in urban methane (CH4) estimates, but the role of diffuse residential and commercial NG consumption in overall emissions remains uncertain. Long-term, continuous eddy covariance flux measurements can help clarify possible post-meter contributions by providing localized, high-resolution observations of cumulative emissions. Here we present nearly 3 years of CH4 flux measurements collected between July, 2022 and April, 2025 from a 42 m tall stationary tower located in downtown Berkeley, California, USA. Methane source types were characterized using contemporaneous ethane and δ13CH4 measurements, and spatially resolved population, building, and land use datasets were used to determine possible post-meter emissions drivers. Average annual CH4 fluxes in Berkeley were 152 nmol m-2 s-1 [95%: 150,155] and were primarily attributed to natural gas. Fluxes were dominated by a persistent spatial gradient wherein higher fluxes were associated with increased commercial building space and lower population density in the downtown core, with estimated average annual fluxes ranging from 85 nmol m-2 s-1 [95%: 82.8, 88.3] in residential areas to 218 nmol m-2 s-1 [95%: 214, 223] downtown. Flux diurnal trends were distinct between different seasons and dominant land uses, but no significant weekday-weekend differences were observed. Residential areas had lower diurnal variation and higher springtime fluxes—exhibiting no positive correlation with NG consumption. In denser commercial areas, CH4 fluxes were significantly lower during warmer months, and monthly emissions were positively correlated with NG consumption at rates of 0.21% and 0.23%. Overall fluxes were 5× larger than the highest inventory estimates and were elevated relative to urban eddy covariance studies in similarly sized European and Asian cities. Our results emphasize how eddy covariance studies can help identify and track the drivers of larger urban CH4 emissions trends and the importance of evaluating these trends across different spatial scales.

[1] Vollrath, et al. (2025) Environ. Res. Lett. 

How to cite: Byrne, H. M., Katz, E. F., Cliff, S. J., Weber, R. J., Szutu, D. J., Verfaille, J. G., Baldocchi, D., Goldstein, A. H., and Apte, J.: Urban Natural Gas Seasonality is Associated with Commercial Areas in Berkeley, California, EGU General Assembly 2026, Vienna, Austria, 3–8 May 2026, EGU26-8094, https://doi.org/10.5194/egusphere-egu26-8094, 2026.

EGU26-8120 | ECS | Posters on site | AS3.17

Top-down quantification of methane emissions from the oil, gas and waste sectors on the Arabian Peninsula using helicopter-borne observations 

Eric Förster, Heidi Huntrieser, Niclas Maier, Halima Al Hinaai, Falk Pätzold, Lutz Bretschneider, Astrid Lampert, Jarosław Nęcki, Jakub Bartyzel, Paweł Jagoda, Mark Lunt, Robert Field, Oman Environmental Services Holding Company (be’ah), and Anke Roiger

Methane (CH4) emissions from the oil and gas (O&G) sector remain highly uncertain on the Arabian Peninsula, despite the region’s major contribution to global hydrocarbon production and increasing mitigation commitments. As the second most important greenhouse gas after carbon dioxide (CO2), CH4 is a key target of global climate initiatives due to its higher short-term global warming potential, enabling faster climate benefits from mitigation. In this context, UNEP’s International Methane Emissions Observatory (IMEO) aims to improve the accuracy of emission data from the oil and gas, waste, and coal sectors through targeted measurement studies to support mitigation activities.

In autumn 2023, airborne observations of CH4 emissions from the O&G and waste sectors were performed for the first time on the Arabian Peninsula, namely in Oman, using the helicopter-towed probe HELiPOD. Equipped with instrumentation measuring the three-dimensional wind vector and in situ CH4 (Picarro G2401-m and LI-7700), repeated upwind and downwind measurements were conducted at varying horizontal distances (~1–5 km) and altitudes (~35–3000 m) to capture inflow conditions and the horizontal and vertical dispersion of CH4 plumes. Co-located mobile ground-based CH4 measurements complemented the airborne probing, with both datasets combined within a mass-balance approach to quantify emissions.

Depending on the surveyed O&G emission source (point or clustered), calculated CH4 emission rates span a wide range from <100 to several thousand kg h⁻¹, which is within the expected range for such installations. These differences reflect variations in production levels as well as stricter safety requirements and newer infrastructure at sour facilities, which generally exhibit lower emissions than sweet installations characterized by partly more aged infrastructure. Importantly, mobile ground-based measurements effectively revealed mitigation-relevant CH4 sources such as leaks and maintenance-related emissions. However, in densely developed production areas with multiple operators, attributing individual leaks to specific companies and isolating sources within complex facility clusters remains challenging. To address this, a dedicated case study demonstrates the combined use of ground-based, airborne, and satellite measurements to disentangle emissions from a complex O&G facility cluster. This integrated approach was also applied to quantify CH4 emissions from Omani landfills: a small landfill, probed by airborne observations, shows emissions up to ~100 kg h⁻¹, whereas the largest landfill, observed by satellite, can emit several tons of CH4 per hour.

Our unique helicopter-borne measurements provide an independent verification tool bridging facility-scale observations, inventories, and satellite products, supporting operators and policymakers in translating CH4 mitigation commitments into measurable and verifiable action. This research was funded within the framework of UNEP’s International Methane Emissions Observatory and forms part of the METHANE-To-Go (MTG) project series. Prior to the MTG-Oman project presented here, CH4 emissions were investigated in Europe (e.g. MTG-Poland) and Central Africa (MTG-Africa).

How to cite: Förster, E., Huntrieser, H., Maier, N., Al Hinaai, H., Pätzold, F., Bretschneider, L., Lampert, A., Nęcki, J., Bartyzel, J., Jagoda, P., Lunt, M., Field, R., (be’ah), O. E. S. H. C., and Roiger, A.: Top-down quantification of methane emissions from the oil, gas and waste sectors on the Arabian Peninsula using helicopter-borne observations, EGU General Assembly 2026, Vienna, Austria, 3–8 May 2026, EGU26-8120, https://doi.org/10.5194/egusphere-egu26-8120, 2026.

EGU26-8190 | Posters on site | AS3.17

Large scale opportunistic vehicle-based monitoring of oil and gas emissions across Alberta, Canada 

Thomas Barchyn, Chris Hugenholtz, Michelle Clements, Tyler Gough, Abbey Munn, Joseph Samuel, Clay Wearmouth, and Zhenyu Xing

Oil and gas production in Alberta, Canada is dispersed across tens of thousands of sites. Here we present opportunistic results from a major ongoing (2021 - present) methane emissions monitoring program. We used high quality atmospheric data collected with sensor packages mounted on operator trucks that regularly drive on public roads. Data were processed on an ongoing basis into site-resolved emissions rate quantifications (n = 3350), validated non-detects (n = 17076), and localizations. In Alberta, most site-level emissions measured would be unresolvable by satellites but are nevertheless targets for mitigation. We show that vehicle-based surveys from public roads can target these sites at a low cost and provide data that is necessary to monitor emissions. We further demonstrate how site-resolved data can be linked to operator, production data, and produce emissions intensity estimates on a site-by-site basis.


First, we detail results from 190 single-blind emissions quantification tests, detailing model bias and uncertainty modeling through various environmental conditions. We show empirical wind speed and measurement distance dependencies in detection limits and how these can be modeled.


Second, we examine survey data. Measurements covered a wide diversity of production styles in all seasons. Site-resolved emissions rates varied considerably among production styles and operator. Most operators’ emissions met regulatory limits. However, some emissions would exceed anticipated future regulatory standards. Repeat measurements allow for efforts to reduce emissions to be quantified. Most notably, in 2022 a large population of sites showed rate reductions of >20 g/s that may be attributable to emissions mitigation efforts by industry.


Emissions intensity was also calculated at the site-scale, providing a clear ranking of emissions associated with energy production that was resolvable by production style and operator. Granular intensity data highlight how certain sites strongly likely affect larger scale intensity goals.


Non-detect data showed that many sites are low-emitting and demonstrate that operational public-road drive-by data can quickly and inexpensively demonstrate normal, low-emissions operations, with detection limits below most satellites. Non-detect data are helpful for prioritizing mitigation efforts.


Overall, we demonstrate that opportunistic vehicle-based monitoring complements other scales of measurement by providing granular site- and operator-resolved emissions data with an affordable, reliable, and scalable modality.

How to cite: Barchyn, T., Hugenholtz, C., Clements, M., Gough, T., Munn, A., Samuel, J., Wearmouth, C., and Xing, Z.: Large scale opportunistic vehicle-based monitoring of oil and gas emissions across Alberta, Canada, EGU General Assembly 2026, Vienna, Austria, 3–8 May 2026, EGU26-8190, https://doi.org/10.5194/egusphere-egu26-8190, 2026.

EGU26-8515 | ECS | Posters on site | AS3.17

High-resolution methane emissions inferred from TROPOMI and GOSAT satellite inversions over western and central Europe  

Yujin J. Oak, Daniel J. Jacob, Lucas A. Estrada, James D. East, Megan He, Xiaolin Wang, and Xuefei Li

Top-down inversion of satellite observations is a powerful tool used to identify sources of atmospheric methane and to evaluate bottom-up emission estimates, providing essential information for achieving short-term climate mitigation goals. Recent satellite inversions indicate an increasing trend in methane emissions and an underestimate in the bottom-up estimates reported to the United Nations Framework Convention on Climate Change (UNFCCC) over Europe, but these results have been limited by coarse resolution and temporal coverage. Here we use satellite observations from TROPOMI and GOSAT to estimate methane emissions at 25 km resolution over western and central Europe during 2019 and 2024, respectively, using the Copernicus Atmospheric Monitoring Service (CAMS) and Global Fuel Exploitation Inventory (GFEI) anthropogenic emissions as prior estimates. Our high-resolution top-down posterior estimates suggest an upward correction in CAMS livestock (17−29%) and waste (5−29%) emissions, and a downward correction in GFEI coal (63−65%) emissions. The total posterior estimates for 2019 and 2024 are 17.7 Tg and 19.7 Tg, respectively, indicating a 2024 versus 2019 increase, attributed to livestock and waste, especially in Italy and Spain, which is not shown in the CAMS bottom-up emissions.

How to cite: Oak, Y. J., Jacob, D. J., Estrada, L. A., East, J. D., He, M., Wang, X., and Li, X.: High-resolution methane emissions inferred from TROPOMI and GOSAT satellite inversions over western and central Europe , EGU General Assembly 2026, Vienna, Austria, 3–8 May 2026, EGU26-8515, https://doi.org/10.5194/egusphere-egu26-8515, 2026.

EGU26-8682 | Posters on site | AS3.17

The Calgary Urban Methane Emissions Measurement Testbed (CURMET) Project 

Chris Hugenholtz, Thomas Barchyn, Michelle Clements, Tyler Gough, Zhenyu Xing, Joseph Samuel, Simon Butt-Vallieres, Coleman Vollrath, Clay Wearmouth, Abbey Munn, and Enisha Bhangoo

Urban methane emissions represent a large yet poorly constrained component of national greenhouse gas budgets. Their characterization is challenging because emissions arise from a complex mix of known sources and a large population of small, spatially distributed, and often intermittent emitters embedded within dense and heterogeneous urban infrastructure. These diffuse emissions complicate measurement, source attribution, and scaling from individual components to the city scale. To address this challenge, we initiated the Calgary Urban Methane Emissions Measurement (CURMET) Testbed (www.curmet.ca), a major Canadian research initiative aimed at quantifying urban methane emissions across spatial scales and identifying the dominant contributors in a large Canadian city. 

The CURMET Project integrates satellite, drone, vehicle-based, human-portable, and component-level measurements with new analytical and modeling approaches to constrain methane emissions across spatial and temporal scales. Satellite-based analyses using TROPOMI provide independent, top-down estimates of Calgary’s total methane emission rate, placing bounds on city-scale fluxes. Extensive vehicle-based surveys resolve methane enhancements from neighborhood to individual infrastructure scales, enabling source localization, attribution, and the identification of actionable emission hotspots. These surveys directly supported mitigation through the detection and subsequent abatement of several large fugitive sources during the project. Targeted measurements of sewers, natural gas meters, natural gas distribution facilities, landfills, and wastewater treatment plants further provide source-level emission estimates that inform prioritization and evaluation of mitigation efforts. 

Key advances from CURMET demonstrate the effectiveness of vehicle-based monitoring for detecting and prioritizing urban methane sources, and the value of geochemical source disambiguation for separating dominant source categories. Early results from Calgary indicate that emissions from natural gas dominate the city’s methane budget, contrasting with research in other Canadian cities where landfills are estimated to be the dominant sources of methane emissions. Methodological developments include a human-portable flux plane technique for quantifying facility-scale emissions, and the deployment of robotic and e-bike–mounted systems to measure emissions in areas inaccessible to conventional vehicles or requiring enhanced maneuverability. 

CURMET results create an empirical basis for urban methane mitigation by distinguishing persistent, episodic, and negligible sources across the city. By linking city-scale fluxes with source-resolved measurements, the project supports targeted mitigation actions, improved emissions inventories, and verification of mitigation effectiveness. These outcomes illustrate how integrated urban measurement programs can directly inform cost-effective methane reduction strategies and support municipal, provincial, and national climate policy. 

How to cite: Hugenholtz, C., Barchyn, T., Clements, M., Gough, T., Xing, Z., Samuel, J., Butt-Vallieres, S., Vollrath, C., Wearmouth, C., Munn, A., and Bhangoo, E.: The Calgary Urban Methane Emissions Measurement Testbed (CURMET) Project, EGU General Assembly 2026, Vienna, Austria, 3–8 May 2026, EGU26-8682, https://doi.org/10.5194/egusphere-egu26-8682, 2026.

EGU26-9756 | ECS | Posters on site | AS3.17

Quantifying Farm-Scale Methane Emissions using Downwind Gaussian Plume Modelling with Tracer Correlation 

Mackenzie LeVernois, James France, Victoria Rafflin, Dave Lowry, Nigel Yarrow, Jacob Shaw, Fabrizio Innocenti, Jon Helmore, Mathias Lanoisellé, Aliah Al-Shalan, and Rebecca Fisher

Agricultural methane emissions, from enteric fermentation and manure management, account for approximately 32% of global anthropogenic methane emissions, yet standardized farm- or herd-scale quantification methods remain lacking (Nisbet et al., 2025). Downwind mobile surveys using Gaussian plume modelling for point sources, primarily from oil and gas, and tracer dispersion methods for diffused sources, such as landfills, have been demonstrated to be effective, relatively low-uncertainty approaches for quantifying methane emissions.

Here, we present a computationally efficient framework for quantifying farm-scale methane emissions using Gaussian plume modelling, developed for small- to medium- scale farms in the UK, with ongoing work to extend the approach to grazing cattle. Using a Lagrangian particle model (Oettl & Kuntner, 2024), a virtual upwind point source is assigned to encompass the farm emission footprint (De Visscher, 2014). Gaussian dispersion modelling with Monte Carlo iterations is then applied to downwind vehicle-based methane measurements to derive farm-scale emission estimates.

These estimates are evaluated against results from a simultaneous controlled tracer release conducted by the National Physical Laboratory at the same farm site. We discuss associated uncertainties and highlight future improvements, including process automation, source apportionment, and methods for quantifying emissions from grazing herds.


References:

De Visscher, A. (2014). Air Dispersion Modeling: Foundations and Applications. Wiley. https://doi.org/10.1002/9781118723098

Dietmar Oettl & Markus Kuntner. (2024). GRAL: Graz Lagrangian Model (Version 24.11) [Computer software]. Graz University of Technology. https://gral.tugraz.at/

Nisbet, E. G., Manning, M. R., Lowry, D., Fisher, R. E., Lan, X. (Lindsay), Michel, S. E., France, J. L., Nisbet, R. E. R., Bakkaloglu, S., Leitner, S. M., Brooke, C., Röckmann, T., Allen, G., Denier van der Gon, H. A. C., Merbold, L., Scheutz, C., Woolley Maisch, C., Nisbet-Jones, P. B. R., Alshalan, A., … Dlugokencky, E. J. (2025). Practical paths towards quantifying and mitigating agricultural methane emissions. Proceedings of the Royal Society A: Mathematical, Physical and Engineering Sciences, 481(2309), 20240390. https://doi.org/10.1098/rspa.2024.0390

How to cite: LeVernois, M., France, J., Rafflin, V., Lowry, D., Yarrow, N., Shaw, J., Innocenti, F., Helmore, J., Lanoisellé, M., Al-Shalan, A., and Fisher, R.: Quantifying Farm-Scale Methane Emissions using Downwind Gaussian Plume Modelling with Tracer Correlation, EGU General Assembly 2026, Vienna, Austria, 3–8 May 2026, EGU26-9756, https://doi.org/10.5194/egusphere-egu26-9756, 2026.

EGU26-10540 | Posters on site | AS3.17

Evaluation of coal mine methane inventory methods using aircraft-based platforms in the Bowen Basin, Australia 

Sven Krautwurst, Stephen J. Harris, Jorg Hacker, Mark Lunt, and Jakob Borchardt and the BBCMap23 Team

Coal mining is a significant human-induced source of atmospheric methane (CH4) on a global scale, contributing notably to national emissions in coal-producing countries such as Australia. Australian mining operators use tiered, bottom-up methods aligned with IPCC guidelines and implemented under the National Greenhouse and Energy Reporting (NGER) scheme to estimate emissions from underground and surface mines. However, underground mine emissions have not been systematically validated by comparison with top-down atmospheric measurements, and surface mine emission factors lack empirical support. Studies have revealed significant discrepancies between top-down and bottom-up estimates at investigated surface mines, prompting concerns about the effectiveness of the current regulatory methods.

In 2023, two independent airborne measurement strategies were used simultaneously by deploying two aircraft to quantify CH4 emission rates from coal mining in the Bowen Basin (Queensland, Australia) as part of the United Nations Environment Programme’s (UNEP) International Methane Emissions Observatory (IMEO) study. A total of 53 emission rate quantifications for 16 coal mines were achieved from the measurements collected within a 31-day campaign. Comparing these estimates with operator-based estimates from underground mines revealed no significant bias at the facility- and aggregated-level, with operator estimates being well within the uncertainties of the airborne estimates. However, a comparison with surface mines showed significant biases at both the facility- and aggregated-level, exceeding the uncertainties of the airborne estimates.

Globally, these results add to growing evidence that Tier 3 approaches based on direct measurements are suitable for estimating fugitive CH₄ emission rates from underground mines. By contrast, the results from surface mines suggests that IPCC Tier 2 and 3 inventory methods (i.e. use of emission factors and potentially coal gas distribution models) for surface mining require careful implementation and independent verification.

This poster will present and discuss the results of the measurements taken in the Bowen Basin.

How to cite: Krautwurst, S., Harris, S. J., Hacker, J., Lunt, M., and Borchardt, J. and the BBCMap23 Team: Evaluation of coal mine methane inventory methods using aircraft-based platforms in the Bowen Basin, Australia, EGU General Assembly 2026, Vienna, Austria, 3–8 May 2026, EGU26-10540, https://doi.org/10.5194/egusphere-egu26-10540, 2026.

Ground-based sensors are essential for monitoring methane emissions. Among the available technologies, remote sensing systems based on Fourier-transform infrared (FTIR) spectroscopy offer a versatile approach to detect and quantify methane emissions from a distance - without the need for direct sampling at the emission source.

Imaging systems equipped with scanning units or focal plane array (FPA) detectors can even generate real-time chemical images of methane plumes overlaid on video footage of the scene. Such systems provide an intuitive visualization of the source of the methane gas clouds.

When equipped with quantification capabilities, these remote sensing systems deliver column-averaged methane concentrations across the observed plume, whether near the ground or throughout the atmospheric column. Since satellite instruments also measure column-averaged concentrations, ground-based FTIR systems are particularly well-suited for satellite data validation.

This presentation will introduce the working principles of various ground-based FTIR remote sensing systems and highlight application examples, including methane measurements at coal mining sites.

How to cite: Wu, X.: Ground-based FTIR remote sensing systems for identification, visualization, and quantification of methane, EGU General Assembly 2026, Vienna, Austria, 3–8 May 2026, EGU26-10647, https://doi.org/10.5194/egusphere-egu26-10647, 2026.

EGU26-10767 | ECS | Posters on site | AS3.17

 Thermal imaging and fugitive CH4 emissions at Tenerife’s municipal solid waste landfill  

Paula Fuentes-Domínguez, María Asensio-Ramos, Ariadna E. Vidaña-Glauser, Paola García-Luis, Jasmina García-Báez, Sergio González-Torres, Víctor Ortega-Ramos, Héctor de los Ríos-Díaz, Nemesio M. Pérez, Óscar Padrón, Gladys V. Melián, and Pedro A. Hernández

Fugitive methane (CH4) emissions from municipal solid waste landfills represent a significant and often underestimated source of greenhouse gases, particularly in complex sites with multiple cells at different operational stages. In this study, diffuse carbon dioxide (CO2) and CH4 emissions were investigated at the Tenerife municipal solid waste landfill (Canary Islands, Spain), combining ground-based flux measurements with thermal infrared imaging acquired by unmanned aerial vehicles (UAVs). 

Diffuse gas fluxes were measured using the accumulation chamber method across more than 1,700 sampling points distributed over active, sealed and closed landfill cells. CH4 emissions were quantified both directly, using an in situ CH4 sensor, and indirectly, by estimating CH4 fluxes from measured CO2 fluxes and CH4/CO2 concentration ratios in the chamber headspace. In parallel, UAV-based thermal surveys were conducted to explore surface temperature patterns and their potential relationship with diffuse gas emissions and landfill cover characteristics. 

Results show clear spatial variability in diffuse gas emissions linked to the operational status of the cells. Active and recently used cells exhibit higher and more spatially heterogeneous CH4 fluxes, while sealed and older cells are characterized by lower direct CH4 emissions but relatively higher indirect CH4 estimates. This discrepancy is attributed to CH4 oxidation and limited surface permeability, which reduce effective CH4 transfer to the atmosphere while allowing CO2 to diffuse more efficiently. 

The combined use of direct and indirect flux measurements together with thermal imaging provides complementary insights into landfill gas dynamics, allowing differentiation between effective atmospheric emissions and subsurface CH4 presence. This integrated approach improves the characterization of fugitive emissions and supports the assessment of landfill gas management efficiency. 

How to cite: Fuentes-Domínguez, P., Asensio-Ramos, M., Vidaña-Glauser, A. E., García-Luis, P., García-Báez, J., González-Torres, S., Ortega-Ramos, V., de los Ríos-Díaz, H., M. Pérez, N., Padrón, Ó., V. Melián, G., and Hernández, P. A.:  Thermal imaging and fugitive CH4 emissions at Tenerife’s municipal solid waste landfill , EGU General Assembly 2026, Vienna, Austria, 3–8 May 2026, EGU26-10767, https://doi.org/10.5194/egusphere-egu26-10767, 2026.

EGU26-10802 | ECS | Posters on site | AS3.17

An updated approach to detect and quantify emissions from highly efficient offshore flares. 

Thomas Moore, James Lee, Jim Hopkins, Will Drysdale, Stuart Young, and Ruth Purvis

The methane pledge brought about during COP26 requires its signatories to reduce their 2020 methane emissions by 30% by 2030 (European Commission and United States of America, 2021). 65 % of all methane emissions are thought to be anthropogenic in nature (Saunois et al., 2025)

One of the major anthropogenic sectors contributing to methane emissions is from the oil and gas industry. Fugitive emissions of methane are one of the major contributors to emissions from this industry, this may refer to unwanted emission during transportation of product (colloquially referred to as gas leaks), or flaring, where methane undergoes combustion to CO2. As of 2023 the oil and gas industry was responsible for 1.2 % of the UK’s methane emissions,  with flaring emissions representing 69 % of this sector's emissions. (North Sea Transition Authority, 2025).

Flaring may occur for one of three reasons; Routine flaring, where an oil producing facility is unable to use the produced gas; Safety flaring, where flaring ensures the safe operation of the facility; Non-routine flaring encompasses all other flaring. The North Sea is one of the most active areas in the world for oil and gas activities. Recent attempts between 2018 and 2022 have reduced flaring activities in the North Sea by 50%, with an aim for zero flaring to take place by 2030. This is an important step to reducing emissions in this region as one fifth of all emissions in the North Sea related to oil and gas production activities are attributed to flaring (North Sea Transition Authority, 2023). While flaring activity continues to be reduced, some facilities require the continued use of flares, in these cases attempts have been made to adapt the flare itself and improve its overall efficiency and ensure that more methane is converted to CO2. 

This work features data collected from one sampling flight of a platform with a highly efficient flare that was intentionally flaring while on task. We explore the feasibility of using previous detection methodologies, such that present in (Shaw et al., 2023), while adding additional stages to confirm the detection of a flare, including source identification using NOx : CO2 ratios as well as modelling the dispersion of multiple sources on the platform using ADMS to understand the likelihood of detecting the flare. 

How to cite: Moore, T., Lee, J., Hopkins, J., Drysdale, W., Young, S., and Purvis, R.: An updated approach to detect and quantify emissions from highly efficient offshore flares., EGU General Assembly 2026, Vienna, Austria, 3–8 May 2026, EGU26-10802, https://doi.org/10.5194/egusphere-egu26-10802, 2026.

EGU26-11110 | ECS | Posters on site | AS3.17

A Surface-Adaptive Framework for Methane Point Source Detection and Quantification Using Sentinel-2 and Google Earth Engine 

Di Xu, Philippa Mason, Jianguo Liu, and Yanghua Wang

Methane point sources are spatially sparse, temporally intermittent, and strongly affected by surface heterogeneity, posing significant challenges for large-scale and continuous monitoring. While hyperspectral sensors provide high retrieval accuracy, their limited spatial and temporal coverage motivates the use of global, open-access multispectral satellite data for scalable identification and quantification of methane emissions. In this study, we present a systematic methane point source detection and quantification framework built upon Sentinel-2 imagery and the Google Earth Engine (GEE) platform, enabling scalable and operational analysis across diverse land surface types and emission sources. The framework incorporates adaptive plume detection and segmentation strategies tailored to different land surface conditions by exploiting characteristic methane signatures in the spatial, spectral, and temporal domains. Dedicated data-driven models are employed to segment methane plumes over homogeneous oil and gas regions, spectrally challenging environments such as vegetated and offshore areas, and heterogeneous sources including landfills and coal mining sites. Detected plumes are subsequently quantified using wind-informed emission estimation to derive point-source emission rates directly from Sentinel-2 observations. The proposed framework is evaluated across multiple representative land surfaces, successfully identifying the majority of high-emission sources as well as several previously unreported ones, and demonstrating improved detection consistency and generalization compared to conventional single strategy approaches. By leveraging the global coverage of Sentinel-2 and the computational scalability of GEE, this work provides a practical pathway toward near-global screening and monitoring of methane point sources, supporting climate mitigation and emission inventory improvement efforts.

How to cite: Xu, D., Mason, P., Liu, J., and Wang, Y.: A Surface-Adaptive Framework for Methane Point Source Detection and Quantification Using Sentinel-2 and Google Earth Engine, EGU General Assembly 2026, Vienna, Austria, 3–8 May 2026, EGU26-11110, https://doi.org/10.5194/egusphere-egu26-11110, 2026.

EGU26-11472 | ECS | Posters on site | AS3.17

Methane mass balance of a Spanish landfill 

Louise Anne Klotz, Anders Michael Fredenslund, Malika Menoud, David Lowry, and Charlotte Scheutz

Landfills represent a great opportunity to reduce anthropogenic methane (CH4) emissions in the near future. Although they accounted for 19% of global anthropogenic CH4 emissions in 2020 (Saunois et al., 2024), emissions mitigation strategies, such as landfill gas capture or microbial methane oxidation systems, have been well documented and successfully implemented in the past. However, accurate monitoring methods are required to assess the efficiency of such mitigation efforts. Currently, the IPCC recommends the use of first-order decay (FOD) models to estimate landfill CH4 generation potentials (IPCC, 2006). Such models remain highly uncertain due to large uncertainties in the model inputs (e.g., waste amounts or waste compositions) and/or model parameters (e.g., waste carbon contents, decay constants, biochemical CH4 potential, oxidation potential of landfill cover) (Rasouli et al., 2025, Wang et al., 2024, Mou et al., 2015). Therefore, estimating the CH4 generation potential of a landfill using direct in-situ measurements is preferred. Combining measurements of CH4 emissions, landfill gas collection and CH4 oxidation allows for more accurate estimates of the landfill CH4 generation potential and CH4 recovery efficiency. Although many studies have measured CH4 emissions using a wide range of in-situ methods (e.g., static flux chamber, atmospheric inversion modelling or tracer dispersion), few have also quantified the oxidation capacity of the landfill cover soils (Agdham et al., 2018; Abichou et al., 2006; Chanton et al., 2009). In this study, we performed a CH4 mass balance to estimate the CH4 generation potential at a landfill in Madrid, Spain receiving more than one million tons of household waste yearly. We collected 76 stable isotope samples and over 200 tracer dispersion measurements over the course of two campaigns in May and October 2025. Combining our measurements with landfill gas collection data, we estimated the landfill CH4 generation potential and CH4 recovery efficiency. Additionally, we compared our estimate to the modelled CH4 generation potential using different FOD models (e.g., IPCC FOD, Afvalzorg, LandGEM, GasSim). Leveraging the strength of direct in-situ measurements, this study provides valuable insights into CH4production at landfill sites and how to further enhance CH4 mitigation.

How to cite: Klotz, L. A., Fredenslund, A. M., Menoud, M., Lowry, D., and Scheutz, C.: Methane mass balance of a Spanish landfill, EGU General Assembly 2026, Vienna, Austria, 3–8 May 2026, EGU26-11472, https://doi.org/10.5194/egusphere-egu26-11472, 2026.

EGU26-11743 | ECS | Orals | AS3.17

An operational, cloud-based system for near-real-time methane emissions monitoring in the Marcellus shale and beyond 

Lucas Estrada, Daniel Jacob, Melissa Sulprizio, Xiaolin Wang, Jack Bruno, and Daniel Varon

We present an operational, cloud-based methane emissions monitoring system with near-real-time latency for the Marcellus shale, the largest gas-producing region in the United States. The system uses an analytical inversion via the Integrated Methane Inversion (IMI) framework to infer emissions from TROPOMI satellite instrument at ~12km resolution. We generate and analyze monthly emissions estimates spanning nearly five years (July 2021-present), enabling characterization of both long-term trends and short-term emission variability. Low-latency processing facilitates rapid detection of emission spikes, while high spatial resolution enables attribution among closely collocated source sectors (gas production, coal mining, livestock, and landfills). We validate our estimates using observations from MethaneSAT and summer 2025 aircraft campaigns. The system is fully automated on AWS and delivers results through an interactive web dashboard. We also develop an IMI extension package that enables users to deploy automated emissions monitoring systems for any region worldwide.

How to cite: Estrada, L., Jacob, D., Sulprizio, M., Wang, X., Bruno, J., and Varon, D.: An operational, cloud-based system for near-real-time methane emissions monitoring in the Marcellus shale and beyond, EGU General Assembly 2026, Vienna, Austria, 3–8 May 2026, EGU26-11743, https://doi.org/10.5194/egusphere-egu26-11743, 2026.

EGU26-12054 | Posters on site | AS3.17

Characterization of Algerian Oil and Gas Methane Emission Point Sources from Satellites to Drive Mitigation Actions  

Alma Raunak, Itziar Irakulis-Loitxate, Manuel Montesino-San Martín, Carol Castaneda Martínez, Gonzalo Mateo-García, Juan Emmanuel Johnson, and Tharwat Mokalled

Methane (CH₄) emissions from point sources in the oil and gas sector are highly heterogeneous in space and time, with emission patterns ranging from short-lived events to long-lasting, persistent sources. High-resolution satellite observations provide a unique capability to systematically detect, classify, and monitor large emissions at the facility level, and to explore links between emission behaviour, infrastructure characteristics, and potential mitigation outcomes. 

In this contribution, we will present the analysis of methane point source emissions in the Algerian oil and gas sector using satellite observations from UNEP’s International Methane Emissions Observatory (IMEO) Methane Alert and Response System (MARS). The study combines hyperspectral and multispectral high spatial resolution satellite data from January 2024 to December 2025 and analyses more than 150 emission point sources with large emissions during this time frame. The source analysis includes a classification by facility type (e.g. flares, gas disposal facilities, pipelines) and facility age based on the historical satellite imagery and visual inspection of high-resolution RGB data. This facility classification aims to assess potential relationships between infrastructure characteristics and emission behaviour. 

Given the differences in sensitivity, noise, revisit frequency, etc., of the satellites considered in this study, we investigate detection patterns across satellite types and find systematic differences between hyperspectral-only and multispectral detections. Sources detected exclusively by hyperspectral instruments are associated with lower estimated flux rates, sporadic emissions, or environmental and operational conditions that worsen the detection limits of multispectral sensors. In contrast, single-plume detections captured by multispectral satellites tend to correspond to big, short-duration emission events. Regarding emissions from flares, detections with multispectral instruments are limited to cases where flares are unlit and methane is vented, since active flaring and smoke significantly degrade methane retrievals, preventing the detection of emissions from incomplete combustion. 

Another parameter that is specifically analysed is the duration of emissions and monitoring of their status after MARS notification. While all emissions are important, those identified as long-duration (several days of emission) or frequent (e.g., a flare that repeatedly goes out and vents) are targeted for urgent mitigation recommendations by MARS in its engagement process and monitoring of the potential effect of its notifications when the emission cessation happens. 

Overall, this work demonstrates the value of an integrated classification framework that combines facility type, emission persistence, and multi-sensor satellite observations. Such an approach improves interpretation of satellite-derived methane detections and supports prioritisation of mitigation efforts in the oil and gas sector.

How to cite: Raunak, A., Irakulis-Loitxate, I., Montesino-San Martín, M., Castaneda Martínez, C., Mateo-García, G., Johnson, J. E., and Mokalled, T.: Characterization of Algerian Oil and Gas Methane Emission Point Sources from Satellites to Drive Mitigation Actions , EGU General Assembly 2026, Vienna, Austria, 3–8 May 2026, EGU26-12054, https://doi.org/10.5194/egusphere-egu26-12054, 2026.

EGU26-12148 | Posters on site | AS3.17

Observation-conditioned probability of detection for satellite methane point sources  

Manuel Montesino-SanMartin, Gonzalo Mateo-García, Javier Gorroño, Carol Castaneda, Juan Emmanuel Johnson, Alma Raunak, and Itziar Irakulis-Loitxate

Methane is a key target for rapid mitigation because of its large warming potential and short life in the atmosphere. The Methane Alert and Response System (MARS), under the UNEP's International Methane Emissions Observatory (IMEO), supports mitigation efforts through satellite-based methane monitoring. In 2025, MARS notified 3738 methane plumes from the oil and gas sector to governments and companies using public multi-spectral (Sentinel-2 and Landsat) and hyper-spectral (EMIT, PRISMA and EnMAP) detections. An important aspect of MARS is the collection of satellite observations where no methane plumes are detected, which can be used as evidence of effective mitigation efforts reported by companies. However, non-detections can also result from unfavourable observing and environmental conditions, such as strong winds, retrieval artifacts, or differences in the sensitivity of instruments. Therefore, interpreting non-detections properly requires considering the observation-specific probability of detection (PoD), which depends on wind conditions, observation geometry, the on-board satellite instrument, and image noise. Here, we quantify how these factors influence the PoD and develop an operational parametric model to efficiently evaluate MARS observations. 

We assess detection performance across a wide range of realistic conditions in oil and gas regions by sampling scenes from the MARS archive covering diverse wind speeds, solar/viewing geometries, and noise regimes that vary with surface albedo and time. Representative synthetic methane plumes simulated with the WRF-LES model are injected into the top-of-atmosphere (TOA) radiance of satellite images. For each scene, multiple plume realizations at different flux rates are processed using the MARS operational detection pipeline to determine the detection frequency. We then fit a logistic PoD curve as a function of flux, with the slope and midpoint related to observation conditions for each instrument. Results show that wind speeds and noise levels are the dominant drivers affecting the slope and shift of the sigmoid PoD curve in most cases. We compare this parametric model on independent testing scenes and provide average probability of detection estimates for different instruments on major oil and gas basins. This parametric model will support the decision-making process in MARS in future potential mitigation actions.

How to cite: Montesino-SanMartin, M., Mateo-García, G., Gorroño, J., Castaneda, C., Johnson, J. E., Raunak, A., and Irakulis-Loitxate, I.: Observation-conditioned probability of detection for satellite methane point sources , EGU General Assembly 2026, Vienna, Austria, 3–8 May 2026, EGU26-12148, https://doi.org/10.5194/egusphere-egu26-12148, 2026.

EGU26-12195 | Posters on site | AS3.17

Satellite-based detections and source attribution of methane emissions from underground mines in China 

Carol Castaneda Martinez, Itziar Irakulis-Loitxate, Manuel Montesino-SanMartín, Alma Raunak, Gonzalo Mateo-García, Juan Emmanuel Johnson, Malgorzata Kasprzak, and Lisette Van Niekerk

Methane is a potent greenhouse gas and a major contributor to global warming. One of the main anthropogenic contributors to these emissions is the coal sector, which emits most of its methane through ventilation and degasification systems, such as drainage stations in underground mines. In this context, the UNEP’s Methane Alert Response System (MARS) and the Steel Methane Programme (SMP), managed by the International Methane Emissions Observatory (IMEO), have made systematic efforts to identify large emissions associated with coal mines using high-resolution hyperspectral satellites such as EMIT, EnMAP, and PRISMA. These efforts focus particularly on metallurgical coal mines globally, with an emphasis on producing countries such as Kazakhstan, the United States, Poland, Czechia, Russia, Australia, and China, among others.

China is not only one of the world's largest coal producers but also one of the main emitters of methane associated with this activity. This study analyzes emissions and their potential sources from underground mines processing metallurgical, thermal, and mixed coal. The analysis is conducted within the IMEO MARS framework, using spatial information provided by the Global Energy Monitor (GEM) database to identify mine boundaries and potential emission point sources. Based on this information, monitoring areas are defined and integrated into the system, allowing for the acquisition of historical images intersecting these areas and subsequent analysis.

In this study we analyzed the emissions of 94 underground mines distributed across 12 provinces in China. To this end, we processed 600 hyperspectral satellite images acquired between February 2020 and January 2026, applying the wide-window matched filter methodology for the retrieval of the methane concentrations, which is suitable for this study due the heterogeneous environments. Afterwards, through visual inspection, we identified over 700 plumes that were attributed to 150 different emission sources. Among the different sources, we found that 60% of the plumes come from venting shafts, 36% from drainage stations, and 4% from other types of coal facility. Based on this data, we aim to support large scale mine level emission assessment and source specific attribution within the IMEO MARS framework, contributing to improved prioritization of mitigation actions in the coal sector.

How to cite: Castaneda Martinez, C., Irakulis-Loitxate, I., Montesino-SanMartín, M., Raunak, A., Mateo-García, G., Johnson, J. E., Kasprzak, M., and Van Niekerk, L.: Satellite-based detections and source attribution of methane emissions from underground mines in China, EGU General Assembly 2026, Vienna, Austria, 3–8 May 2026, EGU26-12195, https://doi.org/10.5194/egusphere-egu26-12195, 2026.

Mitigation of CH4 emissions represents an effective short-term strategy for reducing climate change impacts. However, anthropogenic CH4 emission estimates remain highly uncertain due to the complex and heterogeneous distribution of sources and the strong temporal variability of emission processes. Emission factors for biogas plants and for the waste and wastewater treatment sector are still subject to large uncertainties.
This study focuses on the quantification of CH4 emission rates from biogas plants and wastewater treatment facilities in Germany using mobile methane measurements conducted at street level with cars and bicycles. Localized CH4 concentration enhancements are detected and converted into emission rates using a Gaussian plume model. Based on more than seven years of controlled CH4 release experiments, we developed a best-practice methode for mobile measurements, including optimized driving strategies and data processing procedures, reducing the overall uncertainty of derived emission rates to below 30%.
Mobile measurements were performed at more than 60 biogas plants, with one facility monitored continuously since 2016 to assess long-term emission behavior. Derived methane emission rates ranged from 0.1 to 46 kg CH4 h-1, corresponding to relative CH4 losses of approximately 0.2- 42.7% of the produced CH4. Methane emissions from wastewater treatment plants (WWTPs) in Germany have been investigated only in a limited number of studies, and current national inventories rely largely on emission factors derived from measurements in other European countries. To address this gap, a systematic survey was conducted at 13 WWTPs in Germany. Measurements were used to identify dominant CH4 emission sources, investigate diurnal emission patterns, and quantify facility-level CH4 emission rates and emission factors. At the surveyed sites, sludge treatment units and screening facilities were identified as the main emission sources. Determined CH4 emission rates ranged from 0.42 to 12.96 kg CH4 h-1.
The derived emission rates and emission factors are statistically analyzed, and compared with values currently used in regional and national emission inventories. These findings help to improve inventory accuracy and to target methane mitigation strategies.

How to cite: Schmidt, M., Wietzel, J., and Zeleny, M.: National-Scale Quantification of Methane Emissions from Biogas Facilities and Wastewater Treatment Plants in Germany, EGU General Assembly 2026, Vienna, Austria, 3–8 May 2026, EGU26-12712, https://doi.org/10.5194/egusphere-egu26-12712, 2026.

EGU26-12765 | ECS | Posters on site | AS3.17

Methane emissions from non-producing oil and gas wells in Argentina 

Manuela González Sánchez, Florencia Carreras, Andreea Calcan, James Lawrence France, and Mary Kang

Non-producing oil and gas wells are a poorly quantified source of anthropogenic methane emissions worldwide, posing a significant risk to the environment and contributing to climate change. In Argentina, a country with a long history of oil and gas production, methane emissions from non-producing wells remain largely uncharacterized. Here, we combine a national well database analysis with ground-based methane measurements to assess emissions from non-producing oil and gas wells across Argentina. By analyzing well databases from the government, we found 85,260 wells in Argentina, of which 53,292 (62%) are non-producing, with the largest number of wells in the provinces of Santa Cruz, Chubut and Neuquén. We analyze key well attributes, including well depth, well type (e.g., oil and gas), location, well age and well abandonment date. These attributes are essential to perform a spatial analysis and identify the regions in Argentina that should be prioritized for field measurements.

We conducted ground-based methane flow rates measurements at 75 non-producing oil and gas wells in Chubut province. Unplugged wells exhibited the highest emissions, with a maximum measured methane flow rate of 41g/h. We further analyzed the influence of categorical well attributes, such as operator, well status, plugging status, well type, and lift system on measured methane emissions, identifying attributes associated with higher or lower emission rates.

Using the field measurement results combined with the national well database, we provide an estimate of methane emissions from non-producing oil and gas wells in Argentina. Overall, our findings contribute to improving the characterization of existing non-producing oil and gas wells, to including methane emission estimates in Argentina’s national greenhouse gas inventory, and to identifying the regions that should be prioritized for continued monitoring of methane emissions.

How to cite: González Sánchez, M., Carreras, F., Calcan, A., France, J. L., and Kang, M.: Methane emissions from non-producing oil and gas wells in Argentina, EGU General Assembly 2026, Vienna, Austria, 3–8 May 2026, EGU26-12765, https://doi.org/10.5194/egusphere-egu26-12765, 2026.

EGU26-13220 | ECS | Posters on site | AS3.17

Limitations and challenges of using satellite remote sensing to estimate diffuse methane emissions at a national level in Denmark 

Pau Fabregat, Sine Hvidegaard, Andreas Stokholm, and Charlotte Scheutz

Methane (CH₄) is the second-largest greenhouse gas contributing to climate change, and it is produced by both anthropogenic and biogenic sources. The TROPOspheric Monitoring Instrument (TROPOMI) on board ESA’s Sentinel 5 Precursor (S5-P) satellite provides daily total column-averaged methane mixing ratio values at high spatial resolution, allowing the monitoring and flux estimation of diverse methane sources.

In Denmark, CH₄ emissions are mainly related to the agricultural and waste sectors, mostly attributed to diffuse sources and point sources with low emission rates (below 100 kg/h). Emission estimates compiled in the national GHG emissions inventory are mostly based on emission factors derived from models, with few empirical measurements. The lack of measurements and spatial information of methane sources introduces uncertainty when projecting the inventory emission estimates into a spatial grid. Gridded emission estimates from emissions databases like EDGAR disagree with the inventory on both their spatial distribution and magnitude, raising the question as to how to correctly account for diffuse emissions and which sources to trust.
Understanding the distribution of diffuse anthropogenic methane fluxes and their quantification is crucial for nations to plan mitigation strategies and have an empirical knowledge of their inventories.

In this study, we use TROPOMI data to detect hot spots of diffuse methane sources and estimate fluxes attributed to different sectors and source types over Denmark. Focus is set on analyzing the limitations and challenges of pursuing these tasks, including flux detection thresholds, data availability, background estimation, and methods for flux estimation. A multi-year period ranging from 2019 to 2024 is chosen to both assess seasonal variability and enhance flux estimation through temporal averaging.

How to cite: Fabregat, P., Hvidegaard, S., Stokholm, A., and Scheutz, C.: Limitations and challenges of using satellite remote sensing to estimate diffuse methane emissions at a national level in Denmark, EGU General Assembly 2026, Vienna, Austria, 3–8 May 2026, EGU26-13220, https://doi.org/10.5194/egusphere-egu26-13220, 2026.

EGU26-13302 | ECS | Posters on site | AS3.17

Harmonization of Mobile Methane Measurement Methods for IM4CA Project Based on a Controlled Release Experiment  

Rana Kanaan, Jean-Daniel Paris, Dylan Geissbühler, Jakub Bartyzel, Jarosław Nęcki, Jean Sciare, Kamil Strzelecki, Nataly Velandia Salinas, Paweł Jagoda, Pierre-Yves Quéhé, Roubina Papaconstantinou, Roy Meinen, Sebastian Iancu, and Thomas Röckmann

The global concentration of methane (CH4) in the atmosphere has more than doubled since the pre-industrial era and accounts for roughly one-third of current global warming. Because of its short lifetime, reducing anthropogenic CH4 emissions can effectively lower its atmospheric levels and ease its climate impact. Accurately quantifying CHemissions remains crucial for informing decision-making and mitigation strategies to lower those emissions.

One of the key objectives of the EU-funded research project IM4CA “Investigating Methane for Climate Actions” is to quantify the anthropogenic CH4 emissions at the site level in Romania as a post-monitoring campaign following ROMEO campaign of MEMO2 Project. To achieve this, a variety of top-down CH4 measurement approaches are to be implemented. These approaches use ambient CHmole fraction measurements from sensors in vehicles, drones, aircrafts or tall towers combined with models to estimate total CH4 flux rates at source of different scales. Intercomparing and harmonizing these CH4 measurement methods are essential to accurately quantify CH4 emissions in the context of a large-scale campaign.

Here, we aim to compare car and drone-based measurements prior to their field deployment in IM4CA, using a CH4-controlled release experiment. This experiment was conducted around the Unmanned System Research Laboratory (USRL) airstrip in Orounda, Cyprus, where CH4 was measured simultaneously using infrared spectrometers mounted on drone platforms and cars. To better account for any variability related to the measurement tools, three different drone systems were used, each equipped with one CH4 gas analyzer, and three additional analyzers were mounted in the same car. The quantified CH4 emissions using either mass balance or Gaussian plume model are compared from both measurement platforms and their possible joint use in the field for complete plume characterization is discussed.

The results from this experiment will enhance the accuracy of reported CH4 fluxes and pave the way for harmonized measurement approaches, particularly for intensive large-scale monitoring campaigns within the IM4CA project and other similar third-party measurement initiatives.

How to cite: Kanaan, R., Paris, J.-D., Geissbühler, D., Bartyzel, J., Nęcki, J., Sciare, J., Strzelecki, K., Velandia Salinas, N., Jagoda, P., Quéhé, P.-Y., Papaconstantinou, R., Meinen, R., Iancu, S., and Röckmann, T.: Harmonization of Mobile Methane Measurement Methods for IM4CA Project Based on a Controlled Release Experiment , EGU General Assembly 2026, Vienna, Austria, 3–8 May 2026, EGU26-13302, https://doi.org/10.5194/egusphere-egu26-13302, 2026.

EGU26-13350 | ECS | Orals | AS3.17

MethaneSAT - Quantifying Methane Emissions on Basin-Scales From Space 

Marvin Knapp, Joshua Benmergui, Apisada Chulakadabba, Ethan Kyzivat, Jacob Bushey, Maryann Sargent, Zhan Zhang, Sebastian Roche, Christopher Chan Miller, Nicholas LoFaso, Sasha Ayvazov, Marcus Russi, Tom Veness, James Williams, Marc Omara, Katlyn MacKay, Anthony Himmelberger, Kaiya Weatherby, Ritesh Gautam, and Steve Wofsy

Anthropogenic methane emissions, particularly from the oil and gas (O&G) sector, span a broad spectrum of rates and demonstrate significant temporal variability and intermittency. The MethaneSAT satellite addresses a critical limitation in space-based methane monitoring by enabling simultaneous quantification of both discrete point sources and diffuse area sources across regional scales, such as O&G production basins, using snapshot observations. MethaneSAT retrieves the total column dry-air mole fraction of methane (XCH₄) with high spatial resolution (100 m × 400 m) and precision (20–40 ppb) across observation swaths of 220 km × 200 km. Operating from March 2024 to June 2025, MethaneSAT acquired 1,152 scenes over 231 global targets, and to date, EDF has released over 190 emission maps spanning 49 O&G basins.

We present MSAT L4 CORE (MethaneSAT Level 4 Conserved, Optimized Retrieval of Emissions), an inverse modeling framework for quantifying regional-scale methane emissions. CORE employs Hamiltonian Monte Carlo sampling via the Stan software to infer posterior distributions of surface fluxes, conditioned on single-scene MethaneSAT measurements. Emissions are estimated in 4 km × 4 km grid cells, generating ensemble posterior flux distributions that reproduce the observations. A spatially homogeneous prior is imposed on the emissions, and regional-scale boundary inflow is estimated concurrently. MSAT L4 CORE enables regional-scale, snapshot emission estimates with typical uncertainties of 30% on aggregated emissions.

We demonstrate CORE using both simulated and real MethaneSAT data, and discuss its applicability to the airborne MethaneAIR mission as well as other airborne and spaceborne methane observing platforms.

How to cite: Knapp, M., Benmergui, J., Chulakadabba, A., Kyzivat, E., Bushey, J., Sargent, M., Zhang, Z., Roche, S., Miller, C. C., LoFaso, N., Ayvazov, S., Russi, M., Veness, T., Williams, J., Omara, M., MacKay, K., Himmelberger, A., Weatherby, K., Gautam, R., and Wofsy, S.: MethaneSAT - Quantifying Methane Emissions on Basin-Scales From Space, EGU General Assembly 2026, Vienna, Austria, 3–8 May 2026, EGU26-13350, https://doi.org/10.5194/egusphere-egu26-13350, 2026.

EGU26-13466 | ECS | Posters on site | AS3.17 | Highlight

An e-Bike Measurement System for Urban Methane Emissions Measurements 

Simon Butt-Vallieres, Clay Wearmouth, Chris Hugenholtz, and Thomas Barchyn

Mobile, ground-based methane measurements play a critical role in detecting, locating, and quantifying urban emissions and are increasingly relied upon for mitigation tracking and inventory development. Most existing studies employ automobile-based platforms, which offer broad spatial coverage but constrain sampling speed, proximity to sources, and access to dense or traffic-restricted environments. These limitations introduce persistent uncertainties in source localization and plume interpretation, particularly in urban settings.

To address these challenges, we developed a bicycle-based methane measurement system that prioritizes transport-aware localization as a core measurement capability. The platform integrates an open-path methane sensor with high-accuracy GNSS positioning, and a sonic anemometer mounted directly on the platform. High-frequency (10 Hz) measurements are synchronized and fused in real time, enabling wind-resolved interpretation of methane enhancements within their spatial context. By operating at flexible travel velocities and leveraging the maneuverability of a bicycle, the system enables targeted sampling in narrow corridors, pedestrian zones, and other environments that are often inaccessible or impractical for automobile-based surveys.  

Initial deployments in the City of Calgary, Alberta demonstrate the platform’s ability to detect, localize, and attribute methane emissions from a range of anthropogenic sources, including wastewater and other urban infrastructure, that are difficult to resolve using conventional mobile methods. Direct integration of high-fidelity wind measurements on the mobile platform provides critical transport context which can be used in real time to constrain source locations and improve plume-based quantification. Together, these results show that bicycle-based platforms equipped with integrated wind sensing can generate high-resolution methane datasets and represent an effective approach for improving urban methane mapping and emission attribution.

How to cite: Butt-Vallieres, S., Wearmouth, C., Hugenholtz, C., and Barchyn, T.: An e-Bike Measurement System for Urban Methane Emissions Measurements, EGU General Assembly 2026, Vienna, Austria, 3–8 May 2026, EGU26-13466, https://doi.org/10.5194/egusphere-egu26-13466, 2026.

EGU26-13485 | Posters on site | AS3.17

A methane controlled release system for small and intermediate emission quantification with associated drone airspace 

Pierre-Yves Quéhé, Roubina Papaconstantinou, Jean-Daniel Paris, Jean Sciare, and Unmanned Systems Research Laboratory (USRL) Team

Methane (CH4) is a key short-lived climate forcer, making accurate emission quantification essential for climate mitigation strategies. Methods to estimate CH4 emissions from sources such as landfills, wetlands, agriculture, and the oil and gas sector using atmospheric concentration measurements are available and relatively well established, yet their practical implementation remains challenging and they lack standardization. Emission estimates are sensitive to numerous factors, including measurement techniques (e.g. differential absorption lidar, optical gas imaging, diode laser absorption spectroscopy), measurement platforms (e.g. satellite, aircraft, drone, vehicle, ground-based station, handheld system), sites size and complexity, meteorological conditions, signal processing and quantifications approach (e.g. gaussian plume or mass-balance). 

To test and validate methods aiming at small and medium leak-like emissions under realistic conditions, the Cyprus Institute (CyI) developed an open-air controlled-release site capable of generating CH4 emissions from 0 to 25 kg h-1, spanning a wide range of real-world emission scenarios. It is located at the Unmanned Systems Research Laboratory (USRL) airfield of CyI, on the Orounda plateau approximately 40 km from Nicosia, Cyprus. The facility includes two runways (200 m × 12 m and 90 m × 6 m) and is surrounded by flat access roads, providing a versatile environment for drone-based and vehicle-mounted measurements. The controlled-release system consists of two units enabling the distribution and precise flow control of high-purity CH4 (99.5%), connected to a dedicated 180 m-long hose (1-inch inner diameter). The gas outlet (open-ended release) is located at a height of 3.2 m above ground level. Multi-level wind measurements are provided by three wind sensors installed at heights of 13 m, 8 m, and 2.5 m. 

We present this controlled release system, its operations, and associated uncertainties in flow rates. It has been first used during the IM4CA (Investigating Methane for Climate Action) campaign, intercomparing UAV-based and car-based in-situ methane quantification techniques from 8 to 11 December 2025. As USRL is a National Facility (in the framework of ACTRIS), it can be accessed on a Transnational Access (TNA) basis by a large number of users and can provide access to a large and diverse fleet of fixed and rotary-wing UAS.

How to cite: Quéhé, P.-Y., Papaconstantinou, R., Paris, J.-D., Sciare, J., and Team, U. S. R. L. (.: A methane controlled release system for small and intermediate emission quantification with associated drone airspace, EGU General Assembly 2026, Vienna, Austria, 3–8 May 2026, EGU26-13485, https://doi.org/10.5194/egusphere-egu26-13485, 2026.

EGU26-13620 | ECS | Posters on site | AS3.17

Concurrent Mobile–Aerial Monitoring of Landfill Methane Emissions 

Roubina Papaconstantinou, Pierre-Yves Quéhé, Dylan Geissbühler, Paweł Jagoda, Rana Kanaan, Roy Meinen, Nataly Velandia Salinas, Jakub Bartyzel, Kamil Strzelecki, Sebastian Iancu, Jaroslav Nęcki, Unmanned Systems Research Laboratory (USRL) Team, Thomas Röckmann, Jean Sciare, and Jean-Daniel Paris

Methane (CH4) emissions from the waste sector represent a substantial and addressable component of global greenhouse gas emissions, accounting for around 20% of total anthropogenic methane and ranking third after agriculture and fossil fuels. In Europe, landfills alone contribute approximately 30% of anthropogenic CH4 emissions, drawing increasing attention due to CH4’s high global warming potential and the relative feasibility and cost-effectiveness of mitigation measures in this sector. Accurate quantification of fugitive landfill methane is therefore critical, both for greenhouse gas mitigation and for evaluating the performance of gas recovery systems and bio-covers.

Recent advances in atmospheric methane measurement techniques have enabled high-resolution, in situ observations using mobile and aerial platforms. In this work, we present an integrated dual-platform approach that combines car-based mobile measurements with unmanned aerial vehicle (UAV) observations to improve the characterization of landfill methane emissions. By merging ground-level and aerial perspectives, this approach enhances spatial coverage and provides three-dimensional insight into plume behaviour, particularly in complex terrains where single-platform methods are often insufficient.

We demonstrate the methodology at the Kotsiatis landfill in Cyprus, a closed municipal waste site currently undergoing environmental rehabilitation. Three measurement campaigns conducted in 2025 captured methane emissions at different stages of post-closure works. During the December 2025 campaign, partner teams from the IM4CA project also participated, deploying two UAV teams alongside three instruments on the mobile platform.

We examine how differences in monitoring platforms, meteorological conditions (including wind, atmospheric pressure, and temperature), stage of post-closure works and flux estimation methodologies influence methane quantification results. This analysis provides critical insight into the strengths and limitations of mobile- and UAV-based approaches for landfill methane emission assessment and supports their effective application in complex real-world settings.

How to cite: Papaconstantinou, R., Quéhé, P.-Y., Geissbühler, D., Jagoda, P., Kanaan, R., Meinen, R., Velandia Salinas, N., Bartyzel, J., Strzelecki, K., Iancu, S., Nęcki, J., Team, U. S. R. L. (., Röckmann, T., Sciare, J., and Paris, J.-D.: Concurrent Mobile–Aerial Monitoring of Landfill Methane Emissions, EGU General Assembly 2026, Vienna, Austria, 3–8 May 2026, EGU26-13620, https://doi.org/10.5194/egusphere-egu26-13620, 2026.

EGU26-13792 | ECS | Posters on site | AS3.17

UAV-based CH4 flux estimation intercomparison using controlled releases within the IM4CA project 

Dylan Geissbühler, Roubina Papaconstantinou, Pierre-Yves Quéhé, Paweł Jagoda, Rana Kanaan, Roy Meinen, Nataly Velandia Salinas, Jakub Bartyzel, Kamil Strzelecki, Sebastian Iancu, Jaroslav Nęcki, Jean Sciare, Jean-Daniel Paris, and Thomas Röckmann

Methane (CH4) is a key driver of near-term climate warming, and rapid mitigation requires robust, independent, and spatially resolved quantification of emissions, including their temporal variability and intermittency. Within the IM4CA (Investigating Methane for Climate Action) project, Unmanned Aerial Vehicles (UAVs) are being developed as flexible platforms to support emission monitoring and verification at the scale of individual sources. However, differences in instrumentation, flight strategies, and emission quantification methodologies can lead to substantial variability in derived flux estimates across teams and campaigns.

To address this challenge, a dedicated UAV intercomparison campaign was conducted in December 2025 at the Unmanned System Research Laboratory (USRL), near Orounda, Cyprus. Over five days, four research teams: Utrecht University (UU), The Cyprus Institute (CyI), AGH University Krakow (AGH), and the National Institute for Aerospace Research Elie Carafoli (INCAS), performed coordinated UAV measurement flights at a common site, targeting a controlled CH4 release with known emission rates.

The teams operated with differing levels of platform independence: UU and CyI flew their instruments on their own UAVs, AGH deployed their sensor both on their own platform and on a CyI UAV, while INCAS operated their CH4 sensor exclusively on a CyI platform. Meteorological data were collected using ground-based stations operated by CyI and AGH around the runway, as well as onboard measurements from the UU UAV. Controlled methane releases were designed to allow each team to sample all release rates under comparable environmental conditions. The emission rates, ranging from 0 to 25 kg h-1, were known by the release operator but disclosed to the teams only after the campaign, ensuring an unbiased intercomparison.

In this contribution, we first describe and compare the experimental setups of the participating teams, including sensor technologies, UAV platforms, and flight strategies. We then present and intercompare the CH4 flux estimates derived from each system for identical release periods, focusing on accuracy relative to the known CH4 flux, their internal consistency, and sensitivity to environmental conditions, such as wind speed and atmospheric stability. Differences arising from flight patterns, data processing choices, background determination and flux estimation methodologies are examined. The results will provide critical insight into the strengths and limitations of the UAV-based methane quantification approaches used in the context of the IM4CA project, and support robust results in future project-wide campaigns.

How to cite: Geissbühler, D., Papaconstantinou, R., Quéhé, P.-Y., Jagoda, P., Kanaan, R., Meinen, R., Velandia Salinas, N., Bartyzel, J., Strzelecki, K., Iancu, S., Nęcki, J., Sciare, J., Paris, J.-D., and Röckmann, T.: UAV-based CH4 flux estimation intercomparison using controlled releases within the IM4CA project, EGU General Assembly 2026, Vienna, Austria, 3–8 May 2026, EGU26-13792, https://doi.org/10.5194/egusphere-egu26-13792, 2026.

EGU26-14040 | ECS | Posters on site | AS3.17

Improving methane emission monitoring in Oman’s oil and gas sector with mobile measurements and well pad identification 

Jade Boutot, James L. France, Jaroslaw M. Necki, Paweł Jagoda, Jakub Bartyzel, Mary Kang, and Mark Lunt

Methane is a potent greenhouse gas and has become a global priority to combat global warming. In Oman, fugitive methane emissions from the oil and gas sector account for the majority (77%) of the country’s anthropogenic methane emissions. Oman’s primary oil and gas company has joined the Oil and Gas Methane Partnership 2.0 (OGMP 2.0), committing to monitoring and reducing their methane emissions. However, methane emissions from Oman’s oil and gas sector remain highly uncertain, and there have been no independent, academic-led ground-based measurement studies conducted in Oman until now.

To address this gap, the United Nations Environment Programme’s (UNEP) International Methane Emissions Observatory (IMEO) funded the first vehicle-based methane measurement campaign targeting oil and gas infrastructure in Oman in 2023 to improve data collection in measurement-scarce regions. Methane measurements were collected using vehicle-based Licor-7810 and Los Gatos MGGA-918 analysers, allowing high-resolution methane observations along accessible roads and offroad paths surrounding oil and gas infrastructure. Here, we present initial results across three oil and gas fields, including methane source attribution, detection, and quantification across various oil and gas infrastructure types.

In addition to methane detections, national methane emission estimates also depend on the number of oil and gas well pads and associated infrastructure that exist across the country, but this number remains highly uncertain. To improve estimates of oil and gas well counts, we introduce an initial framework for identifying oil and gas well pads from satellite imagery using machine learning.

By combining mobile measurement data and satellite imagery, we aim to improve methane monitoring in Oman’s largest anthropogenic methane-emitting sector, the oil and gas sector. This approach also demonstrates the value of relatively cost-effective vehicle-based screening methods for assessing emissions across large-scale oil and gas developments, and provides a foundation for similar efforts in regions with limited monitoring data.

How to cite: Boutot, J., France, J. L., Necki, J. M., Jagoda, P., Bartyzel, J., Kang, M., and Lunt, M.: Improving methane emission monitoring in Oman’s oil and gas sector with mobile measurements and well pad identification, EGU General Assembly 2026, Vienna, Austria, 3–8 May 2026, EGU26-14040, https://doi.org/10.5194/egusphere-egu26-14040, 2026.

EGU26-14130 | ECS | Orals | AS3.17

Towards accurate methane emission reporting from coal mine ventilation: a direct measurement approach at the shaft  

Yaroslav Bezyk, Adrian Góra, Dawid Szurgacz, Jakub Bartyzel, Pawel Jagoda, Justyna Swolkien, and Jarosław Nęcki

Emissions from coal production represent one of the major anthropogenic sources of atmospheric methane, particularly CH4 released through underground mine degassing and discharged via the ventilation system. Ventilation air methane (VAM) is of great interest in terms of safe mining exploitation and GHG emission reduction targets. The direct measurements and quantification of CH4 emission from mining activities and its controlling factors are often subject to considerable uncertainty. Therefore, it is necessary to perform continuous monitoring of CH4 content and estimate methane emission rates across mine ventilation shafts into the atmosphere.

This study investigates methane concentration variability in ventilation air, evaluates the performance of a low-cost TDLAS analyzer (Axetris LGD), and estimates a site-specific methane emission factor for an underground coal mine ventilation system. The analysis is based on continuous one-year VAM measurements conducted at the exhaust ventilation shaft of a hard coal mine located in the western part of Upper Silesian Coal Basin (USCB), Poland. During the study period, the mine operated three active longwall panels at a depth of ⁓700 m b.g.l.

Methane monitoring conducted between July 2024 and August 2025 revealed pronounced temporal variability in concentration and volume of exhausted VAM in the ventilation shaft on daily and weekly timescales. These variations reflect episodic gas release events, changes in airflow rates, and operational dynamics associated with mining activities. Seasonal fluctuations in shaft methane concentrations, ranging from 0.15 to 0.45 %, were generally associated with intensified mining activity, particularly during the pre-winter period, whereas downward trends corresponded to a reduced number of active longwalls.

A comparison of the Axetris LGD analyzer with in-mine thermocatalytic Pellistor gas detector at 1-minute resolution revealed systematic offsets in the Pellistor measurements, which consistently underestimated CH4 content under low-concentration conditions. Following recalibration of the Pellistor sensor using the higher-resolution Axetris measurements as a reference, a strong agreement between the two instruments was achieved, characterized by convergent concentration trends and a substantially reduced measurement bias (relative RMSE of ⁓7 %). These results demonstrate the necessity of regular low-range calibration to ensure the reliability of long-term Pellistor-based CH4 monitoring in mine ventilation air.

Analysis of methane concentrations from coal mine ventilation shaft identified three distinct emission trends. Period 1 (August–December 2024) exhibited the highest CH4 emission rates, averaging 1060 ± 140 tons ∙ month–1, Period 2 (January–March 2025) showed slightly lower emissions, with an average of 1034 ± 80 tons ∙ month–1, while Period 3 (April–June 2025) was characterized by the lowest methane release, averaging 720 ± 40 tons ∙ month–1. Hourly emission rates ranged from 1.0 to 2.5 tons CH4 ∙ h–1. Methane emission rates correlated with mining activity indicators, including longwall advance (R2 = 0.55) and coal production (R2 = 0.38). A site-specific methane emission factor of 5.1 ± 1.0 m3 ∙ ton–1 coal was determined for the studied mine.

Acknowledgment:

This work was funded by the Polish Ministry of Science and Higher Education under Grant No. 2022/44/C/ST10/00112. The authors want to thank the coal mine company for permission to access the Pellistor sensor and airflow records. 

How to cite: Bezyk, Y., Góra, A., Szurgacz, D., Bartyzel, J., Jagoda, P., Swolkien, J., and Nęcki, J.: Towards accurate methane emission reporting from coal mine ventilation: a direct measurement approach at the shaft , EGU General Assembly 2026, Vienna, Austria, 3–8 May 2026, EGU26-14130, https://doi.org/10.5194/egusphere-egu26-14130, 2026.

EGU26-14423 | Posters on site | AS3.17

Methane emissions from beef farming – in field measurements in the BEEFTWIN project 

Rebecca Fisher, Mackenzie LeVernois, David Lowry, James France, Victoria Rafflin, Ellen Nisbet, Molly Simpson, Catherine Evans, Mingqi Gao, Louise Manning, Roger Maull, Fatima Gillani, Mahdi Rashvand, and Xiao Ma

BEEFTWIN is a UK Research and Innovation interdisciplinary project bringing methane emission data together with other parameters to form a digital twin of UK beef farming. Ultimately the project aims to identify ways to reduce greenhouse gas emissions from the beef farming sector whilst improving productivity, beef quality and animal welfare.

We are developing techniques to quantify grazing cattle emissions using mobile measurements of methane concentrations in transects downwind of cattle pastures, together with meteorological measurements and drone imagery to pinpoint locations of the cattle, followed by atmospheric dispersion modelling.

Measurements of methane stable isotopes and methane:carbon dioxide ratios are used to characterise predominant farm emission sources (eructation and manure). We are linking microbial measurements (relative species abundance and gene expression) in manure samples to the stable isotopic and methane:carbon dioxide ratios of manure emissions.

Through these measurements we are gaining a better understanding of the distribution and variability of methane emissions across beef farms and of how variability in methanogenic communities in manure affects emissions. These results will allow us to provide more insightful greenhouse gas emission estimates for farms employing different livestock management practices.

How to cite: Fisher, R., LeVernois, M., Lowry, D., France, J., Rafflin, V., Nisbet, E., Simpson, M., Evans, C., Gao, M., Manning, L., Maull, R., Gillani, F., Rashvand, M., and Ma, X.: Methane emissions from beef farming – in field measurements in the BEEFTWIN project, EGU General Assembly 2026, Vienna, Austria, 3–8 May 2026, EGU26-14423, https://doi.org/10.5194/egusphere-egu26-14423, 2026.

From 2016 to 2024, multiple flights were performed over managed landfills in the US, with successful quantification of emissions. The publicly available data from Carbon Mapper as well as not yet published Methane AIR data cover 170 managed landfills with 2202 methane plumes quantifications. Most analyses interpret instantaneous plumes against annual emission rates, assuming the average of the measured flux representative of the yearly emissions. We deliberately avoided this framing, and used reported fluxes in kg CH₄ h⁻¹ normalized by the added amounts of waste only as indicators of the “leak intensity” on a specific year. Operational parameters were extracted from yearly reports under the EPA Greenhouse Gas reporting framework, and the facilities of interest were classified in three aridity levels based on meteorological data.

Our approach allowed us to analyze drivers of change in emissions by taking into account multiple factors. We find that the humidity of a region is one of the main causes for inefficient gas capture in US landfills. We have followed the evolution of the magnitude of CH4 emissions as well as the improvement of the gas collecting infrastructure as a case study from the highest emitting climate category.

In relatively wet climates, gas collection is more difficult because of higher generation and increased soil humidity. We show that collection can improve with more wells, but reaching the efficiency of dryer climates landfills is very challenging. It is also important, as previous studies have shown, to implement gas collection as soon as possible after the disposal of organic waste.

On the global scale, the emissions of large dump sites in lower income countries can be reduced with appropriate gas collection systems, but best results are to achieve in relatively dry climates. The disposal of organic waste in landfills is even more to be avoided in tropical countries with relatively high precipitations. We emphasize that collaboration with local operators to investigate landfill specific parameters such as organic content is of major importance to design the best mitigation strategies, together with the analysis of environmental data.

How to cite: Menoud, M., Abichou, T., Aguilera, M. S., and Warren, J.: Compilation of remote sensing emission estimates of CH4 with environmental parameters and operational practices at US sanitary landfills: what works for mitigation?, EGU General Assembly 2026, Vienna, Austria, 3–8 May 2026, EGU26-14435, https://doi.org/10.5194/egusphere-egu26-14435, 2026.

EGU26-14541 | Posters on site | AS3.17

Challenges with Developing a Measurement-Based Basin Methane Intensity Estimate 

Christopher Moore, Kristian Hajny, Bailey Fosdick, Zachary Weller, Hon Xing Wong, and Abigail Corbett

Methane intensity, the emissions relative to production, has been a focus in recent regulations on fossil fuel imports and domestic production globally, given the climate benefits of methane emission reductions. Methodological frameworks to create annual measurement-based emissions inventory estimates and calculate methane intensity using snapshot measurements have been developed. However, there are still multiple decision points within these frameworks, including several affecting methane intensity calculations, whose impact may be underappreciated. These include uncertainty in the underlying facility population and associated production in purview.

In this work, we discuss the development of a comprehensive measurement-based inventory for the dry gas Haynesville Shale Basin, located in northwest Louisiana and northeast Texas in the United States. The inventory was developed using Bridger Photonics LiDAR data. From a measurement dataset covering 7% of all facilities, we estimate annual basin total emissions of 1,030 [710, 1,530] Gg/year and a methane intensity of 1.13% [0.78%, 1.68%] (95% confidence intervals), in agreement with previous studies in the region. We then show that using different facility population data and applying different basin definitions result in a ~15% and ~75% change in the methane intensity, respectively. As such, this work demonstrates the importance of considering all aspects of the methodology to generate comparable methane intensity estimates.

How to cite: Moore, C., Hajny, K., Fosdick, B., Weller, Z., Wong, H. X., and Corbett, A.: Challenges with Developing a Measurement-Based Basin Methane Intensity Estimate, EGU General Assembly 2026, Vienna, Austria, 3–8 May 2026, EGU26-14541, https://doi.org/10.5194/egusphere-egu26-14541, 2026.

EGU26-14955 | ECS | Posters on site | AS3.17

Colorado Ongoing Basin Emissions: Combining Aerial Survey Data with Distributions from the Literature to Estimate a State-Wide Methane Emission Inventory 

Callan Okenberg, Jenna Brown, Michael Moy, William Daniels, Arthur Santos, Olga Khaliukova, Anna Hodshire, and Dorit Hammerling

Accurate quantification of methane emissions from oil and gas operations is essential for guiding mitigation strategies and informing regulatory policy. In the Colorado Ongoing Basin Emissions (COBE) project, we develop a modeling framework to estimate state‑wide annual methane emissions from the upstream oil and gas sector in Colorado by combining instantaneous emission rate measurements from three aerial vendors with emissions distributions from the literature. Aerial surveys conducted throughout 2024 and 2025 by Bridger Photonics, GHGSat, and Insight M captured snapshot measurements of methane emissions across a representative sample of production sites in Colorado. We construct empirical distributions of instantaneous emission rates using these aerial observations, and supplement them with state-of-the art distributions from the literature (Williams et al., 2024 and Sherwin et al., 2025) to capture the small emissions potentially missed by aerial surveys. These distributions are repeatedly sampled from within a Monte Carlo framework to propagate uncertainty, yielding probabilistic estimates of annual emissions at the state level. Aggregation across all production oil and gas sites in Colorado produces a state‑wide annual methane emissions estimate of approximately 90,000 metric tons, varying slightly depending on the literature distribution used, over three times the bottom-up estimate of state-wide emissions. We have also employed continuous monitoring data from point-in-space networks to inform the low emission rate distribution, but do not include those results due to the limited number of sites encompassed. Future work will involve collecting continuous monitoring data at many more sites across Colorado, allowing us to estimate an entirely measurement-derived inventory.

How to cite: Okenberg, C., Brown, J., Moy, M., Daniels, W., Santos, A., Khaliukova, O., Hodshire, A., and Hammerling, D.: Colorado Ongoing Basin Emissions: Combining Aerial Survey Data with Distributions from the Literature to Estimate a State-Wide Methane Emission Inventory, EGU General Assembly 2026, Vienna, Austria, 3–8 May 2026, EGU26-14955, https://doi.org/10.5194/egusphere-egu26-14955, 2026.

EGU26-15109 | Posters on site | AS3.17

Rigorous Methane Inventories for Oil and Gas facilities based on Continuous Monitoring Systems 

Dorit Hammerling, Troy Sorensen, and William Daniels

Accurate methane emissions inventories for oil and gas facilities are increasingly required to support regulatory reporting, voluntary frameworks, and international natural gas trade. Onsite continuous monitoring systems (CMS) provide time-resolved methane concentration measurements, making them a promising avenue for inventory development. To infer emissions from the concentration measurements, however, requires a careful inversion framework considering near-field turbulence and short-term wind conditions. Specifically, it is crucial to be aware of time periods when wind conditions and sensor placement are such that potential emissions are not observable, which we refer to as periods of no information. We present a general framework for constructing measurement-derived methane emissions inventories using CMS data alone, without reliance on bottom-up emission factors or operational estimates. The framework explicitly accounts for no-information periods and provides fully transparent rigorous uncertainty quantification that propagates both inference uncertainty and imputation uncertainty into methane emission inventory estimates. We validate the approach using controlled-release experiments and demonstrate case studies from multiple production sites.

How to cite: Hammerling, D., Sorensen, T., and Daniels, W.: Rigorous Methane Inventories for Oil and Gas facilities based on Continuous Monitoring Systems, EGU General Assembly 2026, Vienna, Austria, 3–8 May 2026, EGU26-15109, https://doi.org/10.5194/egusphere-egu26-15109, 2026.

EGU26-15164 | ECS | Orals | AS3.17

Methane Emissions and Regulatory Stringency: A Case Study Across Canadian Provinces 

Shona Wilde, David Tyner, and Matthew Johnson

Canada enacted its first federal methane regulations for the oil and gas sector in 2020; however, these federal regulations were ultimately implemented as separate provincial regulations that were each negotiated under federal-provincial regulatory equivalency agreements.  This has resulted in significant variation in regulatory stringency, enforcement practices, and approaches to methane mitigation.  These differences present a unique opportunity to examine the direct impact of different regulations on methane emissions in adjacent regions, with otherwise similar production characteristics and operators.

In this work we utilize aerial survey data collected using Bridger Photonics’ Gas Mapping LiDAR to compare methane emissions across jurisdictions operating under different regulatory frameworks. First, we examine emissions in the Lloydminster heavy oil production region that straddles the Alberta–Saskatchewan provincial border.  Higher allowable venting limits means Saskatchewan’s regulatory framework is substantially weaker than Alberta’s. This directly correlates with a near doubling of methane emissions intensities among comparable production facilities with similar infrastructure.  Moreover, for six producers with multiple assets on both sides of the border, five had higher methane intensities in Saskatchewan.  These real-world data highlight the critical importance of regulations in driving mitigation, while simultaneously highlighting the limits of voluntary action.

A further case study examines the Peace River region in Alberta, in which a small sub-region was subjected to stricter regulations (Alberta Directive 084), introduced in response to odour complaints, while immediately adjacent regions were not.  These regulations effectively prohibit routine venting and, despite not explicitly targeting methane, resulted in substantially lower measured methane emissions among facilities within the Directive 084 zone than among similar facilities outside the zone.  Interestingly, these stricter regulations further correlate not only with reductions in occurrence rates of venting tanks but also in a reduction of unlit flares.  Overall, these empirical observations demonstrate that producers in both Alberta and Saskatchewan can and do achieve measurably greater methane reductions but are unlikely to do so without a clear regulatory requirement. 

How to cite: Wilde, S., Tyner, D., and Johnson, M.: Methane Emissions and Regulatory Stringency: A Case Study Across Canadian Provinces, EGU General Assembly 2026, Vienna, Austria, 3–8 May 2026, EGU26-15164, https://doi.org/10.5194/egusphere-egu26-15164, 2026.

Methane emissions reductions in the oil and gas industry is one of the best readily attainable goals to meeting the global emission reduction targets to combatting climate change.  However, real and perceived mitigation costs are often a major barrier to implementing strong regulations.  This work analyzes technically and economically achievable mitigation potential on a source- and site-specific basis at upstream oil and gas sites.  In contrast to previous analyses, this work considers actual measured sources and sources distributions from recent aerial surveys.  Using data for the province of Alberta, Canada as a case study, methane source mitigation via vapour recovery units, vapour combustors, flares, and on-site power generation are considered where applicable to identified sources.  Engineering cost models for each source are first created combining available manufacturer data with previous literature estimates.  Two main scenarios are considered in line with newly released federal methane regulations from Environment and Climate Change Canada (ECCC).  The first scenario estimates costs for eliminating all intentional venting sources, while the second scenario estimates costs to and combined mitigation strategies to reduce the simple site-specific methane intensity to below 0.1%.  The ultimate goal of this work is to assess achievable near-term mitigation potential in the upstream oil and sector in Canada.

How to cite: Killeen, E., Tyner, D., and Johnson, M.: A techno-economic analysis of methane mitigation potential in the upstream oil and gas sector:  A case study using aerially-measured source data in Alberta, Canada, EGU General Assembly 2026, Vienna, Austria, 3–8 May 2026, EGU26-15317, https://doi.org/10.5194/egusphere-egu26-15317, 2026.

EGU26-15376 | Orals | AS3.17

Colombia’s First National Measurement-Based Oil and Gas Inventory 

Nikolai Calderon-Cangrejo, Simon A. Festa-Bianchet, Shona E. Wilde, Bradley M. Conrad, David R. Tyner, Sia Veeramani, and Matthew R. Johnson

As part of the United Nations Environment Programme International Methane Emissions Observatory (UNEP IMEO)’s Science Studies, during 2024 and 2025 the Energy and Emissions Research Lab (EERL) at Carleton University conducted a comprehensive, multi-scale field measurement campaign to quantify methane emissions from upstream oil and gas facilities across Colombia’s major production basins.  This pioneering campaign, one of the first of its kind in the Global South, employed a hybrid measurement framework combining top-down and bottom-up measurement techniques.  The top-down measurements included aerial gas mapping LiDAR (GML) surveys of approximately 3800 facilities, and site-level scans using uncrewed aerial vehicles (UAVs).  Bottom-up measurements involved fugitive emissions screening via optical gas imaging (OGI) and direct on-site measurements of major emission sources, including compressors, flares, and storage tanks.  Finally, operator-level bottom-up emissions data emissions were also considered.  From analysis of these data, this presentation will share a first measurement-based methane inventory for Colombia’s upstream oil and gas sector.  Results provide source-level insights into future mitigation opportunities and demonstrate the role of international collaboration in enabling transparent, science-driven quantification of climate-critical emissions.

How to cite: Calderon-Cangrejo, N., Festa-Bianchet, S. A., Wilde, S. E., Conrad, B. M., Tyner, D. R., Veeramani, S., and Johnson, M. R.: Colombia’s First National Measurement-Based Oil and Gas Inventory, EGU General Assembly 2026, Vienna, Austria, 3–8 May 2026, EGU26-15376, https://doi.org/10.5194/egusphere-egu26-15376, 2026.

EGU26-15901 | Orals | AS3.17

Methane and nitrous oxide emission from garden waste composting facilities – emission factors and mitigation potential 

Charlotte Scheutz, Louise Anne Klotz, and Anders Fredenslund

Bio-waste composting is environmentally favourable to landfilling; however, this practice has been shown to emit methane (CH4) and nitrous oxide (N2O), both of which contribute to climate change. Measurement-based studies are necessary to quantify these emissions accurately, revise emission factors, define composting best practices and monitor mitigation strategies. This study investigated CH4 and N2O emissions, as well as associated parameters (i.e., gas composition, temperature, material age and composition), at garden waste windrow composting facilities in Denmark. We report measured CH4 andN2O emissions and emissions factors at 11 full-scale composting facilities and one farm in Denmark. In addition, gas concentrations and temperatures were measured inside material piles present, including windrows and stored mounds of untreated garden waste, biofuel and compost products. Methane and N2O fluxes on the surface of the windrows and material piles were measured using flux chambers. Total facility emissions were quantified using a tracer gas-based method. Finally, large scale experimental studies were performed to investigate if CH4 and N2O emissions and CO2 emissions from energy consumption could be reduced from composting facilities by improvement in operating conditions such as reducing windrow size, increase turning frequency, implement active aeration and pre-treatment of the garden waste. The outcomes include the establishment of a revised national emission baseline for current composting practices in Denmark; an improvement in the robustness and representativeness of emission factors, thereby enabling an update of the values applied in the Danish National Inventory Report (NIR); and the development of evidence‑based best‑practice recommendations for composting, directed at the Danish Environmental Protection Agency, municipal authorities, and the waste management sector. Collectively, these outputs are anticipated to support forthcoming revisions of the national composting guidelines and to strengthen the scientific foundation for emissions reporting and regulatory decision‑making.

How to cite: Scheutz, C., Klotz, L. A., and Fredenslund, A.: Methane and nitrous oxide emission from garden waste composting facilities – emission factors and mitigation potential, EGU General Assembly 2026, Vienna, Austria, 3–8 May 2026, EGU26-15901, https://doi.org/10.5194/egusphere-egu26-15901, 2026.

EGU26-15950 | Posters on site | AS3.17

Towards a high-granularity methane emissions inventory for Colombia – First in situ measurements of solid waste landfills and wastewater treatment plants emissions 

Rodrigo Jimenez, Andres V. Ardila, Luis A. Morales-Rincon, Angela C. Vargas-Burbano, James Lawrence France, Nataly Velandia, Marci Rose Baranski, Andreea Calcan, and Tarek Abichou

Methane’s comparatively short atmospheric lifetime and low mitigation costs compared to other greenhouse gases enhance its potential for near-term climate action. Both mitigation accounting and climate science require accurate emission inventories. Most emission factors and model parameters have been derived from measurements in and at the conditions of developed countries. On the contrary, Global South methane emission measurements are scarce and usually unsystematic. As a result, large discrepancies exist among global databases and with national inventories, e.g., -60% to +180% in the case of Colombia. Under the coordination and support of UNEP’s International Methane Emissions Observatory (IMEO), a multi-sector observation-based baseline inventory is currently being developed for Colombia, involving multiple research groups and measurement platforms and methodologies. Methane emissions from solid waste landfills (SWLF) are the fastest growing in Colombia. We will present preliminary results from an ongoing SWLF and wastewater treatment plant (WWTP) emission measurement campaign (MET-CO). To build accurate observational inventories, we applied a “mixed approach”, which involves measuring the larger-emission SWLFs and WWTPs to about half of the total emissions along with a set of smaller emission facilities that properly map the emission controlling variables. MET-CO includes sniffing with a drone for diffuse emission mapping, flux chamber and channeled biogas mass flow measurements. Carleton University’s Energy & Emissions Research Lab (EERL) will conduct high precision drone-borne measurements for facility and sub-facility wide top-down emission estimation. Chamber-measured methane fluxes of SWLF cells closed over 10 years ago have been very small, from -1.3 (very small sink) to +2.3 mg CH4 m-2 day-1, while a recently covered cell showed very high emissions, +153.5 g CH4 m-2 day-1. Methane enhancements have ranged from ~0.1 to ~17 ppmv in SWLFs, and from ~0.1 to ~600 ppmv in WWTPs, with the larger near sources and enclosed operations. Additional results and a synthesis will be present.

How to cite: Jimenez, R., Ardila, A. V., Morales-Rincon, L. A., Vargas-Burbano, A. C., France, J. L., Velandia, N., Baranski, M. R., Calcan, A., and Abichou, T.: Towards a high-granularity methane emissions inventory for Colombia – First in situ measurements of solid waste landfills and wastewater treatment plants emissions, EGU General Assembly 2026, Vienna, Austria, 3–8 May 2026, EGU26-15950, https://doi.org/10.5194/egusphere-egu26-15950, 2026.

EGU26-16082 | ECS | Posters on site | AS3.17

Trends in Seasonal Variability of Global Methane Budget constrained by GOSAT observations 

Sang-Ik Oh, Rokjin J. Park, Sang-Woo Kim, and Robert J. Parker

Seasonal variability of atmospheric methane (CH4) is governed by the seasonal cycle of surface emissions and the abundance of the tropospheric hydroxyl radical (OH). As substantial uncertainties remain in the variability of both sources and sinks, we constrain monthly emissions and tropospheric OH using the GEOS-Chem chemistry transport model and 14 years of GOSAT XCH4 observations. The seasonal cycle amplitude (SCA) of posterior global methane emissions shows an increasing trend of 4.23 Tg a-1 a-1, substantially larger than the prior estimate of 1.52 Tg a-1 a-1. Boreal wetlands in North America and Siberia dominate this amplification, accounting for 30% and 27% of the global SCA trend, respectively, with additional contributions from tropical wetland regions in central Africa and the Bengal region. Interannual variability (IAV) in tropospheric OH also plays a compensatory role by modulating the methane sink. While OH IAV amplifies the sink SCA trend in the northern midlatitudes, it dampens the trend over the tropics (–0.47 Tg a-1 a-1) through declining posterior tropical OH. Sensitivity tests are performed to attribute the observed XCH4 SCA trends to emissions and tropospheric OH across latitude bands. In the northern hemisphere midlatitudes, the posterior XCH4 SCA trend is 0.41 Tg a-1 a-1 predominantly driven by increasing emission SCA. In contrast, the tropics exhibit a larger XCH4 SCA trend of 0.81 Tg a-1 a-1, where tropical emissions act to suppress the XCH4 SCA trend. This SCA trend analysis improves our understanding of recent methane dynamics and provides information for projecting future atmospheric methane concentrations.

How to cite: Oh, S.-I., Park, R. J., Kim, S.-W., and Parker, R. J.: Trends in Seasonal Variability of Global Methane Budget constrained by GOSAT observations, EGU General Assembly 2026, Vienna, Austria, 3–8 May 2026, EGU26-16082, https://doi.org/10.5194/egusphere-egu26-16082, 2026.

EGU26-16182 | ECS | Orals | AS3.17

Bayesian inversion methods for quantifying diffuse methane emissions with open-path laser measurements: Enabling landscape-scale tracking of distributed sources  

Elijah Miller, Sean Coburn, Kevin Rozmiarek, Caroline Alden, Tyler Jones, Daven Henze, and Greg Rieker

Quantifying methane emissions from distributed, non-point sources remains a critical barrier to effective mitigation in the waste, agriculture, and natural systems sectors. Unlike oil and gas infrastructure that produces well-defined plumes from point sources at the local scale, emissions from landfills, wetlands, and agricultural operations are often diffuse, cover large spatial extents (100s–1000s m2), and produce weaker local enhancements. Despite potential difficulties in quantification, these sources remain globally significant contributors to the methane budget and require accurate characterization for effective mitigation. The next generation of emissions quantification requires new measurement approaches specifically designed for distributed sources.  

We present a Bayesian inversion framework designed to quantify distributed, area-source fluxes from open-path laser spectroscopy concentration measurements. This method simultaneously retrieves spatially-resolved surface fluxes and time-varying background concentrations. We eliminate the common practice of discarding measurements when unenhanced background concentrations are unavailable by relaxing the constraint of requiring explicit background subtraction or favorable wind conditions. This approach enables quantification in systems characterized by networks of diffuse and nearby sources. By accumulating observations over extended periods (hours to weeks), the method achieves sensitivity to weak signals below traditional detection thresholds while providing detailed uncertainty diagnostics through the Bayesian framework. These diagnostics inform how well our measurements constrain inferred emission rates, providing actionable guidance for observing system design and establishing emission detection thresholds. 

We demonstrate these methods with continuous multi-month observations at an active municipal solid waste landfill, revealing linkages between operational activities and emission patterns. Combining new inversion methods with open-path laser measurements enables reliable mitigation tracking in the distributed-source sectors where closing the gap between atmospheric observations and inventory estimates is most critical. 

How to cite: Miller, E., Coburn, S., Rozmiarek, K., Alden, C., Jones, T., Henze, D., and Rieker, G.: Bayesian inversion methods for quantifying diffuse methane emissions with open-path laser measurements: Enabling landscape-scale tracking of distributed sources , EGU General Assembly 2026, Vienna, Austria, 3–8 May 2026, EGU26-16182, https://doi.org/10.5194/egusphere-egu26-16182, 2026.

EGU26-16573 | Posters on site | AS3.17

Towards Correction-Free Open-Path Eddy Covariance Methane Flux Measurements 

Weihao Shen, Da Pan, Kai Wang, Ting-Jung Lin, Junhui Zeng, Zhimei Liu, and Yin Wang

Ecologically critical regions such as wetlands, coastal beaches, and high-latitude ecosystems play a indispensable role in the global methane (CH₄) budget. However, limited power availability in these environments constrains long-term CH₄ flux observations. As a result, methane eddy covariance (EC) measurements increasingly rely on low-power consumption, highly integrated open-path analyzers. Unlike closed-path systems that measure dry mixing ratios, open-path sensors measure gas density, making EC flux calculations susceptible to spectroscopic effects and density perturbations induced by fluctuations in air temperature and humidity. These effects necessitate complex post-processing corrections and substantially complicate uncertainty quantification.

Here we present a novel open-path CH₄/H₂O analyzer (HT8600P, HealthyPhoton Co., Ltd.) together with a minimally corrective flux calculation framework. Through an innovative instrument design, we establish a pseudo dry mixing ratio formulation that enables point-by-point conversion from density to mixing ratio without relying on spatially separated temperature or water vapor measurements. This allows EC fluxes to be calculated in a manner analogous to closed-path systems, while preserving the logistical advantages of open-path deployment.

Dedicated field experiments, including a zero-flux test, demonstrate that the proposed approach yields near-zero methane fluxes with a random error of 0.057 mg m⁻² h⁻¹. The magnitude of required corrections is an order of magnitude smaller than that of a co-located commercial open-path analyzer. We further identify a “phantom” random error inherent to conventional density-based EC methods, whereby temperature- and humidity-driven fluctuations are misinterpreted as turbulent variance, leading to substantial overestimation of random uncertainty. By removing these artifacts at the signal level, the pseudo dry mixing ratio method reduces apparent random errors by 60–70%, producing uncertainty estimates consistent with the empirically determined noise floor.

Together, the HT8600P analyzer and the optimized pseudo dry mixing ratio EC framework provide a correction-light, noise-resilient solution for expanding long-term CH₄ flux observations in remote regions critical to the global methane budget.

How to cite: Shen, W., Pan, D., Wang, K., Lin, T.-J., Zeng, J., Liu, Z., and Wang, Y.: Towards Correction-Free Open-Path Eddy Covariance Methane Flux Measurements, EGU General Assembly 2026, Vienna, Austria, 3–8 May 2026, EGU26-16573, https://doi.org/10.5194/egusphere-egu26-16573, 2026.

EGU26-16964 | Posters on site | AS3.17

Integrated Estimation of Coal Mine Methane Emissions in China Using Satellite, Surface, and Underground Observations 

Kai Qin, Hu Wei, Zheng Bo, Ding Chenjun, Tang Xun, and Jason Cohen

Coal mining represents a predominant source of anthropogenic methane emissions, with China’s approximately 4,000 active mines driving a significant portion of global output from this sector. Accurately quantifying these emissions is therefore critical both for global climate mitigation and for informing targeted environmental governance in China’s key coal-producing regions.

In China, underground gas monitoring systems have long been deployed in coal mines for safety purposes, providing valuable baseline data for emission accounting. However, monitoring capabilities vary widely across mines: most track only ventilation systems, while a smaller number also collect data from gas extraction stations. Additionally, while some mines maintain long-term continuous monitoring records, others can supply data for only a few months. As a result, existing underground observations do not fully or consistently reflect the overall methane emissions from China’s coal mining sector.

Satellite observations offer an emerging technological approach for monitoring coal mine methane emissions. Instruments such as S5P/TROPOMI have been preliminarily applied to quantify emissions in coal-intensive regions of China, while point-source satellites like GF5, EMIT, and PRISMA have successfully identified distinct methane plumes from so-called “super-emitter” mines. Nevertheless, limitations in spatial resolution (e.g., from S5P/TROPOMI) and spectral resolution (from point-source satellites) constrain the ability of current satellite technology to support policy-relevant and management-level monitoring. To overcome these constraints, satellite-based retrievals must be integrated with and calibrated by underground and ground-based observational data.

Embracing a Satellite-Surface-Underground synergy research framework, the "Remote Sensing of Carbon Emissions and Air Quality" team at China University of Mining and Technology has conducted field observational experiments at over ten coal mines across China. These efforts have improved existing remote sensing methods for methane emissions. The team has developed China’s most comprehensive, manually verified geographic information database of coal mine emission facilities to date and established a high-resolution methane emission database for the coal mining industry in typical regions. This report will systematically present the team’s latest research progress in the aforementioned areas and outline plans for future work.

How to cite: Qin, K., Wei, H., Bo, Z., Chenjun, D., Xun, T., and Cohen, J.: Integrated Estimation of Coal Mine Methane Emissions in China Using Satellite, Surface, and Underground Observations, EGU General Assembly 2026, Vienna, Austria, 3–8 May 2026, EGU26-16964, https://doi.org/10.5194/egusphere-egu26-16964, 2026.

EGU26-17023 | ECS | Posters on site | AS3.17

Characterisation of the regional source mix of methane at different locations in Europe using continuous isotope ratio measurements of d2H and d13C 

Jacoline van Es, Carina van der Veen, Malika Menoud, Stephan Henne, Giorgo Cover, Juan Bettinelli, Jia Chen, Mihaly Molnar, Balázs Áron Baráth, Tamas Varga, Laszlo Haszpra, Paolo Cristofanelli, Simonetta Montaguti, Francesco D’Amico, Ivano Ammoscato, and Thomas Röckmann

Methane (CH4) is a potent greenhouse gas with a global warming potential of about 84 over a 20-year timescale, and an atmospheric lifetime of about 9 years. The increase in CH4 emissions has contributed about 0.6°C to the observed global warming since pre-industrial times. The ongoing increase in atmospheric CH4 undermines efforts to mitigate climate change. To effectively mitigate CH4, it is essential to understand the location, strength and temporal variability of its most important sources, which vary in different regions. A widely used method to distinguish emissions from different source categories is the measurement of CH4 isotopic composition. Such measurements provide additional insight because different CH4 production processes emit CH4 with different isotopic composition.

Traditionally, CH4 isotope measurements have been carried out on atmospheric air samples under controlled laboratory conditions, but since a few years, instruments measuring isotopic composition continuously at monitoring stations have become available. An important application of continuous isotopic CH4 measurements is the evaluation of regional scale emissions with respect to the existing emission inventories. In model simulations using emissions from these inventories, the relative contributions of different source categories to observed enhancements can be calculated. This information can be used to simulate time series of the isotopic composition. By comparing these simulations with observed isotopic data, we can not only assess whether total emissions in a model are over- or underestimated, but also identify which source categories are responsible for any discrepancies.

The mobile isotope ratio mass spectrometry system developed at Utrecht University has been deployed at more than 10 different locations in Europe over the past decade, in most cases for approximately 7 months. The recorded 20-min resolution and high precision isotope data of both d13C and d2H provide empirical constraints to the CH4 source mix at the different locations. The combination with high resolution model simulations has provided many new insights into regional scale emissions. We present an overview of key findings and discuss the value of high resolution isotope measurements for improving our understanding of the regional budgets of this important greenhouse gas. 

How to cite: van Es, J., van der Veen, C., Menoud, M., Henne, S., Cover, G., Bettinelli, J., Chen, J., Molnar, M., Áron Baráth, B., Varga, T., Haszpra, L., Cristofanelli, P., Montaguti, S., D’Amico, F., Ammoscato, I., and Röckmann, T.: Characterisation of the regional source mix of methane at different locations in Europe using continuous isotope ratio measurements of d2H and d13C, EGU General Assembly 2026, Vienna, Austria, 3–8 May 2026, EGU26-17023, https://doi.org/10.5194/egusphere-egu26-17023, 2026.

EGU26-18281 | Orals | AS3.17

Repository of Empirical Methane Emissions for Data Integration (REMEDI) 

Maciej Bartosiewicz, Alexander Bradley, Gwendolyn Dane, Ogochukwu Ikegwuonu, Irina Petrova, Foteini Stavropolou, Bristol Powel, and Stefan Schwietzke

An increasing amount of empirical methane data is being published, drawing on a variety of measurement platforms. However, efforts to track global methane emissions are hampered by fragmentation and scale inconsistency in these diverse data streams. Integrating empirical data across scales and sensor technologies is essential to reveal an accurate picture of emissions, support effective mitigation, monitor progress and drive accountability across anthropogenic activities. Methane data processing consists of compiling and standardizing fragmented measurements collected worldwide. To-date, no  comprehensive methane data repository exists. To address this challenge, UNEP’s International Methane Emissions Observatory (IMEO) is developing a new Repository of Empirical Methane Emissions for Data Integration (hereafter REMEDI), a dedicated database designed as a one-stop-shop for using and exchanging empirical, science-grade methane emissions measurements.

REMEDI is a geospatially referenced repository that compiles methane emission data derived from a variety of scientific activities, such as satellite remote sensing, aerial surveys, ground-based measurements, and mobile campaigns globally. The system accommodates diverse data types spanning multiple spatial scales—from facility-level point sources to basin-scale flux estimates—while preserving metadata necessary for uncertainty characterization, temporal attribution, and methodological traceability. Data ingested into REMEDI undergo pre-screening by IMEO to ensure that all data fit pre-defined eligibility criteria.

While containing only methane emission flux rates based on empirical measurements at site level and beyond (e.g., basin or country level), REMEDI does not consider data from super-emitters thus is complementary to IMEO’s flagship Methane Alert and Response System (MARS) where satellite imagery is used to pinpoint highly emissive sources. The first version of REMEDI, focusing on peer-reviewed data, is available through UNEP’s Eye on Methane platform and aims to support the future of methane data integration products. By filtering empirical measurements according to locations and source types among others, this new repository provides a standardized data backbone and enables users to comparatively mine diverse input streams. This presentation will describe REMEDI’s data architecture, ingestion and review processes, an overview of its content, and potential applications.


How to cite: Bartosiewicz, M., Bradley, A., Dane, G., Ikegwuonu, O., Petrova, I., Stavropolou, F., Powel, B., and Schwietzke, S.: Repository of Empirical Methane Emissions for Data Integration (REMEDI), EGU General Assembly 2026, Vienna, Austria, 3–8 May 2026, EGU26-18281, https://doi.org/10.5194/egusphere-egu26-18281, 2026.

EGU26-18423 | ECS | Posters on site | AS3.17

Assessing OGMP 2.0-reported asset-level methane emissions using independent atmospheric measurements: a pilot study in the Greater Green River Basin 

Foteini Stavropoulou, Alba Lorente, Mark Omara, Howard R. Dieter, Irina Yu. Petrova, and Stefan Schwietzke

The Oil and Gas Methane Partnership 2.0 (OGMP 2.0) is the United Nations Environment Programme’s (UNEP) comprehensive, measurement-based international framework for reporting and reducing methane emissions from the oil and gas sector under the International Methane Emissions Observatory (IMEO). To date, more than 150 companies with assets in over 90 countries have joined OGMP 2.0, aiming to increase their understanding of methane emissions and improve both measurement and reporting practices, with the ultimate goal of reducing emissions.

The objective of the OGMP 2.0 Independent Data Assessment (IDA) project is to provide an additional measurement-based layer of verification that strengthens the credibility and confidence in the asset-level methane emissions reported by OGMP 2.0 member companies. By integrating the best available empirical data, such as satellite observations and aerial surveys, this project enables the validation of reported emissions and helps identify potential inconsistencies between supplementary regional measurements and OGMP 2.0 reported values based on source- and site-level measurements aggregated to the scale of an oil and gas asset (OGMP 2.0 Level 5 – the highest reporting level). 

Here we present the results of the first OGMP 2.0 IDA pilot, which incorporates regional emission quantifications based on aerial remote sensing data collected during a MethaneAIR campaign to reconcile with OGMP 2.0 Level 5 reported emissions at a spatially isolated asset in the Greater Green River Basin (Wyoming, United States) operated by Jonah Energy. The analysis is further supported by independent regional emission estimates from in-situ aircraft mass balance measurements conducted by ChampionX and commissioned by Jonah Energy as part of an internal effort to verify their OGMP 2.0 Level 5 facility-level measurements. The analysis presented here aims to reconcile these two regional quantification approaches with the operator-reported Level 5 emission estimates. It further assesses the potential of the OGMP 2.0 IDA approach to reconcile empirically-based asset-level emissions reporting data with state-of-the-art regional-level measurements for other oil and gas assets and regions in the world.

How to cite: Stavropoulou, F., Lorente, A., Omara, M., Dieter, H. R., Petrova, I. Yu., and Schwietzke, S.: Assessing OGMP 2.0-reported asset-level methane emissions using independent atmospheric measurements: a pilot study in the Greater Green River Basin, EGU General Assembly 2026, Vienna, Austria, 3–8 May 2026, EGU26-18423, https://doi.org/10.5194/egusphere-egu26-18423, 2026.

EGU26-18903 | ECS | Orals | AS3.17

Machine learning-based emission rate estimates of global methane super-emissions 

Clayton Roberts, Joannes D. Maasakkers, Tobias A. de Jong, Berend J. Schuit, Matthieu Dogniaux, Shubham Sharma, Theo Huegens, Sander Houweling, and Ilse Aben

The TROPOspheric Monitoring Instrument (TROPOMI) on board the Sentinel 5-Precursor satellite provides daily global observations of atmospheric methane, enabling the detection of super-emitters that are often missing or highly underestimated in bottom-up inventories. The emission rates of these super-emitters are typically quantified using mass balance-based approaches which have large associated uncertainties. Here, we train a convolutional neural network using simulated TROPOMI methane observations and meteorological reanalysis data in order to create ML-SPERE, a machine learning (ML)-based methodology for estimating the emission rates of super-emitter methane plumes observed by TROPOMI. We show that ML-SPERE outperforms the Integrated Mass Enhancement (IME) method on simulated TROPOMI methane plumes and under ideal observation conditions (where the plume head is visible) can achieve a reduction in median absolute percentage error from 42% to 24%. Additionally, our ML-SPERE quantifications for synthetic plumes are unbiased across wind speeds, whereas the IME estimates are systematically biased low at low wind speeds (a regime in which most TROPOMI methane super-emitting plumes are detected). Moving beyond synthetic data to real world application (where ground truth emission rates are not known), we apply ML-SPERE to TROPOMI methane observations of a 200-day well blowout in Kazakhstan and find agreement with TROPOMI-based IME estimates within uncertainties, a smaller offset relative to inverse modeling results than exhibited by TROPOMI IME estimates, and improved consistency with IME estimates derived from high-resolution point-source imagers.  We additionally quantify a year's worth of TROPOMI detections of methane super-emitters around the globe, and find generally good agreement with IME quantifications. Global trends in estimated methane emissions via ML-SPERE and the IME method for this dataset are largely consistent, with exceptions in northern Russia, the Congo basin, and southwestern Australia. We also find evidence to suggest that IME emission rate estimates for this dataset are negatively biased at low wind speeds, and that ML-SPERE estimates may be unbiased, as seen in our simulation studies. While our experiments with simulated plumes demonstrate that ML-SPERE more accurately recovers emission rates than the IME method, agreement between the methods for real-world plumes (where no ground truth exists) provides confidence in the robustness of both approaches. Although quantifications remain largely constrained by uncertainties in wind fields (as with the IME method), ML-SPERE provides a valuable addition to the suite of quantification methods available for TROPOMI methane plume observations, owing to its computational efficiency, improved accuracy over the IME method, and reduced sensitivity to wind-related biases.

How to cite: Roberts, C., Maasakkers, J. D., de Jong, T. A., Schuit, B. J., Dogniaux, M., Sharma, S., Huegens, T., Houweling, S., and Aben, I.: Machine learning-based emission rate estimates of global methane super-emissions, EGU General Assembly 2026, Vienna, Austria, 3–8 May 2026, EGU26-18903, https://doi.org/10.5194/egusphere-egu26-18903, 2026.

EGU26-19292 | Posters on site | AS3.17

Verifying and improving methane emission inventory data using atmospheric measurements in the Netherlands (IMEO-VIME-NL) 

Katharina Heimerl, Guus J.M. Velders, Thomas Röckmann, Hannes Witt, Margreet van Zanten, Hugo Denier van der Gon, Ingrid Super, Sander Houweling, Arjan Hensen, Ilona Velzeboer, Pim van den Bulk, Ronald Hutjes, Huilin Chen, and Steven van Heuven

Methane is an important greenhouse gas that contributes to about 12% to Dutch greenhouse gas emissions. In previous studies, top-down modelling and satellite inversions have indicated that methane emissions in the Netherlands as represented in bottom-up inventories might be underestimated. The IMEO-VIME-NL project aims to make use of the abundant data sets of methane measurements in the Netherlands to compile a national measurement-based methane emission baseline.

A compilation of available measurement data shows that not all sectors are covered equally. While sectors like peatlands and wastewater treatment plants were frequently targeted by measurements, other sectors, like biodigesters and domestic combustion, are lacking measurement data. Sometimes data are mainly concentrated on a subsector, e.g. most measurement data for the agriculture sector, the main contributor to Dutch methane emissions, focus on dairy farms. This data set collection is then used for upscaling to national total emissions.

An important outcome of the project is a compilation of upscaling methods that could potentially be transferred to other countries. Sensitivity studies are employed to test different data coverages and different activity data when upscaling to national total emissions. For wastewater treatment plant emissions, two different types of activity data are readily available, inhabitants and water usage. Using these activity data for estimating emissions results in similar emission estimates that are higher than the inventory emission. In a similar way, methane emission measurements and available activity data for other sectors are compiled together and upscaled to a measurement-based national methane emission baseline.

How to cite: Heimerl, K., Velders, G. J. M., Röckmann, T., Witt, H., van Zanten, M., Denier van der Gon, H., Super, I., Houweling, S., Hensen, A., Velzeboer, I., van den Bulk, P., Hutjes, R., Chen, H., and van Heuven, S.: Verifying and improving methane emission inventory data using atmospheric measurements in the Netherlands (IMEO-VIME-NL), EGU General Assembly 2026, Vienna, Austria, 3–8 May 2026, EGU26-19292, https://doi.org/10.5194/egusphere-egu26-19292, 2026.

EGU26-19379 * | ECS | Orals | AS3.17 | Highlight

Three years of UNEP’s Methane Alert and Response System: achievements, lessons learned, and next steps 

Itziar Irakulis-Loitxate, Meghan Demeter, Manuel Montesino-San Martín, Alma Raunak, Carol Castañeda Martínez, Gonzalo Mateo-García, Giulia Bonazzi, Juan Emmanuel Johnson, Tharwat Mokalled, Florencia Carreras, Hussameddiin Inbeess, Queen Safari, Konstantin Kosumov, Christoph Karnetzky, and James East

Three years have passed since the United Nations Environment Programme’s International Methane Emissions Observatory (IMEO) launched the Methane Alert and Response System (MARS), with one year in a pilot phase (2023) and two years now in nominal operations (2024–present). MARS leverages the capabilities of more than a dozen methane-sensitive satellites to detect emissions worldwide and to drive mitigation actions. Since its launch, MARS has focused on the rapid detection and notification (within 15 days from the observation date) of oil and gas point-source methane emissions. This has resulted in the notification of more than 5,600 plumes from over 1,500 oil and gas point sources across 34 countries, as well as feedback on the cause and current status of emissions from operators and governments for more than 170 sources in 18 countries and the effective mitigation of nearly 25 sources.

While the number of mitigated sources may appear low compared to the number of notifications, feedback received to date from governments and companies indicates that most detected plumes are linked to permitted, short-duration operational events, including planned activities and emergency releases. Other cases involve temporary mitigation measures that do not ensure long-term emission prevention, or mitigation actions requiring substantial economic and logistical efforts, with implementation timelines of several months to years; therefore, they cannot yet be classified as fully mitigated.

In the meantime, engagement with notified countries has increased significantly, with a growing number of formal responses received. This has led to an increasing number of confirmed mitigation cases and is enabling more robust and representative statistics on emission sources, causes, and mitigation status.

In parallel, MARS has also detected and monitored a large number of emissions from the coal, waste, and other sectors over the years, building a multi-sectoral data set with more than 20,000 plumes. Recognizing that mitigation in these other sectors is equally critical, and that satellite data can be a powerful tool to support action, MARS will start notifying emissions in the coal and waste sectors in 2026, adopting different notification approaches depending on the nature and mitigation potential of the source.

In this presentation, we will provide an update on the current status of MARS, highlighting key results and conclusions, as well as lessons learned to date. We will also provide an overview of upcoming measures and new products to be introduced as part of MARS' expansion.

How to cite: Irakulis-Loitxate, I., Demeter, M., Montesino-San Martín, M., Raunak, A., Castañeda Martínez, C., Mateo-García, G., Bonazzi, G., Johnson, J. E., Mokalled, T., Carreras, F., Inbeess, H., Safari, Q., Kosumov, K., Karnetzky, C., and East, J.: Three years of UNEP’s Methane Alert and Response System: achievements, lessons learned, and next steps, EGU General Assembly 2026, Vienna, Austria, 3–8 May 2026, EGU26-19379, https://doi.org/10.5194/egusphere-egu26-19379, 2026.

EGU26-19629 | ECS | Orals | AS3.17

Quantifying methane emissions from metallurgical coal production at mine-level using empirical measurements in a Bayesian inference framework 

Alexander Bradley, Kushal Tibrewal, Carol Castañeda, Itziar Irakulis-Loitxate, Maciej Bartosiewicz, Robert Field, Malgorzata Kasprzak, Lisette van Niekerk, and Stefan Schwietzke

While thermal coal is being phased out, metallurgical coal is likely to remain essential for steel production for several more decades. Reducing the climate impact of ongoing coal mining requires accurate quantification and mitigation of methane emissions. Reliable emission estimates are crucial for designing effective mitigation strategies and for reporting under frameworks such as the UNFCCC and the Global Methane Pledge.

 Traditional approaches to estimating coal mine methane emissions rely on generalized models, such as Langmuir isotherms, which consider only coal rank and mine depth. These first-order approximations fail to capture the considerable variability in emissions across individual mines, mining methods, production regimes, and operational practices such as ventilation and methane drainage. Recent advances in satellite remote sensing now allow for inversion-based measurement of methane emissions at the scale of individual ventilation shafts and drainage stations. The International Methane Emissions Observatory (IMEO) Steel Methane Programme (SMP) leverages these observations by integrating satellite measurements with aircraft campaigns, published studies, and a comprehensive bottom-up inventory. The SMP applies a Bayesian inference framework to effectively integrate incomplete and heterogeneous data, delivering the first empirically grounded global dataset of methane emission estimates from metallurgical coal mines. Supported by a transparent deterministic methodology, the SMP framework will produce a publicly accessible database of coal mine methane emissions, alongside IMEO’s best estimate of annual mine-level emissions. By providing a transparent, empirically grounded framework, this work also establishes a scalable approach that can be applied to thermal coal production and integrated into global greenhouse gas monitoring initiatives.

How to cite: Bradley, A., Tibrewal, K., Castañeda, C., Irakulis-Loitxate, I., Bartosiewicz, M., Field, R., Kasprzak, M., van Niekerk, L., and Schwietzke, S.: Quantifying methane emissions from metallurgical coal production at mine-level using empirical measurements in a Bayesian inference framework, EGU General Assembly 2026, Vienna, Austria, 3–8 May 2026, EGU26-19629, https://doi.org/10.5194/egusphere-egu26-19629, 2026.

EGU26-20580 | ECS | Posters on site | AS3.17

Truck-Based Methane Detection, Attribution, and Quantification in Upstream Oil and Gas: Controlled Release Validation and Field Case Study 

Robyn Latimer, Evelise Bourlon, Martin Lavoie, Afshan Khaleghi, Gilles Perrine, Jack Johnson, Chukwuemeka Nwokoye, and David Risk

The oil and gas (O&G) sector is a significant source of global anthropogenic methane (CH4) emissions, prompting increased regulatory oversight and the rapid development of new methane measurement and mitigation technologies. While screening technologies such as optical gas imaging (OGI) are widely used for regulatory compliance due to their ability to visually identify component-level leaks, there is emerging evidence from regulatory effectiveness studies in Canada that OGI surveys do not detect all sources, with remote sensing surveys often identifying significantly higher site-level emissions. Complementary methods with low detection thresholds may be necessary to improve regulatory compliance and fully represent low-level emission distributions in measurement inventories. In this study, we characterize the performance of a truck-based measurement system using controlled release data, and present results from a field case study in which this method was applied alongside aerial LiDAR and quantitative OGI surveys.

Truck-based measurement systems are a relatively inexpensive and efficient option for site-level screening and emission quantification. This method integrates a vehicle-mounted gas analyzer, anemometer, and GPS to collect atmospheric CH4 concentrations and wind characteristics along the driven route. This data is processed via an automated framework in which CH4 plumes are identified, attributed to a source based on wind characteristics and source geometry, and quantified using a Gaussian plume dispersion model. We assess detection, attribution, and quantification performance using data collected by Eotrac Incorporated during controlled release experiments (0.025 - 11 kg/h) at test sites simulating realistic O&G emission scenarios. While release rates and locations were blind to the measurement team during testing, the analysis presented here was conducted after the releases were unblinded.

The truck-based system achieved a true positive detection rate exceeding 95 % with no false positives. We find that increasing the number of downwind measurement transects can significantly reduce the 90 % detection limit, from 0.45 kg/h with one transect to 0.03 kg/h with five transects. During single-source release scenarios, source attribution accuracy was 100 % at the facility level, 99.7 % at the equipment group-level, and 50 % at the individual source-level, indicating strong performance for identifying emitting equipment groups (7-15 m radius) despite challenges in pinpointing exact leak locations.

In the field case study, the site-level emission frequency was 74.3 % for the truck-based method, compared to 8.6 % for QOGI and 31.8 % for aerial LiDAR. This suggests that OGI misses a significant fraction of emitting sites. Truck-based methods therefore offer a reliable complement to existing detection approaches and have the potential to improve both regulatory compliance and the representation of low-level emitters in inventories.

How to cite: Latimer, R., Bourlon, E., Lavoie, M., Khaleghi, A., Perrine, G., Johnson, J., Nwokoye, C., and Risk, D.: Truck-Based Methane Detection, Attribution, and Quantification in Upstream Oil and Gas: Controlled Release Validation and Field Case Study, EGU General Assembly 2026, Vienna, Austria, 3–8 May 2026, EGU26-20580, https://doi.org/10.5194/egusphere-egu26-20580, 2026.

EGU26-21001 | ECS | Posters on site | AS3.17

Uncertainties in quantifying coal mine shaft CH4 emissions from in-situ and remote sensing instruments using high-resolution plume modelling 

Rakesh Yuvaraj, Marvin Knapp, Charbel Abdallah, André Butz, Michał Gałkowski, Andreas Fix, Justyna Swolkien, and Thomas Lauvaux

Methane emissions from coalmine shafts contribute significantly to anthropogenic greenhouse gas emissions to the atmosphere. Strategies to quantify and monitor these emissions include remote sensing (using aircraft and satellite imagers) and in-situ measurements (aircraft and UAV measurement campaigns). Each technique offers distinct advantages and limitations. However, quantifying the efficacy and the uncertainties of measurement techniques remains challenging. Here, we use a Large Eddy Simulations (LES) model called Fire Dynamics Simulations (FDS), which can model methane plumes at high-resolutions (<1m). To validate the LES model, we used plumes measured by a HySpex instrument placed approximately 1 km from the Pniowek V coal mine in Poland, next to a Doppler LiDAR instrument able to measure the wind profile.

FDS simulates high-fidelity CH4 plumes compared to the observations, including the angle at the release, the concentration values, and the height of the plume at various distances from the source. Based on our validation, we simulated high-resolution tracks for in-situ instruments (UAV), which measure the near-field of the CH4 plume, and also plume images at a slightly lower resolution (5-30 m) for satellite and aircraft imagers, which measure long-distance plumes.  Methane plumes correspond to various velocity values of releases and mine’s air concentrations, under various environmental conditions (mean wind speed, air temperature, relative humidity) to construct an ensemble of simulated experiments. We conclude this study by comparing the effectiveness of each individual method in terms of emissions uncertainties, aiming at monitoring CH4 emissions from the ventilation shafts of deep coal mines.

How to cite: Yuvaraj, R., Knapp, M., Abdallah, C., Butz, A., Gałkowski, M., Fix, A., Swolkien, J., and Lauvaux, T.: Uncertainties in quantifying coal mine shaft CH4 emissions from in-situ and remote sensing instruments using high-resolution plume modelling, EGU General Assembly 2026, Vienna, Austria, 3–8 May 2026, EGU26-21001, https://doi.org/10.5194/egusphere-egu26-21001, 2026.

EGU26-21364 | ECS | Posters on site | AS3.17

Offshore and urban methane emissions in Gabon 

Magdalena Pühl, Alina Fiehn, Max Eckl, Tiziana Bräuer, Klaus-Dirk Gottschaldt, Heinfried Aufmhoff, Lisa Eirenschmalz, Gregor Neumann, Felicitas Sakellariou, Daniel Sauer, Robert Baumann, Larissa Mengue, Vianney Mpiga Assele Ulrich, and Anke Roiger

Atmospheric CH4 mole fractions have strongly increased since 1750 due to human activity and continue to rise. Reducing CH4 emissions is often easily feasible and also economically interesting, especially from fossil fuel sources (e. g. leakages). For the development of effective reduction strategies and to prioritize actions, CH4 emissions, their spatial distribution and their variability must be well constrained. This study presents airborne top-down emission estimates from Gabonese offshore oil installations as well as emissions from the Libreville urban area. A correlation with installation age and oil production is discussed, and a comparison with reported data and other top-down studies is presented. Further, co-emitted species such as C2H6, CO2, CO and NOy are shown for both offshore fossil fuel sources and the mixture of different urban sources, which include contributions from fossil fuel and biogenic origins (e.g. landfills).

How to cite: Pühl, M., Fiehn, A., Eckl, M., Bräuer, T., Gottschaldt, K.-D., Aufmhoff, H., Eirenschmalz, L., Neumann, G., Sakellariou, F., Sauer, D., Baumann, R., Mengue, L., Ulrich, V. M. A., and Roiger, A.: Offshore and urban methane emissions in Gabon, EGU General Assembly 2026, Vienna, Austria, 3–8 May 2026, EGU26-21364, https://doi.org/10.5194/egusphere-egu26-21364, 2026.

EGU26-22414 | Posters on site | AS3.17

Benchmarking Methane Emissions Across Major U.S. Oil and Gas Basins Using Aerial Gas Mapping LiDAR 

Christopher Donahue, James Dillon, Vickira Hengst, Andrew Bartnik, Kabir Oberoi, Peter Ottsen, and Michael Thorpe

With increasing accessibility of methane emission monitoring technology and advancements in emission modeling, numerous approaches have been developed to create measurement-based emission inventories. Yet inventories often leave emissions unaccounted for due to limited detection sensitivity, limited temporal sampling, or unscalable spatial deployment. We present a framework for building measurement-based methane inventories using Bridger Photonics Gas Mapping LiDAR (GML), a high-resolution, source-resolved aerial technology with a 90% probability of detection at 1 kg h⁻¹. We apply this framework in 2024 across major U.S. oil and gas basins including the Permian, Bakken, Appalachia, Haynesville, and Denver-Julesburg. The framework produces basin-scale methane inventories, attributed to the facility- and equipment-levels, along with methane intensity benchmarks derived from basin-representative sampling designs. Multiple survey deployments are used to characterize temporal variability and sub-basin results provide operator and supply-chain relevant benchmarks that support prioritization of LDAR campaigns and emissions reporting. Inventory methods integrate 1) the GML quantification error model that accurately accounts for uncertainty and bias of emissions estimates, and 2) the GML probability of detection model that estimates missed emissions in the partial detection region of the sensor (0.4-3 kg/h). We describe how representative sampling plans are constructed using U.S. energy infrastructure databases, and how emissions are extrapolated across heterogeneous facility populations with varying equipment and operational characteristics. In regions where public energy infrastructure data are sparse, operators can provide facility and equipment datasets to support sampling and inventory development, which often yield the highest quality results. Applying a single workflow across basins provides comparable, policy-relevant benchmarks for U.S. methane emissions and intensities. Ongoing work addresses remaining limitations, including diurnal variability and quantification uncertainty driven by regional wind models. The framework is transferable to international basins where comparable infrastructure data are available, enabling transparent, scalable, and globally comparable measurement-based methane inventories.

How to cite: Donahue, C., Dillon, J., Hengst, V., Bartnik, A., Oberoi, K., Ottsen, P., and Thorpe, M.: Benchmarking Methane Emissions Across Major U.S. Oil and Gas Basins Using Aerial Gas Mapping LiDAR, EGU General Assembly 2026, Vienna, Austria, 3–8 May 2026, EGU26-22414, https://doi.org/10.5194/egusphere-egu26-22414, 2026.

EGU26-22582 | Posters on site | AS3.17

Modeling Health Risks from International Oil and Gas Methane Emissions: A Pilot Study in the United Kingdom 

Nicholas Heath, Sofia Bisogno, Jeremy Domen, Tamara Sparks, Yannai Kashtan, Sebastian Rowland, Eric Lebel, Gan Huang, Nicole Lucha, Seth Shonkoff, Drew Michanowicz, and Kelsey Bilsback

The Methane Risk Map (MRM) currently quantifies acute health risks from U.S. oil and gas methane emissions events by combining remotely-sensed methane emissions with atmospheric dispersion modeling and gas composition information derived from permit data. Here, we present a pilot study demonstrating the MRM approach can be extended internationally using a super-emitter pipeline leak near Cheltenham, UK and measured benzene-to-methane molar ratios. We modeled the event using satellite-derived emission estimates from GHGSat (236-1,375 kg hr⁻¹ over ~11 weeks) combined with the AERMOD dispersion model driven by 4-km WRF meteorology. We applied the measured benzene-to-methane molar ratios from UK natural gas samples to estimate co-emitted benzene emissions and air concentrations.

Maximum modeled 1-hour benzene concentrations reached 1,277 ppbv near the source and 8-hour averages exceeded 855 ppbv, which is over four times the 200 ppbv EU occupational exposure limit. Critically, modeled benzene enhancements of 1.6 ppbv extended up to 10 km downwind, potentially affecting Cheltenham and several nearby villages. This pilot study validates the technical feasibility of applying MRM methodology internationally and upholds our previous findings (Bisogno et al. 2025) that methane super emitters may pose health risks to surrounding communities. These results also provide actionable information to prioritize mitigation efforts in regions that are subjected to methane super emitter events and motivate expanding MRM internationally. We are currently increasing data collection efforts globally, prioritizing regions with available gas composition data and satellite-detected emissions events to enable worldwide health risk assessment of oil and gas methane emissions.

Reference:

Bisogno, S., Moniruzzaman, C. G., Heath, N., Efstathiou, C., Domen, J. K., Hill, L. A. L., ... & Bilsback, K. R. (2025). Not just a climate problem: the safety and health risks of methane super-emitter events. Environmental Research Letters, 20(9), 094025.

How to cite: Heath, N., Bisogno, S., Domen, J., Sparks, T., Kashtan, Y., Rowland, S., Lebel, E., Huang, G., Lucha, N., Shonkoff, S., Michanowicz, D., and Bilsback, K.: Modeling Health Risks from International Oil and Gas Methane Emissions: A Pilot Study in the United Kingdom, EGU General Assembly 2026, Vienna, Austria, 3–8 May 2026, EGU26-22582, https://doi.org/10.5194/egusphere-egu26-22582, 2026.

EGU26-22603 | Posters on site | AS3.17

A unified Python workflow for mobile downwind quantification of methane emissions from active landfill cells: implementing Gaussian and tracer-release methods 

Victoria Rafflin, James France, Dave Lowry, Rebecca Fisher, Aliah Alshalan, Neil Howes, Linh Nguyen, and Jacob Shaw

In the UK, the waste sector accounted for approximately 31.7% of national CH4 emissions in 2023 (National Atmospheric Emissions Inventory – NAEI 2023), with landfills contributing for nearly 80% of these sectoral emissions, or ≈ 25.4% of national CH4 emissions. This reality, combined with marked spatial and temporal variability in surface fluxes, requires rigorous measurement protocols and explicit quantification of uncertainties.

As part of the MOMENTUM and DEFRA-funded programmes, mobile measurement campaigns were carried out for multiple active landfill cells. Downwind of each cell, ≥10 road transects were completed, with each group of transects run at a constant vehicle speed (typically 20–60 km h⁻¹), using an instrumented mobile laboratory (Toyota RAV4 hybrid) measuring CH4, CO2, C2H6 and δ13C-CH4 with cavity-enhanced analysers; acquisition protocols were harmonised to maximise comparability.

Flux quantification applies two established methods to the same downwind datasets: (i) Gaussian plume dispersion modelling with Monte-Carlo uncertainty propagation to produce probabilistic emission estimates; and (ii) a tracer-dispersion method using controlled releases of ethane (C2H6) during transects, with CH4 emissions estimated from integrated C2H6/ CH4 plume ratios. Survey results are employed illustratively to explore how external factors, meteorological inputs, atmospheric stability conditions, downwind distance from emission points, tracer placement and measurement routing can influence method outputs and uncertainty characterisation.

The objective of this work was to develop and validate a reproducible Python-based post-processing routine for mobile surveys downwind of landfill cells, implemented as a unified workflow that enables the consistent and traceable application of Gaussian-plume dispersion modelling (with uncertainty propagation) and tracer-release quantification methods to identical downwind datasets. The workflow standardises data ingestion and time synchronisation, quality filtering, baseline treatment, plume and peak selection, and execution of both calculation routes, producing comparable methane flux estimates with associated uncertainty characterisation.

Applied across multiple landfills, this common processing environment enables systematic, like-for-like method evaluation and targeted sensitivity analyses, linking variability in estimated fluxes to meteorological conditions and sampling configuration. It facilitates identification of dominant sources of uncertainty and highlights methodological choices that would benefit from standardisation, providing a robust basis for harmonised mobile CH4 quantification and the development of best-practice guidance for inventories and mitigation planning.

How to cite: Rafflin, V., France, J., Lowry, D., Fisher, R., Alshalan, A., Howes, N., Nguyen, L., and Shaw, J.: A unified Python workflow for mobile downwind quantification of methane emissions from active landfill cells: implementing Gaussian and tracer-release methods, EGU General Assembly 2026, Vienna, Austria, 3–8 May 2026, EGU26-22603, https://doi.org/10.5194/egusphere-egu26-22603, 2026.

EGU26-8097 | ECS | Posters on site | AS3.18

Modelling the Enhancement of Methane Oxidation through the Addition of Chlorine 

Kathryn Vest, Ryan Hossaini, Oliver Wild, and Fiona O'Connor

As a potent greenhouse gas that has increased in abundance in recent years, methane is an important target for mitigation. Enhancing the chemical loss of methane by adding chlorine to the atmosphere has been proposed by some as a potential method for atmospheric methane removal. Chlorine is known to have a wide range of impacts in the atmosphere, therefore a rigorous assessment of the potential unintended impacts that could arise from atmospheric chlorine addition is required.

Here, the Frontier Research System for Global Change version of the University of California Irvine Chemical Transport Model (FRSGC/UCI CTM) was used to investigate the efficacy and unintended consequences of atmospheric chlorine addition for methane removal. A range of scenarios were designed with varying chlorine emissions magnitudes and spatial distributions to assess how much chlorine is needed, where the most efficient areas to release the chlorine could be, and how the unintended impacts vary with these amounts and locations.

Using an idealised distribution with chlorine emissions (as Cl2) evenly distributed over the global oceans, we find that atmospheric chlorine addition produces a complex response on the methane lifetime. In broad agreement with previous modelling work, we find a global emission magnitude that is below a threshold of ~100 Tg Cl2/year would increase the methane lifetime and thus not be effective. Below this threshold, the additional chlorine results in enough tropospheric ozone destruction to reduce methane loss via hydroxyl radicals more than the increased loss via chlorine radicals. Above ~100Tg Cl2/year, the additional chlorine begins to decrease the methane lifetime, and chlorine becomes a more important sink of methane.

Other scenarios tested include concentrating chlorine emissions over specific ocean basins (e.g. Pacific, Atlantic) and in different latitude bands, such as the tropics. The response of methane under these and other scenarios, along with the unintended impacts of chlorine addition on air quality (e.g. ground level ozone) and the wider environment, will be discussed.

How to cite: Vest, K., Hossaini, R., Wild, O., and O'Connor, F.: Modelling the Enhancement of Methane Oxidation through the Addition of Chlorine, EGU General Assembly 2026, Vienna, Austria, 3–8 May 2026, EGU26-8097, https://doi.org/10.5194/egusphere-egu26-8097, 2026.

EGU26-8160 | ECS | Posters on site | AS3.18

A framework for assessing atmospheric oxidation enhancement approaches 

Sam Abernethy

Atmospheric oxidation enhancement (AOE) is a proposed category of methane removal that involves dispersing oxidizing agents to accelerate the natural oxidation of atmospheric methane. There is currently a lack of standardized metrics for assessing and comparing proposed AOE approaches. We present a quantitative assessment framework centered on conversion efficiency—the ratio of oxidized methane mass to dispersed material mass—to evaluate the feasibility of AOE approaches.

We propose two necessary but insufficient criteria: (1) climate beneficial (net carbon negative in CO₂e, accounting for methane oxidation and emissions from material production/transport), and (2) cost-effectiveness (cheaper than the social cost of methane, currently estimated to be ~$2000/tCH₄). These thresholds define minimum conversion efficiency requirements for each approach. 

We apply this framework to two case studies: (1) iron salt aerosols (ISA), 40% FeCl₃ dispersed from marine vessels, and (2) hydrogen peroxide, 50% H₂O₂ dispersed from land-based towers. Drawing on published atmospheric modeling results and assumptions for material production costs and carbon intensities, we evaluate the conversion efficiencies that would be required to meet the climate beneficial and cost-effective criteria.

Conversion efficiency varies by location for both ISA and H₂O₂, with some deployment scenarios being climate detrimental. Critical uncertainties include regional variations in OH and Cl recycling rates and poorly constrained atmospheric loss pathways—uncertainties that could shift the conversion efficiency by orders of magnitude.

This proposed framework enables standardized comparisons and identifies priority research questions. Approaches failing to meet these criteria under optimistic assumptions suggest resources may be better allocated elsewhere, while those showing potential under plausible conditions merit deeper investigation. The goal is to provide a shared analytical foundation to help the community efficiently navigate the expanding solution space for atmospheric oxidation enhancement.

How to cite: Abernethy, S.: A framework for assessing atmospheric oxidation enhancement approaches, EGU General Assembly 2026, Vienna, Austria, 3–8 May 2026, EGU26-8160, https://doi.org/10.5194/egusphere-egu26-8160, 2026.

EGU26-15504 | ECS | Posters on site | AS3.18

Measurements and multiphase modeling of dark Fenton chlorine production from iron-salt aerosols at the European Photoreactor (EUPHORE) 

Luisa Pennacchio, Marie Mikkelsen, Chloe Brashear, Rubén Soler, Ezra Wood, Mila Ródenas, Amalia Muñoz, Maarten van Herpen, Thomas Röckmann, Pontus Roldin, and Matthew Johnson

Interactions between iron-containing mineral dust and chloride-rich sea salt aerosols lead to the formation of iron(III) chloride salts, which initiate the photocatalytic release of molecular chlorine (Cl2) [1-5]. Photolysis of the chlorine generates reactive Cl radicals—potent atmospheric oxidants with substantial implications for the degradation of methane and other greenhouse gases. This catalytic chlorine production relies on the reoxidation of Fe(II) to Fe(III) through Fenton chemistry. To understand the photolytic chlorine production, the Fenton chemistry in these aerosols must be understood as well. This study presents experimental investigation and multiphase modeling of the dark chlorine production from the reaction of iron(III) chloride aerosols and H2O2. The experiments were performed in the 200 m3 European Photoreactor (EUPHORE) in Valencia, Spain. Measurements were collected with long-path FTIR, OPS, SMPS, PTR-MS, ACSM, Picarro G2108 and G2201-i as well as monitors for O3, NO, NO2, NOx, CO and HCHO. Furthermore, flask samples were collected for analysis of [CO], d13C-CO, [CH4], d13C-CH4 and VOCs at Utrecht University. Multiphase modeling of the experiment has been done through the integration of Fenton reactions and iron chloride chemistry into the kinetic multilayer model for Aerosol Dynamics, gas- and particle-phase chemistry in CHAMber environments (ADCHAM)[6]. A production was observed of 1.14 Cl2 molecules per Fe atom per hour and 4.33 H2O2 were consumed per Cl2 molecule produced. An inhibition of the chlorine production later in the experiment was observed and is under investigation.


This work is part of a project supported by the European Commission under the Horizon 2020 –Research and Innovation Framework Program through the ATMO-ACCESS Integrating Activity ATMO-TNA-7—0000000004 (GA N. 101008004)

[1] Chen et al. (2024) Environ. Sci. Technol., 58(28), 12585-12597

[2] Mikkelsen et al. (2024) Aerosol Research, 2, 31-47

[3] Wittmer et al. (2015) Environmental Chemistry, 12(4), 461-475

[4] Wittmer et al (2017) Journal of Atmospheric Chemistry, 74, 187-204

[5] van Herpen et al. (2023) PNAS, 120, 31

[6] Roldin et al. (2014) ACP, 14, 7953–7993

How to cite: Pennacchio, L., Mikkelsen, M., Brashear, C., Soler, R., Wood, E., Ródenas, M., Muñoz, A., van Herpen, M., Röckmann, T., Roldin, P., and Johnson, M.: Measurements and multiphase modeling of dark Fenton chlorine production from iron-salt aerosols at the European Photoreactor (EUPHORE), EGU General Assembly 2026, Vienna, Austria, 3–8 May 2026, EGU26-15504, https://doi.org/10.5194/egusphere-egu26-15504, 2026.

EGU26-21983 | ECS | Posters on site | AS3.18

Scaling a Methane Eradication Photochemical System for Agricultural Applications 

Hugo Russell, Nickie Fogde, Svend Bager, Noah Weiss, Aoibhinn McConville, Astrid Skifter Madsen, Anders Feilberg, Matthew S. Johnson, and Morten Krogsbøll

The successful mitigation of anthropogenic methane (CH₄) emissions hinges on the development of technologies that are not only effective but also economically viable at an industrial scale. Building upon previous lab-scale success, this study presents the scaling of an in-situ Methane Eradication Photochemical System (MEPS). The system is built into a shipping container, where air is drawn from a cattle barn and mixed with Cl₂ before entering a 5.5 m³ photochemical chamber. Here, the Cl₂ is photolyzed into chlorine radicals which oxidize CH₄ to CO and CO₂. The treated air is then passed through a scrubber to remove HCl and residual Cl₂. This scaled system was evaluated with airflows ranging from 250 to 1200 m³/hr across various methane concentrations.

The results indicate consistent and robust performance, validating the system's scalability. At relatively high methane concentrations (89 ppm), the system achieved a specific power of 0.33 kWh/gCH₄ and an apparent quantum yield (AQY) of 5.68% at a flow of 243 m³/hr. Performance was maintained at concentrations  of 44 ppm under high-flow conditions (1122 m³/hr), yielding a specific power of 0.53 kWh/gCH₄ and an AQY of 2.3%. Furthermore, the system showed promise against challenging low concentrations (10 ppm at 970 m³/hr), with a specific power of 2.2 kWh/gCH₄.

The successful demonstration of low energy consumption across this range of flow rates and methane levels confirms the scalability of the technology. The possibility of scaling this to a level where it will effectively remove methane from cattle barns seems promising. Ongoing improvements, including the installation of a larger ventilation system, are underway to better understand the operational limits and expand the system's capabilities before scaling for commercialization can happen.

How to cite: Russell, H., Fogde, N., Bager, S., Weiss, N., McConville, A., Skifter Madsen, A., Feilberg, A., S. Johnson, M., and Krogsbøll, M.: Scaling a Methane Eradication Photochemical System for Agricultural Applications, EGU General Assembly 2026, Vienna, Austria, 3–8 May 2026, EGU26-21983, https://doi.org/10.5194/egusphere-egu26-21983, 2026.

EGU26-22360 | Posters on site | AS3.18

Mitigating Agricultural Methane Emissions 

Euan Nisbet

Increased natural methane emissions make the Global Methane Pledge’s goal of cutting the total atmospheric methane burden harder to achieve. Methane’s 2020-2022 surge has faded, but current growth is still rapid. Cutting emissions is feasible: rapid advances are being made in direct practical methods to quantify and reduce agricultural methane emissions worldwide [Nisbet et al. 2025. Practical paths towards quantifying and mitigating agricultural methane emissions. Proc Royal Soc A 481]. Location, identification, quantification, and distinction between different specific sources are all becoming better, though often multiple emitters such as manure pools, animal housing, biodigesters and landfills are co-located. Top targets include cutting emissions from manure stores, biodigesters, and waste. In some cases agricultural methane can be used to generate electricity.  New technology may make it possible to destroy methane in livestock barns. Emissions from crop waste and food waste in heaps and landfills, a major source of air pollution in Africa and South Asia, can be sharply and quickly reduced. Controlling biomass burning is an urgent priority in South Asia and tropical Africa, where rural crop waste burning is widespread, despite the damaging impact on public health. To date, tropical countries have paid little attention to methane, but they have the skills and resources to make significant reductions in agricultural emissions.

How to cite: Nisbet, E.: Mitigating Agricultural Methane Emissions, EGU General Assembly 2026, Vienna, Austria, 3–8 May 2026, EGU26-22360, https://doi.org/10.5194/egusphere-egu26-22360, 2026.

EGU26-5324 | ECS | Orals | AS3.20

Global Ozone Reduction Driven by Dust-Catalyzed Halogens 

Daphne Meidan, Adriana Bossolasco, Carlos A. Cuevas, Julián Villamayor, Rafael P. Fernandez, Qinyi Li, Xiao Fu, Xianyi Sun, and Alfonso Saiz-Lopez

Tropospheric ozone (O3) is an important air pollutant and short-lived climate forcer that influences climate and poses risks to human health and crop productivity. While reactive halogens are known to destroy ozone, the role of mineral dust as a catalyst for halogen activation remains poorly represented in chemistry–climate models. Here we present a global quantitative assessment of ozone reduction driven by dust-catalyzed chlorine and iodine chemistry.

Using the Community Earth System Model (CESM) with explicit dust-induced halogen activation, we show that mineral dust substantially enhances reactive Cl and I production, particularly in marine outflow regions where dust mixes with sea-salt aerosol. This mechanism leads to a global annual mean reduction of ~5% in surface ozone and ~3% in the tropospheric ozone column. Modeled ozone responses are consistent with satellite observations, reproducing observed 3–6% tropospheric ozone column decreases over the tropical Atlantic during high-dust conditions and improving the spatial agreement of ozone responses to dust relative to simulations without dust-halogen chemistry.

Ozone depletion due to this mechanism is strongest over oceanic dust outflow pathways but propagates inland, affecting continental regions far from dust sources. As a result, dust-driven halogen chemistry reduces growing-season ozone exposure (AOT40) across major agricultural regions, increasing crop productivity by up to 9% in South Asia and by 1–7% across parts of Europe, North America, and West Central Asia. Lower ground-level ozone also reduces ozone-attributable premature mortality, with the largest health benefits occurring in densely populated, dust-influenced regions of Asia.

Our results identify dust-catalyzed halogen activation as a previously underrepresented natural global ozone sink with important implications for air quality, agriculture, human health, and the global oxidizing capacity.

How to cite: Meidan, D., Bossolasco, A., A. Cuevas, C., Villamayor, J., P. Fernandez, R., Li, Q., Fu, X., Sun, X., and Saiz-Lopez, A.: Global Ozone Reduction Driven by Dust-Catalyzed Halogens, EGU General Assembly 2026, Vienna, Austria, 3–8 May 2026, EGU26-5324, https://doi.org/10.5194/egusphere-egu26-5324, 2026.

EGU26-6339 | ECS | Posters on site | AS3.20

A Detailed Study Calculating Hydroxyl Radical Concentration from Formaldehyde and VOC Measurements Made During the PEROXY Campaign, Cape Verde,2023 

Ambili Babu, Samuel Seldon, Graham Boustead, Rachel Lade, Katie Read, Anna Callaghan, Shalini Punjabi, James Lee, Lucy Carpenter, Luis Neves, Dwayne Heard, and Lisa Whalley

The hydroxyl radical, OH, is the major daytime oxidant in the troposphere, it controls the lifetime of methane and reacts with volatile organic compounds (VOCs), emitted from both anthropogenic and biogenic sources, often forming formaldehyde as a product. OH is technically difficult to measure, owing to its low atmospheric concentrations, but Wolfe et al., demonstrated that the variation in HCHO concentration can reflect the variation in OH, methane and VOC concentrations and using this relationship were able to estimate OH concentrations during ATom flights [1].

Taking measurements of HCHO made during the PEROXY campaign at the Cabo Verde observatory in 2023, this work presents, the effective yield of HCHO from all OH reactions (α) calculated by determining α  from each VOC measured during the campaign and also using a detailed box model run with the Master Chemical Mechanism [2] and constrained to the observed VOCs to account for HCHO formed from OH reactions with the model generated intermediate species. The daytime average α calculated from the model was ~ 0.126, whilst α calculated from the individual VOCs was ~0.08 demonstrating that the reaction of OH with model-generated intermediates species like PAN can act as a small source of HCHO and should be taken into account.

Using the α determined by the model, the concentration of OH was calculated and compared to the OH measured during the campaign using 1) the model-predicted kOH and modelled HCHO and 2) the measured kOH and measured HCHO from the campaign. OH calculated using measured kOH and HCHO was found to be greater than the OH calculated using the modelled predicted values and greater than the observed OH. This suggests that missing kOH is likely an unmeasured VOC which acts as a source of HCHO and, as such, α is likely greater than calculated by the model. This finding highlight that the unknown VOCs (if not considered) could lead to OH concentrations being over-estimated using the approach outlined.


[1] Wolfe G. M. et al., Mapping hydroxyl variability throughout the global remote troposphere via synthesis of airborne and satellite formaldehyde observations, PNAS, 2019, 116, 11171-11180.

[2] Master Chemical Mechanism, MCMv3.3.1, http://mcm.york.ac.uk/MCM/, (accessed April 2025).


How to cite: Babu, A., Seldon, S., Boustead, G., Lade, R., Read, K., Callaghan, A., Punjabi, S., Lee, J., Carpenter, L., Neves, L., Heard, D., and Whalley, L.: A Detailed Study Calculating Hydroxyl Radical Concentration from Formaldehyde and VOC Measurements Made During the PEROXY Campaign, Cape Verde,2023, EGU General Assembly 2026, Vienna, Austria, 3–8 May 2026, EGU26-6339, https://doi.org/10.5194/egusphere-egu26-6339, 2026.

Changes of O3 and OH are important because they are the major atmospheric oxidants. Both O3 and OH concentrations in Pearl River Delta in southern China have been increasing significantly since 2006, raising serious environmental concerns. In this study, Observation Based Methods (OBM) are developed for OH and Photochemical O3 Production Index (PPI) to investigate the inter-annual variability and trends of  OH and O3. We found that the overall trends of PPI, OH and O3 in 2006-2021 could mostly be attributed to the reduction in NO2 concentrations due to emission control of NOx. However, the short-term (less than 5 years) inter-annual variations of PPI, O3 and OH were primarily driven by meteorological processes.

How to cite: Liu, S. C.: Changes of O3 and OH in Pearl River Delta, China in 2006-2021, EGU General Assembly 2026, Vienna, Austria, 3–8 May 2026, EGU26-6616, https://doi.org/10.5194/egusphere-egu26-6616, 2026.

EGU26-6732 | Posters on site | AS3.20

Ship-borne observations of OH, HO2, RO2 and OH reactivity in the North Atlantic Ocean 

Lisa Whalley, Sabah Mostapha, Daniel Stone, Dwayne Heard, Ming-Xi Yang, Irene Monreal-Campos, Hyunjin An, Jim Hopkins, Charlotte Stapleton, Will Drysdale, Jake Job, James Lee, Phin Petherick, and Pete Edwards

Roughly 90 % of the oxidation of the key greenhouse gas (GHG) methane (CH4) is driven by reaction with the hydroxyl radical (OH) with ~50 % of this processing occurring over the oceans. Ocean emissions of volatile organic compounds (VOCs) have the potential to modify the oxidation capacity (by acting as a sink for OH) and influence the lifetime of CH4. The oxidation of ocean-emitted VOCs may also lead to the formation of secondary organic aerosols (SOA) and ozone (another GHG) and further influence the climate.

Combined observations of OH, peroxy radicals and OH reactivity within the remote marine boundary layer are sparse. Ground-based observations can provide insights into factors influencing the oxidation capacity in this type of environment, but do not allow any spatial variability in ocean emissions to be determined.  

Here, ship-borne observations of OH, HO2, RO2 and OH reactivity made in the North Atlantic Ocean on board the RSS Discovery in June 2025 are presented. The observed OH, HO2 and RO2 will be compared to a preliminary radical budget analysis to assess the major radical sources and sinks. The OH reactivity observed in the North Atlantic as the ship travelled through waters with a range of marine biological activity will be compared to OH reactivity calculated from the coordinated observations of CO, CH4, O3, NOx and VOCs (including oxygenated VOCs measured using PTR-MS and alkanes, alkenes and aromatics measured using canister samples and subsequent GC analysis) to assess the variability in oceanic emissions, the variability in any missing OH reactivity and the impact this missing OH reactivity has on our understanding of the oxidation capacity.

How to cite: Whalley, L., Mostapha, S., Stone, D., Heard, D., Yang, M.-X., Monreal-Campos, I., An, H., Hopkins, J., Stapleton, C., Drysdale, W., Job, J., Lee, J., Petherick, P., and Edwards, P.: Ship-borne observations of OH, HO2, RO2 and OH reactivity in the North Atlantic Ocean, EGU General Assembly 2026, Vienna, Austria, 3–8 May 2026, EGU26-6732, https://doi.org/10.5194/egusphere-egu26-6732, 2026.

EGU26-6849 | Posters on site | AS3.20

Natural Halogens Modulate the Evolution of Global Stratospheric Ozone Depletion  

Julián Villamayor, Rafael P. Fernandez, Daphne Meidan, Amelia Reynoso, Carlos C. Cuevas, Douglas E. Kinnison, and Alfonso Saiz-Lopez

The ozone layer acts as Earth’s primary shield against harmful ultraviolet radiation. Since the mid-20th century, anthropogenic emissions of long-lived chlorinated compounds have disrupted the photochemical balance controlling stratospheric ozone abundance, leading to severe depletion most evident with the formation of the Antarctic ozone hole. While the dominant role of anthropogenic chlorine in global stratospheric ozone depletion is well established, the influence of naturally emitted short-lived halogens, particularly bromine and iodine, on the timing, magnitude and regional variability of ozone loss has been so far overlooked. Using comparative chemistry-climate modeling experiments that include and exclude natural halogen sources for the 1910-2100 period, we show that natural halogen chemistry accounts for up to half of the total halogen-induced ozone loss in the lower extrapolar (60º S – 60º N) stratosphere during recent decades (1990-2020). This contribution is projected to rise sharply, exceeding 80% by the end of the century (2080-2099). Natural halogens also amplify lower-stratospheric ozone loss along the Antarctic periphery by about 35% in recent decades, most notably delaying the projected recovery of its natural seasonal ozone cycle by nearly five decades. Our results demonstrate the disproportionate per-unit-of-mass efficiency of natural bromine and iodine relative to anthropogenic chlorine in controlling lower stratospheric ozone loss. These findings underscore the key but previously overlooked role of natural halogens in the past-to-future spatiotemporal evolution of global stratospheric ozone balance and highlight the need to accurately represent natural halogen chemistry in past and future projections of the stratospheric ozone layer.

How to cite: Villamayor, J., Fernandez, R. P., Meidan, D., Reynoso, A., Cuevas, C. C., Kinnison, D. E., and Saiz-Lopez, A.: Natural Halogens Modulate the Evolution of Global Stratospheric Ozone Depletion , EGU General Assembly 2026, Vienna, Austria, 3–8 May 2026, EGU26-6849, https://doi.org/10.5194/egusphere-egu26-6849, 2026.

EGU26-9133 | ECS | Posters on site | AS3.20

Bridging the Gap: Combining Long-Path DOAS and Satellite Observations to Understand Arctic Bromine Chemistry 

Bianca Lauster, Sebastian Donner, Udo Frieß, Ulrich Platt, Lucas Reischmann, Andreas Richter, William Simpson, Steffen Ziegler, Bianca Zilker, and Thomas Wagner

Halogen chemistry is a central element of tropospheric ozone depletion events (ODEs) during polar spring. Key processes such as sources of reactive halogen species, their transport, and interhalogen interactions as well as the influence of anthropogenic pollution and climate change, however, remain in the focus of Arctic research.

We deployed a long-path DOAS (Differential Optical Absorption Spectroscopy) instrument in Utqiagvik (formerly Barrow), Alaska, in December 2023, and observed enhanced bromine monoxide (BrO) coinciding with reduced ozone concentrations between March and May in 2024 and 2025. By linking these ground-based measurements with satellite observations from TROPOMI and GOME-2B, we aim to improve our understanding of local, regional, and large-scale processes. The results of this comparison highlight the importance of considering the different measurement geometries to capture both near-surface and elevated BrO layers. The findings further suggest that the long-path DOAS measurements are particularly sensitive to bromine activation at an early stage. Therefore, continued ground-based observations are necessary to better characterise near-surface BrO abundances, complementing advances in global satellite monitoring.

How to cite: Lauster, B., Donner, S., Frieß, U., Platt, U., Reischmann, L., Richter, A., Simpson, W., Ziegler, S., Zilker, B., and Wagner, T.: Bridging the Gap: Combining Long-Path DOAS and Satellite Observations to Understand Arctic Bromine Chemistry, EGU General Assembly 2026, Vienna, Austria, 3–8 May 2026, EGU26-9133, https://doi.org/10.5194/egusphere-egu26-9133, 2026.

The hydroxyl (OH) radical serves as the core driver of atmospheric oxidation processes. However, its low concentration and high reactivity pose substantial challenges to accurate measurement in complex atmospheric environments. This study explores a high-sensitivity Laser-Induced Fluorescence (LIF) detection approach based on chemical modulation. An efficient Chemical Titration Cell (CTC) was developed, and key parameters including OH scavenger concentration and flow rate were systematically optimized, resulting in an OH removal efficiency of over 99% and a transmission efficiency of 89%. A high-sensitivity detection system for atmospheric OH radicals based on chemical modulation (CM-LIF) is proposed herein. By optimizing the fluorescence cell, Sampling structure, and minimizing background laser scattering, the system’s measurement accuracy and detection sensitivity are improved. The detection limit reaches (1.78 ± 0.17) × 105 cm-3 with an integration time of 30 s. A comprehensive set of field observation experiaments and comparative analyses were carried out. Measurement results obtained via chemical modulation and laser wavelength modulation analyses show excellent consistency (slope = 0.95, R2 = 0.89). Moreover, in environments with high ozone levels and elevated alkene concentrations, no unknown interferences were detected other than the well-quantified ozone laser photolysis interference. This study demonstrates that the CM-LIF technique offers a reliable solution for the precise measurement of OH radicals in complex atmospheres. This achievement holds significant scientific value, as it enables quantitative assessment of atmospheric oxidation capacity and facilitates the investigation of secondary pollution transformation mechanisms.

How to cite: Hu, R., Cai, H., Lin, C., Zhang, G., and Xie, P.: Enhanced laser-induced fluorescence instrument based on chemical modulation for OH radical measurement: High-sensitivity detection and interference evaluation, EGU General Assembly 2026, Vienna, Austria, 3–8 May 2026, EGU26-9153, https://doi.org/10.5194/egusphere-egu26-9153, 2026.

EGU26-9337 | ECS | Orals | AS3.20

A New Methodology for Evaluating Ozone Production Rate Instruments  

Bérénice Ferrand, Marina Jamar, Alexandre Tomas, and Sébastien Dusanter

Tropospheric ozone (O3), the third most important greenhouse gas, has harmful effects on human health, vegetation and climate. Indeed, increases in O3 are associated with a higher risk of respiratory illnesses, and significant impacts on crop yields have been reported.The formation chemistry of tropospheric ozone is complex and nonlinear, involving photochemical reactions driven by nitrogen oxides (NOx = NO + NO2) and volatile organic compounds (VOCs). Locally, the O3 budget is governed by advection, net local production, and dry deposition. To identify the major production pathways contributing to the net local production rate, P(O3), and distinguish it from advected O3 pollution, a technology capable of monitoring P(O3) has been developed. This instrument is referred to in the literature as Measurement of Ozone Production Sensor (MOPS) or Ozone Production Rate instrument (OPR).

Before field deployment, the performance of this type of instruments must be tested to ensure its reliability and accuracy. In this study, we present an evaluation methodology developed to assess the performance of an OPR instrument. We demonstrate how a small gas-generation unit, capable of providing synthetic air mixtures of VOCs and NOx to the OPR, can be combined with a lamp-based irradiation system covering the OPR to evaluate its performance. In this approach, the ozone production rate P(O3) within the OPR is simulated using the Framework for 0-D Atmospheric Modeling (F0AM), an open-source MATLAB-based box model. We present laboratory tests of the IMT OPR instrument under various controlled conditions spanning ozone production regimes from NOx-limited to NOx-saturated. The reliability and limitations of this combined experimental–modeling approach and the performance of the IMT OPR instrument are discussed.

Acknowledgments. This work was performed as part of the OSEAMS project, funded by the French national agency (ANR) and the National Science and Technology Council (NSTC).

How to cite: Ferrand, B., Jamar, M., Tomas, A., and Dusanter, S.: A New Methodology for Evaluating Ozone Production Rate Instruments , EGU General Assembly 2026, Vienna, Austria, 3–8 May 2026, EGU26-9337, https://doi.org/10.5194/egusphere-egu26-9337, 2026.

EGU26-10405 | ECS | Posters on site | AS3.20

An Updated PKU-LIF System for Synchronized Measurements of OH, HO2 and RO2 

Cuihong Zhang, Shiyi Chen, Qi Zang, Yihui Wang, Xuefei Ma, Zhaofeng Tan, Keding Lu, and Yuanhang Zhang

An upgraded Peking University Laser-Induced Fluorescence (PKU-LIF) system for synchronized measurements of atmospheric OH, HO₂, and RO₂ radicals will be presented. The system features five integrated modules: (1) A Laser Source based on a frequency-doubled dye laser delivering 308 nm radiation at 8 kHz, with 90% power allocated to ambient measurements and 10% to reference monitoring; (2) An Ambient Radical Measurement Module comprising two detection cells, OH-HOx and HOx-ROx, where OH-HOx is used for the measurement of OH and HO2, and HOx-ROx cell combined with a convertor is used for the efficient conversion and detection of RO2.  (3) A Calibration Module employing 185 nm Hg lamp photolysis to generate equal OH/HO₂ concentrations, with CO or CH₄ addition enabling quantitative conversion to HO₂ or CH₃O₂ for sensitivity determination; (4) A Chemical Modulation Module featuring a specially designed Teflon cylinder that ensures vertical airflow alignment and provides 96% OH scavenging efficiency through propane/N₂ injection; (5) A Reference Module with real-time wavelength stabilization using thermocatalytically generated OH, demonstrating exceptional long-term stability (0.2%/hour drift). Recently, the upgraded PKU-LIF system has been applied to the EXACT (Ensembled eXperiments of Atmospheric oxidation Capacity in the Troposphere) campaign to investigate the seasonal evolution of atmospheric radical chemistry and atmospheric oxidation capacity.

How to cite: Zhang, C., Chen, S., Zang, Q., Wang, Y., Ma, X., Tan, Z., Lu, K., and Zhang, Y.: An Updated PKU-LIF System for Synchronized Measurements of OH, HO2 and RO2, EGU General Assembly 2026, Vienna, Austria, 3–8 May 2026, EGU26-10405, https://doi.org/10.5194/egusphere-egu26-10405, 2026.

EGU26-10812 | Orals | AS3.20

Real-time field measurements of HO2 uptake coefficients onto ambient aerosols using laser flash photolysis coupled with laser induced fluorescence detection 

Lavinia Onel, Ze Qin, Lisa Whalley, Michael Flynn, James Allan, Natasha Garner, Ambili Vallipparambil Babu, Graham Boustead, and Dwayne Heard

Hydroperoxy radicals (HO₂) play a key role in atmospheric oxidative chemistry, participating in the transformation of primary emissions into secondary pollutants such as NO₂ and O₃. The uptake of HO₂ onto atmospheric aerosols can significantly impact ozone production in certain regions,[1] and may partly explain in some environments the overestimation of HO2 concentrations by atmospheric chemistry models compared to field measurements. However, currently there have been limited real time field measurements of the HO2 uptake coefficient (γHO2) for ambient air aerosol particles, conducted in Japan.[2-4]

In this study, a new instrument has been developed to directly measure γHO2 for the first time in the UK. A mixture of O₃ and H₂O vapour in air is introduced into a flow tube, where OH radicals are generated via photolysis of O₃ at 266 nm using a Nd:YAG laser. The OH radicals are then converted to HO₂ using excess CO. The temporal decay of HO₂ is measured by sampling the flow tube into a low pressure cell to sensitively monitor HO2 following its conversion to OH and detection at 308 nm using the laser induced fluorescence technique. To quantify the removal of HO₂ that is due to uptake onto ambient aerosols, the ambient aerosol surface area is first enhanced using a Versatile Aerosol Concentration Enrichment System (VACES).[2] Ambient air is passed through VACES and then into the HO₂ reactivity instrument. Alternating between sampling lines—one containing an aerosol filter and one without—allows separation of gas-phase HO₂ reactivity from the total reactivity. The difference in HO2 reactivity between the measurements with and without the filter is used to quantify the HO₂ uptake onto aerosols, and hence a real time observation of γHO2.

The instrument measured γHO2(ambient aerosols) vs. time at the Manchester Air Quality Supersite, UK in August 2025, alongside supporting measurements of aerosol composition and gas-phase species, including OH, HO2 and RO2 radicals and OH reactivity. This fieldwork enables the correlation of the measured γHO2vs. time with factors such as aerosol composition (e.g. transition metals, inorganic salts and organic species), temperature and humidity. The combined measurements will be used to improve the agreement of HO2 concentrations in atmospheric chemistry models with [HO2] in field measurements and understand the impact of the studied aerosol uptake on O3 production.

[1]. Ivatt et al., Nat. Geosci., 15, 536-540, 2022

[2]. Zhou et al., Atmos. Environ., 223, 117189, 2020

[3]. Zhou et al., Atmos. Chem. Phys., 21, 12243–12260, 2021

[4]. Li et al., Environ. Sci. Technol., 56, 12926−12936, 2022


How to cite: Onel, L., Qin, Z., Whalley, L., Flynn, M., Allan, J., Garner, N., Vallipparambil Babu, A., Boustead, G., and Heard, D.: Real-time field measurements of HO2 uptake coefficients onto ambient aerosols using laser flash photolysis coupled with laser induced fluorescence detection, EGU General Assembly 2026, Vienna, Austria, 3–8 May 2026, EGU26-10812, https://doi.org/10.5194/egusphere-egu26-10812, 2026.

EGU26-11318 | Posters on site | AS3.20

Replacing Methyl Bromide with Sulfuryl Fluoride: Long-Term Trends in European Fumigant Emissions 

Francesco Graziosi, Alistair Manning, Luke Western, and Michela Maione

Methyl bromide (CH₃Br) and sulfuryl fluoride (SO₂F₂) are widely used fumigants in agriculture and quarantine and pre-shipment activities, leading to atmospheric emissions. While methyl bromide is both anthropogenic and naturally emitted, its regulation under the Montreal Protocol has driven a strong decline in use due to its ozone-depleting potential (ODP = 0.57) and short atmospheric lifetime (~0.8 years). In contrast, SO₂F₂ has increasingly been adopted as a replacement for CH₃Br and is a potent greenhouse gas, with a 100-year global warming potential of 4090.

We present an observation-based analysis of European emissions of CH₃Br and SO₂F₂ covering the period 2003–2023. Emissions are quantified using long-term atmospheric measurements from four European stations combined with an atmospheric transport model and an inversion framework. Our results show a marked decline in CH₃Br emissions consistent with regulatory controls, alongside a rise in SO₂F₂ emissions until around 2020.

This study provides the first long-term, top-down assessment of European SO₂F₂ emissions and evaluates regulatory compliance for CH₃Br. The findings highlight the importance of sustained atmospheric monitoring to track substitution effects and assess the climate implications of ozone-safe but high-GWP alternatives.

How to cite: Graziosi, F., Manning, A., Western, L., and Maione, M.: Replacing Methyl Bromide with Sulfuryl Fluoride: Long-Term Trends in European Fumigant Emissions, EGU General Assembly 2026, Vienna, Austria, 3–8 May 2026, EGU26-11318, https://doi.org/10.5194/egusphere-egu26-11318, 2026.

EGU26-11358 | ECS | Posters on site | AS3.20

Tropospheric degradation of Fourth-Generation halocarbons by O3: Formation of long-lived greenhouse gases and ozone-depleting substances 

Maria de los Angeles Garavagno, Kieran Stanley, Dudley Shallcross, and Andrew Orr-Ewing
Hydrofluoroolefins (HFOs) and hydrochlorofluoroolefins (HCFOs) are widely adopted as next-generation substitutes for ozone-depleting substances (ODSs) and long-lived greenhouse gases (GHGs) in refrigeration, foam-blowing, and propellant applications. In the troposphere, these compounds are primarily removed by reaction with hydroxyl radicals, resulting in short atmospheric lifetimes and low global warming potentials (GWPs) compared with their predecessors, hydrofluorocarbons (HFCs), hydrochlorofluorocarbons (HCFCs), and chlorofluorocarbons (CFCs).¹˒² However, their secondary chemistry, particularly the formation of the potent GHG trifluoromethane (HFC-23) during the ozonolysis of HFOs and HCFOs,³˒⁴ has raised increasing concern and remains incompletely understood.

In this work, we examine the ozonolysis of selected HFOs and HCFOs in the 123 L EXTreme RAnge (EXTRA) chamber, a Teflon®-coated stainless-steel reactor,⁵ under atmospheric conditions (25 °C, 1 atm). Studies of four HFOs demonstrate that ozonolysis can produce either the GHG HFC-23 or carbon tetrafluoride (PFC-14). HFC-23 is formed from HFO-1234ze(E) in a yield of

Figure 1. Experimentally determined ozonolysis product yields at 298 K and 1 atm pressure of: Left panel: HFC-23 from HFO-1234ze(E); Middle panel: PFC-14 from HFO-1225ye(E), HFO-1225ye(Z), and HFO-1234yf; Right panel: CFC-13 from HFCO-1233xf. Different symbols distinguish separate experiments. The panels show the ratio of products to initial HFO or HCFO concentrations plotted against the fractional change in the HFO or HCFO concentration.


1 B. Burkholder, R. A. Cox, A. R. Ravishankara, Chem. Rev., 2015, 115, 3704.

2 J. Wallington, M. P. Sulbæk Andersen, O. J. Nielsen, Chemosphere, 2015, 129, 135.

3 R. McGillen, Z. T. P. Fried, M. A. H. Khan, K. T. Kuwata, C. M. Martin, S. O’Doherty, F. Pecere, D. E. Shallcross, K. M. Stanley, K. Zhang, Proc. Natl. Acad. Sci. USA, 2023, 120, e23127141204.

4 J. Nielsen, M. P. Sulbaek Andersen, T. J. Wallington, Atmos. Environ., 2025, 343, 120953.

5 E. Leather, M. R. McGillen, C. J. Percival, Phys. Chem. Chem. Phys.,2010, 12, 2935.

6 M.d.l.A. Garavagno, A. Wenger, R. E. T. Holland, B. R. Fena, S. D. Goldstein, D. E. Hicks, F. Liu, J. B. Madell, S. J. Solomon, K. T. Kuwata, M. R. McGillen, M. A. H. Khan, D. E. Shallcross, K. M. Stanley, A. J. Orr-Ewing, Environ. Sci. Technol., 2025, 59, 26031.


How to cite: Garavagno, M. D. L. A., Stanley, K., Shallcross, D., and Orr-Ewing, A.: Tropospheric degradation of Fourth-Generation halocarbons by O3: Formation of long-lived greenhouse gases and ozone-depleting substances, EGU General Assembly 2026, Vienna, Austria, 3–8 May 2026, EGU26-11358, https://doi.org/10.5194/egusphere-egu26-11358, 2026.

EGU26-12396 | Posters on site | AS3.20

Reviewing volcanic halogen emissions 

Nicole Bobrowski

Volcanoes are a natural source of halogens for the atmosphere. After water, carbon dioxide and sulphur compounds, halogens are often the most common gases in volcanic plumes. Over the past two decades, progress has been made in the study of volcanic emissions, particularly those of the heavy halogens bromine and iodine. This contribution provides an interdisciplinary literature review on the current state of the art, and including also some unpublished data, in particularly with regard to bromine and iodine emissions. A detailed global emission estimate is provided, including an analysis of global distribution and comparison with different natural sources. Although volcanoes are point sources with sometimes very high halogen concentrations (mixing ratios in the ppb range), after all their global source strength is rather low compared to other natural halogen sources such as the ocean. The contribution of volcanoes to global halogen emissions into the atmosphere is only in the low percentage range, with the possible exception of extremely large eruptions. However, the spatial distribution of the emissions is quite inhomegeous, so that halogen emissions from volcanoes can still have a local and regional impact on the atmosphere that has not yet been sufficiently investigated.

How to cite: Bobrowski, N.: Reviewing volcanic halogen emissions, EGU General Assembly 2026, Vienna, Austria, 3–8 May 2026, EGU26-12396, https://doi.org/10.5194/egusphere-egu26-12396, 2026.

EGU26-12995 | ECS | Posters on site | AS3.20

A super-simplified OH chemistry scheme for ICON-ART 

Philipp Dietz, Roland Ruhnke, Oliver Kirner, and Peter Braesicke

The monitoring of greenhouse gas (GHG) emissions is essential to reliably assess key drivers of climate change. Accurate GHG inventories provide the quantitative basis for mitigation and adaption strategies under global warming. The ITMS project (“Integriertes Treibhausgas Monitoringsystem”, in English “integrated GHG monitoring system”)[1], is designed to establish an operational GHG data assimilation service at the German Meteorological Service (DWD) based on the model system ICON-ART[2] to enable Germany to operationally monitor the sources and sinks of three important GHGs: carbon dioxide (CO2), methane (CH4) and nitrous oxide (N2O).

In the first phase of the ITMS project DWD together with the Karlsruhe Institute of Technology (KIT) and other partners are focusing on the emission, distribution and depletion of methane. In the troposphere, methane is mainly depleted by the chemical reaction with the OH radical. Tropospheric OH is created mostly by photodissociation of ozone (O3) and thus its abundance depends mainly on the available solar UV radiation and the ozone concentration. The calculation of this chemical system is computationally expensive. Therefore, a simplified calculation of the OH chemistry has to be included in the ICON-ART forward model.

Here, we present a super-simplified OH chemistry scheme for ICON-ART, a data-driven approach based on Minschwaner et al., 2011[3]. The OH concentration is hereby estimated based on the solar zenith angle (SZA) at the respective grid cell. The required parameters are pre-trained on SZA information and OH concentration. We test two independent training datasets – the CAMS global reanalysis (EAC4)[4] and an in‑house chemistry‑climate simulation using the EMAC (ECHAM/MESSy Atmospheric Chemistry) model[5] – and find that the scheme yields reasonable results for both.

[1] www.itms-germany.de

[2] Schröter, J., Rieger, D., Stassen, C., Vogel, H., Weimer, M., Werchner, S., Förstner, J., Prill, F., Reinert, D., Zängl, G., Giorgetta, M., Ruhnke, R., Vogel, B., and Braesicke, P.: ICON-ART 2.1: a flexible tracer framework and its application for composition studies in numerical weather forecasting and climate simulations, Geosci. Model Dev., 11, 4043–4068, https://doi.org/10.5194/gmd-11-4043-2018, 2018.

[3] Minschwaner, K., Manney, G. L., Wang, S. H., and Harwood, R. S.: Hydroxyl in the stratosphere and mesosphere – Part 1: Diurnal variability, Atmos. Chem. Phys., 11, 955–962, https://doi.org/10.5194/acp-11-955-2011, 2011.

[4] Inness, A., Ades, M., Agustí-Panareda, A., Barré, J., Benedictow, A., Blechschmidt, A.-M., Dominguez, J. J., Engelen, R., Eskes, H., Flemming, J., Huijnen, V., Jones, L., Kipling, Z., Massart, S., Parrington, M., Peuch, V.-H., Razinger, M., Remy, S., Schulz, M., and Suttie, M.: The CAMS reanalysis of atmospheric composition, Atmos. Chem. Phys., 19, 3515–3556, https://doi.org/10.5194/acp-19-3515-2019, 2019.

[5] Jöckel, P., Kerkweg, A., Pozzer, A., Sander, R., Tost, H., Riede, H., Baumgaertner, A., Gromov, S., Kern, B., Development cycle 2 of the Modular Earth Submodel System (MESSy2), Geoscientific Model Development, 3, 717-752, https://doi.org/10.5194/gmd-3-717-2010, 2010.

How to cite: Dietz, P., Ruhnke, R., Kirner, O., and Braesicke, P.: A super-simplified OH chemistry scheme for ICON-ART, EGU General Assembly 2026, Vienna, Austria, 3–8 May 2026, EGU26-12995, https://doi.org/10.5194/egusphere-egu26-12995, 2026.

EGU26-13597 | Orals | AS3.20

A TROPOMI-based survey of stationary BrO sources  

Andreas Richter, Bianca Zilker, and Hartmut Bösch

Bromine monoxide levels in the troposphere are usually very low. Under certain conditions, local concentrations can be enhanced, and if the enhancement is large enough, it can be detected in satellite observations using UV absorption spectroscopy.

Most satellite BrO observations focus on polar regions, where many BrO enhancements occur every spring, resulting in local ozone depletion and impacting atmospheric mercury chemistry. BrO enhancements are also observed in some volcanic plumes, and the BrO-to-SO2 ratio can help better understand magma conditions and possibly even predict changes in volcanic activity. Enhanced tropospheric BrO levels have also been detected in satellite data near salt lakes and salt marshes.

In this study, 8 years of TROPOMI BrO slant columns have been evaluated for stationary BrO signals indicating local sources. In addition to the emissions from Rann al Katch, the Dead Sea, and the Great Salt Lakes, which have already been reported in earlier work, many more local BrO enhancements could be identified, mostly linked to salt lakes and salt marshes. The BrO hotspots are evaluated for potential artefacts from enhanced albedo, surface spectral reflectance, and scene inhomogeneity. For the signals deemed real, the seasonal variation is analysed, and the magnitude of the BrO enhancement is estimated.

How to cite: Richter, A., Zilker, B., and Bösch, H.: A TROPOMI-based survey of stationary BrO sources , EGU General Assembly 2026, Vienna, Austria, 3–8 May 2026, EGU26-13597, https://doi.org/10.5194/egusphere-egu26-13597, 2026.

Chemically reactive atmospheric radicals and their precursors species (such as HO2, NO3, HONO, H2CO, etc.) play a crucial role in the atmospheric chemistry processes. Reliable and real-time assessment of the concentration change of such reactive species in the atmosphere is essential for understanding the oxidation capacity of the atmosphere, which might have a severe impact on air pollution models, prediction of tropospheric chemical processes, regional air quality and global climate change, and political decisions related to emission control strategies. Contrary to long-lived species (such as greenhouse gases), fast, interference-free, accurate, and precise in situ monitoring of such strongly reactive species represents a real challenge due to their very high reactivity resulting in short lifetimes (down to seconds), ultralow concentrations ranging from ppbv (109) to ppqv (1015), and due to the complex reaction networks they participate in.

In this presentation, we will overview our recent progress in the development of spectroscopic measurement technique for optical monitoring of radicals and their precursors, including : (1) novel technique development for lab investigation; (2) intercomparison of different methods in simulation chamber and in real-world field campaign; as well as intercompaison through modeling; (3) applications to field campaigns and chamber studies.

Acknowledgments

This work is partially supported by the French national research agency (ANR) under the Labex CaPPA (ANR-10-LABX-005), ANR MULTIPAS, ANR MABCaM, ANR ICAR-HO2 and PIA SEAM contracts; the PHC-ORCHID project; the EU-INTERREG SAFESIDE project; the EU H2020-ATMOS project (Marie Skłodowska-Curie grant agreement No 872081), and the regional CPER ECRIN, CPER-IRENE, CPER-CLIMIBIO programs.

References

[1] H. Yi, M. Cazaunau, A. Gratien, V. Michoud, E. Pangui, J.-F. Doussin, W. Chen, Intercomparison of IBBCEAS, NitroMAC and FTIR for HONO, NO2 and CH2O measurements during the reaction of NO2 with H2O vapour in the simulation chamber CESAM, Atmos. Meas. Tech. 14 (2021) 5701–5715.

[2] H. Yi, L. Meng, T. Wu, A. Lauraguais, C. Coeur, A. Tomas, H. Fu, X. Gao and W. Chen, Absolute determination of chemical kinetic rate constants by optical tracking the reaction on the second timescale using cavity-enhanced absorption spectroscopy, Phys. Chem. Chem. Phys. 24 (2022) 7396-7404.

[3] W. Chen, H. Yi, T. Wu, W. Zhao, C. Lengignon, G. Wang, E. Fertein, C. Coeur, G. Wysocki, T. Wang, M. W. Sigrist, X. Gao and W. Zhang, Photonic Sensing of Reactive Atmospheric Species, in Encyclopedia of Analytical Chemistry © 2017 John Wiley & Sons, Ltd.

How to cite: Chen, W.: Advance in spectroscopic measurements of key atmosperic radicals and their applications in simulation chamber and field campaign, EGU General Assembly 2026, Vienna, Austria, 3–8 May 2026, EGU26-14214, https://doi.org/10.5194/egusphere-egu26-14214, 2026.

Carbonyl oxides, known as Criegee intermediates, are transient species produced in the ozonolysis of unsaturated hydrocarbons. These intermediates play a key role in the chemistry of the troposphere, effecting complex reaction pathways that lead to production of OH radicals, peroxy radicals, highly oxygenated molecules, etc. Currently, Criegee intermediates are studied in isolation from the ozonolysis reaction by synthesis of stabilized carbonyl oxides through the photodissociation of a corresponding iodoalkane and a subsequent addition of O2. This method has permitted the study of various kinetic rate constants and product yields of reactions of Criegee intermediates with compounds of atmospheric interest. However, the ozonolysis reaction is highly exothermic, and the produced Criegee intermediates have a broad energy distribution. Thus, research on Criegee intermediates as a key step of the ozonolysis reaction network, and their effect on the different reaction pathways, requires also the ability of measuring these transient species in the actual ozonolysis reaction.

Here, we report on the direct measurements of formaldehyde oxide produced from ozonolysis of ethene in a flow cell using cavity ring-down spectroscopy. The gas flow and pressure in the optical cavity were carefully controlled to allow the reaction cell to behave as a plug-flow reactor, and high-resolution (0.01nm) ultraviolet spectra were obtained for the ozonolysis of ethene under different reaction conditions. An a priori chemical mechanism was simulated in the plug-flow reactor to determine reaction conditions that would enhance the quasi steady-state production of formaldehyde oxide, which was quantified by fitting the measured ultraviolet spectra with the known cross-section of its B̃(1A′) ← X̃(1A′) transition. Average concentrations of CH2OO were determined in the flow cell under different residence times, and time profiles were obtained corresponding to different steady states. The time profiles serve as constrains to benchmark a posterior reaction mechanism of ethene ozonolysis, allowing for the determination of yields and other kinetic information, as well as providing insights on some yet-unexplored reactions pathways in the ozonolysis reaction network.

How to cite: Campos-Pineda, M., Yang, L., and Zhang, J.: Direct measurements of the Criegee intermediate formaldehyde oxide, CH2OO, produced from ozonolysis of ethene in a plug-flow optical cavity., EGU General Assembly 2026, Vienna, Austria, 3–8 May 2026, EGU26-14403, https://doi.org/10.5194/egusphere-egu26-14403, 2026.

EGU26-14785 | ECS | Orals | AS3.20

Potential sources of excess nitrous acid in the troposphere inferred from airborne remote sensing 

Benjamin Weyland, Simon Rosanka, Domenico Taraborrelli, Birger Bohn, Andreas Zahn, Florian Obersteiner, Eric Förster, Mariano Mertens, Patrick Jöckel, Helmut Ziereis, Katharina Kaiser, Horst Fischer, John N. Crowley, Nijing Wang, Achim Edtbauer, Jonathan Williams, Maria Dolores Andrés Hernández, John P. Burrows, André Butz, and Klaus Pfeilsticker

The photolysis of nitrous acid (HONO) produces the hydroxyl radical (OH). For decades. HONO measurements have exceeded model predictions, which are often based on gas phase chemistry, and various mechanisms have been proposed as sources of this excess HONO. We report here on airborne remote sensing observations from the mini-DOAS instrument onboard the HALO aircraft during several research missions from various regions (Europe, Asia, the Atlantic) at altitudes up to 15 km. HONO slant column densities detected from limb scattered skylight in the ultraviolet wavelength range using the DOAS technique are converted to volume mixing ratios with the O3/O4 scaling method. These observations form a C-shaped profile in the troposphere which exceed model (EMAC/MECO(n)) predictions by up to an order of magnitude, with volume mixing ratios up to 150 ppt in the boundary layer and more than 100 ppt in the upper troposphere. Together with a plethora of atmospheric parameters and trace gases measured simultaneously onboard HALO, various formation mechanisms are explored to investigate in situ HONO sources. While the photolysis of particulate nitrate can explain HONO in the marine boundary layer over the remote Atlantic, HONO formation in the polluted lower troposphere remains difficult to explain quantitatively. In the cold upper troposphere of the tropics, the aerosol loading was not sufficient to explain the necessary HONO source with heterogeneous chemistry, and a novel gas phase formation mechanism is proposed. The potential formation, lifetime, and oxidation of peroxynitrous acid in the upper troposphere is investigated in some detail. 

How to cite: Weyland, B., Rosanka, S., Taraborrelli, D., Bohn, B., Zahn, A., Obersteiner, F., Förster, E., Mertens, M., Jöckel, P., Ziereis, H., Kaiser, K., Fischer, H., Crowley, J. N., Wang, N., Edtbauer, A., Williams, J., Andrés Hernández, M. D., Burrows, J. P., Butz, A., and Pfeilsticker, K.: Potential sources of excess nitrous acid in the troposphere inferred from airborne remote sensing, EGU General Assembly 2026, Vienna, Austria, 3–8 May 2026, EGU26-14785, https://doi.org/10.5194/egusphere-egu26-14785, 2026.

EGU26-16530 | Posters on site | AS3.20

Overview of the EXACT Campaign and Establishing an Oxidation Network in China 

Zhaofeng Tan, Xuefei Ma, Keding Lu, Renzhi Hu, and Shengrong Lou

Atmospheric radicals critically govern tropospheric oxidation processes, yet chemical models systematically underestimate OH and HO2 under high- and low-NOₓ conditions, limiting accurate prediction of haze and ozone in polluted regions like China. To address these gaps, the Ensembled eXperiment of Atmospheric oxidation Capacity in the Troposphere (EXACT) was conducted across the North China Plain, deploying advanced instrumentation at urban (Beijing), rural (Luancheng), and remote (Shangdianzi) sites over four seasons from autumn 2024 to summer 2025.

Preliminary results reveal strong seasonal variability: peak OH concentrations reached ~2×107 cm-3 in spring and summer but dropped to ~2×106 cm-3 in winter. Significant nighttime HO2 and RO2 were observed in rural and remote areas, indicating active dark chemistry. OH-j(O1D) correlations strengthened from winter (R2≈0.5) to summer (R2≈0.8), reflecting increasing photochemical dominance. HONO photolysis dominated ROx production in winter, while O3 and carbonyl photolysis became more important in warmer seasons. Chlorine chemistry also contributed significantly to ROₓ, with distinct diurnal ClNO2 patterns suggesting multiple source mechanisms.

Compared to earlier campaigns, EXACT shows elevated OH turnover rates since 2020, offering a partial explanation for slowed PM2.5 decline and rising ozone. Building on these findings, the EXACT-Plus campaign will expand into central China’s Gan-E-Xiang region, where complex terrain, high humidity, and unique chlorine sources, such as kilns, fireworks, and biomass burning, may drive unexplored oxidation pathways. This work advances understanding of radical-driven pollution and supports improved model development and air quality management.

How to cite: Tan, Z., Ma, X., Lu, K., Hu, R., and Lou, S.: Overview of the EXACT Campaign and Establishing an Oxidation Network in China, EGU General Assembly 2026, Vienna, Austria, 3–8 May 2026, EGU26-16530, https://doi.org/10.5194/egusphere-egu26-16530, 2026.

EGU26-16634 | Posters on site | AS3.20

Experimental investigation of the ozone budget in Taiwan during the OSEAMS campaign 

Sébastien Dusanter, Bérénice Ferrand, Yu-Hsun Lee, Marina Jamar, Jia-Lin Wang, Neng-Huei Lin, Stephen Griffith, and Alexandre Tomas

Tropospheric ozone (O₃) is a key greenhouse gas that adversely affects human health, ecosystems, and climate; the economic cost associated with ozone pollution worldwide is already substantial and tropospheric ozone concentrations are projected to increase under future climate change scenarios, particularly in Southeast Asia. Ambient O3 concentrations are driven by various physicochemical processes including air mass transport, net chemical in-situ production, P(O3), and dry deposition, but the chemistry driving P(O3) is highly complex and characterized by a nonlinear set of photochemical reactions involving nitrogen oxides (NOx = NO + NO2) and volatile organic compounds (VOCs). The inherit uncertainty of estimating P(O3) limits our understanding of the tropospheric ozone budget, i.e. distinguishing between locally-produced ozone and transported pollution, while measuring P(O3) in-situ would provide an important constraint on the ozone budget.

As part of the bilateral France-Taiwan OSEAMS (tropospheric Ozone in Southeast Asia: budget and Mitigation Strategies) project, a five-week field campaign was conducted in a highly polluted urban-industrial area of Kaohsiung, Taiwan. An Ozone Production Rate (OPR) instrument that measures P(Ox) [Ox=O3+NO2], as well as complementary instruments such as a Proton Transfer Reaction-Mass Spectrometer, were deployed next to existing Taiwan-EPA and PAMS (Photochemical Assessment Monitoring Stations) stations. In this study, we present preliminary results including measurements of VOCs, NOx and ozone production rates. We discuss the diurnal variability of these measurements and provide first insights into the contribution of in-situ O3 production to ambient O3 levels, as well as the main chemical pathways of ozone formation affecting an industrial-urban area in southern Taiwan.

Acknowledgments. This work was performed as part of the OSEAMS project, funded by the French National Research Agency (ANR) and the National Science and Technology Council (NSTC) in Taiwan.

How to cite: Dusanter, S., Ferrand, B., Lee, Y.-H., Jamar, M., Wang, J.-L., Lin, N.-H., Griffith, S., and Tomas, A.: Experimental investigation of the ozone budget in Taiwan during the OSEAMS campaign, EGU General Assembly 2026, Vienna, Austria, 3–8 May 2026, EGU26-16634, https://doi.org/10.5194/egusphere-egu26-16634, 2026.

EGU26-17095 | Posters on site | AS3.20

Chlorine chemistry and its impacts in the polluted urban and marine-coastal atmosphere 

Yee Jun Tham, Xinghan Zhu, and Wenxin Tao

Atmospheric chlorine radical plays essential roles in tropospheric photochemical processes, such as affecting the oxidation capacity and aerosol formation. Tropospheric chlorine chemistry was initially known to be important in the marine and polar atmosphere; nevertheless, more and more recent studies have indicated that chlorine chemistry was also active in polluted areas including the urban and marine-coastal environment. Here, we will present the vital chlorine radical precursors, such as nitryl chloride (ClNO2), molecular chlorine (Cl2) and hypochlorous acid (HOCl) that were observed recently in a typical polluted urban (Shijiazhuang) and a marine-coastal (Zhuhai) atmosphere of China. We measured significant concentrations of ClNO2, Cl2, and HOCl at the polluted urban and marine-coastal sites, showing there is active chlorine chemistry at both environments. We will discuss the formation mechanism of these species, as well as the possible of influence from anthropogenic chlorine sources. We will finally discuss their contribution the radical formation and impacts on the atmospheric oxidation capacity at both environments.

How to cite: Tham, Y. J., Zhu, X., and Tao, W.: Chlorine chemistry and its impacts in the polluted urban and marine-coastal atmosphere, EGU General Assembly 2026, Vienna, Austria, 3–8 May 2026, EGU26-17095, https://doi.org/10.5194/egusphere-egu26-17095, 2026.

EGU26-17415 | ECS | Orals | AS3.20

OH, HO2 and RO2 Radical Chemistry Across North China Plain Informed by Multi-seasonal Observations and Experimental Budgets 

Qi Zang, Cuihong Zhang, Xuefei Ma, Zhaofeng Tan, Keding Lu, Shengrong Lou, and Renzhi Hu

ROx radicals (including OH, HO2 and RO2) are central to atmospheric chemistry, governing the removal of trace gases and the formation of secondary pollutants such as ozone and secondary organic aerosols. Despite decades of research since OH radical was recognized as the core atmospheric oxidant, the chemical production and destruction processes of ROx radicals under varied NOx levels remain insufficiently constrained, limiting a mechanistic comprehension of atmospheric oxidation capacity. To address this, the Ensembled eXperiment of Atmospheric oxidation Capacity in the Troposphere (EXACT) campaign was conducted over one year across urban, regional, and background sites in the North China Plain. OH, HO2 and RO2 were measured online using an updated Peking University Laser Induced Fluorescence (PKU-LIF) system during one representative month per season (autumn, winter, spring, summer).

Preliminary results indicate that the daily maximum OH concentrations reached up to 1.5×10⁷ molecules cm-3 in summer, which is five times higher than in winter (~3×10⁶ molecules cm-3). HO2 and RO2 concentrations typically peaked at (2-3)×109 molecules cm-3 in summer across different sites, approximately an order of magnitude higher than (1-2)×108 molecules cm-3 in winter, with spring and autumn exhibiting intermediate levels. Total OH reactivity (kOH) showed distinct spatiotemporal patterns, with daily peak values ranging from 10 s-1 at the background site to over 30 s-1 at the regional site, reflecting the complex mixture of anthropogenic and biogenic VOCs. The seasonal and diurnal variability of ROx concentrations highlights distinct patterns influenced by local environmental conditions and photochemical activity. Based on the comprehensive observational datasets, we perform a detailed experimental budget analysis for individual radicals and their sum (ROx). The research quantifies the contributions of critical radical sources and sinks, and identifies the dominant chemical pathways driving ROx levels under varying NOx conditions. Our findings advance the mechanistic understanding of radical chemistry and provide observational constraints that refine current chemical mechanisms for simulating atmospheric oxidation capacity and secondary pollution formation.

How to cite: Zang, Q., Zhang, C., Ma, X., Tan, Z., Lu, K., Lou, S., and Hu, R.: OH, HO2 and RO2 Radical Chemistry Across North China Plain Informed by Multi-seasonal Observations and Experimental Budgets, EGU General Assembly 2026, Vienna, Austria, 3–8 May 2026, EGU26-17415, https://doi.org/10.5194/egusphere-egu26-17415, 2026.

EGU26-18091 | Posters on site | AS3.20

Nighttime N₂O₅ Chemistry in Fog-Influenced Urban Environments: Implications for NOₓ Removal and Aerosol Nitrate Formation 

Stephen M. Griffith, Jia-Lin Wang, and Neng-Huei Lin

Dinitrogen pentoxide (N₂O₅) plays a central role in nighttime nitrogen oxide chemistry, acting as both a temporary NOx reservoir and an efficient pathway for permanent NOₓ removal through heterogeneous uptake on to aerosols. The nitrate radical (NO₃) serves as a key intermediate linking ozone and nitrogen dioxide to N₂O₅ formation and exists only under nighttime conditions, making it a critical component of nocturnal oxidation chemistry. In this study, we examine nighttime NO3 and N₂O₅ behavior at two urban sites in Taiwan with contrasting fog frequencies, using surface observations of trace gases and meteorology together with satellite-based identification of fog and low cloud conditions. A box modeling framework was employed to estimate the nighttime evolution of NO₃ and N₂O₅ concentrations across a range of fog-likely and fog-free conditions. By comparing the nocturnal N2O5 chemistry across these conditions, we assess how the presence of liquid water modifies the partitioning of reactive nitrogen and the efficiency of nocturnal NOₓ loss. The analysis focuses on differences in inferred N₂O₅ abundance and persistence, with particular attention to conditions favorable for enhanced nitrate production. Model results indicate that efficient N₂O₅ loss to fog droplets shifts the NO₃ / NO₂ / N2O5 equilibrium, reinforcing N₂O₅ formation and accelerating reactive nitrogen removal from the gas phase. These findings underscore the importance of fog in regulating nighttime NOₓ chemistry and highlight N₂O₅ as a major pathway linking urban emissions to secondary aerosol nitrate formation.

How to cite: Griffith, S. M., Wang, J.-L., and Lin, N.-H.: Nighttime N₂O₅ Chemistry in Fog-Influenced Urban Environments: Implications for NOₓ Removal and Aerosol Nitrate Formation, EGU General Assembly 2026, Vienna, Austria, 3–8 May 2026, EGU26-18091, https://doi.org/10.5194/egusphere-egu26-18091, 2026.

EGU26-18483 | ECS | Posters on site | AS3.20

Attribution of tropical hydroxyl radical variability from amulti-species chemical data assimilation 

Pieter Rijsdijk, Kazuyuki Miyazaki, Takashi Sekiya, Henk Eskes, and Sander Houweling

The hydroxyl radical (OH) is the primary oxidizing agent in the atmosphere, making characterization of its variability essential for accurate forecasting and reanalysis of greenhouse gases and air pollutants such as methane. We seek to understand and quantify the processes governing OH anomalies, with a focus on the El Niño–Southern Oscillation (ENSO). In this presentation, we share results from the Tropospheric Chemical Reanalysis (TCR) data assimilation system, analyzed using a machine learning approach. Our results indicate that the spatio-temporal variability of monthly mean OH anomalies in the tropics from 2019-2024 can, to a large extent, be attributed to variations in nitrogen dioxide (38%), ozone (20%), carbon monoxide (15%), and specific humidity (21%). We find that anomalies in these species are linked to ENSO in both space and time. The spatial pattern of OH variability in the Tropics also shows the imprint of ENSO through these gases. When considering the time-mean OH anomaly, three variables are sufficient to explain the majority of the variance, namely nitrogen dioxide (46%), carbon monoxide (30%), and ozone (15%). These findings imply that questions regarding the contribution of the OH sink to the observed global growth rate of atmospheric methane may be addressed using only these three historically well-observed variables. Furthermore, our method delivers important new Information about regional variations in OH, required for a reliable process attribution in inverse modeling studies.   

How to cite: Rijsdijk, P., Miyazaki, K., Sekiya, T., Eskes, H., and Houweling, S.: Attribution of tropical hydroxyl radical variability from amulti-species chemical data assimilation, EGU General Assembly 2026, Vienna, Austria, 3–8 May 2026, EGU26-18483, https://doi.org/10.5194/egusphere-egu26-18483, 2026.

EGU26-20827 | Orals | AS3.20

Direct in-situ molecular speciation of atmospheric oxidized mercury in polar regions 

Tuija Jokinen, Juan Carlos Gómez Martín, Aryeh Feinberg, Anoop Mahajan, John Plane, Ulises Acuña, Juan Dávalos, Carlos Cuevas, Lauriane Quéléver, Ivo Beck, Julia Schmale, Heikki Junninen, Mikko Sipilä, Markku Kulmala, Tuukka Petäjä, and Alfonso Saiz-Lopez

Mercury is a persistent environmental pollutant with strong impacts in polar regions, where atmospheric oxidation and subsequent deposition drive ecosystem loading and human exposure via methylmercury bioaccumulation. However, atmospheric mercury chemistry remains poorly constrained because gaseous oxidized mercury (Hg(II)) has rarely been resolved at the molecular level under ambient conditions. Most field observations rely on hours-to-days preconcentration techniques that provide limited speciation and are subject to sampling artefacts, leaving key oxidation pathways and deposition estimates largely unvalidated.

Here we present novel in-situ, online molecular measurements of individual oxidized mercury species in remote polar environments. We deployed nitrate-based chemical ionization atmospheric pressure interface time-of-flight mass spectrometry (NO₃⁻ CI-APi-TOF) to detect neutral Hg(II) compounds in real time, complemented by measurements of naturally charged ambient ions (APi-TOF). Observations were conducted in Antarctica at the Aboa station (austral summer 2014–2015) and in the central Arctic during the MOSAiC expedition (spring 2020, >80°N).

In Antarctica, we observe chemically diverse Hg(II) halides, including HgCl₂, HgBr₂, BrHgCl, and iodinated species (ClHgI, BrHgI, HgI₂), with episodic enhancements reaching several hundred pg Hg m⁻³ (reported as Hg mass concentration at STP). In the central Arctic, HgBr₂ is the only Hg(II) halide detected above the limit of detection during April 2020, with concentrations up to ~80 pg Hg m⁻³ and a decline to below detection by June. HgBr₂ maxima coincide with collocated Hg⁰ depletion and ozone variability, consistent with tight coupling to springtime halogen photochemistry.

Thermodynamic calculations support stable clustering of several mercuric halides with NO₃⁻ under inlet conditions, enabling selective detection of pure halides. While the ionization efficiency implies the derived concentrations represent lower limits, the observed magnitudes agree with other polar measurements, indicating that mercuric halides are major contributors to oxidized mercury in the polar boundary layer. The dominance of HgBr₂, and the presence of iodinated Hg(II) species in Antarctica, challenge current chemical transport models that typically predict HgCl₂ and Hg(OH)₂/HOHgBr as dominant oxidized forms. Because individual Hg(II) species differ strongly in photolysis rates, solubilities, and particle uptake, these new speciation constraints imply potentially substantial shifts in predicted mercury lifetime, transport, and deposition.

Our results demonstrate that real-time molecular speciation of oxidized mercury is now feasible in remote environments and provides a critical observational foundation for improving mercury redox chemistry in models and strengthening policy-relevant assessments of polar mercury deposition.

How to cite: Jokinen, T., Gómez Martín, J. C., Feinberg, A., Mahajan, A., Plane, J., Acuña, U., Dávalos, J., Cuevas, C., Quéléver, L., Beck, I., Schmale, J., Junninen, H., Sipilä, M., Kulmala, M., Petäjä, T., and Saiz-Lopez, A.: Direct in-situ molecular speciation of atmospheric oxidized mercury in polar regions, EGU General Assembly 2026, Vienna, Austria, 3–8 May 2026, EGU26-20827, https://doi.org/10.5194/egusphere-egu26-20827, 2026.

As a key reactive iodine species, iodine monoxide (IO) plays a significant role in atmospheric oxidative capacity and particle formation. We developed a newly designed dual-optical cell Differential Optical Absorption Spectroscopy (DOAS) system to generate and measure IO radical. IO was produced through the photochemical interaction between molecular iodine (I₂) and ozone (O₃), allowing independent control of precursor and oxidant levels. By varying I2 or O₃ concentrations under stable environmental conditions, we demonstrate that IO can be generated reproducibly and maintained at steady concentrations over experimental timescales. The measured IO concentrations were subsequently used to constrain a zero-dimensional box model incorporating state-of-the-art iodine chemistry. Model development focused on revising key reaction pathways governing I₂-O₃ interactions and subsequent IO formation, motivated by discrepancies between observed and simulated IO at high oxidant levels. Adjustments to branching ratios significantly improved model performance, with correlation coefficients (R) between observed and simulated values exceeding 0.9 and slope error below 23%. The dual-optical cell DOAS system is suitable to provide a stable and reproducible IO source for instrument calibration and chemical mechanism evaluation.

How to cite: Wang, S., Yan, Y., Jiang, Z., and Zhou, B.: A newly designed dual-optical cell DOAS system for generating and measuring iodine monoxide radical and observation-constrained model development, EGU General Assembly 2026, Vienna, Austria, 3–8 May 2026, EGU26-23025, https://doi.org/10.5194/egusphere-egu26-23025, 2026.

Subtropical forest soils are global hotspots of nitrous oxide (N2O) emissions and are increasingly exposed to extreme meteorological variation. Episodic drying-rewetting events can strongly alter N cycling, yet the mechanisms by which event-scale precipitation frequency at constant precipitation amount regulate N2O production and reduction in N-saturated forests remain poorly constrained. Here, we conducted an in-situ precipitation simulation after a summer drought at the Tieshanping forest site in Southwest China under three treatments: Control without adding water, single heavy precipitation event (30 mm on the first day), and multiple precipitation event (10 mm d−1 over the first three days; same total amount as the single precipitation event).

We measured N2O fluxes together with the natural abundance N2O isotopes, δ15Nbulk and δ15NSP (i.e. 15Nα15Nβ), as well as soil moisture, KCl-extractable mineral N and water-extractable organic carbon. Isotopocule-based mapping and end-member mixing were used to partition production pathways and quantify the N2O reduction to N2. The single precipitation event rapidly increased water-filled pore space (WFPS) to more than 90% and triggered a pronounced N2O emission peak (more than 200 μg N m−2 h−1) which was dominated by denitrification, while N2O reduction remained limited. Under multiple precipitation events, the peak N2O flux was delayed and followed by strong negative fluxes (−130 μg N m−2 h−1), accompanied by a marked increase in δ15NSP (~40‰), indicating enhanced N2O reduction. Notably, cumulative N2O emissions during this 5-day simulation were highest under single precipitation events (5 mg N m−2), followed by control treatment and multiple precipitation events (3.7 and 0.8 mg N m−2, respectively).

Across all treatments, soil moisture together with availability of soil nitrate and labile carbon controlled the shifts in N2O sources and sinks we observed. Our findings provide process-level constraints on how event-scale precipitation frequency reshape N2O source-sink dynamics in N-saturated subtropical forests, and highlight the importance of incorporating precipitation frequency and intensity into predictions of forest N2O responses under future extreme climate events.

How to cite: Zhang, B., Yu, L., Wang, Y., and Homyak, P.: Precipitation frequency constrains N2O source-sink dynamics in an N-saturated subtropical forest: Insights from natural abundance N2O isotopes, EGU General Assembly 2026, Vienna, Austria, 3–8 May 2026, EGU26-407, https://doi.org/10.5194/egusphere-egu26-407, 2026.

EGU26-2292 | Orals | BG2.2

Tracing anthropogenic nitrogen deposition in Southeast Asian megacities: Isotopic evidence from Singapore and Ho Chi Minh City  

Shaoneng He, Tian-Hao Su, Xia-Yan Zhang, Kun Zhang, Thi Hiend To, Xianfeng Wang, and Xue-yan Liu

Rapid urbanization and industrialization in Southeast Asia have substantially increased emissions of reactive nitrogen (N), raising concerns over atmospheric nitrogen deposition and its environmental impacts in the region. Here, we combine nitrogen stable isotopes measurements with precipitation chemistry and flux observations to investigate the magnitude and sources of wet nitrogen deposition in two major cities, Singapore (SG) and Ho Chi Minh City (HCMC).  Both SG and HCMC exhibit high annual wet nitrogen deposition fluxes of 31.3 and 30.4 kg N ha-1 yr-1, respectively, with ammonium (NH4+) and nitrate (NO3-) as dominant components. Isotope mixing models indicate comparable contributions from fossil and non-fossil fuel sources to NOx emissions in both cities. In SG, combustion-related NH3 sources account for ~66% of NH4+ deposition, whereas in HCMC, volatilized sources such as agriculture and waste play a more significant role. Dissolved organic nitrogen was primarily attributed to biogenic emissions, including plant debris. Seasonal variations in deposition are associated with monsoon-driven transboundary transport, reflecting the regional coupling of nitrogen emissions and deposition. Our findings demonstrate the strong influence of anthropogenic activities and cross-border pollutant transport on nitrogen deposition in tropical megacities, with implications for targeted emission control strategies in rapidly urbanizing regions.

How to cite: He, S., Su, T.-H., Zhang, X.-Y., Zhang, K., To, T. H., Wang, X., and Liu, X.: Tracing anthropogenic nitrogen deposition in Southeast Asian megacities: Isotopic evidence from Singapore and Ho Chi Minh City , EGU General Assembly 2026, Vienna, Austria, 3–8 May 2026, EGU26-2292, https://doi.org/10.5194/egusphere-egu26-2292, 2026.

EGU26-6762 | Posters on site | BG2.2

Differentiating anthropogenic and geogenic carbon dioxide (CO2) sources in urban and volcanic environments. Case studies from Sicily (Italy), La Palma and Tenerife (Canary Islands, Spain) 

Roberto M. R. Di Martino, Sergio Gurrieri, Marcello Liotta, Nemesio M. Pérez, María Asensio-Ramos, Eleazar Padrón, Gladys V. Melián, Pedro A. Hernández, Carla Méndez-Pérez, Germán D. Padilla, and Beverley C. Coldwell

Although our ability to reconstruct precise atmospheric carbon dioxide (CO2) levels is currently limited to the last 800,000 years, CO2 has played a fundamental role in regulating Earth's climate and biosphere evolution since the Precambrian.

A significant rise in airborne CO2 began with the industrial revolution, driven largely by the byproduct release of hydrocarbon combustion. The resulting increase in tropospheric CO2 concentrations has led to global warming and associated climate change impacts, including rising sea levels, extreme weather events, and biodiversity loss. Urban areas, as major consumers of fossil fuels, are key contributors to rising emissions. However, in geologically active regions, natural volcanic (geogenic) emissions also contribute significantly to the local carbon budget. In such mixed environments, measurements of bulk CO2 concentration alone cannot resolve the source apportionment between geogenic and anthropogenic origins. Consequently, a combination of concentration measurements and stable isotope analysis is required to distinguish these sources effectively.

This study monitors the stable isotope composition and concentration of CO2 in Sicily (Italy) and Canary Islands (Spain). Laser-based isotope analyzers were deployed onsite to detect various CO2 isotopologues. Each instrument measured the various isotopologues of CO2 (e.g., COO, 13COO, and C18OO), and total CO2 concentration. Measurements were conducted at Palermo, in the Madonie Mountains, Puerto Naos (La Palma), and Puerto de la Cruz (Tenerife). Data were referenced hourly and calibrated daily using standard reference materials, achieving an accuracy of ± 0.25‰ for isotope compositions and ±1 ppmv for concentration.

We present a comparison of CO2 isotope compositions across diverse environmental settings. The results demonstrate that volcanic and anthropogenic emissions can be successfully distinguished based on the carbon isotope signature (δ13C-CO2) of atmospheric CO2. Furthermore, variations in both concentration and isotope composition related to latitude (sub-tropical to mid-latitude) and altitude (sea level to approximately one-hundred meters above sea level) were investigated. These findings highlight the necessity of dual-tracer monitoring (concentration and isotopes) in volcanic and urban regions to evaluate greenhouse gas emission dynamics, inform climate mitigation strategies, and assess environmental health risks.

How to cite: Di Martino, R. M. R., Gurrieri, S., Liotta, M., Pérez, N. M., Asensio-Ramos, M., Padrón, E., Melián, G. V., Hernández, P. A., Méndez-Pérez, C., Padilla, G. D., and Coldwell, B. C.: Differentiating anthropogenic and geogenic carbon dioxide (CO2) sources in urban and volcanic environments. Case studies from Sicily (Italy), La Palma and Tenerife (Canary Islands, Spain), EGU General Assembly 2026, Vienna, Austria, 3–8 May 2026, EGU26-6762, https://doi.org/10.5194/egusphere-egu26-6762, 2026.

EGU26-7145 | Posters on site | BG2.2

Development of a Highly Sensitive Laser-Induced Fluorescence Instrument for Isotopologue-resolved Measurements of Atmospheric Nitric Oxide.  

Joanna Alden, Yves Perrette, Quentin Berthome, Basile Faure, Gregoire Souhaité, Graham Boustead, and Ilann Bourgeois

Nitrogen (N) oxides (NOx= NO + NO2) are central to both climate and air quality, acting as short-lived climate forcers while driving the formation of harmful pollutants such as tropospheric ozone (O3) and particulate matter. Although fossil fuel combustion dominates global NO emissions, natural sources—including terrestrial and aquatic ecosystems—contribute an estimated 20–30% to the atmospheric NO budget.1 These natural sources remain poorly constrained, limiting confidence in surface ozone projections under future climate scenarios. Global and regional models are thought to under-estimate terrestrial contributions, particularly from soils, due to poor representation of these sources in emission inventories. Freshwater ecosystems have been considered negligible and are entirely absent from the IPCC AR6 assessment. Improved characterisation of natural NOx emissions requires new measurement approaches capable of distinguishing between different emission sources.

Isotopic analysis of N species provides a powerful tool for source attribution and process identification, as different emission pathways can imprint distinct isotopic composition. We present the development of a laser-induced fluorescence (LIF) instrument for highly sensitive, isotopologue-resolved measurement of atmospheric nitric oxide. The instrument uses a Cavity PQS Nd:YAG Cr⁴⁺:YAG microlaser with precise wavelength control near 214.8 nm to selectively excite ¹⁴N¹⁶O, ¹⁵N¹⁶O, and ¹⁴N¹⁸O by probing distinct rovibrational transitions. Through off-resonance fluorescence detection, the instrument is designed to enable differentiation of isotopologues without signal overlap, providing near-simultaneous, real-time quantification. We expect to achieve sub-pptv sensitivity, enabling measurements of natural NOx emissions in remote environments. Future perspectives include the isotopic fingerprinting of biotic and abiotic NO emissions, with broad applicability in aquatic and terrestrial biogeochemistry studies.

[1] Jaeglé et al. (2005) Faraday Discussions DOI: 10.1039/B502128F

How to cite: Alden, J., Perrette, Y., Berthome, Q., Faure, B., Souhaité, G., Boustead, G., and Bourgeois, I.: Development of a Highly Sensitive Laser-Induced Fluorescence Instrument for Isotopologue-resolved Measurements of Atmospheric Nitric Oxide. , EGU General Assembly 2026, Vienna, Austria, 3–8 May 2026, EGU26-7145, https://doi.org/10.5194/egusphere-egu26-7145, 2026.

EGU26-8150 | ECS | Orals | BG2.2

An intermediary scale setup to measure O2 fractionation factors of aquatic biosphere and application to the interpretation of the δ18O of O2 records found in deep ice cores. 

Nicolas Bienville, Amaelle Landais, Sarah Fiorini, Clément Piel, Joana Sauze, Benoit Lemaire, Nicolas Geyskens, Frédéric Prie, Olivier Jossoud, Clémence Paul, Justin Chaillot, Simon Chollet, Samuel Abiven, and Arnaud Dapoigny

Earth atmospheric O2 is mainly produced by biosphere photosynthesis, and biosphere respiration is also one of the main consumers of this gas. The evolution of atmospheric O2 is thus linked to global biosphere productivity, and in particular the isotopic composition of O218O and δ 17O). Quantitative interpretation of the isotopic composition of O2 in the past relies on robust estimate of oxygen fractionation coefficients associated with the relevant biological processes: photosynthesis and respiration. In the past decades, some determinations of these biological fractionation coefficients were performed in uncontrolled large-scale environments or at the scale of the micro-organisms in conditions very different from the natural environment. There are thus uncertainties in the applicability of the previous determinations of the O2 fractionation for the interpretation of δ18O and δ17O of atmospheric O2.

In order to come up with coherent estimates of oxygen biological fractionation coefficients applicable to the scale of plants or ecosystems, we developed closed biological chambers as a biosphere replica, with controlled environment parameters, and measured the dynamics of O2 concentration and of its isotopic composition.

Our set-up is based on round-bottom stainless steel tube of 10 cm in diameter and 88 cm in height to simulate a water column, on top of which we place a structure equipped with sensors (temperature, CO2 concentration, O2 elemental and isotopic measurements) to obtain a closed system. The multiplexing system that we developed can allow to use 6 tubes simultaneously to run replicate studies in parallel with the same environmental conditions.

We present here 3 measurement series, lasting between 2 and 9 months, run with the freshwater species, chlorella vulgaris. These measurement series permit to optimize the use of our newly developed system for aquatic closed biological chambers. We also determined the isotopic discrimination associated with 18O/16O of O2 during respiration as -30 permil which is higher than most of the previously published values. We will also compare these results with new values measured with our setup for oceanic species (the diatoms Phaeodactylum). Finally, we will use the newly determined fractionation coefficients to improve interpretation of the δ18O of O2 record in air bubbles from ice cores

How to cite: Bienville, N., Landais, A., Fiorini, S., Piel, C., Sauze, J., Lemaire, B., Geyskens, N., Prie, F., Jossoud, O., Paul, C., Chaillot, J., Chollet, S., Abiven, S., and Dapoigny, A.: An intermediary scale setup to measure O2 fractionation factors of aquatic biosphere and application to the interpretation of the δ18O of O2 records found in deep ice cores., EGU General Assembly 2026, Vienna, Austria, 3–8 May 2026, EGU26-8150, https://doi.org/10.5194/egusphere-egu26-8150, 2026.

EGU26-9266 | ECS | Posters on site | BG2.2

Cross-Ecosystem Patterns in Carbonyl Sulfide Exchange 

Felix Spielmann, Albin Hammerle, Anna De-Vries, Karolina Sakowska, and Georg Wohlfahrt

Gross primary production (GPP) is a key driver of the terrestrial carbon cycle, yet it cannot be directly measured at the ecosystem scale. Carbonyl sulfide (COS) has emerged as a promising tracer for GPP because it shares the same leaf-level diffusion pathway as CO₂ and is, with negligible re-emission, irreversibly taken up by plants through carbonic anhydrase. As a result, ecosystem-scale COS fluxes provide an independent constraint on photosynthetic CO2 uptake and offer new opportunities to evaluate and refine GPP estimates derived from eddy covariance and modeling approaches. However, uncertainties remain regarding how vegetation type, canopy structure, and environmental conditions modulate COS uptake across ecosystems. In particular, the leaf relative uptake rate (LRU) of COS and CO2 deposition velocities, commonly used to infer GPP from COS fluxes, varies across species and depends on factors such as photosynthetic active radiation and vapor pressure deficit.

Here, we present a multi-site synthesis of ecosystem-scale COS exchange measurements spanning a broad range of vegetation types and climatic conditions, including savanna (Quercus ilex), temperate mountain grassland, agricultural cropland (Glycine max.), temperate deciduous forest (Fagus sylvatica), and temperate coniferous forest (Pinus sylvestris). These sites differ markedly in plant functional types, leaf morphology, phenology, canopy structure, and typical environmental forcing, providing an ideal framework to investigate controls on COS uptake across ecosystems.

All COS fluxes are derived using eddy covariance measurements and processed with a unified workflow using the EddyUH software, ensuring methodological consistency across sites and enabling robust cross-ecosystem comparisons without confounding effects from data processing choices. This harmonized approach allows us to focus on ecosystem-specific drivers rather than methodological artifacts.

Our analysis explores how differences in plant species influence COS uptake dynamics, and how these interact with environmental drivers such as photosynthetically active radiation, vapor pressure deficit, air temperature and soil moisture.

The results presented will provide new insights into ecosystem-specific COS exchange behavior and its implications for using COS as a tracer for GPP across heterogeneous landscapes. Ultimately, this work aims to improve our understanding of how vegetation and climate jointly regulate COS fluxes and to support the broader application of COS-based approaches for constraining ecosystem-scale photosynthesis.

How to cite: Spielmann, F., Hammerle, A., De-Vries, A., Sakowska, K., and Wohlfahrt, G.: Cross-Ecosystem Patterns in Carbonyl Sulfide Exchange, EGU General Assembly 2026, Vienna, Austria, 3–8 May 2026, EGU26-9266, https://doi.org/10.5194/egusphere-egu26-9266, 2026.

Changes in atmospheric sinks could explain the renewed increase of CH4 and the simultaneous decrease in δ13C(CH4) since 2007. In this work, we present comprehensive numerical sensitivity simulations to explore how atmospheric methane oxidation (both by OH and Cl), uptake by soil, and uncertainties in the kinetic isotope effect (KIE) influence the simulated global atmospheric δ13C(CH4) trend. Furthermore, we examine the sensitivity of the latter to reduced emissions from biomass burning, which have relatively high isotopic source signatures. We use the state-of-the-art global chemistry-climate model EMAC with a simplified approach to simulate CH4 loss. The model considers all four CH4 isotopologues and the (partly temperature-dependent) isotope fractionation during  physical and chemical loss of CH4. Our setup uses recent CH4 emission inventories and accounts for regional differences in the corresponding isotopic signatures depending on source material and type of formation. Our results emphasize the importance of atmospheric sinks when interpreting the global CH4 budget with respect to δ13C(CH4).

How to cite: Nickl, A.-L., Jöckel, P., Winterstein, F., and Schmidt, A.: Modelling the impact of atmospheric sink variability and CH4 biomass burning emissions on the global mean δ13C(CH4) trend with the comprehensive chemistry-climate model EMAC., EGU General Assembly 2026, Vienna, Austria, 3–8 May 2026, EGU26-9958, https://doi.org/10.5194/egusphere-egu26-9958, 2026.

EGU26-10863 | Orals | BG2.2

Anthropogenic perturbations to atmospheric methane reflected in Greenland firn air clumped isotope measurements 

Malavika Sivan, Jiayang Sun, Patricia Martinerie, Maria Elena Popa, James Farquhar, Maarten Krol, Carina van der Veen, Bibhasvata Dasgputa, Mojhgan A. Haghnegahdar, Camilla Marie Jensen, Ji-Woong Yang, Johannes Freitag, Kévin Fourteau, Thomas Blunier, and Thomas Röckmann

Uncertainties regarding the origin of rising atmospheric methane levels underscore gaps in our understanding of the global methane cycle. The clumped isotopic composition (Δ13CH3D and Δ12CH2D2) of methane has recently been developed as an additional tracer to constrain atmospheric methanesources and sinks (1, 2). We present a novel perspective by reconstructing the clumped isotopic composition of atmospheric methane dating back to the early 1990s, based on large-volume firn air samples from the Greenland ice cap. Our measurements indicate that atmospheric ∆12CH2D2 around 1993 was 10 ± 2 ‰ lower than in the mid-2020s.

We used a two-box atmospheric model to investigate the drivers of the observed ∆12CH2D2 evolution. Emission fluxes for 1980–2024 were taken from an inversion constrained by atmospheric CH4, δ13C, and δD observations (3). However, sensitivity experiments show that this large ∆12CH2D2 increase cannot be explained by recent changes in methane source composition, as the globally averaged source ∆12CH2D2 varies by less than 1 ‰ over recent decades. Instead, the signal reflects the long-term source-sink disequilibrium effects (4). Owing to the longer atmospheric lifetime of 12CH2D2 relative to other methane isotopologues, Δ12CH2D2 responds slowly to perturbations and records changes in the methane budget over multi-decadal to centennial timescales, leading to a temporal lag relative to changes in methane concentration and bulk isotopic ratios.

Extending the simulations back to 1200 CE shows that accelerating methane emissions during industrialisation progressively drove atmospheric Δ12CH2D2 to lower values, reaching a minimum of ~40 ‰ in the late 20th century. The subsequent slowdown in methane growth after 1990 allowed partial re-equilibration, leading to the observed increase in Δ12CH2D2.Our results demonstrate that Δ12CH2D2 uniquely records the anthropogenic perturbation of the global methane cycle and suggest that the firn air samples measured in this study capture the lowest Δ12CH2D2 values of the past millennium.


  • M. Sivan, T. Röckmann, C. van der Veen, M. E. Popa, Extraction, purification, and clumped isotope analysis of methane (Δ13CDH3 and Δ12CD2H2) from sources and the atmosphere. Atmos. Meas. Tech. 17, 2687-2705 (2024).
  • M. A. Haghnegahdar et al., Tracing sources of atmospheric methane using clumped isotopes. Proceedings of the National Academy of Sciences 120, e2305574120 (2023).
  • B. Dasgupta et al., Global Methane Emission Estimates from a Dual-Isotope Inversion: New Constraints from δD-CH₄. EGUsphere 2025, 1-21 (2025).
  • P. P. Tans, A note on isotopic ratios and the global atmospheric methane budget. Gl. Biogeochem. Cycles 11, 77-81 (1997).

How to cite: Sivan, M., Sun, J., Martinerie, P., Popa, M. E., Farquhar, J., Krol, M., van der Veen, C., Dasgputa, B., Haghnegahdar, M. A., Jensen, C. M., Yang, J.-W., Freitag, J., Fourteau, K., Blunier, T., and Röckmann, T.: Anthropogenic perturbations to atmospheric methane reflected in Greenland firn air clumped isotope measurements, EGU General Assembly 2026, Vienna, Austria, 3–8 May 2026, EGU26-10863, https://doi.org/10.5194/egusphere-egu26-10863, 2026.

EGU26-11478 | ECS | Orals | BG2.2

Isotopic analysis to identify N2O production pathways and to quantify its reduction in wastewater treatment  

Hannes Keck, Laurence Strubbe, Paul M. Magyar, Andreas Froemelt, Adriano Joss, and Joachim Mohn

Nitrous oxide (N2O) emissions from biological nitrogen removal dominate the carbon footprint of the wastewater treatment (WWT) sector. Understanding both the major N2O production pathways and its reduction to dinitrogen (N2) is essential for effective mitigation. In WWT, N2O is mainly produced via three microbial pathways: (i) hydroxylamine oxidation, (ii) nitrifier denitrification, and (iii) heterotrophic denitrification; only the latter can also reduce N2O to N2. Analysis of the isotopologues, 14N15N16O, 15N14N16O, and 14N14N18O, relative to 14N14N16O, expressed in the δ notation, enables pathway identification by comparing measured signatures to reported endmember values. However, those endmember values are derived from limited pure culture or lab incubations and may not represent complex ecosystems such as those in activated sludge of WWT plants sufficiently, necessitating system-specific source signatures. This study combines isotopic analysis of produced N2O with dedicated process control to disentangle microbial pathways and quantify N2O reduction under realistic operating conditions. Online N2O isotopic measurements were performed over a one-year period using off-axis integrated cavity output spectroscopy (LGR-ABB) at two 8 m3 pilot-scale sequencing batch reactors during aeration phases treating municipal wastewater (Eawag, Dübendorf, Switzerland). Results indicate no significant contribution of hydroxylamine oxidation to N2O production, while both nitrifier and heterotrophic denitrification emit N2O under specific process conditions and are characterized by system specific isotopic endmembers. The availability of NH4+ as an electron donor is a prerequisite for nitrifier denitrification, while heterotrophic denitrification needs low dissolved oxygen (DO) concentration. Process-specific isotopic fingerprints were applied to disentangle active pathways and assess their response to pH, carbon availability, and DO. In parallel, we calculated the fraction of reduced N2O by applying the Rayleigh equation coupled with published fractionation factors to our data. N2O reduction decreased within individual aeration phases and varied between cycles. Preliminary results from explainable machine learning identified pH, temperature, NO3-, DO, and peak NO2- as key drivers of N2O reduction.  This work provides a comprehensive isotopic framework for simultaneously resolving N2O production pathways and N2O reduction dynamics in WWT, advancing process understanding and informing operational strategies to mitigate greenhouse gas emissions in the wastewater sector. 

How to cite: Keck, H., Strubbe, L., Magyar, P. M., Froemelt, A., Joss, A., and Mohn, J.: Isotopic analysis to identify N2O production pathways and to quantify its reduction in wastewater treatment , EGU General Assembly 2026, Vienna, Austria, 3–8 May 2026, EGU26-11478, https://doi.org/10.5194/egusphere-egu26-11478, 2026.

EGU26-11530 | Posters on site | BG2.2

Performance of a Counter-Current Flow Tube Method for Gaseous NH3 Collection and Isotope Analysis 

Yusuke Fujii, Ayumi Tachibana, Mugi Sawabe, Hiroto Kawashima, and Norimichi Takenaka

Ammonia (NH3), the most abundant atmospheric alkaline trace gas, plays a crucial role in fine particulate matter formation and nitrogen cycling. While agriculture is the primary source, recent studies highlight significant contributions from non-agricultural urban sources. However, NH3 spatiotemporal variability is complex and not fully understood, necessitating reliable and high time-resolution data. For more comprehensive source apportionment, combining such data with stable nitrogen isotope ratio (δ15N) analysis serves as a powerful approach.

To enable high time-resolution measurements, we previously developed a continuous measurement system using a counter-current flow tube (CCFT) technique (Huy et al., J. Atmos. Chem. 73, 223-240, 2016). Initially designed for ambient levels, its performance at elevated concentrations typical of emission sources has not yet been evaluated. In this study, we modified the CCFT measurement system to collect NH3 as ammonium (NH4+) in an aqueous solution for δ15N analysis. We evaluated its absorption efficiency and δ15N measurement accuracy across a wide range of NH3 concentrations.

Gaseous NH3 was captured in pure water using the modified CCFT sampling system (Huy et al., 2016). Sample air was drawn at 1.0 L min-1 into a vertical tube, while pure water was introduced from the top at 0.12 mL min-1. NH3 was absorbed by diffusion and dissolution into the counter flowing solution. NH4+ concentrations were determined by ion chromatography; δ15N was measured using the denitrifier method and a GasBench II system coupled to an isotope ratio mass spectrometer. Detailed procedures are provided in Kawashima et al. (Rapid Commun. Mass Spectrom. 35, e9027, 2021). To evaluate the collection efficiency and isotopic accuracy, the modified CCFT system was operated in parallel with a conventional boric acid (BA) trap system as a reference.

For concentrations measured by a BA trap ([NH3]BA) exceeding 600 μg m-3, CCFT absorption efficiencies were clearly below 1.0, whereas efficiencies nearly reached 1.0 below 300 μg m-3. The difference in δ15N of NH3 between the CCFT and BA systems increased with [NH3]BA, reaching 12.17 ‰ at 1307.1 μg m-3. This suggests that within the CCFT sampler, lighter 14NH3 is less efficiently collected than heavier 15NH3. The isotopic difference was particularly pronounced above 400 μg m-3.

How to cite: Fujii, Y., Tachibana, A., Sawabe, M., Kawashima, H., and Takenaka, N.: Performance of a Counter-Current Flow Tube Method for Gaseous NH3 Collection and Isotope Analysis, EGU General Assembly 2026, Vienna, Austria, 3–8 May 2026, EGU26-11530, https://doi.org/10.5194/egusphere-egu26-11530, 2026.

EGU26-11953 | ECS | Posters on site | BG2.2

How Well Do Nitrate Isotopes in Alpine Ice Cores Preserve Atmospheric Signals? 

Jack Saville, Julien Witwicky, Diyanath Attonde, Jiaran Zheng, Elsa Gautier, Patrick Ginot, Nicolas Caillon, and Joël Savarino

In the face of natural and anthropogenic emissions, the habitability of Earth’s atmosphere is maintained thanks to atmospheric oxidants – photochemically produced reactive species which destroy toxic pollutants, remove greenhouse gases and maintain chemical stability. Understanding the chemical dynamics of the atmosphere is hence crucial for accurate predictions of air quality and radiative forcing in a changing climate, as identified in IPCC AR6. Because the species involved are often highly reactive, studying historic atmopsheric chemistry is challenging: consequently, there is no consensus on the magnitude or the sign of the relationship between atmospheric oxidative capacity and global climate.

One avenue for past atmospheric chemistry reconstructions is isotopic analysis of nitrate – an oxidation product of atmospheric NOx – archived in non-polar ice cores. The N and O isotope compositions of ice core nitrate depend on past oxidation reactions and past NOx sources, while newly-accessible nitrate clumped isotopes may provide complementary information on nitrate formation pathways. However, useful signals can be obscured by isotopic fractionation during nitrate transport, deposition and burial, while seasonal variations in atmospheric chemistry or snow accumulation can bias ice core records. These difficulties often make ice core nitrate isotope interpretations non-unique, limiting their utility as investigative tools for past atmospheric chemistry.

To investigate the processes controlling nitrate isotopes archived in non-polar ice cores, we collected firn cores and weekly high-volume atmospheric samples at high altitude sites in the Mont-Blanc massif (France/Italy) and the Cordillera Oriental (Bolivia). Using the newly-adapted Electrospray-Orbitrap mass spectrometer, we investigated the seasonality of atmospheric nitrate isotope ratios δ15N, δ18O and Δ17O, and clumped isotopes Δ15N18O and Δ18O18O, and compared atmospheric isotopic signals to those in contemporaneously-deposited firn over an accumulation season. We find substantial seasonal isotopic variability in atmospheric nitrate, which is partially preserved in firn core records. However, several isotopic disagreements could reflect syn- or post-depositional isotopic fractionation processes, and the isotopic seasonality should be carefully considered when intepreting ice core records where accumulation is seasonal.

How to cite: Saville, J., Witwicky, J., Attonde, D., Zheng, J., Gautier, E., Ginot, P., Caillon, N., and Savarino, J.: How Well Do Nitrate Isotopes in Alpine Ice Cores Preserve Atmospheric Signals?, EGU General Assembly 2026, Vienna, Austria, 3–8 May 2026, EGU26-11953, https://doi.org/10.5194/egusphere-egu26-11953, 2026.

EGU26-12027 | ECS | Orals | BG2.2

Multi-year dual-isotope fingerprinting at South Asian receptor sites constrain carbon monoxide sources and enhanced oxidation 

Peng Yao, Henry Holmstrand, Carina van der Veen, Maria Elena Popa, Chloe A. Brashear, Krishnakant Budhavant, Mohanan Remani Manoj, Joakim Romson, Abdus Salam, Thomas Röckmann, and Örjan Gustafsson

Carbon monoxide (CO) is an indirect short-lived climate forcer with uncertainties both in sources and its role in atmospheric oxidation. Based on nine winter-long dual-isotope campaigns at two South Asian receptor sites intercepting the continental outflow, we quantified CO source contributions and emission–sink dynamics. Combustion accounts for 68–74% of South Asia regional CO (including 34–37% from biomass burning) with secondary atmospheric oxidation contributing 26–32% (dominated by oxidation of non-methane volatile organic compounds NMVOCs at 21–26% with methane oxidation contributing 5.5–6.4%). These isotope-observational constraints suggest a twice higher role for atmospheric oxidation than in model estimates. Spatially, the absolute contributions of both primary and secondary CO decrease from the Indo-Gangetic Plain (IGP) to the northern Indian Ocean, indicating enhanced oxidation near source regions, while the relative contribution of secondary CO increases. Observation-model comparison suggests that continental transport dominates CO over adjacent oceanic regions, while local production is minor. During the COVID-19 pandemic, combustion-derived CO fell sharply, NMVOC-derived CO rose, and CH4-derived CO remained stable, suggesting enhanced oxidation from reduced competition among precursors. Our results reveal a far greater contribution of CO from atmospheric oxidation in South Asia than in current model estimates, highlighting the need for sustained emission controls to deliver concurrent climate and health benefits.

How to cite: Yao, P., Holmstrand, H., van der Veen, C., Elena Popa, M., A. Brashear, C., Budhavant, K., Remani Manoj, M., Romson, J., Salam, A., Röckmann, T., and Gustafsson, Ö.: Multi-year dual-isotope fingerprinting at South Asian receptor sites constrain carbon monoxide sources and enhanced oxidation, EGU General Assembly 2026, Vienna, Austria, 3–8 May 2026, EGU26-12027, https://doi.org/10.5194/egusphere-egu26-12027, 2026.

EGU26-12183 | Posters on site | BG2.2

Towards continuous, long-term eddy covariance measurements of CO2 isotopologues 

Oisín Jelle Boersma, Nicolas Brüggemann, Matthias Claß, Anas Emad, Christian Markwitz, Youri Rothfuss, Edgar Tunsch, and Alexander Knohl

Eddy covariance measurements are a standard practice when measuring fluxes of CO2 between the surface and the atmosphere. However, they may be limited in their use for disentangling and quantifying the different contributors to these fluxes (i.e. sources and sinks). Measuring the stable isotopologue composition of the CO2 flux, using ¹³C and ¹⁸O signatures, allows for a more direct flux partitioning, based on differences in the isotopologue composition of CO2 sources in ecosystems. Yet, studies investigating isotopologue fluxes remain scarce and mostly limited to short time periods on weekly or monthly scales.

Here we present a new setup for continuous, long-term stable isotopologue eddy covariance measurements of CO2 using a quantum cascade laser absorption spectrometer and evaluate ongoing data collection over a two-year period (2025-2027) in a managed beech forest in central Germany. Furthermore, we discuss the calibration strategy and performance requirements necessary to conduct high-frequency isotopologue measurements suitable for eddy covariance applications and present first flux calculation results.

First results show that frequent instrument calibration of the isotope raw reading is critical and must be performed regularly. We identify pressure and temperature fluctuations as major sources of instrumental drift. To address this, we developed an automated calibration system that performs hourly drift corrections and daily concentration-dependence corrections to reach the precision needed for eddy covariance measurements and resolve the subtle differences in the environmental signal.

Our results highlight important methodological requirements, for continuous, long-term, isotopologue eddy covariance measurements. This work can act as a stepping stone toward the implementation of similar measurements into existing flux observation networks such as ICOS or FLUXNET. Furthermore, this represents an important step toward using stable isotopologues to better understand ecosystem-atmosphere exchange processes by characterizing greenhouse gas sources and sinks in ecosystems.

How to cite: Boersma, O. J., Brüggemann, N., Claß, M., Emad, A., Markwitz, C., Rothfuss, Y., Tunsch, E., and Knohl, A.: Towards continuous, long-term eddy covariance measurements of CO2 isotopologues, EGU General Assembly 2026, Vienna, Austria, 3–8 May 2026, EGU26-12183, https://doi.org/10.5194/egusphere-egu26-12183, 2026.

EGU26-12644 | ECS | Orals | BG2.2

High-precision determination of the temperature-dependent kinetic isotope effect for the CH4 + OH reaction 

Chih-Chang Chen, Getachew Adnew, Alexis Gilbert, Carina van der Veen, Marie Mikkelsen, Matthew Johnson, Jianghanyang Li, Maarten Krol, and Thomas Röckmann

Methane (CH4) is a strong greenhouse gas, yet its global budget remains incompletely constrained. The uncertainties in its sources and sinks limit the implementation of successful mitigation. Stable isotope analysis (δ13C-CH4 and δ2H-CH4) offers powerful constraint for methane source attribution, but the accuracy of these constraints depends on accurate values of the kinetic isotope effects (KIEs) associated with its primary removal process, reaction with the OH radical.

Here, we present new laboratory measurements of both carbon and hydrogen isotope fractionation during the CH4 + OH reaction. Our experimental design included extensive control runs to eliminate potential interferences from secondary radical species. In addition, we used kinetic chemical model and a reaction - transport model to verify that the observed fractionation results are exclusively driven by the OH oxidation.

We determined the fractionation across a wide temperature range to cover various atmospheric condition. Our data reveal a moderate but clear temperature dependence for both δ13C-CH4 and δ2H-CH4 fractionation, which is evaluated against theoretical estimates to assess its implications. These findings resolve previous literature discrepancies and provide a refined benchmark for inverse modeling applications.

How to cite: Chen, C.-C., Adnew, G., Gilbert, A., van der Veen, C., Mikkelsen, M., Johnson, M., Li, J., Krol, M., and Röckmann, T.: High-precision determination of the temperature-dependent kinetic isotope effect for the CH4 + OH reaction, EGU General Assembly 2026, Vienna, Austria, 3–8 May 2026, EGU26-12644, https://doi.org/10.5194/egusphere-egu26-12644, 2026.

EGU26-14935 | ECS | Posters on site | BG2.2

Constraining the regional and global hydrogen cycle using stable isotope measurements 

Corstian van Rijswijk, Ceres Woolley Maisch, Thomas Röckmann, and Carina van der Veen

Atmospheric molecular hydrogen (H2) is increasingly being considered as an important energy carrier in future energy systems. Due to leakages during production, storage, transport, and use of H2, a rise in atmospheric H2 levelsis expected. Such an increase may lead to a prolonged lifetime of methane, enhanced tropospheric ozone concentrations, and increased stratospheric water vapor. Although the major sources and sinks of atmospheric hydrogen are relatively well known, large uncertainties remain in the global hydrogen budget due to limited observational constraints and an incomplete understanding of the underlying processes.

Measurements of isotopic signatures of H2 provide a powerful tool to distinguish between different source and sink processes and to better constrain the hydrogen budget, for example by providing improved observational input for atmospheric models. However, recent observations of the hydrogen stable isotope (δD) remain scarce.

Here we present new measurements of atmospheric H2 and its stable isotopologue HD, carried out at the Institute for Marine and Atmospheric research Utrecht (IMAU). The system separates the H2 from the air matrix and determines its isotopic composition using isotope-ratio mass spectrometry (IRMS). The dataset includes atmospheric samples from globally distributed sampling networks, including station data and (Atlantic) ship transects, and local sources.

These new observations contribute to a better observational basis for understanding the regional and global hydrogen cycle and provide valuable input for future studies of atmospheric hydrogen.

How to cite: van Rijswijk, C., Woolley Maisch, C., Röckmann, T., and van der Veen, C.: Constraining the regional and global hydrogen cycle using stable isotope measurements, EGU General Assembly 2026, Vienna, Austria, 3–8 May 2026, EGU26-14935, https://doi.org/10.5194/egusphere-egu26-14935, 2026.

EGU26-17312 | ECS | Posters on site | BG2.2

Investigating Nitrate Formation Pathways Using Isotope Analysis in Controlled Chamber Experiments 

Kathleen A. Alden, Jack Saville, Julien Witwicky, Nicolas Caillon, Mathieu Cazaunau, Prodip Acharja, Edouard Pangui, Damien Lopez, Patrick Dewald, Lucas Beltran, Manuela Cirtog, Bénédicte Picquet-Varrault, and Joël Savarino

Atmospheric nitrate, comprising particulate NO3- and gas-phase nitric acid (HNO3), is a highly significant product of the oxidation of NOx (= NO + NO2). Its isotopic composition (Δ17O, δ18O and δ15N) provides valuable information on NOx sources and atmospheric oxidation pathways, making nitrate preserved in ice cores a proxy for past atmospheric chemical reactivity. However, the interpretation of these ice core records is currently limited by an incomplete understanding of both isotope fractionation and isotope clumping effects associated with different nitrate formation pathways.

To better constrain these effects, we conducted a series of atmospheric chamber experiments in CESAM to investigate atmospheric nitrate production via two major nocturnal formation pathways: N2O5 heterogeneous hydrolysis on aerosol particles and the oxidation of volatile organic compounds by the NO3 radical. Reactant concentrations, temperature, and humidity were monitored and controlled throughout each chamber experiment, and the resulting nitrate was collected on filters for isotope analysis. In addition, particulate NO3- formation and aerosol chemical composition were quantified simultaneously using a high-resolution time-of-flight aerosol mass spectrometer (HR-ToF-AMS), providing process-level constraints on nitrate production for each formation pathway.

This study aims to investigate whether distinct isotopic signatures arise between nitrate produced via N2O5 hydrolysis and NO3-VOC reactions. The isotopic composition of the produced nitrate (Δ17O, δ18O, and δ15N) will be analysed to quantify pathway-dependent isotope effects. In addition, a newly developed methodology using the ESI-Orbitrap mass spectrometer will be applied to measure clumped isotopes (i.e. Δ15N18O and Δ18O18O) in the produced nitrate, to evaluate whether clumped isotope signatures provide an additional constraint on nitrate formation mechanisms.

How to cite: Alden, K. A., Saville, J., Witwicky, J., Caillon, N., Cazaunau, M., Acharja, P., Pangui, E., Lopez, D., Dewald, P., Beltran, L., Cirtog, M., Picquet-Varrault, B., and Savarino, J.: Investigating Nitrate Formation Pathways Using Isotope Analysis in Controlled Chamber Experiments, EGU General Assembly 2026, Vienna, Austria, 3–8 May 2026, EGU26-17312, https://doi.org/10.5194/egusphere-egu26-17312, 2026.

EGU26-18527 | Posters on site | BG2.2

Atmospheric methane sink isotope fractionation throughout last six decades: Projections using new kinetic data and implications for CH4 budget 

Sergey Gromov, Chih-Chang Chen, Matthew Stanley Johnson, Marie Kathrine Mikkelsen, Andrea Pozzer, and Thomas Röckmann

Recent theoretical and laboratory studies [1, 2] provide new and updated estimates of carbon and hydrogen kinetic isotope effects in the gas-phase reactions removing atmospheric methane (CH4). In particular, new temperature dependence of kinetic fractionation in reactions with hydroxyl (OH) and chlorine (Cl) radicals is determined for a range of isotopomers, including the multiply substituted (clumped) ones. In this study, we use the ECHAM/MESSy Atmospheric Chemistry (EMAC) model in a comprehensive chemistry-inclusive hind-cast setup [3] to obtain projections of the nominal and effective sink fractionation in atmospheric CH4 throughout the 1960–2020 period, based on the new isotope kinetic data. Use of EMAC allows to obtain realistic spatiotemporal distribution of fractionation magnitudes resulting from convolution of temperature and sink rate distributions, further modified by atmospheric transport and mixing.

Our simulations yield a range of significantly different projections for most of the isotopomers, compared either to the literature values or to theoretical approach/laboratory data considered. The laboratory and more advanced theoretical approaches yield larger fractionations for both 13CH4 and CH3D in reactions with OH. The opposite is obtained for the reactions with Cl, however with more advanced theory being closer to the laboratory data-based estimates. For clumped isotopomers, comparison to available literature data yields no systematic relationships.

The obtained time series witness a significant (up to 1.5‰) increase in the total nominal 13CH4 sink fractionation during 1960–1990 due to the changes in the stratospheric Cl sink distribution, following the onset of anthropogenic chlorofluorocarbons (CFC) emissions. After the global ban on CFCs, a reverse gradual decrease on the order of 0.1‰/decade is projected. A similar, though much smaller in relative magnitude, evolution is estimated for CH3D. Whilst the mean OH the sink rate-weighted atmospheric temperature exhibits a slight positive trend, the Cl and O(1D) sink rates-weighted temperatures witness larger decreases, in line with tropospheric warming and stratospheric cooling occurring in the last decades. We discuss the implications and uncertainties of our findings for isotope-inclusive efforts to improve past and present CH4 atmospheric budget estimates.

References

1. M. K. Mikkelsen, et al., Kinetic isotope effects in methane oxidation reactions: temperature dependence of the OH and Cl KIEs for 13CH4, CDH3, 13CDH3, CD2H2, CD3H, and CD4 from 100 to 500 K, AGU Fall Meeting, B13N-1736, 2025. https://agu.confex.com/agu/agu25/meetingapp.cgi/Paper/1911885

2. C.-C. Chen, C. van der Veen, G. Adnew, T. Röckmann, Comparative analysis of 13CKIE and DKIE in CH4-OH reaction, AGU Fall Meeting, A21M-2178, 2025. https://agu.confex.com/agu/agu25/meetingapp.cgi/Paper/1944364

3. P. Jöckel, et al., RD1SD: EMAC CCMI-2022 hindcast simulations with specified dynamics, ERA-5, 1979-2019. World Data Center for Climate (WDCC) at DKRZ. Deposited 18 June 2024. https://doi.org/10.26050/WDCC/ESCiMo2_RD1SD


How to cite: Gromov, S., Chen, C.-C., Johnson, M. S., Mikkelsen, M. K., Pozzer, A., and Röckmann, T.: Atmospheric methane sink isotope fractionation throughout last six decades: Projections using new kinetic data and implications for CH4 budget, EGU General Assembly 2026, Vienna, Austria, 3–8 May 2026, EGU26-18527, https://doi.org/10.5194/egusphere-egu26-18527, 2026.

Atmospheric reactive nitrogen oxides including NOₓ and nitrate acquire oxygen isotope anomalies (Δ17O = δ17O - 0.52 × δ18O) through ozone-driven chemistry. Prior chemical transport modeling studies have investigated the spatiotemporal patterns of Δ17O of atmospheric nitrate, yet these approaches remain fundamentally localized as they neglect inter-grid transport effects (Alexander et al., 2020; Walters et al., 2024). Transport process can influence Δ17O both directly through mixing and indirectly by altering precursor concentrations, thereby modulating isotopic transfer during chemical reactions. However, integrating transport into Δ17O modeling has been hindered by the requirement to track multiple isotopologues per species, which would substantially increase the complexity in chemical mechanism and computational cost.

This study introduces a novel, computational efficient Δ17O modeling framework with the transport effect incorporated, in which Δ17O is treated directly as prognostic variable. The contributions of chemical and transport processes to Δ17O evolution are separated using operator splitting. The Δ17O transfer during chemistry is computed explicitly following the method of Morin et al. (2011). The Δ17O transport equations are solved using a similar numerical scheme for the Eulerian transport equation. We apply this framework within an adapted version of the PACT-1D model (Tuite et al 2021) to examine how boundary layer dynamics impact the Δ17O variability in reactive nitrogen oxides. In particular, modeled Δ17O values of atmospheric nitrate are evaluated against recent vertical profile observations. This comparison aims to improve our understanding of the controlling factors on nitrate Δ17O and to assess its utility as a proxy for atmospheric oxidation capacity.

How to cite: Jiang, Z. and Geng, L.: Exploring the impact of boundary layer dynamics on the Δ17O of reactive nitrogen oxides with the PACT-1D model, EGU General Assembly 2026, Vienna, Austria, 3–8 May 2026, EGU26-18848, https://doi.org/10.5194/egusphere-egu26-18848, 2026.

EGU26-19689 | ECS | Orals | BG2.2

Preparation and calibration of O-17 enriched nitrite isotope standards 

Tao Zhou, Sarah Albertin, Zhuang Jiang, Joel Savarino, and Lei Geng

The oxygen-17 isotope anomaly (Δ17O) serves as a powerful tool to elucidate the chemical transformation mechanisms of atmospheric reactive nitrogen species such as NO2 and HONO. Current studies employ the denuder collection methods to convert atmospheric NO2 and HONO into nitrite for isotopic analysis. However, accurate Δ17O measurement of atmospheric NO2 and HONO is hampered by the lack of internationally recognized nitrite isotope reference materials with applicable Δ17O signals. In this study, we prepared new nitrite isotope standards with nonzero Δ17O signals through oxygen isotope exchange between high-purity nitrite reagents and 17O-enriched water. Using a developed ozone oxidation calibration method, the Δ17O values of a newly prepared nitrite standard (i.e., N-Δ17O-1) and the international nitrite reference material RSIL-N10219 were determined as (69.7 ± 1.0) ‰ (n = 10, 1σ) and (-8.7 ± 0.3) ‰ (n = 11, 1σ), respectively. The two additional O-17 enriched nitrite standards were then measured and calibrated against RSIL-N10219 and N-Δ17O-1, yielding Δ17O values of (34.5 ± 0.3) ‰ (n = 6, 1σ) and (6.4 ± 0.1) ‰ (n = 8, 1σ), respectively. The δ15N and δ18O values of the three home-made nitrite isotope standards were also calibrated against international nitrite reference materials. This study introduces a new and reliable method to obtain the Δ17O values of nitrite, and the establishment of Δ17O values of nitrite standards provides a foundation for accurately assessing Δ17O variations atmospheric NO2 and HONO. The latter will facilitate the application of the Δ17O tracer in investigating atmospheric cycling of reactive nitrogen and radicals.

How to cite: Zhou, T., Albertin, S., Jiang, Z., Savarino, J., and Geng, L.: Preparation and calibration of O-17 enriched nitrite isotope standards, EGU General Assembly 2026, Vienna, Austria, 3–8 May 2026, EGU26-19689, https://doi.org/10.5194/egusphere-egu26-19689, 2026.

EGU26-22195 | ECS | Orals | BG2.2

Semi-continuous automated Δ47 measurements of atmospheric CO2 

Henrik Eckhardt, Martina Schmidt, Thomas Röckmann, and Norbert Frank

Stable isotope measurements of atmospheric CO2 are a powerful tool for partitioning contributions of different CO2 sources and sinks. In addition to the conventional tracers δ13C and δ18O, the “clumped isotope” tracer Δ47 can improve the distinction between high- and low-temperature sources of atmospheric CO₂ in urban studies. Despite its potential, Δ₄₇ measurements of atmospheric CO₂ remain sparse, particularly from long-term observations. One reason for this may be the high effort of manually processing samples for the measurement of Δ47 in atmospheric CO₂, with high precision analysis typically require several hours per sample. Here, we present an automated preparation line coupled with a dual inlet isotope ratio mass spectrometer (MAT253+). This setup enables automated extraction and purification of atmospheric CO2 and measurement of approximately five atmospheric CO₂ samples per day with sample preparation time of about 90 minutes. Over a 10-month period, the system achieved a reproducibility of ∼ 0.005 ‰ for δ13C, ∼ 0.01 ‰ for δ18O, and ∼ 0.011 ‰ for Δ47.

Regular measurements using this setup provided insight into the temporal change in atmospheric Δ47 in the semi-urban area of Heidelberg (Germany). In addition to the technical challenges, also the scientific interpretation of atmospheric Δ47 data is not straightforward, because this “clumped isotope” tracer exhibits nonlinear behavior during air-mass mixing. Consequently linear extrapolation approaches such as the traditional Keeling plots can yield biased source signature estimates. We therefore present a thorough correction procedure applicable to cases where CO₂ enhancements are too small to allow a direct nonlinear fit.

How to cite: Eckhardt, H., Schmidt, M., Röckmann, T., and Frank, N.: Semi-continuous automated Δ47 measurements of atmospheric CO2, EGU General Assembly 2026, Vienna, Austria, 3–8 May 2026, EGU26-22195, https://doi.org/10.5194/egusphere-egu26-22195, 2026.

The tropopause represents a central feature of the vertical structure of the atmosphere, marking the transition between the troposphere and stratosphere. While common definitions such as the thermal tropopause (TTP) defined by the WMO primarily rely on quantitates that  are conserved under adiabatic processes, diabatic effects resulting from radiation, cloud processes, or turbulence are also decisive for the tropopause structure.

We propose a new definition of the tropopause based on the vertical gradient of the relative humidity with respect to ice (RHi), named the RHi Gradient Tropopause (RHi-GT). The RHi-GT is determined using a simple, robust gradient method. We demonstrate that the RHi-GT definition is generally consistent with the TTP but often provides a clearer characterization. In individual profiles, the RHi-GT coincides more closely with regions that mark a clear transition in atmospheric structure, such as sharp gradients in absolute humidity or increases in static stability. Furthermore, when examining mean profiles over the 10-year period relative to the RHi-GT, both RHi and static stability show a more coherent and distinct transition between the moist troposphere and the very dry stratosphere compared to when referenced to the TTP.

How to cite: Reutter, P. and Spichtinger, P.: The frosty frontier: redefining the mid-latitude tropopause using the relative humidity over ice, EGU General Assembly 2026, Vienna, Austria, 3–8 May 2026, EGU26-1775, https://doi.org/10.5194/egusphere-egu26-1775, 2026.

EGU26-2278 | ECS | Orals | AS3.22

Diagnosing CO2 Transport in the North Atlantic Upper Troposphere: Evaluation of ICON-ART and IFS using IAGOS Observations 

Achraf Qor-el-aine, Stefan Versick, Annika Oertel, and Anna Agusti-Panareda

Vertical transport processes, such as for example associated with Warm Conveyor Belt airstreams (WCBs) which is defined as a coherent strongly ascending airstream associated with extratropical cyclones, play a critical role in determining the distribution of greenhouse gases within the Upper Troposphere and Lower Stratosphere (UTLS). This study evaluates the performance of two global numerical weather prediction models, ICON-ART (ICOsahedral Nonhydrostatic model with Aerosol and Reactive Trace gases) and IFS (Integrated Forecasting System), in simulating CO₂ mixing ratios during the winter of 2022. Model outputs with different resolutions are compared against in situ measurements from the IAGOS (The In-service Aircraft for a Global Observing System, https://iagos.aeris-data.fr/) infrastructure during transatlantic flights during a period characterised by strong latitudinal CO₂ gradients and vigorous synoptic activity.

The analysis focuses on specific flight campaigns where measured CO₂ mixing ratios exhibited distinct enhancements of 4–6 ppm above background levels in the mid-Atlantic UTLS region. To attribute these anomalies to specific meteorological features, a multi-diagnostic approach is employed. A machine learning algorithm to detect footprints of WCB inflow, ascent and outflow regions (ELIAS 2.0; Quinting et al., 2022) is utilised alongside HYSPLIT Lagrangian backward trajectories initialised from flight coordinates to characterise air mass origin relative to cyclone evolution.

Results reveal persistent model–data discrepancies during January–February 2022, with both ICON-ART and IFS underestimating observed CO₂ spikes by 1–5 ppm. Our analyses show a spatial proximity between WCB activity and elevated CO2 anomalies suggesting vertical transport of air with distinct chemical signatures from the boundary layer into the upper troposphere through the WCB air stream. Specifically, we find co-located high WCB ascent probabilities (0.4 – 0.8). Moreover, trajectory origins over eastern North America confirm that surface-influenced air masses are lifted via the WCB airstream. We hypothesise that systematic biases in simulated CO₂ distributions stem from model misrepresentation of vertical transport processes and/or uncertainties in emission inventories and natural fluxes, as well as missing chemical production of CO2 in both modelling frameworks.

These findings highlight the value of combining machine learning-based flow identification with in situ observations to diagnose transport errors in atmospheric models. As WCB activity is projected to intensify under climate change scenarios, improved representation of both synoptic-scale ascent and parametrised turbulent mixing is critical for reducing uncertainties in modelled CO₂ distributions and constraining the global carbon budget.

How to cite: Qor-el-aine, A., Versick, S., Oertel, A., and Agusti-Panareda, A.: Diagnosing CO2 Transport in the North Atlantic Upper Troposphere: Evaluation of ICON-ART and IFS using IAGOS Observations, EGU General Assembly 2026, Vienna, Austria, 3–8 May 2026, EGU26-2278, https://doi.org/10.5194/egusphere-egu26-2278, 2026.

EGU26-3004 | ECS | Orals | AS3.22

Stratospheric aerosol perturbation by tropospheric biomass burning and deep convection 

Xiaoli Shen, Justin Jacquot, Yaowei Li, Steven Sharpe, John Dykema, Gregory Schill, Kenneth Bowman, Cameron Homeyer, Matthew Fraund, Ryan Moffet, Temitope Olayemi, Jasna Pittman, Felipe Rivera-Adorno, Daniel Murphy, Jessica Smith, Alexander Laskin, Frank Keutsch, and Daniel Cziczo

The stratosphere is often considered to be dynamically stable with limited vertical exchange; however, episodic deep convection can even transport tropospheric air masses into the upper troposphere (UT) and even across the tropopause into lower stratosphere (LS). We deployed a newly developed airborne single particle mass spectrometer, Particle Analysis by Laser Mass Spectrometry – Next Generation (PALMS-NG), aboard a NASA ER-2 stratospheric aircraft to characterize aerosol particles in the UTLS during the Dynamics and Chemistry of the Summer Stratosphere (DCOTSS) mission. Here, we present observations revealing substantial perturbations of the stratospheric aerosol layer during an active convection and wildfire season in 2022.

We show that carbonaceous–sulfate particles of tropospheric origin account for up to 90% of stratospheric particles with physical diameters between 0.1 and 1.5 µm within an approximately 4 km layer above the tropopause. Approximately 43% of these stratospheric carbonaceous–sulfate particles are directly attributed to biomass burning. The injected particles are chemically complex and organic-rich, and some exhibit internally mixed signatures containing both tropospheric and stratospheric components.

Our observations further demonstrate that biomass-burning-related aerosols do not remain chemically unchanged following injections into the stratosphere. Instead, they undergo chemical mixing with stratospheric components, indicating a pronounced perturbation of the stratospheric aerosol layer driven by convective transport.

These results highlight the coupling between dynamics and chemistry in modulating UTLS aerosol populations. As wildfire frequency and intensity increase alongside enhanced deep convection in a warming climate, convective delivery of biomass-burning products to the stratosphere may become increasingly important, with implications for ozone chemistry and radiative forcing.

How to cite: Shen, X., Jacquot, J., Li, Y., Sharpe, S., Dykema, J., Schill, G., Bowman, K., Homeyer, C., Fraund, M., Moffet, R., Olayemi, T., Pittman, J., Rivera-Adorno, F., Murphy, D., Smith, J., Laskin, A., Keutsch, F., and Cziczo, D.: Stratospheric aerosol perturbation by tropospheric biomass burning and deep convection, EGU General Assembly 2026, Vienna, Austria, 3–8 May 2026, EGU26-3004, https://doi.org/10.5194/egusphere-egu26-3004, 2026.

EGU26-6306 | Posters on site | AS3.22

Transcontinental stratospheric and upper tropospheric measurements with the new GLORIA-Lite instrument 

Gerald Wetzel and the GLORIA-Lite Team

The Gimballed Limb Observer for Radiance Imaging of the Atmosphere (GLORIA) is a cooled limb-imaging Fourier-Transform spectrometer (iFTS) providing mid-infrared spectra with high spectral resolution. A newly developed, compact and uncooled version of GLORIA (called GLORIA-Lite) is significantly smaller and lighter thanks to state-of-the-art infrared sensors, tailored electronics and innovative manufacturing technology. The development of this instrument enabled the first transcontinental stratospheric balloon flight from northern Sweden via Greenland to Canada, which took place in June 2024. The objectives of observation have been primarily its technical qualification and the provision of a first imaging hyperspectral limb-emission dataset (spectral sampling 0.2 cm-1 in the wavelength range 750-1450 cm-1) from 5 to 40 km altitude as well as the retrieval of key stratospheric and tropospheric species (level-2 data).

In this contribution we will demonstrate the performance of GLORIA-Lite with regard to level-2 data, consisting of retrieved altitude profiles of a variety of trace gases. We will show examples of selected results together with uncertainty estimations, altitude resolution as well as comparisons to atmospheric model simulations.

How to cite: Wetzel, G. and the GLORIA-Lite Team: Transcontinental stratospheric and upper tropospheric measurements with the new GLORIA-Lite instrument, EGU General Assembly 2026, Vienna, Austria, 3–8 May 2026, EGU26-6306, https://doi.org/10.5194/egusphere-egu26-6306, 2026.

EGU26-6721 | Posters on site | AS3.22

The 2025 Canadian wildfires: a new formation of smoke charged vortex 

Loïc Vieille, Clair Duchamp, Gwenaël Berthet, Fabrice Jégou, Bernard Legras, and Aurélien Podglajen

With global warming, Canada is increasingly affected by extreme weather events, mainly wildfires. With more than 8.3 million hectares burned over the country, the 2025 Canadian fire season is the second-worst on record after 2023. The associated emissions injected an exceptional aerosol load in the Northern Hemisphere upper troposphere – lower stratosphere (UTLS). Part of the emitted aerosols reached the lower stratosphere and, over Europe, organized into a new “smoke-charged vortex” (SCV). SCVs – anticyclonic structures that confine polluted air into long-lived “smoke bubbles” – have already been documented and studied after the “Pacific Northwest Event” (PNE) in Canada in 2017 and the “Australian New Year” event (ANY) in Australia in 2019-2020, making the 2025 event the third such case identified to date. Once formed, their anticyclonic circulation tends to limit dilution and mixing with the ambient air, maintaining high black-carbon-rich aerosol concentrations and chemical species emitted from biomass burning – for weeks to months within these vortices. These include carbon monoxide (CO), water vapor (H2O), inorganic compounds such as nitrogen-(NOx) and chlorine-(ClOx) containing species, and a range of organic compounds such as non-methane hydrocarbons (NMHCs) and oxygenated volatile organic compounds (OVOCs), all of which play key roles in atmospheric chemistry.

In this study, we track the SCV over Europe using vorticity anomaly, analyse its aerosol burden using balloon-borne and satellite observations and characterize its chemical composition. Together, these results provide a comprehensive overview on the SCV characteristics and place the 2025 event in context with the previously documented PNE and ANY cases.

How to cite: Vieille, L., Duchamp, C., Berthet, G., Jégou, F., Legras, B., and Podglajen, A.: The 2025 Canadian wildfires: a new formation of smoke charged vortex, EGU General Assembly 2026, Vienna, Austria, 3–8 May 2026, EGU26-6721, https://doi.org/10.5194/egusphere-egu26-6721, 2026.

Convection represents a major pathway of moisture and trace species into the upper troposphere. However, the role of convection for cross-tropopause transport is still under discussion, e.g., the processes of moisture entry into the lower stratosphere. Deep convection highly perturbs the local tropopause structure, which is partly reversible. It thus can either penetrate the tropopause, injecting trace species (including water) into the stratosphere, but it can also lead to a lifting of the tropopause as the thermals from below and their adiabatic cooling reach to higher altitude.

In this study, we analyse model results on the kilometer scale of idealised deep convective events and analyse the modifications of the tropopause above convection, using both thermal as well as dynamical tropopause definitions. Furthermore, we depict how the thermal structure of the atmosphere is modified after the convective event, effectively changing the tropopause altitude. Additionally, we determine the amount of water vapour transported to elevated altitudes above the original tropopause and how much water irreversibly enters the stratosphere. The exchange also encompasses downward transport of air masses with stratospheric characteristics into the troposphere. We analyse, which factors (e.g., vertical wind shear, CAPE and the strength of the initial disturbance) show the strongest influence on the tropopause modifications and, therefore, assess the effects of deep convection for the UTLS.

How to cite: Tost, H. and Hoor, P.: Convective local tropopause modifications and entrance into the stratosphere - a modelling perspective, EGU General Assembly 2026, Vienna, Austria, 3–8 May 2026, EGU26-6812, https://doi.org/10.5194/egusphere-egu26-6812, 2026.

EGU26-6815 | ECS | Orals | AS3.22

The influence of the convection parameterisation on simulated present and future UTLS greenhouse gas distributions 

J. Moritz Menken, Patrick Jöckel, Holger Tost, Hella Garny, Adrienne Jeske, and Anja Schmidt

State-of-the-art Chemistry Climate Models (CCMs) exhibit a large model spread in their simulated chemical composition of the Upper Troposphere / Lower Stratosphere (UTLS). As the surface climate is highly sensitive to differences in greenhouse gas composition in the UTLS region, understanding and reducing this model spread is required for more confidence in climate projections. One large source of uncertainty in atmospheric simulations is the representation of convection. While heavily parameterised, convection is crucial for the water distribution in the air, the formation of clouds, and their radiative effect, as well as for the fast vertical transport in the troposphere. In addition to its direct effect on the UTLS composition, it may also have an indirect impact on transport into the stratosphere. By affecting the wind and temperature fields, convection influences the creation, propagation, and dissipation of Rossby waves that drive the Brewer-Dobson circulation in the stratosphere.

To investigate the effect of the convection parameterisation on the simulated UTLS composition, we performed sensitivity simulations with the CCM ECHAM/MESSy Atmospheric Chemistry (EMAC). Two simulations were performed under present climate conditions. The simulations are identical except for the applied convection parameterisation. The simulations were repeated, but with projected future climate boundary conditions, to investigate the effect of different convection parameterisations on the simulated UTLS composition under climate change.

Our results show that the simulated UTLS composition is highly sensitive to the applied convection parameterisation. The convective transport strength and outflow altitude vary strongly between different parameterisations, affecting the distribution of short-lived tracers in the upper troposphere as well as their transport into the tropical lower stratosphere. Significant differences in cloud and water distribution lead to changes in chemical reaction rates, particularly in the polar lower stratospheric ozone chemistry. Despite these differences, the effects of climate change on convective transport are in close agreement between the sensitivity simulations. Nevertheless, the strong coupling between temperature, water, and ozone creates large differences in the projected changes of the UTLS composition.

We found that the choice of the convection parameterisation influences the composition and the transport in the entire atmosphere, far beyond its direct effect in the troposphere.

How to cite: Menken, J. M., Jöckel, P., Tost, H., Garny, H., Jeske, A., and Schmidt, A.: The influence of the convection parameterisation on simulated present and future UTLS greenhouse gas distributions, EGU General Assembly 2026, Vienna, Austria, 3–8 May 2026, EGU26-6815, https://doi.org/10.5194/egusphere-egu26-6815, 2026.

EGU26-7037 | ECS | Orals | AS3.22

Tropical cyclones drive enhanced inorganic iodine in the mid-latitude upper troposphere 

Karolin Voss, Bärbel Vogel, Thorsten Diederich, Andreas Engel, Jens-Uwe Grooß, Timo Keber, Flora Kluge, Meike K. Rotermund, Tanja Schuck, Benjamin Weyland, André Butz, and Klaus Pfeilsticker

Halogens deplete tropospheric and stratospheric ozone, but the role of iodine remains elusive. Nevertheless, recent research has demonstrated iodine’s wide-ranging impact on tropospheric photochemistry. We report airborne measurements of atmospheric iodine oxide (IO) concentrations up to 15 km altitude from two flights of the WISE (Wave-driven ISentropic Exchange) campaign over the mid-Atlantic in September and October 2017. IO was retrieved from limb-scattered skylight in the upper troposphere (UT) using the airborne mini-DOAS instrument onboard the German High Altitude and Long Range research aircraft (HALO). Up to sixfold elevated IO mixing ratios (up to 0.6 ± 0.1 ppt) above background levels were observed in the UT in air masses transported by the category 5 hurricanes Irma and Maria, as indicated by CLaMS back-trajectory analyses. Atmospheric iodine predominantly originates from marine inorganic (I₂, HOI) and organic (CH₃I, CH₂I₂, CH₂IBr, and CH₂ICl) emissions. Our findings suggest that enhanced IO mixing ratios are likely driven by enhanced marine iodine emissions associated with high surface wind speeds in the vicinity of hurricanes, photochemical conversion of source gases into reactive iodine and efficient vertical transport of these iodine-rich air masses by tropical cyclones. Furthermore, our observations imply a potentially significant role of iodine-driven chemistry in air masses affected by tropical storms.

How to cite: Voss, K., Vogel, B., Diederich, T., Engel, A., Grooß, J.-U., Keber, T., Kluge, F., Rotermund, M. K., Schuck, T., Weyland, B., Butz, A., and Pfeilsticker, K.: Tropical cyclones drive enhanced inorganic iodine in the mid-latitude upper troposphere, EGU General Assembly 2026, Vienna, Austria, 3–8 May 2026, EGU26-7037, https://doi.org/10.5194/egusphere-egu26-7037, 2026.

EGU26-7539 | ECS | Posters on site | AS3.22

On the cause of climate model wet biases in the lowermost stratosphere 

Hongyue Wang, Paul Konopka, Astrid Kerkweg, and Felix Ploeger

Water vapor in the lowermost stratosphere (LMS) plays a critical role in the climate system, as even small perturbations can significantly affect stratospheric temperatures and the position of the subtropical and eddy-driven jets. Climate models such as the ECHAM MESSy Atmospheric Chemistry (EMAC) model simulate strong wet biases in the LMS, reaching up to 400% compared with satellite observations. The strongest biases are found in the summer hemisphere. We find that 19% of air parcels in the LMS in the EMAC simulation exceed 30 ppmv in water vapor, a feature absent in both observations and independent Lagrangian model simulations. To diagnose the origin of this bias, we perform backward trajectory simulations with the Chemical Lagrangian Model of the Stratosphere (CLaMS) to trace the pathways of LMS air parcels and sample their Lagrangian cold points (LCPs). EMAC-simulated large-scale dehydration near the tropical cold trap is consistent with the sampled LCPs and shows no indication of a moist bias. Hence, the excessive moistening must occur downstream during transport into the LMS rather than at entry into the stratosphere. We further analyze the processes contributing to the LMS model moist bias by interpolating the physical and chemical tendencies from the EMAC model along the trajectories, including convection, vertical diffusion, and methane oxidation, as well as ice water content. For the subset of anomalously moist air parcels (water vapor mixing ratios greater than 30 ppmv), these processes collectively explain at most 30% of the simulated water vapor mixing ratios. Among the model processes, ice sublimation provides the dominant contribution, followed by vertical diffusion and convection, while methane oxidation is negligible. The large unexplained residual strongly suggests that numerical diffusion during transport is the primary driver of the excessive climate model wet bias in the LMS.


How to cite: Wang, H., Konopka, P., Kerkweg, A., and Ploeger, F.: On the cause of climate model wet biases in the lowermost stratosphere, EGU General Assembly 2026, Vienna, Austria, 3–8 May 2026, EGU26-7539, https://doi.org/10.5194/egusphere-egu26-7539, 2026.

EGU26-8259 | ECS | Orals | AS3.22

Aerosols and greenhouse gases at the dynamical tropopause: Lagrangian transport and climatology 

Tuule Müürsepp, Hanna Joos, Heini Wernli, and Michael Sprenger

The upper troposphere and lower stratosphere (UTLS) serves as the transition region between the two atmospheric layers. Chemical constituents, aerosols, and water are transported in coherent airstreams or mixed from their tropospheric source regions into the UTLS. Therefore, the vertical and geographical distribution of all these constituents in the UTLS strongly depends on the transport or mixing pathways and on their (tropospheric) sources. Furthermore, during the transport constituent concentrations can be modified due to many microphysical and chemical processes. A detailed understanding about the constituent concentrations in the UTLS is needed because of their dynamic-radiative-chemical coupling, which affects atmospheric tracer distributions, the radiative budget and the dynamics of the tropopause.  

We present a 10-year climatology of selected aerosol (dust, sea salt, sulphate), tracer (CO) and greenhouse gas (CO2 and CH4) concentrations at the dynamical tropopause (2-pvu isosurface).  We make use of the Copernicus Atmosphere Monitoring Service reanalysis datasets CAMSRA and CAMS GHG and combine these Eulerian climatologies with a Lagrangian troposphere-to-stratosphere transport (TST) climatology to determine and characterize the pathways from the constituent sources to the UTLS. This way, we analyse anomalies of aerosols and greenhouse gases at the tropopause that arise from the TST, and we compare them to seasonal atmospheric composition climatology.

We show that the TST trajectories that originated from the boundary layer (deep TST) lead to stronger anomalies at the dynamical tropopause. The concentration patterns at the dynamical tropopause for different species depend on the emissions at the surface, the exact dynamical pathway from the surface to the UTLS, and the sinks and sources along the way. For example, we demonstrate that dust concentrations at the dynamical tropopause over Asia are mostly from local dust source regions but they can be enhanced with dust advection from other regions.

How to cite: Müürsepp, T., Joos, H., Wernli, H., and Sprenger, M.: Aerosols and greenhouse gases at the dynamical tropopause: Lagrangian transport and climatology, EGU General Assembly 2026, Vienna, Austria, 3–8 May 2026, EGU26-8259, https://doi.org/10.5194/egusphere-egu26-8259, 2026.

EGU26-9641 | ECS | Posters on site | AS3.22

Novel mechanism for troposphere-to-stratosphere transport due to the interaction between typhoons and orography 

Massimo Martina, Anahí Villalba Pradas, Šimon Bartoň, and Petr Šácha

Troposphere-to-Stratosphere Transport (TST) can inject anthropogenic pollutants from the Earth’s surface into the Upper Troposphere – Lower Stratosphere (UTLS), changing its chemical composition and influencing the radiative processes. Furthermore, TST may play a key role in sustaining the long-range transport of pollutants across the globe, particularly during extreme weather events. Indeed, during such events, a large quantity of pollutants can be transported from the Boundary Layer (BL) to the free atmosphere, enhancing the probability of long-range transport as the contaminants reach higher altitudes. The various mechanisms that contribute to TST have not yet been fully resolved due to the multi-scale nature of this transport process. In our study, we investigated the TST processes triggered by the transition of the typhoon Molave over the Philippines in the autumn 2020, combining a Lagrangian modeling tool with the Weather Research and Forecasting model. Our findings supported the proposal of a novel TST mechanism based on the interaction between typhoon updrafts, convection, orographic lifting, and gravity waves. Firstly, our results demonstrate that this interaction can rapidly transport air from the BL to the UTLS region, carrying a significant amount of pollutants despite deposition processes. Secondly, our work highlights the importance of gravity waves in the mixing processes close to the tropopause region. Overall, our study suggests that the interplay between typhoon episodes and mountainous regions can play an important, yet previously insufficiently considered, role in TST. This interaction influences key topics that are relevant to our society, such as the long-range dispersion of pollutants.

How to cite: Martina, M., Villalba Pradas, A., Bartoň, Š., and Šácha, P.: Novel mechanism for troposphere-to-stratosphere transport due to the interaction between typhoons and orography, EGU General Assembly 2026, Vienna, Austria, 3–8 May 2026, EGU26-9641, https://doi.org/10.5194/egusphere-egu26-9641, 2026.

EGU26-10333 | Orals | AS3.22

Balloon-based observations of trace gas composition over Europe/Germany in summer 2025, impacted by the Asian Summer Monsoon 

Christian Rolf, Johannes Laube, Markus Geldenhuys, Attahir Mainika, Bärbel Vogel, and Michaela I. Hegglin

For many important trace gases, precise observations in the upper troposphere and lower stratosphere (UTLS) are spatially and/or temporally sparse and/or inhomogeneous. This is particularly problematic since the UTLS features a highly variable transition region between the troposphere and stratosphere. We here present a new dataset obtained from weather balloon-based sensors from the Juelich Modular Balloon Observatory (JUMBO) across the summer and autumn of 2025. Between 27th May and 5th November, 46 balloons were launched on an almost weekly basis from near Jülich, Germany, typically reaching altitudes of around 30 km.  Of those, 37 flights focused on trace gas composition, including 18 near-simultaneous double launches quantifying the vertical distribution of water vapour and ozone as well as multiple halogenated species. The JUMBO campaign was planned, among other objectives, to infer the impact of the Asian summer monsoon on the UTLS over Germany during the full monsoon period. The observations thus enabling access to the temporal evolution of many key UTLS components over a period of about 5 months. Focusing on chlorinated very short-lived substances (Cl-VSLSs) and water vapor in combination with a model-based regional tracer approach, we also investigate the influence of the Asian Summer Monsoon as the respective anticyclone increasingly exports air masses into the global northern hemispheric UTLS.

How to cite: Rolf, C., Laube, J., Geldenhuys, M., Mainika, A., Vogel, B., and Hegglin, M. I.: Balloon-based observations of trace gas composition over Europe/Germany in summer 2025, impacted by the Asian Summer Monsoon, EGU General Assembly 2026, Vienna, Austria, 3–8 May 2026, EGU26-10333, https://doi.org/10.5194/egusphere-egu26-10333, 2026.

EGU26-10542 | Posters on site | AS3.22

Redistribution of total reactive nitrogen in the lowermost Arctic stratosphere in late winter 2024/2025:  Comparison with the findings during the cold winter 2015/2016 

Helmut Ziereis, Peter Hoor, Jens-Uwe Grooß, Andreas Zahn, Paul Stock, Michael Lichtenstern, Andreas Engel, and Björn-Martin Sinnhuber

Total reactive nitrogen and its distribution between the gas and particle phases are key parameters for understanding the processes controlling the ozone budget in the polar winter stratosphere. Observations in the lowermost stratosphere reflect heterogeneous processes in the stratosphere above, leading to denitrification and later to nitrification below the vortex.

In the late winter of 2025, aircraft measurements were carried out as part of the ASCCI mission (Arctic Springtime Chemistry Climate Investigations) using the HALO (High Altitude and Long-Range Research Aircraft) research aircraft from Kiruna/Sweden and Oberpfaffenhofen/Germany. Tracer-tracer correlations were used to investigate the vertical redistribution of gas-phase total reactive nitrogen.

The winter of 2024/2025 was characterized by low temperatures in the polar vortex at the beginning of the winter, which enabled the formation of polar stratospheric cloud (PSC) particles. In March, the polar vortex collapsed. The observations of total reactive nitrogen in the lowermost stratosphere showed a mixture of different fingerprints of Arctic nitrogen chemistry. Elevated levels of reactive nitrogen are indicative of the evaporation of sinking PSC particles from the middle stratosphere. On the other hand, the sinking air from the polar vortex in late winter can show considerable denitrification.

During the ASCCI field measurement campaign in March, periods of elevated reactive nitrogen concentrations alternated with periods when concentrations were lower than would be expected for undisturbed chemistry. In some cases, more than 40 % of the observed total reactive nitrogen could be attributed to evaporating PSC particles, while in other flights air masses with a deficit of about 30 % of total reactive nitrogen were measured. At the end of the observation period, air masses with undisturbed background concentrations were probed.

These results from 2025 are compared with those obtained during the POLSTRACC aircraft mission in winter 2025/2016. Both missions show similar behavior regarding the redistribution of total reactive nitrogen in the lowermost stratosphere. However, lower values were observed during the most recent mission. The present observations are also compared with CLaMS model simulations.

How to cite: Ziereis, H., Hoor, P., Grooß, J.-U., Zahn, A., Stock, P., Lichtenstern, M., Engel, A., and Sinnhuber, B.-M.: Redistribution of total reactive nitrogen in the lowermost Arctic stratosphere in late winter 2024/2025:  Comparison with the findings during the cold winter 2015/2016, EGU General Assembly 2026, Vienna, Austria, 3–8 May 2026, EGU26-10542, https://doi.org/10.5194/egusphere-egu26-10542, 2026.

EGU26-10707 | ECS | Orals | AS3.22

Climatology-based chemical tropopauses from global O3 and N2O observations since 1980 

Sophie Bauchinger, Andreas Engel, Andreas Zahn, Harald Bönisch, Hans-Christoph Lachnitt, Gisèle Krysztofiak, and Tanja Schuck

Long-term global trace gas observations can be used to define chemical tropopauses, which are not limited by the availability or resolution of vertical profiles or reanalysis data sets. Tracers that can be used for these definitions need to show clearly defined differences in stratospheric vs. tropospheric characteristics with notable examples being O3, N2O, CO or H2O.

We focus on two approaches: (1) the definition of an O3-based tropopause using a clearly defined climatology expressed as mixing ratios relative to the tropopause and (2) the filtering of stratospheric data by applying an iterative baseline filter on N2O measurements. Our objective is to provide clear, globally applicable definitions of these chemical tropopauses, that can be easily applied to new measurement data and provide a representative distance to the tropopause.

We analyse globally distributed ozone sonde measurements, as well as aircraft and balloon measurements of N2O, in combination with meteorological parameters from interpolated ERA5 reanalyses. By evaluating profiles for each month and geographical region, a representative distance to the tropopause can be assigned to any measurement of O3 or N2O. We further investigate the sensitivity of these assignments to spatial and temporal factors and apply these to separate measurement data sets.

Tropopause-relative coordinates are beneficial for trace gas analysis in regions close to the tropopause. However, this effect diminishes with greater distances. We examine for which lower and upper boundaries tropopause-relative coordinates remain beneficial.

How to cite: Bauchinger, S., Engel, A., Zahn, A., Bönisch, H., Lachnitt, H.-C., Krysztofiak, G., and Schuck, T.: Climatology-based chemical tropopauses from global O3 and N2O observations since 1980, EGU General Assembly 2026, Vienna, Austria, 3–8 May 2026, EGU26-10707, https://doi.org/10.5194/egusphere-egu26-10707, 2026.

EGU26-10858 | ECS | Orals | AS3.22

Impact of Small-Scale Gravity Waves on Tracer Transport 

Irmgard Steiger, Devadharsini Suresh, Stamen Dolaptchiev, and Ulrich Achatz

The large-scale zonal-mean transport of tracers, such as ozone and water vapor, is governed by global circulations. Because of the radiative effects of tracers, an accurate representation of their transport in climate models is essential for reliable climate simulations. Small-scale processes such as gravity waves and turbulence can significantly influence the transport and distribution of tracers. As these processes are unresolved in most weather and climate models, their effects must be parameterized. We present the novel parameterization for the direct impact of gravity waves on tracer transport (Knop et al., 2026). Using multiple-scale analysis of the governing atmospheric equations, we derive expressions for gravity wave–induced tracer fluxes, enabling a physically based parameterization. The parameterization is thoroughly validated by comparing idealized simulations with parameterized waves to wave-resolving reference simulations. Finally, we aim to extend the theory to include turbulent effects.

Knop, I., Dolaptchiev, S. & Achatz, U. (2026) Impact of small-scale gravity waves on tracer transport. Quarterly Journal of the Royal Meteorological Society, e70091. Available from: https://doi.org/10.1002/qj.70091

How to cite: Steiger, I., Suresh, D., Dolaptchiev, S., and Achatz, U.: Impact of Small-Scale Gravity Waves on Tracer Transport, EGU General Assembly 2026, Vienna, Austria, 3–8 May 2026, EGU26-10858, https://doi.org/10.5194/egusphere-egu26-10858, 2026.

Volcanic injections into the upper troposphere-lower stratosphere (UTLS) affect climate by altering Earth's radiation budget and atmospheric chemistry. However, the pathways by which mid-latitude eruptions spread globally remain poorly understood. We combine nighttime Compact Optical Backscatter Aerosol Detector (COBALD) profiles over Lhasa with ERA5-driven Chemical Lagrangian Model of the Stratosphere (CLaMS) backward trajectories and global three-dimensional sulfur dioxide (SO2)-based tracer simulations. With this integrated framework, we track the Raikoke plume (21-22 June 2019; VEI 4) as it evolved within the mature Asian Summer Monsoon Anticyclone (ASMA). Balloon-borne measurements capture the plume’s arrival, vertical spreading, and dilution by ASMA-interior air. Trajectories reveal two principal pathways from distinct Raikoke plumes: (i) an upper-level branch within the summertime stratospheric easterly flow (460-490 K) carrying the trailing filament of the vorticized volcanic plume (VVP), and (ii) a lower-level branch within the subtropical westerly jet (390-430 K) carrying the main plume. Although the ASMA can act as a transport barrier at certain potential-temperature levels, it admits in-mixing along jet-aligned filaments and redistributes aerosols internally. SO2-based tracer simulations are sensitive to how parameterized small-scale mixing is represented in CLaMS, underscoring the need to adjust subgrid-scale mixing parameterizations when model resolution changes (here, from ERA-Interim to ERA5 reanalyses). Portable Optical Particle Spectrometer (POPS) profiles over Boulder (USA) confirm the plume’s timing and altitude, providing an independent evaluation away from the ASMA region.

How to cite: Yang, Z.: Transport of volcanic aerosol from the Raikoke eruption in 2019 through the Northern Hemisphere, EGU General Assembly 2026, Vienna, Austria, 3–8 May 2026, EGU26-11329, https://doi.org/10.5194/egusphere-egu26-11329, 2026.

EGU26-11858 | ECS | Posters on site | AS3.22

Airborne Water Vapor Observations for ISSR Analysis and improved Humidity Prediction in the Upper Troposphere using the ICON Model 

Mara Montag, Stefan Kaufmann, Laura Tomsche, Marius Neumann, Carmen Emmel, and Christoph Schraff

The persistence of aircraft contrails and their climate impact are strongly controlled by the extent, lifetime, and properties of ice-supersaturated regions (ISSRs). Reliable prediction of such conditions remains challenging due to uncertainties in the representation of water vapor in numerical weather prediction models at typical cruising altitudes in the upper troposphere. In-situ airborne observations are therefore essential for evaluating model performance and assessing the potential benefit of additional humidity data sources.

This study employs three complementary data sources: (1) high-resolution in-situ water vapor measurements obtained with the Sophisticated Hygrometer for Atmospheric Research (SHARC) and a modified Water Vapor Sensing System II (WVSS-II) aboard the High Altitude and Long-Range Research Aircraft (HALO); (2) routine aircraft observations from the Aircraft Meteorological Data Relay (AMDAR) program using WVSS-II sensors; and (3) numerical weather model output from the ICON-DREAM reanalysis of the German Weather Service (DWD).

To evaluate the data quality of WVSS-II sensors on commercial aircraft, comparisons between HALO reference measurements and AMDAR observations with spatial overlap during the Arctic Springtime Chemistry Climate Investigations (ASCCI) field campaign are conducted. An indirect comparison uses the entire dataset to analyze water vapor concentration (H₂O) and relative humidity with respect to ice (RHi) as a function of potential temperature. In addition, a short parallel flight segment of HALO and a commercial flight at the same altitude was performed which allows for a direct comparison of both sensors. For both comparison approaches, agreement and variability between the datasets are assessed using statistical metrics. Furthermore, the HALO dataset is used to evaluate and quantify the representation of RHi in ICON first-guess fields, covering multiple campaign periods between 2012 and 2025 with a total of 878 flight hours.

Building on the previous steps, ongoing work investigates the use of AMDAR humidity observations in dedicated ICON data assimilation experiments to evaluate their impact on humidity prediction. Differences between routine model simulations and assimilation runs are analyzed to assess potential improvements in upper-tropospheric humidity forecasts relevant for ISSR prediction.

How to cite: Montag, M., Kaufmann, S., Tomsche, L., Neumann, M., Emmel, C., and Schraff, C.: Airborne Water Vapor Observations for ISSR Analysis and improved Humidity Prediction in the Upper Troposphere using the ICON Model, EGU General Assembly 2026, Vienna, Austria, 3–8 May 2026, EGU26-11858, https://doi.org/10.5194/egusphere-egu26-11858, 2026.

EGU26-11979 | ECS | Orals | AS3.22

The CO2 seasonal signal as a transport diagnostic in the UTLS  

Johannes Degen, Bianca C. Baier, Patrick Jöckel, Hans-Christoph Lachnitt, J. Moritz Menken, Tanja J. Schuck, Colm Sweeney, and Andreas Engel

The atmospheric distribution and variability of CO2 result from the interplay of different processes and mechanisms. Although these trace gas patterns contain valuable information on mixing and transport at different timescales, the information is difficult to extract from observed or simulated mole fractions, particularly in the upper troposphere and lower stratosphere (UTLS), due to the combination of long-term increase and the seasonal cycle of CO2.

Using a compilation of vertical trace gas profiles derived from measurements with the balloon-based AirCore technique together with ECHAM/MESSy Atmospheric Chemistry (EMAC) model data, we investigate how the seasonality of CO2 in the troposphere propagates into the lowermost stratosphere. Simulating an artificial, deseasonalised CO2 tracer enables us to separate and study the seasonal cycle in a unique way in remote areas and on a global scale. Our results show that the tropospheric CO2 seasonal cycle is strongly modulated in the extratropical UTLS region, characterised by a substantial change in amplitude, a phase shift of several months and a tilt in the shape of the seasonal cycle, which can be associated with the transport barrier related to the strength of the subtropical jet. In the stratosphere, we identified both a vertical and a horizontal “tape recorder” of the CO2 seasonal cycle. Originating in the tropical tropopause region this imprint is linked to the upwelling and the shallow branch of the Brewer-Dobson circulation.

To validate these model-based findings we developed a strategy to isolate the seasonal signal in observational data as well. This requires CO2-independent Age of Air (AoA) information to disentangle seasonality from the combined effect of transport and long-term trend. To achieve this, we choose an approach using a normalised methane vs. mean age correlation based on independent observational data. We present average vertical profiles of the isolated CO2 seasonal signal for latitude bands with sufficient AirCore measurement coverage. Statistical analyses are then used to assess the robustness and representativeness of these results and to determine whether AirCore observations can be used to constrain the CO2 seasonality in the UTLS.

How to cite: Degen, J., Baier, B. C., Jöckel, P., Lachnitt, H.-C., Menken, J. M., Schuck, T. J., Sweeney, C., and Engel, A.: The CO2 seasonal signal as a transport diagnostic in the UTLS , EGU General Assembly 2026, Vienna, Austria, 3–8 May 2026, EGU26-11979, https://doi.org/10.5194/egusphere-egu26-11979, 2026.

EGU26-12268 | Orals | AS3.22

Upper-Tropospheric pollution transport by the Asian Summer Monsoon from IASI observations 

Anne Boynard, Camille Viatte, Laura Pan, Shawn Honomichl, Angel Luque-Lazaro, Selviga Sinnathamby, Juliette Hadji-Lazaro, Warren Smith, Qing Liang, Francesco D'Amato, Silvia Viciani, Teresa Campos, and Cathy Clerbaux

The Asian Summer Monsoon (ASM) plays a major role in lifting surface pollutants into the upper troposphere, influencing air quality and climate at regional and global scales. We use 17 years (2007-2023) of carbon monoxide (CO) satellite observations from the Infrared Atmospheric Sounding Interferometer (IASI) to study variability in the ASM region. Seasonal cycles, long-term changes, and dynamical processes such as eddy shedding are analyzed to understand how pollution is transported within and beyond the ASM anticyclone.

IASI measurements show good agreement with aircraft observations from the 2022 Asian Summer Monsoon Chemical and CLimate Impact Project (ACCLIP) campaign, confirming the reliability of satellite data for assessing pollution in the upper troposphere. Climatological CO patterns reveal persistent enhancements associated with ASM circulation features, demonstrating IASI’s ability to capture monsoon dynamics over extended periods. Two case studies using IASI observations illustrate upper-tropospheric CO transport from the ASM: the first, supported by GEOS-FP (Goddard Earth Observing System – Forward Processing) simulations, shows consistent spatial structures over the Western Pacific during quiet and eddy shedding periods, while the second highlights how eddy shedding drives long-range transport of ASM-sourced CO across the Pacific towards North America.

These findings emphasize the value of long-term satellite observations for tracking upper-tropospheric pollution and understanding its regional and global impacts.

How to cite: Boynard, A., Viatte, C., Pan, L., Honomichl, S., Luque-Lazaro, A., Sinnathamby, S., Hadji-Lazaro, J., Smith, W., Liang, Q., D'Amato, F., Viciani, S., Campos, T., and Clerbaux, C.: Upper-Tropospheric pollution transport by the Asian Summer Monsoon from IASI observations, EGU General Assembly 2026, Vienna, Austria, 3–8 May 2026, EGU26-12268, https://doi.org/10.5194/egusphere-egu26-12268, 2026.

EGU26-12720 | Posters on site | AS3.22

Chlorine Chemistry and Partitioning in the arctic UT/LS during Spring 2025 from in-situ measurements during ASCCI  

Thorsten Diederich, Heiko Bozem, Elisabeth Horst, Peter Hoor, Stefan Kaufmann, Timo Keber, Stephan Kessler, Hans-Christoph Lachnitt, Mara Montag, Tanja Schuck, Laura Tomsche, Christiane Voigt, Franziska Weyland, and Andreas Engel

Chemically active chlorine species (ClOx​) play a central role in the catalytic depletion of ozone in the polar winter and spring stratosphere. Together with the reservoir species HCl and ClONO2​, they form inorganic chlorine (Cly​). The amount and partitioning of Cly strongly influences the magnitude of polar ozone loss. Trends and variability in the upper troposphere lower stratosphere region (UTLS) are of particular importance, as this region is a large contributor to lower-stratospheric ozone change.


We present new in-situ measurements from the HALO campaign ASCCI (Arctic Springtime Chemistry and Climate Investigations), obtained in spring 2025. The total organic chlorine (CCly) is directly derived from the major chlorine species measured by the Gas Chromatograph for Observational Studies using Tracers (GhOST). From these measurements, inorganic chlorine is derived, allowing an observational assessment of the chlorine budget in the Arctic UTLS. Additional in situ observations of the reservoir species HCl and ClONO2​ from the Airborne Chemical Ionisation Mass Spectrometer (AIMS) are used to constrain the abundance of chemically active chlorine (ClOx) and to investigate chlorine activation and deactivation processes during spring 2025.


The new ASCCI data are compared with observations from previous aircraft campaigns, including PGS (Arctic measurements in 2015) and SOUTHTRAC (Antarctic measurements from 2019) both performed during hemispheric springtime, allowing for an assessment of hemispheric differences between Arctic and Antarctic conditions as well as temporal changes in chlorine loading and partitioning. These comparisons place the new measurements in the context of declining stratospheric chlorine and ozone recovery.

How to cite: Diederich, T., Bozem, H., Horst, E., Hoor, P., Kaufmann, S., Keber, T., Kessler, S., Lachnitt, H.-C., Montag, M., Schuck, T., Tomsche, L., Voigt, C., Weyland, F., and Engel, A.: Chlorine Chemistry and Partitioning in the arctic UT/LS during Spring 2025 from in-situ measurements during ASCCI , EGU General Assembly 2026, Vienna, Austria, 3–8 May 2026, EGU26-12720, https://doi.org/10.5194/egusphere-egu26-12720, 2026.

EGU26-13154 | ECS | Posters on site | AS3.22

A partial column perspective on ozone and water vapor in the lowermost stratosphere from satellite observations, reanalysis, and model data 

Franziska Weyland, Peter Hoor, Daniel Kunkel, Felix Plöger, Thomas Birner, and Luis Millán

Ozone and water vapor in the lowermost stratosphere (LMS) modify the Earth’s radiative budget, influence large-scale dynamics, and affect tropospheric air quality through exchange processes at the tropopause. Despite this importance, the variability and long-term trends of LMS ozone and, in particular, water vapor (WV) remain highly uncertain. This uncertainty is compounded by variability in the thermodynamic structure of the LMS itself: extratropical tropopause height, tropical tropopause temperatures, and the latitudinal width of the tropical tropopause have all shown systematic changes in recent decades.

In this study we present an LMS partial column framework that explicitly accounts for the variable LMS boundaries and explore the partial column as an UTLS diagnostics for global observations and models.

The LMS limits are defined from ERA5 reanalysis and partial columns of ozone and WV are obtained by integrating satellite measurements from the Microwave Limb Sounder (MLS) and the Atmospheric Chemistry Experiment – Fourier Transform Spectrometer (ACE-FTS) within these limits. Unlike conventional mixing-ratio analyses, the partial column approach also incorporates the density and area effects of the spherical atmosphere.

Our analysis shows that the extratropical LMS comprises a considerable amount of the total stratospheric mass, stratospheric WV mass, and stratospheric ozone mass. The spatial and seasonal variability of LMS partial column ozone and WV is largely influenced by variations in total LMS mass. LMS partial column ozone shows very good agreement across the data sets whereas LMS partial column WV exhibits a larger spread. Calculated long-term trends result from a complex interplay of LMS mass and mixing-ratio changes.

How to cite: Weyland, F., Hoor, P., Kunkel, D., Plöger, F., Birner, T., and Millán, L.: A partial column perspective on ozone and water vapor in the lowermost stratosphere from satellite observations, reanalysis, and model data, EGU General Assembly 2026, Vienna, Austria, 3–8 May 2026, EGU26-13154, https://doi.org/10.5194/egusphere-egu26-13154, 2026.

EGU26-13578 | Posters on site | AS3.22

Additional OClO formation due to major forest fires and volcanic eruptions: comparison between TROPOMI measurements and EMAC model simulations 

Janis Pukite, Steffen Ziegler, Christoph Brühl, Andrea Pozzer, and Thomas Wagner

Chlorine dioxide (OClO) is a by-product of the ozone depleting halogen chemistry in the stratosphere and serves as an indicator of the chlorine activation in polar regions during polar winter and spring at twilight conditions because of the nearly linear dependence of its formation on chlorine oxide (ClO) and its detectability by UV-VIS spectral instruments.

The TROPOspheric Monitoring Instrument (TROPOMI) is an UV-VIS-NIR-SWIR instrument on board the Sentinel-5P satellite developed for monitoring the composition of the Earth’s atmosphere. Launched on 13 October 2017 in a near polar orbit, it provides    continuous monitoring of many constituents including the observation of OClO at an unprecedented spatial resolution.

The EMAC (ECHAM5-MESSy Atmospheric Chemistry) model is a chemistry climate model based on a general circulation model including interactive gasphase and aerosol atmospheric chemistry simulation and is nudged to the meteorology (in particular ERA5).

In this study we analyse the time series of slant column densities (SCDs) of chlorine dioxide (OClO) at polar regions and compare them with EMAC simulations in particular for the periods of the 2019/2020 Australian megafires and the Hunga volcanic eruption (January 2022).

While in the aftermath of the Australian megafires an increased, anomalous pattern of OClO is found for a period of two years no such an anomaly can be seen with respect to the Hunga eruption, both being well in agreement between the model and the measurements.


How to cite: Pukite, J., Ziegler, S., Brühl, C., Pozzer, A., and Wagner, T.: Additional OClO formation due to major forest fires and volcanic eruptions: comparison between TROPOMI measurements and EMAC model simulations, EGU General Assembly 2026, Vienna, Austria, 3–8 May 2026, EGU26-13578, https://doi.org/10.5194/egusphere-egu26-13578, 2026.

EGU26-13914 | ECS | Posters on site | AS3.22

Biomass burning in Australia: No evidence for carbonyl sulfide (OCS) enhancement in fire plumes from in-situ measurements during SouthTRAC 

Stephan Kessler, Nicolas Emig, Hans-Christoph Lachnitt, Daniel Kunkel, Heiko Bozem, Vera Bense, Philipp Joppe, Thorsten Kaluza, Jens-Uwe Grooß, Andreas Zahn, Helmut Ziereis, Martin Riese, and Peter Hoor

Determining the atmospheric abundance and the emission sources of carbonyl sulfide (OCS) plays a crucial role for the sulfur budget in the atmosphere.

In addition to its main anthropogenic and biogenic sources, biomass burning is assumed to be an essential, but not well constrained source of OCS.

From November 2019 onward extensive bushfires along the eastern coast of Australia released huge amounts of trace species into the atmosphere; during one flight of the SouthTRAC campaign air masses were observed carrying signatures of these fires along the southern coast of South America.

We present an analysis of the composition of air masses inside and outside the plume, revealing distinct differences in the trace species abundances. Specifically, our results indicate that OCS shows no enhancement in its atmospheric mixing ratio due to the Australian fires and thus highlights the varying emission strength of OCS for different types of biomass burning.

How to cite: Kessler, S., Emig, N., Lachnitt, H.-C., Kunkel, D., Bozem, H., Bense, V., Joppe, P., Kaluza, T., Grooß, J.-U., Zahn, A., Ziereis, H., Riese, M., and Hoor, P.: Biomass burning in Australia: No evidence for carbonyl sulfide (OCS) enhancement in fire plumes from in-situ measurements during SouthTRAC, EGU General Assembly 2026, Vienna, Austria, 3–8 May 2026, EGU26-13914, https://doi.org/10.5194/egusphere-egu26-13914, 2026.

EGU26-14224 | Orals | AS3.22

Long-term Changes in Global Tropopause Characteristics from GNSS-RO Observations 

Cameron Homeyer and Emily Tinney

The tropopause is an important boundary (or transition layer) for many studies in the atmospheric sciences and is an indicator of global climate change. Numerous characteristics of the tropopause have been shown to exhibit significant long-term change over the most recent 40+ year period, including height, temperature, and the occurrence of multiple tropopauses. However, prior observational studies rely mostly upon suitable records of radiosondes, which are only available over land and vary in coverage globally. Observation-based model reanalyses have been used in many studies to provide global coverage but resulting assessments of tropopause characteristics are not always consistent with observational analyses. In recent decades, the emergence of global navigational satellite system (GNSS) radio occultation (RO) atmospheric profiles provides an observational record with global coverage and fine vertical resolution necessary for tropopause analysis. The GNSS-RO data record is now approaching the period length necessary for robust assessment of long-term changes (trends). In this study, we leverage a continuous record of nearly 25 years of GNSS-RO data and apply two universal tropopause definitions, the WMO temperature lapse-rate tropopause (LRT) and the potential temperature gradient tropopause (PTGT), to evaluate global tropopause characteristics and their long-term changes. We find widespread increases in multiple tropopause frequency in the midlatitudes, consistent with several recent radiosonde and reanalysis studies. We also find regionally varying changes in tropopause height and temperature, which in some cases imply changes in the width of the tropics. Results are generally insensitive to the choice of LRT or PTGT definition. Implications of the diagnosed changes and their relationships to drivers of climate variability will be discussed.

How to cite: Homeyer, C. and Tinney, E.: Long-term Changes in Global Tropopause Characteristics from GNSS-RO Observations, EGU General Assembly 2026, Vienna, Austria, 3–8 May 2026, EGU26-14224, https://doi.org/10.5194/egusphere-egu26-14224, 2026.

EGU26-14363 | ECS | Orals | AS3.22

Using ACE-FTS to assess mixing barrier strength in nudged chemistry-climate models 

Laura Saunders, Kaley Walker, David Plummer, Diane Pendlebury, Cynthia Whaley, Naga Oshima, Patrick Sheese, Rong-You Chien, Joshua Fu, Gloria Manney, and Luis Millán

Methane is a potent greenhouse gas with an increasing trend in the atmosphere due to rising emissions. Aside from its climate impacts, it is important to monitor methane because its long lifetime of about ten years makes it a useful tracer of atmospheric transport. As a result, modelled methane fields can therefore be compared with observations to evaluate transport in atmospheric models. Several methods have been proposed for assessing the strength of the subtropical mixing barrier and the polar vortex edge using long-lived tracers, but most require high data density. In addition, it is difficult to separate the effects of mixing from those of chemical production and loss or from other aspects of atmospheric transport. In this study, we explore various methods of using methane probability density functions and time series to quantify the strength of the subtropical mixing barrier and the polar vortex edge, based on comparisons with relatively sparse satellite measurements from the Atmospheric Chemistry Experiment Fourier Transform Spectrometer (ACE-FTS). ACE-FTS is a solar occultation instrument with near-global coverage and 3–4 km vertical resolution, spanning the upper troposphere to the lower mesosphere. The focus of the comparisons is on a specified dynamics run of the Canadian Middle Atmosphere Model (CMAM39-SD) for the 2004-2018 period. In general, we find that the modelled subtropical mixing barrier is too weak in the lower stratosphere and too strong in the upper stratosphere. In contrast, CMAM39-SD reproduces methane variability near the polar vortex edge very well. To provide context, we also compare ACE-FTS with the air quality model GEM-MACH, the Earth system model MRI-ESM2, and the chemical transport model GEOS-Chem.

How to cite: Saunders, L., Walker, K., Plummer, D., Pendlebury, D., Whaley, C., Oshima, N., Sheese, P., Chien, R.-Y., Fu, J., Manney, G., and Millán, L.: Using ACE-FTS to assess mixing barrier strength in nudged chemistry-climate models, EGU General Assembly 2026, Vienna, Austria, 3–8 May 2026, EGU26-14363, https://doi.org/10.5194/egusphere-egu26-14363, 2026.

EGU26-14427 | Orals | AS3.22

Strateole 2 superpressure balloons reveal persistent errors in reanalyzed winds in the tropical lower stratosphere 

Riwal Plougonven, Pierre Cadiou, Aurélien Podglajen, Albert Hertzog, and Alexandra Mac Farlane

Winds in the tropical lower stratosphere raise difficulties for numerical weather prediction models: without geostrophy, winds decouple from temperature and direct observations are scarce. The Strateole 2 project explores the tropical lower stratosphere using superpressure balloons that drift for up to three months between 18 and 21 km altitude. Wind measurements from the technological campaign (2019–2020) and the first scientific campaign (2021–2022) are used to assess errors in the ERA5 reanalysis for latitudes between 18° S and 10° N. The comparison reveals significant errors, with standard deviations of 3.76 m s−1 for zonal and 3.24 m s−1 for meridional wind. Relative to a previous comparison in 2010, only a modest decrease of 20 % and 10 % is found, revealing the persistent difficulty of modeling winds in the tropical lower stratosphere. 

Additionally, the errors in modelled balloon trajectories are also assessed, with a focus on the predictability of the trajectories. It is shown that the initial error in the wind gives a reliable indication on the skill of the subsequent forecast. Trajectory calculations have very variable skill, with median errors after 24 h of 260 km, but a tenth of the errors larger than 600 km. Factors leading to large errors, such as initial wind error and latitude are identified. 

Certain instruments onboard Strateole 2 balloons measure features below the balloons (temperature, thin cirrus, water vapour..). While the sampling of air at balloon flight level is quasi-Lagrangian, observations of features below the balloon describe both spatial and temporal variations. In order to disentangle these and facilitate the interpretation of observations made below the balloons, we document the dispersion of air below the balloons (altitudes between about 15 and 21 km). Trajectory dispersion of air below the balloon is very variable, depending on the initial shear. The persistent errors highlight the need for regular obsevations of winds in the tropical lower stratosphere. 

Overall, we emphasize the need for caution when using trajectory calculations for process studies.


How to cite: Plougonven, R., Cadiou, P., Podglajen, A., Hertzog, A., and Mac Farlane, A.: Strateole 2 superpressure balloons reveal persistent errors in reanalyzed winds in the tropical lower stratosphere, EGU General Assembly 2026, Vienna, Austria, 3–8 May 2026, EGU26-14427, https://doi.org/10.5194/egusphere-egu26-14427, 2026.

EGU26-14483 | ECS | Orals | AS3.22

Simulated Tropical Cyclone Impacts on Upper Troposphere Lower Stratosphere Composition  

Andrea Gordon and Cameron Homeyer

Tropical cyclones (TCs) have received notable attention for their damaging hazards and impacts on the climate system. One under-investigated climate impact is stratosphere-troposphere exchange (STE) from TCs and accompanying upper troposphere and lower stratosphere (UTLS) composition change. STE irreversibly modifies the distribution and concentration of greenhouse gases such as water vapor and ozone in the UTLS, which is important for the radiation budget and climate. Prior case studies have individually identified multiple STE processes that can occur in TCs, however it remains unclear how these individual processes contribute to total STE in TCs, and how contributions vary by TC intensity and deep-layer shear. This study uses multiple idealized simulations conducted with Cloud Model 1 (CM1) to provide a more thorough understanding of STE in TCs, including the role of various STE process and how they vary based on TC intensity and deep-layer shear. UTLS composition change and STE is assessed using water vapor concentrations and a suite of custom passive tracers. Simulations suggest substantial hydration of the lower stratosphere occurs within the TC inner core, reaching up to 20 ppmv (4x stratospheric background) at 18.5 km (2 km above the tropopause). This hydration is spatially limited to the inner core of the TC due to surrounding cold temperatures near the tropopause. Overshooting tops within the TC and its inner core are shown to lead to substantial two-way transport. Downward transport of stratospheric air occurs (a) via subsidence within the eye and (b) in the upper portion of the near-tropopause outflow. Additional simulations reveal that TC intensity and deep-layer environmental wind shear are also important for TC STE.

How to cite: Gordon, A. and Homeyer, C.: Simulated Tropical Cyclone Impacts on Upper Troposphere Lower Stratosphere Composition , EGU General Assembly 2026, Vienna, Austria, 3–8 May 2026, EGU26-14483, https://doi.org/10.5194/egusphere-egu26-14483, 2026.

EGU26-15393 | Orals | AS3.22

Tropical upwelling in observations and reanalyses 

Susann Tegtmeier, Marta Abalos, and William Randel

Tropical upwelling transports air masses across the tropical tropopause into the lower stratosphere and constitutes the ascending branch of the global mean stratospheric circulation. The strength of the tropical upwelling influences the thermal characteristics and chemical composition of the lower stratosphere and the transition region between troposphere and stratosphere, the tropical tropopause layer (TTL). Given the lack of direct measurements and the small magnitude of vertical velocities, the variability and long-term changes of tropical upwelling are difficult to determine and poorly constrained in meteorological analysis data.

Here we use water vapor measurements from the MLS (Microwave Limb Sounder) instrument to determine interannual variations and long-term changes in tropical upwelling in the lower stratosphere for 2005-2023. Our upwelling estimates represent an effective vertical transport velocity and provide an estimate of the speed of the vertical branch of the stratospheric circulation. We show that interannual variations of the tropical upwelling are anti-correlated with TTL temperatures derived from Global Navigation Satellite System – Radio Occultation (GNSS-RO) measurements with warmer (colder) temperatures coinciding with years of less (more) upwelling. A regression analysis results in a negative upwelling trend of  consistent with positive temperature trends in the TTL. Upwelling is also found to be anti-correlated with independent time series of ozone and other gases in the lower stratosphere.

We compare the observational upwelling estimates to residual vertical velocity from four reanalysis and find very good agreement of the interannual variability between all data sets. The reanalysis eddy and momentum fluxes are used to investigate the impact of extratropical waves on tropical upwelling. Our analysis shows that a large fraction of the interannual variability in tropical upwelling is associated with waves propagating meridionally into the subtropical stratosphere.

How to cite: Tegtmeier, S., Abalos, M., and Randel, W.: Tropical upwelling in observations and reanalyses, EGU General Assembly 2026, Vienna, Austria, 3–8 May 2026, EGU26-15393, https://doi.org/10.5194/egusphere-egu26-15393, 2026.

EGU26-15566 | ECS | Posters on site | AS3.22

Characterizing Organic Stratospheric Aerosols by Functional Group Analysis from the SABRE 2023 Campaign 

Sophie Abou-Rizk, Yaowei Li, Tae Cooper, Michael Gee, Zezhen Cheng, Swarup China, Zhenli Lai, Brian O'Callahan, Gregory Vandergrift, and Frank Keutsch

Stratospheric aerosols play a crucial role in atmospheric chemistry and climate through heterogeneous chemical reactions and radiative forcing. Although sulfate aerosols in the stratosphere have been extensively studied, the organic fraction remains poorly characterized, despite its potential importance for both climate and chemical processes.

The Stratospheric Aerosol Processes, Budget, and Radiative Effects (SABRE) 2023 campaign deployed the WB-57 high-altitude aircraft with a payload designed to improve characterization of stratospheric aerosols. Aerosol particles with aerodynamic diameters between 0.18 and 3.2 μm were collected using a cascade impactor (Mini-MOUDI 135, MSP) for offline analysis. We apply Scanning Transmission X-ray Microscopy coupled with near-edge X-ray absorption fine structure (STXM-NEXAFS) to characterize the composition and morphology of individual stratospheric aerosol particles. Carbon K-edge spectra are used to classify particles by organic carbon, elemental carbon, and inorganic content, enabling investigation of aerosol mixing state, morphology, and carbon functional group distributions. NEXAFS analysis also measures potential tracers, such as potassium associated with biomass burning, and other anthropogenic organic species. Using a radial distance shell-based classification scheme, we present preliminary results highlighting the complexity and diversity of particle morphologies. These microphysical properties help constrain the impacts of stratospheric aerosols on radiative forcing and ozone chemistry. We compare results across multiple flights, distinguishing aerosols sampled within and outside the polar vortex. Together, these observations advance our understanding of the chemical and radiative roles of stratospheric aerosols in Earth’s atmosphere.

How to cite: Abou-Rizk, S., Li, Y., Cooper, T., Gee, M., Cheng, Z., China, S., Lai, Z., O'Callahan, B., Vandergrift, G., and Keutsch, F.: Characterizing Organic Stratospheric Aerosols by Functional Group Analysis from the SABRE 2023 Campaign, EGU General Assembly 2026, Vienna, Austria, 3–8 May 2026, EGU26-15566, https://doi.org/10.5194/egusphere-egu26-15566, 2026.

EGU26-16654 | Posters on site | AS3.22

Empirical air mass budgets in the winter-spring lower stratosphere from in-situ measurements during ASCCI, SouthTRAC and POLSTRACC missions 

Peter Hoor, Franziska Weyland, Vera Bense, Heiko Bozem, Jonas Blumenroth, Nico Emig, Daniel Kunkel, Hans-Christoph Lachnitt, Andreas Engel, Philipp Joppe, Linda Ort, Valentin Lauther, Felix Ploeger, Bjoern-Martin Sinnhuber, Johannes Strobel, Michael Volk, Helmut Ziereis, Andreas Zahn, and Martin Riese

The composition of the UTLS plays a critical role in shaping Earth’s radiation budget, large-scale dynamics, and not least surface weather and air quality. Yet, its high spatiotemporal variability - driven by diverse transport and mixing pathways on different time scales - remains poorly quantified, limiting predictive capabilities.

In this study, we use a trace gas budget approach to quantify contributions of different transport and mixing pathways into the lowermost stratosphere (LMS). Especially the contribution of aged and partially chemically processed polar vortex air masses is difficult to determine due to isentropic transport and mixing with air masses originating in the extratropical troposphere.

We present an empirical approach using in-situ N2O, NOy, SF6 and CO measurements from three winter-to-spring aircraft campaigns using the HALO aircraft (ASCCI 2025, SouthTRAC 2019 and POLSTRACC 2016). We apply the contrasting trace gas lifetimes (N₂O: ~100 years; CO: ~months) to partition LMS air masses into three dynamically distinct fractions constituting of 1) a tropospheric fraction of air transported and mixed across the extratropical tropopause, 2) a stratospheric fraction, originating from diabatic downwelling and 3) a further separation of the stratospheric contribution accounting for vortex and extra-vortex air.

We present climatologies of the individual contributions, comparing the three campaigns. A focus is set on the evolution of the vortex fraction from winter to spring. Furthermore, robust validation against independent CH₄, SF6 and NOy measurements builds confidence in the framework’s ability to reconstruct distributions of other long-lived species from the three resolved fractions. We furthermore argue that the N2O-CO budget approach provides a quantitative, observation-based separation of LMS transport pathways, enabling improved evaluation of climate models and process studies.

How to cite: Hoor, P., Weyland, F., Bense, V., Bozem, H., Blumenroth, J., Emig, N., Kunkel, D., Lachnitt, H.-C., Engel, A., Joppe, P., Ort, L., Lauther, V., Ploeger, F., Sinnhuber, B.-M., Strobel, J., Volk, M., Ziereis, H., Zahn, A., and Riese, M.: Empirical air mass budgets in the winter-spring lower stratosphere from in-situ measurements during ASCCI, SouthTRAC and POLSTRACC missions, EGU General Assembly 2026, Vienna, Austria, 3–8 May 2026, EGU26-16654, https://doi.org/10.5194/egusphere-egu26-16654, 2026.

EGU26-16920 | ECS | Posters on site | AS3.22

Organophosphates in the UTLS - Understanding the link between meteorology and occurrence of anthropogenic aerosol tracers 

Anna Breuninger, Christian Rolf, Patrick Konjari, Heiko Bozem, Nicolas Emig, Peter Hoor, Anette Miltenberger, Laurin Merkel, Arthur Kutschka, Philipp Waleska, Stefan Hofmann, Thorsten Hoffmann, and Alexander L. Vogel

The chemical composition throughout the atmosphere changes as a consequence of urbanization, developing industry and anthropogenic activities.  Especially the upper troposphere and lower stratosphere (UTLS) is highly sensitive to these changes in chemical composition. With increasing anthropogenic emissions, the urgency to understand the changing chemical composition and its impact on the UTLS grows.

Organophosphates are one of the most prominent anthropogenic tracers, as they are solely man-made and found ubiquitously in the environment. They are widely used as flame retardants and plasticizers and have already been found in pristine environments such as the Arctic and are considered as chemicals of emerging concern. So far, they have been studied in air, water, sediment, and sludge and their human exposure and human and ecological risk has been assessed (Wang et al. 2020). Research on outdoor air and particle-bound organophosphates has been steadily growing over the years, however, the UTLS remains a poorly studied region.

In this study, we target the question of how meteorological conditions influence the chemical composition and thereby use organophosphates as anthropogenic tracers throughout the UTLS. Here, we present results from the TPEx campaign, conducted during June 2024 over Germany. Results from eight scientific flights, probing different regions of the UTLS during different meteorological conditions, were analyzed. With our in-house developed and manufactured Sampler for Organic Aerosol Particles (SOAP), we were able to collect a total of 27 filters throughout the whole campaign. Subsequently using ultra-high performance liquid chromatography, coupled with high-resolution Orbitrap mass spectrometry, we analyzed the organic fraction of aerosols. With this setup a non-target analysis allowed for the identification of unknown compounds and especially yet understudied organophosphates in the UTLS.

We identified five distinct meteorological conditions by using tracer-tracer correlations, cloud water content as well as water vapor content and categorized each filter respectively. For each meteorological condition, a distinct chemical composition was identified using molecular fingerprinting. As a first result, compounds like C8H19O4P and C8H19O3PS, which are found in the troposphere as well as the stratosphere, seem to disappear during cloudy conditions and are less abundant in combination with high water vapor mixing ratios. Simultaneously, a mix of thiophosphates, which are possible transformation products of organophosphates, becomes more abundant during high water vapor mixing ratios. We further aim to quantify various organophosphates and transformation products to understand occurrence, transportation and potential global distribution, as they are unambiguous tracers for the anthropogenic impact.


Wang, X., Zhu, Q., Yan, X., Wang, Y., Liao, C., Jiang, G. (2020c). A review of organophosphate flame retardants and plasticizers in the environment: Analysis, occurrence and risk assessment. Sci. Total Environ. 731, 139071. https://doi.org/10.1016/j.scitotenv.2020.139071

How to cite: Breuninger, A., Rolf, C., Konjari, P., Bozem, H., Emig, N., Hoor, P., Miltenberger, A., Merkel, L., Kutschka, A., Waleska, P., Hofmann, S., Hoffmann, T., and Vogel, A. L.: Organophosphates in the UTLS - Understanding the link between meteorology and occurrence of anthropogenic aerosol tracers, EGU General Assembly 2026, Vienna, Austria, 3–8 May 2026, EGU26-16920, https://doi.org/10.5194/egusphere-egu26-16920, 2026.

The Arctic Springtime Chemistry Climate Investigations (ASCCI) aircraft campaign studied processes in the Arctic upper troposphere and lower stratosphere and their impact on midlatitudes in a changing climate. It was conducted between February and early April 2025 as a coordinated research effort by several German Universities and research institutes.

For the ASCCI mission, the German High Altitude and Long-Range Research Aircraft HALO was equipped with a payload consisting of a mixture of in-situ and remote sensing instruments, allowing for a detailed chemical and dynamical characterization of the lowermost polar stratosphere during late winter to early spring 2025. The campaign was especially designed to complement information from the POLSTRACC campaign carried out with HALO during the Arctic winter 2015 to 2016, and the SouthTRAC campaign in 2019 which was aimed at studying the Antarctic lower polar stratosphere during late winter and early spring. Our main aims were to study (i) the inter-annual variability of Arctic lower stratospheric ozone depletion in comparison to POLSTRACC, (ii) high latitude stratosphere-troposphere exchange and the structure of the high latitude tropopause and (iii) the impact of short-lived climate pollutants (ozone, aerosols) and their precursors on the Arctic upper troposphere.

The Arctic winter 2024/2025 was characterized by a record-cold mid-winter period, followed by an early stratospheric warming from which the polar vortex only partly recovered. Despite this warming, we were able to observe signs of heterogeneous redistribution of nitrogen species and of chemical ozone depletion. We will present an overview of the flights carried out during ASCCI and first results of the observations.


The ASCCI team

University of Mainz, Institute for Physics of the Atmosphere

Franziska Weyland, Peter Hoor, Vera Bense, Heiko Bozem, Jonas Blumenroth, Hans-Christoph Lachnitt,

Forschungszentrum Jülich (FZJ)

Jens-Uwe Grooß, Michaela Hegglin, Marc von Hobe, Tom Neubert, Felix Ploeger, Markus Retzlaff,     Christian Rolf, Georg Schardt, Nicole Spelten, Martin Riese, Sebastian Rhode, Joern Ungermann.

University of Wuppertal

Michael Volk, Valentin Lauther, Johannes Strobel, Ronja von Luijt.

Deutsches Zentrum für Luft- und Raumfahrt (DLR)

Georgios Dekoutsidis, Andreas Fix, Silke Groß, Konstantin Krüger, Andreas Schäfler, Martin Wirth, Stefan Kaufmann, Mara Montag, Elisabeth Horst, Laura Tomsche, Christiane Voigt, Helmut Ziereis.

Karlsruhe Institute of Technology (KIT)

Bastian Kirsch, Simone Scheer, Florian Obersteiner, Andreas Zahn, Felix Friedl-Vallon, Michael Höpfner, Wolfgang Woiwode, Erik Kretschmer, Georg, Wetzel, Anne Kleinert, Guid Maucher, Hans Nordmeyer, Christog Piesch, Franziska Trinkl.

University of Heidelberg

Benjamin Weyland, Karolin Voss, Maximilain Albrecht, Andre Butz, Klaus Pfeilsticker

How to cite: Engel, A. and Sinnhuber, B.-M.: The Arctic Springtime Chemistry Climate Investigations – ASCCI aircraft campaign – an overview, EGU General Assembly 2026, Vienna, Austria, 3–8 May 2026, EGU26-17846, https://doi.org/10.5194/egusphere-egu26-17846, 2026.

EGU26-17925 | ECS | Posters on site | AS3.22

In situ observations of turbulent cross-tropopause mixing of cirrus particles at the jet stream over the North Sea 

Nicolas Emig, Armin Afchine, Heiko Bozem, Peter Hoor, Martina Krämer, Hans-Christoph Lachnitt, Annette Miltenberger, Holger Tost, and Yun Li

The composition of the extratropical transition layer (ExTL), in particular the mixing ratios of ozone and water vapor, has a high impact on the radiative budget of the atmosphere. It is characterized by states originating from merging and mixing of tropospheric and stratospheric characteristics. The transport pathways into the ExTL governing this composition are (1) quasi-isentropic mixing at the subtropical jet with sources in the higher tropical troposphere, (2) diabatic downwelling as part of the overturning circulation with sources in the stratosphere and (3) diabatic transport and mixing across the extratropical tropopause with sources in the extratropical troposphere. The pathway (3) is partially suppressed by the high static stability above the tropopause, such that only strong diabatic processes are able to facilitate mixing between the troposphere and the ExTL.
Here we present in situ measurements taken during the TPEx campaign in summer 2024 over the North Sea, that provide evidence for turbulent mixing across the tropopause caused by strong wind shears above the jet stream. The measurements are complemented by Lagrangian analyses of ICON (icosahedral non‐hydrostatic) model simulations which yield atmospheric context and history of the probed airmasses. We use measurements of N2O, CO, O3 and H2O as well as ice particles to confirm cross-tropopause mixing with special emphasis on the simultaneous occurrence of ice particles in subsaturation and stratospheric chemical signature of the probed air mass. For the identification of turbulence as the responsible process we use high resolution acceleration measurements that are in good agreement with the occurrence and strength of simulated turbulence from ICON. The Lagrangian analysis shows suitable conditions for the turbulent mixing of cirrus particles an hour before the measurements.
This analysis confirms the occurrence of cross-tropopause mixing caused by shear induced turbulence at the jet stream. This process is sufficiently fast to transport ice particles into the strongly subsaturated lower stratosphere where they are sampled before complete evaporation. Thus this turbulent mixing represents a possible transport pathway of tropospheric air, and therefore a source of water, into the ExTL.

How to cite: Emig, N., Afchine, A., Bozem, H., Hoor, P., Krämer, M., Lachnitt, H.-C., Miltenberger, A., Tost, H., and Li, Y.: In situ observations of turbulent cross-tropopause mixing of cirrus particles at the jet stream over the North Sea, EGU General Assembly 2026, Vienna, Austria, 3–8 May 2026, EGU26-17925, https://doi.org/10.5194/egusphere-egu26-17925, 2026.

EGU26-20116 | ECS | Orals | AS3.22

Transport and mixing of pollutants into the Arctic LMS derived from HAGAR-V in situ observations of a wide range of trace gases during the HALO ASCCI mission 

Johannes Strobel, Ronja van Luijt, Valentin Lauther, Franziska Weyland, Heiko Bozem, Stephan Kessler, Peter Hoor, and C. Michael Volk

Transport and mixing strongly determine the trace gas composition of the Arctic upper troposphere / lower stratosphere (UTLS), but spatial and temporal variability of the relevant processes are still not well quantified. The Arctic lowermost stratosphere (LMS) is fed via, and thus controlled by, various transport paths from regions with very differing chemical composition - young tropospheric air from the subtropics or even directly from the boundary layer, to photochemically very old air descending slowly from the mid- and high-latitude stratosphere. The HALO aircraft mission ASCCI conducted from Kiruna, Sweden in late winter and early spring 2025 aimed at investigating transport and mixing processes and time scales in the Arctic UTLS region, especially stratosphere-troposphere exchange, and the role of chemistry and tropospheric pollution for ozone in the Arctic UTLS. For answering these questions, measuring a wide range of trace gases with different source regions and chemical lifetimes ranging from days to many years is crucial.

We present a survey of first results of in situ tracer measurements made with the High Altitude Gas AnalyseR - five channel version (HAGAR-V) instrument. HAGAR-V measured a suite of more than 30 trace gases including very short-lived NMHCs (e.g. Benzene, C2H2, C4H10), halogenated VOC (e.g. CH2Cl2, CHCl3, C2Cl4, CH2Br2), as well as longer-lived halocarbons (e.g. CH3Cl, CH3Br, CCl4, Halons, HCFCs, and HFCs) every 120 s using in-flight gas chromatography and mass spectrometry. Further very long-lived species, including the age-of-air tracer SF6, were measured every 40 s (CFC-12, SF6) and every 80 s (CFC-11, CFC-113, H1211) using electron capture detection. Additionally, very precise CO2 measurements by a NDIR analyser were conducted at high time resolution (5 s).

Using tracer-tracer relations of short-lived pollutants with long-lived tracers, we can distinguish between different transport and mixing processes in the Arctic UTLS. Besides observing mixing of fresh tropospheric air with older stratospheric air at the extratropical tropopause, we also identified rather young (several months) air transported from the tropical tropopause layer (TTL) to the high latitude stratosphere and mixing with old polar air at potential temperatures about 380 K. We also observed pollution by short-lived chlorinated substances such as CH2Cl2, CHCl3, C2Cl4 and 1,2-dichloroethanein the Arctic, likely from both regional and remote sources. Besides the analysis of transport processes, we also derived the mean age of air both from SF6 and CO2. Using both species independently increases the reliability of the calculated ages significantly.

How to cite: Strobel, J., van Luijt, R., Lauther, V., Weyland, F., Bozem, H., Kessler, S., Hoor, P., and Volk, C. M.: Transport and mixing of pollutants into the Arctic LMS derived from HAGAR-V in situ observations of a wide range of trace gases during the HALO ASCCI mission, EGU General Assembly 2026, Vienna, Austria, 3–8 May 2026, EGU26-20116, https://doi.org/10.5194/egusphere-egu26-20116, 2026.

EGU26-20189 | ECS | Posters on site | AS3.22

Separation of tropopause mixing from long-term stratospheric variability using in-situ measurements during PHILEAS and ASCCI 

Jonas Blumenroth, Hans-Christoph Lachnitt, Heiko Bozem, Franziska Weyland, Nicolas Emig, Stephan Kessler, Daniel Kunkel, Linda Ort, Philipp Joppe, Andreas Zahn, Andreas Engel, Martin Riese, Felix Plöger, and Peter Hoor

Mixing between the upper troposphere (UT) and the lower stratosphere (LS) occurs on short timescales compared to dynamic processes within the stratosphere. These mixing processes form the Extratropical Transition Layer (ExTL). Due to the nature of the tropopause as transport barrier, tracers exhibit strong vertical gradients within the ExTL. The ExTL is often identified based on the correlations of airborne trace gas measurements. However, inner-stratospheric variability on longer time scales can also lead to enhanced variability and thus might cause false identification of the ExTL.

Our goal is to distinguish the ExTL from stratospheric variability on longer timescales. Therefore, the choice of tracers is crucial, particularly for species with stratospheric sources like CO or H2O. To circumvent this problem, comparisons with tracers that have only tropospheric sources such as C2H6 are necessary. For this purpose, simultaneous measurements of C2H6 and CO have been conducted during the PHILEAS (Probing High Latitude Export of air from the Asian Summer Monsoon) campaign and the ASCCI (Arctic Springtime Chemistry Climate Investigations) campaign using the University of Mainz QCL-based Spectrometer (UMAQS).

Our results show that similarly to CO, stratospheric variability of C2H6 is also non-zero up to potential temperatures of 400 K. Therefore, dynamic processes rather than chemical sources most likely are the origin of this variability. By using tracer-tracer correlations, we are able to account for the longer-term variability and to separate cross-tropopause mixing from transport and mixing on longer timescales.

When applying this method to PHILEAS data (autumn of 2023) and ASCCI data (spring of 2025) from the northern lowermost stratosphere (LMS), the ExTL can be isolated in vertical tracer profiles, showing a similar extent in autumn and spring. Further, the LMS structure in winter shows a surprisingly well separation from the overworld, indicating two different transport timescales in the background lower stratosphere.

How to cite: Blumenroth, J., Lachnitt, H.-C., Bozem, H., Weyland, F., Emig, N., Kessler, S., Kunkel, D., Ort, L., Joppe, P., Zahn, A., Engel, A., Riese, M., Plöger, F., and Hoor, P.: Separation of tropopause mixing from long-term stratospheric variability using in-situ measurements during PHILEAS and ASCCI, EGU General Assembly 2026, Vienna, Austria, 3–8 May 2026, EGU26-20189, https://doi.org/10.5194/egusphere-egu26-20189, 2026.

EGU26-1797 | ECS | Posters on site | AS3.23

Record growth of stratospheric aerosols from 2019 Raikoke eruption with sulfate-coating of submicronic ash 

Paul Ruyneau de Saint-George, Marie Boichu, Joris Bonnat, Raphaël Grandin, Philippe Goloub, Théo Mathurin, and Nicolas Pascal

The 2019 Raikoke eruption injected material directly into the stratosphere and had major impact on climate. The particle composition of the volcanic aerosols still remains debated today. The eruption generated usual hemispherically-dispersed plumes, but also a long-lived, compact and vorticized volcanic plume (VVP). While this type of plume is usually observed for biomass burning aerosol smoke plumes, it is identified for the first time after a volcanic eruption. A synergistic analysis of S5P/TROPOMI, MetOp/IASI, CALIPSO/CALIOP and AERONET data is conducted to retrieve particle size in the VVP and in the dispersed plumes. In the VVP, fine particle peak radii increased to a record size within three months after the eruption. It is three times greater than the particle radius retrieved in the dispersed plumes, and even greater than the one reached by the strongest eruption of the last decades, i.e., the 1993 Mt Pinatubo eruption. The growth coincides with the decrease in SO2 concentration, suggesting the growth of sulfate aerosols. However, dynamical, optical and radiative signatures point to a more complex composition, where submicronic ash become coated by sulfates. This phenomenon is enhanced in the VVP where SO2 concentration is initially one order of magnitude higher than in the dispersed plumes, because of its vorticized nature. It means that the local SO2 concentration is the critical factor limiting sulfate aerosols growth, and not the total eruption SO2 emission budget. Finally, this unprecedented particle size observed in the VVP with persisting submicronic ash calls for a re-evaluation of the current approach for modeling impacts of stratospheric eruptions on climate.

How to cite: Ruyneau de Saint-George, P., Boichu, M., Bonnat, J., Grandin, R., Goloub, P., Mathurin, T., and Pascal, N.: Record growth of stratospheric aerosols from 2019 Raikoke eruption with sulfate-coating of submicronic ash, EGU General Assembly 2026, Vienna, Austria, 3–8 May 2026, EGU26-1797, https://doi.org/10.5194/egusphere-egu26-1797, 2026.

We have developed a new set of radiative kernels to facilitate the quantification of the stratospheric aerosol direct radiative effect. The multi-dimensional kernel dataset quantifies the radiative sensitivity, which varies with latitude, longitude, time, and wavelength, to stratospheric aerosol optical depth (AOD), distinguishing absorptive and scattering aerosol types. Besides the geographical varying band-by-band kernels, we also introduce an analytical method that emulates the kernel values as a function of environmental control factors, including top-of-atmosphere insolation and reflectance. Applying these kernels, we estimate the stratosphere aerosol radiative effects of the 2022 Hunga volcanic eruption and the 2020 Australian wildfire. The Hunga eruption resulted in a global mean cooling effect of approximately -0.4 W/m² throughout 2022. In contrast, the Australian wildfire induced a global mean instantaneous ARE of +0.3 W/m² and a stratosphere-adjusted ARE of -0.04 W/m². Validation against radiative transfer model calculations confirms the accuracy of the kernel-based estimates. Our findings underscore the significance of spectral dependencies in stratospheric aerosol radiative effect and highlight the distinct radiative sensitivities of stratospheric aerosols compared to their tropospheric counterparts. The radiative kernels afford an efficient and versatile tool for assessing the climatic impacts of stratospheric aerosols.

How to cite: Huang, Y. and Yu, Q.: Estimation of the radiative effect of stratospheric aerosols using a new set of radiative kernels , EGU General Assembly 2026, Vienna, Austria, 3–8 May 2026, EGU26-3194, https://doi.org/10.5194/egusphere-egu26-3194, 2026.

EGU26-4069 | Orals | AS3.23

Multi-model simulations of the evolution of aerosols and water vapor from the Hunga eruption. 

Valentina Aquila, Rei Ueyama, Adam Bourassa, Sergey Khaykin, Alexandre Baron, Landon Rieger, and Alexei Rozanov and the Hunga Tonga–Hunga Ha′apai Volcano Impact Model Observation Comparison (HTHH-MOC) Team

The eruption of the Hunga volcano on January 15, 2022, was unprecedented in the satellite record because of the ~150 Tg of water injected in the stratosphere, paired to a relatively low (~0.5 Tg) sulfur dioxide injection. The uniqueness  of this eruption provides an opportunity to evaluate chemistry-climate models over a new range of conditions, different from the sulfur rich eruptions on which they have generally been tested. We  describe coordinated Hunga simulations from ten chemistry climate models with prognostic aerosol modules and show how the presence of the volcanic water vapor led to larger particles than would occur in a water-poor eruption. This has the effect of rapidly increasing the stratospheric aerosol optical depth in the first month and accelerating the settling of the volcanic aerosols in the following months. While the models are able to reproduce the observed evolution of the water vapor eruption plume and the distribution of volcanic aerosols. they fail to simulate the aerosol optical depth. Most of the difference between models and observations, and among models themselves, can be traced to the aerosol microphysics, which is highly dependent on the parameterizations made by each model.

How to cite: Aquila, V., Ueyama, R., Bourassa, A., Khaykin, S., Baron, A., Rieger, L., and Rozanov, A. and the Hunga Tonga–Hunga Ha′apai Volcano Impact Model Observation Comparison (HTHH-MOC) Team: Multi-model simulations of the evolution of aerosols and water vapor from the Hunga eruption., EGU General Assembly 2026, Vienna, Austria, 3–8 May 2026, EGU26-4069, https://doi.org/10.5194/egusphere-egu26-4069, 2026.

EGU26-6092 | Posters on site | AS3.23

Seasonal Timing Controls ENSO Responses to Tropical Volcanic Eruptions 

Francesco S.R. Pausata and Davide Zanchettin

Volcanic eruptions in the tropics inject aerosols into the stratosphere, altering radiative fluxes and perturbing climate patterns, including the El Niño–Southern Oscillation (ENSO). Using a set of 40-member ensemble simulations with the NorESM1-M model, we investigate how the season and hemisphere of tropical eruptions influence ENSO responses. Our results demonstrate that the eruption season significantly modulates aerosol distribution and radiative forcing, with summer eruptions producing up to 50% stronger forcing than fall or winter events. ENSO responses exhibit a pronounced phase-locking behavior: tropical Northern Hemisphere eruptions in spring or summer trigger El Niño-like anomalies in the first post-eruption winter, followed by La Niña-like conditions in the second year, whereas fall and winter eruptions produce weaker, delayed anomalies. Southern Hemisphere eruptions generally induce muted ENSO signals, emphasizing the role of hemispheric location in modulating response amplitude. These findings reveal a two-tiered control on volcanic impacts: eruption timing sets the ENSO “anomaly clock,” while injection hemisphere modulates its strength, highlighting the importance of seasonality in predicting climate responses to tropical volcanic events.

How to cite: Pausata, F. S. R. and Zanchettin, D.: Seasonal Timing Controls ENSO Responses to Tropical Volcanic Eruptions, EGU General Assembly 2026, Vienna, Austria, 3–8 May 2026, EGU26-6092, https://doi.org/10.5194/egusphere-egu26-6092, 2026.

EGU26-7286 | Posters on site | AS3.23

Climate-volcano feedbacks under global warming 

May Chim, Thomas Aubry, and Anja Schmidt

Stratospheric volcanic aerosols can induce global cooling and other climatic effects on annual to multi-decadal timescales. Future global warming is projected to affect atmospheric processes governing volcanic plume dynamics and stratospheric aerosol transport. For instance, tropospheric warming driven by anthropogenic emissions leads to increased tropopause height and reduced tropical temperature lapse rate, resulting in enhanced atmospheric stratification. In addition, the Brewer-Dobson circulation is expected to accelerate under climate warming. These atmospheric changes can significantly influence volcanic plume rise dynamics, sulfate aerosol lifecycle, and the magnitude of radiative forcing. Despite growing recognition of climate-volcano feedbacks, few studies have examined their effects within fully-coupled Earth System Models.

In this study, we investigated the climate effects of future volcanic eruptions under different background climate states, including pre-industrial, low-end (SSP1-2.6) and high-end (SSP3-7.0) future anthropogenic emission scenarios. We first generated stochastic future eruption scenarios based on an array of bipolar ice cores, satellite measurements, and geological records spanning the past 11,500 years. We then simulated climate projections from 2015 to 2100 using three selected stochastic scenarios representing low-end, median, and high-end future volcanic activity within a plume-aerosol-chemistry-climate modelling framework (UKESM-VPLUME) with interactive volcanic aerosols. The UKESM-VPLUME framework couples a 1-D eruptive plume model (Plumeria) with the UK Earth System Model, enabling the simulation of injection height changes under different background climate states. Our results show that volcanic effects on stratospheric aerosol optical depth, effective radiative forcing, and global mean surface temperature are greater under climate warming for both tropical and extratropical eruptions. Our findings demonstrate the importance of accounting for climate-volcano feedbacks to understand long-term volcanic radiative forcing in future climates.

How to cite: Chim, M., Aubry, T., and Schmidt, A.: Climate-volcano feedbacks under global warming, EGU General Assembly 2026, Vienna, Austria, 3–8 May 2026, EGU26-7286, https://doi.org/10.5194/egusphere-egu26-7286, 2026.

EGU26-7896 | ECS | Orals | AS3.23

Evaluation of the CMIP7 historical stratospheric aerosol forcing dataset 

May Chim, Dominik Stiller, Elisa Ziegler, and Thomas J. Aubry and the CMIP7 Stratospheric Aerosol Forcing Evaluation Team

Stratospheric aerosol forcing, which primarily represents aerosols from explosive volcanic sulfur emissions, is a key natural forcing dataset for Phase 7 of the Coupled Model Intercomparison Project (CMIP7) climate modelling experiments. The CMIP7 stratospheric aerosol forcing datasets for the historical period (1750-2023) include (1) stratospheric sulfate aerosol optical properties, and (2) upper tropospheric-stratospheric volcanic sulfur dioxide emissions. Understanding how historical volcanic forcing has changed from CMIP6 to CMIP7 is essential for interpreting differences in simulation results across CMIP phases and assessing model performance. A key methodological advance in CMIP7 is the emission-driven approach for pre-satellite era stratospheric aerosol optical properties, which incorporates additional ice-core-based volcanic sulfur emission data compared to CMIP6. In this study, we present a systematic evaluation comparing the CMIP6 and CMIP7 stratospheric aerosol forcing datasets against observations, including aerosol optical depth estimates from lunar eclipses, stellar extinction, and satellite retrievals. The comparison provides an in-depth analysis of spatial and temporal patterns in stratospheric aerosol optical depth across CMIP6 and CMIP7, examining both background climatology and selected large-magnitude eruptions in the pre-satellite and satellite eras. This evaluation highlights the key differences between CMIP6 and CMIP7 datasets, improvements achieved through updated methodologies, their potential implications for climate simulations, and directions for future forcing dataset development.

How to cite: Chim, M., Stiller, D., Ziegler, E., and Aubry, T. J. and the CMIP7 Stratospheric Aerosol Forcing Evaluation Team: Evaluation of the CMIP7 historical stratospheric aerosol forcing dataset, EGU General Assembly 2026, Vienna, Austria, 3–8 May 2026, EGU26-7896, https://doi.org/10.5194/egusphere-egu26-7896, 2026.

EGU26-8219 | ECS | Posters on site | AS3.23

Stratospheric Aerosol Particle Size Explains Divergent Limb and Solar Occultation Measurements After the Hunga Eruption 

Cara Remai, Daniel Zawada, Adam Bourassa, Kimberlee Dube, Alexandre Baron, Kate Smith, Landon Rieger, and Doug Degenstein

The 2022 Hunga eruption significantly perturbed the stratosphere by injecting substantial water vapor and SO2, drastically changing the aerosol optical depth and particle size. Post-eruption, satellite limb-scattering retrievals of aerosol extinction from Ozone Mapping and Profiler Suite Limb Profiler (OMPS-LP) and Optical Spectrograph and InfraRed Imager System (OSIRIS) diverged from Stratospheric Aerosol and Gas Experiment on the International Space Station (SAGE III/ISS) solar occultation measurements. We demonstrate that this discrepancy stems from the fixed aerosol particle size assumptions inherent to the limb sensor's retrieval algorithms, which are  different than the large particle sizes observed following the eruption.
Using particle size distribution parameters derived from SAGE III/ISS measurements as input to the OMPS-LP and OSIRIS retrievals, we effectively eliminated the bias in retrieved extinction and Aerosol Optical Depth (AOD) compared to SAGE III/ISS. This consistency across the three datasets provides an improved understanding of aerosol distributions in the highly perturbed stratosphere.

How to cite: Remai, C., Zawada, D., Bourassa, A., Dube, K., Baron, A., Smith, K., Rieger, L., and Degenstein, D.: Stratospheric Aerosol Particle Size Explains Divergent Limb and Solar Occultation Measurements After the Hunga Eruption, EGU General Assembly 2026, Vienna, Austria, 3–8 May 2026, EGU26-8219, https://doi.org/10.5194/egusphere-egu26-8219, 2026.

EGU26-9285 | ECS | Posters on site | AS3.23

Water vapor impacts from the 2022 Hunga eruption on the Arctic stratospheric polar vortex and surface temperatures 

Lan Dai, Axel Timmermann, Tido Semmler, Yuanrui Chen, and Jonathon S. Wright

The January 2022 Hunga Tonga–Hunga Ha’apai eruption caused an unprecedented injection of water vapor into the stratosphere. The excess water vapor from this event stayed in the stratosphere for several years, but whether it influenced surface climate conditions remains unclear. Here, we aim to investigate the impacts of the anomalous water vapor on the variability of the Arctic stratospheric polar vortex and its downward influence on extratropical surface climate. Using the coupled high-top Community Earth System Model Version 2 (CESM2/WACCM6), we conduct a 12-member ensemble of 3-year-long idealized water vapor perturbation simulations that mimic the eruption. Our ensemble simulations demonstrate that water vapor-induced upper-stratospheric cooling weakens the Arctic stratospheric polar vortex in the first post-eruption winter of 2022/2023, with a weaker influence in the second post-eruption winter. The weakening of the polar vortex is driven by the reduced equator-to-pole temperature gradient in the winter stratosphere and is accompanied by pronounced polar stratospheric warming episodes that propagate into the troposphere. We identify more frequent occurrences of the negative Arctic Oscillation and colder-than-normal winters over the northern Eurasian continent in individual perturbation simulations. Our simulations suggest that the Hunga water vapor forcing increases the frequency of a weakened Arctic stratospheric polar vortex and slightly increases the chance for Eurasian winter cooling, although with a weak signal-to-noise ratio.

How to cite: Dai, L., Timmermann, A., Semmler, T., Chen, Y., and Wright, J. S.: Water vapor impacts from the 2022 Hunga eruption on the Arctic stratospheric polar vortex and surface temperatures, EGU General Assembly 2026, Vienna, Austria, 3–8 May 2026, EGU26-9285, https://doi.org/10.5194/egusphere-egu26-9285, 2026.

EGU26-9868 | ECS | Posters on site | AS3.23

Exploring the role of SO2 emission altitude in the 1912 eruption of Katmai/Novarupta 

Lauren Marshall, Andrea Burke, Yang Yu, and Kirstin Krüger

The 1912 eruption of Katmai/Novarupta injected an estimated 7 Tg SO2 into the atmosphere leading to Northern Hemisphere cooling. The eruption has been an important case study for deriving the relationship between ice-sheet sulfate deposition and stratospheric SO2 emission, the so-called ‘transfer function’, which has been subsequently used to estimate the SO2 emissions for other historical extratropical eruptions. However, new ice core data and sulfate isotope analyses demonstrate that a portion of the SO2 was injected below the stratospheric ozone layer, suggesting a lower injection altitude for the plume bottom than previously assumed, with implications for the transfer function. Here, using the UK Earth System Model and an interactive aerosol scheme, we investigate the role of injection altitude and magnitude and revisit the transfer function and climate response considering both tropospheric and stratospheric SO2 emissions.

How to cite: Marshall, L., Burke, A., Yu, Y., and Krüger, K.: Exploring the role of SO2 emission altitude in the 1912 eruption of Katmai/Novarupta, EGU General Assembly 2026, Vienna, Austria, 3–8 May 2026, EGU26-9868, https://doi.org/10.5194/egusphere-egu26-9868, 2026.

Our simulations with the chemistry climate model EMAC show an extreme sensitivity of aerosol properties and radiative and chemical implications to
the spatial distribution of the injections of Hunga SO2 and water vapour. The main effects are modification of particle size and sedimentation by water 
uptake and lofting of aerosol by radiative heating with consequences for horizontal tranport and residence time of aerosol and water vapour. For Hunga we got an instantaneous radiative forcing by aerosol of -0.12 to -0.17 W/m2 at the top of the atmosphere in the first 6 months after the eruption depending on injection patterns like the vertical distribution and the horizontal extent of the plume. How much water vapour is retained in the stratosphere strongly depends on the altitude and the horizontal size of the box into which water vapour is injected because of ice formation in case of supersaturation. Observations indicate that the vertical distributions of SO2 and H2O injections differ. We will present an extension of the published results and further sensitivity studies  to optimize the agreement in the temporal and spatial development of aerosol extinction and water vapour with observations by OSIRIS, SAGE III and MLS, including the effects of the Ruang eruption in April 2024. The study will contribute to the APARC-HTHH-MOC model comparison project.

How to cite: Brühl, C. and Kohl, M.: Sensitivity of radiative forcing by volcanic aerosol to the injection patterns for SO2 and H2O, studies with the CCM EMAC for 2022 to 2024, EGU General Assembly 2026, Vienna, Austria, 3–8 May 2026, EGU26-10125, https://doi.org/10.5194/egusphere-egu26-10125, 2026.

EGU26-11343 | ECS | Posters on site | AS3.23

 Towards a transfer function for tropospheric volcanic sulfur emissions: The Holuhraun 2014-2015 eruption​ 

Milena Gottschalk, Tómas Zoëga, and Kirstin Krüger

Reconstructions of past volcanic forcing and the associated climate response are currently limited to volcanic stratospheric sulfur injections (VSSI) by explosive eruptions. Transfer functions that link volcanic SO4 depositions in polar ice cores with VSSI are estimated based on observations and climate modeling. Tropospheric sulfur emissions from effusive and explosive eruptions are climate-relevant, yet historical volcanic sulfur fluxes to the troposphere are poorly quantified before the satellite era. Reconstructing volcanic contributions to tropospheric aerosol concentrations is, however, essential to understanding past, present, and future climate, and to correctly assessing anthropogenic versus natural tropospheric aerosol contributions.

Using the Community Earth System Model with the Community Atmosphere Model set-up (CESM2-CAM6), we simulate SO2 and SO4 dispersal and deposition during an effusive volcanic eruption with continuous emissions. The case study is based on the 2014-2015 Holuhraun eruption in Iceland, which released up to 9.6 Tg SO2 between 31 August 2014 and 27 February 2015. We vary the meteorological conditions during the time of the eruption by performing ten free-running simulations as well as one simulation that is nudged towards MERRA reanalysis winds.

From the modeled SO4 deposition in Greenland, we calculate transfer functions between deposition and total (prescribed) sulfur emissions for three different domains: the Greenland ice sheet, central Greenland, and the location of the EastGRIP ice coring project. This interpretation of a transfer function differs from that used for explosive stratospheric eruptions, which assumes that all emitted SO2 is converted into SO4 before deposition. We find, however, that only about half of the total sulfur deposition is in the form of SO4 in the simulated scenario, and half as SO2. Owing to Greenland's proximity to the emission source in Iceland, combined with a deposition region limited to the North Atlantic and adjacent areas, the relative local SO4 deposition is higher than for previously investigated statospheric eruptions with global deposition. Thus, the resulting transfer function values are lower than in previous studies of stratospheric volcanic sulfur.

The presented tropospheric transfer function provides an approach to reconstructing tropospheric sulfur loading from past volcanic eruptions in the northern extratropics based on local SO4 signals in Greenland ice.

How to cite: Gottschalk, M., Zoëga, T., and Krüger, K.:  Towards a transfer function for tropospheric volcanic sulfur emissions: The Holuhraun 2014-2015 eruption​, EGU General Assembly 2026, Vienna, Austria, 3–8 May 2026, EGU26-11343, https://doi.org/10.5194/egusphere-egu26-11343, 2026.

EGU26-13104 | ECS | Posters on site | AS3.23

Evolution of optical parameters of volcanic and wildfire plumes in the stratosphere from CALIOP and ATLID observations 

Oceane Soares, Sergey Khaykin, Sophie Godin-Beekmann, and Nikolay Kadygrov

Volcanic eruptions and extreme wildfires produce stratospheric aerosol plumes with distinct optical properties and lifetimes. Here we analyze the evolution of volcanic and wildfire aerosols using Level-2 aerosol layer products from the CALIOP (CALIPSO) and ATLID (EarthCARE) spaceborne lidars.

The analysis is based on a layer approach, in which aerosol properties are binned and analyzed at the Level-2 aerosol layer scale rather than along individual vertical profiles, allowing a consistent comparison between events and throughout plume ageing. Aerosol layers are characterized using observations at 532 and 1064 nm (CALIOP) and 355 nm (ATLID) in terms of scattering ratio, depolarization ratios (volume depolarization, VDR, and particulate linear depolarization, PLDR), and color ratio. The scattering ratio constrains aerosol concentration, depolarization ratios provide insight into particle shape and type, whereas the color ratio scales with particle size, with coarse particles preferentially removed by gravitational sedimentation.

Distinct optical fingerprints are found for volcanic and wildfire aerosols. Volcanic eruptions such as Puyehue–Cordón Caulle (2011), Calbuco (2015) and Raikoke (2019) eruptions exhibit strong ash signatures at early stages, characterized by high PLDR and elevated color ratios, indicative of coarse, non-spherical particles. In contrast, Kasatochi (2008) and Sarychev (2009) eruptions shows intermediate PLDR values, consistent with a mixed aerosol composition combining volcanic ash and sulfate particles. Hunga eruption (2022) is dominated by sulfate aerosols and shows low depolarization but relatively high color ratios in the young plume, which rapidly decrease as the largest ash particles are efficiently removed by gravitational sedimentation.

ATLID Level-2 product is  used to document the temporal, vertical, and zonal evolution of stratospheric smoke after the Panboreal wildfire outbreak in May 2025. Very high value of scattering ratio and aerosol optical depth (AOD) are observed shortly after the largest pyroCb  injection on 29 May, followed by a progressive decrease associated with plume dilution and redistribution during vertical ascent and long-range transport. PLDR values remain moderate throughout the plume evolution, indicating the presence of non-spherical particle components in stratospheric smoke. A slight increase in PLDR with plume ageing is observed for most events, possibly related to particle aggregation or microphysical processing. These consistent PLDR patterns across different events provide insight into the ageing processes of stratospheric smoke.
The lidar ratio exhibits coherent values within individual layers throughout plume evolution, providing a stable constraint on aerosol optical properties despite decreasing aerosol loading.

First ATLID observations of the Canadian wildfires in May 2025 demonstrate the added value of the HSRL (High Spectral Resolution LiDAR) technique. ATLID exploits Rayleigh and Mie backscatter separation to provide direct measurements of aerosol extinction and lidar ratio. These observations offer new constraints on aerosol type and ageing of smoke aerosols in the stratosphere while extending the CALIOP-based statistics of stratospheric aerosol optical properties.

How to cite: Soares, O., Khaykin, S., Godin-Beekmann, S., and Kadygrov, N.: Evolution of optical parameters of volcanic and wildfire plumes in the stratosphere from CALIOP and ATLID observations, EGU General Assembly 2026, Vienna, Austria, 3–8 May 2026, EGU26-13104, https://doi.org/10.5194/egusphere-egu26-13104, 2026.

EGU26-13126 | Orals | AS3.23 | Highlight

 Do CMIP6 models agree on the climate response in Eurasian winter to major volcanic eruptions since 1850? 

Stephanie Fiedler, Kirstin Krüger, and Lisa Weber

This study provides a comprehensive analysis of the climate response in Northern Hemisphere winter to major volcanic eruptions of the past, using multi-member ensembles of historical experiments of 15 models from the Coupled Model Intercomparison Project Phase 6 (CMIP6) and three reanalysis data sets. Focusing on the two largest historical eruptions of Krakatoa and Pinatubo, the results highlight a large model consensus on the strengthening of the polar vortex and an associated increase in surface temperatures over parts of Northern Eurasia in the CMIP6 multi-model mean in the first winter following the eruptions. This finding is consistent with models simulating a positive phase of the North Atlantic Oscillation. The responses of the surface temperatures and winds show hardly any dependence on the phase of the El Nino-Southern Oscillation. Our results further underline a strong influence of internal variability on the simulated near-surface responses to volcanic forcing, even in the case of these strong eruptions. Thus, separating the influence of internal variability from the forced response requires output from large ensembles of historical simulations.

Reference

Weber, L., Krüger, K., and Fiedler, S.: On CMIP6 model consensus for the climate response in Eurasian winter to historical volcanic eruptions, in revision.

How to cite: Fiedler, S., Krüger, K., and Weber, L.:  Do CMIP6 models agree on the climate response in Eurasian winter to major volcanic eruptions since 1850?, EGU General Assembly 2026, Vienna, Austria, 3–8 May 2026, EGU26-13126, https://doi.org/10.5194/egusphere-egu26-13126, 2026.

EGU26-14031 | Orals | AS3.23

Global Transport and Composition of Volcanic and PyroCb Stratospheric Aerosols Observed by EarthCARE/ATLID and ground-based lidars 

Sergey Khaykin, Oceane Soares, Nicolas Kadygrov, Michael Sicard, Thierry Leblanc, Gwenael Berthet, Nickolay Balugin, Tetsu Sakai, Yoshitaka Jin, and Ben Liley

ESA’s EarthCARE satellite mission launched in May 2024 and carrying Atmospheric LIDar (ATLID) provides high-resolution vertical profiling of aerosols and clouds at 355 nm. Fully operational since August 2024, ATLID has been witness to a significant perturbation of stratospheric aerosol budget following the eruptions of Ruang volcano (Indonesia) in late April 2024 as well as to a major panboreal outbreak of wildfire-generated pyrocumulonimbus (pyroCb) events in Canada and Siberia in late May 2025 that had a hemisphere-scale impact on stratospheric aerosol loading and composition. Using ATLID L1B data together with limb-viewing satellite observations (OMPS-LP and SAGE III), we quantify the stratospheric aerosol perturbations generated by these events, characterize the long-range transport of volcanic and smoke aerosols and contrast their optical properties and dynamical evolution.

 To evaluate the ATLID performance in the stratosphere, its data are compared with collocated lidar observations at various locations in both hemispheres and overpass-coordinated balloon flights in France carrying in situ aerosol sensors. The intercomparison with suborbital observations suggests excellent performance of ATLID in the stratosphere and proves its capacity to accurately resolve fine structures in the vertical distribution of stratospheric aerosols.

ATLID observations of the global progression of volcanic and wildfire aerosols align closely with those from OMPS-LP and SAGE III, while uniquely providing continuous coverage through polar night. We show that Ruang aerosols were subject to an unusually massive isentropic transport into the southern extratropics and were most probably entrained by the 2025 Antarctic polar vortex, potentially enhancing the polar stratospheric cloud occurrence and Antarctic ozone hole.

The stratospheric aftermath of the 2025 panboreal wildfire outbreak (POW) was characterized through a synergy of ATLID and ground-based lidar observations within ACTRIS and NDACC networks. The lidar measurements consistently report record-breaking values of stratospheric aerosol backscatter and AOD during the passage of the most intense Canadian pyroCb plume. This plume displayed a pronounced warm anomaly, linked to strong solar absorption by black carbon, and underwent diabatic self-lofting from ~13 km to 20 km altitude. ATLID further indicates that smoke aerosols dispersed across the northern extratropical stratosphere and may have penetrated into the tropics.

How to cite: Khaykin, S., Soares, O., Kadygrov, N., Sicard, M., Leblanc, T., Berthet, G., Balugin, N., Sakai, T., Jin, Y., and Liley, B.: Global Transport and Composition of Volcanic and PyroCb Stratospheric Aerosols Observed by EarthCARE/ATLID and ground-based lidars, EGU General Assembly 2026, Vienna, Austria, 3–8 May 2026, EGU26-14031, https://doi.org/10.5194/egusphere-egu26-14031, 2026.

EGU26-14064 | Posters on site | AS3.23

The USask OMPS-LP v2.1 Stratospheric Aerosol Data Product 

Daniel Zawada, Kimberlee Dube, Adam Bourassa, and Doug Degenstein

The University of Saskatchewan (USask) routinely derives stratospheric aerosol extinction from limb radiance measurements by the Ozone Mapping and Profiler Suite Limb Profile (OMPS-LP).  Recently a new version of the data product (v2.1) has been publicly released with several improvements. Most notably aerosol extinction is reported at multiple wavelengths using a novel bias correction scheme that reduces wavelength dependent errors present in limb scatter derived aerosol by training a gradient boost regression scheme on coincidences with SAGE III-ISS occultation measurements.  The algorithm has also been extended to routinely process data from both the NPP (launched in 2011) and N21 (launched in 2021) versions of OMPS-LP.  Here we describe the algorithm, it's improvements, and validate the data product against correlative measurements.

How to cite: Zawada, D., Dube, K., Bourassa, A., and Degenstein, D.: The USask OMPS-LP v2.1 Stratospheric Aerosol Data Product, EGU General Assembly 2026, Vienna, Austria, 3–8 May 2026, EGU26-14064, https://doi.org/10.5194/egusphere-egu26-14064, 2026.

EGU26-14229 | Posters on site | AS3.23

Using simple models to understand the global mean temperature response to volcanic aerosol forcing 

Matthew Toohey and Minoo Morovati

Radiative forcing from stratospheric aerosols produced by major volcanic eruptions is likely to be the primary forcing agent of preindustrial climate variability, and will have a significant impact on climate when the next strong eruption occurs. The radiative forcing from volcanic eruptions is relatively short-lived, and the surface cooling is controlled by various factors including the magnitude of the forcing, its duration, the climate feedback parameter and other aspects like effective ocean heat capacity and ocean mixing. Here, we explore analytical solutions to simple energy balance models using idealized forms of volcanic aerosol forcing, and estimate model parameters based on comprehensive Earth-System Model simulations of volcanic forcing from VolMIP and LESFMIP experiments. We use the analytical solutions to explore relationships between forcing and response, for example, between the magnitude of forcing and the peak temperature anomaly, and the sensitivity of these relationships to the model parameters.

How to cite: Toohey, M. and Morovati, M.: Using simple models to understand the global mean temperature response to volcanic aerosol forcing, EGU General Assembly 2026, Vienna, Austria, 3–8 May 2026, EGU26-14229, https://doi.org/10.5194/egusphere-egu26-14229, 2026.

Trajectory hunting is a Lagrangian, transport-based technique that links atmospheric observations along calculated air-parcel pathways to enable consistency checks and to contribute to validation and data comparison studies. By connecting independent observations across space and time, trajectory hunting increases the number of coincidences available for comparison and thus reduces uncertainty in studies limited by sparse availability of direct matches. In this study, we assess the use of trajectory hunting for stratospheric aerosol extinction measurements based on observations from the Optical Spectrograph and InfraRed Imaging System (OSIRIS). Trajectories computed with HYSPLIT and FLEXPART are used to connect independent OSIRIS aerosol extinction profiles along transport pathways, enabling self-consistency tests under various stratospheric conditions. In addition, using the 2022 Hunga Tonga eruption as a case study, we apply trajectory hunting to assess volcanic plume transport by mapping plume evolution and age along simulated dispersion pathways, and to compare these against spaceborne observations to evaluate the consistency of trajectory hunting during periods of strong stratospheric perturbation. These results will demonstrate the potential of using trajectory hunting to support validation of stratospheric aerosol products and to provide observationally constrained insights into aerosol transport and evolution, with implications for future applications to the High-Altitude Aerosols, Water Vapour, and Clouds (HAWC) mission and multi-sensor stratospheric aerosol datasets.

How to cite: Wu, Y., Walker, K., and Bloxam, K.: Trajectory hunting for linking stratospheric aerosol extinction measurements: validation with OSIRIS and application to the 2022 Hunga Tonga eruption, EGU General Assembly 2026, Vienna, Austria, 3–8 May 2026, EGU26-14419, https://doi.org/10.5194/egusphere-egu26-14419, 2026.

EGU26-14830 | Orals | AS3.23

Atmospheric transport and evolution of Hunga water vapour and aerosols   

Adam Bourassa, Sergey Khaykin, Valentina Aquila, Alexandre Baron, Landon Rieger, Alexei Rozanov, and Rei Ueyama

This talk presents the highlights of the third chapter of the APARC Hunga Volcanic Eruption Atmospheric Impacts Report. The study focuses on the global meridional and vertical evolution of the Hunga sulphate aerosols and water vapour after the full zonal dispersion of the plume, which occurred about one month after the eruption.  Measurements from satellites, balloon, and ground-based stations are used to track the dispersion of water vapour and aerosol, and to document the evolution of the aerosol size distribution.   The uncertainties in the satellite observations are assessed using detailed intercomparisons.  Finally, results from dedicated climate model simulations of the global transport and evolution of Hunga aerosol and water vapour in comparison to the observations are summarized. 

How to cite: Bourassa, A., Khaykin, S., Aquila, V., Baron, A., Rieger, L., Rozanov, A., and Ueyama, R.: Atmospheric transport and evolution of Hunga water vapour and aerosols  , EGU General Assembly 2026, Vienna, Austria, 3–8 May 2026, EGU26-14830, https://doi.org/10.5194/egusphere-egu26-14830, 2026.

Rapid adjustments are a key component of effective radiative forcing, influencing both short- and long-term climate responses and prediction uncertainty. Volcanic eruptions act as “natural laboratories” for studying these adjustments, providing insights into the atmospheric and surface mechanisms that occur in response to sudden stratospheric aerosol perturbations.

To disentangle these responses from internal variability and anthropogenic trends, we adopt a stepwise approach, analysing six model and observational datasets that capture rapid adjustments to imposed negative shortwave forcing. These include idealized reduced-solar-constant datasets (abrupt-solm4p from CFMIP), idealized stratospheric aerosol layer simulations with non-absorbing and absorbing aerosols (provided by Moritz Günther), and fixed as well as fully coupled sea surface temperatures. Furthermore, the volc-pinatubo-full simulations from VolMIP, CMIP6 historical simulations, ERA5 reanalysis, and CLARA satellite observations were analysed.

Across these datasets, we identify characteristic adjustment patterns of radiative fluxes, temperature, circulation, and cloud properties on timescales of months to a year after peak forcing. In volcanic eruptions, stratospheric temperature and dynamical adjustments play a key role and are often closely coupled to tropospheric responses. Comparing idealized solar and aerosol forcing with realistic Pinatubo simulations and observations allows us to assess the extent to which simplified experiments capture essential adjustment patterns typical for volcanic eruptions.

Results reveal consistent vertical and regional adjustment fingerprints across datasets, while also highlighting model limitations. For example, due to low stratospheric resolution and simplified QBO parametrizations, models fail to reproduce the full stratospheric temperature response observed in ERA5, whereas observations are more strongly influenced by internal variability than ensemble-mean model results.

These findings demonstrate the value of volcanic eruptions as a useful tool for constraining rapid adjustments to shortwave forcing and for improving their representation in climate models.

How to cite: Lange, C. and Quaas, J.: Understanding rapid adjustments to shortwave forcing: from idealized solar perturbations to model and observational analysis of the 1991 Pinatubo eruption, EGU General Assembly 2026, Vienna, Austria, 3–8 May 2026, EGU26-14962, https://doi.org/10.5194/egusphere-egu26-14962, 2026.

EGU26-15123 | Orals | AS3.23

The evolution of stratospheric water vapour in the years since the Hunga Tonga eruption  

Kimberlee Dubé, William Randel, Adam Bourassa, Susann Tegtmeier, Xinyue Wang, Eilidh Hlady, and Meghan Brehon

The Hunga Tonga-Hunga Ha'apai underwater volcanic eruption in January 2022 injected 150 Tg of water vapour (H2O) into the stratosphere, increasing the total stratospheric H2O mass by 10%. The goal of this study is to investigate the transport of the Hunga H2O within, and out of, the stratosphere in the four years since the eruption, using H2O observations from the Microwave Limb Sounder (MLS) and model simulations from WACCM and FLEXPART. The Hunga H2O is isolated by using the tropical cold point temperature to account for H2O that entered the stratosphere through the tropical tropopause, rather than via the eruption. The resulting residual H2O shows that the Hunga water vapor has moved to higher latitudes and lower altitudes over time. There is excess H2O in the tropics in 2023 and 2024, providing evidence of mixing from mid-latitude back to the tropics. As of mid-2025, approximately half of the 150 Tg of H2O that was injected by Hunga has either been removed or transported to the lowermost stratosphere.

How to cite: Dubé, K., Randel, W., Bourassa, A., Tegtmeier, S., Wang, X., Hlady, E., and Brehon, M.: The evolution of stratospheric water vapour in the years since the Hunga Tonga eruption , EGU General Assembly 2026, Vienna, Austria, 3–8 May 2026, EGU26-15123, https://doi.org/10.5194/egusphere-egu26-15123, 2026.

EGU26-17112 | ECS | Posters on site | AS3.23

An assessment of the stratospheric temperature response to volcanic sulfate injections from recent Model Intercomparison Projects 

Katharina Perny, Timofei Sukhodolov, Ales Kuchar, Pavle Arsenovic, Bernadette Rosati, Christoph Brühl, Sandip S. Dhomse, Andrin Jörimann, Anton Laakso, Graham Mann, Ulrike Niemeier, Giovanni Pitari, Ilaria Quaglia, Takashi Sekiya, Kengo Sudo, Claudia Timmreck, Simone Tilmes, Daniele Visioni, and Harald E. Rieder

Some major volcanic eruptions, such as the one of Mt. Pinatubo in 1991, can inject large amounts of sulfur dioxide (SO2) into the stratosphere, leading to the formation of a volcanic aerosol cloud. This dense aerosol cloud induces radiative heating of the stratosphere, causing ozone and water vapour changes, thereby altering middle atmospheric dynamics and chemistry. The scale of these impacts on stratospheric temperature anomalies is still highly uncertain.

In this study we analyse data from the Historical Eruptions SO2 Emission Assessment Protocol (HErSEA) under the Interactive Stratospheric Aerosol Model Intercomparison Project (ISA-MIP). The results from eight global interactive-aerosol models confirm our general understanding of the stratospheric aerosol forcing due to SO2 injection following a volcanic eruption. As direct observations are sparse we compare models to three widely used reanalyses (ERA5, MERRA2, and JRA55). This analysis shows that while the multi-model mean temperature anomalies agree well with reanalyses, differences among individual models can be large. Our study shows that agreement in the median occurs through error compensation when averaging across models. The analysis and the sensitivity tests for model selection presented here highlight that by far the most important factor driving both magnitude and spread of the multi-model distribution in temperature response to volcanic aerosol forcing is model choice. Differences in transport, radiative transfer, and microphysics as well as the characterization of aerosol size distributions play a crucial role for the simulated spread in the temperature response.

Another candidate to explain the spread in the ISA-MIP models, is the use of interactive aerosol schemes. To test this hypothesis, we compared the ISA-MIP multi-model distribution with those obtained from CCMI-2022 and CMIP6-AMIP model intercomparisons, which use prescribed SADs. If indeed interactive aerosol treatment would be a key contributor, one would expect smaller multi-model temperature anomaly distributions from CCMI-2022 and CMIP6-AMIP. Interestingly, this hypothesis has to be rejected, as no reduction in the multi-model spread is found. Hence, we argue for caution in attribution studies and the interpretation of stratospheric aerosol injection experiments relying on individual or few models.

How to cite: Perny, K., Sukhodolov, T., Kuchar, A., Arsenovic, P., Rosati, B., Brühl, C., Dhomse, S. S., Jörimann, A., Laakso, A., Mann, G., Niemeier, U., Pitari, G., Quaglia, I., Sekiya, T., Sudo, K., Timmreck, C., Tilmes, S., Visioni, D., and Rieder, H. E.: An assessment of the stratospheric temperature response to volcanic sulfate injections from recent Model Intercomparison Projects, EGU General Assembly 2026, Vienna, Austria, 3–8 May 2026, EGU26-17112, https://doi.org/10.5194/egusphere-egu26-17112, 2026.

EGU26-17957 | ECS | Posters on site | AS3.23

Simulated modulation of stratospheric polar vortices by the Hunga Tonga-Hunga Ha’apai eruption 

Bruno Lehner, Ales Kuchar, and Harald Rieder

The submarine eruption of the Hunga Tonga-Hunga Ha’apai (HTHH) in January 2022 represents a novel geophysical event due to the injection of large amounts of water vapor (WV) into the stratosphere. Following the eruption, the injected WV was transported from the tropics to higher latitudes via stratospheric circulation. Approximately one year after the eruption, the WV anomalies were spread throughout the global stratosphere, including both polar regions.

Previous studies have shown that the excess stratospheric WV was associated with significant anomalies in atmospheric circulation, particularly a weakening of the Northern Hemisphere (NH) stratospheric polar vortex (SPV). However, the observed 2024/2025 winter with an exceptionally strong NH SPV may represent a plausible manifestation of HTHH-induced modulation of vortex variability.

Here we diagnose the chain of processes linking the HTHH eruption to the exceptional behavior of the SPV observed in recent years using satellite observations, reanalyses data, and ensemble model simulations with the SOCOLv4 Earth system model, as well as model data from the HTHH Impact Model Observation Comparison project.

Our preliminary multi-model results show a seasonally recurring transport of WV in the stratosphere and lower mesosphere, accompanied by changes in composition, radiation, and dynamics. We propose mechanisms whereby excess WV from HTHH and associated ozone changes induce radiative perturbations that precondition the SPV. Furthermore, we examine how the underlying mechanisms depend on the model-projected WV forcing and how this relates to known biases of chemistry-climate models.

How to cite: Lehner, B., Kuchar, A., and Rieder, H.: Simulated modulation of stratospheric polar vortices by the Hunga Tonga-Hunga Ha’apai eruption, EGU General Assembly 2026, Vienna, Austria, 3–8 May 2026, EGU26-17957, https://doi.org/10.5194/egusphere-egu26-17957, 2026.

EGU26-19794 | Orals | AS3.23

Extending the late 1963 to 1964 Mt Agung rescued searchlight aerosol profiles dataset, from early 1963 to 1976. 

Juan Antonio Añel, Juan Carlos Antuña-Marrero, Abel Calle, Victoria Cachorro, Laura de la Torre, David Barriopedro, Ricardo García-Herrera, Jeannette van den Bosch, and Javier Pacheco
Here we present a set of aerosol turbidity profiles (ATP) and aerosol extinction profiles (AEP), observed with searchlight in New Mexico at 32ºN, digitized from plots in scientific articles. The ATP and AEP cover the periods February to June 1963 and September 1965 to May 1975, complementing a former dataset of 105 rescued individual AEP, corresponding to 36 days, between December 1963 and December 1964. Eleven AEPs were calculated (AEPc) from the ATP, and the corresponding stratospheric aerosol optical depth (sAOD) between 12 and 25 km were also derived. Estimates of digitization errors, the AEPc, and the sAOD were also calculated using information available in the literature. The combined set of rescued AEP reported here and the earlier rescued set of AEP from searchlight observations are the only AEP datasets covering the period between the 1963 Mt Agung and the 1974 Fuego eruptions at northern midlatitudes. Two relevant features identified in the AEP and the sAOD are described. The first, using AEPc from March and April 1963, identified what could be the date of arrival of the stratospheric aerosols from the Mt. Agung first eruption on March 17th, 1963. This fact challenges the accepted criteria that the arrival of the stratospheric aerosols from Mt Agung occurred in the northern hemisphere midlatitudes in the second half of 1963. The second feature shows two anomalous increases in the sAOD during a period that is supposed to correspond to the decay of the sAOD following the Mt. Agung eruption. They show our limited knowledge and understanding of the 1963 Mt Agung volcanic stratospheric aerosol transport. The work has been developed in the framework of the Stratospheric Sulfur and its Role in Climate (SSiRC) activity of the APARC.

How to cite: Añel, J. A., Antuña-Marrero, J. C., Calle, A., Cachorro, V., de la Torre, L., Barriopedro, D., García-Herrera, R., van den Bosch, J., and Pacheco, J.: Extending the late 1963 to 1964 Mt Agung rescued searchlight aerosol profiles dataset, from early 1963 to 1976., EGU General Assembly 2026, Vienna, Austria, 3–8 May 2026, EGU26-19794, https://doi.org/10.5194/egusphere-egu26-19794, 2026.

EGU26-21627 | Posters on site | AS3.23

Measurements and interactive modeling of the 1960s stratospheric aerosol layer 

Graham Mann, Jiaying Xu, Charlotte Tate, Sandip Dhomse, Wuhu Feng, Alexandru Rap, and Zhengyao Li

In contrast to the near-quiescent decades of the 1920s-1950s, the 1960s stratospheric aerosol layer had continued volcanic enhancement, with the major eruption of 1963 Agung and the subsequent VEI4 eruptions of 1965 Taal, 1966 Awu and 1968 Fernandina.

The first in-situ measurements of a volcanic enhancement to the stratosphere aerosol layer were made from high-altitude balloon in 1963 and 1964, from Minneapolis. A continuing program of these dust-sondes were launched approximately quarterly from Minneapolis, and a short series of launches from Panama in September 1966 (Rosen, 1968) measured strong volcanic enhancement just weeks after the Aug 1966 Awu eruption.

A different series of balloon measurements were made from Minneapolis in 1965-1968, and within coincident soundings in Panama in Sep 1966. This instrument was a rotating 4-telescope sun photometer designed to measure the vertical profile of solar extinction at 4 wavelengths and provided the foundations for the SAGE and SAM satellite instruments launched in 1979.  A 2021 MRes project at Leeds University has recovered the vertical profile datasets of the 910nm channel of these 22 balloon solar extinction soundings from Figures within the University of Wyoming PhD thesis of Ted Pepin. 

This poster presentation will present the 1965-1968 solar extinction measurements, analysed within an 2024/25 undergraduate dissertation project, comparing to CMIP stratospheric aerosol forcing datasets and showing the clear signal of volcanic enhancement apparent during NH winter 1966/67.  We are preparing the dataset for inclusion in the archive of the Network for Detection of Atmospheric Composition and Change (NDACC), alongside the 1963-1967 dust-sonde measurements provided in 2017 to the NDACC archive by the instrument PI (James Rosen (University of Wyoming).

We will analyse 1963-67 simulations with the UM-UKCA interactive stratospheric aerosol model, from continuing from runs already validated for the Agung period (Dhomse et al. 2020). The Minneapolis balloon measurements will be used to assess potential SO2 emissions from 1965 Taal (September) and 1966 Awu (August), the 3D model shown to represent well variations in the transport to mid-latitudes of volcanic aerosol from similar tropical eruptions.

How to cite: Mann, G., Xu, J., Tate, C., Dhomse, S., Feng, W., Rap, A., and Li, Z.: Measurements and interactive modeling of the 1960s stratospheric aerosol layer, EGU General Assembly 2026, Vienna, Austria, 3–8 May 2026, EGU26-21627, https://doi.org/10.5194/egusphere-egu26-21627, 2026.

EGU26-22524 | Orals | AS3.23

Residence time of Hunga stratospheric water vapour perturbation quantified at 9 years 

Xin Zhou, Quanliang Chen, Wuhu Feng, Saffron Heddell, Sandip Dhomse, Graham Mann, Hugh Pumphrey, and Michelle Santee

The January 2022 eruption of the Hunga volcano (20°S) injected 150 Tg of water vapour into the middle atmosphere, leading to an increase in the stratospheric water burden of 10%, unprecedented in the observational record. In the first two years post-eruption, the stratospheric burden hardly changed (Millán et al., 2024), except for a small decay due to Antarctic polar stratospheric cloud dehydration in 2023 (Zhou et al., 2024), leaving the residence time of volcanically injected water vapour—a key control on its climate impact—uncertain. Here we use satellite observations from the Microwave Limb Sounder (MLS) and an off-line 3-D chemical transport model (CTM), TOMCAT/SLIMCAT, with ERA5 meteorology to study the residence time of this excess H2O.

Using MLS observations, we show a substantial decline from 2024 to early 2025, the largest drop since the eruption. Simulations with the TOMCAT/SLIMCAT CTM reproduce the observed global spread and decline of the injected H2O through early 2025. Together, observations and model simulations indicate that the long-term removal of the Hunga water has now entered a new phase, with stratosphere-troposphere exchange playing an increasingly important role, exceeding Antarctic dehydration in 2024. We estimate that the additional stratospheric water vapour is now decaying steadily with an e-folding time of 3 years and will reach the observed pre-Hunga range of variability around 2030.

The presentation will provide an up-to-date status of observations and discuss whether the decay of the Hunga excess water is proceeding as expected.

How to cite: Zhou, X., Chen, Q., Feng, W., Heddell, S., Dhomse, S., Mann, G., Pumphrey, H., and Santee, M.: Residence time of Hunga stratospheric water vapour perturbation quantified at 9 years, EGU General Assembly 2026, Vienna, Austria, 3–8 May 2026, EGU26-22524, https://doi.org/10.5194/egusphere-egu26-22524, 2026.

EGU26-227 | ECS | Posters on site | ST3.2

Chemical equilibria and characteristic times in the mesopause region during SSW events. 

Krystine Naranjo Villalón, Claudia Stephan, William Ward, and Mykhaylo Grygalashvyly

Atomic oxygen is a critical species in the mesosphere and lower thermosphere, governing the chemistry, airglow, and energy budget (taking part in exothermic chemical processes and microwave cooling processes). It participates in chemical reactions in that region. Hence, it is involved in the coupling between dynamics, chemistry and energetics. However, to date no satellite mission has measured atomic oxygen directly. It and related photochemically active species (atomic hydrogen, hydroxyl and hydroperoxyl) are deduced through indirect methods from airglow observations. Such techniques are based on the assumption of ozone photochemical equilibrium. In time of Sudden Stratospheric Warmings (SSWs) strong dynamical perturbations of the mesopause chemical system occur. With 3D modelling we find that ozone strongly deviates from photochemical equilibrium in the mesopause region during SSW events and nighttime conditions. The lower boundary of ozone equilibrium jumps up to a height of 90 km, implying that traditional techniques for retrieving atomic oxygen, atomic hydrogen, and chemical heat from airglow observations cannot be applied at times of SSWs below 90 km under nighttime conditions. We discuss and explain our results in terms of characteristic times. Additionally, to better understand the behavior of exothermic chemical heat, we calculate odd-hydrogens photochemical equilibria and characteristic times, which are involved into exothermic chemical reactions.

How to cite: Naranjo Villalón, K., Stephan, C., Ward, W., and Grygalashvyly, M.: Chemical equilibria and characteristic times in the mesopause region during SSW events., EGU General Assembly 2026, Vienna, Austria, 3–8 May 2026, EGU26-227, https://doi.org/10.5194/egusphere-egu26-227, 2026.

EGU26-2889 | Orals | ST3.2

Dust and ionospheric constituents measured in the MLT during noctilucent cloud conditions 

Ingrid Mann, Sveinung V. Olsen, Yngve Eilertsen, Yoshihiro Yokoyama, Jean-Claude Tinguely, Andres Spicher, Jonas Hedin, Joerg Gumbel, Boris Strelnikov, Kai Schueler, Gerd Baumgarten, Ralph Latteck, Devin Huyghebaert, Toralf Renkwitz, Espen Trondsen, Lasse Clausen, Johann Stamm, and Erik Varberg

The mesosphere – lower thermosphere (MLT) contains dust particles made of both ice and refractory materials. Since the MLT overlaps with the heights of meteor ablation, it contains small nanometric particles made of cosmic dust material known as meteor smoke. The smoke particles influence the charge balance and ion chemistry and may serve as condensation nuclei for the formation of the ice particles. The ice particles are observed in summer at mid and high latitudes near the mesopause as noctilucent clouds (NLC) or polar mesospheric clouds (PMC). The presence of ice particles in combination with charge interactions, neutral air turbulence and dynamics also leads to specific radar echoes, known as polar mesospheric summer echoes (PMSE). Radar observations of PMSE and PMC/NLC measurements with cameras or lidar are among the few long-term observations around the summer mesopause. PMC/NLC measurements with satellites, cameras or lidar and PMSE measurements with radar indicate there are changes over the last decades. Aside from the ice and the meteoric smoke, space debris is possibly a third source of dust in the MLT that increases over time.

The Maxidusty-2 (MXD2) allowed to measure dust, ions and neutrals from a rocket launched from Andoya, Norway (69.1° N, 16° E) on 5 July 2025 around 8:01 am local time. The MXD2 science payload included four dust in-situ detectors, a neutral gas instrument as well as a Faraday rotation experiment and Langmuir probes to measure electron density. Two independent and different instruments collected dust particles. NLC were observed at that time with the Alomar RMR lidar close by. PMSE were observed at the same time with the MAARSY radar close to the launch site and with the EISCAT radar in Ramfjord (69.6° N, 19.2° E) near Tromsoe at about 130 km distance. All in situ instruments recorded science data. The recovery was successful, and analysis of the collected refractory dust samples is ongoing. An overview of the campaign measurements is given. The initial analysis notably shows that the dust instruments measured a signal at the altitude of the NLC but only small signals at the altitude of higher PMSE layer. We discuss the results in terms of dust charging and the link between dust and the other parameters measured.

How to cite: Mann, I., Olsen, S. V., Eilertsen, Y., Yokoyama, Y., Tinguely, J.-C., Spicher, A., Hedin, J., Gumbel, J., Strelnikov, B., Schueler, K., Baumgarten, G., Latteck, R., Huyghebaert, D., Renkwitz, T., Trondsen, E., Clausen, L., Stamm, J., and Varberg, E.: Dust and ionospheric constituents measured in the MLT during noctilucent cloud conditions, EGU General Assembly 2026, Vienna, Austria, 3–8 May 2026, EGU26-2889, https://doi.org/10.5194/egusphere-egu26-2889, 2026.

EGU26-4892 | Orals | ST3.2

Inferring the variability and magnitude of the vertical winds and associated heating/cooling rates from multistatic meteor radar measurements and meteorological reanalysis induced by the residual circulation  

Gunter Stober, Alan Liu, Alexander Kozlovsky, Johan Kero, Loretta Pearl Poku, Witali Krochin, Diego Janches, Masaki Tsutsumi, Satonori Nozawa, Mark Lester, and Nicholas Mitchell

Vertical winds induced by the residual circulation are extremely challenging to retrieve from measurements. Multistatic meteor radar networks facilitate implementing more sophisticated tomographic wind retrievals, either based on Bayesian inversions such as the 3DVAR+DIV algorithm or the spherical volume velocity processing (SVVP). A vertical wind climatology obtained from the Nordic Meteor Radar Cluster (NORDIC) showed summer upwelling with vertical winds between 8-12 cm/s corresponding to a cooling rate of 80 K/d. During the winter season, the downwelling indicated values of -2 to -4 cm/s, resulting in a warming of 15-25 K/d. An analysis of the time series from 2022 to 2025 revealed a correlation between the vertical wind magnitude and the strength of the meridional wind during the summer months, as expected from the residual circulation. Furthermore, we compared winds observed with NORDIC to the meteorological reanalysis JAWARA.   

How to cite: Stober, G., Liu, A., Kozlovsky, A., Kero, J., Pearl Poku, L., Krochin, W., Janches, D., Tsutsumi, M., Nozawa, S., Lester, M., and Mitchell, N.: Inferring the variability and magnitude of the vertical winds and associated heating/cooling rates from multistatic meteor radar measurements and meteorological reanalysis induced by the residual circulation , EGU General Assembly 2026, Vienna, Austria, 3–8 May 2026, EGU26-4892, https://doi.org/10.5194/egusphere-egu26-4892, 2026.

EGU26-4904 | ECS | Posters on site | ST3.2

Bridging Observations, Chemistry, and AI: A Comprehensive Study of Gigantic Jets from Parent Thunderstorms to Mesospheric Chemical Impact 

Yiwei Zhao, Gaopeng Lu, Hailiang Huang, Xin Huang, Zhu Meng, and Mengwen Guo

This study presents an integrated investigation of Gigantic Jets (GJs), encompassing an analysis of parent thunderstorm conditions and a quantitative assessment of their chemical impact on the middle atmosphere via a novel modelling approach. We focus on a remarkable sequence of five GJs observed within 7 minutes from an isolated thunderstorm over South China on 18 August 2022. Analysis reveals the event was associated with a high-altitude -10 ℃ isotherm, substantial convective available potential energy (~2158 J/kg), pronounced upper-level wind shear (~14.5 m/s), and dominant intracloud lightning activity preceded by narrow bipolar events.

To quantify the chemical perturbations, we developed the first one-dimensional plasma-chemical model that couples time-dependent electron kinetics with a comprehensive atmospheric reaction scheme. Simulations indicate that GJ discharges induce transient yet significant perturbations, most notably ozone depletion and nitrogen oxide (NOx) enhancement within the 40–50 km altitude range, driven by electron-impact ionization and subsequent ion-molecule chemistry. The model also captures the characteristic blue-to-red spectral transition in optical emissions, linking it to the excitation dynamics of N2 states.

Addressing computational efficiency and parametric uncertainty in traditional models, this research innovatively integrates a Physics-Informed Neural Network (PINN) into the framework. The PINN, constrained by the underlying physicochemical equations, learns the mapping from background atmospheric parameters and electric fields to species concentrations. This hybrid approach enables rapid, physically consistent predictions of chemical perturbations and provides a robust tool for sensitivity analysis, highlighting the altitude-dependent sensitivity of key reaction pathways.

By synthesizing multi-platform observations, detailed plasma-chemical modelling, and advanced machine learning techniques, this work provides a comprehensive understanding of GJs, establishing a powerful and scalable framework for assessing the role of transient luminous events in middle atmospheric chemistry.

How to cite: Zhao, Y., Lu, G., Huang, H., Huang, X., Meng, Z., and Guo, M.: Bridging Observations, Chemistry, and AI: A Comprehensive Study of Gigantic Jets from Parent Thunderstorms to Mesospheric Chemical Impact, EGU General Assembly 2026, Vienna, Austria, 3–8 May 2026, EGU26-4904, https://doi.org/10.5194/egusphere-egu26-4904, 2026.

EGU26-5016 | ECS | Posters on site | ST3.2

Impact of Solar Proton Events on the Stratospheric Polar Vortex in the Northern Hemisphere: A Quantitative Analysis 

Yaxuan Li, Hui Li, Yuting Wang, Jingkang Sun, and Chi Wang

The stratospheric polar vortex (SPV) profoundly affects northern hemisphere weather and climate, with its dynamics influenced by terrestrial and solar factors. Despite established terrestrial influences, the quantitative effects of solar energetic particles have not yet been fully understood. This study presents a quantitative analysis of 27 intense solar proton events (SPEs) from 1986 to 2020, revealing a significant correlation between the integrated flux of SPEs and enhanced SPV wind speeds across altitudes. Notably, the wind speed enhancements, ranging from 1.8 m/s (15.1%) at 100 hPa to 3.0 m/s (7.3%) at 1 hPa, demonstrate an altitude‐dependent pattern, with the greatest impacts of 5.8 m/s (19.1%) at 5 hPa. A partial correlation analysis identifies SPEs as the dominant driver of SPV enhancement in the middle and lower stratosphere, while ultraviolet radiation dominates at the stratopause. We propose a mechanism involving the amplification of the meridional temperature gradient due to differential ozone responses, thereby linking solar activity to the modulation of the SPV. These findings enhance our understanding of solar‐terrestrial interactions and their implications for climate modeling.

How to cite: Li, Y., Li, H., Wang, Y., Sun, J., and Wang, C.: Impact of Solar Proton Events on the Stratospheric Polar Vortex in the Northern Hemisphere: A Quantitative Analysis, EGU General Assembly 2026, Vienna, Austria, 3–8 May 2026, EGU26-5016, https://doi.org/10.5194/egusphere-egu26-5016, 2026.

EGU26-5417 | Orals | ST3.2

Local and Global Drivers of the Mesopause 

Urs Schaefer-Rolffs and Christoph Zülicke

The drivers of the southern summer mesopause are investigated through a series of simulations using the Kühlungsborn Mechanistic General Circulation Model (KMCM) compared to lidar and radar observations from 2010 to 2013, which were presented in Lübken et al., JGR (2015). In general, the simulations before and during the breakdown of the polar jet agree quite well with the observations in terms of mesospheric winds and mesopause jumps, i.e., cooling and altitude changes. After the breakdown, the agreement is less good, as the mesopause response is more pronounced in the simulations than in the observations.

In my presentation, I will discuss the reason for the qualitative differences during the summer, namely the interaction between gravity wave activity and the two different mechanisms responsible for the jumps. These are 1)  the breakdown of the jet stream in November or December (allowing gravity waves from the lower atmosphere to propagate into the mesopause) and 2), the manifestation of interhemispheric coupling triggered by the warming of the northern winter stratosphere (which modifies the temperature gradient between the equatorial and polar regions). I will finish with an explanation for the differences between observations and simulations in the latter case due to a shift in the most cooled region relative to the mesopause.

How to cite: Schaefer-Rolffs, U. and Zülicke, C.: Local and Global Drivers of the Mesopause, EGU General Assembly 2026, Vienna, Austria, 3–8 May 2026, EGU26-5417, https://doi.org/10.5194/egusphere-egu26-5417, 2026.

EGU26-6323 | ECS | Posters on site | ST3.2

Evolutionary Structures of Kelvin–Helmholtz Instability in the Ionosphere Ca⁺ Layer Observed by Lidar 

Jixin Guo, Tao Yu, Lifang Du, Wenyu Hao, Jin Wang, Xiangxiang Yan, Yan Yu, Yifan Qi, Haoran Zheng, and Guotao Yang

Kelvin-Helmholtz (KH) instability driven by neutral wind shear is an important mechanism for the generation of sporadic-E (Es) layer irregularities. However, direct observational evidence describing the morphological evolution of these instabilities across different height regimes in the mesosphere and lower thermosphere (MLT) region, from collision-dominated to magnetized, remains rare. Here we present high-resolution lidar observations of the Ca⁺ layer at Beijing (40.5°N, 116.0°E), revealing structural morphology at different heights. In the lower E region (~110 km), we identify a cat's eye characteristic of KH turbulence, indicating that ions are effectively dragged by neutral motion due to high ion-neutral collision frequency. In addition to the cat's-eye features, the Ca⁺ ion layer also exhibits quasi-sinusoidal structures and streak-like features, demonstrating a pronounced periodicity. In contrast, at higher altitudes (>120 km) extending to 180 km, these layers evolve into isolated patches and streaks. Using numerical simulations with a coupled neutral ion fluid model, we successfully reproduce these height-dependent features. The model shows that although neutral wind waves at ~110 km altitude induce quasi sinusoidal modulation, the dominant role of the Lorentz force at high altitudes (~180 km) constrains ion motion along magnetic field lines, causing plasma to aggregate into dense clumps rather than overturning waves. These results provide observational verification of neutral turbulence modulating ionospheric plasma.

How to cite: Guo, J., Yu, T., Du, L., Hao, W., Wang, J., Yan, X., Yu, Y., Qi, Y., Zheng, H., and Yang, G.: Evolutionary Structures of Kelvin–Helmholtz Instability in the Ionosphere Ca⁺ Layer Observed by Lidar, EGU General Assembly 2026, Vienna, Austria, 3–8 May 2026, EGU26-6323, https://doi.org/10.5194/egusphere-egu26-6323, 2026.

EGU26-6500 | ECS | Posters on site | ST3.2

Influence of solar activity on the chemistry of the MLT-region modelled with ICON-ART 

Alexander Siebelts, Miriam Sinnhuber, and Markus Kunze

During times of high solar activity an increased amount of solar coronal mass ejections (CME) are observed and initiate geomagnetic storms. These solar wind particles are guided and accelerated by Earth's magnetic field and get redirected towards the polar region, where they precipitate into the atmosphere of Earth. In conjungtion with varying solar activity these SPEs and geomagnetic storms lead to increased ionization and dissociation of gases in the mesosphere and lower thermosphere of Earth. This leads to the photochemical creation of NOx and HOx species which influence the ozone chemistry of Earth's polar regions a short time after the CMEs.
To be able to study these events we use the ICOsahedral Non-hydrostatic model (ICON), a numerical weather and climate model developed by the German Weather Service (DWD), the Max-Planck Institute of Meteorology (MPI-M) and various codevelopers. Specifically we use the upper atmosphere extension (UA-ICON) and an external interactive chemistry model to study specific periods of high solar activity. This is a summary showcasing the different additions that have been made to the model to aid our studies, including an updated photolysis mechanism, fitting of geomagnetic data on the model grid, updated Lyman-α process and photoionization in the extreme UV and Schumann-Runge Continuum.

How to cite: Siebelts, A., Sinnhuber, M., and Kunze, M.: Influence of solar activity on the chemistry of the MLT-region modelled with ICON-ART, EGU General Assembly 2026, Vienna, Austria, 3–8 May 2026, EGU26-6500, https://doi.org/10.5194/egusphere-egu26-6500, 2026.

EGU26-6747 | ECS | Orals | ST3.2

Imaging Sub-minute Kilometer-Scale PMSE Dynamics and Layering Using a 5-Beam Multistatic Mode with the MAARSY Radar  

Mehrdad Vazifehkhah Hafteh, Devin Huyghebaert, Toralf Renkwitz, Ralph Latteck, and Jorge L. Chau

During the summer of 2025, the Middle Atmosphere Alomar Radar System (MAARSY) was operated to observe polar mesospheric summer echoes (PMSE) in a 5-beam multistatic configuration. The experiment combined 5 beam directions at the MAARSY transmitter with a newly established receiver array near Stø, located approximately 48 km southwest of MAARSY. Multi-beam coherent radar imaging (CRI) was applied for both the bistatic (MAARSY– Stø) link, and the monostatic (MAARSY–MAARSY) link, enabling for the first time, imaging of the same PMSE volume from different viewing geometries. Using CRI with high angular and temporal resolution, four-dimensional (space–time) observations of sub-minute, kilometer-scale dynamics in the mesosphere–lower thermosphere (MLT) region are achieved. The measurements resolve small-scale dynamical processes associated with turbulence, and gravity waves. The occurrence, evolution, and motion of PMSE structures, including layering, and sub-layers are investigated using radar signal strength, line of sight Doppler shift velocities, and spectral widths. In addition, the SIMONe meteor radar network around Andøya is used for providing continuous horizontally resolved background wind fields at PMSE altitudes. The presented case studies provide high resolution temporal and spatial information on kilometer-scale PMSE dynamics and demonstrate the advantage of multi-static imaging for advancing the understanding of MLT instabilities and turbulence.

How to cite: Vazifehkhah Hafteh, M., Huyghebaert, D., Renkwitz, T., Latteck, R., and L. Chau, J.: Imaging Sub-minute Kilometer-Scale PMSE Dynamics and Layering Using a 5-Beam Multistatic Mode with the MAARSY Radar , EGU General Assembly 2026, Vienna, Austria, 3–8 May 2026, EGU26-6747, https://doi.org/10.5194/egusphere-egu26-6747, 2026.

Sudden Stratospheric Warmings (SSWs) provide a direct route for dynamical and chemical coupling between the troposphere, stratosphere, mesosphere and lower thermosphere (MLT), but the vertical structure and event-to-event diversity of the associated ozone response are still not well quantified. We examine five Northern Hemisphere warmings (2009, 2011, 2013, 2019, and 2025) using Aura/MLS and TIMED/SABER temperature and ozone observations together with ERA5 reanalysis. Polar-cap (≥70°N) time–height temperature and ozone diagnostics are used to track anomalies from the lower stratosphere to the upper mesosphere (down to 0.001 hPa).

Major midwinter SSWs followed by elevated stratopause (ES) formation (2009, 2013, 2019) exhibit the strongest vertically coherent response: pronounced mesospheric cooling and a strong enhancement of the secondary ozone maximum near 0.01–0.003 hPa (≈80–90 km), with ozone nearly doubling shortly after onset. In contrast, the April 2011 final warming and the March 2025 major–final event show only weak mesospheric anomalies. In the lower–middle stratosphere (100–10 hPa), ozone increases persist for weeks after onset, while ES-type events are followed later by marked upper-stratospheric ozone decreases (10–1 hPa), consistent with the descent of NOx-rich MLT air during post-SSW recovery. Agreement across MLS, SABER, and ERA5 indicates that these coupled signals are robust and that SSW morphology controls the vertical reach of stratosphere–MLT coupling. We additionally present preliminary diagnostics of the 2026 SSW to place this event in the same framework.

How to cite: Shapiro, A. and Foelsche, U.: Vertical structure of upper-stratospheric and mesospheric ozone during polar stratospheric warmings, EGU General Assembly 2026, Vienna, Austria, 3–8 May 2026, EGU26-6868, https://doi.org/10.5194/egusphere-egu26-6868, 2026.

The sodium (Na) layer is a valuable tracer for mesosphere and lower thermosphere (MLT) dynamics. Integrating the observations from the instrument Optical Spectrograph and InfraRed Imaging System (OSIRIS) on the Odin satellite with simulation from the Specified Dynamics Whole Atmosphere Community Climate Model (SD-WACCM), we quantify high-latitude Na transport within a transformed Eulerian-mean framework. The mean residual circulation drives a seasonally reversing transport poleward of 60°: winter downdrafts deplete Na, while summer upwelling enhances it. This transport is modulated by gravity wave–driven mixing and molecular diffusion, with rapid chemistry limiting Na residence time. These coupled processes collectively regulate the Na layer's column abundance, peak density, and vertical extent, explaining observed hemispheric asymmetries and establishing Na as a sensitive diagnostic for MLT circulation-chemistry coupling.

How to cite: Wu, J.: Transport of the High-Latitude Sodium Layer in the Mesosphere and Lower Thermosphere, EGU General Assembly 2026, Vienna, Austria, 3–8 May 2026, EGU26-8673, https://doi.org/10.5194/egusphere-egu26-8673, 2026.

EGU26-10262 | Orals | ST3.2

The role of the electric field in formation of multilayered sporadic E(Es) in equatorial regions 

Giorgi Dalakishvili, Goderdzi G. Didebulidze, and Maya Todua

The multilayered structure of sporadic E(Es) is a well-known observable phenomenon in equatorial and mid-latitudes. This phenomenon can be caused by the presence of additional altitude regions, caused by electric field, with nodes of the vertical ion drift velocity, where near these nodes the maximum rate of their vertical convergence is achieved, which leads to the formation of Es layers.  In this case, regions with maximum ion convergence rate in the lower thermosphere (at an altitude of about 90-150 km) can be caused by an electric field, in addition with the propagation of atmospheric gravity waves and tidal wind.             

In this case, the combined effect of electric field, zonal wind velocity and wind shear can lead to the formation of additional Es layers, in contrast to the case where only zonal wind or/and its vertical shear factor dominates in the vertical convergence of ions.    

In the case of a combined effect of these factors, the disappearance of Es layers formed in the presence of only zonal wind velocity, its vertical shear or electric field is also possible.

In the equatorial region the factor of electric field in formation and dynamics of Es layers is significant.      

These processes of formation of multilayer sporadic E and/or its disappearance, using the horizontal wind model (HWM14) data and electric field (with constant vertical and zonal components in the cases of various polarizations), are considered numerically in equatorial regions.      

Evolution of sporadic E with Es-type two sub-layers sometimes could lead to the formation of the high density single Es layers.      

In the equatorial regions, electric field influences the ion drift velocity and therefore also can cause the displacement of layers. Here we will show the predominance of the downward motion of the Es sublayers, under influence of the electric field and the possibility of their merging into one high-density Es layer localizing in their most observable regions (about 95-105 km) of the lower thermosphere.      

Acknowledgements. This study is supported by the Shota Rustaveli National Science Foundation of Georgia Grant no. FR-21-22825.                

How to cite: Dalakishvili, G., Didebulidze, G. G., and Todua, M.: The role of the electric field in formation of multilayered sporadic E(Es) in equatorial regions, EGU General Assembly 2026, Vienna, Austria, 3–8 May 2026, EGU26-10262, https://doi.org/10.5194/egusphere-egu26-10262, 2026.

EGU26-10529 | Orals | ST3.2

Measurements of Atmospheric Dynamics from Space: SOVA-S, an ESA SCOUT mission candidate  

Sabine Wüst, Alexander Schall, Ulrike Stöffelmair, and Michael Bittner

For many decades, hydroxyl (OH) airglow has been used to study atmospheric dynamics on different scales from infrasound and gravity waves to tides and planetary waves. These measurements refer to the upper mesosphere/lower thermosphere; they are mostly ground-based and only performed at night. In recent years, equivalent space-based measurements, i.e. nadir and off-nadir measurements, have also been carried out by instruments such as Suomi/VIIRS (Visible Infrared Imaging Radiometer Suite) and AWE (Atmospheric Wave Experiment).

Unlike ground-based measurements, satellite-based instruments can provide global or nearly global information depending on the orbit. However, nadir and off-nadir space-based measurements are subject to additional unwanted background signals. The main sources of this background radiation are moonlight reflected by clouds and the Earth's surface, as well as emissions from artificial lights on the ground. Whether the background radiation omits the analysis of space-based OH-airglow data with respect to atmospheric waves depends on the strength of the background signal and of its spatial and temporal variations compared to the dynamically-induced variations of the OH airglow.

Suomi/VIIRS operates in a spectral range that is not ideal for OH-airglow observations and does not utilise a dedicated background channel; OH-airglow measurements are only possible on moonless nights against a dark background. This limitation could be reduced by measuring the strongest OH-airglow emissions in the infrared, and by using a background channel. SOVA-S is one such concept. It was selected as one of four projects for the consolidation phase in the second ESA SCOUT cycle in 2025, focusing on OH(3-1) Q-branch measurements.

The measurement concept of SOVA-S is briefly introduced, along with the differences to AWE — an OH airglow mission in the infrared with an onboard background channel on the ISS. The conditions, under which atmospheric wave analyses should be possible with SOVA-S with regard to cloud cover, moon phase and surface albedo, are outlined; the underlying analyses were performed using the radiative transfer model SCIATRAN. Potential applications of these data in the context of applied research (e.g. the influence of middle atmospheric dynamics on the GNSS signal integrity) are presented.

How to cite: Wüst, S., Schall, A., Stöffelmair, U., and Bittner, M.: Measurements of Atmospheric Dynamics from Space: SOVA-S, an ESA SCOUT mission candidate , EGU General Assembly 2026, Vienna, Austria, 3–8 May 2026, EGU26-10529, https://doi.org/10.5194/egusphere-egu26-10529, 2026.

EGU26-11654 | Orals | ST3.2

Comparisons of the meteoric input function derived from model-lidar data assimilation and Arecibo Observatory meteor measurements 

Tai-Yin Huang, Yanlin Li, Julio Urbina, Fabio Vargas, and Wuhu Feng

A new sodium chemistry model, NaChem, has been developed to study the sodium layer in the mesosphere and lower thermosphere. The NaChem model solves the continuity equation of all species with no steady-state assumption.  This work examines the Meteoric Input Function (MIF) using model data assimilation constrained by lidar observations, as well as the meteor measurements from the Arecibo Observatory (AO).  Sodium number density from the Colorado State University (CSU) Lidar and the Andes Lidar Observatory (ALO) are used as reference profiles in NaChem to infer the MIF, while the AO MIF is derived from micro-meteor radiant distributions.  Our results show that the CSU MIF agrees well with the AO MIF, but the ALO MIF exhibits significant differences.  The inferred meteoroid material input rates are 53+/-23 t/d from CSU and 83+/-28 t/d from ALO.  Our study also indicates that the sodium sink is mainly controlled by smoke uptake which is approximately three times more effective than the NaHCO3 dimerization process to remove sodium.  Lastly, our sensitivity study reveals that more NO+ will directly lead to fewer observable Na atoms in the atmosphere.  

How to cite: Huang, T.-Y., Li, Y., Urbina, J., Vargas, F., and Feng, W.: Comparisons of the meteoric input function derived from model-lidar data assimilation and Arecibo Observatory meteor measurements, EGU General Assembly 2026, Vienna, Austria, 3–8 May 2026, EGU26-11654, https://doi.org/10.5194/egusphere-egu26-11654, 2026.

EGU26-11983 | Orals | ST3.2

EPP-NOy Upper-Boundary Condition, validation and long-term trends 

Stefan Bender, Bernd Funke, Manuel Lopez Puertas, Gabriele Stiller, Peter Bernath, and Christopher Boone

Polar winter descent of NOy produced by energetic particle precipitation (EPP) in the mesosphere and lower thermosphere affects polar stratospheric ozone by catalytic reactions. This, in turn, may affect regional climate via radiative and dynamical feedbacks. NOy observations by MIPAS/Envisat during 2002--2012 have provided observational constraints on the solar-activity modulated variability of stratospheric EPP-NOy. These constraints have been used to formulate a chemical upper boundary condition (UBC) for climate models in the context of solar forcing recommendations. We have updated the UBC with the recently released, reprocessed MIPAS version~8 data. We compare this updated NOy UBC model to data from the ACE-FTS solar occultation instrument which has been providing measurements since 2004 and is still actively providing data today. This 20+-year, long-term dataset will enable us to assess the validity of the assumptions underlying the UBC model, such as its climatological approach, outside of the time period of the data it was derived from. Any deviation will enable us to assess the projected, climate-change induced changes in middle atmospheric chemistry and transport, e.g. via changes in the Brewer-Dobson circulation.

How to cite: Bender, S., Funke, B., Lopez Puertas, M., Stiller, G., Bernath, P., and Boone, C.: EPP-NOy Upper-Boundary Condition, validation and long-term trends, EGU General Assembly 2026, Vienna, Austria, 3–8 May 2026, EGU26-11983, https://doi.org/10.5194/egusphere-egu26-11983, 2026.

EGU26-13898 | Orals | ST3.2

Towards predicting the weather of the mesosphere and lower thermosphere 

Daniel Marsh, Felix Sainsbury-Martinez, and Tracy Moffat-Griffin

Our knowledge of the dynamics and chemistry of the mesosphere and lower thermosphere (MLT) has increased greatly over the last several decades, aided by extensive satellite and ground-based observations and advances in numerical models. Together they provide estimates of the climatology of the MLT and how it varies with season and over decadal timescales. However, we have limited capability in predicting MLT day-to-day variations, i.e., its weather. Empirical models that take as input the day of year and solar flux / geomagnetic activity indices remain the standard tool for predicting such things as the drag on space debris in low earth orbit.  Such models can disagree on the state of the atmosphere by a factor of two.  Using the specified dynamics version of the Whole Atmosphere Community Climate Model (SD-WACCM) we explore MLT weather variations in a simulation that covers the period 2005 to 2015. Here we focus on variations near the mesopause at representative equatorial and high-latitude sites. After removing seasonal variations, we find that the majority of day-to-day weather arises from changes in the amplitude and phase of atmospheric tides. Moreover, it is typical that at most 5 tidal modes are sufficient to capture most of the short-term variability. Using wavelet analysis, we show that tidal variations can be linked to both external forcing (e.g., solar flux) and variability that propagates from below. We confirm prior studies that have shown a link to sudden stratospheric warmings but also see variations correlated to the North Atlantic Oscillation, the El Niño-Southern Oscillation, and the Quasi-Biennial Oscillation. Additionally, we explore if persistence of tidal variability can be used to improve prediction of near term MLT dynamics and demonstrate improvements over climatological approaches. Taken together these finding provide a gateway to improved MLT weather prediction, with the potential to reduce uncertainty in targeted re-entry, collision avoidance and disruptions to radio communications and global positioning systems.

How to cite: Marsh, D., Sainsbury-Martinez, F., and Moffat-Griffin, T.: Towards predicting the weather of the mesosphere and lower thermosphere, EGU General Assembly 2026, Vienna, Austria, 3–8 May 2026, EGU26-13898, https://doi.org/10.5194/egusphere-egu26-13898, 2026.

EGU26-14768 | Orals | ST3.2

From mesosphere to regional climate variability: Mechanism for downward coupling of polar mesospheric ozone loss 

Annika Seppälä, Niilo Kalakoski, Pekka Verronen, Daniel Marsh, Alexey Karpechko, and Monika Szelag

Solar driven energetic particle precipitation (EPP) is an important factor in polar atmospheric ozone balance throughout mesosphere and stratosphere. EPP has previously been linked to ground-level regional climate variability, but the linking mechanism has remained ambiguous. Reported observed and simulated ground-level changes start well before the processes from the main candidate, the so-called EPP-indirect effect, would start. Here, we show that initial reduction of polar mesospheric ozone and the resulting change in atmospheric heating rapidly couples to dynamics, transferring the signal downwards through the mesosphere and stratosphere, resulting in shifting the tropospheric jet polewards. This pathway is not constrained to the polar vortex, rather, a subtropical route plays a key role. Our results show that the signal propagates downwards in timescales consistent with observed tropospheric level climatic changes linked to EPP. This pathway, from mesospheric ozone to regional climate, is independent of the EPP-indirect effect, and solves the long-standing mechanism problem for EPP effects on climate.

How to cite: Seppälä, A., Kalakoski, N., Verronen, P., Marsh, D., Karpechko, A., and Szelag, M.: From mesosphere to regional climate variability: Mechanism for downward coupling of polar mesospheric ozone loss, EGU General Assembly 2026, Vienna, Austria, 3–8 May 2026, EGU26-14768, https://doi.org/10.5194/egusphere-egu26-14768, 2026.

EGU26-14879 | ECS | Orals | ST3.2

A Novel Technique for Remote Sensing of Mesospheric Temperatures with the NASA EZIE Mission 

Rafael Luiz Araujo de Mesquita, Jeng-Hwa Yee, William Swartz, Viacheslav Merkin, Greg Starr, Jeff Garretson, Sidharth Misra, Frank Werner, and Michael Schwartz

The Electrojet Zeeman Imaging Explorer (EZIE) mission employs measurements of the Zeeman-split O2 118.75 GHz polarized microwave emission to remotely sense magnetic fields associated with ionospheric electrojet currents. In addition to its primary science objectives, EZIE measurements are also sensitive to the mesospheric temperature altitude structure and line-of-sight Doppler shifts, enabling new measurements of the mesosphere and lower thermosphere (MLT).

We describe the technique used to retrieve mesospheric temperature profiles from EZIE brightness temperature spectra. The retrieval exploits the dependence of the O2 118.75 GHz spectral line shape on atmospheric temperature and pressure, as well as its polarization properties, using an iterative inversion framework applied to multi-polarization radiance measurements. Temperature information is encoded in the spectral width and shape of the emission, with the highest sensitivity in upper stratosphere and mesosphere.

We present initial EZIE temperature retrievals that reveal coherent mesospheric temperature structures consistent with wave-like variability in the MLT region. We also briefly discuss the sensitivity of the measurements to line-of-sight Doppler shifts associated with neutral winds, noting that vertical wind shear and broad contribution functions complicate direct wind interpretation. These results demonstrate the high potential of EZIE measurements to provide new constraints on mesospheric thermal structure and dynamics, complementing existing observational techniques and contributing to studies of MLT coupling processes.

How to cite: Araujo de Mesquita, R. L., Yee, J.-H., Swartz, W., Merkin, V., Starr, G., Garretson, J., Misra, S., Werner, F., and Schwartz, M.: A Novel Technique for Remote Sensing of Mesospheric Temperatures with the NASA EZIE Mission, EGU General Assembly 2026, Vienna, Austria, 3–8 May 2026, EGU26-14879, https://doi.org/10.5194/egusphere-egu26-14879, 2026.

EGU26-15357 | Posters on site | ST3.2

Laboratory Studies of OH(v) Production from the H + O3 Reaction 

Konstantinos S. Kalogerakis and Robert M. Robertson

The hydroxyl radical is a key player in the chemistry and energy balance of the middle terrestrial atmosphere and numerous studies have investigated the relevant photochemical processes. Nevertheless, several gaps exist in the understanding of its photochemistry, including the details of its production by the H + O3 reaction. A detailed understanding of the sources for mesospheric OH is necessary for the interpretation of the prominent OH Meinel band emissions. This knowledge is also a prerequisite for estimates of the heating efficiency of the highly exothermic H + O3 reaction, a key factor included in photochemical models of the upper atmosphere.

We will report on our laboratory measurements to investigate the production pathways and yields of highly vibrationally excited hydroxyl radical, OH(v), produced from H + O3. This knowledge is critical for a reliable analysis and interpretation of data from ground- and space-based observations of the nightglow OH Meinel band emission.

Research supported by NASA Heliophysics (LNAPP) under Grant 80NSSC23K0694.

How to cite: Kalogerakis, K. S. and Robertson, R. M.: Laboratory Studies of OH(v) Production from the H + O3 Reaction, EGU General Assembly 2026, Vienna, Austria, 3–8 May 2026, EGU26-15357, https://doi.org/10.5194/egusphere-egu26-15357, 2026.

EGU26-15777 | ECS | Posters on site | ST3.2

Investigation of spatial distribution of equatorial plasma bubbles and the potential causing factors 

Weijia Zhan, Yun-ju Chen, and Maosheng He

The ICON and GOLD missions provide a unique opportunity to investigate equatorial ionospheric dynamics and their role in the formation and evolution of equatorial plasma bubbles (EPBs). In this study, we examine the seasonal and solar cycle dependences of different EPB types, focusing on their spatial distributions and the underlying mechanisms responsible for their variations. We aim to address two key science questions: (1) What are the statistical characteristics of different EPB types across seasons and solar activity levels, and what are the corresponding background equatorial ionospheric conditions?(2) What primary factors drive the observed seasonal and solar cycle dependencies of these EPB types? EPB types are classified based on the spatial structures observed by GOLD, while the associated background ionosphere–thermosphere state is primarily inferred from ICON measurements, supplemented by ground-based observations where available. This study aims to provide critical insights that will help identify the root causes of EPB formation and contribute to the development of predictive strategies based on specific spatial characteristics.

How to cite: Zhan, W., Chen, Y., and He, M.: Investigation of spatial distribution of equatorial plasma bubbles and the potential causing factors, EGU General Assembly 2026, Vienna, Austria, 3–8 May 2026, EGU26-15777, https://doi.org/10.5194/egusphere-egu26-15777, 2026.

EGU26-15839 | ECS | Posters on site | ST3.2

Formation and evolution of nighttime MSTID modulated by the atmospheric tides 

Longchang Sun, Jiyao Xu, Weiyuan Yuan, and Yajun Zhu

In this report, we utilize data from the multi-ground-based instruments of the Chinese Meridian Project (CMP) and public national websites, including red-line all-sky airglow imagers, digisondes, GNSS-TEC receivers, and so on, to conduct an in-depth investigation into the formation and evolution processes as well as the accompanying physical mechanisms of two nighttime MSTID events occurring over the mid- and low-latitude regions of China. Specifically, we focus on the impacts of the hourly tidal-induced atmospheric dynamo process and its modulation effect on ionospheric electron density (airglow), which in turn affect the formation and evolution of these nighttime MSTIDs. The specific physical processes associated with the nighttime MSTIDs are discussed.

How to cite: Sun, L., Xu, J., Yuan, W., and Zhu, Y.: Formation and evolution of nighttime MSTID modulated by the atmospheric tides, EGU General Assembly 2026, Vienna, Austria, 3–8 May 2026, EGU26-15839, https://doi.org/10.5194/egusphere-egu26-15839, 2026.

This study investigates the modulation of the Quasi-Two-Day Wave (Q2DW) by the Quasi-Biennial Oscillation (QBO) in the mesosphere and lower thermosphere during 2012–2019, building on the framework of He and Forbes et al. (2021, Geophysical Research Letters). Meteor radar observations are used to characterize Q2DW variability, and a multivariate phase-based representation of the QBO and seasonal cycle is employed to quantify their joint influence. A statistical coupling analysis is applied to identify dominant modes linking QBO variability to Q2DW activity and to reconstruct the Q2DW field from the derived drivers. The results show that inclusion of the QBO significantly improves the representation of Q2DW variability, demonstrating a clear QBO modulation.

How to cite: He, M.: Seasonal and Quasi-Biennial Oscillation Control of Quasi-Two-Day Wave Variability, EGU General Assembly 2026, Vienna, Austria, 3–8 May 2026, EGU26-15919, https://doi.org/10.5194/egusphere-egu26-15919, 2026.

EGU26-16559 | ECS | Posters on site | ST3.2

Short-Term Tidal Modal Variability in the MLT Revealed by Combined ICON/MIGHTI and Meteor Radar Chain Observations 

Han Ma, Maosheng He, Xu Zhou, and Libo Liu

Atmospheric tides propagating upward from the lower atmosphere undergo nonlinear interactions and modulate ionospheric plasma redistribution, leading to pronounced day-to-day variability in ionospheric parameters. This variability reflects the superposition of multiple tidal components with different periods, zonal wavenumbers, and mode structures, yet the dominant modes remain unclear. A hybrid method that combines space-based observations (ICON/MIGHTI), ground-based measurements (Chinese meteor radar chain), and empirical tidal modes (ETMs) is applied to extract the short-term tidal variability. The method is validated during the 2021 sudden stratospheric warming event, capturing the enhancement of the SW2 tidal amplitude, a strengthened first antisymmetric mode, and the phase advance in E-region neutral winds. Future work will extend this approach to assess the modal contributions of tides to the variability of ionospheric plasma drift.

How to cite: Ma, H., He, M., Zhou, X., and Liu, L.: Short-Term Tidal Modal Variability in the MLT Revealed by Combined ICON/MIGHTI and Meteor Radar Chain Observations, EGU General Assembly 2026, Vienna, Austria, 3–8 May 2026, EGU26-16559, https://doi.org/10.5194/egusphere-egu26-16559, 2026.

EGU26-16872 | ECS | Posters on site | ST3.2

Evaluating the precision of age of air derived from trace gas satellite observations   

Sarah Vervalcke, Quentin Errera, Florian Voet, Michael Höpfner, Bernd Funke, Björn-Martin Sinnhuber, Alex Hoffmann, Peter Preusse, Stefan Bender, and Jörn Ungermann

Following the increase of greenhouse gas emissions, atmospheric models predict a strengthening of the middle atmospheric Brewer-Dobson circulation (BDC). Changes in the BDC, inferred from age of air (AoA) trends, can influence UTLS exchange processes, including stratosphere–troposphere transport of ozone. While models predict an acceleration of the BDC (i.e. a decrease of AoA), in-situ balloon observations suggest the opposite, although not significantly, given the limited number of observations and the substantial uncertainties (Garny et al., 2024a). Additionally, meteorological reanalyses disagree on the sign and magnitude of AoA trends, despite providing an optimized estimate of atmospheric circulation constrained by observations.

The Changing Atmosphere Infrared Tomography explorer (CAIRT) was proposed for ESA’s Earth Explorer 11 to address these inconsistencies. CAIRT was foreseen to achieve a precision of 0.5 years on the age of air, a requirement to assess long-term trends. 

This contribution aims to evaluate the capability of CAIRT to achieve this precision. Synthetic CAIRT profiles of six long-lived species (SF6, CH4, N2O, CFC11, CFC12 and HCFC22) are simulated by the Belgian Assimilation System for Chemical ObsErvations (BASCOE) chemistry transport model, considering CAIRT’s expected measurement errors and spatial resolution. CAIRT AoA observations, derived from the six long-lived species using the method of Voet et al. (2025), are compared to clock tracer AoA, simulated by the BASCOE model, to evaluate the agreement. The analysis is repeated three times by driving the model with the meteorological reanalyses MERRA2, ERA5, and JRA-3Q, respectively, to check if CAIRT precision would be sufficient to evaluate meteorological reanalyses.

How to cite: Vervalcke, S., Errera, Q., Voet, F., Höpfner, M., Funke, B., Sinnhuber, B.-M., Hoffmann, A., Preusse, P., Bender, S., and Ungermann, J.: Evaluating the precision of age of air derived from trace gas satellite observations  , EGU General Assembly 2026, Vienna, Austria, 3–8 May 2026, EGU26-16872, https://doi.org/10.5194/egusphere-egu26-16872, 2026.

The important role of the magnitude, direction, and shear of the neutral wind in the formation and localization of sporadic ionospheric E(Es) layers, recently noted by the authors (Dalakishvili et al., JASTP, 2020; Didebulidze et al., Atmosphere, 2020; 2023; 2025; JASTP, 2025), allowed us to better understand the observed relationship between this phenomenon and the nightglow intensity of the oxygen green 557.7 nm line.

The predominantly descending tendency of the Es layers at mid-latitudes and their localization at it more observable height region (around 95-105km) of the lower thermosphere are close to the peak height (around 95km) of the volume emission rate (VER) of the 557.7nm line.

In these cases, the Es layers can be formed by neutral wind velocity with a northerly, westerly, or descending component. Such a neutral wind, can be tidal in origin or/and originate from atmospheric gravity waves (AGWs), which can also cause an increase in the green line intensity, due to increased oxygen reach downstream flux to the height of the green line luminous layer.     

Using the Barth two-step mechanism of O(1S) excitation and estimating corresponding VER of the 557.7nm line and its integral intensity, the downward flux of neutrals caused by the tidal wind, and the approximate speed of neutral wind, the possibility of formation of Es layers and their localization at an altitude close to the luminous layer is shown.  

The emphasizes will be on the formation of Es layers during tectonic events by the influence of AGWs, which sometimes are characterized by an increase in the 557.7nm line intensity. In this case, AGWs can form Es layers and also influence the downward flux of neutral particles as they dissipate above the green line emission layer.

Acknowledgements. This study is supported by the Shota Rustaveli National Science Foundation of Georgia Grant no. FR-21-22825.                


How to cite: Didebulidze, G. G., Dalakishvili, G., and Todua, M.: Relationship between formation and localization of the ionospheric sporadic E(Es) layers and the oxygen green 557.7nm line nightglow intensity  , EGU General Assembly 2026, Vienna, Austria, 3–8 May 2026, EGU26-17219, https://doi.org/10.5194/egusphere-egu26-17219, 2026.

EGU26-17434 | ECS | Posters on site | ST3.2

Sodium Layer Responses to the Sudden Stratospheric Warming 

Shuo Li, Hailun Ye, Jianfei Wu, and Xianghui Xue

This study investigates the response of the mesospheric and lower thermospheric (MLT) sodium (Na) layer to the 2002 Southern Hemisphere sudden stratospheric warming (SSW) event using model simulations. Simulations from the Whole Atmosphere Community Climate Model (WACCM) metal layer dataset reveal a marked decrease in sodium number density occurring during the SSW. The latitudinal evolution of sodium number density displays a distinct northward propagation toward near-equatorial regions. Furthermore, ground-based sodium lidar observations at 23°S in Brazil record a significant reduction in sodium number density approximately 10 days following the SSW onset. Planetary wave components derived from WACCM simulations of Na density and temperature are closely associated with the observed modulation in the Na layer. These findings indicate that SSWs can induce cross-hemispheric responses in the sodium layer, likely mediated by enhanced planetary wave activity.

How to cite: Li, S., Ye, H., Wu, J., and Xue, X.: Sodium Layer Responses to the Sudden Stratospheric Warming, EGU General Assembly 2026, Vienna, Austria, 3–8 May 2026, EGU26-17434, https://doi.org/10.5194/egusphere-egu26-17434, 2026.

EGU26-17606 | Orals | ST3.2

Ozone responses to the geomagnetic storms in 2024 and 2025 

Jia Jia, Yvan Orsolini, Antti Kero, Jiarong Zhang, Neethal Thomas, Maxime Grandin, Max Van de Kamp, and Patrick. J. Espy

Solar Cycle 25 has approached its maximum phase, bringing an elevated frequency of solar eruptive events and associated geomagnetic disturbances. During 2024 and 2025, several intense geomagnetic storms have provided rare opportunities to examine the short-term coupling between space‐weather forcing and the middle atmosphere. Previous studies have shown that energetic particle precipitation (EPP) during geomagnetic storms can substantially modify the chemical composition of the mesosphere and lower thermosphere (MLT), particularly through the production of odd nitrogen (NOx) and odd hydrogen (HOx), which catalytically destroy ozone. In this presentation, we investigate the MLT ozone responses to several large geomagnetic storms occurring in 2024–2025 using MLS satellite observation. We will also estimate the particle forcing associated with these events using the observed ozone chemical responses. This analysis provides a testbed for climate model inputs.

How to cite: Jia, J., Orsolini, Y., Kero, A., Zhang, J., Thomas, N., Grandin, M., Van de Kamp, M., and Espy, P. J.: Ozone responses to the geomagnetic storms in 2024 and 2025, EGU General Assembly 2026, Vienna, Austria, 3–8 May 2026, EGU26-17606, https://doi.org/10.5194/egusphere-egu26-17606, 2026.

EGU26-17676 | ECS | Posters on site | ST3.2

A New Hybrid PINN for High-Resolution Spatiotemporal Nowcasting of Stratospheric and Mesospheric States 

Zhengqing Liu and Junfeng Yang

High-precision prediction of atmospheric environmental parameters is vital for high-altitude balloon experiments, aerospace missions, and climate simulation research. While traditional numerical weather prediction (NWP) models solve atmospheric partial differential equations (PDEs), their high computational cost limits short-term forecast timeliness. Pure data-driven deep learning models improve efficiency but often violate physical laws, leading to overfitting and poor generalization.

To address these issues, Physics-Informed Neural Networks (PINNs) integrate data-driven learning with physical equations by incorporating PDEs as soft constraints in the loss function. However, standard PINNs struggle with high-dimensional spatiotemporal prediction due to training instability and convergence difficulties, especially in multi-scale, nonlinear atmospheric systems.

In response to the above issues, this study proposes a new PINN framework that combines hard constraints and soft constraints for high-resolution short-term and near-term prediction of wind, temperature, density and air pressure within an altitude range of 10 to 70 km. The core innovation lies in a novel network design that enforces symbolic constraints and the equation of state via hard constraints, while incorporating atmospheric dynamics equations through soft constraints, thereby creating a complementary optimization mechanism. Specifically, hard constraints strictly ensure the positivity of key variables (such as air pressure and temperature) by modifying the output structure of the network. Soft constraints are based on the Navier-Stokes equation in spherical coordinate form, introducing the residual terms of momentum conservation and mass conservation into the loss function as physical regularization terms. In addition, this study is the first to verify the model using actual stratospheric balloon flight test data. By comparing the observation results of the SENSORs project in the Qinghai region of China in 2019, the prediction accuracy and stability of the model in real scenarios are evaluated.

The experimental results show that the hybrid constrained PINN framework proposed in this study has achieved remarkable effects in the case of Qinghai region (90°-100°E, 30°-40°N). This method effectively suppresses non-physical oscillations while maintaining the physical consistency of the prediction results, reducing the root mean square error of short-term and near-term forecasts by approximately 28% compared to pure data-driven models. This method demonstrates superior generalization performance and stability in tasks ranging from sparse training data (0.5°×0.5°×2 km) to high-resolution predictions (0.25°×0.25°×1 km). Meanwhile, the collaborative mechanism of hard constraints and soft constraints significantly enhances the physical interpretability of the model, providing a new reliable approach for high-precision and high-efficiency numerical prediction in complex atmospheric environments.

How to cite: Liu, Z. and Yang, J.: A New Hybrid PINN for High-Resolution Spatiotemporal Nowcasting of Stratospheric and Mesospheric States, EGU General Assembly 2026, Vienna, Austria, 3–8 May 2026, EGU26-17676, https://doi.org/10.5194/egusphere-egu26-17676, 2026.

EGU26-18818 | ECS | Orals | ST3.2

Effect of energetic electron precipitation on ozone and the southern polar vortex: The role of chlorine deactivation 

Antti Salminen, Timo Asikainen, and Kalevi Mursula

The polar vortex is a system of strong westerly winds surrounding the cold polar region which forms in the middle atmosphere every winter. In the southern hemisphere the polar vortex is stronger and lasts longer than its northern counterpart. Consequently, the southern polar vortex provides sufficiently cold circumstances where massive ozone depletion by reactive chlorine oxides (ClOx) forms a large ozone hole after the polar night. Energetic electron precipitation (EEP) is an external driver which modifies ozone chemistry and, thereby, the thermal and dynamical balance in the wintertime middle atmosphere. Precipitating electrons originate from the near-Earth space and produce nitrogen (NOx) and hydrogen oxides (HOx) which catalytically destroy ozone. Earlier studies have shown that EEP-NOx both decreases ozone and deactivates chlorine oxides in the stratosphere in the southern hemisphere. Moreover, EEP is found to affect the strength of the polar vortex and even surface climate modes like the NAO (North Atlantic Oscillation) and the SAM (Southern Annular Mode), but the mechanisms causing these effects are still unclear. We study here the chemical and dynamical variability related to EEP and its seasonal evolution in the southern mesosphere and stratosphere using the POES and Aura satellite measurements and the ERA5 reanalysis data. We show that EEP increases NOx and decreases both ozone and ClO in the upper stratosphere in early winter. However, when EEP-NOx reaches the middle stratosphere during the spring, ClO is still decreased but ozone and temperature are increased, and the polar vortex becomes weaker. Moreover, we found that the correlation between EEP and the southern polar vortex has significantly changed during the last 80 years and is tightly related to the amount of chlorine in the stratosphere. These findings show that EEP weakens the southern springtime vortex and drives negative SAM at least partly via chlorine deactivation.

How to cite: Salminen, A., Asikainen, T., and Mursula, K.: Effect of energetic electron precipitation on ozone and the southern polar vortex: The role of chlorine deactivation, EGU General Assembly 2026, Vienna, Austria, 3–8 May 2026, EGU26-18818, https://doi.org/10.5194/egusphere-egu26-18818, 2026.

EGU26-19094 | ECS | Orals | ST3.2

Thermospheric Mass Density Observations and Empirical Modeling Using the Tianmu-1 Constellation 

Yujiao Jin, Maosheng He, Xianguo Zhang, Yongping Li, and Jiangzhao Ai

Thermospheric mass density is a major source of uncertainty in spacecraft orbit prediction, particularly in low earth orbit. Since 2023, the Tianmu-1 constellation has deployed 12 satellites in sun-synchronous orbits at ~500 km altitude, each equipped with the Orbital Neutral Atmospheric Detectors (OADs) to provide in-situ measurements of thermospheric mass density and composition. In this study, density data from five Tianmu-1 satellites (TM02, TM03, TM07, TM11, and TM15) are used to construct a preliminary empirical thermospheric mass density model. The OAD measurements are firstly compared against the independent GRACE-FO accelerometer-derived density data. The results show that the calibrated Tianmu-1 densities agree well with GRACE-FO observations, with correlation coefficients exceeding XX and mean biases below XX%. The calibrated densities are then analyzed to quantify their responses to solar EUV flux and geomagnetic activity. Finally, an empirical density model is developed using the Empirical Orthogonal Function (EOF) decomposition. The EOF-based model reproduces the major spatial-temporal variability of the thermosphere and achieves a modeling accuracy of XX%, demonstrating the potential of the Tianmu-1 constellation for operational thermospheric mass density specification.

How to cite: Jin, Y., He, M., Zhang, X., Li, Y., and Ai, J.: Thermospheric Mass Density Observations and Empirical Modeling Using the Tianmu-1 Constellation, EGU General Assembly 2026, Vienna, Austria, 3–8 May 2026, EGU26-19094, https://doi.org/10.5194/egusphere-egu26-19094, 2026.

EGU26-19824 | ECS | Posters on site | ST3.2

Long-term Observations of Gravity Wave Energy and Momentum Fluxes in the Middle Atmosphere from SABER/TIMED satellite 

Juliana Jaen, Corwin Wright, and Neil Hindley

Gravity waves are a fundamental component of middle-atmosphere dynamics, playing a key role in the redistribution of momentum and energy and thereby shaping the thermal structure and large-scale circulation of the stratosphere and mesosphere. Through their interaction with the mean flow, gravity waves contribute to processes such as the driving of the residual circulation, seasonal variability, and coupling between atmospheric layers. Despite their recognised importance, gravity wave activity remains highly variable in space and time and is still poorly represented in global circulation and climate models, highlighting the need for long-term observational constraints. This work aims to quantify gravity wave contributions in the stratosphere and lower mesosphere using temperature perturbations derived from the Sounding of the Atmosphere using Broadband Emission Radiometry (SABER) instrument over the period 2002–2025. Gravity wave potential energy, momentum fluxes, and wave amplitudes are used to construct climatologies describing the spatial structure and temporal variability of gravity wave activity. The analysis focuses on the Northern Hemisphere winter, when enhanced gravity wave potential energy is observed in the SABER seasonal climatology. Beyond seasonal variability, the ongoing analysis investigates interannual and long-term variations in gravity wave activity, with the aim of exploring potential links to changes in large-scale circulation and background conditions. To complement the satellite-based observations, wind perturbation variances derived from the Esrange meteor radar (68°N, 21°E) are used to characterise gravity wave signatures at high northern latitudes over the period 1999–2024. By combining long-term satellite and ground-based observations, this work seeks to improve the observational characterisation of gravity wave variability in the middle atmosphere.

How to cite: Jaen, J., Wright, C., and Hindley, N.: Long-term Observations of Gravity Wave Energy and Momentum Fluxes in the Middle Atmosphere from SABER/TIMED satellite, EGU General Assembly 2026, Vienna, Austria, 3–8 May 2026, EGU26-19824, https://doi.org/10.5194/egusphere-egu26-19824, 2026.

EGU26-19902 | Posters on site | ST3.2

Climatology of middle atmospheric conditions to support studies of future satellite middle atmospheric missions 

Quentin Errera, Jonathan Flunger, Bernd Funke, Alex Hoffmann, Michael Höpfner, Piera Raspollini, Jörn Ungermann, and Björn-Martin Sinnhuber

This contribution presents a climatology of the atmospheric conditions that was created to support feasibility studies for the Changing Atmosphere Infra-Red Tomography explorer (CAIRT) candidate mission to ESA Earth Explorer 11. This climatology provides the mean and standard deviation of 35 atmospheric parameters (BrONO2, C2H2, C2H6, CCl4, CF4, CFC11, CFC12, CH4, ClO, ClONO2, CO, CO2, H2O, H2SO4, HCFC22, HCN, HDO, HNO3, HO2NO2, N2O, N2O5, NH3, NO, NO2, O, O1D, O2, O3, OCS, PAN, SF6, SO2, temperature, pressure and surface pressure) on a vertical grid between 0 and 200 km with 1 km spacing, five latitude bands (90°S–70°S, 55°S–35°S, 20°S–20°N, 35°N–55°N and 70°N–90°N), four months corresponding to different seasons (January, April, July, and October) and two overpass local times (09:30 and 21:30).

Since no single atmospheric model or dataset provides all relevant trace gases across the required vertical domain, this climatology was created by blending outputs from multiple simulations of different models : WACCM-ACOM, WACCM-AMIP, WACCM-X and BASCOE. For two species (CF4 and HDO), no model simulation has been found and their climatology is based on ACE-FTS observations. This contribution will describe the input models and observations and how they have been merged vertically when necessary. This climatology, named CAIRT ERS (Extended Reference Scenario) can be downloaded here: https://doi.org/10.5281/zenodo.10022129.

How to cite: Errera, Q., Flunger, J., Funke, B., Hoffmann, A., Höpfner, M., Raspollini, P., Ungermann, J., and Sinnhuber, B.-M.: Climatology of middle atmospheric conditions to support studies of future satellite middle atmospheric missions, EGU General Assembly 2026, Vienna, Austria, 3–8 May 2026, EGU26-19902, https://doi.org/10.5194/egusphere-egu26-19902, 2026.

EGU26-20233 | Orals | ST3.2

Insights into Mesospheric Chemistry by Ionospheric Heating at HAARP  

Robert C. Moore, Harrison Burch, James Camp, R. William McCoy, and Joshua Santos

During three ionospheric heating campaigns in 2025, including the 2025 Polar Aeronomy and Radio Science (PARS) summer school held by the University of Alaska Fairbanks, the University of Florida’s Ionospheric Radio Lab (IRL) performed a variety of active ionospheric heating experiments using the High-frequency Active Auroral Research Program’s (HAARP) Ionospheric Research Instrument (IRI).  High frequency (HF) partial reflection and HF cross-modulation experiments were used to investigate the dynamic response of the mesosphere to short time-scale heating.  ELF/VLF wave generation experiments were designed to identify the location of the ELF/VLF source region and to quantify the spatial distribution of the auroral electrojet currents.  Additionally, VLF scattering experiments were designed to characterize mesospheric HF heating by moving the HAARP-generated scattering body in a proscribed manner.

UF made a concerted effort to detect the effects described above at seven widely spaced radio receiver locations, each of which was selected to be extremely radio quiet.  Noise at each site was mitigated at the receiver by operating using a sinusoidal power generator. The logistical effort required all UF graduate students’ effort, and we are especially grateful for the efforts of our colleagues at Auburn University and at the University of Alaska Fairbanks for their help operating these remote sites.

In this paper, we present observations and analysis for the experimental efforts studying HF propagation, ELF/VLF wave generation, and VLF scattering with a particular emphasis on insights provided into mesospheric dynamics.  We comment on the possible future impact of the (now-operational) HAARP Lidar on these analyses: a potentially important diagnostic for the mesospheric electron density and electron temperature, as well for as the spatial distribution of electrojet currents above HAARP.

How to cite: Moore, R. C., Burch, H., Camp, J., McCoy, R. W., and Santos, J.: Insights into Mesospheric Chemistry by Ionospheric Heating at HAARP , EGU General Assembly 2026, Vienna, Austria, 3–8 May 2026, EGU26-20233, https://doi.org/10.5194/egusphere-egu26-20233, 2026.

EGU26-21665 | Orals | ST3.2

Lower-thermospheric tidal variability as diagnosed by rotated empirical orthogonal function analysis 

Yosuke Yamazaki, Huixin Liu, Kaoru Sato, Dai Koshin, and Claudia Stolle

Understanding tidal variability in the lower thermosphere is essential for accurate prediction of ionospheric weather. In this study, we investigate lower-thermospheric tidal variability by applying rotated empirical orthogonal function (EOF) analysis to tides in temperature and wind fields at 80-110 km obtained from the JAWARA reanalysis over the past two decades. The rotated EOF analysis identifies the dominant modes of tidal variability as functions of latitude and altitude. The leading EOF modes exhibit latitudinal structures similar to the Hough modes predicted by classical tidal theory. Their principal component time series are compared with various meteorological indices (such as ENSO and QBO indices), allowing us to assess the relative importance of different meteorological processes for different tidal components (such as DE3 and SW2).

How to cite: Yamazaki, Y., Liu, H., Sato, K., Koshin, D., and Stolle, C.: Lower-thermospheric tidal variability as diagnosed by rotated empirical orthogonal function analysis, EGU General Assembly 2026, Vienna, Austria, 3–8 May 2026, EGU26-21665, https://doi.org/10.5194/egusphere-egu26-21665, 2026.

The longitudinal structures of EIA have been extensively studied by using satellite data. However, there are few observations and studies, due to the weak ionosphere near midnight. In this paper, we studied the longitudinal structures of EIA at 02:00 local time during geomagnetically quiet period, benefitted from the satellite orbits and high sensitivity of FY‐3D IPM. We found that the wavenumber 4 longitudinal structures of EIA still exist at 02:00 local time and are obvious at equinoxes. Compared with SSUSI F18 data, FY‐3D IPM data showed different characteristics of wavenumber 4 component of EIA longitudinal structures. Because of the different local time of data between SSUSI F18 and FY‐3D IPM, we consider that the longitudinal wavenumber 4 structures of EIA after midnight originated from the cross‐equatorial neutral wind rather than the electric field modulated by zonal neutral wind in daytime.

How to cite: Zhang, B., Fu, L., Mao, T., Jiang, F., and Wang, J.: Wavenumber 4 Longitudinal Structure of the Ionosphere after Midnight Based on the OI135.6 nm Night Airglow Using FY‐3D Ionospheric Photometer, EGU General Assembly 2026, Vienna, Austria, 3–8 May 2026, EGU26-21711, https://doi.org/10.5194/egusphere-egu26-21711, 2026.

EGU26-22391 | Orals | ST3.2

Keystone: a novel terahertz limb-sounding mission advancing chemistry, dynamics, and vertical coupling in the MLT 

Daniel Gerber, Heinz-Wilhelm Huebers, John Plane, Daniel Marsh, Christian von Savigny, Maya Garcia Comas, Patrick Espy, Claudia Stephan, Corwin Wright, Jörg Gumbel, Luca Spogli, William E Ward, Elisabetta Iorfida, and Ben Veihelmann

The Mesosphere and Lower Thermosphere (MLT, ~70–120 km) is a key transition region governing the coupling between the lower atmosphere and near-Earth space. Despite its central role in atmospheric chemistry and dynamics, the MLT remains one of the least observed domains, leading to large uncertainties in composition, temperature, density, and winds, particularly near the mesopause and below the turbopause. A long-standing “holy grail” of MLT research is the direct, global, and time-resolved measurement of atomic oxygen, the dominant energy carrier controlling the chemistry and thermal balance of the region, which has remained inaccessible until recent advances in terahertz (THz) receiver technology.

Keystone is one of the four ESA Earth Explorer 12 candidate missions and is currently undergoing Phase-0 science and system studies. Its primary scientific objective is to provide comprehensive, global, and time-resolved measurements of MLT chemistry, temperature, and dynamics, enabling improved understanding of vertical coupling and wave–mean flow interactions involving gravity waves, tides, and planetary waves from diurnal to seasonal timescales. The mission’s core payload is a high-spectral-resolution supra-THz (1–5 THz) radiometer, complemented by infrared and UV–visible limb instruments. Keystone will retrieve vertical profiles of key neutral species, including direct global measurements of atomic oxygen, together with temperature profiles and mesospheric winds derived from Doppler-shift spectroscopy. These simultaneous observations of neutral dynamics and composition also support improved understanding of the drivers of ionospheric variability, including the neutral wind dynamo governing electrodynamics in the E-region.

Beyond its fundamental science goals, Keystone addresses an important societal challenge. Improved constraints on MLT density and temperature provide physically consistent lower-boundary conditions for thermospheric density models used in satellite drag prediction. By reducing uncertainties propagated upward into the thermosphere, such constraints are expected to yield order-tens-of-percent improvements in residual drag and orbit propagation accuracy, supporting safer and more sustainable operation of the increasingly congested low and very-low-Earth-orbit environment.

How to cite: Gerber, D., Huebers, H.-W., Plane, J., Marsh, D., Savigny, C. V., Comas, M. G., Espy, P., Stephan, C., Wright, C., Gumbel, J., Spogli, L., Ward, W. E., Iorfida, E., and Veihelmann, B.: Keystone: a novel terahertz limb-sounding mission advancing chemistry, dynamics, and vertical coupling in the MLT, EGU General Assembly 2026, Vienna, Austria, 3–8 May 2026, EGU26-22391, https://doi.org/10.5194/egusphere-egu26-22391, 2026.

EGU26-1814 | ECS | PICO | AS3.26

The 100 largest surface ozone episodes in Europe during 2003–2022: role of meteorology and emissions 

Tahimy Fuentes-Alvarez, Carlos Ordóñez, Ricardo García-Herrera, David Barriopedro, Rodrigo Crespo-Miguel, and Miguel M. Lima

Large-scale ozone episodes over Europe are influenced by complex interactions between meteorology and precursor availability, whose relative importance varies across regions and seasons. This study investigates the spatial distribution and drivers of the 100 largest ozone episodes identified in the Copernicus Atmosphere Monitoring Service (CAMS) global reanalysis over Europe during April–September 2003–2022.

First, ozone extremes are identified as exceedances of the local 95th percentiles of daily ozone maxima. A semi-Lagrangian algorithm is employed to merge them as daily patterns and then into ozone episodes if they are connected in space and time. This enables a robust characterisation of their spatial extent and temporal evolution. We find that large ozone episodes mainly affect regions north of around 48° N in Apr-May and south of 54° N in Jun-Sep, clustering in three key regions: the British Isles (BRIT) and Eastern Europe (EEU) during Apr-May, and a large region that covers Central Europe (CEU) in Jun-Sep. Additional meteorological and chemical data, as well as an algorithm for the identification of atmospheric blocking and subtropical ridges, are used to assess the role of meteorological processes and precursor emissions in the formation of ozone episodes in these regions and seasons.

In EEU, ozone episodes are favoured by well-defined anticyclonic conditions, although elevated precursor concentrations, frequently linked to biomass burning, are also required. In contrast, large episodes affecting BRIT occur under atypical synoptic conditions characterized by negative anomalies of 500 hPa geopotential height and daily maximum temperature at 2 m as well as stronger than usual winds. The potential reasons for these unexpected results are discussed. In CEU, we identify significant north-south differences: episodes in northern CEU are strongly influenced by persistent blocks and ridges, while those in the south are associated with weaker synoptic forcing, with enhanced subsidence as the main contributing mechanism. These findings are relevant for future air quality assessments as they demonstrate that the occurrence of large-scale ozone episodes in Europe is driven by region-specific combinations of meteorological conditions and precursor availability.

How to cite: Fuentes-Alvarez, T., Ordóñez, C., García-Herrera, R., Barriopedro, D., Crespo-Miguel, R., and Lima, M. M.: The 100 largest surface ozone episodes in Europe during 2003–2022: role of meteorology and emissions, EGU General Assembly 2026, Vienna, Austria, 3–8 May 2026, EGU26-1814, https://doi.org/10.5194/egusphere-egu26-1814, 2026.

The re-emergence of COVID-19 in late spring (April 29 to June 5) of 2022 compelled the Beijing government to implement a stringent lockdown policy to curb the spread of the virus. In comparison to the first lockdown in the winter of 2020, the late spring lockdown provided a more suitable opportunity to examine how ozone (O3) responds to substantial emission reductions during a photochemically active season. This study investigates the
meteorological and chemical mechanisms underlying the surface O3 enhancement during the 2022 late spring lockdown in Beijing, using a combination of ground-based and satellite observations, along with three meteorology normalization models (Random Forest, Long Short Term Memory, and eXtreme Gradient Boosting). The results indicate that the surface O3 concentration in Beijing increased by 4.9 ppbv during the 2022 lockdown
(compared to the same period in 2021 and 2023). The multiple meteorology normalization models reveal that on average 14.3 % (0.7 ppbv) of surface ozone enhancement was attributed to adverse meteorological conditions, and the remaining 85.7 % (4.2 ppbv) attributed to unfavorable emission factors, including a substantial reduction in nitrogen oxides (NOx) and a slight increase in volatile organic compounds (VOCs). Despite substantial NOx reductions during the lockdown, the O3 formation sensitivity remained VOC-limited, rather than shifting to NOx-limited as expected, highlighting the priority of VOC-targeted management for controlling O3 pollution at the current stage.

How to cite: Ma, Z. and Liao, Z.: Meteorology-normalized ozone enhancement during the 2022 late-spring COVID-19 lockdown in Beijing, EGU General Assembly 2026, Vienna, Austria, 3–8 May 2026, EGU26-2409, https://doi.org/10.5194/egusphere-egu26-2409, 2026.

EGU26-4020 | ECS | PICO | AS3.26

Setting the path for evaluating ozone recovery in the Alps using a homogenised long-term ground-based ozone time series. 

Fernanda Cabello, Julian Gröbner, Luca Egli, Franz Zeilinger, Eliane Maillard Barras, Rolf Ruefenacht, and Gunter Stober

The recovery of the ozone layer is expected by the middle of the 21st century, after the significant depletion detected during the 1980s. However, confirming this recovery critically relies on high-quality and long-term measurements, which play a key role in monitoring changes in atmospheric constituents and in detecting global trends.

Here we present the homogenised ozone time series of Arosa/Davos. This time series is based on measurements performed by Dobson and Brewer spectroradiometers covering the period from 1926 to the present and constitutes the world’s longest continuous ground-based ozone dataset. This study focuses on the 1990 to 2024 period and the eventual recovery of ozone after the international efforts to reduce the chlorofluorocarbons emissions. We use the merged ozone times series of Arosa/Davos composed of three Brewer and three automated Dobson spectroradiometers data records. To reconcile the seasonal discrepancies between the Brewer and the Dobson dataset, we followed the methodology explained in previous studies. The improvements employed includes replacing the operational ozone absorption cross-section (Bass and Paur, 1985) with the measured by the University of Bremen (Serdyuchenko et al., 2014) and correcting the ozone effective temperature using the ozone sondes measurements from Payerne. Furthermore, the measurement uncertainty was derived for each of the six instruments to produce homogenised merged ozone dataset.

The relocation of the instruments from Arosa to Davos during the period 2011-2021 was carefully analysed and allowed the determination of a constant transfer factor to ensure homogeneity of total column ozone between both sites. This factor was found to be equal to the climatological tropospheric ozone column differences. Finally, the datasets from all instruments were merged to combine one consistent single record.

The robustness of this merged ozone time series should enable the detection of an ozone recovery signal, by reducing the possibility of misinterpretation due to instrumental artefacts. As a future work, we will aim to assess long-term ozone changes and evaluated the attribution of the stratospheric and tropospheric ozone from the potential recovery detection of this homogenised time series.

How to cite: Cabello, F., Gröbner, J., Egli, L., Zeilinger, F., Maillard Barras, E., Ruefenacht, R., and Stober, G.: Setting the path for evaluating ozone recovery in the Alps using a homogenised long-term ground-based ozone time series., EGU General Assembly 2026, Vienna, Austria, 3–8 May 2026, EGU26-4020, https://doi.org/10.5194/egusphere-egu26-4020, 2026.

EGU26-4775 | PICO | AS3.26

Tropospheric ozone in western Antarctica driven by synoptic-scale transport over 25 years at Belgrano II station 

Jose Adame, Mónica Navarro-Comas, Héctor Ochoa, Cristina Prados-Roman, and Margarita Yela

Tropospheric ozone (O₃) is a key oxidant and secondary pollutant that influences air quality and radiative forcing. Understanding its variability is crucial in regions highly sensitive to climate change, such as Antarctica, where complex interactions among stratosphere–troposphere exchange, air mass origin and local meteorology govern O₃ dynamics. Detailed characterisations of ozone vertical profiles under specific airflow regimes remain limited, especially for western Antarctica. This study analyses a comprehensive 25-year dataset (1999–2023) of ozone and meteorological profiles (754 in total) collected at Belgrano II station (77.87° S, 34.62° W). The objective is to characterise the vertical distribution of tropospheric ozone in western Antarctica and identify the main drivers of its variability.

Atmospheric transport and synoptic conditions were assessed using seasonal 850 hPa geopotential height maps and HYSPLIT back trajectories. A homogenisation procedure enabled the computation of seasonal and monthly means and long-term trends. The region is influenced by the Antarctic Polar Anticyclone, semi-permanent cyclones over the Weddell and Amundsen–Bellingshausen Seas, and persistent katabatic winds from the Antarctic Plateau. Four distinct transport regimes were identified: strong marine influence from the Weddell Sea, continental flows from northern and southern sectors, and mixed marine–continental influence over the Antarctic Peninsula.

Seasonal analysis of tropospheric ozone revealed increasing concentrations with altitude, ranging from ~20–30 ppb near the surface to ~45–55 ppb in the upper troposphere. O₃ concentrations peaked in winter (~25–35 ppb at low levels, ~45–50 ppb aloft) and early spring (~28–38 ppb at low levels, ~50–55 ppb aloft), while lower values were observed in summer (~20–25 ppb at low levels, ~40–45 ppb aloft) and autumn (~22–28 ppb at low levels, ~42–48 ppb aloft). These variations reflect the interplay of reduced photochemical destruction, enhanced stratosphere–troposphere exchange under the polar vortex, and increasing solar radiation during spring and summer.

Lower-tropospheric O₃ profiles (950–700 hPa) were modulated by transport regime. Highest mean concentrations occurred under purely marine flows from the Weddell Sea (29.8 ± 1.2 ppb), while Weddell–Antarctic Peninsula flows showed the lowest values (23.5 ± 1.7 ppb) due to topographic effects and halogen-driven ozone depletion. Continental flows exhibited intermediate levels (Northern: 26.9 ± 1.5 ppb; Southern: 24.3 ± 1.4 ppb). Finally, analysis of monthly mean profiles over the past two decades revealed a modest increase throughout the troposphere, below 1 ppb dec⁻¹.

These results highlight the combined influence of large-scale circulation, local dynamics, and seasonal processes on Antarctic tropospheric ozone and provide a baseline for evaluating future changes in the western Antarctic troposphere.

How to cite: Adame, J., Navarro-Comas, M., Ochoa, H., Prados-Roman, C., and Yela, M.: Tropospheric ozone in western Antarctica driven by synoptic-scale transport over 25 years at Belgrano II station, EGU General Assembly 2026, Vienna, Austria, 3–8 May 2026, EGU26-4775, https://doi.org/10.5194/egusphere-egu26-4775, 2026.

EGU26-4836 | ECS | PICO | AS3.26

Impacts of Stratospheric Ozone on Antarctic Spring Sea Ice: Based on WACCM6  

Chang Shujie, Chen zhenfeng, Feng Wuhu, Ci Ren, Xu Ting, and He Haotian

Austral spring (September–November) represents the season with the most pronounced chemical depletion of stratospheric ozone over Antarctica, during which the associated radiative and circulation responses reach their annual maximum. Against the background of persistently low Antarctic sea ice, this study focuses on austral spring and examines the influence of stratospheric ozone variability on Antarctic sea ice through both thermodynamic and dynamic processes. The analysis is based on simulations from the Whole Atmosphere Community Climate Model version 6 (WACCM6), combined with composite analysis and other statistical methods, to investigate the interannual variability of Antarctic springtime stratospheric ozone and its impacts on sea ice.The results indicate that WACCM6 successfully reproduces the interannual variability of Antarctic spring total column ozone (TCO), with simulated TCO variations consistent with those derived from the SWOOSH and Microwave Limb Sounder (MLS) observational datasets. Composite analyses show that ozone-related anomalies in Antarctic spring sea ice concentration are primarily confined to the seasonal ice zone between 60°S and 70°S, with magnitudes reaching ±5%–20%. During years of anomalously high springtime stratospheric ozone, sea ice concentration over the Amundsen and Bellingshausen Seas (ABS; 60°S–70°S) exhibits significant negative anomalies, indicating a marked reduction of sea ice along the ice-edge region. Thermodynamic analysis reveals that elevated springtime stratospheric ozone is associated with pronounced positive anomalies in sea surface temperature and surface net radiation over the ABS ice-edge zone, with magnitudes of approximately +1–3 °C and +5–15 W m⁻², respectively. The enhanced radiative heating leads to substantial near-surface warming, thereby suppressing sea ice formation and accelerating ice-edge melt. Further analysis of the dynamical processes shows that increased absorption of shortwave radiation by ozone induces warming in the high-latitude stratosphere, accompanied by rising geopotential heights and a weakened meridional temperature gradient. As a result, high-latitude stratospheric westerlies weaken and the polar vortex intensity decreases. These stratospheric circulation anomalies subsequently propagate downward and modify near-surface wind stress patterns, creating wind forcing favorable for Ekman pumping in the ice-edge region. The enhanced upwelling of subsurface warm water ultimately contributes to reduced sea ice concentration along the Antarctic seasonal ice zone.

How to cite: Shujie, C., zhenfeng, C., Wuhu, F., Ren, C., Ting, X., and Haotian, H.: Impacts of Stratospheric Ozone on Antarctic Spring Sea Ice: Based on WACCM6 , EGU General Assembly 2026, Vienna, Austria, 3–8 May 2026, EGU26-4836, https://doi.org/10.5194/egusphere-egu26-4836, 2026.

Atmospheric methane (CH4) is a key short-lived climate forcer whose concentration has increased rapidly over the last two decades, yet important uncertainties remain regarding its regional-scale evolution and its relationship to reported anthropogenic emissions. In particular, Eastern Europe remains comparatively underrepresented in regional methane assessments based on consistent long-term datasets. In this study, we investigate recent methane trends at global, European and national (Romania) scales by combining atmospheric reanalysis products, surface observations and emission inventories.

Near-surface methane concentrations are analysed using the Copernicus Atmosphere Monitoring Service (CAMS) global greenhouse gas reanalysis for the period 2003–2022. Regional mean time series are derived for Europe and Romania and compared to the global mean methane evolution obtained from NOAA surface observations. To provide a bottom-up perspective, anthropogenic methane emissions are analysed using the EDGAR inventory, with a focus on national and sectoral contributions relevant for Romania. The consistency between atmospheric concentration trends and reported emission changes is assessed across spatial scales.

The study provides new insight into the regional behaviour of atmospheric methane in Eastern Europe and contributes to the ongoing evaluation of methane mitigation efforts at European and national levels. The value of combining reanalysis products, observational datasets and emission inventories to characterise methane trends from global to national scales is also shown.

How to cite: Scarlat, A., Tudor, A., and Iorga, G.: Atmospheric drivers of climate change over Romania with focus on CH4: sources and changes inferred from reanalysis, observations, and emission inventories, EGU General Assembly 2026, Vienna, Austria, 3–8 May 2026, EGU26-6307, https://doi.org/10.5194/egusphere-egu26-6307, 2026.

EGU26-6864 | PICO | AS3.26

Evaluating aerosol representation in TM5 chemical transport model using in-situ observations 

Christina Williamson, Meryem Bouchahmoud, Putian Zhou, Linnea Mustonen, Tommi Bergman, Risto Makkonen, and Inés Zabala

Aerosol and cloud uncertainty dominates uncertainty in climate prediction (Masson-Delmotte 2021). Aerosol Cloud Interactions (ACIs) are mediated through cloud condensation nuclei (CCN), aerosol particles of large enough size and hygroscopicity to act as seeds upon which cloud droplet can form. Cloud droplet number concentration (CDNC) is determined by both the number of available CCN and the water vapour supersaturation these CCN experience. Variability and uncertainty in CCNC are primarily important in CCN-limited regimes where the CDNC is limited by the number of available CCN. These conditions prevail in much of the boundary layer and lower free troposphere (Rosenfeld et al. 2014). The number concentration of CCN is highly variable, both globally and locally (Schmale et al. 2018), depending on the abundance, size distribution and chemical composition of primary and secondary aerosols from both anthropogenic and biogenic sources. Therefore, CCN and related aerosol observations in different environments are needed to evaluate their representation in global models.

Here we use long-term in-situ observations of CCN number concentrations, particle number size distributions, and particle chemical composition from ground-stations to evaluate CCN representation in the TM5 chemical transport model. We evaluate the default version of TM5 alongside representation of some of the sources of aerosol uncertainty in the model, represented by one-at-a-time sensitivity studies of uncertain aerosol input parameters including emissions of sea salt and biomass burning aerosol, secondary organic aerosol precursors and removal by wet and dry deposition. The model was run for 2017 and 2018, and so ground stations with relevant publicly available observations over at least 9 months of this period are chosen for evaluation including US Department of Energy (DOE) Atmospheric Radiation Measurement (ARM) site at Oklahoma, USA (Southern Great Plains) and ARM mobile facility deployment during the Layered Atlantic Smoke Interactions with Clouds (LASIC) campaign on Ascension Island (Andrews et al. 2025), SMEAR II station in Hyytiälä, Finland (Kulmala 2023) and Kennaook/Cape Grim Baseline Air Pollution Station in Tasmania (Keywood 2018).

References

Andrews, E., Zabala, I., Carrillo-Cardenas, G., et al. 'Harmonized aerosol size distribution, cloud condensation nuclei, chemistry and optical properties at 10 sites', Scientific Data, 12: 937.10.1038/s41597-025-04931-y 2025.

Keywood, M., Ward, J., Derek, N., GAW-WDCA. 'Cloud_condensation_nuclei_number_concentration at Kennaook / Cape Grim Baseline Air Pollution Station, data hosted by EBAS at NILU'.10.48597/Z8RB-RDC9 2018.

Kulmala, M., Petäjä, T. "Particle_number_concentration at Hyytiälä, data hosted by EBAS at NILU." In.https://doi.org/10.48597/RHAH-5H7M 2023.

Masson-Delmotte, V., P. Zhai, A. Pirani, S.L. Connors, C. Péan, S. Berger, N. Caud, Y. Chen, L. Goldfarb, M.I. Gomis, M. Huang, K. Leitzell, E. Lonnoy, J.B.R. Matthews, T.K. Maycock, T. Waterfield, O. Yelekçi, R. Yu, and B. Zhou. "IPCC Climate Change 2021: The Physical Science Basis." In.: Cambridge University Press.10.1017/9781009157896 2021.

Rosenfeld, D., Andreae, M.O., Asmi, A., et al. 'Global observations of aerosol-cloud-precipitation-climate interactions', Reviews of Geophysics, 52: 750-808.https://doi.org/10.1002/2013RG000441 2014.

Schmale, J., Henning, S., Decesari, S., et al. 'Long-term cloud condensation nuclei number concentration, particle number size distribution and chemical composition measurements at regionally representative observatories', Atmos. Chem. Phys., 18: 2853-81.10.5194/acp-18-2853-2018 2018.

How to cite: Williamson, C., Bouchahmoud, M., Zhou, P., Mustonen, L., Bergman, T., Makkonen, R., and Zabala, I.: Evaluating aerosol representation in TM5 chemical transport model using in-situ observations, EGU General Assembly 2026, Vienna, Austria, 3–8 May 2026, EGU26-6864, https://doi.org/10.5194/egusphere-egu26-6864, 2026.

To gain a comprehensive understanding of the Earth’s climate system, it is essential to consider all the atmospheric gases with high global warming potential or substantial effects on the ozone layer. Besides CO2 and CH4, nitrous oxide (N2O) and halogenated carbon compounds—such as CFCs, HFCs, HCFCs, and PFCs—collectively classified as Other Long-Lived Greenhouse Gases (OLLGHGs), are particularly important due to their long atmospheric lifetimes and strong warming influence. In addition, nitrous oxide and chlorine-containing compounds are major contributors to anthropogenic ozone depletion.

The Long-Lived Greenhouse Gas Products Performance (LOLIPOP) Climate Change Initiative (CCI+) project, initiated by ESA in 2023, focuses on the OLLGHGs through the exploitation of multi-mission, satellite-based datasets. The main objective of the project is to assess whether the current suite of satellite observations is sufficiently robust for its use in climate science and climate services. If that is the case, the development of a harmonized and consistent dataset will be pursued in the future. Conversely, if limitations are identified, recommendations will be provided to improve the quality of satellite measurements of the OLLGHGs or to develop dedicated satellite missions for their monitoring.

Within the project, an inventory of available limb and nadir satellite datasets has been compiled for 11 OLLGHGs. Based on the outcomes of a literature review, the user needs (identified through a survey), and the dataset inventory, a subset of data has been selected for homogenization and intercomparison/validation exercises. The potentiality of satellite datasets for climate research and modeling is further demonstrated in the project through five test cases addressing the sensitivity of climate model simulations to OLLGHGs, including their radiative forcing, atmospheric lifetimes, and impacts on the stratosphere, such as effects on ozone recovery and atmospheric circulation. A growing community of scientific users is engaging with the project and has been involved in discussions on data quality and needs at a recent user workshop. Results from these studies, together with findings from the user needs survey and the dataset quality assessment, will be presented.

How to cite: Castelli, E. and the LOLIPOP team: Using satellite-based Other Long-Lived GHGs datasets for climate models applications and climate studies : The ESA LOLIPOP CCI project, EGU General Assembly 2026, Vienna, Austria, 3–8 May 2026, EGU26-7520, https://doi.org/10.5194/egusphere-egu26-7520, 2026.

EGU26-8986 | ECS | PICO | AS3.26

Long-Term High-Frequency Measurements of Atmospheric CO₂ and δ¹³CO₂ at Gosan: Implications for Source Characteristics in East Asia 

Jihye Jang, Jooil Kim, Haklim Choi, Jieun Choi, Jaegeun Yun, Jimin Jang, Sumin Kim, Daegeun Shin, Sehwan Yang, and Sunyoung Park

Atmospheric carbon dioxide (CO₂) and its stable carbon isotope composition (δ¹³C) provide important constraints on CO₂ sources and sinks; however, long-term high-frequency observations remain limited in East Asia.

This study presents continuous observations of atmospheric CO₂ and δ¹³CO₂ obtained at the Gosan station on Jeju Island, South Korea, from 2017 to 2025 using a cavity ring-down spectroscopy (CRDS) analyzer. The 9-year record is based on 1 Hz measurements aggregated into hourly mean values, with measurement precisions of 0.01 ppm for CO₂ and 0.05‰ for δ¹³CO₂.

The observations reveal pronounced seasonal cycles in both CO₂ and δ¹³CO₂, with mean seasonal amplitudes of approximately 8–10 ppm for CO₂ and 0.4–0.5 ‰ for δ¹³CO₂, exceeding those observed at global background sites and reflecting the continental–marine boundary characteristics of the Gosan station. From 2017 to 2021, both the CO₂ growth rate and the long-term decline in δ¹³CO₂ are broadly consistent with global background trends, whereas after 2022, notable deviations from global background behavior are observed in both CO₂ growth rates and δ¹³CO₂ trends. Superimposed on these background variations, pollution-influenced air masses exhibit pronounced changes in δ¹³CO₂. Yearly Keeling plot analysis of CO₂–δ¹³CO₂ relationships for pollution events indicates a progressive enrichment in isotopic source signatures over time, suggesting a temporal shift in dominant emission sources.

To investigate anthropogenic source characteristics associated with these pollution signals, high-CO₂ events are first classified based on air mass transport pathways, and further examined by incorporating high-frequency measurements of carbon monoxide (CO) and nitrous oxide (N₂O) provided by the National Institute of Meteorological Sciences (NIMS), which serve as complementary tracers of combustion-related and non-combustion emission influences, respectively.

How to cite: Jang, J., Kim, J., Choi, H., Choi, J., Yun, J., Jang, J., Kim, S., Shin, D., Yang, S., and Park, S.: Long-Term High-Frequency Measurements of Atmospheric CO₂ and δ¹³CO₂ at Gosan: Implications for Source Characteristics in East Asia, EGU General Assembly 2026, Vienna, Austria, 3–8 May 2026, EGU26-8986, https://doi.org/10.5194/egusphere-egu26-8986, 2026.

EGU26-9744 | PICO | AS3.26

The atmospheric composition variability above Cerro Paranal/Chile 

Wolfgang Kausch, Stefan Kimeswenger, Alain Smette, and Stefan Noll

The Chilean Atacama desert hosts the largest astronomical observatories world-wide due to its unique dry meteorological conditions and high altitude of the Andes. One of the largest facilities is Cerro Paranal, among others hosting the Very Large Telescope, which is equipped with several spectrographs ranging from the ultraviolet to the mid-infrared. As ground-based telescopes have to observe through the Earth's atmosphere, the spectra taken from astronomical objects are affected by molecular absorption arising from the present various species. This imprint -called telluric contamination- varies in the same way as the composition of the Earth's atmosphere varies. Therefore it is of crucial importance for astronomers to know about the chemical components of the atmosphere at the time of observation to be able to correct for these contaminations.

In the past, mostly static atmospheric standard models were used to fit and correct the telluric contaminations. In the meanwhile, several sources of world-wide, time-dependent information of the chemical composition are available. We are currently investigating data from the Copernicus Atmospheric Monitoring Service (CAMS) Global Reanalysis (EAC4) and CAMS Global Greenhouse reanalysis (EGG4), which provide height profiles of various molecular species (e.g. NO, NO2, O3, CO, HNO3,...) on a 3-hourly resolution ranging from 2003 through 2020 (EGG4) and 2024 (EAC4). This allows us a detailed analysis on the hourly, daily, seasonal, and yearly variability of the chemical composition of the Earth’s atmosphere above Cerro Paranal.

We found significant variations of nearly all species on various time scales, highly affecting the astronomical observations. In this presentation we show first results of our investigations. As astronomical observations are conducted during night, we focus on day/night-time differences and long-term trends to estimate the impact on telluric contamination.

How to cite: Kausch, W., Kimeswenger, S., Smette, A., and Noll, S.: The atmospheric composition variability above Cerro Paranal/Chile, EGU General Assembly 2026, Vienna, Austria, 3–8 May 2026, EGU26-9744, https://doi.org/10.5194/egusphere-egu26-9744, 2026.

EGU26-10164 | ECS | PICO | AS3.26

Exploring the Potential of long-term Aerosol Size Distribution Measurements as Proxies for Cloud Condensation Nuclei in Welgegund, South Africa  

Linnea Mustonen, John Backman, Pieter van Zyl, Ville Vakkari, and Christina Williamson

Cloud condensation nuclei (CCN) play a central role in regulating cloud microphysical properties and, consequently, aerosol-cloud interactions, which are the largest source of uncertainty of radiative forcing (RF) in global climate models. For an aerosol to be able to act as CCN at certain atmospheric conditions, high enough aerosol hygroscopicity (κ) and particle size (dp) are required. These properties can be directly characterized using cloud condensation nuclei counters (CCNc) and, when measured over extended periods, provide valuable constraints for the representation of aerosol–cloud interactions in climate models. However, long-term CCN observations remain sparse in the Southern Hemisphere, limiting the ability to evaluate and improve model performance using observational constraints. 

In this study we focus on measurements from the atmospheric measurement station in Welgegund, South Africa. The station is strategically located to capture air masses influenced by pristine grassland background as well as major anthropogenic source regions. The site is situated approximately 100 km southwest of the Johannesburg–Pretoria conurbation at approximately 1480 m above mean sea level. The coexistence of pristine and polluted air mass influences provides an opportunity to compare the CCN-activity of natural and anthropogenic aerosol in southern Africa, where other measurement stations are sparce. 

The aim is to evaluate the potential of using long-term measurements of particle number size distributions (PNSD) produced since 2010 at Welgegund station as a proxy for CCN concentrations. This is done by utilizing an unpublished dataset from a measurement campaign with a CCNc counter during January 2017-April 2017. The analysis will evaluate the commonly used approximation of particles larger than 100 nm as a proxy for CCN during the campaign and then utilize this information to the 15-year PNSD data set. Applicable conditions are first determined by analyzing the characteristics of CCN (κ, critical diameter at given supersaturations dcrit), potential diurnal cycle of CCN concentrations, the correlation to other relevant meteorological parameters and sources of the air masses during the campaign.   

In the future, the presented dataset is expected to contribute to the development of a standardized long-term CCN observational framework to support the integration of southern African measurements into global CCN databases. Thereby helping to address the current geographical imbalance of observations, that can be used to reduce climate model RF-uncertainty associated with aerosol–cloud interactions. 

How to cite: Mustonen, L., Backman, J., van Zyl, P., Vakkari, V., and Williamson, C.: Exploring the Potential of long-term Aerosol Size Distribution Measurements as Proxies for Cloud Condensation Nuclei in Welgegund, South Africa , EGU General Assembly 2026, Vienna, Austria, 3–8 May 2026, EGU26-10164, https://doi.org/10.5194/egusphere-egu26-10164, 2026.

EGU26-10456 | ECS | PICO | AS3.26

Expanding Atmospheric Surveillance: Non-Target Screening and Open Spectral Databases for Persistent Halogenated Compounds 

Lionel Constantin, Alina Begley, Marta Augugliaro, Livia Schneider, Martin Vollmer, and Reimann Stefan

The Montreal Protocol (1989) is widely regarded as one of the most successful environmental agreements, having phased down ozone-depleting substances such as chlorofluorocarbons (CFCs), followed by hydrofluorocarbons (HCFCs) in 2013 and hydrofluorocarbons (HFCs) in 2019. Today, developed countries primarily use hydrofluoroolefins (HFOs) as fourth-generation replacements. A key factor in this success is continuous global monitoring of these compounds. The Scientific Assessment of Ozone Depletion, published every four years, lists over 780 substances with their ozone-depleting potential (ODP) and global warming potential (GWP). However, fewer than 10% (~70) have quantified atmospheric abundances, primarily measured by the Ad-vanced Global Atmospheric Gases Experiment (AGAGE) network using cryogenic pre-concentration (Medusa) coupled with gas chromatography quadrupole mass spectrometry (GC–qMS).
As the number of regulated and unregulated compounds grows, comprehensive detection is essential. Quadrupole MS limits ion coverage, prompting the development of a non-target screening (NTS) approach. We combine an advanced preconcentration unit (Aprecon), GC-time-of-flight MS, and the ALPINAC algorithm for automated fragment formula annotation. This workflow has identified more than 80 previously unidentified persistent halogenated compounds in routine air samples.
To support global research efforts, we provide a suspect screening list of atmospheric compounds of concern, including mass fragments and retention time indices. High-resolution mass spectra are shared via Mass Bank, including data for compounds lacking publicly available spectra. This resource enhances the identification and monitoring of emerging halogenated substances, strengthening global capacity to track and mitigate their environmental impact.

How to cite: Constantin, L., Begley, A., Augugliaro, M., Schneider, L., Vollmer, M., and Stefan, R.: Expanding Atmospheric Surveillance: Non-Target Screening and Open Spectral Databases for Persistent Halogenated Compounds, EGU General Assembly 2026, Vienna, Austria, 3–8 May 2026, EGU26-10456, https://doi.org/10.5194/egusphere-egu26-10456, 2026.

EGU26-10902 | PICO | AS3.26

The state of greenhouse gases in the atmosphere using global observations through 2024 

Oksana Tarasova, Xin Lan, Huilin Chen, Alex Vermeulen, and Kazuhiro Tsuboi

This paper highlights the main findings of the twenty-first annual Greenhouse Gas Bulletin (https://library.wmo.int/idurl/4/69654) of the World Meteorological Organization (WMO). The results are based on research and observations performed by laboratories contributing to the WMO Global Atmosphere Watch (GAW) Programme (https://community.wmo.int/site/knowledge-hub/programmes-and-initiatives/global-atmosphere-watch-programme-gaw).

The Bulletin presents global analyses of observational data collected according to GAW recommended practices (https://library.wmo.int/idurl/4/69672) and submitted to the World Data Center for Greenhouse Gases (WDCGG). Bulletins are prepared by the WMO/GAW Scientific Advisory Group on Greenhouse Gases in collaboration with WDCGG.

Observations used for the global analysis are from 179 marine and terrestrial sites for CO2, 171 for CH4 and 123 for N2O. The globally averaged surface mole fractions calculated on the basis of these observations reached new highs in 2024, with CO2 at 423.9±0.2 ppm, CH4 at 1942±2 ppb and N2O at 338.0±0.1 ppb. These values constitute, respectively, 152%, 266% and 125% of pre-industrial (before 1750) levels. The record increase in CO2 from 2023 to 2024 (3.5 ppm) was most likely due to a combination of natural variability and continued emissions of fossil fuel CO2. For CH4, the increase from 2023 to 2024 was lower than that observed from 2022 to 2023 and also lower than the average annual growth rate over the last decade (2014–2023). For N2O, the increase from 2023 to 2024 was lower than that observed from 2022 to 2023 and slightly lower than the average annual growth rate over the last decade.

The increase of CO2 in the global surface atmosphere by 3.5 ppm in 2024 was the largest one-year increase in the modern measurement record, exceeding the previous record of 3.3 ppm from 2015 to 2016 and surpassing the increase of 2.4 ppm from 2022 to 2023 by a large margin. Global fossil CO2 emissions were almost static during 2023–2024 at the record level of 10.2 ± 0.5 GtC/yr. The global terrestrial ecosystems and global oceans are likely responsible for the additional 1.1 ppm/yr (equivalent to 2.34 GtC) in CO2 growth compared to 2022–2023. Wildfire emissions in the Americas reached historic levels in 2024 and could have contributed to the record CO2 annual increase.

Current CO2 emissions to the atmosphere not only impact the global climate today but will continue to do so for millennia, and ongoing CO2 emissions will ensure that warming continues indefinitely. The removal of anthropogenic CO2 from the atmosphere depends on exchanges among reservoirs on timescales ranging from years (surface ocean) to hundreds of thousands of years (weathering). The slowed uptake of anthropogenic CO2 emissions within the global carbon cycle is exacerbated by the slow uptake of heat by the deep oceans, so once CO2 is emitted to the atmosphere, it affects climate indefinitely. This is different from CH4, whose atmospheric lifetime is about nine years due to its removal by chemical oxidation. While reducing CH4 emissions is useful and necessary, climate action urgently needs to focus on reducing fossil fuel CO2 emissions, which represent the vast majority of overall greenhouse gas emissions.

How to cite: Tarasova, O., Lan, X., Chen, H., Vermeulen, A., and Tsuboi, K.: The state of greenhouse gases in the atmosphere using global observations through 2024, EGU General Assembly 2026, Vienna, Austria, 3–8 May 2026, EGU26-10902, https://doi.org/10.5194/egusphere-egu26-10902, 2026.

EGU26-11870 | ECS | PICO | AS3.26

Preliminary results from the direct comparison of four atmospheric background detection methods at a central Mediterranean WMO/GAW station: potential implications for long-term CO, CO2, and CH4 monitoring 

Francesco D'Amico, Teresa Lo Feudo, Ivano Ammoscato, Daniel Gullì, Mariafrancesca De Pino, and Claudia Roberta Calidonna

Long term trends in greenhouse and reactive gases highlight changes in the atmospheric background (AB) and help determining the impact of anthropogenic emissions. The presence of pollution events calls for the implementation of background detection methods, capable of differentiating the AB from fresh anthropogenic emissions. At the Mauna Loa observatory (MLO) operated by NOAA, ad hoc procedures are applied to measurements in order to filter out pollution events and sinks from the AB of key gases such as carbon dioxide (CO2) and methane (CH4). These procedures account for MLO’s known sources and sinks in the area, and its location.

At the Lamezia Terme (LMT) observation site in Calabria, Southern Italy, part of the WMO/GAW network, several methods have been implemented to filter out non-AB measurements of carbon monoxide (CO), CO2, and CH4. Namely, the BaDS (Background Data Selection), SM (Smoothed Minima), Wind, and the ONRPI (Ozone to Nitrogen Oxides Ratio Proximity Indicator). While the Wind method is based on an algorithm specifically designed to consider LMT’s characteristics as a central Mediterranean site, BaDS and SM were already present in literature and their implementation at LMT involved minor changes. These methods are statistical in nature, while the ONRPI is based on atmospheric chemistry, i.e. the O3/NOx ratio. The ONRPI classifies as BKG (Background) data with a O3/NOx ratio higher than 100, attributed to very aged air masses. Multiple studies on LMT’s record of greenhouse and reactive gases, as well as aerosols, have expanded the ONRPI and turned LMT into a key hotspot for the implementation of this methodology and its correction factors.

The performance of BaDS, SM, and Wind on the LMT record of CO, CO2, and CH4 has been assessed using nearly a decade of continuous measurements, however no attempts have been made to compare these methods with the ONRPI. A direct comparison between the ONRPI and other methodologies has highlighted the presence of data in the LMT record attributed by BaDS, SM, and Wind to the AB of CO, CO2, and CH4, which are however characterized by very low O3/NOx ratios and therefore affected by local sources of emissions. For example, up to 49.79% of the data classified as URB (Urban, with O3/NOx ratio lower than 0.1) by the ONRPI, are flagged by BaDS as representative of CO’s AB. Consequently, the AB itself tends to be overestimated.

A multi-year analysis applied to nearly one decade of continuous measurements at LMT, integrated by statistical evaluations, has shown substantial differences between the seasonal oscillations and annual growth rates of CO2 and CH4 as computed by the ONRPI, and those resulting from the other methods. During the boreal summer, the AB of CO filtered by ONRPI is nearly 20% lower than that of the other methods, possibly due to contributions such as Mediterranean open fires which are not filtered out by BaDS, SM, and Wind. While these comparisons need to be further expanded, the findings underline the importance of integrating multiple methodologies for AB detection.

How to cite: D'Amico, F., Lo Feudo, T., Ammoscato, I., Gullì, D., De Pino, M., and Calidonna, C. R.: Preliminary results from the direct comparison of four atmospheric background detection methods at a central Mediterranean WMO/GAW station: potential implications for long-term CO, CO2, and CH4 monitoring, EGU General Assembly 2026, Vienna, Austria, 3–8 May 2026, EGU26-11870, https://doi.org/10.5194/egusphere-egu26-11870, 2026.

EGU26-12272 | PICO | AS3.26

The vertical distribution of NOx and its variability above metropolitan areas in America, Europe, and Asia, as observed by IAGOS 

Christoph Mahnke, Ulrich Bundke, Norbert Houben, Chris Schleiermacher, Torben Galle, Susanne Rohs, Philippe Nédélec, Valérie Thouret, Hannah Clark, Kuo-Ying Wang, Hiroshi Tanimoto, and Andreas Petzold

Nitrogen oxide (NOX) is an important air quality indicator and one of the main precursors of ozone (O3). These trace gases have natural and anthropogenic sources at ground level and in the troposphere. At ground level, the main sources are transport emissions, industry, agriculture, and biomass burning. In the troposphere, additional sources include lighting and aircraft emissions and in the upper troposphere, downmixing from the stratosphere also makes a significant contribution to the ozone budget.

The European Research Infrastructure IAGOS (www.iagos.org) uses in-service passenger aircraft as observation platforms, equipped with instruments to measure gaseous species, aerosols, and cloud particles. The IAGOS-CORE NOx instrument (Package 2b) is designed to measure NO, NO2, and total NOX. Since its operation started on one Lufthansa aircraft in 2015 and further expansion of the fleet in 2023, a fourth aircraft was equipped with this instrument type in 2025. These four IAGOS-CORE aircraft from Air France, China Airlines, Iberia, and Lufthansa cover routes to North, Central and South America, Europe, Africa and Asia. From this unique in situ measurements, we discuss the vertical NOX profiles from ground up to about 12 km altitude. Thereby we are not only focusing on the abundance of NOX within the planetary boundary layer but also how NOX is distributed in the free troposphere and how this vertical distribution varies globally above different metropolitan aeras. Cities such as New York, Montevideo, Frankfurt, Madrid, Hong Kong, Taipei, and Tokyo were selected to represent different global regions and have a statistical base of at least ten and up to about 300 individual profiles for each city available.   

Acknowledgments: We thank all members of IAGOS-CORE, in particular the airlines for enabling these IAGOS-CORE observations. The data were created with support from the European Commission, national agencies in Germany (BMBF), France (MESR), and the UK (NERC), and the IAGOS member institutions (http://www.iagos.org/partners).

How to cite: Mahnke, C., Bundke, U., Houben, N., Schleiermacher, C., Galle, T., Rohs, S., Nédélec, P., Thouret, V., Clark, H., Wang, K.-Y., Tanimoto, H., and Petzold, A.: The vertical distribution of NOx and its variability above metropolitan areas in America, Europe, and Asia, as observed by IAGOS, EGU General Assembly 2026, Vienna, Austria, 3–8 May 2026, EGU26-12272, https://doi.org/10.5194/egusphere-egu26-12272, 2026.

EGU26-12375 | ECS | PICO | AS3.26

Integrated Water Vapour (IWV) trend analysis from GNSS and NWP reanalyses: a homogenised long-term analysis over Granada 

Victor Manuel Naval Hernández, Arlett Díaz Zurita, Onel Rodríguez Navarro, Jorge Muñiz Rosado, Daniel Pérez Ramírez, David Neil Whiteman, Lucas Alados Arboledas, and Francisco Navas Guzmán

In a context of climate change and global warming, the characterisation and operational monitoring of greenhouse gases is of uppermost importance for implementing mitigation strategies that could help to reduce the impact of the current climatic emergency in the surrounding ecosystems and society. Among these gases, water vapour can contribute to almost a 60% of the total greenhouse effect. Moreover, its interaction with solar and infrared radiation or its main role in cloud formation, make water vapour a key driver of most atmospheric thermodynamic processes and a crucial component of the Earth's radiative budget. 

Nevertheless, the large spatial and temporal variability of water vapour hinders the acquisition of reliable operational measurements. Remote sensing techniques such as the Global Navigation Satellite System (GNSS) have been proven to be an accurate and trustworthy alternative for integrated water vapour (IWV) retrievals, providing a valuable platform for continuous operational monitoring and thus enabling long-term characterisation. To further address this challenge, reanalysis data from Numerical Weather Prediction (NWP) models can significantly increase the temporal and spatial coverage of atmospheric variables datasets. In particular, ERA5 (fifth generation of European Centre for Medium-Range Weather Forecasts reanalysis) and MERRA-2 (Modern-Era Retrospective Analysis for Research and Applications, version 2) provide validated data for the city of Granada, in southeastern Spain, since 1980.

The current study presents a comprehensive analysis of IWV trends retrieved from a 15-year GNSS database and an extended 45-year reanalysis dataset. Special attention is paid to time-series quality control and homogenisation. Small jumps or discontinuities due to GPS receiver updates or changes in the data assimilation strategies of NWP models, can introduce artificial artifacts in the time series and consequently lead to biased or misleading trend esimates. A modified Mann-Kendall test proposed by Coen et al. (2020)  that applies a Variance-Corrected Trend-Free Pre-Whitening approach is evaluated against a General Least Square method with a full custom covariance matrix accounting for residual heteroscedasticity and autocorrelation. While both methodologies agree on the sign and uncertainties of the retrieved trends, some discrepancies are found in the magnitudes, reflecting the different nature of both algorithms and highlighting the sensibility of trend detection techniques. Positive increasing IWV trends of a 3% per decade on average were obtained from both datasets and algorithms, being significant to a 95% level when analysing the 45-year time series. Nonetheless, relevant behaviour differences are found between the 1980-2000 and 2000-2024 periods, unveiling the pronounced increasing in IWV experimented during the last 25 years. The results obtained are consistent with previous studies, both regarding the trend magnitude and the uncertainty range, reinforcing the capability of the GNSS technique and NWP models as robust tools for environmental and atmospheric monitoring of complex variables such as water vapour (Parracho et al., 2018; Yuan et al., 2023). However, they also unveil trend discrepancies which are inherent to the chosen retrieval methodologies and that must always be assessed.

How to cite: Naval Hernández, V. M., Díaz Zurita, A., Rodríguez Navarro, O., Muñiz Rosado, J., Pérez Ramírez, D., Whiteman, D. N., Alados Arboledas, L., and Navas Guzmán, F.: Integrated Water Vapour (IWV) trend analysis from GNSS and NWP reanalyses: a homogenised long-term analysis over Granada, EGU General Assembly 2026, Vienna, Austria, 3–8 May 2026, EGU26-12375, https://doi.org/10.5194/egusphere-egu26-12375, 2026.

EGU26-12567 | PICO | AS3.26

Processes influencing summertime ozone concentrations at a high Arctic site 

Zhuyun Ye, Jakob B. Pernov, Jens L. Hjorth, Jesper H. Christensen, Kaj M. Hansen, and Henrik Skov

Arctic surface ozone (O3) is an important short lived climate forcer as it interacts with light both in the solar light and in the infrared region and thus it plays an important role during Arctic summer. Surface O3 in the High Arctic exhibits substantial variability during summer months, driven by complex interactions between photochemistry, long-range transport, and boundary layer dynamics. Understanding the relative contributions of these processes and their long-term changes is critical for interpreting observed O3 variability and projecting future changes under rapid Arctic climate warming. We present a comprehensive analysis of summertime (June-August) O3 at a high Arctic monitoring station in North-east Greenland (Villum Research Station) spanning three decades (1995-2024), combining advanced statistical decomposition methods, back trajectory analysis, data-driven Bayesian modeling for entrainment detection, and chemical transport model simulations to quantify the major processes controlling surface O3 concentrations and assess their temporal evolution. Long-term analysis using traditional (Mann-Kendall test and Sen’s slope) and STL (Seasonal-Trend decomposition using Loess) reveals complex temporal patterns in summertime O3 and its baseline concentrations over the 30-year period, with substantial interannual variability. STL decomposes the time series into baseline, seasonal component, and residuals, enabling process-specific analysis. Back trajectory analysis comparing high versus low O3 episodes identifies distinct source regions and transport pathways. Trajectories are categorized by surface type (land, snow, sea ice, ocean) and altitude (within versus above mixing layer). High O3 episodes are predominantly associated with air masses from above the mixing layer and open ocean, whereas low O3 periods show dominant patterns indicating sea ice and land sources. To quantify local boundary layer entrainment processes, we apply automated entrainment detection on the STL residuals, which isolate short-term variability after removing baseline and seasonal components. Entrainment events bring O3-rich free tropospheric air to the surface, characterized by simultaneous O3 increases, relative humidity (RH) decreases at 9m, and enhanced vertical RH gradients. A two-stage Bayesian inference approach is developed to first screens candidates using physical thresholds, following by probabilistically estimates event timing, magnitude, and persistence while accounting for measurement uncertainty.  We analyze temporal patterns in entrainment frequency and magnitude over the three decades to assess potential changes in boundary layer dynamics. To complement the observational analysis, we employ the Danish Eulerian Hemispheric Model (DEHM), a chemical transport model, to perform long-term O3 simulations. The model quantifies stratospheric contributions to surface O3 and enables evaluation of how well current chemical transport schemes capture the observed variability and process attribution identified through the statistical and trajectory analyses. This integrated approach provides robust process attribution and understanding by linking observed O3 to air mass origin, transport characteristics, vertical mixing, and stratospheric inputs, demonstrating that Arctic O3 variability results from complex interplay of hemispheric transport, local meteorology, and boundary layer dynamics.

How to cite: Ye, Z., Pernov, J. B., Hjorth, J. L., Christensen, J. H., Hansen, K. M., and Skov, H.: Processes influencing summertime ozone concentrations at a high Arctic site, EGU General Assembly 2026, Vienna, Austria, 3–8 May 2026, EGU26-12567, https://doi.org/10.5194/egusphere-egu26-12567, 2026.

The prediction of nitrogen dioxide (NO₂) concentration is crucial for protecting human health and controlling environmental pollution. However, the complex temporal patterns and rapid time fluctuations pose significant challenges to accurate NO₂ forecasting. Some existing studies have introduced machine learning techniques like Recurrent Neural Networks (RNNs) and Long Short-Term Memory (LSTM) networks to extract richer temporal features, while they are still struggling with effectively capturing long-term dependencies. Moreover, most studies focus primarily on individual monitoring stations, often overlooking the spatial correlations between stations, which limits the ability to make comprehensive predictions for larger regions. To address these issues, this study expands the scope to include all monitoring stations across China. By employing Transformer models, we aim to extract long-term dependencies at multiple temporal scales while incorporating spatial and attributive distances to facilitate information sharing among different monitoring stations. Our objective is to achieve holistic prediction of NO₂ concentrations nationwide and make analysis for the future trend. The findings of this research are expected to provide valuable theoretical support for proactive environmental pollution management and prevention.

How to cite: Xiao, M. and Huang, B.: Transformer-based forecasting of national NO₂ concentrations with spatiotemporal and attributive dependencies, EGU General Assembly 2026, Vienna, Austria, 3–8 May 2026, EGU26-13107, https://doi.org/10.5194/egusphere-egu26-13107, 2026.

EGU26-14717 | ECS | PICO | AS3.26

Mean Stratospheric Age of Air from Satellite Observations of N2O and Tracer Correlations 

Ariana Castillo, Eric Ray, Laura Saunders, and Marianna Linz

Climate modeling studies predict a strengthening of the Brewer Dobson Circulation, which has implications for global atmospheric composition, radiation, and climate. This predicted acceleration has not been confirmed with observations, and models also disagree about the mean stratospheric circulation and mixing strength. In previous work, we developed a long record of mean age of air from an N2O combined satellite product – part of the Stratospheric Water and OzOne Satellite Homogenized (SWOOSH) package – by inferring age from latitude-dependent Age:N2O relationships. While SWOOSH corrects for the drift in Microwave Limb Sounder (MLS) N2O measurements, positive trends in derived mean ages over the past two decades based on these fixed Age:N2O relationships are in contrast to mean age trends derived from Atmospheric Chemistry Experiment (ACE) SF6 and in situ measurements. This contrast in mean age trends confirms the changes of the in-situ Age:N2O relationship over time and indicates a need to have both latitude and time varying Age:N2O relationships for more accurate age derivations. Using time-varying Age:N2O relationships, we introduce an N2O-derived mean age product that now addresses 1) biases in satellite N2O observations and 2) the positive N2O-age trends. In addition, we compare our results with previous mean age trend analyses to determine if the corrections are robust, which will further contribute to understanding long-term circulation and mixing variability based on observed trace gas trends.

How to cite: Castillo, A., Ray, E., Saunders, L., and Linz, M.: Mean Stratospheric Age of Air from Satellite Observations of N2O and Tracer Correlations, EGU General Assembly 2026, Vienna, Austria, 3–8 May 2026, EGU26-14717, https://doi.org/10.5194/egusphere-egu26-14717, 2026.

EGU26-14905 | ECS | PICO | AS3.26

Observations of post Hunga-Tonga UTLS water vapor over the Alpine region with balloon-borne low-GWP frost point hygrometers 

Yann Poltera, Frank G. Wienhold, Vivienne Artho, Steven Brossi, Thomas Brossi, Simone Brunamonti, Gonzague Romanens, Anja Brun, Beiping Luo, Thomas Peter, and Gunter Stober

We present seasonal post Hunga-Tonga measurements (2023-2025) of upper tropospheric and lower stratospheric water vapor over the Alpine region, obtained from deployments of balloon-borne frost point hygrometers within the Swiss H2O Hub, a consortium dedicated to water vapor measurements from ground to space. The chilled mirror hygrometers consist of the CFH (Cryogenic Frostpoint Hygrometer) instrument with classical cryogen, as well as two low global warming potential instruments: CFH-DIA (CFH using a mixture of dry ice and alcohol) and PCFH (Peltier Cooled Frostpoint Hygrometer).

The CFH measurements compare well to collocated space-borne Aura/MLS H2O retrievals, confirming the increased water vapor content in the lower stratosphere after the Hunga-Tonga eruption, with MLS being on average drier than the CFH reference by about 0.1-0.3 ppmv at around 20 km altitude over Switzerland. Starting May 2024, the temporal availability of MLS H2O observations decreased to around one week per month, due to the duty-cycling of the MLS 190 GHz receiver, in order to extend its lifespan.

We find that, despite a reduced cooling power (which is governed by the sublimation of CO2), CFH-DIA can be used as alternative reference to CFH for the Swiss H2O Hub, with a residual risk of losing frost control in certain atmospheric situations (e.g., when the 2nd cleaning cycle of CFH-DIA occurs above the tropopause).

The PCFH instrument uses thermoelectric cooling with custom-made heat sinks. It has undergone important design revisions through 2023-2025, improving heat dissipation, the quality of the optical signal, and controller operation. We find that the redesigned instrument is able to provide atmospheric dew or frost point measurements from the ground up to at least 23 km, with little preparation efforts due to a fully-electric design.

These new developments in chilled mirror hygrometry pave the way for environmentally friendly, high accuracy, and high vertical resolution observations of water vapor in the UTLS.

How to cite: Poltera, Y., Wienhold, F. G., Artho, V., Brossi, S., Brossi, T., Brunamonti, S., Romanens, G., Brun, A., Luo, B., Peter, T., and Stober, G.: Observations of post Hunga-Tonga UTLS water vapor over the Alpine region with balloon-borne low-GWP frost point hygrometers, EGU General Assembly 2026, Vienna, Austria, 3–8 May 2026, EGU26-14905, https://doi.org/10.5194/egusphere-egu26-14905, 2026.

EGU26-15075 | PICO | AS3.26

Evaluating satellite-based measurements of halogenated gases 

Kaley A. Walker, Laura N. Saunders, Gabriele P. Stiller, Piera Raspollini, Felicia Kolonjari, Ali Jalali, Luis F. Millán, Gerald Wetzel, and Geoffrey C. Toon

Industrial compounds that contain halogens are potent greenhouse gases, and those that contain chlorine and bromine substantially reduce springtime ozone over the poles. As a result, these gases have been phased out by the 1987 Montreal Protocol and its subsequent amendments. However, many persist in the atmosphere due to their long lifetimes and gradual elimination from industry. Chlorofluorocarbons (CFCs) and carbon tetrachloride (CCl4) were scheduled to be fully phased out by 2010 and replaced by hydrochlorofluorocarbons (HCFCs), which will be banned worldwide by 2030. Some halogenated gases, such as perfluorocarbons (PFCs), have global warming potentials thousands of times greater than carbon dioxide but are not controlled by the Montreal Protocol or any other agreement. With so many halogen-containing compounds remaining in the atmosphere at different levels of regulation, it is crucial to continue carefully monitoring their abundances and trends. This can be accomplished using global satellite-based measurements, which have been continuously available for many of these gases as of the early 2000s. To maximize the reliability of these measurements, it is important to validate them through comparisons with other observations. In this study, we compare collocated measurements from three different satellite instruments (ACE-FTS on SCISAT, HIRDLS on Aura, and MIPAS on Envisat) with each other and with independent reference data from balloon-based instruments for CFC-11, CFC-12, CFC-113, HCFC-22, CCl4, and CF4. We find that overall, the satellite instruments perform well, but for certain regions and time periods, there are significant biases that need to be considered throughout any monitoring activities.

How to cite: Walker, K. A., Saunders, L. N., Stiller, G. P., Raspollini, P., Kolonjari, F., Jalali, A., Millán, L. F., Wetzel, G., and Toon, G. C.: Evaluating satellite-based measurements of halogenated gases, EGU General Assembly 2026, Vienna, Austria, 3–8 May 2026, EGU26-15075, https://doi.org/10.5194/egusphere-egu26-15075, 2026.

EGU26-15583 | ECS | PICO | AS3.26

Insights from Diurnal Cycle of O2 and CO2 Records Collected at Scripps Pier, La Jolla, California 

Madat Sardarli, Jens Mühle, Eric J. Morgan, Bill Paplawsky, Stephen Walker, Jooil Kim, Timothy Lueker, and Ralph F. Keeling

The Scripps Pier (Scripps Institution of Oceanography) is one of the few sites globally with concurrent, continuous, in situ measurements of atmospheric O2 and CO2. Situated at a land ocean interface near a dense urban corridor, the site receives marine and continental air masses under transport conditions shaped by land sea breezes, boundary layer evolution, productive coastal waters, terrestrial biosphere and local fossil fuel fluxes. We find that variations of atmospheric O2 and CO2 were largely anticorrelated, but shifted in phase, a pattern consistent with opposite-sign responses to surface exchange processes and to modulation by atmospheric transport. Diurnal phase space relationships between O2 and CO2 often form closed loop structures that emerge from phase offsets between surface fluxes and transport pathways. The detailed structure of these phase relationships varied from day to day with changes in wind regimes and with varying contributions from urban fossil fuel emissions, terrestrial biosphere exchange, and air-sea fluxes. Back trajectory classification resolved these relationships into nocturnal offshore and daytime onshore flows with distinct O2 to CO2 slopes that indicated differing mixtures of the contributing processes. Many features of the observed patterns can be understood based on day-to-day variation of the relative amounts of different processes with fixed exchange ratios. This study also addresses the extent to which episodic variability in oceanic dissolved oxygen influences atmospheric O2 variability at the site.

How to cite: Sardarli, M., Mühle, J., Morgan, E. J., Paplawsky, B., Walker, S., Kim, J., Lueker, T., and Keeling, R. F.: Insights from Diurnal Cycle of O2 and CO2 Records Collected at Scripps Pier, La Jolla, California, EGU General Assembly 2026, Vienna, Austria, 3–8 May 2026, EGU26-15583, https://doi.org/10.5194/egusphere-egu26-15583, 2026.

EGU26-16228 | ECS | PICO | AS3.26

Assessment of the relationship between tropospheric NO2 and photosynthetic activity across seasonal croplands in India 

Anagha Kunhimuthappan Suresan and Jayanarayanan Kuttippurath

Tropospheric nitrogen dioxide (NO2) is an indicator of anthropogenic activity and a key precursor of the phytotoxic surface ozone (O3), with potential implications for agricultural ecosystems. Recent satellite-based studies have reported negative association between NO2 and vegetation greenness over agricultural regions, but the persistence of these relationships over longer timescales and their relevance for crop photosynthetic functioning remain unclear. Here, we assess co-variability between NO2 and photosynthetic activity over Indian croplands (rice and wheat dominated regions) over a decadal scale (2007–2022) using High Spatial-Temporal Coverage Merged tropospheric NO2 (HSTCM-NO2) dataset and Solar Induced Fluorescence (SIF) from the Global Solar-induced Chlorophyll Fluorescence (GOSIF) product. Analyses conducted separately for the kharif (July–September) and rabi (January–March) seasons to account for contrasting agro-climatic and photochemical conditions. We find widespread increases in SIF for rabi season croplands (0.0032 W/m²/μm/sr/yr) including wheat-dominated regions, despite spatially heterogeneous NO2 trends (0.0096×10¹⁵ molec./cm2/yr) that increase across much of the Indo-Gangetic Plain (IGP). However, analysis of detrended interannual variability reveals a significant negative association between NO2 and SIF during the rabi season (Pearson correlation, r=-0.5, p=0.048), indicating reduced photosynthetic activity in years with elevated pollution. A similar but weaker relationship is observed for kharif season croplands in rice-dominated regions (r=-0.1, p=0.704). The results indicate that variations in NO2 pollution may modulate interannual crop performance by influencing photosynthetic activity, even in systems where long-term productivity trends are primarily driven by management and technology.

Keywords: Tropospheric NO2; Pollution; Croplands; Photosynthetic activity; SIF; India

How to cite: Kunhimuthappan Suresan, A. and Kuttippurath, J.: Assessment of the relationship between tropospheric NO2 and photosynthetic activity across seasonal croplands in India, EGU General Assembly 2026, Vienna, Austria, 3–8 May 2026, EGU26-16228, https://doi.org/10.5194/egusphere-egu26-16228, 2026.

EGU26-16273 | ECS | PICO | AS3.26

Tracing the emerging Recovery Signals of Arctic Stratospheric Ozone 

Anjali Sathyanath and Jayanarayanan Kuttippurath

The recovery of Arctic ozone has become an increasingly important indicator of the effectiveness of global policies regulating ozone-depleting substances. While severe ozone depletion first emerged over Antarctica in the late 1970s and reached its maximum in the late 1980s, Antarctic ozone has exhibited clear recovery since the early 2000s. In contrast, long-term ozone trends in the Arctic have remained uncertain due to strong dynamical variability. In this study, we investigate Arctic ozone changes from 1988 to 2024 using a comprehensive set of observations, including satellite datasets, ozonesondes, reanalysis products, and ground-based measurements. Our analysis reveals statistically significant positive trends in upper-stratospheric ozone (3–1 hPa), reaching up to 0.915 ± 0.251% per decade, based on the Stratospheric Water and Ozone Satellite Homogenized (SWOOSH) and merged satellite records (SAGE-CCI-OMPS). Total column ozone (TCO) also exhibits a significant increase during 2000–2024, with trends of 8.51 ± 6.03 DU/dec from merged satellite (MSAT) records and 6.51 ± 3.88 DU/dec from ground-based observations. Seasonal analysis of combined station data reveals robust positive trends in the southern Arctic (Lerwick, Scoresbysund, Sodankylä, Oslo) during autumn (9.11 ± 2.38 DU/dec) and spring (6.24 ± 4.71 DU/dec), while the other seasons exhibit weak but positive trends. Although the extreme Arctic ozone depletion event of 2020 influences trend estimates across different post-2000 periods. Nevertheless, all stations exhibit positive TCO trends from 2000 to 2024, providing strong evidence that Arctic ozone is undergoing recovery.

How to cite: Sathyanath, A. and Kuttippurath, J.: Tracing the emerging Recovery Signals of Arctic Stratospheric Ozone, EGU General Assembly 2026, Vienna, Austria, 3–8 May 2026, EGU26-16273, https://doi.org/10.5194/egusphere-egu26-16273, 2026.

EGU26-16637 | PICO | AS3.26

Long-term reductions in regional pollutants contributed to decreased PM2.5 concentrations in Taiwan from 2017 to 2023 

Shane S.-E. Sun, Charles C.-K. Chou, Chung-Te Lee, and Shih-Yu Chang

Long-term monitoring of PM2.5 mass concentrations and chemical composition provides essential insights into the temporal variation of air pollutants and serves as a basis for evaluating the effectiveness of emission control strategies. Although the Taiwan Ministry of Environment (MOE) has established a nationwide air quality monitoring network comprising over 75 stations, routine measurements of PM2.5 chemical composition are not included. To address this gap, this study collected PM2.5 samples every six days from 2017 to 2023 at six MOE stations—Hualien, Banqiao, Zhongming, Douliu, Chiayi, and Xiaogang—to analyze their chemical composition. The results indicate that sulfate (SO42-), nitrate (NO3-), and organic carbon (OC) were the predominant components, jointly accounting for over 50% of the PM2.5 mass. All three species exhibited decreasing trends across the six sites during the study period. In 2023, compared to 2017, SO42 concentrations decreased by 1.09–2.06 μg m-3 (20–42%), NO3- by 0.27–2.32 μg m-3 (17–36%), and OC by 0.63–1.90 μg m-3 (27–43%). Positive Matrix Factorization (PMF) analysis resolved six major source factors: “Regional pollution,” “Mixed secondary pollution,” “Mixed primary pollution,” “Oil combustion,” “Sea spray,” and “Suspended dust.” The “Regional pollution” and “Oil combustion” sources were strongly associated with transboundary pollution. Notably, the “Oil combustion” factor exhibited a marked decline starting in 2020, coinciding with the implementation of the International Maritime Organization's global sulfur cap (IMO 2020), which limited the sulfur content in marine fuels. Over the seven-year period, the contributions from “Regional pollution” and “Oil combustion” decreased by an average of 29% and 76% across the six stations, respectively. In contrast, “Mixed primary” and “Mixed secondary” pollution were more closely linked to local sources, particularly traffic emissions. The “Mixed primary pollution” factor showed a strong correlation with CO (r = 0.65), with correlation coefficients exceeding 0.7 at the Douliu , Xiaogang, and Zhongming stations, indicating a significant influence from primary traffic emissions. While “Mixed secondary pollution” decreased significantly by 40% on average across the six sites over the last seven years, “Mixed primary pollution” showed only a marginal decline of 5%. In summary, the overall decline in PM2.5 concentrations from 2017 to 2023 can be attributed to reductions in regional pollution and secondary aerosols. However, the stagnation in reducing mixed primary pollution highlights a critical gap, suggesting that future control strategies must prioritize stricter regulations on primary pollutants, encompassing both traffic and industrial emissions.

How to cite: Sun, S. S.-E., Chou, C. C.-K., Lee, C.-T., and Chang, S.-Y.: Long-term reductions in regional pollutants contributed to decreased PM2.5 concentrations in Taiwan from 2017 to 2023, EGU General Assembly 2026, Vienna, Austria, 3–8 May 2026, EGU26-16637, https://doi.org/10.5194/egusphere-egu26-16637, 2026.

EGU26-17700 | ECS | PICO | AS3.26

Atmospheric N2O trends, variability, and regional emissions derived from long-term observations and the radon tracer method at Schauinsland and Zugspitze stations (Germany) 

Sarah Johanna Ernestina Reith, Cedric Couret, Julian Großmann, Frank Meinhardt, Sabine Schmid, and Martina Schmidt

Nitrous oxide (N2O) is the third most important long-lived greenhouse gas and the most dominant contributor to stratospheric ozone depletion. In Germany, long-term atmospheric N2O mole fractions are measured continuously at two background stations: Schauinsland (47°55‘N, 7°55‘E, 1205 m above sea level) and Zugspitze (47°25‘N, 10°58‘E, 2656 m above sea level). In this study, high-resolution measurements from 2001 (Schauinsland) and 2003 (Zugspitze) to 2024 were subjected to a comprehensive quality control process, including consistency checks and filtering to reduce the influence of local sources.

The long-term trends of N2O mole fractions at Schauinsland and Zugspitze stations, of 0.82 ppb/yr and 0.85 ppb/yr, respectively, agree well with the marine background observations from the AGAGE at Mace Head station, and with global tropospheric growth rates. The continental excess during the last 25 years was found to be 0.9 ppb at Schauinsland and 0.5 ppb at Zugspitze. At Schauinsland station, the amplitude of the seasonal cycle decreased from 1.0 ppb during 2001-2010 to 0.7 ppb during 2011-2024. The diurnal variability ranges from 0.1 ppb  in winter to 1.0 ppb in summer. At Zugspitze, the annual variability is 0.4 ppb. The amplitudes in the mean diurnal cycle range from 0.03 ppb during the winter months to 0.15 ppb during summer months.  Regional N2O emissions in the vicinity of Schauinsland (Upper Rhine Valley) were quantified using the radon tracer method, based on 222Rn activity measurements provided by the German Federal Office for Radiation Protection. The derived N2O fluxes from the radon tracer method were extrapolated to annual emissions and compared with different emission inventories (EDGAR, UNFCCC, and E-PRTR/IREP), focusing particularly on the differences between the inventories regarding emissions attributed to the chemical industry in the Alsace region of France.

How to cite: Reith, S. J. E., Couret, C., Großmann, J., Meinhardt, F., Schmid, S., and Schmidt, M.: Atmospheric N2O trends, variability, and regional emissions derived from long-term observations and the radon tracer method at Schauinsland and Zugspitze stations (Germany), EGU General Assembly 2026, Vienna, Austria, 3–8 May 2026, EGU26-17700, https://doi.org/10.5194/egusphere-egu26-17700, 2026.

EGU26-18698 | PICO | AS3.26

Changes in global atmospheric oxidant chemistry from land cover conversion 

Andrea Pozzer, Sergey Gromov, Clara Nussbaumer, Laura Stecher, Matthias Kohl, Samuel Ruhl, Holger Tost, Jos Lelieveld, and Ryan Vella

The natural landscape has undergone profound transformations due to human activities, with vast areas being converted for agriculture and grazing. This shift  has far-reaching consequences for the Earth's system, impacting various components such as surface reflectivity, roughness, evapotranspiration, and atmospheric composition.

To better understand the effects of land cover change on atmospheric chemistry, this study employs the chemistry–climate model EMAC to simulate two distinct scenarios. The first scenario represents the current state of land cover, characterized by widespread deforestation for agricultural and grazing purposes, with the potential natural vegetation (PNV) cover simulated by the model. In contrast, the second scenario depicts an extreme reforestation scenario, where grazing land is restored to its natural state.

The results of this study reveal that the expansion of agricultural land leads to a decline in global emissions of biogenic volatile organic compounds (BVOCs). This decrease in BVOC emissions, in turn, results in higher surface concentrations of hydroxyl radicals (OH, +5.7%) and lower mixing ratios of carbon monoxide (CO, -6.2%). Notably, this trend persists despite increased CO emissions from agricultural biomass burning.

At the same tim, the mixing ratios of nitrogen oxides (NOx) exhibit an increase (+7.8%) due to enhanced anthropogenic and natural soil sources. While regional ozone responses may vary, the global ozone production sensitivity shifts from a NOx- to a VOC-sensitive regime.

These changes have significant implications for radiative forcing, with reductions in tropospheric ozone and methane lifetimes contributing to a combined radiative effect of −60 mW m−2 (cooling). This cooling effect partially offsets the warming resulting from reduced BVOC-driven aerosol formation. 

How to cite: Pozzer, A., Gromov, S., Nussbaumer, C., Stecher, L., Kohl, M., Ruhl, S., Tost, H., Lelieveld, J., and Vella, R.: Changes in global atmospheric oxidant chemistry from land cover conversion, EGU General Assembly 2026, Vienna, Austria, 3–8 May 2026, EGU26-18698, https://doi.org/10.5194/egusphere-egu26-18698, 2026.

EGU26-18877 | ECS | PICO | AS3.26

Multi-Year Simulations of the Global Atmosphere: The role of Biomass Burning Emissions Datasets 

Konstantina Paraskevopoulou, Chrysa Vamvakaki, Stelios Myriokefalitakis, Rafaila-Nikola Mourgela, Manolis P. Petrakis, Konstantinos Seiradakis, and Apostolos Voulgarakis

Wildfires are a significant source of trace gases and aerosols emitted into the atmosphere with the potential to influence the Earth’s radiative balance, and therefore climate. To assess their present-day influence on atmospheric composition, we conducted multi-year simulations using a range of emissions datasets over the period 2003-2015.  

In our study we employ TM5-MP Chemical Transport Model (CTM) and five biomass burning (BB) emissions datasets: GFED4.1s, GFASv1.2, FEERv1.0-G1.2, QFEDv2.4r1 and FINNv2.5, to drive the simulations. This intercomparison aims to assess the model's ability to simulate atmospheric composition and wildfire-driven changes in atmospheric tracers such as carbon monoxide (CO), nitrogen oxides (NOx), ozone, and aerosol abundances, distribution, seasonal cycles, and interannual variability (IAV), while examining the dependency of the results on the input wildfire emissions dataset. Hot-spots of wildfire influences are identified, and results are compared with satellite and ground-based observations, to examine where the model captures the role of biomass burning emissions in the atmosphere more accurately and where deficiencies are evident.  

Comparing results for CO, high IAV is captured in BB hotspots in the corresponding BB season, with simulations using FEER showing the lowest IAV of all datasets. Simulated Aerosol Optical Depth (AOD) shows pronounced IAV in Siberia (boreal spring/summer), South America (boreal summer/autumn) and Boreal North America (boreal summer), across all datasets, albeit, with different magnitudes. These patterns align with the seasonal burning in each region; when fire emissions are excluded, AOD IAV decreases significantly during the corresponding burning seasons.

How to cite: Paraskevopoulou, K., Vamvakaki, C., Myriokefalitakis, S., Mourgela, R.-N., Petrakis, M. P., Seiradakis, K., and Voulgarakis, A.: Multi-Year Simulations of the Global Atmosphere: The role of Biomass Burning Emissions Datasets, EGU General Assembly 2026, Vienna, Austria, 3–8 May 2026, EGU26-18877, https://doi.org/10.5194/egusphere-egu26-18877, 2026.

EGU26-19412 | ECS | PICO | AS3.26

Changes in methane source signatures inferred from long-term CH₄ and δ¹³C-CH₄ observations 

Xietiancheng Yu, Bibhasvata Dasgupta, Sylvia Englund Michel, John B. Miller, Xin Lan, Sourish Basu, Shinji Morimoto, Ryo Fujita, Daisuke Goto, and Thomas Röckmann

Methane is the second most important anthropogenic greenhouse gas. Since 2007, atmospheric methane concentrations have resumed growth following a period of relative stabilization, with the growth rate accelerating in recent years. At the same time, a reversal in the isotopic trend of atmospheric methane suggests possible changes in sources driving the observed increase in atmospheric CH₄.

In this study, we use a novel approach based on the Miller-Tans method, which uses short-term devations from a smooth background signal in observed time series of CH4 mole fraction and isotopic composition to infer δ¹³C-CH₄ source signatures of this short-term component. This allows us to focus on regional scale changes in methane sources .

We use 20 years of long-term atmospheric methane and carbon isotope (δ¹³C-CH₄) observations from a global sampling network to conduct a comprehensive analysis of the spatial distribution, seasonal variability, and long-term trends of δ¹³C-CH₄ source signatures. In particular, we observe a pronounced decrease in δ¹³C-CH₄ source signatures at high northern latitudes after 2007, indicating a relative increase in isotopically depleted, biogenic methane sources in this region. By comparing our observation-based results with inverse modeling studies, we further discuss how this regional shift is reflected at the global scale and explore possible explanations underlying the substantial shifts in the source mix at high northern latitudes.

How to cite: Yu, X., Dasgupta, B., Michel, S. E., Miller, J. B., Lan, X., Basu, S., Morimoto, S., Fujita, R., Goto, D., and Röckmann, T.: Changes in methane source signatures inferred from long-term CH₄ and δ¹³C-CH₄ observations, EGU General Assembly 2026, Vienna, Austria, 3–8 May 2026, EGU26-19412, https://doi.org/10.5194/egusphere-egu26-19412, 2026.

EGU26-19578 | PICO | AS3.26

15 years of measurements at Welgegund atmospheric measurement site in South Africa 

Ville Vakkari, Liezl Bredenkamp, Markku Kulmala, Lauri Laakso, Tuukka Petäjä, and Pieter G. van Zyl

Long-term measurements of aerosol particles and trace gases are available from several well-equipped research stations in Europe and North America, but global coverage of such measurements is far from complete. Notably, Welgegund measurement station in South Africa is the only site in continental Africa where e.g. submicron aerosol size distributions are continuously monitored. Welgegund is located in a grazed grassland savanna environment approx. 100 km west of Johannesburg (26.57°S, 26.94°E) at 1480 m above sea level. The station has been operational since May 2010 and is equipped with continuous measurements of aerosol properties such as submicron size distributions, PM10, aerosol particle scattering, absorption-based black carbon (BC) with a MAAP, basic trace gases (SO2, O3, NO, NOx, CO) as well as ecosystem fluxes (CO2, H2O).

Seasonality at Welgegund is characterised with a wet season from October to April, and a dry season from May to September. During the dry season, BC is elevated due to both increased sources (e.g. landscape fires) and reduced wet removal. In the BC time series, a decrease is observed between May 2015 and May 2017. Until May 2015, the mean wet season BC is 0.33 µg m-3, but after May 2017, the mean wet season BC is 0.24 µg m-3. Simultaneously, the mean dry season BC drops from 0.98 µg m-3 to 0.75 µg m-3. For both seasons, the decrease is statistically significant with p-value ≤ 0.001 using Mann-Whitney U test. The decrease in BC affects single scattering albedo at 635 nm, which increases from 0.88 to 0.91 for the wet season and from 0.81 to 0.86 for the dry season, respectively.

Last year, an ACSM for on-line measurement of non-refractory submicron aerosol chemical composition and an on-line GC-MS system for volatile organic compound measurements were added to Welgegund instrumentation. These new measurements, together with the existing long time series, enable more detailed characterisation of aerosol particles and their precursors at the grassland savanna environment at Welgegund.

How to cite: Vakkari, V., Bredenkamp, L., Kulmala, M., Laakso, L., Petäjä, T., and van Zyl, P. G.: 15 years of measurements at Welgegund atmospheric measurement site in South Africa, EGU General Assembly 2026, Vienna, Austria, 3–8 May 2026, EGU26-19578, https://doi.org/10.5194/egusphere-egu26-19578, 2026.

EGU26-19754 | ECS | PICO | AS3.26

Chlorine Processing by Organic Aerosol from the 2020 Australian Wildfires and Implications for Future Ozone Recovery 

Lavinia Toso, Martyn Chipperfield, and Jeremy Harrison

The monitoring of inorganic chlorine species in the stratosphere, particularly hydrogen chloride (HCl), has been a critical measure for the success of the 1987 Montreal Protocol. As the most abundant chlorinated reservoir, HCl levels also reflect stratospheric variability caused by transient events, such as large wildfires. During December 2019 and January 2020, the Australian wildfires injected an unprecedented amount of smoke, containing organic aerosol, into the stratosphere. These particles provided surfaces for heterogeneous chemical reactions, altering the partitioning of chlorine species as a result. To investigate these effects, we used the TOMCAT 3-D chemical transport model to analyse the transport and chemical impact of smoke in the stratosphere in 2020. By incorporating an organic tracer (hexanoic acid) into our simulations, we modelled the evolution of smoke-related aerosol and its observed impact on the HCl distribution and variability.

Output from TOMCAT was evaluated using remote sensing data from the Atmospheric Chemistry Experiment - Fourier Transform Spectrometer (ACE-FTS) solar occultation instrument, along with data from the Aura Microwave Limb Sounder (MLS). ACE-FTS measurements show that HCl concentrations decreased to half their climatological values following the Australian wildfires. Reactivation processes on sulfate and organic aerosol particles contributed to this reduction, accompanied by an increase in active inorganic chlorine species and, in particular, approximately a 4% depletion of southern mid-latitude total column ozone.  

Ongoing work explores the potential impact of similar wildfire smoke injections under future conditions, in an atmosphere with less chlorine (and increased methane and nitrous oxide), by performing TOMCAT simulations for the year 2050. These experiments provide insights into inorganic chlorine processing and ozone layer recovery under conditions of increasing wildfire frequency and intensity driven by climate change.

Overall, our findings highlight the role of smoke organic aerosol in perturbing stratospheric chlorine chemistry and ozone. With wildfires expected to become more frequent and severe due to climate change, understanding these processes is essential for attribution of observed trace gas variability and ensuring the underlying recovery of the ozone layer from halogenated ozone-depleting substances.


How to cite: Toso, L., Chipperfield, M., and Harrison, J.: Chlorine Processing by Organic Aerosol from the 2020 Australian Wildfires and Implications for Future Ozone Recovery, EGU General Assembly 2026, Vienna, Austria, 3–8 May 2026, EGU26-19754, https://doi.org/10.5194/egusphere-egu26-19754, 2026.

EGU26-20533 | ECS | PICO | AS3.26

Spatiotemporal variability of ammonia as observed from space: global patterns and regional insights from hotspots  

Filothei Boufidou, Johann Rasmus Nüß, Mark Shephard, Lieven Clarisse, Martin Van Damme, Nikos Daskalakis, Mihalis Vrekoussis, and Maria Kanakidou

For decades, our understanding of the atmospheric distribution of ammonia has relied on a combination of in situ measurements, satellite remote sensing observations, and emission-driven atmospheric chemistry-transport model results.  However, the limitations of these approaches, including sparse spatial distribution of in-situ measurements and underutilization of satellite data due to challenges in validating column observations against surface measurements, motivate further investigation of the global spatiotemporal variability of atmospheric ammonia. In this study, we jointly analyze observations from two well-validated infrared satellite instruments, IASI and CrIS, which provide near-global coverage and whose different overpass times (IASI at around 09:30 and CrIS at around 13:30 local time) yield complementary information on diurnal variability.  We additionally examine the time-resolved ammonia concentrations from surface stations at selected locations within ammonia hotspot regions and assess how satellite observations compare over the same time frame. The results show that the magnitude of IASI-CrIS differences varies spatially. We investigate four factors that could impact the intercomparison -sensor sensitivity, seasonality, overpass time, and land-use characteristics- and find that their relative influence differs by location. At larger spatial scales, major global ammonia hotspots exhibit heterogeneous temporal behavior despite broadly consistent increasing decadal trends.  Beyond these long-term trends, we investigate the seasonal variability of ammonia at the regional scale and examine how climatological and regional characteristics shape the observed patterns. 

How to cite: Boufidou, F., Nüß, J. R., Shephard, M., Clarisse, L., Van Damme, M., Daskalakis, N., Vrekoussis, M., and Kanakidou, M.: Spatiotemporal variability of ammonia as observed from space: global patterns and regional insights from hotspots , EGU General Assembly 2026, Vienna, Austria, 3–8 May 2026, EGU26-20533, https://doi.org/10.5194/egusphere-egu26-20533, 2026.

EGU26-20940 | ECS | PICO | AS3.26

Disentangling Source and Sink Contributions to Atmospheric Methane Isotope Evolution: Insights from Two-Box Model Experiments 

Bibhasvata Dasgupta, Xietiancheng Yu, and Thomas Röckmann

Understanding the drivers of atmospheric CH₄ variability requires separating emission changes from sink perturbations—a challenge that arises when either alter CH₄ concentrations. Stable isotopes (δ¹³C, δD) provide additional constraints because sources have distinct signatures, while sinks fractionate isotopes through kinetic isotope effects (KIEs). We use complementary two-box modelling approaches to quantify how isotopes respond when CH₄ observations alone cannot distinguish mechanisms.

Our forward model simulates the evolution of hemispheric CH₄, ¹³CH₄, and CH₃D, where emissions add mass with source-specific signatures (thermogenic, biogenic, and pyrogenic), chemical sinks (OH, stratosphere, and soil) remove mass and accordingly fractionate isotopes, and interhemispheric mixing transfers methane across hemispheres. During spin-up, baseline emissions balance removal, yielding steady-state atmospheric isotopic trajectories.

Following the equilibrium period in the spin-up, we enforce OH perturbation, where we impose emission compensation to hold CH₄ constant while varying OH trends (-1.0 to +1.0%/yr). Four compensation strategies, proportional (maintains baseline mix), microbial-dominated, fossil-dominated, and pyrogenic-dominated, produce different isotopic trajectories despite identical CH₄ evolution. For +1.0%/yr OH, Northern Hemisphere δ¹³C shifts range from -3.7‰ (microbial compensation, depleted sources balance enriched removal) to +3.3‰ (pyrogenic compensation, enriched sources overcompensate). Isotopic phase-space analysis reveals cumulative compensation masses of 1200-1900 Tg over 45 years, with δD providing orthogonal constraints (Δδ¹³C/ΔδD slopes distinguish microbial vs thermogenic sources). Forward simulations without compensation show transient isotope responses with ~8-year relaxation timescales, demonstrating that observed 2000-2006 methane stabilization (δ¹³C flattening at ~-47.3‰) requires near-cancellation of source and sink trends. Our dual-isotope framework demonstrates that atmospheric composition networks can attribute decadal CH₄ variability to specific emission sectors even when concentration trends vary, critical for verifying bottom-up inventories and climate-policy targets.

How to cite: Dasgupta, B., Yu, X., and Röckmann, T.: Disentangling Source and Sink Contributions to Atmospheric Methane Isotope Evolution: Insights from Two-Box Model Experiments, EGU General Assembly 2026, Vienna, Austria, 3–8 May 2026, EGU26-20940, https://doi.org/10.5194/egusphere-egu26-20940, 2026.

EGU26-21260 | PICO | AS3.26

AtmoBox, a real time device to measure atmospheric pollutants on board of Perseverance: transoceanic and polar cruises 

Remi Losno, Aurelie Colomb, Marion Fourquez, Fatima-Ezzahraa Bouatir, Joel Knoery, Hervé Le Goff, Véronique Garçon, and Marie Boye

The Perseverance is a sailboat belonging to the "Polar Ocean" association, headed by Jean-Louis and Elsa Etienne. This vessel carries several scientific instruments, including five atmospheric measurement systems monitoring gaseous mercury, ozone, nitrogen oxides, radon, and a laser particle counter. Over the past six months, the ship departed Nice, France, in the Mediterranean Sea, crossed the Strait of Gibraltar and the North Atlantic to reach Nuuk, Greenland. The second leg took the ship from Nuuk to San Francisco, via the Northwest Passage and the Bering Strait. The third leg took the ship along the Mexican coast, to Clipperton Atoll, Papeete, Tahiti, and Christchurch, New Zealand. Atmospheric quality was continuously monitored during this period, and we will present the combined variations of these five parameters in space and time variabilities. As expected, pollution is highest in ports and decreases during the passage from the Atlantic to the Pacific, with a further decrease upon entering the Southern Hemisphere.
The Atmobox onboard system also has the unique feature of transmitting its data in real time for long term experiments, thus allowing its operation to be monitored by a team of scientists on Earth when there are no qualified personnel on board. 

Aknowledgements: Jean Louis and Elsa Etienne head of the association "Océan Polaire" leadind the Persévérance.


How to cite: Losno, R., Colomb, A., Fourquez, M., Bouatir, F.-E., Knoery, J., Le Goff, H., Garçon, V., and Boye, M.: AtmoBox, a real time device to measure atmospheric pollutants on board of Perseverance: transoceanic and polar cruises, EGU General Assembly 2026, Vienna, Austria, 3–8 May 2026, EGU26-21260, https://doi.org/10.5194/egusphere-egu26-21260, 2026.

EGU26-21403 | ECS | PICO | AS3.26

Impacts of Iodinated Very Short-Lived Substances on Stratospheric Ozone 

Zihao Wang and Martyn Chipperfield

The recovery of the stratospheric ozone layer faces increasing challenges from the rising emissions of unregulated very short-lived substances (VSLS). While the rapid increase in chlorinated VSLS, particularly dichloromethane (DCM), has been considered as a measurable threat to ozone recovery timelines, the potential risks posed by iodinated alternatives remain under-characterized. Although iodine emissions are largely natural, climate change may lead to a change in source strength. It is also important to quantify the impact of any possible anthropogenic sources. Finally, the interaction of iodine with other (decreasing) halogens may affect the efficiency of some chemical ozone loss mechanisms.

We investigate the potential impact on the stratospheric ozone layer of the several emission scenarios of iodinated VSLS. Model sensitivity experiments with a global 3-D chemical transport model TOMCAT show a strong dependence of ozone depletion on emission locations. Emissions in the wider tropics, or localised in southeastern Asia, give depletion 4-6 times that from emission in the mid-latitudes of the northern hemisphere. We will show ozone responses to the emissions in terms of polar ozone loss, and global total column trends. We will present our results in terms of ozone depletion potential (ODP) and a new metric, integrated ozone depletion (IOD). We will compare the results for iodine with the widely discussed chlorinated VSLS, DCM, and the long-lived ozone-depleting substance, CFC-11.

How to cite: Wang, Z. and Chipperfield, M.: Impacts of Iodinated Very Short-Lived Substances on Stratospheric Ozone, EGU General Assembly 2026, Vienna, Austria, 3–8 May 2026, EGU26-21403, https://doi.org/10.5194/egusphere-egu26-21403, 2026.

EGU26-21821 | PICO | AS3.26

Using stable isotope of measurements of carbon monoxide for constraining short- and long-term changes in its global budget and atmospheric chemistry 

Thomas Röckmann, Chloe Brashear, Sergey Gromos, Maarten van Herpen, Xietiancheng Yu, Carina van der Veen, Hella van Asperen, Sönke Zaehle, Heiko Moossen, Armin Jordan, Daphne Meidan, Alfonso Saiz-Lopez, Peter Sperlich, Rowena Moss, John Mak, Gabrielle Petron, Andrew Crotwell, Matthew Johnson, and Francesco D'Amico and the The ISAMO team

Carbon monoxide (CO) is an important indirect greenhouse gas, plays a key intermediate role in the cycling of carbon compounds in the atmosphere and via these reactions affects the atmospheric oxidation capacity. Its sources and sinks can be (partially) distinguished with isotope measurements, but extensive observations of CO isotopic composition are sparse. A network of independent global observatories monitored 𝛿13CCO and 𝛿 18OCO at the turn of the 21st century. Since this time, the sole continuous monitoring of CO isotopic composition has been carried out at Baring Head, New Zealand. Starting in 2023, as part of the ISAMO project, we have resumed regular measurements of 𝛿13CCO and 𝛿 18OCO  at seven global monitoring stations, with a focus on the tropical Atlantic. The goal of ISAMO is to better constrain the proposed pathway of methane removal via chlorine radicals that can be released photochemically from mixed mineral dust - salt aerosols. Here we use the new and existing CO isotope data together with model simulations to derive empirical constraints for the production rate of CO from the CH4 + Cl reaction. In addition, we will demonstrate how CO isotope measurements can be used to constrain long-term, and episodic, changes in the global and regional CO budget, arguing for sustaining such measurements at globally distributed locations.

How to cite: Röckmann, T., Brashear, C., Gromos, S., van Herpen, M., Yu, X., van der Veen, C., van Asperen, H., Zaehle, S., Moossen, H., Jordan, A., Meidan, D., Saiz-Lopez, A., Sperlich, P., Moss, R., Mak, J., Petron, G., Crotwell, A., Johnson, M., and D'Amico, F. and the The ISAMO team: Using stable isotope of measurements of carbon monoxide for constraining short- and long-term changes in its global budget and atmospheric chemistry, EGU General Assembly 2026, Vienna, Austria, 3–8 May 2026, EGU26-21821, https://doi.org/10.5194/egusphere-egu26-21821, 2026.

EGU26-5067 | Posters on site | AS3.27

Advancing Atmospheric Hydrogen Emission Quantification Through Airborne Online Mass Spectrometry 

Armin Wisthaler, Felix Piel, Tomas Mikoviny, Aleks Borisov Karabelyov, Malgven Roudot, and Victoria Krohl

Accurate emission measurements are critical for assessing the climate impacts of gases released by human activities. While robust and widely applied methods exist for quantifying carbon dioxide and methane emissions, comparable approaches for atmospheric hydrogen remain less mature. Recent advances in analytical instrumentation, however, are beginning to close this gap. Advanced Monitoring Solutions (adMS) has developed a fast-response (1 Hz) mass spectrometer (H₂MS) capable of measuring atmospheric hydrogen with sub-ppb precision. These direct, rapid, and precise measurements enable established emission quantification techniques to be extended to hydrogen [1].

In 2025, as part of the Hydrogen Emissions Quantification (HEQ) project – a collaboration between adMS and Equinor – we applied and evaluated multiple approaches to quantify hydrogen emissions at an operational industrial site. In this study, we present two emission quantification methods based on airborne online mass spectrometry.

First, the H₂MS analyzer was deployed aboard a helicopter to perform 1 Hz measurements of atmospheric hydrogen. Helium was released at a known rate at the site and used as a tracer, enabling application of the tracer ratio method. To support this approach, a second mass spectrometer (HeMS) was developed to provide highly precise, online measurements of atmospheric helium. These observations represent the first demonstration of real-time airborne monitoring of both hydrogen and helium and show that fast, direct hydrogen measurements can be integrated into established emission quantification frameworks. While the tracer ratio method is demonstrated here, the rapid response of the H₂MS analyzer also enables the application of other emission quantification approaches previously used for methane, including airborne mass balance and inverse modeling techniques.

In addition, we investigated an alternative measurement strategy using a drone-lifted 200 m sampling line to quantify hydrogen emissions from a 100 m-high flare. This approach highlights the potential of unmanned aerial systems to access complex emission geometries that are difficult to sample using conventional ground-based techniques.

[1] Roudot, Malgven and Piel, Felix and Sobolev, Nikita and Mikoviny, Tomas and Wisthaler, Armin and Krohl, Victoria, A New Analytical Framework for Industrial Hydrogen Emissions Quantification: Validation and First Results (September 29, 2025). Available at SSRN: https://ssrn.com/abstract=6041754 or http://dx.doi.org/10.2139/ssrn.6041754

How to cite: Wisthaler, A., Piel, F., Mikoviny, T., Borisov Karabelyov, A., Roudot, M., and Krohl, V.: Advancing Atmospheric Hydrogen Emission Quantification Through Airborne Online Mass Spectrometry, EGU General Assembly 2026, Vienna, Austria, 3–8 May 2026, EGU26-5067, https://doi.org/10.5194/egusphere-egu26-5067, 2026.

EGU26-6750 | Orals | AS3.27

Developing and Validating Airborne Methods for Industrial Hydrogen Emissions Quantification 

Malgven Roudot, Victoria Krohl, Felix Piel, Armin Wisthaler, Tomas Mikoviny, Aleks Borisov Karabelyov, Steven M.A.C. van Heuven, Hubertus A. Scheeren, and Iris M. Westra

The transition to a hydrogen economy is considered to represent an important contribution to climate change mitigation, yet models of the climate impact of a future hydrogen economy rely on appropriate hydrogen emissions scenarios. Reliable empirical data on hydrogen emissions is therefore critical for refining climate models. The HEQ (Hydrogen Emissions Quantification) project, a collaboration between Equinor and adMS, previously reported its first site-level emissions quantification from a grey hydrogen production facility using a novel analytical framework based on mass spectrometry and tracer-ratio methods. This initial study highlighted the need for airborne data acquisition capabilities and enhanced understanding of flaring and venting systems. 

In 2025, the HEQ project carried out a comprehensive data collection campaign at an Equinor-operated refinery, representing the world’s first online airborne effort to quantify hydrogen emissions from an industrial facility. This groundbreaking effort employed a multi-faceted approach combining helicopter-based, drone-assisted, and land-based techniques. The campaign had three primary objectives: validating and qualifying airborne measurement methods for hydrogen, quantifying fugitive emissions from reformers and hydrogen-rich circuits and directly measuring the combustion efficiency of the flaring system. 

This presentation will share valuable insights and results from the campaign, highlighting the effectiveness of diverse data acquisition methods and their implications for emissions measurements and monitoring in real-world industrial environments. By improving our understanding of hydrogen emissions, we aim to provide the empirical data necessary to support future regulatory requirements and enhance climate models for a sustainable hydrogen economy. 

How to cite: Roudot, M., Krohl, V., Piel, F., Wisthaler, A., Mikoviny, T., Borisov Karabelyov, A., van Heuven, S. M. A. C., Scheeren, H. A., and Westra, I. M.: Developing and Validating Airborne Methods for Industrial Hydrogen Emissions Quantification, EGU General Assembly 2026, Vienna, Austria, 3–8 May 2026, EGU26-6750, https://doi.org/10.5194/egusphere-egu26-6750, 2026.

EGU26-7586 | Posters on site | AS3.27

Performance of the adMS hydrogen mass spectrometer (H2MS) for continuous on-line detection of low-level atmospheric hydrogen  

Hubertus A. Scheeren, Iris M. Westra, Steven M.A.C. van Heuven, Bert A.M. Kers, Felix Piel, Armin Wisthaler, and Harro A.J. Meijer

Performance of the adMS hydrogen mass spectrometer (H2MS) for continuous on-line detection of low-level atmospheric hydrogen

Hubertus A. Scheeren1, Iris M. Westra1, Steven M.A.C. van Heuven1, Bert A.M. Kers1, Felix Piel2, Armin Wisthaler2, Harro A.J. Meijer1

1University of Groningen, Department of Science and Engineering, Centre for Isotope research, The Netherlands

2Advanced Monitoring Solutions AS, Oslo, Norway

Abstract. Only recently, new techniques to detect low-level hydrogen emissions along the value chain have become available (1,2,3). We tested the performance of the novel hydrogen mass spectrometer (H2MS) from Advanced Monitoring Solutions (adMS), Norway, against our high-precision Agilent gas-chromatrography system equipped with a Pulsed Discharge Helium Ionization Detector (PDHID) (1) for measuring ambient hydrogen. The H2MS analyzer utilizes electron ionization and magnetic sector separation (following the same fundamental principles as conventional leak-detection mass spectrometers) to isolate and detect H2⁺ ions ((m/z 2) (2). It features a dedicated, patent-pending inlet system that allows for the stable and precise detection of background levels of atmospheric H2 (~530 ppb). We present results from both laboratory and field performance tests of the H2MS system as compared to our GC-PDHID system. As such, we evaluate its measurement performance when using our UAV-borne ‘active AirCore’ samplers for hydrogen emission quantification studies (1,4,6). Furthermore we evaluate the results of a continous monitoring intercomparison experiment against our GC-PDHID system at our field station Lutjewad (4) measuring ambient air from a 60 m high mast. Our results demonstrate that the H2MS is a valuable addition to our low-level hydrogen detection and emission quantification methodologies so far (1,6) with sufficient precision and resolution compared to our GC-systems but unparralled advantages when working under field conditions.

1) I.M. Westra, H.A. Scheeren, F.T. Stroo, S.M.A.C. van Heuven, B.A.M. Kers, W. Peters, H.A.J. Meijer, First detection of industrial hydrogen emissions using high precision mobile measurements in ambient air, Sci. Rep. 14 (2024) 24147, https://doi.org/10.1038/s41598-024-76373-2.

2) Malgven Roudot, Felix Piel, Nikita Sobolev, Thomas Mikoviny, Armin Wisthaler, Victoria Krohl, A New Analytical Framework for Industrial Hydrogen Emissions Quantification: Validation and First Results (September 29, 2025). Available at SSRN: http://dx.doi.org/10.2139/ssrn.6041754.

3) A. Momeni, J.D. Albertson, S. Herndon, C. Daube, D. Nelson, J.R. Roscioli et al. Quantification of Hydrogen Emission Rates Using Downwind Plume Characterization Techniques. Environ. Sci. Technol., 2025, 59, 6016-6024. DOI:10.1021/acs.est.4c13616.

4) T. Andersen, B. Scheeren, W. Peters, and H. Chen: A UAV-based active AirCore system for measurements of greenhouse gases, Atmos. Meas. Tech., 11, 2683–2699, https://doi.org/10.5194/amt-11-2683-2018, 2018.

5) Lutjewad (ICOS class 2) monitoring station: https://meta.icos-cp.eu/resources/stations/AS_LUT.

6) Iris M. Westra, Hubertus A. Scheeren, Mareen J. Penninga, Steven M.A.C. van Heuven, Harro A.J. Meijer, Controlled-release experiment to optimize emission quantification of H2 point source, under review at ES&T-Air, 2026.

How to cite: Scheeren, H. A., Westra, I. M., van Heuven, S. M. A. C., Kers, B. A. M., Piel, F., Wisthaler, A., and Meijer, H. A. J.: Performance of the adMS hydrogen mass spectrometer (H2MS) for continuous on-line detection of low-level atmospheric hydrogen , EGU General Assembly 2026, Vienna, Austria, 3–8 May 2026, EGU26-7586, https://doi.org/10.5194/egusphere-egu26-7586, 2026.

EGU26-7858 | ECS | Orals | AS3.27

Uncertainty analysis and future changes in the soil uptake of hydrogen 

Ye Wang and Oliver Wild

We present results from the EU HYDRA Project (Hydrogen Economy Benefits and Risks: Tools Development and Policies Implementation to Mitigate Possible Climate Impacts), focusing on the soil sink of hydrogen, and its associated historical and future variations. We calculate the dry deposition velocity of hydrogen to soil with and without consideration of soil carbon content and simulate atmospheric hydrogen concentrations in 2010 using the FRSGC/UCI global chemical transport model (CTM). Surface concentrations and their seasonal variation compare better with observations when soil carbon content is accounted for. The contribution of each soil parameter to the overall uncertainty in hydrogen dry deposition was quantified using Gaussian process (GP) emulation and Sobol sensitivity analysis. We find that soil moisture is the key factor influencing soil uptake, and we identify regions with differing responses to soil moisture using the Expectation-Maximization (EM) method. We then explore the influence of dry deposition on the interannual variation in surface hydrogen concentration from 2010 to 2022 using the CTM and find that the interannual variation is driven principally by variations in dry deposition, especially in years with a large soil moisture anomaly relative to the decadal mean. The impact of climate change on future hydrogen dry deposition was then estimated using soil information output from 11 CMIP6 models, and we find a change in soil uptake between 2015 and 2100 of -1.5% to +7.8% following the SSP1-2.6 and +4.6% to +22.2% following the SSP5-8.5 pathway.

How to cite: Wang, Y. and Wild, O.: Uncertainty analysis and future changes in the soil uptake of hydrogen, EGU General Assembly 2026, Vienna, Austria, 3–8 May 2026, EGU26-7858, https://doi.org/10.5194/egusphere-egu26-7858, 2026.

EGU26-9040 | ECS | Posters on site | AS3.27

First year of atmospheric hydrogen measurements and source fingerprinting at the ICOS Lutjewad Station 

Iris M. Westra, Hubertus A. Scheeren, and Harro A.J. Meijer

Molecular hydrogen (H₂) plays an important role in atmospheric chemistry and is considered an indirect greenhouse gas through its influence on methane's lifetime and tropospheric ozone formation. With the anticipated expansion of a hydrogen-based economy, establishing background concentrations and identifying present-day emission sources are essential for detecting and attributing future changes. In this study, we present a one-year record of continuous atmospheric H₂ measurements conducted at the ICOS atmospheric station Lutjewad, located in the north of the Netherlands. Atmospheric H₂ mole fractions were measured using a gas chromatograph with a pulsed discharge helium ionization detector (GC-PDHID) sampling dried ambient air from a 60 m tall tower, alongside measurements of CH₄, CO₂, N2O, and CO used for source fingerprinting of the observed H₂ enhancements. Field campaigns at regional source locations were conducted to investigate the potential emission sources, including traffic emissions (tunnel measurements), methanogenic sources (landfills), and cattle farms. Furthermore, we investigated the potential of the Radon Tracer Method (RTM) to infer regional hydrogen emissions. We observe that continental air masses lead to pronounced atmospheric H₂ enhancements (up to 700 ppb), whereas northerly (marine) winds consistently represent clean background conditions (490–540 ppb), comparable to the observations at the European continental background station Mace Head on the east coast of Ireland. We present results of our on-going Jena sausage flask intercomparison programme which includes hydrogen measurements (once every 4 months), allowing for an independent quality control of the accuracy of our hydrogen measurements in the atmospheric range of 410 – 630 ppb H2.

Overall, this work establishes a pre–hydrogen economy baseline for atmospheric H₂ in northwestern Europe. Our continuous observations proof to be fundamental for a better understanding of H₂ sources within the footprint of our station and a starting point for monitoring emission changes associated with the emerging hydrogen economy.

How to cite: Westra, I. M., Scheeren, H. A., and Meijer, H. A. J.: First year of atmospheric hydrogen measurements and source fingerprinting at the ICOS Lutjewad Station, EGU General Assembly 2026, Vienna, Austria, 3–8 May 2026, EGU26-9040, https://doi.org/10.5194/egusphere-egu26-9040, 2026.

EGU26-9384 | ECS | Posters on site | AS3.27

Quantifying H2 emissions of new and existing infrastructure 

Ceres Woolley Maisch, Ilona Velzeboer, Pim van den Bulk, Harmen van Mansom, Arjan Hensen, and Thomas Röckmann

The hydrogen value chain, including the production, distribution, storage and end use of H2, is growing around the world. Although hydrogen is viewed as a sustainable energy carrier, it has an indirect radiative effect. H2 is a leak prone gas, and emissions from leaks/purging/venting across the H2 value chain could lead to increased H2 mole fraction in the atmosphere. Through the reaction of H2 with OH, this would increase mole fractions of CH4, tropospheric ozone and stratospheric water vapour, all of which result in warming. Hence, the GWP20 and GWP100 of H2 are estimated to be around 37 and 12, respectively.

Therefore, measurements of emissions of H2 from existing and new hydrogen infrastructure are needed. However, low levels of H2 are difficult to measure and suitable measurement technologies are becoming available only recently. One such technology is the Aerodyne Research TILDAS H2 monitor. This monitor has a high precision (down to 5 parts per billion which is 100 times below ambient), has fast time resolution (5 seconds), and can perform continuous 1 Hz air measurements. The instrument has been found to successfully observe a wide range of mole fraction enhancements of H2 on a mobile platform, and these plumes can be converted to emission rates with dispersion models and/or release of tracers at controlled rate. Emission rates from new and existing infrastructure such as refuelling and refilling stations, pipelines, electrolysers and buses will be presented here.

How to cite: Woolley Maisch, C., Velzeboer, I., van den Bulk, P., van Mansom, H., Hensen, A., and Röckmann, T.: Quantifying H2 emissions of new and existing infrastructure, EGU General Assembly 2026, Vienna, Austria, 3–8 May 2026, EGU26-9384, https://doi.org/10.5194/egusphere-egu26-9384, 2026.

EGU26-11201 | Orals | AS3.27

Investigating environmental and microbial drivers of hydrogen uptake in UK peatlands 

Ruby Devlin, Julia Drewer, Nicholas Cowan, Alex Dumbrell, and David Stevenson

Uptake of hydrogen from the atmosphere by microbial activity in soils is the main global H2 sink mechanism. The processes and environmental drivers which modulate the H2 soil sink are highly uncertain, but research has demonstrated that moisture, soil porosity and temperature affect the magnitude of H2 uptake by soil microbes. Peatlands are carbon-rich, dynamic environments with a fluctuating water table and temporal seasonal variation. These environments harbour a relatively large capacity for microbial activity but also contain a variety of mixed environments and microtopography (hummocks and hollows). There are no dedicated studies reported in literature exploring H2 flux dynamics in peatlands to date.

To investigate the drivers of H2 flux in peatland environments, in-situ field measurements of H2 flux have been carried out using the flux chamber method at two Scottish peatlands. Auchencorth Moss (AC) and Whim Bog (WH) are located within the Pentland region south of Edinburgh. AC was previously drained, with peat depth at the study site between 0.5 - 1 m, whereas WH has been left in its natural state with peat depth ranging between 3 - 6 m. At each site, chambers were placed to capture variation in H2 flux due to microtopography. Water table depth and temperature measurements were taken at each chamber at each measurement occasion. Initial results show that mean H2 flux in autumn and winter were -21.5 nmol m-2 s-1 at AC and -18.5 nmol m-2 s-1 at WB.

As well as in-situ field studies, lab-based incubations using soil samples from AC and WH have been conducted to investigate H2 flux under controlled moisture conditions to identify optimum conditions for uptake. Analysis is being carried out using DNA sequencing to identify the microbial species responsible for H2 consumption in samples. Molecular sequencing will also explore the abundance of the gene which activates the expression of the hydrogenase enzyme under varying moisture levels to infer the favourable environmental conditions for H2 uptake on a microbial scale. We hope to report preliminary results at EGU. The main aim of this work is to assess the strength H2 soil sink in high carbon landscapes such as peatlands and explore the key environmental and microbial drivers that constrain H2 uptake.

How to cite: Devlin, R., Drewer, J., Cowan, N., Dumbrell, A., and Stevenson, D.: Investigating environmental and microbial drivers of hydrogen uptake in UK peatlands, EGU General Assembly 2026, Vienna, Austria, 3–8 May 2026, EGU26-11201, https://doi.org/10.5194/egusphere-egu26-11201, 2026.

EGU26-11613 | Orals | AS3.27

Decade-long Observations of Hydrogen Soil Uptake and Traffic Emissions in a Suburban Environment (Gif-sur-Yvette, France) 

Doreen Schell, Camille Yver-Kwok, Martina Schmidt, and Jean-Daniel Paris

To mitigate climate change, alternative energy carriers are required to replace fossil fuels. Hydrogen is widely regarded as a promising candidate, and the hydrogen economy is currently expanding. However, hydrogen is an indirect greenhouse gas, with estimates of its 100-year global warming potential reaching up to 12.8.  A robust assessment of its climate impact therefore requires a detailed understanding of atmospheric hydrogen sources and sinks. Despite this need, observational studies of atmospheric hydrogen remain relatively limited and most are over short measurement periods. Long-term measurements are essential for identifying trends and characterizing decadal variability. Therefore, this study presents an analysis of ten years (2006–2017) of tropospheric hydrogen measurements conducted at a suburban site in Gif-sur-Yvette, France. The in-situ observations show an average baseline hydrogen concentration of (518 ± 18) ppb, characterized by a seasonal cycle, with maxima between April and June and minima between September and November. Both the baseline levels and the seasonal pattern remain stable over the full decade of measurements. The most uncertain component of the atmospheric hydrogen budget is uptake by soils. Using the radon tracer method applied to nighttime data, soil hydrogen uptake was quantified consistently over the ten-year period. An average deposition velocity of (2.8 ± 0.5) · 10−2 cm s−1 was obtained, with stronger uptake during the summer. Despite some interannual variability, no significant long-term trend in soil uptake is observed, providing rare observational evidence for the decadal stability of this major hydrogen sink. Diurnal cycles of hydrogen and carbon monoxide exhibit distinct morning peaks associated with traffic emissions. These were used to derive the H2/CO ratio, a key parameter for estimating hydrogen emissions from traffic based on carbon monoxide inventories. An average ratio of 0.56 ± 0.05 was determined, which likewise shows no systematic trend over the decade. Overall, this study provides decade-long observations of hydrogen, demonstrating the long-term stability of baseline concentrations, soil uptake and traffic-related emission ratios.

How to cite: Schell, D., Yver-Kwok, C., Schmidt, M., and Paris, J.-D.: Decade-long Observations of Hydrogen Soil Uptake and Traffic Emissions in a Suburban Environment (Gif-sur-Yvette, France), EGU General Assembly 2026, Vienna, Austria, 3–8 May 2026, EGU26-11613, https://doi.org/10.5194/egusphere-egu26-11613, 2026.

EGU26-11675 | ECS | Posters on site | AS3.27

Comparative Evaluation of Hydrogen Emission Quantification Methods at the Component Level Using Controlled Releases 

Juliette Louvet, Jean-Daniel Paris, Camille Yver-Kwok, and Violeta Bescos Roy

Hydrogen (H₂) is widely regarded as a promising energy carrier for the energy transition, as it can be produced from renewable energy with low direct greenhouse gas (GHG) emissions and offers strong potential to decarbonize sectors that are difficult to electrify. Consequently, H₂ production is expected to increase in the coming decades. However, H₂ burden in the atmosphere indirectly contributes to climate change by extending the atmospheric lifetime of methane and leading to the formation of stratospheric water vapor and tropospheric ozone. The 100-year global warming potential of H₂ is estimated at 11.6±2.8. As the smallest naturally occurring molecule, H₂ is highly prone to leakage, and intentional releases may occur for operational or safety reasons. Despite this, anthropogenic H2 emissions from non-combustion sources are poorly known, limited by the lack of availability of precise measurement solutions.

This study reports on a controlled release experiment to assess the performance and limitations of H₂ component-level quantification methods. Seven different methods are compared: a bagging method (leak enclosure with a controlled carrier gas flow), two high-flow sampling (HFS) methods (concentration measurement in high-flow rate suction of the leaking gas), and four acoustic imaging methods (converting sound levels in a microphone array into volumetric flow). The controlled H₂ releases are performed on a test bench at the Enagas Metrology & Innovation Center in Zaragoza, Spain. 15 blind controlled releases up to 313 g·h⁻¹ are generated on typical H₂ industry components, including a flange, a valve, and open-ended lines. Leak-rate restrictions are imposed on the instruments for safety reasons. The maximum measurable leak rate is 216 g·h⁻¹ for bagging, 35 g·h⁻¹ for HFS while acoustic cameras have no limitations.

Early results of the intercomparison suggest that the most accurate methods are one HFS method and bagging, with mean relative errors of 13 and 25%, respectively. The second HFS method exhibits a higher mean relative error of 38%.  In contrast, the acoustic camera methods show higher errors of 63%, 98%, 443%, and 1240%.

In conclusion, bagging, although time-consuming, provides reliable measurements across a wide range of leak rates. HFS delivers fast measurements with high accuracy for moderate leak rates but may be limited at very high rates. Acoustic cameras allow rapid detection without upper leak-rate restrictions. However, their quantification accuracy varies widely among methods making some more suitable for leak detection than precise measurement.

How to cite: Louvet, J., Paris, J.-D., Yver-Kwok, C., and Bescos Roy, V.: Comparative Evaluation of Hydrogen Emission Quantification Methods at the Component Level Using Controlled Releases, EGU General Assembly 2026, Vienna, Austria, 3–8 May 2026, EGU26-11675, https://doi.org/10.5194/egusphere-egu26-11675, 2026.

EGU26-11773 | ECS | Posters on site | AS3.27

Role of soil heterogeneity and hydrological variability in atmospheric hydrogen uptake 

Gabriele Nesta, Luca Ridolfi, and Matteo Bertagni

The soil sink of atmospheric hydrogen is the biggest uncertainty related to the climatic impacts of H2 emissions and the projection of hydrogen-based energy scenarios. In this context, a crucial role is played by H2-oxidising bacteria spread basically in every soil and accounting for about 80% of the atmospheric hydrogen removal. Many studies on soils and bacterial activity have been performed and multiple factors, both biotic and abiotic, have been found to influence the hydrogen uptake. Above all, soil moisture and, in particular, its temporal fluctuations have been shown to be the dominant control, conditioning both bacterial activity and hydrogen diffusion in the soil.
In the present work, we extend the dimension of these previous models, taking into account the horizontal spatial diffusion of both soil moisture and hydrogen. This addition opens the way to investigate the key effects of soil spatial heterogeneities and the related occurrence of spatial patterns in soil hydrogen uptake dynamics. Early results show a clear dependence of the H2 atmospheric flux on the presence of the horizontal diffusion terms, with a different behaviour according to the hydroclimatic conditions chosen. Furthermore, spatio-temporal averages computed neglecting the complete coupled dynamics of soil moisture and hydrogen are found to lead to significant errors due to the non-linearities encoded in the model. This latter result is enhanced in climates with poor rainfall events (semi-arid ecosystems), while it is quite negligible in wet cases, where the non-linearities are smoothed down.
The findings of this study improve the understandings of soil hydrogen dynamics and underscore possible biases associated with coarse-resolution global modelling.

How to cite: Nesta, G., Ridolfi, L., and Bertagni, M.: Role of soil heterogeneity and hydrological variability in atmospheric hydrogen uptake, EGU General Assembly 2026, Vienna, Austria, 3–8 May 2026, EGU26-11773, https://doi.org/10.5194/egusphere-egu26-11773, 2026.

EGU26-12029 | ECS | Posters on site | AS3.27

Constraining the atmospheric hydrogen budget through spatiotemporal patterns in models and observations 

Max Coleman and William Collins

Atmospheric hydrogen is an important atmospheric constituent, affecting the oxidative capacity of the atmosphere and indirectly causing a climate warming effect through its chemical interactions. To quantify these effects, and that of future hydrogen emissions from anthropogenic activity, requires understanding hydrogen’s atmospheric budget. We aim to constrain this budget using spatial and temporal patterns of hydrogen, its sources, and sinks, derived from observations and a multi-model comparison.

As part of the Climate Impacts of a HYdrogen economy: the pathWAY to knowledge (HYway) project, emissions-driven simulations of present-day hydrogen have been conducted in several climate and chemistry transport models. Variation in the meridional, vertical and seasonal patterns of hydrogen concentration across these models arise due to differences in the corresponding patterns of each budget term. By comparing the hydrogen concentration patterns in observational data to that of the models and their budget terms, we attempt to constrain the magnitude of each budget term. These constraints are determined from basic statistical analysis and simple box modelling approaches.

We thus present an analysis of the spatial and temporal patterns of atmospheric hydrogen and its sources and sinks, derived from observational and model data, and estimation of the magnitude of budget terms.

How to cite: Coleman, M. and Collins, W.: Constraining the atmospheric hydrogen budget through spatiotemporal patterns in models and observations, EGU General Assembly 2026, Vienna, Austria, 3–8 May 2026, EGU26-12029, https://doi.org/10.5194/egusphere-egu26-12029, 2026.

EGU26-12059 | Orals | AS3.27

Improved simulation of atmospheric hydrogen using Eulerian and Lagrangian models 

Robert Reisch, Jens-Uwe Grooß, Astrid Kerkweg, Benedikt Steil, Nic Surawski, Andreas Engel, and Felix Ploeger

Renewably produced hydrogen will contribute to climate change mitigation for hard to abate emission generating sectors, if leakage rates are minimised. Despite this benefit, leakage of hydrogen into the atmosphere is well documented to cause indirect climate effects such as depletion of hydroxyl radical and changes in different greenhouse gases, such as increases in methane lifetime, tropospheric ozone and stratospheric water vapor. Therefore accurate earth system modeling of hydrogen budget changes, especially in the upper troposphere and lower stratosphere (UTLS), is an important tool to quantify climate change impacts, induced by changes due to different hydrogen budgets. It has been shown, that Lagrangian transport improves the simulation of water vapour in the UTLS, by reducing climate model moist biases by a factor between 2 and 3 in the lowermost stratosphere (Charlesworth et. al., 2023).

Following this approach, we investigate the atmospheric distribution of hydrogen using a similar model setup, which faciliates an improved estimation of the hydrogen-induced water vapor climate effect. We show simulations of two model versions, the Eulerian EMAC model and the Lagrangian coupled model EMAC-CLaMS. Emissions of hydrogen and methane as well as the soil sink are prescribed from previous work by Surawski et al. (2025) The model has a resolution corresponding to a horizontal grid of 1.87° * 1.87° (≈ 180-190 km) up to a model top height of 80 km. Another major model improvement is the change from a default to an improved radiation scheme. To ensure that the new Lagrangian transport scheme only affects the stratosphere, the entire troposphere in the Lagrangian EMAC-CLaMS simulation is set to the EMAC simulation data.
For model evaluation and comparison between the Eulerian and Lagrangian frameworks, the simulation results are compared with NOAA ground-based hydrogen measurements as well as balloon-borne stratospheric measurements by the University of Frankfurt cryosampler BONBON between 1998 and 2005.

How to cite: Reisch, R., Grooß, J.-U., Kerkweg, A., Steil, B., Surawski, N., Engel, A., and Ploeger, F.: Improved simulation of atmospheric hydrogen using Eulerian and Lagrangian models, EGU General Assembly 2026, Vienna, Austria, 3–8 May 2026, EGU26-12059, https://doi.org/10.5194/egusphere-egu26-12059, 2026.

EGU26-13790 | ECS | Orals | AS3.27

Assessing the co-emission of methane and hydrogen from dairy farms in the Netherlands 

Noni van Ettinger, Steven van Heuven, Iris Westra, Bert Scheeren, and Huilin Chen

The atmospheric composition plays a crucial role in the climate through radiative forcing and chemical processes. Although hydrogen (H2) is not a greenhouse gas itself, it indirectly influences the climate by affecting methane (CH4) lifetime and atmospheric chemistry. To date, H2 emissions have not been studied extensively, limiting our ability to detect trends in a changing economy. Recently, efforts have been made towards developing the first European anthropogenic hydrogen budget by combining bottom-up estimates with spatially resolved activity data. Focusing on the correlation between H2 and carbon monoxide (CO), e.g., fingerprinting, helps further identify H2 emissions from combustion sources. Even though this technique works well for combustion sources, it does not allow for the inference of fluxes from non-combustion sources.

In this study, we aim to extend the fingerprinting method by examining the correlation between CH4 and H2 emissions from dairy farms, following previous studies that showed that H2 and CH4 emissions from dairy cows are dynamically linked. To this end, flask samples were collected at different locations on a dairy farm to determine the correlation between the two trace gases for sub-farm-scale sources. Additionally, this study quantified full-farm H2 and CH4 emissions by using the active AirCore technique on a UAV platform. The CH4-H2 correlations observed at point sources within the farm and those within the full-farm emission plume are found to be consistent with each other. Upscaling based on the well-constrained Dutch national inventory of dairy farming CH4 emissions, we present an initial estimate of national total H2 emissions from dairy farming.

How to cite: van Ettinger, N., van Heuven, S., Westra, I., Scheeren, B., and Chen, H.: Assessing the co-emission of methane and hydrogen from dairy farms in the Netherlands, EGU General Assembly 2026, Vienna, Austria, 3–8 May 2026, EGU26-13790, https://doi.org/10.5194/egusphere-egu26-13790, 2026.

EGU26-14500 | ECS | Orals | AS3.27

Constraining the atmospheric hydrogen oxidation and soil sinks using HFC-152a 

Candice Chen, Kane Stone, Susan Solomon, Luke Western, Paul Krummel, Gabrielle Pétron, Jens Mühle, and Simon O'Doherty

As the hydrogen (H2) economy expands, there is growing interest in understanding the atmospheric lifetime of H2, which affects its impact on atmospheric chemistry and climate. While some global H2 is destroyed via reaction with the hydroxyl radical (OH), most is lost to microbial activity in soils. However, the sources and sinks of H2 are still uncertain on global and local scales. This study focuses on how monthly resolved observations of HFC-152a can help to constrain the seasonal OH cycle and the H2 budget, particularly the seasonal range and phase of H2 oxidation and soil loss. Seasonal observations of HFC-152a are used to constrain OH through a Bayesian inversion in a three-box model comprising the Northern, Tropics, and Southern regions over 2010–2022. In the North, a seasonal range of the soil sink of 18–21 ± 8 Tg year-1 is found, peaking in July–August, while the OH loss seasonal range is 8 ± 1 Tg year-1, peaking in July. The South has much less land and so displays a smaller soil sink seasonal range of 2–3 ± 2.5 Tg year-1, peaking in January–March. The OH loss in the South has a seasonal range of 7 ± 1 Tg year-1, peaking in January. The OH and soil sink loss in the Tropics is more consistent across all months, but with larger uncertainty. The results presented here will be a useful comparison for H2 cycles in fully integrated chemistry climate models.

How to cite: Chen, C., Stone, K., Solomon, S., Western, L., Krummel, P., Pétron, G., Mühle, J., and O'Doherty, S.: Constraining the atmospheric hydrogen oxidation and soil sinks using HFC-152a, EGU General Assembly 2026, Vienna, Austria, 3–8 May 2026, EGU26-14500, https://doi.org/10.5194/egusphere-egu26-14500, 2026.

EGU26-16570 | Posters on site | AS3.27

Initial results from VOCMIP 

Gunnar Myhre and the VOCMIP team

Volatile organic compounds (VOCs) play a key role in atmospheric chemistry, influencing the cycling of peroxy and hydroxyl radicals, the formation of tropospheric ozone, hydrogen, secondary organic aerosols, and the lifetime of methane and other greenhouse gases. The largest source of atmospheric hydrogen is the photochemical destruction of formaldehyde (HCHO), which is primarily produced through the oxidation of other VOCs.

The Volatile Organic Compound Model Intercomparison Project (VOCMIP) aims to identify model consistencies and discrepancies, improve the representation of chemical mechanisms, and advance our understanding of VOC-related processes in the atmosphere. Here, we present initial VOCMIP results, focusing on differences in budget terms for emissions, chemical production and loss, dry and wet deposition, and lifetimes. Particular attention is given to formaldehyde and the key precursor compounds contributing to its formation.

How to cite: Myhre, G. and the VOCMIP team: Initial results from VOCMIP, EGU General Assembly 2026, Vienna, Austria, 3–8 May 2026, EGU26-16570, https://doi.org/10.5194/egusphere-egu26-16570, 2026.

EGU26-17744 | Posters on site | AS3.27 | Highlight

Uncertain climate effects of anthropogenic reactive nitrogen 

Øivind Hodnebrog, Caroline Jouan, Didier A. Hauglustaine, Fabien Paulot, Susanne E. Bauer, Maureen Beaudor, Michael J. Prather, Marit Sandstad, Ragnhild B. Skeie, and Gunnar Myhre

Green ammonia (NH3) is produced based on green hydrogen (H2) and has recently gained wide interest due to its potential to decarbonize ammonia production, and as a carbon-free solution for energy storage and transportation. However, the production and use of ammonia come with other climate and environmental challenges due to its alteration of the Earth’s nitrogen cycle. Before introducing new ammonia technologies on a large scale, it is important to thoroughly understand current atmospheric impacts of anthropogenic reactive nitrogen (Nr), mainly the impacts of ammonia, nitrogen oxides (NOX) and nitrous oxide (N2O) emissions. The present work addresses pre-industrial (1850) to present-day (2019) climate effects of Nr, and has been published in Hodnebrog et al. (2025, Nature, https://doi.org/10.1038/s41586-025-09337-9).

We use five independent latest-generation atmospheric chemistry models (OsloCTM3, CESM2, GISS ModelE, GFDL-AM4.1 and LMDZ-INCA), and find that the change over the industrial era of nitrate and sulfate aerosol abundances owing to Nr emissions varies greatly across the models. Consequently, the direct aerosol radiative forcing (RF) differs widely by model, even in sign. The positive ozone and negative methane RF due to Nr emissions also vary widely between models. While all five models show a net negative RF (i.e., cooling) due to historical anthropogenic Nr emissions, the net climate effect is the sum of several terms that vary in sign and are associated with substantial uncertainties. Future research is clearly needed, both to better define and narrow the uncertainties on the climate effects given here and to quantify climate effects for processes for which estimates do not yet exist (for example, aerosol-cloud interactions due to Nr emissions).

How to cite: Hodnebrog, Ø., Jouan, C., Hauglustaine, D. A., Paulot, F., Bauer, S. E., Beaudor, M., Prather, M. J., Sandstad, M., Skeie, R. B., and Myhre, G.: Uncertain climate effects of anthropogenic reactive nitrogen, EGU General Assembly 2026, Vienna, Austria, 3–8 May 2026, EGU26-17744, https://doi.org/10.5194/egusphere-egu26-17744, 2026.

EGU26-17789 | Posters on site | AS3.27

Multi-model and box modeling evaluation of the tropospheric hydrogen budget 

Srinath Krishnan

Hydrogen (H2) is expected to play an important role in the transition to low-carbon energy systems. Tropospheric H2 is either emitted directly or produced in situ in the atmosphere through chemical reactions, while the two sinks are soil uptake and reaction with the hydroxyl radical (OH). Large uncertainties persist in the global H2 budget, particularly due to limited direct observations of atmospheric H2 production, soil uptake, and the global OH abundance.

In this study, we investigate the global H2 budget using a suite of three-dimensional atmospheric chemistry models to evaluate the key species involved in atmospheric hydrogen production (such as formaldehyde) and loss through OH-related chemistry (such as nitrogen dioxide and carbon monoxide). We then use a box model incorporating isotopic compositions with sources and sink estimates to test different plausible H2 budget scenarios. Combining model evaluations and box model constraints, we suggest atmospheric H2 production of 37-60 Tg yr-1, and atmospheric losses of 15-30 Tg yr-1. Finally, we evaluate the uncertainty in these estimates using the box model framework.

How to cite: Krishnan, S.: Multi-model and box modeling evaluation of the tropospheric hydrogen budget, EGU General Assembly 2026, Vienna, Austria, 3–8 May 2026, EGU26-17789, https://doi.org/10.5194/egusphere-egu26-17789, 2026.

EGU26-18139 | ECS | Posters on site | AS3.27

Interactive Simulation of Methane and Hydrogen Soil Deposition Using the Newly Implemented BIODEP Submodel of the ECHAM5/MESSy Atmospheric Chemistry Model (EMAC) v2.55 

Anna Martin, Klaus Klingmüller, Benedikt Steil, Sergey Gromov, Yu-Ri Lee, Dong Yeong Chang, Nic Surawski, Jos Lelieveld, Sujong Jeong, and Andrea Pozzer
Methane (CH₄) and molecular hydrogen (H₂) are key components of atmospheric composition with important implications for climate processes. Methane acts as a strong greenhouse gas, whereas hydrogen affects climate indirectly by modifying the atmosphere’s oxidative capacity. The primary atmospheric removal pathway for methane is its reaction with hydroxyl radicals, while hydrogen is mainly removed through microbial consumption in soils. In addition to atmospheric oxidation, roughly 6% of global methane emissions are taken up by soils, making this pathway a meaningful contributor to the overall methane budget. The efficiency of soil uptake depends on a range of environmental and soil-related factors, including soil texture, temperature, moisture content, and -for methane- nitrogen availability. Accurately representing these controls requires an integrated description of atmospheric conditions alongside land surface characteristics and soil hydrological processes.
In this work, we present BIODEP, a newly developed biogenic deposition module implemented within the Modular Earth Submodel System (MESSy). BIODEP is coupled to the ECHAM5/MESSy atmospheric chemistry model (EMAC) and the JSBACH land surface and vegetation model, which includes a detailed five-layer soil hydrology scheme. The performance of the model including the newly implemented BIODEP submodel is evaluated by comparing simulated methane and hydrogen atmospheric mixing ratios with measurements from more than 50 stations of the NOAA GML Carbon Cycle Cooperative Global Air Sampling Network covering the period 2009–2019. In addition, the column-averaged methane mixing ratio is compared with observations from the Greenhouse Gases Observing Satellite (GOSAT). For present-day conditions, the model captures observed spatial distributions and seasonal variability of soil uptake fluxes.
By explicitly connecting soil characteristics with meteorological drivers and atmospheric composition, BIODEP enhances EMAC’s capability to represent trace gas dynamics across a range of climate conditions. This development advances the understanding of soil–atmosphere exchange mechanisms and provides a robust modeling framework for assessing future methane and hydrogen cycles, which is essential for climate mitigation strategies and the planning of a sustainable hydrogen economy.

How to cite: Martin, A., Klingmüller, K., Steil, B., Gromov, S., Lee, Y.-R., Chang, D. Y., Surawski, N., Lelieveld, J., Jeong, S., and Pozzer, A.: Interactive Simulation of Methane and Hydrogen Soil Deposition Using the Newly Implemented BIODEP Submodel of the ECHAM5/MESSy Atmospheric Chemistry Model (EMAC) v2.55, EGU General Assembly 2026, Vienna, Austria, 3–8 May 2026, EGU26-18139, https://doi.org/10.5194/egusphere-egu26-18139, 2026.

EGU26-20197 | ECS | Orals | AS3.27

Multi-model diagnostics and uncertainties of atmospheric H2 chemical production and loss terms within the HYway project 

Jiayu Xu, Didier Hauglustaine, Hui Li, Ragnhild Bieltvedt Skeie, Yuanhong Zhao, Bo Zheng, Shushi Peng, and Philippe Ciais

Hydrogen (H2) is expected to be a crucial substitute for fossil fuels in the ongoing energy transition. However, atmospheric H2 is recognized as an indirect greenhouse gas, as it can contribute to global warming through its coupling to the atmospheric oxidative capacity, including interactions with methane, ozone and stratospheric water vapour. Yet, large uncertainties still remain in the atmospheric H2 budget.

Within the framework of the HYway Horizon Europe project, we quantify and diagnose key chemical drivers of uncertainty in simulated H2 by focusing on two components: chemical production linked to formaldehyde (HCHO) and chemical destruction controlled by the hydroxyl radical (OH). HCHO photolysis is a major source of atmospheric H2, accounting for more than half of the global total. We firstly assess the HCHO chemical production, loss, and global burden across multiple HYway models. The global HCHO burden range from 0.69 to 1.03Tg, indicating a wide inter-model difference of 50%. Therefore, we evaluate the simulated HCHO by ground- and satellite-based observations. The contribution of biogenic hydrocarbons emissions to the HCHO budget is discussed. Oxidation by OH is the second-largest sink of atmospheric H2 after soil uptake. However, the modeled OH is typically overestimated by global chemical models. Here, we examine uncertainty in H2 chemical loss by characterizing the range of OH simulated across HYway models, and by comparing simulated OH with observation-constraint OH fields. Finally, we present a free-running H2 simulation (driven by emissions rather than prescribed surface H2 concentrations) and show that the resulting H2 fields are consistent with observations. Overall, this work provides an integrated evaluation of the chemical controls on H2 in global models and a basis for improving H2 projections under future emission scenarios.

How to cite: Xu, J., Hauglustaine, D., Li, H., Skeie, R. B., Zhao, Y., Zheng, B., Peng, S., and Ciais, P.: Multi-model diagnostics and uncertainties of atmospheric H2 chemical production and loss terms within the HYway project, EGU General Assembly 2026, Vienna, Austria, 3–8 May 2026, EGU26-20197, https://doi.org/10.5194/egusphere-egu26-20197, 2026.

EGU26-20265 | ECS | Orals | AS3.27

Hydrogen economy and its critical role in future low carbon energy systems 

Siddharth Joshi, Luca Cassamassima, Jana Fakhreddine, Oliver Fricko, and Volker Krey

Global energy systems are undergoing significant structural changes in response to the overarching aim of mitigating and adopting to the geophysical impacts of climate change. One of the key strategies for enabling this structural change is the incremental transition away from fossil fuels and gradual uptake of renewable and low carbon energy sources. While remarkable progress has been achieved in electricity decarbonisation - which contributed around 35% global GHG emissions in 2025, a significant part of the energy system pie is still exploring suitable solutions especially for “hard-to-abate" sectors—such as steel manufacturing, chemical production, and long-haul shipping—where direct electrification is technically or economically challenging. With increased decarbonisation of electricity sectors using variable renewable generation technologies like solar and wind, there is also a growing need to balance and store the wasted energy from intraday supply and demand mismatch. Additionally, increasing severity of climate change impacts globally is accelerating these structural changes where some nation states have also attempted to raise the climate change mitigation ambition by suggesting complete phaseout of fossil fuels at UNFCCC’s COP28 and COP30. Consequently, there is renewed interest in global hydrogen economy and its direct benefits in circumventing majority of the issues highlighted above.


Pursuant to this, under the Horizon Europe’s HyWay project, researchers are generating future scenarios for hydrogen economy and analysing the warming impacts of subsequent fugitive hydrogen emissions. In this research, hydrogen economy scenarios are being generating using MESSAGEix-GLOBIOM-GAINS modelling framework of IIASA. The modelling framework generates bottom-up energy system futures for 12 Global regions, while also capturing intra-regional and inter-regional energy commodity trade. The framework generates a least cost solution under various technology transition and climate mitigation constraints using linear programming-based optimisation. Using this framework, we generate a set of scenarios using national implemented policies, nationally determined goals, regional net zero targets, hydrogen generation infrastructure and trade policy data, and different global temperature targets for various Shared Socioeconomic Pathway narratives. In addition, some specialised scenarios also looked at more wide-spread use of hydrogen in the energy system vs. more confined use in industrial clusters. These broad policy and techno-climatic levers along with discussions with key industry stakeholders enabled us to analyse in detail a) the future hydrogen generation configuration at various time steps, b) displacement of fossil-fuels from global energy systems, and 3) sectoral utilisation of hydrogen especially in the industrial sector. Across the scenario solution space, we observe that from a current production volume of 100Mt H2 at a global level mainly for industrial use, hydrogen economy can surpass 400Mt H2 production by 2050 and upwards of 1000 Mt H2 by 2100. This would require significant investment in hydrogen economy infrastructure and possibly underwriting and repurposing of fossil fuel-based energy generation units. We also observe that from current domination of “grey hydrogen”, the energy system will transition completely to “green hydrogen” generation by 2050, with “blue hydrogen” acting as a transition enabler. The results also provide significant insights into regional and global dynamics of hydrogen economy including its climate impacts.

How to cite: Joshi, S., Cassamassima, L., Fakhreddine, J., Fricko, O., and Krey, V.: Hydrogen economy and its critical role in future low carbon energy systems, EGU General Assembly 2026, Vienna, Austria, 3–8 May 2026, EGU26-20265, https://doi.org/10.5194/egusphere-egu26-20265, 2026.

EGU26-22029 | ECS | Orals | AS3.27

Scenario Based Assessment of Hydrogen Emissions from Road Transport Infrastructure 

Isheeka Dasgupta, Simone Ehrenberger, Andreas Lischke, Gunnar Knitschky, Aron Moritz, and Nina Thomsen

In this work, hydrogen demand, infrastructure development and emission pathways are quantified for the road transport sector at the European scale. Three scenarios are defined, a business-as-usual, a reference, and a hydrogen-favouring scenario, extending to 2070 and differentiated by assumptions on CO₂ prices, hydrogen prices and infrastructure availability. The resulting hydrogen emission inventories are intended as input to climate chemistry models in a subsequent step to assess the climate implications of road transport hydrogen emissions.

The analysis focuses on the fuel distribution and use stages, where hydrogen refuelling stations (HRS) emerge as the dominant emission source compared to vehicle-level losses (Clark et al. 2025). Emissions at HRS arise from storage venting and boil-off, tanker depressurisation during delivery, compressor leakages, hose venting and purging events, which scale non-linearly with station size and utilisation and depend strongly on station type (compressed or liquid hydrogen). This creates a trade-off between infrastructure scale, utilisation, economic performance and emissions which is an identified gap in literature.

Hydrogen demand needed to be supplied by HRSs in the scenarios is derived for passenger cars, light- and heavy-duty vehicles based on the temporal evolution of transport activity and drivetrain market shares competing with battery electric and conventional technologies. Passenger car activity is modelled using GDP and population dependent motorisation rates as Gompertz functions. Freight activity is estimated based on scenario calculations of the International Transport Forum (ITF). Total passenger and freight transport activity are modelled for reference scenario and is kept constant across the scenarios. Passenger car technology shares and stock evolution in Europe are simulated using the agent-based vehicle choice model VECTOR21 (www.vector21.de). Commercial vehicle stocks are computed using the LAREDO model, informed by expert surveys on hydrogen drivetrain penetration.

Component-level hydrogen emission rates for HRS are compiled from literature (Clark et al. (2025) and others) and distinguished between continuous and event-based releases. Due to the limited number of highly utilised operational stations, reported emission rates span wide ranges. HRSs are simulated by defining component structures, station size and utilisation frequency. To meet spatially resolved hydrogen demand, stations are located using freight and travel demand trip data and clustered to optimise utilisation and scale-dependent costs for compressed and liquid hydrogen supply. Given that liquid hydrogen supply contain high emission processes at lower utilization but are also more cost effective for larger scales, the works thus aims to presents an assessment of trade-offs between costs, utilisation and emissions for HRSs especially across the three scenarios.

Emission inventories are thus created at a 0.1° resolution with global-level analysis, as was done previously (Righi et al. 2025) by authors, and also for other species to provide a consistent input for subsequent climate impact assessments within the project CLEANLIEST.

How to cite: Dasgupta, I., Ehrenberger, S., Lischke, A., Knitschky, G., Moritz, A., and Thomsen, N.: Scenario Based Assessment of Hydrogen Emissions from Road Transport Infrastructure, EGU General Assembly 2026, Vienna, Austria, 3–8 May 2026, EGU26-22029, https://doi.org/10.5194/egusphere-egu26-22029, 2026.

EGU26-481 | PICO | AS3.28

Spatiotemporal Distribution of Air Pollutants across Indo Gangetic Plain: A Multi-Regional Comparative Analysis 

Manoj K Srivastava, Arti Chaudhary, Bharat Ji Mehrotra, and Atul K Srivastava

Elevated air pollution endangers the environment, climate, and human health, creating significant socioeconomic challenges. These pollutants harm ecosystems and exacerbate climate change. This study presents a comprehensive analysis of air quality variations across the Indo Gangetic Plain (IGP) of North India, examining spatial patterns of multiple pollutants across five distinct sub-regions over the four major seasons, namely, Summer, Monsoon, Post-monsoon, and Winter. Data across the major IGP monitoring stations reveal significant regional and seasonal differences in pollutant concentrations and Air Quality Index (AQI). The Middle-Indo Gangetic Plain (MIGP) exhibited the highest particulate matter concentrations (PM 10: 160.23±8.47 μg/m³, PM 2.5: 71.5±4.68 μg/m³), while the North Eastern region (NE) demonstrated the lowest levels (PM 10: 61.72±27.23 μg/m³, PM 2.5: 32.07±14.01 μg/m³). Notable variations were observed in gaseous pollutants, with the Lower-Indo Gangetic Plain (LIGP) showing the highest SO2 (18.55±4.68 μg/m³) concentrations. Major urban centers emerged as pollution hotspots with AQI values exceeding 175, while Aizawl in the cleaner and less populated northeast India maintained AQI below 42. These findings indicate a west-to-east pollution gradient with significant influence from local emission sources, topographical features, and weather conditions. The pronounced inter-regional differences over various seasons highlight the need for tailored air quality management strategies addressing region-specific pollution characteristics rather than uniform approaches across the entire IGP region.

How to cite: Srivastava, M. K., Chaudhary, A., Mehrotra, B. J., and Srivastava, A. K.: Spatiotemporal Distribution of Air Pollutants across Indo Gangetic Plain: A Multi-Regional Comparative Analysis, EGU General Assembly 2026, Vienna, Austria, 3–8 May 2026, EGU26-481, https://doi.org/10.5194/egusphere-egu26-481, 2026.

EGU26-592 | ECS | PICO | AS3.28

Satellite-Derived Seasonal CO₂ Dynamics Over a Northern Indian Megacity: OCO-2 Observations for Delhi (2019–2024) 

Alerk Sharma, Madhavi Jain, Aakriti Yadav, and Pallavi Saxena

Delhi, located within the Indo-Gangetic Plain (IGP), has undergone rapid urbanisation over the past few decades and today represents one of the most densely populated megacities, with nearly 40 million people in the wider National Capital Region regularly exposed to severe air-quality stress. Despite this significance, long-term ground-based CO2 measurements remain sparse, making Delhi a data-scarce environment for greenhouse-gas assessment. In such context, satellite observations offer an essential alternative for evaluating broad-scale CO₂ behaviour, particularly for cities lacking extensive monitoring networks.

This study examines the seasonal variability of column-averaged CO₂ (XCO₂) over Delhi using six years (2019–2024) of quality-filtered observations from NASA’s Orbiting Carbon Observatory-2 (OCO-2). To understand how XCO₂ evolves through the year, monthly values were compared against their multi-year averages, allowing us to identify recurring seasonal tendencies rather than year-specific fluctuations. Using this approach, the satellite data consistently show elevated CO₂ levels during the pre-monsoon months (April–June), followed by a noticeable reduction during the monsoon season, attributed to the precipitation-induced scavenging of CO₂, and increased vegetation growth. As winter approaches, XCO₂ begins to rise again, reflecting the influence of shallow boundary-layer height and larger wind-speed stagnation over northern India.

Delhi’s strong seasonal contrasts provide a clear setting for investigating how satellite-retrieved CO₂ responds to regional meteorology within a dense megacity. The patterns identified in this study highlight the capability of spaceborne observations to capture physically meaningful CO₂ dynamics even in complex, polluted urban environments. These findings also emphasise the value of publicly accessible satellite datasets for cities where continuous ground-based measurements are limited.

How to cite: Sharma, A., Jain, M., Yadav, A., and Saxena, P.: Satellite-Derived Seasonal CO₂ Dynamics Over a Northern Indian Megacity: OCO-2 Observations for Delhi (2019–2024), EGU General Assembly 2026, Vienna, Austria, 3–8 May 2026, EGU26-592, https://doi.org/10.5194/egusphere-egu26-592, 2026.

Ozone in the upper troposphere (UT) is critical for maintaining radiative balance at the top of the atmosphere (TOA). This study utilizes CMIP6 simulations to investigate photochemical pathways influencing ozone production in the UT during the Asian summer monsoon (ASM). We analyze the impact of convectively transported ozone precursors like nitrogen oxides (NOx), non-methane volatile organic compounds (NMVOCs), and carbon monoxide (CO) on the sensitivity of ozone formation over the Asian region in the UT. Our results show an increase of ozone in the UT by ~70% in the present-day compared to the pre-industrial era. This excess ozone is photochemically produced due to the elevated levels of NOx and CO in the UT, along with its direct convective transport from the boundary layer. Changes in formaldehyde (HCHO), a proxy for VOCs, are negligible in the UT. Analysis of ozone in relation to its precursors (HCHO, CO, and NO2) suggests that the UT is primarily NOx-limited, and ozone production follows the NOx-CO-O3 pathway. The UT ozone changes due to increasing ozone precursor emissions affect the radiative balance by exerting a positive ozone radiative effect at the TOA over the ASM anticyclone region. These findings indicate that suitable emission control strategies must be formulated to reduce NOx and CO emissions for limiting ozone enhancement in the UT

How to cite: Roy, C.: Sensitivity of upper tropospheric ozone to anthopogenic emissions during the Asian summer monsoon, EGU General Assembly 2026, Vienna, Austria, 3–8 May 2026, EGU26-607, https://doi.org/10.5194/egusphere-egu26-607, 2026.

Urban ecosystems in megacities like Delhi are shaped by interactions between emissions, built structures, and seasonal meteorology, making policy evaluation vital for understanding environmental resilience and health risks. This study assesses the effectiveness of the Graded Response Action Plan (GRAP) which is Delhi’s tiered emergency framework that mandates escalating pollution-control measures during periods of severe air quality deterioration, across 2022-23, 2023-24, and 2024-25 by analysing high-resolution air quality variations at two contrasting urban settings; residential zone (Dwarka) and industrial cluster  zone (Mundka). Multi-pollutant datasets (PM₂.₅, PM₁₀, NO₂, SO₂, CO, and O₃) were examined across Pre-, During-, and Post-GRAP periods to capture seasonal dynamics and ecosystem-specific responses.

Across all years, particulate pollution showed sharp winter escalation, with PM₂.₅ rising from 40–90 µg/m³ in the Pre-GRAP window (defined as the 45 days prior to GRAP enforcement) to 130–230 µg/m³ during-GRAP, and PM₁₀ increasing from 150–300 µg/m³ to 300–400 µg/m³, with maxima exceeding 600–800 µg/m³ at specific sites. GRAP which typically is implemented for 6 to 8 months each year depending on prevailing pollution levels, which was then evaluated using this ±45-day framework to capture baseline and recovery phases. These particulate levels far exceed WHO and national limits, posing severe respiratory and cardiovascular risks. NO₂ often doubled during GRAP (reaching 50–70 µg/m³), while O₃ showed expected winter suppression (<20 µg/m³) and strong post-winter recovery (30–50 µg/m³), clearly reflected in the 45-day Post-GRAP period. Unlike other pollutants, SO₂ showed inconsistent GRAP influence, increasing during-GRAP and decreasing post-GRAP, indicating a significant policy gap especially in industrial zone where sulfur emissions persist. This is concerning because SO₂ forms sulfate aerosols, contributing to secondary PM and amplifying health impacts.

Although pollutants declined post-GRAP, they rarely returned to Pre-GRAP baselines, especially at industrial sites. Findings show that GRAP mitigates extreme peaks but remains insufficient, underscoring the need for ecosystem-specific, year-round emission controls particularly targeting sulfur sources to strengthen urban environmental health.

How to cite: Singh, M., Sharma, R., Bali, R., and Saxena, P.: Synergistic Approach Towards the Implementation and Effectiveness of the Graded Response Action Plan (GRAP) on Air Quality in Delhi NCR, EGU General Assembly 2026, Vienna, Austria, 3–8 May 2026, EGU26-639, https://doi.org/10.5194/egusphere-egu26-639, 2026.

EGU26-658 | PICO | AS3.28

Ozone and Multi-Pollutant Dynamics: Indoor Chemistry and Exposure Risks in Printing Environments in University Campus Area, Delhi, India 

Pallavi Saxena, Shalini Suryanarayan, Ronak Sharma, Roman Bali, and Mohita Singh

Urban air pollution in the Anthropocene increasingly reflects mixed emissions from both traditional outdoor sources and emerging indoor technological activities. Among these, printing and photocopying shops constitute important yet understudied microenvironments within academic institutions such as University of Delhi, where students and informal-sector workers experience routine exposure to diverse pollutants in confined spaces. To characterise pollutant composition, indoor chemistry, and associated health implications in these settings, we monitored ozone (O₃), PM₂.₅, PM₁₀ and NO₂ across three contrasting printing environments in University of Delhi: an open-front photocopy shop in Hindu College (North Campus), a semi-enclosed photocopy room in South Campus, and a closed indoor flex-printing facility in commercial area nearby (Malka Ganj, Delhi). Continuous measurements were conducted during the monsoon season (1 August–30 September 2025) at 15-minute intervals between 11:00–17:00, alongside temperature and relative humidity observations.

Ozone concentrations remained consistently low (16–22 ppb) across all microenvironments, influenced by the modest O₃-generation capacity of photocopiers and monsoon-season conditions that favour rapid ozone scavenging via humid surfaces and co-emitted NO. In contrast, pronounced multi-pollutant interactions emerged in the semi-enclosed and enclosed settings. Strong O₃–NO₂ correlations (r = 0.75 and 0.72, respectively) highlight the role of shared machine-driven emissions coupled with restricted dilution. Likewise, the very high PM₂.₅–PM₁₀ correlations (r = 0.93 in the semi-enclosed shop; r = 0.80 in the flex-printing room) confirm distinct particulate-generation mechanisms: fine-particle–rich emissions from heated toner units in photocopier rooms and coarse, solvent-associated particulate bursts from flex-printing operations. The enclosed flex environment exhibited the largest PM excursions, marking it as the most pollution-intensive indoor printing microenvironment.

A structured worker survey revealed frequent symptoms (eye/throat irritation, cough, headaches, fatigue) and a lack of safety training for over 70% of operators. As most photocopy shops in Delhi operate in narrow, poorly ventilated galis, real-world exposures may exceed those observed in the monitored sites.

Collectively, these results demonstrate that microenvironmental design and ventilation strength fundamentally regulate indoor pollutant composition, chemical interactions, and human exposure risk. The findings emphasise the urgent need for ventilation-oriented design standards, emission-reduced printing technologies, and targeted occupational-health safeguards within densely populated institutional and urban commercial settings.


How to cite: Saxena, P., Suryanarayan, S., Sharma, R., Bali, R., and Singh, M.: Ozone and Multi-Pollutant Dynamics: Indoor Chemistry and Exposure Risks in Printing Environments in University Campus Area, Delhi, India, EGU General Assembly 2026, Vienna, Austria, 3–8 May 2026, EGU26-658, https://doi.org/10.5194/egusphere-egu26-658, 2026.

Pollution challenges in India intensify during the post-monsoon period, particularly across the Indo-Gangetic Plain, where multiple emission sources intersect with adverse meteorological conditions to elevate particulate matter concentrations. This study investigates PM2.5 variations in Delhi-National Capital Region (NCR) during October-November of 2024 and 2025, with specific focus on the influence of crop-residue burning in Punjab and Haryana, local firecracker emissions, and temperature-driven atmospheric processes.

In 2024, a total of 779 stubble-burning incidents were detected between 1st to 12th October in Punjab and Haryana, coinciding with days that recorded high PM2.5 levels in Delhi-NCR. Satellite-based Fire Radiative Power (FRP) signals and air-mass back-trajectory analyses further validated the long-range transport of smoke plumes into the NCR. In contrast, severe flooding in 2025 in large parts of Punjab and pockets of Haryana resulted in a 77.5% decline in fire incidents during this period. This created a unique natural experiment to assess Delhi’s pollution baseline under minimal agricultural burning influence. Correspondingly, Delhi’s seasonal average PM2.5, reduced by 15.5%, highlighting the substantial contribution of transported biomass burning aerosols to regional air quality degradation.

However, despite significantly fewer regional stubble burning fire events, Delhi-NCR continued to experience notable PM2.5 spikes. Analysis indicates these increases in PM concentration were primarily driven by local emissions such as vehicular exhaust, road dust resuspension, refuse burning, episodic firecracker bursts around festive periods, construction and demolition activities. Additionally, secondary aerosol formation, particularly the conversion of NOx to nitrate under high humidity and low temperatures, contributed to elevated pollution loads.

Meteorological conditions further intensified pollution build-up in this region. Significant night-time temperature dips, shallow planetary boundary layers heights, and low wind speeds limited vertical mixing and hindered pollutant dispersion, causing pollutants to remain trapped near the surface.

The findings demonstrate that early-winter PM2.5 levels in Delhi-NCR are shaped by a complex interplay of transboundary smoke transport, persistent local emissions, and temperature-driven atmospheric processes that favour pollutant accumulation.

How to cite: Balyan, P., Kumar, A., and Dhaka, S. K.: Coupled Emission-Meteorology Controls on Early-Winter PM2.5 in Delhi-NCR Under Variable Biomass-Burning Regimes, EGU General Assembly 2026, Vienna, Austria, 3–8 May 2026, EGU26-672, https://doi.org/10.5194/egusphere-egu26-672, 2026.

EGU26-687 | ECS | PICO | AS3.28

Three decades of Dust Storm Dynamics in Thar Desert region of India: Evolving Aerosol Properties and Impacts on Urban Air Quality. 

Ronak Raj Sharma, Madhavi Jain, Neha Batra Bali, and Pallavi Saxena

In the Anthropocene, interactions between natural mineral dust and anthropogenic emissions have become a major driver of deteriorating air quality across the Indian subcontinent. While the Indo-Gangetic Plain (IGP) remains a persistent hotspot for fine-mode urban pollution, increasingly frequent and intense pre-monsoon dust storms now act as powerful amplifiers of existing aerosol burdens. This study presents a three-decade (1995–2025) spatiotemporal assessment of dust-storm dynamics using the Modern-Era Retrospective analysis for Research and Applications, Version 2 (MERRA-2) reanalysis product, multi-sensor satellite observations including the Moderate Resolution Imaging Spectroradiometer (MODIS), Cloud–Aerosol Lidar and Infrared Pathfinder Satellite Observation (CALIPSO), and ground-level Particulate Matter (PM) monitoring.

Across these three decades, all datasets show a systematic intensification of pre-monsoon dust activity, with percentage changes derived from contrasts between monthly means of the early decade (1995–2005) and the most recent decade (2015–2025). In May, Aerosol Optical Depth (AOD) increases by 26%, Dust Column Mass Density (DCMD) by 15%, and Ångström Exponent (AE) by 31%, indicating stronger dust uplift accompanied by enhanced mixing with fine anthropogenic particles. In comparison, June shows a modest rise in AOD (9%) and DCMD (~2%) with a smaller AE increase (14%), suggesting a gradual end of the peak dust-activity season in the IGP.

Using a three decades long dataset rather than a shorter record is crucial: two-decade comparisons masked the gradual shift in dust-storm timing and the emergence of mixed dust–pollution regimes, whereas the full 1995–2025 time frame reveals coherent, climatologically robust transitions. The results show that strengthening dust intrusions now interact with rapidly evolving urban emissions, modifying aerosol properties and elevating exposure risks. Accounting for these dust–pollution couplings is essential for realistic air-quality assessment and climate–health planning.

How to cite: Sharma, R. R., Jain, M., Bali, N. B., and Saxena, P.: Three decades of Dust Storm Dynamics in Thar Desert region of India: Evolving Aerosol Properties and Impacts on Urban Air Quality., EGU General Assembly 2026, Vienna, Austria, 3–8 May 2026, EGU26-687, https://doi.org/10.5194/egusphere-egu26-687, 2026.

EGU26-836 | ECS | PICO | AS3.28

Air Pollution and Public Health: A Multi-City Assessment of PM₂.₅ Exposure in Punjab, Pakistan 

Saadia Hina, Ayesha Sana, Muhammad Adrees, Shamaila Noureen, and Immad Zulfiqar

Particulate matter, particularly PM₂.₅ continues to be a critical determinant of the global disease burden, underscoring the scale of exposure and the multifaceted processes through which it affects human health. In Pakistan, particularly the Punjab province, fast-growing urbanization and industrialization has dramatically intensified PM₂.₅ load, with many metropolitan cities consistently surpassing WHO air quality guidelines. This study aims to examine the persuasive relationship between PM₂.₅ exposure and associated health impacts across five major cities including Lahore, Faisalabad, Rawalpindi, Multan and Rahim Yar Khan. Integrating NASA MERRA-2 satellite derived PM₂.₅ data (January 2015–July 2025) with hospital health records, this study performed a time series epidemiological analysis to quantify the impact of PM₂.₅ on morbidity and mortality from respiratory, cardiovascular, and allergic diseases across multiple urban centers. Demographic factors including gender and age group have also been considered for evaluating vulnerable populations. Results indicate a positive correlation between escalating PM₂.₅ concentrations and respiratory (r = 0.33), cardiovascular (r = 0.46), and allergies (r = 0.44) diseases, with pediatric and older being more susceptible. Although significance dip in PM₂.₅ levels was observed during COVID-19 period, the disease incidence continued to surge with a little decline during lockdown months displaying just a short-term fluctuation. Findings underscore the pressing need for consolidated, data-driven approaches including strict air quality regulations, healthcare system strengthening and sustainable city development strategies. Ultimately, this study will contribute to the current understanding of environmental and public health, providing a foundation for future research and policy interventions aimed at safeguarding populations from the health impacts of particulate matter.

How to cite: Hina, S., Sana, A., Adrees, M., Noureen, S., and Zulfiqar, I.: Air Pollution and Public Health: A Multi-City Assessment of PM₂.₅ Exposure in Punjab, Pakistan, EGU General Assembly 2026, Vienna, Austria, 3–8 May 2026, EGU26-836, https://doi.org/10.5194/egusphere-egu26-836, 2026.

Urban environmental degradation in India’s metropolitan centres poses escalating challenges for public health, economic productivity, and sustainable urban governance. Among these regions, the National Capital Region (NCR) especially Delhi continues to be one of the most environmentally stressed urban agglomerations, experiencing chronic air pollution, deteriorating water quality. Although several domain-specific assessments exist, there remains a critical gap in developing an integrated and empirically grounded framework that jointly evaluates air, water, and captures their combined influence on urban environmental quality. This study fills that gap by constructing the Composite Environmental Quality Index – Air, Water (CEQI-AW) for Delhi, using 2022–23 as the base year (Index = 100). The index facilitates both monthly and annual comparisons of environmental quality from 2022–23 onward, drawing on publicly available real-time monitoring networks, administrative datasets, and spatial environmental information.
The framework consists of three pillars: Air Quality Index (AQI), Water Quality Index (WQI). Monthly data from April 2022 to March 2023 are used to construct the base-year composite index, and subsequent months up to the latest available period are incorporated for temporal trend analysis. Air quality indicators are sourced from Central Pollution Control Board (CPCB) and Delhi Pollution Control Committee (DPCC) continuous monitoring stations and include concentrations of PM₂.₅, PM₁₀, NO₂, SO₂, CO, and O₃. Water quality parameters are compiled from CPCB’s Yamuna monitoring network, Delhi Jal Board treatment plant reports, and Central Ground Water Board (CGWB) groundwater assessments, covering indicators such as BOD, COD, DO, TDS, fecal coliform, nitrate, fluoride, and heavy metals. 
The study employs a hybrid weighting method: equal weights are assigned across the two pillars for transparency, and within each pillar, a simple geometric mean is used to construct item-level indices. The CEQI-AW is then computed for each year from the base year (2022–23) through 2024–25, enabling an assessment of inter-annual and seasonal variation.
Preliminary findings reveal that while some districts in Delhi show modest improvements in air quality during targeted winter interventions, environmental quality remains under significant strain. The year-on-year comparison for winter season (especially November, December and January) shows the highest variation in air quality in Delhi, driven by severe winter smog episodes and meteorological stagnation. Water quality exhibits distinct seasonal fluctuations, with the summer months (May and June) showing peak contamination until dilution and runoff effects during the monsoon lead to temporary improvement. Overall, the composite index exhibits an upward but uneven trajectory, heavily influenced by air quality volatility. The results highlight the need for season-specific policy interventions—winter mitigation for air pollution, summer strategies for water contamination, to effectively address environmental challenges in Delhi.

How to cite: Malick, B. K.: A Composite Environmental Quality Index: An Analysis of Air, Water (CEQI-AW) in Delhi from 2022 to 2025, EGU General Assembly 2026, Vienna, Austria, 3–8 May 2026, EGU26-909, https://doi.org/10.5194/egusphere-egu26-909, 2026.

EGU26-974 | ECS | PICO | AS3.28

Assessment of black carbon concentrations, emission sources and health risks in two cities of Peninsular Malaysia  

Nurzawani Binti Md Sofwan, Nur Faseeha Suhaimi, Hartini Mahidin, Zulfa Hanan Ash'aari, Noor Zaitun Yahaya, and Bálint Alföldy

Black carbon (BC) is known as a pollutant that poses serious risks to both the climate system and human health. The Southeast Asia region relies heavily on fossil fuels, and experiences frequent biomass burning that contributes significantly to BC emissions, yet research on BC measurements remains limited. To address these knowledge gaps, the present study aims to investigate the BC levels at two sites in Peninsular Malaysia, apportion the potential sources, and estimate the associated human health risks from BC exposure. The measurement campaign was conducted from August to November 2024 at Putrajaya and April to May 2025 at Johan Setia, Klang respectively. Real-time measurements of aerosol light absorption were continuously obtained using a AE33 aethalometer. The measured mean equivalent BC mass concentrations of 4.61 ± 1.75 g m-3 and 2.53 ± 0.75 g m-3 were observed in Johan Setia and Putrajaya, respectively. Johan Setia records higher BC concentrations due to multiple local emission sources from traffic, industries, residential, agricultural and commercial activities. BC from fossil fuel (BCff) dominated both sampling sites throughout the study period with several irregular localized peak episodes. Daily variations in BC concentrations reflect the critical contributions of traffic emissions during weekdays. A well-planned township like Putrajaya exhibits lower BC emissions, with consistent patterns indicating that light-duty vehicles are the primary source, reflecting its role as a government administrative and residential township. Elevated BCff were observed from midnight to early morning at Johan Setia, driven by emissions from nearby industrial facilities, power stations and heavy-duty vehicles operate at night because the position of the site lies along the main route connecting Klang to Port Klang, one of Malaysia’s busiest seaports. In addition, increasing trends of BC concentrations from biomass burning (BCbb) were prevalent from late evening until night at Johan Setia, likely due to the burning of agricultural residues by the residents. The BC index at both sites shows a dominant of the satisfactory category, with BC concentrations ranging from 1 to 3 g m-3. Health risk assessments revealed that the calculated chronic hazard quotient (HQ) for BC across the exposed groups was less than 1 (HQ < 1). Both sampling sites recorded cancer risk values exceeding the acceptable value of 1 x 10⁻⁶. This work provides a foundation of understanding BC pollution in the tropical region of Malaysia. Recognising the implications of BC on climate and health, Malaysia should establish BC monitoring efforts and give sufficient attention to evidence-based policies to reduce black carbon emissions.

How to cite: Binti Md Sofwan, N., Suhaimi, N. F., Mahidin, H., Ash'aari, Z. H., Yahaya, N. Z., and Alföldy, B.: Assessment of black carbon concentrations, emission sources and health risks in two cities of Peninsular Malaysia , EGU General Assembly 2026, Vienna, Austria, 3–8 May 2026, EGU26-974, https://doi.org/10.5194/egusphere-egu26-974, 2026.

Problem considered: Air pollution is a critical environmental health issue with profound impacts on vulnerable populations. Understanding the impact of ambient air pollution on adverse health outcomes and death rate is crucial for informing evidence-based interventions and policy measures to address this critical issue.

Methods: We analyzed secondary data on ambient air pollutants particulate matter (PM2.5 and PM10), nitrogen dioxide (NO2), sulphur dioxide (SO2) and ozone (O3) levels from 2018 to 2023 across all eight districts in New Delhi. Data were obtained from the Central Pollution Control Board (CPCB) and Delhi government databases. Health outcome indicators, including overall mortality rate, were assessed for associations with ambient air pollutant levels.

 Results: Air pollutant levels across all districts of New Delhi were found to be highest during 2018–2019, followed by a decline in 2019–2021, likely due to the COVID-19 pandemic and related restrictions. Additionally, all pollutants showed positive associations with adverse health outcomes (mortality indices), with particularly strong links between SO2 and ozone in Delhi.

Conclusion: Our findings highlight a concerning association between ambient air pollution and adverse health outcomes in New Delhi. However, the findings should be interpreted with caution, as multiple confounding factors such as socioeconomic status, lifestyle, and healthcare access may also influence outcomes. More large-scale and long-term studies are needed to minimize these limitations and establish stronger causal relationships.

Keywords: Air Pollution, Particulate Matter, Death Rate, Mortality Indices

How to cite: Arora, T., Gautam, R., and Vasudevan, S.: Analysis trends of Environment pollutants (Ambient Air Pollution) and its adverse health effect in New Delhi over a period of 2018-2023, EGU General Assembly 2026, Vienna, Austria, 3–8 May 2026, EGU26-1556, https://doi.org/10.5194/egusphere-egu26-1556, 2026.

Urban air pollution represents a major environmental and public health issue, particularly in large metropolitan areas. This study presents an analysis of black carbon (BC) and particulate matter with an aerodynamic diameter smaller than 2.5 µm (PM2.5) concentrations in Bucharest, Romania, over the period 2022–2025, using a combination of on-site and mobile measurements. Field campaigns considered both short-term (about 10 days) and longer-term measurements, up to three months. The short-term field campaign, was carried out using a mobile laboratory that covered more than 1,500 km in August 2024. The city area was divided into three distinct zones—north-west, north-east, and south—with a specific route defined for each zone. Each route was travelled four times: once during night-time and three times during daytime on consecutive days. This data acquisition strategy ensured adequate statistical consistency and enabled the capture of both temporal and spatial variations in atmospheric BC and PM2.5 concentrations. The temporal variability of atmospheric pollutants was analysed based on data gathered in the long-term campaign performed at a location situated in the western part of the city, an area with high traffic. The results reveal significant spatial-temporal variability in BC and PM2.5 levels, strongly influenced by road traffic intensity, urban land-use characteristics, and time of day. Areas that exhibit elevated fine particulate pollution were identified within Bucharest. As an example, in 2022, close to the high traffic western area with traffic noise levels ranging from 40 dB (night-time) to about 75 dB (daytime), a mean PM2.5 concentration of about 35 µg m⁻³, and mean black carbon (BC) concentration of 11.38 ng m⁻³ in the ultrafine particles were measured. No significant changes were detected in PM2.5 and BC levels over time at that location, indicating a significant people chronic exposure. These elevated long-term concentrations support the role of road traffic as a major urban stressor by the combined exposure to air pollution and noise, both relevant for public health risk. Each field campaign was also meteorological characterized, in order to better understand the variations of PM2.5 and BC concentrations. During the mobile measurement campaign in summer 2024, the Bucharest area was characterized by a moderately deep atmospheric boundary layer (mean height ~850 m), favouring partial vertical mixing, while prevailing weak-to-moderate south-easterly winds (mean speed 2.6 m s⁻¹) suggest limited horizontal ventilation. Air temperatures ranging between 22 and 32 °C, combined with relatively low to moderate relative humidity (35–55%), indicate warm and generally dry conditions, conducive to thermal stress and potentially reduced dispersion of urban pollutants, especially during night-time stable periods. This is a typical meteorological condition for Bucharest summers.

Present study highlights the importance of integrating fixed and mobile measurements for a detailed assessment of urban atmospheric composition to further assess the population exposure to harmful atmospheric constituents, and provides relevant information to support air quality management strategies in Bucharest.

How to cite: Tudor, A., Scarlat, A., and Iorga, G.: Anthropogenic Impact on Atmospheric Composition over Bucharest, Romania: Insights from Multiple Field Campaigns (2022–2025), EGU General Assembly 2026, Vienna, Austria, 3–8 May 2026, EGU26-4997, https://doi.org/10.5194/egusphere-egu26-4997, 2026.

EGU26-6037 | ECS | PICO | AS3.28

Fine particulate matter, nitrogen dioxide, and Tdap vaccine antibody levels in Mexican children 

Mike Z. He, Maayan Yitshak-Sade, Itai Kloog, Allan C. Just, Corina Lesseur, Sally A. Quataert, Martha M. Téllez-Rojo, Libni Torres, Héctor Lamadrid, M. Cecilia Berin, Robert O. Wright, Todd A. Jusko, and Elena Colicino

Objective: Existing research suggests that vaccine antibody response can be attenuated by environmental factors, but limited studies have assessed the association with air pollutants. We hypothesize that air pollution exposure early in life can alter immune response in later childhood.

Methods: We obtained serum antibody levels of tetanus, diphtheria, and pertussis measured in vaccinated children ages 4-6 years from the Programming Research in Obesity, Growth, Environment and Social Stressors (PROGRESS) cohort in Mexico. We constructed 1-km2 fine particulate matter (PM2.5) and nitrogen dioxide (NO2) models over the Mexico City Metropolitan Area, which we geocoded to participants’ home addresses. We employed linear mixed-effects models to examine the association between early life exposure to PM2.5 and NO2, measured as averaged pollutants exposures in the first year of life, and log-transformed tetanus, diphtheria, and pertussis (Tdap) antibody levels in later childhood (ages 4-6). Models included random intercepts for participant and were adjusted for temperature, sex, child age at blood draw, maternal age at birth, BMI, and socioeconomic status.

Results: 299 children contributed to antibody levels at 4 years (n=287) and 6 years (n=12). We observed negative but imprecise associations with both pollutants. Per 1 µg/m3 increase in one-year postnatal PM2.5, Tdap antibody levels decreased by 3.47% (95%CI: -7.35, 0.57%), 3.37% (95%CI: -7.18, 0.60%), and 2.56% (95%CI: -6.93, 2.02%) respectively. Per 1 µg/m3 increase in one-year postnatal NO2, Tdap antibody levels decreased by 3.89% (95%CI: -7.22, -0.45%), 3.51% (95%CI: -6.81, -0.09%), and 1.93% (95%CI: -5.74, 2.04%) respectively.

Conclusion: We found preliminary evidence suggesting decreased antibody levels in response to postnatal PM2.5 and NO2 exposure, though not all results were significant. Additional work is necessary to explore associations for different types of routine vaccinations and at different critical time windows.

How to cite: He, M. Z., Yitshak-Sade, M., Kloog, I., Just, A. C., Lesseur, C., Quataert, S. A., Téllez-Rojo, M. M., Torres, L., Lamadrid, H., Berin, M. C., Wright, R. O., Jusko, T. A., and Colicino, E.: Fine particulate matter, nitrogen dioxide, and Tdap vaccine antibody levels in Mexican children, EGU General Assembly 2026, Vienna, Austria, 3–8 May 2026, EGU26-6037, https://doi.org/10.5194/egusphere-egu26-6037, 2026.

EGU26-10658 | PICO | AS3.28

Particulate Matter Pollution Episodes in a Multisource Coastal Environment: Insights from Single-Particle Analysis and atmospheric dynamic 

Alexandre Deguine, Andebo Waza, Soulemane Ngagine, Pascal Flament, Patrick Augustin, Fabrice Cazier, Dorothée Dewaele, Elsa Dieudonne, Hervé Delbarre, Marc Fourmentin, and Karine Deboudt

Coastal industrial and urban regions in Europe host a substantial fraction of the population and economic activity, yet they remain highly vulnerable to particulate matter (PM) pollution episodes. Despite the implementation of air quality regulations, exceedances of PM10 and PM2.5 concentration thresholds persist, driven by the coexistence of dense emission sources and complex coastal atmospheric dynamics. In this study, pollution days (PDs) were analyzed over a four-year period (2018–2021) in the Greater Dunkirk Area, a coastal region influenced by multiple anthropogenic and marine sources. Spatial analyses indicate that PM2.5 pollution episodes are predominantly associated with regionally extended plumes, whereas PM10 episodes are more frequently linked to locally confined plumes, exhibiting marked seasonal variability. Detailed aerosol chemical characterization was conducted using SEM–EDX analysis on more than 23,000 individual particles collected during a one-year field campaign in 2021. The results reveal a highly heterogeneous particle population, largely dominated by sea-salt and carbonaceous aerosols, with fine particles enriched in secondary sulfur-containing species and coarse particles characterized by calcium-rich components. The particle mixing state index (χ) spans a wide range (0.5–0.9), reflecting a continuum between externally and internally mixed aerosols, strongly modulated by atmospheric ageing processes, pollutant recirculation, and turbulent mixing. Our findings demonstrate that neither local wind direction nor plume spatial extent alone adequately explains the observed chemical variability. Instead, the evolution of aerosol composition and mixing state is governed by fine-scale meteorological processes, including sea-breeze circulations and recirculation events, which critically influence pollutant dispersion and ageing. These results underscore the importance of integrating high-resolution single-particle chemistry with urban-scale meteorological dynamics in air quality assessments, particularly in complex coastal environments subject to multiple emission sources.

How to cite: Deguine, A., Waza, A., Ngagine, S., Flament, P., Augustin, P., Cazier, F., Dewaele, D., Dieudonne, E., Delbarre, H., Fourmentin, M., and Deboudt, K.: Particulate Matter Pollution Episodes in a Multisource Coastal Environment: Insights from Single-Particle Analysis and atmospheric dynamic, EGU General Assembly 2026, Vienna, Austria, 3–8 May 2026, EGU26-10658, https://doi.org/10.5194/egusphere-egu26-10658, 2026.

EGU26-20727 | ECS | PICO | AS3.28

VOCs Over Himalayan Glaciers: Speciation, Sources and Comparison with Other Glaciers 

Aishwaryashri Tamrakar and Shamsh Pervez

This study presents the concentration and speciation of VOCs over three high-altitude Himalayan glacier regions {Western Himalayan region (WHR; Thajiwas glacier, 2799 m asl), central Himalayan region (CHR; Gomukh glacier, 3415m asl) and eastern Himalayan region (EHR; Zemu glacier, 2700 m asl)} along with their comparison with those reported over Arctic and Antarctic glacier regions. 28 VOCs were determined in ambient air samples, collected in sorbent tubes using a ACTI -VOC low flow pump sampler, throughout the summer and winter periods of 2019-2020, followed by analysis using thermal desorption gas-chromatography mass spectrometry (TD-GC-MS/MS). The average sums of 28 VOCs were found to be 161.58 µg.m-3 at CHR, 120.73 µg.m-3 at EHR and 94.33 µg.m-3 at WHR. These values are found to be 4 to 40 fold and 0.8 to 2 fold higher than those reported over Arctic and Antarctic glaciers. On comparing these findings with those reported for an urban-industrial location of India (Raipur, Chhattisgarh) with similar period of measurement campaigns, a 2-fold lower concentration is observed over Himalayan glaciers. The results, also, indicated that CHR site has higher concentration of VOCs compared to other two sites WHR and EHR. Evaluation of seasonal variation pattern across the sites and source characterization by PMF5.0 were also made. UNMIX output of three-factor solution that explain >90% ambient VOC’s measurement is found to be similar to those of three source-factor solution from PMF5.0. The results revealed that three VOCs source types were: vehicle engine exhausts, biomass burning and coal combustion and biogenic emissions. The findings have important implications for appropriately assessing the effects of VOCs on glacial melting in high-altitude Himalayan glacier regions.

Keywords: Ambient VOCs, Seasonal variability; Himalayan glacier region, Source identification

How to cite: Tamrakar, A. and Pervez, S.: VOCs Over Himalayan Glaciers: Speciation, Sources and Comparison with Other Glaciers, EGU General Assembly 2026, Vienna, Austria, 3–8 May 2026, EGU26-20727, https://doi.org/10.5194/egusphere-egu26-20727, 2026.

EGU26-22201 | PICO | AS3.28

Spatiotemporal Assessment of Black Carbon in the Urban Environment of Dun Valley, Himalayan Foothills, India 

Chhavi Pant Pandey, Aman Shrivas, and Abhishek Thakur

Rapid urbanisation and rising vehicular emissions have become one of the major causes of declining air quality in the Himalayan foothill regions/cities. Black Carbon (BC), a short-lived climate pollutant primarily emitted due to the incomplete combustion of fossil fuels, biomass fuels, and open burning, is not only associated with atmospheric warming but also with adverse human health. In the present study, the spatial distribution of BC was assessed in Dehradun, the capital city of Uttarakhand state, India. Dehradun resides in the valley sandwiched between the Shiwalik range to the south and the Lesser Himalayan range to the north.  In the present study, the integration of a comprehensive mobile and fixed-site monitoring approach has been applied to the assessment of BC in the region during 2022–2023. The microAeth MA350 was used for mobile monitoring, while the Aethalometer AE33 was used for fixed-site monitoring. Further, personal exposure to BC was evaluated to assess the spatial-temporal variation of human exposure to it along four different routes.  The selected routes represented different microenvironments, including urban regions with heavy traffic, industrial regions, and green corridors.  A total of ~100 hours of mobile monitoring was conducted. The mean BC concentration of 3.78 ± 3.01 µg/m³ at the fixed site was much lower than the mean BC concentration along the mobile-monitored routes, which varied from 18.09 ± 15.51 µg/m³ to 27.22 ± 17.90 µg/m³.  For the determination of individual inhalation doses, three different respiratory rates (RRs) were used, indicating diverse commuting intensities in the region, viz. passive travel (0.47 m³/hr), walking (0.63 m³/hr), and cycling/motorcycling (0.70 m³/hr). It was realised that at the lowest RR, the total inhalation doses were estimated within the range of 10.08 µg to 14.06 µg, while at the highest RR, the inhalation doses ranged from 15.01 µg to 20.94 µg. However, during moderate activity levels, inhalation doses remained within the range of 13.51-18.84 µg. Whereas higher RR results in increased air intake, the inhalation dose of pollutants, such as BC, also increases with greater physical exertion. This pattern is evident for all routes, reinforcing the idea that physical exertion plays a crucial role in determining personal exposure levels. Individuals engaged in more physically demanding commuting modes, such as cycling or motorcycling, inhale more air per hour, which increases their intake of airborne pollutants. The inhalation dose shows a consistent increase with respiratory rate across all chosen routes, thereby indicating the impact of physical activity on pollutant intake. The preliminary results of this unique regional study emphasise the need to consider mobility patterns and the choice of path when determining pollutant exposure. This study also highlights the uncertainty and challenges associated with the estimation of BC concentrations within our environment. The present study is an initiative that may help in understanding and managing the urban air quality, thereby suggesting the importance of sustainable transportation strategies and public awareness initiatives aimed at reducing the health risks within the valley.

How to cite: Pandey, C. P., Shrivas, A., and Thakur, A.: Spatiotemporal Assessment of Black Carbon in the Urban Environment of Dun Valley, Himalayan Foothills, India, EGU General Assembly 2026, Vienna, Austria, 3–8 May 2026, EGU26-22201, https://doi.org/10.5194/egusphere-egu26-22201, 2026.

EGU26-1209 | ECS | Orals | AS3.29

Meteorology Induced New Particle Formation over India - A modelling approach 

Bala Naga Manikanta Meda, Chandan Sarangi, Mathew Sebastian, Oishi Chakraborthy, Rakesh K Hooda, Antti-P Hyvarinen, Paul Cherian, Tuija Jokinen, and Vijay P Kanawade

Atmospheric particles strongly influence air quality, climate, and human health, and understanding how new particles form in the atmosphere is essential for improving predictions of these impacts. New particle formation (NPF) is one of the key processes that creates fresh aerosol particles, but its behaviour varies widely across regions and seasons. Winter conditions, with shallow boundary layers and high aerosol loading, usually suppress NPF. However, in Hyderabad, India, we observed frequent winter NPF events that occur despite these unfavourable conditions occurring on about 30% of the days. This study combines long-term particle size distribution measurements with meteorological reanalysis and high-resolution WRF-Chem simulations to investigate the meteorological drivers behind these winter events.

Particle number size distributions (10–600 nm) were collected at the University of Hyderabad between 2019 and 2022. Large-scale atmospheric conditions were analysed using ERA-5 and MERRA-2 reanalysis, and a detailed WRF-Chem simulation was conducted for a one-week period in February 2020, during which three consecutive NPF events occurred. The reanalysis data show that a persistent high-pressure system developed during these days, producing calm winds, stable conditions, and strong vertical subsidence. Under these conditions, we observed both high aerosol loading and high levels of precursor gases, which helped support NPF even during winter pollution episodes.

WRF-Chem results reveal elevated SO2 and PM2.5 concentrations up to 2–3 km altitude on NPF event days. Despite high PM2.5, the SO2/PM2.5 ratio was much higher compared to non-event days, indicating a more favourable chemical environment for nucleation. Importantly, the simulations also show that these favourable meteorological and chemical conditions extend over a large spatial region around Hyderabad covering around 500 Kms, suggesting that winter NPF is not only a local phenomenon but part of a wider regional process. Overall, the findings highlight that winter NPF in Hyderabad is strongly controlled by high-pressure-driven meteorology, vertical subsidence, enhanced precursor availability, and large-scale regional influence. These results improve our understanding of particle formation mechanisms in polluted urban environments.


How to cite: Meda, B. N. M., Sarangi, C., Sebastian, M., Chakraborthy, O., Hooda, R. K., Hyvarinen, A.-P., Cherian, P., Jokinen, T., and Kanawade, V. P.: Meteorology Induced New Particle Formation over India - A modelling approach, EGU General Assembly 2026, Vienna, Austria, 3–8 May 2026, EGU26-1209, https://doi.org/10.5194/egusphere-egu26-1209, 2026.

EGU26-1243 | ECS | Orals | AS3.29

Optimising crop-residue burning PM2.5 emissions over the Indo-Gangetic Plain using inverse modelling 

Akanksha Arora, Harish Gadhavi, and Prabir K Patra

The Indo-Gangetic Plain (IGP)—one of the most polluted regions globally—experiences intense seasonal crop-residue burning, yet its contribution to ambient PM₂.₅ remains poorly quantified. Existing studies report a wide range of CRB influence (7%-78%) because satellites miss many short-lived or low-intensity fires, chemical signatures of CRB overlap with those from residential biomass burning, and bottom-up inventories lack reliable, region-specific activity data for agricultural burning. These issues highlight the need for a more rigorous, observation-driven framework to isolate and optimise CRB-related emissions robustly. To identify days when receptor-site PM2.5 was influenced by transported emissions from open biomass burning (CRB), satellite fire counts (MODIS and VIIRS) and Lagrangian particle dispersion modelling (FLEXPART) were used. For each day, weighted fire counts (WFC) were calculated by overlapping satellite fire hotspots with FLEXPART back-trajectory sensitivities, assigning greater weight to fires located within high-sensitivity regions of the footprint. The days were then ranked according to their WFC values. Based on this ranking, the study period was partitioned into biomass-burning period (23 October–16 November) and non-biomass-burning period (4–27 September; 7–11 October). PM2.5 emissions for each period were optimised using the analytical inverse modelling system FLEXINVERT, constrained by surface observations and ECLIPSE v6b as the prior emission inventory. The observational constraint was provided by a 32-station monitoring network distributed across Punjab, Haryana, Delhi NCR (National Capital Region), and western Uttar Pradesh states in the northwestern IGP. The results show that during the non-biomass-burning period, posterior emissions showed a ~25% regional increase, ndicating that anthropogenic non-biomass-burning sources—such as brick kilns, agro-processing facilities, small food-processing units, sugar mills, and agricultural energy use—are systematically underestimated in current global emission inventories. During the biomass-burning period, posterior PM2.5 emission fluxes increased up to ~300% relative to the prior. The strongest increments occurred over central Punjab, southern Haryana and the India-Pakistan border region, coinciding with known CRB hotspots. In contrast, Delhi NCR exhibited negative increments, suggesting that prior inventories overestimated emissions over Delhi NCR region while underestimating emissions in upwind agricultural states. By comparing biomass-burning and non-biomass-burning periods, CRB-related emission enhancements in posterior fluxes reached ~250% in several Punjab and Haryana grids, whereas Delhi NCR showed only a ~15% increase. The analysis is further extended to 2023 and 2024 which revealed that although satellite fire counts decreased, posterior optimized fluxes increased, suggesting that satellite fire detections alone underrepresent true CRB activity. The study further quantifies the total amount of crop residue burnt and the effective emission factor per fire to reconcile modelled and observed PM2.5. This work provides the observational constrained regional optimisation of CRB-related PM2.5 emissions over the IGP, offering new insight into the quantification, spatial distribution, and regional influence of CRB emissions in India. These improved CRB emission estimates can provide insight for air-quality mitigation and agricultural-burning policy, and provide an input for aerosol-climate modelling studies.

How to cite: Arora, A., Gadhavi, H., and K Patra, P.: Optimising crop-residue burning PM2.5 emissions over the Indo-Gangetic Plain using inverse modelling, EGU General Assembly 2026, Vienna, Austria, 3–8 May 2026, EGU26-1243, https://doi.org/10.5194/egusphere-egu26-1243, 2026.

In this work we are expanding upon our previous statistical modeling methodology for reconstruction of daily courses of SO42-, NO3- and NH4+ concentrations in cumulative precipitation samples (Hunova et al 2022, Hunova et al 2024). Here, we investigate relationship between the wet concentrations and concentrations of gaseous pollutants (NOx, SO2, NH3) in a detailed way from several viewpoints using modern and highly flexible statistical approach based on GAM (Generalzied Additive Model) with complexity-penalized spline components. This framework allows for decomposition of influences upon wet concentration into several easily interpretable components as well as for the nonlinearity dictated by basic physical consideration (such as saturation phenomena). The GAM model is formulated in such a way that it deals appropriately with the time-aggregated collections whose length changed historically (from 7 days to 1 day). Since it is quite obvious that the wet concentration in a spatial point sample is related to the gas concentration in a much broader area, we work not only with gaseous concentrations measured at the wet-sample-collection location, but also with numerical air pollution model (CAMx) aerial average estimates in our simultaneous models. Here, it is not clear a priori, how large neighborhood we should take for the most informative CAMx output spatial average and similarly whether it is more natural to take CAMx concentrations at surface or in 50 m. Therefore, we assess both of these features in a formalized way (via AIC model comparison).  The modelling approach is illustrated at four professional Czech Hydrometeorological Institute (CHMI) stations (ALIB, JKOS, PPRM, TBKR) with long-term data (2016-2021). There, it turns out that both local measurement and relatively large area CAMx gaseous concentration averages influence water sample ion concentrations significantly. Hight and spatial aggregation differs for different ions. Further analysis using time-varying (TVAR) framework then shows that the influence of the concentration measurements is highly seasonal (local slope changes smoothly but very substantially, favoring spring to summer influences). The work has been done in cooperation with the CHMI and is related to the Technology Agency Czech Republic project ARAMIS, SS02030031).


References:
Hunova,I.-Brabec,M.-Maly,M. (2024): Major ions in Central European precipitation – insight into changes in NO3-/SO42-, NH4+/NO3- and NH4+/SO42- ratios over the last four decades. Chemosphere 349 (2024) 140986
Hunova,I.-Brabec,M.-Maly,M.-Skachova,H. (2022): Reconstruction of daily courses of SO42-, NO3-, NH4+ concentrations in precipitation from cumulative samples. Atmosphere 2022, 13, 1049. https://doi.org/10.3390/atmos13071049

How to cite: Brabec, M., Hunova, I., and Maly, M.: Time-varying relationship between SO42-, NO3-, NH4+ concentrations in cumulative precipitation samples and gaseous pollutants, EGU General Assembly 2026, Vienna, Austria, 3–8 May 2026, EGU26-1950, https://doi.org/10.5194/egusphere-egu26-1950, 2026.

EGU26-3611 | Orals | AS3.29

Air Quality Modeling for the Baltimore-Washington Area: Rigorous Science for Effective Policy 

Russell Dickerson, Dale Allen, Timothy Canty, Hao He, Allison Ring, and Joel Dreessen

After decades of poor air quality (AQ), Baltimore, MD, and its neighbor  Washington, DC are within striking distance of attaining the USEPA's standards for criteria pollutants including ozone.  This results from the implementation of policies based on the best available science and on forecasts of air quality using the CMAQ model.  Community-scale problems with black carbon (BC), coarse particles, and ultrafine particles (UFP) have received much less scrutiny and persist.  We will discuss how measurements have helped constrain and improve chemical transport models and how effective communication with policy-makers has led to targeted emissions reductions.  Examples include consideration of subgrid-scale sea and bay breezes that recirculate pollutants on hot summer days, how reservoirs such as organic nitrates extend the effective lifetime of NOx, and how aerosols and clouds alter photolysis rates.  Combining observations and models has also helped quantify which, when, and where VOC controls can effectively reduce the rate of ozone formation in a regime, on average NOx-limited.  Despite dramatic region-wide improvements in AQ, health and environmental problems continue on the community scale.  These issues present new challenges for model resolution, and measurement coverage.  We will discuss how new measurements and modeling capabilities attack the problems of over-nutrification of surface waters, and health and environmental justice impacts of short-lived pollutants BC, coal dust, and UFP.

How to cite: Dickerson, R., Allen, D., Canty, T., He, H., Ring, A., and Dreessen, J.: Air Quality Modeling for the Baltimore-Washington Area: Rigorous Science for Effective Policy, EGU General Assembly 2026, Vienna, Austria, 3–8 May 2026, EGU26-3611, https://doi.org/10.5194/egusphere-egu26-3611, 2026.

EGU26-3698 | ECS | Orals | AS3.29

A Performance Analysis of Air Quality Prediction using the Korean Air Chemistry Modeling System version 2.0 (K_ACheMS v2.0) 

Nara Youn, Jinhyeok Yu, Kyung Man Han, Jaehee Kim, and Chul Han Song

Accurate air quality forecasting is essential for issuing early warnings of high-concentration air pollution episodes, mitigating their adverse health impacts. This study evaluates the performance of the Korean Air Chemistry Modeling System version 2.0 (K_ACheMS v2.0), an integrated system designed to enhance the predictability of air pollutant concentrations in South Korea. The K_ACheMS v2.0 incorporates (i) a modified Weather Research and Forecasting (WRF) version 4.1.5 with machine learning (ML) based wind-speed corrections; (ii) GIST Multiscale Air Quality (GMAQ) v1.0, utilizing an updated Statewide Air Pollution Research Center 07 (SAPRC07TC) chemical mechanism; and (iii) a three-dimensional variational (3D-VAR) data assimilation method to optimize the chemical initial conditions. The 5-day PM2.5 predictability of the K_ACheMS v2.0 was evaluated against ground-based PM2.5 observations in South Korea for 2024. Furthermore, we conducted an intercomparison of the K_ACheMS v2.0 against two global real-time air quality prediction systems, the Copernicus Atmosphere Monitoring Service (CAMS) from ECMWF and the Goddard Earth Observing System Composition Forecast (GEOS-CF) from NASA GMAO. We further analyzed the chemical composition of PM2.5 to identify the key drivers of performance variability among these systems, using observations measured at two supersites in South Korea during the Airborne and Satellite Investigation of Asian Air Quality (ASIA-AQ) campaign. Our findings demonstrate that K_ACheMS v2.0 exhibits robust predictive performance for PM2.5 and its chemical components compared to the global models, achieving an Index of Agreement (IOA) of 0.71, which outperforms CAMS (0.66) and GEOS-CF (0.46).

How to cite: Youn, N., Yu, J., Han, K. M., Kim, J., and Song, C. H.: A Performance Analysis of Air Quality Prediction using the Korean Air Chemistry Modeling System version 2.0 (K_ACheMS v2.0), EGU General Assembly 2026, Vienna, Austria, 3–8 May 2026, EGU26-3698, https://doi.org/10.5194/egusphere-egu26-3698, 2026.

EGU26-3714 | ECS | Posters on site | AS3.29

Performance Evaluation of PM2.5 Forecasting Using Multiscale WRF–CMAQ over East Asia 

Dae-Ryun Choi, JeongBeom Lee, SeungHee Han, and JinGoo Kang

High PM2.5 concentrations can be detrimental to human and ecosystem health, as long-term exposure is associated with the aggravation of asthma and, in some cases, increased mortality. Chemical transport models (CTMs) have long been used to complement observation-based understanding of atmospheric conditions. These models are invaluable tools for scientists, as they provide spatially and temporally comprehensive representations of atmospheric states. The Community Multiscale Air Quality (CMAQ) model was developed by the U.S. Environmental Protection Agency (US EPA) and has been extensively used to investigate complex air quality issues from regional to hemispheric scales.

In this study, the nested-down approach of chemical transport modeling is employed to analyze the target region using finer grid resolutions. However, the nested-down approach may introduce unrealistic inflow and outflow of chemical species across the boundary regions. East Asia includes China, South Korea, and Japan, and China is one of the largest emitters globally. South Korea, which is the primary focus of this study, is located downwind of China; therefore, it is essential to represent boundary influences as realistically as possible.

In this work, East Asia was configured as a single domain with a horizontal resolution of 9 km, and an additional nested-down configuration with 27 km to 9 km horizontal resolution was constructed. Furthermore, two vertical configurations were applied: 22 vertical layers with a model top at 200 hPa and 29 vertical layers with a model top at 50 hPa. CMAQ simulations were conducted using an offline approach, in which meteorological and air quality models were run separately. The Weather Research and Forecasting (WRF, version 4.4.2) model and CMAQ (version 5.3.1) were used, with meteorological initial and boundary conditions provided by the Korea Integrated Model (KIM).

The representation of modeled meteorological variables—including near-surface temperature, humidity, wind speed, and wind direction—generally improved with increasing horizontal resolution across all cases examined in this study. Most variables showed the largest improvements when the grid spacing was reduced from 27 km to 9 km. PM2.5 statistical performance was best at the 9 km resolution, while little difference in model performance was observed with respect to vertical resolution.

Acknowledgment

"This research was supported by Particulate Matter Management Speciallized Graduate Program throu the Korea Environmental Industry & Technology Institute(KEITI) funded by the Ministry of Environment(MOE)"

How to cite: Choi, D.-R., Lee, J., Han, S., and Kang, J.: Performance Evaluation of PM2.5 Forecasting Using Multiscale WRF–CMAQ over East Asia, EGU General Assembly 2026, Vienna, Austria, 3–8 May 2026, EGU26-3714, https://doi.org/10.5194/egusphere-egu26-3714, 2026.

EGU26-4149 | Posters on site | AS3.29

Assessing the added value of high-resolution PM2.5 mapping for population exposure estimates in Seoul, South Korea 

Kyung-Hui Wang, Seung-Hee Han, Kwon Jang, and Hui-Young Yun

Accurate representation of fine particulate matter (PM2.5) at urban scales remains a major challenge in air pollution modelling, as conventional chemical transport models (CTMs) are typically operated at kilometer-scale resolution, which may smooth out strong local concentration gradients. Such limitations can influence not only the interpretation of model results but also the application of model-derived concentration fields to exposure-related analyses.

In this study, we assess the added value of high-resolution PM2.5 concentration fields for urban-scale air pollution modelling applications by comparing population-weighted exposure (PWE) estimates derived from multiple PM₂.₅ datasets. Daily PM2.5 fields from CMAQ simulations at 9 km resolution, observation-based gridded PM2.5, and a deep-learning-based super-resolution PM2.5 product at 100 m resolution were harmonized on a common analysis grid over the Seoul metropolitan area. These concentration fields were combined with 100 m gridded population data to calculate district-level PWEs for 25 administrative districts.

The results show that CMAQ reproduces the broad spatial patterns of PM2.5 across Seoul, while the high-resolution PM2.5 product reveals localized variability that is not captured at coarser resolution, particularly in densely populated districts. Comparison with observation-based PWEs indicates that exposure estimates derived from the high-resolution PM2.5 fields are often closer to observations than those based on the original CMAQ outputs, although the magnitude of improvement varies by district. Population distribution maps further highlight that spatial heterogeneity in population density plays a key role in shaping district-level exposure patterns.

Overall, this study demonstrates that enhancing the spatial representation of PM2.5 concentration fields can provide additional insight when air pollution model outputs are applied to population exposure assessment in urban environments. The proposed framework illustrates a practical approach for evaluating the application-level benefits of high-resolution air quality products within air pollution modelling studies.


Acknowledgement

This research was supported by the Korea National Institute of Health (KNIH) research project(Project No. 2024-ER0606-01) and the Particulate Matter Management Specialized Graduate Program through the Korea Environmental Industry & Technology Institute (KEITI), funded by the Ministry of Environment (MOE).

How to cite: Wang, K.-H., Han, S.-H., Jang, K., and Yun, H.-Y.: Assessing the added value of high-resolution PM2.5 mapping for population exposure estimates in Seoul, South Korea, EGU General Assembly 2026, Vienna, Austria, 3–8 May 2026, EGU26-4149, https://doi.org/10.5194/egusphere-egu26-4149, 2026.

EGU26-4153 | Posters on site | AS3.29

Hybrid Physical–Statistical Reanalysis of Urban PM and NO₂ for High-Resolution Exposure Assessment in Epidemiological Studies 

Hui-young Yun, Kyung-Hui Wang, Seung-Hee Han, and Kwon Jang

High-resolution exposure data for particulate matter (PM) are a critical determinant of accuracy in environmental epidemiology and urban health impact assessments. However, conventional chemical transport models (CTMs) are limited in representing fine-scale spatial variability of PM at the urban scale, while purely statistical approaches often struggle to maintain physical consistency and interpretability over long-term time series.

In this study, we developed a hybrid physical–statistical reanalysis framework to construct high-resolution exposure datasets for urban PM (PM₂.₅ and PM₁₀), with complementary treatment of traffic-related NO₂, suitable for national-scale health impact studies. The proposed framework consists of three main components. First, a regional CTM (CMAQ, 9 km resolution) was used to generate national-scale background concentrations of PM and gaseous pollutants, along with meteorological reanalysis data, for the period 2013–2024. Second, physically based dispersion patterns derived from the CALPUFF model were applied to redistribute primary PM concentrations to a 100 m grid through a hybrid downscaling approach, enhancing the representation of intra-urban spatial gradients. Third, to improve the temporal accuracy of traffic-sensitive NO₂, an auxiliary XGBoost-based error correction layer was implemented to reduce model uncertainty while preserving the underlying physical structure.

The framework was applied to seven major metropolitan areas and key industrial and traffic-influenced regions in South Korea. The results demonstrate that the hybrid reanalysis effectively captures urban PM concentration gradients and roadside pollution hotspots, yielding substantial improvements over conventional coarse-resolution CTM outputs. The final exposure datasets were integrated with national health cohort data, providing multiple exposure metrics including short-term lagged PM exposures and medium- to long-term moving-average indicators.

By combining high predictive performance with physical consistency, this hybrid approach offers a robust alternative to purely data-driven downscaling methods for PM exposure assessment. The resulting high-resolution PM exposure datasets enable precision environmental health studies at both community and individual levels and provide a scientific basis for evidence-based urban and national environmental health policy development.


Acknowledgement

This research was supported by the Korea National Institute of Health (KNIH) research project (Project No. 2024-ER0606-01) and the Particulate Matter Management Specialized Graduate Program through the Korea Environmental Industry & Technology Institute (KEITI), funded by the Ministry of Environment (MOE).


How to cite: Yun, H., Wang, K.-H., Han, S.-H., and Jang, K.: Hybrid Physical–Statistical Reanalysis of Urban PM and NO₂ for High-Resolution Exposure Assessment in Epidemiological Studies, EGU General Assembly 2026, Vienna, Austria, 3–8 May 2026, EGU26-4153, https://doi.org/10.5194/egusphere-egu26-4153, 2026.

EGU26-4162 | Posters on site | AS3.29

Evaluation of European Air Quality Simulations in 2019 Using the CMAQ–WRF Modeling System 

Efthimios Tagaris, Nektaria Traka, Ioannis Stergiou, Rafaella – Eleni P. Sotiropoulou, and Dimitris Kaskaoutis

Air pollution levels across Europe have declined significantly over the past two decades, largely due to targeted emission controls in the energy, industry, and transport sectors. Recent monitoring data (2023–2024) show that EU air quality standards are met at 99% of stations for PM2.5 and 98% for nitrogen dioxide (NO2). Despite this progress, air pollution remains the leading environmental health risk in Europe. The European Environment Agency (EEA) estimates that annual exposure to PM2.5, ozone (O3), and NO2 caused approximately 239,000, 70,000, and 48,000 premature deaths, respectively, in the EU–27.  Therefore, member States are required to prepare National Air Pollution Control Programmes (NAPCPs) and local action plans, with a stronger role for air quality modeling in complementing monitoring, assessing pollutant distributions, and evaluating mitigation pathways. Air quality modeling has become indispensable for understanding pollutant dynamics, quantifying the effects of emission reductions, and designing integrated air–climate policies. Large–scale initiatives such as FAIRMODE, AQMEII, EURODELT, and HTAP have advanced knowledge on model performance and uncertainties, while emphasizing the need for harmonized approaches across Europe. These efforts show that robust policy support requires continent–wide evaluations based on consistent emissions, updated meteorological drivers, and comprehensive observational datasets. In this context, a harmonized pan-European framework based on the Weather Research and Forecasting (WRF) and Community Multiscale Air Quality (CMAQ) models is developed and evaluated for 2019 using unified meteorological, chemical, and emission inputs. Model skill for O3 and PM2.5 is assessed against observations from over 2300 and 1700 stations, respectively, employing standard and advanced diagnostics (mean bias (MB), root mean square error (RMSE), correlation coefficient (r), Taylor, Target, and quantile-binned error (QBE) analyses). For hourly O3, r = 0.51 and MB = +1.9 ppb; for hourly PM2.5, r = 0.52 and MB = −5.0 µg m−3 (Mod–Obs). The model reproduces large-scale and seasonal patterns but underestimates PM2.5 by 4–6 µg m−3 and damps O3 variability by ~40–50 %. Taylor and Target diagnostics show that random and phase errors dominate (uRMSD/σ_obs ≈ 0.85–0.9), whereas systematic bias is modest (MB/σ_obs ≤ 0.3–0.5). QBE analysis confirms amplitude compression, with underestimation of high-O3 and high-PM2.5 events and overprediction of low-O3 levels. Overall, model skill is limited more by variance and episode representation than by mean offset. Improving boundary-layer dynamics, emission timing, and secondary aerosol processes will reduce seasonal and regional biases. Despite moderate underestimation, the framework provides a scientifically robust, harmonized basis for continental air-quality evaluation and scenario analysis, consistent with FAIRMODE, AQMEII, and the EU 2030 Air Quality Directive.

How to cite: Tagaris, E., Traka, N., Stergiou, I., Sotiropoulou, R. –. E. P., and Kaskaoutis, D.: Evaluation of European Air Quality Simulations in 2019 Using the CMAQ–WRF Modeling System, EGU General Assembly 2026, Vienna, Austria, 3–8 May 2026, EGU26-4162, https://doi.org/10.5194/egusphere-egu26-4162, 2026.

EGU26-4944 | ECS | Posters on site | AS3.29

Modeling of fine and ultrafine particulate matter in Poland using WRF-Chem 

Tatiana Tabalchuk, Maciej Kryza, and Małgorzata Werner

Air pollution caused by particulate matter (PM) remains one of the major environmental challenges in Europe, with fine and ultrafine particles (UFP) posing a particularly serious risk to human health and the climate system. Owing to their small size, UFP can penetrate deep into the respiratory tract and enter the bloodstream, thereby contributing to cardiovascular and pulmonary diseases. In addition, ultrafine aerosols play an important role in atmospheric chemistry and radiative processes. In Central and Eastern Europe, wintertime residential heating based on coal, peat, and wood combustion is a dominant source of elevated PM concentrations and is frequently associated with severe air pollution episodes.

While PM2.5 and PM10 have been extensively studied, much less attention has been paid to ultrafine particles. In particular, their spatial variability, their contribution to total particulate matter, and their representation in chemistry–transport models remain insufficiently constrained, especially during the winter heating season. As a result, model evaluation beyond standard mass-based PM metrics is still limited.

In this study the WRF-Chem model is used to simulate fine and ultrafine particle pollution over Poland for the period from 10 December 2024 to 3 January 2025, during which several high PM2.5 concentration events linked to residential heating emissions were observed. The simulations employ the MOZART–MOSAIC chemistry and aerosol scheme, which allows for an explicit representation of aerosol size distributions and microphysical processes relevant for combustion-related particles.

Model output is evaluated using ground-based observations from the ACTRIS research infrastructure, including size-resolved aerosol measurements, as well as routine PM2.5 observations from the Polish national air quality monitoring network (GIOŚ). The evaluation is based on spatial and temporal collocation of modeled and observed data and focuses on model performance during the winter pollution episode.

The results provide insight into the ability of WRF-Chem to reproduce wintertime PM2.5 episodes driven by residential heating emissions and into the role of ultrafine particles in shaping total PM concentrations.

This work was supported by the European Union’s programme “Support to Advanced Learning and Training (EU4Belarus- SALTII)”.

How to cite: Tabalchuk, T., Kryza, M., and Werner, M.: Modeling of fine and ultrafine particulate matter in Poland using WRF-Chem, EGU General Assembly 2026, Vienna, Austria, 3–8 May 2026, EGU26-4944, https://doi.org/10.5194/egusphere-egu26-4944, 2026.

EGU26-10054 | ECS | Posters on site | AS3.29

The GRINS Italian Large Datasets on Air Quality, Climate and Emissions for the Period 2013-2023 

Alessandro Fusta Moro and Alessandro Fassò

Air quality in Italy is a major concern due to elevated pollutant concentrations, particularly in the northern regions during the winter period. Within the GRINS (Growing Resilient, Inclusive and Sustainable) project (www.grins.it), Italy aims to foster the digital transition and support decision-making within a data-driven framework. In this context, we collected air quality, climate, and emissions data for the Italian territory covering the period 2013–2023. Air quality data were obtained from ground-based monitoring stations, climate data from the ERA5 reanalysis, and emissions data from the CAMS-REG-ANT inventory. By integrating these data sources, we produced high-resolution maps of NO2 concentrations over the entire Italian territory, with daily temporal resolution on a regular 0.05° × 0.05° grid. The maps include both predicted concentrations and associated uncertainty estimates. The statistical model adopted is Fixed Rank Kriging, which is well suited for large datasets. The high-resolution maps were subsequently aggregated to the municipal level to ensure spatial consistency with other datasets available at the same administrative scale, such as health statistics. In addition to air quality data, we provide municipal-level estimates of climate variables and emissions for the same period, also at daily resolution. The dataset is freely available on Zenodo (https://zenodo.org/records/17605148) with almost 1000 downloads after few months. The corresponding code is accessible on GitHub. The data products are suitable for a wide range of applications at the intersection of environmental exposure, public health, and social impact assessment.

How to cite: Fusta Moro, A. and Fassò, A.: The GRINS Italian Large Datasets on Air Quality, Climate and Emissions for the Period 2013-2023, EGU General Assembly 2026, Vienna, Austria, 3–8 May 2026, EGU26-10054, https://doi.org/10.5194/egusphere-egu26-10054, 2026.

EGU26-10135 | ECS | Posters on site | AS3.29

PM10 and PM2.5 Reduction under BAU and MFR Scenarios in the EU Air Quality Directive Context 

Aleksandra Starzomska, Paweł Durka, Joanna Strużewska, Jacek Kamiński, Grzegorz Jeleniewicz, and Aleksander Norowski

Particulate matter remains a significant air quality challenge in Europe, underscoring the need for effective solutions in the context of the revised EU Ambient Air Quality Directive (EU) 2024/2881, which introduces stricter requirements for protecting human health.

In this study, the impact of national emission reduction pathways on PM10 and PM2.5 concentrations is analysed using the on-line chemical transport model GEM-AQ, which provides a detailed assessment tool for policymakers and researchers. The model is based on the Global Environmental Multiscale (GEM) numerical weather prediction system and was extended with a comprehensive tropospheric chemistry and aerosol module within the MAQNet project.

Three simulations for the base year 2022 were conducted: a baseline emission scenario and two emission reduction scenarios - Business as Usual (BAU), reflecting current legislation, and Maximum Feasible Reduction (MFR), representing the maximum technically achievable emission reductions. These scenarios enable policymakers and researchers to evaluate PM10 and PM2.5 responses to emission changes across national and urban-regional scales, supporting evidence-based decision-making.

The comparison of BAU and MFR scenarios highlights how concentrations respond to emission control efforts, emphasising the value of this research for informing policy and supporting evidence-based air quality management under evolving EU regulations.

We will present the change of the extent of exceedance areas, population exposed and number of air quality zones with exceedances with a focus on urban zones. 

How to cite: Starzomska, A., Durka, P., Strużewska, J., Kamiński, J., Jeleniewicz, G., and Norowski, A.: PM10 and PM2.5 Reduction under BAU and MFR Scenarios in the EU Air Quality Directive Context, EGU General Assembly 2026, Vienna, Austria, 3–8 May 2026, EGU26-10135, https://doi.org/10.5194/egusphere-egu26-10135, 2026.

EGU26-10694 | Posters on site | AS3.29

Volcanic Degassing of Hazardous Gases and Their Atmospheric Dispersion: A Case Study of Vulcano Island, Aeolian Archipelago, Italy 

Salvatore Inguaggiato, Fabio Vita, Benedetto Schiavo, Claudio Inguaggiato, Jacopo Cabassi, Stefania Venturi, and Franco Tassi

Gaseous emissions from active volcanic systems constitute a primary natural source of global atmospheric pollution. Typically, these fluids are dominated by high concentrations of water vapor (H2O) and carbon dioxide (CO2), which together account for more than 90% of the total emission volume. These are followed by sulfur species, specifically SO2 and H2S, within a range of a few percentage points. The remaining fluid emissions comprise minor species—including HCl, HF, CO, H2, He,and  N2 alongside numerous other trace elements. Many of these gases, particularly SO2, H2S, CO2, and CO, are hazardous to human health and exhibit various deleterious effects. Consequently, extensive environmental research has been conducted in recent years to evaluate the impact of these gases on public health. The primary objective of this study is to characterize the atmospheric dispersion of gaseous emissions from the volcanic system of Vulcano Island, originating from the main degassing centers: the crater area and the hydrothermal system of the Levante Bay. Atmospheric concentrations of sulfur dioxide SO2 were monitored using a quasi-continuous network based on Scanning Differential Optical Absorption Spectroscopy (Scan-DOAS) technology. Concurrently, H2S and CO2 concentrations in the Levante Bay area were measured using Multi-GAS instrumentation.By integrating SO2 flux data derived from Scan-DOAS measurements with atmospheric dispersion maps generated via AERMOD modeling software, we estimated the spatial distribution of SO2 across the volcanic crater and inhabited regions, including Vulcano Village and Vulcano Piano. This investigation provided critical insights into areas where anomalous concentrations of SO2, H2S, and CO2 exceed the threshold limits established by the World Health Organization (WHO) and the European Union (EU). Findings indicate that these thresholds are frequently surpassed within and adjacent to the crater zone.

How to cite: Inguaggiato, S., Vita, F., Schiavo, B., Inguaggiato, C., Cabassi, J., Venturi, S., and Tassi, F.: Volcanic Degassing of Hazardous Gases and Their Atmospheric Dispersion: A Case Study of Vulcano Island, Aeolian Archipelago, Italy, EGU General Assembly 2026, Vienna, Austria, 3–8 May 2026, EGU26-10694, https://doi.org/10.5194/egusphere-egu26-10694, 2026.

EGU26-10716 | ECS | Posters on site | AS3.29

Spatiotemporal modelling of air pollution in the Valencian Community using spectral analysis and daily geostatistical mapping 

Daniela Cruz Leiva, María-Elena Rodrigo-Clavero, Eduardo Cassiraga, and Javier Rodrigo-Ilarri

Air pollution constitutes one of the leading modifiable environmental risks to public health, and its evolution can be influenced by meteorological variability and climate change. In this context, air quality in Mediterranean coastal regions exhibits strong seasonal variability and pronounced spatial gradients, driven by urban emissions, meteorology, and complex topography. In this work, the spatiotemporal evolution of 12 atmospheric pollutants in the Valencian Community (Spain) is modelled over 2009–2023 at daily resolution, and a reproducible and transferable methodology for the spatiotemporal analysis of environmental variables is presented, applicable not only to air pollution but also to other datasets with spatial and temporal components.

Data from the Valencian Air Quality Monitoring Network (RVVCCA), collected at 87 monitoring stations, are used. Prior to processing, an exhaustive quality assessment is conducted to validate record consistency, identify and handle missing or anomalous data, and robustly establish the effective study period. Temporal variability is analysed using time-series techniques, including descriptive exploration (basic statistics, variability, and seasonal patterns) and spectral analysis, in order to identify periodicities and dominant signals across different temporal scales.

Spatial analysis follows the methodology proposed by Yao and Journel (1998), which enables the automatic computation of covariance surfaces via the Fast Fourier Transform (FFT), facilitating operational implementation for a large number of days and pollutants. Based on these covariance surfaces, a geostatistical estimation scheme based on Ordinary Kriging (OK) is implemented to generate daily gridded concentration fields over the Valencian Community, enabling the assessment of persistent spatial patterns, regional gradients, and their interannual evolution. The final outcome is an integrated workflow that combines quality control, temporal analysis, and daily geostatistical mapping, providing a solid methodological basis to study the spatiotemporal dynamics of air pollution from monitoring networks.

How to cite: Cruz Leiva, D., Rodrigo-Clavero, M.-E., Cassiraga, E., and Rodrigo-Ilarri, J.: Spatiotemporal modelling of air pollution in the Valencian Community using spectral analysis and daily geostatistical mapping, EGU General Assembly 2026, Vienna, Austria, 3–8 May 2026, EGU26-10716, https://doi.org/10.5194/egusphere-egu26-10716, 2026.

EGU26-13492 | ECS | Orals | AS3.29

Smoke simulation from peatland wildfires: a case study in northern Ukraine 

Dmytro Oshurok, Dmytro Grabovets, Arina Petrosian, Daniil Boldyriev, Tetiana Maremukha, Varvara Morhulova, Oleksii Chulkov, Polina Yaryfa, and Oleg Skrynyk

This study presents the results of smoke simulations from wildfires that occurred in September 2024 in northern Ukraine. The case study focuses on peatland fires near Loshakova Huta (Chernihiv region), specifically during 19–23 September, when smoke was transported toward the capital city of Kyiv under northerly wind direction. Burnt areas were identified using multiple data sources, including Sentinel-2 and Planet satellite imagery (false-colour analysis), EFFIS (European Forest Fire Information System) polygons, land surface temperature anomalies obtained from MODIS and VIIRS satellite instruments (NASA FIRMS (Fire Information for Resource Management System) platform) and EUMETSAT LSA SAF (Land Surface Analysis Satellite Application Facility), and Sentinel-3 fire radiative power data. Emissions of major air pollutants were estimated using the Fuel Fire Tools application, which integrates the FCCS (Fuel Characteristic Classification System), the CONSUME fuel consumption model, and FEPS (Fire Emission Prediction Simulator). The FCCS module provided fire behaviour parameters and fuel loading for the identified burnt areas based on a 30-m fuel map developed for Ukraine, which had previously been modified by introducing peat fuel classes using available soil data. Total emissions and their temporal dynamics were then calculated. Smoke transport and dispersion were simulated by means of the CALPUFF Lagrangian puff model and HYSPLIT (Hybrid Single-Particle Lagrangian Integrated Trajectory Model) at 1 km spatial resolution. Both models were applied to simulate the transport of carbon monoxide and particulate matter (PM2.5 and PM10) using meteorological fields simulated by the WRF (Weather Research & Forecasting) model driven by ERA5 reanalysis. Model performance was evaluated by comparing background-corrected modelled pollutant concentrations with measurements from eight air-quality monitoring stations in Kyiv, using several statistical metrics. Data from seven stations were provided by the Department of Environmental Protection and Climate Change Adaptation of the Kyiv City State Administration, and data from one station were provided by the SI “Marzieiev Institute for Public Health of the National Academy of Medical Sciences of Ukraine”. The results showed acceptable accuracy for both models, despite the relatively large distance from the active fires (~60-70 km) and uncertainties related to other emission sources and surrounding conditions near the monitoring sites. Periods of substantial concentration increases were also well reproduced by the models.

Peatland wildfires pose a significant public health hazard due to their enormous emissions of air pollutants, particularly the PM2.5 fraction. This case study is valuable due to the availability of qualitive satellite-based information, on-site documentation, and reliable air-quality measurements in Kyiv. The results indicate that the CALPUFF and HYSPLIT models can adequately reproduce smoke plume transport and dispersion when peat-fire source terms are properly parameterized, especially with respect to emission rates, and when accurate meteorological input is used.

How to cite: Oshurok, D., Grabovets, D., Petrosian, A., Boldyriev, D., Maremukha, T., Morhulova, V., Chulkov, O., Yaryfa, P., and Skrynyk, O.: Smoke simulation from peatland wildfires: a case study in northern Ukraine, EGU General Assembly 2026, Vienna, Austria, 3–8 May 2026, EGU26-13492, https://doi.org/10.5194/egusphere-egu26-13492, 2026.

EGU26-14449 | Orals | AS3.29

Photochemical modelling of wintertime HOx sources and sinks in a polluted sub-Arctic environment 

Steve R. Arnold, Alicia Hoffman, Rachel James, Dwayne E. Heard, Lisa Whalley, Daniel Stone, Samuel Seldon, Jochen Stutz, Jonas Kuhn, Sol Cooperdock, Brice Temime-Roussel, Amna Ijaz, Barbara D'Anna, Kathy S. Law, Slimane Bekki, Fangzhou Gou, James Flynn, James St Clair, Meeta Cesler-Maloney, and William Simpson

The hydroxyl radical (OH) plays a key role in regulating gas-phase pollutant concentrations and particle formation and composition in the global troposphere. Globally, OH formation is dominated by production of O(1D) from photolysis of ozone and subsequent reaction with water vapour. However, under conditions characteristic of the polluted wintertime Arctic, this mechanism is inhibited by limited short-wave radiation and water abundance. A lack of observations means that our understanding of radical and oxidant sources under such conditions is lacking. The Alaskan Layered Pollution and Chemical Analysis (ALPACA) field campaign, made comprehensive measurements of trace gas and aerosol pollution chemistry and meteorology during January and February 2022 in the sub-Arctic city of Fairbanks, Alaska, USA. During the campaign, severe surface-based temperature inversions gave rise to several enhanced pollution events, interspersed with weakly stable periods of lower pollution levels and influence from the free troposphere. Here, we use the Dynamically Simple Model of Atmospheric Chemical Complexity (DSMACC) 0D box model incorporating the comprehensive Master Chemical Mechanism (MCM) v3.3.1  to quantify processes controlling the abundances of atmospheric oxidants in Fairbanks. We constrain the model using available measurements from the ALPACA campaign, and compare HOx radical sources and sinks during a strongly-stable heavily polluted period of the campaign with a less stable, cleaner period.  OH formation from HONO photolysis is the major chemical source of HOx in the polluted, low-light environment of wintertime Fairbanks and formaldehyde is an important precursor for HO2. We find that the HOx budget is distinct between a polluted, strongly stable inversion event and a clean, weakly stable period, with influences of meteorology being important in regulating peroxynitric acid (PNA, HO2NO2) cycling. Our results help improve understanding of the unique atmospheric pollution chemistry that regulates oxidant abundances in cold and low-light conditions.

How to cite: Arnold, S. R., Hoffman, A., James, R., Heard, D. E., Whalley, L., Stone, D., Seldon, S., Stutz, J., Kuhn, J., Cooperdock, S., Temime-Roussel, B., Ijaz, A., D'Anna, B., Law, K. S., Bekki, S., Gou, F., Flynn, J., St Clair, J., Cesler-Maloney, M., and Simpson, W.: Photochemical modelling of wintertime HOx sources and sinks in a polluted sub-Arctic environment, EGU General Assembly 2026, Vienna, Austria, 3–8 May 2026, EGU26-14449, https://doi.org/10.5194/egusphere-egu26-14449, 2026.

EGU26-14848 | Posters on site | AS3.29

Air‑pollution modelling for health‑risk assessment under future climate scenarios in Germany 

Mariano Mertens, Anna Götz, Anna Lanteri, Nikolaos Nikolaou, and Alexandra Schneider

Ambient air pollution is the leading environmental threat to human health worldwide. In Europe, ongoing emission-control measures are expected to reduce pollutant concentrations, but rising temperatures associated with climate change may heighten human vulnerability to these pollutants. Therefore, it is important to consider effects of increasing temperatures when considering future air pollution effects on human health. To do so, however, consistent air-quality climate simulations are needed, with spatial resolution sufficient for detailed health assessment.

Here, we present an approach for a detailed health assessment for Germany considering future climate and air pollution scenarios. The approach is based on health data from the German National Cohort (NAKO, nako.de) and exposure data from model simulations with the global-regional chemistry climate model MECO(n) with resolution up to 2 km over Germany. The NAKO has more than 200 000 participants and started in 2014. First, we link MECO(n) exposure data (2014‑2021) to the health data. In a second step, health effects for future conditions are analyzed based on future exposure data.

We will present the framework in detail, with a focus on the exposure modelling. In addition, we will present first analyses of the present-day exposure data including an assessment of the temporal trends of the exposure data over the present-day period. Additionally, we will examine how emission reductions influence exposure, using model‑based source‑apportionment to demonstrate their role in present‑day exposure declines.

How to cite: Mertens, M., Götz, A., Lanteri, A., Nikolaou, N., and Schneider, A.: Air‑pollution modelling for health‑risk assessment under future climate scenarios in Germany, EGU General Assembly 2026, Vienna, Austria, 3–8 May 2026, EGU26-14848, https://doi.org/10.5194/egusphere-egu26-14848, 2026.

EGU26-14979 | Posters on site | AS3.29

The new online-coupled chemistry transport model ICON-MUSCAT: First applications and validation 

Roland Schrödner, Anna Sührig, Jens Stoll, Michael Weger, Marie Luttkus, Jana Wackermann, Hanna Wiedenhaus, Willi Schimmel, Oswald Knoth, Silvia Müller, Bernd Heinold, and Ralf Wolke

The chemistry transport model MUSCAT (Wolke et al., 2012), was coupled to the numerical weather prediction (NWP) model ICON of German Weather Service (DWD, Zängl et al., 2015). MUSCAT was previously already coupled to COSMO, the former NWP model of DWD. Since with ICON, not only the horizontal grid structure (icosahedral grid consisting of triangles) did change, but also the whole code structure. Hence, the coupling required more steps than previous updates of COSMO, both for ensuring efficiency and flexibility of the model simulations and easy further updates.

With the two model versions, COSMO-MUSCAT and ICON-MUSCAT, the whole year 2019 was simulated over Europe. Results with COSMO-MUSCAT are already published by Thürkow et al., 2024. The presentation therefore focuses on the validation of ICON-MUSCAT and a comparison to the performance of the predecessor model version. For this purpose, we utilize data of European air quality monitoring stations provided by the European Environmental Agency (EEA). The model is validated according to FAIRMODE (Janssen and Thunis, 2022) standards. Overall, ICON-MUSCAT performs well and similarly as with the previous meteorological driver. Differences between the two model versions were found related to boundary layer physics. For example, the ozone deposition was found to be sensitive to the surface temperature, which leads to night-time differences between the two model version for the ground-level ozone concentration. The comparison to traffic-related observations of NO2 concentrations in urban locations and to traffic counts suggest a revision of the prescribed emission profiles of the traffic-sector (CAMS-TEMPO, Guevara et al., 2021) as in particular morning emission peaks were simulated earlier than in occurring in the observations. In addition, different available emission inventories (amongst others CAMS, EDGAR, CEDS) were investigated to analyze the uncertainty due to the choice of emission inventory.


Guevara, M., et al., 2021, Earth Syst. Sci. Data, 13, 367–404, https://doi.org/10.5194/essd-13-367-2021.

Thürkow, M., Wolke, R., Heinold, B., Stoll, J., et al., 2023, Science of The Total Environment, Volume 906, https://doi.org/10.1016/j.scitotenv.2023.167665.

Wolke, R., Schrödner, R. et al., 2012, Atmos. Env., 53, 110–130.

Zängl, G., Reinert, D., Rípodas, P., and Baldauf, M., 2015, Q. J. R. Meteorol. Soc., 141, 563–579, https://doi.org/10.1002/qj.2378.

Janssen, S., and Thunis, P., 2022: FAIRMODE Guidance Document on Modelling Quality Objectives and Benchmarking, Version 3.3, JRC Technical Report, doi:10.2760/41988.

How to cite: Schrödner, R., Sührig, A., Stoll, J., Weger, M., Luttkus, M., Wackermann, J., Wiedenhaus, H., Schimmel, W., Knoth, O., Müller, S., Heinold, B., and Wolke, R.: The new online-coupled chemistry transport model ICON-MUSCAT: First applications and validation, EGU General Assembly 2026, Vienna, Austria, 3–8 May 2026, EGU26-14979, https://doi.org/10.5194/egusphere-egu26-14979, 2026.

EGU26-15230 | Orals | AS3.29

Providentia: an evaluation software package for the atmospheric modelling community  

Dene Bowdalo, Alba Vilanova, Paula Serrano Sierra, Amalia Vradi, Francesco Benincasa, Oriol Jorba, and Carlos Pérez García-Pando

Providentia is an evaluation software package designed for the in-depth analysis of in-situ surface observations and colocated model output, tailored specifically for the atmospheric modelling community.

Reproducibility is a key concern when performing any type of model evaluation. A variety of factors can affect reproducibility, including how observations are processed and filtered, and how statistics are calculated. Even two scientists within the same institution may obtain markedly different results depending on their methodologies. Providentia addresses this challenge by leveraging harmonised observational datasets, such as GHOST and ACTRIS, which are widely used by the community, and by allowing precise customisation of fully documented statistics. Critically, by using the same configuration file, two users can be confident that their evaluations are exactly the same.

Providentia offers a variety of use modes, these include an interactive dashboard for quick-look visualisations; a report mode designed for more exhaustive evaluations, generating PDF reports; a library mode that enables Providentia's backend functions to be used in scripts or Jupyter notebooks, for example for reading, filtering, or plotting data; a download mode that automatically retrieves and formats observational (e.g. GHOST and ACTRIS) and model datasets (e.g. CAMS model forecasts and reanalyses); and an interpolation mode that spatially colocates model output with observational stations. 

Providentia is publicly available on GitHub (https://github.com/BSC-ES/providentia), and is fully documented on a dedicated ReadTheDocs page (https://providentia.readthedocs.io/). 

How to cite: Bowdalo, D., Vilanova, A., Serrano Sierra, P., Vradi, A., Benincasa, F., Jorba, O., and Pérez García-Pando, C.: Providentia: an evaluation software package for the atmospheric modelling community , EGU General Assembly 2026, Vienna, Austria, 3–8 May 2026, EGU26-15230, https://doi.org/10.5194/egusphere-egu26-15230, 2026.

EGU26-15578 | ECS | Posters on site | AS3.29

Integration of a Smoke Plume Rise Scheme and 3BEM-FRP Emission Inventory into gocartMPAS: Application to the 2024 South America Wildfire Season 

Jaqueline Pereira, Saulo Freitas, Mary Barth, William Skamarock, Soyoung Ha, Rajesh Kumar, Forrest Lacey, Gabriel Pereira, and Valter Oliveira

Wildfires inject aerosols into the atmosphere at varying altitudes, modifying long‐range transport, which affects air quality, atmospheric chemistry, human health, and Earth's radiative budget. As biomass burning is a major and recurrent environmental problem in South America, the development of the next generation of Earth System model, named Model for Ocean-laNd-Atmosphere predictioN (MONAN), needs to account for the wildfire aerosol emission fields and their effects included in the model physics formulations. The MONAN’s atmospheric component, the Model for Prediction Across Scales - Atmosphere (MPAS-A) stand alone v8.3.1, is being advanced through the coupling with the Second-Generation Goddard Chemistry Aerosol Radiation and Transport Model (GOCART-2G) described in Collow et al. (2024), forming the so-called gocartMPAS system. Building on the importance of accurate plume rise parametrization, this study involves the implementation of Freitas et al. (2007, 2011) plume rise model (PRM) within the gocartMPAS framework to assist the fire emission module with the vertical distribution of the hot smoke produced by the fires. As part of the planned experiments, we will investigate the 2024 biomass burning season over South America by conducting simulations during the July–October period on a global quasi-uniform mesh with 60 km resolution. Physical parameterizations are from the “convection_permitting" suite, with initial conditions from ERA5 reanalysis. Regarding the input data for the plume rise scheme, we employed Fire Radiative Power, Active Fire Size and biomass burning emissions from the Brazilian Biomass Burning Emission Model with Fire Radiative Power (3BEM-FRP) inventory, which was processed in a latitude-longitude grid using the Prep-Chem-Src v1.8.3 preprocessor. We will discuss the overall characteristics of plume injection heights and transport of black carbon, organic carbon and brown carbon, including an initial evaluation of the aerosol mass concentration and optical depth simulated with the CAMS reanalysis dataset. These efforts are intended to improve the representation of wildfire smoke plume rise and to increase the accuracy of wildfire aerosol transport in the gocartMPAS model.

How to cite: Pereira, J., Freitas, S., Barth, M., Skamarock, W., Ha, S., Kumar, R., Lacey, F., Pereira, G., and Oliveira, V.: Integration of a Smoke Plume Rise Scheme and 3BEM-FRP Emission Inventory into gocartMPAS: Application to the 2024 South America Wildfire Season, EGU General Assembly 2026, Vienna, Austria, 3–8 May 2026, EGU26-15578, https://doi.org/10.5194/egusphere-egu26-15578, 2026.

EGU26-17551 | ECS | Orals | AS3.29

An inter-comparison of bottom-up and satellite-derived emissions for trace gases over agricultural regions in Europe 

Eleftherios Ioannidis, Jieying Ding, Ronald van der A, Roy Wichink Kruit, Alessandro Marongiu, and Michiel van Weele

Trace gases, such as ammonia (NH3) and nitrogen oxides (NOx), serve as key precursors for secondary inorganic aerosols and play an important role in air quality and the nitrogen cycle. The primary anthropogenic sources of NH3 and NOx in Europe are agriculture, industry and transportation. Additionally, soil NOx emissions contribute significantly to the total NOx budget. Anthropogenic emission reporting is based on “bottom-up” emission inventories, which provide gridded NH3 and NOx emissions, and are widely used for air quality modelling and effective policymaking.

However, bottom-up emission inventories rely on statistical information, activity data and emission factors, resulting to uncertainties and significant time lags in data availability. Therefore, in addition to bottom-up emission inventories, “top-down” methods have been developed using various inverse modelling techniques. These techniques make use of satellite data, which provide independent information on emissions and can be used to evaluate bottom-up emission inventories and help to identify potential unknown or unreported sources.

In this study we use the Daily Emissions Constrained by Satellite Observations (DECSO) inversion algorithm combined with Cross-track Infrared Sounder (CrIS) and TROPOspheric Monitoring Instrument (TROPOMI) satellite data to derive NH3 and NOx emissions on a spatial resolution of 0.1o x 0.1o. DECSO is coupled to Eulerian regional offline CHIMERE CTM. Our study focuses on BENELUX and Po-Valley, two regions with high agricultural emissions, as part of the Agricultural Atmospheric Emissions (AGATE) ESA project.

We validate the DECSO NH3 and NOx emissions by comparing them directly against bottom-up inventories, such as Copernicus Atmosphere Monitoring Service (CAMS) and Emissions Database for Global Atmospheric Research (EDGAR). Satellite-derived emissions are consistent with bottom-up inventories regarding the magnitude of country-region totals.

To further validate the DECSO emissions we also perform forward simulations using CHIMERE CTM with DECSO and bottom-up emission inventories. The focus of the validation here is on aerosol precursors, such as nitrogen dioxide (NO2) and NH3, and compare the model results against in-situ observations and independent satellite data. The comparison against observations shows that the model simulations using the DECSO NH3 and NOx emissions perform similarly to simulations using bottom-up inventories providing further confidence on the quality of satellite-derived emissions.

How to cite: Ioannidis, E., Ding, J., van der A, R., Wichink Kruit, R., Marongiu, A., and van Weele, M.: An inter-comparison of bottom-up and satellite-derived emissions for trace gases over agricultural regions in Europe, EGU General Assembly 2026, Vienna, Austria, 3–8 May 2026, EGU26-17551, https://doi.org/10.5194/egusphere-egu26-17551, 2026.

EGU26-18702 | ECS | Orals | AS3.29

Heterogeneous oxidation shapes inorganic aerosol composition and acidity in East Asia 

Xurong Wang, Alexandra Tsimpidi, Astrid Kerkweg, and Vlassis Karydis

Sulfate–nitrate–ammonium aerosols are the main secondary inorganic components of particulate matter, particularly PM2.5 (particulate matter with an aerodynamic diameter of 2.5 µm or less), contributing more than 40% of PM2.5 mass (Tao et al., 2017), and even up to 60% during polluted events in East Asia (Geng et al., 2017). Sulfate and nitrate are formed through the chemical oxidation of precursor gases (i.e., NOx and SO2). These oxidation pathways include homogeneous processes (i.e., in the gas and aqueous phases) and heterogeneous processes (i.e., on particle surfaces). Previous studies have emphasized the importance of heterogeneous oxidation in secondary inorganic aerosol formation during severe haze events. However, heterogeneous oxidation mechanisms are either neglected in current models or represented using empirical and oversimplified parameterizations, leading to substantial discrepancies between field observations and model simulations, particularly the underestimation of sulfate concentrations. In addition, the size distribution of sulfate–nitrate–ammonium mass fractions and aerosol acidity is influenced by heterogeneous chemistry. However, most studies focus on the fine mode (PM2.5), and the size-resolved responses of aerosol chemical composition and acidity remain poorly understood. In this study, we incorporate an updated heterogeneous oxidation scheme into the formation mechanism of sulfate–nitrate–ammonium aerosols to improve simulations over East Asia using the EMAC atmospheric chemistry–climate model. Compared with observational datasets, the inclusion of the updated heterogeneous oxidation scheme improves model performance, with the normalized mean bias of sulfate, nitrate, and ammonium decreasing from −50%, 61%, and −51% to −45%, 60%, and −35%, respectively. We find that enhanced sulfate formation promotes the partitioning of ammonium into the aerosol phase, especially in the coarse size mode (PM ≥ 2.5 µm), while increased sulfate in the coarse mode suppresses coarse nitrate formation. In addition, aerosol acidity in the fine mode shows a negligible response, whereas acidity in the coarse mode increases by approximately 0.1 pH units. These findings highlight the importance of heterogeneous oxidation mechanisms, particularly in the coarse size mode.

References

Geng, G., Zhang, Q., Tong, D., Li, M., Zheng, Y., Wang, S., and He, K.: Chemical composition of ambient PM2. 5 over China and relationship to precursor emissions during 2005–2012, Atmos. Chem. Phys., 17, 9187-9203, 10.5194/acp-17-9187-2017, 2017.

Tao, J., Zhang, L., Cao, J., and Zhang, R.: A review of current knowledge concerning PM2. 5 chemical composition, aerosol optical properties and their relationships across China, Atmos. Chem. Phys., 17, 9485-9518, 10.5194/acp-17-9485-2017, 2017.


How to cite: Wang, X., Tsimpidi, A., Kerkweg, A., and Karydis, V.: Heterogeneous oxidation shapes inorganic aerosol composition and acidity in East Asia, EGU General Assembly 2026, Vienna, Austria, 3–8 May 2026, EGU26-18702, https://doi.org/10.5194/egusphere-egu26-18702, 2026.

EGU26-19623 | Orals | AS3.29

Delineating Intra-Urban Air-sheds using High-Resolution WRF Modelling: Insights from Ahmedabad, India 

Anurag Kandya, Viral Patel, Shubham Kela, Kaivalya Gadekar, Raj Baru, and Ashish Sharma

Understanding intra-urban air-shed dynamics is increasingly critical for effective air quality management. While regional-scale air-shed characterisation has been widely studied, comparatively limited attention has been given to air-shed delineation at the city scale, where pollutant transport pathways, stagnation zones and recirculation patterns exert direct influence on population exposure. Identifying prominent urban air-sheds and quantifying their dependence on key meteorological drivers such as wind speed, wind direction, thermal structure and humidity can substantially improve the predictive understanding of pollutant accumulation hotspots.

With this motivation, the present study investigates the air-shed behaviour of Ahmedabad, a densely populated and industrially active city in western India having a population of around 8.2 million and spread across 464 sq km. The Weather Research and Forecasting (WRF) model was configured for high-resolution urban simulations and validated for two contrasting seasons: a five-day period in May representing hot, dry summer conditions and a five-day period in winter characterised by lower boundary-layer heights and reduced dispersion. Simulated fields of wind speed, wind direction, ambient temperature and relative humidity were generated at hourly intervals and evaluated against available meteorological observations. Using these validated simulations, the study attempts to delineate intra-city air-sheds by analysing dominant flow regimes, seasonal shifts in ventilation and stagnation patterns and the sensitivity of air-shed boundaries to changes in meteorological parameters.

The insights derived from this analysis hold significant implications for urban regulators and civic administrators. A refined understanding of air-shed structure can support targeted emission control strategies, optimise the spatial prioritisation of air action plans, and ultimately contribute to improving public health outcomes for city residents.

How to cite: Kandya, A., Patel, V., Kela, S., Gadekar, K., Baru, R., and Sharma, A.: Delineating Intra-Urban Air-sheds using High-Resolution WRF Modelling: Insights from Ahmedabad, India, EGU General Assembly 2026, Vienna, Austria, 3–8 May 2026, EGU26-19623, https://doi.org/10.5194/egusphere-egu26-19623, 2026.

EGU26-19966 | Posters on site | AS3.29

Climate-driven air pollution extremes over Portugal (2012–2025): insights from CAMS data  

Rita Durao, Madalena Simões, Ana Russo, and Célia Gouveia

Air pollution poses significant risks to human health and ecosystems, being strongly influenced by meteorological conditions and climate-driven extremes variability. In southern Europe, climate change is expected to intensify heatwaves, droughts, and wildfire activity, thereby increasing the likelihood of compound events and exacerbating the severity of air pollution episodes. This study analyses the spatiotemporal variability of atmospheric pollutants over the mainland Iberian Peninsula for the period 2012–2025, using data provided by Copernicus Atmosphere Monitoring Service (CAMS). The use of CAMS data enables a spatially consistent assessment of air quality across regions that are less covered by national monitoring networks. The applied analysis focuses on key pollutants, namely carbon monoxide CO, PM₁₀, and PM₂.₅, examining their intra-annual and inter-annual variability, inter-pollutant relationships, and associations with meteorological conditions conducive to extreme events. 

The methodology used includes statistical and spatial analysis to identify the spatiotemporal patterns of key pollutants (CO, PM10, PM2.5) from CAMS reanalysis data and in situ measurements for the study period from 2012 to 2025. The influence of atmospheric conditions on the dispersion and concentration of pollutants was also addressed, with particular attention to atmospheric circulation patterns that can influence the occurrence of forest fires and consequent episodes of pollutant concentration exceedances. Results show marked seasonal cycles and substantial inter-annual variability in pollutant concentrations, with extreme pollution episodes frequently co-occurring with heatwaves, droughts, and periods of intense wildfire activity. Confirming that these compound events are characterised by simultaneous meteorological drivers and elevated pollutant concentrations, leading to repeated exceedances of air quality thresholds. CAMS data successfully captures the spatial and temporal signatures of these extremes, particularly for CO and particulate matter, highlighting regions recurrently affected by compound fire–air pollution events. By linking air pollution extremes to climate-related extremes, this work advances understanding of compound climate–air quality events and provides a basis for future attribution studies assessing the role of climate change in modulating air pollution extremes in the Iberian Peninsula.  


How to cite: Durao, R., Simões, M., Russo, A., and Gouveia, C.: Climate-driven air pollution extremes over Portugal (2012–2025): insights from CAMS data , EGU General Assembly 2026, Vienna, Austria, 3–8 May 2026, EGU26-19966, https://doi.org/10.5194/egusphere-egu26-19966, 2026.

EGU26-20989 | ECS | Posters on site | AS3.29

Long-term simulation and evaluation of cosmogenic Beryllium-7: insights into atmospheric transport and deposition processes 

Essaid. Chham, Josè Antonio García Orza, Jesper Heile Christensen, and Zhuyun Ye

Cosmogenic beryllium-7 (⁷Be) is a valuable natural radiotracer for constraining atmospheric transport, vertical exchange, and aerosol removal processes in chemical transport models. We present a comprehensive implementation of 7Be in the Danish Eulerian Hemispheric Model (DEHM), a regional chemical transport model, and present model output for 2000-2025 evaluated against long-term 7Be observations over Europe.

The ⁷Be production rates are prescribed from the CRAC:7Be (CRAC:Be) model, which includes the main geophysical controls on atmospheric cosmogenic ⁷Be production. Three-dimensional production fields are mapped to the DEHM grid with 75×75 km resolution horizontally and 29 vertical layers from surface to 100 hPa, and coupled with the advection–diffusion, boundary-layer mixing, and wet/dry deposition schemes in DEHM to simulate near-surface ⁷Be concentrations. Meteorological fields driving DEHM are simulated using the Weather Research and Forecasting (WRF) model based on ERA5 reanalysis data. ⁷Be is treated as particle-bound accumulation-mode aerosol in all the model processes and with a representative particle diameter of 0.33 μm for dry deposition.

The model is evaluated against observations from 18 European sampling sites spanning contrasting climatic and dynamical regimes (mid- and high-latitude stations), with heterogeneous sampling strategies (daily to weekly/monthly). Model performance is assessed using temporal Pearson correlation (r), root mean square error (RMSE) and mean absolute percentage error (MAPE).

DEHM reproduces observed ⁷Be temporal variability with strongly site-dependent skill. Mid-latitude stations, particularly in central Europe, show high temporal correlations and lower bias, indicating that synoptic-scale transport and mixing are reasonably represented at 75 km resolution. In contrast, northern and southern Europe stations show larger MAPE and more pronounced regional mean biases. These discrepancies likely reflect challenges in representing wet scavenging, boundary-layer dynamics, and sub-grid processes including orographic precipitation, coastal effects, and convective activity. The larger errors over southern Europe may also be partly linked to episodic coarse-mode aerosol conditions (e.g., dust outbreaks), which are not explicitly resolved in the accumulation-mode ⁷Be aerosol size representation.

To better understand these discrepancies, we stratify model performance by precipitation regime to constrain wet scavenging and by season to assess boundary layer mixing and stratosphere-troposphere exchange. We quantify wet versus dry deposition contributions on temporal variability and assess resolution/representativeness effects at coastal and complex-terrain sites. Sensitivity tests of different particle size assumptions on Saharan dust events to assess the role of size-dependent removal processes. These analyses advance our understanding on 7Be cycling mechanisms and demonstrate the value of cosmogenic tracers for evaluating transport and deposition processes in regional models.

How to cite: Chham, E., Orza, J. A. G., Christensen, J. H., and Ye, Z.: Long-term simulation and evaluation of cosmogenic Beryllium-7: insights into atmospheric transport and deposition processes, EGU General Assembly 2026, Vienna, Austria, 3–8 May 2026, EGU26-20989, https://doi.org/10.5194/egusphere-egu26-20989, 2026.

Background: In LMICs, population-level evidence on the acute health effects of air pollution is limited by sparse data and underdeveloped surveillance systems. South Africa’s Air Quality Management Priority Areas (Highveld, Vaal Triangle, and Waterberg-Bojanala), identified for chronic air quality exceedances, provide an opportunity to examine exposure.

Objectives: We assessed the short-term effects of five major air pollutants (NO₂, SO₂, O₃, PM₁₀, PM₂.₅) on cause-specific mortality and morbidity between 2005 and 2020. We adapted a distributed lag non-linear model (DLNM) embedded in a three-stage DL-CCO framework for mortality, and a pseudo-case-crossover design for morbidity validation.

Methods: Weekly mortality and monthly morbidity data (ICD-10 J(All), A(15-19)) were linked to ambient air pollutant concentrations across the Priority Areas. The modelling strategy was: (1) DLNM estimation of district-level risk functions, (2) pooling via random-effects meta-analysis, and (3) application of a distributed lag case-crossover (DL-CCO) approach using conditional logistic regression to validate findings. For morbidity, where matched control data were unavailable, a pseudo-case-crossover approach was applied as a sensitivity test.

Results: Increases of 10 µg/m³ in PM2.5 and NO₂ were associated with elevated respiratory and infectious mortality risks within a 3-week lag structure. Pooled estimates showed a significant cumulative relative risk (RR) of 1.17 (95% CI: 1.09–1.26) for pneumonia following NO₂ exposure in HPA, and 1.21 (95% CI: 1.10–1.34) for tuberculosis mortality associated with PM2.5 in VTAPA. DL-CCO validation confirmed consistent lag–response patterns for mortality, while pseudo-CCO analyses for morbidity showed parallel but attenuated associations. No significant associations were found for SO₂ or O₃.

Conclusions: This study is the first to implement a DLNM framework for mortality and pseudo-CCO sensitivity test for morbidity in Southern Africa. The multi-pollutant, multi-region analysis confirms the acute health burden of NO₂ and PM2.5 and demonstrates the feasibility of applying advanced epidemiologic models in resource-constrained settings.

How to cite: Howlett-Downing, C., Kapwata, T., and Wright, C.: A Multi-site Mortality and Morbidity Assessment of Air Pollution in South Africa's Priority Areas: an Adapted Three-Stage Distributed Lag Non-linear Case-Crossover Framework for Parsimonious Datasets, EGU General Assembly 2026, Vienna, Austria, 3–8 May 2026, EGU26-340, https://doi.org/10.5194/egusphere-egu26-340, 2026.

EGU26-947 | Posters on site | AS3.30

Cascade-Machine-learning quantifies hourly wildfire smoke exposure and acute health risks in California 

Luyao Wang, Xiyao Chen, and Anqi Jiao

The rising frequency and severity of wildfires have intensified concerns regarding their adverse impacts on public health. However, accurately quantifying acute wildfire smoke exposure and its associated health impacts remains challenging due to limitations in existing high-resolution exposure data. Here, we develop a novel Cascade-Machine-Learning framework to generate unprecedented hourly wildfire-specific PM2.5 concentrations at a 1 km × 1 km resolution across California, achieving substantial accuracy improvements over traditional chemical transport models and satellite-derived datasets. Leveraging this high-resolution dataset with health records from the University of California, we identify critical relationships between short-term wildfire smoke exposure and acute pneumonia-related health risks. Notably, we introduce a new exposure metric, Pmax, capturing the intensity of hourly peak exposures relative to daily accumulated exposure, and reveal that short-lived, pulse-type wildfire smoke events are associated with nearly tenfold higher pneumonia-related medical risks compared to sustained exposure at equivalent daily average concentrations. Our results further highlight heightened vulnerability among individuals younger than 18 years and the African American populations. This work underscores the urgent need for temporally detailed exposure assessment in wildfire health studies and provides a robust scientific foundation for targeted public health interventions and emergency preparedness in an era of intensifying wildfire risks.

How to cite: Wang, L., Chen, X., and Jiao, A.: Cascade-Machine-learning quantifies hourly wildfire smoke exposure and acute health risks in California, EGU General Assembly 2026, Vienna, Austria, 3–8 May 2026, EGU26-947, https://doi.org/10.5194/egusphere-egu26-947, 2026.

EGU26-1958 | Posters on site | AS3.30

The Health and Economic Cost of PM2.5 in Kazakhstan: Identifying Source-Driven Mitigation Priorities 

Nassiba Baimatova, Ivan Radelyuk, Olga P. Ibragimova, and Kazbek Tursun

Ambient fine particulate matter (PM2.5) exposure is a leading global health risk, requiring integrative frameworks that link atmospheric science, epidemiology, and socioeconomic analysis to enable effective mitigation. Despite this global attention, Central Asia faces a knowledge gap regarding the dominant sources of PM2.5 pollution due to the scarcity of related research. This study applies advanced source apportionment, health impact modeling, and multi-criteria decision-making analysis to quantify the health and economic burdens and mitigation strategies resulting from persistent PM2.5 pollution in Kazakhstan’s two largest urban centers, Almaty and Astana.

The study employed Positive Matrix Factorization (PMF), HYSPLIT trajectory, and Conditional Probability Function analysis to characterize PM2.5 sources [1]. An extensive year-long sampling campaign (August 2022–July 2023) confirmed that annual PM2.5 concentrations exceeded the World Health Organization (WHO) guideline (5 µg/m3) by 7.1 times in Almaty and 3.9 times in Astana. PMF identified five distinct sources in both cities, with coal and biomass combustion emerging as the overall predominant contributors to PM2.5. In Almaty, sources included the urban atmosphere (20%), power plants (18%), residential heating (16%), and exhaust emissions (14%), with the valley topography exacerbating pollutant accumulation. In Astana, contributions were distributed among heating, regional/local power plants, and traffic emissions (exhaust/non-exhaust), each contributed 20%, and industrial emissions (18%), with HYSPLIT analysis confirming the influence of regional industrial emissions originating from areas such as Karagandy and Pavlodar.

The subsequent health risk assessment, quantified using the Global Exposure Mortality Model (GEMM), showed that PM2.5-attributable excess mortality was 2108±144 deaths annually in Almaty and 676±41 deaths in Astana (2022-2024) [2]. These fatality rates significantly exceeded those from road traffic accidents and HIV/AIDS in both cities. The corresponding economic losses, quantified using the Value of Statistical Life (VSL) approach, were estimated at USD 2.8-4.6 billion per year for Almaty and USD 0.9-1.5 billion for Astana. Achieving the WHO limit could prevent 1642-2195 deaths and yield annual economic savings exceeding USD 3.8 billion.

The DEMATEL-ANP analysis, based on responses from 20 international experts, assessed the interaction among key mitigation measures [2]. It identified that effective air quality policies must prioritize pollution-purification efficiency, manage capital costs, and minimize the risks of secondary pollution, identified as the primary criteria driving systemic improvements. The findings emphasize the urgent need for comprehensive air quality management, particularly fossil fuel phase-out initiatives. High-capital interventions, such as the planned modernization of Almaty's CHPP-2 to gas in 2026, are critical, as the resulting economic savings from reduced health burdens (USD 1066-6300 million) significantly exceed the modernization cost (USD 703.6 million).

Acknowledgments

This research was funded by the Science Committee of the Ministry of Higher Education and Science of the Republic of Kazakhstan (Grant No. AP23486720, 2024-2026).

References

 [1]   K. Tursun et al. Dominant sources of PM2.5 in Kazakhstan’s urban cities: A PMF and HYSPLIT-based study for air quality management in Central Asia, Urban Clim 64 (2025) 102706.

[2]   A. Muratuly et al. Urban PM2.5 pollution in Kazakhstan: health burden and economic costs, Environ. Sci: Adv. (2025).

How to cite: Baimatova, N., Radelyuk, I., Ibragimova, O. P., and Tursun, K.: The Health and Economic Cost of PM2.5 in Kazakhstan: Identifying Source-Driven Mitigation Priorities, EGU General Assembly 2026, Vienna, Austria, 3–8 May 2026, EGU26-1958, https://doi.org/10.5194/egusphere-egu26-1958, 2026.

EGU26-2423 | Orals | AS3.30

Satellite-derived spatio-temporal variations of aerosol properties over China: competing anthropogenic and meteorological effects 

Gerrit de Leeuw, Cheng Fan, Xiaoxi Yan, Jiantao Dong, Hanqing Kang, Chengwei Fan, Zhengqiang Li, and Ying Zhang

Satellite observations showed the increase of the aerosol optical depth (AOD,  a measure for the aerosol burden), over China at the end of the previous century, continuing until about 2007 and decreasing after 2011/2014. The initial increase, in response to economic growth and urbanization, was mitigated by the successive implementation of a series of emission reduction policy measures that resulted in strong AOD variations between 2007 and 2014, followed by a substantial AOD decrease after the implementation of the 2013 - 2017 Clean Air Action Plan. However, AOD time series show that the reductions were cancelled or even reversed over extended periods of time when the AOD increased. Model simulations show that these variations can be attributed to influences of unfavorable meteorological effects on the AOD which become stronger as AOD decreases. Further analysis shows the different effects of the occurrences of El Niño and La Niña on the AOD, in addition to economic effects. Furthermore, the emission reductions result not only in the decrease of aerosols but also affect the concentrations of precursor gases, both direct and through the chemical balance which effects the oxidative capacity of the atmosphere. As a result, aerosol composition changes occur which in turn affect aerosol optical properties. Changes in both concentrations and optical properties provide a plausible explanation for satellite observations of changes in AOD patterns. The reduction of aerosol concentrations reduces both the direct effect of aerosols and indirect effects on the Earth radiative balance.  

How to cite: de Leeuw, G., Fan, C., Yan, X., Dong, J., Kang, H., Fan, C., Li, Z., and Zhang, Y.: Satellite-derived spatio-temporal variations of aerosol properties over China: competing anthropogenic and meteorological effects, EGU General Assembly 2026, Vienna, Austria, 3–8 May 2026, EGU26-2423, https://doi.org/10.5194/egusphere-egu26-2423, 2026.

Intermediate-volatility and semi-volatile organic compounds (I/SVOCs) constitute an important fraction of organic pollutants in urban atmospheres. They can partition between the gas and particle phases and are key precursors of secondary organic aerosol (SOA). As representative nonpolar I/SVOCs (NP-I/SVOCs), n-alkanes and polycyclic aromatic hydrocarbons (PAHs) provide valuable molecular fingerprints for investigating the atmospheric behaviour and sources of I/SVOCs. Here, we conducted a multi-year data analysis (2014-2015, 2019, 2022 and 2024) to characterise long-term pollutant trends and improve source attribution by accounting for gas-particle partitioning. Seasonal data of n-alkanes (C8-C40) and PAHs were analysed in a central Chinese city, where the measurements of gaseous NP-I/SVOCs remain scarce. Positive Matrix Factorisation (PMF) model was employed to apportion source contributions. The results revealed a 58% reduction in PM2.5 and a 50% reduction in PM2.5 bounded n-alkanes in 2022 compared to 2014-2015, reflecting the positive impact of past pollution control measures. Gas-particle partitioning of NP-I/SVOCs was largely governed by absorption into organic matter; however, partitioning models showed limitations in reproducing observed partitioning behaviour. PMF results indicated that motor vehicle emissions overtook coal combustion as the primary anthropogenic contributor to PM2.5 bounded n-alkanes in recent years, and remained a major source of intermediate-volatility/semi-volatile n-alkanes and PAHs in 2024. Notably, particle-only and dual-phase (gas + particle) PMF analyses yielded significantly different source contributions and PAH health risk metrics, underscoring the importance of gas-particle partitioning in both source attribution and risk assessment. Incorporating gas-phase data enables a more comprehensive assessment of the NP-I/SVOC sources, particularly for sources enriched in low-molecular-weight homologues. These findings deepen the understanding of long-term NP-I/SVOC profiles and support more targeted air pollution control strategies. 

How to cite: Xu, R., Kong, M., Wei, X., Guo, J., and Zhang, R.: Multi-year trends and source shifts of representative nonpolar I/SVOCs: Insights from gas-particle partitioning in a central Chinese city, EGU General Assembly 2026, Vienna, Austria, 3–8 May 2026, EGU26-2621, https://doi.org/10.5194/egusphere-egu26-2621, 2026.

EGU26-3217 | ECS | Posters on site | AS3.30

Sixteen Years of Ozone Changes: Photochemical Pollution Control Experience in Beijing 

yanyu kang and guiqian tang

 In recent years, air pollution control in China has advanced substantially. While these efforts have led to pronounced reductions in particulate matter concentrations, ozone (O₃) levels have increased significantly. Many previous studies have suggested that reductions in nitrogen oxides (NOₓ) may be a major driver of the observed increase in O₃, thereby highlighting the importance of controlling volatile organic compounds (VOCs). Using Beijing, a Chinese megacity, as a case study, this work analyzes long-term observational data from 2009 to 2024 to investigate the temporal evolution of O₃ and its precursors (NOₓ and VOCs) and their interrelated response characteristics.

The results show that during 2009–2015, both the maximum daily 8-hour average ozone (MDA8 O₃) concentration and total oxidant (Oₓ) increased rapidly, at rates of 8.9% yr⁻¹ and 5.4% yr⁻¹, respectively. After 2015, the growth rates slowed markedly and both metrics exhibited high-level fluctuations (O₃: 2.9% yr⁻¹; Oₓ: −0.9% yr⁻¹). Further stratification by pollution level and temperature reveals that, since 2015, the 90th percentile of O₃ and O₃ concentrations under high-temperature conditions (≥25 °C) have shown declining trends (90th percentile: −0.47% yr⁻¹; ≥25 °C: −0.76% yr⁻¹), with the decreases mainly occurring during midday high-ozone periods.

A combined analysis of the response relationships between O₃ and NOₓ, together with photochemical reactivity indicators, indicates that 2015 represents a turning point at which O₃ formation sensitivity in Beijing shifted from a VOC-limited regime toward a transitional, co-limited regime. Looking ahead, further reductions in NOₓ emissions from natural gas–fired power plants and mobile sources—particularly diesel vehicles and non-road mobile machinery—will be critical for effective O₃ pollution mitigation in Beijing. This study provides valuable insights and practical experience for photochemical air pollution control in megacities worldwide.

How to cite: kang, Y. and tang, G.: Sixteen Years of Ozone Changes: Photochemical Pollution Control Experience in Beijing, EGU General Assembly 2026, Vienna, Austria, 3–8 May 2026, EGU26-3217, https://doi.org/10.5194/egusphere-egu26-3217, 2026.

EGU26-3824 | ECS | Posters on site | AS3.30

  Enhancing Hourly AOD Retrieval from MSG-1/SEVIRI Imagery Integrating Deep and Transfer Learning 

Yulong Fan, Zhanqing Li, Lin Sun, Oleg Dubovik, and Jing Wei

Geostationary Earth Orbit (GEO) satellites offer unique capabilities for capturing diurnal variations and providing valuable insights into aerosol cycles. However, publicly available hourly aerosol products with sufficient accuracy remain scarce across Europe, Africa, and West Asia, primarily due to the lack of shorter-wavelength (< 0.6 µm) channels on the Meteosat Second Generation (MSG) satellite series. Therefore, we developed a novel deep learning framework to retrieve hourly aerosol optical depth (AOD) at 550 nm over land in 2021 from MSG-1/SEVIRI imagery, which offers wider spatial coverage through Indian Ocean Data Coverage (IODC). This framework integrates an advanced time-sequence Transformer architecture with transfer learning, utilizing pre-training and fine-tuning techniques. The eXplainable Artificial Intelligence (XAI) analysis revealed that satellite observations across multiple wavelengths contribute 38% to the AOD retrieval, followed by viewing geometry (34%). In comparison with ground-based AOD measurements, our model achieves high accuracy, with an average ten-fold cross-validation (CV) R2 of 0.88 and a root mean square error (RMSE) of 0.079. Additionally, our model maintains strong predictive performance in areas and periods lacking ground-based measurements, as evidenced by strong spatial- and temporal-based CV-R2 values ranging from 0.71 to 0.86. The model performance is significantly improved when withholding each continent, showing marked increases in R (0.71–0.78) compared to models trained without transfer learning (0.23–0.47). Using the generated reliable 3-km-resolution AOD datasets, we capture pronounced diurnal aerosol variations, characterized by a gradual increase after sunrise, a peak around 10:00 UTC, and a decline by late afternoon, with average magnitude changes of approximately 26% ± 15% relative to the daily mean level (0.22 ± 0.14) on an annual scale, especially during the Northern Hemisphere summer, reaching 30% ± 19%. More importantly, we successfully tracked the rapid dispersion of aerosols and their transport process throughout the day during highly polluted events, driven by both natural and anthropogenic emissions, including dust storms, wildfires, and urban haze. These findings emphasize the unique value of our study for advancing aerosol research over under-monitored regions, particularly focusing on diurnal variations during extreme events.

How to cite: Fan, Y., Li, Z., Sun, L., Dubovik, O., and Wei, J.:   Enhancing Hourly AOD Retrieval from MSG-1/SEVIRI Imagery Integrating Deep and Transfer Learning, EGU General Assembly 2026, Vienna, Austria, 3–8 May 2026, EGU26-3824, https://doi.org/10.5194/egusphere-egu26-3824, 2026.

Fine fractions of urban road dust represent an environmentally relevant and potentially hazardous component of particulate matter due to their high mobility, efficient atmospheric resuspension, and capacity to accumulate anthropogenic pollutants. This study provides an integrated mineralogical, physicochemical, magnetic, and organic components characterization of the finest fraction (<50 μm) of road dust collected from seven urban locations (V1-V7) in Vienna, Austria, with particular emphasis on sources of minerals and organic components of road dust.

Magnetic properties were assessed using mass-specific magnetic susceptibility (χ), frequency-dependent susceptibility (χfd%), anhysteretic remanent magnetization susceptibility (χARM), hysteresis loop parameters, and thermomagnetic κ(T) curves. Complementary mineralogical and physicochemical analysis included Scanning Electron Microscopy with Energy-Dispersive X-ray Spectroscopy (SEM-EDS), quantitative X-ray Diffraction (QXRD), Fourier Transform Infrared Spectroscopy (FTIR), Thermogravimetry coupled with Quadrupole Mass Spectrometry (TG-QMS), and elemental CHNS and TOC analyses, supported by multivariate statistics adapted for compositional data.

All samples showed a complete dominance (≈100%) of strongly magnetic material in the <50 μm fraction. Mass-specific magnetic susceptibility values ranged from 362 × 10⁻⁸ m³ kg⁻¹ (V4) to 911 × 10⁻⁸ m³ kg⁻¹ (V6), indicating substantial enrichment in ferrimagnetic particles. Frequency-dependent susceptibility values ranged from 4.1% to 6.5%, confirming a significant contribution of ultrafine superparamagnetic grains. Hysteresis loop parameters (Mrs/Ms = 0.057-0.089; Hcr/Hc = 4.44-6.18) and King plot relationships indicate a dominance of stable single-domain magnetite with a minor superparamagnetic fraction, characteristic of anthropogenic sources such as brake abrasion, fuel combustion, and industrial emissions. Thermomagnetic κ(T) curves revealed Curie temperatures consistent with magnetite and evidence of magnetic enhancement during heating, suggesting the formation of secondary magnetite from combustion-related precursors.

QXRD analysis showed a mineralogical composition dominated by carbonates and silicates, including quartz (24–46 wt%), dolomite (12-36 wt%), calcite (~10-15 wt%), feldspars (6-12 wt%), and muscovite (5-15 wt%), accounting for ~90 wt% of the samples. Minor phases included chlorite, kaolinite, amphiboles, and biotite (7-10 wt%), while iron oxides occurred below the quantitative detection limit of QXRD but were confirmed by XRD, FTIR, and SEM observations.

FTIR and TG-QMS analyses revealed abundant aliphatic C-H functional groups and hydrocarbon fragments indicative of organic matter derived from tire wear, asphalt binders, lubricants, fuel residues, and polymeric materials. TG-derived organic matter contents ranged from 3.0 to 8.6 wt%, closely matching TOC values (2.9-8.6 wt%). SEM-EDS provided direct evidence of microplastic particles, including carbon- and oxygen-rich fibers, irregular polymeric fragments, and significant amount of slag glasses (balls, rods).

The combined magnetic–chemical approach demonstrates that ultrafine road dust acts as an efficient carrier of strongly magnetic particles, C-H-rich organic pollutants, and microplastics. These findings highlight the environmental and health relevance of fine road dust as a vector for inhalable anthropogenic contaminants and emphasize the value of integrating magnetic indicators with mineralogical and organic analyses in urban pollution assessments.

This research was funded in whole by the National Science Centre, Poland under grant number 2021/43/D/ST10/00996.


How to cite: Lempart-Drozd, M. and Dytłow, S. K.: An Integrated Methodological Framework for the Characterization of Fine Urban Road Dust (<50 μm): Magnetic, Mineralogical, and Organic Components, EGU General Assembly 2026, Vienna, Austria, 3–8 May 2026, EGU26-4442, https://doi.org/10.5194/egusphere-egu26-4442, 2026.

EGU26-5146 | ECS | Posters on site | AS3.30

Predicting Air Pollution from sparse and movable observation points using machine learning techniques 

Abhishek Ajit Sabnis, Mihai Mitrea, Lya Lugon, Karine Sartelet, Marc Bocquet, and Sibo Cheng

Exposure to pollutants is closely linked to respiratory illness, cardiovascular disease, and premature mortality. Accurate full-field prediction of air pollutant concentrations is essential for assessing exposure to pollution and guide sustainable urban planning. However, the intrinsic interaction among pollutants, hard-to-predict weather patterns, along with limited and randomly placed monitoring stations make this a complex task. While the domain has shifted from traditional interpolation methods towards machine learning algorithms, generation of high-resolution maps remain challenging. In this study, we use hourly available sparse data and apply data-driven techniques to provide faster and accurate reconstruction of four key pollutants - NO2, O3, PM2.5 and PM10. Models are trained on full-field simulation data and evaluated on real-world observations collected from 20-25 monitoring stations in the city of Paris. We propose multi-pollutant modelling using both discriminative and ensemble-based generative approaches, investigate the impact of incorporating historical data into discriminative models, and introduce stochastic modelling via diffusion techniques to capture the variability in spatial distribution. Despite observing anomalies in spatial map and recording noisy observations, the proposed ML models achieve high structural similarity (SSIM) in field reconstruction. By utilizing noise-based augmentation strategy, we facilitate prediction of real-world data without model retraining. The models exhibit superior generalization ability on real-data by predicting realistic pollution patterns on time periods that lie outside the training period. These findings highlight the potential of ML-models for reliable real-world deployment in reconstruction tasks.

How to cite: Sabnis, A. A., Mitrea, M., Lugon, L., Sartelet, K., Bocquet, M., and Cheng, S.: Predicting Air Pollution from sparse and movable observation points using machine learning techniques, EGU General Assembly 2026, Vienna, Austria, 3–8 May 2026, EGU26-5146, https://doi.org/10.5194/egusphere-egu26-5146, 2026.

The 2021 WHO Air Quality Guidelines impose substantial challenges for achieving further reductions in ambient fine particle matter (PM2.5). Although China has experienced major PM2.5 declines through controls on industry, transportation, power generation, and residential combustion, livestock-driven ammonia (NH3) remains weakly regulated and poorly constrained. Here we integrate CAMS-GLOB-ANT and MEIC inventories to construct a high-resolution livestock NH₃ emission dataset, and use WRF-Chem sensitivity simulations to quantify its contribution to PM2.5 across China from 2010 to 2020. PM2.5 concentrations attributable to livestock NH3 emissions [hereafter PM2.5(NH3)] exhibit marked seasonal and spatial heterogeneity, with persistent winter hotspots in southern China and summer hotspots shifting northward to the North China Plain while gradually weakening. Despite national PM2.5 improvements, regions with PM2.5(NH3) exceeding 5–10 μg m-3 remain widespread, and livestock emissions alone frequently elevate summer PM2.5 above WHO daily limits. As other sources decline, the relative role of PM2.5 (NH3) increases, underscoring the urgent need for integrated agricultural-air quality management.

How to cite: Ma, X. and the XUST: Livestock ammonia emerges as a dominant barrier to compliance with the WHO PM2.5 guidelines in China, EGU General Assembly 2026, Vienna, Austria, 3–8 May 2026, EGU26-6103, https://doi.org/10.5194/egusphere-egu26-6103, 2026.

Bottom-up emission inventories often miss day-to-week variability, especially during extreme events, and they can also omit or underestimate sources that are sporadic, poorly monitored, or rapidly changing. Here we present a joint NO2-CO remote-sensing constraint framework designed to diagnose these problems in a consistent way across regions and scales. The framework leverages the complementary information content of NO2 (short-lived, strongly tied to local sources) and CO (longer-lived, sensitive to both combustion and atmospheric transport) to separate local emission signals from meteorology-driven redistribution, and to flag conditions where inventories are likely biased.

First, we use joint NO2-CO signals to constrain plume injection and vertical placement, showing that simple plume-rise formulations can systematically underestimate injection heights (by ~33% on average) and that NO2 and CO terms are essential predictors for capturing free-tropospheric lofting. Second, we apply top-down constraints on daily-to-weekly emissions to reproduce observed extremes in the Monsoon Asia free troposphere, where matching the magnitude and spatial reach of events requires substantially larger effective emissions. Third, we extend the concept to broader spatial domains, using satellite-derived NO2 and CO to estimate emission variability with uncertainty bounds and to identify missing or underestimated sources; the inferred extra CO can further translate into non-negligible CO2 mass equivalents through oxidation, highlighting a coupled air-quality–carbon implication.

A China-focused application illustrates how vertical information improves attribution: incorporating MOPITT vertical profiles strengthens surface–column consistency across 1577 sites and reveals episodes in which CO from major urban sources (e.g., Xi’an) is lofted to ~500 hPa and transported >2000 km downwind. Overall, the proposed NO2-CO constraint framework provides a practical route to evaluate and refine emission inventories under extreme conditions, while explicitly accounting for vertical transport and source intermittency, while also helping models to better close the missing carbon budget.

How to cite: Wang, S., Guan, L., Cohen, J., and Qin, K.: A Joint Satellite NO2-CO Constraint Framework Reveals Emission Biases Driven by Extreme Events and Missing Sources in Emission Inventories, EGU General Assembly 2026, Vienna, Austria, 3–8 May 2026, EGU26-6110, https://doi.org/10.5194/egusphere-egu26-6110, 2026.

EGU26-6336 | ECS | Posters on site | AS3.30

Renewable energy droughts shape the air pollution patterns through power system response 

Xin Xin and Dan Tong

Accelerating the energy transition toward a new electricity system dominated by renewable energy, with coal power serving as a flexible backup, is a critical strategy to synergize pollution control and carbon reduction. This study couples a power system model with WRF-CMAQ to reveal the power system's response to renewable energy droughts and assess associated environmental impacts. Our findings reveal that while large-scale development of renewable energy will contribute to the reduction of anthropogenic emissions and overall air quality improvement across China, it also introduces regional increasing pollution. The annual average PM2.5 concentrations exhibit significant increases in the Border Area of Jiangsu, Anhui, Shandong, and the Twain-Hu Basin, accompanied by a rise in the frequency of mildly polluted days in the Twain-Hu Basin and the Sichuan Basin. Moreover, the Twain-Hu Basin experiences a nearly tenfold surge in short-term severe air pollution episodes compared to the baseline scenario. These regional pollution spikes are linked to renewable energy droughts triggered by extreme low-wind, extreme low-radiation, and compound low-wind-low-solar events. Our research underscores that while advancing the integration of wind and solar, it is essential to conduct regional environmental risk assessments across multiple time scales and enhance extreme weather early warning and emergency response mechanisms.

How to cite: Xin, X. and Tong, D.: Renewable energy droughts shape the air pollution patterns through power system response, EGU General Assembly 2026, Vienna, Austria, 3–8 May 2026, EGU26-6336, https://doi.org/10.5194/egusphere-egu26-6336, 2026.

EGU26-8664 | ECS | Posters on site | AS3.30

Sensitivity of Simulated Aerosol Optical Depth to Biomass Burning Emission Inventories over North America 

Samaneh Ashraf, Patrick Hayes, Timothé Payette, Robin Stevens, and Jack Chen

Chemical Transport Models (CTMs) are widely used to simulate aerosol mass concentrations, composition, and optical properties at regional to global scales and are fundamental tools for assessing aerosol impacts on climate and air quality. Despite continued advances in CTMs, their performance remains strongly dependent on the accuracy of meteorological inputs, chemical mechanisms, and emission inventories. Differences among biomass burning emission inventories can arise from several factors, such as fire detection methods, fuel consumption estimates from fire radiative power (top-down) or burn area (bottom-up) approaches, assumptions regarding fuel type, combustion completeness, emission factors, and temporal allocation assumptions. Systematic evaluation of biomass burning emission datasets against ground-based observations is therefore essential for identifying region-specific aerosol representation in CTMs. In this study, we use the GEOS-Chem chemical transport model to quantify the sensitivity of simulated Aerosol Optical Depth (AOD) to biomass burning emission inventories during the 2019 wildfire season over North America. We perform simulations driven by two recently developed biomass burning emission products from Environment and Climate Change Canada (ECCC): the Canadian Forest Fire Emissions Prediction System (CFFEPS) and the Global Forest Fire Emissions Prediction System (GFFEPS). We compare these against simulations driven by three commonly used global inventories (the Global Fire Emissions Database version 4 (GFED4), the Global Fire Assimilation System (GFAS), and the Quick Fire Emissions Dataset version 2 (QFED2)). Model output is evaluated against quality-assured Level 2 AOD observations from 138 NASA Aerosol Robotic Network (AERONET) stations across Canada and the United States. The evaluation reveals substantial regional variability in model performance across emission inventories. Over Canada, simulations driven by CFFEPS and GFFEPS exhibit the strongest agreement with observations, particularly in northern and western regions, where correlations reach values of up to ~0.88 and normalized mean errors are as low as ~30%–49%, while simulations using other global inventories generally show larger normalized errors. Across the United States, GFAS-driven simulations achieve correlations of approximately 0.6–0.7 in the western and eastern regions, while all inventories exhibit reduced skill over the central United States. Overall, these results demonstrate the strong sensitivity of simulated AOD to biomass burning emission datasets and emphasize the importance of regionally optimized fire emissions for accurately representing aerosols in chemical transport models.

How to cite: Ashraf, S., Hayes, P., Payette, T., Stevens, R., and Chen, J.: Sensitivity of Simulated Aerosol Optical Depth to Biomass Burning Emission Inventories over North America, EGU General Assembly 2026, Vienna, Austria, 3–8 May 2026, EGU26-8664, https://doi.org/10.5194/egusphere-egu26-8664, 2026.

Influenza epidemics have increasingly threatened human lives and socioeconomic development in recent decades. It is widely acknowledged that weather and climate play a vital role in influenza epidemics, however, which specific meteorological factors and to which extent the changes of the factors are responsible for the influenza intensity remains unclear. Previous studies suggest a decreasing trend of influenza intensity with the rise of winter temperature, which is contradictory to the observed enhanced influenza intensity under global warming. This study focuses on the potential contributions of high-frequency climate variability to the changes of influenza intensity in the United States. The results show that, the peak strength of the influenza season increased by 50% from 1997 to 2021 and two-thirds of this increase is associated with the amplified October–November temperature changes between neighboring days (TCN), a measure of high-frequency temperature variability. This association is most evident in the central region of the United States. Based on the ensemble of CMIP6 simulations, an evident increase of TCN by 0.16°C/decade (p < 0.01) is pronounced along with the enhanced warming driven by the reduction of anthropogenic aerosol emissions. The strengthening of the meridional temperature gradient caused by uneven changes in anthropogenic aerosol and greenhouse gas emissions favored immune-related TCN, leading to the intensification of influenza epidemics eventually. Our findings address the need for more thoughtful mitigation and adaptation strategies to minimize the adverse health effects of human-induced climate drivers.

How to cite: Yasen, G., Guo, W., and liu, Q.: Rapid increase in U.S. influenza epidemics driven by human-induced rapid temperature variations during the autumn transition period, EGU General Assembly 2026, Vienna, Austria, 3–8 May 2026, EGU26-8856, https://doi.org/10.5194/egusphere-egu26-8856, 2026.

Oxidative potential (OP) is a critical metric for assessing the health effects of particulate matter (PM) pollution. Among the various OP assays, the dithiothreitol (DTT) assay is the most widely used and several online systems have been developed. However, existing online systems either lack sufficient reliability for field deployment or offer relatively low temporal resolution, typically around 1 hour. This study presents an automated online DTT measurement system designed for minute-scale monitoring of PM2.5 OP with enhanced sensitivity. The system consists of three main components: a Particle-Into-Liquid Sampler (PILS) for PM2.5 collection, a dual-path incubation module with precisely controlled reaction temperatures (37°C) and durations (~5 and ~10 minutes), and an absorbance-based detector utilizing a liquid waveguide capillary cell (LWCC). This dual-path design enables DTT consumption measurement at two time points within a 15-minute cycle. Assay optimization was conducted to improve the sensitivity of the system. System calibration demonstrated strong correlation (R2 > 0.99) and repeatability for DTT detection (0-10 μM) with rapid response. Validation using standards 9,10-phenanthraquinone and Cu2+ solutions showed excellent correlations between species concentrations and DTT consumption (R2 > 0.99), with strong agreement between online and offline methods. Field deployment further confirmed the system's capability for real-time monitoring and long-term atmospheric OP observation

How to cite: Liu, J. and Fang, T.: Development of an Automated Online System for Minute-Resolution Measurement of PM2.5 Oxidative Potential Using the DTT Assay, EGU General Assembly 2026, Vienna, Austria, 3–8 May 2026, EGU26-10311, https://doi.org/10.5194/egusphere-egu26-10311, 2026.

EGU26-11413 | ECS | Posters on site | AS3.30

Forecasting the UV-Index and Analyzing its Dependence on Influencing Factors 

Valentin Hanft, Roland Ruhnke, Axel Seifert, and Peter Braesicke

Solar ultraviolet (UV) radiation at Earth’s surface poses a well documented risk for human health [1]. The World Health Organization has defined the UV-
Index to quantify the amount of UV radiation as integer numbers in a range of typically 1 to 10 [2].

The UV-Index is typically forecasted on the scale of days to warn the public in the case of high UV-Index values. In Germany this is done by Deutscher Wetterdienst (DWD) who use their weather model ICON (ICOsahedral Nonhydrostatic model) [3] in combination with external datasets for Ozone forecasts and UV radiation calculations [4].

In order to make the UV-Index forecast more self-consistent, we present a setup that provides atmospheric ozone via the LINearized OZone (LINOZ) scheme [5] that is used for UV radiation calculations via the Cloud-J scheme [6] from within ICON and the coupled Aerosols and Reactive Trace gases (ART) module [7].

The result is a setup that can forecast ozone and UV-Index fields for a time frame of January to April 2025 with a precision of ±1 for 94.9% of the data points in comparison to ground measurement stations. Ozone columns stay within 5% agreement for a time frame of four months in the northern hemisphere in comparison to Ozonewatch satellite data.

We use this setup for an analysis of the influencing factors on UV radiation that finds that the solar zenith angle is the quantity that introduces most variability on the UV-Index. Aerosol optical depth, cloud cover and overhead ozone introduce smaller variabilites while the effect of surface albedo and altitude is even less pronounced. A comparison of the novel setup to the operational forecast by DWD agrees within ±2 units of UV-Index for almost all data points with the exception of larger differences in mountainous areas.


References:
[1] Mohammed Ahmed Sadeq et al. Causes of death among patients with cutaneous melanoma: a US population-based study. Scientific Reports 2023 13:1, 13(1):1–11, 6 2023.

[2] Report of the WMO-WHO Meeting of Experts on Standardization of UV Indices and their Dissemination to the Public. Technical report, 1997.

[3] Günther Zängl et al. The ICON(ICOsahedral Non-hydrostatic) modelling framework of DWD and MPI-M : Description of the non-hydrostatic dynamical core. Quarterly Journal of the Royal Meteorological Society, 141(687):563–579, 1 2015.

[4] Henning Staiger et al. UV index forecasting on a global scale. Meteorologische Zeitschrift, 14(2):259–270, 4 2005.

[5] C. A. McLinden et al. Stratospheric ozone in 3-D models: A simple chemistry and the cross-tropopause flux. Journal of Geophysical Research: Atmospheres, 105(D11):14653–14665, 6 2000.

[6] M. J. Prather. Photolysis rates in correlated overlapping cloud fields: Cloud-J 7.3c. Geoscientific Model Development, 8(8):2587–2595, 8 2015.

[7] Jennifer Schröter et al. ICON-ART 2.1: A flexible tracer framework and its application for composition studies in numerical weather forecasting and climate simulations. Geoscientific Model Development, 11(10):4043–4068, 10 2018.

How to cite: Hanft, V., Ruhnke, R., Seifert, A., and Braesicke, P.: Forecasting the UV-Index and Analyzing its Dependence on Influencing Factors, EGU General Assembly 2026, Vienna, Austria, 3–8 May 2026, EGU26-11413, https://doi.org/10.5194/egusphere-egu26-11413, 2026.

Deploying carbon dioxide removal (CDR) can delay the reduction in fossil fuels and associated air pollutants, thereby reducing health co-benefits from climate action. The heterogeneity of these effects, however, remains unclear. By assessing the grid-level (36 km2) air pollution-related mortality in China’s pathway to net-zero CO2 emissions over 2020–2060, we show that CDR exacerbates health inequity by disproportionally reducing more health co-benefits in developing regions, while improving health equality by aligning mortality rates across all regions. In addition to the differences in CDR deployment, such disproportionate impact is largely attributed to CDR trading, by which developing regions can obtain additional CDR quotas, in turn, decreasing local health co-benefits and hampering national health equity. Nonetheless, CDR trading prevents an even greater exacerbation of health inequity, as CDR trading also transfers CDR quotas and associated health burdens from developing to developed regions. Our results support how health-considered policy can be incorporated into CDR deployment strategies to enhance health co-benefits and promote equitable health outcomes.

How to cite: Liu, Z.: Disproportionate effects of direct air carbon capture and storage on regional health co-benefits from net-zero emissions, EGU General Assembly 2026, Vienna, Austria, 3–8 May 2026, EGU26-11534, https://doi.org/10.5194/egusphere-egu26-11534, 2026.

EGU26-11717 | ECS | Posters on site | AS3.30

How the global health burden changes due to heatwaves and air pollution in a warmer world 

Fuzhen Shen, Michaela Hegglin, Tamara Emmerichs, Domenico Taraborrelli, and Qi Zhao

The global premature mortality attributable to air pollution and heatwaves is substantial, yet determining which driver exerts a larger impact remains a complex task. Here, mortalities associated with heatwaves, fine particulate matter (PM2.5), and ozone (O3) are estimated from storylines of air pollution with constant anthropogenic emissions, comparing a factual scenario for 2018-2019 to two warmer scenarios at +2K and +2.75K above pre-industrial levels. The mortality evaluation reveals regional disparities: in Asia and Africa, air pollution far outweighs heatwaves. Conversely, in Europe, heatwave effects dominate. In warmer worlds, heatwaves control changes in aggregated mortality but are partially offset by improved air quality, especially in a +2.75K scenario. The shape of the air quality indices-population-exposure curve reveals the industrialization level, indicating the degree of population exposure risk. These findings highlight the need for region-specific adaptation strategies that address both air pollution and climate change exposures to effectively reduce the global mortality burden.

How to cite: Shen, F., Hegglin, M., Emmerichs, T., Taraborrelli, D., and Zhao, Q.: How the global health burden changes due to heatwaves and air pollution in a warmer world, EGU General Assembly 2026, Vienna, Austria, 3–8 May 2026, EGU26-11717, https://doi.org/10.5194/egusphere-egu26-11717, 2026.

Background: Isolating the independent health effects of atmospheric constituents remains a challenge due to their complex physicochemical coupling. Traditional single-pollutant models frequently neglect these correlations, leading to systematic Omitted Variable Bias (OVB) and distorted disease burden estimates.

Methods: I introduces a novel "post-hoc adjustment meta-regression" framework to quantify and correct OVB. By integrating extensive epidemiological data with high-resolution global atmospheric reanalysis products, the approach utilizes location-specific pollutant correlations to retrieve unbiased causal estimates.

Results: Applying this framework across varying temporal scales and chemical components revealed that single-pollutant models consistently overestimate health risks. Specifically, correcting for OVB in short-term PM2.5 and ozone co-exposures reduced the estimated global mortality burden by approximately 16%. In long-term assessments, unadjusted models were found to inflate ozone risk estimates due to confounding by PM2.5. Furthermore, for specific chemical constituents, neglecting non-Black Carbon (BC) components exaggerated BC's mortality risk by a median of 147%, obscuring its true, albeit higher, intrinsic toxicity relative to other particulate matter. Some of the case studies have been published after peer review.

Conclusions: OVB introduces significant, pervasive errors in current epidemiological syntheses. This unified multi-pollutant correction framework provides a robust solution for refining health impact assessments, underscoring the necessity of accounting for co-pollutant confounding in future air quality policy-making.

How to cite: Xue, T.: Mitigating Omitted Variable Bias in Air Pollution Health Risk Assessment: A Unified Multi-Pollutant Framework, EGU General Assembly 2026, Vienna, Austria, 3–8 May 2026, EGU26-12142, https://doi.org/10.5194/egusphere-egu26-12142, 2026.

EGU26-13072 | ECS | Orals | AS3.30

Future Ozone Exposure in Europe under Net-Zero Emission Scenario using Downscaled ICON-ART Simulations 

Corina Keller, Lukas Emmenegger, and Dominik Brunner

Tropospheric ozone is a major air pollutant that poses significant risks to human health and ecosystems. As the European Union aims to achieve net-zero greenhouse gas (GHG) emissions by 2050, it is critical to understand how emission reductions will influence near-surface ozone concentrations. Unlike primary air pollutants, ozone is formed through complex, non-linear photochemistry involving nitrogen oxides, volatile organic compounds (VOCs), and meteorological conditions, making predictions of its response to emission reductions highly challenging.

In this study, we assess the impact of a transition to net-zero GHG emissions on near-surface ozone across Europe by comparing a reference year (2019) with a net-zero emission scenario for 2050. Our analysis is based on simulations with the atmospheric chemistry and transport model ICON-ART, which was specifically configured and further developed for air quality applications. The model incorporates the latest MOZART tropospheric chemistry scheme, enabling an accurate representation of key oxidation processes involving ozone, nitrogen oxides, and VOCs. ICON-ART further includes advanced modules for aerosol dynamics, gas-aerosol interactions, and emissions from biogenic and natural sources. Anthropogenic emissions are integrated via the ICON-ART online emission module. Together, the model components provide a physically consistent representation of regional scale atmospheric composition. However, the model's spatial resolution limits its direct applicability for exposure and health impact assessments.

To address this limitation, we apply a machine learning-based downscaling approach using the ensemble algorithm XGBoost to generate hourly near-surface ozone fields at 1 km spatial resolution. The model is trained on ground-based ozone observations and a comprehensive set of predictors, including ICON-ART chemical fields, meteorological variables, land use data, emission proxies, and topographic information. This hybrid framework combines process-based atmospheric modeling with a data-driven approach to capture fine-scale spatial and temporal variability in surface ozone. Moreover, the downscaling reduces model biases by leveraging observations to correct systematic errors in the ICON-ART outputs, improving accuracy and local representativeness.

Using the downscaled ozone projections, we examine changes in distributions, extreme events, and temporal dynamics between present-day and net-zero conditions. Our results provide new insights into how climate mitigation pathways may reshape ozone exposure across Europe and underscore the importance of high-resolution ozone projections for assessing the air quality implications of a transition to a net-zero society.

How to cite: Keller, C., Emmenegger, L., and Brunner, D.: Future Ozone Exposure in Europe under Net-Zero Emission Scenario using Downscaled ICON-ART Simulations, EGU General Assembly 2026, Vienna, Austria, 3–8 May 2026, EGU26-13072, https://doi.org/10.5194/egusphere-egu26-13072, 2026.

CO₂ sequestration technologies (CSTs) allow for increased CO₂ emissions without exceeding a chosen temperature limit by creating additional carbon budgets. While these technologies offer low-cost routes to net-zero emissions (i.e., CST benefits), they impede progress toward the Sustainable Development Goals (i.e., CST disbenefits). Focusing on China, we assess both the disbenefits and benefits of CSTs across the climate-energy-air-health cascade using an integrated modeling framework. We show that CSTs can save 4.98–15.65 trillion CNY in achieving net-zero emissions but compromise sustainability in non-fossil energy penetration, air quality, and public health improvement, resulting in a total loss of up to 7.82 trillion CNY during 2020–2060. Given the high likelihood of large-scale CST deployment in the future, pursuing policy coherence to balance trade-offs between disbenefits and benefits is vital. To that end, CSTs should be prioritized in the power sector, and stringent end-of-pipe equipment should be retrofitted in non-power sectors before CST allocation.

How to cite: Wang, F.:  Assessment of Climate-Energy-Air-Health Co-benefits and Trade-offs of CO₂ Sequestration Technologies in China, EGU General Assembly 2026, Vienna, Austria, 3–8 May 2026, EGU26-13970, https://doi.org/10.5194/egusphere-egu26-13970, 2026.

EGU26-15556 | ECS | Posters on site | AS3.30

A Kinetic Machine Learning Model to Simulate PM-Induced Cellular ROS Generation Across the Human Respiratory Tract 

Yingjing Miao, Yuting Shen, and Ting Fang

The generation of reactive oxygen species (ROS), particularly superoxide radical anion (·O2-), is a primary driver of particulate matter (PM) toxicity. However, traditional toxicological assessments are often limited by static endpoint measurements and high experimental doses, failing to capture the dynamic reaction kinetics relevant to real-world ambient exposure. To bridge this gap, we developed a high-temporal-resolution machine learning model based on XGBoost, trained on a comprehensive dataset comprising over 60,000 kinetic data points of ·O2- generation. The model demonstrated robust predictive performance (R2 > 0.8) on the testing set, proving its capability to capture complex, non-linear kinetic patterns. Specifically, the model successfully reproduced the non-monotonic inverted V-shaped dose-response of Isoprene SOA and 9,10-Phenanthrenequinone (PQN) and accurately captured the antagonistic effects in PQN-Fe2+ mixtures, distinguishing these complex interactions from simple additive effects. Ongoing work focuses on applying this validated model to extrapolate cell-based kinetic data to environmentally relevant scenarios in human respiratory tract. We will first calculate the pollutant burden across different respiratory regions (e.g., trachea, bronchi, alveoli) by integrating ambient PM concentration data with a lung deposition model. We will then simulate region-specific ·O2- generation profiles by incorporating varying cell densities and analyzing kinetic parameters. Ultimately, this study aims to develop a model that translates ambient data into physiologically relevant oxidative profiles, providing a precise and cost-effective strategy for screening region-specific respiratory health risks.

How to cite: Miao, Y., Shen, Y., and Fang, T.: A Kinetic Machine Learning Model to Simulate PM-Induced Cellular ROS Generation Across the Human Respiratory Tract, EGU General Assembly 2026, Vienna, Austria, 3–8 May 2026, EGU26-15556, https://doi.org/10.5194/egusphere-egu26-15556, 2026.

EGU26-15947 | Orals | AS3.30 | Highlight

The Health Impacts of Combined Exposure to Air Pollution and Extreme Weather in China 

Mei Zheng, Tianle Zhang, Yaxin Xiang, Yunyun Liu, Jie Li, Yingze Tian, Qin Wang, Yanjun Du, Qing Wang, Tiantian Li, and Tong Zhu

China has achieved substantial reductions in air pollutant concentrations through multiple effective control measures, yet severe pollution episodes remain a persistent challenge. Meanwhile, climate change has increased the frequency and intensity of extreme weather events in China, including dust storms in spring, heatwaves and heavy rainfall in summer, and cold extremes in winter, which pose significant health risks due to the combined exposure to air pollution and extreme weather. Such combined exposures are of particular concern in the densely populated North China Plain region, challenging traditional management strategies that focus on either criteria air pollutants or temperature alone.

With experts from meteorology, air pollution, and health in our team, this interdisciplinary study aims to investigate health risks in the North China Plain under the combined influence of air pollution and climate change. First, we quantify personal exposure to both metals and polycyclic aromatic hydrocarbons (PAHs) using advanced techniques, including wearable compound exposure sensors, high-resolution and filter-based personal exposure samplers (PES), and highly sensitive analytical methods capable of quantifying trace metals using micro-synchrotron radiation X-ray fluorescence analysis and organic pollutants using thermal desorption–gas chromatography–time-of-flight mass spectrometry (TD–GC–TOFMS) at very low concentrations. Second, in order to identify major sources contributing to health impacts of PM2.5, the Nested Air Quality Prediction Modeling System (NAQPMS) is integrated with measurements to simulate major species such as PAHs and metals, as well as oxidative potential of PM2.5 to link health risks to specific emission sectors and source regions. Finally, we aim to develop integrated health risk early-warning systems that jointly consider air pollution and extreme weather, such as ozone pollution and heatwaves, building on the already established heatwave health risk warning system in China. This approach will enable proactive mitigation of combined exposure risks and provide a foundation for future public health interventions.

How to cite: Zheng, M., Zhang, T., Xiang, Y., Liu, Y., Li, J., Tian, Y., Wang, Q., Du, Y., Wang, Q., Li, T., and Zhu, T.: The Health Impacts of Combined Exposure to Air Pollution and Extreme Weather in China, EGU General Assembly 2026, Vienna, Austria, 3–8 May 2026, EGU26-15947, https://doi.org/10.5194/egusphere-egu26-15947, 2026.

EGU26-16081 | ECS | Posters on site | AS3.30

Spatial and Temporal Analysis of Aerosol Levels in Colombia Using Aerosol Optical Depth (AOD) 

Johana M. Carmona-García, Roberto Rojano Alvarado, and Ana Yael Vanoye-García

Air pollution is one of the primary environmental concerns in public health, resulting in millions of premature deaths annually. Particulate matter (PM) is an important indicator of atmospheric pollution due to its ability to penetrate the lungs and cardiovascular system. However, the spatial and temporal coverage of air quality measurements remains a considerable challenge. In Colombia, there are 23 Air Quality Monitoring Systems, of which only 48% have adequate temporal representativeness. Currently, 209 monitoring sites have been installed, distributed in 63% of the departments and covering only 8% of the municipalities. However, only 39% of these sites are in operation, covering 43% of the departments and 4% of the municipalities. This limitation highlights the need to explore alternative and complementary estimates to obtain a more comprehensive understanding of air quality in the country. In this context, analyzing satellite-derived Aerosol Optical Depth (AOD)  is essential to understanding the dynamics of atmospheric pollution and assessing its impact on climate and public health. This study analyzes changes in aerosol levels in Colombia using AOD, with the aim of identifying spatial and temporal patterns in the Caribbean, Andean, Pacific, Orinoquía, and Amazon subregions. The MAIAC collection 6.1 algorithm in Google Earth Engine (GEE) was used to analyze annual AOD data over a 20-year period, from 2005 to 2024. The results indicate that the Orinoquía and Amazon regions showed the greatest increases in aerosol levels, possibly associated with activities such as deforestation and biomass burning. A notable finding was the link between the highest aerosol levels and dry periods associated with the El Niño phenomenon, which promotes forest fires and the resuspension of soil particles. In contrast, the lowest aerosol levels were recorded during La Niña periods, characterized by wetter and cooler conditions. In 2020, despite the reduction in anthropogenic activity due to the COVID-19 pandemic lockdown, high aerosol levels were observed in the coastal and continental areas of Colombia. These elevated levels can be attributed to a high incidence of forest fires and the entry of intercontinental air masses loaded with Saharan dust. The study highlights the complexity of pollution sources and the need to consider both anthropogenic and natural factors. The approach used allowed for a detailed analysis of the distribution and changes in aerosol levels across different subregions of the country.

How to cite: Carmona-García, J. M., Rojano Alvarado, R., and Vanoye-García, A. Y.: Spatial and Temporal Analysis of Aerosol Levels in Colombia Using Aerosol Optical Depth (AOD), EGU General Assembly 2026, Vienna, Austria, 3–8 May 2026, EGU26-16081, https://doi.org/10.5194/egusphere-egu26-16081, 2026.

EGU26-17250 | ECS | Posters on site | AS3.30

Satellite-AOD and Machine Learning for Urban Air Quality and HealthRisk Assessment in the Indo-Gangetic Plain 

Vishal Sengar, Manuj Sharma, and Suresh Jain

Satellite based remote sensing techniques have proved effective in estimating critical pollutants concentration especially in regions which lack spatial coverage due to limited ground-based monitoring stations. This study presents a comprehensive, data-driven framework for evaluating urban air quality and associated health risks across the Indo-Gangetic Plain (IGP), a critically polluted region characterised by limited ground-based monitoring coverage. High-resolution satellite observations namely Aerosol Optical Depth (AOD) from MODIS-MAIAC and tropospheric ozone (O3) from Sentinel-5P TROPOMI were integrated with meteorological parameters to estimate surface-level concentrations of PM2.5, PM10, and O3 for 16 major cities across the IGP during the period 2020–2024. A Random Forest (RF) modelling approach demonstrated strong predictive performance (R2 = 0.94 for PM2.5/PM10 and 0.84 for O3; RMSE = 8.03–14.02 µg m-3; Index of Agreement > 0.96). Estimates of the relative risk (RR) of mortality attributable to long-term PM2.5 exposure indicated a substantial health burden in cities such as Delhi, Patna, and Kanpur, highlighting the pressing need for targeted mitigation and intervention strategies. The integrated satellite-machine learning framework effectively identifies pollution hotspots, enables robust exposure assessment, and addresses critical data gaps, thereby strengthening the scientific basis for informed decision-making. The findings provide actionable insights for the development of evidence-based, region-specific clean air action plans, contributing to enhanced urban liveability, improved environmental governance, and greater social equity. The novelty of this work lies in the combined use of satellite-derived AOD, TROPOMI-based O3 observations, meteorological variables, and machine learning techniques to simultaneously predict PM2.5, PM10, and O3 concentrations and assess associated health risks across the IGP. By advancing progress towards Sustainable Development Goals 3.9, 11.6, and 13, this research supports the transition towards healthier, more resilient, and sustainable urban environments in South Asia.

Keywords: Aerosols, Satellite Observations, Predictive Modelling Framework, Relative Risk


How to cite: Sengar, V., Sharma, M., and Jain, S.: Satellite-AOD and Machine Learning for Urban Air Quality and HealthRisk Assessment in the Indo-Gangetic Plain, EGU General Assembly 2026, Vienna, Austria, 3–8 May 2026, EGU26-17250, https://doi.org/10.5194/egusphere-egu26-17250, 2026.

EGU26-17411 | ECS | Posters on site | AS3.30

A Comparative Analysis of Air Quality (PM2.5) and Its Health Impact in Central Asia 

Lorena Vega Garcia, Alexandre Caseiro, Seán Schmitz, Mark Lawrence, and Erika von Schneidemesser

Air pollution, particularly fine particulate matter (PM2.5), presents a significant environmental health risk in Central Asia, where scientific understanding and monitoring systems remain limited. This study provides a comprehensive analysis of PM2.5 concentrations and their associated health impacts in the capital cities of Kazakhstan, Kyrgyzstan, Tajikistan, Turkmenistan, and Uzbekistan – Astana, Bishkek, Dushanbe, Ashgabat, and Tashkent – during the period 2010-2019. A fused dataset combining satellite-derived estimates with CAMS reanalysis outputs was developed to produce daily, spatially refined PM2.5 concentrations for the region.

All five cities exceeded the WHO annual guideline of 5 µg/m³, with Ashgabat and Tashkent recording the highest annual averages, surpassing 25 µg/m³. Using the AirQ+ model, a Health Impact Assessment (HIA) was performed for chronic obstructive pulmonary disease (COPD) and lung cancer (LC) in adults aged 25 and older. Attributable COPD mortality under the background pollution scenario (2.4 µg/m³) reached up to 34 cases per 100,000 in Bishkek, with attributable proportions ranging from 9% to 21% across cities. LC burdens, although lower in absolute numbers, showed attributable fractions between 9% and 20% in Ashgabat and Tashkent, corresponding to 2 - 3 deaths per 100,000 – values comparable to estimates from studies in similarly polluted urban areas.

Scenario analysis revealed that reducing PM2.5 to the WHO guideline of 5 µg/m³ would cut COPD and LC mortality by up to 80% in the most polluted cities. Notably, even moderate reductions, such as reaching the WHO Interim Target-3 of 15 µg/m³, already yielded substantial health benefits. These findings emphasize the urgent need for targeted air quality interventions and stricter regulatory standards across Central Asia.

How to cite: Vega Garcia, L., Caseiro, A., Schmitz, S., Lawrence, M., and von Schneidemesser, E.: A Comparative Analysis of Air Quality (PM2.5) and Its Health Impact in Central Asia, EGU General Assembly 2026, Vienna, Austria, 3–8 May 2026, EGU26-17411, https://doi.org/10.5194/egusphere-egu26-17411, 2026.

Renewable energy shortages usually refer to prolonged periods of low wind speeds and reduced solar irradiance, which pose a significant threat to the stability of electricity supply. In future energy systems, fossil‑fuel power plants are typically relied upon to compensate for such energy deficits. By integrating an electricity system model with a chemical transport model, this study quantifies the impacts of renewable energy shortages on air quality in China during the 2050s. Our results show that under high‑renewable‑penetration scenarios, renewable energy shortages can increase PM2.5 concentrations by up to 30% and O3 levels by up to 20%. Incorporating these health‑related externalities into renewable capacity planning could significantly reduce electricity generation from fossil‑fuel plants, compared to scenarios that neglect these air‑quality impacts. These findings highlight the critical importance of integrating health‑cost considerations into energy system design.

How to cite: Shen, L.: Impacts of renewable energy shortages on air quality, EGU General Assembly 2026, Vienna, Austria, 3–8 May 2026, EGU26-20677, https://doi.org/10.5194/egusphere-egu26-20677, 2026.

EGU26-21118 | ECS | Posters on site | AS3.30

Influence of Seasonal Emissions, Regional Transport, and Particle Morphology on PM2.5-Bound Elements in Rural Northern India 

Riya Sharma, Hariparasad Puttaswamy, and Sudhir Tyagi

Rural environments play a critical role in shaping regional air quality and atmospheric chemistry due to their distinct emission sources, seasonal activities, and meteorological conditions. This study investigates the seasonal variability of PM2.5 mass concentrations and their associated major and trace elements in a rural region of Uttar Pradesh, India, based on day- and nighttime sampling conducted from July 2023 to May 2024. A total of 135 samples were collected and analysed for elemental composition. In total, 31 elements (Li, B, Na, Mg, Al, P, K, Ca, Ti, V, Cr, Mn, Fe, Co, Ni, Cu, Zn, As, Se, Rb, Sr, Y, Zr, Mo, Ag, Cd, Sn, Sb, Ba, Pb, Bi) were quantified using ICP–MS.

Seasonal analysis revealed that nighttime PM2.5 levels were consistently higher than daytime concentrations (1.3–1.5 times higher), with the highest mass loadings observed during the post-monsoon season, followed by the winter, pre-monsoon, and monsoon seasons. In contrast, elemental concentrations peaked in winter despite lower PM2.5 mass relative to the post-monsoon period, indicating stronger influences from combustion and industrial emissions along with reduced atmospheric dispersion. Enrichment factor (EF) analysis revealed a strong enrichment of anthropogenic elements (K, Cu, Zn, Pb, Sb, Bi), while crustal elements (Ca, Al, Fe, Mg, Ti) exhibited low EF values, confirming a significant contribution from soil and resuspended dust. FTIR analysis further revealed seasonal shifts in functional groups, with higher contributions of organic and carbonyl species in winter and post-monsoon periods.

Principal Component Analysis (PCA) identified major source categories—including biomass burning, industrial emissions, and traffic-related sources in agreement with EF-derived source signatures. HYSPLIT back-trajectory analysis further demonstrated the influence of regional long-range transport on seasonal aerosol composition. SEM–EDX morphological analysis also revealed clear seasonal differences in particle size and structure, with substantially higher particle loading during the winter and post-monsoon seasons.

Health risk assessment indicated substantially elevated risks during winter, with carcinogenic risk increasing by ~1.8-fold relative to post-monsoon and ~2.3-fold relative to monsoon, and non-carcinogenic hazards rising by 0.5–7.6-fold across seasons. Elements such as Pb, Cr, V, and Mn were the dominant contributors to both carcinogenic and non-carcinogenic risks.

Overall, the findings highlight the significant influence of seasonal emission patterns, combustion activities, and atmospheric dynamics on shaping the composition of rural aerosols and their associated health impacts.


Keywords: Particulate matter; Elements Analysis: Principal component analysis; Enrichment factor; Health risk assessment.


How to cite: Sharma, R., Puttaswamy, H., and Tyagi, S.: Influence of Seasonal Emissions, Regional Transport, and Particle Morphology on PM2.5-Bound Elements in Rural Northern India, EGU General Assembly 2026, Vienna, Austria, 3–8 May 2026, EGU26-21118, https://doi.org/10.5194/egusphere-egu26-21118, 2026.

EGU26-21724 | ECS | Orals | AS3.30

Global Health Map: Coupling EMAC and KM-SUB-ELF to estimate air pollution health effects using accurate iron soluble fractions 

Matteo Krüger, Klaus Klingmüller, Simon Rosanka, Johannes Lelieveld, Ulrich Pöschl, Andrea Pozzer, and Thomas Berkemeier

Large-scale atmospheric chemistry-climate models such as the ECHAM/MESSy Atmospheric Chemistry model (EMAC) are capable of accurately describing the composition and distribution of air pollutants on a global scale. On the other hand, small-scale multiphase models are developed to investigate health-related effects of air pollutants. The kinetic multi-layer model for surface and bulk chemistry in the epithelial lining fluid (KM-SUB-ELF) simulates chemical reactions and mass transport in the human lung, allowing for accurate estimations of the production and persistence of reactive oxygen species (ROS), hydroxyl radicals (OH) and damage to biomolecules. In recent publications, KM-SUB-ELF has been extended to consider endogenous production and transport of ROS through membranes in the lung, opening the avenue of mechanistically investigating the effects of air pollution on various diseases that have been linked to particulate matter exposure in epidemiological studies.

In this work, we present a multi-scale modelling approach to link large-scale atmospheric chemistry-climate models with small-scale multiphase kinetic models to derive a global health map. We use the chemistry-climate model EMAC to derive air pollutant distributions with various time resolutions. As studies suggested that metals capable of redox cycling (especially iron and copper) play a dominant role in the exogenous production of ROS and thus particulate matter toxicity, we focus on an accurate distribution of compounds containing iron.

In this work, we bring together the latest scientific developments in both global climate and multiphase chemical kinetics modelling, enabling a state-of-the-art evaluation of the global health burden of air pollution. Our multi-scale modelling approach yields air pollutant health effect simulations with accurate resolution in both space and time, contributing to the unravelling of the complex association of air pollutant emission profiles with epidemiological observations.  The non-linearity of KM-SUB-ELF permits an evaluation of averaging effects over space and time, a common practice in the association of air pollutant profiles with epidemiological observations.

How to cite: Krüger, M., Klingmüller, K., Rosanka, S., Lelieveld, J., Pöschl, U., Pozzer, A., and Berkemeier, T.: Global Health Map: Coupling EMAC and KM-SUB-ELF to estimate air pollution health effects using accurate iron soluble fractions, EGU General Assembly 2026, Vienna, Austria, 3–8 May 2026, EGU26-21724, https://doi.org/10.5194/egusphere-egu26-21724, 2026.

EGU26-21844 | ECS | Posters on site | AS3.30

Spatiotemporal variations of ground-level ozone on public health in megacities: a continuous analysis of Shenzhen, China 

Han Wang, Jiayi Fu, Hao Huang, Junmao Zhang, Xi Tan, Honggang Ni, and Jiansheng Wu

Ground-level ozone pollution poses significant public health risks globally, necessitating spatially-resolved governance strategies. Utilizing real-time monitoring data from China's National Environmental Monitoring Network (2017–2021), this study establishes localized exposure-response relationships for Shenzhen through meta-analytic synthesis and BenMAP-CE modeling, quantifying spatial-temporal health burdens. The results found that: (1) the ozone concentration in Shenzhen exhibited fluctuating patterns between seasons and years, indicating an overarching decline between 2017 and 2021 and a peak annual average was observed in 2019; (2) the disease- risk hierarchy was found that cardiovascular mortality with the highest susceptibility (RR=1.0092), followed by respiratory diseases (RR=1.0063), and all-cause non-accidental mortality (RR=1.0046); and (3) severe health burdens were mainly concentrated in western industrial zones in Shenzhen. The study provides insights into the spatial-temporal distribution of ozone pollution and its health impacts in Shenzhen, and the results confirm that ozone control must prioritize megacity emission hotspots and seasonal peaks. Future research should integrate microenvironmental exposure assessment, toxicological mechanisms, and demographic stratification to advance spatially-precise governance in megacities.

How to cite: Wang, H., Fu, J., Huang, H., Zhang, J., Tan, X., Ni, H., and Wu, J.: Spatiotemporal variations of ground-level ozone on public health in megacities: a continuous analysis of Shenzhen, China, EGU General Assembly 2026, Vienna, Austria, 3–8 May 2026, EGU26-21844, https://doi.org/10.5194/egusphere-egu26-21844, 2026.

EGU26-23194 | Orals | AS3.30

Air Pollution and Health Impacts in Southeast Asia under Present and Future Climate 

Steve Hung Lam Yim, Tingting Fang, Jie Hu, Jiaying Li, and Yefu Gu

Southeast Asia faces escalating air quality challenges driven by rapid development, climate change, and transboundary pollution, with significant implications for human health. This talk will summarize the recent regional modelling studies in NTU Centre for Climate Change for Environmental Health (CCEH) that quantifies present-day and future health impacts of surface ozone (O₃) and fine particulate matter (PM2.5) across Southeast Asia under different emission and climate pathways. Using state-of-the-art chemical transport and climate–air quality models, we assess pollutant formation regimes, source contributions, and premature mortality under current conditions and future Shared Socioeconomic Pathways (SSPs).

We find that urban O3 in major Southeast Asian cities is sensitive to both nitrogen oxides (NOₓ) and volatile organic compounds (VOCs), requiring synergistic precursor controls, while suburban, rural, and maritime regions remain predominantly NOₓ-limited. Under sustainable emission pathways, O₃-attributable premature mortality is projected to decline substantially by mid-century, whereas high-emission scenarios lead to marked increases. For PM2.5, Southeast Asia is largely ammonia-rich, limiting the effectiveness of NH₃ controls, while reductions in VOCs and sulfur dioxide are more effective in lowering secondary PM2.5. Although climate change is projected to slightly reduce regional PM2.5 concentration, PM2.5-attributable premature mortality is expected to increase due to demographic changes, resulting in substantial economic losses. We further show that haze pollution is shaped by both local emissions and transboundary transport, strongly modulated by climate variability such as El Niño and the Indian Ocean Dipole. Overall, integrated air quality and climate policies are essential to mitigate future health burdens in Southeast Asia.

How to cite: Yim, S. H. L., Fang, T., Hu, J., Li, J., and Gu, Y.: Air Pollution and Health Impacts in Southeast Asia under Present and Future Climate, EGU General Assembly 2026, Vienna, Austria, 3–8 May 2026, EGU26-23194, https://doi.org/10.5194/egusphere-egu26-23194, 2026.

EGU26-980 | ECS | Posters on site | AS3.31

Influence of Fuel Standards on Vehicular Emissions: Assessing the Impact of Bharat Stage Regulations in Urban Idling Conditions (Black Carbon and Carbon Monoxide) 

Amir Ali, Azajul Haque, Anjanay Pandey, Vikram Singh, and Mayank Kumar

Accurately constraining real-world vehicular emissions remains a major challenge for megacities where certification values often fail to represent on-road behaviour. To address this gap for Delhi, we conducted near-tailpipe measurements of Black Carbon (BC), Carbon Monoxide (CO), and Carbon Dioxide (CO2) from a representative fleet of 42 gasoline Two-Wheelers (2Ws) and Light-Duty Vehicles (LDVs) across Bharat Stage (BS) III, IV, and VI categories. Emissions were quantified under controlled idling and high-idling conditions using an Aethalometer AE33 for BC and Horiba/LI-850 analysers for CO and CO2, with fuel-based emission factors derived through carbon-balance calculations. To incorporate real-world usage, active in-use fleet fractions (45% for 2Ws and 60% for LDVs) were applied to estimate idling-related fuel demand. Annual idling fuel consumption was 24.93 × 10³ ton for Two-Wheelers and 79.75 × 10³ ton for LDVs, corresponding to 5.7% and 14% of their respective total fuel use. These mode-specific contributions were used as weighting factors for composite BC, CO, and CO2 emission factors. Measured idle emission factors averaged 1.24 mg km-1 (BC) and 5.11 g km-1 (CO) for Two-Wheelers, and 0.10 mg km-1 (BC) and 0.72 g km-1 (CO) for Light-Duty Vehicles. BS VI vehicles exhibited more than an order-of-magnitude reduction in BC compared with BS III–IV, confirming the efficiency of newer emission-control technologies. However, strong heavy-tailed behaviour was observed: approximately 30% of the fleet contributed nearly 80% of total BC emissions, indicating a pronounced super-emitter segment. Fuel-scaled annual emissions for Delhi’s gasoline fleet were estimated as 0.029 Gg yr-1 (BC), 100.86 Gg yr-1(CO), and 2.86 Mt yr-1 (CO2). The findings underscore the substantial impact of ageing and poorly maintained vehicles on urban pollution burdens and provide high-resolution, measurement-based emission factors essential for improved inventories and targeted mitigation strategies.

How to cite: Ali, A., Haque, A., Pandey, A., Singh, V., and Kumar, M.: Influence of Fuel Standards on Vehicular Emissions: Assessing the Impact of Bharat Stage Regulations in Urban Idling Conditions (Black Carbon and Carbon Monoxide), EGU General Assembly 2026, Vienna, Austria, 3–8 May 2026, EGU26-980, https://doi.org/10.5194/egusphere-egu26-980, 2026.

EGU26-1706 | Orals | AS3.31

From air to rail: Carbon mitigation through modal shift in China’s intercity transport 

Jun Liu, Yating Hou, Haowen An, Ge Song, Denise Mauzerall, Zbigniew Klimont, Qiang Zhang, and Tong Zhu

Decarbonizing the transportation sector is a critical component of global climate change mitigation strategies. Achieving net-zero emissions in aviation remains particularly challenging due to the sector’s heavy reliance on carbon-intensive liquid fuels, as well as the substantial climate forcing from non-CO2 effects such as contrails. In China, the rapid expansion of high-speed rail (HSR) provides a promising alternative to short- and medium-haul flights and has the potential to directly reduce aviation demand. However, the magnitude of its contribution to emission mitigation remains uncertain. In this study, we employ a difference-in-differences approach to quantify the causal impact of HSR introduction on domestic civil aviation in China. We estimate CO2 emissions from both aviation and HSR, and further assess the additional substitution and mitigation potential of HSR under a set of future scenarios. Our results show that, between 2008 and 2019, the introduction of HSR led to a 24% reduction in aviation-related CO2 emissions among city pairs connected by HSR. In 2019, CO2 emissions from civil aviation and HSR were estimated at 87.0 and 17.9 Mt, respectively. Given the existing aviation and HSR networks in 2019, HSR operations could reduce aviation CO₂ emissions by approximately 9.1 Mt (10%). Under enhanced substitution conditions—assuming passengers are willing to extend travel time by up to two hours when switching to HSR, combined with power system decarbonization and full-speed HSR operation—the net mitigation potential increases to 50.6 Mt (48%) for the combined civil aviation and HSR transport system. Our findings demonstrate that HSR expansion can deliver substantial climate benefits by decarbonizing the civil aviation sector. With rising environmental awareness, continued electricity decarbonization, and accelerated HSR development, significantly larger emission reductions can be achieved through intermodal substitution.

How to cite: Liu, J., Hou, Y., An, H., Song, G., Mauzerall, D., Klimont, Z., Zhang, Q., and Zhu, T.: From air to rail: Carbon mitigation through modal shift in China’s intercity transport, EGU General Assembly 2026, Vienna, Austria, 3–8 May 2026, EGU26-1706, https://doi.org/10.5194/egusphere-egu26-1706, 2026.

EGU26-2272 | ECS | Posters on site | AS3.31

A double-box model for aircraft exhaust plumes based on the MADE3 aerosol microphysics 

Monica Sharma, Mattia Righi, Johannes Hendricks, Anja Schmidt, Daniel Sauer, and Volker Grewe

Aviation emissions at typical cruise altitude (~9-13 km) consists of a blend of chemical components including aerosols and their precursor gases, affecting the Earth's radiation budget via both direct and indirect aerosol effects, resulting in a significant climate effect. Current estimates of aviation-induced climate effects are based on coarse-resolution global aerosol-climate models, which are not able to resolve the microphysical processes at the aircraft plume scale. This results in large uncertainties in the aviation-induced impact on aerosol number and size, which are key quantities for estimating the aerosol indirect effect, especially for low-level liquid-phase clouds. A double-box aircraft exhaust plume model is developed to explicitly simulate the aerosol microphysics inside the dispersing aircraft exhaust plume, together with a simplified representation of the vortex regime (which begins ∼ 10 s after emission and captures the dynamics of aerosol particle interactions with contrail ice particles). This study focuses specifically on sulfate (SO4) and soot aerosols, as well as the total number concentration of aviation-induced aerosol particles. The plume model is used to quantify aviation-induced aerosol number concentrations at the end of the dispersion regime where the exhaust has dispersed on scales resolved by global models (~46 h), and the results are compared with those from the instantaneous dispersion approach commonly used in global models. The difference between the two approaches is defined as the plume correction. For typical North Atlantic cruise conditions, the plume correction ranges from −15% (with contrail ice in the vortex regime) to −4.2% (without contrail ice). A tendency-based process analysis shows that the negative value of the plume correction is due to the higher efficiency of coagulation process in the plume approach, leading to lower total particle number concentrations compared to the instantaneous dispersion approach. Sensitivity studies performed for different world regions highlight the role of background conditions for the plume-scale processes, with the plume correction varying between −12 % for Europe and −42 % for China. Parametric studies performed on various aviation emission parameters used to initialise the plume model demonstrate the strong influence of contrail ice in the vortex regime, which substantially reduces aerosol number concentrations in the plume approach. They also show a large sensitivity towards aviation fuel sulfur content, as SO2 emissions and subsequent H2SO4 formation are key drivers of nucleation. The plume model can be directly implemented in coarse-resolution global aerosol–climate models or used as offline parametrisation to constrain quantifications of the climate effects of aviation-induced aerosol particles.

How to cite: Sharma, M., Righi, M., Hendricks, J., Schmidt, A., Sauer, D., and Grewe, V.: A double-box model for aircraft exhaust plumes based on the MADE3 aerosol microphysics, EGU General Assembly 2026, Vienna, Austria, 3–8 May 2026, EGU26-2272, https://doi.org/10.5194/egusphere-egu26-2272, 2026.

EGU26-2854 | ECS | Orals | AS3.31

Preliminary Data Analysis of the 2023 Boeing ecoDemonstrator Explorer SAF Emissions and Contrail Project 

Rose Miller, Steven Baughcum, Timothy Rahmes, Colin Tully, William Griffin, Richard Moore, Richard Miake-Lye, Christiane Voigt, Daniel Sauer, Raphael Märkl, Rebecca Dischl, Anke Roiger, and George Dalakos

In October 2023, Boeing and NASA conducted a joint flight and ground experiment based out of Paine Field in Everett, Washington. This experiment measured the emissions and contrail properties of a Boeing 737-10 equipped with CFM LEAP-1B engines, utilizing the NASA DC-8 airborne laboratory as a chase aircraft. The experiment measured and evaluated particulate emissions and contrail properties from three fuel types over 11 flights and two ground tests.  In-situ flight measurements on the DC-8 were typically conducted at distances ranging from 1 to 20 nautical miles behind and within a vertical range of +/- 100 feet of the altitude of the 737-10 for both contrail and plume sampling. Atmospheric conditions ranged from ice supersaturation for persistent contrails to subsaturated temporary contrails to non-contrail conditions. The fuels tested included low sulfur Jet A, 100% paraffinic sustainable aviation fuel, and local Jet A.  Significant efforts were made to minimize fuel mixing to avoid contamination with sulfur and/or aromatics across fuel types.

Here we present preliminary data analyses from both the ground test and in-flight measurements, focusing on the measurements of total particles, non-volatile particles measured after passing through a 350C thermal denuder, and ice particle concentration measured using a Cloud Aerosol Spectrometer (CAS) and contrasting the results for different fuel types. Differences in particulate matter with fuel type were also captured by the NASA high-spectral-resolution lidar (HSRL) High Altitude Lidar Observatory (HALO) Water Vapor differential absorption lidar (DIAL) instrument, which sampled approximately 1,000-5,000 ft above the contrails made by the Boeing 737-10.   Challenges of using instruments originally developed for particle measurements in clear air to the more complicated environment of an ice cloud such as a contrail will be discussed.

This presentation will also highlight challenges related to logistics, fuel handling, and sampling in contrails, which highlights the complex interactions between atmospheric chemistry and microphysical processes in cloud formation and ice nucleation. Next steps will encompass future campaign needs, outstanding research questions, and measurement techniques.

How to cite: Miller, R., Baughcum, S., Rahmes, T., Tully, C., Griffin, W., Moore, R., Miake-Lye, R., Voigt, C., Sauer, D., Märkl, R., Dischl, R., Roiger, A., and Dalakos, G.: Preliminary Data Analysis of the 2023 Boeing ecoDemonstrator Explorer SAF Emissions and Contrail Project, EGU General Assembly 2026, Vienna, Austria, 3–8 May 2026, EGU26-2854, https://doi.org/10.5194/egusphere-egu26-2854, 2026.

EGU26-2951 | ECS | Posters on site | AS3.31

The role of volatile particulate matter in simulated contrail AEI ice compared to the Boeing ecoDemonstrator campaign 

Colin Tully, Steven Baughcum, and Rose Miller

Preliminary data analyses from the 2023 joint NASA and Boeing ecoDemonstrator campaign indicate that volatile particulate matter (vPM) contributed significantly to the measured ice emissions indices (AEI ice) as non-volatile PM (i.e., soot) emissions were very low for the particular engine studied. Similarly, as the fuel sulfur contents of the two primary fuels tested during the campaign were also very low, it is likely that lubrication oil vented from the engine into the core flow of the exhaust made up a large portion of the vPM; however, there is very little measurement data to verify this claim. Widely available modelling tools are now starting to include simplified vPM activation parameterizations in their contrail ice formation schemes, without the necessary data for evaluation. This may overstate the climate impacts of the simulated contrails, which has broader implications on contrail mitigation strategies.

In this study, the pycontrails model was adapted to include the properties of the fuels used during the ecoDemonstrator campaign. The current vPM activation scheme in the model follows a competition-based, temperature-dependent approach for ice formation, where a constant vPM concentration competes for available water vapor with emitted soot particles (non-volatile PM) and ambient aerosol particles. Temperature values are sourced from meteorological input data to the model that is subject to some uncertainty. To test the temperature sensitivity of the vPM activation scheme on the predicted AEI ice, this study will compare model output between meteorological initializations using ERA5 reanalysis data and similar parameters measured during the 2023 ecoDemonstrator campaign. Comparisons are also made with measured AEI ice values.

This study will provide insights into how simple treatments of particle activation are likely to be highly influenced by the input assumptions of the model. The findings will help to determine future campaign goals that aim to make measurements of vPM more thoroughly as well as identify key sensitivities to test in future contrail modeling intercomparison projects.

How to cite: Tully, C., Baughcum, S., and Miller, R.: The role of volatile particulate matter in simulated contrail AEI ice compared to the Boeing ecoDemonstrator campaign, EGU General Assembly 2026, Vienna, Austria, 3–8 May 2026, EGU26-2951, https://doi.org/10.5194/egusphere-egu26-2951, 2026.

EGU26-3154 | ECS | Orals | AS3.31

Six-year DOAS observations reveal post-2020 rebound of ship SO2 emissions in a Shanghai port despite low-sulfur fuel policies 

Jiaqi Liu, Shanshan Wang, Yan Zhang, Mark Wenig, Sheng Ye, and Bin Zhou

The expansion of maritime trade has made ship emissions a significant target for SO2 reduction policies. However, there is still a lack of observational data to reflect the long-term changes in SO2 emission from ships. This study conducted continuous observational experiments using Differential Optical Absorption Spectroscopy (DOAS) from 2018 to 2023 in a shipping channel in Shanghai, China. By employing machine learning for gap filling and meteorological normalization, the trends of ambient SO2 related to ship emissions over the six-year period were revealed. Furthermore, whether ships in the channel were using low-sulfur fuels was determined by a decomposition of SO2-rich plumes signals (which reflect high-emission ships) and baseline variations. The findings indicate that ship activities increased ambient SO2 concentrations in the channel by 0.48 ± 0.25 ppbv (43.24% of urban background levels). During the policy adjustment phase (2018 to 2020), Ship related SO2 levels declined steadily due to low-sulfur fuel regulations. While from 2021 to 2023 (the policy stabilization phase), increased ship activity became the dominant driver of rising ship related SO2 levels. Despite policy effectiveness, excessive emissions from cargo ships persisted throughout the study period, suggesting that the emission inventory could be overestimating the actual abatement effectiveness of the policy. This study quantified the contribution of ship emissions to ambient SO2 during 2018–2023 based on observations, evaluating the effectiveness of low-sulfur policies and supporting ongoing efforts to mitigate SO2 pollution from maritime activities. The methodology developed here can be adapted to other global shipping channels, providing a framework for monitoring and regulating ship emissions worldwide.

How to cite: Liu, J., Wang, S., Zhang, Y., Wenig, M., Ye, S., and Zhou, B.: Six-year DOAS observations reveal post-2020 rebound of ship SO2 emissions in a Shanghai port despite low-sulfur fuel policies, EGU General Assembly 2026, Vienna, Austria, 3–8 May 2026, EGU26-3154, https://doi.org/10.5194/egusphere-egu26-3154, 2026.

EGU26-3555 | ECS | Posters on site | AS3.31

Predicting Aviation Contrail Occurrence Using Bayesian Population Statistics From Reanalysis Data 

Daniel Williams, Cyril Morcrette, and James Haywood

Despite the ongoing climate crisis and recent pandemic-induced disruption, the aviation sector is expected to experience 5% annual growth over the next decade. While the industry moves towards decarbonisation through use of sustainable fuels and improved operating practices, the contribution by non-CO2 effects become ever more apparent. Contrails and contrail-induced cirrus clouds contribute an estimated 57% to the sector’s total effective radiative forcing (ERF). Contrail avoidance methods are gaining ground as tools to strategically reroute flights to reduce their ERF by predicting contrail forming regions in advance.

The task of prediction remains a challenge however, with typical methodologies employing either highly parametrised models that suffer from uncertainties, or machine learning methods that are heavily abstracted away from the background physics. We propose a novel, robust method for contrail prediction that leverages large-scale population behaviours. Using ERA-5 reanalysis and the OpenContrails dataset for over 50,000 confirmed contrails between 2019 and 2020 over North America, we train an informed contrail predictor using Bayesian methods which we verify on unseen data. We will present the results and statistical evaluation of this model, which we believe provides a scalable but interpretable contrail predictor that could be run using output from numerical weather prediction models. 

How to cite: Williams, D., Morcrette, C., and Haywood, J.: Predicting Aviation Contrail Occurrence Using Bayesian Population Statistics From Reanalysis Data, EGU General Assembly 2026, Vienna, Austria, 3–8 May 2026, EGU26-3555, https://doi.org/10.5194/egusphere-egu26-3555, 2026.

EGU26-4027 | ECS | Orals | AS3.31

Quantifying the impact of maritime AIS-based emissions on Gulf of Mexico coastal air quality using high-resolution modelling 

Mauro Cortez-Huerta, Leandro Cristian Segado-Moreno, Rodolfo Sosa Echeverría, Gilberto Fuentes García, José María Baldasano, Juan Pedro Montavez, and Pedro Jiménez-Guerrero

Air quality is a critical factor in both public health and environmental protection, particularly in coastal regions that are heavily influenced by maritime activity. This study quantifies the contribution of shipping emissions to atmospheric pollutant levels in coastal areas along the Gulf of Mexico, an important international trade hub.

The WRF-Chem v4.5.2 model was used with a horizontal resolution of 5x5 km and 38 vertical levels. The MOZART chemistry mechanism was coupled with the MOSAIC aerosol scheme, and the model was run with an hourly temporal resolution. Maritime emissions were derived from Automatic Identification System (AIS) data, while terrestrial emissions were represented using the CAMS inventory. Representative case studies were identified through long-term synoptic analysis based on 30 years using HYSPLIT. This analysis applied frequency and cluster analysis to air mass transport patterns enabled the dominant synoptic transport components over the Gulf of Mexico to be identified: northerly (N), northeasterly (NE), easterly (E), southeasterly (SE) and northwesterly (NW) flows. These collectively represent over 85% of prevailing atmospheric circulation conditions in the region. For each synoptic component, a representative case study was selected consisting of a four-day simulation period, excluding model spin-up time. Two numerical experiments were conducted for each synoptic component: one including ship emissions, and one excluding them while keeping all other emission sources constant.

The model results were evaluated using observations from 116 air quality monitoring stations (AQMS) located no more than 10 km from the coastline. The results show that shipping emissions have a significant impact on coastal air quality, which varies depending on the pollutant. Of the primary pollutants, nitrogen dioxide (NO2) was found to be the most sensitive to maritime emissions. Maximum contributions were found to be 37% under SE flow and 29% under E conditions, reflecting the efficient transport of emissions from major shipping corridors onto land. Sulfur dioxide (SO2) contributions peaked at around 13% under SE flow, highlighting the impact of fuel sulfur content and shipping density. Particulate matter concentrations were also notably affected, with PM10 contributions exceeding 20% under NE and SE regimes, while PM2.5 exhibited maximum increases of around 15% under E transport. For secondary pollutants, ozone (O3) formation showed positive contributions of up to 15% under E flow, highlighting the role of NOX derived from ships in photochemical processes. In contrast, carbon monoxide (CO) had comparatively smaller impacts, with maximum contributions below 9%. While observed concentrations generally remain within air quality limits, the relative contribution of shipping emissions is significant and represents an important emerging pressure on coastal air quality.

These findings demonstrate that maritime emissions significantly influence pollutant levels in the coastal areas of the Gulf of Mexico, particularly under dominant synoptic regimes. The results emphasize the importance of including shipping emissions in regulatory and mitigation strategies and highlight the need to strengthen the regional implementation and enforcement of MARPOL (Annex VI) regulations to protect air quality and public health in coastal environments.

How to cite: Cortez-Huerta, M., Segado-Moreno, L. C., Sosa Echeverría, R., Fuentes García, G., Baldasano, J. M., Montavez, J. P., and Jiménez-Guerrero, P.: Quantifying the impact of maritime AIS-based emissions on Gulf of Mexico coastal air quality using high-resolution modelling, EGU General Assembly 2026, Vienna, Austria, 3–8 May 2026, EGU26-4027, https://doi.org/10.5194/egusphere-egu26-4027, 2026.

Abstract: Rapid motorization has established urban road transportation as a dominant contributor to both carbon dioxide (CO2) and air pollutants. However, the long-term co-evolution and potential for synergistic mitigation of greenhouse gases and air pollutants remain to be further quantified at the high-resolution city-fleet scale. Here, we present a comprehensive, vehicle-fleet-based emission dataset for 338 Chinese cities spanning 1985–2023, quantifying CO2, seven air pollutants (NOx, CO, PM2.5, VOCs, SO2, OC, BC), and specialized organic aerosol precursors (I/S/LVOCs ) with 1 km spatial resolution. Our analysis shows that the relationship between urban carbon emissions and pollutant emissions has undergone a profound transition from early synergistic growth to a subsequent period of divergent decoupling. Driven by the stringent implementation of China I to VI emission standards, the seven pollutants have peaked and entered a sustained decline, achieving reductions of 35.7%–84.2% by 2023 relative to their historical peaks. Conversely, while CO2 emissions have not yet peaked, they have begun to decouple from the exponential growth of the vehicle population (VP).  We further reveal that this divergence is driven by unbalanced contributions of key factors: the substantial negative contribution of pollution intensity (pollutant/CO2) has effectively offset the pressures from motorization, whereas carbon intensity (CO2/VP) remained a primary driver of emission growth until 2015. By constructing a carbon-pollution peaking matrix at the city scale, we find that only 6.5% of cities—predominantly megacities—have achieved dual peaking of carbon and pollutants. In contrast, 57.6% of cities exhibit a pollutant-peaked and carbon-plateaued pattern, where the effectiveness of pollutant governance has been overwhelmed by the scale effect of vehicle intensity (VP/GDP), resulting in a temporal inconsistency between air quality improvements and climate targets. We propose that the transition toward synergistic mitigation is achievable as supported by scenario analysis: an integrated policy package combining accelerated vehicle electrification, obsolete vehicle phase-out, and freight structure optimization could achieve a 55.7% reduction in CO2 and a 57.9% reduction in air pollutants.  These findings provide a robust evidence base for city-specific governance, highlighting the urgency for regions with inadequate carbon-pollutant synergy to proactively implement vehicle emission reduction strategies through structural transformation to align local air quality efforts with national carbon neutrality goals.

How to cite: Zhu, Y. and Zheng, B.: Four Decades of Road Transport Carbon and Air Pollution emissions across Chinese Cities: Trends, Drivers, and Synergistic Mitigation, EGU General Assembly 2026, Vienna, Austria, 3–8 May 2026, EGU26-4397, https://doi.org/10.5194/egusphere-egu26-4397, 2026.

EGU26-4926 | Posters on site | AS3.31

Aviation soot interactions with natural cirrus clouds are unlikely to have a significant impact on global climate 

Mattia Righi, Baptiste Testa, Christof G. Beer, Johannes Hendricks, and Zamin A. Kanji

The impact of aviation soot on natural cirrus clouds is considered the most uncertain among the climate impacts of the aviation sector. In this study, a global aerosol-climate model equipped with a cirrus parametrisation is applied to quantify the impact of aviation soot on natural cirrus clouds and its resulting climate effect. For the first time, the cirrus parametrisation in the model is driven by novel laboratory measurements specifically targeting the ice nucleation ability of aviation soot, thus enabling an experimentally-constrained estimate of the aviation-soot cirrus effect. The results indicate no statistically significant impact of aviation soot on natural cirrus clouds, with an effective radiative forcing of −6.9 ± 29.8 mW m−2 (95% confidence interval). Sensitivity simulations conducted to investigate the role of other ice nucleating particles (INPs) competing with aviation soot for ice supersaturation in the cirrus regime (soot from sources other than aviation, mineral dust and ammonium sulphate) further show that the impact of aviation soot remains statistically insignificant also when the impact of these other INPs on cirrus is reduced in the model. Acknowledging that the complexity of the soot cirrus interaction is associated with uncertainties, the model results supported by dedicated laboratory measurements suggest that the climate impact due to the aviation soot cirrus effect is likely negligible with no statistical significance.

How to cite: Righi, M., Testa, B., Beer, C. G., Hendricks, J., and Kanji, Z. A.: Aviation soot interactions with natural cirrus clouds are unlikely to have a significant impact on global climate, EGU General Assembly 2026, Vienna, Austria, 3–8 May 2026, EGU26-4926, https://doi.org/10.5194/egusphere-egu26-4926, 2026.

Global maritime transport faces intensifying threats from climate change, yet current emission inventories typically overlook the environmental penalties associated with vessel navigation under extreme weather stress. Existing assessments often rely on averaged weather conditions, potentially underestimating the carbon footprint of active storm evasion maneuvers. This study proposes a conceptual framework to quantify these "hidden" carbon costs by linking vessel behavioral dynamics with hydrodynamic resistance analysis.
 
Utilizing high-resolution Automatic Identification System (AIS) data and meteorological reanalysis products, we investigate the operational responses of merchant vessels to tropical cyclones. The research focuses on identifying high-intensity navigation behaviors in hurricane-affected waters and assessing their theoretical impact on fuel consumption. By integrating vessel kinematics with wave resistance principles, the study highlights the variability of emissions across different evasion strategies.
 
This presentation will discuss the magnitude of these unaccounted emission variations and their implications for global carbon budgets. The findings emphasize the need to transition from static to dynamic emission inventories that account for the increasing frequency of extreme weather events, offering insights for developing climate-resilient shipping policies.

How to cite: Luo, Q. and Huang, B.: The Hidden Shipping Carbon Cost of Extreme Weather: Unveiling the Hydrodynamic Penalty of Hurricane Evasion, EGU General Assembly 2026, Vienna, Austria, 3–8 May 2026, EGU26-5344, https://doi.org/10.5194/egusphere-egu26-5344, 2026.

EGU26-5636 | Posters on site | AS3.31

UK research programme on aviation’s non-CO2 impacts on the climate  

Neil Harris, Anna Smallwood, Mark Westwood, and Xinyue Cui

The climate impacts of aviation arise in 3 main ways. Carbon dioxide is the inevitable consequence of burning hydrocarbon fuels. Nitrogen oxides (NOx) are formed by the high temperatures in jet engines and subsequently affect the concentrations of the greenhouse gases ozone and methane. Contrails and cirrus are produced following the emission of a range of particle precursors under certain atmospheric conditions. Roughly, contrail-cirrus is responsible for half of the overall climate impact of aviation, NOx for a sixth, and CO2 the remaining third. Significant climate wins would result from reducing NOx and contrail-cirrus, the non-CO2 impacts from aviation.

The UK government has established a £30M research programme on Aviation’s non-CO2 Impacts on the Climate which covers atmospheric and technological projects involving academia and industry and funded through Natural Environment Research Council (NERC) and the Aerospace Technology Institute (ATI). In this way it links the climate science and technology research. The programme focuses on (a) improving our understanding of aviation’s non-CO2 impacts; and (b) identifying and developing mitigating actions to address those impacts.

The research programme brings together atmospheric scientists, technologists, industry partners and policymakers to research into how NOx emissions, contrails and other non-CO₂ effects influence climate, as well as into realistic mitigation options. The coordination team provides strategic direction, integrates findings to offer higher-level insights, and facilitates engagement with government (especially Department for Transport and Department for Business & Trade), industry, NGOs and international experts. Activities include workshops, annual meetings, cross-project synthesis and policy-facing assessments. The project aims to deliver evidence that informs operational, technological and regulatory decisions, supporting the UK’s transition to lower-impact aviation

This presentation describes the projects covered in the proposals, their achieved and intended key learnings and how research in the various projects will be used to provide actionable outcomes. Opportunities for collaboration with international partners will be discussed.

How to cite: Harris, N., Smallwood, A., Westwood, M., and Cui, X.: UK research programme on aviation’s non-CO2 impacts on the climate , EGU General Assembly 2026, Vienna, Austria, 3–8 May 2026, EGU26-5636, https://doi.org/10.5194/egusphere-egu26-5636, 2026.

EGU26-5744 | ECS | Posters on site | AS3.31

Improved humidity treatment and trajectory–grid mapping in the EMAC contrail submodel and their implications for contrail climate change functions 

Patrick Peter, Sigrun Matthes, Christine Frömming, Patrick Jöckel, Simone Dietmüller, and Volker Grewe

Contrails are a major contributor to aviation’s non-CO₂ climate effects, and trajectory-based mitigation concepts depend on robust estimates of contrail formation, persistence, optical properties, and radiative forcing. In EMAC, contrails evolve along Lagrangian trajectories and are subsequently transformed back to grid-point space to derive contrail climate change functions (CCFs; Frömming et al., 2021). However, the baseline EMAC contrail scheme has previously shown very low optical thickness values, which can be linked to low humidity values and to artefacts introduced by sampling and mapping between the Lagrangian and Eulerian frameworks.

We present targeted developments of the EMAC contrail submodel that address (i) humidity and saturation consistency and (ii) trajectory–grid coupling. First, we revise the humidity formulation by introducing an H₂O compensation factor and an explicit humidity threshold for contrail processes, implemented with a consistent treatment of saturation specific humidity and timestep handling. Second, we extend the grid-point-to-Lagrangian mapping by adding four-point bilinear horizontal interpolation of meteorological variables at the exact Lagrangian positions, reducing step-like gradients when trajectories cross grid boxes. Third, we update the Lagrangian-to-grid transformation to mitigate mapping artefacts affecting contrail ice water content and optical properties. In addition to the previously investigated North Atlantic flight region, we also analyse contrail climate change function fields for multiple days over Asia.

In the shown test cases, the added humidity threshold systematically reduces contrail persistence: the baseline setup (no threshold) yields a characteristic lifetime of ~7.8 h, while threshold-based setups reduce lifetimes to ~4.0–4.2 h and down to ~2.9–3.5 h depending on threshold strength. These developments improve numerical consistency and reduce sampling/mapping artefacts, providing a more robust basis for EMAC-based contrail RF estimates and for constructing contrail climate change functions for aviation applications.

The project leading to this study was funded by the European SESAR programme under Grant Agreement No. 101114785 (CONCERTO). High performance supercomputing resources were used from the DKRZ Cluster in Hamburg.

References:  

[1] Matthes, S., Lührs, B., Dahlmann, K., Grewe, V., Linke, F., Yin, F., Klingaman, E. and Shine, K. P.: Climate-Optimized Trajectories and Robust Mitigation Potential: Flying ATM4E, Aerospace 7(11), 156, 2020.

[2] Frömming, C., Grewe, V., Brinkop, S., Jöckel, P., Haslerud, A. S., Rosanka, S., Van Manen, J., and Matthes, S.: Influence of weather situation on non-CO2 aviation climate effects: The REACT4C climate change functions, ACP, 21, 9151 – 9172, 2021.

How to cite: Peter, P., Matthes, S., Frömming, C., Jöckel, P., Dietmüller, S., and Grewe, V.: Improved humidity treatment and trajectory–grid mapping in the EMAC contrail submodel and their implications for contrail climate change functions, EGU General Assembly 2026, Vienna, Austria, 3–8 May 2026, EGU26-5744, https://doi.org/10.5194/egusphere-egu26-5744, 2026.

EGU26-6341 | ECS | Orals | AS3.31

Real-time chemical characterisation of aviation based ultrafine particle using Orbitrap-MS  

Julia David, Florian Ungeheuer, and Alexander L. Vogel

The transport sector, and particularly aviation, is an important contributor to both climate forcing and local air pollution. While measures to mitigate emissions are advancing, airport-related particulate pollution remains insufficiently characterised, especially regarding ultrafine particles (UFPs), which affect both air quality and human health. Due to their aerodynamic diameter below 0.1 µm, UFPs can penetrate deep into the pulmonary alveoli and enter the bloodstream, where they can trigger oxidative stress, inflammatory responses and other adverse physiological effects (Jonsdottir et al. 2019). Airports are recognised as UFP sources, primarily due to emissions from jet engines and auxiliary power units as well as ground support operations. With the predicted growth of the aviation sector, airport-related UFP emissions are expected to increase.

Previous research has identified jet engine lubrication oils as a distinct class of organic compounds associated with airport-related UFPs (Ungeheuer et al. 2022). These compounds contribute to the local air quality burden and can serve as specific tracer species for aircraft emissions. However, detailed chemical characterisation of these compounds remains difficult, because UFPs are due to their low mass and size hard to detect and are often masked by other organic aerosol components. Currently used approaches are mostly based on offline, filter-based techniques that are labor-intensive and offer only limited temporal resolution.

In this study, we present a novel approach for the real-time detection of JetOil tracers using in-situ Orbitrap mass spectrometry (MS). Measurements were conducted approximately 15 km from Frankfurt International Airport using a dielectric barrier discharge ion source coupled to a high-resolution Orbitrap-MS. The setup was operated in fast polarity-switching mode to simultaneously detect JetOil tracers (positive ionization) as well as possible oxidation products and sulfate (negative ionization). In parallel, a scanning mobility particle sizer (SMPS) measured size-dependent particle number and mass concentrations. Over a period of four weeks in August and September 2025, JetOil tracers were frequently detected in air masses originating from the direction of Frankfurt International Airport, coinciding with the airport’s operating hours. Simultaneously, when JetOils are present an increase in UFP concentrations in the 20–40 nm size range. In contrast, no correlation with particle-phase sulfate was observed, indicating that airport operations are not a significant source of sulfate aerosol mass in an urban environment. 


Jonsdottir et al. (2019) Commun. Biol., 2(1), 90.

Ungeheuer et al. (2022) Commun Earth Environ., 3(1), 319.

How to cite: David, J., Ungeheuer, F., and Vogel, A. L.: Real-time chemical characterisation of aviation based ultrafine particle using Orbitrap-MS , EGU General Assembly 2026, Vienna, Austria, 3–8 May 2026, EGU26-6341, https://doi.org/10.5194/egusphere-egu26-6341, 2026.

EGU26-7091 | ECS | Posters on site | AS3.31

A guide to spatial interpolation methods for local environmental assessments 

Benjamin Percival, Ling Lim, Xin Zhao, Chenzhao Li, Moritz Kolb, Adnan Muslić, Barlas Türkyilmaz, and Feijia Yin

Spatial interpolation methods (SIMs) are widely used in local environmental assessments, yet their computational cost and performance vary substantially across datasets. High resolution modelling of elements of local environmental studies, including pollutant concentrations and noise, is often computationally demanding. As a result, SIMs are widely used to estimate values between modelled points and construct exposure contour maps. The choice of interpolation method therefore has a direct influence on both computational efficiency and the accuracy of subsequent impact assessments.

This work develops a structured framework for comparing and selecting SIMs by examining how they differ in three practical respects: how strongly they smooth or preserve sharp spatial features, how sensitive they are to the spacing of available data points, and how computationally demanding they are to apply. To demonstrate these distinctions, we analyse pollutant concentration and noise datasets using airport sites as the case study. High resolution model outputs are used as reference values, against which we evaluate interpolated estimates derived from coarser grids across a range of SIMs. This enables a systematic assessment of method behaviour under realistic sampling conditions typical of local environmental modelling.

We compare commonly used SIMs including nearest neighbour, inverse distance weighting, linear and Clough–Tocher triangulation, radial basis functions and several kriging variants across multiple sampling densities. Errors relative to fine grid values are analysed together with measures of local spatial gradients, allowing us to identify when methods smooth peaks, distort steep transitions or perform reliably in more uniform regions. The study also reviews recent machine learning and hybrid interpolation approaches and summarises current software support for SIMs.

The outcome has two components. First, we present a decision tree that groups SIMs according to their ability to represent sharp spatial changes, their sensitivity to spatial sampling and their computational requirements. This framework provides a general guide for method selection in local environmental assessments. Second, the case studies show that interpolation performance depends strongly on the structure of the dataset being modelled, meaning that method choice should always be verified for the specific application. Together, the framework and case study findings offer both a basis for SIM selection and insight into how different methods perform in practice when balancing accuracy and computational cost.

How to cite: Percival, B., Lim, L., Zhao, X., Li, C., Kolb, M., Muslić, A., Türkyilmaz, B., and Yin, F.: A guide to spatial interpolation methods for local environmental assessments, EGU General Assembly 2026, Vienna, Austria, 3–8 May 2026, EGU26-7091, https://doi.org/10.5194/egusphere-egu26-7091, 2026.

EGU26-7179 | ECS | Orals | AS3.31

Sensitivity of Contrail Radiative Forcing to Radiative Transfer Parameterization 

Paulina Czarnecki, Nicolas Bellouin, Olivier Boucher, and Etienne Vignon

Contrail cirrus, ice clouds produced when an airplane passes through cold, supersaturated air, make up over half of the effect of aviation on the global energy balance. In the shortwave spectrum, clouds (including contrails) reflect sunlight, exerting a negative forcing. Meanwhile, in the longwave spectrum, they exert a positive forcing, warming the planet due to their cold emission temperature. Thus, depending on atmospheric conditions, cloud properties, the time of day, and the season, the balance between the negative shortwave and positive longwave effects determines whether contrails cool or warm the planet overall. Furthermore, in the context of global climate modeling, the sign and magnitude of the net contrail radiative forcing can be sensitive to assumptions used in the radiation parameterization. For example, simplifications made to the cloud optical properties and assumptions about how clouds overlap within a model column increase the uncertainty in the calculated forcing. In this work, we examine the radiative forcing of contrails in idealized single-column simulations in order to isolate the effect of these assumptions on the calculated forcing. We compare calculations performed with the radiation parameterization used in the LMDZ climate model to a higher-complexity line-by-line code that serves as a reference calculation. Together these results allow us to identify the radiative transfer parameters and configurations that most strongly affect the magnitude and sign of the net contrail radiative forcing, which we will use to identify modeling priorities for the LMDZ contrail parameterization.

How to cite: Czarnecki, P., Bellouin, N., Boucher, O., and Vignon, E.: Sensitivity of Contrail Radiative Forcing to Radiative Transfer Parameterization, EGU General Assembly 2026, Vienna, Austria, 3–8 May 2026, EGU26-7179, https://doi.org/10.5194/egusphere-egu26-7179, 2026.

EGU26-7589 | Orals | AS3.31

Recent insights into the non-CO2 effects of aviation 

Nicolas Bellouin and the Climaviation and ACACIA projects

The non-CO2 effects of aviation on climate have received much attention recently from the aviation industry and European policymakers, and several research consortia are working on the topic. Focus is especially on the non-CO2 effects that are both most uncertain and potentially associated with sizeable radiative forcings compared to aviation CO2: contrail formation, the perturbation of atmospheric chemistry by aviation nitrogen oxides (NOx) emissions, and the interactions between aviation aerosols and clouds.

This talk will present recent insights into understanding and quantifying the radiative forcing of the non-CO2 effects of aviation obtained by the ACACIA and Climaviation research projects. Those projects involve several types of models, including computational fluid dynamics, large eddy simulation, and global climate models, and ground-, aircraft- and satellite-based observations. Key insights are (1) improved understanding of the influence of the near field for contrail formation and evolution, (2) a new estimate of global contrail radiative forcing and its adjustments in the LMDZ climate model, (3) quantification of the benefits and risks of contrail avoidance for a given flight, (4) improved understanding of the response of ozone and methane chemistry to aviation NOx perturbations, (5) new results on aviation aerosol-cirrus interactions.

Together, these results inform mitigation options aimed at reducing the climate impact of aviation non-CO2 effects.

How to cite: Bellouin, N. and the Climaviation and ACACIA projects: Recent insights into the non-CO2 effects of aviation, EGU General Assembly 2026, Vienna, Austria, 3–8 May 2026, EGU26-7589, https://doi.org/10.5194/egusphere-egu26-7589, 2026.

EGU26-7834 | Posters on site | AS3.31

Towards Global Contrail Observation: From Single-Instrument to Global Geostationary Data 

Elke Michlmayr, Joe Yue-Hei Ng, Joseph Kuebler, Andrea Favia, Steffen Van, Max Vogler, and Scott Geraedts

One of aviation's largest non-CO2 climate impacts originates from persistent contrails. Since only a small minority of flights cause persistent contrails, preventing contrail formation has potential to be cost-effective in comparison to other measures and therefore could be part of climate change mitigation strategies in the transport sector. However, determining which flights cause persistent contrails to form is uncertain, as is the overall extent of the impact of contrails on climate change. More research is needed in both areas to fully understand and mitigate these uncertainties.

Observations of persistent contrails through geostationary satellite-based imagers can be used to develop non-CO2 climate impact inventories. Recent work has focussed on training machine learning models to detect contrails at large scale. To date, these models have been trained and evaluated on observations from the same satellite instrument. But in order to get global contrail coverage, one must consider multiple instruments mounted on different satellites (e.g., GOES-ABI for the Americas, Meteosat-FCI for Europe and Africa, and Himawari for Asia). 

In this work, we analyze whether a deep learning model trained on one satellite instrument can be applied to data from others. Validating this approach is important, as it could eliminate the need to create large labeled datasets for every new instrument which is a time-consuming and expensive process. We also explore if training models on a combined dataset of multiple satellite instruments can lead to overall quality improvement in contrail detection.

How to cite: Michlmayr, E., Ng, J. Y.-H., Kuebler, J., Favia, A., Van, S., Vogler, M., and Geraedts, S.: Towards Global Contrail Observation: From Single-Instrument to Global Geostationary Data, EGU General Assembly 2026, Vienna, Austria, 3–8 May 2026, EGU26-7834, https://doi.org/10.5194/egusphere-egu26-7834, 2026.

EGU26-8063 | ECS | Posters on site | AS3.31

Assessing the climate footprint of LNG as a marine fuel: evidence from a high-resolution AIS-based emission model for Spain 

Ivan Lombardich, Paula Castesana, Oliver Legarreta, Carles Tena Medina, Carmen Piñero-Megías, Artur Viñas Ferran, Johanna Gehlen, Luca Rizza, Carlos Pérez García-Pando, and Marc Guevara Vilardell

LNG adoption in shipping is often presented as a route to lower air-pollutant emissions and meet tighter sulphur limits under IMO 2020 and EU in-port requirements. The climate side is trickier: LNG-related methane (CH4) emissions depend heavily on CH4 slip, and that matters more under new EU policies that price and regulate greenhouse gases (GHG) emissions. Since January 2025, the FuelEU Maritime applies well-to-wake GHG-intensity targets, while from January 2026, CH4 emissions from maritime transport also fall under the EU Emissions Trading System.

Here we present results on shipping CH4 emissions over Spain derived from a near-real-time, high-resolution Automatic Identification System (AIS)-based emission model developed within the RESPIRE-CLIMATE national project, which received formal endorsement from the WMO-IG3IS initiative. Using 2019–2025 AIS trajectories, we quantify CH4 slip from LNG-fuelled ships using engine-type- and load-dependent emission factors. The system is fully operational and generates daily outputs per ship type on a 0.01°×0.01° grid.

Across Spanish waters, we detect a marked increase in LNG-related activity after 2022, consistent with Europe’s rapid shift in gas supply chains following the war in Ukraine. Spain is indeed a major LNG gateway in Europe, with roughly one-third of Europe’s regasification capacity, which supports high LNG carrier traffic and enables re-export flows.

A Barcelona case study shows how this trend intersects with intensified LNG operations, reaching 618 port calls of LNG-fuelled ships during 2023. Results highlight where and when CH4 slips concentrate near ports and in traffic lanes and which ship types are driving the largest emission peaks. They also show how, for several major cruise and cargo ships, CH4 slip can substantially change the CO2-equivalent balance of LNG-fuelled ships under certain operating profiles.

The results presented in this study can contribute to the monitoring, reporting, and verification activities of GHG emissions from the maritime transport.

How to cite: Lombardich, I., Castesana, P., Legarreta, O., Tena Medina, C., Piñero-Megías, C., Viñas Ferran, A., Gehlen, J., Rizza, L., Pérez García-Pando, C., and Guevara Vilardell, M.: Assessing the climate footprint of LNG as a marine fuel: evidence from a high-resolution AIS-based emission model for Spain, EGU General Assembly 2026, Vienna, Austria, 3–8 May 2026, EGU26-8063, https://doi.org/10.5194/egusphere-egu26-8063, 2026.

EGU26-8657 | Orals | AS3.31

Super-Emitters On California Roads -On-road VOC fingerprinting from Mobile Monitoring 

Michael R. Giordano, Samuel J. Cliff, Haley M. Byrne, Allen H. Goldstein, and Joshua S. Apte

Various programs, regulations, and technologies targeting emissions from the vehicle fleet on roadways around the world have made significant air quality gains over the past few decades. However, recent monitoring in the San Francisco Bay and surrounding areas by the UC Berkeley Mobile Air Pollution Laboratory (CalMAPLab) has shown that high- emission vehicles (“super-emitters”) are likely now having an outsized impact on total fleet emissions. Fingerprinting and bounding the emission factors for these super-emitters is therefore critical in assessing the overall impact on air toxics from these vehicles. Here we present extensive chemical speciation (VOCs, combustion tracers, GHGs) from on- road and on-highway emissions measurements around the Bay Area performed by the CalMAPLab in 2025. We present and compare the speciated fingerprints for vehicles powered by gasoline and diesel, and super-emitters in these classes.

How to cite: Giordano, M. R., Cliff, S. J., Byrne, H. M., Goldstein, A. H., and Apte, J. S.: Super-Emitters On California Roads -On-road VOC fingerprinting from Mobile Monitoring, EGU General Assembly 2026, Vienna, Austria, 3–8 May 2026, EGU26-8657, https://doi.org/10.5194/egusphere-egu26-8657, 2026.

EGU26-9063 | Posters on site | AS3.31

Emulating the effect of land-based transport emissions on aerosol-induced radiative forcing change based on a perturbed parameter ensemble method 

Jingmin Li, Mattia Righi, Johannes Hendricks, J. Christopher Kaiser, Christof G. Beer, and Anja Schmidt

Emissions from transport contribute significantly to anthropogenic climate change, and evaluating the climate effect induced by aerosols from transport in different emission scenarios usually relies on computing-intensive general circulation models (GCMs). As an alternative approach, simple climate response functions between the emissions from a given sector and their resulting climate impact are desirable, to evaluate emissions scenarios in a more efficient way.

In this study, the Perturbed Parameter Ensemble (PPE) method is applied to generate such simple response functions (emulators), based on simulations with the global aerosol–chemistry–climate model EMAC equipped with the aerosol microphysical submodel MADE3. Emission rates of four species from land-based transport emissions (NOx, SO2, black carbon and organic carbon) are varied simultaneously across a four-dimensional parameter space using the Latin Hypercube method, which generates 41 representative combinations. Global model simulations are conducted for each of these combinations and used to train Gaussian Process (GP) emulators that represent the aerosol climate effects arising from emission changes. Finally, a variance-based sensitivity analysis is performed to quantify the relative contributions of individual emission parameters to the aerosol-induced radiative forcing change.

The emulators are generated and evaluated separately in five world regions: Europe, Asia, North America, South America, and the rest of the world. The results demonstrate that the emulators successfully capture the relationship between aerosol-climate effects and emissions and accurately reproduce the model results. The results further reveal pronounced regional differences in the relative contributions of emission parameters to the aerosol climate effect. In South America, organic carbon emissions account for approximately 55% of the land-transport-induced climate effect, with SO₂ contributing the remaining ~45%. By contrast, in all other regions, SO₂ contributes more than 90% and represents the dominant emission parameter driving the aerosol-induced change in radiative forcing.

How to cite: Li, J., Righi, M., Hendricks, J., Kaiser, J. C., Beer, C. G., and Schmidt, A.: Emulating the effect of land-based transport emissions on aerosol-induced radiative forcing change based on a perturbed parameter ensemble method, EGU General Assembly 2026, Vienna, Austria, 3–8 May 2026, EGU26-9063, https://doi.org/10.5194/egusphere-egu26-9063, 2026.

EGU26-9150 | ECS | Posters on site | AS3.31

Fundamental trade-off between climate and air quality from sulfur reductions in marine fuels  

Liliane Isselhorst, Mattia Righi, Anja Schmidt, and Axel Lauer

International shipping is a major source of anthropogenic sulfur emissions, affecting both climate and air quality. The high fuel sulfur content (FSC) in marine fuels leads to high sulfur dioxide (SO2) emissions and subsequent sulfate aerosol particle formation in the atmosphere, particularly over major shipping lanes and along coastal regions where cloud susceptibility is high. Sulfate aerosol particles act as cloud condensation nuclei (CCN) and can alter the microphysical and radiative properties of clouds, enhancing cloud albedo and exerting a net cooling effect on the climate. At the same time, sulfate aerosol particles deteriorate air quality and pose risks to human health. To mitigate the adverse health effects, the International Maritime Organization (IMO) implemented the “IMO2020” regulations, which reduced the maximum allowed FSC in marine fuels from 3.5% to 0.5% as of January 2020. However, the resulting reduction in sulfate aerosol particle burden also diminishes the aerosol-induced cooling effect, potentially unmasking part of the previously suppressed anthropogenic warming. In this thesis, aerosol-climate model simulations suggest that IMO2020 regulations led to a loss of aerosol-induced cooling of +67 mW m−2 globally, while the concentration of ship-induced fine particulate matter simultaneously dropped by ~60% across continents. Sensitivity simulations to test the effects of hypothetical region-specific regulation strategies demonstrate that the strongest air quality improvements occur when IMO2020 regulations are enforced in coastal regions where population density is high, while open-ocean regulations have little effect on air quality. However, the largest loss of aerosol cooling is also attributable to FSC reductions in coastal regions, where ship traffic is dense and cloud albedo highly susceptible to aerosol perturbations. Consequently our results highlight a fundamental trade-off: efforts to reduce air pollution caused by the shipping sector simultaneously lead to a substantial loss of aerosol-induced cooling. The balance between air quality improvements and retaining the cooling strongly depends on the spatial distribution of ship traffic, population exposure and cloud cover. Future research should explore the trade-off across multiple models and for region-specific regulation strategies under different climate change scenarios.

How to cite: Isselhorst, L., Righi, M., Schmidt, A., and Lauer, A.: Fundamental trade-off between climate and air quality from sulfur reductions in marine fuels , EGU General Assembly 2026, Vienna, Austria, 3–8 May 2026, EGU26-9150, https://doi.org/10.5194/egusphere-egu26-9150, 2026.

EGU26-9492 | ECS | Posters on site | AS3.31

Characterisation of aircraft APU aerosol emissions relevant to contrail formation 

Emily Winter, Jack Macklin, Georgia Gamble, Ihab Ahmed, Benjamin Murray, Mohamed Pourkashanian, and Marc Stettler

Contrail cirrus, aviation-induced condensation trails and their associated cloudiness form when ice crystals nucleate on exhaust and ambient aerosols. The size, morphology, and chemical composition of these aerosols influence contrail formation and the resulting atmospheric perturbations, and are controlled by multiple factors, including fuel type and combustion conditions. To investigate these physicochemical effects, emissions from an aircraft Auxiliary Power Unit (APU) were characterised under full-load and ready-to-load operating conditions. Particle size distributions (PSDs) were measured for conventional Jet A-1 and aviation fuel surrogates composed of n-paraffins and iso-paraffins, to assess the influence of fuel composition on emissions. Under full-load conditions, n-paraffin surrogates produced the smallest particles, with a modal diameter of 22 nm, compared with 28 nm and 32 nm for iso-paraffin surrogates and Jet A-1, respectively.

The fractal structure of the emitted particles was examined using a tandem Aerodynamic Aerosol Classifier (AAC) - Scanning Mobility Particle Sizer (SMPS) system and Transmission Electron Microscopy (TEM). In parallel, the ice-nucleating behaviour of APU emissions was investigated using the Portable Ice Nucleation Experiment (PINE) chamber.

The IATA Net Zero Roadmap projects that 62% of aviation-sector CO2 reductions by 2050 will rely on replacing 80-90 % of conventional aviation fuel with sustainable alternatives (IATA, 2023). As higher sustainable aviation fuel (SAF) blend ratios are increasingly adopted, understanding how fuel-dependent emission properties and ice-nucleating behaviour influence contrail formation is essential for assessing the full climate impact of these mitigation strategies.

Reference: IATA: Energy and New Fuels Infrastructure Net Zero Roadmap, International Air Transport Association, https://www.iata.org/en/programs/sustainability/roadmaps/, 2023.

How to cite: Winter, E., Macklin, J., Gamble, G., Ahmed, I., Murray, B., Pourkashanian, M., and Stettler, M.: Characterisation of aircraft APU aerosol emissions relevant to contrail formation, EGU General Assembly 2026, Vienna, Austria, 3–8 May 2026, EGU26-9492, https://doi.org/10.5194/egusphere-egu26-9492, 2026.

EGU26-9775 | Posters on site | AS3.31

HYDEA Project Work Package 6: Contrail formation pathways for hydrogen combustion 

Jhaswantsing Purseed, Catherine Mackay, Simon Unterstrasser, Josef Zink, Wing-Fai Thi, Francesco Vannini, Kamila Roszkiewicz, Tomasz Iglewski, Nicolas Bonne, and Etienne Terrenoire

Aviation’s contribution to climate change stems from both CO2 and non-CO2 emissions. Among the latter, the warming effect generated by contrail-cirrus is recognised as a major contributor, albeit large uncertainties remain (Lee et al. 2021). 

A condensation trail - or contrail - is composed of ice crystals which form behind an aircraft at high altitudes in sufficiently cold air. The formation is also influenced by engine technology, operating conditions and the fuel type. On the other hand, contrails are persistent in Ice Super-Saturated Regions (ISSRs) and their transition into contrail-cirrus depends on many atmospheric parameters and also on early contrail properties. ISSRs are local atmospheric air masses characterised by low temperatures and a high humidity level that is saturated versus ice. 

In order to reduce aviation’s climate impact, hydrogen propulsion has been considered as one promising alternative, in line with the European Green Deal and Clean Aviation Strategic Research and Innovation Agenda (SRIA). In this context, the EU-funded HYDEA project was launched in 2023. 

The advantage of a hydrogen-powered aircraft compared to kerosene is that the former combustion is free of carbon-dioxide emissions as well as soot particles and sulphur oxides, classical pathways to ice formation. However, H2 combustion also produces NOx and approximately 2.6 times more water-vapour than kerosene combustion. In this case, a need for modelling new ice crystal formation pathways is required to understand how ice crystals are formed and what properties they would have in order to ultimately understand their climate impacts. 

Consequently in HYDEA WP6, we investigate several aspects of ice crystal formation modelling for a hydrogen-powered engine. Three distinct ice crystal (IC) formation pathways were considered and  investigated. On one hand ONERA uses their 3D CFD model, CEDRE, to perform high-fidelity simulations and their box model MOMIE to investigate the potential role of NOx to act as condensation nuclei. On the other hand, DLR uses their Lagrangian Cloud Module (LCM) box model approach to investigate the role of background aerosols and that of lubrication oil on IC formation. However, they need dilution information from an engine exhaust in order to perform such a study. 

Several simulations were performed using ANSYS CFX solver by GEAP and FLUSEPA solver by AIRBUS to “feed” DLR’s box model. The use of two distinct solvers allows for an inter-model comparison and their potential impact on the IC formation. The use of the Common Research Model (engine and aircraft) allows comparison of isolated versus installed configurations. Three configurations were considered: an isolated engine, an engine-pylon and a full aircraft configuration. While we limit our simulations to the “jet regime” (approx. 300 m downstream of the exhaust), these configurations should provide insights on their influence on the mixing process in the plume.

References:

Lee, David S., et al. "The contribution of global aviation to anthropogenic climate forcing for 2000 to 2018." Atmospheric environment 244 (2021): 117834.

How to cite: Purseed, J., Mackay, C., Unterstrasser, S., Zink, J., Thi, W.-F., Vannini, F., Roszkiewicz, K., Iglewski, T., Bonne, N., and Terrenoire, E.: HYDEA Project Work Package 6: Contrail formation pathways for hydrogen combustion, EGU General Assembly 2026, Vienna, Austria, 3–8 May 2026, EGU26-9775, https://doi.org/10.5194/egusphere-egu26-9775, 2026.

A comprehensive understanding of international trade-linked transportation CO2 emissions is essential for achieving net-zero emission goals. However, the current simplified representation of transportation patterns obscures the heterogeneity of these CO2 emissions in international trade and limits the development of targeted decarbonization policies. This study developed an integrated and highly detailed model that incorporated commodity-scale modal shares and shipping carbon intensities for each trade pair, assisted by machine learning and observed voyage signals, respectively. The results indicate that transportation modal shares vary significantly across different scales. In 2021, trade-linked transportation contributed 971 Mt CO2 emissions globally. When attributing CO2 emissions to countries and commodities, the simplification of modal share can lead to significant biases through carbon-intensity weighting. By shifting the focus from end-of-pipe emissions to upstream demand, this study identified a decarbonization potential of 41.6% through optimizing transportation distances. The findings offer valuable insights for designing targeted mitigation policies for international freight transportation.

How to cite: Luo, Z.: Global mapping of disaggregated international trade-linked transportation CO2 emissions, EGU General Assembly 2026, Vienna, Austria, 3–8 May 2026, EGU26-10040, https://doi.org/10.5194/egusphere-egu26-10040, 2026.

EGU26-10340 | Orals | AS3.31

On the non-CO2 to CO2 ratio of aviation emissions and associated uncertainties 

Roland Eichinger, Katrin Dahlmann, Johannes Pletzer, Volker Grewe, Malte Niklass, and Christian M. Weder

Aviation non-CO2 emissions influence atmospheric chemistry and physics mainly through NOx, H2O, aerosols and contrail-induced cirrus cloudiness (CiC). These processes alter Earth's radiation budget and thus near-surface temperatures. Studies report that all aviation emissions together currently warm the climate at approximately three times the rate of that associated with aviation CO2 emissions alone. However, this factor is by no means universal, as the various natures of the different climate effects and in particular the different time scales they act on, make blending the effects into one number not straightforward. Climatologically, the CO2 to non-CO2 climate effect factor ranges between 0.5 and 10.5 as it depends on numerous decisions, including climate metric, time horizon and if pulse or continuous emissions are considered. We here explain the influence of some of these decisions on the calculated climate effect and discuss implications. The factor is additionally associated with large uncertainties and for individual flights, it strongly depends on meteorological conditions and location.

For this study, we first develop traffic scenarios with representative flight missions covering a wide range of flight regions, altitudes, distances and aircraft types to calculate air traffic emissions. To analyse how much the contribution of non-CO2 effects to the total climate impact varies for different trajectory types, climate metrics and time horizons, CO2 and non-CO2 climate effects are calculated for these trajectories using the AirClim model. Moreover, we identify the uncertainties of aviation non-CO2 effects, assess their ranges and derive probability distributions of these uncertainties, in particular with regard to lifetimes, radiative forcing and efficacies. To assess the influence of these input data to the uncertainties, we then conduct Monte Carlo simulations with the uncertainty distributions and analyse the confidence intervals for non-CO2 climate effects to be larger than that of CO2. Further, the relative climate effect differences through mitigation measures are calculated and the risk that a measure leads to unintentional climate warming is estimated. This work shall deepen the understanding of aviation non-CO2 uncertainties and help paving the way for their incorporation in operational application.

How to cite: Eichinger, R., Dahlmann, K., Pletzer, J., Grewe, V., Niklass, M., and Weder, C. M.: On the non-CO2 to CO2 ratio of aviation emissions and associated uncertainties, EGU General Assembly 2026, Vienna, Austria, 3–8 May 2026, EGU26-10340, https://doi.org/10.5194/egusphere-egu26-10340, 2026.

EGU26-10922 | Orals | AS3.31

Air-pollutants linked to shipping emissions observed in the North of France in July 2023 during the Aero-HdF campaign 

Adèle Georgeot, Paola Formenti, Chenjie Yu, Astrid Bauville, Karine Deboudt, jean-Christophe Péré, Marie Choël, Yevgeny Derimian, Isabelle Chiapello, Baptiste Fontaine, Frédérique Auriol, Cyril Delegove, Rodrigue Loisil, Luc Blarel, Souichiro Hioki, Jérôme Riedi, Frédéric Parol, Philippe Goloub, Qiaoyun Hu, and Fabien Waquet and the LOA team

Aerosols originate from diverse sources, which determine their physical, chemical and optical properties, and influence both climate and clouds. Fine submicron particles are particularly hazardous; mostly linked to air pollution, they can penetrate deep into the human respiratory system and bloodstream, posing a significant health risk.

The AERO-HDF airborne campaign was conducted in July 2023 over the North of France, the English Channel, and the North Sea; a region characterized by dense shipping traffic. During the mission, a series of scientific flights utilized in situ instruments onboard the SAFIRE (Service des Avions Français Instrumentés pour la Recherche en Environnement) ATR 42 research aircraft to measure the size and optical properties of atmospheric particles using the AVIRAD sampling system, as well as gas concentrations. Additionally, remote sensing data were collected for the same air masses using OSIRIS (Observation System Including Polarisation in the Solar Infrared Spectrum), the airborne simulator for newly launched spaceborne 3MI (Multi-viewing Multi-channel Multi-polarisation Imager) satellite sensor. Atmospheric particles were also sampled to study their chemical composition, morphology and mixing state.

First, our measurements reveal that, in the marine boundary layer, aerosols displayed significant light absorption. They were predominantly externally mixed, and characterised by a dominant mode of particles below 100 nm in diameter and a fine mode mostly consisting in organic aerosols. Multiple passes at very low altitude measured an aerosol Single Scattering Albedo (SSA) of 0.85-0.80 at 630 nm in a fresh ship plume, significantly lower than in the background air (SSA=0.90). These fresh emissions were also accompanied by elevated levels of NOx, SO2, and water vapour. Traces of amorphous carbon, a signature profile of diesel ship engines, were also detected.

Finally, a chemical transport model model (WRF-CHIMERE) was used to model aerosols and gases. We will present comparisons between the model results, in situ data, and polarimeter retrievals. Potentially, we will share preliminary findings regarding the impact of these pollutants on cloud formation.

How to cite: Georgeot, A., Formenti, P., Yu, C., Bauville, A., Deboudt, K., Péré, J.-C., Choël, M., Derimian, Y., Chiapello, I., Fontaine, B., Auriol, F., Delegove, C., Loisil, R., Blarel, L., Hioki, S., Riedi, J., Parol, F., Goloub, P., Hu, Q., and Waquet, F. and the LOA team: Air-pollutants linked to shipping emissions observed in the North of France in July 2023 during the Aero-HdF campaign, EGU General Assembly 2026, Vienna, Austria, 3–8 May 2026, EGU26-10922, https://doi.org/10.5194/egusphere-egu26-10922, 2026.

EGU26-13064 | ECS | Posters on site | AS3.31

Is There a Spatial Link Between Ice Supersaturation and Aviation Turbulence? 

Hui Ling Wong, Rafael Palacios, and Edward Gryspeerdt

Contrail cirrus contributes significantly to aviation’s climate warming impact. To limit this impact, flight trajectories can be climate-optimised by minimising both CO2 and non-CO2 emissions. Operationally, safety is often an overriding consideration that must be accounted for before a climate-optimised flight trajectory can be undertaken. Since atmospheric turbulence is the leading cause of commercial aviation accidents, it is vital to establish if and how ice supersaturated regions (ISSRs) are spatially related to region with moderate-or-greater (MOG) turbulence. This link is motivated by the role of vertical air motions, which promote ice supersaturation through adiabatic cooling and are also a defining characteristic of atmospheric turbulence.

Using European Centre for Medium-Range Weather Forecasts ERA5 reanalysis data and the most relevant clear air turbulence (CAT) diagnostics, we first examine whether ISSRs and MOG turbulence occur concurrently and whether they are correlated. Preliminary results indicate a weak relationship exists between the two regions. Analysis of the instantaneous plots indicate that, while co-occurrence is uncommon, the two regions often occur adjacent to each other. This adjacency is particularly evident in three-dimensional reconstructions of regions where an intersection had occurred. We quantified this spatial relationship via the Euclidean distance from an ISSR to a MOG CAT region and aggregated these distances (e.g., mean distance) to identify regions that frequently exhibits this behaviour. Finally, this measure is used to establish whether ISSRs that originate from large scale vertical movements and MOG CAT are related. These insights provide a foundational step toward establishing whether this underlying relationship between the two regions can be leveraged to improve forecast confidence and the implications on the operational complexity of safe, climate-optimised flight trajectories.

How to cite: Wong, H. L., Palacios, R., and Gryspeerdt, E.: Is There a Spatial Link Between Ice Supersaturation and Aviation Turbulence?, EGU General Assembly 2026, Vienna, Austria, 3–8 May 2026, EGU26-13064, https://doi.org/10.5194/egusphere-egu26-13064, 2026.

Near-real-time emission inventories are essential for accurate modeling of air quality and climate impacts. While advances in transportation big data have enabled high-resolution emission inventories in various sectors, existing maritime models still face two key limitations. On one hand, ship technical parameters are updated much slower than activity data, leading to uncertainty in emission calculation. On the other hand, maintaining a dynamically updated inventory platform remains challenging. Here, to address these gaps, this study develops a near-real-time global ship emission inventory model with a daily-updated ship technical database​ and a scrubber-use simulation module. Our model identifies newly added ships from daily Automatic Identification System (AIS) data and predicts their deadweight tonnage and engine power using an XGBoost-based regression model, enabling more accurate emission factor matching. For sulfur-dioxide and particular matter emission calculation, both low-sulfur fuel use and scrubber use are considered as the potential choices of ships. Compared with models with daily-updated technical database, failure to supplement newly-identified ships results in an underestimation of approximately 12.9% to 16.1% in daily ship emissions. Results from our improved model show that from 2022 to 2024, global annual ship emissions experienced steady growth from 835 million tons to 872 million tons, consistent with the increase in maritime trade. The model also captured the abrupt decline by 40% in daily emissions in the Red Sea following the Red Sea crisis in December 2023, alongside the corresponding rise in the Indian Ocean and South Atlantic Ocean due to rerouted container ships.

How to cite: Zhang, W. and Liu, H.: A near-real-time global ship emission inventory model with daily-updated technical database, EGU General Assembly 2026, Vienna, Austria, 3–8 May 2026, EGU26-13088, https://doi.org/10.5194/egusphere-egu26-13088, 2026.

EGU26-13213 | Posters on site | AS3.31

Effective radiative forcing of aviation-induced aerosols in present-day and future climate simulated with UKESM 

Masaru Yoshioka, Lynnette Dray, Paul Field, Weiyu Zhang, Andreas Schafer, and Alexandru Rap

Current best estimates suggest that aviation contributes around 5% to global warming, with a substantial fraction arising from non-CO₂ effects. While contrail cirrus dominates these non-CO₂ impacts, aerosol-cloud interactions have also been suggested to play an important role. However, aviation-induced aerosol-cloud interactions remain poorly quantified, limiting our ability to inform future aviation climate mitigation policies. Improving our understanding of aviation-induced aerosol-cloud interactions is therefore essential, particularly in the context of ambitious mitigation targets and emerging alternative fuels.

Here, we quantify the effective radiative forcing (ERF) from aerosol–radiation interactions (ARI) and aerosol-cloud interactions (ACI) driven by aviation emissions using the UK Earth System Model (UKESM). Three-dimensional emissions of H2O, SO2, soot, and NOx are constructed based on fuel consumption data from two independent aviation inventories: the Aviation Environmental Design Tool (AEDT) and the Aviation Integrated Model (AIM), and are implemented within the UKCA chemistry-aerosol framework. Atmospheric chemistry, aerosol microphysical processes, and cloud microphysical processes are simulated with UKCA and its GLOMAP component.

A present-day simulation for 2018 indicates a net aviation aerosol ERF (ARI + ACI, SW + LW) of -24 mW m-2 when using AEDT-based emissions, relative to a control simulation without aviation emissions. This forcing is dominated by ACI (-22 mW m-2), with shortwave and longwave contributions of -17 and -5 mW m-2, respectively, while ARI contributes only -3 mW m-2. Very similar results are obtained using AIM-based emissions, yielding a net ERF of -27 mW m-2. These values are large enough to offset approximately half of the best-estimate ERF from contrail cirrus reported by Lee et al. (2021). 

Changes in cloud macrophysical properties such as cloud fractions and liquid water paths remain difficult to detect above internal variability, whereas cloud microphysical responses are clearly visible. Cloud droplet number concentrations in the upper troposphere increase by up to ~15% over northern mid- to high-latitude regions, primarily driven by sulphate-liquid cloud interactions. Interactions between soot and ice clouds, including contrail cirrus, are not yet fully represented and will be addressed in future work by coupling UKESM with more sophisticated cloud microphysics model, CASIM.

Ongoing simulations extend this analysis to 2050 under multiple fuel scenarios, including conventional fuels, sustainable aviation fuel (SAF), and liquid hydrogen. While growing aviation demand amplifies both warming and cooling effects under conventional fuels, reduced aerosol emissions from alternative fuels are expected to weaken aviation-induced aerosol cooling effect. Results from these future scenarios will also be presented.

How to cite: Yoshioka, M., Dray, L., Field, P., Zhang, W., Schafer, A., and Rap, A.: Effective radiative forcing of aviation-induced aerosols in present-day and future climate simulated with UKESM, EGU General Assembly 2026, Vienna, Austria, 3–8 May 2026, EGU26-13213, https://doi.org/10.5194/egusphere-egu26-13213, 2026.

EGU26-13222 | Orals | AS3.31

Impact of Sulfur Cap on Pollution Levels over the Aegean and the Eastern Mediterranean 

Burcak Kaynak, Muhittin Gunes Onay, and Serra Saracoglu

Here, IMO 2020 Sulfur Cap regulation impacts on air quality were comprehensively investigated over the Aegean and the Eastern Mediterranean by integrating satellite-based SO2 and NO2 retrievals, and shipping route density analysis for the period of 2019–2023. This approach provided insights into how international maritime fuel regulations affect SO2 and NO2 levels, and heavily trafficked seas. TROPOMI SO2 and NO2 retrievals were evaluated over major shipping routes, open sea areas and important ports. The findings demonstrated that IMO 2020 regulation improvements were regionally and seasonally heterogeneous. In the Aegean Sea, satellite data indicated reductions in SO2 levels, particularly during the summer and autumn. Ports such as Canakkale, Izmir and Aliaga exhibited declines in SO2 concentrations confirming the measurable impact of the Sulfur Cap on air quality around the coastal regions. In contrast, the Eastern Mediterranean presented a more complex picture. Certain ports and routes, notably around Mersin, Taşucu, and Iskenderun, exhibited either no change or even increases in SO2 levels during the post-2020 period. At the regional scale, TROPOMI retrievals showed elevated SO2 over high-traffic corridors, including the Suez Canal approaches and Levantine Basin, despite the Sulfur Cap. Several factors may account for this variability, with potential non-compliance and weaker inspection regime with the Sulfur Cap regulation and the growing intensity of maritime traffic in critical transit corridors such as the Suez Canal. All of these impacts can diminish the anticipated reductions in ship-related SO2 emissions, and thereby weaken the overall improvement in regional air quality.

Route-based analysis showed a slowly declining trend emerged along high-intensity corridors when SO2 concentrations were normalized by shipping activity. These decreases, ranging from 14–16% in the Aegean, and approximately 10% in parts of the Eastern Mediterranean, suggested that the regulation achieved per-unit emission reductions, even though absolute SO2 levels did not decline as strongly due to growing shipping traffic volumes. The analysis of NO2 revealed a different regulatory outcome. While localized reductions were evident around ports such as Beirut, Ashdod, Haifa and Souda, broad-area increases were observed in open-sea regions, particularly along the main transit corridors.

In conclusion, IMO 2020 Sulfur Cap has yielded positive, but irregular air quality improvements across the Aegean and the Eastern Mediterranean. The benefits were pronounced in the Aegean Sea and around major Turkish ports, while the Eastern Mediterranean exhibited mixed outcomes shaped by maritime traffic growth and possible regulatory non-compliance. The observed reductions were generally smaller than the expected emission decreases in fuel sulfur content. These findings showed the significant contribution of shipping to regional air pollution and the necessity for stricter control measures, especially on open seas where enforcement is limited. The observed spatial heterogeneity emphasizes the critical role of localized monitoring and regional governance complementing global maritime policies to achieve cleaner air.

Keywords: Eastern Mediterranean; Shipping; IMO Sulfur Cap; SO2; NO2

How to cite: Kaynak, B., Onay, M. G., and Saracoglu, S.: Impact of Sulfur Cap on Pollution Levels over the Aegean and the Eastern Mediterranean, EGU General Assembly 2026, Vienna, Austria, 3–8 May 2026, EGU26-13222, https://doi.org/10.5194/egusphere-egu26-13222, 2026.

EGU26-13857 | Orals | AS3.31

The impact of soot emissions and fuel composition on contrail microphysics 

Julien Manin and Deniz Kaya Eyice

Understanding the microphysics of contrail formation is crucial for predictive models to be developed and deployed. Reliable model predictions are essential to accurately assess the environmental impact of aviation and to develop strategies to mitigate the effects of aircraft-induced cloudiness. This research aims to enhance our knowledge of the nucleation processes involved in contrail particle formation, by investigating the effect of soot emission levels, as well as the more complex fuel effects. To investigate these effects, we developed an altitude chamber facility dedicated to the study of atmospheric nucleation from ground level up to the stratopause. This facility enables precise control on ambient pressure, temperature, and gas composition. Exhaust gases, including particulates from relevant aviation fuels, are being fed to the chamber, emulating the exhaust stream of a jet engine. Utilizing a suite of advanced laser and optical diagnostic techniques, we characterized water nucleation processes varying soot emission levels and fuel composition, while changing ambient temperature under realistic atmospheric conditions around commercial airliners’ cruise altitudes.

Our experimental results provide compelling evidence for the significant role of soot emissions in the water nucleation process. Specifically, we observe that contrail nucleation is both delayed and less intense at lower soot levels in the exhaust. These findings align with previous research, indicating that contrail nucleation intensity diminishes with soot levels up to a certain threshold, beyond which further reductions in soot do not influence contrail formation. Notably, we do not observe an increase in contrail formation intensity at low soot levels, at all tested temperatures, potentially due to the absence of other species or particles that could offer alternative nucleation pathways. Additionally, our measurements reveal variations in fuel effects that extend beyond the soot-contrail relationship. Differences in soot properties, as well as the levels and types of volatiles emitted during combustion, likely account for the observed behaviors when comparing fuels. Ongoing and upcoming tests aim to evaluate the role of ambient humidity on contrail formation and to consider longer residence times to assess contrail development further downstream.

How to cite: Manin, J. and Kaya Eyice, D.: The impact of soot emissions and fuel composition on contrail microphysics, EGU General Assembly 2026, Vienna, Austria, 3–8 May 2026, EGU26-13857, https://doi.org/10.5194/egusphere-egu26-13857, 2026.

EGU26-13947 | ECS | Orals | AS3.31

Global Meteor Network: Large Scale Ground-Based Camera Validation of Contrail Model Predictions using Machine Learning 

Emily Tracey, Luc Busquin, Denis Vida, Lisa Schielicke, Liam Schultz, Jerome Busquin, Andrew Wang, Andrew Shum, Maadhyam Rana, Dan Ndabihayimana, Boris Tchatchoua Ngassam, and Karan Kapoor

Contrail cirrus contributes an estimated 1-2% of all anthropogenic radiative forcing, but this estimate carries significant uncertainty (~70%). A proposed mitigation strategy involves redirecting aircraft to avoid contrail-producing regions, which requires accurate predictions of atmospheric states.  To improve these predictions, direct observations of aircraft forming contrails can validate and constrain atmospheric models. Ground-based cameras bridge the spatial resolution gap left by satellite observations, allowing us to observe contrail formation and attribute contrails to specific flights.

We present first results from a large-scale dataset of flight-attributed contrails observed by the Global Meteor Network (GMN) across two continents over several months. The GMN operates 1,600 calibrated ground-based video cameras in 45 countries which have been modified for 24-hour observations to monitor contrails. Contrails were detected and segmented from camera timelapses using machine learning algorithms, automatically associated with flights from Automatic Dependent Surveillance–Broadcast (ADS-B) flight data (then manually validated), and compared to the CoCiP model predictions.

Our analysis highlights the limitations of current prediction models, which early results suggest stem from insufficient vertical resolution to capture vertically thin ISSRs and a limited number of measurements of humidity in the upper troposphere. While errors in model wind data affect our flight associations, the discrepancy between predicted and observed contrail advection offers a new avenue to quantify this wind error and use the derived measurements to improve associations. Finally, we provide statistics of contrail properties observed by the GMN such as altitude, width, and lifetime.

How to cite: Tracey, E., Busquin, L., Vida, D., Schielicke, L., Schultz, L., Busquin, J., Wang, A., Shum, A., Rana, M., Ndabihayimana, D., Tchatchoua Ngassam, B., and Kapoor, K.: Global Meteor Network: Large Scale Ground-Based Camera Validation of Contrail Model Predictions using Machine Learning, EGU General Assembly 2026, Vienna, Austria, 3–8 May 2026, EGU26-13947, https://doi.org/10.5194/egusphere-egu26-13947, 2026.

EGU26-16188 | Posters on site | AS3.31

Data-Driven Prediction of Anchor Dragging of Vessels under Typhoon Conditions  

JeongSeok Lee, Min An, TaeHoon Kim, and YeBeen Do

The increasing intensity of typhoons associated with climate change has significantly elevated the risk of anchor dragging of vessels sheltering in coastal anchorages, leading to collisions, groundings, and secondary maritime accidents. Despite its operational importance, anchor dragging under extreme weather conditions remains poorly understood and is rarely addressed as a predictive problem. This study proposes a data-driven framework to detect and predict anchor dragging of anchored vessels during typhoon events by integrating vessel motion data with meteorological and oceanographic forcing. Automatic Identification System (AIS) data were combined with typhoon track and intensity information, high-resolution marine weather fields, and bathymetric data for Typhoon Kong-Rey (2018), which directly affected Jinhae Bay, one of the largest typhoon shelter areas in Korea. Anchored vessels were identified using speed-based criteria, and vessel-specific anchor circles were constructed by estimating anchor positions from AIS heading information, anchor chain length, and vessel dimensions. Anchor dragging events were labeled based on deviations from the anchor circle, supported by visual verification. To predict dragging occurrence, a genetic algorithm-based automated machine learning framework (TPOT) was applied to optimize preprocessing steps, feature selection, model structure, and hyperparameters. The explanatory variables included vessel kinematics, wind speed and direction, atmospheric pressure, and local water depth. The resulting model successfully distinguished high-risk vessels during peak typhoon influence, demonstrating strong predictive performance and robustness across vessel types. The proposed approach provides a probabilistic early-warning capability for anchor dragging, enabling prioritized monitoring of high-risk vessels rather than uniform risk management. This framework supports proactive decision-making for Vessel Traffic Services (VTS), port authorities, and emergency response agencies, and contributes to reducing cascading maritime accidents under intensifying extreme weather conditions.


How to cite: Lee, J., An, M., Kim, T., and Do, Y.: Data-Driven Prediction of Anchor Dragging of Vessels under Typhoon Conditions , EGU General Assembly 2026, Vienna, Austria, 3–8 May 2026, EGU26-16188, https://doi.org/10.5194/egusphere-egu26-16188, 2026.

EGU26-16312 | Posters on site | AS3.31

Big Data–Driven Emission Inventory of Ship Exhaust Gases Considering Operational Scenarios 

Min An, JeongSeok Lee, and TaeHoon Kim

Ship exhaust emissions are recognized as a major source of air pollution in coastal regions and an important target of international maritime regulations. With the strengthening of fuel sulfur content regulations, there is an increasing demand for quantitative emission estimates that explicitly account for operational conditions and regulatory application criteria. The U.S. Environmental Protection Agency (EPA) provides guidelines for ship emission estimation, including engine power and load factor calculations based on AIS-derived operational data, low-load operation adjustments, and the application of fuel sulfur regulations. In this study, these EPA-recommended procedures are implemented as a computational framework and algorithm applicable to large-scale AIS data, and are applied to ships operating in Korean waters. The analysis targets oceangoing vessels operating in Korean waters during the period 2021–2024, using AIS-based operational data combined with detailed ship specification data from IHS. Operating time is derived from the time differences between consecutive AIS records, while engine load factors are calculated using relationships between vessel speed and Maximum speed, as well as between draft and Maximum draft. Operating conditions with load factors below 20% are defined as low-load operation, and corresponding low-load adjustment factors recommended by the EPA are applied. Fuel sulfur content regulations are incorporated by reflecting time-dependent and spatially differentiated regulatory criteria to classify fuel types, and emission factors are applied at the level of individual AIS records according to these conditions. Through this procedure, ship emissions are estimated while simultaneously accounting for operational characteristics and regulatory applicability. The estimated pollutants include NOx, CO, HC, PM10, PM2.5, SO₂, and CO₂. The results indicate that low-load operation accounts for 42.56% of all valid AIS records, including 13.69% under stationary conditions (SOG = 0) and 28.87% under low-speed operation. The average SO₂ emission intensity is estimated at 2446.95 g/h in non-regulated areas and 20.30 g/h in regulated areas. These results suggest that ship emission characteristics in Korean waters vary substantially depending on operational conditions and the application of time and space dependent fuel sulfur regulations. The resulting emission inventory enables comparisons of emission characteristics across regions and periods, and can serve as a basis for discussions related to coastal air quality analysis, evaluation of emission control effectiveness, and assessments of emission changes under different regulatory scenarios.

How to cite: An, M., Lee, J., and Kim, T.: Big Data–Driven Emission Inventory of Ship Exhaust Gases Considering Operational Scenarios, EGU General Assembly 2026, Vienna, Austria, 3–8 May 2026, EGU26-16312, https://doi.org/10.5194/egusphere-egu26-16312, 2026.

EGU26-16902 | ECS | Posters on site | AS3.31

Future Changes in Significant Wave Height along Major Shipping Routes in East Asia using CORDEX-EA data 

Taehyung Kim and Dong-Hyun Cha

Climate change is expected to alter wave conditions across the world’s oceans, potentially affecting ship navigation safety and maritime transportation efficiency. In East Asia, where international shipping routes are highly concentrated, understanding future changes in wave climate is particularly important for assessing climate-related maritime risks. In this study, future changes in significant wave height (Hs) along major shipping routes in East Asia are investigated using regional climate projections from the CORDEX framework. Significant wave height data for a historical reference period and future climate scenarios were analyzed to examine changes in annual and seasonal mean conditions as well as high-wave occurrences. The analysis focuses on route-based characteristics by extracting Hs along representative major shipping corridors, allowing spatial variations in wave conditions to be evaluated from an operational maritime perspective. Changes in the frequency of high-wave conditions exceeding selected Hs thresholds were also assessed to identify potential increases in navigational risk. The results indicate that future changes in significant wave height exhibit pronounced spatial and seasonal variability across East Asian seas. While mean Hs changes are modest in some regions, several shipping route segments show an increase in high-wave occurrences, particularly during winter seasons. These changes suggest that climate-driven modifications of wave conditions may lead to increased operational challenges along specific routes, even in the absence of large changes in mean wave height. This study highlights the importance of route-oriented wave climate assessments for maritime applications and demonstrates the usefulness of CORDEX regional climate projections for evaluating future wave-related risks. The findings provide a basis for climate adaptation strategies in maritime transportation, including route planning and risk management under future climate conditions.

How to cite: Kim, T. and Cha, D.-H.: Future Changes in Significant Wave Height along Major Shipping Routes in East Asia using CORDEX-EA data, EGU General Assembly 2026, Vienna, Austria, 3–8 May 2026, EGU26-16902, https://doi.org/10.5194/egusphere-egu26-16902, 2026.

EGU26-17067 | ECS | Posters on site | AS3.31

Insights into Potential Contrail Cirrus Regions During Surface Temperature Extremes from Three Decades of Airborne Measurements 

Yun Li, Susanne Rohs, Ulrich Bundke, Herman G. J. Smit, and Andreas Petzold

Contrails and contrail cirrus, induced by civil aviation and posing a radiative warming threat to the climate, form and persist at high altitudes in the upper troposphere in regions characterized by low temperatures and high relative humidity with respect to ice (RHice). Both temperature and humidity are critical variables controlling the formation of contrails and contrail cirrus. Variability in RHice in the upper troposphere is intrinsically associated with changes in ambient temperature. Recent years have seen record-breaking surface temperatures, particularly across continental regions. However, the relationship between upper-tropospheric temperature and humidity and surface temperatures remains poorly understood.

This work uses 30 years of airborne temperature and relative humidity measurements from the European Research Infrastructure IAGOS to investigate changes in Potential Contrail Cirrus Regions (PCCRs) in relation to surface temperature extremes (heatwaves and cold waves) over Europe. Surface temperature extremes are identified for each season using temperature measurements in the planetary boundary layer (<1.5–2 km altitude), applying statistical methods and significance tests. This classification provides the basis for examining the seasonal variability of RHice and PCCRs during heatwaves and cold waves. This study aims to improve understanding of how an increasingly warming world may affect the formation of contrails and contrail cirrus.

How to cite: Li, Y., Rohs, S., Bundke, U., Smit, H. G. J., and Petzold, A.: Insights into Potential Contrail Cirrus Regions During Surface Temperature Extremes from Three Decades of Airborne Measurements, EGU General Assembly 2026, Vienna, Austria, 3–8 May 2026, EGU26-17067, https://doi.org/10.5194/egusphere-egu26-17067, 2026.

EGU26-17795 | Orals | AS3.31

An updated global contrail forcing assessment accounting for volatile particulate matter 

Joel Ponsonby, Roger Teoh, Christiane Voigt, Marc Shapiro, and Marc E. J. Stettler

Contrails are ice clouds that form behind aircraft. Collectively, they are estimated to have a warming impact that is comparable to aviation’s accumulated CO2 emissions [1]. Individually, the warming impact of a contrail depends, inter alia, on the apparent emission index of ice crystals (AEIice), which is governed by its formation pathway. Accordingly, contrails form when hot exhaust gases mix with cooler ambient air and the plume exceeds water saturation. Under these conditions, water vapour condenses upon particles that are either exhausted by the aircraft or entrained from the environment. These water (or solution) droplets subsequently freeze to generate (contrail) ice crystals.

For aircraft powered by conventional rich-quench-lean (RQL) combustors, contrails predominantly form via non-volatile particulate matter (nvPM) in the “soot-rich” regime. However, lean-burn combustors reduce nvPM emissions by up to several orders of magnitude relative to RQL combustors, driving engine emissions into the “soot-poor” regime. Here, contrails are thought to form via ambient particles and volatile particulate matter (vPM), the latter generated from condensable gaseous emissions [2], including sulphuric acid and lubrication oil. Moreover, sulphuric acid has also been reported as a source of contrail ice crystals behind RQL combustors, for fuel sulphur content of ~500 ppm [3]. Therefore, global simulations that do not incorporate the role of vPM in contrail formation may underpredict AEIice and hence the warming potential of contrails formed under these conditions.

Recently, a model was developed to estimate AEIice across both the “soot-poor” and “soot-rich” regimes by including the role of vPM [4]. We previously integrated this framework into the contrail cirrus prediction model (CoCiP) and showed that incorporating vPM raises the 2019 global contrail net radiative forcing (RF) by up to 30% [5]. Since then, this work has been extended to better constrain the assumed vPM properties, leveraging outputs from two recent flight campaigns that measured AEIice in the “soot-poor” regime [6]. Here, we provide an updated estimate for the 2019 global contrail net RF and characterize the effects of lubrication oil and sulphuric acid emissions. Additionally, we investigate the contrail mitigation potential via fleetwide adoption of 100% sustainable aviation fuel and low-sulphur Jet A-1.                                                                                                                                   

References

[1] D. S. Lee et al., Atmos. Environ., 2021, DOI: 10.1016/j.atmosenv.2020.117834.

[2] F. Yu, B. Kärcher, and B. E. Anderson, Environ. Sci. Technol., 2024, DOI: 10.1021/acs.est.4c04340.

[3] R. Dischl et al., Commun Earth Environ, 2025, DOI: 10.1038/s43247-025-02951-5.

[4] J. Ponsonby et al., Atmos. Chem. Phys., 2025, DOI: 10.5194/acp-25-18617-2025.

[5] R. Teoh, et al., EGU General Assembly, 2025. DOI: 10.5194/egusphere-egu25-17393.

[6] C. Voigt et al., In Review. DOI: 10.21203/rs.3.rs-6559440/v1.

How to cite: Ponsonby, J., Teoh, R., Voigt, C., Shapiro, M., and E. J. Stettler, M.: An updated global contrail forcing assessment accounting for volatile particulate matter, EGU General Assembly 2026, Vienna, Austria, 3–8 May 2026, EGU26-17795, https://doi.org/10.5194/egusphere-egu26-17795, 2026.

EGU26-17802 | ECS | Posters on site | AS3.31

Constraining the role of soot in ice formation for robust estimates of aviation aerosol-cloud interactions 

Kexin Qiu, Masaru Yoshioka, Paul Field, Jack Macklin, Benjamin Murray, Martin Daily, and Alexandru Rap

Non-CO2 effects from aviation, particularly aerosol-cloud interactions, remain one of the largest uncertainties in the climate impact assessment of the transport sector. A key challenge is how aviation-emitted soot contributes to cirrus formation by acting as a potential ice-nucleating particle (INP). Current estimates span a wide range in both sign and magnitude, largely due to limitations in representing atmospheric ice nucleation and the dynamics governing cirrus formation, as well as the poorly constrained ice-nucleating properties of aviation soot in numerical models.

Here, we present a combined modelling and experimental framework to quantify how aviation soot ice nucleation perturbs cirrus properties and the resulting radiative impacts. We use the Met Office Unified Model (UM) coupled with the two-moment Cloud AeroSol Interaction Microphysics scheme (CASIM), which enables prognostic representation of ice crystal number concentration and explicit simulation of INP-driven perturbations. To represent soot-specific ice nucleation, we implement an active site density parameterisation for soot deposition freezing following Ullrich et al. (2017) within CASIM. In parallel, laboratory measurements are conducted using the Portable Ice Nucleation Experiment (PINE), a cloud expansion chamber, to characterise ice nucleation by aviation-relevant soot under cirrus conditions. The resulting constraints on soot INP efficiency across temperature and ice supersaturation are used to evaluate and refine the model parameterisation. Together, the laboratory constraints and regional simulations provide physically based estimates of aviation soot impacts on cirrus and associated radiative forcing.

The model is run in a regional configuration over Europe, focusing on high-traffic flight corridors and selected meteorological case studies relevant for cirrus formation. Model experiments compare baseline and aviation-perturbed simulations and explore sensitivity to assumptions on soot INP activity and emissions. Aviation soot emissions are prescribed using a new emission inventory developed in this work, built upon the GAIA (Global Aviation emissions Inventory based on ADS-B; Teoh et al., 2024). GAIA provides high-resolution, real-world flight activity and emissions, while our inventory explicitly separates contrail-processed and unprocessed soot particles. This separation captures the potential influence of contrail processing on soot ice-nucleating ability and provides a more comprehensive representation of the soot INP population available for cirrus formation. 

How to cite: Qiu, K., Yoshioka, M., Field, P., Macklin, J., Murray, B., Daily, M., and Rap, A.: Constraining the role of soot in ice formation for robust estimates of aviation aerosol-cloud interactions, EGU General Assembly 2026, Vienna, Austria, 3–8 May 2026, EGU26-17802, https://doi.org/10.5194/egusphere-egu26-17802, 2026.

Aircraft emissions play a role in human induced climate change, in particular condensation trails (contrails) formation, NOx and CO2 emissions. Recent years have seen increased research output in contrail studies and mitigation. Geo-engineering has gained attention in recent decades, with the objective to increase the global albedo resulting in reduced radiative forcing. Scenarios for geo-engineering include stratospheric aerosol injection (SAI), Marine Cloud Brightening (MCB), silver iodide injection as well as more niche scenarios. The interaction between aviation and geo-engineering remains underexplored. We explore the role of geo-engineering on contrail formation, persistence and aircraft plume chemistry employing the Aircraft Plume Chemistry, Emissions, and Microphysics Model (APCEMM). We apply this to jet fuel A-1 as well as potential alternative fuels with respective emission indices’ parameters including Synthetic aviation fuels (SAFs), hydrogen internal combustion jet engines and ammonia. We evaluate the chemistry background composition using theoretical adjustments and the G6-Sulfur experiment in CMIP6 model outputs. We explore how the result of increased particulate matter from increased aerosol number density, resulting from geo-engineering, facilitate the seeding of contrail formation. We find changes in ice crystal number density, heterogenous reaction rates of nitric acid, ozone perturbations optical depth of contrails, contrail lifetimes and total extinction, providing insights into the radiative forcings from SAI influenced contrails. [An increase in ice crystal number density is observed due to an abundance of sulfate aerosols acting as condensation nuclei. Reductions in the efficacy of alternative fuels such as hydrogen at minimising contrails, both in lifetime and forcing, when background aerosols replace soot as nucleating particles. Enhanced heterogonous reaction rate were found to increase HNO3 with SAI by 5 % for a 50 % increase in SO2 ]


How to cite: Foster, A., Khan, A., Shallcross, D., and Lowenberg, M.: The impact of Stratospheric Aerosol Injection and other geo-engineering scenarios on aircraft plume chemistry and contrails from conventional and alternative fuels, EGU General Assembly 2026, Vienna, Austria, 3–8 May 2026, EGU26-18790, https://doi.org/10.5194/egusphere-egu26-18790, 2026.

EGU26-19086 | ECS | Posters on site | AS3.31

Assessing the impact of ocean circulation model resolution on optimal maritime routing in the Ligurian Sea using VISIR-2 

Vassiliki Metheniti, Antonios Parasyris, George Alexandrakis, Giorgos Kozyrakis, Nikolaos Kampanis, and Gianandrea Mannarini

Ocean currents play a key role in determining optimal maritime routes, particularly in regions characterized by complex mesoscale and coastal dynamics. This study assesses the sensitivity of weather routing to ocean model resolution by comparing optimal routing paths obtained with the VISIR-2 model [1] forced by ocean circulation models with different spatial resolution. The Bastia (Corsica)–Nice (France) route was selected as a representative ferry corridor in the Mediterranean Sea. The route crosses the Ligurian Sea, a region characterized by a strong boundary current and intense mesoscale activity, making it a suitable test case to assess the sensitivity of optimal ship routing to ocean current resolution. Optimal routes between the two ports are computed daily for one year using: (i) the 4.2 km resolution Copernicus Marine Environment Monitoring Service (CMEMS) Mediterranean reanalysis product  [2] (reference experiment), and (ii) a regional NEMO configuration at 2 km horizontal resolution covering the broader Lingurian Sea (high-resolution experiment). The simulated vessel is a Ro-Pax passenger ferry with an overall length of 125 m, whose propulsion characteristics and CO₂ emission model are derived from [3]. In both experiments, time-varying ocean currents are used by VISIR-2 to compute time-optimal and least-CO₂ trajectories under realistic vessel dynamics. Wave conditions are also accounted for using the CMEMS wave dataset [4]. The comparison focuses on route geometry, travel time, CO₂ emissions and seasonal variability. The analysis aims to assess how differences in ocean model resolution influence optimal maritime routing. 


References:

[1] Mannarini, G., Salinas, M. L., Carelli, L., Petacco, N., and Orović, J.: VISIR-2: ship weather routing in Python, Geosci. Model Dev., 17, 4355–4382, https://doi.org/10.5194/gmd-17-4355-2024, 2024.

[2] Mediterranean Sea Physics Reanalysis. E.U. Copernicus Marine Service Information (CMEMS). Marine Data Store (MDS). DOI: 10.25423/CMCC/MEDSEA_MULTIYEAR_PHY_006_004_E3R1 (Accessed on 13-01-2026)

[3] Mannarini, G.; Carelli, L.; Orović, J.; Martinkus, C.P.; Coppini, G.: Towards Least-CO2 Ferry Routes in the Adriatic Sea. J. Mar. Sci. Eng. 2021, 9, 115. https://doi.org/10.3390/jmse9020115 

[4] Mediterranean Sea Waves Reanalysis. E.U. Copernicus Marine Service Information (CMEMS). Marine Data Store (MDS). DOI: https://doi.org/10.48670/mds-00376 (Accessed on 13-01-2026)


Acknowledgement: This research has received funding from the European Union’s H2020 innovation programme under the Grant Agreement No. 101112752.

How to cite: Metheniti, V., Parasyris, A., Alexandrakis, G., Kozyrakis, G., Kampanis, N., and Mannarini, G.: Assessing the impact of ocean circulation model resolution on optimal maritime routing in the Ligurian Sea using VISIR-2, EGU General Assembly 2026, Vienna, Austria, 3–8 May 2026, EGU26-19086, https://doi.org/10.5194/egusphere-egu26-19086, 2026.

EGU26-19369 | Posters on site | AS3.31

Emission pay-back time of battery-powered versus fossil-fuel powered passenger vessel  

Cristina-Maria Iordan, Rahul Ravi, Andrea Viken Strand, Klara Maria Schluter, and Anne Bruyat

The maritime sector, traditionally one of the hardest sectors to decarbonize, is currently rapidly changing driven by demands for emission reductions. Increasingly stringent regulatory frameworks, including the International Maritime Organization’s (IMO) net-zero ambitions and the European Union’s (EU) greenhouse gas (GHG) reduction targets are driving the maritime sector to adopt low-emission technologies and practices. Increased attention has been previously allocated by the scientific community to the exploration of alternative fuels and efficiency improvements. Nevertheless, the full life-cycle implications of completely electrifying passenger vessels remain insufficiently assessed.

This study estimates the emission pay-back time associated with replacing a conventional marine gas oil (MGO) powered passenger vessel with a concept vessel fully powered by battery and rigid auxiliary sails. The analysis assumes one year of continuous operation for both vessels along the traditional Norwegian coastal route. A life-cycle assessment (LCA) framework is applied. The system boundaries are covering the production of lithium iron phosphate (LFP) batteries with a net capacity of 60 MWh; sails manufacturing, installation, operation, and energy savings; charging infrastructure; energy requirements for vessel’s operation and end-of-life treatment. The resulting total carbon footprint for one year of operation is compared with the one corresponding to the reference vessel, the fossil-fuel powered one, where manufacture, operation, and disposal of diesel engines are considered.

The vessel’s operational energy demand is derived from real-world timetable data and reflects seasonal variations. The energy requirements range between 642 and 666 MWh per roundtrip. The assessment takes into consideration the battery losses as well as the depth-of-discharge constraints. Battery charging is modelled using realistic electricity mixes from Norwegian bidding zones NO2 to NO5 which are corresponding to the geographical route of the vessel. In contrast to the generic national-average electricity mixes usually applied in LCA studies, this dynamic approach for electricity modelling considers the spatial and temporal variations in electricity generation sources. This has a direct impact on the associated emission intensities of the electricity consumption of the vessel. The fossil-fuelled reference vessel requires approximately 50 000 MWh of gross energy annually, assuming an average engine efficiency of 37% and auxiliary heating partly supplied by oil-fired boilers. In contrast, the battery-electric vessel requires about 28 000 MWh per year, enabled by an optimized system design, high propulsion efficiency (around 90%), and improved heat recovery.

Our preliminary results highlight that the emissions pay-back period is highly sensitive to the carbon intensity of the electricity supply as well as to the spatial distribution of charging infrastructure localized in the harbours where the vessel stops. We find as critical for the operational feasibility the availability of high-power chargers in ports such as Ålesund and Trondheim.

Under the current Norwegian grid conditions and the power purchase agreements in place modelled here in the study, the pay-back time is sufficiently short. We therefor find that battery electrification can be one of the near-term decarbonization strategy for the maritime sector. Overall, our results show that full replacement of fossil-fuel coastal vessels with battery-electric solutions can deliver substantial GHG reductions, supporting both IMO and EU climate objectives.

How to cite: Iordan, C.-M., Ravi, R., Viken Strand, A., Schluter, K. M., and Bruyat, A.: Emission pay-back time of battery-powered versus fossil-fuel powered passenger vessel , EGU General Assembly 2026, Vienna, Austria, 3–8 May 2026, EGU26-19369, https://doi.org/10.5194/egusphere-egu26-19369, 2026.

EGU26-19535 | Orals | AS3.31

High-resolution simulations of contrails from hydrogen combustion and fuel cell propulsion 

Simon Unterstrasser, Annemarie Lottermoser, Josef Zink, Dennis Hillenbrand, and Wing-Fai Thi

A climate-friendly aviation sector requires the development of new propulsion technologies to replace conventional kerosene-based propulsion. Hydrogen propulsion is regarded as a promising alternative, and we assess its implications for the contrail effect. For hydrogen propulsion, water vapor emissions are higher, and soot particles—serving as condensation nuclei for ice crystal formation—are absent.

Using high-resolution simulations, we analyze contrails from hydrogen propulsion systems (either direct combustion or fuel-cell based) throughout their entire life cycle and compare them with contrails from conventional kerosene combustion.

The formation of H₂ contrails on entrained ambient aerosols is simulated, and the potential role of oil droplets and homogeneous droplet nucleation (HDN) is discussed. Because ambient aerosols are typically less abundant than soot particles in kerosene combustion, H₂ contrails contain fewer ice crystals. However, in unfavorable scenarios, ice crystal formation on oil droplets or via HDN can become the dominant mechanism.

We further analyze the early evolution of contrails in the presence of downward-moving wake vortices (age ≲ 5 min) and their transition into contrail cirrus over several hours.

To evaluate the effect of H₂ propulsion on contrail development, we adjust two key input parameters: the water vapor emission and the initial number of ice crystals (to reflect altered formation processes). We examine how the radiative properties of contrail cirrus change in response to systematic variations in the initial ice crystal number. Our results show that factors such as the initial ice crystal number, ambient temperature, and relative humidity strongly influence the contrail life cycle, whereas the increased water-vapor emissions have only a secondary effect. Contrails with fewer ice crystals are shown to have a substantially reduced radiative impact.

This work contributes to the joint efforts of the German Aerospace Center (DLR) and Airbus to evaluate the climatic impact of H₂ contrails.

How to cite: Unterstrasser, S., Lottermoser, A., Zink, J., Hillenbrand, D., and Thi, W.-F.: High-resolution simulations of contrails from hydrogen combustion and fuel cell propulsion, EGU General Assembly 2026, Vienna, Austria, 3–8 May 2026, EGU26-19535, https://doi.org/10.5194/egusphere-egu26-19535, 2026.

EGU26-19969 | ECS | Orals | AS3.31 | Highlight

Joint Optimization of Route and Speed for Energy-Efficient Wind-Assisted Shipping 

Thorben Schwedt, Dheeraj Gosala, Tobias Lampe, Annika Fitz, Travis Teske, Sophie Stutz, Lars Schmitz, Vaidehi Gosala, Marco Klein, and Sören Ehlers

Wind-Assisted Propulsion Systems (WAPS) are increasingly recognized as a promising means of exploiting the abundant wind resource, particularly given the high cost and limited availability of renewable fuels. WAPS can contribute significantly to the decarbonization of the shipping sector. Contemporary systems are tightly integrated with onboard energy systems to meet stringent supply chain requirements, with recent developments focusing on larger sail configurations and the integration of hydro-generators to enhance overall efficiency.

Unlike conventionally powered ships, which typically search for the shortest navigational safe route at nearly constant speed, wind-assisted vessels benefit from a more flexible operational paradigm in which routing and speed adaptation are key to realizing their full potential. In the present study, the benefit of jointly optimizing route and speed for a cargo vessel equipped with WAPS is demonstrated. A four-degree-of-freedom steady state simulation model is employed to evaluate vessel performance under varying environmental conditions based on ERA5 data. To identify energy-optimal routes between ports, a dedicated algorithm is developed and presented that combines probabilistic roadmap techniques with dynamic programming.

The proposed framework is highly flexible with respect to the integration of diverse meteorological datasets and ship performance models. A key novelty is its ability to accommodate negative power and energy values, thereby enabling the optimal recuperation of energy through hydro-generator operation. The results indicate a substantial reduction in energy consumption through the combined optimization of routing and speed adjustment across multiple transport routes over a one-year operational period Moreover, by avoiding harsh weather conditions, routing enabled numerous routes that would have been unviable without it. The case study demonstrated average energy savings of approximately 75%, and up to 100% for selected low-speed trans-Atlantic crossings.

How to cite: Schwedt, T., Gosala, D., Lampe, T., Fitz, A., Teske, T., Stutz, S., Schmitz, L., Gosala, V., Klein, M., and Ehlers, S.: Joint Optimization of Route and Speed for Energy-Efficient Wind-Assisted Shipping, EGU General Assembly 2026, Vienna, Austria, 3–8 May 2026, EGU26-19969, https://doi.org/10.5194/egusphere-egu26-19969, 2026.

EGU26-20106 | Posters on site | AS3.31

Role of climate metrics in aviation climate assessments  

Katrin Dahlmann, Sigrun Matthes, Volker Grewe, and Roland Eichinger

Quantitative assessments of CO2 and non-CO2 climate effects of aviation emissions require the choice of a physical climate metric. In consequence estimating mitigation potentials or integrating non-CO2 effects in legislation or cost-benefit analyses require the choice of a metric. However, since various metrics are currently in use and estimates and numbers vary over different climate metrics, it is desirable and necessary to have conversion factors available which allow to convert from one physical climate metric to another. Hence, we introduce an approach how such climate metric conversion factors can be calculated and present an initial set based on the climate response model AirClim. These conversion factors can be used for various applications. These include, for example, converting results from models that only calculate radiative forcing into a climate metric and scaling model results calculated with different metrics to the same one for one-to-one comparisons.

In addition, the conversion factors can be used for convenient analyses of the influence of metric choice on the results of a climate assessment. To this end, it is shown here how the ratio of non-CO2 to CO2 differs depending on the choice of metric. The metrics GWP, EGWP, GTP and ATR are analysed, each with a time horizon of 20, 50, 100 and 500 years.  The choice of the temporal emission curve is also analysed and it is shown exemplarily why a sequence of pulse emissions does not provide the same climate metric result as constant emissions.

How to cite: Dahlmann, K., Matthes, S., Grewe, V., and Eichinger, R.: Role of climate metrics in aviation climate assessments , EGU General Assembly 2026, Vienna, Austria, 3–8 May 2026, EGU26-20106, https://doi.org/10.5194/egusphere-egu26-20106, 2026.

EGU26-20759 | ECS | Posters on site | AS3.31

Improving contrail avoidance through targeted deployment of humidity sensors on aircraft and advanced weather data assimilation. 

Winter Oostwoud, Vincent Meijer, Jessie Smith, and Steven Barrett

Approximately two-thirds of aviation’s climate impact are attributed to contrail cirrus, the clouds resulting from the persistence of initially linear contrails [1]. This persistence can only occur in regions of the atmosphere where the relative humidity w.r.t. ice (RHi) is larger than 100%: these regions are known as ice supersaturated regions (ISSRs). The climate impact of contrail cirrus could be mitigated by means of minor trajectory adjustments that re-route aircraft around ISSRs (or subsets of these regions) at the cost of minor increases in fuel burn [2, 3]. The viability and effectiveness of this mitigation option rely on skillful forecasts of these regions: existing approaches to numerical weather prediction (NWP) have been found to be relatively poor at forecasting such regions of contrail persistence [4, 5]. This lack of skill is attributed to the coarse spatial resolution of such NWP model, simplified treatment of ice clouds, and the scarcity of high-quality measurements of humidity in the upper troposphere. 

This study evaluates the ability of in-flight humidity measurements to improve humidity forecasts, and contrail avoidance relying on these forecasts, through an Observation System Simulation Experiment (OSSE). An original RHi forecast is updated by employing 4D-Var data assimilation of simulated humidity data into ERA5 ensembles. A proof-of-concept case study is first presented, using real IAGOS flights: humidity observations from one transatlantic IAGOS flight are used to improve the humidity forecast for another, temporally adjacent, IAGOS flight. The updated forecast, based on the first flight observations, is validated against the independent RHi observations from this second flight, showing an improvement in RMSE relative to the original forecast. 

Next, the climate impact and operational cost of the improvements to the forecast are assessed for various simulated scenarios at a fleet-wide scale. The scenarios consist of: 1) 6 different levels of allocation of aircraft in the fleet that are equipped with humidity sensors (0%, 20%,40%, 60%, 80%, 100% of fleet penetration), 2) 4 levels of discrepancy between humidity forecasts and ground truths (10%, 30%, 50%, 70% recall on ISSR prediction), and 3) 3 levels of simulated accuracy of the humidity sensors used (3%, 6%, 12%). 

Results show that targeted sensor allocation among a fleet yield increased persistent contrail reduction under realistic forecast discrepancies, supporting scalable aviation climate strategies using on-situ humidity measurements. 

[1] Lee et al. (2021). The contribution of global aviation to anthropogenic climate forcing for 2000 to 2018. Atmospheric Environment 244, 117834. https://doi.org/10.1016/j.atmosenv.2020.117834 

[2] Teoh et al. (2020). Beyond contrail avoidance: Efficacy of flight altitude changes to minimise contrail climate forcing. Aerospace, 7(9), 121. https://doi.org/10.3390/aerospace7090121 

[3] Frias et al. (2024). Feasibility of contrail avoidance in a commercial flight planning system: An operational analysis. Environmental Research: Infrastructure and Sustainability, 4(1), 015013. https://doi.org/10.1088/2634-4505/ad310c 

[4] Gierens et al. (2020). How well can persistent contrails be predicted? Aerospace, 7(12), 169. https://doi.org/10.3390/aerospace7120169 

[5] Geraedts et al. (2024). A scalable system to measure contrail formation on a per-flight basis. Environmental Research Communications, 6(1), 015008. https://doi.org/10.1088/2515-7620/ad11ab 

How to cite: Oostwoud, W., Meijer, V., Smith, J., and Barrett, S.: Improving contrail avoidance through targeted deployment of humidity sensors on aircraft and advanced weather data assimilation., EGU General Assembly 2026, Vienna, Austria, 3–8 May 2026, EGU26-20759, https://doi.org/10.5194/egusphere-egu26-20759, 2026.

EGU26-20936 | Posters on site | AS3.31

Identifying confidence intervals for aviation climate effect mitigation potentials – using algorithmic climate change function 

Sigrun Matthes, Simone Dietmüller, Katrin Dahlmann, and Peter Patrick

One option for quantitative assessment of climate effects of single aircraft trajectories relies on spatially and temporally resolved climate change functions (CCFs) and their algorithmic version (aCCFs). Such aCCFs estimate radiative forcing or temperature change of aircraft emissions depending on their time and location of emission. However, the confidence of these estimates is limited by uncertainties arising at several levels: estimates of aircraft emissions, model representations and the probabilistic nature of numerical weather prediction (NWP) forecasts, and the analysis and representation of atmospheric processes when modelling climate effects and associated uncertainties. Aviation’s climate effects originate from perturbations of atmospheric concentrations in the upper troposphere and lower stratosphere (UT/LS), the principal region where contrails, NOₓ, and other aerosols exert their influence. Consequently, our uncertainty framework explicitly incorporates information from both observational techniques and numerical simulation models representative for this atmospheric layer.

In this study we present an integrated workflow that combines uncertainties from four principal sources: emissions, NWP forecast spread and skill, representation of atmospheric processes in atmosphere-climate models, and reduced complexity from regressions. In the numerical workflow as explored in our study, each uncertainty source is described either by a probability distribution (normal, log‑normal, or empirically derived) or by an ensemble of realizations. Through Monte‑Carlo sampling we propagate these uncertainties across the physical relationships that couple emissions to climate effect estimates, producing a probabilistic estimate of the net climate‑impact reduction and its confidence interval.

Application of this proposed uncertainty workflow to a set of city‑pair routes demonstrates how uncertainties can be represented with confidence levels, and with the help of hypothesis test, we can evaluate the robustness of individual proposed alternative aircraft trajectories. This numerical workflow allows balancing in fuel consumption, operational cost, and reduction in climate effects in a mathematical and statistical way. Ultimately, such type of workflow is designed for integration into automated flight‑planning and decision‑support systems. Limitations include a possible underestimation or overestimation of uncertainty values and the current lack of systematic observational validation of the aCCFs. Future work will aim to improve scientific understanding on non-CO2 climate effects, and to integrate prevailing uncertainties in an overall decision-making-process.

How to cite: Matthes, S., Dietmüller, S., Dahlmann, K., and Patrick, P.: Identifying confidence intervals for aviation climate effect mitigation potentials – using algorithmic climate change function, EGU General Assembly 2026, Vienna, Austria, 3–8 May 2026, EGU26-20936, https://doi.org/10.5194/egusphere-egu26-20936, 2026.

EGU26-1104 | ECS | Posters on site | AS3.32

Advancing UAS-Based Monitoring of Stack Emission of Air Pollutants 

Maria Kezoudi, Roubina Papaconstantinou, Alkistis Papetta, Franco Marenco, Pierre-Yves Quehe, Rafail Konatzii, Jean Sciare, and Usrl Team

The Cyprus Institute recently developed, tested, validated, and deployed a dual multi-sensor uncrewed aerial systems (UAS) platform for high-resolution (1-second), in-situ monitoring of the chemical composition of stack emissions. The first UAS consists of a custom-built multicopter equipped with a commercial optical particle counter POPS (Handix Scientific Inc.) and a micro-aethalometer (AethLabs). These instruments allow for three-dimensional measurements of particulate matter (PM2.5) and black carbon (BC), two key air quality parameters regulated across the European Union. The second UAS integrates on a custom-calibrated SO₂–CO₂ sensor suite to quantify the sulfur content of ship emissions (in compliance with the EU directive (EU) 2016/802).

Together, these UAS platforms enable precise and flexible four-dimensional profiling of aerosols and trace gases within dynamic pollution plumes, in complex and regulated environments. The platforms show great potential for monitoring air quality in urban areas, coastal shipping corridors, and industrial zones, providing high-resolution data on primary emissions and their rapid atmospheric processing within the dispersion of the plume. Results from these novel UAS systems from recent field campaigns, part of the Edu4ClimAte Horizon Europe program, are presented here. Additional results from future campaigns will be made available.

How to cite: Kezoudi, M., Papaconstantinou, R., Papetta, A., Marenco, F., Quehe, P.-Y., Konatzii, R., Sciare, J., and Team, U.: Advancing UAS-Based Monitoring of Stack Emission of Air Pollutants, EGU General Assembly 2026, Vienna, Austria, 3–8 May 2026, EGU26-1104, https://doi.org/10.5194/egusphere-egu26-1104, 2026.

Air pollution growth significantly impacts human health with different sources, i.e., industrial emission, vehicle emission, biomass burning, and urban dust. This analysis focuses on the recent events of the gas tanker and LPG blast on 20 December 2024 and 07 October 2025 at the Jaipur-Ajmer Highway in Rajasthan, India. The study measured air pollutants pre-, during, and post-event from the Central Pollution Control Board (CPCB) and satellite data analysis of the concentration of AOD, black carbon, and active fire to confirm smoke plume and meteorological parameters to explain the pollutant dispersion during the event. The result found that PM2.5, PM10, and CO concentrations increase suddenly when PM2.5 crosses the AQI limit of baseline levels. The concentration of fire data confirmed active thermal anomalies during the event sites, comparing with air pollutant spikes. This observation found that high explosions during the event can significantly degrade air quality post-event, depending on meteorological conditions.

How to cite: Bhati, V. S.: Analysis of air pollution during the Gas tanker burning over the semi-arid eastern plain zone of Rajasthan, India, i.e., Jaipur, EGU General Assembly 2026, Vienna, Austria, 3–8 May 2026, EGU26-1305, https://doi.org/10.5194/egusphere-egu26-1305, 2026.

EGU26-2303 | Posters on site | AS3.32

Sustained reductions in European traffic air-pollution emissions revealed by long-term eddy-covariance fluxes 

Thomas Karl, Werner Jud, Christian Lamprecht, Michael Stichaner, Arianna Peron, Martin Graus, and Bin Yuan

Nitrogen oxides (NOx) play a key role in atmospheric chemistry by regulating ozone formation in conjunction with non-methane volatile organic compounds (NMVOC). In addition, nitrogen dioxide (NO₂) poses significant health risks at elevated concentrations. European air-quality legislation limits annual mean NO₂ to 40 µg m⁻³, while recent World Health Organization guidelines recommend a substantially lower annual mean of 10 µg m⁻³, highlighting the need for accurate urban emission estimates. Here we present nearly a decade of direct eddy-covariance flux measurements of NOx, NMVOC, and CO₂ in a European urban area exposed to persistently high NO₂ levels.

We show that NOx emissions from older policy-relevant projection models underestimated traffic-related emissions by up to a factor of two. Although updated inventories predict higher emissions, substantial scenario-dependent discrepancies remain when compared with direct flux observations. Long-term measurements reveal a sustained decline in traffic-related NOx and NMVOC emissions, with the strongest reductions observed in 2020 during COVID-19 mobility restrictions. However, the NOx/CO₂ traffic emission flux ratio remained largely unchanged during this period, indicating that short-term reductions in traffic activity did not alter fleet-average emission characteristics. The observed long-term decline is instead consistent with a progressive technological shift towards cleaner, lower-NOx emitting vehicle fleets.

Trends in NMVOC emissions are more complex: traffic-related NMVOC decline in parallel with NOx, while oxygenated VOCs exhibit both increasing and decreasing trends, reflecting changes in source composition. Together, these results demonstrate the value of long-term direct flux measurements for evaluating emission inventories and policy scenarios, and provide robust observational evidence of structural changes in European urban traffic emissions.

How to cite: Karl, T., Jud, W., Lamprecht, C., Stichaner, M., Peron, A., Graus, M., and Yuan, B.: Sustained reductions in European traffic air-pollution emissions revealed by long-term eddy-covariance fluxes, EGU General Assembly 2026, Vienna, Austria, 3–8 May 2026, EGU26-2303, https://doi.org/10.5194/egusphere-egu26-2303, 2026.

EGU26-2662 | Orals | AS3.32

Emission, Transformation, and Health Impacts of vehicular non-exhaust pollutants 

Jianfei Peng, Hongjun Mao, Fuyang Zhang, Fuyuan Qi, Jinsheng Zhang, and Qijun Zhang

Vehicular non-exhaust emissions have become a dominant source of particulate pollution in urban areas. In this work, we systematically investigated the emission, transformation, and health effects of vehicular non-exhaust pollutants. Our study focused on three key aspects: (1) real-world emissions and contributions of brake wear particles (BWPs) and tire wear particles (TWPs); (2) heterogeneous aging of atmospheric reactive gases on BWP surfaces; and (3) the evolution of health impacts during atmospheric aging of BWPs and TWPs. By combining laboratory chassis-dynamometer experiments with real-world tunnel observations, we quantitatively constrained non-exhaust emissions from both controlled and actual driving conditions. A new methodology was developed to enable direct and quantitative measurement of BWP emissions on a chassis dynamometer, providing a robust experimental foundation for emission characterization. Tunnel observations under real driving conditions further allowed us to derive BWP and TWP emissions in China using both bulk-composition and single-particle source apportionment approaches, yielding mutually consistent estimates. Complementary flow-tube simulations revealed that BWP surfaces exhibit pronounced heterogeneous reactivity toward atmospheric oxidants and trace gases such as SO₂, NO₂, and O₃. Unexpectedly, these reactions led to substantial sulfate formation from SO₂ oxidation, efficient HONO production from NO₂ uptake, and rapid O₃ decomposition. Moreover, we also found that atmospheric aging by OH and O₃ considerably enhances the oxidative potential of BWPs and TWPs, implying elevated health risks following environmental transformation. Our results reveal that vehicular non-exhaust emissions not only constitute an important primary source of urban particulate matter, but also serve as highly reactive mediators in atmospheric chemistry. We highlight the urgent need to explicitly incorporate non-exhaust sources into air-quality models and account for atmospheric aging when evaluating the health burden associated with traffic-related particles.

How to cite: Peng, J., Mao, H., Zhang, F., Qi, F., Zhang, J., and Zhang, Q.: Emission, Transformation, and Health Impacts of vehicular non-exhaust pollutants, EGU General Assembly 2026, Vienna, Austria, 3–8 May 2026, EGU26-2662, https://doi.org/10.5194/egusphere-egu26-2662, 2026.

PM10 and PM2.5 are major sources of air pollution in Korea, particularly during the winter, necessitating systematic management. South Korea operates an automated air quality monitoring network to manage atmospheric conditions, with Cheongju City currently maintaining eight such monitoring stations. In this study, we analyzed hourly measurements from these eight stations in 2024 to understand the characteristics of PM10 and PM2.5 in Cheongju.
Cheongju City, covering an area of 941 km², is a basin-type city located in central Korea. Surrounded by mountains, the city's topographical structure contributes to higher PM10 and PM2.5 concentrations compared to the Korean national average, despite residential areas accounting for less than 30% of the total area.
First, we conducted a Pearson correlation analysis for each monitoring station to identify common contributing pollutants to PM10 and PM2.5 concentrations. For PM10, the correlation between the eight stations ranged from 0.88 to 0.99, while for PM2.5, it ranged from 0.74 to 0.91. These high correlations suggest that the current monitoring network, which measures at hourly intervals, may need to adopt shorter measurement intervals for more precise data.
Seasonal trends indicated that PM10 and PM2.5 concentrations are high in spring and winter but low in summer. The elevated concentrations during spring and winter are attributed to long-range transport from China, as well as domestic emissions from vehicles and heating. Regarding diurnal trends, PM10 concentrations peak during commuting hours due to vehicular traffic, while PM2.5 levels reach their daily minimum between 3:00 PM and 5:00 PM. These findings can be utilized to establish systematic management plans for PM10 and PM2.5 concentrations in Cheongju City.


Acknowledgment:This research was supported by the Particulate Matter Management Specialized Graduate Program through the Korea Environmental Industry & Technology Institute (KEITI), funded by the Ministry of Environment (MOE).

How to cite: Lee, S. and Kim, Y.: A Study on the Management Plan of Automatic Measurement Networks Based on Seasonal and Time-of-Day Characteristics of PM10 and PM2.5 in Cheongju City, EGU General Assembly 2026, Vienna, Austria, 3–8 May 2026, EGU26-2666, https://doi.org/10.5194/egusphere-egu26-2666, 2026.

EGU26-4043 | Posters on site | AS3.32

"Another One Bites the Dust" : Artificial Neural Networks Application and Source Tracking of Polycyclic Aromatic Hydrocarbons and Ecological Risk Posed by Urban Road Dust 

Sylwia Klaudia Dytłow, Małgorzata Kida, Kamil Pochwat, Grzegorz Karasiński, and Jakub Karasiński

Road dust acts as both a vector and a source of multiple urban pollutants, including polycyclic aromatic hydrocarbons (PAHs), which can be transported into surface waters via runoff, contributing to widespread environmental contamination. This study integrates chemical analyses, magnetic measurements, Artificial Neural Network modeling, source tracking, and ecological risk assessment to evaluate PAHs contamination in Warsaw’s urban road dust and its potential ecological and human health risks. A total of 206 road dust samples were collected across diverse urban locations, encompassing variations in traffic intensity, building height, urban layout, and municipal heating activity. Samples were characterized by particle size fractions and magnetic properties, including magnetic susceptibility, saturation magnetization, and remanent magnetization. A subset of 57 samples focusing on the fine fraction (<0.2 millimeters) was analyzed for sixteen priority PAHs compounds, markers of combustion-derived pollution.

Total PAHs concentrations (∑16PAHs) in the fine fraction ranged from below the limit of quantification to twelve milligrams per kilogram, with an average of 3.5 milligrams per kilogram. The most abundant compounds were acenaphthene, fluorene, and phenanthrene, while high molecular weight PAHs accounted for approximately fifty-five percent of total PAHs. Diagnostic isomer ratios, including indeno[1,2,3-cd]pyrene to the sum of indeno[1,2,3-cd]pyrene and benzo[ghi]perylene, indicated traffic-related pyrogenic sources dominated. Magnetic susceptibility normalized to fine particle proportion (χWN) correlated strongly with total and high molecular weight PAHs (r = 0.79, R² ≈ 0.63), confirming its utility as a rapid, non-destructive proxy for organic contamination. Multivariate analyses revealed distinct pollution patterns, grouping PAHs by shared sources and physicochemical behavior. Elevated PAHs levels occurred in the city center, while peripheral areas had lower concentrations.

Artificial Neural Network models predicted PAHs concentrations from magnetic properties, particle size fractions, traffic intensity, building height, urban layout, and municipal heating patterns. A consolidated model across all samples achieved moderate performance (correlation coefficients ~0.45–0.57), whereas models stratified by municipal heating activity performed significantly better. Neural networks for periods of inactive heating yielded high correlation coefficients (0.91–0.94) and low root mean square errors, indicating strong predictive capability and stability. Sensitivity analysis identified building height and heating-related factors as most influential. Combining neural network predictions with isomer ratio diagnostics allowed source tracking of PAHs, distinguishing contributions from traffic, combustion heating, and urban structural influences. Magnetic proxies, particle size, and urban parameters efficiently identified PAH pollution hotspots in dense urban areas.

Ecological risk assessment using MERM-Q showed most samples fell into the low-risk category, with highest values in the city center. These results provide quantitative insights into potential ecological and human health risks posed by traffic-related PAHs, highlighting road dust as both a local pollutant and a vector transporting contaminants into broader urban environments and surface waters. This methodology enables rapid identification of pollution hotspots, supports targeted mitigation strategies, and informs urban planning, traffic management, and municipal heating policies to reduce environmental and health hazards. By combining predictive modeling with source apportionment, this study offers a robust framework for monitoring and managing hazardous organic pollutants in cities.

This research was funded in whole by the National Science Centre, Poland under grant number 2021/43/D/ST10/00996.

How to cite: Dytłow, S. K., Kida, M., Pochwat, K., Karasiński, G., and Karasiński, J.: "Another One Bites the Dust" : Artificial Neural Networks Application and Source Tracking of Polycyclic Aromatic Hydrocarbons and Ecological Risk Posed by Urban Road Dust, EGU General Assembly 2026, Vienna, Austria, 3–8 May 2026, EGU26-4043, https://doi.org/10.5194/egusphere-egu26-4043, 2026.

The atmospheric pollutants forecast is mainly limited by high uncertainties in emissions, meteorology and chemo-physical processes. Although static monitoring networks have expanded significantly in recent years, large-scale  comprehensive mobile observation campaigns remain scare, particularly in high emission region. To address this need,  we executed a on-road mobile campaign covering over 5000 km accross the North China Plain in June 2025  utilizing a zero-emission comprehensive mobile platform equipped with numbers of high-precision instruments (SPAMS, SP2, SMPS, VOCUS-PTR, PM2.5/O3/NOx analyzer etc.). The campaign is guided by atmospheric pollution sensitivity analysis. The observations revealed complex evolutionary characteristics and high spatiotemporal heterogeneity of pollutants within identified sensitive hotspots, and the data were assimilated into the Nested Air Quality Prediction Modeling System (NAQPMS) using a three-dimensional variational (3D-Var) assimilation system.  Compared to the control run, the model performance for atmospheric chemical components along the mobile path improved, validating the effectiveness of the "sensitivity identification–mobile observation–data assimilation" closed-loop system.

How to cite: Pan, X., Yao, W., Liu, H., Ye, J., and Wang, Z.: Unveiling pollution emission heterogeneity in atmospheric sensitivity hotspots: insights from a ~6000-km comprehensive road-based campaign, EGU General Assembly 2026, Vienna, Austria, 3–8 May 2026, EGU26-4389, https://doi.org/10.5194/egusphere-egu26-4389, 2026.

EGU26-4518 | ECS | Orals | AS3.32

Secondary Organic Aerosol Formation from Emissions of On- and Off-Road Vehicles 

Damianos Pavlidis, Yanfang Chen, Andreas Aktypis, Georgia A. Argyropoulou, Petro Uruci, Angeliki Matrali, Christos Kaltsonoudis, Yuantao Wang, David M. Bell, Philippe Wili, Pierre Comte, Danilo Engelmann, Andre S. H. Prevot, and Spyros N. Pandis

Tailpipe emissions from on- and off-road vehicles can be a significant source of secondary organic aerosol (SOA) both in urban areas and regionally. However, major uncertainties remain in understanding SOA formation from vehicle exhaust in different oxidation timescales.

Individual on- and off-road vehicles were tested on a dynamometer, with their exhaust introduced into an oxidation flow reactor (OFR) and an atmospheric simulation chamber to investigate SOA formation across a range of OH exposures. Exposures approximately ranged from very short durations of 0.1 up to 9 equivalent days, with the smog chamber experiments corresponding on average to 2 equivalent days.  In total, emissions from 14 vehicles, including 4 gasoline cars, 4 diesel cars, 4 scooters, and 2 tractors, covering a range of engine types and control technologies, were examined. Standardized driving cycles were followed, including WLTC for passenger cars, WMTC for scooters, and NRSC for tractors. The on-road cycles, carried out on a chassis dynamometer, simulated urban-speed conditions and included cold starts, while the off-road cycle consisted of steady-state engine operation at multiple loads and speeds, controlled by an EGGERS dynamometer.

Scanning mobility particle sizers (SMPS) were used to measure particle size distributions, while the chemical composition was characterized by a high-resolution aerosol mass spectrometer (HR-ToF-AMS) for the aerosol and by a VOCUS Proton-Transfer-Reaction-Mass-Spectrometer (VOCUS PTR-MS) for the gas phase. Black carbon and trace gases were monitored using an aethalometer (AE33) and online gas analyzers, respectively. The volatility distribution of SOA in the 1-D volatility basis set (VBS) was also characterized using a combination of thermodenuder measurements and TD-GCMS analysis of Tenax sorbent tubes sampled from the smog chamber after the oxidation.

Two-wheelers, especially a pre-Euro 2-stroke scooter, had the highest SOA formation potential (SOAFP) across the full range of OH exposure, exceeding all other on-road vehicle types by more than an order of magnitude, where SOAFP is defined as the amount of SOA formed per kg of fuel burned. A modern off-road tractor (Stage V) also showed substantial SOAFP surpassing a modern scooter (Euro 5) and the rest on-road vehicles. Euro 6 gasoline on-road cars exhibited higher SOAFP values than Euro 6 diesel vehicles. These results highlight the disproportionate contribution of scooters and off-road vehicles to urban SOA, underlining the need for targeted emission control strategies.

How to cite: Pavlidis, D., Chen, Y., Aktypis, A., Argyropoulou, G. A., Uruci, P., Matrali, A., Kaltsonoudis, C., Wang, Y., Bell, D. M., Wili, P., Comte, P., Engelmann, D., Prevot, A. S. H., and Pandis, S. N.: Secondary Organic Aerosol Formation from Emissions of On- and Off-Road Vehicles, EGU General Assembly 2026, Vienna, Austria, 3–8 May 2026, EGU26-4518, https://doi.org/10.5194/egusphere-egu26-4518, 2026.

Urban speed management is widely promoted as a low-cost intervention to improve road safety, reduce vehicle emissions, and enhance public health (Ghaffarpasand et al., 2021). In the UK and across Europe, the expansion of 20 mph zones and other speed limit policies reflects this belief. However, empirical evidence linking posted speed limits to real-world driving behaviour and their downstream environmental and health impacts remains limited, largely due to the absence of high-resolution, longitudinal datasets capturing how vehicles actually move through urban networks. This gap continues to constrain effective policy evaluation and design.

In this research, we tackled this issue by combining extensive vehicle telematics, environmental modelling, and transport monitoring and evaluation to measure the actual effectiveness of urban speed limit policies throughout the West Midlands, UK. The research employs the recently developed GeoSpatial and Temporal Mapping of Urban Mobility (GeoSTMUM) approach to convert telematics data (connected vehicle data) Into highly detailed mobility and transport features at 15 meter spatial and 2-hour temporal resolutions (Xiang et al., 2024). It utilizes almost a decade of connected vehicle data from 2016 to 2023 with fine spatial and temporal detail to chart observed driving speeds over urban networks and rigorously contrast them against policy-specified limits. This structure facilitates recognition of spatial and temporal compliance patterns, discovery of ongoing deviations, and assessment of how such differences extend into road safety risk, emissions, and population exposure.

Preliminary analyses suggest several outcomes. First, compliance with posted speed limits shows substantial spatio-temporal variation across the urban network, with systematic exceedances concentrated on arterial corridors and transitional zones between speed regimes. Second, the divergence between policy-defined and observed speeds will influence emission and safety outcomes, with modest speed reductions producing disproportionate benefits in high-exposure locations. Third, scenario testing is expected to demonstrate that targeted speed interventions, informed by real driving behaviour rather than static policy assumptions, can achieve greater environmental and safety gains than uniform blanket policies.

The study has been co-designed with regional stakeholders, including Transport for West Midlands, Birmingham City Council, and Sandwell Metropolitan Borough Council, ensuring strong policy relevance. It delivers the first high-resolution, regional evidence base linking speed policy, actual driving behaviour, emissions, and health exposure in the West Midlands. By transforming years of foundational research into actionable policy intelligence, the presentation will highlight a transferable framework for evaluating urban speed management strategies in cities seeking safer, cleaner, and more equitable transport systems.

References

GHAFFARPASAND, O., TALAIE, M. R., AHMADIKIA, H., KHOZANI, A. T., SHALAMZARI, M. D. & MAJIDI, S. 2021. Real-world evaluation of driving behaviour and emission performance of motorcycle transportation in developing countries: A case study of Isfahan, Iran. Urban Climate, 39, 100923.

XIANG, J., GHAFFARPASAND, O. & POPE, F. D. 2024. Mapping urban mobility using vehicle telematics to understand driving behaviour. Scientific Reports, 14, 3271.

How to cite: Ghaffarpasand, O. and Pope, F.: Do Urban Speed Limits Deliver What They Promise?High-Resolution Telematics Evidence for Road Safety, Climate and Air Pollutant Emissions in the West Midlands, UK, EGU General Assembly 2026, Vienna, Austria, 3–8 May 2026, EGU26-5463, https://doi.org/10.5194/egusphere-egu26-5463, 2026.

EGU26-5501 | Posters on site | AS3.32

Measurements of Real-World Cold Start Emissions and Secondary Organic Aerosol Formation in a Parking Garage 

Christos Kaltsonoudis, Damianos Pavlidis, Silas Androulakis, Angeliki Matrali, Christina Vasilakopoulou, Ioannis Apostolopoulos, Georgia Argyropoulou, Christina Christopoulou, Katerina Seitanidi, Jeroen Kuenen, Marya el Malki, Yanfang Chen, Andre Prevot, and Spyros Pandis

Motor vehicles remain a significant contributor to urban air pollution, emitting compounds in both the gas and particulate phases. While emissions under hot driving conditions have decreased due to improvements in exhaust after-treatment systems, cold starts continue to contribute disproportionately to total vehicle emissions. Furthermore, gas-phase organic compounds emitted during cold starts can be oxidized in the atmosphere, leading to the formation of secondary organic aerosol (SOA).
To enhance our understanding of cold-start emissions and their potential to form SOA, measurements of approximately 21,000 cold starts were carried out inside an underground parking garage from November 29 to December 24, 2024. The garage consists of 250 parking spaces and is located beneath a shopping mall in Patras, Greece. 
The particle phase was measured by a scanning mobility particle sizer (SMPS) and further characterized using a high-resolution aerosol mass spectrometer (HR-ToF-AMS) and a high-resolution proton-transfer-reaction time-of-flight mass spectrometer (PTR-ToF-MS) coupled to a CHARON inlet. Black carbon was quantified by an Aethalometer (AE33). Gas-phase composition was measured with the PTR-MS, while inorganic trace gases including NO, NO2, CO, CO2, O3, and SO2 were continuously monitored. Tenax tubes were also collected from the garage ambient air for offline GC-MS analysis. Additionally, the traffic flow was recorded at both the entrance and exit of the garage. The SOA formation from vehicle emissions was investigated using an oxidation flow reactor (OFR) under controlled OH exposures by varying combinations of the reactor’s UV lamps.
The measurements of the traffic and the concentrations were combined to derive average emissions of gas and particulate phase pollutants. The estimated cold start emission factors were then compared to those reported in the Dutch Εmission Inventory. Within the OFR, organic aerosol concentrations increased from four to eleven times depending on OH exposure, with the production of highly oxygenated organic compounds. Aromatic compounds were identified as the dominant precursors of SOA.

How to cite: Kaltsonoudis, C., Pavlidis, D., Androulakis, S., Matrali, A., Vasilakopoulou, C., Apostolopoulos, I., Argyropoulou, G., Christopoulou, C., Seitanidi, K., Kuenen, J., el Malki, M., Chen, Y., Prevot, A., and Pandis, S.: Measurements of Real-World Cold Start Emissions and Secondary Organic Aerosol Formation in a Parking Garage, EGU General Assembly 2026, Vienna, Austria, 3–8 May 2026, EGU26-5501, https://doi.org/10.5194/egusphere-egu26-5501, 2026.

Fugitive road dust (FRD) is a major contributor to urban particulate matter (PM) in Chinese cities, accounting for an estimated 25%–90%1,2 of total PM emissions and creating substantial air-quality and health burdens. Despite this relevance, policy and research have focused primarily on exhaust emissions, while FRD remains comparatively under-characterized and weakly regulated3. Importantly, non-exhaust PM from FRD persists under fleet electrification; recent evidence indicates that the monetized impacts of PM associated with battery electric vehicles can be comparable to, or higher than, those from internal combustion engine vehicles due to continued non-exhaust sources4.

The U.S. EPA AP-42 approach is widely used to estimate road dust resuspension and is also embedded in China’s technical guidance (HJ/T 393-2007). Within this framework, the silt load (sL, mass of particles <75 μm per meter squre, g.m-2) is the critical input governing emission intensity. However, conventional sL sampling (e.g., gravimetric sampling or mobile vacuum-based surveys) is labor-intensive and difficult to scale to national wide inventories with representative spatial coverage.

Here, we compile a national database of in situ sL measurements from 28 Chinese cities (>300 roads) and develop interpretable machine-learning models to predict sL by road class and city context. We fuse these predictions with open-source traffic data (200 cities; 20-min resolution; 8 months of records) and apply the AP-42 framework to construct a link-level FRD PM2.5 emission inventory for urban China. Multiple algorithms (XGBoost, support vector regression, and ensembles) are evaluated, and SHAP (SHapley Additive exPlanations) is used to quantify feature contributions and diagnose non-linear effects.

The best-performing models achieve strong generalization (test R2 > 0.7). SHAP results identify road class, precipitation, ambient PM10 concentration, cleaning-vehicle density, longitude, traffic volume, and heavy-duty vehicle share as key drivers of sL, with pronounced non-linear decrease in sL as vehicle speed rises. FRD emission’s contribution to the traffic PM2.5 emission were estimated in city-level, range from 25% to ~80%. Overall, this work first to infer silt load nationally using ML and translate it into a link-level inventory using open traffic data, provides a scalable pathway to high-resolution FRD emission estimation and supports targeted mitigation and urban transport planning.

  • 1.Wang, L. et al.Environmental challenges in electrification: Traffic-induced non-exhaust PM2.5 emissions in Cangzhou, China. Transp. Res. Part Transp. Environ.151, 105137 (2026).
  • 2.Chen, S. et al.Fugitive Road Dust PM2.5 Emissions and Their Potential Health Impacts. Environ. Sci. Technol.53, 8455–8465 (2019).
  • 3.Harrison, R. M. et al.Non-exhaust vehicle emissions of particulate matter and VOC from road traffic: A review. Atmos. Environ.262, 118592 (2021).
  • 4.Liu, Y. et al.Exhaust and non-exhaust emissions from conventional and electric vehicles: A comparison of monetary impact values. J. Clean. Prod.331, 129965 (2022).

How to cite: Chu, M. and Shen, H.: Link-Level Mapping of Fugitive Road-Dust Emissions in Urban China Using Explainable Machine Learning and Open Traffic Data, EGU General Assembly 2026, Vienna, Austria, 3–8 May 2026, EGU26-6623, https://doi.org/10.5194/egusphere-egu26-6623, 2026.

Air pollution remains a significant global issue. Understanding the drivers of air pollution and reducing associated premature deaths have become one of the United Nations’ Sustainable Development Goals. In recent years, traffic emissions have become the main source of urban air pollution in the UK and globally. In the EU, road transport has been identified as the primary source of total NOx (comprising NO2 and NO), contributing 39% of total emissions. In densely populated regions, large-scale events and daily congestion further aggravated the problems. Although traffic flow and temporal character are proven to play an important part in the high-resolution NOx prediction, a systematic component of NOx variability remains unexplained. Thus, current policies based solely on traffic flow control and fleet turnover can hardly reduce the whole network emission effectively in real-world. The observed persistence and spatial coherence of the residual errors also suggest that missing information should not be identified as random noise, but comes from the network dynamics at the microscale driven by individual driving behaviour.

Our study addresses this gap by examining network-level driving behaviour as a candidate mechanism underlying this unexplained variability, and quantifying its impact on urban NOx emissions. By developing a driving style–based urban digital twin emission simulation framework, we investigate how behavioural heterogeneity influences the spatial and temporal distribution of NOx emissions across the Greater Manchester road network. The empirical driving behaviour parameters were localized from 16,897,293 records. Apart from that, realistic hourly traffic flows from Department for Transport (DfT) were employed as constraints in the HBEFA-linked emission modelling within SUMO for spatial analysis based on a ring-based segmentation. Results show that behavioural heterogeneity not only affects the magnitude of NOx emissions, but also the spatial distribution.Contrary to the widely held belief that aggressive driving uniformly increases emissions across the network, we find that aggressive driving reshapes emission patterns by relocating hotspots rather than simply amplifying network-wide totals.

Therefore, emission mitigation benefits are highly context-dependent: policies promoting smoother driving are likely to be most effective in suburban and inter-ring corridors, while targeted restrictions on aggressive driving may be necessary in high-density urban cores during vulnerable periods. Moreover, behavioural interventions aligned with travel demand patterns may outperform static, network-wide emission policies. By constructing a scalable network-level digital twin, this study establishes driving style as a controllable and policy-relevant parameter. The developed framework supports scenario testing, spatial sensitivity evaluation, and behavioural–emission inference at the network scale, contributing to more effective and spatially equitable transport emission management.

How to cite: Zeng, Y., Topping, D., and Zhang, S.: Driving Behaviour as a Missing Control Lever in Urban NOx Mitigation: A Network-Level Digital Twin of Spatial–Temporal Hotspot Migration, EGU General Assembly 2026, Vienna, Austria, 3–8 May 2026, EGU26-7290, https://doi.org/10.5194/egusphere-egu26-7290, 2026.

EGU26-7357 | ECS | Orals | AS3.32

Unaccounted precursors of SOA in Europe: IVOCs emitted from on-road vehicles 

Stella-Eftychia Manavi, Marya El Malki, Jeroen Kuenen, and Spyros N. Pandis

On-road transport is a significant source of organic aerosol, especially in urban environments across Europe. Over the past decades, the implementation of European air-quality policies has successfully led to the reduction of on-road primary organic aerosol (POA). Despite these advances, the total organic aerosol burden from on-road transport is still considerable, as gas-phase species emitted by vehicles act as precursors and form secondary organic aerosol (SOA). Among these precursors, intermediate volatility organic compounds (IVOCs) represent a significant yet poorly constrained source of on-road SOA. IVOCs are organic gases with an effective saturation concentration (C*) between 103 and 106 μg m-3 at 298 K, and in the majority of chemical transport models (CTMs), they are either highly parameterized or even neglected.  The aim of this study is to assess both the overall contribution of on-road IVOCs to SOA formation and the contribution of specific compounds in the IVOC range over Europe. To achieve this, the results of the EASVOLEE (Effects on Air Quality of Semi-VOLatile Engine Emissions) emission characterization campaigns were used to update the emissions of IVOCs and the corresponding SOA-iv formation parametrizations in PMCAMx, a three-dimensional chemical transport model. The model was used to simulate one winter and one summer month (January and July 2019) in Europe. The contribution of the IVOCs emitted by different vehicle types to SOA formation was quantified, including the role of specific IVOCs.

How to cite: Manavi, S.-E., El Malki, M., Kuenen, J., and Pandis, S. N.: Unaccounted precursors of SOA in Europe: IVOCs emitted from on-road vehicles, EGU General Assembly 2026, Vienna, Austria, 3–8 May 2026, EGU26-7357, https://doi.org/10.5194/egusphere-egu26-7357, 2026.

EGU26-7448 | ECS | Posters on site | AS3.32

High-Time-Resolution Analysis of Organic and Inorganic Trace Gases and Particles in a Major European Port Using Mobile and Stationary Measurements 

Himadri Sekhar Bhowmik, René Dubus, Max Gerrit Adam, Dieter Klemp, Michael Busse, Andreas Grill, Timo Lang, Keno Leites, Ulrich Misz, Julian Peters, Marvin Runge, Felix Schweiger, and Robert Wegener

Port environments are characterized by complex and highly variable emissions from shipping, industrial and traffic activities, which results in distinct spatial and temporal heterogeneity in air pollutant concentrations. Fuel cells used in port activities, whether stationary or mobile, can be adversely affected by elevated pollutant concentrations. Therefore, we investigate the concentrations of volatile organic compounds (VOCs), trace gases, and ultrafine particles in the Port of Rotterdam as part of the KaLiBer joint project. MOBILAB serves as the mobile measuring platform equipped with state-of-the-art instrumentation for particle and gas-phase analysis, enabling both mobile transects and stationary monitoring. VOCs were measured using proton-transfer-reaction mass spectrometry (PTR-MS), capturing a wide range of oxygenated and non-oxygenated species, alongside simultaneous observations of CO, CO₂, NOₓ, SO₂, NH₃, and ultrafine particle (UFP) number concentrations. The mobile measurements were conducted over 10 days along selected routes in the port area and subsequent 30 days of stationary monitoring during summer. PTR-MS measurements covered approximately 130 masses, allowing a detailed characterization of both oxygenated and non-oxygenated VOCs.

The mobile measurements capture distinct spatial gradients and short-lived concentration spikes linked to local emission plumes. In contrast, the stationary data set reveals long-term variability and background conditions with additional plumes from ships passing by. Average concentrations and prominent diurnal patterns suggest distinct emission sources from shipping, heavy-duty traffic, and industrial activities. Spatial analysis reveals elevated VOC concentrations accompanied by high UFP and CO2 levels, along port roadways. This suggests a dominant contribution from traffic-related sources. In the urban background, mixing ratios decreased due to chemical transformation and atmospheric dilution. The aromatic-to-oxygenated VOC (OVOC) ratios reveal distinct differences between fresh emissions along traffic-affected routes and more chemically aged air masses at the stationary site. This emphasizes the dynamic interplay between primary emissions and atmospheric processing. Although toluene/benzene ratios were comparable during mobile and stationary periods, they reflect mixed contributions from traffic, shipping, and industrial sources.

The combined mobile–stationary dataset demonstrates the significance of high-time-resolution measurements for capturing emission variability, chemical processing, and source contributions in complex port environments. Such insights are vital for quantifying transport-sector contributions to urban air pollution. They are essential for assessing potential health impacts, and effective emission mitigation and air quality management. Beyond atmospheric characterization, the observed concentration ranges, variability, and occurrence of short-lived pollutant peaks are important for designing and optimizing air filtration systems that protect fuel cell technology. In particular, understanding the temporal occurrence of VOCs and acidic gases is essential for minimizing catalyst poisoning, membrane degradation, and performance losses. This, in turn, improves fuel cell durability and operational lifetime under real-world port conditions.

This work is funded by the Federal Ministry for Economic Affairs and Energy based on a resolution of the German Bundestag under funding code 03EN5043D.

How to cite: Bhowmik, H. S., Dubus, R., Adam, M. G., Klemp, D., Busse, M., Grill, A., Lang, T., Leites, K., Misz, U., Peters, J., Runge, M., Schweiger, F., and Wegener, R.: High-Time-Resolution Analysis of Organic and Inorganic Trace Gases and Particles in a Major European Port Using Mobile and Stationary Measurements, EGU General Assembly 2026, Vienna, Austria, 3–8 May 2026, EGU26-7448, https://doi.org/10.5194/egusphere-egu26-7448, 2026.

EGU26-7490 | ECS | Orals | AS3.32

A Decade of Progress: Quantifying Air Pollution Reductions in West Oakland, CA with Hyperlocal Monitoring (2015-2025) 

Samuel J. Cliff, Michael R. Giordano, Haley M. Byrne, Robert J. Weber, Jude Z. Hebert, Kyle Huang, Allen H. Goldstein, and Joshua S. Apte

West Oakland, California has experienced disproportionate exposure to diesel-related air pollution due to its proximity to the Port of Oakland, major freeways, and freight corridors. In the last decade, California has increased statewide diesel truck emission regulations while Assembly Bill 617 (AB617) has directed targeted local mitigation investments through community-engaged planning. This study quantifies changes in air pollution across West Oakland spanning the decade of 2015-2025 to evaluate these multilevel interventions. We augmented Google Street View vehicle measurements from 2015-2017 by deploying the UC Berkeley Mobile Air Pollution Laboratory to systematically map air pollution at a 30 m resolution on all accessible roads in West Oakland throughout 2025. We focus on black carbon (BC) and nitrogen oxides (NO, NO2) and also draw on additional extensive gas and particle phase air toxic measurements. Spatial patterns were analyzed across seven community-identified impact zones and supplemented with long-term regulatory monitoring trends contextualized against California and national networks. We find substantial reductions of all pollutants between 2015 and 2025. On average, BC, NO and NO2 decreased by 55%, 39% and 38% respectively, with most impact zones meeting community-designated air quality targets. The largest improvements were seen on diesel-heavy port and freeway corridors from which concentration gradients diminished, indicating reduced near-source exposures. West Oakland's improvements exceeded regional trends at other monitoring sites, suggesting local interventions provided benefits beyond statewide policies. Overall, we demonstrate the effectiveness of multilevel approaches combining regulatory standards with targeted, community-guided local investments in overburdened communities.

How to cite: Cliff, S. J., Giordano, M. R., Byrne, H. M., Weber, R. J., Hebert, J. Z., Huang, K., Goldstein, A. H., and Apte, J. S.: A Decade of Progress: Quantifying Air Pollution Reductions in West Oakland, CA with Hyperlocal Monitoring (2015-2025), EGU General Assembly 2026, Vienna, Austria, 3–8 May 2026, EGU26-7490, https://doi.org/10.5194/egusphere-egu26-7490, 2026.

EGU26-9231 | ECS | Posters on site | AS3.32

Characterizing urban traffic emissions across Europe: Insights from canister sampling in Net4Cities 

Archita Rana, Robert Wegener, Max Gerrit Adam, René Dubus, Lukas Kesper, Dieter Klemp, Franz Rohrer, Sean Schmitz, Saskia Drossaart van Dusseldorp, Pablo Garcia, Giorgi Jibuti, Nikos Kalivitis, Francisco Domingues, Sébastien Oftedal Barrault, Ed van der Gaag, Michael Pikridas, Rima Baalbaki, Martine Van Poppel, and Erika von Schneidemesser

Transport-related emissions remain a primary driver of ambient air quality degradation in the European Union, especially in urban environments. The Net4Cities project focuses on establishing an integrated network of air quality and noise measurements across 11 cities in 10 European countries. This initiative aligns with the recently adopted air quality directive (EU/2024/2281), which mandates stricter regulation for target pollutants such as volatile organic compounds (VOCs), thereby supporting the European Union’s Zero Pollution Action Plan.

From March to September 2025, ambient air samples were collected once a month between 08:00 and 09:00 AM local time across all partner cities—Tbilisi, Antwerp, Zurich, Berlin, Duesseldorf, Limassol, Heraklion, Rotterdam, Oslo, Barcelona, and Southampton, using evacuated silco-steel canisters. Once sampled, the canisters are analyzed in GC-MS/FID at Forschungszentrum Juelich for quantification of a broad range of VOCs. Overall, the VOC concentration is dominated by alcohols, aldehydes, alkenes, and ketones. Individual species like ethanol, methanol, and acetaldehyde also played a major role in the overall VOC mixing ratio, followed by alkenes (e.g., ethene and propene) and acetone. But the atmospheric impact of VOCs is determined by their OH reactivity, which reflects the turnover rate of the individual VOCs with OH radicals and is calculated as the product of the VOC concentration and its reaction rate constant with OH. OH-reactivity characterizes the local ozone production for VOC mixtures of different compositions into a single parameter. While species like ethanol and methanol dominate the concentration, species like monoterpenes (such as limonene, α-pinene, myrcene, δ3-carene, isoprene, and β-ocimene) and aromatics (such as toluene and xylenes) dominate the OH reactivity despite their lower mixing ratios. Along with VOCs, carbon monoxide (CO), carbon dioxide (CO2), methane (CH4), nitrogen oxides (NOx) and nitrous oxide (N2O) were also quantified for each city. Furthermore, the observed variability in ∑VOC/NOx ratios reflect a high degree of heterogeneity in local emission profiles across cities. Overall, the results suggest that while oxygenated species dominate the total VOCs concentration, the OH reactivity across these cities is mainly governed by highly reactive monoterpenes and aromatics.

This work is co-funded by the European Union under Project 101138405—Net4Cities, the UK Research and Innovation (UKRI) under the UK government’s Horizon Europe funding guarantee (grant no. 10107404), and the Swiss Secretariat for Education, Research and Innovation (SERI) (grant no. 23.00622).

How to cite: Rana, A., Wegener, R., Adam, M. G., Dubus, R., Kesper, L., Klemp, D., Rohrer, F., Schmitz, S., Drossaart van Dusseldorp, S., Garcia, P., Jibuti, G., Kalivitis, N., Domingues, F., Oftedal Barrault, S., van der Gaag, E., Pikridas, M., Baalbaki, R., Van Poppel, M., and von Schneidemesser, E.: Characterizing urban traffic emissions across Europe: Insights from canister sampling in Net4Cities, EGU General Assembly 2026, Vienna, Austria, 3–8 May 2026, EGU26-9231, https://doi.org/10.5194/egusphere-egu26-9231, 2026.

Vehicle cabins represent a confined transport microenvironment where emissions from interior materials can contribute substantially to occupant exposure to volatile organic compounds (VOCs), particularly during early use and under low-air-exchange conditions. We compared VOC emissions from two widely used seat upholstery materials, genuine leather and microfiber leather, using a 1 m³ emission chamber. Test pieces with an exposed area of 0.40 m² (40 × 100 cm) were placed in the chamber, and air samples were collected at 2 h, 8 h and 24 h to capture early-use conditions, within-day build-up and a full-day exposure window. VOCs were quantified by preconcentration GC–MS targeting 116 compounds with internal and external standard calibration. The sampled aliquot per injection (20 µL) was negligible relative to the chamber volume, supporting quasi-static conditions.

The two materials exhibited clear differences in both total quantified VOC burden and chemical composition over 2–24 h. Genuine leather showed higher concentrations at later time points, increasing from 117 ppb at 8 h to 171 ppb at 24 h. The profile was dominated by oxygenated VOCs with monotonic increases over time; acetone and isopropyl alcohol each approached 75 ppb by 24 h, consistent with sustained release and accumulation under sealed conditions. In contrast, microfiber leather maintained a lower but comparatively stable total VOC level (64–73 ppb across 2–24 h) while showing an aromatic-dominated feature: toluene remained consistently elevated (18–20 ppb) throughout the period, substantially higher than in genuine leather (3–6 ppb). Time-series behavior further differentiated compound classes, with oxygenated species generally exhibiting accumulation-type trends, whereas selected ester-like compounds displayed faster decay consistent with short-lived volatilization.

These results highlight that compound-resolved, time-resolved measurements can distinguish material-specific emission fingerprints and identify exposure-relevant windows that are not apparent from bulk VOC metrics alone. Ongoing experiments extend the same framework to heat-loading (solar-load) and ventilation-representative conditions to quantify temperature and air-exchange sensitivity of in-cabin VOC exposure.

How to cite: Gao, J., Zheng, J., Wu, T., and Zhao, W.: VOCs from vehicle interior materials in a transport microenvironment: time-resolved emissions, exposure windows, and mitigation relevance, EGU General Assembly 2026, Vienna, Austria, 3–8 May 2026, EGU26-9500, https://doi.org/10.5194/egusphere-egu26-9500, 2026.

EGU26-9559 | ECS | Orals | AS3.32

Substantially underestimated health burden of Indian road transportation air pollution 

Karn Vohra, William Bloss, Eloise Marais, Ashirbad Mishra, Poonam Mangaraj, Pallavi Sahoo, Saroj Sahu, Chandan Kumar, and Abhishek Chakraborty

Road transportation is a major contributor to multiple health-harming air pollutants in India, but exclusive focus on fine particulate matter (PM2.5) pollution and premature mortality along with reliance on global emission inventories that lack detailed national information has undermined contribution of this sector. Here, we examine the influence of Indian road transportation on air pollution and public health using the global Community Emissions Data System (CEDS) emissions inventory and the recently developed national Air Quality, Emission Inventory and Modelling (AEIM) inventory for 2019. The AEIM inventory uses high-resolution activity data and technology-specific emission factors to accurately represent the realistic magnitude and spatial heterogeneity in road transportation emissions across India. Both inventories are used to drive the state-of-art atmospheric chemistry model GEOS-Chem at high spatial resolution (~30 km), and AEIM outperforms CEDS when compared to the quality-controlled ground-based observations from India’s extensive air quality monitoring network. We find that CEDS road transportation emissions are linked to population-weighted mean concentrations (or exposures) of 3.3 µg m-3 of PM2.5, 1.4 ppb of nitrogen dioxide (NO2), and 3.5 ppb of maximum daily 8-hour running-mean ozone (MDA8 O3), the metric associated with health risk. Exposures using the robust AEIM inventory are 66-223% higher: 10.6 µg m-3 of PM2.5, 4.0 ppb of NO2, and 5.8 ppb of MDA8 O3. While road transportation PM2.5 is highest in the Indo-Gangetic Plain, we find that contribution of road transportation to other health-harming pollutants is not necessarily co-located. NO2 hotspots are over major cities and transportation corridors and those for MDA8 O3 are in central and south India, indicating additional health burdens in these regions. Using the AEIM-driven model output and considering diverse pollutants and health impacts, we estimate 10.8 million disability adjusted life years (DALYs) from road transportation-related air pollution in India, five times that associated with previously estimated CEDS-driven road transportation PM2.5 mortality and exceeding that attributed to cigarette smoking in India by 27%. Uttar Pradesh in the Indo-Gangetic Plain has the greatest health burden across all adverse outcomes but the rankings for other states vary by pollutants and health outcomes. Our assessment not only quantifies the magnitude of underestimation but also highlights states that emerge as key contributors to the health burden, providing actionable insights for evidence-based mitigation strategies.

Funded by the UKRI-NSF Clean Energy and Equitable Transportation Solutions (CLEETS) project. 

How to cite: Vohra, K., Bloss, W., Marais, E., Mishra, A., Mangaraj, P., Sahoo, P., Sahu, S., Kumar, C., and Chakraborty, A.: Substantially underestimated health burden of Indian road transportation air pollution, EGU General Assembly 2026, Vienna, Austria, 3–8 May 2026, EGU26-9559, https://doi.org/10.5194/egusphere-egu26-9559, 2026.

Nitrogen dioxide (NO₂) is an established indicator of air quality, as it is produced in every process in which fossil fuels are burnt. Air quality is closely linked to economic growth if this is predominantly based on fossil fuels.

It is produced in all the overarching sectors that make up the gross domestic product, namely agriculture, known as the "primary sector", energy and industrial production, known as the "secondary sector", and finally the "tertiary sector", which includes all forms of transport. NO₂ in the troposphere has a lifetime of only about 1-2 days. Therefore, the NO₂ distribution can be used to draw relatively good conclusions about the location of the emission sources and economic activity can be tracked.

We focus in our study on the influence of remote working practices on tropospheric NO₂ vertical column densities over northern Italy, including the Milan metropolitan area. The analysis is based on daily observations from the Ozone Monitoring Instrument (OMI) onboard the Aura satellite, covering the period from 2004 to 2023.

A comparison between gross domestic product (GDP) trends and changes in NO₂ variability indicates that periods of reduced economic activity—most notably after 2019 during the COVID-19 pandemic—are characterized by a weakening of shorter-term oscillations (2–5 days) relative to lower-frequency variability at weekly (7-day) timescales. This shift can be partly attributed to changes in commuting behavior associated with reduced working hours and the increased prevalence of remote work. Widespread lockdown measures forced much of the global workforce to transition to remote work. In many regions, these practices remained more prevalent than before the pandemic.

Overall, our findings demonstrate that anthropogenic NO₂ pollution responds sensitively to changes in commuting patterns, with implications for air quality, public health, and ecosystem health.

How to cite: Engert, R., Bichler, R., and Bittner, M.: Investigating the influence of remote working conditions on tropospheric NO2 vertical column density over northern Italy observed by Aura/OMI, EGU General Assembly 2026, Vienna, Austria, 3–8 May 2026, EGU26-10027, https://doi.org/10.5194/egusphere-egu26-10027, 2026.

EGU26-10277 | ECS | Posters on site | AS3.32

Spatiotemporal PM2.5-bound Polycyclic Aromatic Hydrocarbons Dynamics and Stochastic Cancer Risks in the Metropolitan Hubs of Central Asia   

Anara Omarova, Artem Kashtanov, Diana Sovetova, and Nassiba Baimatova

Central Asian urban centers face persistent air quality challenges characterized by elevated fine particulate matter (PM2.5) concentrations stemming from rapid urbanization, intensive industrial activity, and a heavy reliance on coal-fired central heating plants. Despite the known hazardous nature of polycyclic aromatic hydrocarbons (PAHs), which are carcinogenic and mutagenic, a critical paucity of longitudinal observational data exists for this region [1-3]. This study presents the first systematic, year-long assessment of 14 PM2.5-bound PAHs in Almaty and Astana, Kazakhstan, to characterize their environmental behavior and public health implications.

Results indicated that the annual average concentrations of total PAHs were 144.9±109.1 ng/m³ in Almaty and 25.6±19.9 ng/m³ in Astana, with the most severe pollution recorded during the heating season. Notably, annual benzo[a]pyrene (BaP) concentrations exceeded international guideline values by 5 to 20 times. Almaty’s higher pollution burden is attributed to its coal-intensive heating and mountainous basin topography, which facilitates frequent temperature inversions and atmospheric stagnation, thereby trapping pollutants. Conversely, Astana’s open steppe landscape promotes better ventilation, though it remains susceptible to episodic accumulation during Siberian high-pressure events.

A significant seasonal compositional shift was observed: while naphthalene was the dominant compound year-round, both cities exhibited a substantial increase in high-molecular-weight (4–6 rings) species during winter, driven by increased residential heating combustion. Source identification using diagnostic ratios and principal component analysis confirmed that coal and biomass combustion are the primary contributors to PM2.5-bound PAH levels during the heating season. In the non-heating season, the relative influence of traffic-related emissions and liquid-fuel combustion increased, especially in Astana.

A stochastic human health risk assessment implemented via a Monte Carlo framework revealed alarming inhalation cancer risks. Under the WHO-recommended risk metrics, the probability of exceeding the 10-4 inhalation cancer risk threshold was 100% in Almaty and 77.8% in Astana. BaP and dibenz[a,h]anthracene were identified as the most consequential contributors to this risk. These findings emphasize the urgent need for annual regulatory standards and a transition toward cleaner energy sources to mitigate the severe health risks associated with wintertime air pollution in Central Asia.


Acknowledgments

This research was funded by the Science Committee of the Ministry of Higher Education and Science of the Republic of Kazakhstan (Grant No. AP27510649, 2025-2027).

References

[1] Tursumbayeva et al. Cities of Central Asia: New hotspots of air pollution in the world. Atmospheric Environment. 309  (2023) 119901.

[2] A. Omarova et al. Emerging threats in Сentral Asia: Comparative characterization of organic and elemental carbon in ambient PM2.5 in urban cities of Kazakhstan, Chemosphere. 370 (2025) 143968.

[3] Mukhtarov et al. An episode-based assessment for the adverse effects of air mass trajectories on PM2.5 levels in Astana and Almaty, Kazakhstan, Urban Clim. 49 (2023) 101541.

How to cite: Omarova, A., Kashtanov, A., Sovetova, D., and Baimatova, N.: Spatiotemporal PM2.5-bound Polycyclic Aromatic Hydrocarbons Dynamics and Stochastic Cancer Risks in the Metropolitan Hubs of Central Asia  , EGU General Assembly 2026, Vienna, Austria, 3–8 May 2026, EGU26-10277, https://doi.org/10.5194/egusphere-egu26-10277, 2026.

EGU26-10628 | Orals | AS3.32

Real-Time Source Apportionment at an Urban Traffic Site in Athens during the MI-TRAP 2025 Campaign 

Manousos Manousakas, Erin Kiely, Olga Zografou, Aggelos Laoutaris, Evangelia Diapouli, Maria Gini, Stergios Vratolis, Prodromos Fetfatzis, Eleni Papaioannou, Daniel Deloglou, Kyriaki Tsortanidou, Laurence Windell, Kaspar Daelenbach, Andre Prevot, and Konstantinos Eleftheriadis

Particulate matter (PM) pollution at urban traffic sites reflects a complex mixture of exhaust and non-exhaust traffic emissions together with contributions from other urban sources such as biomass burning, cooking, secondary aerosol formation, and natural inputs. Understanding the temporal variability and seasonal evolution of these sources is essential for designing effective mitigation strategies, yet it is often constrained by traditional offline source apportionment methods. Real-time source apportionment (RT-SA) offers the ability to continuously resolve PM sources and track changes in their chemical composition at high time resolution.

This study presents results from the MI-TRAP 2025 measurement campaign conducted at a single urban traffic site in Athens, Greece, within the framework of the EU Horizon Europe MI-TRAP project. The site was strongly influenced by road traffic emissions while simultaneously capturing the full spectrum of PM sources typically present in an urban traffic environment, including residential biomass burning, cooking activities, secondary aerosol, and natural sources.

An integrated ACSM–Xact–Aethalometer (AXA) system was deployed in combination with the SoFi RT software to perform real-time PM source apportionment. The system provides simultaneous measurements of organic aerosol composition, elemental concentrations, and black carbon, enabling detailed characterization of both primary and secondary PM sources. Traffic-related emissions dominated the PM mass, while secondary components accounted for a significant percentage of the total PM.

A rolling-window RT-SA approach was applied to capture temporal and seasonal changes in source profiles and contributions. This analysis revealed distinct seasonal variability in the chemical composition of several sources, particularly in biomass burning. Changes in elemental markers and organic aerosol signatures reflected shifts in fuel use, atmospheric processing, and driving conditions between seasons. The rolling-window methodology proved essential for resolving these evolving source characteristics, which would be obscured in a single static source apportionment model.

The SoFi RT framework enabled continuous and near-instantaneous source apportionment with automated data processing. Comparison between real-time results and an optimized offline approach showed good agreement, confirming the robustness of the real-time methodology. Overall, the MI-TRAP Athens campaign demonstrates the capability of real-time source apportionment combined with rolling-window analysis to provide new insights into the seasonal dynamics and chemical evolution of PM sources at urban traffic sites.

How to cite: Manousakas, M., Kiely, E., Zografou, O., Laoutaris, A., Diapouli, E., Gini, M., Vratolis, S., Fetfatzis, P., Papaioannou, E., Deloglou, D., Tsortanidou, K., Windell, L., Daelenbach, K., Prevot, A., and Eleftheriadis, K.: Real-Time Source Apportionment at an Urban Traffic Site in Athens during the MI-TRAP 2025 Campaign, EGU General Assembly 2026, Vienna, Austria, 3–8 May 2026, EGU26-10628, https://doi.org/10.5194/egusphere-egu26-10628, 2026.

EGU26-10687 | ECS | Orals | AS3.32 | Highlight

Contribution of different vehicle types to primary and secondary PM2.5 in Europe 

Evangelia Siouti, Ksakousti Skyllakou, Jeroen Kuenen, Marya el Malki, and Spyros Pandis

Over recent years, research has largely concentrated on emissions from passenger cars, while other on-road vehicle categories -such as two-wheelers, buses, and heavy-duty trucks- have received less attention. Consequently, their influence on regional air quality and PM2.5 concentrations remains uncertain. To address this gap, the three-dimensional chemical transport model PMCAMx was applied together with the EASVOLEE (Effects on Air Quality of Semi-Volatile Engine Emissions) emission inventory to quantify the impact of a broad range of on-road vehicle types, including passenger cars, two-wheelers, trucks, and buses, on atmospheric particulate matter.

PMCAMx was applied all over Europe, with a particular focus on selected areas of interest using multiple nested grids with progressively increasing spatial resolution. Organic aerosol (OA) processes were represented using the one-dimensional Volatility Basis Set (VBS) framework, which treats both primary and secondary OA as chemically reactive and semi-volatile components.

The simulations assess the contributions of the different vehicle types to primary and secondary, organic and inorganic PM2.5 levels. The contributions of volatile (VOCs), intermediate volatility (IVOCs), semi-volatile (SVOCs) and low volatility (LVOCs) organic compounds are also quantified. Seasonal variability was also investigated.

How to cite: Siouti, E., Skyllakou, K., Kuenen, J., el Malki, M., and Pandis, S.: Contribution of different vehicle types to primary and secondary PM2.5 in Europe, EGU General Assembly 2026, Vienna, Austria, 3–8 May 2026, EGU26-10687, https://doi.org/10.5194/egusphere-egu26-10687, 2026.

EGU26-10979 | Orals | AS3.32

Continuous Monitoring of Lung Deposited Surface Area (LDSA) Across 11 European Cities: First Results from the Net4Cities Project 

Saskia Drossaart van Dusseldorp, Jacinta Edebeli, Stahl Franziska, Suter Ivo, Fierz Martin, Hügi Mario, Zuber Lukas, Bussmann Jonas, Jibuti Giorgi, Kalivitis Nikos, Schmitz Seán, Oftedal Barrault Sébastien, Pikridas Michael, Rana Archita, Silva Domingues Francisco, Baalbaki Rima, van der Gaag Ed, Van Laer Jo, Van Poppel Martine, and von Schneidemesser Erika

Ultrafine particles (UFPs; <100 nm) represent a significant environmental health challenge, particularly within the transport sector. Traditional mass-based metrics used to monitor particulate matter emissions (PM10​, PM2.5​) poorly capture the impact of UFPs, which contribute only negligibly to mass but dominate in number and need to be addressed1. While Particle Number Concentration (PNC) has long been the primary metric for quantifying UFP exposure2, Lung Deposited Surface Area (LDSA) has emerged as a valuable complementary metric for a more robust health risk assessment. This metric is biologically vital because the particle surface is the primary interface for toxicological interactions and the generation of oxidative stress within human tissue3.

Despite its high relevance as a proxy for potential health impact, there is currently a significant lack of harmonized data on LDSA immissions and a scarcity of long-term measurements across diverse urban environments. To address this gap, an extensive monitoring network has been established under the Horizon Europe Net4Cities project4. Spanning 11 European cities, this network utilizes specifically developed measurement devices based on diffusion charging5, enabling continuous 24/7 online monitoring of LDSA concentrations. The strategic deployment of these devices at different site types—namely road traffic hubs, airports, and ports—allows for a detailed comparative assessment and of how various transport activities contribute to local LDSA levels. 

Our preliminary results confirm a high degree of spatiotemporal heterogeneity in LDSA concentrations, a characteristic previously identified in smaller-scale studies3,6, and demonstrate that these fluctuations are strongly coupled with local human activity across all site types. While road traffic contributes to a consistent diurnal baseline, sites near airports exhibit extreme concentration spikes coinciding with the onset of air traffic, often exceeding peak levels found in heavy road-traffic zones. These findings highlight the importance of LDSA in capturing high-intensity exposure events and provide the robust, multi-city dataset required to support targeted "Zero Pollution" policy interventions in Europe.


References: 

(1)         Directive (EU) 2024/2881 of the European Parliament and of the Council of 23 October 2024 on Ambient Air Quality and Cleaner Air for Europe (Recast); 2024. http://data.europa.eu/eli/dir/2024/2881/oj (accessed 2026-01-09).

(2)         WHO global air quality guidelines: particulate matter (PM2.5 and PM10), ozone, nitrogen dioxide, sulfur dioxide and carbon monoxide: executive summary. https://iris.who.int/items/2f8fec42-5636-4506-9b44-e0c91c678484 (accessed 2026-01-09).

(3)         Yuan, J.; Zhang, W.; Hu, J.; Rupakheti, M.; Rupakheti, D. Studies on Lung-Deposited Surface Area (LDSA) of Particulate Matter during 2005–2024. Air Qual. Atmosphere Health 2025, 18, 2431–2446. https://doi.org/10.1007/s11869-025-01786-5.

(4)         Partner Cities – Net4Cities. https://www.net4cities.eu/partnercities/ (accessed 2026-01-09).

(5)         Fierz, M.; Meier, D.; Steigmeier, P.; Burtscher, H. Aerosol Measurement by Induced Currents. Aerosol Sci. Technol. 2014, 48 (4), 350–357. https://doi.org/10.1080/02786826.2013.875981.

(6)         Edebeli, J.; Spirig, C.; Fluck, S.; Fierz, M.; Anet, J. Spatiotemporal Heterogeneity of Lung-Deposited Surface Area in Zurich Switzerland: Lung-Deposited Surface Area as a New Routine Metric for Ambient Particle Monitoring. Int. J. Public Health 2023, 68, 1605879. https://doi.org/10.3389/ijph.2023.1605879.


How to cite: Drossaart van Dusseldorp, S., Edebeli, J., Franziska, S., Ivo, S., Martin, F., Mario, H., Lukas, Z., Jonas, B., Giorgi, J., Nikos, K., Seán, S., Sébastien, O. B., Michael, P., Archita, R., Francisco, S. D., Rima, B., Ed, V. D. G., Jo, V. L., Martine, V. P., and Erika, V. S.: Continuous Monitoring of Lung Deposited Surface Area (LDSA) Across 11 European Cities: First Results from the Net4Cities Project, EGU General Assembly 2026, Vienna, Austria, 3–8 May 2026, EGU26-10979, https://doi.org/10.5194/egusphere-egu26-10979, 2026.

EGU26-10990 | ECS | Posters on site | AS3.32

Quantification of average NOx emissions from inland ships for different ship types and operation conditions derived from MAX-DOAS measurements 

Simona Ripperger-Lukošiūnaitė, Steffen Ziegler, Philipp Eger, Steffen Beirle, Sebastian Donner, Peter Hoor, and Thomas Wagner

Inland shipping is potentially an important contributor to local air pollution. Long-lasting diesel engines of inland waterway vessels operate at high temperatures and emit NOx (NO + NO2), which have negative impacts on human health.  Emissions from inland ships are concentrated near waterways, making their effect on air quality particularly relevant in densely populated regions located along intensively used waterways, such as the Rhine River. Monitoring and quantifying these emissions is necessary for assessing the importance of inland shipping on local air quality besides other emission sources, such as car traffic.

We use MAX-DOAS (Multi AXis-Differential Optical Absorption Spectroscopy) measurements to quantify NOx emissions from inland ships on the Rhine River in Koblenz, Germany. This remote sensing technique captures ship exhaust plumes from a riverbank while vessels pass the line of sight of the instrument. NO2 column densities measured at different elevation angles provide information about the vertical NO2 distribution in and around the plume. Here we present cross-sections of average ship exhaust plumes of NO2 for different ship types and sizes and for different operation conditions (upstream and downstream) derived from a long-term dataset collected over a period of more than one year. From the combination of the NO2 plumes and wind data, the corresponding NOx emissions are estimated.

How to cite: Ripperger-Lukošiūnaitė, S., Ziegler, S., Eger, P., Beirle, S., Donner, S., Hoor, P., and Wagner, T.: Quantification of average NOx emissions from inland ships for different ship types and operation conditions derived from MAX-DOAS measurements, EGU General Assembly 2026, Vienna, Austria, 3–8 May 2026, EGU26-10990, https://doi.org/10.5194/egusphere-egu26-10990, 2026.

EGU26-11000 | ECS | Orals | AS3.32

Evaluation of Positive Matrix Factorization for the Source Apportionment of Particle Number 

Elena Poulikidi, Meritxell Garcia-Marles, Evangelia Siouti, David Patoulias, Xavier Querol, and Spyros Pandis

Atmospheric aerosols play a critical role in air quality, human health, and climate. Ultrafine particles (UFPs) are of particular concern due to their strong health impact and their dominant contribution to particle number concentrations. While receptor models such as Positive Matrix Factorization (PMF) are widely used to estimate the contribution of various sources to aerosol mass, their application to aerosol number remains challenging. In this work, we apply PMF to the number size distributions predicted by a three-dimensional chemical transport model. The approach used is the same as that used for the PMF analysis of measurements, but in this case the true source contributions are known and the PMF method results can be evaluated.

PMCAMx-UF is a three-dimensional chemical transport model that simulates aerosol number and mass distributions by explicitly resolving key atmospheric processes, including advection, deposition, gas-phase chemistry, nucleation and coagulation. The model is applied over Europe at 36 x 36 km resolution, with increasing resolution over Athens where a 1 x 1 km grid is used. The aerosol number distribution is described using 42 sections. The contribution of the various sources to aerosol number according to PMCAMx-UF is quantified using the approach of Posner and Pandis (2015) for a summer and a winter month. Positive Matrix Factorization (PMF) was also used to apportion sources of particle number size by decomposing the PMCAMx-UF simulated size distributions into factors and calculating their time-resolved contributions.

PMF seriously underestimated the contribution of new particle formation to particles larger than 10 nm in Athens during the summer, N10. PMF estimated that 25% of N10 was due to new particle formation, while this process was actually responsible for 62% of the N10. At the same time, PMF overestimates the contribution of traffic-related sources (57% compared to 13%). During winter, PMF does a reasonable job quantifying the role of new particle formation (17% versus the correct 22%) but still overestimates the role of traffic (71% compared to 34%).


Posner, L. N., & Pandis, S. N. (2015). Sources of ultrafine particles in the Eastern United States. Atmospheric Environment, 111, 103–112. https://doi.org/10.1016/j.atmosenv.2015.03.033

How to cite: Poulikidi, E., Garcia-Marles, M., Siouti, E., Patoulias, D., Querol, X., and Pandis, S.: Evaluation of Positive Matrix Factorization for the Source Apportionment of Particle Number, EGU General Assembly 2026, Vienna, Austria, 3–8 May 2026, EGU26-11000, https://doi.org/10.5194/egusphere-egu26-11000, 2026.

EGU26-12808 | Posters on site | AS3.32

Global black carbon emissions from 2015-2022 constrained by observations and transport modelling  

Sabine Eckhardt, Rona L. Thompson, and Nikolaos Evangeliou

Black carbon (BC) is a product of incomplete combustion, is climate relevant and has negative impacts on human health. It absorbs radiation as an aerosol in the atmosphere, but also changes the albedo of snow covered surfaces and leads to earlier melting. The origins are either anthropogenic or natural, with different annual cycles. While anthropogenic sources like domestic burning peak in the winter, natural sources like wild fires and agricultural burning peak during spring and summer. Due to its short lifetime are the global atmospheric concentrations highly variable.

We use ground based observational data from different global networks, and the atmospheric transport model FLEXPART driven by ERA5 meteorological analysis, emission inventories and the inversion framework FLEXINVERT. By minimizing the mismatch modelled and observed BC concentration we improve the emission inventories for natural emissions (GFAS) and anthropogenic emissions (LRTAP). For every year up to 50 stations are used and each observation is matched with a 50 day FLEXPART backward calculation.

We discuss the distribution and sources of global BC aerosols over the period 2015 to 2022 and compare existing emission inventories with the improved constraints of the global BC emissions derived with the FLEXINVERT inversion framework.

How to cite: Eckhardt, S., Thompson, R. L., and Evangeliou, N.: Global black carbon emissions from 2015-2022 constrained by observations and transport modelling , EGU General Assembly 2026, Vienna, Austria, 3–8 May 2026, EGU26-12808, https://doi.org/10.5194/egusphere-egu26-12808, 2026.

EGU26-13142 | ECS | Orals | AS3.32

Urban aerosol organics in the Eastern Mediterranean: source apportionment and molecular insights 

Evangelos Stergiou, Anthi Karapidaki, Nikos Kalivitis, Michael Pikridas, and Maria Kanakidou

Urban atmospheric particulate matter (PM) pollution poses significant environmental and health problems. The knowledge of the pollution sources and their contribution to air quality can lead to more effective future mitigation strategies for reducing air pollution. We report continuous Aerosol Chemical Speciation Monitor (ACSM) measurements at a traffic urban station in Heraklion (Crete, Eastern Mediterranean) during 2024. To quantify organic aerosol (OA) sources and their temporal dynamics, a positive matrix factorization (PMF) analysis was performed. This analysis was supported by co-located black carbon measurements and trace gas measurements. The resolved factors indicate i) traffic-related OA (HOA) with pronounced diurnal variability consistent with traffic activity, ii) cooking-related OA, iii) biomass burning OA alongside iv) oxygenated OA components linked to secondary aerosol formation and long-range transport. The ACSM-based PMF information was complemented by offline aerosol chemical characterization. About hundred 24h PM10​ filters were collected and analyzed to characterize the organic fraction using untargeted liquid chromatography high resolution mass spectrometry (Orbitrap). This offline dataset provides molecular-level information (elemental classes and marker compounds) enabling deeper understanding of the molecular profile of each pollution source and provides aerosol processing details.                

Financial support from Region of Crete through the project “Action Plan for Addressing Air Pollution in the Region of Crete” is greatly acknowledged. We acknowledge support by Horizon Europe project Net4Cities Contract No. 101138405

How to cite: Stergiou, E., Karapidaki, A., Kalivitis, N., Pikridas, M., and Kanakidou, M.: Urban aerosol organics in the Eastern Mediterranean: source apportionment and molecular insights, EGU General Assembly 2026, Vienna, Austria, 3–8 May 2026, EGU26-13142, https://doi.org/10.5194/egusphere-egu26-13142, 2026.

EGU26-15668 | ECS | Posters on site | AS3.32

Unexpectedly rapid sulfate formation on the surface of vehicular brake wear particles 

Fuyuan Qi, Jianfei Peng, and Hongjun Mao

The missing mechanisms of atmospheric sulfate formation remain a challenging issue for urban haze mitigation worldwide. Over the past decades, with the significant reduction of exhaust emissions and the electrification of vehicle fleets, non-exhaust emissions from vehicle braking have become a major source of aerosol particles in urban environments. Here, we demonstrate that brake wear particles (BWPs), an emerging urban aerosol source, possess exceptional catalytic efficiency for SO2 oxidation and sulfate production under dark ambient conditions. Their SO2 uptake coefficient (up to 1.5 × 10-5) is orders of magnitude higher than those of mineral dust or soot. This remarkable reactivity originates from a self-sustained synergy between Fe2O3 and carbonaceous components: oxygen vacancies in Fe2O3 continuously activate atmospheric O2 and H2O to generate reactive oxygen species and Fe-OH for SO2 oxidation, while organics and elemental carbon promote H2O dissociation through proton abstraction and enhance SO2 adsorption at carbon defects, respectively. Together, these processes sustain cyclic catalysis and mitigate site deactivation. Our findings establish BWPs as a previously overlooked class of reactive aerosols, with broad implications for multiphase chemistry, atmospheric modeling, and air quality management.


How to cite: Qi, F., Peng, J., and Mao, H.: Unexpectedly rapid sulfate formation on the surface of vehicular brake wear particles, EGU General Assembly 2026, Vienna, Austria, 3–8 May 2026, EGU26-15668, https://doi.org/10.5194/egusphere-egu26-15668, 2026.

EGU26-15825 | ECS | Posters on site | AS3.32

Quantifying the air quality benefits of electric vehicles 

Xinyu Yu and Man Sing Wong

Traffic emissions remain a critical source of air pollutants, and electric vehicles (EVs) related policies have been proposed recently to mitigate the adverse impacts on urban air quality. In this study, a scenario-driven Random Forest model is developed to conduct a policy-oriented assessment of EV impacts on air pollution mitigation in Guangdong Province, China. Results show that traffic-affected air pollution concentrations have a significant decreasing trend, especially for NO2 and PM2.5. Additionally, real-world measurements of station-based EV charging consumptions and the EV charging station distribution are involved to quantify the future changes in air pollution concentrations of PM₂.₅, NO₂, SO₂, and CO, responding to varying EV policy implementation intensities. It reveals that a further decline of air pollutant concentrations can be achieved with the increase of EV implementation intensity. Compared to the average values in 2023, mean further reductions of 0.46 µg/m3, 0.37 µg/m3, 0.048 µg/m3, and 0.0043 mg/m3 for PM2.5, NO2, SO2 and CO are presented when there is a 30% increase in the number of EV charging stations and charging demands. This study conducts a fact-based analysis for evaluating the traffic-affected air pollution benefits from EVs adoption, which also provides a scientific basis for formulating the air pollution mitigation policies.


How to cite: Yu, X. and Wong, M. S.: Quantifying the air quality benefits of electric vehicles, EGU General Assembly 2026, Vienna, Austria, 3–8 May 2026, EGU26-15825, https://doi.org/10.5194/egusphere-egu26-15825, 2026.

Air pollution has intensified globally with the acceleration of industrialization and urbanization, posing significant threats to human health and ecosystem stability. In particular, particulate matter (PM) is a major hazardous component that has been strongly linked to the development and worsening of respiratory and cardiovascular diseases. PM concentrations exhibit substantial spatial variability even over short distances due to differences in emission sources, meteorological conditions, and land-use characteristics. Therefore, high-resolution spatial monitoring is essential for accurate exposure assessment, particularly in densely populated and environmentally vulnerable areas. However, existing ground-based monitoring networks are spatially unevenly distributed, thereby constraining their capacity to accurately represent fine-scale spatial variability and localized high-concentration events in urban environments. To address these limitations, this study aims to estimate PM concentrations at a spatial resolution of 20 m using high-resolution satellite imagery, thereby complementing ground-based observations and enabling detailed characterization of local PM variability and hotspots. Sentinel-2 satellite data were integrated with multiple ancillary datasets, including meteorological variables, a digital elevation model, and land cover information, to estimate PM concentrations. Multiple machine learning and deep learning algorithms were implemented and systematically compared, and XGBoost was identified as the optimal model. Model performance was evaluated using multiple statistical metrics. The results demonstrated high predictive performance for both PM10 and PM2.5 concentrations. For PM10, the model achieved a mean absolute error (MAE) of 6.684㎍/㎥, a root mean square error (RMSE) of 11.132㎍/㎥, and a determination of coefficient (R²) of 0.887. Similarly, PM2.5 estimation yielded an MAE of 4.094㎍/㎥, an RMSE of 6.648㎍/㎥, and an R² of 0.841. These findings confirm the feasibility and effectiveness of generating high-resolution PM concentration maps using Sentinel-2 satellite data. This study provides a robust framework for detailed assessment of urban-scale PM spatial distributions and offers valuable baseline data for population exposure assessment and the development of targeted air quality management policies.

How to cite: Koh, M., Park, S., and Park, S.: High-Resolution Estimation of Particulate Matter Concentrations based on Sentinel-2 Satellite Imagery Using Machine Learning and Deep Learning Approaches, EGU General Assembly 2026, Vienna, Austria, 3–8 May 2026, EGU26-15982, https://doi.org/10.5194/egusphere-egu26-15982, 2026.

EGU26-16591 | Posters on site | AS3.32

Urban air quality monitoring for environmentally sensitive traffic management 

Thomas Trabert, Timo Houben, Alexander Sohr, Elmar Brockfeld, and Jan Bumberger

In the pilot region of Leipzig, the Helmholtz Centre for Environmental Research (UFZ) is implementing a sensor network comprising 25 mid-cost measuring devices for the continuous monitoring of air quality parameters PM₂.₅, PM₁₀, O₃, and NOₓ. The initiative is conducted within the project of AIAMO (Artificial Intelligence and Mobility), which aims to expand the existing digital infrastructure for an environmental digital twin which supports data-driven decision-making in sustainable urban development. 
The sensor network focuses on a defined study area (6 km x 6 km) within the city. In close cooperation with various municipal authorities – including the Environment Agency and the Transport and Civil Engineering Agency – traffic-related scenarios are being developed to facilitate the effects of upcoming urban air quality limit changes at an early stage. 

The selection of locations was based on existing or potential air quality hot spots where exceedances of limit values are either observed or expected. Both areas with high traffic volumes and urban background areas, such as parks, were considered. The locations were selected iteratively with all relevant authorities from the city of Leipzig. To this end, various inner-city scenarios have been defined. 
Within these scenarios, continuous air quality measurements are integrated with traffic data and model simulations to produce a consistent, spatially and temporally resolved representation of local emission sources, dispersion dynamics, and possible mitigation strategies. Based on long-term measurement series, targeted measures are identified, tested within virtual environments, and iteratively evaluated in cooperation with municipal stakeholders of Leipzig. The overarching goal is to ensure compliance with air quality standards and to promote environmentally sensitive traffic management strategies.
The project illustrates how regionally anchored urban sensor networks, data-driven analyses, and scenario-based modelling approaches can contribute to the development of sustainable and urban air quality services in contemporary city contexts.

How to cite: Trabert, T., Houben, T., Sohr, A., Brockfeld, E., and Bumberger, J.: Urban air quality monitoring for environmentally sensitive traffic management, EGU General Assembly 2026, Vienna, Austria, 3–8 May 2026, EGU26-16591, https://doi.org/10.5194/egusphere-egu26-16591, 2026.

EGU26-17358 | Posters on site | AS3.32

Translating Citizen Data into Urban Action: AI and Creative Approaches for Inclusive Environmental Monitoring 

Nuria Castell, Tova Crystal, Stavros Tekes, Jessica Guy, Milena Calvo Juarez, and Oscar Gonzalez

Citizen science is increasingly recognised as a critical component of environmental monitoring, particularly in contexts where conventional observation systems lack spatial density, social reach, or local relevance. However, scaling citizen science and integrating its outputs into research and decision-making require robust infrastructures, inclusive engagement models, and tools that make complex data accessible to diverse audiences.

This contribution presents an integrated citizen science infrastructure approach that combines participatory sensing, data integration, and artificial intelligence to support healthy, sustainable, resilient and inclusive cities. Drawing on experiences from CitiObs, we demonstrate how AI-driven tools, including large language models (LLMs), are used to navigate and contextualise complex citizen science resources—such as toolkits and documentation—and to support the interpretation and communication of citizen-generated environmental data. Beyond AI, we highlight innovative, user-centred design approaches, including the structured use of hashtags to curate and connect documentation, which enhance discoverability, accessibility, and knowledge reuse across projects and communities.

We also show how artistic and creative approaches can support community-led action and more inclusive forms of environmental communication. In one CitiObs case, residents of a noise-affected neighbourhood in Barcelona deployed environmental monitors and, in collaboration with local creatives, co-designed Rut, an interactive AI chatbot that reflected community voices and experiences. Posters with QR codes placed in public space invited passers-by to engage with Rut via Telegram, where it answered noise-related questions and shared residents’ stories, helping translate monitoring data into relatable narratives.

CitiObs has worked with 35 European Citizen Observatories and, in its final year, is engaging with 50 Citizen Observatory Fellows worldwide. These cases illustrate how citizen science infrastructures, AI-supported tools, and participatory methodologies can be adapted for low- and middle-income countries (LMICs) and underserved urban communities. We emphasise that direct collaboration with communities not only strengthens social inclusion, but also plays a key role in validating methods, improving data quality, and ensuring policy relevance.

By linking technological innovation and creative practices with community-centred approaches, this work highlights pathways for embedding citizen science more effectively into urban environmental management and evidence-based policy.

How to cite: Castell, N., Crystal, T., Tekes, S., Guy, J., Calvo Juarez, M., and Gonzalez, O.: Translating Citizen Data into Urban Action: AI and Creative Approaches for Inclusive Environmental Monitoring, EGU General Assembly 2026, Vienna, Austria, 3–8 May 2026, EGU26-17358, https://doi.org/10.5194/egusphere-egu26-17358, 2026.

EGU26-17372 | Posters on site | AS3.32

Black Carbon Trends and Source Apportionment in Berlin: A Multi-Year Analysis 

Erika von Schneidemesser, Himanshu Setia, Maria Kanakidou, Aki Pajunoja, Kyriaki Papoutsidaki, Michael Pikridas, Marjan Savadkoohi, and Sean Schmitz

Black Carbon (BC) is a key component of fine particulate matter that impacts air quality, climate, and public health. Understanding its sources is essential for effective mitigation strategies. This study analyses 5+ years of continuous BC observations in Berlin using Aethalometer AE33 measurements, alongside co-located Particulate Matter (PM₂.₅, PM₁₀), Nitrogen Oxides (NOx), Carbon Monoxide (CO) concentrations, and ultrafine particle (UFP) data. BC source contributions are assessed, with NOx and CO serving as traffic-combustion markers, while biomass burning contributions are examined through seasonalBC variability and its relative contribution is validated with levoglucosan, potassium K+ and/or Elemental Carbon/Organic Carbon (EC/OC) measurements. This study is part of the Net4Cities project, contributing to a broader understanding of urban air pollution dynamics and policy interventions, with a focus on transport sources. Aethalometer wavelength-dependent absorption analysis will be used to to apportion relative contribution of liquid fuel and solid fuel BC, with NOx and CO correlations used to evaluate liquid fuel BC estimates. Multiple assumptions and approaches for source apportionment will be tested to quantify uncertainties and the implications evaluated. Relationships between BC and UFP data are investigated for the final year of data to link BC emissions and particle number concentrations in an urban environment.

This work is co-funded by the European Union under Project: 101138405 — Net4Cities, the UK Research and Innovation (UKRI) under the UK government’s Horizon Europe funding guarantee (grant no. 10107404), and the Swiss Secretariat for Education, Research and Innovation (SERI) (grant no. 23.00622). 

How to cite: von Schneidemesser, E., Setia, H., Kanakidou, M., Pajunoja, A., Papoutsidaki, K., Pikridas, M., Savadkoohi, M., and Schmitz, S.: Black Carbon Trends and Source Apportionment in Berlin: A Multi-Year Analysis, EGU General Assembly 2026, Vienna, Austria, 3–8 May 2026, EGU26-17372, https://doi.org/10.5194/egusphere-egu26-17372, 2026.

EGU26-17397 | Orals | AS3.32

Measuring VOCs under real driving emission conditions by means of PTR-MS – experiences and insights from vehicle campaigns 

Andreas Mauracher, Jian Xu, Felix Hasle, Tomas Mikoviny, Bea Rosenkranz, Armin Wisthaler, Mickaël Leblanc, and Philipp Sulzer

In this contribution, we present our experiences and insights on the online measurement of volatile organic compounds (VOCs) under real driving emission (RDE) conditions. The measurements were carried out in the framework of the EU and UKRI funded project AEROSOLS at ‘IFP Energies nouvelles’ in Paris, during two campaigns in summer and winter 2025. Among the numerous instruments used in these campaigns, we employed an advanced laminar-flow oxidation reactor (ILOx; IONICON Analytik) and two proton-transfer-reaction - time-of-flight - mass spectrometry (PTR-TOF-MS) instruments (IONICON Analytik) for online VOC and semi volatile organic compounds (SVOCs) measurements. One of the two PTR-TOF-MS instruments was equipped with a sensitivity enhancing RF+DC reaction chamber and a TOF analyzer with a mass resolution of 10,000 (full width at half maximum (FWHM) definition). The other PTR-TOF-MS instrument was a more compact, customized device that could be installed inside the boot of an SUV. This device was used for online VOC measurements both on the road and in a chassis dynamometer. It consists of two easily separable cubes that can be easily lifted and transported thanks to their robust construction. Two different types of reagent ions were utilized in the study, namely H3O+ and NO+. H3O+ is a well-known reagent ion and the cornerstone of PTR-MS technology. H3O+ can be used to ionize and detect a wide range of VOCs in the atmosphere, while the main constituents of air remain unionized and thus do not interfere in the detection of trace gases. NO+, on the other hand, is known to be more sensitive to the ionization of alkanes, which is important for analysis of exhaust gases from combustion engines. The product ions produced via proton transfer reaction, hydride abstraction or adduct formation are then analysed by means of a time-of-flight mass spectrometer with a mass resolution of 3,000 (FWHM definition). In order to track rapid changes in VOC concentrations, average mass spectra were recorded at least once every second.

Two SUVs were examined as part of the summer and winter campaigns. One was equipped with a diesel engine, the other with a plug-in hybrid gasoline engine. VOC emissions were measured for both SUVs both on the road and in the chassis dynamometer. We provide an overview of the campaigns and report in detail on the challenges and difficulties of online VOC measurements under RDE conditions, as well as some of the results of these two campaigns.

Acknowledgement: This research was co-funded by the European Union’s Horizon Europe research and innovation programme within the AEROSOLS project under grant agreement No. 101096912 and UK Research and Innovation (UKRI) under the UK government’s Horizon Europe funding guarantee [grant numbers 10092043 and 10100997].

How to cite: Mauracher, A., Xu, J., Hasle, F., Mikoviny, T., Rosenkranz, B., Wisthaler, A., Leblanc, M., and Sulzer, P.: Measuring VOCs under real driving emission conditions by means of PTR-MS – experiences and insights from vehicle campaigns, EGU General Assembly 2026, Vienna, Austria, 3–8 May 2026, EGU26-17397, https://doi.org/10.5194/egusphere-egu26-17397, 2026.

EGU26-17614 | ECS | Posters on site | AS3.32

Influence of Airports on Nearby Air Quality Through Emissions of Ultrafine Particles and Volatile Organic Compounds 

Sarah Tinorua, Michael Bauer, Benjamin Brem, Zachary Decker, Jay Slowik, André Prévôt, Suneeti Mishra, Michael Götsch, Joerg Sintermann, and Martin Gysel-Beer

Civil aviation and airports have been shown to be important sources of both Ultrafine particles (UFPs)  and Volatile Organic Compounds (VOCs) in urban areas1. UFPs are a major air quality concern because their small diameter (< 100 nm) allows them to reach the lungs’ alveolar regions causing adverse health effects. The aviation emission profile from the USA’s Environmental Protection Agency includes 15 hazardous VOCs, such as benzene and numerous carcinogenic Polycyclic Aromatic Hydrocarbons (PAHs)2. To assess the impact of UFPs and VOCs emissions from aviation on nearby air quality, two intensive one-month measurement campaigns of gaseous and particulate matter were performed in November 2022 and August 2024, 1 km downwind of Zürich Airport. The results indicate that high UFP number concentrations up to 300 000 cm⁻³ originate solely from aircraft operations, as shown by the similar diurnal profiles between air traffic movements and UFPs concentrations in Fig. 1a. These emissions are either advected downwind of the airport or mixed downward during aircraft landing overpasses. Using Positive Matrix Factorisation (PMF) on the VOCUS Proton Transfer Reaction Mass Spectrometer (PTR-MS) data, a factor containing naphthalene species and several alkanes with m/z > 100 (Fig. 1 c) has been attributed to VOCs aviation-related emissions. This is further supported by the co-increase of its time series with UFPs temporal evolution (Fig 1.b). However, when the site is not downwind and under the influence of landing overpasses, only UFPs concentrations increased, rather than the VOCs aviation-related factor (Fig. 1a), highlighting landing overpasses as a major source of UFPs but not of VOCs. This contrast likely results from lower engine thrust during taxiing at the airport than during landing overpass, which produces more VOCs due to reduced combustion efficiency3. At this stage, we cannot exclude a contribution of VOC emissions from engine refuelling. Future work will investigate the formation and evolution of VOCs in aviation plumes and their potential role in UFPs formation and growth. The widespread presence of UFPs and the co- emission of VOCs poses health concerns for communities near airports that regulators should address.

Figure 1: 10-minutes averaged a) Diurnal cycle of air traffic at Zürich airport, UFPs number concentration ntotalPM , and VOCs aviation emissions when the measurement site was downwind of Zürich airport during the fall 2022 measurement campaign and b) 10-days time series of the same variables. C) Factor profile of the VOCs aviation emissions determined by a source apportionment on the VOCUS PTR-MS data.

This work was supported by the Swiss Federal Office of Civil Aviation (SFLV 2020-080). We acknowledge the support from ZHAW, EMPA, Frithjof Siegerist (SRTechnics), and the City of Kloten.


(1) Masiol, M.; Harrison, R. M. Aircraft Engine Exhaust Emissions and Other Airport-Related Contributions to Ambient Air Pollution: A Review. Atmos. Environ. 2014, 95, 409–455. https://doi.org/10.1016/j.atmosenv.2014.05.070.

(2) US EPA, O. Organic Gas Speciation Profile for Aircraft. https://www.epa.gov/regulations-emissions-vehicles-and-engines/organic-gas-speciation-profile-aircraft (accessed 2026-01-12).

(3) Anderson, B. E.; Chen, G.; Blake, D. R. Hydrocarbon Emissions from a Modern Commercial Airliner. Atmos. Environ. 2006, 40 (19), 3601–3612. https://doi.org/10.1016/j.atmosenv.2005.09.072.

How to cite: Tinorua, S., Bauer, M., Brem, B., Decker, Z., Slowik, J., Prévôt, A., Mishra, S., Götsch, M., Sintermann, J., and Gysel-Beer, M.: Influence of Airports on Nearby Air Quality Through Emissions of Ultrafine Particles and Volatile Organic Compounds, EGU General Assembly 2026, Vienna, Austria, 3–8 May 2026, EGU26-17614, https://doi.org/10.5194/egusphere-egu26-17614, 2026.

EGU26-17788 | ECS | Orals | AS3.32

Measuring Urban Aerosol Volatility Fractions with a Catalytic Stripper at an ACTRIS Aerosol Observatory: Characterization and Implementation 

Maximilian Dollner, Paulus S. Bauer, Vinicius Berger, Bernadett Weinzierl, Agnieszka Kupc, Andreas Gattringer, Anna Lena Busskamp, Hans-Joachim Schulz, Adam Boies, and Jacob Swanson

 Aerosol particles play a central role in atmospheric processes, influencing air quality, human health, and climate. To fully understand these impacts, it is essential to quantify not only the physical properties such as concentration or size but also their chemical composition. Offline chemical analysis of aerosol samples or online mass spectrometry are generally complicated or expensive. Another efficient method is to determine the partitioning between the volatile and non-volatile fractions. This information provides insight into the chemical composition of an air mass and allows to infer information about aerosol sources, chemical aging, and transformation processes in the atmosphere (e.g. Weinzierl et al. (2006); Wehner et al. (2005, 2009); Ehn et al. (2007)).

A catalytic stripper (CS) is commonly used to separate the volatile and semi-volatile fraction from the solid aerosol particles, which allows for precise measurement of the non-volatile fraction and the total aerosol load (Swanson and Kittelson, 2010). Compared to a thermal denuder, it has the advantage that volatile substances undergo catalytic transformation and cannot recondense into particles after treatment. The CS has successfully been used in many automotive applications such as Particle Measurement Program (PMP) compliant studies (Giechaskiel et al., 2020; Swanson and Kittelson, 2010). However, not many atmospheric aerosol studies apply this simple distinction between volatile and solid particles, which plays an important factor for the investigation of air quality, human health and climate impact of aerosols.

Here we present the application of a CS for measurements of non-volatile aerosol particles at the Aerosol Observatory of the University of Vienna which is on track to become a National Facility for aerosol in-situ observations within the pan-European Aerosol, Clouds, and Trace Gas Research Infrastructure ACTRIS. This study includes the characterization of the CS with respect to particle penetration and removal efficiency of volatile and semi-volatile components. For particle penetration silver particles were generated with the Silver Particle Generator (SPG) and treated by the Sintering Stage S8000 to obtain thermally stable silver spheres in the size range between 2nm and 100nm. The characterization of the removal efficiency of volatile and semi-volatile particles is done with tetracontane, which is a well-established method in many regulations for the testing of volatile particle removal (VPR) systems in the automotive section (e.g. Euro-7). The aim of this study is to present initial results from continuous measurements of the non-volatile aerosol fraction over several weeks at the Aerosol Observatory in Vienna, demonstrating their potential for source identification and chemical characterization, and highlighting the importance of non-volatile particle measurements.


Weinzierl et. al. (2009). Tellus B: Chem. Phys. Meteorol., 61(1), 96.

Wehner et al. (2005), Geophys. Res. Lett., 32, L17810.

Ehn et al. (2007), Atmos. Chem. Phys., 7.

Wehner et al. (2009), J. Geophys. Res., 114.

Swanson and Kittelson (2010). J. Aerosol Sci. 41 (12):1113.

Giechaskiel et al. (2020). Vehicles 2 (2):342. 

How to cite: Dollner, M., Bauer, P. S., Berger, V., Weinzierl, B., Kupc, A., Gattringer, A., Busskamp, A. L., Schulz, H.-J., Boies, A., and Swanson, J.: Measuring Urban Aerosol Volatility Fractions with a Catalytic Stripper at an ACTRIS Aerosol Observatory: Characterization and Implementation, EGU General Assembly 2026, Vienna, Austria, 3–8 May 2026, EGU26-17788, https://doi.org/10.5194/egusphere-egu26-17788, 2026.

EGU26-17954 | ECS | Posters on site | AS3.32

Uncertainty-aware downscaling of NO2 surface levels in urban environments 

Andreu Julian-Izquierdo, Cristina Campos, Alvaro Criado, Cristina Carnerero, Albert Soret, Femke C Vossepoel, and Jan M. Armengol

Air pollution is recognised as one of the leading environmental risks to global health, contributing to severe respiratory and cardiovascular diseases. In urban environments, air pollutant concentrations exhibit strong spatial variability at very fine scales, which cannot be adequately resolved by regional air quality models. The recently adopted Directive (EU) 2024/2881 establishes stricter regulatory standards, including a new annual mean limit of 20 μg/m3 for NO2, which is frequently exceeded at specific urban locations, highlighting the need for high-resolution data fusion approaches that integrate air quality models with observational data to support exposure assessment and regulatory compliance.

Current state-of-the-art methods increasingly fuse Sentinel-5P (TROPOMI) tropospheric NO2 columns with high-resolution geospatial proxies and modelled data to refine regional air quality outputs for urban-scale applications. However, high-resolution uncertainty quantification is largely absent from these products, limiting their interpretability. Establishing a clear methodology to provide this information is essential for effective air quality management, as stakeholders require reliable confidence metrics alongside best estimates to design robust mitigation strategies.

In this work, we present a statistical downscaling framework applied to CALIOPE, an operational air quality system integrating meteorological, emission, and photochemical models within a three-level nested configuration covering Europe, the Iberian Peninsula, and Catalonia. In the innermost domain, CALIOPE provides hourly forecasts at a 1 km × 1 km resolution. The proposed methodology bridges the gap between regional and urban scales by integrating high-resolution geospatial covariates (including traffic intensity networks, CORINE land-use data, terrain elevation, and distances to industrial sources) to produce concentration maps at the target high resolution. In particular, the proposed downscaling procedure operates on a non-uniform spatial mesh, achieving resolutions of up to 25 m near emission sources, with dense sampling along the road network and progressively coarser resolution towards the regional background. Sentinel-5P (TROPOMI) tropospheric NO2 column data are interpolated to the final grid and incorporated as a spatially continuous covariate, ensuring regional consistency, particularly in areas lacking ground-based monitoring. The modelling strategy follows a source-oriented stratified approach inspired by area-oriented Kriging principles, separating traffic-influenced and background environments. Deterministic concentration trends are estimated using non-linear machine learning algorithms, including Random Forest and Gradient Boosting, while spatially correlated residuals are interpolated using ordinary kriging. Crucially, uncertainty quantification is explicitly integrated by propagating both model and spatial interpolation uncertainties, resulting in an uncertainty-aware product that provides local confidence estimates alongside predicted concentrations.

The framework is applied to estimate annual mean NO2 concentrations for 2024 in Catalonia, Spain, serving as a high-resolution diagnosis for the regional government. Beyond standard concentration maps, the system provides stakeholders with probability of exceedance maps, relative to the regulatory thresholds, and pixel-level uncertainty metrics. Statistical performance evaluated through Leave-One-Out Cross-Validation demonstrates significant improvements over raw regional outputs, achieving an R2 of 0.87 and reducing the Root Mean Square Error by 35% to 3.4 μg/m3. These results highlight the potential of the proposed approach to resolve complex urban patterns at regional scales for multiple cities, while supporting targeted public health interventions and evidence-based policy-making.

How to cite: Julian-Izquierdo, A., Campos, C., Criado, A., Carnerero, C., Soret, A., C Vossepoel, F., and M. Armengol, J.: Uncertainty-aware downscaling of NO2 surface levels in urban environments, EGU General Assembly 2026, Vienna, Austria, 3–8 May 2026, EGU26-17954, https://doi.org/10.5194/egusphere-egu26-17954, 2026.

EGU26-18205 | ECS | Orals | AS3.32

Cold-start urban emissions from LPG and diesel passenger cars: a focus on NOx, NH₃ and particle number 

Javier David Londoño Echeverri, Rosario Ballesteros Yáñez, and Angel Ramos Diezma

The decarbonisation of road transport requires not only the introduction of alternative fuels, but also a robust evaluation of their real-world pollutant emissions under representative urban conditions. Despite ongoing fleet electrification, diesel passenger cars still represent a significant share of urban traffic in Spain, making them a relevant benchmark for transitional technologies such as Liquefied Petroleum Gas (LPG).


This work presents an experimental comparison of nitrogen oxides (NOx), ammonia (NH₃) and particle number (PN) emissions from an LPG spark-ignition passenger car and a conventional diesel vehicle under urban real driving conditions, using the urban segment of a Euro-7-oriented driving cycle. The LPG vehicle (Euro-6, three-way catalyst and gasoline particle filter) was retrofitted with a commercial LPG system, while the diesel vehicle (Euro-6) was equipped with oxidation catalyst, particle filter and selective catalytic reduction. Both vehicles were tested using a Euro 7-compliant portable emission measurement system during real driving cycles covering typical urban operation.


Tests were conducted at two ambient temperatures representative of moderate and severe urban conditions (23°C and −7°C), with special attention to cold start operation. All experiments were performed on a chassis dynamometer using urban driving cycles characterised by low speeds, frequent stops and high transient operation, where delayed aftertreatment activation strongly influences emissions.


Results show that cold-start events dominate urban NOx, NH₃ and PN emissions for both vehicles, with a marked deterioration at −7°C. Under cold ambient conditions, total urban NOx emissions increase significantly, especially for the diesel vehicle, reflecting reduced efficiency of the NOx control system during warm-up. The LPG vehicle exhibits lower overall NOx emissions over the complete urban cycle, although emissions also increase at low temperature due to delayed catalyst activation.


Ammonia emissions are substantially higher for the LPG vehicle, particularly during cold-start and early urban operation. This behaviour is mainly governed by air–fuel ratio calibration, which controls NH₃ formation over the three-way catalyst, rather than cold-start itself. This is supported by measurable NH₃ emissions during hot start operation at +23°C. At −7°C, NH₃ emissions during hot operation decrease but remain relevant during the initial cold phases. For the diesel vehicle, NH₃ emissions are generally low, with occasional peaks during transient operation, likely associated with aftertreatment warm-up.


Particle number emissions are strongly influenced by cold start for both vehicles. The LPG vehicle shows elevated PN emissions during cold operation, attributed to incomplete combustion and reduced filtration efficiency at low exhaust temperatures, followed by a sharp reduction once thermal stabilisation is achieved. The diesel vehicle exhibits higher PN emissions under cold ambient conditions, particularly at −7°C, indicating reduced filtration efficiency during warm-up.


Overall, LPG operation offers advantages over diesel in terms of urban NOx emissions once aftertreatment is active. However, increased NH₃ and PN emissions during cold start remain key challenges, especially at low ambient temperatures, highlighting the importance of cold-start-oriented emission control strategies and optimised calibration in the context of future Euro 7 regulations.


Acknowledgement

This work was supported by the Spanish Ministry of Science, Innovation and Universities through project ImMA_7 (PID2022-136437OB-I00).

How to cite: Londoño Echeverri, J. D., Ballesteros Yáñez, R., and Ramos Diezma, A.: Cold-start urban emissions from LPG and diesel passenger cars: a focus on NOx, NH₃ and particle number, EGU General Assembly 2026, Vienna, Austria, 3–8 May 2026, EGU26-18205, https://doi.org/10.5194/egusphere-egu26-18205, 2026.

EGU26-18450 | Orals | AS3.32

Contribution of Explicit SVOC and IVOC Emissions from the Transportation Sector on Particulate Matter Concentrations in Europe 

Ben Murphy, Willem van Caspel, Erik Mousing, Jeroen Kuenen, Marya el Malki, and David Simpson

Road transportation is a significant contributor to air pollution across Europe, especially in urban areas, and the resulting impacts on public health are highly uncertain. Pollutants are emitted in both the gas and particle phases from several operational modes including combustion exhaust, non-combustion evaporation, and mechanical brake and tire wear. Conventional air emission inventories used to inform policy in Europe have included inert fine and coarse particle emissions as well as emissions of light hydrocarbons, or volatile organic compounds. But recent laboratory studies have demonstrated that particle emissions are far more dynamic than originally thought, and that key reactive gas-phase compounds have probably been missing from existing inventories. 

As part of the Effects on Air quality of Semi-VOLatile Engine Emissions (EASVOLEE) project, state-of-the-science laboratory measurements have been used to develop a new inventory for present-day European air emissions that explicitly considers semivolatile and intermediate volatility organic compounds (SVOCs and IVOCs) from road transportation. This inventory is used to drive simulations with the European Monitoring and Evaluation Programme (EMEP) MSC-W regional-scale chemical transport model. With this new model platform, we assess the comprehensive primary and secondary contributions of road transport emissions to European particulate matter (PM). We show results from a broad series of chemical sensitivity tests along with measurements of organic aerosol across Europe to build confidence in the model’s predictions and characterize the role of uncertainty in processes like oxidation of IVOCs and multigenerational oxidative aging of second-generation products. We also compare the burden of road transport PM to that from other key sources like residential wood-burning and wildfires to better understand the role of road transport in future policy scenarios.

How to cite: Murphy, B., van Caspel, W., Mousing, E., Kuenen, J., el Malki, M., and Simpson, D.: Contribution of Explicit SVOC and IVOC Emissions from the Transportation Sector on Particulate Matter Concentrations in Europe, EGU General Assembly 2026, Vienna, Austria, 3–8 May 2026, EGU26-18450, https://doi.org/10.5194/egusphere-egu26-18450, 2026.

EGU26-18990 | ECS | Posters on site | AS3.32

Development of a Machine Learning QSAR Platform to Predict Carcinogenicity Potential of Transport-derived PAHs 

Nategheh Najafpour, Jose M. Herreros, Athanasios Tsolakis, Zili Sideratou, Fotios Katsaros, and Soheil Zeraati-Rezaei

Predicting the carcinogenic potential of emerging pollutants is vital to safeguarding public health and the environment. Approaches relying on high-fidelity chemical models incur substantial computational costs, while approaches solely relying on mathematical methods often lack robust predictive performance. In recent years, to address these limitations, Quantitative Structure–Activity Relationship (QSAR) models integrating chemical structure with mathematical methods have been developed. QSAR facilitates the implementation of the three principles of Replacement, Reduction, and Refinement (3Rs) in the context of green and sustainable chemistry for carcinogenicity prediction. Nevertheless, the prediction accuracy of existing models requires enhancement, as it is currently limited due to uncertainties in chemical classification databases, limited feature selection, and the complexity of carcinogenic mechanisms.

This study developed a tailored machine learning QSAR platform to predict the carcinogenic potential of Polycyclic Aromatic Hydrocarbons (PAHs), potentially reducing reliance on in vivo testing. The platform employs the Random Forest machine learning method, an ensemble of decision trees, based on molecular structure features (i.e., descriptors including constitutional, topological, geometrical, etc.) and carcinogenicity classification data. A total of 66 PAHs were selected based on available evidence of their presence in emissions from transport. PAH carcinogenicity classification data were extracted primarily from the International Agency for Research on Cancer (IARC), the Integrated Risk Information System (IRIS), and the European Chemicals Agency (ECHA) databases. PAHs were subsequently classified into carcinogenic (+1) and non-carcinogenic (−1) categories. Of the 66 PAHs, 56 were used for model training and 10 for evaluation using machine learning validation criteria, including accuracy, precision, sensitivity (i.e., recall), and the harmonic mean of precision and recall (i.e., F1 score). The optimal combination of model hyperparameters was selected based on the lowest average prediction error (i.e., out-of-bag error). Molecular descriptors were calculated using PaDEL-descriptor software, yielding 1,875 descriptors for each compound. Constant and highly correlated molecular descriptors (>0.96) were removed, reducing the descriptors to 291.

The results indicate that feature importance analysis successfully reduced the molecular descriptors to a final set of 12. This reduction is critical for preventing overfitting, given the limited transport-derived PAH carcinogenicity data available. The platform demonstrated robustness regarding uncertainties in the initial categorisation of compounds. Furthermore, it captured the most influential molecular characteristics for predicting PAH carcinogenicity. Its high accuracy is evidenced by F1 scores of 0.95 and 0.83 for the training and evaluation sets, respectively. Consequently, this study demonstrates that integrating QSAR with Random Forest can facilitate cost-effective and accurate prediction of the carcinogenic potential of unclassified PAHs, supporting the transition toward New Approach Methodologies (NAMs) by reducing the need for costly in vitro and in vivo testing.

Acknowledgement: This research was funded by the European Union’s Horizon Europe research and innovation programme within the AEROSOLS project under grant agreement number 101096912 and the UK Research and Innovation (UKRI) under the UK government’s Horizon Europe funding guarantee [grant numbers 10092043 and 10100997].

How to cite: Najafpour, N., Herreros, J. M., Tsolakis, A., Sideratou, Z., Katsaros, F., and Zeraati-Rezaei, S.: Development of a Machine Learning QSAR Platform to Predict Carcinogenicity Potential of Transport-derived PAHs, EGU General Assembly 2026, Vienna, Austria, 3–8 May 2026, EGU26-18990, https://doi.org/10.5194/egusphere-egu26-18990, 2026.

EGU26-19211 | Posters on site | AS3.32

In vitro toxicological assessment of secondary organic aerosol precursors from road transport  

Zili Sideratou, Barbara Mavroidi, Fotios Katsaros, and Soheil Zeraati-Rezaei

Exposure to unabated organic aerosol emissions is known to induce pulmonary inflammation and exacerbate respiratory symptoms, primarily through oxidative stress and direct toxic injury. However, the mechanisms by which specific compounds within the primary emissions from road transport, that can also act as secondary organic aerosol precursors, impact health require further characterization. An in vitro safety assessment of selected intermediate-/semi-volatile organic compounds (I/SVOCs) was conducted using human alveolar epithelial A549 cells, murine macrophage RAW 264.7 cells, and rat alveolar macrophage NR8383 cells under both conventional submerged monolayer cultures and advanced air–liquid interface (ALI) exposure systems. The first stage of the biological evaluation comprised a series of experiments using selected I/SVOCs commonly found in road transport-derived aerosols, namely polycyclic aromatic hydrocarbons (e.g., naphthalene and pyrene) and alkanes (e.g., dodecane, tetradecane, and docosane). Furthermore, actual gasoline internal combustion engine exhaust was collected on polytetrafluoroethylene (PTFE) membranes and subsequently subjected to biological evaluation.

The in vitro assessment of the I/SVOCs demonstrated significant cytotoxicity, oxidative stress, and inflammatory responses in all tested cell lines. Traditional submerged cultures revealed concentration-dependent effects, including reactive oxygen species (ROS) generation, glutathione depletion, apoptosis, G₂/M cell cycle arrest, and increased levels of pro-inflammatory cytokines. Moreover, advanced human ALI organotypic airway tissue models exposed via the VITROCELL® Essentials ALI exposure system (VITROCELL SYSTEMS GmbH, Waldkirch, Germany) were employed to more accurately replicate real-world respiratory exposure conditions. The ALI model represents an advanced in vitro airway system in which differentiated primary airway cells, cultured on microporous membrane scaffolds, are directly exposed to aerosols and gases at the air–liquid interface. Unlike submerged monolayer cultures, these differentiated primary cells exhibit transcriptional profiles that more closely resemble the in vivo human airway epithelium. Consequently, ALI airway models more accurately reproduce in vivo airway architecture, including barrier integrity and metabolic activity, while enabling exposure scenarios that better reflect real-world human inhalation. In addition, the integration of the ALI exposure system with a volatile organic compound (VOC) generator and a real-time multi-gas analyser, connected via a bypass sampling line downstream of a mixing chamber, enhanced the exposure precision, flexibility, and physiological relevance. Collectively, the findings are expected to provide a robust basis for the classification and prioritization of I/SVOCs according to their potential health risks, thereby supporting informed decision-making in air quality regulation and public health protection.

Acknowledgement: This research was funded by the European Union’s Horizon Europe research and innovation programme within the AEROSOLS project under grant agreement No. 101096912 and UK Research and Innovation (UKRI) under the UK government’s Horizon Europe funding guarantee [grant numbers 10092043 and 10100997].

How to cite: Sideratou, Z., Mavroidi, B., Katsaros, F., and Zeraati-Rezaei, S.: In vitro toxicological assessment of secondary organic aerosol precursors from road transport , EGU General Assembly 2026, Vienna, Austria, 3–8 May 2026, EGU26-19211, https://doi.org/10.5194/egusphere-egu26-19211, 2026.

EGU26-20213 | ECS | Orals | AS3.32

Source Apportionment and Composition Characterization of Transport-Related Aerosols in the Port of Rotterdam during the MI-TRAP Campaign 

Štěpán Horník, Juliane L. Fry, Joel F. de Brito, Veronique Riffault, Hui Chen, Laurent Alleman, Jean-Eudes Petit, Olivier Favez, Hasna Chebaicheb, Manousos Ioannis Manousakas, Konstantinos Eleftheriadis, Maria Gini, Stergios Vratolis, Jakub Ondráček, Hugo Bison, and Ed van der Gaag

The Port of Rotterdam is Europe’s largest maritime hub and a major hotspot of transport-related air pollution, influenced by intensive shipping activity, and port-related industry. Within the Horizon Europe project Mitigating Transport-related Air Pollution in Europe (MI-TRAP), a comprehensive atmospheric measurement campaign was conducted in this area to improve the quantification and source attribution of transport emissions in the complex port environment. A high-resolution stationary monitoring site was deployed at Hoek van Holland, strategically located to detect emissions from shipping traffic, port operations, and surrounding industrial and urban sources. The measurement setup combined state-of-the-art aerosol chemical, physical, and optical instrumentation with advanced data analysis approaches, enabling detailed characterization of particulate matter.

This contribution presents key results from the Rotterdam campaign with a focus on source apportionment and particle volatility. Positive Matrix Factorization (PMF) applied to Aerosol Chemical Speciation Monitor (ACSM) and Xact Ambient Metals Monitor data reveals distinct factors associated with shipping emissions and industrial activities, alongside contributions from local sources and secondary aerosol formation. In addition, a catalytic stripper was employed upstream of particle and black carbon measurements to quantify the solid particle fraction. Apart from long-term statistics, three characteristic pollution episodes are examined in detail: (i) a summer period dominated by elevated organic aerosol concentrations during high-temperature conditions, (ii) a pronounced ultrafine particle number episode, and (iii) a high nitrate episode.

Overall, the MI-TRAP Rotterdam results show that combining receptor modelling with volatility-resolved measurements and targeted episode analysis helps to separate different emission sources and to better describe their contribution to urban air pollution.

How to cite: Horník, Š., Fry, J. L., de Brito, J. F., Riffault, V., Chen, H., Alleman, L., Petit, J.-E., Favez, O., Chebaicheb, H., Manousakas, M. I., Eleftheriadis, K., Gini, M., Vratolis, S., Ondráček, J., Bison, H., and van der Gaag, E.: Source Apportionment and Composition Characterization of Transport-Related Aerosols in the Port of Rotterdam during the MI-TRAP Campaign, EGU General Assembly 2026, Vienna, Austria, 3–8 May 2026, EGU26-20213, https://doi.org/10.5194/egusphere-egu26-20213, 2026.

EGU26-20627 | ECS | Posters on site | AS3.32

Ambient black carbon monitoring in urban environments using photoacoustic spectroscopy 

Markus Knoll, Herbert Reingruber, Michael Arndt, Petra Kotnik, Johannes Murg, and Alexander Bergmann

Black carbon (BC) is a key indicator of combustion-related urban air pollution, strongly associated with road traffic, industrial emissions and residential heating, and is addressed within the European Ambient Air Quality Directive (EU) 2024/2881 as a parameter for air quality assessment. Reliable BC measurements at low ambient concentrations are therefore required for air quality studies and regulatory monitoring. The Aethalometer is currently the instrument of choice for monitoring ambient air quality and for scientific studies of BC. One issue with the Aethalometer is that it does not use a direct absorption measurement principle; it measures light attenuation and calculates black carbon (BC) absorption using several empirically determined factors. Photoacoustic spectroscopy (PAS) is a filter-free measurement principle that directly measures the absorption of BC. The PAS-based AVL Micro Soot Sensor (MSS) was originally developed for exhaust soot measurements in the automotive sector. In this study, the MSS was adapted for ambient air monitoring by modifying it to improve sensitivity and accuracy, resulting in the AVL Black Carbon Monitor. In the laboratory,  a first benchmark was performed to compare the sensitivity, stability and applicability for air quality measurements of different PAS-based BC instruments against the Aethalometer. The results demonstrate that the AVL Black Carbon Monitor enables time-resolved black carbon (BC) measurements in the nanogram-per-cubic-meter range, making it suitable for long-term urban use. Field measurements were carried out at multiple urban monitoring sites in Graz, Austria, representing locations with varying traffic exposure and residential surroundings. The observed BC time series show characteristic diurnal variability associated with traffic activity. Spatial differences between sites reflect varying local influences on emissions. The study illustrates the applicability of PAS-based BC monitoring for urban air quality assessment and transport-related emission characterization.

How to cite: Knoll, M., Reingruber, H., Arndt, M., Kotnik, P., Murg, J., and Bergmann, A.: Ambient black carbon monitoring in urban environments using photoacoustic spectroscopy, EGU General Assembly 2026, Vienna, Austria, 3–8 May 2026, EGU26-20627, https://doi.org/10.5194/egusphere-egu26-20627, 2026.

EGU26-20755 | ECS | Orals | AS3.32

Abatement of intermediate- and semi-volatile aerosol emissions within road transport 

Hugh Davies, James Brean, Nikhil Khedkar, Jose M Herreros, Mohammed S Alam, Joonas Vanhanen, Athanasios Tsolakis, Roy M Harrison, and Soheil Zeraati-Rezaei

Intermediate/semi-volatile organic compounds (I/SVOCs) emitted from transport are currently unregulated and are believed to contribute significantly to secondary aerosol formation. A key knowledge gap remains regarding the characterisation and enhancement of their abatement via catalytic exhaust aftertreatment systems, particularly in gasoline-fuelled road vehicles where data are scarce. To elucidate potential I/SVOC abatement mechanisms, this study comprehensively characterised emissions from a modern light-duty gasoline internal combustion engine (ICE) upstream and downstream of a three-way catalyst (TWC) and a gasoline particulate filter (GPF).

Undiluted gaseous emissions, including selected volatile organic compounds (VOCs), were directly measured in real time using an MKS multi-gas Fourier transform infrared spectrometer (FTIR). The exhaust was diluted using a two-stage Dekati® eDiluter™ Pro system, maintaining a representative and consistent dilution ratio and temperature. Subsequently, particle number size distribution over the range 1.2 nm – 440 nm was achieved with a combination of two mobility particle size spectrometers (MPSSs) operated in parallel as well as an advanced particle size magnifier coupled with a condensation particle counter (PSM-CPC). A purpose-built adsorption tube and filter sampler (AFS) was employed to simultaneously capture gas- and particle-phase I/SVOC emissions, which were then analysed via comprehensive two-dimensional gas chromatography time-of-flight mass spectrometry (GC×GC-ToF-MS).

Experiments conducted under “low load” engine conditions revealed a total hydrocarbon (THC) removal efficiency of > 96% for the TWC. Results demonstrated some particle removal over the TWC, primarily in the nucleation mode (featuring a considerable I/SVOC fraction); however, total particle numbers were decreased by > 99.7% over the GPF, with removal efficiency not dropping below 99.2% for any individual size bin.  Analysis of engine-out I/SVOCs indicated a high prevalence of alkylbenzenes, polycyclic aromatic compounds (PAHs), and alkyl-PAHs, with most PAHs and oxygen-containing compounds found in the particle phase with monoaromatics found in the gas phase. This study offers insights into the dynamics of I/SVOCs within the exhaust aftertreatment system, aiding the identification of their sources and the development of targeted mitigation strategies.

Acknowledgement:

This research was funded by the European Union’s Horizon Europe research and innovation programme within the AEROSOLS project under grant agreement number 101096912 and the UK Research and Innovation (UKRI) under the UK government’s Horizon Europe funding guarantee [grant numbers 10092043 and 10100997].

How to cite: Davies, H., Brean, J., Khedkar, N., Herreros, J. M., Alam, M. S., Vanhanen, J., Tsolakis, A., Harrison, R. M., and Zeraati-Rezaei, S.: Abatement of intermediate- and semi-volatile aerosol emissions within road transport, EGU General Assembly 2026, Vienna, Austria, 3–8 May 2026, EGU26-20755, https://doi.org/10.5194/egusphere-egu26-20755, 2026.

EGU26-21010 | Orals | AS3.32

Ultrafine, solid particles and Black Carbon Near Real Time assessment and critical properties at a traffic Hotspot MI-TRAP monitoring station in Athens 

Maria Gini, Stergios Vratolis, Manousos Manousakas, Evangelia Diapouli, Konstantinos Granakis, Vakalaki Eleni Amvrosia, Stasinos Konstantopoulos, Theodoros Giannakopoulos, Arpit Malik, Jakub Ondracek, Vladimir Zdimal, Griša Močnik, Konstantina Vasilatou, Andreas Nowak, and Konstantinos Eleftheriadis

Air quality in urban areas and other pollution hotspots, where transport emissions strongly influence human exposure, remains a complex environmental challenge and a major public health concern. The revised EU Air Quality Directive reflects a growing consensus that mass-based metrics, such as PM₁₀ and PM₂.₅, are not sufficient to fully capture the impact of air pollution on human health. As a result, increasing attention is being directed toward emerging pollutants such as black carbon (BC) and ultrafine particles (UFPs). These pollutants are closely associated with combustion processes, especially traffic emissions, and have been strongly linked to adverse health outcomes.

Within this context, the MI-TRAP project aims to improve understanding of these pollutants after emission, through the establishment of a network of 30 monitoring stations across 10 European cities. As part of MI-TRAP, a monitoring station was deployed at a traffic hotspot in Athens (Apr-Nov, 2025). The station was equipped with high time-resolution instrumentation, including an Aethalometer (Magee AE31, 7λ), a Mobility Particle Size Spectrometer (MPSS, TSI), an Optical Particle Sizer (OPS, GRIMM), and a Condensation Particle Counter (CPC, TSI), enabling measurements of aerosol absorption coefficient (babs) and black carbon concentration, particle number and mass size distributions, and total particle number concentration (NC), respectively. To better characterize the link between tailpipe emissions and ambient measurements, a catalytic stripper (Catalytic Instruments) was installed upstream of the AE31, MPSS, and CPC (to enable monitoring of the solid particles), together with an automatic valve, allowing alternating measurements between ambient and heated sampling conditions. These measurements were coupled with an in-house traffic counting and fleet recognition tool.

The results revealed that babs were strongly correlated with the total number concentration of UFPs with sizes above 20nm (NC20nm), whereas a weaker correlation was observed between babs (mean babs,880,amb = 13 ± 10 Mm-1 with more than 90% attributed to fossil-fuel combustion) and PM₂.₅ mass (mean PM2.5 = 9.4 μg/m3).  The diurnal cycle of babs exhibited a clear peak during the early-morning traffic hours, coinciding with the peak in NC>20nm. In contrast, NC<20nm showed a peak around noon, reflecting the influence of photochemical processes. After passing through the CS, the aerosol exhibited a clear shift in its NSD toward smaller diameters, accompanied by a significant reduction in NC in the 10–300 nm size range; the remaining solid particle number concentration accounted for approximately 60% of the ambient level (mean NCtotal,amb = 2.6*104 ± 1.3*104 cm-3). In terms of particle volume, the average reduction after heating was about 50%. The impact of the CS on aerosol absorption was less pronounced than that on particle number.

How to cite: Gini, M., Vratolis, S., Manousakas, M., Diapouli, E., Granakis, K., Amvrosia, V. E., Konstantopoulos, S., Giannakopoulos, T., Malik, A., Ondracek, J., Zdimal, V., Močnik, G., Vasilatou, K., Nowak, A., and Eleftheriadis, K.: Ultrafine, solid particles and Black Carbon Near Real Time assessment and critical properties at a traffic Hotspot MI-TRAP monitoring station in Athens, EGU General Assembly 2026, Vienna, Austria, 3–8 May 2026, EGU26-21010, https://doi.org/10.5194/egusphere-egu26-21010, 2026.

EGU26-21136 | ECS | Orals | AS3.32

Roadside point sampling applied for emission screening and ambient air quality - Insights into particle related air pollution in various European cities 

Alexander Bergmann, Martin Penz, Erika von Schneidemesser, and Markus Knoll

Black carbon (BC) and ultrafine particles (UFPs) are two key metrics of particulate matter (PM) for climate and health. Until 2024, neither of these metrics were addressed in the EU’s ambient air quality directives, which only focused on PM10 and PM2.5, dominated by micron-sized particles. However, with the EU Directive (EU) 2024/2881 both metrics will be measured for the first time, at least at supersites. Both are also key metrics for emissions: BC is the indicator of choice for identifying combustion-related PM, and particle number (PN) of UFPs is regulated in the EU emission standards. Roadside point sampling (PS) is a measurement technique that has been used for decades, primarily for scientific studies of real-world particle emissions (Hansen and Rosen, 1990; Knoll et al., 2024). Due to the continuous roadside measurement of metrics such as BC and UFP/PN it also provides very useful information about ambient air quality at a high resolution next to roads, where large numbers of people live and travel (Farren et al., 2025).

This work presents the results of emission and ambient air quality measurements taken in various European cities using roadside PS. The campaigns were performed in different seasons (spring, autumn and winter), providing interesting information in different settings. The emission results show that exceedances of defined thresholds for PS measured emission factors correspond well with the failure rates of the newly introduced PN periodic technical inspections (PTI) for checking diesel particulate filters (DPFs) in vehicles. Trends in vehicle emissions with different Euro standards provide valuable insights into real-world emission patterns which can be used to monitor the implementation of emission standards as well as for potential introductions of low emission zones. Ambient air quality measurements show that significant concentrations of BC and UFPs are observed near the road, especially during periods of high traffic and in winter. Ambient concentrations of more than 25 µg/m³ of BC were observed in winter, which is likely caused due to various emission sources (transport, industry, residential heating) and climate conditions. An outlook is shown for extending the measuring approach to additionally measure non-exhaust emissions (tire, brake, resuspension) and their influence on ambient air quality.

Keywords: Black Carbon, Ultrafine Particles, Real-World Emissions, Point Sampling, Roadside Ambient Air Quality, High pollution events, Non-exhaust emission

This work has been supported by the EU projects CARES (grant no. 814966), LENS (101056777) and Net4Cities (101138405).

Farren,N.J., Knoll,M., Bergmann,A., Wagner,R.L., Shaw,M.D., Wilson,S., Bernard,Y., Carslaw,D.C., 2025. Highly disaggregated particulate and gaseous vehicle emission factors and ambient concentration apportionment using a plume regression technique. Environ.Sci.Technol. 59, 11698–11707. http://dx.doi.org/10.1021/ACS.EST.5C05015.

Hansen, A. D. and Rosen, H.: Individual measurements of the emission factor of aerosol black carbon in automobile plumes, J. Air Waste Manage., 40, 1654–1657, https://doi.org/10.1080/10473289.1990.10466812, 1990.

Knoll, M., Penz, M., Juchem, H., Schmidt, C., Pöhler, D., and Bergmann, A.: Large-scale automated emission measurement of individual vehicles with point sampling, Atmos. Meas. Tech., 17, 2481–2505, https://doi.org/10.5194/amt-17-2481-2024, 2024.

How to cite: Bergmann, A., Penz, M., von Schneidemesser, E., and Knoll, M.: Roadside point sampling applied for emission screening and ambient air quality - Insights into particle related air pollution in various European cities, EGU General Assembly 2026, Vienna, Austria, 3–8 May 2026, EGU26-21136, https://doi.org/10.5194/egusphere-egu26-21136, 2026.

EGU26-21685 | ECS | Posters on site | AS3.32

Friction-Induced Heterogeneous Nucleation: Unravelling the Formation Mechanism of Brake Wear Particles via a Hybrid Machine Learning Framework and Multi-Dimensional Characterization 

Fuyang Zhang, Jianfei Peng, Jinsheng Zhang, Fuyuan Qi, Qijun Zhang, and Hongjun Mao

Vehicular non-exhaust emissions have become a dominant source of particulate pollution in urban areas. However, the dynamic physicochemical evolution transforming solid friction materials into aerosols under extreme braking conditions remains elusive, which significantly hinders accurate source apportionment. To bridge this gap, we established a comprehensive macro-to-micro analysis framework, integrating transient emission kinetics, multi-scale chemical fingerprinting, and machine learning techniques to decipher the formation mechanism of brake wear particles (BWPs).

By combining laboratory chassis dynamometer experiments (under WLTC and extreme AMS cycles) with high-resolution online monitoring (EEPS/APS), we captured the real-time formation dynamics. Crucially, at friction interface temperatures exceeding 300°C, we observed distinct "banana-shaped" particle size distribution evolution, directly indicative of rapid particle nucleation and subsequent growth events. However, connecting these macro-kinetics to micro-composition revealed a striking physicochemical paradox. Nanoscale single-particle elemental mapping indicated that ultrafine particles were predominantly composed of metallic elements (Fe/Cu) with negligible carbon signals. In sharp contrast, bulk surface spectroscopy (XPS/FTIR) of collected PM2.5 samples revealed a composition overwhelmingly dominated by organic carbon functional groups derived from resin binders.

To reconcile this discrepancy, we pioneered a novel hybrid machine learning methodology. This approach uniquely couples Deep Residual Networks (ResNet) for texture extraction with XGBoost for geometric decision-making. This intelligent analysis allowed for high-throughput quantification of single-particle morphology, revealing that these burst-phase nanoparticles exhibit near-perfect sphericity, ruling out mechanical abrasion. Consequently, we propose a mechanism of metal-vaporization induced heterogeneous nucleation, whereby trace metallic components vaporize to form high-density condensation nuclei. These nuclei subsequently trigger the heterogeneous condensation and coating of semi-volatile organic vapors, thereby forming particles with a distinctive metal-core/organic-shell architecture. Our results redefine the braking process as an active high-temperature physicochemical reactor, providing a robust, data-driven foundation for understanding the complex formation mechanisms of non-exhaust emissions.

How to cite: Zhang, F., Peng, J., Zhang, J., Qi, F., Zhang, Q., and Mao, H.: Friction-Induced Heterogeneous Nucleation: Unravelling the Formation Mechanism of Brake Wear Particles via a Hybrid Machine Learning Framework and Multi-Dimensional Characterization, EGU General Assembly 2026, Vienna, Austria, 3–8 May 2026, EGU26-21685, https://doi.org/10.5194/egusphere-egu26-21685, 2026.

EGU26-21816 | Posters on site | AS3.32

Urban emission and air quality modeling informed by microscopic traffic data 

Michael Weger, Timo Houben, Thomas Trabert, Alexander Sohr, Elmar Brockfeld, and Jan Bumberger

Despite decades of regulatory progress, air pollution, continues to pose a major public health burden in European cities. The transport sector remains a dominant contributor to urban air pollution (particularly to NO2), yet its impacts under real-world driving conditions are still insufficiently quantified. Attribution modeling studies form an important pillar for improving this understanding. However, commonly used approaches most often still rely on static emission inventories, which fail to take the spatial and temporal variability of true traffic dynamics into account. For this reason, modeling errors are often dominated by the emission uncertainties even at street-scale resolution.

This study presents a digital twin framework for urban air quality modeling that integrates the microscopic traffic simulation model SUMO with the urban microscale dispersion model CAIRDIO. In SUMO each vehicle is modeled explicitly on individual interactively managed routes, enabling to dynamically represent real-world traffic conditions, such as congestion patterns leading to emission spikes. Traffic flows and speeds in the network are continuously adjusted at calibration points with available real-time traffic measurements. Emissions are derived directly from simulated traffic data and imported into the CAIRDIO model, which computes urban flow, dispersion and air chemistry based on realistically evolving boundary conditions for meteorological and air composition.

We showcase an application study on the city of Leipzig, for which real-city weather conditions and NOx dynamics are modeled at the neighborhood scale over a period of one week. Based on the results, we assess the contribution of traffic-related emissions to ambient NO2 levels in different urban micro environments (high traffic sites, residential areas) and discuss the impact of variable atmospheric conditions on dispersion and chemical evolution characteristics. Representation of diurnal peak NO2 timing and magnitude in the data-driven emission modeling approach is further evaluated against a conventional modeling approach using available static emissions. Finally, the tool’s capability for scenario-based assessment of, e.g., traffic rerouting impacts is demonstrated, which can quantitatively support the implementation of traffic management strategies, infrastructure modifications, and urban air quality mitigation measures.

How to cite: Weger, M., Houben, T., Trabert, T., Sohr, A., Brockfeld, E., and Bumberger, J.: Urban emission and air quality modeling informed by microscopic traffic data, EGU General Assembly 2026, Vienna, Austria, 3–8 May 2026, EGU26-21816, https://doi.org/10.5194/egusphere-egu26-21816, 2026.

EGU26-22024 | ECS | Orals | AS3.32

Tracing Aviation Impacts on Air Quality: PM Chemical Composition and Source apportionment near Zürich airport 

Suneeti Mishra, Zachary Decker, Peter Alpert, Sarah Tinorua, Michael Bauer, Michael Goetsch, Andre Prevot, Joerg Sintermann, Martin Beer Gysel, Jay Slowik, and Benjamin Tobias Brem

Aircraft emissions are a significant source of particulate matter (PM) and ultrafine particles (UFP) during takeoff, landing, taxiing, and idling, degrading air quality near airports. With air traffic projected to grow by 4.2% annually, doubling pre-pandemic levels by 2040 (IATA, 2023a), the environmental and health implications are profound. Increased PM and UFP has been linked to respiratory and cardiovascular diseases and airports contribute to primary and secondary PM, affecting urban and regional air quality, with studies showing impacts extending up to 18 km downwind from major airports like LAX (Hudda et al., 2012).

The Aviation Plume PROPeRtIes AT Point of Exposure (APPROPRIATE) project investigates aircraft emissions at Zürich Airport, Switzerland’s largest. The project integrates laboratory and test cell measurements with field campaigns to bridge critical knowledge gaps in understanding the influence of aviation on local/regional air quality and human health. As part of this initiative, an intensive, month-long measurement campaign was conducted in the fall of 2022, approximately 1 kilometer east of the airport (downwind side), where a specialized container equipped with state-of-the-art instrumentation was deployed. Key measurements included LTOF-AMS (organic and inorganic composition), EESI-LTOF (molecular-level organic aerosol composition), and VOCUS-PTRMS (organic gases) to sample the complex emissions generated during aircraft operations.

LTOF-AMS source apportionment PMF results from the 2022 campaign, resolved nine factors: two OOA factors, one COA, one HOA, one NOA, two BBOA factors, one organic nitrogen–rich factor, and one event-related factor, providing an overview of the dominant PM₂.₅ components and source influences. Several of these factors show signatures consistent with airport-related emissions, indicating a substantial impact of airport activities on local air quality. Within the organic aerosol fraction, fragments associated with aircraft lubrication oil are observed. Complementary measurements from EESI, VOCUS, and other instruments will be used and distinguish airport emissions from other anthropogenic and biogenic sources.

References

IATA (2023a), Global Outlook for Air Transport.

Neelakshi Hudda, Scott A. Fruin, Environmental Science & Technology 2016 50 (7), 3362-3370

Zhenhong Yu, Scott C. Herndon, Luke D. Ziemba, Michael T. Timko, David S. Liscinsky, Bruce E. Anderson, and Richard C. Miake-Lye, Environmental Science & Technology 2012 46 (17), 9630-9637

How to cite: Mishra, S., Decker, Z., Alpert, P., Tinorua, S., Bauer, M., Goetsch, M., Prevot, A., Sintermann, J., Gysel, M. B., Slowik, J., and Brem, B. T.: Tracing Aviation Impacts on Air Quality: PM Chemical Composition and Source apportionment near Zürich airport, EGU General Assembly 2026, Vienna, Austria, 3–8 May 2026, EGU26-22024, https://doi.org/10.5194/egusphere-egu26-22024, 2026.

EGU26-2698 | ECS | Posters on site | AS3.33

Turn-over Effect of Biogenic HCHO Columns at High Temperatures Seen by TEMPO Satellite 

Xiangyu Luan, Xicheng Li, Xue Zhang, Tzung-May Fu, and Lei Zhu

The deployment of spectrometers on geostationary satellites has enabled unprecedented hourly monitoring of trace gases critical for air quality and atmospheric research. As the dominant species of global BVOC emissions, isoprene has significant implications for health, weather and climate. Field studies have shown that isoprene emission rates increase with temperature until reaching a peak and subsequently decrease. Using TEMPO’s hourly HCHO columns with ERA5 temperature data, we investigate the temperature dependency of HCHO, a proxy for isoprene emissions, across vegetated regions of North America. After accounting for confounding variables such as biomass burning and soil moisture, we apply Pettitt’s test to detect the change-point where correlation between HCHO concentration and temperature shifts from positive to negative. We find distinct turn-over behavior of HCHO columns across diverse regions with different dominant vegetation types, including broadleaf evergreen trees, broadleaf deciduous trees, needleleaf evergreen trees and crops with corresponding temperature thresholds (most significant) of approximately 305.5 K, 306.1 K, 305.6 K and 303.7K, respectively. To ensure statistical robustness, we perform a bootstrap-based Pettitt’s test approach to quantify the uncertainty of these thresholds. The resulting 95% confidence intervals (CI) are [305.97, 306.37] K for broadleaf evergreen trees, [305.49, 306.28] K for broadleaf deciduous trees, [305.60, 305.70] K for needleleaf evergreen trees, and [302.33, 303.06] K for crops, respectively. This marks the first satellite-based detection of such a phenomenon. Our study demonstrates the exceptional potential of Geo-Ring observations, particularly TEMPO’s diurnal sampling, in detecting and constraining biogenic emissions. These findings underscore the value of geostationary data for refining emission models and enhancing predictions of atmospheric composition under a changing climate.

How to cite: Luan, X., Li, X., Zhang, X., Fu, T.-M., and Zhu, L.: Turn-over Effect of Biogenic HCHO Columns at High Temperatures Seen by TEMPO Satellite, EGU General Assembly 2026, Vienna, Austria, 3–8 May 2026, EGU26-2698, https://doi.org/10.5194/egusphere-egu26-2698, 2026.

EGU26-3559 | Orals | AS3.33

Expanding Geostationary Atmospheric Composition Satellite Constellation: Towards Global Coverage  

Ali Omar, Pieternel Levelt, Shobha Kondragunta, Paulo Artaxo, Arlindo daSilva, Sheldon Drobot, Jonathan Hickman, Barry Lefer, Dennis Nicks, Raid Suleman, Ben Veihelman, Helen Worden, Shima Shams, Jun Wang, Emma Knowland, James Hannigan, Owen Cooper, Ray Nassar, and Dominca Czyzewska

Geostationary platforms can provide high spatial and temporal resolution measurements of air quality parameters.  To date, there is an acute absence of geostationary observations over Africa, the Middle East, South America and Oceania, even though these regions tend to be poorly monitored and are undergoing dramatic changes in emissions and air quality. Here we present the results of a study and white paper outlining the benefits of expanding geostationary observations to these regions.  The white paper explores the current state of measurements, technology, data availability, and the feasibility of implementing such observations to improve environmental monitoring and decision-making in these regions. Additionally, the paper discusses the potential impact of such observations on policymaking, public health, and environmental mitigation efforts in the four regions. Some of the parameters sought for high temporal and spatial observation frequency include: O3, NO2, Particulates, and others discussed in the Atmospheric Composition Virtual Constellation (AC-VC) White Papers and currently observed from geostationary platforms by the TEMPO (Tropospheric Emissions: Monitoring of Pollution) and GEMS (Geostationary Environment Monitoring Spectrometer) instruments. These observations are vital in closing the gap in air quality data for improving global air quality models and hemispheric pollution transport. Additional benefits include environmental monitoring in developing regions, aiding in pollution control efforts, and supporting environmental change mitigation strategies through advanced satellite technology.

How to cite: Omar, A., Levelt, P., Kondragunta, S., Artaxo, P., daSilva, A., Drobot, S., Hickman, J., Lefer, B., Nicks, D., Suleman, R., Veihelman, B., Worden, H., Shams, S., Wang, J., Knowland, E., Hannigan, J., Cooper, O., Nassar, R., and Czyzewska, D.: Expanding Geostationary Atmospheric Composition Satellite Constellation: Towards Global Coverage , EGU General Assembly 2026, Vienna, Austria, 3–8 May 2026, EGU26-3559, https://doi.org/10.5194/egusphere-egu26-3559, 2026.

EGU26-4130 | Orals | AS3.33

BAE Systems updates from the GeoXO Atmospheric Composition Instrument and application to future instruments 

Thomas Delker, Dennis Nicks, Sheldon Drobot, Betsy Farris, and Brian Baker

BAE Systems has two geostationary air quality instruments that are currently part of the Geo-Ring North, TEMPO and GEMS. The TEMPO mission was intended to demonstrate the ability and usefulness of hourly measurements of air quality, pollution sources, transport and chemistry over North America. BAE Systems recently finished a study and an initial contract to replace TEMPO with an updated instrument with more capability and minimal changes to heritage. This paper will review the TEMPO mission and the updates to the design, calibration, and capability of future ACX-like instrument. It will highlight how the improved capabilities could enhance the existing and future global monitoring system.

How to cite: Delker, T., Nicks, D., Drobot, S., Farris, B., and Baker, B.: BAE Systems updates from the GeoXO Atmospheric Composition Instrument and application to future instruments, EGU General Assembly 2026, Vienna, Austria, 3–8 May 2026, EGU26-4130, https://doi.org/10.5194/egusphere-egu26-4130, 2026.

EGU26-6199 | Posters on site | AS3.33

Evolution of GEMS Level-2 Algorithms for Atmospheric Composition Retrievals and Their Impacts on Air Quality Monitoring 

suna shin, won-jin lee, hyunkee hong, and hyejung shin

Since the launch of the Geostationary Environment Monitoring Spectrometer (GEMS) in 2020, the Level-2 (L2) algorithms for atmospheric pollutant retrievals—such as nitrogen dioxide (NO₂), ozone, and aerosols—as well as for the generation of a priori data, including cloud and surface reflectance products, have been continuously improved on an annual basis. Through successive algorithm updates, the GEMS NO₂ product has shown reduced overestimation and improved representation of the stratospheric contribution, while the formaldehyde (HCHO) product has mitigated the excessive influence of chemical transport model (CTM) a priori information on the retrieval results. This study presents the major updates and changes implemented in key GEMS L2 products over the past five years and evaluates their impacts through comparisons with other satellite observations and ground-based remote-sensing measurements. These results provide a comprehensive overview of the evolution of the GEMS L2 algorithms and demonstrate their applicability for long-term air-quality monitoring.

How to cite: shin, S., lee, W., hong, H., and shin, H.: Evolution of GEMS Level-2 Algorithms for Atmospheric Composition Retrievals and Their Impacts on Air Quality Monitoring, EGU General Assembly 2026, Vienna, Austria, 3–8 May 2026, EGU26-6199, https://doi.org/10.5194/egusphere-egu26-6199, 2026.

EGU26-6215 | ECS | Posters on site | AS3.33

Early warning system for air quality based on geostationary satellite observations 

Gyuyeon Kim and Yong-Sang Choi

Deterioration of air quality affects human health and socioeconomic conditions. An air quality early warning system (EWS) providing timely information prior to hazardous events is essential for minimizing associated damage and adverse impacts on human health. This study presents an air quality EWS that enables air quality nowcasting using high-resolution observations from Geostationary Environment Monitoring Spectrometer (GEMS). This system is delivered through a mobile application to facilitate wider dissemination of EWS. Southeast Asia is selected as the research region for early warning of trace gases (i.e., aerosol, NO2, and O3) where air quality deteriorates during the dry season. The results are generated using satellite-based observations and are presented through an intuitive mobile application interface. A direct satellite-to-mobile dissemination framework is implemented, allowing rapid transmission of alerts via Cell Broadcast Service (CBS), Short Message Service (SMS), and push notifications. The developed EWS is expected to contribute to disaster risk reduction, climate change adaptation, and the achievement of the Sustainable Development Goals (SDGs). Moreover, this system is scalable to a global extent in regions where Geo-Ring satellite data are available, supporting enhanced response capacities in air quality vulnerable regions.

How to cite: Kim, G. and Choi, Y.-S.: Early warning system for air quality based on geostationary satellite observations, EGU General Assembly 2026, Vienna, Austria, 3–8 May 2026, EGU26-6215, https://doi.org/10.5194/egusphere-egu26-6215, 2026.

EGU26-8558 | ECS | Posters on site | AS3.33

A Synergistic GEO Satellite Algorithm for UV–VIS Spectral Aerosol Absorption Retrieval 

Minseok Kim, Jhoon Kim, Sujung Go, Yeseul Cho, Mijin Kim, Heesung Chong, Hyeji Cha, Yujin Chai, and Sang Seo Park

Aerosol absorption (scattering) property is a key parameter for assessing aerosol radiative effects and identifying aerosol composition. However, current geostationary Earth orbit (GEO) satellite aerosol retrieval algorithms lack accuracy in estimating aerosol absorption. The Geostationary Environment Monitoring Spectrometer (GEMS) provides hyperspectral observations of Earth-reflected solar radiation from 300 nm to 500 nm, which is sensitive to aerosol absorption. However, the current aerosol retrieval algorithm for GEMS struggles to quantify aerosol loading and aerosol absorption simultaneously. Meanwhile, the Advanced Meteorological Imager (AMI) conducts band observations of Earth-reflected solar radiation from 470 nm to 1,330 nm. The longer visible wavelength bands of AMI are less sensitive to assumption errors related to aerosol absorption properties. As a result, aerosol optical depth (AOD) products retrieved from AMI are generally more stable than those from GEMS. Therefore, synergistic use of the GEMS and the AMI can be more effective than using a single instrument to obtain both aerosol loading and absorption data. Furthermore, a wide range of wavelength from UV to visible is covered by using both GEMS and AMI. This study presents sensitivity analyses and preliminary results of a synergistic retrieval algorithm for aerosol spectral absorption properties using synergistic observations from GEMS and AMI. The algorithm incorporates a Transformer-based deep learning model for radiative transfer (RT) calculations. By replacing the traditional line-by-line RT code with a deep learning model, the algorithm enables real-time RT calculations embedded within the retrieval process. This online RT calculation approach enhances the flexibility of the aerosol retrieval algorithm and reduces errors that arise from look-up table interpolation. The developed algorithm can work on other GEO-ring missions such as GeoXO, TEMPO, ABI, Sentinel-4, and FCI.

How to cite: Kim, M., Kim, J., Go, S., Cho, Y., Kim, M., Chong, H., Cha, H., Chai, Y., and Park, S. S.: A Synergistic GEO Satellite Algorithm for UV–VIS Spectral Aerosol Absorption Retrieval, EGU General Assembly 2026, Vienna, Austria, 3–8 May 2026, EGU26-8558, https://doi.org/10.5194/egusphere-egu26-8558, 2026.

Accurate quantification of tropospheric nitrogen dioxide (NO₂) at high spatial resolution is crucial for monitoring air pollution emissions and validating the environmental satellites, including the GEMS (Geostationary Environment Monitoring Spectrometer). In this study, we present the retrieval and analysis of high-resolution NO₂ Vertical Column Densities (VCDs) using airborne hyperspectral observations from the EMSA (Environmental Monitoring Spectrometer for Aircraft) over Yeosu’s industrial complexes in Korea

To ensure retrieval accuracy, Level 1B spectra were first generated through precise radiometric calibration, spectral calibration, and geometric (INR) correction. The NO₂ Slant Column Densities (SCDs) were retrieved using the QDOAS algorithm with an optimized spectral fitting window (420–460 nm) selected to minimize interference. These SCDs were subsequently converted to Vertical Column Densities (VCDs) using Air Mass Factors (AMFs) calculated by the VLIDORT radiative transfer model, incorporating aerosol properties and surface albedo data.

Finally, the airborne NO₂ VCDs were compared with coincident GEMS measurements. The preliminary analysis reveals a consistent spatial distribution between the high-resolution airborne data and satellite observations, particularly in capturing point-source emissions. This study demonstrates that EMSA observations effectively resolve local emission sources unresolved by satellites, serving as a valuable reference dataset for validating GEMS Level 2 products. Detailed validation statistics, including correlation analysis with GEMS, will be presented.

How to cite: Choi, H.: Retrieval of High-Resolution Tropospheric NO₂ VCDs from Airborne EMSA Observations over the Industrial Areas in Yeosu, Korea, EGU General Assembly 2026, Vienna, Austria, 3–8 May 2026, EGU26-8802, https://doi.org/10.5194/egusphere-egu26-8802, 2026.

EGU26-9195 | Orals | AS3.33

Intercomparison of aerosol layer height between geostationary and polar orbiting satellites 

Martin de Graaf, J. Pepijn Veefkind, Maarten Sneep, and Mark ter Linden

Aerosol Layer Height (ALH) is an important parameter for climate studies, air quality monitoring, aviation safety near volcanos and remote sensing of trace gases. The ALH is rapidly becoming available from many new sources, such as polar orbiting satellites like TROPOMI, EarthCARE, Sentinel-3 and 5, and geostationary instruments around the globe, such as GEMS, TEMPO and Sentinel-4. These instruments provide many opportunities, covering a large range of spatial and temporal scales, that are further strengthened by a number of regional lidar networks around the globe, like the Latin American Lidar Network (LALINET), the Asian dust and aerosol lidar observation network (AN-Net), Micro-Pulse Lidar Network (MPLNET) and the European Aerosol Research Lidar Network (EARLINET). The above-mentioned geostationary instruments have the unique capability of providing the temporal variation of ALH and other parameters during the day over a large area, and lidar stations and other ground-based layer height providing instruments can be used to compare and validate the hourly retrievals and their temporal variation. However, the instruments are not overlapping and so cannot be compared directly. Comparison between geostationary instruments must be performed by polar orbiting satellites covering the field of views of geostationary instruments, preferably by satellites with different local overpass times, to cover as much as possible the temporal variation over the day. 

The validation of the various ALH products suffers from a number of issues, next to instrument calibration most notably different measurement techniques, like e.g. oxygen absorption spectroscopy, polarization techniques, stereo photogrammetry or active sensing, and the spatial and temporal coverage of satellite instruments. Here, we provide an overview of the issues and opportunities that are available for ALH comparison and validation from the polar orbiting satellites Sentinel-5p and EarthCARE. Intercomparisons between ATLID average extinction profiles (like a weighted or effective extinction height) and ALH from TROPOMI, GEMS and Sentinel-3 will be shown, to illustrate the possibilities for validation of TEMPO, S4 and S5, and the possibility to intercompare these various geostationary satellites. It will demonstrate the issues that arise from different layer height definitions that exist between the instruments, and that cause problems especially when the extinction profiles become complicated (like e.g. in the case of multiple vertical layers). 
Theoretical treatment of the aerosol layer height problem will be combined with examples of ATLID extinction profiles, showing well-defined and less well-defined layer heights and their associated problems for ALH retrievals. 

How to cite: de Graaf, M., Veefkind, J. P., Sneep, M., and ter Linden, M.: Intercomparison of aerosol layer height between geostationary and polar orbiting satellites, EGU General Assembly 2026, Vienna, Austria, 3–8 May 2026, EGU26-9195, https://doi.org/10.5194/egusphere-egu26-9195, 2026.

EGU26-9573 | ECS | Posters on site | AS3.33

Update of GEMS AEH algorithm V2.1 to V3.0 based on O4 VCD correction 

Seungjae Lee, Minseok Kim, and Sang Seo Park

Optical path length reaching to satellite sensor is affected by changes of aerosol layer altitude. Based on this principle, Aerosol Effective Height (AEH) from the GEMS is retrieved by using the O4 Slant Column Density (SCD) variation. AEH retrieval algorithm is being improved up to V3.0. This algorithm uses a Look-up Table (LUT) to convert O4 SCD, which is calculated directly from GEMS L1C data, into AEH. O4 SCD is retrieved by DOAS fitting and AEH is inversely estimated by comparing O4 SCD, aerosol properties, and geometry to LUT.

In this study, we discuss changes resulting from the update of AEH algorithm V2.1 to V3.0. This update is mainly about correcting atmospheric profile, which is based on the US Standard Atmosphere. O4 Vertical Column Density (VCD) shows seasonal and spatial differences and temperature-dependent (Choi et al., 2019). Using variable O4 VCD can be suitable for realistic atmospheric condition. O4 VCD can be derived from surface pressure, temperature, and relative humidity (Beirle et al., 2022). We corrected the O4 VCD by applying the ratio of monthly mean temperature and pressure from ECMWF ERA5 from 2019 to 2023 relative to the US Standard value.

After update, AEH decreased in India and Southeast Asia, while it slightly increased in Northeastern China and Korea. Compared to TROPOMI Aerosol Layer Height (ALH), March 2021, the bias decreased by approximately 0.5 km compared to V2.1. Although algorithm update results retrievals in stable range, there are changes in retrieval coverage and regional differences. Therefore, further research is required to investigate these regional differences.

How to cite: Lee, S., Kim, M., and Park, S. S.: Update of GEMS AEH algorithm V2.1 to V3.0 based on O4 VCD correction, EGU General Assembly 2026, Vienna, Austria, 3–8 May 2026, EGU26-9573, https://doi.org/10.5194/egusphere-egu26-9573, 2026.

EGU26-10427 | Orals | AS3.33

Hourly observations of HONO and NO2 in fire plumes as detected by GEMS and TEMPO 

Nicolas Theys, Hyeji Cha, Isabelle De Smedt, Huan Yu, Jonas Vlietinck, Thomas Danckaert, Jhoon Kim, and Michel Van Roozendael

Nitrous acid (HONO) is a key atmospheric species primarily due to its role as a source of OH through its rapid photolysis. OH is the atmosphere’s primary oxidant: it plays a central role in breaking down pollutants and greenhouse gases, and at the same time, it is a key ingredient to photochemical smog and ozone formation. Despite recent scientific progress, the emission budget and formation mechanisms of HONO are poorly constrained and consequently the impact of HONO emissions on tropospheric chemistry remains uncertain although it is believed to be important.

With the advent of high-spatial resolution hyperspectral space sensors, it becomes possible to detect short-lived species as HONO from large emission sources such as fires. This has been demonstrated on the global scale using the Sentinel-5 Precursor/TROPOMI instrument. Hourly observations from geostationary instruments, like GEMS and TEMPO, with a similar or even better spatial resolution than TROPOMI, opens new possibilities in terms of research and algorithmic developments. Understanding the time evolution of HONO emissions and conversion into NOx and how this relates to the fire activity and plume composition is particularly interesting.

Here, we present our progress in improving and interpreting HONO space-based data. We focus not only on HONO but also on the retrieval of NO2 in the same spectral range as HONO, using an innovative algorithm (CO-DOAS). The objective is to estimate the enhancement ratio of HONO to NO2 andstudy its relation to the fire intensity both in space and time. We also assess the consistency of GEMS and TEMPO HONO (and HONO/NO2) results with TROPOMI observations.Finally, we briefly discuss the possibility of new HONO observations from future satellite platforms.

How to cite: Theys, N., Cha, H., De Smedt, I., Yu, H., Vlietinck, J., Danckaert, T., Kim, J., and Van Roozendael, M.: Hourly observations of HONO and NO2 in fire plumes as detected by GEMS and TEMPO, EGU General Assembly 2026, Vienna, Austria, 3–8 May 2026, EGU26-10427, https://doi.org/10.5194/egusphere-egu26-10427, 2026.

EGU26-13240 | ECS | Posters on site | AS3.33

The Impact of 3D Cloud Radiative Effect on Trace Gas Retrievals: Bridging the Gap from Low Earth Orbit to Geostationary Missions 

Yu-Wen Chen, Sebastian Schmidt, Hong Chen, and Steven Massie

The three-dimensional (3D) cloud radiative effect, specifically radiance contributions via horizontal photon transport from neighboring clouds that operational algorithms cannot capture, is a significant source of structural uncertainty in trace gas retrievals from Low Earth Orbit (LEO) sensors like TROPOspheric Monitoring Instrument (TROPOMI) and Orbiting Carbon Observatory-2 (OCO-2). Our previous studies have shown that these biases are dependent on Solar Zenith Angle (SZA) due to elongated optical paths at high angles. This dependence presents a critical challenge for the new generation of geostationary (GEO) satellites, specifically the Geostationary Environment Monitoring Spectrometer (GEMS) and Tropospheric Emissions: Monitoring of Pollution (TEMPO). While LEO instruments typically favor low SZA overpasses to maximize signal-to-noise ratios, GEO sensors observe the full diurnal evolution of trace gases. This necessitates measurements at high SZA (low sun elevation), where the 3D cloud effect becomes particularly pronounced.

Furthermore, GEMS and TEMPO deviate from the heritage O2 A-band (760 nm) pressure and cloud properties retrievals used by TROPOMI and OCO-2, instead relying on O2-O2 dimer absorption at 477 nm. This shift introduces distinct radiative transfer challenges, as O2-O2 absorption scales with the square of pressure due to its collisional nature and exhibits different sensitivities to aerosol layering. This study analyzes the 3D cloud radiative effect specific to GEO viewing geometry and gas retrieval products utilizing O2-O2 bands. Specifically, we evaluate the potential for artificial diurnal bias in retrieved NO2 caused by the interplay of changing solar geometry and the 3D cloud effect, and we assess the effectiveness of current Air Mass Factor (AMF) correction strategies for the O2-O2 based retrieval algorithm in the vicinity of clouds.

How to cite: Chen, Y.-W., Schmidt, S., Chen, H., and Massie, S.: The Impact of 3D Cloud Radiative Effect on Trace Gas Retrievals: Bridging the Gap from Low Earth Orbit to Geostationary Missions, EGU General Assembly 2026, Vienna, Austria, 3–8 May 2026, EGU26-13240, https://doi.org/10.5194/egusphere-egu26-13240, 2026.

EGU26-13626 | Orals | AS3.33

The PEGASOS project: Evaluation of Geo-Ring data with LEO and ground based measurements 

Ronny Lutz, Diego Loyola, and Timon Hummel and the PEGASOS team

The PEGASOS project (Product Evaluation of GEMS L2 via Assessment with Sentinel-5P and other Sensors) provides comparisons for GEO L2 data with measurements from LEO instruments and ground-based networks. The main focus is on the evaluation of the operational GEMS and TEMPO L2 data products total Ozone, tropospheric and stratospheric NO2, as well as cloud- and aerosol parameters like cloud fraction, cloud pressure, aerosol index and aerosol layer height. For the evaluation of those GEMS and TEMPO L2 products, comparisons with space-borne instruments rely mainly on TROPOMI/S5P and GOME-2/MetOP-BC, and on ground-based measurements/networks like Dobson, Brewer, Max-DOAS etc.
In this contribution we provide an overview of the current PEGASOS project status and we summarize the activities performed so far for evaluating the GEMS and TEMPO L2 data products mentioned above. The ESA-funded PEGASOS project is coordinated by the German Aerospace Center (DLR) and the consortium is completed by the Aristotle University of Thessaloniki (AUTH), the Royal Belgian Institute for Space Aeronomy (BIRA-IASB), and the Institute for Environmental Physics of the University of Bremen (IUP-UB).

How to cite: Lutz, R., Loyola, D., and Hummel, T. and the PEGASOS team: The PEGASOS project: Evaluation of Geo-Ring data with LEO and ground based measurements, EGU General Assembly 2026, Vienna, Austria, 3–8 May 2026, EGU26-13626, https://doi.org/10.5194/egusphere-egu26-13626, 2026.

EGU26-13754 | ECS | Posters on site | AS3.33

Improved NO2 column retrievals for geostationary satellites: application to GEMS and TEMPO 

Sora Seo, Klaus-Peter Heue, Leonardo Alvarado, Ronny Lutz, and Diego Loyola

Satellite-based remote sensing has significantly advanced our understanding of global tropospheric nitrogen dioxide (NO2) over recent decades. Complementing the daily global observations from low-earth-orbiting (LEO) satellites, new geostationary (GEO) missions offer high temporal resolution with multiple observations per day, enabling detailed monitoring of diurnal NO2 variability driven by emission patterns and complex atmospheric chemistry. The emerging "Geo-Ring" constellation, comprising GEMS (Asia), TEMPO (North America), and Sentinel-4 (Europe), establishes a powerful framework for regional-to-continental air quality monitoring.

In this study, we address key challenges in NO2 retrievals from GEO satellite observations by proposing two primary methodological improvements: (1) advanced NO2 slant column retrievals, and (2) refined stratospheric correction techniques. An improved NO2 retrieval algorithm is applied to GEMS and TEMPO data. First, we conduct round-robin tests of NO2 slant column retrievals using three different approaches: classical Differential Optical Absorption Spectroscopy (DOAS), Covariance-based DOAS, and a hybrid method combining physics-based retrievals with machine learning. These advanced approaches specifically address issues related to de-striping and retrieval accuracy in inhomogeneous scenes, which is critical for GEO sensors that often lack continuous coverage of clean background regions. For the stratosphere-troposphere separation, challenges specific to GEO sensors, arising from restricted clean reference areas and pronounced diurnal variability, are investigated using two methods: an advanced reference sector approach and stratospheric NO2 estimates derived from CAMS forecast model data.

The improved GEO NO2 retrieval algorithm applied to GEMS and TEMPO observations is evaluated through comparisons with current operational product (GEMS v4.0.1 and TEMPO v4.0) as well as LEO satellite data from TROPOMI and GOME-2. The results demonstrate that the enhanced GEO retrieval algorithm effectively addresses challenges associated with high temporal sampling and the limited availability of clean background sectors, leading to improved retrieval accuracy and reduced uncertainties. These improvements strengthen the consistency between GEO and LEO NO2 products and enhance the interpretation of pollution evolution and diurnal air quality variability.

How to cite: Seo, S., Heue, K.-P., Alvarado, L., Lutz, R., and Loyola, D.: Improved NO2 column retrievals for geostationary satellites: application to GEMS and TEMPO, EGU General Assembly 2026, Vienna, Austria, 3–8 May 2026, EGU26-13754, https://doi.org/10.5194/egusphere-egu26-13754, 2026.

EGU26-14289 | Orals | AS3.33

High-Frequency Nitrogen Dioxide Observations over Snow-Covered Surfaces from TEMPO and Ground-Based Measurements 

Debora Griffin, Xiaoyi Zhao, Chris McLinden, Nofel Yazdani, Caroline Nowlan, Gonzalo Gonzalez Abad, Vitali Fioletov, Elisabeth Galarneau, Cris Mihele, Sumi Wren, and Yushan Su

In this presentation TEMPO NO2 observations are evaluated with a focus on snow-covered surfaces. Its ability to capture sharp spatial and temporal gradients in NO2 vertical column densities (VCDs) and surface concentrations are assessed, which are key parameters for assessing air quality and public health impacts. Data from the 2024 Study of Winter Air Pollution in Toronto (SWAPIT), including in situ and mobile MAX-DOAS measurements, are used to assess TEMPO’s precision and accuracy. Additional evaluations are performed at Pandora sites across North America to examine wintertime performance. Comparisons show strong correlations between TEMPO and surface observations, with significant improvements in bias after applying corrections to air mass factors, cloud fraction, and surface albedo (from -32% to -9% over snow). 

How to cite: Griffin, D., Zhao, X., McLinden, C., Yazdani, N., Nowlan, C., Gonzalez Abad, G., Fioletov, V., Galarneau, E., Mihele, C., Wren, S., and Su, Y.: High-Frequency Nitrogen Dioxide Observations over Snow-Covered Surfaces from TEMPO and Ground-Based Measurements, EGU General Assembly 2026, Vienna, Austria, 3–8 May 2026, EGU26-14289, https://doi.org/10.5194/egusphere-egu26-14289, 2026.

EGU26-14436 | ECS | Orals | AS3.33

Seasonal and weekday-dependent diurnal variability of NOx emissions and lifetimes from hourly GEMS NO2 observations  

Kezia Lange, Andreas Richter, John P. Burrows, Hartmut Bösch, Si-Wan Kim, and Seunghwan Seo

Tropospheric nitrogen dioxide (NO2) is a key indicator of nitrogen oxide (NOx) emissions and atmospheric chemical processes.  Tropospheric NO2 columns retrieved from instruments in low Earth orbit (LEO), such as OMI and TROPOMI, have been extensively used to investigate the spatial and temporal variability of NOx emissions. However, they typically have only one overpass per day and location, with the availability of data being further reduced due to the presence of clouds. The new geostationary instruments, GEMS, TEMPO, and Sentinel-4, enable the observation of atmospheric trace gases with hourly temporal resolution. The Geostationary Environmental Monitoring Spectrometer (GEMS), launched in February 2020, is the longest-operating and provides hourly daytime observations of NO2 with a spatial resolution of 3.5 x 8 km2 over a large part of Asia.

In this study, four years of GEMS IUP-UB tropospheric NO2 column data have been analyzed to investigate the seasonal and weekday-dependent diurnal variability of NOx emissions and lifetime for several emission sources within the GEMS domain. The resulting hourly emission and lifetime estimates are used to assess emission inventories and atmospheric models. For some emission sources, such as Seoul, seasonal emissions differ in magnitude and diurnal pattern, whereas other locations, such as Singapore, show almost no seasonal variation and small diurnal variation. Weekday-to-weekend differences are analyzed on an hourly basis, revealing a clear weekend effect, with small diurnal differences for most analyzed emission sources. Hourly emission profiles used in emission inventories and air quality models are compared with the GEMS-based emission estimates, providing observational constraints on the representation of diurnal NOx emissions in current atmospheric chemistry models. GEMS-based hourly lifetime estimates are compared to WRF-Chem model results.

How to cite: Lange, K., Richter, A., Burrows, J. P., Bösch, H., Kim, S.-W., and Seo, S.: Seasonal and weekday-dependent diurnal variability of NOx emissions and lifetimes from hourly GEMS NO2 observations , EGU General Assembly 2026, Vienna, Austria, 3–8 May 2026, EGU26-14436, https://doi.org/10.5194/egusphere-egu26-14436, 2026.

EGU26-15077 | Posters on site | AS3.33

Evaluating NOAA’s Unified Forecast System with TEMPO Trace Gas and Aerosol Products 

Brian McDonald, Maggie Bruckner, Congmeng Lyu, Siyuan Wang, Jian He, Rebecca Schwantes, Owen Cooper, Li Zhang, Jordan Schnell, Ravan Ahmadov, Vaishali Naik, Larry Horrowitz, Barry Baker, Cory Martin, Fanglin Yang, Hai Zhang, Fangjun Li, Maryam Abdioskouei, and Jerome Barre

The Unified Forecast System with Chemistry (UFS-Chem) model is currently being developed at NOAA to provide research-to-operations capability for atmospheric composition applications. Using UFS-Chem, we perform modeling simulations during the Atmospheric Emissions and Reactions Observed from Megacities to Marine Areas (AEROMMA) 2023 airborne field campaign. During the campaign, Canadian wildfire smoke significantly degraded air quality in the Upper Midwest and Northeast US, including high ozone anomalies. Simulations are at the global scale, and include full gas-chemistry (from the GFDL AM4.1 model) connected with GOCART aerosols at relatively coarse resolution (1 degree vs 1 degree). Wildfire emissions are from the Blended Global Biomass Burning Emissions Product (GBBEPx), which is fire radiative power (FRP) based, and modified with emission coefficients constrained to FIREX-AQ field campaign observations. We evaluate the advection and transport of smoke with retrievals from the Tropospheric Emissions: Monitoring of Pollution (TEMPO) satellite instrument, including for nitrogen dioxide (NO2), formaldehyde (HCHO), aerosol optical depth (AOD), and aerosol layer height (ALH). TEMPO satellite operators are utilized from and/or developed for the Joint Effort for Data assimilation Integration (JEDI). We also evaluate NO2/HCHO and NO2/AOD as a diagnostic for flaming versus smoldering emissions, a key determinant in the chemical speciation of smoke. Preliminary evaluation of UFS-Chem with TEMPO NO2 suggests that the primary emissions of flaming smoke may be off between oxidized (e.g., NOx) and reduced nitrogen species (e.g., NH3). Lastly, we also perform higher-resolution global simulations (25 km x 25 km) of the soon to be operationally implemented Global Chemistry and Aerosol Forecast System (GCAFS) version 1. These simulations do not include gas-phase chemistry, and are used to assess the impact of spatial-resolution on plume-rise and advection of smoke with TEMPO aerosol products. In addition to geostationary satellite products, evaluations are made with ground-based observations, and airborne AEROMMA measurements to assess the skill of UFS-Chem and GCAFS.

How to cite: McDonald, B., Bruckner, M., Lyu, C., Wang, S., He, J., Schwantes, R., Cooper, O., Zhang, L., Schnell, J., Ahmadov, R., Naik, V., Horrowitz, L., Baker, B., Martin, C., Yang, F., Zhang, H., Li, F., Abdioskouei, M., and Barre, J.: Evaluating NOAA’s Unified Forecast System with TEMPO Trace Gas and Aerosol Products, EGU General Assembly 2026, Vienna, Austria, 3–8 May 2026, EGU26-15077, https://doi.org/10.5194/egusphere-egu26-15077, 2026.

EGU26-15703 | Orals | AS3.33

Airborne field campaigns in the geostationary satellite era in North America: Results from AEROMMA and AiRMAPS 

Steven Brown, Wyndom Chace, Nell Schafer, Nathan Malarich, Sunil Baidar, Xinrong Ren, Carsten Warneke, and Caroline Womack

Since the launch of TEMPO in 2023, the NOAA Office of Oceanic and Atmospheric Research (OAR) has conducted airborne field campaigns with support from the NOAA National Environmental and Satellite Data Information Service (NESDIS). The 2023 AEROMMA (Atmospheric Emissions and Reactivity Observed from Megacities to Marine Areas) campaign surveyed major urban areas in North America, including Los Angeles, Chicago, Toronto, and New York, with the heavily instrumented NASA DC-8. The 2024 and 2025 AiRMAPS (Airborne and Remote Sensing Multi Air Pollutant Surveys) campaigns surveyed urban areas of Denver, Salt Lake City, and Baltimore–Washington DC, in addition to oil and gas basins in Colorado, Utah, and the mid-Atlantic region of the U.S., with the NOAA Twin Otter and ground-based mobile laboratories.

Here, we present several results from these campaigns. In 2023, widespread smoke impacts from a record-breaking Canadian wildfire season coincided with AEROMMA, providing extensive in-situ observations of smoke, ozone, and its precursors. Vertically-resolved measurements from research flights in Chicago provided constraints on the influence of these fires on urban ozone. The 2024 Utah Summer Ozone Study measured ozone and its precursors in Salt Lake City from a mobile laboratory and the NOAA Twin Otter. Photochemical box modeling and radiative transfer modeling in both cities quantified the effects of ozone transport, local photochemistry, and aerosol shading. These results add to a growing database to quantify the fire influence on ozone in North American cities. Surveys of urban areas and oil and gas basins using a novel airborne Doppler lidar mass balance method have provided new emissions quantification for methane, nitrogen oxides, and other trace gases. These determinations can be compared to emissions estimates from satellite and airborne remote sensing to cross-validate these methods.

How to cite: Brown, S., Chace, W., Schafer, N., Malarich, N., Baidar, S., Ren, X., Warneke, C., and Womack, C.: Airborne field campaigns in the geostationary satellite era in North America: Results from AEROMMA and AiRMAPS, EGU General Assembly 2026, Vienna, Austria, 3–8 May 2026, EGU26-15703, https://doi.org/10.5194/egusphere-egu26-15703, 2026.

EGU26-15783 | Posters on site | AS3.33

5-year Operation of Geostationary Environmental Monitoring Spectrometer (GEMS) for Atmospheric Composition Observation in Asia in High Spatio-temporal Resolution 

Jhoon Kim, Hye-Jung Shin, Myoung Hwan Ahn, Rokjin Park, Hanlim Lee, Jae-Hwan Kim, Yong-Sang Choi, Kyung Soo Han, Chang-Keun Song, Si-Wan Kim, Dongwon Lee, Won-Jin Lee, Hyunkee Hong, Yuha Kim, Kyung-Jung Moon, Dai Ho Ko, Seung-Hoon Lee, Minseok Kim, Yujin Chai, and Zhao-Cheng Zeng and the GEMS science Team

Satellite remote sensing has played a key role in understanding distribution and changes of atmospheric composition including aerosols, ozone, air pollutants, and greenhouse gases. These contributions have been achieved extensively with Low Earth Orbit (LEO) satellite instruments providing one to two observations per day, including but not limited to MODIS, VIIRS, OMI, TROPOMI, GAOFEN, and so on.


Geostationary Environment Monitoring Spectrometer (GEMS) was launched in February, 2020 as the first component of GEO-Ring for atmospheric composition observation from geostationary Earth orbit. GEMS observation is complemented by AMI and GOCI-2 on the same spacecraft for aerosols, and hyperspectral instruments such as Chinese GIIRS. NASA’s TEMPO was launched in 2023 over North America and ESA’s Sentinel 4 UVN was launched in 2025 over Europe, to establish the GEO ring of Air Quality observation. GEMS has provided hourly observation of key air quality components, including aerosol, ozone, and their precursors such as NO2, HCHO, SO2 etc. In this talk, achievements of GEMS observations to monitor atmospheric composition of aerosol and gases from GEMS are presented with algorithm updates and validation results. Achievements and related issues with GEMS observations are discussed for further improvements and harmonization of dataset for the GEO-RING.

How to cite: Kim, J., Shin, H.-J., Ahn, M. H., Park, R., Lee, H., Kim, J.-H., Choi, Y.-S., Han, K. S., Song, C.-K., Kim, S.-W., Lee, D., Lee, W.-J., Hong, H., Kim, Y., Moon, K.-J., Ko, D. H., Lee, S.-H., Kim, M., Chai, Y., and Zeng, Z.-C. and the GEMS science Team: 5-year Operation of Geostationary Environmental Monitoring Spectrometer (GEMS) for Atmospheric Composition Observation in Asia in High Spatio-temporal Resolution, EGU General Assembly 2026, Vienna, Austria, 3–8 May 2026, EGU26-15783, https://doi.org/10.5194/egusphere-egu26-15783, 2026.

EGU26-17200 | Posters on site | AS3.33

Total ozone from LEO and GEO: ground-based validation and mutual consistency 

Tijl Verhoelst, Katerina Garane, Klaus-Peter Heue, Dimitris Balis, Steven Compernolle, Arno Keppens, Jean-Christopher Lambert, Hyunjin Lee, Xiong Liu, Diego Loyola, Ronny Lutz, Junsung Park, Jeroen van Gent, Matteo Alparone, Angelika Dehn, Timon Hummel, and Claus Zehner

The recent launches of Sentinel-4 on MTG-S and Sentinel-5 on EPS-SG-A1 significantly strengthen the Copernicus contribution to the international constellation of low-Earth orbiting (LEO) and geostationary (GEO) satellites dedicated to atmospheric ozone and air quality monitoring. Together with the already operational Sentinel-5P LEO and GEMS (East Asia) and TEMPO (North America) GEO missions, these nadir sounders form an unprecedented observing system coordinated to ensure complementary spatial and temporal sampling and long-term commitment. As a prerequisite to a truly integrated exploitation of this constellation, the present contribution reports on two complementary ozone data validation activities undertaken to build confidence in their traceability to community-agreed standards and in the mutual consistency across missions.

As a first step, we summarize the global, in-depth, and recurrent validation of Sentinel-5P TROPOMI total ozone column data, conducted by the ESA/Copernicus Atmospheric Mission Performance Cluster (ATM-MPC). The ATM-MPC validation service assesses TROPOMI’s traceability to the well-established ground-based Brewer, Dobson, and ZSL-DOAS measurements contributing to WMO’s Global Atmosphere Watch (GAW) and the Network for the Detection of Atmospheric Composition Change (NDACC), and to measurements from the more recent Pandonia Global Network (PGN). The permanent QA/QC of TROPOMI demonstrates the value of this mission as the initial reference sounder for the constellation. As a second step, we present pioneering regional validation and evaluation results for the GEO missions GEMS and TEMPO performed within ESA’s PEGASOS project. This latter activity integrates independent ground-based validation and the use of TROPOMI data as a LEO transfer standard for cross-mission consistency assessment.

The ATM-MPC results confirm the high quality of TROPOMI total ozone observations, characterized by low bias, small random uncertainty, and temporal stability meeting community requirements, both with respect to ground-based reference measurements and relative to the historical benchmark provided by the Aura OMI mission. Building on these resources – both the ground-based validation infrastructure and TROPOMI as well characterized and accurate measurement system-  we assess the quality of the total ozone products from GEMS and TEMPO. The analysis demonstrates overall good data quality across both GEO missions, while also identifying dependences of bias and dispersion on measurement parameters and influence quantities. These findings highlight specific areas where further algorithm refinements may enhance consistency and performance within the emerging global GEO–LEO ozone observing system.

We would like to acknowledge explicitly the long-term dedication of all the ground-based instrument teams (WMO-GAW, NDACC, PGN) to acquire high quality data and make them available to the satellite community. 

How to cite: Verhoelst, T., Garane, K., Heue, K.-P., Balis, D., Compernolle, S., Keppens, A., Lambert, J.-C., Lee, H., Liu, X., Loyola, D., Lutz, R., Park, J., van Gent, J., Alparone, M., Dehn, A., Hummel, T., and Zehner, C.: Total ozone from LEO and GEO: ground-based validation and mutual consistency, EGU General Assembly 2026, Vienna, Austria, 3–8 May 2026, EGU26-17200, https://doi.org/10.5194/egusphere-egu26-17200, 2026.

EGU26-18537 | ECS | Posters on site | AS3.33

Geostationary observations of air pollutants from biomass burning: a synergy of GIIRS and GEMS over Southeast Asia 

Shan Han, Zhao-Cheng Zeng, Mengya Sheng, Jhoon Kim, Isamu Morino, and Voltaire Velazco

Biomass burning (BB) significantly disturbs ecosystems and threatens regional and global climate, air quality, and human health through the massive emission of pollutants. Carbon monoxide (CO) and nitrogen dioxide (NO2) generated from these fires are key components in atmospheric chemistry, revealing combustion processes and efficiency. Over the past two decades, low-Earth-orbit (LEO) platforms have played a dominant role in trace gas monitoring; however, their snapshot sampling capabilities are unable to capture the rapid diurnal evolution of fire emissions, leading to systematic uncertainties in emission inventories. In this study, we integrate observations from the Geostationary Interferometric Infrared Sounder (GIIRS) onboard FY-4B and the Geostationary Environment Monitoring Spectrometer (GEMS) onboard GK-2B to monitor biomass burning over Southeast Asia. Validation against TROPOMI and ground-based networks (TCCON and Pandora) demonstrates the reliability of this combined dataset.  Time-series analysis (July 2022–June 2025) shows that regional CO and NO2 variations exhibit high consistency with fire radiative power (FRP). Focusing on the representative fire hotspot of Northern Laos, we observe a bimodal diurnal NO2 pattern driven by the interplay of emissions, photochemistry, and meteorology. Specifically, we identified a nonlinear response of NO2 growth to fire intensity. Observational evidence suggests that under extreme burning conditions, the conversion of NOx is constrained by limited atmospheric oxidative capacity. We further quantified the intraday dynamics of combustion efficiency (indicated by the enhancement ratio, ER = ΔNO2/ΔCO), revealing significant temporal fluctuations. This pronounced diurnal variability confirms that single-overpass LEO observations introduce a systematic estimation bias in emission factors. This study provides observational constraints for refining emission inventories and demonstrates a framework for applying next-generation global geostationary satellite constellations to fire monitoring.

How to cite: Han, S., Zeng, Z.-C., Sheng, M., Kim, J., Morino, I., and Velazco, V.: Geostationary observations of air pollutants from biomass burning: a synergy of GIIRS and GEMS over Southeast Asia, EGU General Assembly 2026, Vienna, Austria, 3–8 May 2026, EGU26-18537, https://doi.org/10.5194/egusphere-egu26-18537, 2026.

EGU26-18679 | Posters on site | AS3.33

In-flight calibration and validation for Level 1 Products of GEMS 

Yeeun Lee, Myoung-Hwan Ahn, Mina Kang, Jeonghyun Seo, Junha Lee, Hyunkee Hong, Changseok Lee, Jaehoon Jeong, Dai Ho Ko, and Jhoon Kim

The GEO-ring constellation of atmospheric composition missions was established to deliver continuous, diurnally resolved observations of trace gases and aerosols at regional scales. Since the launch of GK2B in 2020, the constellation has expanded to include TEMPO in 2023 and Sentinel-4 in 2025, with additional missions planned. This growing number of operating sensors emphasizes the need for cross-mission consistency and long-term radiometric stability across the GEO-ring framework.

As the first GEO-ring sensor, the Geostationary Environment Monitoring Spectrometer (GEMS) onboard GK-2B has been operating for more than five years under harsh space environmental conditions. Over this period, the optical and electronic components of the sensor have experienced degradation of up to 30%, particularly at shorter wavelengths around 300 nm. Given that this sensor has undergone the longest period of degradation, its characterization and correction provide a valuable basis for other GEO-ring sensors with similar instrumental characteristics. In this regard, this study presents post-launch calibration and evaluation methodologies for GEMS with a focus on Level 1 products, including solar irradiance and Earth reflectance. Calibration updates address long-term degradation along with angular dependence and systematic biases of the onboard solar diffuser.

For validation of the updates, GEMS is inter-calibrated with both geostationary and low Earth orbit sensors, including the Advanced Meteorological Imager (AMI) onboard the twin satellite GK2A, as well as the Tropospheric Monitoring Instrument (TROPOMI) and Ozone Mapping and Profiler Suite (OMPS). Each reference instrument provides unique strengths in spatial, spectral, and temporal coverage, enabling a comprehensive assessment of GEMS performance. The validation results indicate that the updated GEMS reflectance exhibits spectral biases within 5%, except at wavelengths below 320 nm, where straylight effects dominate.

These results demonstrate that the applied calibration and inter-calibration strategies effectively improve the radiometric consistency of GEMS Level 1 products. Building on these approaches, this work highlights the importance of in-flight calibration of Level 1 products for accurate Level 2 retrievals and long-term GEO-ring consistency.

How to cite: Lee, Y., Ahn, M.-H., Kang, M., Seo, J., Lee, J., Hong, H., Lee, C., Jeong, J., Ko, D. H., and Kim, J.: In-flight calibration and validation for Level 1 Products of GEMS, EGU General Assembly 2026, Vienna, Austria, 3–8 May 2026, EGU26-18679, https://doi.org/10.5194/egusphere-egu26-18679, 2026.

EGU26-18872 | Posters on site | AS3.33

Update Plan for GEMS Total Column Ozone: L1C irradiance and Cloud Parameter Improvements 

Hyunjin Lee, Jae-Hwan Kim, Juseon Bak, and Sungjae Hong

The Geostationary Environment Monitoring Spectrometer (GEMS) onboard the GEO-KOMPSAT-2B satellite provides high spatiotemporal resolution observations of various atmospheric constituents over East Asia, including ozone, its precursors (NO2, HCHO), SO2, and aerosols. The GEMS total ozone retrieval algorithm (O3T), based on the TOMS Version 9 look-up table approach, was recently updated to Version 2.2 in December 2024. However, the current GEMS total ozone product has shown a systematic underestimation compared to other satellite observations, such as TROPOMI and OMI, as well as ground-based measurements, mainly due to limitations in the Level 1C (L1C) irradiance data.

To address these issues, we evaluate the O3T algorithm using two types of updated L1C datasets: one applying only the bidirectional transmittance distribution function (BTDF) correction (A1), and another applying both the BTDF and degradation corrections (A2). The results show that the use of both A1 and A2 substantially reduces the underestimation of total ozone, with particularly pronounced improvements at high ozone levels. Furthermore, when using A2, the retrieved total ozone exhibits improved long-term stability. Using these improved GEMS total ozone products, we analyze the characteristics and variability of total ozone over East Asia. In addition, we investigate the impact of cloud information, another critical input to the O3T algorithm, on the total ozone retrieval. These results enhance the reliability of GEMS ozone retrievals and provide a foundation for further algorithm optimization.

How to cite: Lee, H., Kim, J.-H., Bak, J., and Hong, S.: Update Plan for GEMS Total Column Ozone: L1C irradiance and Cloud Parameter Improvements, EGU General Assembly 2026, Vienna, Austria, 3–8 May 2026, EGU26-18872, https://doi.org/10.5194/egusphere-egu26-18872, 2026.

EGU26-21706 | Posters on site | AS3.33

Tropospheric Formaldehyde Retrievals from GEMS within the GEO-RING Project 

Isabelle De Smedt, Nicolas Theys, Huan Yu, Steven Compernolle, Gaia Pinardi, Corinne Vigouroux, Gitaek Lee, Rokjin Park, Jhoon Kim, and Michel Van Roozendael

Formaldehyde (HCHO) is a short-lived product of volatile organic compound oxidation and a key precursor of tropospheric ozone, making it an essential proxy for surface emissions and air quality. Until recently, global HCHO monitoring relied on low-Earth-orbit (LEO) sensors, providing limited temporal coverage. The advent of geostationary UV–visible spectrometers such as GEMS, TEMPO, and Sentinel-4 now enables continuous daytime observations with high spatial and temporal resolution respectively over Asia, North America and Europe.

Within the GEO-RING project, we evaluate the GEMS operational HCHO product and explore methods to improve retrieval accuracy. Performance is assessed against ground-based networks (PGN Pandora, NDACC FTIR and MAX-DOAS) and LEO sensors (TROPOMI, GOME2-B,C), focusing on intermediate quantities such as slant columns that determine the information content from the instrument. To enhance the DOAS inversion, we test two approaches: (1) pseudo-cross-sections derived from principal component analysis of fit residuals, and (2) a CODOAS approach exploiting the covariance of the fit residuals. These methods are designed to be applicable consistently across GEMS, TEMPO, and Sentinel-4 to mitigate instrumental artifacts and scene inhomogeneity.

We also revisit background correction and air mass factor calculations for GEO observations, ensuring compatibility with LEO-based HCHO climate data records (ESA CCI). Finally, GEMS data are analysed to characterise diurnal variability over selected regions and compared with combined morning and afternoon LEO observations, demonstrating the added value of GEO sensors for future long-term atmospheric composition monitoring.

How to cite: De Smedt, I., Theys, N., Yu, H., Compernolle, S., Pinardi, G., Vigouroux, C., Lee, G., Park, R., Kim, J., and Van Roozendael, M.: Tropospheric Formaldehyde Retrievals from GEMS within the GEO-RING Project, EGU General Assembly 2026, Vienna, Austria, 3–8 May 2026, EGU26-21706, https://doi.org/10.5194/egusphere-egu26-21706, 2026.

EGU26-22384 | Orals | AS3.33

Europe's new atmospheric chemistry missions in space: The Path to Operations of Copernicus Sentinel-4/UVN and Sentinel-5/UVNS. 

Rasmus Lindstrot, Sebastian Garcia, Frank Rüthrich, Miriam Keppler, Nan Hao, Philipp Köhler, Christopher Diekmann, Vinod Kumar, Myojeong Gu, Malcolm Taberner, Catherine Hayer, Alexandre Caseiro, Yang Wang, Gabriele Poli, Rosemary Munro, Grandell Grandell, and Bojan Bojkov

The Copernicus Sentinel-4/UVN and Sentinel-5/UVNS imaging spectrometers, hosted on EUMETSAT’s Meteosat Third Generation - Sounder (MTG-S) and EUMETSAT Polar System - Second Generation A (EPS-SG A) satellites, are in space since the summer of 2025. Sentinel-4/UVN is designed to monitor atmospheric trace gases - such as ozone, nitrogen dioxide, sulphur dioxide, formaldehyde and glyoxal - as well as aerosol and cloud properties from hyperspectral measurements in the UV, Visible and Near-Infrared (UVN). Observing from a geostationary orbit, it provides high spatial resolution and hourly coverage over Europe and northern Africa. Sentinel-5/UVNS has a similar scope but additionally covers spectral bands in the Shortwave-Infrared and therefore allows measuring additional species, such as carbon monoxide and methane. Flying in a polar orbit, it provides high spatial resolution and near-daily global coverage. Both instruments provide essential data for tracking atmospheric composition and support the Copernicus Atmosphere Monitoring Service (CAMS). The innovative instruments are completing the European contribution to the constellation of geostationary and polar orbiting atmospheric composition missions, including the existing geostationary GEMS and TEMPO over Asia and North America, respectively, as well as the fleet of Low Earth Orbit air quality missions operating in similar spectral ranges, such as GOME-2, OMI, TROPOMI and OMPS. This presentation will cover the mission status during the ongoing commissioning and Cal/Val activities, including insights into level-2 product status. 

How to cite: Lindstrot, R., Garcia, S., Rüthrich, F., Keppler, M., Hao, N., Köhler, P., Diekmann, C., Kumar, V., Gu, M., Taberner, M., Hayer, C., Caseiro, A., Wang, Y., Poli, G., Munro, R., Grandell, G., and Bojkov, B.: Europe's new atmospheric chemistry missions in space: The Path to Operations of Copernicus Sentinel-4/UVN and Sentinel-5/UVNS., EGU General Assembly 2026, Vienna, Austria, 3–8 May 2026, EGU26-22384, https://doi.org/10.5194/egusphere-egu26-22384, 2026.

EGU26-22766 | Posters on site | AS3.33

TEMPO at Night 

James Carr, Heesung Chong, Xiong Liu, John C. Houck, Virginia Kalb, Zhuosen Wang, Houria Madani, Daniel T. Lindsey, Steven D. Miller, Sergey V. Marchenko, Zhixin Xue, Jun Wang, Dong L. Wu, David E. Flittner, and Kelly Chance

The NASA Tropospheric Emissions: Monitoring of Pollution (TEMPO) instrument is
hosted on a commercial geostationary satellite at 91°W longitude. TEMPO is an
imaging spectrometer covering Greater North America (CONUS and parts of Canada,
Mexico, and the Caribbean including Puerto Rico). The primary mission of TEMPO is
retrieval of trace-gas concentrations from the spectra of reflected sunlight. TEMPO has
an ultraviolet (290 nm – 490 nm) and a visible (540 nm – 740 nm) band with spectra
that have 0.6 nm spectral resolution and 0.2 nm spectral sampling. Direct sunlight into
or close to the aperture of TEMPO represents a potential hazard to its spectrometer. At
night, when sun safety constraints allow the aperture to be open, TEMPO can see city
lights, gas flares, maritime lights, moonlit clouds, aurorae, and nightglow without taking
time away from its primary mission. These nighttime uses had not been envisioned
when TEMPO was first proposed. This paper shows some early results from TEMPO at
night, including clearest-sky composites similar to VIIRS Day-Night Band (DNB) “Black
Marble” mosaics, classifications of city lights by their spectral signatures with radiance
by lighting type, moonlit cloud images, gas flare and wildfire pyrometry, lightning,
maritime lights, aurorae, and nightglow. Level-1 nighttime data from TEMPO are
available from the NASA Atmospheric Science Data Center (ASDC) as the “twilight”
radiance product (RADT). These data are now released in Version 4. They require no
post-processing and are easier to use than Version 3. The Version 4 RADT products
contain background-subtracted radiances that are registered to VIIRS-DNB and include
collocated DNB radiances.

How to cite: Carr, J., Chong, H., Liu, X., Houck, J. C., Kalb, V., Wang, Z., Madani, H., Lindsey, D. T., Miller, S. D., Marchenko, S. V., Xue, Z., Wang, J., Wu, D. L., Flittner, D. E., and Chance, K.: TEMPO at Night, EGU General Assembly 2026, Vienna, Austria, 3–8 May 2026, EGU26-22766, https://doi.org/10.5194/egusphere-egu26-22766, 2026.

We present a status overview of the TEMPO mission including its operation, validation and
status of baseline data products and recent algorithm improvements, development of Near-Real-
Time (NRT) and other research data products, science and application highlights.
TEMPO is the North America component of the geostationary (GEO) air quality constellation
along with GEMS over Asia and Sentinel-4 over Europe. It is the first spaceborne instrument
providing hourly daytime air pollution over North America at neighborhood scale (~10 km 2 at
boresight). It uses UV/visible spectroscopy to measure key elements of tropospheric air pollution
chemistry including O 3 , NO 2 , HCHO and aerosols, and capture the inherent high variability in the
diurnal cycle of emissions and chemistry. At night, TEMPO can observe city lights, gas flaring,
maritime lights, clouds and snow in the moonlight, lightning, aurorae, and nightglow without
interfering with its primary daytime air quality mission. After the successful launch of TEMPO
on board IS-40E into the GEO orbit at 91W in April 2023, it conducted its first light
observations in early Aug. 2023 and started its nominal operation in Oct. 2023, kicking off a new
era of air quality monitoring from space over North America. It finished its 20-month of baseline
Phase E in June 2025. The baseline mission has been extended to Sep. 2026, with further
extension via a NASA senior review in early 2026. Baseline V3 data products were released to
the public in May 2024 from NASA’s ASDC. A significantly improved V4 data products were
released to the public in early Sep. 2025, including the first public release of the ozone profile
product. TEMPO NRT data products with data latency of 2-3 hours and other science quality
data products were funded by NASA Satellite Needs Working Group (SNWG) to assist in air
quality forecasting and modeling efforts and develop better pollution control strategies. NRT
products (V2, based on baseline V4) were also released to the public for the first time in early
Sep. 2025. Many other research data products have been produced by the science community and
TEMPO data products have been widely used by the user community including nearly 700 early
adopters.

How to cite: Liu, X.: A New Era of Air Quality Monitoring from Space over North America with TEMPO:Mission Status from Early Years in Orbit, EGU General Assembly 2026, Vienna, Austria, 3–8 May 2026, EGU26-23278, https://doi.org/10.5194/egusphere-egu26-23278, 2026.

EGU26-854 | ECS | Posters on site | AS3.34

Vertical Structure Matters: Improving Urban PM2.5 Assessment Using Lidar at Background and Traffic-Influenced Sites 

Irina Rogozovsky, Albert Ansmann, Holgar Baars, Julian Hofer, and Alexandra Chudnovsky

Understanding particulate pollution in Eastern Mediterranean (EM) cities is challenging due to the combined influence of local urban emissions, marine aerosols, and long-range transported desert dust. Conventional surface-based measurements often fail to detect lofted dust layers, while satellite-derived Aerosol Optical Depth (AOD) provides only column-integrated information, limiting its ability to represent near-surface PM2.5 (fine particulate matter 2.5 micrometres or less in diameter) concentrations.  Here, we combine five years of ground-based lidar observations with high resolution satellite AOD retrievals, PM2.5 measurements and meteorological data over the EM to investigate aerosol layering, source contributions, and column-to-surface relationships across three contrasting urban environments: regional background, urban traffic and semi-indoor sites located along highway/railroad. Lidar profiling identifies ten distinct aerosol layering types, from shallow anthropogenic layers to deep mixed structures composed of desert dust, marine aerosols, and urban pollution. We find that the AOD-PM2.5 relationship is strongly regime-dependent, and the degree of column-surface coupling varies sharply across the three urban environments. Machine-learning models that incorporate vertical lidar features significantly improve PM2.5 predictions across all sites, outperforming models without vertical information. Overall, our results demonstrate that reliable urban PM2.5 assessment requires explicit consideration of vertical aerosol structure. Integrating lidar-derived features enhances the interpretation of satellite AOD and improves urban exposure estimates in complex EM atmospheres.

How to cite: Rogozovsky, I., Ansmann, A., Baars, H., Hofer, J., and Chudnovsky, A.: Vertical Structure Matters: Improving Urban PM2.5 Assessment Using Lidar at Background and Traffic-Influenced Sites, EGU General Assembly 2026, Vienna, Austria, 3–8 May 2026, EGU26-854, https://doi.org/10.5194/egusphere-egu26-854, 2026.

EGU26-1881 | Orals | AS3.34

High-temporal resolution measurements of radiocarbon in atmospheric CO2 for source sector attribution of urban emissions 

Joachim Mohn, Patrick Siegwolf, Andrew R. Whitehill, Stephan Henne, Samuel Hammer, Lukas Wacker, Lukas Emmenegger, and Béla Tuzson

Urban areas dominate anthropogenic CO2 emissions and play a key role in climate change mitigation. Efficient emissions reduction requires improved knowledge of the attribution of carbon emissions. Measuring the 14C (radiocarbon) content of atmospheric CO2 is the most direct method to distinguish fossil CO2 emissions (ffCO2) from biogenic and natural fluxes, due to their lack of 14CO2 content. Hence, CO2 produced from the combustion of fossil fuels causes a measurable decrease in the atmospheric 14CO2/CO2 isotope ratio. Results from flask sampling campaigns indicate the potential of high time resolution 14C measurements to attribute flux estimates using urban-scale inversions.

We present a novel analytical platform for autonomous and semi-continuous analysis of Δ14C-CO2 in atmospheric air samples with sub-hourly time resolution. The core of the analytics is based on a saturated-absorption cavity ring-down (C14-SCAR) spectrometer (ppqSense). This is coupled to a custom-developed compact quantum cascade laser absorption spectrometer (C13-QCLAS) to provide CO2 purity and δ13CO2. The C14-SCAR and C13-QCLAS share an automated pre-concentration device (NC Technologies), to purify CO2 from air applying a temperature-swing zeolite adsorbent trap and remove N2O interferences. We showcase performance characteristics of the coupled C14-SCAR / C13-QCLAS system for sensitive, i.e. ppm-level detection of fossil CO2 contributions in urban environments, and present first time series data for a monitoring site in the vicinity of Zürich (Dübendorf). Results will be discussed in conjunction with city-wide observations of CO2 and high-resolution simulations of ffCO2 variability.

This work is supported by the SNSF project RADIANCE (206021_220392) and part of the projects 24GRD03 MetHIR and 24GRD06 MetCTG.

How to cite: Mohn, J., Siegwolf, P., Whitehill, A. R., Henne, S., Hammer, S., Wacker, L., Emmenegger, L., and Tuzson, B.: High-temporal resolution measurements of radiocarbon in atmospheric CO2 for source sector attribution of urban emissions, EGU General Assembly 2026, Vienna, Austria, 3–8 May 2026, EGU26-1881, https://doi.org/10.5194/egusphere-egu26-1881, 2026.

EGU26-2213 | Posters on site | AS3.34

Multiscale Analysis of Air Quality in New York City 

Prathap Ramamurthy, Nathan Hosannah, Wenge Ni-Meister, and Naresh Devineni

Dense urban areas experience poor air quality due to increased anthropogenic emissions and complex urban morphology that restricts ventilation. While our general understanding of urban air pollution has improved considerably through advances in numerical modeling and sensor platforms, our insights into neighborhood-to-building-scale pollution remain insufficient. Most current forecasting models do not account for urban climate processes, and traditional in-situ observations do not capture street-level variability in primary pollutants. Here, we investigate the street- and neighborhood-scale dynamics of air pollution in New York City, using both mobile and in situ observations. We used a backpack fitted with research-grade instruments to monitor particulate matter (PM2.5) and ozone. In-situ observations from multiple public air quality networks were also included in our analysis. Our results show a high degree of uniformity in street-level ozone concentrations in NYC, whereas particulate matter concentrations varied significantly. On days impacted by synoptic disturbances, both ozone and particulate matter concentrations were nearly uniform throughout the city. The fixed ground stations adequately captured the median PM2.5 concentration. However, they missed the extremes, which were, in some cases, two to five times the median value. The observations were also used to validate an urbanized WRF-Chem model and satellite-derived measurements. The numerical simulations conducted at 4km X 4km resolution performed better than the current forecast model in predicting both PM2.5 and ozone concentration. The model accounted for the impacts of the urban heat island effect and local sea breeze flows on air pollutants. The model particularly captured the ozone dynamics accurately.

How to cite: Ramamurthy, P., Hosannah, N., Ni-Meister, W., and Devineni, N.: Multiscale Analysis of Air Quality in New York City, EGU General Assembly 2026, Vienna, Austria, 3–8 May 2026, EGU26-2213, https://doi.org/10.5194/egusphere-egu26-2213, 2026.

Major metropolitan areas are critical carbon emission hotspots, and understanding their carbon dynamics is essential for developing targeted climate mitigation strategies. Remote background stations often capture spatially smoothed anthropogenic signals, failing to resolve distinct urban source–sink processes. Here, we leveraged the unique 632-m Shanghai Tower (121.51°E, 31.23°N) to conduct a nearly 2-yr field campaign (April 2021–March 2023), aiming to investigate CO2 and CO dynamic from the top of urban canopy layer (UCL) via stationary, continuous, single-level, high-precision, in-situ measurements with a cavity ringdown laser spectrometer. Campaign-averaged mole fractions substantially exceeded global and regional backgrounds, confirming a pronounced urban carbon burden. Through a multi-stage filtering framework targeting nocturnal measurements, we derived robust regional background values. Component analysis of CO2 excess, using CO as a reliable regional combustion tracer, revealed burning of fossil fuels as the dominant contributor (avg. 85%), alongside biogenic processes that enhanced this atmospheric excess, especially in winter under respiratory predominance, but less so in summer when partially offset by net photosynthetic uptake and cleaner airmass dilution. The 2022 Shanghai lockdown provided a natural experiment that underscored the pronounced sensitivity of UCL-top observations to metropolitan-scale anthropogenic perturbations, as reflected in synchronized decline and rapid rebound of CO2 and CO, along with a marked reversal of their emission ratio compared to 2021. Overall, these findings affirm that UCL-top observations effectively capture integrated metropolitan carbon signals, supporting refined emission tracking and top-down carbon neutrality strategies.

How to cite: Fu, S. and Fang, S.: Observational Insights into Atmospheric CO2 and CO at the Urban Canopy Layer Top in Metropolitan Shanghai, China, EGU General Assembly 2026, Vienna, Austria, 3–8 May 2026, EGU26-2658, https://doi.org/10.5194/egusphere-egu26-2658, 2026.

Cities are major sources of both air pollutants and greenhouse gases due to dense energy consumption, traffic, industry, and residential heating. Fossil fuel carbon dioxide (CO2) is frequently co-emitted with nitrogen oxides (NOx), linking urban air quality degradation with climate forcing. However, monitoring urban CO2 emissions remains challenging because fixed ground stations provide sparse coverage, while bottom-up inventories often lack the temporal responsiveness needed to capture rapid socioeconomic and policy-driven changes. These limitations are particularly critical for cities, where emission patterns are highly heterogeneous in space and time.

Here we present a satellite-based framework to constrain urban and regional fossil fuel CO2 emissions across China from 2019 to 2024 by exploiting the co-emission relationship between NOx and CO2. The approach integrates tropospheric NO2 vertical column densities observed by the TROPOspheric Monitoring Instrument (TROPOMI) with simulations from the GEOS-Chem chemical transport model. Anthropogenic NOx emissions are first optimized using a finite-difference mass balance inversion, which links observed NO2 enhancements to emission perturbations at high spatial resolution. The optimized NOx fields are then translated into fossil fuel CO2 emissions using dynamically derived CO2/NOx ratios from bottom-up inventories, allowing indirect yet spatially explicit constraints on urban CO2 emissions.

Our results reveal that China’s fossil fuel CO2 emissions remained broadly stable over 2019–2024, with pronounced spatial contrasts between urban agglomerations and less developed regions. Persistent emission hotspots are identified over major metropolitan clusters, including the Beijing–Tianjin–Hebei region, the Yangtze River Delta, the Pearl River Delta, and the Fenwei Plain, underscoring the dominant role of cities in national carbon budgets. Despite overall stability at the national scale, many large urban regions exhibit discernible declines in emissions, consistent with strengthened air pollution control policies and structural energy transitions. In contrast, energy-intensive provinces outside the major city clusters continue to show increasing trends, highlighting emerging risks of regional “high-carbon lock-in”. Comparisons with widely used inventories such as EDGAR, MEIC, and Carbon Monitor indicate that the satellite-constrained estimates more effectively capture abrupt emission changes associated with events such as the COVID-19 pandemic and subsequent economic recovery.

Overall, this study demonstrates that satellite-derived NO2 observations provide a powerful, observation-driven pathway to monitor urban fossil fuel CO2 emissions at high spatial and temporal resolution. By bridging air quality and greenhouse gas perspectives, the framework offers new opportunities to evaluate the climate co-benefits of urban air pollution policies, support city-scale carbon budgeting, and improve the transparency of emission monitoring in rapidly evolving urban environments.

How to cite: Mao, Y. and Jiang, F.: Urban-scale constraints on fossil fuel CO2 emissions from satellite-inferred NO2: implications for air quality–climate co-benefits in Chinese cities (2019–2024), EGU General Assembly 2026, Vienna, Austria, 3–8 May 2026, EGU26-2761, https://doi.org/10.5194/egusphere-egu26-2761, 2026.

EGU26-3677 | ECS | Posters on site | AS3.34

Evaluating the effects of urban morphology and emissions on urban air quality using a CFD model 

Jung-Eun Kang, Dong-Ju Kim, Minjoong J. Kim, Sang-Hyun Lee, Wonsik Choi, and Jae‒Jin Kim

This study investigates how urban morphology and pollutant emissions influence near-surface meteorology and the spatial distributions of CO, NO2, O3, and PM2.5 in Songdo, Incheon, Republic of Korea. We use a fine-scale air quality modeling framework that couples computational fluid dynamics with atmospheric chemistry, driven by mesoscale meteorological and chemical fields and high-resolution emissions developed using a top-down approach. Model performance is evaluated against meteorological observations and multi-site air quality measurements within the study area. To examine the determinants of spatial variability, the domain is divided into subzones and statistical analyses are applied to relate simulated surface concentrations to emissions and building morphology parameters, including building surface fraction and occlusivity. Surface concentrations show the strongest associations with emissions for CO, NO2, and O3, whereas occlusivity exhibits the strongest association with PM2.5. Notably, systematic concentration differences are observed even under comparable emission levels, highlighting the influence of morphology on ventilation and near-surface pollutant accumulation. The findings suggest that preserving wind corridors and allocating open spaces, particularly in high-rise districts, can enhance ventilation and reduce pollutant buildup. This work supports urban planning and air quality management and provides a basis for future exposure and environmental health analyses.

How to cite: Kang, J.-E., Kim, D.-J., Kim, M. J., Lee, S.-H., Choi, W., and Kim, J.: Evaluating the effects of urban morphology and emissions on urban air quality using a CFD model, EGU General Assembly 2026, Vienna, Austria, 3–8 May 2026, EGU26-3677, https://doi.org/10.5194/egusphere-egu26-3677, 2026.

EGU26-3731 | ECS | Orals | AS3.34

Mapping the Heterogeneity of NOx Emission Reductions across Chinese cities from 2018 to 2025 

Sijie Wang, Jintai Lin, Hao Kong, and Yuhang Zhang

The reduction of nitrogen oxides (NOx = NO + NO2) emissions is crucial for air pollution control. Since 2011, China has experienced its most intensive and effective period of reducing NOx emissions. Many previous studies have focused on emission trends, but they often lag by several years due to the lack of reliable and timely data. Leveraging the advantages of satellite-based NO2 observations, this study uses tropospheric NO2 vertical column densities (NO2 TVCD) at 0.05° × 0.05° horizontal resolution from POMINO-TROPOMI products and employs a top-down emission inversion method (PHLET). The PHLET is a two-dimensional model that describes the quantitative relationship between NOx emissions and NO2 TVCD over a period, influenced by horizontal transport and nonlinear chemical processes. Then we estimate annual anthropogenic NOx emissions at 0.05° × 0.05° for China from 2018 to 2025. First, it reveals that national anthropogenic NOx emissions exhibit a declining trend, with the rate of decline slowing after 2020. Specifically, this trend is reflected at the provincial level, with 12 out of 31 provincial-level administrative regions showing similar declining trends and meeting their reduction targets in 2025. Second, most cities meeting reduction targets are distributed in North China and East China, while South China, Southwest China, and Northwest China still hold significant reduction potential. Third, the derived NOx emissions show great consistency with ground-based surface NO2 concentration measurements in most cities. In a few cities, discrepancies between emissions and observed concentrations stem from insufficient spatial representativeness of monitoring stations. Moreover, we further validated this conclusion through an atmospheric chemistry transport model (GEOS-Chem) simulation against ground-based measurements.

How to cite: Wang, S., Lin, J., Kong, H., and Zhang, Y.: Mapping the Heterogeneity of NOx Emission Reductions across Chinese cities from 2018 to 2025, EGU General Assembly 2026, Vienna, Austria, 3–8 May 2026, EGU26-3731, https://doi.org/10.5194/egusphere-egu26-3731, 2026.

Despite concerted efforts in emission control, air pollution control remains challenging. Urban planning has emerged as a crucial strategy for mitigating PM2.5 pollution. What remains unclear is the impact of urban form and its interactions with seasonal changes. In this study, based on the air quality monitoring stations in the Yangtze River Delta urban agglomeration, the relationship between urban spatial indicators (building morphology and land use) and PM2.5 concentrations was investigated using full subset regression and variance partitioning analysis, and seasonal differences were further analysed. Our findings reveal that PM2.5 pollution exhibits different sensitivities to spatial scales, with higher sensitivity to the local microclimate formed by the three-dimensional structure of buildings at the local scale, while land use exerts greater influence at larger scales. Specifically, land use indicators contributed substantially more to the PM2.5 prediction model as the buffer zone expanded (from an average of 2.41% at 100 m range to 47.30% at 5000 m range), whereas building morphology indicators displayed an inverse trend (from an average of 13.84% at 100 m range to 1.88% at 5000 m range). These results underscore the importance of considering building morphology in local-scale urban planning, where the increasing building height can significantly enhance the dispersion of PM2.5 pollution. Conversely, large-scale urban planning should prioritize the mixed use of green spaces and construction lands to mitigate PM2.5 pollution. Moreover, the significant seasonal differences in the relationship between urban spatial indicators and PM2.5 pollution were observed. Particularly noteworthy is the heightened association between forest, water indicators, and PM2.5 concentrations in summer, indicating the urban forests may facilitate the formation of volatile compounds, exacerbating the PM2.5 pollution. Our study provides a theoretical basis for addressing scale-related challenges in urban spatial planning, thereby fostering the sustainable development of cities.

How to cite: Jin, X.: Impact of urban space on PM2.5 distribution: A multiscale and seasonal study in the Yangtze River Delta urban agglomeration, EGU General Assembly 2026, Vienna, Austria, 3–8 May 2026, EGU26-5508, https://doi.org/10.5194/egusphere-egu26-5508, 2026.

EGU26-5654 | ECS | Posters on site | AS3.34

Direct quantification of greenhouse gas emissions in a mid-sized German city  

Toprak Aslan and Mana Gharun

Urban areas account for approximately two-thirds of global anthropogenic carbon dioxide (CO₂) emissions. Direct greenhouse gas flux measurements provide the basis for quantifying city emissions and developing effective mitigation strategies. Eddy covariance (EC) is a direct, continuous monitoring method for capturing net surface fluxes of CO2 (and other greenhouse gases) at a high temporal resolution (30 min). Despite the methodological potential, only a few urban locations worldwide currently estimate greenhouse gas fluxes with the EC method.

In this study we established two EC systems in the city of Münster in northwest Germany. Münster is a midsized city (about 300,000 in habitants), known for its extensive cycling culture and green urban character. Often called the bicycle capital of Germany, Münster combines urban life with abundant parks, green spaces, and a high modal share of bicycle traffic. Since May 2025, continuous 30-min observations of CO2 and energy fluxes are being collected in two locations, combining a rooftop (33m above the ground) EC system sampling a heterogeneous urban footprint with complementary near-surface (2.4m above the ground) measurements over unmanaged urban grassland and impervious surfaces. This coordinated observational design enables investigation of how different urban surface types contribute to the integrated city-scale CO2 exchange and provides a robust basis for long-term carbon-cycle monitoring.

In addition, the observational framework is complemented by process-based urban land-surface modeling using the Surface Urban Energy and Water Balance Scheme (SUEWS), which enables a bottom-up representation of urban energy and CO2 exchange. In combination with the multi-site EC measurements, SUEWS will support interpretation of seasonal and diurnal variability and provide a first-order partitioning of biogenic and anthropogenic contributions at the neighborhood scale.

How to cite: Aslan, T. and Gharun, M.: Direct quantification of greenhouse gas emissions in a mid-sized German city , EGU General Assembly 2026, Vienna, Austria, 3–8 May 2026, EGU26-5654, https://doi.org/10.5194/egusphere-egu26-5654, 2026.

EGU26-6781 | Posters on site | AS3.34

Impact of transition of heating types and traffic on urban CO2 emissions – long-term interannual and seasonal analysis of two flux towers in the city of Basel, Switzerland 

Christian Feigenwinter, Armin Sigmund, Robert Spirig, Stavros Stagakis, Roland Vogt, and Markus Kalberer

In this study, long-term data from two flux eddy-covariance flux towers (since 2004 and 2009, respectively) in the city centre of Basel, Switzerland, which are only 1.6 km apart from each other, are analysed with focus on the source strengths of CO2 emissions in the flux footprints of the towers. The wind field in the city of Basel is predominated by a valley wind system due to its location in the Rhine valley with a clear diurnal pattern of the wind flow, if not superimposed by a macroscale synoptic weather situation. For a detailed interpretation of the mean seasonal diurnal courses of CO2 fluxes, a distinct flux footprint analysis, combined with a detailed land cover map of the city, is applied. Land cover classes like “buildings” and “roads” are extended with attributes characterizing the source strength of CO2, i.e. the type of heating (oil, gas, district heating, etc.) and the traffic volumes, respectively, and these source strengths are weighted by the flux footprint. This framework allows a distinct interpretation of the observed seasonal and annual trends of the two flux towers. The long-term time series show different but, in both cases, declining trends in CO2 emissions. These trends can be mainly attributed to the extension of the district heating network by the city administration during the last 15 years. Traffic volume changes have also strong impact on the total amount of CO2 emissions, but, despite great efforts of the city administration to reduce the traffic in the city center, these measures have only minor impacts on the CO2 flux.

How to cite: Feigenwinter, C., Sigmund, A., Spirig, R., Stagakis, S., Vogt, R., and Kalberer, M.: Impact of transition of heating types and traffic on urban CO2 emissions – long-term interannual and seasonal analysis of two flux towers in the city of Basel, Switzerland, EGU General Assembly 2026, Vienna, Austria, 3–8 May 2026, EGU26-6781, https://doi.org/10.5194/egusphere-egu26-6781, 2026.

Ultrafine particles (UFP; diameter < 100 nm) in urban environments are emitted from fossil-fuel combustion, particularly vehicular emissions, whereas indoor emissions from cooking activities remain insufficiently characterized. This study examined indoor UFP exposure in 13 restaurants representing diverse cooking methods by measuring particle number concentrations (PNC) and mean particle diameter. On average, indoor PNC were 16.1 and 7.0 times higher than those in background and adjacent outdoor areas, respectively, while mean particle sizes were correspondingly smaller. The indoor-to-outdoor (I/O) ratio of mean PNC was 7.2 (±7.3), whereas that of mean particle size was 0.93 (±0.24), indicating direct emissions of smaller particles from cooking activities. Indoor PNC often approached or exceeded levels observed along major roadways with high heavy-duty diesel traffic. Variations in indoor PNC were governed not only by cooking characteristics but also by ventilation and microenvironmental factors, including room volume, cooking-source location, and the distance between cooking sources and seating areas. Closing windows or doors increased the indoor–outdoor PNC difference by a factor of 2.6 and the I/O ratio by 2.7, highlighting the importance of adequate ventilation.

A simplified respiratory deposition model estimated that 54.8% of inhaled indoor UFPs are deposited in the human respiratory tract, exceeding the factions estimated for background (45.2%) and adjacent outdoor (50.3%) environments. The alveolar deposition fraction averaged 39.4%, comparable to that in major roadways (42.8%). These findings suggest that long-term exposure to cooking-related UFPs in poorly ventilated environments may pose significant health risks and underscore the need for further characterization of their physical and chemical properties.

How to cite: Seo, S. and Choi, W.: Characterization of Indoor Ultrafine Particles from Various Cooking Activities and Their Respiratory Deposition Potential, EGU General Assembly 2026, Vienna, Austria, 3–8 May 2026, EGU26-8821, https://doi.org/10.5194/egusphere-egu26-8821, 2026.

EGU26-8943 | ECS | Orals | AS3.34

RAHES: Remote Assessment of Health Exposures and Environment in SG100K Study Using a Low-Cost Indoor Air Quality Monitoring System 

Mutian Ma, Xiaoxi Fu, Tomas Gonzales, Müller-Riemenschneider Falk, Jason Kai Wei Lee, Epaminondas Mastorakos, Ronita Bardhan, Mengze Li, and Soren Brage

Air pollution is a significant driver of adverse health outcomes, contributing to an estimated 6–7 million premature deaths in 2019. According to the World Health Organization (WHO), nearly half of these fatalities are attributed by indoor air pollution, including particulate matter (PM), a critical concern as populations spend the majority of their time indoors. Exposure to PM2.5 is positively associated with cardiovascular diseases, lung cancer, neurodegenerative conditions, and elevated oxidative stress in cells. Despite growing recognition of its health relevance, characterizing indoor air quality (IAQ) remains challenging due to building designs, ventilation systems, and human activity. Large-scale residential IAQ monitoring is limited, as indoor data are difficult to collect at scale. While low-cost sensors (LCS) offer a promising approach for improving spatial and temporal coverage, they face challenges related to inter-model variability and limited accuracy for gaseous pollutants such as NO, NO2 and O3.

Singapore is a complex urban city located at the southern tip of the Malay Peninsula. It is characterized by high population density, a major petrochemical complex, and one of the world’s busiest shipping ports and airports. Several previous studies have reported seasonal and spatial variability of black carbon (BC), brown carbon (BrC) and organic aerosols (OA). Our previous work using drone-based light absorption measurements reported elevated outdoor BC and BrC, near the 10th and 20th floors, respectively, compared to ground level. Notably, 77% of Singaporeans live in Housing and Development Board units. Of these buildings, 82% exceed 10 floors and 11% exceed 20 floors. As a result, vertical gradients in air pollution may have important implications for indoor exposure.

In this study, we explore feasibility of collecting IAQ data in the SG100K cohort. The cohort includes 100,000 participants with detailed clinical assessments and linkage to health records, allowing for a direct link between environmental exposure and health outcomes to be examined. This feasibility study consists of 200 participants, informing protocols for scaling up measurements in the SG100K cohort over 5 years. Each participant undergoes three months of continuous indoor measurements in their living room and bedroom. Our low-cost sensor system collects PM2.5, CO2, temperature, and humidity data remote. Data are supported by a proprietary remote data acquisition and quality-control pipeline. A subgroup of participants will also measure particle number concentration to explore the impacts of cooking and traffic emissions.

Preliminary indoor measurements indicate significant vertical variation in PM2.5 concentrations within the same building. Higher concentrations were consistently observed on the 11th floor (12.1±3.9 µg/m3) compared with the 5th and 7th floors (6.3±2.5 and 8.0±3.3 µg/m3, respectively). In addition, indoor PM concentrations do not always follow outdoor ground-level diurnal patterns, suggesting that indoor PM is influenced by indoor human activity, indoor–outdoor air exchange, filtration systems, transport, and secondary processes. Initial cross-sensor comparisons demonstrate consistent performance among individual devices. Further analysis will include a wider range of room types, locations, and floor heights. Data collected from RAHES will be synthesized with longitudinal health records to elucidate how the residential environment influences human behaviours and health outcomes.

How to cite: Ma, M., Fu, X., Gonzales, T., Falk, M.-R., Lee, J. K. W., Mastorakos, E., Bardhan, R., Li, M., and Brage, S.: RAHES: Remote Assessment of Health Exposures and Environment in SG100K Study Using a Low-Cost Indoor Air Quality Monitoring System, EGU General Assembly 2026, Vienna, Austria, 3–8 May 2026, EGU26-8943, https://doi.org/10.5194/egusphere-egu26-8943, 2026.

EGU26-9995 | ECS | Posters on site | AS3.34

Towards an Urban Network of Path Integrated Greenhouse Gas Measurements Using Dual-Comb Spectroscopy 

Moritz Sindram, Tobias D. Schmitt, Romain Dubroeucq, Siddhant Mukherjee, Lukas Pilz, Thomas Pfeifer, Markus K. Oberthaler, and André Butz

Urban areas globally are the major source regions of anthropogenic greenhouse gases [1]. To reduce city-scale uncertainties associated with bottom-up inventory-based emission estimates and to design and evaluate emission reduction measures, top-down emission estimates based on concentration measurements and transport modeling are necessary. Inferring these emissions from a number of in-situ concentration measurements comes with the challenge of limited measurement representativeness, uncertain knowledge of prior emissions, and uncertainties in transport modelling on very local scales. Path-integrated concentration measurements are representative of areas on the kilometer scale, and thus, they are less sensitive to very local processes and more representative of model grid scales. They therefore have the potential to improve measurement-based urban emission quantification in the future.

We measure path-integrated concentrations by sending light along kilometer-long air paths above the city of Heidelberg, Germany, to reflectors and spectroscopically analyze the returning signal. By fitting an absorption model to the spectra, we infer the CO2 concentrations along the respective paths. Our spectroscopic method of choice is Dual-Comb Spectroscopy (DCS) based on two interfering laser frequency combs. It allows measuring broadband spectra with high spectral resolution and signal-to-noise ratio.

We present the first nine months of concentration measurements of greenhouse gases along one path above the city of Heidelberg. We show first results from this deployment period and compare them to a co-deployed Fourier-transform spectrometer (FTIR) that has been continuously running since 2023 [2] and different in-situ sensors. We also report our current progress in expanding our setup into a network consisting of multiple light paths above the city, including modelling of expected concentration gradients, with the aim of inferring urban emissions.


References:
[1] Intergovernmental Panel on Climate Change (IPCC). (2021). Climate Change 2021: The Physical Science Basis. Working Group I Contribution to the Sixth Assessment Report of the Intergovernmental Panel on Climate Change [Masson-Delmotte, et al.]. Cambridge University Press. https://doi.org/10.1017/9781009157896

[2] Schmitt, T. D., et al. (2023). An open-path observatory for greenhouse gases based on near-infrared Fourier transform spectroscopy. Atmos. Meas. Tech., 16(24), 6097–6110. https://doi.org/10.5194/amt-16-6097-2023

How to cite: Sindram, M., Schmitt, T. D., Dubroeucq, R., Mukherjee, S., Pilz, L., Pfeifer, T., Oberthaler, M. K., and Butz, A.: Towards an Urban Network of Path Integrated Greenhouse Gas Measurements Using Dual-Comb Spectroscopy, EGU General Assembly 2026, Vienna, Austria, 3–8 May 2026, EGU26-9995, https://doi.org/10.5194/egusphere-egu26-9995, 2026.

Indoor concentrations of volatile organic compounds (VOCs), such as aromatic hydrocarbons, alkanes, and formaldehyde, are higher than outdoor levels. Exposure to these pollutants has raised ongoing concerns about their long-term health impacts. Assessing indoor air quality and associated health risks requires an in-depth understanding of human lifestyles and comprehensive analysis of VOCs. Key to this is identifying critical pollutants and establishing population exposure scenarios across different indoor environments. Hong Kong serves as a representative urban case study, with a population density of approximately 50,000 residents per square kilometer. This study collected air samples from various microenvironments in Hong Kong, including residences, activity centers, transportation settings, and outdoor areas. The concentrated VOCs were re-volatilized and injected into three gas chromatography systems for analysis, detecting 90 VOCs along with concentrations of carbon monoxide and carbon dioxide. The results revealed significant differences in VOC profiles across different environments: the main components of alkenes were isobutene, propene, isoprene, and ethylene; alkanes primarily consisted of ethane, isobutane, propane, and n-butane, with indoor concentrations of propane significantly higher than outdoor levels. This study conducted a risk assessment of indoor pollutants. The results showed that the cumulative carcinogenic risks for both children and adults exceeded acceptable limits. The cumulative hazard quotient for adults also surpassed safety thresholds in multiple exposure scenarios. These findings indicate that future VOC risk assessments must incorporate predicted compounds and scenario-specific exposure evaluation systems.

How to cite: Xu, Z. and Gu, D.: The Assessment of VOCs Health Risks for Various Indoor Living Scenarios in Hong Kong, EGU General Assembly 2026, Vienna, Austria, 3–8 May 2026, EGU26-10018, https://doi.org/10.5194/egusphere-egu26-10018, 2026.

EGU26-10276 | Orals | AS3.34

Emission and activity uncertainty limits source apportionment for PM2.5 mass in residences 

Simon P. O'Meara, David R. Shaw, Lia Chatzidiakou, Yunqi Shao, Matthew Thomas, Rachael W. Cheung, Rhys Constantine, Tiffany C. Yang, Rosemary R.C. McEachan, Jacqueline F. Hamilton, Gordon McFiggans, and Nicola Carslaw

Deterministic application of computational simulations of PM2.5 mass concentration in residences, informed by occupant diaries, allows evaluation of the uncertainty from emission rates and activity character. Uncertainty is generated by emission rates through varying methods to quantify rates of a given activity, whilst uncertainty is generated by activity character by the fact that participant surveys typically only ask for what activity is occurring, thereby omitting information on how it is occurring. Using the PyCHAM (CHemistry with Aerosol Microphysics in Python) box model alongside measurements for contrasting case studies from inhabited family homes in Bradford (UK), we show that these uncertainties are sufficiently great to undermine apportionment of key sources of PM2.5 in residences, motivating future work to reduce uncertainty.

How to cite: O'Meara, S. P., Shaw, D. R., Chatzidiakou, L., Shao, Y., Thomas, M., Cheung, R. W., Constantine, R., Yang, T. C., McEachan, R. R. C., Hamilton, J. F., McFiggans, G., and Carslaw, N.: Emission and activity uncertainty limits source apportionment for PM2.5 mass in residences, EGU General Assembly 2026, Vienna, Austria, 3–8 May 2026, EGU26-10276, https://doi.org/10.5194/egusphere-egu26-10276, 2026.

EGU26-10583 | Orals | AS3.34

UNICORN – UnIversity Network for CO2 in the Rhine–Neckar metropolitan area: implementation and first insights 

Andre Butz, Kenneth von Buenau, Marting Dermendzhiev, Tom Herrenknecht, Ralph Kleinschek, Marvin Knapp, Sebastian Leyer, Benedikt Löw, Christopher Lüken-Winkels, Robert Maiwald, Moritz Sindram, Tobias Schmitt, Tobbe Voss, and Sanam N. Vardag

Carbon dioxide (CO2) emissions from urban areas constitute the largest share of total anthropogenic emissions. At the same time, cities have positioned themselves as frontrunners in the implementation of emission reduction measures, driven by ambitious goals to achieve carbon neutrality within short timeframes. To design and evaluate such measures, localized CO2 measurement and modelling techniques are under development and demonstration deployments are underway in urban environments to estimate emissions, as well as their temporal evolution and trends, at high spatial and temporal resolution.

In the Rhine–Neckar region, encompassing the cities of Heidelberg and Mannheim in southwest Germany, we have established the UNICORN (UnIversity Network for CO2 in the Rhine–Neckar metropolitan area). The network consists of more than a dozen in-situ mid-cost CO2 sensors, a Fourier Transform Spectrometer (FTS) and a Dual Comb laser Spectrometer (DCS) for horizontal path measurements, a sun-viewing FTS with vertical column sensitivity and a CO2 camera for snapshot images of the local power plant. The in-situ nodes are based on the design developed by the University of California, Berkeley, for the BEACO2N (Berkeley Environmental Air-quality & CO2 Network) and equipped with ancillary air quality sensors measuring carbon monoxide, nitrogen oxides, ozone, and particulate matter. For estimating emission distributions from the observed concentration gradients, we employ the GRAMM–GRAL atmospheric model, which operates at a horizontal resolution of 10 m across the study domain.

Key challenges in establishing the UNICORN include optimal sensor placement, calibration of sensors under resource constraints, combining the various techniques under consideration of their sensitivity characteristics, effective use of ancillary meteorological and air quality data, robust estimation of background concentrations and their variability, and the derivation of emission distributions taking into account atmospheric transport and its uncertainties. Here, we report on our progress in addressing these challenges, showcasing the current UNICORN configuration and discussing lessons learned across the employed measurement and modelling techniques.

How to cite: Butz, A., von Buenau, K., Dermendzhiev, M., Herrenknecht, T., Kleinschek, R., Knapp, M., Leyer, S., Löw, B., Lüken-Winkels, C., Maiwald, R., Sindram, M., Schmitt, T., Voss, T., and Vardag, S. N.: UNICORN – UnIversity Network for CO2 in the Rhine–Neckar metropolitan area: implementation and first insights, EGU General Assembly 2026, Vienna, Austria, 3–8 May 2026, EGU26-10583, https://doi.org/10.5194/egusphere-egu26-10583, 2026.

EGU26-10633 | Orals | AS3.34 | Highlight

Observing urban greenhouse gas emissions – key results of the ICOS Cities project 

Werner Leo Kutsch and the ICOS Cities Team

Cities are at the heart of the climate challenge – and of the climate solutions. Responsible for a large share of fossil-fuel emissions, but also hubs of innovation and community engagement, they hold a unique position to accelerate the transition to climate neutrality.

While most cities recognize the need for climate action, effective policy implementation is often hampered by a lack of timely, reliable, and spatially detailed greenhouse gas (GHG) emission data. Traditional, statistic-based inventories frequently suffer from inconsistency, time lags, and missing local detail.

The ICOS Cities project (PAUL – Pilot Applications in Urban Landscapes), running from 2021 to 2025, was co-designed by scientists, policymakers, and local stakeholders to explore how techniques to quantify and partition CO2 emissions and emission reductions based of direct observations can improve informed climate action.

In three pilot cities, Paris, Munich, and Zurich, ICOS Cities brought together and evaluated the most innovative measurement approaches of greenhouse gas emissions in densely populated urban areas. State-of-the-art instrumentations were deployed and innovative combinations of measurements, modelling and inventories further developed.

The most important insight from the ICOS Cities project is that direct observations of GHG fluxes and concentrations combined with inverse modelling can severely support and improve inventories and general knowledge on greenhouse gas emissions from cities.

The presentation will present the key results of the project and give an outline how future services can be developed based on the project results.

How to cite: Kutsch, W. L. and the ICOS Cities Team: Observing urban greenhouse gas emissions – key results of the ICOS Cities project, EGU General Assembly 2026, Vienna, Austria, 3–8 May 2026, EGU26-10633, https://doi.org/10.5194/egusphere-egu26-10633, 2026.

EGU26-11284 | Posters on site | AS3.34

Indoor aerosol dynamics, composition, and pathway-specific biological responses in human bronchial epithelial cells (BEAS-2B) at Rome Fiumicino International Airport (OASIS Project) 

Massimo Santoro, Maria Pierdomenico, Laura Caiazzo, Lorenzo De Silvestri, Angelica Scamarcia, Costanza Messeri, Liudmila Dobriakova, Francesco Cuscito, Milena Stracquadanio, Teresa Maria Giovanna La Torretta, Ettore Petralia, Ilaria D’Elia, Giandomenico Pace, Fabio Spaziani, Marco Proposito, Maria Giuseppa Grollino, Antonio Piersanti, and Barbara Benassi

Indoor air pollution is a critical public health concern, with fine and ultrafine particulate matter inducing oxidative stress, inflammation, and xenobiotic responses in the respiratory system. The Optimizing Air Safety in Indoor Spaces (OASIS) project applies an innovative integrated framework combining biotag-based droplet mapping, real-time monitoring of indoor air pollutants and environmental parameters, with the direct exposure of air–liquid interface-grown human bronchial epithelial cells (BEAS-2B) using the portable Cultex®-RFS system. This multidisciplinary approach links aerosol dynamics, spatial dispersion, and event-driven air quality variations with pathway-specific cellular responses in a complex indoor environment selected for the campaign at Rome Fiumicino International Airport.
Aerosol characterization includes gravimetric mass concentration of airborne Particulate Matter (PM10, PM2.5 and PM1), particle number size distribution, and black carbon (BC), measured using PM samplers, Optical Particle Counters, and multi-wavelength aethalometer, respectively. Indoor micro-meteorological parameters including temperature, pressure and humidity, were measured using reliable off-the-shelf sensors integrated into a cloud- and edge-based IoT platform, enabling identification of event-related indoor air quality degradation and assessment of the impacts of routine actions, such as opening/closing a door or window.
To track the movement and dispersion of droplets within the indoor space, an advanced technique based on identifiable genomic sequences (Biotag) was applied to the monitored indoor space. This revealed localized hotspots of droplet persistence and concentration near the Cultex exposure module, aerosol instruments, heating, ventilation and air conditioning (HVAC) outlets, indicating that airflow patterns and instrument-induced turbulence strongly influence inhalation exposure.
The toxicological response was characterised in BEAS-2B cells undergoing 24h exposure to the monitored indoor environment (for a total of 15 exposures over the period May-December 2025), and assessed by quantitative real-time PCR of genes involved in oxidative stress  (HMOX1, NQO1, SOD1, SOD2, NFE2L2), xenobiotic response (AHR, CYP1A1, CYP1B1) and inflammation (IL-1β, IL-6, IL-8, IL-18, TNF-α, NLRP3). Pathway-specific biological indices were calculated as the mean standardized fold-change of genes within each pathway. Correlation analyses revealed PM size- and composition-dependent responses, with the xenobiotic response index positively associating with 0.25–0.50 µm particle number (Spearman ρ = 0.59, p = 0.024), PM2.5 mass (ρ = 0.66, p = 0.009), PM₁ mass (ρ = 0.61, p = 0.017), and black carbon (ρ = 0.57, p = 0.030). Oxidative stress and inflammatory indices exhibited more variable associations, suggesting preferential activation of xenobiotic pathways by fine, combustion-derived particles.
Overall, the OASIS project provides a comprehensive mechanistic understanding of indoor aerosol behaviour and related cellular responses, integrating aerosol dynamics, spatial dispersion and pathway-specific biological effects. The results show that indoor exposure patterns and biological responses are shaped not only by indoor sources and airflow regimes, but also by outdoor air pollution infiltrating the indoor environment, particularly fine and combustion-derived particles. These findings underscore the importance of integrated indoor–outdoor air quality monitoring and targeted mitigation strategies to protect occupational and public health in complex indoor environments, supporting timely, evidence-based interventions to promote healthier indoor conditions.

How to cite: Santoro, M., Pierdomenico, M., Caiazzo, L., De Silvestri, L., Scamarcia, A., Messeri, C., Dobriakova, L., Cuscito, F., Stracquadanio, M., La Torretta, T. M. G., Petralia, E., D’Elia, I., Pace, G., Spaziani, F., Proposito, M., Grollino, M. G., Piersanti, A., and Benassi, B.: Indoor aerosol dynamics, composition, and pathway-specific biological responses in human bronchial epithelial cells (BEAS-2B) at Rome Fiumicino International Airport (OASIS Project), EGU General Assembly 2026, Vienna, Austria, 3–8 May 2026, EGU26-11284, https://doi.org/10.5194/egusphere-egu26-11284, 2026.

EGU26-11301 | Orals | AS3.34

Characterizing Anthropogenic and Biogenic Sources of CO2 and CH4 in Houston, Texas, USA 

Bernhard Rappenglück and Irfan Karim

This study presents a comprehensive 2022 dataset of continuous in-situ measurements of δCO2 and CH4, δ¹³CO2 and δ¹³CH4 in Houston, Texas, USA complemented by targeted canister sampling to characterize key anthropogenic and biogenic emission sources. It also integrates ground-based in-situ measurements with satellite observations to characterize CO₂ and CH₄ emission hotspots in Houston, Texas.

Seasonal background variability reflects distinct biogeochemical processes: CO₂ declines from ~435 ppm in winter to ~410 ppm in summer due to photosynthetic uptake, while CH₄ decreases from ~2.02 to ~1.88 ppm primarily through OH oxidation. Regional contrasts are evident, with lower marine-influenced backgrounds (~410 ppm CO₂, ~1.85 ppm CH₄) compared to continental sectors (>435 ppm CO₂, >2.05 ppm CH₄).

Boundary-layer-height (BLH)-corrected enhancements reveal strong seasonal patterns in anthropogenic emissions. ΔCO₂ peaks in winter-fall (up to ~138 ppm hourly; ~20.6 ppm monthly) and drops to ~8.96 ppm in summer, while ΔCH₄ shows maxima in winter-spring (~5.45 ppm hourly; ~0.10 ppm monthly) and a summer minimum (~0.08 ppm). The 2022 mean ΔCH₄/ ΔCO₂ ratio (8.8 ppb/ppm) is ~14% higher than Philadelphia's in-situ winter value and ~35-40% above EDGAR v8.1 and EPA inventories, but broadly consistent with recent satellite-based estimates across U.S. cities.

Bivariate ΔCH₄/ ΔCO₂ mapping identifies major hotspots at McCarty, Blue Ridge, and Coastal Plains landfills (>40-60 ppb/ppm), which are underestimated or absent in inventories. Sharp enhancements at the Ship Channel and McCarty landfill align with satellite NO₂ and HCHO peaks, confirming these as multi-source hotspots. The BLH-corrected in-situ approach captures rapid emission events and diurnal variability, providing finer-scale source attribution and plume detection within the satellite sub-pixel domain that are missed by single overpasses.

Temporal analysis revealed distinct seasonal variability: δ¹³CO2 was most depleted in winter, reflecting enhanced combustion-related CO2, whereas δ¹³ CO2 showed the most negative values in summer and fall, consistent with intensified microbial methanogenesis under warm, humid conditions. Background δ¹³CO2 ranged from –11.8‰ to –13.2‰ depending on air mass origin, while δ¹³CH4 varied between –47.2‰ and –50.7‰, reflecting marine–continental transitions. Spatially, bivariate plots and isotopic mapping identified strong CH₄ enhancements (>0.5 ppm) and highly depleted δ¹³ CH4  (−50.5‰ to −51‰) over the McCarty landfill, indicating dominant microbial methane generation, further confirmed by canister measurements δ¹³CH4 ≈ −60.3‰. Estimated emissions from the McCarty Landfill, based on our isotopic mass-balance analysis, were ~2,100 kg CH₄ h⁻¹ ±55%, exceeding the EPA GHGRP inventory value (~857 kg CH₄ h⁻¹) and moderately higher than the Carbon Mapper satellite-derived flux but within combined uncertainties (~1,427 kg CH₄ h⁻¹ ±91%). highlighting that bottom-up inventories underestimate methane emissions from large urban landfills such as McCarty. Overall, the isotopic evidence demonstrates that integrating δ¹³C analyses data provides critical insights into source attribution and the relative roles of combustion, industrial, and microbial processes shaping Houston’s CO2 and CH4 emission landscape.

How to cite: Rappenglück, B. and Karim, I.: Characterizing Anthropogenic and Biogenic Sources of CO2 and CH4 in Houston, Texas, USA, EGU General Assembly 2026, Vienna, Austria, 3–8 May 2026, EGU26-11301, https://doi.org/10.5194/egusphere-egu26-11301, 2026.

EGU26-11815 | ECS | Orals | AS3.34

Temporal Variability and Spatial Distribution of CO2 Fluxes in a Danish Suburban Environment: Insights from Tall Tower Eddy Covariance 

Ziqiong Wang, Paula Sachsenmaier, Susanne Wiesner, Konstantinos Kissas, Charlotte Scheutz, and Andreas Ibrom

To quantitatively assess the impact of climate mitigation actions and support sustainable urban planning, the eddy covariance (EC) method serves as a potentially powerful tool for independent monitoring, reporting, and verification. However, interpreting EC fluxes in urban environments is challenging due to the spatial-temporal heterogeneity of urban surfaces and human activities, coupled with the complex coexistence of anthropogenic and biogenic fluxes. Furthermore, the EC footprint varies significantly with meteorological conditions, which can lead to biased flux estimates if the spatial representativeness is not properly accounted for.

This study presents a framework to resolve the monthly spatial distribution of CO2 sources and sinks at 10-meters resolution by integrating tall tower EC measurements (at heights up to 112 m) with bottom-up modelling and satellite imagery. The study site is a suburban area in Gladsaxe Municipality, northwest of Copenhagen, Denmark. A 12-months dataset collected throughout 2025 was analysed. Five major activities were considered: transportation, residential heating, human respiration, industrial emissions, and vegetation exchange. By coupling a footprint model with land-use and activity data, we performed a source apportionment to optimize spatially unbiased emission estimates.

Preliminary results indicate that transportation is a major contributor to the net CO2 emission at this suburban site, while residential heating shows an apparent elevation during the winter months. Notably, the CO2 exchange from vegetated areas displays an identifiable seasonal pattern, shifting between a potential weak source in winter and an appreciable sink during the peak growing season. These findings highlight the utility of tall tower EC in partitioning sectoral emissions, providing critical observation-based constraints for local CO2 inventories and urban climate action plans.

We acknowledge the financial support from the Independent Research Fund Denmark (DFF, Grant No. 1127-00308B) and the sponsorship provided by CIBICOM A/S (Ballerup, Denmark).

How to cite: Wang, Z., Sachsenmaier, P., Wiesner, S., Kissas, K., Scheutz, C., and Ibrom, A.: Temporal Variability and Spatial Distribution of CO2 Fluxes in a Danish Suburban Environment: Insights from Tall Tower Eddy Covariance, EGU General Assembly 2026, Vienna, Austria, 3–8 May 2026, EGU26-11815, https://doi.org/10.5194/egusphere-egu26-11815, 2026.

EGU26-11905 | ECS | Posters on site | AS3.34

Outdoor–Indoor VOC Dynamics: Insights from multi-site measurements and impacts of long-range transport on indoor air quality 

Toni Tykkä, Luis Barreira, Delun Li, Sami Harni, Laura Salo, Ville Silvonen, Mohamed Elsayed, Arto Säämänen, Topi Rönkkö, Hilkka Timonen, and Heidi Hellén

Indoor concentrations are consistently higher than outdoors for most VOCs due to indoor sources and limited ventilation. In Finland, outdoor VOC concentrations are low even in urban areas. However, sometimes outdoor air can be impacted by long-range transported (LRT) pollution and concentration levels of VOCs increase. Some of these VOCs also impact the indoor air. In this study we compared indoor-outdoor ratios of VOCs in different kind of environments in Finland (Vantaa and Tampere) Czech Republic (Prague) and Germany (Düsseldorf).

Carbopack B tubes were collected at five different locations, both indoors and outdoors; two daycare centers in Tampere, office in Vantaa, office in Düsseldorf and a high school in Prague. In Vantaa, an online thermal desorption–gas chromatography–mass spectrometry (TD-GC-MS) system was additionally employed to measure indoor and outdoor air with a time resolution of 2 hours over the two-week period.

During the Vantaa campaign with more intensive online VOC measurements a LRT event occurred providing an opportunity to investigate its impact on indoor air quality. For certain compounds, such as benzene, which is not effectively removed by building ventilation, a clear correlation was observed: as outdoor concentrations increased, indoor concentrations rose accordingly, closely matching the outdoor levels. Up to four times higher concentrations were measured both indoors and outdoors during the event. Benzene is a known carcinogenic and regulated by the EU. Similar levels in indoor and outdoor air were also observed in passive samples in all locations for benzene and tetrachloromethane indicating that the main source is in outdoor air. For most other compounds higher indoor air levels were detected. Especially for monoterpenes (α-pinene, 3Δ-carene and limonene) and octane clearly higher concentrations were measured in indoor air indicating strong indoor sources.

How to cite: Tykkä, T., Barreira, L., Li, D., Harni, S., Salo, L., Silvonen, V., Elsayed, M., Säämänen, A., Rönkkö, T., Timonen, H., and Hellén, H.: Outdoor–Indoor VOC Dynamics: Insights from multi-site measurements and impacts of long-range transport on indoor air quality, EGU General Assembly 2026, Vienna, Austria, 3–8 May 2026, EGU26-11905, https://doi.org/10.5194/egusphere-egu26-11905, 2026.

This study explored the inter-transport of PM2.5 between the Kaohsiung Harbor and the neighboring Metro Kaohsiung. PM2.5 was sampled at four sites for analyzing its chemical composition including water-soluble ions, metallic elements, carbons, anhydrosugars, and organic acids to characterize PM2.5’s chemical fingerprints. Furthermore, an air dispersion model, CALPUFF, was applied to simulate the spatiotemporal distribution of PM2.5 in the Kaohsiung Harbor and neighboring urban areas. Additionally, PM2.5 concentrations at nighttime were commonly higher than those in the daytime in winter, spring, and fall, while an opposite trend was observed in summer. High correlation of PM2.5 at the port and urban areas at nighttime implied the inter-transport phenomena of PM2.5 between these two areas. Sea salt spray, ship emissions, secondary aerosols, and heavy fuel-oil boilers were higher in the port area than those in the urban area. Mobile sources, fugitive dust, and waste incinerators were the major sources in the Metro Kaohsiung. Moreover, sea breeze significantly influenced the dispersion of PM2.5 from the Kaohsiung Harbor to the Metro Kaohsiung, particularly in the afternoon. The average contribution of PM2.5 from main engines of ships in the Kaohsiung Harbor was 2.9-5.3%, while the auxiliary engines contributed 3.8-8.3% of PM2.5 to the Metro Kaohsiung.

How to cite: Tseng, Y.-L.: Influences of Ship Emissions from an Asian Seaport on Ambient PM2.5 of Nearby Metropolitan Area: Field Sampling and Model Simulation, EGU General Assembly 2026, Vienna, Austria, 3–8 May 2026, EGU26-12067, https://doi.org/10.5194/egusphere-egu26-12067, 2026.

EGU26-12587 | Orals | AS3.34

Indoor Air Quality Modelling: Challenges and Opportunities 

Christian Pfrang

Indoor air quality (IAQ) has become a critical focus of research due to the substantial amount of time people spend indoors, where a significant proportion of air pollution exposure occurs. However, understanding how time and activity dependent sources, as well as built environment characteristics, influence pollutant emissions and distributions remains very limited.

This presentation will provide an overview of recent developments on indoor air quality modelling outlining the latest capabilities of the tools initially developed in the MetOffice/Strategic Priorities Fund (SPF) project "Indoor Air Quality Emissions & Modelling System (IAQ-EMS)". Specific focus will be the opportunities and challenges associated with contrasting modelling approaches such as ChemFlow3D (Liu et al., 2025; doi.org/10.1063/5.0270416) with high spatial and temporal resolution and multi-box flexible (MBM-Flex) modelling which allows the incorporation of a wide range of chemical schemes and tracking concentration gradients across complex buildings and at the indoor-outdoor interface while assuming well-mixed conditions in each box. Development opportunities and use cases will also be discussed. 

We have also developed, InAPI — an Excel-based Indoor Air Pollution Inventory tool — using data synthesised from reviewing UK indoor air pollution research (Mazzeo et al., 2025; doi.org/10.5194/egusphere-2025-783). For the development of the InAPI tool, we have categorised existing literature by pollutant types, indoor environments, and activities, identifying significant knowledge gaps and offering an open-access database of typical pollutant concentrations and emission rates (Mazzeo et al., 2025; doi.org/10.1039/D4EA00121D). Despite the fragmented methodologies in historical IAQ research and the underrepresentation of key sources, pollutants, and environment-specific characteristics (in particular ventilation and occupant behaviour), InAPI consolidates this evidence into a practical and easy-to-use tool.

By providing a robust platform for understanding indoor air pollutant dynamics, our work aims to advance IAQ research in the UK and beyond given the transferability of the approach, and thus support efforts to mitigate indoor air pollution and inform policy initiatives nationally and globally.

How to cite: Pfrang, C.: Indoor Air Quality Modelling: Challenges and Opportunities, EGU General Assembly 2026, Vienna, Austria, 3–8 May 2026, EGU26-12587, https://doi.org/10.5194/egusphere-egu26-12587, 2026.

EGU26-12615 | ECS | Orals | AS3.34

Oxidation mechanisms study of molecules of interest for indoor air and atmospheric chemistry  

Émilie Chantraine, Marina Jamar, David Shaw, Amaury Lahccen, Christa Fittschen, Sébastien Dusanter, Nicola Carslaw, and Coralie Schoemaecker

Chemical species emitted in indoor environments by humans (skin emission and breath) and their activities (cooking, use of detergents and personal care products), or by building and furnishing materials, have a direct impact on air quality. In addition, these species exhibit an indirect impact through their gas phase reactions with atmospheric oxidants (e.g. hydroxyl radicals), leading to the formation of Oxygenated Volatile Organic Compounds (OVOCs) and Secondary Organic Aerosol (SOA), which can directly affect human health. They can also be transferred outside (through infiltration or ventilation), where they can further react to produce ozone and SOA, potentially having an additional impact on health and climate change. The COST action INDAIRPOLLNET aimed to identify and rank species emitted indoors, according to different criteria such as their health impact, or their reactivity with atmospheric oxidants (OH, O3, Cl and NO3). This work highlighted an important knowledge gap, as more than 800 compounds have been measured indoors, but only a limited number have relevant information to enable ranking. For instance, less than 65% of the molecules have a reported rate constant with OH. In this context, a FAGE (Fluorescence Assay by Gas Expansion) instrument, measuring the total OH reactivity (sum of OH loss rates due to reactions with trace gases), has been used to measure missing rate constants with OH, and to investigate oxidation mechanisms of species of interest that may impact human health, or react quickly with OH. The oxidation of furan, N,N-dimethylformamide and 1.2-diethoxyethane has been studied via two complementary approaches: laboratory experiments and modelling (using INCHEM-Py box model). The experiments were conducted in the DouAir simulation chamber, coupled with a Proton Transfer Reaction-Mass Spectrometer, -monitoring the primary VOCs and their oxidation products -, and with the FAGE instrument. In a second step, these experiments were simulated with INCHEM-Py. Experimental findings confirm the formation of butenedial, 5-hydroxyfuran-2(5H)-one, 4-oxobut-2-enoic acid, 2-hydroxy-5-carboxyfuran and maleic anhydride as the main oxidation products for the furan + OH reaction, and the formation of dimethylnitramine when N,N-dimethylformamide is oxidized by OH radicals. Oxidation products for the reaction of 1.2-diethoxyethane + OH are presented for the first time. In addition, the kinetic of this last reaction was studied using the FAGE technique, yielding a measured rate coefficient of (5.3 ± 0.4) × 10-11 cm3.mol-1.s-1, in good agreement with the value of (5.8 ± 0.6) × 10-11 cm3.mol-1.s-1 reported by Porter et al. 1997. The modelling of these experiments is ongoing to allow to derive and/or validate complete oxidation mechanisms for these three species.

How to cite: Chantraine, É., Jamar, M., Shaw, D., Lahccen, A., Fittschen, C., Dusanter, S., Carslaw, N., and Schoemaecker, C.: Oxidation mechanisms study of molecules of interest for indoor air and atmospheric chemistry , EGU General Assembly 2026, Vienna, Austria, 3–8 May 2026, EGU26-12615, https://doi.org/10.5194/egusphere-egu26-12615, 2026.

EGU26-12681 | Orals | AS3.34

Urban Air Quality: Challenges and future directions  

Martine Van Poppel

Urban air quality (AQ) is impacted by different emission sources (traffic, household heating, industry, energy production,...) and inhabitants are exposed to different pollutants that have impact on their health. Some pollutants, e.g. traffic-related ones (like UFP, BC & NOx), can show a very high spatial and temporal variability within a city or neighbourhood.

There is a need to better understand the spatio-temporal heterogeneity of AQ and at the same time understand levels of pollutants of emerging concern; this information is crucial for improved assessment of health effects and data-driven policy.

The new AQD (2024/2881) sets stricter requirements for  regulated pollutants and requires the monitoring of emerging pollutants at so-called supersites (in urban areas). The purpose is to collect data on pollutants of emerging concern to improve understanding of health and environmental impacts. On the other hand, new (low-cost) monitoring devices can complement regulatory Air Quality Monitoring Stations (AQMS) and  can collect data at multiple locations in urban areas (via stationary networks or mobile deployment). Whereas new monitoring approaches can result in insights on spatial variability across the city, there are still some issues related data quality of low-cost sensors or representativity of mobile mapping.

The recently finished RI-URBANS project (https://riurbans.eu/), provides data on emerging pollutants in different cities in Europe and introduced new methods e.g. to collect fine-grained pollution maps. Within the on-going Net4Cities project (https://www.net4cities.eu/), datasets of emerging pollutants at multiple locations in 11 cities (including UFP, LDSA, ammonia, VOCs) will become available.

In this presentation, challenges related to urban air quality monitoring in (European) cities will be discussed. New monitoring approaches to better understand urban AQ and levels of emerging pollutants will be discussed. Some examples will be given on how innovative monitoring can contribute to improved policy and cleaner cities.


How to cite: Van Poppel, M.: Urban Air Quality: Challenges and future directions , EGU General Assembly 2026, Vienna, Austria, 3–8 May 2026, EGU26-12681, https://doi.org/10.5194/egusphere-egu26-12681, 2026.

EGU26-13487 | ECS | Posters on site | AS3.34

Effects of vegetation models on urban CO2 simulations over the Greater Toronto Area 

Ceren Demirci, Christian DiMaria, Sabrina Madsen-Colford, Brad Weir, Debra Wunch, and Dylan Jones

Urban areas are hotspots for CO2 emissions. Therefore, accurately estimating sources and sinks in these areas is important for studying the urban carbon budget. Due to the heterogeneous land cover of urban areas, modeling in high resolution is essential for accurate estimates of CO2 fluxes and concentrations in urban domains. Being a major sink for CO2, the urban biosphere plays a crucial role in the urban carbon budget, and accurately estimating the biogenic fluxes is key to our understanding of the urban carbon cycle. We model CO2 concentrations in the Greater Toronto Area (GTA), the largest metropolitan area in Canada, using the Weather Research and Forecasting Model coupled with GEOS-Chem (WRF-GC), which makes it possible for us to run high resolution simulations in our region of interest, with a resolution of 1 km x 1 km. For our biogenic fluxes, we use two regional biogenic models, the Solar Induced Fluorescence for Modelling Urban biogenic Fluxes (SMUrF) and the Urban Vegetation Photosynthesis and Respiration Model (UrbanVPRM), in addition to the global biogenic fluxes from the Más Informada Carnegie-Ames-Stanford-Approach (MiCASA) model, to assess the effects of different vegetation models on CO2 concentrations over the GTA. Using the regional biogenic models with 500m x 500m resolution and global emissions with 0.1 x 0.1 degrees resolution, we investigate the effects of including different high resolution fluxes in our model, and how modifications in these vegetation models can affect the CO2 concentrations around our model domain. 

How to cite: Demirci, C., DiMaria, C., Madsen-Colford, S., Weir, B., Wunch, D., and Jones, D.: Effects of vegetation models on urban CO2 simulations over the Greater Toronto Area, EGU General Assembly 2026, Vienna, Austria, 3–8 May 2026, EGU26-13487, https://doi.org/10.5194/egusphere-egu26-13487, 2026.

EGU26-14425 | ECS | Posters on site | AS3.34

Investigating Urban Ammonium Nitrate Aerosol Formation over Asian Cities with In-Situ Measurements and Thermodynamic Modelling 

Ryan Boyd, Yunseo Choi, Hongming Yi, Vladislav Sevostianov, Daniel Moore, Guy Symonds, Dongwook Kim, Pedro Campuzano-Jost, Jose-Luis Jimenez, Katherine Ball, John Crounse, Young Ro Lee, Paul Wennberg, Meehye Lee, Jack Dibb, Josh Digangi, Yonghoon Choi, Glenn Diskin, and Mark Zondlo

Wintertime aerosol loading is a prevalent public health issue in Asian megacities. A combination of meteorological effects, local emissions, and biomass burning contributes to high aerosol loading in some of the most densely populated regions of the globe. Local controls of this pollution have been effective at reducing urban aerosol loading, but the effectiveness of controls of nitrogen oxides (NOx) versus ammonia (NH3) remains to be seen. Ammonium nitrate (AN) formation is especially relevant during the cold season due to increased thermodynamic favorability at lower temperatures. Understanding these chemical controls remains difficult due to a lack of comprehensive measurements that incorporate the precursors and products of aerosol formation spatially in both vertical and horizontal transport. Using in-situ measurements from the NASA DC-8 taken during the 2024 ASIA-AQ campaign, the relative contributions of NH3 and NOx to inorganic AN formation is explored over and near Asian megacities in the Philippines, South Korea, Taiwan, and Thailand. Missed approaches at airports in and near these cities provide insight into the vertical distribution of the relevant gas-phase precursors and their corresponding aerosol products across both tropical and wintertime urban environments.

By quantifying the thermodynamic AN dissociation constant, we calculate that over Taiwan 25% of vertical profiles near urban centers have conditions where NH3 and nitric acid (HNO3) are abundant enough for thermodynamically favorable AN formation. Preliminary results show this is generally NOx limited and more favorable aloft at or above the boundary layer due to lower temperatures. This estimation will be further constrained against the ISORROPIA-II aerosol thermodynamic model and expanded across missed approaches over all the sampled countries. To further understand the impact of urban emissions on this aerosol formation, tracers such as carbon monoxide, methane, and nitrous oxide are used to determine the relevant contributions of urban versus agricultural emissions to the relevant precursors. Results will be compared to relevant policy on emissions regulations to evaluate the effectiveness of currently implemented controls.

How to cite: Boyd, R., Choi, Y., Yi, H., Sevostianov, V., Moore, D., Symonds, G., Kim, D., Campuzano-Jost, P., Jimenez, J.-L., Ball, K., Crounse, J., Lee, Y. R., Wennberg, P., Lee, M., Dibb, J., Digangi, J., Choi, Y., Diskin, G., and Zondlo, M.: Investigating Urban Ammonium Nitrate Aerosol Formation over Asian Cities with In-Situ Measurements and Thermodynamic Modelling, EGU General Assembly 2026, Vienna, Austria, 3–8 May 2026, EGU26-14425, https://doi.org/10.5194/egusphere-egu26-14425, 2026.

EGU26-14614 | Orals | AS3.34

The urban multi-pollutant mixture measured in the Study of Winter Air Pollution in Toronto (SWAPIT) 

Elisabeth Galarneau and the Study of Winter Air Pollution in Toronto

Air quality concerns persist in urban areas due to the density of pollutant releases and population. This leads to complexities in understanding air pollution impacts given the high spatiotemporal variability of ambient pollutant levels. Those complexities are exacerbated by the lack of integration among the research and management activities associated with the air quality issues of smog, acid deposition, trace contaminants, and air toxics. The Study of Winter Air Pollution in Toronto (SWAPIT) involves over 100 scientific and technical collaborators from government and academia working to characterize the composition and spatiotemporal variability of the whole urban air pollution mixture and to better understand urban air pollution sources and impacts. A six-week field campaign was carried out from January to March 2024 using a variety of measurement techniques at multiple locations in the Toronto area. Campaign timing allowed for a focus on the relatively understudied winter period when low temperature and light alter secondary pollutant formation, and seasonal pollutant sources such as roadway de-icing and residential wood combustion are active. Results will be presented to demonstrate the differences in spatial patterns between pollutants, the ongoing impacts of urban transportation sources, and the growing role of non-exhaust pollutants. Insights into human and wildlife health will also be presented along with improvements to satellite and chemical transport modelling tools that have been driven by measurements taken during the SWAPIT field campaign.

How to cite: Galarneau, E. and the Study of Winter Air Pollution in Toronto: The urban multi-pollutant mixture measured in the Study of Winter Air Pollution in Toronto (SWAPIT), EGU General Assembly 2026, Vienna, Austria, 3–8 May 2026, EGU26-14614, https://doi.org/10.5194/egusphere-egu26-14614, 2026.

EGU26-14792 | Orals | AS3.34

Benzene and Other Hazardous Air Pollutants in Consumer-Grade Natural Gas in the United Kingdom, Italy, and the Netherlands 

Tamara Sparks, Yannai Kashtan, Sebastian Rowland, Eric Lebel, Jackson Goldman, Colin Finnegan, Gan Huang, Nicole Lucha, Abenezer Shankute, Nick Heath, Sofia Bisogno, Kelsey Bilsback, Anchal Garg, Lee Ann Hill, Robert Jackson, Seth Shonkoff, and Drew Michanowicz

While consumer-grade natural gas leaks contribute to methane-induced climate change, they can also degrade air quality both indoors and outdoors. However, limited leakage and gas composition data exist outside of North America. Here, we chemically characterized 78 unburned gas samples from residential stoves and measured stove-off natural gas leakage in 35 homes across seven cities in the United Kingdom, Netherlands, and Italy. Benzene, a known human carcinogen, was substantially elevated in unburned gas compared to North America (9 to 73 times higher on average), while sulfur-based odorants, which are added to natural gas to warn against explosivity, were lower. Stove-off methane leakage rates had a highly skewed, long-tailed distribution with an average of 46 mg/hr and a range from no detectable leak to 651 mg/hr. Modeling of indoor kitchen benzene enhancements from gas stove leaks showed potential for hazardous benzene exposure, often undetectable by odor. Eight percent of homes exhibited a stove-off leak that, combined with city-median benzene concentrations in gas, resulted in modeled benzene enhancements above the European Union’s annual limit value of 1.6 ppbv. Modeling of an outdoor distribution pipeline leak resulted in benzene concentrations over four times the European Union’s 200 ppbv occupational hazard limit and showed benzene enhancements up to 10 km away. These modeled indoor and outdoor enhancements are in addition to other sources of benzene exposure from cooking, smoking, gasoline, and leaks from other gas appliances or pipelines. The combination of high benzene and relatively low odorization in natural gas suggests that hazardous leaks are likely underreported in Europe. Natural gas leaks are not just a climate or explosion risk—they are an underrecognized public health issue.

How to cite: Sparks, T., Kashtan, Y., Rowland, S., Lebel, E., Goldman, J., Finnegan, C., Huang, G., Lucha, N., Shankute, A., Heath, N., Bisogno, S., Bilsback, K., Garg, A., Hill, L. A., Jackson, R., Shonkoff, S., and Michanowicz, D.: Benzene and Other Hazardous Air Pollutants in Consumer-Grade Natural Gas in the United Kingdom, Italy, and the Netherlands, EGU General Assembly 2026, Vienna, Austria, 3–8 May 2026, EGU26-14792, https://doi.org/10.5194/egusphere-egu26-14792, 2026.

EGU26-14827 | ECS | Orals | AS3.34

Investigating Pollutant-Meteorology Interactions In Urban Surface Layer Through UAV-Based Vertical Profiling  

Uzma Nawaz, S.M. Shiva Nagendra, and Devaprakash Muniraj

Understanding the vertical structure of aerosols near the surface is crucial for enhancing exposure assessment, validating air quality models, and characterizing boundary layer processes at fine spatial scales, as pollutant level varies significantly due to complex interactions between emissions and local atmospheric conditions. However, most monitoring networks depend on surface stations that cannot detect altitude-related changes within the lowest tens of meters. This range is significant to human exposure and pollutant transformations. This study presents early results from a UAV-based vertical profiling system designed for high-resolution measurements of PM₂.₅ and key meteorological parameters. A multirotor drone equipped with a custom sensor module, including a NOVA-SD laser-scattering PM₂.₅ sensor, a Bosch BME280 sensor for measuring barometric pressure, temperature, and relative humidity, and an STM32 Microcontroller for onboard data logging, was used for two vertical profiling flights. The UAV ascended up to 35 m above ground level, collecting resolution measurements for all mentioned variables at each second. Over both flights, more than 1,500 data points were gathered. The profiles show expected thermodynamic behavior, that is, temperature and pressure decrease with altitude, while relative humidity increases in the upper part of the measured layer. PM₂.₅ levels were generally low but showed noticeable altitude-related variations. A mid-altitude increase appeared consistently in both flights, indicating a shallow aerosol layer rather than sensor noise. These initial findings highlight the potential of UAV-based sensing to detect fine-scale stratification that surface monitors miss. The expanded dataset will help create a validated UAV-based approach that complements traditional monitoring networks and provides better insight into urban boundary-layer air quality.

How to cite: Nawaz, U., Nagendra, S. M. S., and Muniraj, D.: Investigating Pollutant-Meteorology Interactions In Urban Surface Layer Through UAV-Based Vertical Profiling , EGU General Assembly 2026, Vienna, Austria, 3–8 May 2026, EGU26-14827, https://doi.org/10.5194/egusphere-egu26-14827, 2026.

EGU26-15301 | ECS | Orals | AS3.34

High-resolution modelling of atmospheric methane in the Greater Toronto Area using WRF-GEOS-Chem 

Christian DiMaria, Ceren Demirci, Lawson Gillespie, Sebastien Ars, Nicole Jacobs, Lucas Prates, Dylan Jones, and Debra Wunch

Methane (CH4), a potent greenhouse gas, is emitted in large quantities from urban sources including landfills, wastewater treatment facilities, and natural gas distribution networks, and can make up a significant fraction of a city's total carbon budget. Reducing urban CH4 emissions is therefore an important part of anthropogenic climate change mitigation strategies. Toronto, Canada's largest city, has set significant carbon emission reduction goals, aiming to reach net-zero carbon emissions by 2040. The TAME (Toronto Atmospheric Monitoring of Emissions) Project has been established to help track the city's progress towards these goals using both observation networks and atmospheric modelling techniques. As part of TAME, we perform high-resolution (1km) simulations of atmospheric CH4 across the Greater Toronto Area (GTA) using the WRF-GEOS-Chem (WRF-GC) model coupled with two versions of the high-resolution (1km) FLAME-GTA urban methane emission inventory. We use the model to quantify the variability of CH4 across the city in terms of a correlation length scale. We also calculate spatial correlation footprints for multiple observation sites and use these footprints to assess the spatial coverage of different urban observation network configurations. We then compare the modelled CH4 with in-situ surface measurements and remote sensing retrievals at two urban sites and one rural background site. These comparisons show that urban landfill CH4 emissions were likely overestimated in the original FLAME-GTA inventory but have been significantly improved in the updated version. Measured versus modelled spatial gradients of CH4 suggest a possible overestimate of CH4 emissions in Downtown Toronto in both versions of FLAME-GTA. Low biases associated with specific wind directions may indicate regions of underestimated CH4 emissions in the model. These results demonstrate how high-resolution modelling can be combined with observations to assess and improve emission inventories in urban environments. Future work for the TAME project will extend this analysis to include other pollutants including CO2, CO, PM2.5, NOx, and O3.

How to cite: DiMaria, C., Demirci, C., Gillespie, L., Ars, S., Jacobs, N., Prates, L., Jones, D., and Wunch, D.: High-resolution modelling of atmospheric methane in the Greater Toronto Area using WRF-GEOS-Chem, EGU General Assembly 2026, Vienna, Austria, 3–8 May 2026, EGU26-15301, https://doi.org/10.5194/egusphere-egu26-15301, 2026.

EGU26-15478 | Posters on site | AS3.34

Using Commercial Aircraft to Monitor Urban Carbon Reservoirs 

Colm Sweeney and Jeff Peichle

Our current understanding of the carbon cycle relies on a limited network of direct and remote sensing systems for measuring atmospheric greenhouse gases (GHGs). While this has provided a general understanding of natural and anthropogenic GHG sources and sinks, it is insufficient for monitoring subtle emission changes caused by climate change, mitigation efforts, and interventions. To address this, a new network, integrating existing and emerging technologies, will be necessary. This network, enhanced through public-private partnerships, will enable verification of GHG emissions and uptake from global to local scales.

A prime example of these expanding private sector collaborations is the recent partnership between NOAA and United Airlines. This collaboration leverages commercial aircraft to provide up to eight daily atmospheric profiles at a fraction (1%) of the cost of comparable research aircraft. The benefits of these observations are magnified by their low cost, increased frequency, and the ability to frequently sample large metropolitan areas, which are often served by mid-size aircraft like the Boeing 737. These profiles are crucial for bridging the gap between ground-based direct measurements and satellite-based remote measurements, thereby facilitating GHG emission monitoring across all scales.

This presentation will offer an overview and update on a global initiative that utilizes a unique platform to enhance our capacity for GHG observation. Specifically, NOAA's agreement with United Airlines to carry a GHG analyzer in the EE-bay of their 737-900ER short-haul aircraft is expected to significantly expand measurements of CO2, CH4, CO, and water vapor in and out of major metropolitan areas worldwide. With 50 aircraft distributed among 10 different airlines, we anticipate sampling 200 metropolitan areas globally with a frequency of better than every 3 days. This will lead to a substantial reduction in the uncertainty of urban methane emissions, as well as providing critical constraints on regional GHG emissions and satellite retrievals through the unique characteristics of aircraft profiles.

How to cite: Sweeney, C. and Peichle, J.: Using Commercial Aircraft to Monitor Urban Carbon Reservoirs, EGU General Assembly 2026, Vienna, Austria, 3–8 May 2026, EGU26-15478, https://doi.org/10.5194/egusphere-egu26-15478, 2026.

EGU26-15654 | ECS | Orals | AS3.34

Opportunities, Constraints, and Progress of a Mid-Cost Sensor Network for In Situ Greenhouse Gas and Air Quality Monitoring in the Greater Toronto Area 

Mark Panas, Eric Ward, Alexandra Corapi, Isabelle Renee Lao, Sebastien Ars, Jennifer G. Murphy, Felix Vogel, Debra Wunch, and Cora J. Young

In 2021, the city of Toronto adopted a plan to reach net-zero emissions by 2040 that includes ambitious strategies to be implemented over the coming years. The purpose of the Toronto Atmospheric Monitoring of Emissions (TAME) project is to produce measurements of greenhouse gases and air pollutants in the urban area in order to quantify emissions during this period and study air quality co-benefits of emissions reduction strategies. Instrumentation operated as part of TAME includes ground-based column measurements and in situ measurements. Many of the in situ measurements are made with mid-cost sensor packages. One is the QuantAQ Modulair, which measures CO, NOX, O3, and particulate matter, and the other is a CO2 sensor built by Environment and Climate Change Canada. Since August 2024, these sensors have been evaluated against reference instrumentation and deployed at eight sites around the Greater Toronto Area. The pollutant concentrations are calculated using regression models based on colocation with reference instrumentation; we also employ one pair of sensors as a travel standard to assess changes in the sensors’ performance while they are deployed at their respective sites and revise the regression models as needed. We also maintain a set of QuantAQ sensors permanently colocated with our reference instruments throughout the deployment period. The advantages and disadvantages of these calibration approaches will be discussed and compared to other methodologies. A summary of pollutant trends among the sites will be presented with emphasis on what can be confidently quantified given both the spatial gradients and the performance limitations of these sensors.

How to cite: Panas, M., Ward, E., Corapi, A., Lao, I. R., Ars, S., Murphy, J. G., Vogel, F., Wunch, D., and Young, C. J.: Opportunities, Constraints, and Progress of a Mid-Cost Sensor Network for In Situ Greenhouse Gas and Air Quality Monitoring in the Greater Toronto Area, EGU General Assembly 2026, Vienna, Austria, 3–8 May 2026, EGU26-15654, https://doi.org/10.5194/egusphere-egu26-15654, 2026.

EGU26-16450 | Posters on site | AS3.34

Field Intercomparison of Mid-Cost CO2 Sensors for Urban Atmospheric Monitoring 

Alessandro Bigi and Aneena Binoy

Urban environments represent major hotspots of atmospheric CO2 emissions; however, the availability of measurements resolving fine spatial and temporal variability remains limited. This limitation is largely due to the high cost and sparse deployment of reference-grade monitoring systems in complex urban settings. In recent years, sensor-based approaches have shown that dense networks of low- to mid-cost CO2 sensors can substantially enhance spatial coverage in complex urban settings. Urban sensor networks, such as the Zurich CO2 Sensor (ZiCOS) network (Grange et al., 2025) and the BErkeley Atmospheric CO2 Observation Network (BEACO2N) in California (Shusterman et al., 2016), have shown that such deployments can improve the characterization of the urban CO2 spatial patterns and temporal dynamics. These developments highlight how sensor-based networks can enable denser spatial coverage and provide an effective pathway toward a high-resolved  description of urban CO2 variability. 

The current study outlines a recently initiated project on urban CO2 budgeting in the Po Valley, a densely populated area in southern Europe, combining atmospheric monitoring by reference equipment and mid-cost sensors, with atmospheric modelling by urban-scale Lagrangian particle dispersion modelling. We assessed the field comparability of two identical mid-cost CO2 sensors GMP343 (Vaisala Oy). The instruments were deployed between May–November 2025 at the rooftop of the Geophysical Observatory of the University of Modena and Reggio Emilia, a 40 m high tower located in the city centre of Modena, Italy. The sensors were laboratory calibrated prior to deployment, and measured CO2 concentrations were corrected for temperature and pressure using the built-in firmware algorithm, followed by the application of sensor-specific calibration offsets.

To assess the inter-sensor agreement and operational stability, we processed the six months of continuous measurement data. Sensor performance was evaluated using correlation analysis, error statistics, and Deming regression, demonstrating strong agreement between the sensors and good stability. The two mid-cost sensors exhibited a high linear correlation (Pearson’s r = 0.965) and a mean bias of 2.47 ppm during the intercomparison. The results achieved so far showed their suitability for high-resolution urban monitoring and for an integration with reference-grade eddy covariance (EC) observations in urban CO2 assessment studies. 

Since January 2026, a 2 m pole on the rooftop of the Observatory has been equipped with a reference-grade EC measurement setup consisting of a LI-COR 7200RS gas analyzer (LI-COR Biosciences) and a 3D Gill WindMaster anemometer (Gill Instruments), and provides continuous measurements of urban CO2 fluxes. Concurrently since December 2025 the mid-cost sensors were moved at two urban air quality regulatory monitoring stations under urban background and urban traffic conditions, where several regulatory atmospheric pollution monitors are already in place. Study outlooks include the maintenance of the CO2 network for at least 12 months and the setup of an urban scale CO2 dispersion model combining both biogenic and anthropogenic fluxes within a lagrangian particle dispersion model.

How to cite: Bigi, A. and Binoy, A.: Field Intercomparison of Mid-Cost CO2 Sensors for Urban Atmospheric Monitoring, EGU General Assembly 2026, Vienna, Austria, 3–8 May 2026, EGU26-16450, https://doi.org/10.5194/egusphere-egu26-16450, 2026.

EGU26-16692 | Posters on site | AS3.34

Driving a chemistry transport model with a large-eddy simulation 

Rostislav Kouznetsov, Mikhail Sofiev, Jukka-Pekka Keskinen, and Mikko Auvinen

We have interfaced an off-line chemistry-transport model (https://silam.fmi.fi) to the wind velocity fields obtained from PALM large-eddy simulation (LES) model. With the resulting setup the dispersion simulations with a deca-meter resolution become feasible with very moderate compute resources. As a proof of concept we demonstrate a few examples of the LES-driven dispersion simulations  made with an ordinary PC.                        

In the presentation we discuss the difference between the assumptions in the LES and regional air-quality models and indicate several approaches
to cope with them and to reduce the storage and IO requirements for such a setup. We show a  comparison of a simulated tracer dispersion in an urban environment made with native PALM transport scheme and with SILAM model driven by the same wind fields and discuss the differences between the transport schemes used in the models.

How to cite: Kouznetsov, R., Sofiev, M., Keskinen, J.-P., and Auvinen, M.: Driving a chemistry transport model with a large-eddy simulation, EGU General Assembly 2026, Vienna, Austria, 3–8 May 2026, EGU26-16692, https://doi.org/10.5194/egusphere-egu26-16692, 2026.

EGU26-16895 | ECS | Posters on site | AS3.34

Comparative analysis of atmospheric CO₂, CH₄, and ¹⁴CO₂ between a Hungarian urban site and an ICOS regional background station 

Balázs Áron Baráth, Sándor Bán, Tamás Varga, Zoltán Barcza, László Haszpra, and Mihály Molnár

Urban areas are global hotspots of anthropogenic greenhouse gas emissions; however, distinguishing between fossil fuel combustion and biogenic fluxes remains challenging due to the complexity of the urban environment. High-precision atmospheric observations are essential for validating "bottom-up" emission inventories and guiding local green strategies. This study presents a comprehensive comparative analysis examining atmospheric CO2 and CH4 mole fractions, as well as atmospheric radiocarbon (14C) signals, from May 2025 in Debrecen (an urban environment) and two elevations at the regional background station in Hegyhátsál (ICOS HUN).

During the research campaign, Picarro Cavity Ring-Down Spectroscopy (CRDS) analyzers were employed at both sites for continuous, high-resolution measurement of CO2 and CH4 concentrations. These measurements were complemented by a two-week integrated 14CO2 sampling, followed by Accelerator Mass Spectrometry (LEA-AMS) analysis. This dual-tracer approach enables the separation of the Debrecen CO2excess into fossil and biogenic components.

Our results highlight that the urban-derived excess varies dynamically relative to the regional background. The continuous mole fraction data reveal characteristic diurnal and seasonal patterns, with wintertime enrichment of CO2 and CH4, driven by reduced boundary layer mixing and increased heating demand. Analysis of CH4:CO2 correlations provides further insight into sector-specific emissions, distinguishing between traffic-dominated and heating-dominated periods. By combining high-frequency concentration measurements with isotopic constraints, our study provides a more precise understanding of the urban carbon cycle in a mid-sized city in Hungary, highlighting the importance of parallel urban-rural monitoring networks in verifying climate protection measures.

How to cite: Baráth, B. Á., Bán, S., Varga, T., Barcza, Z., Haszpra, L., and Molnár, M.: Comparative analysis of atmospheric CO₂, CH₄, and ¹⁴CO₂ between a Hungarian urban site and an ICOS regional background station, EGU General Assembly 2026, Vienna, Austria, 3–8 May 2026, EGU26-16895, https://doi.org/10.5194/egusphere-egu26-16895, 2026.

EGU26-16968 | ECS | Orals | AS3.34

Linking neighborhood canopy coverage to city-scale biogenic CO2 uptake in Paris, France  

Anni Karvonen, Minttu Havu, Laura Bignotti, Benjamin Loubet, and Leena Järvi

Cities are major sources of anthropogenic carbon dioxide (CO2) emissions. Reducing these emissions is not enough to make urban areas carbon neutral without biogenic sinks offsetting a portion of the remaining emissions. Urban vegetation provides a CO2 sink that contributes to the net CO2 balance of a city. CO2 uptake of a neighborhood is strongly dependent on the number of trees, i.e. the canopy coverage. The current EU Nature Restoration Law recommends that each city should have a canopy coverage of 30% to get the multiple benefits of urban vegetation. However, this limit value is rarely reached at a neighborhood level, where most of the benefits take place.  

In this study, we utilized urban land surface model SUEWS (the Surface Urban Energy and Water balance Scheme) in greater Paris area, France, to examine the variability of biogenic CO2 fluxes across the city with different canopy coverages. SUEWS simulates joint energy, water, and CO2 exchanges on local neighborhood scale with meteorological forcing and vegetation-specific parameterizations. The study period was from March 2024 to June 2025, corresponding to the availability of eddy covariance (EC) measurements from an urban forest Vincennes located in eastern Paris, which were used to evaluate the model. The meteorological input was from ERA5 data. First, we tested the effect of choosing different sets of biogenic CO2 parameters (Park trees, street trees, forest) for modelling CO2 and heat fluxes. We then upscaled the results by modelling CO2 in the greater Paris area with a 500 m x 500 m resolution. Results of CO2 uptake were also compared to canopy coverage of the grids to see the effect of urban vegetation offsetting the CO2 emissions on a neighborhood scale.

How to cite: Karvonen, A., Havu, M., Bignotti, L., Loubet, B., and Järvi, L.: Linking neighborhood canopy coverage to city-scale biogenic CO2 uptake in Paris, France , EGU General Assembly 2026, Vienna, Austria, 3–8 May 2026, EGU26-16968, https://doi.org/10.5194/egusphere-egu26-16968, 2026.

EGU26-17139 | ECS | Orals | AS3.34

Spatio-temporal variation analysis of PM2.5 in Lahore using Beta Attenuation Monitor and Low-cost sensors 

Amina Shahbaz, Abdul-Sattar Nizami, Ann M. Dillner, and Muhammad Naveed Anwar

Spatio-temporal variation analysis of PM2.5 in Lahore using Beta Attenuation Monitor and Low-cost sensors

Shahbaz A. 1, Nizami A.S1, Dillner A. M.2, Anwar M. N.1,2*


1Sustainable Development Study Center, Government College University, Lahore, Pakistan 

2Air Quality Research Center, University of California, Davis, Davis, CA 95618, USA  


*Corresponding author. Tel: 92-333-4881593;

E-mail address: naveedanwarenv@gcu.edu.pk


Air pollution (especially fine particulate matter PM2.5) is a major global issue causing 7 million premature deaths each year. It also reduces the atmospheric visibility and interacts with overall ecosystem. The Low and Middle-Income Countries (LMICs), home to 6.62 billion people, are at forefront to air pollution exposure. Despite grave impact (89% of the premature deaths), LMICs lack sufficient air quality monitoring. Pakistan, like other LMICs, is faced with severe air pollution as well. Lahore, one if its metropolitans, was among top 10 most polluted cities globally in 2022. In this study temporal and spatial variability of PM2.5 concentration in Lahore was investigated by using reference grade Beta Attenuation Monitor (BAM) and low-cost sensors based data from 2019 to 2025. Over the study period, daily PM2.5 concentration was measured by BAM ranged from 0.1 µgm⁻³ to 910.1 µgm⁻³, with an overall mean concentration of 125.5 µg m⁻³. A strong seasonal trend was observed with winter frequently exceeding 300µgm⁻³ (far surpassing WHO and EPA guidelines of 15 µgm⁻³ and 35 µgm⁻³ respectively), even higher than 600µgm⁻³ occasionally. Data from a city-wide network of low-cost sensors was used to examine the spatial variation of the PM2.5. Furthermore, this PM2.5 mass concentration data was validated against the reference grade BAM data and tailored calibrations, catering the potential bias of different factors, were developed. These calibrations can be readily applied in the future on the low cost sensors data to reduce the need for the deployment of expensive reference grade monitors paving the way for routine and dispersed monitoring – much needed towards the prevention of recurrence of smog episodes in Lahore. In addition, the role of the transboundary agricultural residue burning towards the higher PM2.5 mass concentrations was also investigated by using the satellite imageries and meteorological data. These findings underscore the urgent need to improve data integration approaches, strengthened air quality networks, and policy interventions that are evidence based to mitigate the increasing air pollution in urbanizing regions of LMICs.

How to cite: Shahbaz, A., Nizami, A.-S., Dillner, A. M., and Anwar, M. N.: Spatio-temporal variation analysis of PM2.5 in Lahore using Beta Attenuation Monitor and Low-cost sensors, EGU General Assembly 2026, Vienna, Austria, 3–8 May 2026, EGU26-17139, https://doi.org/10.5194/egusphere-egu26-17139, 2026.

EGU26-17218 | ECS | Posters on site | AS3.34

Urban CO2 Emission Assessment based on High-Resolution Dispersion Simulations and MCMC based Inversion 

Junwei Li, Jia Chen, Dominik Brunner, Dietmar Öttl, Christopher Claus Holst, and Haoyue Tang

Cities are significant contributors to global greenhouse gases. Accurately quantifying urban CO2 emissions from atmospheric observations requires fine-scale modelling and rigorous inverse optimization of the emissions. Within the ICOS Cities project, we developed a high-resolution urban CO2 emission estimation framework for Munich, coupling a detailed emission inventory with the computational fluid dynamics (CFD) based GRAMM-SCI/GRAL-ST-ROG model and with a novel inversion algorithm based on a Markov Chain Monte Carlo and Gaussian Process (MCMC-GP) approach.

The framework utilizes GRAMM-SCI to simulate mesoscale wind fields, which are subsequently refined by the GRAL-ST-ROG model. By integrating high-resolution datasets—including land cover, 3D building, and a self-developed tree cover dataset—with surface meteorological observations and Doppler wind lidar vertical profiles, the model generates wind fields at a 10-meter spatial resolution. The resulting wind fields are then combined with high-resolution emission inventories to drive the CO2 dispersion simulation.

The simulated CO2 concentrations were validated against Munich's mid-cost observation network. Furthermore, a new MCMC-GP algorithm was developed to facilitate spatio-temporal inversion across multiple emission sectors. This approach offers high flexibility, the capability to perform inversions under data-sparse conditions, and the ability to refine prior knowledge—such as spatial correlations and uncertainties—to ensure the method’s robustness.

This study presents a high-fidelity tool for quantifying urban emissions, supporting evidence-based policymaking to achieve climate targets.

How to cite: Li, J., Chen, J., Brunner, D., Öttl, D., Holst, C. C., and Tang, H.: Urban CO2 Emission Assessment based on High-Resolution Dispersion Simulations and MCMC based Inversion, EGU General Assembly 2026, Vienna, Austria, 3–8 May 2026, EGU26-17218, https://doi.org/10.5194/egusphere-egu26-17218, 2026.

EGU26-17311 | ECS | Posters on site | AS3.34

RETRO: City-Scale High-Resolution Footprint Modeling Using LPDMs 

Moritz Oliveira Makowski, Haoyue Tang, Robin Brase, Friedrich Klappenbach, Andreas Luther, Josef Stauber, Tobias Grasberger, Xinxu Zhao, and Jia Chen
Surface flux footprints are used to link gas or aerosol emissions with atmospheric observations. These footprints quantify the spatially explicit source-receptor relationships between surface emissions and concentration measurements at a specific receptor location and time. Lagrangian Particle Dispersion Models (LPDMs), such as STILT, FLEXPART, or HYSPLIT, are widely used to compute these surface flux footprints. Most footprint-based inverse modeling studies optimize surface fluxes on a country-, continental-, or global scale. Our focus is on predicting surface emissions at a much finer scale, with horizontal resolutions as small as 100 m, using building-resolving meteorological fields with horizontal resolutions as small as 10 m.
 
RETRO (REgional TRansport Operators for atmospheric inverse modeling) is our newly developed atmospheric footprint tool targeting regionally constrained inverse modeling approaches on city-scale domains. RETRO uses HYSPLIT (in STILT mode) as well as MPTRAC (an LPDM) under the hood and introduces various refinements over the original STILT model. This presentation will highlight three of these refinements: background concentration estimation, surface-emission coupling, and ultra-high-resolution footprints (~ 10m).
 
First, we address how RETRO handles concentration variations coming from outside the modeling domain. This is necessary because the concentration observed at a specific location is the result of both nearby surface fluxes as well as a background concentration. We compare different approaches to estimate the spatially and temporally heterogeneous background concentration of urban sensor networks, using either observations (e.g., using an upwind site) or global/regional model products (e.g., CAMS, ICON-ART, WRF-CHEM). Furthermore, we discuss different approaches to connect surface emissions with the particles simulated by the LPDM. The original STILT formulation does not account for elevated emission sources and can be inaccurate for sources near the receptor. We compare existing solutions to these cases, as well as our new approach implemented in RETRO, to refine the STILT formulation. Lastly, we show how 10 m resolution building-resolving CFD wind fields from GRAMM/GRAL can be used to compute ultra-high-resolution footprints in urban areas using the LPDM MPTRAC.

How to cite: Oliveira Makowski, M., Tang, H., Brase, R., Klappenbach, F., Luther, A., Stauber, J., Grasberger, T., Zhao, X., and Chen, J.: RETRO: City-Scale High-Resolution Footprint Modeling Using LPDMs, EGU General Assembly 2026, Vienna, Austria, 3–8 May 2026, EGU26-17311, https://doi.org/10.5194/egusphere-egu26-17311, 2026.

EGU26-18400 | Posters on site | AS3.34

From stationary Eddy covariance systems to mobile gas analyzer platforms: monitoring urban GHGs and air pollutants 

Christophe Espic, Etienne Smith, and Jonas Bruckhuisen

Urban air pollution and greenhouse gas (GHG) emissions stem from diverse sources, including transportation, heating, buildings, waste management, industrial and agricultural activities, and natural events like forest fires. Simultaneous monitoring of air pollutants and GHGs with high selectivity and sensitivity is essential for resolving the complex chemical interactions and source–sink dynamics that characterize urban atmospheres. Accurate measurements across various spatial and temporal scales are essential for modeling and validating emission inventories or satellite observations.

Traditionally, solutions for monitoring air pollutants or GHGs with high precision and temporal resolution have been "one-gas-one-instrument", resulting in large, stationary setups with high energy consumption. MIRO Analytical’s compact laser absorption spectrometer that integrates multiple mid-IR lasers enables simultaneous high-precision measurements of greenhouse gases (CO2, N2O, H2O, CH4, C2H6), pollutants (CO, NO, NO2, O3, SO2, NH3), and trace gases (OCS, HONO, CH2O) within a single instrument. With a time-resolution of up to 10Hz, it is well-suited for detecting the relationships between co-emitted pollutants and GHGs as well as eddy-covariance flux studies.

In this contribution, we showcase the broad variety of MIRO’s MGA analyzers for urban applications.
Thanks to their versatility, the same instrument can be used for: (I) Ambient air monitoring, demonstrated through a comparison campaign at a Zurich air-quality monitoring station, (II) urban eddy-covariance measurements, linking GHG fluxes to reactive gas emissions and improving the identification of emission sources and (III) airborne and van-based mobile measurements, enabling flexible deployment across urban environments. This unique multi-purpose approach provides insights that go beyond standard monitoring techniques and contributes to a deeper and more comprehensive understanding of the complex urban atmosphere.

Key words: eddy covariance, multi-compound gas analyzer, mobile monitoring, GHG fluxes, air pollutants

How to cite: Espic, C., Smith, E., and Bruckhuisen, J.: From stationary Eddy covariance systems to mobile gas analyzer platforms: monitoring urban GHGs and air pollutants, EGU General Assembly 2026, Vienna, Austria, 3–8 May 2026, EGU26-18400, https://doi.org/10.5194/egusphere-egu26-18400, 2026.

EGU26-18406 | Posters on site | AS3.34

Mobile and Low-Cost Measurement Systems for Indoor and Outdoor Urban Air Quality Characterization 

Jens Voigtländer, Jan-David Förster, Andrea Cuesta, Sebastian Düsing, Anne Wiesner, and Mira Pöhlker

In a rapidly changing world characterized by increasing urbanization and climate change, urban air quality monitoring is essential for advancing fundamental process understanding, assessing environmental impacts, understanding human exposure to air pollution, and supporting evidence-based mitigation strategies in densely populated areas.
The TROPOS Institute has a long-standing track record in developing and applying mobile measurement systems for the comprehensive characterization of aerosol particle properties, including particulate matter (PM), particle number size distributions, and black carbon (BC), which are key indicators of urban air quality. The institute’s expertise spans from hardware design and sensor integration to laboratory-based calibration and long-term quality assurance. Building on these mobile “backpack” platforms and leveraging state-of-the-art low-cost sensor technology, further miniaturized sensor packages have been developed for different indoor and outdoor applications in scientific, as well as engagement and educational projects.
These activities represent a continuous and iterative development process, with systems being regularly adapted to emerging scientific needs and technological advances. A major emphasis is placed on the development of scalable data infrastructures aligned with Internet-of-Things (IoT) concepts. This includes the implementation of MQTT-based communication protocols and the integration of SQL-based database solutions for reliable data storage, management, and analysis. As a result, these developments enable real-time data analysis and facilitate deployment in sensor networks as key improvements. 
The developed instruments are applied across a wide range of interdisciplinary scientific contexts, including local and regional atmospheric studies, large-scale European research projects, but also education and knowledge transfer activities. They support high-resolution, spatiotemporal observations of particulate air quality in diverse urban and indoor environments, providing robust tools for both scientific research and practical applications. As an example, modular low-cost instruments combined with an innovative interactive online platform were successfully applied in the collaborative educational project EngageMINT, in which more than 150 young participants measured air quality parameters and were engaged for environmental topics together with scientists. Furthermore, 15 innovative and very user-friendly devices, named AQBIE (Air Quality Beacon and Immission Evaluator), were developed and applied for several months in a different study exploring indoor air quality to capture seasonal effects of air pollution, mainly the impact of winter biomass burning.

How to cite: Voigtländer, J., Förster, J.-D., Cuesta, A., Düsing, S., Wiesner, A., and Pöhlker, M.: Mobile and Low-Cost Measurement Systems for Indoor and Outdoor Urban Air Quality Characterization, EGU General Assembly 2026, Vienna, Austria, 3–8 May 2026, EGU26-18406, https://doi.org/10.5194/egusphere-egu26-18406, 2026.

EGU26-19136 | ECS | Orals | AS3.34

Sorption Dynamics of Formaldehyde on Microplastics and Indoor Materials: Experiments and 1D‑Box Modelling Insights 

Subhadarsi Nayak, Adrien Gandolfo, Frederic Thevenet, Manolis N. Romanias, and Liselotte Tinel

Formaldehyde remains one of the most critical indoor air pollutants due to its ubiquity, reactivity, and harmful health effects (Salthammer et al., 2010). In recent years, microplastics (MPs) have also been reported as a critical indoor air pollutant (Zhang et al., 2020). Although sorption processes of formaldehyde on indoor surfaces have a significant impact on their persistence and spatial distribution, quantitative data on material-specific adsorption behavior are currently scarce, especially for emerging pollutants like MPs. This study provides a systematic experimental investigation of formaldehyde sorption onto the surface of fresh and O3-aged MPs, such as Low-density polyethylene (LDPE), polyvinyl chloride (PVC), Polyether ether ketone (PEEK) (PlasticsEurope, 2018; Stober et al.,1984), and also common indoor materials: cement, gypsum, conventional paint, and depolluting paint. Uptake measurements were performed in a flow reactor coupled with selective ion flow tube mass spectrometry (SIFT-MS) to enable real-time monitoring of formaldehyde. Experiments were performed at room temperature across a wide range of formaldehyde concentrations (100–550 ppb), under both dry air and 50% relative humidity. The objective was to determine formaldehyde partition coefficients, Ke, on the surfaces of interest.

The partitioning coefficient (Ke) of formaldehyde to MPs was found to be very low, at least two orders of magnitude lower than that of common indoor materials. Ozone aging and relative humidity influenced formaldehyde uptake, with the extent of this effect varying depending on the type of MP studied. However, in all cases, Ke values for MPs remained significantly below those measured for typical indoor surfaces. Under humid conditions (50% RH), depolluting paint exhibited the highest partitioning capacity, followed by conventional paints, gypsum, and cement. These findings suggest that, despite their growing presence in indoor environments, MPs are unlikely to have a significant contribution in formaldehyde loss compared to conventional building materials.

To evaluate the impact of the experimentally derived Ke-values on indoor air quality and identify dominant loss processes, we implemented them in a modified 1D-box model (Fiorentino et al., 2021) representing a typical room, based on the IRINA (Harb et al., 2016) experimental facility. Simulations considered a pollution episode and included ventilation, gas-phase reactions with atmospheric oxidants, and heterogeneous uptake on room surfaces. Results show that heterogeneous loss dominates formaldehyde removal indoors, with rates over an order of magnitude higher than gas-phase processes. Depolluting paint under 50% RH led to the fastest concentration decline. These results highlight the key role of surface interactions in indoor air quality and the importance of material choice in controlling pollutant levels. The combined experimental–modelling approach facilitates improved predictions of pollutant behavior in indoor environments and promotes the development of more potent passive depollution strategies.

References:

Salthammer, T. et al (2010) Chem. Rev. 110, 2536–2572.

Zhang, Y. et al (2020) Earth-Sci. Rev. 203, 103118.

PlasticsEurope (2018) Plastics – the Facts 2018.

Stober, E. J. et al (1984) Polymer 25, 1845–1852.

Fiorentino, E. A. et al (2021) Geosci. Model Dev. 14, 2747-2780.

Harb, P. et al (2016) Chem. Eng. J. 306, 568-578.

How to cite: Nayak, S., Gandolfo, A., Thevenet, F., Romanias, M. N., and Tinel, L.: Sorption Dynamics of Formaldehyde on Microplastics and Indoor Materials: Experiments and 1D‑Box Modelling Insights, EGU General Assembly 2026, Vienna, Austria, 3–8 May 2026, EGU26-19136, https://doi.org/10.5194/egusphere-egu26-19136, 2026.

EGU26-19544 | ECS | Orals | AS3.34

Urban CO2 inversions for Paris using ICOS Cities observations and GRAMM/GRAL 

Robert Maiwald, Hervé Utard, Mali Chariot, Hugo Denier van der Gon, Michel Ramonet, Olivier Laurent, and Sanam N. Vardag

Cities contribute substantially to anthropogenic greenhouse gas emissions and are increasingly implementing mitigation policies.  Robust, sector-resolved emission estimates are needed to assess the effectiveness of these policies. We analyse the capabilities of an inversion framework with a 10m resolution transport model to provide sector-specific emission estimates for the city of Paris.

We use the atmospheric transport model GRAMM/GRAL to compute hourly steady-state wind fields and concentration maps covering central Paris with a horizontal resolution of 10 m. The high resolution makes it possible to simulate street channelling and building effects in densely populated urban areas.

We use two different prior inventories of anthropogenic CO2 fluxes – TNO GHGco_v4 and Origins.earth – and the Vegetation Photosynthesis and Respiration Model (VPRM) for the biogenic fluxes at high spatial and temporal resolution. We then evaluate the spatial and temporal patterns of the simulated concentrations with in-situ measurements from the ICOS Cities project’s network of mid- and high-cost instruments in Paris and discuss shortcomings and uncertainties induced by the model.

Finally, we conduct a Bayesian inversion for an optimized emission estimate based on the available CO2 data for 2023 and 2024. We assess the robustness of the inversion by testing the sensitivity of posterior fluxes on key methodological choices and input data sets, and we discuss the implications of our findings for the city of Paris.

How to cite: Maiwald, R., Utard, H., Chariot, M., Denier van der Gon, H., Ramonet, M., Laurent, O., and Vardag, S. N.: Urban CO2 inversions for Paris using ICOS Cities observations and GRAMM/GRAL, EGU General Assembly 2026, Vienna, Austria, 3–8 May 2026, EGU26-19544, https://doi.org/10.5194/egusphere-egu26-19544, 2026.

EGU26-20168 | ECS | Orals | AS3.34

A Source Focused Approach Applied to Urban Mobile Measurements 

Elinor Tidmarsh, Sri Hapsari Budisulistiorini, James Lee, Marvin Shaw, and David Carslaw

Mobile measurements have emerged as a powerful tool for characterising air pollutant sources, providing high-resolution spatial and temporal information that complements fixed monitoring stations. In this study, we used mobile measurements to investigate air pollution across York, England. High time resolution measurements were made of nitrogen oxides (NOx), carbon dioxide (CO2), methane (CH4), fine particulate matter (PM2.5) and over 20 individual volatile organic compounds (VOCs). The measurements were made on a pre-defined route and repeated 19 times across different times of the day, days of the week, and seasons. The measurement route covered the densely populated city centre, characterised by heavy traffic and numerous commercial activities, such as restaurants and beauty salons, and extended to the outskirts dominated by agricultural land and green spaces. This spatial coverage allows the investigation of contrasting local emission sources, including poorly quantified source types such as restaurants and traffic-related emissions, as well as background pollutant concentrations affected by regional source contributions. Our study explores how best to partition the measurements into background and local increments to investigate the nature of the sources affecting measurements across the city. We also explore the potential of using information on individual source locations for sectors such as restaurants as a method to examine the relationship between source density and pollutant concentration. We derive the source factor through advanced Gaussian modelling of individual sources based on their location and local meteorology. The results demonstrate the applicability of mobile measurements combined with the source factor method for resolving fine-scale variability in urban air pollution. 

How to cite: Tidmarsh, E., Budisulistiorini, S. H., Lee, J., Shaw, M., and Carslaw, D.: A Source Focused Approach Applied to Urban Mobile Measurements, EGU General Assembly 2026, Vienna, Austria, 3–8 May 2026, EGU26-20168, https://doi.org/10.5194/egusphere-egu26-20168, 2026.

EGU26-20306 | Posters on site | AS3.34

Linking Indoor Commercial Source Emissions to Outdoor Volatile Organic Compounds Using Mobile Measurements 

Sri Hapsari Budisulistiorini, Thomas Moore, Marvin Shaw, Will Drysdale, James Lee, and David Carslaw

Assessing the impact of indoor volatile organic compound (VOC) sources on outdoor concentrations remains challenging due to their variability, rapid dispersion, and chemical reactions in the atmosphere. Mobile monitoring can address these challenges by providing spatial and temporal resolution of localized emission sources. In this study, we developed a new approach to characterize the impact of indoor emissions on outdoor air quality using mobile measurements. We used geographic information to identify the locations of hundreds of individual source types in Bradford, England, including restaurants, beauty salons, and automobile repair shops. For each source type, we modeled the potential hourly contribution using an advanced Gaussian plume modeling system across approximately 57 hours of mobile measurements. The outcome is a single source factor for each latitude-longitude coordinate at each hour of the measurement campaign, representing the influential level of each source type. We then applied K-means clustering to group source factors based on their spatial distributions and influence levels, and analyzed their relationship with the incremental concentrations of VOCs and NOx using a generalized additive model. Several previously identified key tracer compounds showed strong correlations with specific source factors. These include m/z 102 (tentatively assigned as butanone) with auto repair source factor, m/z 88 (acetone) with beauty salon source factor, and m/z 68 (isobaric compounds: isoprene and furan) with restaurant source factor. By clustering the source factor metric, we linked these emission sources to VOC concentrations at different locations along the mobile measurement route. Our method offers a new perspective on air quality monitoring by using source location information to inform the analysis of mobile VOC measurements, complementing existing source characterization approaches.

How to cite: Budisulistiorini, S. H., Moore, T., Shaw, M., Drysdale, W., Lee, J., and Carslaw, D.: Linking Indoor Commercial Source Emissions to Outdoor Volatile Organic Compounds Using Mobile Measurements, EGU General Assembly 2026, Vienna, Austria, 3–8 May 2026, EGU26-20306, https://doi.org/10.5194/egusphere-egu26-20306, 2026.

EGU26-21198 | Posters on site | AS3.34

An urban air quality sensor network in Enschede, the Netherlands: Opportunities for science, technology, education, and policy 

Marloes Penning de Vries, Farzaneh Dadrass Javan, Johannes Flacke, Frank Ostermann, and Wim Timmermans

An air quality (AQ) network consisting of roughly 100 low-cost sensors and 12 high-quality AQ instruments is currently being set up in Enschede, the Netherlands. The network is part of Infrastructure Twente for Environmental Monitoring (ITEM), based at the University of Twente, which integrates climate, meteorological and hydrological observations in the region. By introducing AQ sensors in in an area with low sensor coverage, the ITEM-AQ network has the potential to improve local air quality estimates, enable enhanced monitoring, model evaluation, early-warning systems, and source apportionment.

The network will support a wide range of  scientific investigations, including the interaction between air pollution and extreme temperatures in affecting human health, and the extent to which air quality exposure varies with socio-economic status. At the same time, ITEM-AQ will serve as a test bed to improve instrumentation, data handling, storage and sharing, leveraging both new and existing platforms (e.g., samenmeten.nl). Measurements from static AQ stations will be complemented by observations  from instruments mounted on Uncrewed Aerial Vehicles that can provide atmospheric profiles in addition to near-surface  “nose level” observations.

The ITEM-AQ infrastructure offers substantial opportunities for integration into university education and training. Stakeholders will be engaged from an early stage to co-create relevant and actionable outputs. At a later stage, data gathered by the AQ network will be integrated into an urban digital twin to aid policy development and evaluation.

How to cite: Penning de Vries, M., Dadrass Javan, F., Flacke, J., Ostermann, F., and Timmermans, W.: An urban air quality sensor network in Enschede, the Netherlands: Opportunities for science, technology, education, and policy, EGU General Assembly 2026, Vienna, Austria, 3–8 May 2026, EGU26-21198, https://doi.org/10.5194/egusphere-egu26-21198, 2026.

EGU26-21412 | ECS | Orals | AS3.34

CLMS-Cities: Towards monitoring CO2 emissions on the neighbourhood scale in European cities based on Copernicus data 

Robert Spirig, Stavros Stagakis, Konstantinos Politakos, Beatriz García-Moncó Piñeiro, Zina Mitraka, Emmanouil Panagiotakis, Katy Karampour, Elisa Covato, Owen Cranshaw, Mauricia Benedito Bordonau, Alessandra Gandini, Manuel Benito Moreno, Andres Simon Moral, Cristina Monaco, Alessandra Feliciotti, Faezeh Kazemihatami, Ana Monteiro, Zaheer Khan, Nektarios Chrysoulakis, and Mattia Marconcini

With the ever-increasing realisation that measures against climate change have to be local, many cities opted to become NetZero (i.e., CO2-Neutral, emissions compensated) in the near future. Especially within the EU, a large-scale project takes place driven in close collaboration between the EU and cities. The “EU Cities Mission” facilitates urban transition via supporting actions and strategies towards neutrality by offering official labelling to cities that create successful climate city contracts and commit to achieve CO2-Neutrality by 2030. The Horizon project CLMS-Cities targets to support cities with quantifying and trenching their CO2 emissions based on existing and freely available Copernicus Services, in particular within CLMS (Copernicus Land Monitoring Service Cities) and in-situ data such as GNSS based mobility data. Within CLMS-Cities a CO2 exchange model for local-scale scope 1 CO2 emissions is developed at 10m resolution at hourly scale for the five sectors: mobility, buildings, industrial sources, AFOLU (Agriculture, Forestry and other land uses), and human respiration following closely typical city inventories. 
We here present first results and the background of the model for the case study city Vitoria-Gasteiz, Spain (Tier 1 city). The model is mainly based on the Urban Atlas and produces estimates of CO2 exchange by integrating relevant Copernicus services, satellite products and third-party mobility data. To ensure robustness, the model is paired with local-scale eddy covariance observations in the city centre of Vitoria-Gasteiz. Following this validation process, the model will be extended and rolled out to ten additional EU Mission cities to ensure that it accommodates a wide range of spatial, urban and environmental contexts, that is seen across the real cities in the EU. A co-design approach underpins this work, with continuous engagement with cities to ensure that their requirements are fully integrated in the design, development and operationalisation of the model. 

How to cite: Spirig, R., Stagakis, S., Politakos, K., García-Moncó Piñeiro, B., Mitraka, Z., Panagiotakis, E., Karampour, K., Covato, E., Cranshaw, O., Benedito Bordonau, M., Gandini, A., Benito Moreno, M., Simon Moral, A., Monaco, C., Feliciotti, A., Kazemihatami, F., Monteiro, A., Khan, Z., Chrysoulakis, N., and Marconcini, M.: CLMS-Cities: Towards monitoring CO2 emissions on the neighbourhood scale in European cities based on Copernicus data, EGU General Assembly 2026, Vienna, Austria, 3–8 May 2026, EGU26-21412, https://doi.org/10.5194/egusphere-egu26-21412, 2026.

EGU26-21732 | ECS | Orals | AS3.34

Overview of indoor air pollution measurements in elementary schools in Denmark and impacts of air-purification devices: a case study 

Varun Kumar, Frederik Hildebrand, Bjarne Jensen, Christel Christoffersen, Abdillahi Hussein Omar, Henrik W. Madsen, Christian Brix Nielsen, Louise Bøge Frederickson, Vibeke Heitmann Gutzke, Charlotte Gabel, Karin Rosenkilde Laursen, Torben Sigsgaard, Martin Ole Bjært Sørensen, Lise Lotte Sørensen, Jakob Klenø Nøjgaard, and Andreas Massling

Air pollution is the leading Global Burden of Disease risk factor [1]. People spend most of the time indoors and especially children are estimated to spend 90% of their day in indoor environments [2] where they are exposed to indoor air pollution. Children are particularly susceptible to the effects of air pollution, as their faster breathing rate and immature bodies make them more prone to accumulating higher concentrations of pollutants in their bodies [3]. As part of the Horizon Europe project LEARN, we measured indoor air pollution in four elementary schools in Denmark. Our measurements comprised several air-quality parameters such as particulate matter (PM) mass focusing on PM2.5, particle number (PN), and black carbon (BC). The study followed a single blinded crossover design with measurements carried out in two classrooms in parallel. One classroom had an air-purification device with particulate filter in operation (intervention) and the other had an air-purification device without a filter installed (sham) in a randomized manner. The researchers were aware of the presence/absence of the intervention, while children and teachers were blinded. Each measurement campaign lasted five to six weeks including a baseline, intervention, wash-out period, and sham. Fig. 1 shows diurnal variation in PM2.5 levels in two different classrooms with and without intervention. Interestingly, between 8:00-14:00 on weekdays when the classrooms were occupied, measurements showed an increase in PM2.5 indicating high exposure during their school hours. The effects of air-purification device are clearly visible as PM2.5 levels are lower at times when classrooms had the intervention. The absolute mass concentrations are not final as no sensor calibration factors have yet been applied to data shown here. During the next step of the study, we will investigate the factors leading to high PM2.5 concentrations indoors during the classroom hours and suggest mitigation strategies for air pollutants improving indoor air quality in schools. We will also investigate the effects of PM2.5 on children’s cognitive functions during school hours. First results on the efficiency of air purification systems within our studies suggest that such set-ups can improve air quality in classrooms to a significant extent. However, more detailed analysis needs to be conducted before final assessment of this effect can be made.

Fig. 1: Comparison of diurnal variation in PM2.5 for individual classes i.e., a.) classroom 1 and b.) classroom 2 with intervention periods and sham intervention periods.

References:

1. Murray, C. J. L. et al. Global burden of 87 risk factors in 204 countries and territories, 1990–2019: a systematic analysis for the Global Burden of Disease Study 2019. The Lancet 396, 1223–1249 (2020).

2. de Gennaro, G. et al. Indoor air quality in schools. Environ. Chem. Lett. 12, 467–482 (2014).

3. Bennett, W. D., Zeman, K. L. & Jarabek, A. M. Nasal Contribution to Breathing and Fine Particle Deposition in Children Versus Adults. J. Toxicol. Environ. Health A 71, 227–237 (2008).


How to cite: Kumar, V., Hildebrand, F., Jensen, B., Christoffersen, C., Omar, A. H., Madsen, H. W., Nielsen, C. B., Frederickson, L. B., Gutzke, V. H., Gabel, C., Laursen, K. R., Sigsgaard, T., Sørensen, M. O. B., Sørensen, L. L., Nøjgaard, J. K., and Massling, A.: Overview of indoor air pollution measurements in elementary schools in Denmark and impacts of air-purification devices: a case study, EGU General Assembly 2026, Vienna, Austria, 3–8 May 2026, EGU26-21732, https://doi.org/10.5194/egusphere-egu26-21732, 2026.

This study employs a high-resolution modeling framework to quantify traffic-derived contributions to air pollution exposure in Augsburg, Germany, integrating a multi-scale model chain with agent-based population dynamics for exposure assessment. The microscale PALM4U model is driven by a customized WRF4PALM tool for a dynamic driver (meteorology, chemistry and aerosol) and utilizes a customized SALSA+SIMPLE mechanism with a source-tagging scheme. This enhancement explicitly isolates pollutants from road traffic, enabling direct attribution of NO₂, ultrafine particles (UFP), and trace metals within PM₂.₅ to vehicular emissions.

A novel aspect of the workflow is the integration of an agent-based model (ABM), which is informed by population mobility and activity data from the KORA (Kooperative Gesundheitsforschung in der Region Augsburg) cohort in Augsburg. The ABM simulates detailed spatiotemporal trajectories of individuals, providing dynamic urban emissions and enabling the reconstruction of personalized exposure profiles. The coupled PALM-ABM system overlays high-resolution, time-resolved exposure metrics such as inhaled dose and peak concentrations for traffic-attributable pollutants.

The model’s accuracy is rigorously evaluated through a multi-scale validation approach. First, simulated city-wide concentration fields are compared with the measurements from regulatory air quality stations in Augsburg and detailed pollutant speciation data from the Joint Environmental Exposure Center (JEEC) measurement station. Second, spatial patterns are assessed against satellite observations (e.g., TROPOMI NO₂ vertical columns) to ensure consistency at the urban-to-regional scale.

This integrated framework provides unprecedented, source-resolved insights into the contribution of traffic to personal air pollution exposure in a real urban environment. It quantifies the dominant influence of traffic on NO₂ and UFP concentrations at the street scale, while also explaining the trace metals in PM₂.₅. The robust multi-source validation spanning ground stations, specialized monitoring, and satellite data ensures the reliability of both the meteorological-chemistry model and the exposure reconstruction. This methodology establishes the health-oriented urban air quality management and for evaluating the effectiveness of traffic-related emission reduction strategies.

How to cite: Vaithiyanadhan, S. K. and Knote, C.: Urban scale modelling of NO2, ultrafine particles, metal components in particulate matter in Augsburg, Germany, for health applications, EGU General Assembly 2026, Vienna, Austria, 3–8 May 2026, EGU26-21928, https://doi.org/10.5194/egusphere-egu26-21928, 2026.

A key challenge in modern epidemiology is understanding the source-related effects of air pollution on health. Large-scale studies traditionally use measurements of outdoor reference monitoring stations as metrics of exposure. However, these measurements are often poorly correlated with personal exposure levels due to varying local sources, microenvironmental settings, attenuation effects of the building envelops and individual behavioural patterns. My research expands the capabilities of low-cost sensors by developing analytical techniques to maximise extracted information: 

  • A time-activity model to classify major exposure-related microenvironments using as input readily gathered parameters from smartphone technologies. to provide a comprehensive picture of environmental health risks during daily life.
  • A novel source apportionment method to characterise local and regional emission sources, and review how the low-cost sensor measurements can be used as proxies for more detailed measurements.

This integrated technological and analytical framework can revolutionise the fields of indoor exposure, building science and epidemiology. Health models using improved exposure metrics indicate the strong influence of source-related exposure on health.

How to cite: Chatzidiakou, L.: Integrated technological and computational tools to capture detailed personal exposure for improved health models, EGU General Assembly 2026, Vienna, Austria, 3–8 May 2026, EGU26-22310, https://doi.org/10.5194/egusphere-egu26-22310, 2026.

Evaluating urban mobility scenarios typically relies on single-metric assessments—CO2 reductions, modal shares, or air quality indices—that fail to capture trade-offs between environmental effectiveness, social equity, and policy feasibility. A scenario delivering maximum emission cuts may exacerbate inequalities; one prioritising accessibility may underperform on climate targets. Decision-makers need multi-dimensional frameworks that make these trade-offs explicit and comparable across contexts.

We present the Key Performance Indicator (KPI) framework developed within IMTECC (Integrated Multimodal Traffic Emissions Climate and Cities), a Sino-European collaboration funded by ANR, Innovation Fund Denmark, and NSFC, involving LISA-CNRS, University of Copenhagen, Aarhus University, Zhejiang University, and the Municipality of Copenhagen. The framework structures scenario evaluation across six pillars and fourteen sub-dimensions:

• Climate & Pollution: emission reductions, net-zero pathway alignment, public health impacts 
• Society & Lifestyles: behavioural shifts, inequality trends 
• Mobility & Transport: pricing and incentives, multimodality, infrastructure upgrades 
• Technology & Innovation: low-emission vehicle penetration, ITS optimisation 
• Governance & Policy: master plan integration, low-emission zone implementation 
• Territorial: urban typology coherence, innovation cluster development 

This structure enables systematic cross-city comparison between Paris (OLYMPUS-CHIMERE platform), Copenhagen (COMPASS transport model), and Hangzhou, despite differences in modelling approaches and local policy contexts.

For the Paris metropolitan area, four scenarios at the 2035 horizon are evaluated against this KPI matrix:
• Scenario A (Reference): Baseline trajectory. 
• Scenario B (Densification): 220,000 inhabitants and 140,000 jobs relocated within 800m of Grand Paris Express stations. 
• Scenario C (LEZ + Electrification): 50% electric vehicle target with reinforced emission standards. 
• Scenario E1 (Progressive LEZ + Equity): Gradual implementation with social support for vulnerable households.

The KPI matrix reveals differentiated scenario profiles. Scenario C scores highest on climate & pollution indicators (emission reductions, net-zero alignment) but neutral on inequality trends. Scenario B shows balanced performance across territorial coherence, multimodality, and master plan integration. Scenario E1 achieves the strongest score on inequality trends while maintaining moderate climate performance—demonstrating that equity need not be sacrificed for environmental ambition.

Cross-pillar analysis exposes synergies and tensions: scenarios combining electrification with densification (B+C hybrid) could maximise both climate and territorial scores, while pure technology-push approaches (C alone) leave behavioural and equity dimensions unaddressed. A composite sustainability index weighting GHG emissions, travel times, population exposure, exposure inequalities, and non-fossil energy share is proposed to support multi-criteria decision-making. This KPI-based approach, aligned with the Integrated Urban System framework promoted by the World Meteorological Organization, offers a replicable methodology for evidence-based urban climate governance.

How to cite: Elessa Etuman, A., Coll, I., Benoussaid, T., and Costes, M.: A multi-dimensional KPI framework for evaluating urban mobility scenarios: Integrating air quality, climate, and equity metrics across three metropolitan areas, EGU General Assembly 2026, Vienna, Austria, 3–8 May 2026, EGU26-23261, https://doi.org/10.5194/egusphere-egu26-23261, 2026.

EGU26-1719 | ECS | Posters on site | AS3.35

Geometric Form and Density Govern Microplastic Particle Kinetics During Aeolian Transport 

Lucrecia Alvarez Barrantes, Joanna E. Bullard, Cheryl McKenna Neuman, and Patrick O’Brien

Microplastics (MP) have been found in most terrestrial areas of the Earth including rural, remote and isolated locations where the only expected source is through atmospheric transport and deposition. Currently, there has been limited research on the mechanics of microplastic transport by wind, and in particular, the similarities and differences between the motion of mineral grains and microplastic particles within boundary layer flows. Such information is needed to lay the foundation for the development of models of mineral-microplastic interaction during transport in the environment. This study examines the influence of geometric form on the dynamics of microplastic particle entrainment and transport by wind. Using high speed photography, a series of particle tracking velocimetry (PTV) measurements were obtained in wind tunnel experiments to quantify and compare the kinetics of nylon fibres (volume equivalent spherical diameter (deq) of 314 µm ),  polyethylene terephthalate fragments (deq=215 µm), polyethylene spheres (deq=182 µm), and quartz sand (deq=267 µm) during flight within a wall bounded airflow. Particular attention is given to quantifying the 2D velocity components of each particle as it approached and impacted the bed surface, as compared to the consequent rebound/ejection event. Preliminary results show that microplastic particles—particularly spheres, fragments, and fibres—exhibit higher transport velocities than quartz sand but impact the surface at shallower angles. These findings suggest that existing sediment transport models may require adaptation to account for the distinct behaviours of microplastics in aeolian systems.

How to cite: Alvarez Barrantes, L., Bullard, J. E., McKenna Neuman, C., and O’Brien, P.: Geometric Form and Density Govern Microplastic Particle Kinetics During Aeolian Transport, EGU General Assembly 2026, Vienna, Austria, 3–8 May 2026, EGU26-1719, https://doi.org/10.5194/egusphere-egu26-1719, 2026.

EGU26-2071 | ECS | Posters on site | AS3.35

Dynamics of microplastics across the air–sea interface: enrichment in the sea-surface microlayer, foam, and links to regional biogeochemistry 

Sajjad Abbasi, Maryam Saemi-Komsari, Andrew Turner, and Jeroen E. Sonke

We used a simultaneous, multi-compartment sampling approach to quantify microplastics (MPs) in the coastal zone of the Persian Gulf during winter and summer. Samples were collected from subsurface seawater, the sea-surface microlayer (SML), sea foam, suspended atmospheric particles and deposited dust. MPs were dominated by fibres of varied sizes and colours and, based on µ-Raman analysis of a subset, comprised thermoplastics, thermoplastic elastomers, synthetic rubbers and resins. MPs were strongly enriched in the SML and in sea foam relative to underlying seawater (enrichment factors on the order of 10², using SML thickness estimates up to 1000 µm), indicating the SML is a key reservoir and mediator of air–sea exchange. Estimated settling velocities in the lower atmosphere (derived from suspended concentrations and depositional fluxes) ranged from ~28 to 47 m h⁻¹, and size- and shape-dependent fractionation was evident: the finest fraction (<100 µm) showed greater affinity for the atmospheric phase, while larger particles were preferentially retained in aqueous reservoirs. Notably, the proportion of MPs as fibres correlated with concentration ratios involving Ca²⁺ (the only major seawater ion showing non-conservative behaviour), suggesting that regional biogeochemical processes (e.g., precipitation, flocculation, organic binding) may influence MP partitioning and fractionation. These observations point to coupled physical (bubble-mediated ejection, wave breaking, deposition) and biogeochemical controls on MP dynamics at the air–sea boundary. Our results highlight the SML and foam as critical compartments for MP accumulation and transfer and underscore the need for targeted laboratory and longer-term field studies to unravel mechanistic links between MP behaviour and coastal biogeochemistry.


Acknowledgements

This project received funding from the European Union’s Horizon Europe research and innovation program under the Marie Skłodowska-Curie Actions Grant Agreement No. 101153990.

How to cite: Abbasi, S., Saemi-Komsari, M., Turner, A., and E. Sonke, J.: Dynamics of microplastics across the air–sea interface: enrichment in the sea-surface microlayer, foam, and links to regional biogeochemistry, EGU General Assembly 2026, Vienna, Austria, 3–8 May 2026, EGU26-2071, https://doi.org/10.5194/egusphere-egu26-2071, 2026.

EGU26-3432 | ECS | Orals | AS3.35

Reconciling modeled and observed atmospheric microplastics: a physically consistent framework reduces global emission estimates by a factor of 20 

Ian Hough, Nela Dobiasova, Théo Segur, Didier Voisin, Ruth Price, Jeroen Sonke, Jennie L. Thomas, and Hélène Angot

Atmospheric transport is central to the global cycling of microplastics, yet model-based estimates of emissions, concentration, and deposition remain highly uncertain. A critical challenge arises from the mismatch between models, which simulate microplastics as mass-based tracers, and observations, which are typically reported as particle counts and are often limited by microscopy techniques that fail to detect the smallest modeled particles.

To address this, we extend previous work1 and use the GEOS-Chem global chemical transport model to simulate atmospheric microplastic  emissions, transport, and removal. We develop a physically consistent framework to reconcile simulations with observations by: (i) deriving a size distribution for atmospheric microplastics from literature data; (ii) extrapolating observations to the model’s size range, and (iii) converting particle counts to mass using literature-based assumptions about shape and density.

Our results show that this framework reduces simulated global emissions by a factor of 20, with the contribution of marine sources decreasing from over 50% to just 20% of total emissions. The revised global emission estimate (~15 Gg/year) aligns with recent studies suggesting lower emissions than previously thought.2,3 Our findings highlight the need for standardized experimental methods, reporting of particle size distributions, and consistent frameworks to compare modeled and observed microplastics.

References:

1. Fu, Y. et al. Modeling atmospheric microplastic cycle by GEOS-Chem: An optimized estimation by a global dataset suggests likely 50 times lower ocean emissions. One Earth 6, 705–714 (2023). 

2. Bucci, S., Richon, C. & Bakels, L. Exploring the Transport Path of Oceanic Microplastics in the Atmosphere. Environ. Sci. Technol. 58, 14338–14347 (2024).

3. Yang, S., Brasseur, G., Walters, S., Lichtig, P. & Li, C. W. Y. Global atmospheric distribution of microplastics with evidence of low oceanic emissions. Npj Clim. Atmospheric Sci. 8, 1–10 (2025). 

How to cite: Hough, I., Dobiasova, N., Segur, T., Voisin, D., Price, R., Sonke, J., Thomas, J. L., and Angot, H.: Reconciling modeled and observed atmospheric microplastics: a physically consistent framework reduces global emission estimates by a factor of 20, EGU General Assembly 2026, Vienna, Austria, 3–8 May 2026, EGU26-3432, https://doi.org/10.5194/egusphere-egu26-3432, 2026.

Despite growing concern regarding the wet deposition of atmospheric microplastics (MPs), the role of particle morphological complexity in controlling deposition efficiency and atmospheric transport remains insufficiently understood. Characterising MP geometry is essential for analysing aerodynamic behaviour and environmental interactions. This study presents the first quantitative assessment of the fractal dimension (FD) of microplastics deposited via rainfall in Central Europe. Over a 14‑month period, rainwater samples were collected from urban residential and traffic‑influenced areas in Wroclaw, Poland, using a passive sampler positioned 5 m above ground level. Advanced morphological characterisation was conducted using scanning electron microscopy (SEM), followed by vector‑based geometric analysis implemented in Python for particle classification and FD estimation. Mean MP abundances were 135 ± 89 particles L⁻¹ in the residential area and 168 ± 64 particles L⁻¹ in the traffic‑influenced area. Fibres dominated wet deposition and exhibited a narrow FD range (1.10 ± 0.15), indicating smooth, elongated geometries with low structural complexity. Fragments were observed less frequently and showed greater morphological variability; however, the analysis focuses primarily on fibres because they are more common. These findings demonstrate that fractal dimension provides a quantitative descriptor of microplastic morphological complexity and may serve as an indicator of aerodynamic behaviour and environmental fate in atmospheric systems.

How to cite: Rasheed, Z. and Bęcek, K.: Quantifying Morphological Complexity and Wet Deposition of Microplastics Abundance: A Case Study of Wroclaw, Poland, EGU General Assembly 2026, Vienna, Austria, 3–8 May 2026, EGU26-3707, https://doi.org/10.5194/egusphere-egu26-3707, 2026.

EGU26-3800 | ECS | Orals | AS3.35

Nano-/micro-plastics could be an important source of ice-nucleating particles 

Shuling Chen, Jie Chen, Cameron McErlich, Arthur Chan, Heike Wex, Zamin Kanji, Laura Revell, Yanxu Zhang, Xi Zhao, and Xianda Gong

Nano-/micro-plastics (NMPs) are ubiquitous anthropogenic pollutants in the atmosphere. However, their impact on cloud microphysical properties and climate dynamics remains poorly understood. Here, we show that several types of NMPs can effectively trigger heterogeneous ice nucleation under mixed-phase cloud conditions. At −20 °C, the number of nucleation sites per unit mass of NMPs varied by more than one order of magnitude and is higher than that of marine organic aerosol, but lower than that of K-feldspar. Combining the developed ice nucleation parameterization with the global concentrations of NMPs, we found that the NMPs are an important source of ice-nucleating particles (INPs) globally, particularly in urban areas with high population density and extensive road networks, as well as in cities with concentrated textile industries, where tire wear particles and polyester exhibit relatively high ice-nucleation efficiency. By serving as INPs, NMPs can modulate the cloud microphysical properties and substantially affect longwave and shortwave cloud forcing. With the expected increase of NMP emissions in the future, we believe that NMPs may play a crucial role in influencing cloud microphysical properties and the broader climate system.

How to cite: Chen, S., Chen, J., McErlich, C., Chan, A., Wex, H., Kanji, Z., Revell, L., Zhang, Y., Zhao, X., and Gong, X.: Nano-/micro-plastics could be an important source of ice-nucleating particles, EGU General Assembly 2026, Vienna, Austria, 3–8 May 2026, EGU26-3800, https://doi.org/10.5194/egusphere-egu26-3800, 2026.

Urban road dust in Vienna, Austria’s capital, is a complex reservoir of microplastics (MPs) and anthropogenic magnetic particles, acting as a vector and source of environmental pollution. This study presents the first comprehensive analysis of road dust in Vienna using magnetic separation to investigate MPs and their association with magnetic properties. Seven urban sites were sampled, and dust was fractionated into 0.2–0.1 mm, 0.1–0.05 mm, and <0.05 mm particle sizes. Magnetic susceptibility (χ), frequency-dependent susceptibility (χfd%), anhysteretic remanent magnetization (χARM), and hysteresis parameters were measured to characterize magnetic minerals, while MPs were quantified and polymer types identified using laser direct infrared imaging (LDIR).

Results show that the finest fraction (<0.05 mm) is entirely magnetic, enriched in superparamagnetic and ferrimagnetic particles, whereas intermediate and coarse fractions contain both magnetic and non-magnetic components. Magnetic extracts contained the highest MPs concentrations, up to 25,423 particles/g, predominantly polypropylene (PP) and polyurethane (PU), indicating strong traffic-related sources such as brake dust and tire wear. Non-magnetic fractions were dominated by polyethylene (PE) and polyethylene terephthalate (PET), reflecting consumer waste contributions. Magnetic separation revealed hidden MPS patterns and enabled clear differentiation of polymer flows across particle sizes using Sankey diagrams.

Microplastic contamination was assessed with the Microplastic Contamination Factor (MCF) and Pollution Load Index (MPLI). The largest magnetic fractions showed dangerous to extremely dangerous MPLI levels (19.6–36.9), while medium fractions ranged from moderate to high contamination, and the finest fraction (<0.05 mm) was mostly uncontaminated except at one hotspot (27.4). Non-magnetic fractions exhibited moderate contamination primarily in the medium size fraction, confirming that traffic-related magnetic dust is the main contributor to urban MPs pollution. Hierarchical cluster analysis highlighted co-varying patterns among MPs, magnetic properties, and traffic intensity, indicating that local environmental factors influence MPs distribution beyond direct vehicular load.

These findings demonstrate that magnetic separation combined with granulometric analysis is a powerful tool for tracing microplastics in road dust and assessing their ecological significance. Fine, highly magnetic fractions concentrate MPSs from vehicular sources, representing the highest environmental risk due to potential atmospheric transport and runoff into soil and water systems. Coarser and non-magnetic fractions reflect additional inputs from infrastructure degradation and urban waste, emphasizing the multiplicity of sources. This study provides the first quantitative evidence linking magnetic properties of road dust with microplastic pollution in Vienna, Austria, and highlights the value of magnetic monitoring for rapid identification of high-risk dust fractions. Overall, this work establishes a baseline for urban MPs contamination in Vienna, showing strong size-dependent and magnetism-dependent patterns in road dust, and offers an effective methodology for future monitoring and risk assessment of microplastic pollution in urban environments.

This research was funded in whole by the National Science Centre, Poland under grant number 2021/43/D/ST10/00996.

How to cite: Kida, M., Dytłow, S. K., and Ziembowicz, S.: "Dust in the Fire" : First Investigation of Microplastics in Urban Road Dust via Magnetic Separation of Strong and Weak Components in Vienna, Austria, EGU General Assembly 2026, Vienna, Austria, 3–8 May 2026, EGU26-4046, https://doi.org/10.5194/egusphere-egu26-4046, 2026.

EGU26-5085 | ECS | Posters on site | AS3.35

The four Seasons of Micro- and Nanoplastic in the Air 

Milena Latz, Elke Ludewig, and Dušan Materić

Micro- and nanoplastics (MNPs) are contaminants of emerging concern. With current research focusing mostly on their detection in the aquatic and terrestrial environment, atmospheric MNPs remain underrepresented. Recent studies confirm, that not only ingestion but also inhalation can be seen as a major exposure pathway, increasing exposure risks for humans and all air-breathing organisms.1 Moreover, the particle's ability to reach even remote areas through long-range atmospheric transport increases their threat as an environmental pollutant.2–4 Still, studies focusing on long-term monitoring of MNPs are scarce and their impact in the atmosphere is still poorly investigated.5,6

For this study, we sampled airborne MNPs using a PM10 Cascade Impactor over the course of 52 continuous weeks, separating our collected particles into four size-dependent fractions. Samples were subsequently analyzed using a high-resolution analytical method: TD-PTR-MS. Through qualitative and semi-quantitative analysis of even sub 1 µm particles, we successfully detected six common polymer types (PE, PP, PS, PVC, PET, TWP). By implementing this yearlong monitoring station at Sonnblick Observatory in the Austrian Alps, we were able to collect a significant dataset of MNPs pollution levels in the remote alpine region. We established current contamination levels in the atmosphere, while also being able to research the influence of seasonality including other meteorological parameters in more detail.

This study aims to present robust evidence of current contamination levels, possibly supporting ongoing policy dialogues and informing evidence-based decision-making.

References

[1] Rajendran, D. & Chandrasekaran, N. Journey of micronanoplastics with blood components. RSC Adv. 13, 31435–31459; 10.1039/D3RA05620A (2023).

[2] Illuminati, S. et al. Microplastics in bulk atmospheric deposition along the coastal region of Victoria Land, Antarctica. Sci. Total Environ. 949, 175221; 10.1016/j.scitotenv.2024.175221 (2024).

[3] Rosso, B. et al. Characteristics and quantification of small microplastics (<100 µm) in seasonal svalbard snow on glaciers and lands. J. Hazard. Mater. 467, 133723; 10.1016/j.jhazmat.2024.133723 (2024).

[4] Jurkschat, L. et al. Using a citizen science approach to assess nanoplastics pollution in remote high-altitude glaciers. Sci Rep 15, 1864; 10.1038/s41598-024-84210-9 (2025).

[5] Pradel, A., Catrouillet, C. & Gigault, J. The environmental fate of nanoplastics: What we know and what we need to know about aggregation. NanoImpact 29, 100453; 10.1016/j.impact.2023.100453 (2023).

[6] Kaushik, A., Peter, A. E., van Pinxteren, M., Scholz-Böttcher, B. M. & Herrmann, H. Composition, interactions and resulting inhalation risk of micro- and nano-plastics in urban air. Commun. Earth Environ. 6; 10.1038/s43247-025-02980-0 (2025).

How to cite: Latz, M., Ludewig, E., and Materić, D.: The four Seasons of Micro- and Nanoplastic in the Air, EGU General Assembly 2026, Vienna, Austria, 3–8 May 2026, EGU26-5085, https://doi.org/10.5194/egusphere-egu26-5085, 2026.

EGU26-5122 | ECS | Orals | AS3.35

A global atmospheric microplastics dataset and model-assisted insights into their atmospheric emissions 

Ioanna Evangelou, Silvia Bucci, and Andreas Stohl

Microplastics, defined as synthetic polymers from 1 μm to 5 mm, are manufactured for specific purposes or created from the fragmentation and degradation of larger plastic items in the environment. Microplastics are transported by wind and water, can traverse long distances in the atmosphere, and pose ecological and potential human-health risks by acting as vectors for additives and pollutants. Despite increasing attention, their atmospheric distribution remains poorly understood. Although observations are becoming more abundant, estimates of their emissions to the atmosphere differ by orders of magnitude. In this work, we compile a global dataset of atmospheric microplastic measurements and compare it with size-aligned simulations based on the Lagrangian particle dispersion model FLEXPART. The simulations overestimate measured global median concentrations up to four orders of magnitude. Median concentrations above land are 27 times higher than over the ocean (0.08 versus 0.003 particles m-3). Using a simple scaling approach, we infer that the oceanic source emits fewer particles than terrestrial sources. We estimate annual emissions of 6.1×10¹⁷ (1.3×10¹⁷-1.1×10¹⁸) particles yr-1 from land and 2.6×10¹⁶ (2.7×10¹⁵-5.0×10¹⁶) particles yr-1 from the ocean. Land sources dominate particle counts but not mass, highlighting the need to better constrain the emission size distributions.

How to cite: Evangelou, I., Bucci, S., and Stohl, A.: A global atmospheric microplastics dataset and model-assisted insights into their atmospheric emissions, EGU General Assembly 2026, Vienna, Austria, 3–8 May 2026, EGU26-5122, https://doi.org/10.5194/egusphere-egu26-5122, 2026.

EGU26-7277 | ECS | Orals | AS3.35

Using the power law size distribution to extrapolate and compare microplastic number and mass concentrations in environmental media 

Théo Segur, Ian Hough, Nela Dobiasova, Didier Voisin, Camille Richon, Hélène Angot, Jennie L. Thomas, and Jeroen E. Sonke

Studies reporting environmental MP concentrations typically do so for variable MP size ranges, depending on sampling, processing and analytical detection methods. However, microplastic (MP) number concentrations in the environment increase exponentially with decreasing particle size. This leads to difficulties in intercomparison and extrapolation of studies, which is critical for data reviews, plastic dispersion modelling, and environmental and human health risk assessment. To address these challenges, we collected 90 MP particle size distributions (PSDs) from 55 published studies that observed environmental MP in the atmosphere, ocean surface, and deep ocean. The data are compiled in the online MPsizeBase open access database (https://zenodo.org/records/17380284). Improving from published methods (Kooi et al., 2021; Kooi and Koelmans, 2019), a new MP size-alignment framework based on the power law distribution is proposed and validated (Segur et al., 2026). This framework is then applied to the MPsizeBase data to extrapolate observed MP number and mass concentrations to the full MP size range (1 to 5000 µm, noted MP1-5000µm), or any other sub-size range. Our findings reveal distinct fragmentation patterns: power law slopes for fragments (−2.76 ± 0.62) are significantly steeper than for fibers (−1.84 ± 0.38), underscoring differences in their environmental behavior. Strikingly, reported airborne MP concentrations (0.8–37 MP m⁻³) fall 35–130 times below extrapolated values (up to 4800 MP m⁻³ for fragments), with mass concentrations reaching 0.06–22 µg m⁻³. Similarly, atmospheric deposition fluxes (90–190 MP m⁻² d⁻¹) are 80–140 times lower than extrapolated estimates (up to 16,000 MP m⁻² d⁻¹), with mass deposition of 10–190 µg m⁻² d⁻¹. These disparities underscore a pressing need: standardized size extrapolation is essential to harmonize datasets, refine risk assessments, and disentangle true environmental trends from methodological biases.

References

Kooi, M. and Koelmans, A. A.: Simplifying Microplastic via Continuous Probability Distributions for Size, Shape, and Density, Environ. Sci. Technol. Lett., 6, 551–557, https://doi.org/10.1021/acs.estlett.9b00379, 2019.

Kooi, M., Primpke, S., Mintenig, S. M., Lorenz, C., Gerdts, G., and Koelmans, A. A.: Characterizing the multidimensionality of microplastics across environmental compartments, Water Research, 202, 117429, https://doi.org/10.1016/j.watres.2021.117429, 2021.

Segur, T., Hough, I., Dobiasova, N., Voisin, D., Richon, C., Angot, H., Thomas, J. L., and Sonke, J. E.: Using the power law size distribution to extrapolate and compare microplastic number and mass concentrations in environmental media, https://doi.org/10.21203/rs.3.rs-8524083/v1, 8 January 2026.

How to cite: Segur, T., Hough, I., Dobiasova, N., Voisin, D., Richon, C., Angot, H., Thomas, J. L., and Sonke, J. E.: Using the power law size distribution to extrapolate and compare microplastic number and mass concentrations in environmental media, EGU General Assembly 2026, Vienna, Austria, 3–8 May 2026, EGU26-7277, https://doi.org/10.5194/egusphere-egu26-7277, 2026.

EGU26-8968 | ECS | Orals | AS3.35

Quantification of Micro- and Nanoplastic Formation from Flexible- and Rigid Plastic Products under Photooxidation 

Soeun Eo, Sang Hee Hong, Yulee Jang, and Won Joon Shim

When plastic waste is released into the environment, it undergoes weathering processes that lead to the formation of micro- and nanoplastics (MNPs). In recent years, the production mechanisms of secondary MNPs and their surface property changes during weathering have been widely studied. However, information on these fragmented particles remains limited compared to that on parent plastics, particularly with respect to quantitative assessments of particle generation. In this study, we investigated the changes in surface characteristics of flexible- (zipper bags made of low-density polyethylene) and rigid plastic products (single-use plastics made of polypropylene and polyethylene) after photooxidation, and quantified the generated MNPs to calculate their fragmentation rates. Neither plastic exhibited naturally formed surface cracks during exposure. However, both materials became progressively hardened after approximately 100 days of photooxidation and fragmented readily when subjected to external stress. The carbonyl index increased consistently with exposure duration, indicating ongoing photooxidative degradation. These results demonstrate that photooxidation induces polymer embrittlement, which substantially enhances susceptibility to fragmentation under subsequent mechanical abrasion. Generation of MNPs increased markedly when mechanical abrasion followed photooxidation. For flexible plastics, photooxidation alone did not show a clear exposure-dependent trend in particle generation, whereas the application of mechanical abrasion resulted in an estimated annual production of 9,573,818 particles/cm². For rigid plastics, annual particle production increased from 3,251,032 particles/cm² under photooxidation alone to 11,884,373 particles/cm² when combined with mechanical abrasion. This study demonstrates that photooxidation under atmospheric conditions progressively embrittles both flexible and rigid plastics, while subsequent mechanical abrasion accelerates MNP formation. These findings indicate that various weathering factors should be considered when quantifying secondary MNP generation and evaluating polymer-specific fragmentation behavior.

This research was supported by 'Land/Sea-based input and fate of microplastics in the marine environment' of Korea Institute of Marine Science & Technology Promotion (KIMST) funded by the Ministry of Oceans and Fisheries, Republic of Korea (RS-2022-KS221604).

How to cite: Eo, S., Hong, S. H., Jang, Y., and Shim, W. J.: Quantification of Micro- and Nanoplastic Formation from Flexible- and Rigid Plastic Products under Photooxidation, EGU General Assembly 2026, Vienna, Austria, 3–8 May 2026, EGU26-8968, https://doi.org/10.5194/egusphere-egu26-8968, 2026.

EGU26-10538 | Posters on site | AS3.35

Thermal desorption and analysis of atmospheric nanoplastics via PTR-MS 

Rene Gutmann, Andreas Klinger, Markus Müller, and Martin Graus

Nanoplastics (NP) represent a global anthropogenic pollutant. Aerosolized NP enter the atmosphere and are eventually deposited in precipitation and surface waters, facilitating their entry into the food chain. Due to their small size, these particles can translocate within organisms and penetrate tissues and cells. While the health effects of environmental exposure levels remain poorly understood, the continuous increase in global concentrations is a growing concern. However, the characterization and analysis of aerosolized or deposited NP are analytically challenging.

In this study, we present a newly developed low-volume thermal desorption (TD) solution that is directly interfaced to a proton-transfer-reaction mass-spectrometer (PTR-TOF 6000X2, IONICON Analytik GmbH, Austria) for real-time detection of volatile organic compounds at lowermost concentrations. The TD unit allows for precise temporal temperature control up to 400°C. These temperatures are sufficient to efficiently thermolyze a large fraction of common NP into PTR-MS detectable volatile organic compounds (VOCs). In most cases, the released VOCs serve as specific markers for plastic identification: for instance, styrene for polystyrene (PS), methyl methacrylate for polymethyl methacrylate (PMMA), and terephthalic acid for polyethylene terephthalate (PET). Polyvinyl chloride (PVC) is identified via aromatic compounds such as benzene and naphthalene, while polyethylene (PE) exhibits a characteristic homologous series of alkenes and alkanes.

To validate this TD method, commercial monodisperse solutions of PS and PMMA were prepared with concentrations ranging from 0 to 60 ng in HPLC-grade water that was prefiltered through a 0.2 µm PTFE syringe filter. These samples were contained in precleaned headspace vials baked in a vacuum oven at 150°C and 10 mbar for >5 h to eliminate potential contaminants. After an evaporation step in a vacuum desiccator, the dry samples were heated in the TD unit and the thermolysis products were transferred in a controlled carrier gas (Air or N2) to the PTR-MS for quantitative analysis. Several replicates were prepared for each sample, along with laboratory blanks. Respective signals were integrated, and linear regressions were calculated. We achieved an R2 of 0.99 with a 3σ limit of detection (LOD) of 2.8 ng for PS, and an R2 of 0.98 with an LOD of 9.2 ng for PMMA.

We further present initial results from samples containing deposited NP and explore data analysis methods based on matrix factorization.

How to cite: Gutmann, R., Klinger, A., Müller, M., and Graus, M.: Thermal desorption and analysis of atmospheric nanoplastics via PTR-MS, EGU General Assembly 2026, Vienna, Austria, 3–8 May 2026, EGU26-10538, https://doi.org/10.5194/egusphere-egu26-10538, 2026.

EGU26-10867 | Posters on site | AS3.35

Global Atmospheric Microplastics Emissions Estimated Using Constrained Bayesian Inverse Modeling 

Ondřej Tichý, Michal Uliáš, Ioanna Evangelou, Václav Šmídl, and Nikolaos Evangeliou

We present an analysis of global atmospheric microplastics (MPs) concentration and deposition measurements using constrained Bayesian inverse modeling to estimate global MPs emissions. The proposed Bayesian framework explicitly accounts for unknown ratios between size fractions inherent to MPs measurements and incorporates prior emission information to stabilize the inversion. The coupling between observations and unknown emissions is established using the atmospheric transport model FLEXPART version 11 operated in backward mode for each measurement. Model parameters are inferred using a variational Bayes approach, resulting in an iterative estimation scheme that updates both model parameters and the effective spatial structure of the computational domain. This methodology reduces the need for manual intervention during the inversion process and limits potential bias in the results. The resulting global MPs emission estimates are evaluated against previously published ones.


Acknowledgment:

This research has been supported by the Czech Science Foundation (grant no. GA24-10400S). N.E. was funded by the Norwegian Research Council (NFR) project MAGIC (No.: 334086). FLEXPART model simulations are cross-atmospheric research infrastructure services provided by ATMO-ACCESS (EU grant agreement No 101008004). The computations were performed on resources provided by Sigma2 - the National Infrastructure for High Performance Computing and Data Storage in Norway.

How to cite: Tichý, O., Uliáš, M., Evangelou, I., Šmídl, V., and Evangeliou, N.: Global Atmospheric Microplastics Emissions Estimated Using Constrained Bayesian Inverse Modeling, EGU General Assembly 2026, Vienna, Austria, 3–8 May 2026, EGU26-10867, https://doi.org/10.5194/egusphere-egu26-10867, 2026.

EGU26-11335 | Posters on site | AS3.35

Bayesian Top-Down Pattern-Restricted Estimates of Atmospheric Microplastics Emissions using Gibbs sampler 

Vaclav Smidl, Ioanna Evangelou, Václav Košík, Nikolaos Evangeliou, and Ondřej Tichý

We present a top-down estimate of atmospheric microplastics (MPs) emissions based on deposition measurements, optimized against an atmospheric transport model (ATM). The central challenge of this work is the severe ill-posedness of the spatial-temporal inverse problem, as emissions cannot be uniquely inferred from the limited number of available measurements. To regularize the inversion, we constrain emissions to follow physically motivated source patterns associated with global road dust, agricultural activities, bare soils, and ocean surface, while estimating their strengths. The relationship between emissions and measurements is established using source–receptor sensitivity (SRS) fields calculated using the ATM Flexpart 11. To estimate source strengths and rigorously quantify uncertainties, we employ a Bayesian inversion framework with a hierarchical prior model, whose parameters are inferred using Gibbs sampler. This approach avoids excessive tuning and enables a realistic representation of uncertainty arising from measurements, transport modeling, and emission assumptions. The inferred atmospheric MPs emissions ranges are broadly consistent with existing literature and measurements from different areas around the world, and the framework provides a transparent and robust quantification of uncertainty in global atmospheric MPs emissions.


Acknowledgment:

This research has been supported by the Czech Science Foundation (grant no. GA24-10400S). N.E. were funded by the Norwegian Research Council (NFR) project MAGIC (No.: 334086). FLEXPART model simulations are cross-atmospheric research infrastructure services provided by ATMO-ACCESS (EU grant agreement No 101008004). The computations were performed on resources provided by Sigma2 - the National Infrastructure for High Performance Computing and Data Storage in Norway.

How to cite: Smidl, V., Evangelou, I., Košík, V., Evangeliou, N., and Tichý, O.: Bayesian Top-Down Pattern-Restricted Estimates of Atmospheric Microplastics Emissions using Gibbs sampler, EGU General Assembly 2026, Vienna, Austria, 3–8 May 2026, EGU26-11335, https://doi.org/10.5194/egusphere-egu26-11335, 2026.

EGU26-12721 | ECS | Orals | AS3.35

Laboratory Investigation of Nanoplastic Mixing States with Water-Soluble Coatings using Single-Particle Mass Spectrometry 

Lin Kong, Alex Lee, Man Nin Chan, Isabel García Castellanos, and Arthur Chan

Nanoplastic particles (NPPs) are increasingly recognized as an emerging class of atmospheric aerosol. However, their mixing state with inorganic and organic aerosol components remains poorly constrained, limiting our understanding of their atmospheric lifecycle and environmental fate. Conventional bulk aerosol measurements often obscure particle-to-particle chemical heterogeneity, complicating predictions of NPP transport, deposition, and cloud-relevant properties.

Here, we present an online mass spectrometric approach using an Aerosol Mass Spectrometer (AMS) to resolve the mixing state of NPPs in real time by combining event-trigger single-particle (ETSP) measurements with complementary bulk analysis. This approach extends recent AMS-based efforts for real-time NPP detection from bulk tracers to particle-resolved mixing-state constraints. Controlled laboratory experiments were conducted to simulate atmospheric mixing, in which polystyrene-NPP suspensions were atomized and mixed with representative inorganic and organic constituents, including ammonium nitrate, ammonium sulfate, sodium chloride, and succinic acid. Chemically resolved single-particle mass spectra were analyzed using unsupervised k-means clustering to separate externally mixed particle populations from internally mixed NPP–coating systems.

We identified distinct particle classes characterized by the co-occurrence of polymer fragments (e.g., styrene-related ions) with coating-specific ions (e.g., nitrate markers), enabling the direct differentiation of coated versus uncoated NPPs at the single-particle level. The derived mixing-state index (χ) varied systematically across coating types (ranging from 10% to 40%), indicating a transition from external to partial internal mixing under controlled conditions. Coated NPPs further exhibited distinct vaporization kinetics and temporal ion profiles relative to bare particles, reflecting particle-level interactions between polymer cores and inorganic or organic coatings and providing independent evidence for internal mixing that is not discernible from bulk-averaged spectra.

These results illustrate how the AMS can be effectively leveraged to quantitatively constrain the mixing state of NPPs. This work provides a methodological foundation for identifying polymeric particles within complex atmospheric aerosol matrices and for improving the representation of NPPs in atmospheric transport and lifecycle models, where mixing state is a key but largely unconstrained parameter.

How to cite: Kong, L., Lee, A., Chan, M. N., Castellanos, I. G., and Chan, A.: Laboratory Investigation of Nanoplastic Mixing States with Water-Soluble Coatings using Single-Particle Mass Spectrometry, EGU General Assembly 2026, Vienna, Austria, 3–8 May 2026, EGU26-12721, https://doi.org/10.5194/egusphere-egu26-12721, 2026.

EGU26-13137 | Posters on site | AS3.35

Understanding the sources of atmospheric microplastics 

Silvia Bucci, Ioanna Evangelou, and Andreas Stohl

A direct consequence of the increasing number of atmospheric micro- and nanoplastic observations is the need for designing reliable atmospheric modelling, capable of describing their emission processes and transport. At the current state of the art, one of the main uncertainties lies in the identification of source regions and their relative contributions to observed atmospheric concentrations. In this work, we aim at comparing different atmospheric concentration studies in urban, periurban and remote locations, and their associated atmospheric transport analysis. The objective is to determine whether current source knowledge is sufficient to explain the observed variability, and whether any contribution (e.g. oceans, populated areas, agricultural activities) emerges as dominant.

The analysis covers a collection of data from literature, including total mass concentrations from Thermal Desorption–Proton Transfer Reaction–Mass Spectrometry (TD-PTR-MS) and particle-counting data from µ-Raman and Fourier Transform Infrared (FTIR) spectroscopy. Backward simulations from FLEXPART v11 (Bakels et al. 2024) are used to evaluate the consistency between observed MP variability and candidate source regions. For some datasets, statistically significant correlations (up to ~80%) are found between modelled source sensitivities and observed concentrations, indicating that some source contributions are well captured, particularly in free-tropospheric regimes. However, in the cases in which a greater variety of sources was potentially involved, the analysis showed weak or absent correlations, highlighting both gaps in the current emission inventories hypothesis and limitations in the comparability of available observations.

Overall, our results indicate that no dominant single source can explain atmospheric microplastic observations across all environments. In the free troposphere, oceanic and mineral dust-related sources often emerge as main contributors, while near-surface and urban observations display more complex and site-specific signatures. These findings underscore the need for case-by-case source attribution, improved emission characterisation, and closer integration between modelling and measurement strategies to robustly constrain the atmospheric microplastic budget.

How to cite: Bucci, S., Evangelou, I., and Stohl, A.: Understanding the sources of atmospheric microplastics, EGU General Assembly 2026, Vienna, Austria, 3–8 May 2026, EGU26-13137, https://doi.org/10.5194/egusphere-egu26-13137, 2026.

EGU26-13429 | Posters on site | AS3.35

Co-emission of Siloxane Compounds with Polyester Nanofibers from Household Laundry Dryer Exhaust 

Alex Lee, Michael Tawadrous, and Arthur Chan

Airborne nanoplastics (NPs) are an emerging class of environmental contaminants with potential implications for air quality and human exposure, yet their sources remain poorly characterized. Given the widespread use of synthetic fibers in textiles and the recognition of household laundry washing as a major source of nanofibers to aquatic environments, this study aims to investigate emissions and characteristics of airborne polyester nanofibers released from household laundry dryer exhaust. Using online aerosol mass spectrometry (AMS) coupled with particle sizing measurements, particle emissions from drying polyester textiles with fleece-knitted and pile-weave fabric constructions were quantified and chemically resolved. This study presents the first direct observation of the co-emission of airborne polyester nanofibers and siloxane compounds, likely originating from fabric surface treatments. For pile-weave fabrics, major siloxane-related fragments contributed up to 11.5% of the total organic aerosol (OA) mass. Distinct polyester marker ions were reproducibly detected from five different polyester fabrics, but they accounted for less than 3% of the total OA mass measured during the drying process. Particle size measurements revealed an additional coarse mode peaking at approximately 3 µm, indicative of microfiber emissions, although their number concentrations were two orders of magnitude lower than those of nanoparticles peaking near 300 nm. Emission factors showed strong dependence on fabric construction and retained moisture, ranging from 0.1 to 10.5 mg of total organic mass per kilogram of polyester fabric. Under realistic moisture content scenarios, Canada-wide emissions of total organic aerosol from household laundry drying are estimated to be on the order of 1–10 tonnes per year. While this suggests that laundry drying is unlikely to be a major contributor to ambient PM2.5 mass in Canada, the potential human health and environmental implications of co-emitted polyester nanofibers and siloxane compounds warrant further investigation.

How to cite: Lee, A., Tawadrous, M., and Chan, A.: Co-emission of Siloxane Compounds with Polyester Nanofibers from Household Laundry Dryer Exhaust, EGU General Assembly 2026, Vienna, Austria, 3–8 May 2026, EGU26-13429, https://doi.org/10.5194/egusphere-egu26-13429, 2026.

EGU26-13584 | ECS | Posters on site | AS3.35

Microplastic Deposition Flux in Vienna  

Hannah Brown, Fabiana Corami, Beatrice Rosso, Thilo Hofmann, Manuel Schachinger, Bernadett Weinzierl, Agnieszka Kupc, Andreas Stohl, and Silvia Bucci

Microplastic Deposition Flux in Vienna

Atmospheric microplastic deposition presents an important pathway for plastic pollution in all ecosystems, yet quantitative data on atmospheric deposition fluxes in urban areas remain sparse. This study quantifies atmospheric microplastic deposition fluxes in Vienna using a combined observational and modelling approach. Specifically, atmospheric deposition is measured using a wet and dry passive sampler, allowing separate calculations of wet and dry deposition fluxes. Samples are collected daily over one-week campaigns during winter, spring, and autumn to enable the calculation of daily deposition fluxes and evaluation of seasonal variability. These samples are processed using a recently developed technique called oleo extraction and are then analysed via Fourier transform infrared spectroscopy and microscopy (Micro-FT-IR) for particle identification and classification. Additionally, wind speed and direction are used in correlation analyses against deposition to assess the influence of local sources, whilst FLEXPART Lagrangian dispersion modelling is applied to evaluate the contribution of long-range atmospheric transport. Preliminary results from the pilot study and autumn sampling campaign have confirmed the identification of microplastic particles in the deposition fluxes (e.g. 40-50 µm fragments of polypropylene and polyvinyl chloride). Alongside this, the preliminary analysis shows in several samples a dominant fraction of dark particles below 10µm in diameter, occasionally detected by the Micro-FT-IR as rubber. Due to their size, morphology and colour, we suspect them to be tire wear particles. This would confirm the dominant role of traffic related sources on the microplastic particles detected in urban air. In contrast to previous studies, the analysis of the first collected samples shows a very low percentage of plastic microfibers.  These findings highlight the importance of gaining microplastic deposition fluxes in urban environments, along with their dominant source processes.

How to cite: Brown, H., Corami, F., Rosso, B., Hofmann, T., Schachinger, M., Weinzierl, B., Kupc, A., Stohl, A., and Bucci, S.: Microplastic Deposition Flux in Vienna , EGU General Assembly 2026, Vienna, Austria, 3–8 May 2026, EGU26-13584, https://doi.org/10.5194/egusphere-egu26-13584, 2026.

EGU26-13639 | Orals | AS3.35

Atmospheric contribution of nanoplastics to North Atlantic Ocean  

Nemat Omidikia, Helge Niemann, Alex Baker, and Rupert Holzinger

Nanoplastics (d ≤ 1 µm) are now recognized as ubiquitous contaminants throughout the Earth system. However, the mechanisms governing their transport and exchange between environmental compartments remain poorly constrained. Although elevated concentrations of nanoplastics have been reported in the North Atlantic Ocean, their dominant sources and transport pathways still require clarification. Marine nanoplastics may originate from the fragmentation and physicochemical degradation of larger plastic debris entering the ocean, but atmospheric transport and dry deposition represent an additional, potentially important pathway supplying nanoplastics to remote oceanic regions.


In this study, thermal desorption proton-transfer-reaction mass spectrometry (TD-PTR-MS), coupled with multicomponent multivariate standard addition (MMSA), was applied to quantify nanoplastics collected on aerosol filters during a research expedition across the North Atlantic Ocean from Vigo, Spain, to the Bahamas in November–December 2023. Nanoplastics from five major polymer classes—polystyrene (PS), polyethylene (PE), polyvinyl chloride (PVC), polypropylene (PP), and polyethylene terephthalate (PET)—were detected in all air samples.


The results reveal substantially higher nanoplastic concentrations in air masses influenced by continental sources, with a pronounced decrease over the mid-Atlantic region. Concentrations ranged from 2.01 to 11.69 ng m⁻³ for PS, 7.12  to 59.71 ng m⁻³ for PVC, 9.94  to 50.91  ng m⁻³ for PE, 6.99 to 44.77 ng m⁻³ for PP, and 10.54 to 35.31 ng m⁻³ for PET.

These findings demonstrate that atmospheric transport plays a central role in controlling the distribution of nanoplastics over the North Atlantic and constitutes a major pathway linking terrestrial plastic emissions to the remote ocean.

How to cite: Omidikia, N., Niemann, H., Baker, A., and Holzinger, R.: Atmospheric contribution of nanoplastics to North Atlantic Ocean , EGU General Assembly 2026, Vienna, Austria, 3–8 May 2026, EGU26-13639, https://doi.org/10.5194/egusphere-egu26-13639, 2026.

EGU26-13984 | ECS | Posters on site | AS3.35

HoLDI mass spectrometry for rapid, solventless detection of airborne nanoplastics and co-occurring aerosol organics 

Zi Wang, Nadim Saadé, Robert Panetta, and Parisa Ariya

Nanoplastics are increasingly recognized as an atmospheric contaminant with potential implications for exposure and climate-relevant aerosol processes, yet routine detection in real-world air remains limited by laborious sample preparation, contamination risk, and poor cross-study comparability. Here we present a practical analytical workflow built around a 3D-printed hollow laser desorption/ionization (HoLDI) target that adapts MALDI time-of-flight mass spectrometry for direct, solventless analysis of particles collected on common aerosol substrates. We integrate HoLDI-MS with size-resolved aerosol sampling (cascade impactor) and real-time particle sizing (SMPS/OPS), complemented by electron microscopy and EDS for morphology and elemental context. Indoor air measurements reveal polymer signatures consistent with polyethylene, polyethylene glycol, and polydimethylsiloxanes, with higher relative signal intensities in the microscale size fractions than in the submicron range, indicating a size-dependent distribution and/or detection efficiency in complex indoor matrices. In outdoor air, HoLDI-MS captures polycyclic aromatic hydrocarbon patterns with relatively stronger signals in the nanoscale fractions, underscoring the capability to concurrently track plastic-related polymers and non-plastic organic aerosol constituents across size modes. HoLDI provides an accessible, rapidly deployable pathway toward harmonized, size-resolved chemical fingerprints of airborne nano/microplastics and co-occurring aerosols, helping close critical observational gaps needed for exposure assessment and atmospheric process studies.

How to cite: Wang, Z., Saadé, N., Panetta, R., and Ariya, P.: HoLDI mass spectrometry for rapid, solventless detection of airborne nanoplastics and co-occurring aerosol organics, EGU General Assembly 2026, Vienna, Austria, 3–8 May 2026, EGU26-13984, https://doi.org/10.5194/egusphere-egu26-13984, 2026.

EGU26-14530 | ECS | Posters on site | AS3.35

From clothing to atmospheric fallout: characterising direct microplastic fibre emissions in air 

Marlene Haase and Silvia Bucci

Synthetic textiles are estimated to be a major source of airborne microplastic pollution and microplastic fibres can be found in dry and wet atmospheric deposition in various sample media (air, water and sediment). While this is well known, there is little understanding of the contribution given by the direct emission from synthetic garments. Current literature often focusses more on microfibre emission during washing processes although the majority of microfibres in the environment are considered to originate from land-based sources. This project aims to determine the parameters that will help constrain the role of direct emission from synthetic clothing. This is achieved by performing shedding experiments on clothes under dry friction. Released fibres are collected and characterised in terms of number, length, width and morphology using digital microscopy. Since the majority of synthetic clothing consists of polyester mixed with other synthetic or natural materials, garments made of different polyester blends were tested and the relative amount of shed fibres was determined. The influence of garment age is also tested by performing shedding experiments on similar types of clothing with varying ages. Preliminary results show that the peak of the size distribution for the length of all emitted fibres lies at 310 ± 150 μm and the aspect ratio distribution peak is 16 ± 3. The findings of this project will provide important parameters directly relevant to assess whether the emitted particles are compatible with atmospheric transport processes and inhalation and will direct the designing for further targeted experiments.

How to cite: Haase, M. and Bucci, S.: From clothing to atmospheric fallout: characterising direct microplastic fibre emissions in air, EGU General Assembly 2026, Vienna, Austria, 3–8 May 2026, EGU26-14530, https://doi.org/10.5194/egusphere-egu26-14530, 2026.

EGU26-14540 | ECS | Posters on site | AS3.35

Direct atmospheric emissions of polyester microfibres from clothing 

Valentina Höchtl, Silvia Bucci, Ioanna Evangelou, and Andreas Stohl

The rapid growth of the fast fashion industry over recent decades has led to a significant increase in global textile fibre production, with polyester becoming the dominant component. Concurrently, clothing is recognised as the predominant source of atmospheric polyester microfibres. The process of mechanical friction occurring during everyday outdoor human activities, e.g. walking, results in continuous polyester microfibre shedding into the air. Although this has significant consequences for both the environment and human health, the direct atmospheric emissions of polyester microfibres from clothing during everyday use have largely been overlooked.
This study aims at assessing the role of direct emission from the population and testing if it is the primary driver of airborne polyerster microfibers. For this, backward simulations with the Lagrangian particle dispersion model FLEXPART v11 (Bakels et al., 2024) are being conducted for a range of measurement sites located across Europe, with a focus on both urban and rural regions to investigate source-receptor relationships. To obtain the source contribution, emission sensitivities are coupled with gridded population density data to determine spatial emission patterns and to evaluate their consistency with reported airborne and deposited polyester microfibre observations. Forward simulations are utilised for sensitivity studies, in which polyester microfibre size distributions, aspect ratios, and emission factors are systematically varied to assess their influence on aerodynamic behaviour and atmospheric transport. The applied modelling framework enables the investigation of links between everyday clothing use and atmospheric polyester microfibre burdens.

How to cite: Höchtl, V., Bucci, S., Evangelou, I., and Stohl, A.: Direct atmospheric emissions of polyester microfibres from clothing, EGU General Assembly 2026, Vienna, Austria, 3–8 May 2026, EGU26-14540, https://doi.org/10.5194/egusphere-egu26-14540, 2026.

EGU26-15354 | Posters on site | AS3.35

Numerical simulations of bursting bubbles: effects of contamination on droplet ejection and micro- and nanoplastics transport 

Thomas Abadie, AmirHossein Ghaemi, and Ricardo C. Constante-Amores

As air is entrained (e.g. surface wave breaking, waterfalls) or injected (e.g. wastewater aeration) into water, bubbles are formed and either dissolve or rise back to the surface, collapse, and eject droplets. These bubbles that burst at the water surface represent a key contribution to aerosol formation and facilitate the exchange of mass, momentum and energy between water bodies and the atmosphere with significant implications for weather and climate. In addition, environmental and industrial water bodies contain a large number of suspended materials, such as micro- and nanoplastics, pollutants and diverse microorganisms, which can be entrained in the ejected droplet and thereby pose major environmental and health risks.
While recent numerical studies have focused primarily on clean interfaces, the contaminants present in natural and industrial settings affect both the bubble size distribution and droplet ejection mechanisms through Marangoni stresses. The present work aims to characterise drop ejection dynamics in the presence of contaminants, with a focus on Marangoni stresses that lower surface tension and rigidify the interface.  
Numerical simulations of bubbles bursting at a free surface are performed with the open source finite volume solver Basilisk. The mass and momentum conservation equations are solved on a Cartesian grid, using a Volume of Fluid method to capture the air-liquid interface while Adaptive Mesh Refinement allows to capture the jet dynamics. The effects of surface active agents or contaminants, often overlooked until recently in numerical simulations of bursting bubbles, are implemented and validated against experiments. 
Droplet ejection mechanism and the number of drops produced are analysed through regime maps spanning a wide range of Bond, Ohnesorge and Marangoni numbers, which characterise the bubble size, the fluid properties and the contamination effects. In the jetting regime, drops dynamics are characterised in terms of size, velocity, and maximum height. Initial results highlight the crucial damping effects of contaminants on capillary waves and the resulting jet during cavity collapse. The entrainment of micro- and nanoplastics is discussed as a function of particle sizes and concentration, providing insight into the coupling between interfacial physics and aerosol generation.

How to cite: Abadie, T., Ghaemi, A., and Constante-Amores, R. C.: Numerical simulations of bursting bubbles: effects of contamination on droplet ejection and micro- and nanoplastics transport, EGU General Assembly 2026, Vienna, Austria, 3–8 May 2026, EGU26-15354, https://doi.org/10.5194/egusphere-egu26-15354, 2026.

EGU26-16846 | Posters on site | AS3.35

Observations of Size-Segregated Airborne Microplastics in Ho Chi Minh City, Vietnam 

Anh Luong Ngoc Quynh, Yusuke Fujii, Yasuhiro Niida, Minh Tran Hoang, Nguyen Thao Nguyen, Nguyen Thi Thanh Nhon, Ngoc Tran, To Thi Hien, Norimichi Takenaka, and Hiroshi Okochi

Microplastics (MPs), generally defined as plastic particles smaller than 5 mm in diameter, have emerged as an environmental concern owing to their persistence, mobility, and potential impacts on ecosystems and human health. Although previous studies have primarily focused on aquatic and terrestrial environments, airborne MPs (AMPs) have recently attracted increasing attention due to their potential health risks via inhalation. Nevertheless, research on AMPs remains limited. In this study, we characterized AMPs in size-segregated aerosols (PM2.5, PM2.5-10, and PM10<) in HCMC, Vietnam, based on observations conducted during the rainy season in 2023. To our knowledge, this is the first size-segregated AMP investigation in this region.

Aerosol samples were collected at the top of an 11-story office building at the University of Science, Vietnam National University Ho Chi Minh City in HCMC, Vietnam. A multi-nozzle cascade impact sampler was used to continuously collect PM2.5, PM2.5-10, and PM10< on Teflon-coated glass fiber filters over sampling periods of approximately 1 week at a flow rate of 20 L min-1. Following sample collection, the filters were subjected to a series of pretreatment steps, including extraction with ultrapure water, organic removal by hydrogen peroxide solution, and density separation by sodium iodide solution. After pretreatment, AMPs on the filters were identified by attenuated total reflection imaging with micro-Fourier transform infrared spectroscopy (Spectrum3/Spotlight 400; PerkinElmer). Detailed analytical procedures are described in our previous publication (Wang et al., Environ. Chem., Lett., 21, 3055-3062, 2023).

Here, we present the results for the rainy season. AMP concentrations ranged from 0.45 to 3.51 particles m-3 and differed significantly among samples. The polymer composition showed substantial temporal variability throughout the sampling period. Polyethylene (PE) was consistently the most abundant polymer, followed by polyethylene terephthalate (PET), poly(methyl methacrylate) (PMMA), and polypropylene (PP). Other identified polymers included polyethylene/polypropylene copolymers (PE/PP), alkyd resin (alkyd), polyurethane (PU), polyester (PES), ethylene-vinyl acetate (EVA), polyvinyl chloride (PVC), and acrylic polymers. Rubber-related polymers, such as ethylene-propylene-diene monomer rubber (EPDM) and isoprene rubber, were detected in mid-July and early August. These results may suggest the presence of multiple urban sources such as packaging and textile materials, paints and coatings, and traffic-related emissions, with increasing polymer diversity toward August.

Meteorological data and backward air trajectory analyses showed predominantly southwesterly to westerly airflow during the sampling period, with a mean wind speed of 1.61 m s-1. Air masses arriving from the southwest likely reflect the influence of marine air from coastal and ocean regions, whereas trajectories passing over the Mekong Delta may carry particles associated with agricultural activities and nearby industrial areas, including packaging and textile manufacturing. These results suggest that AMP concentrations in HCMC are influenced by both local urban emissions and regional-scale transport.

How to cite: Luong Ngoc Quynh, A., Fujii, Y., Niida, Y., Tran Hoang, M., Thao Nguyen, N., Thi Thanh Nhon, N., Tran, N., Thi Hien, T., Takenaka, N., and Okochi, H.: Observations of Size-Segregated Airborne Microplastics in Ho Chi Minh City, Vietnam, EGU General Assembly 2026, Vienna, Austria, 3–8 May 2026, EGU26-16846, https://doi.org/10.5194/egusphere-egu26-16846, 2026.

EGU26-17765 | Orals | AS3.35

Wet and dry atmospheric deposition of microplastics in Switzerland 

Christoph Hueglin, Narain M. Ashta, Guillaume Crosset-Perrotin, Angélique Moraz, Matthias Philipp, Thomas D. Bucheli, Atiur Md. Rahman, and Ralf Kaegi

Microplastics (MPs) are contaminants of global concern, and the atmosphere plays an important role in distributing these contaminants in the environment.1 We developed a tailored analytical chain – including sample collection, processing, and analysis based on optical microscopy and focal plane array μ-Fourier transform infrared spectroscopy (FPA-μ-FTIR) – to quantify MPs (20-215 μm) in wet and dry atmospheric deposition.2 As part of the sampling setup, an on-site precipitation filtration device was developed to collect particulate wet deposition. An assessment of the total measurement uncertainty was performed, taking into account each individual step of the analytical chain. The resulting total expanded uncertainty was approximately 90% for determining MP numbers in a single wet or dry deposition sample. The conversion of MP numbers and associated size information into MP mass was estimated to generate an additional systematic error of 50%.

The analytical chain developed was used in a one-year monitoring study of atmospheric deposition of MPs in Switzerland. Specifically, we collected wet and dry deposition samples at five stations in Switzerland, including one urban, one suburban, two rural and one mountainous site, on a four-weekly basis. Based on the analysis of these samples, we determined the wet and dry deposition rates at each site both in terms of the number of MPs and MP mass. To put the determined deposition rates into context, we compared the deposition rates of MPs to those of total aerosols or dust as well as of tire wear particles, which were measured in parallel partner projects at the same or similar sites. The sizes and polymer types of MPs found in atmospheric deposition samples are reported. Finally, based on the MP mass deposition at the different sites and land-use statistics in Switzerland, we estimated the total annual deposition of MPs (including tire wear) across Switzerland, including an estimation of MP inputs from the atmosphere to soil and water. We found that the atmospheric deposition of tire wear in Switzerland is by mass about one order of magnitude higher than that of other synthetic polymers.


References

(1) Brahney, J.; Mahowald, N.; Prank, M.; Cornwell, G.; Klimont, Z.; Matsui, H.; Prather, K. A. Constraining the Atmospheric Limb of the Plastic Cycle. Proc. Natl. Acad. Sci. 2021, 118 (16), e2020719118. https://doi.org/10.1073/pnas.2020719118.

(2) Ashta, N. M.; Crosset-Perrotin, G.; Moraz, A.; Stoffel, J.; Schilt, U.; Ceglie, E.; Schoenenberger, D.; Philipp, M.; Bucheli, T. D.; Kaegi, R.; Hueglin, C. Atmospheric Deposition of Microplastics: A Sampling and Analytical Method Including the Associated Measurement Uncertainties. EGUsphere 2025, 2025, 1–30. https://doi.org/10.5194/egusphere-2025-4786.

How to cite: Hueglin, C., Ashta, N. M., Crosset-Perrotin, G., Moraz, A., Philipp, M., Bucheli, T. D., Rahman, A. Md., and Kaegi, R.: Wet and dry atmospheric deposition of microplastics in Switzerland, EGU General Assembly 2026, Vienna, Austria, 3–8 May 2026, EGU26-17765, https://doi.org/10.5194/egusphere-egu26-17765, 2026.

EGU26-18546 | Posters on site | AS3.35

AFM-IR as a tool to detect nanoplastic particles in aerosols 

Ralf Kaegi, Nico Kummer, Stefan Horender, Tero S. Kulmala, Konstantina Vasilatou, and Christoph Hueglin

Whereas the presence of microplastic particles (1µm – 1mm) have been documented all around the globe, the evidence for plastic particles in the submicrometer size range (<1µm) and especially in the nano size range (NPs<100nm) falls short.1,2 This is, on the one hand, related to the lack of suitable sampling methods which allow a representative collection of plastic particles in the respective size range and, on the other hand, to the lack of analytical techniques providing sufficient lateral resolution and chemical specificity. The lateral resolution of commonly used vibrational spectroscopy methods such as infrared (IR) or Raman spectroscopy are diffraction limited to a few micrometers (IR) or slightly below 1µm (Raman) and are therefore not suitable for the analysis of submicron or nano sized plastic particles. Thus, other methods, either using shorter wavelengths (e.g. electron microscopy) or relying on non-optical effects (e.g., atomic force microscopy (AFM)) have to be used. In this study, we assessed the potential of AFM-IR to detect and quantify submicron and nanoscale plastic particles. We evaluated different substates for their suitability to conduct AFM-IR analysis and found silicon (Si) wafers most suitable. Other substrates such as mica were well suited to image particles using the AFM but led to artefacts or high background contributions during AFM-IR analysis. Size detection limits depended on the polymer types and were as low as 80nm for polystyrene.

Synthetic aerosols containing major particulate components of the urban atmosphere including photochemically aged soot, organic compounds, geogenic dust and salts were collected using an electrostatic sampling device. This approach allowed a representative collection of individual aerosol particles directly on laser cut Si wafers with a diameter of 3mm.3 AFM-IR analysis of individual particles demonstrated the high specificity of the method and allowed identifying the different particle and polymer types in complex (aerosol) mixtures. After removing water soluble compounds such as salts in an initial washing step, particles collected electrostatically from the urban atmosphere were dominated by soot, whereas NPs were not detected. Based on our dataset, the maximum possible atmospheric concentration of NPs in the analyzed air sample was estimated at 9 NPs per cm3. Future studies will be dedicated to a selective enrichment of NPs to further constrain the concentration of NPs in ambient air.


References

(1)       R. C. Thompson, W. Courtene-Jones, J. Boucher, S. Pahl, K. Raubenheimer and A. A. Koelmans, Twenty years of microplastic pollution research-what have we learned?, Science, 2024, 386, eadl2746.

(2)       N. P. Ivleva, Chemical Analysis of Microplastics and Nanoplastics: Challenges, Advanced Methods, and Perspectives, Chem Rev, 2021, 121, 11886-11936.

(3)       R. Kaegi, M. Fierz and B. Hattendorf, Quantification of Nanoparticles in Dispersions Using Transmission Electron Microscopy, Microsc Microanal, 2021, 27, 557-565.

How to cite: Kaegi, R., Kummer, N., Horender, S., Kulmala, T. S., Vasilatou, K., and Hueglin, C.: AFM-IR as a tool to detect nanoplastic particles in aerosols, EGU General Assembly 2026, Vienna, Austria, 3–8 May 2026, EGU26-18546, https://doi.org/10.5194/egusphere-egu26-18546, 2026.

EGU26-19608 | Posters on site | AS3.35

Characterisation and Source Identification of Atmosphericmicro/nanoplastics in Hong Kong 

Yun fat Lam, Ping Pui Joseph Ching, Yize Wang, Hiroshi Okochi, and Masaki Takeuchi

Airborne micro- and nanoplastic (AMNP) pollution is ubiquitous in the environment, and its abundance and persistence in the atmosphere have raised global concern. Transport and the changing interface of micro- and nanoplastics play an essential role in linking their sources and sinks within the planetary system. In this study, an airborne micro- and nanoplastic measurement campaign was conducted using our newly developed active samplers to investigate the unique sources and interface changes of AMNPs in Hong Kong. These include tyre wear from take-off and landing operations at Hong Kong International Airport (HKIA). Two distinct sampling sites from Tung Chung for airport-related AMNPs were selected. Seasonal measurements were arranged to capture both seasonal and event-based variations in AMNP concentrations. All collected samples underwent Micro-FTIR and PY-GC-MS analyses to determine the physical properties (e.g., size, shape, morphology) and chemical composition of AMNPs, and were subsequently applied to source and receptor analyses. To the best of our knowledge, this is the first survey of atmospheric AMNPs in Hong Kong, providing essential information on background AMNP levels.

How to cite: Lam, Y. F., Ching, P. P. J., Wang, Y., Okochi, H., and Takeuchi, M.: Characterisation and Source Identification of Atmosphericmicro/nanoplastics in Hong Kong, EGU General Assembly 2026, Vienna, Austria, 3–8 May 2026, EGU26-19608, https://doi.org/10.5194/egusphere-egu26-19608, 2026.

EGU26-20790 | Orals | AS3.35

Quantifying Airborne Micro- and Nanoplastics at the Aerosol Observatory of the University of Vienna 

Agnieszka Kupc, Dušan Materić, Judith Drack, Victoria Bicserdy, Hannah Brown, Silvia Bucci, Andreas Stohl, and Bernadett Weinzierl

Understanding the atmospheric concentrations and properties of micro- and nano-plastics (MNPs) is essential to evaluate not only their sources, transport pathways and sinks, but also the effects they have on the environment, climate and human health. Especially as these effects are still largely unknown.

Here we present first results of atmospheric MNPs in PM2.5 (particulate matter with aerodynamic diameter < 2.5 μm) collected on filters at the Aerosol Observatory (35 m agl.) of the University of Vienna between 12.2024 and 12.2025. We aim to quantify the share of MNPs in PM2.5, their type and mass concentration over four seasons, and determine their sources (i.e. local versus long-range transport) by coupling observations with meteorological parameters, and FLEXPART Langrangian transport modelling.

In this study, daily PM2.5 filter samples are collected on quartz fibre filters using low volume filter sampler (SEQ47 50, Sven Leckel GmbH; 24 hr resolution) over a course of one year, and are subsequently analyzed with the thermal desorption – proton transfer reaction- mass spectrometer (TD-PTR-MS), for MNP mass concentration and chemical composition. The carbonaceous aerosol fractions (i.e. organic and elemental carbon) are analyzed using an offline thermo-optical method utilized by the Sunset Analyzer (Sunset Laboratory, Inc., USA) and follow the EUSAAR II protocol. Here we present the pilot results that focus on the analysis of the daily PM2.5 filter samples, as well as the preliminary results of the full-scale study that covers weekly pooled samples over the course of one year.

Preliminary results of the pilot study which covers ten daily PM2.5 filter samples with high (4.78-10.06 μg/m3) and low (~ 1 μg/m3) organic carbon loading show the presence of the following polymer types: polyethylene (PE), polyethylene telephtalate (PET), polypropylene (PP), polystyrene (PS), polyvinyl chloride (PCV) and tire wear. High correlation (p<0.05) is found between the high organic carbon mass loading and the total mass of polymers detected.

These initial results highlight the presence of micro and nanoplastics in the urban air in Vienna and the importance of ensuring quantitative data to better understand their effects and transport pathways. Further, the results of this study are expected to complement the micro-FT-IR analysis of atmospheric particle deposition collected using wet and dry passive sampler at the Aerosol Observatory. Brought together, these measurements will provide a picture of micro- and nanoplastic occurrence across a size range from the nanoscale to hundreds of micrometres.

How to cite: Kupc, A., Materić, D., Drack, J., Bicserdy, V., Brown, H., Bucci, S., Stohl, A., and Weinzierl, B.: Quantifying Airborne Micro- and Nanoplastics at the Aerosol Observatory of the University of Vienna, EGU General Assembly 2026, Vienna, Austria, 3–8 May 2026, EGU26-20790, https://doi.org/10.5194/egusphere-egu26-20790, 2026.

EGU26-21209 | ECS | Posters on site | AS3.35

Occurrence of Microplastics in PM10 Airborne Particulate Matter in Kraków, Poland 

Dominika Uchmanowicz, Justyna Pyssa, Mateusz Rzeszutek, and Katarzyna Styszko

Airborne microplastics (MPs) are increasingly recognized as emerging atmospheric contaminants with potential implications for environmental and human health. While their presence has been documented in various urban and remote regions worldwide, data from Central Europe remain scarce. This study focuses on the occurrence of microplastics within PM10 particulate matter collected in Kraków, Poland, a city characterized by complex emission sources and persistent air quality challenges. Preliminary observations indicate that microplastic particles, can be present as a component of airborne PM10. Their atmospheric presence suggests multiple emission pathways, including traffic-related abrasion, textile fiber release, and resuspension from urban surfaces. Understanding the occurrence and distribution of MPs in urban air is essential for assessing exposure scenarios and identifying research gaps related to inhalation risks. These findings underscore the need for further monitoring efforts and interdisciplinary research on airborne microplastics in densely populated environments.

How to cite: Uchmanowicz, D., Pyssa, J., Rzeszutek, M., and Styszko, K.: Occurrence of Microplastics in PM10 Airborne Particulate Matter in Kraków, Poland, EGU General Assembly 2026, Vienna, Austria, 3–8 May 2026, EGU26-21209, https://doi.org/10.5194/egusphere-egu26-21209, 2026.

EGU26-21210 | ECS | Posters on site | AS3.35

Quantifying Atmospheric Small Micro- and Nanoplastics (MNP) in The Netherlands 

Willem S. J. Kroese, Pascale Ooms, Nemat Omidikia, Juliane Fry, Ulrike Dusek, and Rupert Holzinger

Airborne small micro- and nanoplastics (MNP) are ubiquitous in the atmosphere and pose a potential health risk, as they can enter deep into the lungs and into the bloodstream. Accurate quantification of atmospheric MNP load, source attribution, and deposition is crucial for the assessment of the plastic burden and fluxes.

In March-April 2025, the CAINA project conducted an extensive field campaign in the Netherlands. Quartz filter samples were taken at Cabauw, an urban background monitoring site situated within an agricultural landscape and influenced by its proximity to the major urban centers of Rotterdam and Amsterdam. The samples were taken using a high-volume air sampler with a PM2.5 size cut-off. Twenty filters were collected during the campaign. Each filter represented a 24-hour continuous air sampling period. These filters are analyzed in the laboratory for inorganic ions, organic aerosol composition, and MNP quantification.

The MNP load was quantified using a Thermal Desorption-Proton Transfer Reaction-Mass Spectrometer (TD-PTR-MS) together with Multicomponent Multivariate Standard Addition (MMSA). Filter aliquots were heated from 50°C to 350°C to desorb material on the filter, and detected by PTR-MS. By incrementally adding plastic standards to the samples, mass concentrations of polystyrene (PS), polyethene (PE), polyethylene terephthalate (PET), polyvinyl chloride (PVC), and polypropylene (PP) can be retrieved accurately by applying Non-Negative Matrix Factorization (NMF).

Using atmospheric back trajectory analysis, the origin of the sampled air mass will be discussed. Distinct air mass regimes were observed, characterized by periods of relatively clean air associated with northerly winds and periods of elevated pollution associated with easterly air mass transport.

How to cite: Kroese, W. S. J., Ooms, P., Omidikia, N., Fry, J., Dusek, U., and Holzinger, R.: Quantifying Atmospheric Small Micro- and Nanoplastics (MNP) in The Netherlands, EGU General Assembly 2026, Vienna, Austria, 3–8 May 2026, EGU26-21210, https://doi.org/10.5194/egusphere-egu26-21210, 2026.

EGU26-22094 | Posters on site | AS3.35

Characterizing the Atmospheric Concentration, Transformation, and Cloud Condensation Nuclei Activity of Nanoplastic Particles 

Yue Zhang, Sahir Gagan, Rajab Mammadov, Sining Niu, Alana Dodero, Miska Olin, Zezhen Cheng, Andrew Lambe, Yuzhi Chen, and Swarup China

Nanoplastic particles (NPPs) are emerging anthropogenic pollutants identified from urban to remote areas. Characterizing the spatial and temporal distribution, process, and cloud-forming potential of atmospheric NPPs improves understanding of their environmental processes and climate impacts. This study provides the spatial and temporal distribution of several types of nanoplastic particles in the Houston area, including polystryene (PS), polyethylene (PE),  polyethylene terephthalate (PET), and Polyvinyl chloride (PVC), showing an average concentration ranging from tens to hundreds of nanogram per cubic meter, with high spatial variability.

In addition, we also presented the first quantified heterogeneous reaction rate and lifetimes of polystyrene (PS) NPPs against common atmospheric oxidants. The atomized PS NPPs were introduced to a Potential Aerosol Mass (PAM) oxidation flow reactor with ·OH exposure of 0 to 1.5 × 10¹² molecule cm-3 s, equivalent to atmospheric exposure from 0 to 18 days, assuming ambient ·OH concentration of 1 × 106 cm-3. The decay of the PS mass concentration was quantified by monitoring tracer ions, C6H6+ (m/z 78) and C8H8+ (m/z 104), using a high-resolution time-of-flight aerosol mass spectrometer (HR-ToF-AMS). The pseudo-first-order rate constant of PS particles reacting with ·OH, kOH, was determined to be (3.2 × 0.7) × 10-13 cm3 molecule-1 s-1, equivalent to a half-lifetime of a few hours to ~80 days in the atmosphere, depending on particle sizes and hydroxyl radical concentrations. The hygroscopicity of 100 nm PS NPPs at different ·OH exposure levels was quantified using a cloud condensation nuclei counter (CCNC), showing a two-fold increase of hygroscopicity parameter upon 27 days of atmospheric photo-oxidation.

Overall, the above results suggest that atmospheric processes can be an important part of the total plastic cycle in the environmental systems, faciliating both short range and long range transport of plastic globally. 

How to cite: Zhang, Y., Gagan, S., Mammadov, R., Niu, S., Dodero, A., Olin, M., Cheng, Z., Lambe, A., Chen, Y., and China, S.: Characterizing the Atmospheric Concentration, Transformation, and Cloud Condensation Nuclei Activity of Nanoplastic Particles, EGU General Assembly 2026, Vienna, Austria, 3–8 May 2026, EGU26-22094, https://doi.org/10.5194/egusphere-egu26-22094, 2026.

The number of launches and objects in space has been growing fast in the last few years, particularly due to the growth of satellite mega-constellations. Defunct satellites and other space junk products collide and create a collisional cascade of smaller space debris. Space debris ablates and burns up in the atmosphere upon re-entry and thereby metals and rare materials are injected, some of which already exceed the natural input of exogenous material today.

Quantifying the influx of these anthropogenic materials into the atmosphere is essential to address the possible environmental consequences, through constraining the physico-chemical atmospheric models. This quantification can be done using catalogs of spacecraft being launched, but not all manufacturers provide these data. Small micro-debris can be used as tracers of their larger counterparts through the collisional cascade, which would complement these existing catalogs, for the inventory of elemental compositions of human-made materials in Low EarthOrbit that will re-enter in the atmosphere.

We propose in situ measurements of sub-micrometer and micrometer sized particles as tracers of the larger space debris, using in situ mass spectrometers with a velocity grid, that were originally designed for cosmic dust measurements.

These instruments can measure the elemental composition (impact-speed dependent), mass distribution, surface charge, impact velocity vector, and time-resolved fluxes of dust and debris particles. Moreover, measuring the natural cosmic dust flux itself is necessary as a benchmark for the debris.

In this talk we introduce in situ cosmic dust measurements in the past, the different measurement methods, and measurements of micrometer-sized space debris so far with “active” (time-resolved) and “passive” (sample return) methods. We elaborate on the particles we can expect to measure in orbit, and the science goals to be achieved through such measurements that are useful for both the assessment of the anthropogenic influx into the atmosphere and for space debris research in Low Earth Orbit.  

Elemental composition measurements of these micro-debris particles, combined with orbital velocity and location data, offer a new avenue for quantifying the chemical influx of anthropogenic material into Earth’s atmosphere, and for assessing more thoroughly the broader space debris populations.

How to cite: Sterken, V. and Manelli, M.: Constraining the atmospheric influx of anthropogenic materials using in situ micro-debris composition measurements , EGU General Assembly 2026, Vienna, Austria, 3–8 May 2026, EGU26-1032, https://doi.org/10.5194/egusphere-egu26-1032, 2026.

EGU26-1943 | ECS | Orals | AS3.37

Update on an Experimental Approach to Assess Particle Formation from Re-entering Spacecraft 

Dominik Kuenstler, David Leiser, Martin Eberhart, Stefanos Fasoulas, and Stefan Loehle

There is a significant lack of knowledge about the impact of the ever-increasing number of satellites in the Low Earth Orbit (LEO) that are supposed to demise during re-entry into the upper atmosphere. Aluminum is injected into the upper atmosphere as a rather new element, because it is a major constituent of satellites, while being only a minor constituent of micrometeorites [1]. The impact of this new trace element on the atmospheric behavior is hardly investigated so far.

Current research assumes the immediate oxidation of molten or evaporated aluminum due to the high abundance of reactive atomic oxygen in the upper atmosphere. The reaction leads to either gaseous aluminum monoxide (AlO), to aluminum hydroxides (Al(OH)x), or solid aluminum oxide (Al2O3) particles are formed. During the re-entry airborne observation campaign of the CYGNUS-OA6 re-entry in 2016, we detected spectral signatures of AlO at an altitude of approximately 70km [2]. The formation of (Al(OH)x) [3], as well as the formation of solid aluminum oxide (Al2O3) particles is discussed in literature [4] [5]. However, few experimental data sets are available of these processes. In our group, we are trying to experimentally evaporate aluminum and detect the paths toward aluminum containing products by suitable diagnostic means.

These experimental simulations are performed in the plasma wind tunnels at the Institute of Space Systems (IRS) at the University of Stuttgart. We observed the evaporation of aluminum in a series of experiments using different experimental setups. The sole injection of solid aluminum only led to larger molten droplets released form the solid. In a second setup, a sample of aluminum powder cured in epoxy resin was placed in the plasma flow. The sample ablated, which lead to the evaporation of aluminum powder. A formation of AlO was observed by acquiring spectral signatures of known AlO bands. In a new approach, aluminum powder was ejected against the plasma flow direction through a water-cooled brass probe. This injection method allows for a higher entrainment time and the evaporation of aluminum. Again, the formation of AlO was observed through spectral signatures.

In this presentation, we will give a detailed insight in the experimental work developing an experimental setup to study the processes after the demise of re-entering satellites. Also, we will provide an outlook in the development of experimental setups for the detection of eventually formed solid particles. These experimental studies are of high interest to gain an understanding of the environmental impact of the rising number of re-entering satellites.

[1] Schulz and Glassmeier, Advances in Space Research, 2021.

[2] S. Loehle et al., Meteoritics and Planetary Science, 2021.

[3] Plane et al., JGR Space Physics, 2021

[4] Maloney et al., JGR Atmospheres, 2025.

[5] Park and Leyland, Acta Astronautica, 2021. 


How to cite: Kuenstler, D., Leiser, D., Eberhart, M., Fasoulas, S., and Loehle, S.: Update on an Experimental Approach to Assess Particle Formation from Re-entering Spacecraft, EGU General Assembly 2026, Vienna, Austria, 3–8 May 2026, EGU26-1943, https://doi.org/10.5194/egusphere-egu26-1943, 2026.

EGU26-4786 | ECS | Orals | AS3.37

Development of space transportation launch and re-entry emission inventories for 2019-2025 

Jan-Steffen Fischer, Jens Neubert, Stefanos Fasoulas, Matthias Nützel, and Anja Schmidt

The space sector has experienced significant growth in recent years, with rocket launch rates increasing from 102 in 2019 to 329 in 2025. Launch and re-entry operations of space transportation systems are the only source of anthropogenic emissions in the upper atmosphere. This increase in space activities is raising concerns about both ozone and climate effects. In recent years, there has been an increasing number of studies assessing the effects of these emissions using global Earth system models. For accurate assessments of the atmospheric effects, emission inventories that take into account the individual characteristics (trajectory, propellant, engine parameters, materials) of launches and re-entries are required.
This study addresses the general problem of how to model launch and re-entry emissions of space transportation systems under contemporary and near-future operational conditions. Here, we present results using the Launch Emissions Assessment Tool (LEAT) and the Re-entry Emissions Assessment Tool (REAT) to model all orbital space transportation missions conducted between 2019 and 2025. We show that the combined LEAT–REAT framework enables modelling of emission composition, trajectories, and altitude-dependent chemical effects of afterburning for multiple propulsion technologies and vehicle configurations. Compared to previous approaches that relied on generic profiles, the new toolset captures individual flight paths, staging and fragmentation events, and vehicle-specific launch and re-entry combustion modelling, pointing out uncertainties compared to previous emission inventories. The results are compared with natural sources such as meteorites and other anthropogenic sources. An assessment of uncertainties via the implementation of a parameter study concludes the presentation.
In a further step, future measures for modelling the reaction pathways in the upper atmosphere are presented.

How to cite: Fischer, J.-S., Neubert, J., Fasoulas, S., Nützel, M., and Schmidt, A.: Development of space transportation launch and re-entry emission inventories for 2019-2025, EGU General Assembly 2026, Vienna, Austria, 3–8 May 2026, EGU26-4786, https://doi.org/10.5194/egusphere-egu26-4786, 2026.

EGU26-7078 | ECS | Orals | AS3.37

Sensitivity analysis of radiative effects of alumina particles from spacecraft re-entries 

Selina Bernlochner, Matthias Nützel, Bernhard Mayer, Anja Schmidt, and Christopher Maloney

The rapid growth of satellite mega-constellations is expected to substantially increase spacecraft disposal and atmospheric reentry rates in the coming decades. As most spacecraft are composed primarily of aluminum, reentries are anticipated to release aluminum oxide (Al2O3, alumina) particles into the upper atmosphere. Alumina efficiently scatters solar radiation and has therefore also been discussed in potential solar radiation modification (SRM) scenarios. However, the respective climatic impact, and even the sign of the radiative forcing, remain highly uncertain due to limited constraints on particle size distributions and associated microphysical processes. Here, the radiative effects of alumina aerosols are investigated using sensitivity experiments with the radiative transfer model libRadtran, complemented by a simplified global climate model to estimate stratospherically adjusted radiative forcings. The analysis focuses on the influence of aerosol particle size, injection altitude, and background atmospheric conditions on radiative forcing and heating rates. Alumina distributions based on two scenarios from Maloney et al. (2025) are considered as reference cases and form the basis for the sensitivity studies: RS1, representing small particles with effective radii of approximately 10nm, and RS2, representing larger particles around 0.1μm. The results demonstrate a strong dependence of both the magnitude and sign of the radiative forcing on particle size and atmospheric background assumptions, particularly cloud configurations. Although the simulated forcings fall within the uncertainty range of Maloney et al. (2025), the RS1 scenario generally produces a positive radiative forcing, whereas the RS2 scenario leads to a negative forcing under most conditions, resulting in signs opposite to their reported best estimates. Potential reasons for these discrepancies are currently being investigated; however, the results generally emphasize the key role of aerosol microphysics and the large uncertainties in the climatic impact of alumina aerosols.

How to cite: Bernlochner, S., Nützel, M., Mayer, B., Schmidt, A., and Maloney, C.: Sensitivity analysis of radiative effects of alumina particles from spacecraft re-entries, EGU General Assembly 2026, Vienna, Austria, 3–8 May 2026, EGU26-7078, https://doi.org/10.5194/egusphere-egu26-7078, 2026.

EGU26-7192 | Posters on site | AS3.37

Understanding the Atmospheric Effects of Spacecraft Re-entry 

Adam Mitchell

As part of ESA’s Green Agenda, the Agency is committed to driving the design of space products and services towards minimising environmental impacts across their entire life cycle. With the rapidly increasing frequency of satellite launches and spacecraft re-entries, robust assessment of their atmospheric and environmental consequences has become a critical scientific priority.

This presentation emphasises the importance of acquiring real-world observational data and advancing our understanding of the chemical and physical processes associated with spacecraft launch and re-entry emissions. Recent studies indicate that anthropogenic metal emissions from spacecraft re-entry may become a significant contributor to the stratospheric particle burden, in some cases approaching the natural meteoritic influx for specific elements. Observations from high-altitude aircraft and ground-based facilities have already identified metal-rich aerosols in the stratosphere, raising concerns regarding their roles in cloud formation, radiative forcing, ozone depletion, and broader atmospheric chemistry.

The presentation addresses key scientific, engineering, and environmental challenges related to spacecraft launch and re-entry, including the initiatives of the Atmospheric Impacts of Re-entry and Launch (AIRL) working group, ESA’s targeted measurement campaigns, and ongoing and future research opportunities. It highlights the need for coordinated, cross-disciplinary approaches that integrate observations, laboratory studies, and modelling. As space activities continue to accelerate, sustained upper-atmosphere research and science-driven policy development are increasingly essential. This presentation highlights ESA’s initiatives in responding to these challenges, reinforcing the need of atmospheric impact assessment in shaping the future of sustainable space operations.

How to cite: Mitchell, A.: Understanding the Atmospheric Effects of Spacecraft Re-entry, EGU General Assembly 2026, Vienna, Austria, 3–8 May 2026, EGU26-7192, https://doi.org/10.5194/egusphere-egu26-7192, 2026.

EGU26-7304 | Posters on site | AS3.37

Updating the inventory of spacecraft reentries: challenges and limitations 

Jonathan McDowell

A crucial input to the scientific study of anthropgenic effects on the upper
atmosphere is a reliable inventory of reentering objects. Some studies
have relied on the US Space Force catalog as a finding list for reentries,
but it is severely incomplete as it does not include objects which stay in
space for less than a few orbits. The General Catalog of Space Objects
(planet4589.org) includes an `auxiliary catalog' which adds these missing
objects, mostly launch vehicle upper stages. For the past three years
the catalog has been enhanced to include approximate reentry locations,
mostly based on NOTAM and similar warning area notifications, permitting
a spatially dependent assesment of the input reentry flux; the study
by Barker, Marais and McDowell (2024) has made use of this data.
I will discuss some features of the catalog as well as its limitations.


How to cite: McDowell, J.: Updating the inventory of spacecraft reentries: challenges and limitations, EGU General Assembly 2026, Vienna, Austria, 3–8 May 2026, EGU26-7304, https://doi.org/10.5194/egusphere-egu26-7304, 2026.

EGU26-8240 | Posters on site | AS3.37

Sustaining the Future in Low Earth Orbit 

Daniel N. Baker

The developments rapidly (and alarmingly) playing out in low-Earth orbit (LEO) are significantly affecting aspects of radio astronomy, nighttime ground-based astronomy, space weather remote sensing, space physics, solar observing, and access to space itself. It is suggested that space-involved organizations should step in to promote actions to regulate the nearly $400 billion space industry that presently is operating in a Wild West , essentially unregulated, fashion due to the inadequacy of current licensing and launch practices. Many forums have provided compelling evidence from scientists and engineers about the interference that communications spacecraft are having on research programs. When the added—and extremely concerning—consequences of exponentiating orbital debris associated with satellite launches and collisions are folded in, we are seeing the equivalent of Garrett Hardin’s “Tragedy of the Commons” in near-Earth space (Science, 1968). It is enticing to citizens world-wide to have low-priced, essentially global, and unfettered communications. However, this is coming at a significant cost to science in our cosmic “backyard”. If satellites continue to increase in number and attendant debris continues to fill bands around Earth, it will soon be nearly impossible to observe the universe beyond our planet with ground-based telescopes or even safely launch and operate scientific satellites in LEO. What is quite clear is that the uncontrolled and unregulated flooding of LEO now is encouraging further players to do the same as what the U.S. is doing.  This will not ‘self-regulate’ for economic reasons: an earlier 2021 NSF-funded study by the JASON committee, titled “The Impacts of Large Constellations of Satellites”, found that the perceived and persistent positive economic payoff return vs. investment cost would not limit the rapid deployment trend even beyond 100,000 satellites. Until the problems and dangers of the populating LEO are better understood and until mitigation is possible, research bodies should be insisting that governments (as well as non-government players) be constrained from carrying out more massive launches. It would be hoped that this presentation will allow an examination of the issues and will lead to productive discussion of policy approached that can help address the growing problem including:

  • Regulatory Framework and Governance
  • Sustainability of Satellite Operations
  • Astronomical Obscuration
  • Radio Astronomy Interference
  • Satellite Collisions and Orbital Debris
  • International Cooperation and Coordination

How to cite: Baker, D. N.: Sustaining the Future in Low Earth Orbit, EGU General Assembly 2026, Vienna, Austria, 3–8 May 2026, EGU26-8240, https://doi.org/10.5194/egusphere-egu26-8240, 2026.

EGU26-8332 | Posters on site | AS3.37 | Highlight

Spacecraft, Ablation Processes, and Metals in the Stratosphere 

Daniel Murphy, Gregory Schill, and Michael Lawler

Both metals from meteoroids and metals from the reentry of rocket boosters and satellites are incorporated into natural sulfuric acid particles in the stratosphere. Numerous elements from both meteoroids and spacecraft reentry have been measured in stratospheric particles.

In many cases, the measurements can separate how much of a given metal came from meteoroids and how much from spacecraft. These data provide constraints on both the amounts of ablated metals and the ablation process. For example, the aluminum to iron ratio in particles from meteors constrains the ablation fraction for aluminum. The amounts of metals from spacecraft can be compared to an inventory of the composition of objects re-entering the atmosphere.

How to cite: Murphy, D., Schill, G., and Lawler, M.: Spacecraft, Ablation Processes, and Metals in the Stratosphere, EGU General Assembly 2026, Vienna, Austria, 3–8 May 2026, EGU26-8332, https://doi.org/10.5194/egusphere-egu26-8332, 2026.

EGU26-8440 | ECS | Orals | AS3.37

The Impact of Rocket-Emitted Chlorine on Stratospheric Ozone 

Yuwen Li, Wuhu Feng, John M.C. Plane, Tijian Wang, and Martyn P. Chipperfield

Although stratospheric ozone is showing signs of healing following the implementation of the Montreal Protocol, the impact of the rapidly developing space industry may affect the rate and extent of this recovery. We assess the potential for rocket-emitted chlorine, under different scenarios of launch rates, to offset the decrease in chlorine from controlled long lived Ozone Depleting Substances (ODSs). We use the Whole Atmosphere Community Climate Model Version 6 (WACCM6) nudged to meteorological reanalyses in order to simulate realistic atmospheric conditions and variability. Chlorine emissions from modest (×10) increase in launch rates relative to 2019 causes near-global column ozone depletion of less than 0.1 DU (0.04%), while large (×52) growth causes depletion of 0.59 DU (0.23%). These two scenarios respectively cause local ozone decreases of up to 0.4% and 2% in the upper stratosphere. Lower stratospheric loss and column ozone depletion are largest at high latitudes with a pronounced annual cycle and, in the Arctic, large meteorology-driven variability. The impact on Antarctic ozone peaks in October (additional depletion of 0.5 DU (modest growth) and 3 DU (large growth)), while the impact in the Arctic peaks in April (2 DU for large growth). Although the mean impact in the Arctic is much smaller than for the Antarctic, the ozone loss shows large variability. In very cold years (exemplified by 2010/11 meteorology), the column loss in the Arctic exceeds the Antarctic for all launch scenarios and can exceed 8 DU for large growth. Ozone depletion in both the polar lower stratosphere and upper stratosphere shows a linear dependence on the level of chlorine enhancement. Overall, the estimated impact of rocket-emitted chlorine for reasonable growth scenarios is small but does have the potential to offset some of the gains of the Montreal Protocol. This impact needs to be considered when deciding on propulsion systems for future launches and in projections of ozone layer recovery.

How to cite: Li, Y., Feng, W., Plane, J. M. C., Wang, T., and Chipperfield, M. P.: The Impact of Rocket-Emitted Chlorine on Stratospheric Ozone, EGU General Assembly 2026, Vienna, Austria, 3–8 May 2026, EGU26-8440, https://doi.org/10.5194/egusphere-egu26-8440, 2026.

With the number of rocket launches increasing almost exponentially in the last years, a trend that will presumably continue, the question of the environmental impact of rocket launches becomes more and more important. However, rocket plume investigations in the past were mostly focused on engine monitoring and not on environmental aspects, so the amount of experimental data related to ozone-destroying radicals, carbon oxides and soot is limited.

As a first step in tackling this problem, spectroscopic measurements of rocket exhaust plumes were taken during ground-based LOX/methane rocket engine tests at the test benches at DLR Lampoldshausen.

Emission spectroscopy in the UV-VIS range enables non-intrusive measuring of light emitted by chemically excited species within the plume as they fall back to their ground states. Each atom or molecule emits light at characteristic wavelengths, so it can be identified and analysed in the measured spectra. The focus was placed on OH* and CH*, well-known intermediate products of methane combustion, as well as C2* which could serve as an indicator for soot formation.

Since the shape of the exhaust plume, i.e. the location of the Mach disk, its diameter or its inner structure, can vary drastically during different operating conditions throughout a test run, time resolved comparison of measurement position and plume structure was made possible with complementary imaging of the plume.

Through careful intensity calibrations, post-processing and geometric analysis, the actual amount of the emitting excited state molecules in the plume can then be calculated from the measured spectra and the results will be presented at the conference. While these excited state species do not immediately provide information about the total species population without further analysis, they nonetheless serve as an indicator and solid first step towards a better understanding of near-field rocket exhaust plume chemistry and could potentially also be used to validate numerical models.

How to cite: Lober, L., Knapp, B., and Hardi, J.: Towards Determining OH*, CH* and C2* Concentrations in LOX/Methane Rocket Engine Tests via Emission Spectroscopy as a Potential Means to Assess Climate Impact, EGU General Assembly 2026, Vienna, Austria, 3–8 May 2026, EGU26-11387, https://doi.org/10.5194/egusphere-egu26-11387, 2026.

In space sustainability the so-called “design for demise” (D4D) approach is advocated as the most sustainable option for the end-of-life of Low Earth Orbit (LEO) spacecraft, the goal being that a minimal footprint of re-entering debris mass survives to ground. Instead it is considered preferable that a majority of spacecraft mass is vaporised or aerosolised in the upper atmosphere. As such it is vital that the nature of the generation of these upper-atmospheric pollutants by demising debris is well understood. Such research sits at the intersection of aerospace engineering and atmospheric science, this work seeks to explore a vehicle-specific engineering analysis.

Recent work on the open-source TransAtmospherIc FlighT SimulAtioN tool (TITAN) developed at the University of Strathclyde has enabled the use of the software as an uncertainty quantification tool. This functionality is applied here in order to explore how the distribution of upper-atmosphere mass emission during demise of a typical LEO satellite can be characterised.

In this work the re-entry of a representative model of a tumbling Starlink satellite is simulated, accounting for 6 Degree-of-Freedom trajectory dynamics and transatmospheric aerothermodynamical effects. Perturbations in terms of initial spacecraft state and temperature, as well as flight-relevant atmospheric conditions, are applied. Then a Monte Carlo campaign is used to recover distributions of emitted species across altitude. Due to the high similarity of Starlink satellites such an approach can be considered generalisable across the constellation, enabling mass emissions predictions to be extended to a global scale.

This work hopes to provide both a tutorial on how such analyses can be performed as well as giving information from a spacecraft-specific perspective that can be applied in atmospheric modelling approaches and also potentially used to inform future compliance behaviours and life cycle analyses.

How to cite: Williamson, T. and Fossati, M.: Uncertainty Quantification of Pollutant Generation During Uncontrolled Re-entry with an Open Source Re-entry Simulator, EGU General Assembly 2026, Vienna, Austria, 3–8 May 2026, EGU26-11723, https://doi.org/10.5194/egusphere-egu26-11723, 2026.

EGU26-12155 | ECS | Orals | AS3.37

Evolution of the population of stratospheric aerosols on the 1981-2010 period: focus on injections related to space activities during launch and re-entry of satellites. 

Quentin Taupin, Jérémie Lasue, Anni Määttänen, Michael Zolensky, Victoria Amgoune, Julien Annaloro, and Aurélie Bellucci

Space traffic is increasing rapidly, with a threefold increase in launches and a thirtyfold increase in satellites launched between 2000 and 2024 (Taupin et al., 2025). In 2024, we estimate that the ratio between the re-entered dry-mass from anthropogenic space activities (DISCOSWeb, J.McDowell RCAT) and natural input from Earth’s cosmic natural input (Carrillo-Sánchez et al., 2020) is between 20-40%. For aluminum in particular, this ratio was estimated to exceed 100% in 2024 (Ferreira et al., 2025). In addition, the space traffic increase is mainly occurring below 600 km altitude, where satellites naturally decay in less than ~10 years. This mass is ablated in the form of atoms and solid aerosols that accumulate in the stratosphere. They may impact radiative forcing and ozone depletion, and have other unknown effects at local, regional and global scales (Ferreira et al., 2024, Ross et al., 2014). It is therefore important to accurately quantify the past and present levels of these injections in order to model their atmospheric effects.

First, we present a finely tuned classification that helps to assess the potential origin of solid stratospheric aerosols (~1-100 microns diameter) collected in-situ by aircrafts mostly over the United States by NASA's Cosmic Dust program between 1981 and 2020. Here we study the 1981-2010 period comprising more than 4 400 particles. Based on the Energy Dispersive X-ray spectra of these particles and previous work (Lasue et al., 2010), we have developed a semi-automated method that classifies them into compositional clusters. For example, we identified potential artificial contaminants rich in Al, Cd, Cu and Ti that stand out from other clusters. For clarity, the particle compositions are compared to known minerals and pure elements. A visualization of the classification will be presented for each year in which particles were sampled, showing the evolution of the aerosol population composition.

Soon, this work will be supplemented by a new spectral analysis of 46 particles that will serve as a calibration to improve the quantification of the chemical composition of all particles in the catalogues.

Secondly, we will introduce a new method for estimating the re-entered ablated mass from space waste. Existing methods rely on average ablation coefficients (Schulz et al., 2021) or focus on specific chemical species (Ferreira et al., 2025).  We use the DEBRISK software (from CNES) to estimate several average ablation profiles for a few simplified models of satellites and rocket upper stages based on their different average cross-sections, masses, and orbital parameters. Then, we use these parameters available in DISCOSweb to derive the total ablated mass of satellites and rocket upper stages in the stratosphere from 1981 to 2010. Finally, we estimate the total mass of black-carbon and alumina injected in the stratosphere during all orbital launch on the same period, using a newly created database on propellant masses cross-referencing information from different sources (DISCOSweb, J.McDowell GCAT, user manuals). These numbers will then be compared to the evolution of the solid aerosol population presented in the first part.

How to cite: Taupin, Q., Lasue, J., Määttänen, A., Zolensky, M., Amgoune, V., Annaloro, J., and Bellucci, A.: Evolution of the population of stratospheric aerosols on the 1981-2010 period: focus on injections related to space activities during launch and re-entry of satellites., EGU General Assembly 2026, Vienna, Austria, 3–8 May 2026, EGU26-12155, https://doi.org/10.5194/egusphere-egu26-12155, 2026.

EGU26-12400 | ECS | Posters on site | AS3.37

Particle Collection in High-Enthalpy Supersonic Flows: Objectives and Challenges 

Ciro Salvi and Ali Gülhan

The rapid growth of space-related activities over the past decade has prompted increasing attention to their potential environmental impacts, particularly those associated with launch and atmospheric re-entry events. These processes release high-temperature gases laden with solid and liquid particles spanning a wide size range—from nanometric to millimetric—across a broad spectrum of altitudes. Despite their potential relevance to atmospheric chemistry, radiative balance, and long-term sustainability of space operations, the physical and chemical impacts of such particles on the atmosphere remain poorly understood due to the scarcity of dedicated experimental data.

To address this gap, the German Aerospace Center (DLR) is conducting a multidisciplinary research effort aimed at assessing the atmospheric impact of space activities. Within this framework, the Supersonic and Hypersonic Technologies Department in Cologne is developing a particle collection system certified for high-enthalpy environments. The collector is intended to enable in-situ sampling of particles generated by rocket motor exhausts as well as by material ablation during hypersonic flight and atmospheric re-entry. Subsequent post-flight laboratory analyses of the collected samples will support the generation of a comprehensive dataset, contributing to a deeper understanding of particle properties and their implications for environmental sustainability.

Experimental investigations of particle-laden high-enthalpy flows have been carried out at the arc-heated wind tunnel L2K and in the vertical test section VMK in Cologne. A combination of intrusive and non-intrusive diagnostic techniques has been employed to characterize suspended particulate matter. The L2K facility has been used to study particle-laden flows in CO₂ atmosphere, while the VMK facility has focused on assessing the environmental impact of small-scale solid rocket motors.

This contribution presents recent progress and remaining experimental challenges in the design of a high-enthalpy particle collector, alongside the current state of the art in multiphase flow diagnostics within the department. The methodologies and findings discussed are also relevant to planetary science applications and may, in the future, be extended to the characterization of Martian atmospheric entry conditions, including scenarios involving global dust storms.

How to cite: Salvi, C. and Gülhan, A.: Particle Collection in High-Enthalpy Supersonic Flows: Objectives and Challenges, EGU General Assembly 2026, Vienna, Austria, 3–8 May 2026, EGU26-12400, https://doi.org/10.5194/egusphere-egu26-12400, 2026.

EGU26-13101 | Posters on site | AS3.37

Potential detection and quantification of aluminum oxide aerosols from space debris via infrared limb-emission sounding 

Michael Höpfner, Bernd Funke, Björn-Martin Sinnhuber, Quentin Errera, Felix Friedl-Vallon, Alex Hoffmann, Peter Preusse, and Jörn Ungermann

The planned deployment of satellite mega-constellations will substantially increase the flux of anthropogenic space debris re-entering Earth’s atmosphere. A large fraction of this material is composed of aluminum, which will ablate during re-entry and form aluminum oxide (Al2O3) containing aerosols in the mesosphere and lower thermosphere. These particles represent a new, human-made metal aerosol source that may interact with natural meteoric smoke and potentially impact upper-and middle- atmospheric chemistry, radiative balance, polar mesospheric cloud, polar stratospheric cloud as well as stratospheric aerosol formation. However, observational constraints on the abundance and vertical distribution of such aluminum-bearing aerosols are currently very limited.

Aluminum oxide exhibits characteristic spectral features in the mid-infrared, allowing detection via remote sensing spectroscopic measurements. In contrast to techniques based on scattering in the visible wavelength range, mid-infrared spectroscopic detection is independent of particle size as long as the particle radius remains small compared to the wavelength. This makes it particularly suited to constraining nanometer- to sub-micrometer-sized aluminum oxide aerosols expected from debris ablation. Moreover, spectrally resolved infrared limb measurements enable the quantification of total aerosol volume (and thus mass) profiles, providing a direct link between observed aerosol burdens and modeled debris input fluxes.

In this work, we quantitatively assess the capability of a space-borne infrared limb-imaging instrument to detect and characterize aluminum oxide aerosols from re-entering space debris. We perform end-to-end simulations of atmospheric radiances and instrument response in the mid-infrared, incorporating realistic Al2O3 optical properties and assumed vertical profiles derived from debris model scenarios associated with upcoming mega-constellations. Radiative transfer calculations are used to compute infrared limb-emission spectra and sensitivities, which are then passed through an instrument simulator system representative of the CAIRT (Changing-Atmosphere Infra-Red Tomography) limb-imaging mission concept, studied as an EE11 candidate for ESA’s Earth Explorer program.

We demonstrate that the characteristic mid-infrared absorption features of aluminum oxide remain detectable at realistic noise levels for CAIRT-like performance, over a range of plausible aerosol loads. Sensitivity analyses show that vertical profiles of total Al2O3 aerosol volume can be retrieved, even when particle sizes and shapes are not well constrained. Our results indicate that a CAIRT-type infrared limb-sounding mission could provide the first global, vertically resolved observational constraints on aluminum oxide aerosols from space debris.

How to cite: Höpfner, M., Funke, B., Sinnhuber, B.-M., Errera, Q., Friedl-Vallon, F., Hoffmann, A., Preusse, P., and Ungermann, J.: Potential detection and quantification of aluminum oxide aerosols from space debris via infrared limb-emission sounding, EGU General Assembly 2026, Vienna, Austria, 3–8 May 2026, EGU26-13101, https://doi.org/10.5194/egusphere-egu26-13101, 2026.

EGU26-16722 | ECS | Posters on site | AS3.37

DLR Inventory of Global Emissions by Launchers 2024 

Moritz Herberhold, Jascha Wilken, Steffen Callsen, and Martin Sippel

The rapid growth of orbital launch activity continued in 2024, marking the fourth consecutive year of record-breaking launch rates. Since 2019, the annual number of launches has more than doubled, with total propellant mass burned increasing even more strongly. This trend underscores the need for quantitative assessments of rocket emissions and their impacts on atmospheric chemistry, ozone, and climate.

We present the DLR Inventory of Global Emissions by Launchers 2024, a global, four-dimensional dataset describing direct exhaust from all orbital launches conducted in 2024. The inventory provides spatially and vertically resolved exhaust across all affected atmospheric layers and is designed for direct use in global chemistry–climate models.

All launch systems contributing at least 0.5% of the total propellant burned in 2024 are individually reconstructed and simulated, including Ariane 62, multiple Long March variants, Falcon 9, Starship, Soyuz, and other major systems. Detailed aerodynamic, mass, and engine models capture thrust profiles, engine exhaust, staging, and mass properties for the launchers. This enables estimates of key exhaust species such as CO₂, H₂O, chlorine compounds, and black carbon. The three-dimensional exhaust profiles for the pollutants are derived from ascent and booster return trajectories that are optimized for each individual launch. Smaller systems are represented using surrogate models that preserve propellant mass and engine type.

The DLR Inventory of Global Emissions by Launchers 2024 provides a consistent basis for assessing the growing role of spaceflight emissions in the Earth system. In the coming years, as part of the S3D-BETTER project the inventory will be further improved by adding early plume and intermediate plume simulations and it will be extended to a longer timeframe. Furthermore, it will be used by the DLR Institute of Atmospheric Physics to estimate the climate and ozone impact of launch emissions.

Beyond its role within S3D-BETTER, the inventory will be made publicly available and its use by other projects and institutions is explicitly encouraged.

How to cite: Herberhold, M., Wilken, J., Callsen, S., and Sippel, M.: DLR Inventory of Global Emissions by Launchers 2024, EGU General Assembly 2026, Vienna, Austria, 3–8 May 2026, EGU26-16722, https://doi.org/10.5194/egusphere-egu26-16722, 2026.

EGU26-17205 | Orals | AS3.37

Quantifying the atmospheric and climatic effects of reusable, hydrogen-fueled rocket launches 

Hiroshi Yamashita, Matthias Nützel, Anja Schmidt, Moritz Herberhold, Jascha Wilken, and Volker Maiwald

Rocket launches emit climate-relevant gases and particles in the atmosphere. Although rocket launches are transient and local emission sources, long lifetimes within the upper atmosphere allow the emitted gases and particles to accumulate. This potentially causes a significant climate impact in the future with an expected increasing frequency of launches, e.g. for installation of mega-constellations. The German Aerospace Center (DLR) has launched the S3D-BETTER project in 2026. One of the aims of the project is to assess the potential atmospheric and climatic effects caused by gases and particles emitted from future rocket launches or created in its aftermath via reaction with ambient gases. An exhaust inventory based on hydrogen-fueled reusable launch vehicles from the European Next Reusable Ariane (ENTRAIN) study is used as a case study. The inventory has been developed by DLR and includes eight exhaust species. The atmospheric and radiative effects are calculated for the ENTRAIN rocket launches by using the European Center HAMburg general circulation model (ECHAM) and Modular Earth Submodel System (MESSy) Atmospheric Chemistry (EMAC) model. Our simulations provide initial results on atmospheric effects of those rocket launches, particularly focusing on stratospheric ozone changes, and examine the radiative forcing caused by those rocket launches. Remaining challenges for climate-modelling and for future research is also discussed.

How to cite: Yamashita, H., Nützel, M., Schmidt, A., Herberhold, M., Wilken, J., and Maiwald, V.: Quantifying the atmospheric and climatic effects of reusable, hydrogen-fueled rocket launches, EGU General Assembly 2026, Vienna, Austria, 3–8 May 2026, EGU26-17205, https://doi.org/10.5194/egusphere-egu26-17205, 2026.

EGU26-19631 | ECS | Posters on site | AS3.37

Rocket launch tropospheric NOx emission: Impact on ozone and methane concentrations and launch location sensitivity. 

Alex Walsh, Steve Bullock, Dudley Shallcross, Simon Hanna, Dick Derwent, and Anwar Khan

A global three-dimensional Lagrangian chemistry-transport model (STOCHEM-CRI) is employed to describe the impact of space rocket exhaust NOx emissions on the global distributions of methane (CH4) and tropospheric ozone (O3), the second and third most man-made greenhouse gases after carbon dioxide (CO2). Tropospheric column NOx emissions have been injected above key active launch sites with One-At-A-Time (OAT) sensitivity experiments producing global warming potentials (GWP) for short- and long-term ozone as well as long term methane GWP contributions.  A sensitivity to launch location and timing is observed, opening future work for potential mitigation strategies. Although current impacts of space rocket launch on global distributions of CH4 and O3 are small, future challenges exist with increasing launch cadence requiring further controlling of NOx emissions into the future to avoid further impacts on GWP. 

How to cite: Walsh, A., Bullock, S., Shallcross, D., Hanna, S., Derwent, D., and Khan, A.: Rocket launch tropospheric NOx emission: Impact on ozone and methane concentrations and launch location sensitivity., EGU General Assembly 2026, Vienna, Austria, 3–8 May 2026, EGU26-19631, https://doi.org/10.5194/egusphere-egu26-19631, 2026.

EGU26-19738 | ECS | Posters on site | AS3.37

Tracking Rocket Launch and Spacecraft Re-entry Emissions Across the Space Age 

Connor Barker and Eloise Marais

Deployment of satellite megaconstellations has led to unprecedented growth in the space industry, with record launch rates and anthropogenic mass re-entering the Earth’s atmosphere in 2025. These activities uniquely release air pollutant emissions throughout all atmospheric layers, leading to long lifetimes in upper atmospheric layers where turnover rates are very slow. A growing number of recent studies have highlighted the potential of these emissions to result in extremely effective stratospheric ozone depletion and radiative forcing. With rocket launch emissions in the satellite megaconstellation era (2020-present) now dwarfing those of the 20ᵗʰ century, there is an ever greater need to quantify space industry emissions across the space age. We previously published a 3-D, global inventory of space industry emissions for the megaconstellation era (2020-2022), categorized by whether the launch contained megaconstellation payloads. This inventory, designed for input to global chemistry-climate models, included black carbon (BC), nitrogen oxides (NOx≡NO+NO2), water vapour (H2O), carbon monoxide (CO), alumina aerosol (Al2O3) and chlorine species (Cly≡HCl+Cl2+Cl) from rocket launches and nitrogen oxides (NOx≡NO) and oxidized alumina (AlOx) from re-entries. Here we present a significant expansion to our inventory to cover the entirety of the space age (1957-present), demonstrating significant increases in recent rocket launch and re-entry emissions since 2020. We also introduce new emission species from re-entry (BC, HCl, Cl) and present an online platform to visualise the growth in space industry emissions (https://cbarker211.github.io/). We will use our historical emissions data to drive the calculation of future pathways for the space industry, presenting business-as-usual, conservative, and high-growth scenarios. We will also implement our updated geolocated emissions into the GEOS-Chem 3-D model of atmospheric composition coupled to a radiative transfer model to assess the long-term impacts on ozone and climate.

How to cite: Barker, C. and Marais, E.: Tracking Rocket Launch and Spacecraft Re-entry Emissions Across the Space Age, EGU General Assembly 2026, Vienna, Austria, 3–8 May 2026, EGU26-19738, https://doi.org/10.5194/egusphere-egu26-19738, 2026.

EGU26-21595 | Orals | AS3.37

Lithium Observations in the Mesosphere: Seasonal Variability and the Impact of a Falcon 9 Re-entry 

Michael Gerding, Robin Wing, Wuhu Feng, John Plane, Yanmichel Morfa, Yosuke Yamazaki, Josef Höffner, Jan Froh, Gerd Baumgarten, and Claudia Stolle

Ablation of re-entering satellites and rocket stages is expected to become a significant source of metals in the mesosphere, yet systematic observations remain limited so far. We present our initial Li atom observations between about 80 km and 100 km altitude using our lidar at Kühlungsborn, Germany (54°N, 12°E), covering a period between August 2024 and February 2025. The main source of the Li layer is still thought to be cosmic dust ablation. However, lithium is a crucial species for investigating anthropogenic impacts on the middle atmosphere because of its extensive use in the space industry. Our measurements revealed a column abundance mostly between 1x106 cm-2 and 5x106 cm-2. Initial simulations using the WACCM-Li model are in reasonable agreement with the observations, suggesting natural seasonal variability as the primary driver for the changes in Li abundance. Some of the observations in early 2025 showed, however, an unusually high abundance that cannot yet be explained by natural variation. A notable event occurred on February 19-20, 2025, at 00:21 UTC, with the detection of a Li cloud exhibiting densities ten times higher than typical, reaching up to ~30 atoms/cm³. Back-trajectory analysis with UA-ICON indicated the probed air mass originated from a location west of Ireland, coinciding with the atmospheric re-entry of a Falcon 9 upper stage. Simulations of the re-entry process revealed a beginning metal ablation of this rocket stage already around 100 km altitude due to its shallow entry angle. We will present the details of this case study as well as our observations of the typical Li layer. Furthermore, we will show first results of our new 3-channel multi-species lidar (MSL) that is set up to search for different species expected to be ablated by re-entering space debris, like Cu, Hf, AlO, etc., along observations of Li and (purely natural) Na.

How to cite: Gerding, M., Wing, R., Feng, W., Plane, J., Morfa, Y., Yamazaki, Y., Höffner, J., Froh, J., Baumgarten, G., and Stolle, C.: Lithium Observations in the Mesosphere: Seasonal Variability and the Impact of a Falcon 9 Re-entry, EGU General Assembly 2026, Vienna, Austria, 3–8 May 2026, EGU26-21595, https://doi.org/10.5194/egusphere-egu26-21595, 2026.

EGU26-671 | ECS | Orals | AS3.38

High-resolution measurement-based methane quantification from beef cattle feedlots to improve agricultural GHG inventories 

Sushree Sangita Dash, Trevor W. Coates, and Chandra A. Madramootoo

Methane (CH4) emissions from livestock production remain one of the largest and most uncertain components of national greenhouse gas inventories, largely because direct measurements at operational facilities are limited. This measurement gap constrains the accuracy of agricultural CH4 estimates and the development of effective mitigation strategies. Strengthening the empirical basis for these inventories is therefore essential. Emerging close-range tools, such as uncrewed aerial vehicle (UAV) plume-sampling systems, can enhance monitoring, reporting, and verification (MRV) by providing high-resolution, facility-level observations.

To evaluate this approach, this study conducted a five-day field campaign at a commercial cattle feedlot in southern Alberta, Canada, housing approximately 28,000 cattle. UAV plume sampling was deployed alongside continuous CH4 measurements from an open-path laser (OPL) to estimate CH4 emission rate downwind of the facility. For both techniques, emission rates were derived using inverse dispersion modeling, for a direct comparison of performance and assessing the extent to which UAV-based sampling can complement established ground-based flux measurements.

Uncrewed aerial vehicle-derived CH4 emission rates varied from 149 to 392 g head-1 day-1 (mean ± SE: 280 ± 22), in near-perfect agreement with OPL-derived emissions of 152-438 g head-1 day-1 (280 ± 22). Daily mean emissions differed by only 0.08% during overlapping sampling periods, and statistical distributions were highly consistent across methods. Hour-to-hour variability reflected transient atmospheric dynamics and associated changes in plume dispersion, rather than methodological bias. UAV flights also revealed spatial plume gradients not captured by the fixed OPL geometry, and consistent hourly emission estimates were found when UAV flights collected at least four usable plume samples per hour. Performance declined under very low-wind or highly turbulent conditions, clarifying key operational constraints for future deployments.

Overall, these findings demonstrate that UAV-based plume sampling can provide CH4 emission estimates consistent with established ground-based systems, providing a validated pathway for quantifying emissions from commercial feedlots. The approach aligns with the Integrated Global Greenhouse Gas Information System (IG3IS) good-practice principles and provides empirical information that can improve IPCC Tier 2 emission factors for open-lot beef operations.

How to cite: Dash, S. S., Coates, T. W., and Madramootoo, C. A.: High-resolution measurement-based methane quantification from beef cattle feedlots to improve agricultural GHG inventories, EGU General Assembly 2026, Vienna, Austria, 3–8 May 2026, EGU26-671, https://doi.org/10.5194/egusphere-egu26-671, 2026.

EGU26-2527 | ECS | Orals | AS3.38

Investigating Regional Halocarbon Emissions: The Seoul Tracer Release Experiment 

Michelle Jessy Müller, Martin K. Vollmer, Stephan Henne, Jaegeun Yun, Haklim Choi, Sunyoung Park, Lukas Emmenegger, and Stefan Reimann

Hydrofluorocarbons (HFCs) are used as refrigerants, propellants or insulating foams. They don’t deplete the ozone layer like their predecessors, (hydro)chlorofluorocarbons ((H)CFCs). However, HFCs are still potent greenhouse gases and are regulated under the Kyoto Protocol (1997) and, more recently, the Kigali Amendment to the Montreal Protocol. The Kigali amendment targets reductions in HFC production and consumption over the coming decades.1, 2 Observing halogenated substances in the atmosphere provides an independent means to verify compliance with these international treaties. From these observations, regional and global emission estimates can be obtained by combining them with atmospheric modelling or using a reference tracer with known emissions.3, 4 Due to rapid industrialization and high demand for refrigeration and air conditioning, the eastern Asian region contributes significantly to global HFC emissions. Therefore, it is crucial to understand the emission patterns in this region to assess global compliance.

We have conducted a large-scale controlled-release tracer experiment to estimate regional halocarbon emissions of the greater Seoul metropolitan area (South Korea). Ethyl fluoride (HFC-161)5 and hexafluorobutane (HFO-1336mzzE), which are virtually absent in the background atmosphere, were released at one location in the City of Seoul. Release times were selected to align with favorable meteorological conditions that allowed air masses to reach the AGAGE station Gosan (Jeju Island, 490 km south of Seoul). The site is equipped with an instrument for in-situ halocarbon measurements. Intermediately located along the path of air mass transport, sites at the Global Atmosphere Watch (GAW) Observatory Anmyeondo and Mokpo National University (138 km and 320 km from Seoul, respectively) were used for additional flask sampling. The atmospheric transport model FLEXPART6 was used to forecast the tracer plume's trajectory and dispersion, and the release and sampling times were adjusted accordingly.

During two releases in November 2024 and April 2025, both tracers were detected at the flask sampling sites Anmyeondo GAW Observatory and Mokpo National University, as well as at Gosan station. The measurements show a strong correlation of our tracer substances with various HFCs. Preliminary emission estimates for the greater Seoul metropolitan area are derived using the tracer ratio method, and its limitations are discussed. Finally, a comparison to a full regional inversion, based on the continuous observations at Gosan, is conducted.

References

[1] Kyoto Protocol to the United Nations Framework Convention on Climate Change. adopted on December 11th, 1997; Kyoto, 1998, 1-22.

[2] Kigali Amendment to the Montreal Protocol on Substances that Deplete the Ozone Layer. adopted on October 15th, 2016; United Nations, Kigali.

[3] Matt Rigby, Sunyoung Park, Takuya Saito, Luke M. Western, Alison L. Redington, et al., Nature, 2019, 569 (7757), 546-550.

[4] Peter G. Simmonds, Matthew Rigby, Alistair J. Manning, Sunyoung Park, Kieran M. Stanley, et al., Atmospheric Chemistry and Physics 2020, 20 (12), 7271-7290.

[5] Dominique Rust, Martin K. Vollmer, Stephan Henne, Arnoud Frumau, Pim van den Bulk, et al., Nature, 2024, 633, 96-100.

[6] Ignacio Pisso, Espen Sollum, Henrik Grythe, Nina I. Kristiansen, Massimo Cassiani, et al., Geoscientific Model Development, 2019, 12 (12), 4955-4997.

How to cite: Müller, M. J., Vollmer, M. K., Henne, S., Yun, J., Choi, H., Park, S., Emmenegger, L., and Reimann, S.: Investigating Regional Halocarbon Emissions: The Seoul Tracer Release Experiment, EGU General Assembly 2026, Vienna, Austria, 3–8 May 2026, EGU26-2527, https://doi.org/10.5194/egusphere-egu26-2527, 2026.

EGU26-2643 | Orals | AS3.38

Unveiling Carbon Sequestration Dynamics in Bamboo Forests, China: An Observation-Based Approach Using Atmospheric Tracers 

Shuangxi Fang, Oksana Tarasova, Yanxia Li, Jocelyn Turnbull, Yi Lin, Gordon Brailsford, and Sara Mikaloff-Fletcher

Bamboo, a perennial grass species, exhibits rapid growth rates surpassing many native trees, offering substantial potential for atmospheric carbon capture and subsequent sequestration into durable products. Despite this promise, the carbon sequestration capacity of bamboo forests and its variability under different land management practices and environmental conditions remain underexplored. This study examines carbon sequestration in a representative bamboo forest in Anji, eastern China, employing a novel observation-based approach utilizing multiple atmospheric tracers (CO₂, CO, and ¹⁴C-CO₂) measurements to attribute fluxes accurately. The study also includes regular biomass inventory to be able to compare CO2 fluxes between two approaches. Departing from conventional inventory-based estimates of carbon emissions and uptakes, observations-based method yields detailed insights into individual carbon-cycle processes within bamboo ecosystems and identifies the most effective tracers for quantifying regional CO₂ fluxes. Leveraging high-resolution atmospheric CO₂ observations, coupled with advanced modeling systems and analytical tools—including machine learning techniques to reconstruct and correct prior Net Ecosystem Exchange (NEE) fluxes for the bamboo forest—we derive carbon fluxes while accounting for variations in management strategies and environmental factors. These findings enhance our understanding of bamboo's role in global carbon mitigation, informing sustainable forestry practices and climate policy. This work highlights the transformative potential of tracer-based methodologies for precise, scalable carbon flux assessments in managed ecosystems.

The study is supported by the Quadrature Climate Foundation (Grant No. 01-21-000133).

How to cite: Fang, S., Tarasova, O., Li, Y., Turnbull, J., Lin, Y., Brailsford, G., and Mikaloff-Fletcher, S.: Unveiling Carbon Sequestration Dynamics in Bamboo Forests, China: An Observation-Based Approach Using Atmospheric Tracers, EGU General Assembly 2026, Vienna, Austria, 3–8 May 2026, EGU26-2643, https://doi.org/10.5194/egusphere-egu26-2643, 2026.

EGU26-2748 | Orals | AS3.38

Design, operation, and insights from Zurich’s mid- and low-cost ICOS Cities CO2 sensor network 

Lukas Emmenegger, Luce Creman, Andrea Fischer, Stuart K. Grange, Christoph Hüglin, Pascal Rubli, and Dominik Brunner

Zurich aims for net-zero direct greenhouse gas emissions by 2040, a target supported by 75 % of voters. Progress is tracked through a detailed CO2 inventory covering energy, transport, industry, and waste. Under the European ICOS Cities project, a monitoring program was launched using two approaches: (i) a network of mid- and low-cost CO2 sensors combined with atmospheric inverse modeling, and (ii) CO2 flux measurements from an eddy-covariance system on a city-center high-rise building, paired with footprint modeling.

Here, we focus on the mid-cost (ZiCOS-M) and low-cost (ZiCOS-L) NDIR (nondispersive infrared) CO2 networks, which were both operational for at least 3 years since 2022.

ZiCOS-M consists of 26 monitoring sites, 21 in the city and 5 outside the urban area. Daily calibrations using two reference gas cylinders, and corrections of the sensors’ spectroscopic response to water vapour were performed. The hourly mean root mean squared error (RMSE) was 0.98 ppm (0.46 - 1.5 ppm) and the mean bias ranged between 0.72 and 0.66 ppm compared to parallel measurements with a high-precision reference gas analyser for a period of 2 weeks or more. CO2 concentrations in the city were highly variable with site means ranging from 434 to 460 ppm, and Zurich’s mean urban CO2 increment was 15.4 ppm above the regional background.

ZiCOS-L consists of 56 sites with paired sensors. The sensors require in-field training for model calibration before deployment and further post-processing steps to account for drift and outliers. After data processing, the hourly RMSE was 13.6±1.4 ppm, and the mean bias 0.75±1.67 ppm when validated against parallel reference measurements from ZiCOS-M. CO2 concentrations were highly variable with site means in Zurich ranging from 438 to 465 ppm, reflecting mainly the influence of sources in the nearby surroundings. Vegetation (mainly grassland) amplified the morning concentration on average in summer by up to 20 ppm due to ecosystem respiration, while heavy traffic increased the morning rush hour concentration by 15 ppm. Despite its lower measurement accuracy, the ZiCOS-L network enables the study of concentration dynamics at a spatial and temporal scale that is not accessible by any other means.

The ZiCOS-M data was extensively used to derive top-down CO2 emissions. Similar modelling activities are currently ongoing with the ZiCOS-L data, and both are compared to emissions derived from the eddy covariance system and to the city's emission inventory.


Grange SK, … Emmenegger L, The ZiCOS-M CO2 sensor network: measurement performance and CO2 variability across Zurich. https://doi.org/10.5194/acp-25-2781-2025.

Creman L, … Bernet L, The Zurich Low-cost CO2 sensor network (ZiCOS-L): data processing, performance assessment and analysis of spatial and temporal CO2 dynamics. https://doi.org/10.5194/egusphere-2025-3425

Brunner D, … Emmenegger L, Building-resolving simulations of anthropogenic and biospheric CO2 in the city of Zurich with GRAMM/GRAL. https://doi.org/10.5194/acp-25-14279-2025.

Hilland R, … Christen A, Sectoral attribution of greenhouse gas and pollutant emissions using multi-species eddy covariance on a tall tower in Zurich, Switzerland. https://doi.org/10.5194/acp-25-14279-2025.

Ponomarev N, … Brunner D, Estimation of CO2 fluxes in the cities of Zurich and Paris using the ICON-ART CTDAS inverse modelling framework. https://doi.org/10.5194/egusphere-2025-3668.

How to cite: Emmenegger, L., Creman, L., Fischer, A., Grange, S. K., Hüglin, C., Rubli, P., and Brunner, D.: Design, operation, and insights from Zurich’s mid- and low-cost ICOS Cities CO2 sensor network, EGU General Assembly 2026, Vienna, Austria, 3–8 May 2026, EGU26-2748, https://doi.org/10.5194/egusphere-egu26-2748, 2026.

EGU26-2817 | ECS | Orals | AS3.38

Concurrent data assimilation of methane concentrations and fluxes  

Niklas Becker, Niels Heinrich Keil, Valentin Bruch, and Andrea Kaiser-Weiss

We use atmospheric inverse modelling to provide observation-based estimates of methane emissions at the national scale in Europe. We apply the numerical weather prediction model ICON-ART to obtain an ensemble of methane concentrations by varying the meteorology, the lateral boundary conditions and emission fields. By comparing to ground based observations of the ICOS network, we employ a 4D LETKF to assimilate both the concentrations and emissions concurrently. We create an ensemble of emissions in two ways: We can perturb the underlying emission field with a gaussian random field, or we can separate it into regions and economic sectors and scale these. We compare the two approaches and the resulting emission estimates to national greenhouse gas inventories and synthesis inversion results with a focus on Germany. The first results are presented for 2021 and we identify a considerable mismatch with the reported emissions in central Europe.

How to cite: Becker, N., Keil, N. H., Bruch, V., and Kaiser-Weiss, A.: Concurrent data assimilation of methane concentrations and fluxes , EGU General Assembly 2026, Vienna, Austria, 3–8 May 2026, EGU26-2817, https://doi.org/10.5194/egusphere-egu26-2817, 2026.

EGU26-3366 | Posters on site | AS3.38

Characteristics of CO2 and CH4 from different emission sources using mobile measurements and stable carbon isotope analysis 

Hyeongseok Choi, Jongbyeok Jun, Sunran Lee, Sumin Kim, and Yongjoo Choi

Achieving effective greenhouse gases (GHGs) mitigation policy requires accurate quantification of contribution from each emission source based on in-situ measurements. In this study, we investigated the spatial distribution of CO2 and CH4 emitted from different emission sources by conducting mobile measurements using a GLA331-GGA analyzer (ABB–LGR Inc.) mounted on a vehicle. We conducted seven mobile measurements in spring (N = 3), summer (N = 2), and fall (N = 2) over Seoul Metropolitan Area (SMA) in 2025. By comparing the correlation between two GHGs from various emission sources, we selected representative sites including livestock facilities (cattle and swine barns), industrial complexes, urban, wastewater treatment plants, LNG power plants, rural areas. Background GHGs concentrations were defined as the daily 5th percentile for each measurement day, and correlations between enhancements (ΔCO2 and ΔCH4) were assessed. Along with real time measurements, stable carbon isotopes samplings were also conducted to provide complementary constraints on concentration variability and the contributions of end-member of each emission source. For stable isotope measurements, two ambient air samples were collected per site using canisters (Entech, Simi Valley, CA, USA) and analyzed with Picarro G2131-i for δ13C–CO213C) and Picarro G2132-i for δ13C–CH413CH4). Strong co-variability between the two GHGs was observed at several emission sources and seasons, including springtime cattle barns (R = 0.75), LNG power plants (R = 0.83), industrial complexes (R = 0.74), and swine barns (R = 0.64); summertime cattle barns (R = 0.66) and LNG power plants (R = 0.67); and fall industrial complexes (R = 0.70) and cattle barns (R = 0.97). These correlations suggested that CO2 and CH4 were likely emitted concurrently from shared sources or similar emission activities in SMA region. The observed δ13C values ranged from −8.2‰ to −12.5‰, while δ13CH4 ranged from −47.2‰ to −48.6‰. Seasonal mean δ13C values were −11.2‰ in spring, −9.2‰ in summer, and −10.1‰ in fall, consistent with a summertime influence from enhanced biospheric respiration, with the most depleted values occurring in spring. In contrast, δ13CH4 exhibited relatively small seasonal variability, as indicated by the coefficient of variation (sd/mean; 0.004 in spring, 0.013 in summer, and 0.012 in fall), but still provided useful constraints on source attribution. In addition, a Bayesian isotope mixing model (the ‘simmr’ package in R) was applied to quantify relative source contributions indicating that coal combustion contributed most strongly to δ13C, whereas wastewater treatment and natural gas were the dominant contributors to δ13CH4.

How to cite: Choi, H., Jun, J., Lee, S., Kim, S., and Choi, Y.: Characteristics of CO2 and CH4 from different emission sources using mobile measurements and stable carbon isotope analysis, EGU General Assembly 2026, Vienna, Austria, 3–8 May 2026, EGU26-3366, https://doi.org/10.5194/egusphere-egu26-3366, 2026.

EGU26-3437 | ECS | Orals | AS3.38

Development of an Ensemble-Based Data-Assimilation System for CO2 Fluxes Using ICON-ART 

Jakob Böttcher, Niklas Becker, Andrea Kaiser-Weiss, and Maya Harms

Observation based quantification of surface CO2 fluxes relies on the consistent integration of atmospheric observations with numerical transport models. We present the development and demonstration of an ensemble-based data assimilation system that couples atmospheric CO2 observations to the ICON-ART modeling framework using a Local Ensemble Transform Kalman Filter (LETKF).


Starting with a flux estimate provided by CarbonTracker Europe High-Resolution we start with a dynamic model with hourly resolution with a focus on fluxes in Europe for 2021. We then create an ensemble of perturbed prior fluxes within assumed uncertainties using prescribed spatial and temporal correlation structures. We simulate the transport of these ensemble members in ICON-ART in limited area mode, while varying the meteorological conditions to represent meteorological uncertainties. Subsequently, we use the LETKF to update the state vector of concentrations and CO2 fluxes daily, resulting in an posterior estimate of surface CO2 fluxes over Europe. 


This work provides the foundation for an ICON-ART-based CO2 flux assimilation system and establishes a technical basis for future extensions toward longer assimilation periods, refined error modeling, and the assimilation of anthropogenic emission signals.

How to cite: Böttcher, J., Becker, N., Kaiser-Weiss, A., and Harms, M.: Development of an Ensemble-Based Data-Assimilation System for CO2 Fluxes Using ICON-ART, EGU General Assembly 2026, Vienna, Austria, 3–8 May 2026, EGU26-3437, https://doi.org/10.5194/egusphere-egu26-3437, 2026.

In this research, we propose a simple and effective method for gas analysis of semiconductor and display industries. To achieve this, residual gas analyzer (RGA) was adopted and two high-global warming potential (GWP) gases such as CF4 and NF3 commonly used in industrial application were focused. The experiment was conducted in four key steps: identifying gas species using optical emission spectroscopy (OES), calibrating RGA with a quadrupole mass spectrometer (QMS), constructing a five-point calibration graph to correlate RGA and Fourier-transform infrared spectroscopy (FT-IR) data, and estimating the concentration of unknown samples using the calibration graph. The results under plasma-on conditions demonstrated correlation and accuracy, confirming the reliability of our approach. In other words, the method effectively captured the relationship between RGA intensity and gas concentration, providing valuable insights into concentration trends. Thus, our approach serves as a useful tool for estimating gas concentrations and understanding the correlation between RGA intensity and gas composition.


Reference

[1] B. G. Jeong, S. H. Park, D. H. Goh, and B. J. Lee, Metrology 5 (2025) 60

How to cite: Jeong, B. G.: Real-Time Monitoring and Quantification of Fluorinated Greenhouse Gases in Semiconductor/Display Manufacturing, EGU General Assembly 2026, Vienna, Austria, 3–8 May 2026, EGU26-4566, https://doi.org/10.5194/egusphere-egu26-4566, 2026.

The semiconductor and display industries are significant sources of fluorinated greenhouse gas (F-GHG) emissions in the electronics, making accurate emission estimation essential for addressing climate change. The Republic of Korea, a leading country in the semiconductor and display industries, requires precise evaluation of the environmental impact of these industries due to its global competitiveness. Currently, The Republic of Korea relies on default emission factors provided by the 2006 IPCC guidelines for estimating F-GHG emissions. However, this approach does not account for the latest mitigation technologies implemented in Republic of Korea, resulting in a conservative overestimation of actual F-GHG emissions. To address this issue, this study conducted direct measurements of F-GHG emissions from semiconductor manufacturing processes in facilities equipped with advanced mitigation technologies. By employing state-of-the-art measurement methods, the study evaluated the use rate of gas (Ui) and generation rate of by-product gas (Bbyproduct, Bi) and compared the results with the default emission factors provided by IPCC G/L (2006 and 2019). Moreover, based on derived country-specific emission factors (Tier 3b), GHG emissions were estimated and compared with tier-based methodologies using 2006 and 2019 IPCC G/L default factors (Tier 2a, 2b, 2c and 3a). The finding highlights the need for developing country-specific emission factors and contribute to the establishment of precise, data-driven policies for reducing GHG emissions in Republic of Korea’s electronics industry. Furthermore, this research serves as valuable reference for other countries aiming to refine their emission estimates with country-specific data and technological advancements, ultimately contributing to global efforts towards carbon neutrality.

How to cite: Inkwon, J. and Bong-Jae, L.: Comparative Analysis of F-GHGs Emission Estimates between IPCC Default Factors and Measurement-based Korea-specific Emission Factors in Semiconductor Manufacturing, EGU General Assembly 2026, Vienna, Austria, 3–8 May 2026, EGU26-4570, https://doi.org/10.5194/egusphere-egu26-4570, 2026.

EGU26-5198 | ECS | Orals | AS3.38

Monitoring urban atmospheric CO2 plumes from space: sensitivity to urban physics and scale effects over Paris 

Alohotsy Rafalimanana, Thomas Lauvaux, Charbel Abdallah, Mali Chariot, Michel Ramonet, Josselin Doc, Olivier Laurent, Morgan Lopez, Anja Raznjevic, Maarten Krol, Leena Järvi, Leslie David, Olivier Sanchez, Andreas Christen, Dana Looschelders, Laura Bignotti, Benjamin Loubet, Sue Grimmond, and William Morrison

Quantifying urban CO2 emissions from space can be approached using different methodologies, including direct plume-based analyses, but combining satellite observations with atmospheric transport models requires the ability to realistically reproduce fine-scale spatial gradients over cities. Using the Grand Paris area as a testbed, we investigate the sensitivity of simulated near-surface CO2 concentrations to urban physics parameterization and horizontal resolution within the WRF-Chem modeling framework coupled to a high-resolution fossil fuel emission inventory. At mesoscale resolution (900 m), a hierarchy of urban representations ranging from simulations without urban physics to multi-layer urban canopy models is evaluated, showing that the Building Energy Model (BEM) provides the most physically consistent simulation of surface energy fluxes, boundary-layer development, and near-surface CO2 variability. Building on this configuration, we compare mesoscale simulations with Large-Eddy Simulation (LES) runs at 300 m and 100 m resolution. Model results are evaluated against dense urban CO2 observations from the high-precision Picarro network, a complementary mid-cost sensor network from ICOS-Cities, and surface sensible and latent heat flux observations from the ICOS ETC Level-2 fluxes data product. An extensive urban observation network including wind lidars and ceilometers from Urbisphere project provides an exceptional constraint for the evaluation of boundary-layer structure and vertical mixing at fine scales. The LES simulations substantially enhance the representation of spatial heterogeneity and localized CO2 enhancements associated with major emission sources, which are smoothed or underestimated at mesoscale resolution. However, increased resolution also amplifies sensitivity to local wind fields and emission inventory uncertainties. These results highlight that both urban physics and model resolution critically shape the ability of transport models to reproduce observed urban CO2 gradients.

How to cite: Rafalimanana, A., Lauvaux, T., Abdallah, C., Chariot, M., Ramonet, M., Doc, J., Laurent, O., Lopez, M., Raznjevic, A., Krol, M., Järvi, L., David, L., Sanchez, O., Christen, A., Looschelders, D., Bignotti, L., Loubet, B., Grimmond, S., and Morrison, W.: Monitoring urban atmospheric CO2 plumes from space: sensitivity to urban physics and scale effects over Paris, EGU General Assembly 2026, Vienna, Austria, 3–8 May 2026, EGU26-5198, https://doi.org/10.5194/egusphere-egu26-5198, 2026.

EGU26-5426 | ECS | Orals | AS3.38

Quantifying Agricultural Methane Emissions Using Satellite Observations 

Mengyao Liu, Ronald van der A, Michiel van Weele, Elefttherios Ioannidis, Ruoqi Liu, Zichong Chen, and Jieying Ding

Methane (CH₄) is the second most important greenhouse gas after CO₂, and its emissions from the agricultural sector, particularly rice paddies and dairy farms, remain highly uncertain and challenging to quantify. While recent advancements in satellite technology, such as high spatial resolution instruments, have enabled the detection of methane sources from global to facility scales, agricultural emissions still pose challenges. These emissions are typically diffuse and area-like, making them less detectable by targeted satellites like GHGSat and EMIT, which are better suited for isolated point sources such as oil/gas facilities or landfills. Additionally, agricultural emissions exhibit significant spatiotemporal variability driven by climate conditions, water management practices in rice paddies, and differences in farm types.

In the AGATE project of ESA, we apply an improved divergence method to estimate monthly methane emissions using TROPOspheric Monitoring Instrument (TROPOMI) satellite observations at a 0.1° grid resolution. We focus on major agricultural regions, including the Po Valley in Italy, as well as India and Bangladesh, over the period 2019-2022. To better isolate agricultural emissions, we separate area-like sources (e.g., rice paddies) from isolated point sources. The locations of identified big emitters are cross-validated using bottom-up emission inventories and targeted satellite observations (e.g., EMIT, Carbon Mapper) to minimize the influence of non-agricultural sources. Furthermore, to better understand the seasonality of methane emissions, we analyze the correlations between methane emission variations and auxiliary datasets, such as rice paddy maps and ammonia emissions derived from satellites.

How to cite: Liu, M., van der A, R., van Weele, M., Ioannidis, E., Liu, R., Chen, Z., and Ding, J.: Quantifying Agricultural Methane Emissions Using Satellite Observations, EGU General Assembly 2026, Vienna, Austria, 3–8 May 2026, EGU26-5426, https://doi.org/10.5194/egusphere-egu26-5426, 2026.

EGU26-5912 | ECS | Posters on site | AS3.38

Investigating Germany’s progress in decoupling air pollution emissions from economic activity using satellite-based measurements of NO₂. 

Erika Remy, Rosina Engert, Laurenz Werner, and Michael Bittner

In efforts to mitigate the effects of global climate change several prominent policies and guidelines which emphasize the importance of sustainable growth have been introduced in recent years. Examples include the 2019 European Green Deal, and the subsequent Clean Industrial Deal in 2025. A key aspect of these goals is the reduction of air pollutant emissions, particularly from fossil fuel combustion, without sacrificing economic growth. The Green Deal commits to an EU wide emission reduction of at least 55% by 2030, as compared to 1990 levels. Remote sensing offers many advantages for tracking progress towards reduction of pollutant emissions. In particular, the global coverage allows for analysis of regions which do not have sufficient ground-based measurement networks. This study presents a method of using spectral analysis with tropospheric NO2 column density and the gross domestic product (GDP) to track and compare progress of the German federal states towards decoupling emissions from economic growth. Most studies evaluating economic decoupling focus on CO2, or CO2 equivalences. There is a current lack of studies which investigate other key combustion products. This study focuses on NO2 as a proxy for emissions related to economic activity. NO2 originates primarily from anthropogenic combustion sources, andhas a short tropospheric lifetime, making it suitable to represent localized fossil fuel emissions.  Measurements of NO2 used in this study are obtained from the Ozone Monitoring Instrument (OMI) launched aboard the NASA Aura satellite in 2004. The application of spectral analysis techniques, such as the wavelet analysis, gives additional insight into temporal variability of NO2, to better observe the path of decoupling for each region. Decoupling between GDP and NO2 variability is observed for all regions of Germany in the period between the two most recent global economic recessions (the 2008 financial crisis, and the Covid-19 pandemic). Similar decreasing trends are observed for both the yearly average tropospheric column density and the calculated yearly variability. The variability obtained from the wavelet analysis shows greater sensitivity to changes in NO2 emissions than the absolute tropospheric column density. Further regional differences such as the main economic sectors and types of emission regulations in place are discussed to contextualize the differences present in decoupling processes between the federal states. Overall, NO2 variability is found to be a sensitive and effective indicator for tracking and comparing decoupling progress across different administrative regions.

How to cite: Remy, E., Engert, R., Werner, L., and Bittner, M.: Investigating Germany’s progress in decoupling air pollution emissions from economic activity using satellite-based measurements of NO₂., EGU General Assembly 2026, Vienna, Austria, 3–8 May 2026, EGU26-5912, https://doi.org/10.5194/egusphere-egu26-5912, 2026.

EGU26-7798 | ECS | Posters on site | AS3.38

Low latency and high resolution GHG emission estimates to support monitoring and modelling activities in Spain 

Oliver Legarreta, Paula Castesana, Ivan Lombardich, Carles Tena, Carmen Piñero-Megías, Artur Viñas, Johanna Gehlen, Luca Rizza, Carlos Pérez García-Pando, and Marc Guevara Vilardel

Reliable and timely information on greenhouse gas (GHG) emissions is essential for evaluating mitigation policies and supporting data assimilation and verification modelling frameworks. In this contribution, we present the sPanisH EmissioN mOnitoring systeM for grEeNhouse gAses (PHENOMENA), a low-latency GHG modelling framework developed within the RESPIRE-CLIMATE Spanish national project, which received formal endorsement from the WMO-IG3IS initiative.

PHENOMENA provides harmonised daily and high spatial resolution (up to 1 km × 1 km) CO2 and CH4 emissions for the main combustion-related sectors, including electricity generation, manufacturing industry (cement and iron and steel), residential and commercial combustion, road transport, shipping and aviation. The system estimates CO2 and CH4 emissions by combining low latency activity data and fuel- and process-dependent emission factors through bottom-up and downscaling approaches. The data collected and pre-processed includes hourly near-real-time traffic counts from the national road network, hourly electricity production data reported by individual power plants, daily Copernicus ERA5-Land surface temperature, monthly industrial production statistics and AIS (Automatic Identification System) data, among others.

PHENOMENA produces multiple GHG emission products, including high resolution maps of daily emissions per sector, as well as daily summaries of emissions aggregated at different regional levels and for the main Spanish metropolitan regions. The emissions computed with PHENOMENA allows representing the intra-weekly and seasonal variability of GHG emissions as well as changes in their spatial patterns, which can be linked to specific policy, socioeconomic, and weather impacts.

The results produced with PHENOMENA are compared to official GHG emission inventories as well as to other state-of-the-art low latency GHG emission datasets, such as the ones produced by the CAMS Carbon Monitor initiative. Overall, these developments demonstrate the capability of PHENOMENA to deliver consistent, multisector and near-real-time GHG emission estimates, supporting national monitoring, policy evaluation and future verification and data-assimilation efforts.

How to cite: Legarreta, O., Castesana, P., Lombardich, I., Tena, C., Piñero-Megías, C., Viñas, A., Gehlen, J., Rizza, L., Pérez García-Pando, C., and Guevara Vilardel, M.: Low latency and high resolution GHG emission estimates to support monitoring and modelling activities in Spain, EGU General Assembly 2026, Vienna, Austria, 3–8 May 2026, EGU26-7798, https://doi.org/10.5194/egusphere-egu26-7798, 2026.

EGU26-7927 | Orals | AS3.38

Using point source imaging satellite observations to guide landfill methane model improvements at the national and sub-national scale 

Tia Scarpelli, Daniel Cusworth, Jinsol Kim, Kelly O'Neill, Riley Duren, and Katherine Howell

As national and sub-national governments, companies, and communities plan methane mitigation action, there is a need for robust emissions tracking systems, especially for major sectors like waste where countries have made commitments to reduce emissions. Landfills are a major source of methane emissions in many jurisdictions spread across the world, so there is a need in the waste sector for monitoring frameworks that are applicable at scale but also provide facility-level insights to guide decision making. 


Given the complexity of landfill emissions both in terms of variability and underlying causes, models are a common tool used for planning and tracking landfill methane mitigation, but past studies show potential biases in models and inventories compared to observations. In this work, we bring together both process-level insights as provided in bottom-up models and our top-down observations from the Tanager-1 satellite by (1) improving the accuracy and consistency of satellite-derived annual average emission rates and (2) developing methodologies for reconciling the two unique datasets. The goal of this work is to use satellite methane observations to identify improved bottom-up model parameters, focusing on the modeling frameworks used by national and sub-national jurisdictions.


As a point source imaging satellite, Tanager-1 is well suited for tracking emissions at landfills as it provides facility-scale methane emissions data, but existing algorithms and workflows for creating the emissions data have been primarily validated based on controlled release experiments which mimic environments more similar to the oil and gas sector than landfills. We identify methods that are robust and best suited to landfills by performing sensitivity tests for our quantification methods, testing algorithms and parameters, and identifying causes of bias unique to landfill environments (e.g., albedo, topography). The next step is translating our Tanager-1 observations to annual averages. We present a new methodology for temporally averaging satellite observations that accounts for null detects through scene-specific probability of detection limits. Finally, we compare our annual average satellite-based emission estimates to bottom-up models typically used by jurisdictions for official reporting (e.g., IPCC, LandGEM, US GHGRP), focusing on select countries where there is sufficient spatiotemporal coverage with Tanager-1. We use statistical methods to adjust parameters in the bottom-up models to reconcile the model estimates with observed emissions, allowing region-specific model parameter adjustments to account for potential climatic and meteorological factors. Finally, we discuss the implications of our initial results in terms of improvements to official national reporting and compare to inverse modeling results.

How to cite: Scarpelli, T., Cusworth, D., Kim, J., O'Neill, K., Duren, R., and Howell, K.: Using point source imaging satellite observations to guide landfill methane model improvements at the national and sub-national scale, EGU General Assembly 2026, Vienna, Austria, 3–8 May 2026, EGU26-7927, https://doi.org/10.5194/egusphere-egu26-7927, 2026.

EGU26-8459 | Posters on site | AS3.38

Validating environmental reporting of carbon emissions 

Lee Stokes, Aleksandra Przydrozna, and Valerie Livina

ESG (Environmental, Social, Governance) reporting is essential for industry as it helps secure investment for companies’ development. While Scope 1 are direct emissions and Scope 2 are indirect emissions, most of the industrial players report Scope 2 emissions from the use of energy (electricity and gas): these are carbon emissions that are emitted in the power station that uses fossil fuels (oil, coal, gas, biomass, etc.), see [1].

Conventional way to report company’s carbon emissions of Scope 2 is to obtain electrical meter readings and multiply them by the average carbon intensity of the electric grid that supplies electricity. In the UK, such carbon factors were previously published (annually) by the Department for Environment, Food, and Rural Affairs (Defra), then more recently by the Department for Energy Security and Net Zero (DESNZ). These average annual factors are approximate, and actual fuel mix of the electrical grid varies within a few minutes, depending on the operating power generators.

In some cases, the annual carbon intensity may underestimate the actual intensity of the grid. This usually happens in Europe in winter, when a large number of gas-fuelled generators are active to provide sufficient heating, and at the same time wind conditions are placid, providing little of renewable energy. In other cases, when there is lots of wind-generated energy and less gas-generated energy (for example, on a windy summer day), the average carbon factor may overestimate actual carbon intensity of the grid.

In several case studies, we demonstrate that such discrepancies may reach 10-15% of the total carbon emissions, as they are presented in quarterly or annual ESG reports. The results suggest that the current way of reporting carbon emissions should be revised, so that actual state of the dynamical energy grid would be taken into account for improvement of ESG reporting. Subsequently, this will impact their ESG standing and potential investment, which is crucial for European business as well as for the correct accounting of the impact of European carbon emissions [2].

References

[1] Livina et al, International Journal of Metrology and Quality Engineering, in revision.

[2] Livina et al, in preparation.

How to cite: Stokes, L., Przydrozna, A., and Livina, V.: Validating environmental reporting of carbon emissions, EGU General Assembly 2026, Vienna, Austria, 3–8 May 2026, EGU26-8459, https://doi.org/10.5194/egusphere-egu26-8459, 2026.

Reducing methane (CH4​) emissions through environmentally friendly agriculture, such as Alternate Wetting and Drying (AWD), is a critical strategy for climate change mitigation in rice production. To effectively implement and evaluate these mitigation measures, it is essential to monitor agricultural practices and environmental variables at a high spatial resolution. This study develops a standardized data-processing protocol, which leverages Google Earth Engine (GEE) to generate high-resolution remote sensing features necessary for quantifying CH4​ emissions.

The protocol integrates multi-sensor satellite data to capture the spatio-temporal dynamics of sustainable rice farming. Central to this protocol is the use of Sentinel-1 Synthetic Aperture Radar (SAR) data to classify water management regimes, specifically distinguishing between continuous flooding (CF) and AWD at the pixel level. Additionally, Sentinel-2 optical imagery is processed to extract key vegetation indices (e.g., NDVI, GRVI) to monitor crop growth. To address environmental factors, coarse-resolution soil moisture data from SMAP is downscaled to resolution by incorporating Sentinel-2 and Digital Elevation Model (DEM) data.

By synthesizing these multi-sensor inputs, the protocol provides the necessary foundation for mapping methane emission hotspots and assessing the impact of environmentally friendly management practices. This high-resolution approach supports the design of region-specific mitigation strategies and the advancement of climate-smart agriculture.

As for future research plans, we will apply the constructed model with the field-measured validation data to the extensive rice paddies in southern Ibaraki Prefecture in Japan to estimate methane emissions on a pixel-by-pixel basis and create hotspot maps. This enables the upscaling of a single-point observation model to a broader area while reflecting regional characteristics. This methodology is expected to serve as a powerful tool for examining highly effective methane reduction measures (such as utilization under the J-Credit system) based on each region's agricultural practices and environmental conditions.

How to cite: Shoyama, K., Hirai, C., and Den, H.: Monitoring Environmentally Friendly Agriculture for Methane Emission Reduction: A High-Resolution Multi-Sensor Remote Sensing Protocol on Google Earth Engine, EGU General Assembly 2026, Vienna, Austria, 3–8 May 2026, EGU26-8591, https://doi.org/10.5194/egusphere-egu26-8591, 2026.

EGU26-9177 | Posters on site | AS3.38

Transport model error in inverse modelling: Developments within the ITMS project 

Christoph Gerbig, Michal Galkowski, Frank-Thomas Koch, Lena Danyeli, Fabian Maier, Saqr Munassar, Yang Xu, and Christian Rödenbeck

Inverse modelling of CO2 and CH4 using atmospheric in-situ data relies on simulations of atmospheric transport that arederived from models used in numerical weather prediction. The relevant time scales for inversions range from hours to decades, which is far beyond the time scales of a few weeks for which NWP models are designed. The strong diurnal and seasonal variations in surface to atmosphere fluxes of CO2 covary with atmospheric mixing in the boundary layer, as both are solar radiation driven. This way slight seasonal or diurnal biases in the representation of mixing can be amplified. In addition, different atmospheric models show differences in vertical mixing through turbulent mixing and through moist convection, and thus in the representation of vertical gradients in tracers, which results strong differences in flux estimates from inverse modelling. These facts have been known since several decades by now, but progress in addressing these issues has been slow. Within the atmospheric network of ICOS (Integrated Carbon Observation System) additional meteorological observations are available that provide information on atmospheric mixing heights. Also, IAGOS (In-service Aircraft for a Global Observing System) provides information on vertical gradients which can be related to mixing through turbulence and convection.

ITMS, the Integrated Greenhouse gas Monitoring system for Germany, is implemented in multiple development phases: a first phase with the development of a demonstrator system, followed by the second phase, the development of a first-generation system, and a third and last phase, the transfer to operations. With each phase lasting about four years, the project provides a medium-term framework that allows also addressing some of the longer lasting problems such as transport uncertainty. Within ITMS the CarboScope Regional inversion system (CSR) is used as a reference system for CO2 and CH4 inversions, but also as a testbed for model developments. The presentation will provide an overview of recent results obtained within ITMS. This includes evaluating vertical mixing by using additional meteorological profile data or mixing height information, using additional tracers in inversions such as Radon, and confronting vertical profiles from airborne observations with model equivalents. 

How to cite: Gerbig, C., Galkowski, M., Koch, F.-T., Danyeli, L., Maier, F., Munassar, S., Xu, Y., and Rödenbeck, C.: Transport model error in inverse modelling: Developments within the ITMS project, EGU General Assembly 2026, Vienna, Austria, 3–8 May 2026, EGU26-9177, https://doi.org/10.5194/egusphere-egu26-9177, 2026.

EGU26-9574 | ECS | Orals | AS3.38

A global coal mine methane tracker to highlight inventory gaps and target mitigation 

Rebekah Horner, Sabina Assan, and Adomas Liepa

Methane (CH4) is a key short-lived climate forcer, yet robust monitoring of its anthropogenic sources remains limited by inconsistent national reporting and incomplete inventories, especially from coal mining. Global anthropogenic CH4 emissions are about 369 million tonnes per year, of which coal mine methane (CMM) contributes roughly 40 million tonnes per year, which is comparable to emissions from the gas sector. In 2023 only 15% of coal production reported annual CMM emissions in national greenhouse gas inventories and this limits the scientific basis for monitoring and verification of progress towards the Global Methane Pledge and the Paris Climate Agreement.

We present Ember’s Coal Mine Methane Data Tracker as a new open, global, evidence based dataset for understanding CMM emissions, reporting quality and methane targets. The Data Tracker compiles and harmonises national greenhouse gas inventory submissions to the United Nations Framework Convention on Climate Change (UNFCCC). It integrates these data with historic coal production statistics from the US Energy Information Administration (EIA), International Energy Agency (IEA) coal production forecasts and independent emission estimates (IEA Methane Tracker, Global Energy Monitor (GEM) Global Coal Mine Tracker).

To reconstruct national emissions from 1990 onwards, we calculate country and year specific CH4 emission intensities wherever both reported emissions and coal production exist. Emission intensity is defined as CH4 emissions (in kilotonnes) per million tonnes of coal produced. This approach also enables consistent comparison of reported emissions across countries and over time.

We fill gaps in the intensity time series using values from neighbouring years so that each country has a continuous record. We then multiply these completed intensity series by observed production to estimate unreported emissions. Ember’s gap filled series indicates that global active CMM emissions exceeded 34 million tonnes in 2023, whereas official UNFCCC inventories reported only 4.62 million tonnes, less than 14% of the inferred total. For 2024, the latest compilation of submissions implies 34.5 million tonnes of reported CMM, with underreporting of up to 21.2 million tonnes when compared with independent datasets.

We introduce a quantitative confidence score from 0 to 6 for each country’s reported CMM emissions, combining recency of UNFCCC reporting, consistency with independent estimates from both top down and bottom up approaches, and methodological robustness. Applied to major producers, this score shows that most large coal producing countries fall in the low-to-moderate confidence range, with only a small number, such as Poland (score 5), achieving higher confidence in their reported CMM inventories. 

By providing a transparent, harmonised framework for CMM monitoring, we demonstrate that systematic underreporting pervades national inventories. This gap is driven by widespread reliance on low tier IPCC methods, with 86% of reported CMM emissions relying on emission factors rather than direct measurement. Our quantitative confidence score (ranging from 0 to 6) highlights this reliance, showing that low scoring countries correlate directly with significant underestimation. This evidence necessitates the need for transparent, measurement based Monitoring, Reporting and Verification (MRV) frameworks to establish the rigorous CH4 accounting required by global climate commitments.

How to cite: Horner, R., Assan, S., and Liepa, A.: A global coal mine methane tracker to highlight inventory gaps and target mitigation, EGU General Assembly 2026, Vienna, Austria, 3–8 May 2026, EGU26-9574, https://doi.org/10.5194/egusphere-egu26-9574, 2026.

EGU26-10112 | ECS | Posters on site | AS3.38

Urban greenhouse gas monitoring across the Barcelona Metropolitan Area 

Vanessa Monteiro, Gara Villalba Mendez, Qing Luo, and Roger Curcoll Masanes

An urban greenhouse gas (GHG) monitoring network has been established in the Barcelona Metropolitan Area to support the evaluation of GHG mitigation strategies. The network currently consists of five measurement sites equipped with high-precision Picarro analysers providing continuous observations of carbon dioxide (CO2) and methane (CH4). These measurements, in combination with atmospheric modelling will be used to investigate spatial and temporal variability in urban GHG concentrations.

The five sites (Fabra, ICM, ICTA, IDAEA, and UPC-Agropolis) were strategically selected to represent a range of urban and peri-urban environments, including a natural forest, an urban coastal site, a traffic-influenced highway location on the outskirts of the city, an urban park embedded within a densely built area, and a peri-urban agricultural region. This configuration enables the assessment of how different landuse types and emission sources influence observed GHG mole fractions across the metropolitan area.

Hourly averaged CO2 mole fractions show pronounced differences between sites. Lower values are observed at the forested Fabra site, while the ICTA site, located near a major highway, exhibits the highest mole fractions and the largest variability. These spatial contrasts are consistent with results from previous multi-site measurement campaigns in Barcelona, which indicated that densely urbanized, impermeable landscapes are associated with enhanced CO2 concentrations compared to greener areas, particularly during morning hours dominated by traffic emissions.

Maintaining a continuous urban monitoring network is essential for capturing both spatial and temporal variability in GHG concentrations and for improving our understanding of urban atmospheric processes. Such observations are also critical for constraining and validating atmospheric models and for quantifying changes in emissions over time. Here, we present recent observations from the Barcelona Metropolitan Area GHG network and illustrate their application to the study of greenhouse gas variability in complex urban environments.

How to cite: Monteiro, V., Villalba Mendez, G., Luo, Q., and Curcoll Masanes, R.: Urban greenhouse gas monitoring across the Barcelona Metropolitan Area, EGU General Assembly 2026, Vienna, Austria, 3–8 May 2026, EGU26-10112, https://doi.org/10.5194/egusphere-egu26-10112, 2026.

EGU26-10768 | ECS | Posters on site | AS3.38

Forward modelling of SF6 with ICON-ART 

Maya Harms, Katharina Meixner, Tanja Schuck, Thomas Wagenhäuser, Sascha Alber, Kieran Stanley, Andreas Engel, Valentin Bruch, Thomas Rösch, Martin Steil, and Andrea Kaiser-Weiss

Sulfur hexafluoride (SF6) is a highly potent greenhouse gas (GHG). Despite its high global warming potential (GWP), it continues to be produced and used in Germany. The reported emission estimates can be used to calculate expected concentrations at measurements sites. Within the PARIS (Process Attribution of Regional Emissions) project we used the operational numerical weather prediction model ICON (ICOsahedral Nonhydrostatic) and its extension module for aerosol and trace gases (ART) as an Eulerian forward model to calculate the expected mixing concentrations response of Germany's largest point source of SF6. We compared the modelled concentration peaks that occur when the modelled plume crosses the measurement site of the Taunus observatory (TOB) with the respective observed signals (requiring background subtraction). The 4-year period of 2020-2023 was covered, and the uncertainty of the meteorological transport was estimated using a 20-member ensemble in our limited area model for Europe, which was run with a horizontal grid resolution of 6.5 km and 74 vertical levels.The model predicts well when peaks are measured but weWe found that most observed peaks at TOB are considerably higher than in the model, suggesting that prior emissions estimates were too low. 
This indicates that the independent, observation-based emission estimate of our ICON-ART based system is in the range of double-digit tons, which is considerably higher than the self-reported SF6 emission estimate for this point source, also if the model uncertainties are taken into account. 

How to cite: Harms, M., Meixner, K., Schuck, T., Wagenhäuser, T., Alber, S., Stanley, K., Engel, A., Bruch, V., Rösch, T., Steil, M., and Kaiser-Weiss, A.: Forward modelling of SF6 with ICON-ART, EGU General Assembly 2026, Vienna, Austria, 3–8 May 2026, EGU26-10768, https://doi.org/10.5194/egusphere-egu26-10768, 2026.

EGU26-11447 | ECS | Posters on site | AS3.38

Satellite-Based Estimation of Nitrous Oxide Concentration and Emission in a Large Estuary 

Wenjie Fan and Zhihao Xu

Estuaries are nitrous oxide (N2O) emission hotspots and play an important role in the global N2O budget. However, the large spatiotemporal variability of emission in complex estuary environments is challenging for large-scale monitoring and budget quantification. This study retrieved water environmental variables associated with N2O cycling based on satellite imagery and developed a machine learning model for N2O concentration estimations. The model was adopted in China’s Pearl River Estuary to assess spatiotemporal N2O dynamics as well as annual total diffusive emissions between 2003 and 2022. Results showed significant variability in spatiotemporal N2O concentrations and emissions. The annual total diffusive emission ranged from 0.76 to 1.09 Gg (0.95 Gg average) over the past two decades. Additionally, results showed significant seasonal variability with the highest contribution during spring (31 ± 3%) and lowest contribution during autumn (21 ± 1%). Meanwhile, emissions peaked at river outlets and decreased in an outward direction. Spatial hotspots contributed 43% of the total emission while covering 20% of the total area. Finally, SHapley Additive exPlanations (SHAP) was adopted, which showed that temperature and salinity, followed by dissolved inorganic nitrogen, were key input features influencing estuarine N2O estimations. This study demonstrates the potential of remote sensing for the estimation of estuarine emission estimations.

How to cite: Fan, W. and Xu, Z.: Satellite-Based Estimation of Nitrous Oxide Concentration and Emission in a Large Estuary, EGU General Assembly 2026, Vienna, Austria, 3–8 May 2026, EGU26-11447, https://doi.org/10.5194/egusphere-egu26-11447, 2026.

EGU26-11719 | ECS | Posters on site | AS3.38

Using atmospheric observations to identify point sources of halogenated trace gases 

Katharina Meixner, Dominique Rust, Tanja J. Schuck, Thomas Wagenhäuser, Fides Gad, Cedric Couret, Armin Jordan, Martin Vojta, Andreas Stohl, and Andreas Engel and the PARIS project

Measurement-based emission estimates derived from atmospheric observations provide an independent and important approach for identifying emission sources, quantifying emissions and verifying reported inventories. This is particularly relevant for halogenated gases, which due to their role as ozone depleting substances and potent greenhouse gases are regulated under various international and national frameworks. Here, we present two studies highlighting the urgency and the challenges of the measurement-based emission estimates of sulfur hexafluoride (SF6) and fluoroform (HFC-23) with a particular focus on the influence of point sources.

SF6 and HFC-23 are two of the most potent greenhouse gases with a GWP100 of approximately 24,000 and 14,700, respectively. Previous studies consistently showed a dominant emission source in southern Germany contributing to a large share of European SF6 emissions. Meixner et al., 2025 analysed emission estimates based on 22 European measurement sites revealing an underestimated SF6 emission point source in southern Germany in contrast to the national inventory reports.

Recent studies highlighted major challenges in quantifying HFC-23 emissions (Adam et al., 2024; Rust et al., 2024). We investigate the effects of intermittency in emissions and explore different possibilities based on a priori assumptions about specific emission sources. Forward calculations from these potential emission sources are used to derive expected time series at observational sites. These are compared to observations from different European stations situated in the regions influenced by the potential point sources. We present different approaches based on European atmospheric measurements combined with multiple model approaches, including ICON-ART, FLEXPART and NAME.

Adam, B., Western, L.M., Mühle, J., Choi, H., Krummel, P.B., O’Doherty, S., Young, D., Stanley, K.M., Fraser, P.J., Harth, C.M., Salameh, P.K., Weiss, R.F., Prinn, R.G., Kim, J., Park, H., Park, S., Rigby, M., 2024. Emissions of HFC-23 do not reflect commitments made under the Kigali Amendment. Commun. Earth Environ. 5, 783. https://doi.org/10.1038/s43247-024-01946-y

Meixner, K., Wagenhäuser, T., Schuck, T.J., Alber, S., Manning, A.J., Redington, A.L., Stanley, K.M., O’Doherty, S., Young, D., Pitt, J., Wenger, A., Frumau, A., Stavert, A.R., Rennick, C., Vollmer, M.K., Maione, M., Arduini, J., Lunder, C.R., Couret, C., Jordan, A., Gutiérrez, X.G., Kubistin, D., Müller-Williams, J., Lindauer, M., Vojta, M., Stohl, A., Engel, A., 2025. Characterization of German SF6 Emissions. ACS EST Air 2, 2889–2899. https://doi.org/10.1021/acsestair.5c00234

Rust, D., Vollmer, M.K., Henne, S., Frumau, A., van den Bulk, P., Hensen, A., Stanley, K.M., Zenobi, R., Emmenegger, L., Reimann, S., 2024. Effective realization of abatement measures can reduce HFC-23 emissions. Nature 633, 96–100. https://doi.org/10.1038/s41586-024-07833-y

How to cite: Meixner, K., Rust, D., Schuck, T. J., Wagenhäuser, T., Gad, F., Couret, C., Jordan, A., Vojta, M., Stohl, A., and Engel, A. and the PARIS project: Using atmospheric observations to identify point sources of halogenated trace gases, EGU General Assembly 2026, Vienna, Austria, 3–8 May 2026, EGU26-11719, https://doi.org/10.5194/egusphere-egu26-11719, 2026.

EGU26-11963 | Posters on site | AS3.38

 Bridging Science and National GHG Inventories: Insights from the PARIS Project – Process Attribution of Regional Emissions 

Sylvia Walter, Alistair Manning, Thomas Röckmann, and Anita Ganesan and the PARIS Team

Strengthening the link between scientific research and official greenhouse gas (GHG) reporting is an important step under the Paris Agreement’s Enhanced Transparency Framework. The PARIS Project, funded by Horizon Europe, is working with eight European countries to develop practical tools for this purpose.

A central innovation of PARIS is the development of draft annexes to National Inventory Documents (NIDs). These annexes provide a structured and transparent interface between official bottom-up inventories and top-down atmospheric estimates. They do not alter formal reporting rules; instead, they document how independent scientific assessments compare with inventory estimates, identify consistencies and discrepancies, and highlight where further investigation or methodological development is warranted. In this way, the annexes enable inventory compilers, policymakers, and scientists to interpret atmospheric results within the legal and institutional framework of national reporting.

The annexes are underpinned by major advances in PARIS observation and modelling capacity. Expanded and harmonised networks for CH₄, N₂O, F-gases, and aerosols, together with multi-model inverse systems and common data standards publicly available on the ICOS Carbon Portal, provide robust, traceable estimates of regional emissions and their sectoral drivers. These scientific outputs are synthesised in the annexes in a form that is directly usable by inventory agencies.

Through close engagement with national inventory teams in the UK, Switzerland, Germany, Ireland and other focus countries, PARIS has co-developed annex templates and begun populating them with results from multiple inversion systems. This process reduces barriers between the research and inventory communities and supports routine, transparent comparison of bottom-up and top-down estimates.

The poster will present the main outcomes of the PARIS project, demonstrating how the outcomes advance and embed atmospheric science in national GHG reporting to strengthen confidence in emission estimates, improve process attribution of regional emissions, and ultimately support more effective climate policy under the Paris Agreement.

How to cite: Walter, S., Manning, A., Röckmann, T., and Ganesan, A. and the PARIS Team:  Bridging Science and National GHG Inventories: Insights from the PARIS Project – Process Attribution of Regional Emissions, EGU General Assembly 2026, Vienna, Austria, 3–8 May 2026, EGU26-11963, https://doi.org/10.5194/egusphere-egu26-11963, 2026.

EGU26-12319 | ECS | Orals | AS3.38

The use of CLMS products for improving the spatialization of greenhouse gases emissions from LULUCF and agriculture sectors  

Giulia Cecili, Paolo De Fioravante, Guido Pellis, Marina Vitullo, and Angela Fiore

The Land Use, Land-Use Change, and Forestry (LULUCF) and agriculture sectors are increasingly central to global climate policy. They play a crucial role in climate mitigation strategies, as land acts as a carbon sink that needs to be enhanced and as a source of greenhouse gas (GHG) emissions that must be reduced. In the European context, the LULUCF Regulation (EU 2018/841), revised in 2023, aims for 310 Mt CO2eq net removals by 2030 and requires spatially explicit land-use representations to monitor land dynamics and assess policy impacts.

Within the Horizon project AVENGERS (Attributing and Verifying European and National Greenhouse Gas and Aerosol Emissions and Reconciliation with Statistical Bottom-up Estimates), a methodology was developed to generate an IPCC-compliant land-use map by integrating multiple Copernicus Land Monitoring Service (CLMS) products. In national GHG inventories, the operational use of spatial explicit data is often limited due to restricted temporal coverage, inconsistencies with national statistics, and challenges in interpreting mixed classes and land-use/land cover definitions. This methodology provides a transparent approach to reconcile inventory data with high-resolution spatial datasets.

The approach combines the CLC Plus Backbone geometry with CORINE Land Cover (CLC) and ancillary CLMS datasets, including the High-Resolution Layer Crop Types and Priority Areas monitoring products (e.g., Coastal Zones, Riparian Zones, and Protected areas). Multiple layers were integrated using overlay techniques and priority rules, resulting in an harmonized map at 10-m spatial resolution. CLC attributes were aggregated to IPCC land use categories, allowing direct comparison between mapped areas and inventory surfaces.

Preliminary validation involved cross-checks with national land-use activity data to ensure reliability of mapped areas across LULUCF categories. The resulting maps enable the spatialization of inventory-based LULUCF and agriculture emissions, producing gridded emission datasets based on improved spatially explicit land-use information. These datasets are suitable for use as input (priors) in atmospheric inversion modelling, a top-down emissions estimation method supporting policy evaluation.

The methodology is designed to be replicable across all European countries covered by CLMS data and to be updated approximately every 2–3 years, in line with the regular update cycle of CLMS products. The methodological framework is modular and flexible, based on a spatial data storage and management scheme developed by ISPRA, which allows the integration of additional datasets and adaptation to different territorial contexts. The approach was applied and tested in three national case studies for the year 2018—Italy, Sweden, and the Netherlands—with specific adaptations introduced to account for distinct territorial characteristics. This first implementation represents a promising step and provides a solid foundation for further refinements and future developments, supporting the production of high-resolution land-use maps helpful for national inventory agencies and inversion modelling experts.

How to cite: Cecili, G., De Fioravante, P., Pellis, G., Vitullo, M., and Fiore, A.: The use of CLMS products for improving the spatialization of greenhouse gases emissions from LULUCF and agriculture sectors , EGU General Assembly 2026, Vienna, Austria, 3–8 May 2026, EGU26-12319, https://doi.org/10.5194/egusphere-egu26-12319, 2026.

EGU26-12745 | ECS | Posters on site | AS3.38

Impact of Local-Scale Effects in Methane (CH₄) Inversions on Model-Observation Discrepancies 

Elena Zwerschke, Frank-Thomas Koch, Christoph Gerbig, Jennifer Mueller-Williams, Matthias Lindauer, Frank Keppler, and Dagmar Kubistin

Accurate estimates of greenhouse gas emissions are critical for determining the effectiveness of mitigation strategies under the Paris Agreement. These estimates are commonly derived by atmospheric inversion frameworks, which combine atmospheric transport models with in situ observations to obtain greenhouse gas fluxes. However, regional inversions are often challenged by local-scale signals in atmospheric measurements, that are insufficiently represented by the models. If not properly accounted for, these can introduce biases in inverse flux estimates undermining the reliability of emission estimates.

To address this limitation, observational data has typically been filtered for local influences before being used in inversion simulations, based on assumptions such as stable boundary conditions or wind speed. To make full use of the available dataset, we implemented an observation-dependent model-data uncertainty in the inversion optimisation process, allowing local signals to be explicitly considered. This approach has been applied to CH4 inversions over Europe using the mesoscale Jena CarboScope-Regional (CSR) system at 0.25° × 0.25° resolution.

To determine the time varying model-data uncertainty based on the local influence signal, a leave-one-out cross validation was performed for ground based in situ data of 47 atmospheric stations, excluding one station per inversion simulation. By determining the difference between modelled and observed concentrations, a model-data mismatch was estimated across station categories defined by surrounding land type. These estimates were then combined with local signal features, resulting from low wind speeds, atmospheric stability, and concentration spikes using a multivariate regression. The derived model-data mismatch function was applied to adjust the data weighting in the inversion enabling the inclusion of the observational dataset without discarding any measurements.

In this presentation, we demonstrate the potential of this novel approach to improve the robustness of regional CH4 inversions and to reduce the bias from local-scale signals.

How to cite: Zwerschke, E., Koch, F.-T., Gerbig, C., Mueller-Williams, J., Lindauer, M., Keppler, F., and Kubistin, D.: Impact of Local-Scale Effects in Methane (CH₄) Inversions on Model-Observation Discrepancies, EGU General Assembly 2026, Vienna, Austria, 3–8 May 2026, EGU26-12745, https://doi.org/10.5194/egusphere-egu26-12745, 2026.

EGU26-12776 | ECS | Posters on site | AS3.38

Quantifying European SF6 emissions (2005-2021) using a large ensemble of atmospheric inversions 

Martin Vojta, Andreas Plach, Rona L. Thompson, Pallav Purohit, Kieran Stanley, Simon O'Doherty, Dickon Young, Joe Pitt, Jgor Arduini, Xin Lan, and Andreas Stohl

Sulfur hexafluoride (SF₆) is an extremely potent (GWP100 = 24,300) and long-lived greenhouse gas whose atmospheric concentrations continue to rise due to anthropogenic emissions. Europe represents a particularly relevant test case for investigating SF₆ emissions, as successive EU F-gas regulations over the past two decades have aimed to substantially reduce emissions. A key question is whether these regulatory measures are reflected in observed emission trends and whether reported national inventories are consistent with observation-based estimates.

 In this study, we quantify European SF₆ emissions for the period 2005–2021 using a large ensemble of atmospheric inversions with a strong focus on uncertainty characterization. Uncertainties are assessed using an extensive set of sensitivity tests in which key inversion parameters are systematically varied, while final uncertainties are quantified via a Monte Carlo ensemble that randomly samples combinations of these parameters. This allows us to identify the main sources of uncertainty and to evaluate the robustness of inferred emission trends.

Our analysis focuses on countries with relatively dense observational coverage - the United Kingdom, Germany, France, and Italy - while also examining aggregated emissions for the EU-27.  The inversion results reveal declining SF₆ emissions in all studied regions except Italy, broadly consistent with the timing of EU F-gas regulations (842/2006, 517/2014). In several countries, inferred emissions exceed reported national inventories, although the agreement generally improves in more recent years. At the EU-27 scale, emissions exhibit a pronounced decline between 2017 and 2018, coinciding with a marked reduction in emissions from southwestern Germany, suggesting regional actions were taken as the 2014 regulation took effect.

Our sensitivity tests highlight the crucial role of dense and sustained atmospheric monitoring networks for robust inversion-based emission estimates. In particular, expansions of the UK observing system in 2012 and 2014 lead to significant reductions in emission uncertainties, demonstrating the importance of comprehensive observational networks in refining emission estimates.

How to cite: Vojta, M., Plach, A., Thompson, R. L., Purohit, P., Stanley, K., O'Doherty, S., Young, D., Pitt, J., Arduini, J., Lan, X., and Stohl, A.: Quantifying European SF6 emissions (2005-2021) using a large ensemble of atmospheric inversions, EGU General Assembly 2026, Vienna, Austria, 3–8 May 2026, EGU26-12776, https://doi.org/10.5194/egusphere-egu26-12776, 2026.

EGU26-14303 | ECS | Orals | AS3.38

Urban Atmospheric Monitoring and Modeling System (Urban-AMMS): A Top-Down Approach to Investigate Sources and Variability of an Inert Tracer in the Washington, DC, and Baltimore, MD, Metropolitan Area 

Miguel Cahuich-Lopez, Christopher Loughner, Fong Ngan, Anna Karion, Lei Hu, Israel Lopez-Coto, Kimberly Mueller, Julia Marrs, John Miller, Brian McDonald, Colin Harkins, Congmeng Lyu, Meng Li, Kevin Gurney, Sonny Zinn, Xinrong Ren, Mark Cohen, Howard Diamond, Ariel Stein, and James Whetstone

Accurate quantification of the sources and sinks of long-lived air pollutants is fundamental for effective emissions management, particularly in urban areas where emissions are generally more intense. Stakeholders commonly use so-called bottom-up methods to estimate emissions for urban areas. This type of emission accounting is typically carried out for annual totals, often with a latency of one or more years. Alternative methods that provide estimates with higher temporal resolution and lower latency could be helpful for stakeholders seeking targeted strategies to reduce emissions. A top-down urban emissions estimation system for the Washington, DC, and Baltimore, MD, metropolitan area, called the Urban Atmospheric Monitoring and Modeling System (Urban-AMMS), is being developed to provide accurate, up-to-date urban emissions data. Urban-AMMS has several components, including tower-based, aircraft, and mobile van measurements platforms, whose data are assimilated by the CarbonTracker-Lagrange analytical inverse model; an ensemble of HYSPLIT backward dispersion simulations driven by in-house high-resolution WRF simulations (spatial resolution of 1 km) enhanced with urban meteorological observations; biospheric models; and bottom-up inventories used for a prior estimate of emissions in the domain. The inversion system is tailored to account for the underlying variability in urban fluxes of an inert tracer (CO2) by solving for hourly fluxes and incorporating explicit spatiotemporal covariance of prior errors, as well as high-resolution source-receptor sensitivities estimated by WRF-HYSPLIT. Here, we present an overview of Urban-AMMS, including initial results and sensitivity analyses to investigate the effects of prior spatial aggregation, background handling, and the temporal covariance of prior errors. Numerical experiments show improvements in estimates of urban surface fluxes at both the city and grid cell scales. Still, the reliability of inverse fluxes depends on prior uncertainty, as observed in previous studies. These findings provide critical insights for the inverse estimation of long-lived air pollutants in complex urban environments.

How to cite: Cahuich-Lopez, M., Loughner, C., Ngan, F., Karion, A., Hu, L., Lopez-Coto, I., Mueller, K., Marrs, J., Miller, J., McDonald, B., Harkins, C., Lyu, C., Li, M., Gurney, K., Zinn, S., Ren, X., Cohen, M., Diamond, H., Stein, A., and Whetstone, J.: Urban Atmospheric Monitoring and Modeling System (Urban-AMMS): A Top-Down Approach to Investigate Sources and Variability of an Inert Tracer in the Washington, DC, and Baltimore, MD, Metropolitan Area, EGU General Assembly 2026, Vienna, Austria, 3–8 May 2026, EGU26-14303, https://doi.org/10.5194/egusphere-egu26-14303, 2026.

EGU26-14957 | Orals | AS3.38

Quantifying N₂O Flux over the EU27+3 Region Using CIF-CHIMERE Model for 2005–2023 

Tianqi Shi, Antoine Berchet, and Philippe Ciais

Nitrous oxide (N₂O) is the third most important long-lived greenhouse gas after CO₂ and CH₄, yet large uncertainties remain in its regional emission estimates. In this study, we apply the regional inverse modeling system CIF-CHIMERE to quantify N₂O surface fluxes over the EU27+3 region (European Union, United Kingdom, Norway, and Switzerland) for the period 2005–2023, providing a long-term and high spatiotemporal resolution assessment of N2O fluxes. The inversion is primarily constrained by in situ atmospheric N₂O measurements from the ICOS (Integrated Carbon Observation System) ground-based station network across Europe, and uses the CIF-CHIMERE transport model coupled with a four-dimensional variational (4D-Var) data assimilation framework to estimate posterior N2O fluxes. For 2005–2023, inversions are conducted at a spatial resolution of 0.5° × 0.5°, while for 2018–2023 the resolution is refined to 0.2° × 0.2°. In both configurations, hourly surface fluxes are estimated, enabling analysis of diurnal, seasonal, and interannual variability. The inversions significantly improve the representation of localized emission patterns and short-term flux dynamics. Overall, the results provide a top-down dataset for evaluating bottom-up inventories and for improving the understanding of regional and temporal variability in N₂O emissions across EU27+3.

How to cite: Shi, T., Berchet, A., and Ciais, P.: Quantifying N₂O Flux over the EU27+3 Region Using CIF-CHIMERE Model for 2005–2023, EGU General Assembly 2026, Vienna, Austria, 3–8 May 2026, EGU26-14957, https://doi.org/10.5194/egusphere-egu26-14957, 2026.

EGU26-15692 | ECS | Posters on site | AS3.38

CH4 emissions in Vietnamese Rice Agriculture: Benchmarking process-based model approaches (Tier 3) against Tier 1/2 Estimates 

Chien Nguyen, David Kraus, Tanh Nguyen, Reiner Wassmann, Klaus Butterbach-Bahl, Thi Bach Thuong Vo, Van Trinh Mai, Thi Phuong Loan Bui, and Ralf Kiese

Rice cultivation is the largest source of methane (CH4) emissions in Vietnam’s agricultural sector, making accurate quantification of these emissions critical for national GHG inventories and the design of mitigation policies. Currently, for UNFCCC GHG reporting, Vietnam primarily employs IPCC Tier 2 approaches using national emission factors combined with Tier 1 scaling factors. With the implementation of large-scale mitigation projects and Vietnam’s ambition to achieve Net Zero by 2050, Methane Global Pledge commitment by 2030, and joining international carbon markets, there is an urgent need to transition towards higher-tier methodologies. However, also process-based model (Tier 3) outputs are associated with uncertainty, which needs to be benchmarked first with established Tier 1 and 2 emission estimates.

In this study, CH4 emission data from 13 Vietnamese field experiments are split into two groups—one with comprehensive management information (sufficient data) and one with sparse information (limited data)—to test IPCC Tier methods under different activity data conditions. Furthermore, for Tier 3, an inter-comparison is conducted between two biogeochemical models, DNDC and LandscapeDNDC. The evaluation focuses on the performance in estimating rice yields, seasonal CH4 emissions, and daily flux dynamics, while also analyzing the impact of different model parameterization and simulation setups.

Our evaluation shows that Tier 1 significantly underestimates CH4 emissions, whereas Tier 2 provides a substantial improvement and remains robust across varying soil and management conditions. In contrast, Tier 3 outperforms Tier 2 only when comprehensive management data is available, reflecting its distinctive capacity to represent daily emission dynamics and management-driven peaks.  Consequently, while Tier 2 remains a practical choice for national inventories, Tier 3 is essential for high-resolution mitigation assessments, particularly for large-scale emission reduction evaluations where detailed management data are comprehensively collected and systematically organized. The process-based model comparison reveals that while DNDC and LandscapeDNDC show similar performance under continuous flooding, they diverge significantly under Alternate Wetting and Drying (AWD) regimes. These discrepancies are primarily attributed to the models' different concepts of representing water table fluctuations.

Building on these results, the Tier 3 approach of LandscapeDNDC was integrated into the web‑based LUI‑RICE platform (https://ldndc.online/rice/). This makes GHG quantification for Vietnamese rice cultivation directly accessible to local stakeholders and policymakers, translating the scientific findings of this study into a practical decision-support application.

How to cite: Nguyen, C., Kraus, D., Nguyen, T., Wassmann, R., Butterbach-Bahl, K., Vo, T. B. T., Mai, V. T., Bui, T. P. L., and Kiese, R.: CH4 emissions in Vietnamese Rice Agriculture: Benchmarking process-based model approaches (Tier 3) against Tier 1/2 Estimates, EGU General Assembly 2026, Vienna, Austria, 3–8 May 2026, EGU26-15692, https://doi.org/10.5194/egusphere-egu26-15692, 2026.

EGU26-15734 | Orals | AS3.38

ΔXCO/ΔXCO2 characteristics over coal-fire areas in Xinjiang, China using a portable EM27/SUN FTIR spectrometer 

Qiansi Tu, Jiaxin Fang, Frank Hase, André Butz, África Barreto, Omaira García, and Kai Qin

Long-term coal spontaneous combustion (CSC) represents a severe and persistent threat, resulting in substantial waste of energy resources, significant environmental degradation, and serious risks to human health and safety. To better understand the emission characteristics of CSC, we conducted ground-based measurements of XCO₂, XCH₄, XCO and aerosol optical depth (AOD) using a Fourier-transform infrared spectrometer (EM27/SUN) within the COCCON network, in the Wugonggou coal-fire region near Fukang, Xinjiang.

Our results indicate that TROPOMI satellite data systematically underestimated XCO, with a mean bias of 4.53 ± 5.53 ppb (4.54%). For distinct enhancement events observed by COCCON, ΔXCO₂ and ΔXCO exhibit a strong correlation (R² = 0.6082), with a slope of 9.782 ppb/ppm (9.782 × 10⁻³ ppm/ppm). This value is lower than the CAMS inventory ratio of 13.52 × 10⁻³. This discrepancy arises primarily from their distinct spatial representativeness. The COCCON instrument, located within the coal fire region, captures intense local combustion emission. In contrast, the CAMS product represents a daily average over a much larger model grid cell, which dilutes strong local point sources like coal fires within a broader regional background. Additionally, correlation analysis shows that ΔXCO is more closely linked to AOD (R² = 0.2283) than either ΔXCO₂ or ΔXCH₄, underscoring the distinct behavior of CO in coal-fire plumes.

How to cite: Tu, Q., Fang, J., Hase, F., Butz, A., Barreto, Á., García, O., and Qin, K.: ΔXCO/ΔXCO2 characteristics over coal-fire areas in Xinjiang, China using a portable EM27/SUN FTIR spectrometer, EGU General Assembly 2026, Vienna, Austria, 3–8 May 2026, EGU26-15734, https://doi.org/10.5194/egusphere-egu26-15734, 2026.

EGU26-16089 | Orals | AS3.38

National-scale methane emissions in South Korea (2010–2021): insights from multiple inversion systems  

Samuel Takele Kenea, Daegeun Shin, Wonick Seo, Sunran Lee, Fenjuan Wang, Shamil Maksyutov, Rajesh Janardanan, Soojeong Lee, Dmitry A. Belikov, Prabir K. Patra, Nicole Montenegro, Antoine Berchet, Marielle Saunois, Adrien Martinez, Ruosi Liang, Yuzhong Zhang, Ge Ren, Hong Lin, Sara Hyvärinen, and Aki Tsuruta and the Sangwon Joo, Sumin Kim

Accurate estimation of methane (CH₄) emissions is essential for assessing mitigation progress, 
yet substantial uncertainties persist at the national scale. In South Korea, CH₄ emissions are 
predominantly anthropogenic, with the waste and agricultural sectors contributing 
approximately 82% of total national emissions. This study analyzes national-scale CH₄ 
emission estimates for South Korea during 2010–2021 using multiple atmospheric inversion 
systems participating in the Methane Inversion Inter-Comparison for Asia (MICA) project. 
Results from inversions using only in situ observations indicate that prior emissions over South 
Korea were likely overestimated. Prior estimates range from 1.5 to 1.7 Tg yr⁻¹ for most years, 
whereas posterior emissions are, on average, about 15% lower than the prior estimates. A 
notable exception is the LMDZ inversion model, which yields posterior estimates that are 40
67% lower than prior values. This substantial reduction is primarily associated with the waste 
sector. Sectoral attribution reveals substantial inter-model differences. LMDZ shows a 
decreasing waste-sector emission trend in Exp. 1 but an increasing trend when only satellite 
observations are assimilated (Exp. 2), whereas the STILT-based inversion consistently 
indicates increasing waste-sector emissions. Given that the waste sector dominates national 
CH₄ emissions, these discrepancies strongly influence total emission estimates. The prior 
waste-sector emissions, derived from EDGAR v7, exceed those reported in South Korea’s 
national greenhouse gas inventory (GIR), contributing to the observed overestimation. 
Additionally, the inversion-derived posterior estimates consistently indicate an overestimation 
of prior agricultural emissions during the summer months. Model performance evaluation over 
the region of interest indicates varying levels of agreement between simulated and observed 
CH₄ mole fractions, with correlation coefficients ranging from 0.24 to 0.85 and posterior biases 
ranging from −65.6 to 0.34 ppb, highlighting the choice of transport model is important. Overall, 
this study highlights the value of multi-model inversion inter-comparisons for constraining 
national-scale CH₄ emissions, diagnosing sector-specific uncertainties, and identifying 
structural differences among inversion frameworks that can guide future improvements. 

How to cite: Takele Kenea, S., Shin, D., Seo, W., Lee, S., Wang, F., Maksyutov, S., Janardanan, R., Lee, S., Belikov, D. A., Patra, P. K., Montenegro, N., Berchet, A., Saunois, M., Martinez, A., Liang, R., Zhang, Y., Ren, G., Lin, H., Hyvärinen, S., and Tsuruta, A. and the Sangwon Joo, Sumin Kim: National-scale methane emissions in South Korea (2010–2021): insights from multiple inversion systems , EGU General Assembly 2026, Vienna, Austria, 3–8 May 2026, EGU26-16089, https://doi.org/10.5194/egusphere-egu26-16089, 2026.

EGU26-16769 | Posters on site | AS3.38

Improving the Accuracy of CO₂ Emission Estimates over South Korea Using a Top-down Inversion Framework 

Ho Yeon Shin, Daegeun Shin, Samuel Takele Kenea, Sunran Lee, Sumin Kim, and Yun Gon Lee

The international community has continuously monitored carbon emissions by publishing National Inventory Reports (NIRs) under the Paris Agreement adopted in 2015 to address the climate crisis. However, current emission estimation methods predominantly rely on bottom-up approaches based on statistical information, which are subject to limitations, including the potential omission of emission sources and the long time required for emission compilation. To overcome these limitations, top-down approaches that estimate emissions using meteorological models and observed atmospheric greenhouse gas concentrations have recently gained increasing attention. This approach has been adopted as a scientific methodology of the Integrated Global Greenhouse Gas Information System (IG3IS), developed under the auspices of the World Meteorological Organization (WMO), and is regarded as a complementary alternative to conventional emission inventories. In this study, carbon dioxide (CO₂) emissions over South Korea were estimated using a top-down approach based on the Stochastic Time-Inverted Lagrangian Transport Model (STILT) and observations from WMO/Global Atmosphere Watch (GAW) stations, and their accuracy was evaluated. The STILT-based inversion results indicate that anthropogenic CO₂ emissions in South Korea for 2019 amount to 589.7 Mt yr⁻¹, which is 83.6 Mt yr⁻¹ lower than the estimate reported in the existing NIR. The downward correction is primarily concentrated in Seoul and the surrounding metropolitan region. Furthermore, to account for the spatial characteristics of CO₂ emission distributions, high-resolution and realistic emission estimates were derived for regions with dense point-source emissions using the Weather Research and Forecasting (WRF) model. The application of top-down approaches for greenhouse gas emission estimation in East Asian countries, together with continuous technological advancement, is expected to provide a scientific foundation for improving the reliability of emission estimates and supporting future climate crisis response strategies.

How to cite: Shin, H. Y., Shin, D., Kenea, S. T., Lee, S., Kim, S., and Lee, Y. G.: Improving the Accuracy of CO₂ Emission Estimates over South Korea Using a Top-down Inversion Framework, EGU General Assembly 2026, Vienna, Austria, 3–8 May 2026, EGU26-16769, https://doi.org/10.5194/egusphere-egu26-16769, 2026.

EGU26-17209 | Posters on site | AS3.38

Development and Application of a Cryogenic Preconcentration System for Halogenated Greenhouse Gas Measurements in Korea 

Joo-Ae Kim, Sunggu Kang, Dohyun Kwon, Sunyoung Park, Soojeong Lee, and Sumin Kim

East Asia represents a major source region of greenhouse gas emissions associated with rapid industrialization and increasing energy demand. Among these emissions, halogenated synthetic greenhouse gases such as HFCs and PFCs, which have been widely used as substitutes following international regulations for ozone layer protection, are characterized by high global warming potentials (GWPs).

In South Korea, halogenated greenhouse gases have been monitored at the Gosan station on Jeju Island using the MEDUSA system of the AGAGE network.  However, the expansion of observational coverage and the establishment of measurement capabilities remain essential to better characterize regional emission signals.  In this study, a cryogenic preconcentration and analysis capability for halogenated greenhouse gases (NIMS-preconcentrator) was developed and and evaluate its capability for monitoring halogenated greenhouse gases.

The analytical setup includes a cryogenic thermal desorption (TD) unit and a pre-concentration trap capable of reaching temperatures down to −170 °C, integrated with an automated valve control module and gas chromatography–mass spectrometry (GC–MS). Measurements were conducted using an offline canister-based sampling approach. Analysis of ambient air samples collected at Anmyeondo (GAW station) resolved about ten halogenated greenhouse gas species, including HFC-134a, HFC-125, and legacy chlorofluorocarbons such as CFC-11 and CFC-12. Concentrations were evaluated using calibration standards, and ongoing performance assessment is conducted using laboratory working standards employed at the Gosan AGAGE station.

This study aims to establish a new measurement capability for halogenated greenhouse gases and to assess its consistency with international observation. Continued operation of this system will support the accumulation of long-term observational datasets and facilitate regional-scale analysis and inter-comparison of high-GWP halogenated greenhouse gases in Northeast Asia.

How to cite: Kim, J.-A., Kang, S., Kwon, D., Park, S., Lee, S., and Kim, S.: Development and Application of a Cryogenic Preconcentration System for Halogenated Greenhouse Gas Measurements in Korea, EGU General Assembly 2026, Vienna, Austria, 3–8 May 2026, EGU26-17209, https://doi.org/10.5194/egusphere-egu26-17209, 2026.

EGU26-17591 | Posters on site | AS3.38

High-resolution direct GHG emission estimation and simulation from residential space heating using open data  

Kirsten v. Elverfeldt, Gefei Kong, Veit Ulrich, Maria Martin, Moritz Schott, and Sebastian Block

Residential space heating remains a major source of greenhouse gas emissions in the building sector. In Germany, space heating accounts for the largest share of residential energy consumption, and accurate quantification of associated emissions is essential to meet national climate mitigation targets.

Most research on residential heating emissions focuses on the regional or national levels, while estimates at finer spatial scales remain limited. Data availability further constrains the transferability and usability of current models. Consequently, approaches that deliver spatially and temporally detailed emission estimates and interactive tools to support analysis and decision-making by stakeholders are urgently needed.

We introduce the Climate Action Navigator (CAN), a dashboard for the analysis and visualization of climate mitigation and adaptation spatial data, based entirely on open science principles. One of the tools available in the CAN estimates carbon dioxide emissions from residential heating at fine spatial at temporal scales. The tool applies a bottom-up accounting methodology at 100 m spatial resolution based on publicly available census and building characteristics data in Germany, including building age and dominant energy carriers. The resulting emission estimates are consistent with official city- and national-level inventories, confirming methodological reliability. Germany-wide analyses reveal strong spatial heterogeneity in energy consumption and emissions that correlate with urban morphological characteristics.

Temporal dynamics are captured through an hourly simulation using the Demand Ninja model based on local weather data. The resulting temporal emission patterns can support inverse emission modelling applications as well as aid energy management by, for example, revealing peak heating demand times and locations.

Results are delivered via the CAN interface as intuitive, interactive maps and charts that allow users to compare across neighborhoods, explore temporal emission dynamics, and assess potential mitigation actions. By integrating open-source data with high-resolution modeling and visualization, the Climate Action Navigator bridges the gap between scientific emission quantification and practical decision making. The approach supports transparent attribution and tracking of residential space-heating emissions, thereby advancing evidence-based climate mitigation planning.

How to cite: v. Elverfeldt, K., Kong, G., Ulrich, V., Martin, M., Schott, M., and Block, S.: High-resolution direct GHG emission estimation and simulation from residential space heating using open data , EGU General Assembly 2026, Vienna, Austria, 3–8 May 2026, EGU26-17591, https://doi.org/10.5194/egusphere-egu26-17591, 2026.

EGU26-19274 | ECS | Posters on site | AS3.38

Carbon dioxide and methane emissions from a network of thirty eddy-covariance sites in the Netherlands 

Ignacio Andueza Kovacevic, Laurent Bataille, Isabel Cabezas, Freek Engel, Wietse Franssen, Corine van Huissteden, Ronald Hutjes, Ruchita Ingle, Wilma Jans, Tan JR Lippmann, Jeferson Zerrudo, Hong Zhao, Reinder Nouta, and Bart Kruijt

Understanding the temporal dynamics and controls on greenhouse gas exchange between terrestrial ecosystems and the atmosphere is critical for advancing process-level understanding and informing national greenhouse gas budgets and inventories. A large portion of soils in the Netherlands are either drained or restored peatlands, where the high carbon/organic matter content is accompanied by large risk of carbon loss to the atmosphere through enhanced soil respiration (drained sites) and/or enhanced methane emissions (rewetted sites). For this reason, increasing attention is being paid to understanding and quantifying the greenhouse gas budgets of both drained and restored peatland sites across the Netherlands. 
 
To both inform national GHG inventories and improve our understanding of site scale process, we present a multi-site analysis of a network of more than thirty eddy-covariance sites in the Netherlands. We discuss the daily, seasonal, and annual variability of carbon dioxide (CO₂) and methane (CH₄) fluxes measured at these sites. These sites include intensively managed grasslands, arable fields, semi-natural pastures, forested peatlands, wetlands and marshes. These sites encompass a wide range of vegetation types, soil characteristics, and water-management practices, with continuous or semi-continuous high-frequency flux datasets extending across multiple years within the last decade.
 
We quantify daily, seasonal, and annual CO₂ and CH₄ fluxes and discuss key biophysical drivers, including soil composition and moisture, vegetation dynamics, groundwater levels, and the impacts of climate anomalies such as temperature and precipitation extremes across varying timescales. We discuss differences between sites and potential impacts of soil characteristics, vegetation, land management, and recent climate anomalies.
 
Our analysis indicates substantial variability in both CO₂ and CH₄ fluxes across sites and seasons. These results highlight the invaluable contributions of both high-resolution flux observations and rigorous data processing methods when disentangling ecosystem controls on gas exchange. These flux observations provide much needed empirical constraints for model evaluation and can facilitate improved representation of peatland and wetland systems in greenhouse gas inventories and process-based models.

How to cite: Andueza Kovacevic, I., Bataille, L., Cabezas, I., Engel, F., Franssen, W., van Huissteden, C., Hutjes, R., Ingle, R., Jans, W., Lippmann, T. J., Zerrudo, J., Zhao, H., Nouta, R., and Kruijt, B.: Carbon dioxide and methane emissions from a network of thirty eddy-covariance sites in the Netherlands, EGU General Assembly 2026, Vienna, Austria, 3–8 May 2026, EGU26-19274, https://doi.org/10.5194/egusphere-egu26-19274, 2026.

EGU26-19514 | Orals | AS3.38

Towards accurate quantification of New Zealand’s methane emissions from waste and agriculture 

Peter Sperlich, Christian Stiegler, Alex Geddes, Hamish Sutton, Brendon Smith, Molly Leitch, Sally Gray, Gordon Brailsford, Rowena Moss, Beata Bukosa, Sara Mikaloff-Fletcher, Amir Pirooz, Richard Turner, Jocelyn Turnbull, Johannes Laubach, Suzanne Rowe, Lorna McNaughton, Olivia Spaans, Kevan Brian, and Ellen Wymei

Methane emissions from waste and agriculture account for 46.6 % of Aotearoa New Zealand’s (ANZ) gross greenhouse gas emissions in 2023. Despite the significance of methane emissions, the only way to estimate their magnitude is based on emission factor methods, which include large uncertainties.  We present newly developed tools to directly measure methane emissions from wastewater treatment facilities, animal effluent storage systems and herds of dairy cows. We deploy in situ analysers on mobile observation platforms (vehicle and drone) and quantify methane emission fluxes using the tracer gas technique.  The accuracy of this method is estimated in multiple ways: i) a controlled release experiment, ii) through comparison to a mass-balance modelling approach, iii) through comparison to co-located chamber measurements for methane emissions from effluent ponds, iv) through comparison to co-located measurements of animal emissions using the “GreenFeed” technique. The comparisons show excellent agreement, providing much needed assurance of analytical performance to our mobile techniques. Our tools support ANZ’s farmers and waste managers to better understand current emissions, as well as to assess the efficacy of investments into emission mitigation. Additional tests explore new isotope techniques with the goal to quantify methane fluxes from different components within a plant, for example methane derived from digestors versus methane derived from biosolids in wastewater treatment systems, or methane from the open face of a landfill versus emissions from an area that is covered.

How to cite: Sperlich, P., Stiegler, C., Geddes, A., Sutton, H., Smith, B., Leitch, M., Gray, S., Brailsford, G., Moss, R., Bukosa, B., Mikaloff-Fletcher, S., Pirooz, A., Turner, R., Turnbull, J., Laubach, J., Rowe, S., McNaughton, L., Spaans, O., Brian, K., and Wymei, E.: Towards accurate quantification of New Zealand’s methane emissions from waste and agriculture, EGU General Assembly 2026, Vienna, Austria, 3–8 May 2026, EGU26-19514, https://doi.org/10.5194/egusphere-egu26-19514, 2026.

EGU26-19832 | ECS | Orals | AS3.38

Can observation-based atmospheric mixing state reduce filtering sensitivity in GHG inversions? Lessons from the UK GEMMA programme 

Dafina Kikaj, Peter Andrews, Alexandre Danjou, Alistair Manning, Matt Rigby, Ed Chung, Grant Forster, Angelina Wenger, Chris Rennick, Emmal Safi, Simon O’Doherty, Kieran Stanley, Joe Pitt, and Tom Gardiner

Uncertainty in atmospheric transport models, especially boundary-layer mixing and turbulence, still limits confidence in top-down GHG emission estimates. In inversion workflows, observation selection is commonly supported by empirically tuned filters based on modelled meteorological variables (e.g., boundary-layer height, wind speed). The selection prioritises periods when transport is expected to be well represented. This motivates continued work to characterise atmospheric mixing and its associated uncertainties using observations.

In the UK GEMMA programme, we investigate whether observation-based atmospheric mixing state can provide complementary information to support uncertainty characterisation in UK CH₄ inversions. We demonstrate the framework at UK sites with radon measurements and at a newly instrumented site in Scotland where only meteorological measurements are available. Where radon is measured, we use it as an independent tracer of near-surface mixing and compare observed radon with radon simulated using the Met Office NAME dispersion model and a radon flux map. This comparison is used to define transport-performance classes (periods of relatively better vs poorer agreement) and associated atmospheric mixing state. At the Scotland site, we derive atmospheric mixing regimes from in situ meteorological measurements alone, using a vertical profile sampled every 10 m to characterise stratification and mixing.

We show how the resulting atmospheric mixing state and transport-performance classes can be used in two operational ways: (i) as additional information to support observation selection alongside existing practice, and (ii) to define regime-dependent uncertainty characterisation within inversion frameworks rather than assuming a single fixed error model. We illustrate the approach using two UK CH₄ inverse methods (InTEM and RHIME) and discuss how observation-based mixing information can improve transparency and reproducibility in hybrid (inventory + atmospheric) emissions estimation for IG3IS-aligned information services.

How to cite: Kikaj, D., Andrews, P., Danjou, A., Manning, A., Rigby, M., Chung, E., Forster, G., Wenger, A., Rennick, C., Safi, E., O’Doherty, S., Stanley, K., Pitt, J., and Gardiner, T.: Can observation-based atmospheric mixing state reduce filtering sensitivity in GHG inversions? Lessons from the UK GEMMA programme, EGU General Assembly 2026, Vienna, Austria, 3–8 May 2026, EGU26-19832, https://doi.org/10.5194/egusphere-egu26-19832, 2026.

EGU26-20089 | Posters on site | AS3.38

From GHG Observations to Actionable Climate Information Services 

Daphne Kitsou, Parakevi Chantzi, Dimitrios Gkoutzikostas, Vasileios Rousonikolos, Georgios Galanis, Argiro Papastergiou, and Georgios Zalidis

Effective climate mitigation requires obtaining greenhouse gas (GHG) information and accounting that is scientifically robust and actionable for decision-making. The CARBONICA project has developed and implemented a robust climate-positive action plan for carbon farming implementation across the widening countries of Greece, Cyprus and North Macedonia, generating climate information services that operate at regional, national, and international scales. An extended management practices inventory has been developed and implemented in pilot sites across 15 crops between the 3 countries, fully aligned with the IPCC, the Natural Climate Solutions World Atlas, the GHG Protocol, and climate related EU laws and initiatives. GHG accounting is supported by a robust MRV system combining soil sampling, field inputs following IPCC Scope guidance, and management practices, covering direct, indirect, and upstream emissions across the farm system, with all procedures are fully compliant with ISO 14064-2. Farm-level data are also collected using the validated Field Diagnostic Toolbox, which includes soil CO₂ flux monitoring using spectroscopy to support accurate assessment of emissions and carbon removals.

This enables explicit attribution of emissions and carbon removals to farms, regions, and in general, the agrifood sector, supporting monitoring, reporting and validating of mitigation measures for positive climate action. LCA modelling on a pilot site (1ha peach orchard) has shown significant results in emissions reductions and carbon removals. The model was used once on the baseline (business-as-usual scenario) in 2024, and once after the management practices no- till and residues incorporation were implemented in the orchard, for the year 2025. The total greenhouse gas emissions from the pilot peach orchard decreased from 2,660 kg CO₂e in 2024 to 1,280 kg CO₂e in 2025, with emissions per ton of produced fruit dropping from 147.63 kg CO₂e to 71.04 kg CO₂e. Beyond the reduction of the emission sources, the demonstrated change in the soil carbon stock was also significant. While the 2024 cultivation season showed a net-zero change compared to the baseline scenario, the implementation of no-till and crop residue incorporation during the 2025 season created an active carbon sink, resulting in a net removal of 597.76 kg of CO₂e from the atmosphere into the soil. Thus, the project successfully demonstrated a twofold climate benefit: a major reduction in operation emissions and a significant sequestration of atmospheric carbon into the soil.

The results presented above are part of a third-party validated carbon farming project, facilitated through CARBONICA. This work also contributes to IG3IS-aligned applications demonstrating the operational use of multi-source GHG observations for real-world solutions in carbon farming.

How to cite: Kitsou, D., Chantzi, P., Gkoutzikostas, D., Rousonikolos, V., Galanis, G., Papastergiou, A., and Zalidis, G.: From GHG Observations to Actionable Climate Information Services, EGU General Assembly 2026, Vienna, Austria, 3–8 May 2026, EGU26-20089, https://doi.org/10.5194/egusphere-egu26-20089, 2026.

EGU26-20826 | ECS | Orals | AS3.38

Daily and 1/16 degree maps of CO2 fossil fuel emissions based on satellite retrievals of pollutant atmospheric data 

Alexandre Héraud, Frédéric Chevallier, Grégoire Broquet, Philippe Ciais, Adrien Martinez, and Anthony Rey-Pommier

In the context of the Paris Agreement on climate change and of a global effort to reduce greenhouse gas emissions, the monitoring of anthropogenic carbon dioxide (CO2) emissions is needed to assist policy makers but represents a major challenge. While current inventories provide rather robust annual emission totals at country scale, they lag behind real time by many months and they lack spatial and sub-annual details. Here we map the daily surface fossil fuel CO2 emissions at a 1/16 degree resolution over Europe, with the year 2021 as an example, based on spaceborne atmospheric composition observations.

As the high-resolution satellite monitoring of atmospheric CO2 remains challenging, especially at a local spatial scale and a daily time scale, we take advantage of the co-emission of CO2 and nitrogen oxides (NOX) during fossil fuel combustion: we exploit images of nitrogen dioxide (NO2) concentrations retrieved from the measurements of the Tropospheric Monitoring Instrument (TROPOMI) onboard the Sentinel-5P satellite.

From the TROPOMI NO2 concentrations, we retrieve daily maps of NOX emissions based on the divergence of the mass fluxes within the NO2 images. We combine the changes of these maps from one year to the next with low latency national CO2 emissions from Carbon Monitor (https://carbonmonitor.org/), and with a baseline of monthly spatially-distributed CO2 emissions for a previous year (here 2020) from GridFED (https://mattwjones.co.uk/co2-emissions-gridded/) from which we removed aviation and shipping emissions beforehand.

The resulting maps of emission increments from 2020 to 2021 capture changes in highly emitting areas: major urban or industrial areas, and main transport corridors. The emissions for the year 2021 show good consistency with existing inventories. The dataset also produces realistic seasonal variability at a local scale and captures daily variability, although temporally smoothed due to a 5-day rolling average of Carbon Monitor data.

This method is both temporally and spatially scalable and can therefore be extended to the entire world and to additional years, which provides encouraging prospects for the continuation of this work.

How to cite: Héraud, A., Chevallier, F., Broquet, G., Ciais, P., Martinez, A., and Rey-Pommier, A.: Daily and 1/16 degree maps of CO2 fossil fuel emissions based on satellite retrievals of pollutant atmospheric data, EGU General Assembly 2026, Vienna, Austria, 3–8 May 2026, EGU26-20826, https://doi.org/10.5194/egusphere-egu26-20826, 2026.

Quantitative evidence is increasingly required to assess the mitigation potential of cities in achieving global carbon neutrality. However, although urban green spaces contribute simultaneously through biophysical carbon sequestration and reductions in energy demand driven by urban heat island mitigation, few studies have systematically compared and evaluated these two effects within a unified framework at the global scale.This study quantifies the total contribution of urban green spaces to carbon neutrality across global cities and decomposes this contribution into carbon sequestration and cooling driven energy savings, assessing their relative importance and spatial patterns.The urban heat island effect is estimated using remote sensing derived land surface temperature differences between urban and non urban areas, while carbon sequestration by urban green spaces is simultaneously quantified based on satellite based observations.These two contributions are then integrated and compared. Furthermore, this study examines how the relative importance of the two effects varies across major climate zones and how heterogeneity manifests in distinct spatial patterns. Finally, this study investigates how vegetation related indicators, socio economic variables, and urban structural characteristics influence the two effects across climate zones with AI based approaches and identify contextual conditions under which the mitigation benefits of urban green spaces are amplified or attenuated even under similar urban green space availability.This study provides a global assessment of the contribution of urban green spaces to carbon neutrality and offers empirical evidence to support the design of climate and context specific nature based mitigation strategies in cities.

How to cite: Kim, S. and Choi, Y.: The dual role of urban green spaces in carbon neutrality: carbon sequestration and cooling driven energy savings at the global scale, EGU General Assembly 2026, Vienna, Austria, 3–8 May 2026, EGU26-20959, https://doi.org/10.5194/egusphere-egu26-20959, 2026.

EGU26-22515 | Orals | AS3.38 | Highlight

Assessing the accuracy of the Climate Trace global vehicular and power plant CO2 emissions 

Kevin Gurney, Bilal Aslam, Pawlok Dass, Lech Gawuc, Toby Hocking, Jarrett Barber, and Anna Kato

Accurate estimation of greenhouse gas (GHG) emissions at the infrastructure scale remains essential to climate science and policy applications. Powerplant and vehicle emissions often form the majority of fossil fuel CO2 (FFCO2) emissions in much of the world at multiple scales. Climate Trace, co-founded by former U.S. Vice President Al Gore, is a new AI-based effort to estimate pointwise and roadway-scale GHG emissions, among other sectors. However, limited independent peer-reviewed assessment has been made of this dataset. Here, we update a previous analysis of Climate Trace powerplant FFCO2 emissions in the U.S. and present a new analysis of Climate Trace urban on-road CO2 emissions in U.S. urban areas. This is done through comparison to an atmospherically calibrated, multi-constraint estimates of powerplant and on-road CO2 emissions from the Vulcan Project (version 4.0).

Across 260 urban areas in 2021, we find a mean relative difference (MRD) of 69.9% in urban inroad FFCO2 emissions. Furthermore, differing versions of the Climate Trace on-road emissions releases shift from over to under-estimation in almost equal magnitudes. These large differences are driven by biases in Climate Trace’s machine learning model, fuel economy values, and fleet distribution values. An update to the powerplant FFCO2 emissions analysis (from a 2024 paper) show both improved and degraded convergence of emissions. We continue to recommend that sub-national policy guidance or climate science applications using the GHG emissions estimates in these sectors made by Climate Trace should be done so with caution.

How to cite: Gurney, K., Aslam, B., Dass, P., Gawuc, L., Hocking, T., Barber, J., and Kato, A.: Assessing the accuracy of the Climate Trace global vehicular and power plant CO2 emissions, EGU General Assembly 2026, Vienna, Austria, 3–8 May 2026, EGU26-22515, https://doi.org/10.5194/egusphere-egu26-22515, 2026.

EGU26-3025 | ECS | Orals | AS3.39

Quantum dynamical modelling of photochemistry in gas-phase and complex environments 

Leon Cigrang and Graham Worth

Understanding the chemistry in our atmosphere requires, at the fundamental level, a mechanistic understanding of the various processes taking place. Many steps in the large reaction networks involve photochemical reactions and dissociation plays a particularly important role. From a theoretical standpoint, modelling such processes is challenging due to the highly non-equilibrium nature of the problem. In this presentation, it will be demonstrated how accurate quantum chemistry methods can be used to characterise excited states of key molecules (e.g. methanol), and how quantum dynamical simulations are then able to fully describe the dissociation pathways accessible in a given range of wavelengths. Quantitative branching ratios can be automatically obtained for each channel, along with their timescales, which offers valuable information for atmospheric modellers. Furthermore, a newly developed procedure is also discussed, which allows these same quantum dynamics simulations to be performed in an explicit, atomistic environment. Applying these techiques to atmospherically relevant systems is sure to yield valuable insights and to reduce error bars on many of the parameters used in large scale models. 

How to cite: Cigrang, L. and Worth, G.: Quantum dynamical modelling of photochemistry in gas-phase and complex environments, EGU General Assembly 2026, Vienna, Austria, 3–8 May 2026, EGU26-3025, https://doi.org/10.5194/egusphere-egu26-3025, 2026.

Cloud chamber experiments provide a controlled environment for investigating the microphysical processes that govern cloud formation, as well as elucidating the physical mechanisms underlying artificial weather modification. The Dual-Tank Mixed Cloud Chamber (2.7 m³ + 9 m³) allows precise control of temperature (−40-40°C), pressure (30-1110 hPa), and humidity. It is equipped with a comprehensive suite of instruments capable of monitoring the entire particle size distribution and activation, from aerosols to fog droplets. Quantitative seeding experiments for warm cloud (12°C)and cold clouds (-4°C) were performed to systematically examine their formation characteristics and microphysical responses to different seeding agents. In the warm-cloud experiments, the introduction of 10 g of a hygroscopic catalyst induced rapid nucleation of small droplets (3-10 μm), while simultaneously increase the development of larger droplets (≥ 20 μm) through enhanced hygroscopic growth. Under the -4°C condition in the cold-cloud experiments, the introduction of 0.5 g of AgI increased the submicron aerosol number concentration to 2 × 10⁴ cm⁻³, promoting rapid ice crystal formation that subsequently triggered the freezing and precipitation of liquid droplets.

How to cite: Luo, J. and Wu, H.: Design of a Dual-Tank Mixed Cloud Chamber and Quantitative Seeding Experiments for Warm and Cold Clouds, EGU General Assembly 2026, Vienna, Austria, 3–8 May 2026, EGU26-4934, https://doi.org/10.5194/egusphere-egu26-4934, 2026.

EGU26-5980 | Posters on site | AS3.39

Comparison of the results of hydrocarbon oxidation experiments in an indoor and an outdoor atmospheric simulation chamber 

Hendrik Fuchs, Paul Wills, Mixtli Campos-Pineda, Shogo Saito, Amir Ben Brik, Claudiu Roman, Satheesh Chandran, John Wenger, Anna Novelli, Michelle Färber, Yichen Gu, Peeyhush Kharee, Ralf Tillmann, Dhanya Wilson, Robert Wegener, Max Gerrit Adam, Birger Bohn, and Albert A. Ruth

Experiments in atmospheric simulation chambers enable the parameters of reaction kinetics to be determined and chemical mechanisms to be tested. However, observations are also affected by processes within the chambers that must be considered when interpreting experiments. This work compares results from experiments conducted in two chambers: the outdoor chamber SAPHIR at Forschungszentrum Jülich in Germany and the indoor chamber IASC at University College Cork in Ireland. The experiments were conducted on the same hydrocarbon oxidation processes. Box model calculations that included the chemical mechanisms of the species under study and the chemical and physical processes related to the chambers demonstrate good agreement between the modelled and measured time series of the observed species. This shows that the effects of the chambers were accurately characterised. The results could be used as a template for quality assurance and quality control protocols for simulation chambers, particularly within the ACTRIS research infrastructure.

How to cite: Fuchs, H., Wills, P., Campos-Pineda, M., Saito, S., Brik, A. B., Roman, C., Chandran, S., Wenger, J., Novelli, A., Färber, M., Gu, Y., Kharee, P., Tillmann, R., Wilson, D., Wegener, R., Adam, M. G., Bohn, B., and Ruth, A. A.: Comparison of the results of hydrocarbon oxidation experiments in an indoor and an outdoor atmospheric simulation chamber, EGU General Assembly 2026, Vienna, Austria, 3–8 May 2026, EGU26-5980, https://doi.org/10.5194/egusphere-egu26-5980, 2026.

EGU26-9454 | ECS | Orals | AS3.39

Theoretical Investigation of the Reactivity of Organosulfur Compounds with OH Radical 

Zahraa Chouaib, Denis Duflot, and Céline Toubin

ABSTRACT

Organosulfur compounds (OSs), including organosulfates (R–OSO₃⁻) and sulfonates (R–SO₃⁻), are important constituents of atmospheric aerosols and cloud droplets, playing a significant role in Earth’s energy balance and climate dynamics. OSs are considered dominant contributors to particulate-phase organosulfur, accounting for approximately 5–30% of the organic mass in PM10, and are formed through complex chemical pathways involving biogenic volatile organic compounds and sulfate under acidic conditions. Inspired by recent experimental studies using LP-LPA [1], LC–MS [2,3], and DART [4] techniques, this work presents a comprehensive theoretical investigation of the conformational preferences, chemical reactivity, and atmospheric transformation pathways of methyltetrol sulfates (2-MTS and 3-MTS), together with several smaller organosulfates and sulfonates.

In particular, the reaction of these OSs with hydroxyl radical OH was examined by means of computational chemistry methods. DFT optimization of all stationary points at the M06-2X/6-311++G(d,p) level was used, followed by single-point calculations using CBS/DLPNO-CCSD(T1) with implicit solvation through the SMD model [5]. Rate constants at 298 K were obtained from transition-state theory, enabling direct comparison with experiments [1-4]. We also explored reaction channels leading to fragmentation, functionalization, conversion to non-organosulfate products, and degradation to inorganic sulfate.


Keywords: Organosulfur, atmospheric chemistry, quantum chemistry, hydroxyl radicals, kinetics.


References


[1] Lai, D.; Schaefer, T.; Zhang, Y.; Li, Y. J.; Xing, S.; Herrmann, H.; Chan, M. N. ACS ES&T Air, 2024.

[2] Gweme, D. T.; Styler, S. A. J. Phys. Chem. A, 2024, 128, 9462–9475.

[3] Lam, H. K.; Kwong, K. C.; Poon, H. Y.; Davies, J. F.; Zhang, Z.; Gold, A.; Surratt, J. D.; Chan, M. N. Atmos. Chem. Phys., 2019, 19, 2433–2440.

[4] Chen, Y.; Zhang, Y.; Lambe, A. T.; Xu, R.; Lei, Z.; Olson, N. E.; Zhang, Z.; Szalkowski, T.; Cui, T.; Vizuete, W. Environ. Sci. Technol. Lett., 2020, 7, 460–468

[5] Marenich, A. V.; Cramer, C. J.; Truhlar, D. G. J. Phys. Chem. B, 2009.

How to cite: Chouaib, Z., Duflot, D., and Toubin, C.: Theoretical Investigation of the Reactivity of Organosulfur Compounds with OH Radical, EGU General Assembly 2026, Vienna, Austria, 3–8 May 2026, EGU26-9454, https://doi.org/10.5194/egusphere-egu26-9454, 2026.

EGU26-9612 | ECS | Orals | AS3.39 | Highlight

Nucleation of pinic acid: Using matrix-isolation Fourier transform infrared spectroscopy to get a first glance at processes on the molecular level 

Vincent Enders, Dennis F. Dinu, Astrid Nørskov Pedersen, Jonas Elm, Hinrich Grothe, Maren Podewitz, Julius Stolze, and Dominik Stolzenburg

New particle formation (NPF) is the predominant source of atmospheric aerosols globally in terms of particle number concentration [1]. NPF is a multi-step process, consisting of the nucleation of low-volatility vapors from the gas-phase, and subsequent growth of the initial molecular clusters through condensation. Nucleation is, in many environments, primarily driven by inorganic acids, such as sulfuric acid over land or iodic acid over the ocean. Organic acids, such as pinic acid, an oxidation product of the highly abundant alpha-pinene, are also contributing to the mass of fully grown particles. It is, however, not yet clear at what stage of NPF organic compounds become important and whether organic compounds can nucleate even without inorganic substances being present [2]. This knowledge gap arises partly from the fact that mass spectrometry provides only compositional data and lacks structural insights into potential bindings of initial-stage clusters.

Here, we show that matrix-isolation Fourier transform infrared spectroscopy (MI-FTIR) can be used to study the initial steps of nucleation. Monomers and dimers of pinic acid are studied in cryogenic argon matrices to characterize their bindings based on the vibrational spectrum. In such cryogenic matrices, the infrared spectra are greatly simplified compared to gas-phase FTIR measurements due to the suppression of the rotational bands, making small dimer bands clearly visible. In addition, we investigate the free energies and harmonic vibrational frequencies of pinic acid monomers and dimers using molecular dynamics simulations and quantum chemical calculations, aiming to assess how different molecular alignments during nucleation influence the IR spectrum. By comparing the experimental MI-FTIR data with these density functional theory (DFT) calculations, it is shown that the measured pinic acid dimer spectra best fit the calculated ones for dimers with only one OH-bridge having formed during dimerization. The existence of such singly bonded clusters, which are not predicted as the lowest free energy conformer by DFT, could be ideal for subsequent growth due to up to three unbound OH-groups available for further oligomerization. We also find that pinic acid forms dimers much more easily than other alpha-pinene oxidation products, such as pinonic acid.

This study on the nucleation of pinic acid shows that MI-FTIR is a versatile method to study the structure of precursor molecules of NPF and the very first stages of nucleation. The toolbox of MI-FTIR in conjunction with DFT calculations can readily be implemented for other organic NPF-precursors, such as MBTCA, and their nucleation, leading to valuable insights into the structure of initial clusters.

References:

[1]: Stolzenburg, D. et al. Atmospheric nanoparticle growth. Rev. Mod. Phys. 95, 045002 (2023).

[2]: Elm, J., et al.: Quantum Chemical Modeling of Organic Enhanced Atmospheric Nucleation: A Critical Review. WIREs Comp. Molec. Sc. 13, e1662 (2023).

How to cite: Enders, V., Dinu, D. F., Pedersen, A. N., Elm, J., Grothe, H., Podewitz, M., Stolze, J., and Stolzenburg, D.: Nucleation of pinic acid: Using matrix-isolation Fourier transform infrared spectroscopy to get a first glance at processes on the molecular level, EGU General Assembly 2026, Vienna, Austria, 3–8 May 2026, EGU26-9612, https://doi.org/10.5194/egusphere-egu26-9612, 2026.

EGU26-11258 | Orals | AS3.39

The reactivity of peroxy radicals 

Christa Fittschen, Bo Fang, Yu Xia, I-Yun Chen, Yu-Xuan Wu, Sebastien Batut, Amaury Lahccen, Weixiong Zhao, Xiaofeng Tang, Pei-Ling Luo, and Laure Pillier

Peroxy radicals, RO2, are key species in the atmosphere. They are formed from a reaction of OH radi-cals with hydrocarbons:

                                               RH + OH + O2 ->  RO2 + H2O

In polluted environments, RO2 radicals react predominantly with NO, leading to formation of NO2, and eventually through photolysis of NO2 to formation of O3.

At low NOx concentrations such as in the marine boundary layer or the background troposphere, the life-time of RO2 radicals increases and other reaction pathways such as self- and cross reaction with other RO2 or with HO2 radicals become competitive.

To study the reactivity of peroxy radicals, UV absorption spectroscopy has been employed in the past: this technique gives good sensitivity for peroxy radicals, but poor selectivity as these radicals have broad absorption features in the UV. We have established a technique allowing to follow peroxy radicals with a better selectivity compared to UV, but with still good sensitivity by coupling laser photolysis to cw-Cavity Ring Down Spectroscopy in the near IR. Two identical cw-CRDS paths are installed in a recently constructed temperature-controlled photolysis reactor in a small angle with respect to the Excimer photolysis beam, leading to an overlap of around 35 cm between the photolyzed volume and the detection volume. A third detection path for UV absorption measurements is installed in a slightly larger angle, leading to an overlap of around 20 cm between photolysis and absorption volume.

Here, we will present the first results obtained in the new reactor: the reaction between RO2 radicals and NO2. This reaction leads in an equilibrium reaction to the formation of RO2NO2 species. If the lifetime of these RO2NO2 are long enough, they will be transported and become a NOx source in remote environments. Therefore, determination of rate- and equilibrium constants of such reactions is important. In this work, two RO2 radicals have been generated simultaneously by 248nm laser photolysis of acetone, leading to roughly 1/3 CH3C(O)O2 radicals and 2/3 CH3O2 radicals. Time-resolved decays have then been observed for both radicals in the presence of different NO2 concentrations. The detection of both RO2 radicals is done simultaneously by high sensitivity cw-CRDS. RO2 concentrations can be decreased to a level where self-reaction becomes negligible at still excellent S/N ratio, making the measurement of RO2 + NO2 reaction straightforward. NO2 is quantified by UV-multipass absorption spectroscopy at 532nm in the photolysis reactor, and concentrations are compared with the calculated ones from the use of calibrated flowmeters.

How to cite: Fittschen, C., Fang, B., Xia, Y., Chen, I.-Y., Wu, Y.-X., Batut, S., Lahccen, A., Zhao, W., Tang, X., Luo, P.-L., and Pillier, L.: The reactivity of peroxy radicals, EGU General Assembly 2026, Vienna, Austria, 3–8 May 2026, EGU26-11258, https://doi.org/10.5194/egusphere-egu26-11258, 2026.

EGU26-11435 | ECS | Posters on site | AS3.39

Molecular-Scale Simulation of Water Adsorption and Chemisorption on Copper Oxide Surfaces 

Golnaz Roudsari, Mária Lbadaoui Darvas, Ana A. Piedehierro, Yrjö Viisanen, Ari Laaksonen, and Athanasios Nenes

Understanding how water adsorbs on metal oxide surfaces is essential for describing interfacial processes relevant to atmospheric chemistry, heterogeneous catalysis, and aerosol-cloud interactions. While recent experiments have shown pronounced adsorption-desorption hysteresis for water on nonporous oxides such as copper(II) oxide (CuO), the molecular mechanisms underlying this behavior remain unclear, particularly in the presence of chemisorption and surface hydroxylation. Molecular simulations provide a unique route to directly resolve these processes at the atomic scale.

In this work, we investigate water adsorption on the CuO(111) surface using a combined grand-canonical Monte Carlo (GCMC) and reactive molecular dynamics (MD) approach. GCMC simulations were performed at fixed temperature and water chemical potential to obtain adsorption isotherms directly comparable to experiment. Interatomic interactions were described using a ReaxFF reactive force field, allowing spontaneous water dissociation, proton transfer, and dynamic surface restructuring. Adsorption isotherms were constructed over a wide range of chemical potentials and converted to relative humidity using the simulated condensation chemical potential. The simulations reveal a multistage adsorption mechanism. At low chemical potentials, water adsorbs primarily via dissociative chemisorption, leading to progressive hydroxylation of the CuO surface. As chemical potential increases, additional water accumulates non-uniformly as hydrogen bonded clusters rather than as a continuous film. Near saturation, these clusters coalesce and trigger rapid multilayer growth. Reactive MD simulations show that chemisorbed species remain mobile and influence cluster stability, growth pathways, and desorption behavior. Simulated adsorption isotherms are in good agreement with experimental measurements and capture key features associated with adsorption-desorption hysteresis. By extracting adsorption parameters directly from the simulations, we assess the applicability of Frenkel-Halsey-Hill type multilayer adsorption models to reactive oxide surfaces, demonstrating that chemisorption must be explicitly accounted for in molecularly based adsorption frameworks.

How to cite: Roudsari, G., Lbadaoui Darvas, M., A. Piedehierro, A., Viisanen, Y., Laaksonen, A., and Nenes, A.: Molecular-Scale Simulation of Water Adsorption and Chemisorption on Copper Oxide Surfaces, EGU General Assembly 2026, Vienna, Austria, 3–8 May 2026, EGU26-11435, https://doi.org/10.5194/egusphere-egu26-11435, 2026.

EGU26-11876 | Orals | AS3.39

Evolution of the spectral optical properties of black carbon soot due to coating and ageing: insights from simulation chamber experiments 

Claudia Di Biagio, Johannes Heuser, Jerome Yon, Mathieu Cazaunau, Antonin Bergé, Edouard Pangui, Marco Zanatta, Laura Renzi, Angela Marinoni, Chenjie Yu, Servanne Chevaillier, Daniel Ferry, Paolo Laj, Michel Maillé, Paola Formenti, Benedicte Picquet-Varrault, and Jean-Francois Doussin

Black carbon (BC) soot aerosol, produced during the incomplete combustion of fossil fuels, biofuels, and biomasses, is a major light-absorbing species and a key climate forcer. Despite its importance, BC remains challenging to represent in models due to persistent uncertainties in its spectral optical properties. In particular, the formation of non-absorbing coatings on fractal BC soot is a ubiquitous atmospheric process that enhances absorption, yet the magnitude of this enhancement (Eabs) remains highly uncertain and poorly represented in current models.

In order to advance on this topic, a set of experiments were performed using the 4.2 m3 CESAM simulation chamber on BC-soot aerosol generated from a propane diffusion flame. Experiments were conceived to systematically investigate the impact of coating formation and further ageing on soot spectral optical properties. Two chemical systems inducing the formation of a coating by a second scattering aerosol phase produced via the photo-oxidation of SO2 and the ozonolysis of α-pinene were considered.

The resulting dataset quantifies the magnitude and variability of Eabs under varying conditions, highlighting its dependence on soot morphology, soot–coating structure, and particle-to-particle heterogeneous mixing state. We show that the relative importance of these factors evolves with the dynamics of coating formation and ageing. Importantly, the Eabs cannot be reliably predicted using a fixed value or simple core–shell optical models, as commonly assumed in climate simulations.

How to cite: Di Biagio, C., Heuser, J., Yon, J., Cazaunau, M., Bergé, A., Pangui, E., Zanatta, M., Renzi, L., Marinoni, A., Yu, C., Chevaillier, S., Ferry, D., Laj, P., Maillé, M., Formenti, P., Picquet-Varrault, B., and Doussin, J.-F.: Evolution of the spectral optical properties of black carbon soot due to coating and ageing: insights from simulation chamber experiments, EGU General Assembly 2026, Vienna, Austria, 3–8 May 2026, EGU26-11876, https://doi.org/10.5194/egusphere-egu26-11876, 2026.

EGU26-13803 | ECS | Orals | AS3.39

Sampling of clusters of oxygenated organic molecules enhanced with machine learning models 

Jaakko Kähärä, Katsiaryna Haitsiukevich, Hanna Vehkamäki, and Theo Kurtén

Oxygenated organic molecules (OOMs), formed in the atmosphere by oxidation of volatile organic compounds, are expected to take part in new particle formation (NPF). To determine their contribution to NPF, it is necessary to sample global minima of OOM clusters. However, the complexity of potential energy surfaces and the requirement of expensive of quantum calculations makes modelling of OOM cluster formation extremely time consuming. We have previously addressed these bottlenecks by assuming that the minimum cluster energy is likely to found by maximizing the hydrogen bonds between the monomers. Thus, we initially perform a constrained sampling to force random hydrogen bond formation. Additional local minima are found by utilizing metadynamics simulations.

We further improve upon cluster sampling by replacing the costly DFT methods with significantly faster UMA and Orb-v3 neural network potentials (NNP). The pretrained models allow us optimize clusters geometries and predict cluster binding energies at near quantum chemical accuracy. We study the efficacy of the NNPs by generating dimer clusters of selected C10 sized OOMs. We find that the ability of OOMs to bind strongly is often hindered by the tendency of monomers to form intramolecular hydrogen bonds. Additionally, we show that C20 sized alpha-pinene accretion production may form cluster without the involvement of inorganic acids or ions, and their clustering ability with sulfuric acid is comparable to that of ammonia.

While our approach is more efficient, the sampling become less likely find the true global minima as cluster complexity increases. To further reduce the number of structures to needed optimize, we use the previously generated OOM cluster data to train a graph neutral network (GNN) model to predict energies of the configurations from graph-based descriptions. GNNs allow us to very quickly find a subset of hydrogen bond pairings most likely to optimize towards a new global energy minima though the prediction accuracy is significantly reduced compared to NNPs. Our goal is to train a general model which may also extrapolate to molecules and clusters not included in the training set.

How to cite: Kähärä, J., Haitsiukevich, K., Vehkamäki, H., and Kurtén, T.: Sampling of clusters of oxygenated organic molecules enhanced with machine learning models, EGU General Assembly 2026, Vienna, Austria, 3–8 May 2026, EGU26-13803, https://doi.org/10.5194/egusphere-egu26-13803, 2026.

EGU26-15039 | ECS | Orals | AS3.39

Shedding light on the atmospheric photochemistry of pyruvic acid with theory and experiment 

Javier Carmona-García and Basile F. E. Curchod

Pyruvic acid (PA) is an atmospherically relevant organic compound that belongs to the family of keto acids, molecules that contain both a carbonyl and a carboxylic moiety and whose reactivity is suggested to contribute to the formation of secondary organic aerosols (SOAs) in the atmosphere [1]. The photochemistry of PA has received a great deal of attention due to it being its primary atmospheric sink, with stark differences observed when PA is in the gas phase or in an aqueous environment. In the gas phase, PA photochemistry is primarily driven by singlet states [2], although experimental evidence suggests that triplet states may still contribute to the formation of specific photoproducts [3]. Conversely, triplet pathways appear to dominate the photochemical reactivity of the molecule in aqueous phase [4], giving rise to different photoproducts. Despite the advances in the understanding of the photochemistry of PA, the underlying chemical mechanisms governing the photochemistry of the system remain unclear.

Recently, we have focused on studying the light-induced reactivity of PA using computational methods, in direct collaboration with experimental spectroscopists, to rationalise the phase-dependency of the photochemistry of this molecule. The computational approaches employed include static explorations of the ground and excited states potential energy surfaces of PA, which involve the determination of critical points and connected pathways between them, conformational analyses to establish the most relevant conformers of the molecule in gas and aqueous phases, and the obtention of absorption properties and vibrationally resolved photoelectron spectra.

In this contribution, we will discuss the main computational analyses carried out in a recent study in which we combined anion photoelectron spectroscopy and computational photochemistry to accurately determine the energy gap between the lowest singlet and triplet excited states of the molecule in the gas phase, a key quantity for understanding the photochemistry of the molecule that has remained elusive until now [5]. Furthermore, we will comment on the effect of aqueous solvation on the excited-state properties of the system. The results presented here will contribute to having a better understanding of why the light-induced reactivity of PA changes significantly from the gas phase to an aqueous environment and, ultimately, will help to assess the role and fate of this molecule in the atmosphere.

References:

[1] Rapf, R. J.; Perkins, R. J.; Carpenter, B. K.; Vaida, V. J. Phys. Chem. A 2017, 121 (22), 4272–4282.

[2] Hutton, L.; Curchod, B. F. E. ChemPhotoChem. 2022, 6 (11), e202200151.

[3] Sauer, L. J.; Davis, H. F. J. Phys. Chem. Lett. 2025, 16 (15), 3721– 3726.

[4] Griffith, E. C.; Carpenter, B. K.; Shoemaker, R. K.; Vaida, V. Proc. Natl. Acad. Sci. U. S. A. 2013, 110 (29), 11714– 11719.

[5] Burrow, E. M.; Carmona-García, J.; Clarke, C. J.; Curchod, B. F. E.; Verlet, J. R. R. J. Am. Chem. Soc. 2025, 147 (41), 36987-36991.

How to cite: Carmona-García, J. and Curchod, B. F. E.: Shedding light on the atmospheric photochemistry of pyruvic acid with theory and experiment, EGU General Assembly 2026, Vienna, Austria, 3–8 May 2026, EGU26-15039, https://doi.org/10.5194/egusphere-egu26-15039, 2026.

Coarse-graining is a powerful tool for bridging atomistic and mesoscopic scales in fluid particle systems. However, fixed coarse-grained (CG) mappings do not account for the fact that fluid particles do not form persistent groups. Here we propose an entropy-regularized fuzzy clustering approach with temporal smoothness constraints, and then examine in detail the role of the time-evolving fuzzy membership degrees throughout the coarse-graining process. Entropy regularization controls the level of membership fuzziness, while the temporal smoothness constraints enhance the continuity of cluster trajectories. Within a bottom-up force-matching framework, the interactions between clusters are decomposed into a particle-interaction term (the weighted sum of particle-particle interactions) and a membership-evolution term (arising from the temporal variation of membership degrees). Analyses based on a Lennard–Jones (L-J) fluid particle system show that an intermediate fuzziness best preserves local structural properties, and that the membership-evolution term provides a repulsive contribution. Moreover, CG dynamics simulations demonstrate that including the membership-evolution term effectively restores the system pressure, which can be interpreted as a pressure-correction mechanism. This finding provides a physical perspective on how microscopic interactions transform into mesoscopic effective interactions between fluid particles, which could be beneficial for modelling atmospheric dynamical processes.

How to cite: Han, J.: Bottom-up Coarse-Graining of Fluid Particles via Time-Evolving Fuzzy Clustering: A Pressure-Correction from Membership Evolution, EGU General Assembly 2026, Vienna, Austria, 3–8 May 2026, EGU26-16326, https://doi.org/10.5194/egusphere-egu26-16326, 2026.

EGU26-17024 | Posters on site | AS3.39

 Adsorption-Driven Cloud Droplet Activation of Fresh and Aged Polypropylene Particles 

Mária Lbadaoui-Darvas and Athanasios Nenes

Micro- and nanoplastics (MNPs) have been detected in atmospheric deposition and cloud samples, suggesting that they may act as cloud condensation nuclei (CCN) and/or ice-nucleating particles (INPs), which is likely the main pathway through which atmospheric microplastics impact climate. Laboratory studies report immersion freezing temperatures for various microplastics between −15.1 °C (Ganguly 2019) and −23.2 °C (Seifried 2024), comparable to those of mineral dust, the dominant global source of atmospheric INPs. Immersion freezing IN activity also requires CCN activity as immersion freezing occurs in existing cloud droplets. Atmospheric aging may further enhance the CCN or IN activity of MNPs, consistent with laboratory evidence and observations showing that microplastics in cloud samples are predominantly aged, as indicated by increased hydroxyl functionalization identified by FTIR analysis (Wang 2023). 

Despite growing evidence for their potential role in cloud microphysics, no parameterization currently exists to represent the CCN or IN activity of microplastics in cloud models, largely due to limited understanding of the underlying activation mechanisms. Here, we use hybrid Grand Canonical Monte Carlo–molecular dynamics simulations to investigate cloud droplet growth and activation on fresh and atmospherically aged crystalline polypropylene (PP) surfaces. Our results show that aged PP activates as CCN via an adsorption-driven mechanism, whereas fresh, non-oxidized PP does not activate under the simulated conditions. Activation on aged surfaces proceeds through (1) dropletwise adsorption of water nanoclusters at active sites, (2) cluster growth, and (3) coalescence into a continuous multilayer of water. Model calculations based on adsorption nucleation theory (Laaksonen 2015) indicate that activation occurs at slightly higher critical supersaturations than for mineral dust, while the critical radius is smaller than for illite, Saharan dust, or Arizona Test Dust. These findings provide mechanistic insight into CCN activation on aged microplastics and the model calculation provides a first approach to develop parameterizations of microplastics for cloud microphysics schemes.


Ganguly, M.; Ariya, P.A.  ACS Earth and Space Chemistry 2019, 3, 1729–1739.

Seifried, T.M.; Nikkho, S.; Morales Murillo, A.; Andrew, L.J.; Grant, E.R.; Bertram, A.K. Environmental Science & Technology 2024, 58, 15711–15721.

Wang, Y.; Okochi, H.; Tani, Y.; Hayami, H.; Minami, Y.; Katsumi, N.; Takeuchi, M.; Sorimachi, A.; Fujii, Y.; Kajino, M.; et al. Environmental Chemistry Letters 2023, pp. 1–8.

Laaksonen, A. The Journal of Physical Chemistry A 2015, 119, 3736–374.

How to cite: Lbadaoui-Darvas, M. and Nenes, A.:  Adsorption-Driven Cloud Droplet Activation of Fresh and Aged Polypropylene Particles, EGU General Assembly 2026, Vienna, Austria, 3–8 May 2026, EGU26-17024, https://doi.org/10.5194/egusphere-egu26-17024, 2026.

EGU26-18505 | ECS | Posters on site | AS3.39

Using New Generation Neural Network Potentials to Benchmark Ice-Water Equilibria 

Rasmus Nilsson, Golnaz Roudsari, Mária Lbadaoui-Darvas, Bernhard Reischl, and Stephen Ingram

Ice and mixed phase clouds in the earth's atmosphere form predominantly through heterogeneous nucleation on seed particles, such as mineral dust and organics. Determining the atomistic ice-nucleation mechanism on these particles is challenging for experiments and simulations. When simulating ice nucleation using Molecular Dynamics (MD), one typically relies on classical empirical potentials (force fields) to describe interactions between atoms in the particle surface and water. However, due to the large number of different materials ice-nucleating particles can consist of, accurate classical empiric potentials are not available for all systems, leading to heavy computational costs for creating and testing new ones.  

In recent years, foundation neural network potentials (NNPs), trained on large sets of quantum chemical data, aim to enable simulations of any system, thus circumventing the issue of creating new potentials. These NNPs would ideally combine accuracies of Density Functional Theory (DFT) with simulation speeds of classical MD. To determine the viability of using foundation models in MD simulations of heterogenous ice nucleation, we have benchmarked the ice-water equilibria of four NNPs: SO3LR (Kabylda et al. 2025), Orb v3 (Rhodes et al. 2025), Fennix-Bio1 (Plé et al. 2025) and ANI-2x (Devereux et al. 2020). We determined their melting points and, where not available in the literature, the water density isobars they exhibit in the temperature range 250-300 K. We have used the coexistence method: A system initially containing hexagonal ice and liquid water is simulated in the NPT ensemble, and the melting point is determined as the temperature at which the number of ice-like water molecules (counted using the classification algorithm LICH-TEST) does not change over time.  

The SO3LR potential was the only one of the four displaying a melting point close to 273 K. Fennix-Bio1 underestimated the melting point by 20 K, while both Orb v3 and ANI-2x overestimated it by over 75 K. By comparing variants of the latter two models, we can infer that inclusion of dispersion interactions during either training or inference improves the water density isobar, which in turn leads to a more accurate melting point. In addition, we find that while the NNPs are in theory reactive models, no Grotthus-like proton transfers were observed in the simulations.  

Kabylda et al.: Molecular Simulations with a Pretrained Neural Network and Universal Pairwise Force Fields, ChemRxiv, 2025. 

Rhodes et al.: Orb-v3: atomistic simulation at scale, https://arxiv.org/abs/2504.06231, 2025.

Plé et al.: A Foundation Model for Accurate Atomistic Simulations in Drug Design, ChemRxiv, 2025. 

Devereux et al.: Extending the Applicability of the ANI Deep Learning Molecular Potential to Sulfur and Halogens, Journal of Chemical Theory and Computation, 16, 4192–4202, 2020. 

How to cite: Nilsson, R., Roudsari, G., Lbadaoui-Darvas, M., Reischl, B., and Ingram, S.: Using New Generation Neural Network Potentials to Benchmark Ice-Water Equilibria, EGU General Assembly 2026, Vienna, Austria, 3–8 May 2026, EGU26-18505, https://doi.org/10.5194/egusphere-egu26-18505, 2026.

EGU26-18933 | Posters on site | AS3.39

 Nanoscopic insights on ice nucleation on feldspar microcline and sanidine  

Bernhard Reischl, Florian Schneider, Rasmus Nilsson, Ralf Bechstein, Thomas Koop, Angelika Kühnle, and Tobias Dickbreder

Ice and mixed-phase clouds can form at moderate supercooling on seed particles through heterogeneous ice nucleation. Feldspar particles constitute a significant fraction of mineral dust in the atmopshere and have been identified as good ice nucleating particles. However, they can exhibit different chemical composition and crystal structure, which affects their ice nucleation activity [1], and the details of the ice nucleation mechanism(s) remain unknown.

Here, we present atomic force microscopy images of ice crystals growing from the vapor phase at low temperature on the (001) surfaces of two types of feldspar crystals: the highly ordered microcline, and the disordered sanidine. In contrast to the prevailing view of active sites such as step edges or cracks being responsible for ice nucleation on feldspar [2], we observe ice growth at random positions on the bare terrace of feldspar microcline (001). For the closely related feldspar sanidine, ice nucleation is only observed at step edges, as previously reported.

Our observations underscore the exceptional ice nucleating ability of microcline as it demonstrates ice nucleation even in the absence of surface defects and raise important questions regarding the different ice nucleation mechanisms on these two feldspar mineral surfaces, which are investigated using atomistic simulations.

[1] Harrison, A. D., et al., Atmos. Chem. Phys., 16, 10927-10940, 2016.
[2] Kiselev, A., et al., Science, 355, 367-371, 2017.

How to cite: Reischl, B., Schneider, F., Nilsson, R., Bechstein, R., Koop, T., Kühnle, A., and Dickbreder, T.:  Nanoscopic insights on ice nucleation on feldspar microcline and sanidine , EGU General Assembly 2026, Vienna, Austria, 3–8 May 2026, EGU26-18933, https://doi.org/10.5194/egusphere-egu26-18933, 2026.

EGU26-20055 | Posters on site | AS3.39

Nocturnal Radical Chemistry of (E)-β-Farnesene in the Atmosphere 

Iustinian Bejan, Claudiu Roman, Niall O'Sullivan, Laurentiu Movila, Amir Ben Brink, Mixtli Campos Pineda, Emma Galloway, Andy Ruth, and John Wenger

Plants that are prone to environmental oxidative and thermal stress exhibit high emission rates of biogenic volatile organic compounds. In this context sesquiterpenes have received an increased interest during the past decade, however, the organic compounds formed from their atmospheric degradation have not been thoroughly investigated, and their contribution to secondary organic aerosol (SOA) remains poorly characterized. Moreover, the nocturnal chemistry of sesquiterpenes has received virtually no attention.

The farnesenes are acyclic sesquiterpenes emitted by plants and agricultural crops and have applications in the biofuel, pharmaceutical, and food industry, and more recently in biotechnology (Sandoval et al., 2014). The (E)-β-farnesene has been studied in reactions with OH radicals and ozone (Kourtchev et al., 2009; 2012) however, the gas-phase chemistry of nitrate radical (NO3) initiated oxidation of (E)-β-farnesene has not yet been investigated. In particular, the study of nighttime SOA formation from (E)-β-farnesene oxidation is important, because nocturnal chemistry generates preconditions to daytime ozone formation and secondary organic aerosol growth.

Investigations on the gas-phase kinetic and atmospheric chemical degradation of (E)-β-farnesene with NO3 were performed in the 27 m3 Irish Atmospheric Simulation Chamber IASC (Cork, Ireland) at 295±2 K and 1000±3 mbar of atmospheric pressure. Positive-benzene and negative-iodide mode Chemical Ionization Mass Spectrometry (CIMS) analysis was used to evaluate the chemical composition of the gas mixture. SOA were sampled on PTFE filters (1 µm, 25 mm) and subsequently analyzed via the FIGAERO N2-thermo-desorption inlet connected to the CIMS instrument. A Scanning Mobility Particle Sizer (SMPS) was employed to measure particle number, size distributions and formation yields.

The reactivity of (E)-β-farnesene toward NO3 radicals was investigated by a relative rate method with 2-methoxyphenol and 2,5-dimethylfuran as reference compounds. (E)-β-farnesene was found to have a short atmospheric lifetime due to its fast reactions with NO₃ radicals, which efficiently remove it from the atmosphere under nighttime conditions.

The formation of gas-phase organic nitrates and peroxynitrates and highly oxygenated products were identified during the NO3-initiated oxidation of (E)-β-farnesene. The aerosol composition was also investigated in this study. Compounds observed in both gas and particle phases provide a direct link between gas-phase chemistry and aerosol composition since their volatility decreases through functionalization or accretion reactions. Atmospheric chemical mechanisms for the formation of these oxidation products, both in the gas and particle phase, will complement daytime OH and ozone (E)-β-farnesene oxidation. The degradation of (E)-β-farnesene on the reaction pathways will also be discussed. 

Acknowledgement: This research is part of a Transnational access project that is supported by the European Commission under the Horizon 2020 – Research and Innovation Framework Programme, H2020-INFRAIA-2020-1, ATMO-ACCESS Grant Agreement number: 101008004. Funding is also provided by Taighde Éireann - Research Ireland (Grant numbers 21/FFP-A/8973 and GOIPD/2025/1260).

References:

Kourtchev, I., Bejan, I., Sodeau, J. R., & Wenger, J. C. (2009) Atmos. Environ., 43, 3182–3190.

Kourtchev, I., Bejan, I., Sodeau, J. R., & Wenger, J. C. (2012) Atmos. Environ. 46, 338–345.

Sandoval, C. M., Ayson, M., Moss, N., Lieu, B., Jackson, P., Gaucher, S. P., Horning, T., Dahl, R. H., Denery, 

How to cite: Bejan, I., Roman, C., O'Sullivan, N., Movila, L., Ben Brink, A., Campos Pineda, M., Galloway, E., Ruth, A., and Wenger, J.: Nocturnal Radical Chemistry of (E)-β-Farnesene in the Atmosphere, EGU General Assembly 2026, Vienna, Austria, 3–8 May 2026, EGU26-20055, https://doi.org/10.5194/egusphere-egu26-20055, 2026.

EGU26-20162 | ECS | Posters on site | AS3.39

Source-driven variability of particulate matter oxidative potential at urban and rural coastal sites in the northwestern Mediterranean 

Mingchen Wei, Carolina Molina, Kalliopi Violaki, Edouard Bard, Philippe Kerhervé, Maxime Bridoux, Christos Panagiotopoulos, and Athanasios Nenes

Health effects associated with particulate matter (PM) exposure are closely linked to the ability of particles to induce the formation of reactive oxygen species (ROS) and trigger oxidative stress. Accordingly, the oxidative potential (OP) of PM is considered a more health-relevant toxicity metric than mass concentration alone. However, in densely populated and ecologically sensitive areas in the northwestern Mediterranean, the main sources contributing to OP remain poorly constrained, particularly regarding differences between urban and rural environments.

This sutdy systematically evaluated the OP of total suspended particulate matter (TSP) at an urban coastal site (Endoume) and a rural coastal site (Banyuls) in the region. OP was quantified using the dithiothreitol (DTT) assay and evaluated the contributions of primary emission sources and secondary formation to OP. Chemical tracers, dual carbon isotopes (¹³C & ¹⁴C), and positive matrix factorization (PMF) were used to apportion the main local sources.

The results reveal pronounced differences in both magnitude and source contribution to OP between urban and rural coastal aerosols. The annual mean organic-carbon-normalized DTT activity (DTTm) at Endoume was 20.0 ± 9.1 pmol min⁻¹ μg⁻¹ and 17.0 ± 5.3 pmol min⁻¹ μg⁻¹ at Banyuls (Mann–Whitney U test, p = 0.06). The annual mean volume-normalized OP (DTTv) was comparable at both sites (≈ 0.04 ± 0.02 pmol min⁻¹ m⁻³, Mann–Whitney U test, p < 0.05).

At Endoume, DTTv showed strong positive correlations with traffic- and fossil-fuel-combustion-related (FF) tracer metals (Pb, Cu, Zn) and elemental carbon (ρ ≈ 0.60–0.66, p < 0.01), together with pronounced seasonal variability. In spring, OP was primarily controlled by traffic and industrial emission (ρ > 0.75); in summer, ship emission emerged as the dominant driver (V–DTTv: ρ > 0.9, p < 0.01); while in autumn and winter, the contribution from biomass burning (BB) increased substantially (DTTv–nssK⁺: ρ = 0.74, p < 0.01). In contrast, the OP at Banyuls was dominated by traffic emission in spring (Zn–DTTv: ρ > 0.7, p < 0.01), whereas BB and ship emission jointly influenced OP in summer (V–Ni: ρ ≈ 0.7, p < 0.01). Additionally, dust and sea salt contributed significantly to OP at both sites, with a more pronounced influence at Banyuls (nss-Ca²⁺–DTTv: ρ ≈ 0.85, p < 0.01). Carbon isotope analysis showed that autumn samples at both sites exhibited lower OCNF and DTTv values, indicating that the influence of FF on OP may be more pronounced.

PMF results further show that at Banyuls, traffic emission and BB together accounted for approximately 25% of OPv, with natural dust contributing about 14%, whereas at Endoume, industrial emissions (25%), BB (20%), and traffic emission (19%) were the major contributors to OPv. For OPm, industrial emission dominated at Endoume, while natural sources such as sea salt and dust were the primary contributors at Banyuls; secondary formation processes contributed substantially to OPm at both sites. Overall, this study demonstrates strong spatial and seasonal source dependence of PM oxidative toxicity in the northwestern Mediterranean coastal region, providing important constraints for health-oriented air pollution assessments.

How to cite: Wei, M., Molina, C., Violaki, K., Bard, E., Kerhervé, P., Bridoux, M., Panagiotopoulos, C., and Nenes, A.: Source-driven variability of particulate matter oxidative potential at urban and rural coastal sites in the northwestern Mediterranean, EGU General Assembly 2026, Vienna, Austria, 3–8 May 2026, EGU26-20162, https://doi.org/10.5194/egusphere-egu26-20162, 2026.

EGU26-20621 | Orals | AS3.39

Fast formation of aerosol precursors in polycyclic aromatic hydrocarbon oxidation: Evidence for ozone-assisted chemistry 

Avinash Kumar, Mojtaba Bezaatpour, Aliisa Ojala, Prasenjit Seal, Shawon Barua, Petteri Marjanen, Olga Garmash, Topi Rönkkö, Siddharth Iyer, and Matti Rissanen

The formation of highly oxygenated organic molecules (HOM) during the OH-initiated oxidation of naphthalene remains poorly understood, despite experimental evidence for efficient aerosol precursor formation (Molteni et al., 2018; Garmash et al., 2020). As the simplest polycyclic aromatic hydrocarbon (PAH) and a major anthropogenic volatile organic compound in urban atmospheres, naphthalene is ubiquitous and readily oxidized under ambient conditions. However, current molecular-level descriptions of its oxidation predict autoxidation rates that are too slow to explain the observed HOM abundances, indicating missing or overlooked chemical pathways (Zhang et al., 2012; Shiroudi et al., 2015; Lannuque et al., 2024).

Ozone is one of the most abundant atmospheric oxidants, yet it is generally assumed to play a negligible role in the gas-phase oxidation of PAHs and their contribution to secondary organic aerosol (SOA) formation. Here, we show that this assumption does not hold for naphthalene oxidation, and that ozone can strongly influence the early stages of its autoxidation chemistry.

We investigated the hydroxyl radical (OH)–initiated oxidation of naphthalene using a flow reactor coupled to a nitrate-based chemical ionization mass spectrometer (NO₃⁻-CIMS), with reaction times ranging from 0.7 to 1.8 s. The presence of ozone led to a pronounced enhancement in product signal intensities, particularly for monomeric species (C₁₀H₉O5-10). At the shortest reaction time (0.7 s), a distinct suite of oxygenated monomers was observed only in the presence of ozone, indicating rapid ozone-assisted chemistry. Experiments using isotopically labelled ozone (¹⁸O₃) demonstrate that ozone directly influences the early stages of OH-initiated naphthalene oxidation. High-level quantum chemical calculations support mechanistic pathways in which ozone alters the fate of key radical intermediates, enabling efficient HOM formation. Moreover, the experiments on OH initiated oxidation of 1-naphthol, 2-naphthol, biphenyl, and anthracene show that this behavior is strongly structure-dependent, highlighting the broader relevance of ozone-assisted chemistry for PAHs.

Finally, global modeling indicates that ozone-driven pathways can increase anthropogenic SOA formation from naphthalene by up to 7% on a global scale. Together, these results reveal an unrecognized role of ozone in PAH oxidation and provide a mechanistic framework that helps to resolve the discrepancies between laboratory observations and current molecular-level understanding of PAH derived SOA formation.


References:

Molteni, U. et al (2018) Atmos. Chem. Phys. 18, 1909-1921.

Garmash, O. et al (2020) Atmos. Chem. Phys. 20, 515-537.

Zhang, Z. et al (2012) Phys. Chem. Chem. Phys. 14, 2645 - 2650.

Shiroudi, A. et al (2015) Phys. Chem. Chem. Phys. 17, 13719-13732.

Lannuque, A. et al (2024) Atmos. Chem. Phys. 24, 8589–8606.


How to cite: Kumar, A., Bezaatpour, M., Ojala, A., Seal, P., Barua, S., Marjanen, P., Garmash, O., Rönkkö, T., Iyer, S., and Rissanen, M.: Fast formation of aerosol precursors in polycyclic aromatic hydrocarbon oxidation: Evidence for ozone-assisted chemistry, EGU General Assembly 2026, Vienna, Austria, 3–8 May 2026, EGU26-20621, https://doi.org/10.5194/egusphere-egu26-20621, 2026.

Recent advances in machine learning interatomic potentials have enabled the simulation of cluster formation from precursor vapor at a high level of theory. However, performing these simulations requires verifying that the models accurately describe cluster formation dynamics, particularly collision processes. In this work, we study the performance of two distinct machine learning (ML) architectures, AIMNet2 and PaiNN, against GFN1-xTB and ωB97X-3c reference data for atmospherically relevant collision systems (H2SO4–H2SO4, H2SO4–HSO4-, and H2SO4–NH(CH3)2).

We evaluate the models' ability to reproduce one-dimensional potentials of mean force (PMFs) and collision probabilities. Both models achieve excellent agreement with reference PMFs, yielding RMSEs at least an order of magnitude lower than chemical accuracy (1 kcal mol-1). Notably, PaiNN achieves lower errors in the binding region.

However, we observe significant differences in collision probabilities. While AIMNet2 accurately reproduces these probabilities, PaiNN fails to capture long-range interactions beyond its local cutoff (10 Å). For the charged H2SO4–HSO4- system, this leads to a complete loss of collision probability beyond 14 Å and an underestimation at shorter distances.

Our results demonstrate a clear trade-off: while PaiNN offers superior accuracy for equilibrium properties and binding energies, its local nature makes it unsuitable for collision kinetics in systems with strong long-range interactions. Conversely, AIMNet2's ability to model these long-range interactions makes it the necessary choice for simulating collisions in such systems.

How to cite: Neefjes, I., Kubecka, J., and Elm, J.: Machine learning interatomic potentials with accurate long-range interactions for molecular dynamics collision simulations of atmospherically-relevant molecules, EGU General Assembly 2026, Vienna, Austria, 3–8 May 2026, EGU26-21549, https://doi.org/10.5194/egusphere-egu26-21549, 2026.

EGU26-22171 | Orals | AS3.39

Atmospheric HO2/RO2 Ratios Weaken NOₓ Suppression of α-Pinene SOA 

Veronica Geretti, Yarê Baker, Thomas Bannan, Aristeidis Voliotis, Quanfu He, Thorsten Hohaus, Sungah Kang, Michael Priestley, Epaminondas Tsiligiannis, Hui Wang, Rongrong Wu, Annika Zanders, Sören R. Zorn, Gordon McFiggans, Cheng Wu, Thomas F. Mentel, and Mattias Hallquist

Secondary organic aerosol (SOA) form from the atmospheric oxidation of volatile organic compounds (VOC), and impacts both climate and human health. Chamber studies typically show significant decrease of SOA by nitrogen oxides (NOx), yet these experiments often neglect atmospherically relevant hydroperoxy radical (HO₂) levels. Here we investigate α-pinene photooxidation under low and high hydroperoxy-to-organic peroxy radical (RO₂) ratios with added NOx. While NOx reduces aerosol formation under both conditions, suppression is substantially weaker under high HO₂ conditions (33–55%) than under low HO₂ conditions (60–70%). Under high HO₂ conditions, enhanced formation of low-volatility monomers offsets enhanced fragmentation, yielding a more condensable product mixture despite higher bulk volatility. These results demonstrate that laboratory studies conducted under low under high HO₂ conditions likely underestimate secondary organic aerosol formation in NOx-influenced atmospheres.

How to cite: Geretti, V., Baker, Y., Bannan, T., Voliotis, A., He, Q., Hohaus, T., Kang, S., Priestley, M., Tsiligiannis, E., Wang, H., Wu, R., Zanders, A., Zorn, S. R., McFiggans, G., Wu, C., Mentel, T. F., and Hallquist, M.: Atmospheric HO2/RO2 Ratios Weaken NOₓ Suppression of α-Pinene SOA, EGU General Assembly 2026, Vienna, Austria, 3–8 May 2026, EGU26-22171, https://doi.org/10.5194/egusphere-egu26-22171, 2026.

EGU26-520 | ECS | Posters on site | AS3.40

Enviro-HIRLAM model simulations of aerosol–cloud interactions during two cases of heavy rain in Italy and Ukraine 

Daria Hrama, Larysa Pysarenko, Liudmyla Nadtochii, Maryna Rudas, Mykhailo Savenets, Alexander Mahura, and Tuukka Petäjä

Heavy rain episodes in the midlatitudes turn often into hazardous natural disasters, causing flooding events, infrastructure damage, and environmental repercussions. While the synoptic processes responsible for heavy rain are usually well understood, the aerosol–meteorology feedbacks sometimes remain uncertain despite their tremendous role in such episodes. The modeling study is conducted to identify key aerosol–cloud interactions during two heavy rain episodes that occurred in Europe in 2023: one over the Italy region in May 2023 and another over the Black Sea – Ukraine region in November 2023. The simulations were performed employing the Environment – HIgh-Resolution Limited Area Model (Enviro-HIRLAM) run at 15, 5 and 2 km horizontal resolutions for two model configurations: a reference run without aerosol effects (REF) and a run including indirect aerosol effects (IDAE).

Simulations with the IDAE configuration showed a significant increase in specific cloud ice and liquid water, a higher fraction of low-tropospheric cloud cover (but a reduction above 5 km), and an overall increase in total cloud condensate. Despite these changes, accumulated precipitation generally decreased by up to 3–4 mm per 6 h intervals when the aerosol effects were included. At finer spatial resolutions, localized areas with enhanced precipitation were identified, although the patterns differed regionally. In particular, in Italy, higher precipitation occurred mainly over marine areas, while in Ukraine it appeared predominantly over the land surface compared with the Black Sea aquatoria. Spatial correlation analysis between the aerosol fields and the differences between REF and IDAE configurations indicated that the dominant drivers of increased cloud water, ice content, and low-level cloud cover are soluble sulfate and sea-salt particles in the accumulation and coarse modes. Their influence was most pronounced within the 2–4 km layer. Less strong, although still significant, positive correlations were identified between the cloud cover and water/ice content and the presence of soluble coarse-mode dust, black carbon, and organic carbon. At finer resolution, these correlations weaken substantially, although the relationships for sulfate and sea-salt particles in the accumulation and coarse modes remained detectable. At the same time, no direct relationship was detected between aerosol fields and total precipitation, nor with the general decrease in rainfall in the IDAE relative to REF run. This suggests that complex atmospheric feedbacks govern precipitation formation, and that increased cloud water content does not necessarily translate into increased surface rainfall.

This study was conducted within the Horizon Europe programme under Grant Agreement No 101137680 CERTAINTY project (Cloud-aERosol inTeractions & their impActs IN The earth sYstem). The required infrastructure, computing and storage resources, and technical support were provided by the CSC – IT Center for Science (Finland) under PEEX Modelling Platform research and development through CSC HPC research projects (PEEX-MP-at-CSC). Initial and boundary conditions for meteorology, chemistry, aerosols, observations for data assimilation, other input required for the Enviro-HIRLAM simulations were provided by the European Centre for Medium-range weather Forecasting (ECMWF).

How to cite: Hrama, D., Pysarenko, L., Nadtochii, L., Rudas, M., Savenets, M., Mahura, A., and Petäjä, T.: Enviro-HIRLAM model simulations of aerosol–cloud interactions during two cases of heavy rain in Italy and Ukraine, EGU General Assembly 2026, Vienna, Austria, 3–8 May 2026, EGU26-520, https://doi.org/10.5194/egusphere-egu26-520, 2026.

EGU26-1880 | Orals | AS3.40

The NSF NCAR Next-Generation Online-Coupled Air Quality and Weather Analysis and Forecasting System (MPAS-GOCART2G-JEDI) 

Soyoung Ha, Rajesh Kumar, Mary Barth, Gabriele Pfister, Shih-Wei Wei, Jun Park, Michael Duda, Cheng Dang, Forrest Lacey, Cheng-Hsuan Lu, and Maryam Abdi-Oskouei

Accurate aerosol prediction remains challenging due to uncertainties in atmospheric composition arising from imperfect initial conditions, errors in emission inventories, and our limited understanding of aerosol processes and properties interacting with atmospheric variables. Due to their short lifetime and strong spatial/temporal variability, global observations of aerosols and clouds rely heavily on satellite remote sensing. 

The U.S. National Science Foundation (NSF) National Center for Atmospheric Research (NCAR) has recently developed the atmospheric Model for Prediction Across Scales (MPAS-A; Skamarock et al. 2012) coupled with the next-generation Goddard Chemistry Aerosol Radiation and Transport model (GOCART-2G; Collow et al. 2024) and interfaced with the Joint Effort for Data Assimilation Integration (JEDI) system. This integrated framework enables online-coupled data assimilation of multi-sensor, hyperspectral satellite aerosol retrievals and all-sky radiances across a wide spectral range within a unified atmosphere-aerosol analysis and forecasting system. 

This talk introduces the new MPAS-GOCART2G-JEDI system, with an emphasis on the assimilation of NASA Plankton, Aerosol, Cloud, ocean Ecosystem (PACE) Aerosol Optical Depth (AOD) retrievals and their systematic evaluation against legacy AOD products such as MODIS, VIIRS, and AERONET.

How to cite: Ha, S., Kumar, R., Barth, M., Pfister, G., Wei, S.-W., Park, J., Duda, M., Dang, C., Lacey, F., Lu, C.-H., and Abdi-Oskouei, M.: The NSF NCAR Next-Generation Online-Coupled Air Quality and Weather Analysis and Forecasting System (MPAS-GOCART2G-JEDI), EGU General Assembly 2026, Vienna, Austria, 3–8 May 2026, EGU26-1880, https://doi.org/10.5194/egusphere-egu26-1880, 2026.

EGU26-1984 | ECS | Orals | AS3.40

Mainz Convective Transport and Scavenging: A new parameterization of convection-chemistry-interaction in global chemistry-circulation models 

Adrienne Jeske, J. Moritz Menken, Gustavo C. Cuchiara, Hendrik Ranocha, Mary C. Barth, and Holger Tost

Convective systems redistribute atmospheric trace gases due to the inherent high vertical wind velocities. Furthermore, the different convective cloud hydrometeors interact with soluble tracers, partially removing them from the atmosphere via precipitation. These processes have an impact on air quality, acid rain, and upper tropospheric composition and photochemistry via the outflow from the storms. Convection also affects the aerosol particle composition due to cloud processing and potentially enables the new particle formation in the upper troposphere, representing a feedback mechanism on the meteorology. Therefore, it is crucial to accurately represent convective transport and scavenging in models aiming to predict the chemical composition.

As current convection parameterising models struggle with this task, we developed a new parameterisation, Mainz Convective Transport and Scavenging (MCTS). MCTS calculates convective transport and scavenging quasi-simultaneously in one column. It considers tracer redistribution due to the high vertical wind velocity, uptake by droplets, and aqueous-phase chemistry. Retention and uptake by ice crystals are included as well.

To evaluate the novel scheme, a case study was performed for a convective situation observed during the NASA SEAC4RS campaign in the US in 2013. MCTS is compared to DC8 flight observations and to cloud-resolving WRF-Chem simulations performed by Cuchiara et al. (2020). MCTS performs reasonably and sufficiently reproduces the HCHO mixing ratios measured during the convective core intercept flights.

MCTS opens the path for a more consistent and accurate representation of convection composition interactions in large-scale models. Ensuring that the consequences of these interactions, i.e., new particle formation in the upper troposphere, radiative feedback, and air quality can be addressed with enhanced accuracy.

Reference

Cuchiara, G. C., Fried, A., Barth, M. C., Bela, M., Homeyer, C. R., Gaubert, B., et al. (2020). Vertical transport, entrainment, and scavenging processes affecting trace gases in a modeled and observed SEAC4RS case study. Journal of Geophysical Research: Atmospheres, 125, e2019JD031957. https://doi.org/10.1029/2019JD031957

How to cite: Jeske, A., Menken, J. M., Cuchiara, G. C., Ranocha, H., Barth, M. C., and Tost, H.: Mainz Convective Transport and Scavenging: A new parameterization of convection-chemistry-interaction in global chemistry-circulation models, EGU General Assembly 2026, Vienna, Austria, 3–8 May 2026, EGU26-1984, https://doi.org/10.5194/egusphere-egu26-1984, 2026.

EGU26-4169 | Orals | AS3.40

An Improved Representation of Organic Aerosol Composition in the ECMWF IFS-COMPO 

Stelios Myriokefalitakis, Samuel Rémy, Vincent Huijnen, Orfeas Karathanasopoulos, Alexandra P. Tsimpidi, and Vlassis A. Karydis

Organic compounds constitute roughly half of the submicron aerosol mass in the troposphere, highlighting the need for accurate representation of organic aerosol (OA) in atmospheric composition (AC) modeling systems to improve aerosol forecasting. The secondary fraction of OA (SOA), formed through the oxidation of various volatile organic compounds (VOCs) from both natural and anthropogenic sources, complicates OA simulation. However, most global AC models either assume a nonvolatile SOA produced with a constant yield from known precursors or provide a simplistic parameterization of its volatility, treating the primary fraction of OA (POA) as nonreactive. This approach often fails to accurately reproduce observed OA atmospheric measurements. Additionally, primary biological aerosol particles are commonly identified as part of the supermicron OA mass, although most global AC models inadequately represent them.

In the context of the Copernicus Atmosphere Monitoring Service, we focus on improving the OA representation in the CAMS global forecasting system (IFS-COMPO). We here present simulations of the partitioning and chemical evolution of POA vapors, including their changes in volatility, as well as the incorporation of coarse organic carbon emissions from major bioaerosol species. The formation of SOA from semi-volatile organic compounds (SVOCs) and intermediate-volatility organic compounds (IVOCs) has been integrated into the SOA formation schemes from biogenic and anthropogenic VOCs in IFS-COMPO using a lite version of the well-documented aerosol module ORACLE, which allows for relatively limited computing resources. Additionally, fungal spores and pollen grains have been included in IFS-COMPO through interactive emission schemes that depend on ecosystem types, the leaf area index (LAI), and meteorological parameters. Overall, our efforts aim to bridge the gap between model simulations and observations, thereby enhancing our understanding of the atmospheric organic carbon burden.

How to cite: Myriokefalitakis, S., Rémy, S., Huijnen, V., Karathanasopoulos, O., Tsimpidi, A. P., and Karydis, V. A.: An Improved Representation of Organic Aerosol Composition in the ECMWF IFS-COMPO, EGU General Assembly 2026, Vienna, Austria, 3–8 May 2026, EGU26-4169, https://doi.org/10.5194/egusphere-egu26-4169, 2026.

Ozone (O3) is a secondary pollutant in the atmosphere formed by photochemical reactions that endangers human health and ecosystems. Since the mid-1990s, Asian regions have experienced the fastest O3 increase rate of 2–8 ppb per decade at remote surface sites and in the lower free troposphere across the world. Therefore, a deeper understanding of the long-term changes and causes of tropospheric O3 concentrations is of significance in both the environment and climate policy making.

In this study, to quantify the impacts of future climate change on O3 pollution, near-surface O3 concentrations over Asia in 2020–2100 are projected using a machine learning (ML) method along with multi-source data. The ML model is trained with assimilated O3 data from a global atmospheric chemical transport model and real-time observations. The ML model is then used to predict future O3 with meteorological fields from CMIP6 multi-model simulations under various climate scenarios. The climate penalty on future O3 is robust over most regions of Asia. The near-surface O3 levels are projected to increase by 5 %–20 % over South China, Southeast Asia, and South India under the high-forcing scenarios in the last decade of 21st century, compared to the first decade of 2020–2100. We also find that the summertime O3 pollution over eastern China will expand from North China to South China and extend into the cold season in a warmer future.

Unlike the traditional “black box” ML models, we predict near‐surface O3 concentrations in China in 2030 and 2060 based on a process‐based interpretable ML method, integrated with physical and chemical processes of O3, natural emissions of O3 precursors, and other multi‐source data. The direct (via changing physical and chemical processes of O3) and indirect (via changing natural emissions of O3 precursors) impacts of future climate change on O3 concentrations are quantitatively analyzed. The results suggest that the climate‐driven O3 levels are projected to decrease by more than 0.4 ppb in 2060 over eastern China under a carbon neutral scenario relative to a high emission scenario. The physical and chemical processes under climate change play a more important role in regulating O3 concentrations than natural emissions in the future under the carbon neutral scenario.

How to cite: Li, H.: Projecting future climate change impacts on ozone pollution with machine learning, EGU General Assembly 2026, Vienna, Austria, 3–8 May 2026, EGU26-5011, https://doi.org/10.5194/egusphere-egu26-5011, 2026.

EGU26-5190 | Orals | AS3.40

Rapid-response simulation of the 2025 Hayli Gubbi eruption with an enhanced WRF-Chem v4.8 model 

Alexander Ukhov, Sateesh Masabathini, Marianthi Pateraki, Nikolaos Papagiannopoulos, Umberto Rizza, and Ibrahim Hoteit

Volcanic ash and SO2 clouds pose significant hazards to aviation, air quality, and downwind ecosystems, motivating rapid, physically consistent plume modeling. We present a new and improved volcanic capability in WRF-Chem v4.8 [1] that addresses key limitations of earlier implementations by (i) strengthening ash/SO2/sulfate mass conservation and diagnostics, (ii) correcting ash gravitational settling and refining removal pathways via added wet and dry deposition for ash and sulfate, (iii) improving SO2 oxidation to sulfate (gas-phase and in-cloud pathways), and (iv) enabling direct radiative effects of ash and sulfate for fully interactive aerosol–meteorology coupling. These developments are paired with an emission-preprocessing workflow that supports time- and height-varying volcanic source terms for rapid-response simulations.

We demonstrate the approach for the unusually explosive Hayli Gubbi eruption (Afar, Ethiopia) on 23 November 2025 by reconstructing emissions using backward-trajectory analysis and constraining the simulation with satellite and ground-based observations. The downwind plume was captured by an AERONET station in Oman, providing rare constraints on the ash size distribution, while TROPOMI retrievals constrain SO2 columns and plume properties. The enhanced WRF-Chem reproduces the observed plume timing and structure and yields best-fit total emissions of approximately 1.0 Mt of fine ash and 0.3 Mt of SO2. Ash is injected mainly at ~7-11 km with a brief pulse up to ~14 km, whereas SO2 is emitted higher (~8–16 km) and remains predominantly tropospheric during the first day, implying limited near-term climate impact for the inferred SO2 burden. Simulated deposition indicates measurable ash fallout to the southern Red Sea and Gulf of Aden within ~28 hours, consistent with satellite-observed chlorophyll anomalies suggestive of an early marine response. This workflow is readily transferable to other eruptions for near-real-time plume forecasting and impact assessment.

References:

[1] Ukhov, A., Stenchikov, G., Schnell, J., Ahmadov, R., Rizza, U., Grell, G., and Hoteit, I.: Enhancing volcanic eruption simulations with the WRF-Chem v4.8, Geosci. Model Dev., 18, 9805–9825, https://doi.org/10.5194/gmd-18-9805-2025, 2025.

How to cite: Ukhov, A., Masabathini, S., Pateraki, M., Papagiannopoulos, N., Rizza, U., and Hoteit, I.: Rapid-response simulation of the 2025 Hayli Gubbi eruption with an enhanced WRF-Chem v4.8 model, EGU General Assembly 2026, Vienna, Austria, 3–8 May 2026, EGU26-5190, https://doi.org/10.5194/egusphere-egu26-5190, 2026.

EGU26-5262 | Orals | AS3.40

Upper tropospheric composition during Iberian cut-off lows as seen by IAGOS and CAMS 

Hannah Clark, Bastien Sauvage, Yasmine Bennouna, Julie Patuel, Christoph Mahnke, and Susanne Rohs

For thirty years, the European Research Infrastructure  IAGOS has been equipping commercial aircraft with instruments to monitor the composition of the atmosphere on long-haul flights around the world.  The aircraft measure  a number of chemical species,  meteorological parameters and cloud particles at cruise altitude in the upper troposphere/lower stratosphere and during landing and take-off at many international airports.   The in-situ data on chemical composition of the atmosphere collected by IAGOS is used in the routine validation of the forecasts and analyses from the Copernicus Atmosphere Monitoring Service (CAMS).  This  evaluation by IAGOS now covers  the  CAMS global and regional forecasts for ozone, carbon monoxide, and nitrous oxides, and the CAMS global greenhouse gas forecasts for carbon dioxide and methane.  We describe recent cut-off lows that led to severe flooding over Spain in Autumn 2024, characterised by the dynamical fields in the ERA-5 meteorological re-analysis. IAGOS measurements of the trace gases, ozone, water vapour and carbon monoxide in the cut-off low allowed us to identify stratosphere to troposphere transport. We describe the differences between the CAMS forecasts and IAGOS observations of these trace gases during this event. In addition,  we use a new tool based on  FLEXPART using ERA-5 winds and METEOSAT third generation's (MTG)  lightning imager to determine the origin of elevated NOx observed at altitude. 

How to cite: Clark, H., Sauvage, B., Bennouna, Y., Patuel, J., Mahnke, C., and Rohs, S.: Upper tropospheric composition during Iberian cut-off lows as seen by IAGOS and CAMS, EGU General Assembly 2026, Vienna, Austria, 3–8 May 2026, EGU26-5262, https://doi.org/10.5194/egusphere-egu26-5262, 2026.

EGU26-11014 | Posters on site | AS3.40

Changes to the IFS-COMPO atmospheric composition mode in support to the CAMS update to cycle 51R1 

Samuel Remy, Vincent Huijnen, Simon Chabrillat, Daniele Minganti, Swen Metzger, Emmanuele Russo, and Johannes Flemming

The Integrated Forecasting System with atmospheric composition extension (IFS-COMPO) of ECMWF is core of the Copernicus Atmosphere Monitoring Service (CAMS) to provide global analyses and forecasts of atmospheric composition, including reactive gases, as well as aerosol and greenhouse gases. The IFS-COMPO system is composed of tropospheric and stratospheric aerosol and chemistry components which are deeply intertwined. The composition model is updated regularly, aligned with updates of ECMWF’s operational meteorological model. Here we report on updates planned for the operational version after next, referred to as CY51R1. This concerns revisions on a large range of topics, as developed over the recent years, and therefore impacting many aspects of chemistry and aerosol composition in troposphere and stratosphere. The main aspects of the proposed upgrade concern:

  • The representation of the life cycle desert dust, with the implementation of 6 size bins instead of three, and a new emission scheme that takes into better account high latitude dust sources,
  • An updated representation of aerosol dry deposition,
  • Optimized and online stratospheric photolysis, taking into the account the impact of clouds and aerosols,
  • Use of prognostic aerosol information in stratospheric heterogeneous chemistry instead of climatological information,
  • Update of Isoprene degradation chemistry and introduction of a tracer for ethyne and associated chemistry.

In this contribution we provide an overview of expected changes with emphasis on changes in composition modeling aspects and particulary the desert dust updates. We will present their expected impact on key atmospheric composition aspects, including air quality performance across major pollution regions across the world, aerosol optical depth, dust, and stratospheric composition products.

How to cite: Remy, S., Huijnen, V., Chabrillat, S., Minganti, D., Metzger, S., Russo, E., and Flemming, J.: Changes to the IFS-COMPO atmospheric composition mode in support to the CAMS update to cycle 51R1, EGU General Assembly 2026, Vienna, Austria, 3–8 May 2026, EGU26-11014, https://doi.org/10.5194/egusphere-egu26-11014, 2026.

EGU26-11188 | Orals | AS3.40

Evaluation of a 20-year simulation of nitrogen and sulfur deposition fluxes in IFS-COMPO 

Vincent Huijnen, Samuel Rémy, Jason Williams, Swen Metzger, and Johannes Flemming

Within the Copernicus Atmosphere Monitoring Service (CAMS), ECMWF operates the Integrated Forecasting System with atmospheric composition extension (IFS-COMPO) to provide global forecasts and reanalyses of aerosols and trace gases. In support of ongoing preparations for a new CAMS reanalysis, which will cover the years 2003-present, multi-decadal model simulations with a fixed IFS-COMPO model configuration have been produced for the same period. The model version for these evaluations is similar as planned for the next CAMS Reanalysis. Particularly, the CAMS-GLOB-ANT-M01 ‘Mosaic’ anthropogenic emissions are used. But different than planned for the new CAMS reanalysis we exclude composition data assimilation and perform the simulation on a comparatively coarse model resolution (~80 km).

In this contribution we evaluate the quality of sulfur, oxidized nitrogen and reduced nitrogen deposition fluxes in IFS-COMPO for the period 2003-2022, making use of E4C as described in Williams et al., GMD, 18, 9913–9943 (2025). We present evaluations against various observational networks, namely CASTNet (US), EMEP (Europe) and EANET (Eastern Asia). Also we compare our simulation results with those obtained for the existing CAMS Reanalysis that is based on an older model configuration.

We will show to what extent the simulated deposition fluxes follow the observed trends in the different parts of the world, thereby giving confidence particularly in the used sulfur and nitrogen emissions on a continental scale. Uncertainties due to modelling will be highlighted by assessing our simulation results with multi-model assessments as done, e.g., in HTAP.

How to cite: Huijnen, V., Rémy, S., Williams, J., Metzger, S., and Flemming, J.: Evaluation of a 20-year simulation of nitrogen and sulfur deposition fluxes in IFS-COMPO, EGU General Assembly 2026, Vienna, Austria, 3–8 May 2026, EGU26-11188, https://doi.org/10.5194/egusphere-egu26-11188, 2026.

EGU26-12282 | Orals | AS3.40

Evaluation of HAM-M7 within the ECMWF IFS and OpenIFS frameworks 

Tommi Bergman, Eemeli Holopainen, Lianghai Wu, Harri Kokkola, Anton Laakso, Hermanni Halonen, Kasper Juurikkala, Philippe Le Sager, Twan van Noije, Vincent Huijnen, Ramiro Checa-Garcia, Athanasios Tsikerdekis, Adrian Hill, Marcus Köhler, Samuel Rémy, and Swen Metzger

Aerosols are a ubiquitous part of the Earth’s climate system, where they influence radiative forcing, cloud microphysics, and air quality. Accurate modelling of their spatiotemporal evolution is needed for producing accurate simulations of climate and air quality impacts. Thus far, the aerosol description of ECMWF IFS-COMPO (Integrated Forecast System with atmospheric composition extension) has relied on a “bulk-bin” scheme (denoted IFS-AER) where only aerosol mass is simulated. However, a detailed representation of both mass and number concentrations of aerosols is required for a more accurate simulation of the climate effects and impact on air quality. For this work we show results from IFS-COMPO (Cy50r1) and OpenIFS (Cy48r1; portable and easy-to-use version of the IFS). Within these models we replaced the AER scheme with a modal aerosol scheme based on HAM-M7 (Hamburg Aerosol Model with M7 microphysics core) that is coupled to an aerosol composition module (E4C). We have used both models to simulate the global aerosol evolution and evaluate their performance against observational data.

The HAM-M7 module includes representations of aerosol processes such as new particle formation, emissions, sedimentation, deposition, and microphysical interactions across seven log-normal modes, including both mass and number concentrations as size-resolved properties for key aerosol species, including sulphate, black carbon, organic matter, sea salt, and dust supplemented with E4C compounds nitrate and ammonium. Furthermore, current implementation within OpenIFS Cy48r1 includes aerosol interactions with radiation and cloud microphysics. However, within IFS Cy50r1 only the coupling with radiation is included due to the expected strong influence of cloud activation on the forecast.

Models are run for one year (2018) with either CMIP (OpenIFS) or CAMS (IFS) emissions with one year of spinup. The simulated aerosol fields are compared with observed number and mass concentrations from the ACTRIS observational network as well as earlier simulations with the chemical transport model TM5. Furthermore, the simulated aerosol budgets and surface concentrations are compared with those provided by the aerosol models within the AeroCom project.

This work was supported by the European Union’s Horizon Europe projects CAMAERA - CAMS AERosol Advancement (number 101134927), CAMS2_35bis project and FOCI, Non-CO2 Forcers and Their Climate, Weather, Air Quality and Health Impacts (number 101056783).

How to cite: Bergman, T., Holopainen, E., Wu, L., Kokkola, H., Laakso, A., Halonen, H., Juurikkala, K., Le Sager, P., van Noije, T., Huijnen, V., Checa-Garcia, R., Tsikerdekis, A., Hill, A., Köhler, M., Rémy, S., and Metzger, S.: Evaluation of HAM-M7 within the ECMWF IFS and OpenIFS frameworks, EGU General Assembly 2026, Vienna, Austria, 3–8 May 2026, EGU26-12282, https://doi.org/10.5194/egusphere-egu26-12282, 2026.

EGU26-13979 | Posters on site | AS3.40

Extending the CAMS Carbon Monoxide Reanalysis after the Loss of MOPITT: An ML‑Based Approach 

Johannes Flemming, Paula Harder, and Antje Inness

Reanalyses of atmospheric composition (AC) combine atmospheric models with satellite retrievals to produce consistent, long‑term, gridded datasets that are widely used to assess trends and variability in atmospheric composition and air quality. However, changes in the availability of the assimilated observations can introduce artificial discontinuities, complicating the interpretation of long‑term trends. Bias correction and careful selection of the assimilated datasets are therefore essential to ensure temporal consistency.

The Copernicus Atmosphere Monitoring Service (CAMS) global AC reanalysis (EAC4) assimilates multiple retrievals of aerosol optical depth, ozone, and nitrogen dioxide, as well as total column carbon monoxide (TCCO) from the MOPITT instrument—the sole CO data source in the system. EAC4 spans 2003 to near‑present and has been extensively used for reporting AC anomalies and trends. The termination of MOPITT operations in January 2025 resulted in a substantial shift in CO fields in the subsequent EAC5 reanalysis, preventing its direct use for diagnosing TCCO anomalies in 2025.

To address this discontinuity, we developed a machine‑learning‑based method to emulate the MOPITT‑driven assimilation impact in EAC4. The ML model predicts monthly mean TCCO fields by learning the relationship between EAC4 and a corresponding control simulation without data assimilation. The control simulation uses the same meteorological fields and the same emissions as EAC4, including the CO wildfire emissions that dominate interannual variability.

We evaluate the agreement between EAC4 TCCO trends and annual anomalies and their ML‑based predictions. We also discuss alternative approaches for deriving TCCO anomalies for 2025, such as the use of the control simulation alone or the TCCO analysis from the operational CAMS forecasting system.

This work represents an initial step toward emulating AC data assimilation using machine learning, with the broader aim of improving the robustness of long‑term AC datasets in the presence of observational gaps.

How to cite: Flemming, J., Harder, P., and Inness, A.: Extending the CAMS Carbon Monoxide Reanalysis after the Loss of MOPITT: An ML‑Based Approach, EGU General Assembly 2026, Vienna, Austria, 3–8 May 2026, EGU26-13979, https://doi.org/10.5194/egusphere-egu26-13979, 2026.

Accurate real-time prediction of surface ozone at high spatial and temporal resolution is critical for air-quality management, exposure assessment, and public health protection. However, developing an operational hourly ozone prediction system at the national scale remains challenging due to the need for continuous data acquisition, integration of heterogeneous data sources, and computationally efficient modeling frameworks. This study presents a real-time, data-driven framework for high-resolution hourly ozone prediction across South Korea by constructing an automated, nationwide atmospheric database that integrates satellite, meteorological, and ground-based observations.

We establish an operational data pipeline that collects and processes near-real-time meteorological observations from the Korea Meteorological Administration’s Operational Data Assimilation and Model (ODAM), atmospheric information derived from the GK2A geostationary satellite, and surface ozone measurements from the AIRKOREA monitoring network. All data streams are ingested on an hourly basis and systematically harmonized through temporal synchronization and spatial alignment to generate high-resolution predictors covering the entire Korean Peninsula. This integrated database enables consistent representation of rapidly evolving meteorological conditions, atmospheric composition, and surface-level air quality.

Using the constructed real-time database, we develop a data-driven prediction model to estimate hourly surface ozone concentrations, with AIRKOREA observations used as the target variable. The modeling framework is designed with operational feasibility in mind, supporting continuous updates, automated preprocessing, and near-real-time inference without reliance on computationally expensive chemical transport models. The resulting system provides high-resolution ozone predictions that capture fine-scale spatiotemporal variability at the national level.

Model evaluation demonstrates that integrating geostationary satellite data with real-time meteorological and surface observations substantially enhances the prediction of hourly ozone variability compared to single-source or static-input approaches. The proposed framework highlights the advantages of real-time, high-resolution, and nationwide data integration for operational ozone forecasting in South Korea. Beyond ozone, this scalable and extensible system provides a foundation for real-time prediction of additional atmospheric pollutants and supports the development of next-generation data-driven air-quality forecasting services.

How to cite: Kim, S., Kim, Y., and Lee, W.: A real-time, high-resolution framework for nationwide hourly ozone prediction in South Korea using integrated satellite, meteorological, and surface observations, EGU General Assembly 2026, Vienna, Austria, 3–8 May 2026, EGU26-18034, https://doi.org/10.5194/egusphere-egu26-18034, 2026.

EGU26-18359 | Posters on site | AS3.40

Development of an inversion system for biogenic isoprene emissions in IFS-COMPO 

Flora Kluge, Johannes Flemming, Vincent Huijnen, Antje Inness, Christopher Kelly, Jean-François Müller, Glenn-Michael Oomen, Roberto Ribas, Trissevgeni Stavrakou, and Miró van der Worp

We report on the development of an inversion system for biogenic emissions within ECMWF’s Integrated Forecasting System IFS-COMPO.  As part of the Horizon Europe CAMEO (CAMS EvOlution) project, a satellite-retrieval based inversion system for surface fluxes of biogenic volatile organic compounds was implemented in the IFS global model. The scheme is based on formaldehyde (HCHO) satellite observations from multiple satellite instruments. As part of the work, an assimilation capacity for formaldehyde was developed for use in IFS-COMPO, which uses the 4DVAR data assimilation technique. The extension for HCHO assimilation applies the tangent linear and adjoint of recently developed simplified formaldehyde-isoprene chemistry scheme. The purpose of the adjoint simplified chemistry scheme is to enable a modification of the isoprene fields based on the assimilation of HCHO observations. The impact of the assimilation of HCHO in IFS-COMPO is analyzed using TROPOMI S5P formaldehyde observations, with a particular focus on its impact on HCHO as well as key atmospheric reactive trace gases, such as isoprene, ozone, and carbon monoxide. We further present first optimizations of the a priori biogenic isoprene emissions based on HCHO satellite observations. Particular focus is put on the sensitivity of the implemented simplified HCHO chemistry to isoprene emissions by systematically investigating the link of isoprene and formaldehyde both in the IFS standard configuration and when using the new simplified HCHO chemistry scheme. The latter is assessed by scaling climatological a-priori isoprene emissions by differing factors and consecutively analysing the resulting variance of full-IFS-COMPO and simplified-chemistry formaldehyde in respective IFS-COMPO forecasts.

How to cite: Kluge, F., Flemming, J., Huijnen, V., Inness, A., Kelly, C., Müller, J.-F., Oomen, G.-M., Ribas, R., Stavrakou, T., and van der Worp, M.: Development of an inversion system for biogenic isoprene emissions in IFS-COMPO, EGU General Assembly 2026, Vienna, Austria, 3–8 May 2026, EGU26-18359, https://doi.org/10.5194/egusphere-egu26-18359, 2026.

EGU26-18643 * | ECS | Orals | AS3.40 | Highlight

AIFS-Compo: A Data-Driven Atmospheric Composition Forecasting System  

Paula Harder, Johannes Flemming, Mihai Alexe, and Matthew Chantry

Machine learning has shown great success in numerical weather prediction. Here, we extend these advances to atmospheric composition forecasting by introducing AIFS-Compo, an AI-based system for predicting aerosols and reactive trace gases. Building on ECMWF’s AI weather forecasting framework, AIFS, we develop a large-scale graph-transformer model trained in two stages: first on CAMS EAC4 reanalysis data, and subsequently on a combination of CAMS analysis and forecast data. The resulting system produces 3-hourly forecasts and jointly uses prognostic variables from both numerical weather prediction and atmospheric composition.

When verifying against observations, AIFS-Compo achieves lower errors than the operational IFS-Compo system for 5-day forecasts of aerosol optical depth (AOD) and PM2.5, while showing comparable skill for reactive gases including ozone, carbon monoxide, nitrogen dioxide, and sulfur dioxide. Overall, AIFS-Compo delivers performance competitive with the operational system at a fraction of the computational cost. This efficiency for example enables extension to longer leadtimes, such as 10-day forecasts, supporting applications including early ozone hole prediction.

How to cite: Harder, P., Flemming, J., Alexe, M., and Chantry, M.: AIFS-Compo: A Data-Driven Atmospheric Composition Forecasting System , EGU General Assembly 2026, Vienna, Austria, 3–8 May 2026, EGU26-18643, https://doi.org/10.5194/egusphere-egu26-18643, 2026.

EGU26-18833 | Posters on site | AS3.40

Simulation and Evaluation of CO2 Concentration Variability over the Korean Peninsula using the WRF-VPRM Model. 

Chu-Yong Chung, Do-Hyun Kim, Hyun Min Sung, Minhae Kim, Tae-Jun Kim, and Kyung-On Boo

In this study, simluation performance was evaluated using the WRF-CHEM model coupled with the Vegetation Photosynthesis and Respiration Model(VPRM) module, which accounts for the Net Echosystem Exchange (NEE) by terrestrial ecosystems. In the WRF-VPRM model, carbon dioxide (CO2) concentrations are simulated by dividing them into three components: background, anthropogenic, and biogenic.

To execute the WRF-VPRM model, various input datasets were utilized, including ERA5 meteorological fields, CAMS CO2 concentrations, EDGAR CO2 emission data, and MODIS surface reflectance data. To obtain high-resolution results for the Korean Peninsula, a nested grid system was configured, covering East Asia (27 km spatial resolution) and the Korean Peninsula (9 km spatial resolution). Fore Vegetation information - a critical input for VPRM - the Enhanced Vegetation Index (EVI) and Land Surface Water Index (LSWI), which represent vegetation activity and soil moisture derived from MODIS observations, were employed.

To evaluate the model's preformance, including seasonal variability, simulations were conducted over a three-year period from 2018 to 2020 for the East Asian region. Validation against ERA5 (meteorological variables) and CAMS data (CO2 concentration) usde for initial and boundary conditions confirmed an annual trend of increasing CO2 concentrations over the Korean Peninsula.  Furthermore, the WRF-VPRM model successfully captured seasonal variability, showing lower concentrations during the summer - when vegetation effects are most prominent - compared to other seasons. This presentation introduces the validation of meteorological variable simulations and the analysis of characteristics related to CO2 concentration fluctuations.

How to cite: Chung, C.-Y., Kim, D.-H., Sung, H. M., Kim, M., Kim, T.-J., and Boo, K.-O.: Simulation and Evaluation of CO2 Concentration Variability over the Korean Peninsula using the WRF-VPRM Model., EGU General Assembly 2026, Vienna, Austria, 3–8 May 2026, EGU26-18833, https://doi.org/10.5194/egusphere-egu26-18833, 2026.

EGU26-19175 | Orals | AS3.40

Stratospheric composition Limb observations to improve NWP forecasts and (re)analyses 

Beatriz Monge-Sanz, Antje Inness, Quentin Errera, and Björn-Martin Sinnhuber

This work assesses the impact that the assimilation of ozone profiles has on meteorological fields in NWP simulations of recent weather events that were influenced by stratosphere-troposphere interactions.

We use the European Centre for Medium-Range Weather Forecasts (ECMWF) IFS model with CAMS configurations, focusing on Northern Hemisphere winters within the period 2020-2023. We investigate the impact of Microwave Limb Sounder (MLS) ozone profiles, as MLS on the Aura satellite has been providing essential observations of ozone for the stratosphere and the upper troposphere-lower stratosphere (UTLS) regions.

Chemistry-dynamics interactions in these regions are key for winter weather and climate patterns, and for the coupling between troposphere and stratosphere. Our work highlights the capacity of MLS O3 to enhance weather forecasting and shows the need for alternatives once MLS is decommissioned.

Our study also explores alternatives to be used after MLS data will stop being available. And it shows the need for future observation platforms similar to the ESA-CAIRT EE11 candidate instrument, to provide atmospheric composition measurements that would enable better representation of stratospheric and UTLS processes and enhance stratosphere-troposphere coupling in weather forecast systems and reanalyses.

How to cite: Monge-Sanz, B., Inness, A., Errera, Q., and Sinnhuber, B.-M.: Stratospheric composition Limb observations to improve NWP forecasts and (re)analyses, EGU General Assembly 2026, Vienna, Austria, 3–8 May 2026, EGU26-19175, https://doi.org/10.5194/egusphere-egu26-19175, 2026.

EGU26-20341 | ECS | Posters on site | AS3.40

Data-driven one-day-ahead PM₁₀ prediction for Portugal: comparing MLP and LSTM models under extreme fire event 

Ana Oliveira, André Brito, Rita Durão, and Ana Russo

Air pollution is one of the most critical environmental threats to human health and ecosystems, with major socio-economic impacts, and remains the leading environmental health risk in Europe, contributing to hundreds of thousands of premature deaths each year. Accurate one-day-ahead air quality forecasts are therefore essential to support timely mitigation actions and protect vulnerable populations under rapidly evolving atmospheric conditions.

This work develops and evaluates machine learning approaches for next-day prediction of PM₁₀ concentrations in Portugal, focusing on the Centro (NUTS II) region over the period 2003–2022. Two architectures were implemented and tested: a multilayer perceptron (MLP) and a deep learning long short-term memory (DL-LSTM) model, trained and cross-validated on data from 2003–2021, with 2022 reserved as an independent test year.

Model skill was assessed both for routine conditions and during two well-documented extreme events: the 2020 Oleiros wildfires and the 2022 Serra da Estrela wildfires, which produced intense PM₁₀ episodes in central Portugal. The models showed high predictive capability for daily PM₁₀, with the MLP achieving a correlation coefficient of 0.97 and slightly outperforming the DL-LSTM configuration.

These results highlight the potential of data-driven methods to anticipate short-term air quality degradation, including wildfire-driven pollution peaks, and to support operational warning systems at the regional scale. The proposed framework can be extended to other pollutants and regions, contributing to more effective environmental management and public health planning in Portugal.

How to cite: Oliveira, A., Brito, A., Durão, R., and Russo, A.: Data-driven one-day-ahead PM₁₀ prediction for Portugal: comparing MLP and LSTM models under extreme fire event, EGU General Assembly 2026, Vienna, Austria, 3–8 May 2026, EGU26-20341, https://doi.org/10.5194/egusphere-egu26-20341, 2026.

EGU26-20963 | Posters on site | AS3.40

QLC: An Automated Forecast Verification Suite for CAMS and AI-Integrated Weather Prediction Systems 

Swen Metzger, Gregor Feigel, Orfeas Karathanasopoulos, Stelios Myriokefalitakis, Thierry Elias, Samuel Rémy, Vincent Huijnen, Cathy Wing Yi Li, Paula Harder, and Johannes Flemming

The Quick Look Content (QLC) suite provides automated forecast verification and analysis capabilities optimized for the Copernicus Atmosphere Monitoring Service (CAMS) and emerging AI-integrated forecasting systems. QLC addresses the growing need for systematic, reproducible evaluation of atmospheric composition forecasts through an end-to-end workflow from data retrieval to publication-quality visualizations.

The system integrates direct access to ECMWF's MARS archive with currently 16 observation networks including EBAS, AirNow, and GHOST-harmonized datasets, covering 7,855 atmospheric variables. Native GRIB support preserves forecast step information critical for analyzing temporal forecast evolution. QLC handles the complete verification workflow: automated MARS data retrieval, model-observation collocation with configurable spatial and temporal matching, statistical analysis including bias, RMSE, and correlation metrics, and generation of comprehensive visualizations (e.g., maps, time series, scatter plots, Taylor diagrams).

Recent development of an AIFS-specific workflow enables systematic comparison of AI-integrated forecasts against traditional IFS-COMPO runs and observational data. QLC supports multiple evaluation modes: single experiment validation, multi-experiment intercomparison, and observation-only analysis. Processing scales from single-station quick looks to continental-scale multi-variable assessments. Integration with the evaltools package (CNRM/Météo-France) provides advanced statistical diagnostics including diurnal cycles, station score maps, and exceedance analysis.

Here we introduce QLC and demonstrate its capabilities through verification examples comparing IFS-COMPO and AIFS-COMPO forecasts for ozone, nitrogen oxides, and particulate matter against multi-network observations. Results highlight the tool's utility for operational forecast monitoring, model development support, and scientific analysis. The open-source package (PyPI: rc-qlc) is designed for use on both HPC systems and workstations, with one-command installation and comprehensive documentation at docs.researchconcepts.io/qlc.

This work is supported by CAMS2_35_bis_KNMI: "Developments on reactive gases and aerosol in the global system" (https://atmosphere.copernicus.eu/).

How to cite: Metzger, S., Feigel, G., Karathanasopoulos, O., Myriokefalitakis, S., Elias, T., Rémy, S., Huijnen, V., Wing Yi Li, C., Harder, P., and Flemming, J.: QLC: An Automated Forecast Verification Suite for CAMS and AI-Integrated Weather Prediction Systems, EGU General Assembly 2026, Vienna, Austria, 3–8 May 2026, EGU26-20963, https://doi.org/10.5194/egusphere-egu26-20963, 2026.

EGU26-748 | ECS | Posters on site | AS3.41

Integrating radiocarbon measurements for CO2 source attribution at a suburban site upwind of the Delhi NCR 

Vimal Jose Vazhathara, Ravi Kumar Kunchala, Sajeev Philip, and Rajveer Sharma

Atmospheric carbon dioxide (CO2) is the most significant anthropogenic greenhouse gas, driving changes in Earth’s radiative balance and climate. The Indo-Gangetic Plain (IGP) is a global hotspot of CO2 emissions due to dense population, intensive energy use, and widespread industrial activity; however, continuous and high-precision CO2 observations across the region remain sparse. To address this gap, we conducted the first long-term in situ measurements of atmospheric CO2 at a suburban site in Sonipat, located upwind of the Delhi National Capital Region. Using a state-of-the-art laser-based cavity ring-down spectrometer, continuous CO2 observations were collected from February 2023 to February 2024, revealing an annual mean concentration of 422.3 ± 26.52 ppm. The seasonal cycle shows lower concentrations during the monsoon (404.9 ± 25.95 ppm) and elevated values in the post-monsoon season (438.8 ± 27.73 ppm), driven primarily by changes in boundary layer dynamics, regional emissions, and biospheric fluxes. Consistent diurnal patterns further highlight the influence of convective mixing, rush-hour traffic, and local industrial activity.

To quantify fossil fuel CO2 (CO2ff) contributions, we present the first radiocarbon (14C) measurements in CO2 from Sonipat for April 2024 to March 2025. These data provide direct constraints on CO2ff and enable separation of fossil and biospheric carbon components. By combining 14C-derived CO2ff with collocated high-frequency carbon monoxide (CO) observations, we derive a constant CO–CO2ff enhancement ratio (RCO). This ratio is then applied to reconstruct a continuous, high-resolution CO2ff time series, capturing the strong seasonality linked to local emissions and meteorology. Subtracting fossil fuel and background contributions allows the isolation of regional biospheric CO2 signals. 

Together, these integrated measurements demonstrate the value of continuous CO2, CO, and 14C observations for improving carbon budget assessments over the IGP and highlight the critical role of multi-species atmospheric monitoring in constraining regional carbon fluxes.

Keywords: In-situ measurements, Indo-Gangetic Plain, Fossil fuel CO2, Radiocarbon

How to cite: Vazhathara, V. J., Kunchala, R. K., Philip, S., and Sharma, R.: Integrating radiocarbon measurements for CO2 source attribution at a suburban site upwind of the Delhi NCR, EGU General Assembly 2026, Vienna, Austria, 3–8 May 2026, EGU26-748, https://doi.org/10.5194/egusphere-egu26-748, 2026.

EGU26-1700 | Orals | AS3.41

Comparison of carbon dioxide sources for use as spectroscopic radiocarbon (Δ14CO2) standards 

Andrew Whitehill, Patrick Siegwolf, Samuel Hammer, Susanne Preunkert, Ruth Hill-Pearce, Sarah Channell, Sangil Lee, Hanjun Eun, Kiryong Hong, Lukas Emmenegger, Béla Tuzson, and Joachim Mohn

Advances in spectroscopic techniques for measuring radiocarbon (14C) in carbon dioxide (CO2) allow near-real-time analyses of atmospheric CO2 and the characterization of the fossil fuel fraction of CO2 emissions on sub-hourly timescales. Calibration and drift correction of these measurements require high-purity CO2 with near-modern (atmospheric) radiocarbon and stable isotopic (δ13C) signatures. Most commercially available compressed CO2 gases are fossil fuel-derived (14C-dead), while biogenic CO2 remains a niche product with limited purity specifications. Both total gas purity and the presence of ppbv-level impurities of nitrous oxide (N2O) can adversely impact the spectroscopic Δ14C-CO2 measurements.

We present results on purity and isotopic characterization (δ13C, Δ14C) of different CO2 gas sources as part of ongoing work to develop CO2 standard gases with modern Δ14C and δ13C signatures. We tested CO2 from distinct biogenic sources, including brewery, ethanol production, and biogas production. We also characterize several high-purity fossil CO2 sources. Gases were tested for Δ14C-CO2 and N2O impurities by saturated-absorption cavity ring-down spectroscopy (SCAR) using a commercial instrument (ppqSense). These measurements were calibrated against spectra from CO2 released from a NIST oxalic acid standard (SRM 4990C). We also characterized Δ14C-CO2 by accelerator mass spectrometry, δ13C-CO2 using isotope ratio mass spectrometry, and the presence of trace impurities using different techniques. Preliminary results show the N2O impurities from three tested biogenic gas sources vary by a factor of 103, the 14C content varies by almost 30%, and the δ13C values vary by over 25 ‰. These results will be presented in the larger context of supporting semi-automated SCAR Δ14C-CO2 measurements in Dübendorf, Switzerland.

How to cite: Whitehill, A., Siegwolf, P., Hammer, S., Preunkert, S., Hill-Pearce, R., Channell, S., Lee, S., Eun, H., Hong, K., Emmenegger, L., Tuzson, B., and Mohn, J.: Comparison of carbon dioxide sources for use as spectroscopic radiocarbon (Δ14CO2) standards, EGU General Assembly 2026, Vienna, Austria, 3–8 May 2026, EGU26-1700, https://doi.org/10.5194/egusphere-egu26-1700, 2026.

Pollutants released from open biomass burning (OBB) considerably impact air quality, human health, and ecosystems. Only a few studies have used geostationary satellites to monitor OBB emissions in China. Therefore, we construct the China Open Biomass Burning Emissions Inventory (COBBEI) from 2020 to 2023. This dataset included eight pollutants with a temporal resolution of 1 hour and a spatial resolution of 2 km. The COBBEI integrated multi-satellite data, including MODIS, NPP, and Fengyun-4A (FY-4A). The Fire Radiation Power (FRP) data were reconstructed to the FRP cycle, and we integrated the curves to obtain the hourly biomass burned. We also developed five filtering rules based on FRP, considering fire point frequency, radiation values, timing, and variation. These rules were applied to correct the land cover maps, and their validity was verified. The annual average emissions of CO2, CO, CH4, NOx, SO2, PM2.5, K, and LG were 46530, 2262, 132, 82, 25, 247, 11, and 12 Gg, respectively. The spatial distribution characteristics of all eight pollutants were generally consistent. Northeast China served as a major center of pollutant emissions. Different types of fires exhibited various spatial distributions. Emission peaks from cropland and grassland fires typically occurred between 11:00 and 13:00, with a smaller peak at midnight. The number of SFs significantly increased, indicating a rise in the extent and decentralization of OBB, particularly in Tibet, Qinghai, and Sichuan. By validating the method and comparing it with other databases, it was confirmed that COBBEI reduced uncertainty in the OBB emission inventory by providing more information on fire points and effectively screening out fires that were not from OBB. The dataset could offer essential data for air quality modeling, environmental policy development, and fire emergency response strategies. 

How to cite: Shi, J. and Ji, Y.: China Open Biomass Burning Emissions Inventory (COBBEI) from 2020 to 2023: A Fusion Approach with Fengyun-4A and Polar Orbit Satellites Data Based on Filtering Rules, EGU General Assembly 2026, Vienna, Austria, 3–8 May 2026, EGU26-1921, https://doi.org/10.5194/egusphere-egu26-1921, 2026.

EGU26-4933 | ECS | Posters on site | AS3.41

Using harmonized radon (222Rn) observations in a dual-tracer inversion to estimate CH4 emissions  

Fabian Maier, Christian Rödenbeck, Ute Karstens, Frank-Thomas Koch, Maksym Gachkivskyi, Andrew Smerald, and Christoph Gerbig

Radon (222Rn) is an ideal tracer for studying atmospheric mixing and evaluating atmospheric transport models because its lifetime is comparable to the timescale of atmospheric ventilation. A persistent challenge for atmospheric transport models is accurately representing vertical mixing especially under stable boundary layer conditions. Errors in this representation directly propagate into biases in greenhouse gas flux estimates derived from inverse modelling. Here, we demonstrate the potential of consistent, harmonized atmospheric 222Rn observations to assess transport model performance and improve methane (CH4) emission estimates using a joint CH4-222Rn inversion framework.

To this end, we compiled and harmonized 222Rn activity concentration measurements – alongside concurrent CH4 observations – from multiple atmospheric sites across central Europe. Using the Stochastic Time-Inverted Lagrangian Transport (STILT) model and prior flux estimates, we calculated the differences between observed and modelled concentrations (the so-called model-data mismatches, MDMs) for both 222Rn and CH4. We found significant correlations between the MDMs of 222Rn and CH4, indicating shared errors in their simulations, which primarily originate from the transport model’s inadequate representation of vertical mixing. To exploit this information, we conducted a dual-tracer CH4-222Rn inversion using the CarboScope-Regional inversion framework. We present the latest CH4 flux estimates from this dual-tracer approach and compare them with results from a single-tracer CH4-only inversion without additional 222Rn information. Finally, we assess how biases and uncertainties in 222Rn observations and 222Rn flux maps propagate into the dual-tracer inversion and affect the derived CH4 flux estimates. Our findings highlight the critical need for harmonized, spatially and temporally extensive 222Rn data, as well as accurate 222Rn flux maps, to fully leverage the dual-tracer approach and improve the reliability of CH4 flux estimates.

How to cite: Maier, F., Rödenbeck, C., Karstens, U., Koch, F.-T., Gachkivskyi, M., Smerald, A., and Gerbig, C.: Using harmonized radon (222Rn) observations in a dual-tracer inversion to estimate CH4 emissions , EGU General Assembly 2026, Vienna, Austria, 3–8 May 2026, EGU26-4933, https://doi.org/10.5194/egusphere-egu26-4933, 2026.

EGU26-6770 | ECS | Posters on site | AS3.41

The main causes and trends of air pollution in the Czech Republic 

Vladimíra Volná, Radim Seibert, and Daniel Hladký

The main causes and trends of air pollution in the Czech Republic

Radim Seibert1, Vladimíra Volná1, Daniel Hladký1

1Czech Hydrometeorological Institute, Air Quality Department, K Myslivně 3/2182, 708 00 Ostrava, Czech Republic


Air pollution in the Czech Republic shows significant regional differences resulting from the specific historical, natural, and socioeconomic conditions of individual areas. The main causes include historical industrial development, mining and related energy production, individual household heating, and major transport hubs, whose impact is amplified by the Czech Republic's central location within Europe. The spatial distribution of pollution is further influenced by varying orographic and meteorological conditions, which determine the degree of dispersion or accumulation of pollutants.

Detailed knowledge of the main causes of pollution is essential for the effective proposal and targeting of measures to improve air quality, both at regional and national level. Since 2018, the Czech Hydrometeorological Institute has been addressing this issue systematically, through projects and in cooperation with other specialised institutions (Seibert et al., 2025; Seibert et al., 2024; Volná et al., 2024).

Source apportionment carried out between 2018 and 2024 using receptor models as part of several research projects has highlighted a significant spatial gradient of pollution from individual domestic heating with solid fuels. While the overall share of domestic heating in the Czech Republic in PM concentrations decreases from north to south, the share of emissions from biomass heating in this direction is increasing. This is probably a consequence of the higher share of coal in the fuel mix in the vicinity of historic coal regions.

In terms of the temporal development of air pollution, the concentrations and mutual ratios of organic markers reveal a declining share of PM originating from biomass combustion in individual domestic heating, accompanied by an improvement in the quality of combustion processes. Although overall PM concentrations showed a decreasing trend, there was a notable increase in certain elements associated with coal combustion between 2018 and 2024. This could have been caused by the dramatic increase in energy prices after 2019 and the related transition to more affordable fuels.


References:

  • Seibert, R., Pokorná, P., Vodička, P., Volná, V., Lhotka, R., Zíková, N., Ondráček, J., Windell, L.C., Schwarz, J., Ždímal, V. (2025). Multi-site vs. supersite aerosol source apportionment in a lignite basin area. Environmental Pollution 386, 127226, https://doi.org/10.1016/j.envpol.2025.127226.
  • Seibert, R., Kotlík, B., Kazmarová, H., Dombek, V., Volná, V., Hladký, D., Krejčí, B. (2024). Regional and seasonal drivers of metals and PAHs concentrations in road dust and their health implications in the Czech Republic. Heliyon 10, e40725, https://doi.org/10.1016/j.heliyon.2024.e40725.
  • Volná, V.; Seibert, R.; Hladký, D.; Krejčí, B.(2024). Identification of Causes of Air Pollution in a  Specific Industrial Part of the Czech City of Ostrava in Central Europe. Atmosphere 2024, 15, 177. https://doi.org/10.3390/atmos15020177.

How to cite: Volná, V., Seibert, R., and Hladký, D.: The main causes and trends of air pollution in the Czech Republic, EGU General Assembly 2026, Vienna, Austria, 3–8 May 2026, EGU26-6770, https://doi.org/10.5194/egusphere-egu26-6770, 2026.

EGU26-7688 | Orals | AS3.41

Traceability and Internal Consistency of Greenhouse Gases and Related Tracers within the Global Atmosphere Watch Programme 

Christoph Zellweger, Martin Steinbacher, and Lukas Emmenegger

Reliable and traceable measurements of greenhouse gases (GHGs) and related tracers are essential for detecting trends, understanding sources and sinks, and supporting climate policy. The World Meteorological Organization’s (WMO) Global Atmosphere Watch (GAW) programme provides a Quality Management Framework to ensure that observations meet strict requirements for compatibility and traceability. As part of this initiative, Empa is operating the World Calibration Centre for Surface Ozone, Carbon Monoxide, Methane, Carbon Dioxide, and Nitrous Oxide (WCC-Empa) since 1996, providing independent verification of measurement quality across the GAW network.

A core activity of WCC-Empa is to conduct on-site system and performance audits at GAW stations. These audits include station visits, comparisons with travelling standards and extended parallel measurements, which are used to assess traceability to GAW reference scales. Over the past 30 years, WCC-Empa has performed over 120 audits worldwide, enhancing the quality and availability of data, particularly in regions with limited resources. Operator training and capacity building are also key components, ensuring sustainable improvements in measurement practices.

Recent audits demonstrate substantial progress in CH₄ and CO₂ measurements, driven by advancements in laser spectroscopy. The adoption of cavity-enhanced laser spectroscopy has led to a significant increase in compliance with WMO/GAW network compatibility goals. Over 80% of CH₄ and more than 50% of CO₂ comparisons now meet the respective targets (2 nmol mol⁻¹ for CH₄; 0.1 µmol mol⁻¹ for CO₂). This represents a roughly twofold improvement for CH₄ and a threefold improvement for CO₂ compared to previous gas chromatography (GC) and non-dispersive infrared (NDIR) techniques.

However, challenges remain for CO due to frequent amount fraction drifts in calibration standards, and for N₂O due to the limited availability of high-accuracy reference materials. These challenges result in uncertainties that exceed the network compatibility goals. Currently, only around 20% of CO audits and less than 10% of N₂O audits meet their respective goals (2 nmol mol⁻¹ for CO and 0.1 nmol mol⁻¹ for N₂O). Strengthening traceability chains for these gases is critical for harmonisation across networks.

This contribution will present traceability concepts within GAW, summarise WCC-Empa audit results and lessons learned, and outline ongoing efforts to improve the internal consistency and cross-network comparability of GHG and tracer measurements.

How to cite: Zellweger, C., Steinbacher, M., and Emmenegger, L.: Traceability and Internal Consistency of Greenhouse Gases and Related Tracers within the Global Atmosphere Watch Programme, EGU General Assembly 2026, Vienna, Austria, 3–8 May 2026, EGU26-7688, https://doi.org/10.5194/egusphere-egu26-7688, 2026.

Ambient particulate matter (PM) in industrially influenced environments often contains a complex chemical composition, reflecting interactions among local emissions, regional transport, and natural background sources. When chemically-speciated datasets are available, receptor modeling provides a powerful framework for attributing observed concentrations of emissions—such as metals and metalloids—to their contributing sources, particularly in settings where industrial signatures are chemically distinct from urban PM and locally resuspended dust.

The Horne Smelter in Rouyn-Noranda, Quebec, Canada, is the only remaining copper smelter in the country and the largest processor of metals from electronic scrap in North America. In recent years, emissions from the facility have been subject to heightened scrutiny due to elevated concentrations of metals and metalloids measured at surrounding monitoring stations. Robust PM source attribution is therefore critical for interpreting long-term monitoring data and informing emission reduction strategies. In particular, there is a need to quantify the relative contributions of different smelter-related activities to elemental concentrations measured at locations throughout the town of Rouyn-Noranda, which directly borders the facility.

This study applies Positive Matrix Factorization (PMF) to multi-year datasets of chemically speciated PM10 (PM <10µm) and total suspended particles (TSP) samples from multiple monitoring stations in the vicinity of the Horne Smelter—alongside metrological data including wind speed and direction—to reveal the dominant sources of metals and metalloids to ambient air and their emission dynamics. PMF is a widely used receptor modeling technique that resolves diverse multi-species datasets into an optimized number of factors, or chemical sources. Analysis focused on trace metals and metalloids sources and concentrations, including arsenic, lead, and chromium. The PMF analysis resolved seven (7) consistent source factors, five of which are associated with distinct materials and processes related to smelter operations (e.g., Bath Smelting, Feedstock, E-waste, Primary Furnace off gas), while the remaining two factors are crustal & road dust and vehicle emission sources which may come from the town, distance sources, or the smelter. By leveraging long-term datasets, temporal patterns of source contributions are revealed, with road dust and fugitive ore-related sources decreasing during winter months when snow cover is prevalent, while smokestack-related smelting sources show no consistent seasonal patterns. These trends confirm the identification of the sources based on their chemical profiles.

Additionally, we analyze the differences in source profiles between PM10 and TSP datasets and stations with varying time resolution (hourly vs 1-3 day). This secondary analysis explores how representative multi-day average samples are in describing PM in comparison to high resolution measurements, especially for industrial emissions. These findings demonstrate the value of long-term, multi-site PMF analyses for improving source attribution of metal and metalloid-rich PM in industrial regions and provide insights relevant to emission reduction efforts.

How to cite: Norris, E. and Hayes, P.: Resolving Metal-Rich Industrial Fingerprints: Multi-Site PMF Insights from PM10 and TSP at a Canadian Copper Smelter, EGU General Assembly 2026, Vienna, Austria, 3–8 May 2026, EGU26-7951, https://doi.org/10.5194/egusphere-egu26-7951, 2026.

Accurate source apportionment of particulate pollution is essential for timely emission control strategies to improve air quality and mitigate its health impacts. Traditional receptor models face challenges including extensive data dependency, technical complexities, and computational burden. Here we develop a machine learning (ML) based source apportionment model that leverages diverse aerosol composition measurements across a wide range of spatiotemporal scales. Particularly in the near-real time fashion, the model enables swift PM2.5 source apportionment using high temporal resolution online measurements on certain sites, supporting agile policy responses. On the larger spatial and temporal scales, the model also accurately quantifies PM2.5 sources for two decades in the Pearl River Delta region in China and the state of California in U.S., exhibiting strong generalization capability. For the megacities, the ML model results reveal that Shenzhen, China, experienced a significant decline in PM2.5 over the past decade due to the successful control of anthropogenic sources, while Los Angeles, U.S., witnessed a flattened PM2.5 trend under the joint effects of the reduced coal combustion and the exacerbated climate-driven wildfire pollution. This study highlights the potential of ML in air pollution research and policy-making toward environmental sustainability.

How to cite: Peng, X. and Feng, N.: Machine learning-based source apportionment of particulate pollution aids real-time predictions and long-term emission regulations, EGU General Assembly 2026, Vienna, Austria, 3–8 May 2026, EGU26-8639, https://doi.org/10.5194/egusphere-egu26-8639, 2026.

EGU26-10104 | ECS | Orals | AS3.41

First preparation of isotopic nitrous oxide in synthetic air reference materials for underpinning measurements of δ15N-N2O, δ15N-N2OSP and δ18O-N2O 

Aimee Hillier, Freya Wilson, Ruth Hill-Pearce, Tom Gardiner, Christoph Nehrbass-Ahles, Rebecca Fisher, Dave Lowry, Joachim Mohn, and Paul Brewer

The precise measurement of the nitrous oxide (N2O) isotope ratio in the atmosphere is required to understand global emission trends. Currently, however no internationally accepted reference materials for atmospheric amount fraction N2O exist with characterised isotope ratio including uncertainties. Therefore, there is an urgent need for the development of reference materials to fill this traceability gap and meet the requirements to underpin global atmospheric measurements. Reference materials are typically traceable to internationally recognised stable isotope ratio scales: AIR-N2 and VSMOW (Vienna Standard Mean Ocean Water) for δ15N and δ18O respectively. The linearly asymmetric structure of the N2O molecule introduces an additional challenge in the measurement of the position specific δ15Nα (central N) and δ15Nβ (terminal N). Reference materials are required to span the ranges of δ15Nα and δ15Nβ expected across samples from global atmospheric measurements in addition to bulk δ15N.

We will present progress towards the development of atmospheric amount fraction N2O in synthetic air reference materials with characterised isotope ratios suitable for calibration of optical isotope ratio spectrometers (OIRS). The reference materials span a wide range of δ values. The pure N2O used to prepare the N2O in synthetic air reference materials was prepared at Empa (Switzerland) and has traceability to the primary AIR-N2 and VSMOW scales. The N2O in synthetic air reference materials were certified for N2O amount fraction and isotope ratio using OIRS against traceable reference materials. We will present on certification of N2O isotope ratios based on two approaches: direct calibration of delta values; and calibration of isotopocule amount fractions. A comparison of the two approaches to certification was performed considering the sensitivities, uncertainty contributions, traceability and potential biases of each approach.

The sensitivities in the measured isotope ratios to commonly occurring synthetic air matrix impurities (e.g. trace N2O), and the sensitivity of delta value certification to N2O amount fractions have been assessed to provide a comprehensive uncertainty budget for the certification of N2O in synthetic air reference materials using each approach.

Reproducibility within 0.3 ‰ has been demonstrated across five measurements over a 6-month period using delta and isotopocule amount fraction approaches. Standard measurement uncertainties (k=1) within 1.4 ‰ for δ15Nα, δ15Nβ and 0.5 ‰ for δ15N, δ18O were achieved for certification based on a delta value approach. Standard measurement uncertainties (k=1) within 1.5 ‰ for δ15Nα, δ15Nβ, δ15Nand 0.7 ‰ for δ18O were achieved for certification based on an isotopocule amount fraction approach.

How to cite: Hillier, A., Wilson, F., Hill-Pearce, R., Gardiner, T., Nehrbass-Ahles, C., Fisher, R., Lowry, D., Mohn, J., and Brewer, P.: First preparation of isotopic nitrous oxide in synthetic air reference materials for underpinning measurements of δ15N-N2O, δ15N-N2OSP and δ18O-N2O, EGU General Assembly 2026, Vienna, Austria, 3–8 May 2026, EGU26-10104, https://doi.org/10.5194/egusphere-egu26-10104, 2026.

EGU26-10765 | ECS | Posters on site | AS3.41

PMF-resolved source contribution uncertainty estimation via effective variance least squares 

Qili Dai, Jiajia Chen, Xinyi Zhang, Yingze Tian, Yinchang Feng, and Philip Hopke

Reliable source apportionment of ambient air pollutants is essential for effective air quality management. Positive Matrix Factorization (PMF) has been the most widely applied receptor-based method for ambient particulate matter (PM) (Hopke et al., 2020). Although EPA PMF v5 incorporates approaches to evaluate uncertainties in source profiles due to measurement error and rotational ambiguity (Paatero et al., 2014), it does not provide quantitative estimates of uncertainties in source contributions. Previous attempts to address this issue have been limited to sensitivity tests rather than rigorous uncertainty analyses. Here we introduce a novel approach to quantify uncertainties in source contributions (G matrix) within PMF solutions. By combining PMF-derived factor profiles (F matrix) with observed concentration data, we employ an Effective Variance Least Squares (EVLS) reverse-calculation framework to estimate the standard deviation of each source contribution, yielding a more rigorous and quantitative assessment of PMF uncertainties. A total of 837 valid daily filter-based speciation samples, collected from May 2013 to February 2019 in Tianjin, China (Dai et al., 2023), were used for PMF modeling and methodological testing. Compared with conventional PMF analysis, the PMF-EVLS approach yields both source contribution concentrations and their associated standard deviations. These uncertainties, expressed as standard deviations, reflect the combined influence of various error sources (e.g., model assumptions, measurement errors). The proposed PMF–EVLS method was demonstrated to effectively estimate the uncertainty of source-specific PM2.5 concentrations, thereby enhancing the reliability of source-specific health effect assessments and supporting air quality management decisions. 

Refs:
1. Dai, Q., Chen, J., Wang, X., Tian, Y., et al. (2023). Environ. Pollut. 325:121344.
2. Hopke, P.K., Dai, Q., Li L., Feng Y. (2020). Sci. Total Environ. 740, 140091.
3. Paatero, P., Eberly, S., Brown, S.G., Norris, G.A. (2014). Atmos. Meas. Tech. 7, 781–797.

How to cite: Dai, Q., Chen, J., Zhang, X., Tian, Y., Feng, Y., and Hopke, P.: PMF-resolved source contribution uncertainty estimation via effective variance least squares, EGU General Assembly 2026, Vienna, Austria, 3–8 May 2026, EGU26-10765, https://doi.org/10.5194/egusphere-egu26-10765, 2026.

EGU26-11174 | ECS | Orals | AS3.41

Quantifying Pollution Events using Gas and Aerosol Observations via Flexible Receptor Framework over Urban Shanxi 

Xiaolu Li, Jason Cohen, Kai Qin, and Pravash Tiwari

Fine particular matter (PM) pollution still occurs frequently in China. Source apportionment of pollutants is a necessary prerequisite for proposing pollution prevention and control policies, and most studies have been conducted using receptor or air quality models. This work combined the composition of PM2.5 and top-down gas pollutant emission (calculated by a Mass-Conserving inversion estimate framework based on daily TROPOMI NO2 and CO columns and ground observation), and jointly analyzed the results using an Empirical Orthogonal Functions Principal Components Analysis (EOF) approach at 0.05°×0.05° over the Taiyuan Basin, an urban, economic, and industrial aera of Shanxi Province. This area presents an important study region wherein atmospheric pollution is relatively severe, with diverse pollutant sources and challenging topography. This method used is both flexible and demonstrates the details and correct days when the pollutant events happened. Various pollution sources have been detected, including dust and haze, emissions from industrial enterprises of different scales, and diverse combustion-related sources. In addition to standard source types, there are some more pronounced pollution events that can be found, such as during the Spring Festival of each year, there is a significant increase in CO/NOx implying increased residential combustion sources. The same signal is even more obvious in rural areas during 2020 when the COVID-19 induced lockdowns occurred. At the same time in 2021, we demonstrate both further reduction of pollution from large enterprises and poorer control of small, scattered sources and residential combustion sources, including a further increase in CO/NOx. The opposite result with a decrease in emission intensity and decrease CO/NOx ratio in 2022 is observed, inferring a close relationship with strict control during the Winter Olympics. Diagnosis of pollution events by NOx and CO Emissions calculated by Mass-Conserving Inversion method and compositions of PM2.5 was successfully attempted, and it is hoped that it can form a basis for other rapidly changing regions found in topographically challenging regions throughout the Global South.

How to cite: Li, X., Cohen, J., Qin, K., and Tiwari, P.: Quantifying Pollution Events using Gas and Aerosol Observations via Flexible Receptor Framework over Urban Shanxi, EGU General Assembly 2026, Vienna, Austria, 3–8 May 2026, EGU26-11174, https://doi.org/10.5194/egusphere-egu26-11174, 2026.

EGU26-11367 | ECS | Orals | AS3.41

Optimizing a calibration strategy for precise δ13CH4 measurements of ambient air using a CRDS analyzer 

Marius Feuerle, Julia B. Wietzel, and Martina Schmidt

Methane (CH₄) is an important greenhouse gas with multiple natural and anthropogenic sources. Precise δ¹³CH₄ measurements are essential for distinguishing these sources, understanding biogeochemical cycles, and improving climate models. While in-situ CRDS (Cavity Ring-Down Spectroscopy) measurements may have limited absolute precision, well-calibrated continuous measurements of δ13CH4 provide high-temporal-resolution data that are essential for reliably attributing atmospheric CH4 sources.

Here, we present an instrumental characterization, determination of cross-sensitivities and an improved calibration strategy for high-precision δ13CH4 measurements in ambient air using a Picarro G2201-i CRDS analyzer. This approach combines the determination of internal correction parameters from regular measurements (every 5-6 hours) of a single calibration gas at atmospheric concentration with annual multi-point calibrations using reference gases at 10 ppm CH4 spanning an isotopic range of -60 to -37 ‰ in δ13CH4. This strategy corrects the non-linearity in δ13CH4 with changing CH4 mole fraction, which can reach up to 3 ‰ in δ13CH4 over the 2-10 ppm CH4 range.

Applying the Keeling-plot method to nightly CH₄ enhancements in Heidelberg, Germany, the new calibration leads to δ13CH4 source signatures for individual events differing up to 4.6 ‰ to the previous one-point δ-calibration. Using this new calibration scheme, the mean δ13CH4 source signature for 2021-2025 was (-52.3 ± 0.3) ‰, slightly more enriched compared to 2014-2020 ((-53.9 ± 0.3) ‰, presented by Hoheisel and Schmidt, 2024). Only a careful instrument characterization combined with an adapted calibration strategy can ensure the high precision required for δ¹³CH₄ data suitable for quantitative atmospheric studies.

How to cite: Feuerle, M., Wietzel, J. B., and Schmidt, M.: Optimizing a calibration strategy for precise δ13CH4 measurements of ambient air using a CRDS analyzer, EGU General Assembly 2026, Vienna, Austria, 3–8 May 2026, EGU26-11367, https://doi.org/10.5194/egusphere-egu26-11367, 2026.

EGU26-12044 | Posters on site | AS3.41

Assessment of eight laser spectrometers for atmospheric nitrous oxide analysis 

Martin Steinbacher, Christoph Zellweger, and Lukas Emmenegger

Recent advances in laser spectroscopy have substantially improved the detection of atmospheric trace gases, accelerating progress in environmental monitoring. The number of commercially available analyzers has grown, offering measurements for an expanding range of species. Manufacturers are increasingly prioritizing reduced power consumption, compact design, and cost-effectiveness, while aiming to maintain high sensitivity and selectivity. This presentation highlights recent instruments developed for monitoring atmospheric nitrous oxide (N₂O), the third most important long-lived greenhouse gas and the largest single contributor to stratospheric ozone depletion. Despite its global relevance, N₂O remains insufficiently observed, in part due to the high cost of established measurement technologies. The emergence of more economical, energy-efficient, and compact instruments presents an opportunity to strengthen the global N₂O monitoring network.

We assessed eight commercial analyzers at Empa using four spectroscopic techniques: (i) mid-infrared tunable diode laser absorption spectroscopy (TDLAS) with Interband Cascade Lasers (ICLs) and Quantum Cascade Lasers (QCLs), (ii) optical-feedback cavity-enhanced absorption spectroscopy (OF‑CEAS), (iii) off-axis integrated cavity output spectroscopy (OA‑ICOS), and (iv) cavity ring-down spectroscopy (CRDS). The tests revealed significant performance differences across techniques and considerable variability among instruments, particularly for mid-IR TDLAS systems using ICLs. The latter showed pronounced performance drift over time and, thus, were found unsuitable for sustained monitoring.

Overall, OA‑ICOS and CRDS analyzers remain the most robust solutions, consistent with their widespread adoption in World Meteorological Organization's Global Atmosphere Watch (GAW) program and the European Integrated Carbon Observation System Research Infrastructure (ICOS‑RI). While lower-cost alternatives exist, they usually involve trade-offs in precision and accuracy. Instrument selection should therefore balance cost, size, and performance requirements for the intended application.

How to cite: Steinbacher, M., Zellweger, C., and Emmenegger, L.: Assessment of eight laser spectrometers for atmospheric nitrous oxide analysis, EGU General Assembly 2026, Vienna, Austria, 3–8 May 2026, EGU26-12044, https://doi.org/10.5194/egusphere-egu26-12044, 2026.

Shipping emissions are an important contributor to PM2.5 in coastal regions. Globally, the Bohai Sea is recognized as the most aerosol-polluted inland sea. Here, we quantify the influence of shipping-related PM2.5 from the Bohai Sea along the western coastal region using synchronous observations across coastal and inland areas. A coordinated monitoring network was established with three sites located approximately 9, 30, and 50 km from the coastline, providing continuous measurements of PM2.5 mass and chemical composition from April 2023 to February 2024. On average, PMF-resolved shipping emissions contributed 8.4%, 1.6%, and 1.2% of PM2.5 at sites located ~9, ~30, and ~50 km from the coast, respectively, indicating a clear decrease with increasing distance inland. Seasonally, shipping contributions at the coastal site were 5.9–13.0 times higher than those observed at ~50 km inland, with the strongest spatial gradients occurring in summer and the weakest in winter. These results provide direct observational evidence that shipping emissions can measurably influence urban PM2.5 concentrations up to ~50 km inland. Our findings underscore the importance of explicitly accounting for marine emission sources in coastal air quality management, particularly for semi-enclosed seas such as the Bohai Sea.

How to cite: Li, L.: Distance-dependent contributions of shipping emissions to PM2.5 along the western Bohai coast: insights from multiple site PMF modeling, EGU General Assembly 2026, Vienna, Austria, 3–8 May 2026, EGU26-12305, https://doi.org/10.5194/egusphere-egu26-12305, 2026.

EGU26-12583 | ECS | Orals | AS3.41

Chemical characterization and source apportionment of aerosols at a high-altitude site (3106 m asl) in the Austrian Alps 

Alicja Skiba, Daniela Kau, Thomas Riedelberger, Christine Hochwartner, Andjela Vukicevic, Gerhard Schauer, Barbara Scherllin-Pirscher, and Anne Kasper-Giebl

The aim of the work was to determine the seasonal variability of particulate matter (PM) sources at the summit of Mt. Sonnblick in the Austrian Alps (3106 m asl, 12°57’E, 47°03’N) based on the chemical analysis of the PM10 fraction. The Sonnblick Observatory is situated on the main alpine ridge and represents a high-altitude remote sampling site. The observatory is part of the Global Atmosphere Watch (GAW) and Aerosol, Clouds, and Trace Gases Research Infrastructure (ACTRIS) monitoring networks. Results obtained at remote monitoring stations enable seeing long-range air mass influences and could be treated as a reference source for other studies. A total of 244 weekly PM10 samples were collected from 17 January 2019 to 28 December 2023.

Comprehensive chemical analyses were conducted to obtain concentrations of (i) carbohydrates and their derivatives and selected ions (by ion chromatography), (ii) organic and elemental carbon (by thermal-optical analysis) and (iii) selected elements (by inductively coupled plasma optical emission spectroscopy). In total, 36 components of PM in collected samples were measured. The obtained results were then used to identify the emission sources during the study period and to determine their seasonal variability and contributions. For this purpose, Positive Matrix Factorization (PMF) by U.S. Environmental Protection Agency was used. The analysis resolved four major source factors connected with: 1) Saharan dust events, 2) biomass burning, 3) anthropogenic-related emissions, and 4) sugars and sugar-related compounds. Each emission source was characterized with individual temporal pattern through the whole measurement period, e.g. the strong seasonal pattern was confirmed for sugars and sugar-related factor, with increased concentration during the vegetation season. Additionally, more than 15 Saharan dust events were identified and confirmed by numerical models and backward trajectory analyses. The overall results revealed that the Saharan dust events were confirmed as the dominant factor during the study period, with an approximately 40 % contribution to the PMF-related mass, while the average contribution of sugars and sugar-related compounds as well as that of the factor connected with anthropogenic-related emissions was around 25 %. The smallest contribution was found for the factor related to biomass burning ~10 %.

Acknowledgements
This work was financially supported by the Excellence Initiative – Research University program at the AGH University of Krakow (ID: 13958).

How to cite: Skiba, A., Kau, D., Riedelberger, T., Hochwartner, C., Vukicevic, A., Schauer, G., Scherllin-Pirscher, B., and Kasper-Giebl, A.: Chemical characterization and source apportionment of aerosols at a high-altitude site (3106 m asl) in the Austrian Alps, EGU General Assembly 2026, Vienna, Austria, 3–8 May 2026, EGU26-12583, https://doi.org/10.5194/egusphere-egu26-12583, 2026.

EGU26-13426 | ECS | Orals | AS3.41 | Highlight

Planning-Oriented Receptor Modeling: Apportioning Emissions Reductions Required for PM2.5 Attainment 

Chirag Manchanda, Libby H. Koolik, Alper Ünal, Inez Y. Fung, Julian D. Marshall, Rachel Morello-Frosch, Alexander J. Turner, Robert A. Harley, and Joshua S. Apte

Air-quality concentration standards inherently do not specify which emissions controls are necessary to achieve them. Such standards set up a planning challenge that is fundamentally underdetermined, since many distinct emissions pathways can achieve the standard. Forward scenario testing rarely reveals which control levers are truly required versus merely sufficient, and does not necessarily identify optimal approaches. Here, we present a planning-oriented receptor modeling framework that inverts the traditional source apportionment approach. Instead of attributing observed concentrations to sources, we apportion the emissions reductions required for attainment to specific locations, precursors, and sectors, conditional on receptor-based concentration constraints.

We couple a source–receptor sensitivity matrix (mapping emissions changes to downwind concentration  responses at receptors) with a constrained Bayesian inverse problem that infers the minimal, spatially explicit emissions changes needed to meet a fine particulate matter (PM2.5) concentration target everywhere (or within a specified attainment definition). An emissions prior regularizes solutions toward a baseline inventory, while constraints enforce physical and policy realism (e.g., non-negativity, sectoral controllability, optional caps/targets by precursor or region). This yields a transparent “control apportionment” output dictating how much each source category must change and where, in order to satisfy receptor targets. In addition, the model estimates uncertainty-aware diagnostics of which receptors bind and which sources dominate the required controls.

In application across the contiguous United States, we show that strategies with comparable economy-wide reductions (~10%) can produce dramatically different attainment outcomes depending on spatial allocation, ranging from near-universal compliance to minimal improvements in population exposure. By systematically exploring the feasible solution space, we quantify a compliance penalty for misallocation: the additional emissions reductions required when controls are applied non-optimally. Together, the framework bridges receptor modeling and attainment planning by producing source-resolved, defensible control requirements and actionable diagnostics that help agencies benchmark, compare, and stress-test attainment strategies.

How to cite: Manchanda, C., Koolik, L. H., Ünal, A., Fung, I. Y., Marshall, J. D., Morello-Frosch, R., Turner, A. J., Harley, R. A., and Apte, J. S.: Planning-Oriented Receptor Modeling: Apportioning Emissions Reductions Required for PM2.5 Attainment, EGU General Assembly 2026, Vienna, Austria, 3–8 May 2026, EGU26-13426, https://doi.org/10.5194/egusphere-egu26-13426, 2026.

EGU26-13510 | Posters on site | AS3.41

Extended chemical speciation and source apportionment of PM2.5 at two sites in NE Italy 

Mauro Masiol, Matteo Salvini, Marianna D’Amico, Flavia Visin, Andrea Gambaro, Matteo Feltracco, Eleonora Favaro, Giovanna Mazzi, Marta Radaelli, Gianni Formenton, Piero Silvestri, Giorgia Crivellaro, Anna Paloschi, Thomas Nadal, and Philip K. Hopke

Despite decades of EU air-quality policies and sector-specific emission controls, Northern Italy remains a European hotspot for PM pollution. With the forthcoming revision of the Ambient Air Quality Directive expected to tighten limit values, regions already close to (or exceeding) current thresholds will face an even greater compliance challenge. This study characterises the chemical composition and major contributing sources of PM2.5 at two sites in NE Italy: Belluno (Alpine valley) and Conegliano (Po Valley foothills).

A total 266 daily samples were collected during 2023. Comprehensive chemical speciation was performed, including elemental and organic carbon, major inorganic ions, major and trace elements, carboxylic acids, monosaccharides, alcohol-sugars, anhydrosugars, and benzothiazoles. These compounds serve as tracers of specific urban and regional emission sources, such as secondary aerosol formation, biomass burning, biogenic emissions, and traffic-related sources. In addition, a suite of organophosphate flame retardants (OFRs) was quantified.

PM2.5 mass closure was achieved, supporting the robustness of the chemical dataset. Source contributions were resolved through positive matrix factorization (PMF), complemented by post-processing analyses to better investigate local and regional influences. Results highlight differences between the two sites, reflecting their distinct geographical and meteorological settings.  At Belluno, residential biomass burning emerges as a dominant PM2.5 source during the cold season, with pronounced wintertime increases associated with persistent thermal inversions and limited atmospheric dispersion. In Conegliano, PM2.5 shows a strong contribution from secondary aerosol formation and regional transport consistent with Po Valley influence. Traffic, biogenic aerosol, and resuspended dust contribute to a lesser yet non-negligible extent at both locations. An OFRs-related factor grouping most flame retardants was identified but having negligible influence on PM2.5 mass. Overall, the study provides insight into the role of local versus regional sources and meteorological controls on PM2.5 pollution in different sites across NE Italy, offering valuable information to support targeted mitigation strategies in both mountain and lowland environments.

Funding: European Union - NextGenerationEU, in the framework of the iNEST - Interconnected Nord-Est Innovation Ecosystem (iNEST ECS_00000043 – CUP H43C22000540006).

How to cite: Masiol, M., Salvini, M., D’Amico, M., Visin, F., Gambaro, A., Feltracco, M., Favaro, E., Mazzi, G., Radaelli, M., Formenton, G., Silvestri, P., Crivellaro, G., Paloschi, A., Nadal, T., and Hopke, P. K.: Extended chemical speciation and source apportionment of PM2.5 at two sites in NE Italy, EGU General Assembly 2026, Vienna, Austria, 3–8 May 2026, EGU26-13510, https://doi.org/10.5194/egusphere-egu26-13510, 2026.

EGU26-14715 | Orals | AS3.41

Estimating regional methane emissions using the Radon Tracer Method – a case study from North Italy 

Delia Segato, Nicola Arriga, Serena Mancini, Andrea Mainardi, Simone Santarelli, Gianfranco Minchillo, and Giovanni Manca

Due to its relatively short half-life, radon (²²²Rn) is considered a tracer of boundary layer mixing processes. This property is exploited in the Radon Tracer Method (RTM), a top-down technique for estimating local-to-regional emissions of trace gases. However, its applicability has been shown to be site-specific and to require experimental measurement of soil radon exhalation. Here, we apply the RTM to estimate regional methane emissions in the footprint of the ICOS (Integrated Carbon Observation System) Ispra 100m tall tower in northern Italy.  We present methane and radon concentrations from the tall tower, alongside measurements of soil radon exhalation rate and soil water content conducted at two sites near the tower between 2023 and 2025. Methane fluxes are calculated using two types of radon flux as input to the RTM: 1) radon fluxes measured in situ, and 2) modeled radon fluxes obtained from the traceRadon project. We find that both approaches yield comparable methane flux estimates, supporting the use of modeled radon fluxes as an alternative to direct measurements. Furthermore, the resulting methane fluxes are in good agreement with anthropogenic emissions reported by the EDGAR inventory.

How to cite: Segato, D., Arriga, N., Mancini, S., Mainardi, A., Santarelli, S., Minchillo, G., and Manca, G.: Estimating regional methane emissions using the Radon Tracer Method – a case study from North Italy, EGU General Assembly 2026, Vienna, Austria, 3–8 May 2026, EGU26-14715, https://doi.org/10.5194/egusphere-egu26-14715, 2026.

EGU26-16659 | ECS | Posters on site | AS3.41

Identification of anthropogenic marker compounds through LC/HRMS analysis of atmospheric organic aerosol from the ACROSS dataset: Development and method validation 

Niklas Karbach, Pauline Pouyes-Artiguenave, Emilie Perraudin, Eric Villenave, and Thorsten Hoffmann

Comprehensive untargeted analysis of atmospheric organic aerosol filter samples can provide detailed insight into the history of air masses and atmospheric conditions. Due to the large amount of data, automatic analysis must be used in order to interpret and connect individual datapoints across multiple measurements in a given dataset.

This poster presents results of untargeted atmospheric organic aerosol analysis with LC/HRMS. The samples were acquired during the ACROSS campaign in summer of 2022 in the Rambouillet forest in central France (south-west of Paris). Through automated analysis, several individual compounds and compound classes could be identified as tracers or markers for certain sources and events.

In order to identify anthropogenic marker compounds, the influence of wind direction has been investigated in this work. Samples were divided into two different subsets. Samples where the primary wind direction was coming over central Paris and the Seine river were in subset A (higher anthropogenic influence estimated), and samples where the primary wind direction was coming over rural France were in subset B (lower anthropogenic influence estimated). By applying K-Means clustering, a total of 30 individual compounds were found to be indicative of samples from subset A. As expected, the compounds were mainly nitrophenols and a whole compound class containing one sulphur atom (CnH2nSO5). Those compounds have also been found in earlier studies in anthropogenically influenced aerosol samples (Wang et al. 2021). Here, no information about the structure could be provided, so in this study, an inhouse developed algorithm was used to identify fragments of the individual compounds from FullMS/AIF measurements to yield structural information. That information indicated that the compounds do not possess a sulphate or sulfonate group but are rather a thiol. The identified compounds can be used as tracers for anthropogenic influences in future studies.

The influence of the diurnal cycle on the concentration of individual compounds was also studied, and by applying the same methods, compounds specific for night and day could be identified. Note that other factors (e.g. the diurnal cycle) can just as easily be investigated, completely depending on the desired information.

The presented analysis methods hugely benefit from the availability of large, continuous and high-quality datasets with accurate and detailed metadata. This ensures that smaller contributing factors can be identified with statistical significance. Although the provided dataset that was acquired during the ACROSS campaign is comparatively large, datasets acquired at different locations, during different seasons and with an increased time resolution might be beneficial for identifying more contributing factors with a higher statistical significance. We therefore aim to set up an easy-to-operate and low maintenance aerosol measurement station. This station will also be used to allow students to get hands on experience in atmospheric aerosol analysis and analytical techniques in general.

This poster presents the results and findings of the analysis of the ACROSS samples regarding aerosol marker classes for specific sources and atmospheric events. We thank Vincent Michoud and Chris Cantrellas co-organizers of the ACROSS 2022 campaign.

How to cite: Karbach, N., Pouyes-Artiguenave, P., Perraudin, E., Villenave, E., and Hoffmann, T.: Identification of anthropogenic marker compounds through LC/HRMS analysis of atmospheric organic aerosol from the ACROSS dataset: Development and method validation, EGU General Assembly 2026, Vienna, Austria, 3–8 May 2026, EGU26-16659, https://doi.org/10.5194/egusphere-egu26-16659, 2026.

EGU26-16702 | Posters on site | AS3.41

AI-Driven Toolset for High-Efficiency N2O/CH4/NH3 Open-path Gas Analyzer Plume Data Analysis 

Yuechen Zhao, Weihao Shen, Ruisheng Jiang, Ting-Jung Lin, and YIn Wang

Accurate characterization of greenhouse gas (CH4, N2O) and atmospheric pollutant (NH3) plumes is essential for quantifying point-source emission rates and understanding regional carbon-nitrogen cycles. However, current plume analysis workflows face significant bottlenecks. At the algorithmic level, plume identification, background subtraction, and feature extraction rely heavily on subjective manual expertise, hindering standardized and high-throughput outputs. At the data fidelity level, conventional closed-path systems suffer from signal desynchronization caused by the sorption kinetics of polar molecules (e.g., NH3) within sampling line, creating uncertainty in multi-species correlation analysis and source apportionment and resulting real-time decision-making during field campaigns.

To overcome these limitations, this study proposes an automated multi-species plume analysis framework driven by Generative AI. The innovation lies in an end-to-end mapping architecture that autonomously transforms multi-dimensional raw observation sequences into structured scientific insights. It integrates advanced recognition algorithms for plume signal stripping and high-precision emission rate inversion by fusing synchronized 3D wind fields, geospatial coordinates, and solar radiation data. Analytical performance is further enabled by high-fidelity input data acquired from a self-developed open-path quantum cascade laser (OP-QCL) spectrometer, which delivers inherently synchronized 10 Hz multi-species signals with inherent physical synchronization. This work eliminates the need for complex pre-processing of sampling artifacts at the hardware level, thereby increasing the efficiency of high-level feature extraction.

Field validation demonstrates that this AI-driven workflow achieves a paradigm shift in processing efficiency, reducing data interpretation time from hours to minutes. In industrial and wastewater treatment scenarios, the system captured transient fluctuations of CH4 (up to 7539 ppb) and NH3 (background increments of ~37 ppb). Leveraging the high temporal coherence between species (r = 0.62, p < 0.01; lag,±1 s), the AI successfully extracted representative source fingerprints (CH4/NH3 ratio ≈10), with inversion robustness verified through controlled release experiments. Notably, the real-time feedback supports an adaptive sampling strategy, enabling dynamic path adjustments during mobile monitoring to ensure high-fidelity capture of stochastic emission events. This integrated, intelligent framework fills a critical gap in real-time plume capturing and provides a robust digital toolset for industrial emission regulation and the realization of carbon-neutral goals.

How to cite: Zhao, Y., Shen, W., Jiang, R., Lin, T.-J., and Wang, Y.: AI-Driven Toolset for High-Efficiency N2O/CH4/NH3 Open-path Gas Analyzer Plume Data Analysis, EGU General Assembly 2026, Vienna, Austria, 3–8 May 2026, EGU26-16702, https://doi.org/10.5194/egusphere-egu26-16702, 2026.

EGU26-19615 | Posters on site | AS3.41

Advancing Global Harmonisation of Carbon and Methane Stable Isotope Measurements 

Christoph Nehrbass-Ahles and Abneesh Srivastava

There are still no commutable reference materials available at scale to support and harmonise the measurement of stable isotope ratios of greenhouse gases, and while calibration good practice guides exist, awareness and implementation remain limited. Together, these gaps are hampering progress toward global comparability of carbon (CO₂) and methane (CH₄) isotope data, amid growing expectations for accurate, traceable measurements that can stand as defensible evidence in regulatory and legal contexts. Under the initiative of the CCQM Task Group on Greenhouse Gas Isotope Ratio Metrology, the international community has taken coordinated steps to address these challenges and strengthen metrological support.

A first milestone was the Global Workshop on Harmonisation of Optical Isotope Ratio Analyser Calibration Practices, held in September 2025, which gathered over 100 experts from metrology institutes, atmospheric monitoring networks, and instrument manufacturers. The workshop addressed critical calibration and data harmonisation challenges and produced a list of user-driven recommendations for instrument manufacturers, encouraging implementation of new functionality to improve metrological traceability.

A second milestone was the launch of a global survey to map current CH₄ isotope measurement capabilities. Conducted under the CCQM GAWG/IRWG Task Group framework, the survey collected data from laboratories worldwide on their ability to measure and calibrate δ¹³C-CH₄ and δ²H-CH₄ in air and pure methane.

This presentation will share the outcomes of both activities. It will summarise the workshop recommendations for instrument manufacturers to enable transparent, traceable calibration workflows, and present the results of the global survey. These include examples such as strong consensus on the urgent need for traceable CH₄ reference materials at atmospheric amount fractions, and significant variation in calibration workflows, underscoring the need for harmonisation.

These findings provide the first global evidence base for prioritising development of isotopic reference materials and harmonised calibration guidelines. They also inform future work on establishing Calibration and Measurement Capabilities (CMCs) for CO2 and CH₄ isotopes at NMIs and DIs. By presenting these results, we aim to engage stakeholders in shaping the intended outcome of this international effort: building a robust metrological infrastructure to support accurate, comparable CO2 and CH₄ stable isotope measurements for science, policy, and legal accountability.

How to cite: Nehrbass-Ahles, C. and Srivastava, A.: Advancing Global Harmonisation of Carbon and Methane Stable Isotope Measurements, EGU General Assembly 2026, Vienna, Austria, 3–8 May 2026, EGU26-19615, https://doi.org/10.5194/egusphere-egu26-19615, 2026.

EGU26-20182 | Posters on site | AS3.41

Continuous methane isotope ratio δ13C(CH4) δ2H(CH4) at UK tall tower sites 

Christopher Rennick, Emmal Safi, Cameron Yeo, Freya Wilson, Dafina Kikaj, Edward Chung, and Tom Gardiner

Methane (CH4) is an attractive target for emissions reduction due to its short atmospheric lifetime and emission from distinct source sectors. The primary UK emissions are from the fossil fuel, agricultural and waste landfill sectors that have different δ13C(CH4) and δ2H(CH4) isotopic signatures. Top-down estimates of total emissions are already made using continuous measurements of CH4 amount fraction using a tall tower network and inversion modelling but there are limited observations for isotope ratio. Continuous measurements of the isotope ratio in atmospheric CH4 provide an additional observable to disaggregate the relative emissions by source sector.

NPL have developed Boreas, an automated cryogenic preconcentrator coupled to an optical isotope ratio spectrometer (OIRS). Boreas purifies CH4 from a ~5 L ambient air, removing air matrix gases and delivers a sample of CH4 in N2 at ~550 ppm to the spectrometer, improving measurement precision. The OIRS is calibrated using mixtures prepared gravimetrically from a single high-purity CH4 parent that has been characterised for δ13C and δ2H by mass spectrometry, and the measurements are referenced to a whole air working standard that is sampled in sequence with the air.

Boreas has been deployed to an atmospheric monitoring station and makes simultaneous measurements of δ13C(CH4) and δ2H(CH4) at hourly intervals, with a repeatability of 0.07‰ for δ13C(CH4) and 0.9‰ for δ2H(CH4). We will show results from four years of continuous measurements of δ13C(CH4) and δ2H(CH4) at a GAW regional station in the Southeast of England, and a new deployment in Scotland.

How to cite: Rennick, C., Safi, E., Yeo, C., Wilson, F., Kikaj, D., Chung, E., and Gardiner, T.: Continuous methane isotope ratio δ13C(CH4) δ2H(CH4) at UK tall tower sites, EGU General Assembly 2026, Vienna, Austria, 3–8 May 2026, EGU26-20182, https://doi.org/10.5194/egusphere-egu26-20182, 2026.

EGU26-20231 | Posters on site | AS3.41

A high-resolution regional CTDAS-WRF-Chem framework for constraining methane emissions over East Asia 

Mengrong Lu, Huilin Chen, Sander Houweling, and Klaus Hubacek

As a major methane hotspot, East Asia urgently requires high-resolution, reliable emission maps to support mitigation strategies. We applied and evaluated a regional inversion framework by coupling the CarbonTracker Data Assimilation Shell (CTDAS) with WRF-Chem. This framework was used to perform inversions across East Asia (13.3°N–49.3°N, 99.8°E–150.2°E) for 2022 based on ground-based atmospheric methane observations, using a 9 km nested grid focused on the Yangtze River Delta (YRD) in eastern China. Pseudo-observation tests show robust recovery of the prescribed “true” emissions across three well-constrained regions: the YRD, Korea, and northern Japan (≥37°N). Among eight tested parameters and input datasets, the number of ensemble member accounts for most of the uncertainty reduction. In the YRD sectoral inversion, major sources (fuel exploitation, waste, natural, and agricultural emissions) are effectively corrected, whereas minor contributors (<6%, livestock and others) remain weakly constrained. Based on the in-situ inversion, we find that prior methane emissions over East Asia are generally overestimated. In the YRD, posterior annual emissions are reduced by 8.4%–22.4% (0.13–0.35 Tg a⁻¹) relative to the prior across the four provinces. The prior appears to underestimate emissions in summer, whereas it overestimates emissions in the other seasons. The strongest seasonal adjustment occurs in winter, with reductions of 27.3%–39.6%. In other Asian regions, inversion output shows that EDGARv8 underestimates northern Japan by 8.3% and overestimates Korea by 8.6%. This study provides the first benchmark of the CTDAS–WRF-Chem system for East Asia. Future works will assimilate multiple observation types over a longer period to deliver more comprehensive reference for mitigation planning, especially in China.

How to cite: Lu, M., Chen, H., Houweling, S., and Hubacek, K.: A high-resolution regional CTDAS-WRF-Chem framework for constraining methane emissions over East Asia, EGU General Assembly 2026, Vienna, Austria, 3–8 May 2026, EGU26-20231, https://doi.org/10.5194/egusphere-egu26-20231, 2026.

EGU26-20685 | ECS | Posters on site | AS3.41

Metrological calibration approaches for atmospheric measurement of δ13C-CH4 employing CRDS 

Komal Yadav, Hamed Abbasi, and Javis Nwaboh

Accurate measurement of atmospheric greenhouse gases is essential for tracking emissions and assessing the effectiveness of mitigation strategies. Methane (CH4), a potent greenhouse gas with diverse sources, requires isotope analysis to determine its origin (e.g. biogenic, anthropogenic, thermogenic, etc.) in the atmosphere. Precise and consistent measurements of atmospheric δ13C-CH4 are critical for the source attribution and understanding global methane budget.

Cavity ring-down spectroscopy (CRDS) is a versatile technique for monitoring atmospheric δ13C in CH4, providing rapid, continuous measurements with high precision (better than 0.8 ‰). CRDS isotope ratio analyzers like the Picarro G2201 offer flexibility for both laboratory and field applications. However, δ13Cmeasurements can be affected by instrument biases, drift, concentration dependence and matrix gas effects. These challenges highlight the need for a careful and traceable calibration strategy to ensure accurate, reproducible, and comparable results.

There are two approaches to calibration laser spectroscopic isotope analyzers: (a) Isotope-ratio (δ-based) approach: Reference gases with assigned δ13C values, traceable to e.g. the Vienna Pee Dee Belemnite (VPDB) scale, are used to directly calibrate δ13C-CH4 (or CO2). Samples are measured between two reference gases in a bracketing sequence, which allows correction for short-term instrumental drift and assignment of δ values. This approach is most effective when sample and reference CH4 amount fractions (concentrations) are close. (b) Isotopologue approach: The amount fractions of individual isotopologue (¹²CH4 and ¹³CH4) are calibrated separately. δ13C-CH4 is then calculated from their ratio using the conventional delta notation relative to e.g. VPDB. This approach is well suited for measurements over a wider range of CH4 amount fractions.

In this work, we carefully evaluate the capabilities of both calibration approaches for δ13C measurement in CH4 (also for CO2), targeting field site application. We compare results from both approaches, assess their relative accuracy, precision and suitability for long term in situ atmospheric δ13C monitoring. Metrological data qualities, such as traceability of the results and Guide to the expression of uncertainty in measurement (GUM) complaint uncertainties evaluation, are addressed. The use of accurate and reliable reference gases traceable to the VPDB scale ensure that the isotope ratio measurements for CH4 (and CO2) are metrologically reliable to ensure comparability across instruments and laboratories.

References

  • 19ENV05 STELLAR; D5: Good practice guide for specification and application of OIRS for atmospheric measurements, including sample handling protocol, optimised analytical procedures, traceability to the international standards and target uncertainties (0.05 ‰ for δ13C-CO2 and δ18O-CO2).
  • Srivastava, A., ... & Nwaboh, J. (2025). Developing calibration and measurement capabilities for atmospheric CH4 stable isotope ratios at NMIs/DIs: metrology for global comparability. Metrologia62(3), 032001.

Acknowledgement  

This work was carried out within project 24GRD03-MetHIR, which has received funding from the European Partnership on Metrology, co-financed by the European Union’s Horizon Europe Research and Innovation Programme and by the Participating States.

How to cite: Yadav, K., Abbasi, H., and Nwaboh, J.: Metrological calibration approaches for atmospheric measurement of δ13C-CH4 employing CRDS, EGU General Assembly 2026, Vienna, Austria, 3–8 May 2026, EGU26-20685, https://doi.org/10.5194/egusphere-egu26-20685, 2026.

EGU26-21547 | ECS | Posters on site | AS3.41

Revealing Hidden Episodic Sources in Complex Urban Atmospheres: A Case Study of Firework Events during the ASIA-AQ Campaign 

Jian-Xian Wu, Ta-Chih Hsiao, Renyi Zhang, and Kouji Adachi

Accurate source characterization of particulate matter requires the simultaneous analysis of chemical composition and the ability to distinguish between continuous background emissions and transient episodic events. Traditional source apportionment methods, such as Positive Matrix Factorization (PMF), often smooth out short-term spikes when applied to long-term datasets, effectively "averaging" high-intensity episodes into stable source profiles. This limitation poses a significant challenge in complex Asian urban atmospheres, where specific pollution events can dominate short-term air quality deterioration yet remain obscured in annual averages.

This study utilizes high-time-resolution measurements of PM2.5 chemical composition collected during the 2024–2025 ASIA-AQ campaign in Southern Taiwan. We applied a dynamic source apportionment approach to resolve episodic sources that are typically difficult to identify using conventional long-term analysis.

Our analysis identifies distinct "firework-related emissions" factors that are strictly episodic. These factors were characterized by high loadings of Bismuth (Bi) and specific trace metal signatures. Results indicate that while these sources contribute minimally to the annual average PM2.5 mass, they are the dominant contributors (> 50%) during specific pollution episodes. Failing to isolate these episodic factors leads to the misattribution of pollution mass to other continuous sources, such as traffic or industrial emissions.

This study demonstrates that relying solely on long-term average source apportionment may underestimate the health risks associated with acute exposure events. The proposed event-driven analysis framework provides a more accurate scientific basis for targeted control strategies in highly polluted environments.

How to cite: Wu, J.-X., Hsiao, T.-C., Zhang, R., and Adachi, K.: Revealing Hidden Episodic Sources in Complex Urban Atmospheres: A Case Study of Firework Events during the ASIA-AQ Campaign, EGU General Assembly 2026, Vienna, Austria, 3–8 May 2026, EGU26-21547, https://doi.org/10.5194/egusphere-egu26-21547, 2026.

Mitigating methane emissions is widely regarded as one of the most cost-effective strategies for combating climate change. Achieving this goal requires a complementary and flexible combination of source attribution and quantification technologies with various minimum detection limits (MDLs) and spatial-temporal resolutions. Ground-based mobile monitoring (MOMO) offers advantages such as high temporal resolution, lower MDLs, and great source attribution capability in mixed-source environments. However, the lack of guidance on appropriate methodological choices have limited its integration into the broader “space–air–ground” methane monitoring framework, particularly for sources with diverse emission characteristics. Here, we present a comprehensive evaluation of MOMO techniques, including their advantages, limitations, quantification uncertainties, and MDLs. Building on this assessment, we propose a “Plus MOMO” strategy to address monitoring needs ranging from regional-scale source identification to source-level localization, while enabling discrimination between fossil-fuel and biogenic methane emissions. To support this approach, we developed a MOMO data integration and visualization platform designed to facilitate multi-source data fusion and interpretation. The “Plus MOMO” strategy has been applied in several in situ case studies, including methane leaks from rural natural gas usage in Beijing, emissions from high- and low-gas coal mines, and abandoned coal mines. Based on these applications, we advocate the development of standardized MOMO protocols and a “MOMO Plus” multi-source data integration framework to improve the accuracy and robustness of methane emission attribution and quantification.

How to cite: Lu, X. and Gao, L.: Methane Emissions Attribution and Quantification Based on “Plus Mobile Monitoring” Approach, EGU General Assembly 2026, Vienna, Austria, 3–8 May 2026, EGU26-22280, https://doi.org/10.5194/egusphere-egu26-22280, 2026.

EGU26-830 | ECS | Orals | AS3.43

Projections of PV energy production in the Eastern Mediterranean and Middle East during the 21st century: Assessing the role of atmospheric aerosols 

Nikolaos Papadimitriou, Ilias Fountoulakis, Kostas Douvis, Stergios Misios, Antonis Gkikas, Stelios Kazadzis, Andreas Kazantzidis, and Christos S. Zerefos

The Eastern Mediterranean and Middle East (EMME) region constitutes a critical domain for assessing the impact of atmospheric aerosols on solar photovoltaic (PV) power potential. The EMME region is characterized by exceptionally high solar resource availability and is affected by a variety of aerosol species transported from distant sources, while also hosting suspended particles of both anthropogenic and natural origin that are frequently recorded at high concentrations. Moreover, the Eastern Mediterranean, it is identified as a climate change hotspot, where projected changes in aerosol concentrations are expected to play a pivotal role. In this study, we analyze projections from the GFDL-ESM4 global climate model, participating in the 6th phase of the Coupled Model Intercomparison Project (CMIP6), to quantify the impact of aerosols’ and cloudiness’ spatiotemporal variability on PV power production in the EMME region, within the 21st century. To address this, we investigate trends and variability of radiation-related parameters – surface downwelling solar irradiance under all-sky and clear-sky conditions, under different Share Socioeconomic Pathways (SSP–based scenarios): SSP2-4.5, SSP3-7.0, SSP5-8.5. To simulate the PV power output, we employ the Global Solar Energy Estimator (GSEE), which incorporates a climate interface submodule designed to process gridded climate datasets with varying temporal resolutions, ranging from hourly to seasonal, as model input. Attenuation by cloudiness plays a significant role regarding future energy production, especially at the northernmost EMME regions. Nevertheless, the role of atmospheric aerosols is dominant during the sunniest months of the year, especially in the southeastern Mediterranean.

How to cite: Papadimitriou, N., Fountoulakis, I., Douvis, K., Misios, S., Gkikas, A., Kazadzis, S., Kazantzidis, A., and Zerefos, C. S.: Projections of PV energy production in the Eastern Mediterranean and Middle East during the 21st century: Assessing the role of atmospheric aerosols, EGU General Assembly 2026, Vienna, Austria, 3–8 May 2026, EGU26-830, https://doi.org/10.5194/egusphere-egu26-830, 2026.

EGU26-864 | ECS | Posters on site | AS3.43

Assessing aerosol-related uncertainties in satellite-based retrievals of effective UV doses for the production of cutaneous vitamin D.   

Theodora Stavraka, Ilias Fountoulakis, Kostas Eleftheratos, Panagiotis Nastos, Thomais Papazoi, Konstantinos Fragkos, Alkiviadis Bais, Katerina Garane, Andreas Kazantzidis, Alex Papayannis, Vassilis Amiridis, and Christos Zerefos

Solar Ultraviolet (UV) radiation plays a key role in many chemical and biological processes, and affects significantly human health. Excessive UV exposure may lead to adverse health effects, including sunburns, skin cancer, and cataracts, whereas moderate exposure is beneficial, e.g., by supporting vitamin D production and promoting mental well-being, among other benefits. UV radiation interacts with various atmospheric components before reaching the Earth’s surface. Photons with shorter wavelengths are absorbed at higher atmospheric layers by oxygen and tropospheric ozone, and practically only UV-A and a small part of the UV-B irradiance reach the troposphere. In the troposphere, UV is scattered by air molecules and is further attenuated by aerosols and clouds. Interactions between UV radiation and aerosols are not yet completely understood, and their parameterization constitutes a major uncertainty factor in models and satellite retrieval algorithms. Understanding these interactions is thus essential for accurately assessing UV exposure using modeled UV irradiance.

Τhe purpose of this study is to evaluate satellite- and reanalysis-based retrievals of the effective dose for the cutaneous vitamin D synthesis using ground-based measurements over Athens and Thessaloniki, Greece. We evaluate data that are derived (1) using the methodology described in Fragkos et al., (2024, https://doi.org/10.3390/rs16111878), based on CAMS information in combination with satellite data from OMI and MSG, and (2) the UV climatology of which is also based on data from various sensors analyzing air quality. Ground-based spectral solar UV irradiance measurements performed with a MKIV single monochromator Brewer spectrophotometer in Athens, and a MKIII double monochromator Brewer spectrophotometer in Thessaloniki are used to validate the Satellite-based retrievals. AOD measurements from co-located CIMEL sun-photometers, part of the AERONET network are used to assess the effect of aerosols. The evaluation has been performed for the period 2004 - 2024. Further analysis yielded positive trends in the effective dose for vitamin D production in the last two decades, mainly due the decreasing trends in aerosols.  

How to cite: Stavraka, T., Fountoulakis, I., Eleftheratos, K., Nastos, P., Papazoi, T., Fragkos, K., Bais, A., Garane, K., Kazantzidis, A., Papayannis, A., Amiridis, V., and Zerefos, C.: Assessing aerosol-related uncertainties in satellite-based retrievals of effective UV doses for the production of cutaneous vitamin D.  , EGU General Assembly 2026, Vienna, Austria, 3–8 May 2026, EGU26-864, https://doi.org/10.5194/egusphere-egu26-864, 2026.

EGU26-3052 | ECS | Orals | AS3.43 | Highlight

Effect of stratospheric aerosol injection scenarios on surface irradiation and solar energy production 

Kevin Kilchhofer, Kyriaki Papachristopoulou, Manouk Geurts, Timofei Sukhodolov, and Stelios Kazadzis

This study aims to quantify how different stratospheric aerosol injection (SAI) scenarios influence clear-sky (cloudless) surface solar radiation (SSR) by applying benchmark radiative transfer calculations. SAI is a solar radiation modification (SRM) method, which is increasingly viewed as a potential backstop against global warming. If SRM techniques are implemented in the future, it will be important to understand their potential financial and societal implications, particularly with respect to reduced solar energy production. Currently, there is limited understanding of how SRM might influence photovoltaic (PV) power generation or which measures could effectively counteract potential declines in SSR.

We obtain SSR estimates of a reference and SAI scenarios using the libRadtran radiative transfer model [1, 2]. The SAI scenarios include an aerosol layer of different solid and liquid materials, including sulfuric acid, diamonds, alumina, and calcite aerosol particles. The optical properties of these particles were determined with the Mie scattering module in libRadtran, using the physical parameters reported in Vattioni et al., 2024 [3] and Hummel et al., 1988 [4]. We performed radiation simulations using location-specific ambient tropospheric composition profiles obtained from the Copernicus Atmosphere Monitoring Service (CAMS). We calculated it for a reference and specified SAI scenarios and for different solar PV geometries (azimuthal orientation and tilting angles).

In summary, the results reveal a slight negative percentage difference (3-12%) for low solar zenith angles (sza < 60°) of the direct horizontal irradiance component when applying an aerosol optical depth of 0.07 for all SAI scenarios. Interestingly, the differences are larger for solid particles (e.g., diamond) and increase further at higher sza values. On average, the diffuse fraction of the irradiance is about 40% higher with an SAI layer than in the reference case, increasing from roughly 110 Wm−2 to 150 Wm−2. The data will be supplied for PV energy production simulations as a function of the PV material, and the resulting outputs will offer valuable insight into how SAI could alter the Earth’s radiation budget.

This work was supported by ESA as part of the 'STATISTICS' project.

(1) Mayer, B.; Kylling, A. Atmospheric Chemistry and Physics 2005, 5, 1855–1877.
(2) Emde, C.; Buras-Schnell, R.; Kylling, A.; Mayer, B.; Gasteiger, J.; Hamann, U.; Kylling, J.; Richter, B.; Pause, C.; Dowling, T.; Bugliaro, L. Geoscientific Model Development 2016, 9, 1647–1672.
(3) Vattioni, S.; Käslin, S. K.; Dykema, J. A.; Beiping, L.; Sukhodolov, T.; Sedlacek, J.; Keutsch, F. N.; Peter, T.; Chiodo, G. Geophysical Research Letters 2024, 51, DOI: 10.1029/2024GL110575.
(4) Hummel, J. R.; Shettle, E. P.; Longtin, D. R. A New Background Stratospheric Aerosol Model for Use in Atmospheric Radiation Models; tech. rep.; OptiMetrics, Inc., 1988.

How to cite: Kilchhofer, K., Papachristopoulou, K., Geurts, M., Sukhodolov, T., and Kazadzis, S.: Effect of stratospheric aerosol injection scenarios on surface irradiation and solar energy production, EGU General Assembly 2026, Vienna, Austria, 3–8 May 2026, EGU26-3052, https://doi.org/10.5194/egusphere-egu26-3052, 2026.

EGU26-4530 | Posters on site | AS3.43

Spectral Radiative Effects of Extreme Wildfire Aerosols at the Izaña High-Altitude Observatory 

García Rosa D., Barreto África, Cachorro Revilla Victoria E., González-Sicilia Pablo, León Luis Sergio, Álvarez Hernández Ayoze, Bustos Juan José, Ramos Ramón, Almansa Fernando, Álvarez Losada Óscar, González Ramos Yenny, Rivas Pedro Pablo, and Torres García Carlos

High-altitude observatories play a key role in monitoring background atmospheric composition and radiation, yet they are increasingly affected by extreme wildfire plumes. In August 2023, an intense wildfire on Tenerife (Canary Islands, Spain) reached the immediate surroundings of the Izaña Observatory, creating an exceptional near-source observational configuration at a high-altitude mountain site. This event provides a rare opportunity to investigate the spectral radiative effects of freshly emitted biomass-burning aerosols under extreme loading conditions in a clean-background environment. During the most intense phase of the episode, aerosol optical depth reached exceptionally high values, while the Ångström Exponent remained consistently elevated, indicating a strong dominance of fine-mode smoke particles. Spectral measurements of global, direct-normal and diffuse solar irradiance across the ultraviolet to near-infrared range reveal a strong attenuation of the direct solar component and a pronounced enhancement of diffuse radiation, particularly in the visible spectrum. Relative to clean-sky conditions, daily global irradiance experienced a substantial reduction, while direct-normal irradiance was strongly suppressed, in some cases approaching complete extinction. Surface aerosol radiative forcing and radiative forcing efficiency were quantified using radiative transfer simulations assuming pristine atmospheric conditions as reference. The resulting shortwave radiative forcing indicates intense surface cooling, largely driven by aerosol scattering processes. Maximum forcing and efficiency occurred in the visible spectral range, consistent with the optical properties of freshly emitted smoke aerosols. Despite a reduction in aerosol loading during the later stage of the event, radiative forcing efficiency remained comparable or slightly enhanced, reflecting changes in aerosol optical properties and solar geometry. Concurrent increases in particle concentrations, black carbon and trace gases confirm the direct impact of the wildfire plume on atmospheric composition at the observatory. These results demonstrate how extreme wildfire events can temporarily disrupt radiative and compositional conditions at high-altitude background sites and highlight the importance of accurately representing fine-mode smoke aerosols in radiative transfer and climate models.

How to cite: Rosa D., G., África, B., Victoria E., C. R., Pablo, G.-S., Sergio, L. L., Ayoze, Á. H., Juan José, B., Ramón, R., Fernando, A., Óscar, Á. L., Yenny, G. R., Pedro Pablo, R., and Carlos, T. G.: Spectral Radiative Effects of Extreme Wildfire Aerosols at the Izaña High-Altitude Observatory, EGU General Assembly 2026, Vienna, Austria, 3–8 May 2026, EGU26-4530, https://doi.org/10.5194/egusphere-egu26-4530, 2026.

EGU26-4834 | Orals | AS3.43

Assessing Inversion Products Differences in co-Located SKYNET and AERONET Sites 

Monica Campanelli, Gaurav Kumar, Victor Estelles, Lionel Doppler, Francesca Barnaba, AnnaMaria Iannarelli, Annalisa Di Bernardino, Hitoshi Irie, and Elea Gomila

Continuous observations at high spatial and temporal resolutions over the globe are necessary to characterise the high variability of atmospheric aerosol in space and time. At the global scale, two of the most widely used photometer networks for aerosol studies, operating since the end of 90’s, are SKYNET (Nakajima et al., 2020) and AERONET (AErosol ROboc NETwork; Holben et al., 1998). Both the networks provide, in near real time, day and night columnar aerosol optical and physical properties, with open access from their respective websites. The official instruments are robotic multichannel radiometers produced by PREDE and CIMEL, respectively. Both instruments measure solar (and lunar for some of them) direct irradiance and the angular distribution of sky diffuse radiation. Over the last decades, both  networks have been supported by space agencies, as they represent essential tools for Fiducial Reference Measurements  for  satellite aerosol retrievals (e.g. Sentinel-3, TROPOMI, EarthCare). However, recent comparisons of the respective aerosol retrievals (e.g., Khatri et al., 2016; Nakajima et al., 2020; Kudo et al., 2021) revealed discrepancies in some products. This study aims to analyse common long-term datasets from both the  SKYNET and AERONET instruments, at selected sites where the two instruments operate co-located: downtown Rome and Rome-Tor Vergata (Italy), Valencia (Spain), Lindenberg (Germany) and Chiba (Japan). All inversion products from simultaneous co-located measurements will be compared, and potential discrepancies will be investigated. In particular,  we will focus on Single Scattering Albedo, complex Refractive Index, Asymmetry Factor, volume Size Distribution, Depolarization and Lidar Ratios, precipitable water vapour content and diurnal and nocturnal (where available) Aerosol Optical Depths (AOD). For all  products, a statistical analysis of the differences will be carried out across different AOD classes using both AERONET Level 1.5 and 2.0  and SKYNET Level 2 datasets.  The influence of meteorological parameters (e.g.  relative humidity, wind direction and intensity, and ambient temperature) will also be evaluated. Finally, the climatology of some aerosol products from both networks will be compared.

How to cite: Campanelli, M., Kumar, G., Estelles, V., Doppler, L., Barnaba, F., Iannarelli, A., Di Bernardino, A., Irie, H., and Gomila, E.: Assessing Inversion Products Differences in co-Located SKYNET and AERONET Sites, EGU General Assembly 2026, Vienna, Austria, 3–8 May 2026, EGU26-4834, https://doi.org/10.5194/egusphere-egu26-4834, 2026.

EGU26-4897 | ECS | Orals | AS3.43

Synthetic Validation of a GRASP Inversion Strategy Combining CE376 Lidar and CE318-T Photometer Measurements 

Pablo González-Sicilia, Roberto Román, África Barreto, Yenny González, Celia Herrero del Barrio, Rosa D. García, A. Fernando Almansa, and Óscar Álvarez-Losada

The complex interactions of atmospheric aerosols with solar radiation and clouds represent a major source of uncertainty in atmospheric effective radiative forcing. These interactions are driven by aerosol optical and microphysical properties and depend critically on their spatial and vertical distribution. Consequently, obtaining accurate measurements with high spatial and temporal resolution is essential for improving climate models and reducing uncertainty. To this end, remote sensing techniques are employed globally from both space-borne and ground-based platforms. While space-borne instruments provide superior spatial and temporal coverage, ground-based techniques offer more limited spatial extent but higher measurement quality and precision.

However, both techniques measure optical quantities that depend on aerosol properties, which necessitates the use of inversion algorithms to retrieve these underlying characteristics. Among ground-based techniques, sun-sky-lunar photometers and lidars are two of the most prominent instruments, and inversion methods have been developed and applied to each separately. For instance, the AERONET inversion algorithm for photometers employs both aerosol optical depth (AOD) and sky radiance measurements at multiple viewing geometries across four wavelengths to retrieve the aerosol volume size distribution and complex refractive index. For lidars, methods as the Klett-Fernald and Raman enable the retrieval of vertically resolved aerosol properties. Nevertheless, each technique has inherent limitations: while sun photometer inversions can retrieve both optical and microphysical properties, they lack vertical resolution due to the column-integrated nature of their measurements. Conversely, lidar-based methods provide excellent vertical resolution but often rely on assumptions or ancillary data.

Consequently, the combined use of photometers and lidar systems offers the potential to provide complete and robust characterization of vertically resolved aerosol properties. To this end, numerous inversion algorithms have been developed that combine sun-sky-lunar photometers with low-power lidar systems to retrieve both columnar and vertically resolved aerosol optical and microphysical properties. This approach benefits from enhanced spatial and temporal coverage due to the widespread availability of both instrument types. Among these algorithms, GARRLiC (Now integrated into the GRASP algorithm) stands out as a flexible option capable of being applied to a wide range of photometers and lidar configurations, providing both intensive and extensive aerosol properties for two aerosol modes in the atmospheric column and with vertical resolution when the lidar system includes multiple wavelengths or polarization channels.

This study presents a synthetic evaluation of a GRASP-based inversion combining AOD and sky radiance observations (440, 675, 870, and 1020 nm) from a CE318-T sun-sky-lunar photometer with dual-wavelength elastic lidar measurements (532 and 808 nm) from a CE376 micro-pulse lidar to retrieve both columnar and vertically resolved optical and microphysical properties for two aerosol modes (fine and coarse). Our methodology involves generating synthetic observations from selected aerosol properties, adding realistic noise based on reported uncertainties, performing GRASP inversions, and comparing retrieved parameters with input values under diverse aerosol loadings and viewing geometries. This framework provides comprehensive characterization of the algorithm's performance, accuracy, and sensitivity, validating the method for operational application.

How to cite: González-Sicilia, P., Román, R., Barreto, Á., González, Y., Herrero del Barrio, C., García, R. D., Almansa, A. F., and Álvarez-Losada, Ó.: Synthetic Validation of a GRASP Inversion Strategy Combining CE376 Lidar and CE318-T Photometer Measurements, EGU General Assembly 2026, Vienna, Austria, 3–8 May 2026, EGU26-4897, https://doi.org/10.5194/egusphere-egu26-4897, 2026.

EGU26-5430 | ECS | Posters on site | AS3.43

Retrieval of Solar Shortwave Irradiance from All-Sky Camera Images 

Daniel González-Fernández, Roberto Román, David Mateos, Celia Herrero del Barrio, Victoria E. Cachorro, Gustavo Copes, Ricardo Sánchez, Rosa D. García, Lionel Doppler, Sara Herrero-Anta, Juan Carlos Antuña-Sánchez, África Barreto, Ramiro González, Javier Gatón, Abel Calle, Carlos Toledano, and Ángel de Frutos

A convolutional neural network (CNN) based model, named CNN-CMF, is proposed to estimate solar shortwave global horizontal irradiance (GHI) from daytime all-sky camera images by retrieving the cloud modification factor (CMF). This work explores the use of all-sky cameras as an additional observational resource for solar radiation studies. The model has been trained and tested using a total of 237,669 sky images paired with pyranometer GHI measurements from Valladolid and Izaña (Spain) and Lindenberg (Germany). A comparison between model results and pyranometer data shows a high determination coefficient (R²) of 0.99 for the test dataset. Statistical metrics show a mean bias error (MBE) of −2% and a standard deviation (SD) of 9%, indicating a slight underestimation of the model. The generalization capability of the model was examined using independent measurements from the Antarctic station of Marambio, which was not included in the training dataset. The retrieved GHI values remained a high correlation, with an R² of 0.95. The statistical metrics show at this location a small overestimation of the model GHI values (MBE ≈ 2%), increasing the uncertainty in the precision of the model (SD ≈ 26%). The model results present an improvement when daily irradiation values (GHId) are retrieved. These results show a performance of the model yielding MBE and SD values of approximately 3% and 11%, respectively, and an R² value up to 0.99.

This work was supported by the Ministerio de Ciencia e Innovación (MICINN), with the grant no. PID2024-157697OB-I00 and TED2021-131211B-I00375. Financial support of the Department of Education, Junta de Castilla y León, and FEDER Funds is acknowledged (CLU-2023-1-05). This work was funded by European Comision through the EUBURN-RISK project (INTERREG-SUDOE; S2/2.4/F0327). The authors acknowledge the support of COST Action CA21119 HARMONIA and the Spanish Ministry for Science and Innovation to ACTRIS ERIC and the Marie Sklodowska-Curie Staff Exchange Actions with the project GRASP-SYNERGY (grant no. 10 101131631).

González-Fernández, D., Román, R., Mateos, D., Herrero del Barrio, C., Cachorro, V.E., Copes, G., Sánchez, R., García, R.D., Doppler, L., Herrero-Anta, S., et al. (2024). Remote Sensing, 16, 3821.

How to cite: González-Fernández, D., Román, R., Mateos, D., Herrero del Barrio, C., Cachorro, V. E., Copes, G., Sánchez, R., García, R. D., Doppler, L., Herrero-Anta, S., Antuña-Sánchez, J. C., Barreto, Á., González, R., Gatón, J., Calle, A., Toledano, C., and de Frutos, Á.: Retrieval of Solar Shortwave Irradiance from All-Sky Camera Images, EGU General Assembly 2026, Vienna, Austria, 3–8 May 2026, EGU26-5430, https://doi.org/10.5194/egusphere-egu26-5430, 2026.

EGU26-6009 | Posters on site | AS3.43

Dust optical properties in the UV 

Miguel Huerta Gómez, Alkiviadis Bais, Alberto Redondas, Daniela Meloni, Ilias Fountoulakis, Alcide di Sarra, Katerina Garane, Stelios Kazadzis, and Martin WIld

Ultraviolet (UV) radiation has a major impact not only on human health (e.g., vitamin D synthesis, erythema, and skin and eye diseases) but also on the Earth’s environment, influencing all living organisms and interacting chemically with various commonly used materials. For these reasons, accurately measuring UV radiation and understanding its response to atmospheric changes—its primary modulator and the medium responsible for the largest variations in the UV flux reaching the surface—are of great importance. 

Aerosols, particularly mineral dust, exert significant effects on solar radiation by scattering or absorbing it, thereby contributing to atmospheric cooling or warming, respectively. Several optical properties govern these effects, including the Single Scattering Albedo (SSA), the refractive index, and the Absorption Aerosol Optical Depth (AAOD). Previous studies have shown that dust optical properties in the UV range, are linked to enhanced absorption, which is linked to the mineralogical composition of the particles. However, NASA’s Aerosol Robotic Network (AERONET), one of the main global sources of aerosol data, does not provide inversion products (such as SSA and the imaginary part of the refractive index, k) at UV wavelengths. Consequently, there remains limited knowledge regarding dust effects on UV radiation. This work therefore aims to deepen the understanding of the absorption properties of dust aerosols in the solar UV range. Knowing these properties especially in dust events that are commonly linked with moderate to high aerosol optical depth is essential for the determination of UV e.g. in UV Index forecasting models. 

To achieve this objective, a multi-instrumental approach will be employed using ground-based solar radiometers located at key stations influenced by major global dust sources (namely the Sahara, the Arabian Desert, and the arid regions of Western and Central Asia). 

Acknowledgements: This work is supported by the Marie Curie Doctoral Network project (GA101168425), Dust-DN and by the COST Action HARMONIA CA21119, supported by COST (European Cooperation in Science and Technology).

How to cite: Huerta Gómez, M., Bais, A., Redondas, A., Meloni, D., Fountoulakis, I., di Sarra, A., Garane, K., Kazadzis, S., and WIld, M.: Dust optical properties in the UV, EGU General Assembly 2026, Vienna, Austria, 3–8 May 2026, EGU26-6009, https://doi.org/10.5194/egusphere-egu26-6009, 2026.

Accurate retrieval of atmospheric carbon dioxide from ground-based solar spectral measurements in the near-infrared spectral range requires precise characterisation of interfering absorbers, such as atmospheric water vapour and aerosols. In the near-infrared spectral region, water vapour absorption strongly overlaps with carbon dioxide (CO₂) features, which is making reliable carbon dioxide retrieval highly sensitive to uncertainties in the integrated water vapour (IWV) column.

The primary objective of this work is the development of a robust CO₂ retrieval algorithm using compact spectroradiometers with moderate spectral resolution; however, as a critical prerequisite, an accurate water vapour retrieval framework must be established.

In this study, IWV is retrieved from direct solar spectral irradiance measured by a compact Bi-Tec Sensor (BTS) spectroradiometer using an optimised wavelength selection approach. The optimum wavelengths were identified through synthetic radiative transfer simulations covering a wide range of atmospheric conditions at Davos, Switzerland. Wavelengths exhibiting strong water vapour sensitivity and high stability across seasons were selected and subsequently applied to real atmospheric measurements. The resulting BTS-derived IWV algorithm was evaluated against co-located GPS IWV (AGNES) observations and compared with AERONET IWV retrievals.

The formulated BTS IWV retrieval algorithm exhibits good agreement with GPS (AGNES) measurements, with a mean bias of -1.01 mm and a standard deviation of 0.80 mm over the analysed period. In comparison, the co-located AERONET IWV retrieval shows a larger mean bias of -2.60 mm and higher residual variability of 1.82 mm, indicating the BTS-based algorithm improved stability and accuracy of water vapour retrieval. These results demonstrate that the careful selection of physically meaningful and spectrally stable wavelengths identified through synthetic radiative-transfer modelling and subsequently applied to real atmospheric measurements leads to a substantial improvement in retrieval performance.

Building on this validated water vapour retrieval, ongoing work focuses on integrating the IWV product into a CO₂ retrieval framework in the 1.6 µm to 2 µm spectral region. The established IWV retrieval provides a critical constraint for reducing systematic errors and improving the robustness of CO₂ estimation from compact spectroradiometers.

How to cite: Jaine, D. and Groebner, J.: Atmospheric trace gas retrievals and monitoring using a medium-resolution spectroradiometer , EGU General Assembly 2026, Vienna, Austria, 3–8 May 2026, EGU26-6187, https://doi.org/10.5194/egusphere-egu26-6187, 2026.

EGU26-6742 | ECS | Posters on site | AS3.43

 Evaluation and advancement of the SKYNET Improved Langley Plot method in the Mediterranean area 

Gaurav Kumar, Masahiro Momoi, Monica Campanelli, Meritxell Garcia-Suñer, Víctor Estellés, and Rei Kudo

Accurate calibration of the Sun-sky radiometers is essential for the reliable retrieval of the aerosol optical properties. The standard Langley plot (Shaw, 1983) method is widely used to calibrate Sun-sky radiometers. Although it provides us with the most reliable calibration, the instrument has to be transported to a pristine location at high altitude to perform this procedure. An improved Langley method (ILP) was proposed by Nakajima et al. (1996) and Campanelli et al. (2004) to address this issue. Currently, ILP is widely used for PREDE POM radiometers in the SKYNET. In ILP, the Sun-sky radiometer can be calibrated on site without requiring transport to high altitude. Radiance data in the almucantar plane is used to obtain the AOD using Skyrad 4.2 (Nakajima et al., 1996). Later, this AOD is used to calculate the calibration value. Because the AOD is allowed to vary, unlike the Standard Langley plot method, which assumes AOD is constant, the calibration can be obtained even at non-ideal sites.  

In this study, we upgrade the Improved Langley plot (method) by replacing the old Skyrad 4.2 inversion algorithm with the latest Skyrad MRI v2 (Kudo et al., 2021). Skyrad MRI v2 employs an optimisation of the inversion technique similar to the one used by the AERONET network. It also employs a dynamic cost function rather than the static cost function used in Skyrad 4.2. Moreover, it can handle non-spherical particles. Overall, Skyrad MRI v2 helps ILP obtain a more accurate AOD, enabling a better estimate of the calibration constant. We also propose a modification to the ILP method that uses an iterative method to calculate the calibration value. We used the data from the QUAlity and TRaciability of Atmospheric aerosol Measurements (QUATRAM, www.euroskyrad.net/quatram) campaigns and from the Skynet sites of Burjassot and Valencia, and showed that the upgraded ILP method using the iterative method improved the calibration values. The comparison of the direct AOD computed using the new calibration with co-located AERONET and PFR measurements showed an increase in the number of points in agreement within the WMO limits imposed for AOD. The mean difference in direct AOD is also reduced to within ±0.01, indicating improved consistency. The improvement was significant for wavelengths below 500 nm, whereas it was minor for wavelengths at or above 500 nm. This indicates the robustness of the ILP at longer wavelengths. At the same time, this highlights the need for a more robust approach at shorter wavelengths, which is addressed by the proposed methodology.

Acknowledgement

The current analysis has been done in the frame of the COST Action CA21119 HARMONIA, supported by COST (European Cooperation in Science and Technology). The Spanish Ministry of Economy and Competitiveness also funded the research through project PID2022-138730OB-I00. The participation of G. Kumar has been supported by the Santiago Grisolia program fellowship GRI-SOLIAP/2021/048. We thank AERONET, PHOTONS and SKYNET for their scientific and technical support

How to cite: Kumar, G., Momoi, M., Campanelli, M., Garcia-Suñer, M., Estellés, V., and Kudo, R.:  Evaluation and advancement of the SKYNET Improved Langley Plot method in the Mediterranean area, EGU General Assembly 2026, Vienna, Austria, 3–8 May 2026, EGU26-6742, https://doi.org/10.5194/egusphere-egu26-6742, 2026.

EGU26-8253 | Posters on site | AS3.43

Retrieval of nighttime AOD values with all-sky cameras 

Roberto Roman, Daniel Gonzalez-Fernández, Juan Carlos Antuña-Sanchez, Celia Herrero del Barrio, Sara Herrero-Anta, África Barreto, Victoria E. Cachorro, Lionel Doppler, Ramiro González, Christoph Ritter, David Mateos, Natalia Kouremeti, Gustavo Copes, Abel Calle, María José Granados-Muñoz, Carlos Toledano, and Ángel M. de Frutos

Measuring aerosol properties such as aerosol optical depth (AOD) at nighttime is crucial for understanding the overall impact of aerosols on climate, especially during polar night. Nocturnal AOD measurements can be obtained using Moon photometers; however, the Moon is not present throughout the entire night, resulting in a lack of AOD observations during more than half of the nighttime period. Star photometers, which use different stars as targets, can fill this gap. Nevertheless, only a few star photometers are currently operating worldwide, as they are expensive instruments and present several challenges for unattended operation.

Within this framework, this study explores the use of all-sky cameras, capable of capturing images of the entire sky vault, to extract the incoming irradiance of several visible stars and use this information to retrieve nighttime AOD both under Moon presence and during Moon-free periods. A new methodology to extract star irradiances from all-sky camera images is proposed, together with a Langley-plot technique to estimate AOD from these irradiances (Román et al., 2025). The resulting AOD values were calculated at several locations and compared with Moon photometer measurements. The comparison shows a high correlation between both datasets at all sites. On average, the proposed method overestimates Moon photometer AOD values by approximately 0.02, with a precision of about 0.03–0.04.

These results indicate that all-sky cameras could provide a viable solution to fill the nighttime AOD observation gap on a global scale, owing to their low cost and fully automatic operation.

How to cite: Roman, R., Gonzalez-Fernández, D., Antuña-Sanchez, J. C., Herrero del Barrio, C., Herrero-Anta, S., Barreto, Á., Cachorro, V. E., Doppler, L., González, R., Ritter, C., Mateos, D., Kouremeti, N., Copes, G., Calle, A., Granados-Muñoz, M. J., Toledano, C., and de Frutos, Á. M.: Retrieval of nighttime AOD values with all-sky cameras, EGU General Assembly 2026, Vienna, Austria, 3–8 May 2026, EGU26-8253, https://doi.org/10.5194/egusphere-egu26-8253, 2026.

EGU26-11157 | Posters on site | AS3.43

Extreme Aerosol Loadings from Iberian Peninsula Wildfires  

David Mateos, Celia Herrero del Barrio, Roberto Román, Daniel González-Fernández, Sara Herrero-Anta, Ramiro González, Bruno Longarela, Javier Gatón, Abel Calle, Carlos Toledano, Victoria Cachorro, and Angel de Frutos

Large wildfire episodes can substantially perturb regional aerosol loads and atmospheric composition; however, their quantitative impact remains difficult to constrain due to uncertainties in fire emissions, plume rise, and aerosol properties. During August 2025, exceptionally intense wildfire events affected large areas of the Iberian Peninsula, leading to severe aerosol emissions, reduced visibility, and pronounced air-quality degradation over extensive regions. In this study, we investigate these events by ground-based aerosol observations from CAECENET, an automatic system that retrieves vertically-resolved and column-integrated aerosol properties by applying the GRASP (Generalized Retrieval of Atmosphere and Surface Properties) inversion algorithm to combined sun–sky photometer and ceilometer measurements (Román et al. 2018).

The atmospheric aerosol emissions are primarily characterized at several sites in Spain and Portugal, including Valladolid, Madrid, Badajoz, Évora, and Granada. This network provides continuous measurements of optical and microphysical aerosol properties, enabling detailed monitoring of aerosol optical depth (AOD), fine and coarse mode contributions, and temporal evolution during the episodes. In addition, information on aerosol vertical distribution and plume heights is analyzed to assess the altitude at which fire related aerosols were injected and transported.

Satellite based fire products from the Global Fire Assimilation System (GFAS) and surface European Monitoring and Evaluation Programme (EMEP) data are used to complement this analysis.

This study highlights the value of dense ground-based aerosol networks such as CAECENET for monitoring extreme wildfire impacts, providing essential information to complement satellite observations and models, and for the assessment of the radiative effects of fire-emitted aerosols.

This work was supported by the Ministerio de Ciencia e Innovación (MICINN), with the grant no. PID2024-157697OB-I00. This work is part of the project TED2021-131211B-I00375 funded by MCIN/AEI/10.13039/501100011033 and European Union, “NextGenerationEU”/PRTR, is based on work from COST Action CA21119 HARMONIA and the Marie Sklodowska-Curie Staff Exchange Actions with the project GRASP-SYNERGY (grant no. 10 101131631). Financial support of the Department of Education, Junta de Castilla y León, and FEDER Funds is gratefully acknowledged (Reference: CLU-2023-1-05). This work was funded by European Comision through the EUBURN-RISK project (INTERREG-SUDOE; S2/2.4/F0327). The authors acknowledge the support of the Spanish Ministry for Science and Innovation to ACTRIS ERIC.

Román, R. et al., 2018: Retrieval of aerosol profiles combining sunphotometer and ceilometer measurements in GRASP code, Atmospheric Research, 204, 161-177.

How to cite: Mateos, D., Herrero del Barrio, C., Román, R., González-Fernández, D., Herrero-Anta, S., González, R., Longarela, B., Gatón, J., Calle, A., Toledano, C., Cachorro, V., and de Frutos, A.: Extreme Aerosol Loadings from Iberian Peninsula Wildfires , EGU General Assembly 2026, Vienna, Austria, 3–8 May 2026, EGU26-11157, https://doi.org/10.5194/egusphere-egu26-11157, 2026.

EGU26-11648 | ECS | Posters on site | AS3.43

Atmospheric aerosols in the Southern European Alps: Long-term SKYNET observations and synergy with AERONET at the Aosta–Saint-Christophe station, Italy 

Annachiara Bellini, Claudia Desandré, Monica Campanelli, Africa Barreto, Ramiro González Catón, Francesca Barnaba, and Henri Diémoz

Quantifying variations of the aerosol load and characteristics in the Southern European Alps is crucial for distinguishing local from Po Basin and broader synoptic contributions. This work presents long-term observations from the Aosta-Saint Christophe Observatory (570 m a.s.l.), focusing on the analysis of the SKYNET Prede POM-02 dataset (operational since 2012) and its synergy with a recently installed AERONET Cimel CE318-TS9 (since 2023). We present long-term aerosol trends derived from the POM series and discuss their relationship with air quality policies and atmospheric circulation changes. Furthermore, we analyze the consistency between SKYNET and AERONET products during the overlapping period, discussing harmonization procedures in light of instrumental differences and retrieval assumptions. The ultimate aim is to derive a harmonized climatology to establish a robust baseline for the region and to support future experimental campaigns deploying distributed photometers to investigate aerosol gradients across the Alpine valley.

How to cite: Bellini, A., Desandré, C., Campanelli, M., Barreto, A., González Catón, R., Barnaba, F., and Diémoz, H.: Atmospheric aerosols in the Southern European Alps: Long-term SKYNET observations and synergy with AERONET at the Aosta–Saint-Christophe station, Italy, EGU General Assembly 2026, Vienna, Austria, 3–8 May 2026, EGU26-11648, https://doi.org/10.5194/egusphere-egu26-11648, 2026.

EGU26-12178 | ECS | Posters on site | AS3.43

Analysis of SKYNET derived AOD during the FRC VI campaign in Davos, and validation of improved data processing and calibration algorithms  

Meritxell Garcia-Suñer, Gaurav Kumar, Víctor Estellés, María Pilar Utrillas, Monica Campanelli, Natalia Kouremeti, Ramiro González, Angelos Karanikolas, Luc Blarel, and África Barreto

The 6th Filter Radiometer Comparison campaign for Aerosol Optical Depth (AOD) measurements was held from 20th of September to 10th (extended to 17th) of October 2025 in Davos (Switzerland). This campaign was organised by the PMOD/WRC and supported by the World Meteorological Organisation. For AOD measurements, groups with sun-photometers and spectroradiometers participated, including reference instruments representing several major global networks (such as the Cimel-CE318T, belonging to AERONET; the Prede-POM 1 and 2, which are the instruments used by SKYRAD; and the Precision Filter Radiometers, PFRs, that belong to the GAWPFR network). The main objective of the campaign was the harmonisation and traceability of ground-based aerosol optical depth measurements to the WMO AOD reference scale, as maintained by the PMOD/WRC reference Precision Filter Radiometers (PFRs). Furthermore, the fact that these data are collected at the same time and place allows the discrepancies in the measurements to be attributed to the instrumentation, processing algorithms or calibration processes, providing an opportunity to understand the limitations of existing methods and suggest possible improvements. In this study, the AOD from Prede-POMs was compared to the obtained based on the Cimel-CE318T and PFR measurements. Some discrepancies were found in the 340 nm and 1020 nm channels. Prede-POM’s overestimation of AOD at 1020 nm could be related to temperature effects or calibration issues (i.e. the performance of the Improved Langley Plot method in Davos, filter degradation, etc.) and requires further investigation. Another task that was successfully carried out was the validation of the SUNRAD algorithm, which is adopted by the SKYNET network to obtain AOD, when applied to raw data from the Cimel-CE318T, showing mostly good agreement with the AOD provided by AERONET (MBD = -0.0005 and RMSD = 0.0014 for Cimel #953 and MBD = -0.0005 and RMSD = 0.0006 for Cimel #1144 for AOD at 675 nm). In addition, several analyses of the SKYNET calibration method of Prede-POMs have been performed. In particular, two versions of the calibration processing algorithm, along with some variations, have been run: the standard Improved Langley Plot (ILP), and a new version recently developed. Then, the obtained calibration coefficients were used in the computation of AOD for the Prede-POMs, which was compared to the results from AERONET and GAWPFR. This analysis confirmed that the deterioration of a filter affects the determination of the Solid View Angle (SVA), and thus the computation of the calibration coefficients. In particular, it was found that the comparisons improved when the 340 nm channel from Valencia’s Prede-POM was excluded during the computation of the calibration coefficients. However, the calculation of a new SVA using disk scan measurements collected during the campaign did not yield a significant improvement in the AOD comparison.

How to cite: Garcia-Suñer, M., Kumar, G., Estellés, V., Utrillas, M. P., Campanelli, M., Kouremeti, N., González, R., Karanikolas, A., Blarel, L., and Barreto, Á.: Analysis of SKYNET derived AOD during the FRC VI campaign in Davos, and validation of improved data processing and calibration algorithms , EGU General Assembly 2026, Vienna, Austria, 3–8 May 2026, EGU26-12178, https://doi.org/10.5194/egusphere-egu26-12178, 2026.

EGU26-12278 | ECS | Orals | AS3.43

Impact of Satellite Aerosol Assimilation on AOD Representation and Long-Term Trends in CAMS Reanalysis 

Anna Moustaka, Antonis Gkikas, Stavros-Andreas Logothetis, Johannes Flemming, Samuel Rémy, Melanie Ades, Kleareti Tourpali, Vassilis Amiridis, and Stelios Kazadzis

Atmospheric aerosols play a crucial role in the Earth system by influencing climate, air quality, human health and environmental processes. Aerosol loading is quantified in optical terms using Aerosol Optical Depth (AOD), a wavelength dependent measure of the attenuation of solar radiation by particles in the atmosphere. The Copernicus Atmosphere Monitoring Service (CAMS) provides global aerosol reanalyses by combining numerical modelling with satellite observations (among others) via data assimilation. In the CAMS ECMWF Atmospheric Composition Reanalysis 4 (EAC4), satellite-retrieved AOD at 550 nm is assimilated to constrain aerosol fields. A parallel control simulation (CTRL), produced without AOD assimilation, enables the direct impact of assimilation to be isolated. In this study, we assess the impact of data assimilation both in the representation of the aerosol burden and its long-term variability by comparing EAC4 and CTRL configurations over the period 2003–2024. The assimilated observations in EAC4 include AOD from MODIS aboard the Terra and Aqua satellites, complemented by AATSR on-board Envisat satellite. The AOD products from both configurations are evaluated against reference ground-based AERONET measurements at 178 stations worldwide, selected after applying a set of criteria in order to ensure a robust and internally consistent analysis of long-term AOD trends. Overall, both EAC4 and CTRL show good agreement with AERONET at low AOD values (AOD < 0.2), which account for the majority of observations. However, as aerosol loading increases, both configurations tend to underestimate the actual AOD, with substantially larger biases in CTRL. Assimilation in EAC4 systematically reduces these underestimations across all AOD ranges and results in a narrower error distribution, indicating improved stability and consistency. Evaluation metrics confirm this improvement, with EAC4 exhibiting higher correlations, lower errors, and a near-zero mean bias relative to AERONET. The assimilation of satellite AOD indirectly alters the simulated aerosol composition, with the most pronounced changes occurring over dust-dominated regions, where the relative dust contribution is substantially reduced and partially redistributed toward organic matter and other aerosol components, indicating that CTRL overestimates dust loading. Additionally, satellite AOD assimilation significantly improves the representation of long-term AOD trends. Trends derived from EAC4 show strong agreement with AERONET, correctly capturing both the magnitude and sign of observed changes over the majority of the AERONET stations. Compared to CTRL, EAC4 demonstrates markedly higher correlations, reduced trend errors, and a greater fraction of statistically significant trends consistent with observations. These results highlight that satellite AOD assimilation not only enhances present-day aerosol distributions but also plays a key role in constraining long-term aerosol variability in reanalysis products.

Acknowledgements: Part of this work was supported by the COST Action Harmonia (CA21119) supported by COST (European Cooperation in Science and Technology). This work received financial support through the ACTRIS Switzerland 2025-2028 grant (Swiss contribution to the ACTRIS ERIC) funded by the Swiss State Secretariat for Education and Research and Innovation (SERI).

How to cite: Moustaka, A., Gkikas, A., Logothetis, S.-A., Flemming, J., Rémy, S., Ades, M., Tourpali, K., Amiridis, V., and Kazadzis, S.: Impact of Satellite Aerosol Assimilation on AOD Representation and Long-Term Trends in CAMS Reanalysis, EGU General Assembly 2026, Vienna, Austria, 3–8 May 2026, EGU26-12278, https://doi.org/10.5194/egusphere-egu26-12278, 2026.

EGU26-12597 | Orals | AS3.43

What aerosol and cloud observations reveal about model robustness and aerosol forcing uncertainty 

Leighton Regayre, Lea Prevost, Kunal Ghosh, Jill Johnson, Jeremy Oakley, Jonathan Owen, Iain Webb, and Ken Carslaw

Aerosol radiative forcing remains one of the largest sources of uncertainty in climate projections, despite substantial advances in aerosol and cloud observations from ground-based networks and satellites. We quantify how effectively current aerosol, cloud, and radiative observations constrain aerosol forcing uncertainty in global climate models, and identify where and why significant uncertainty persists. Using large perturbed-parameter ensembles of an Earth system model evaluated against satellite-derived aerosol, cloud, and radiation products, we map the spatial distribution of aerosol forcing uncertainty before and after observational constraint.

We show that observational constraints reduce aerosol forcing uncertainty by more than 70–80% in Northern Hemisphere marine regions and substantially narrow the global mean forcing range. However, large uncertainties remain in key regions, notably Southern Hemisphere stratocumulus-to-cumulus transition zones and some industrialized continental areas. Analysis of uncertainty clusters reveals common controlling processes that resist constraint even when multiple observational datasets are applied.

A central outcome of this work is that applying observational constraints to large perturbed-parameter ensembles provides new insights into structural model behaviour. Simultaneous evaluation against multiple observed aerosol and cloud properties reveals where model tuning is by necessity a compromise. This approach exposes structural model deficiencies – model development priorities.

Our results provide actionable guidance for aerosol measurement communities, including ACTRIS and Harmonia, by identifying regions and processes where improved, harmonized aerosol and cloud observations could most effectively reduce aerosol-cloud radiative forcing uncertainty. The study underscores the need for coordinated observation-model development strategies to maximize the value of long-term aerosol datasets.

How to cite: Regayre, L., Prevost, L., Ghosh, K., Johnson, J., Oakley, J., Owen, J., Webb, I., and Carslaw, K.: What aerosol and cloud observations reveal about model robustness and aerosol forcing uncertainty, EGU General Assembly 2026, Vienna, Austria, 3–8 May 2026, EGU26-12597, https://doi.org/10.5194/egusphere-egu26-12597, 2026.

EGU26-14140 | ECS | Posters on site | AS3.43

Evaluation of the Cyprus UV Index (UVI) Forecasting System Over One Year of Observations: Assessing the Impact of Ozone and Aerosols  

Georgia Charalampous, Konstantinos Fragkos, Ilias Fountoulakis, Kyriaki Papachristopoulou, Argyro Nisantzi, Diofantos Hadjimitsis, and Stelios Kazadzis

Cyprus is characterized by some of the highest ultraviolet (UV) radiation levels in Europe, emphasizing the need for accurate UV Index (UVI) forecasting to support public awareness and health protection, atmospheric research. This study presents the evaluation of the Cyprus Erythemal Irradiance Forecasting System (CERYFOS), an operational system providing hourly UVI forecasts across Cyprus at a spatial resolution of 0.1° × 0.1°.

CERYFOS is based on radiative transfer simulations using libRadtran package, driven by aerosol optical properties from the Copernicus Atmosphere Monitoring Service (CAMS), satellite-based total ozone column forecasts from TEMIS, surface elevation information, and cloud related information derived from the Weather Research and Forecasting (WRF) model forecast for clear-sky and all-sky conditions.

The evaluation covers approximately one year of data (July 2024–September 2025) and is based on comparisons with high-quality ground-based measurements in Limassol, including a Kipp & Zonen SUV-E erythemal radiometer and a double monochromator Bentham DMc150 spectrophotometer, operated following established calibration and traceability protocols. Clear-sky conditions were identified using all-sky camera observations. In addition, CERYFOS forecasts are compared with CAMS UVI products, while satellite ozone data from the Ozone Monitoring Instrument (OMI) are used to assess the consistency and impact of forecasted ozone input on UVI forecast performance. The influence of aerosol input uncertainties is investigated through comparison of CAMS aerosol optical depth with co-located AERONET observations and their effect on UVI differences.

This work underscores the value of harmonized aerosol and ozone observations and traceable ground-based UV measurements for improving UVI forecasting systems and supports ongoing Harmonia efforts in aerosol–radiation interaction studies and UV exposure services.


Acknowledgments:

The authors acknowledge the ‘EXCELSIOR’: ERATOSTHENES: Excellence Research Centre for Earth Surveillance and Space-Based Monitoring of the Environment H2020 Widespread Teaming project (www.excelsior2020.eu). The ‘EXCELSIOR’ project has received funding from the European Union’s Horizon 2020 research and innovation programme under Grant Agreement No. 857510, the Government of the Republic of Cyprus through the Directorate General for the European Programmes, Coordination and Development, and the Cyprus University of Technology. Authors would like to acknowledge the Action Harmonia CA21119 supported by COST (European Cooperation in Science and Technology). G.C., K.P., A.N., and S.K. acknowledge: “ATARRI: This project has received funding from the European Union’s Horizon Europe Twinning Call (HORIZON-WIDERA-2023-ACCESS-02) under grant agreement No. 101160258.


How to cite: Charalampous, G., Fragkos, K., Fountoulakis, I., Papachristopoulou, K., Nisantzi, A., Hadjimitsis, D., and Kazadzis, S.: Evaluation of the Cyprus UV Index (UVI) Forecasting System Over One Year of Observations: Assessing the Impact of Ozone and Aerosols , EGU General Assembly 2026, Vienna, Austria, 3–8 May 2026, EGU26-14140, https://doi.org/10.5194/egusphere-egu26-14140, 2026.

EGU26-16395 | Posters on site | AS3.43

Automated quality control of atmospheric aerosol time series in near real-time 

Jan Bumberger, Thomas Müller, Peter Lünenschloss, Jens Voigtländer, Thomas Trabert, Ema Vosgerau, David Schäfer, and Timo Houben

Ensuring reliable and comparable aerosol optical data across monitoring networks demands automated, standardized quality control (QC) procedures. We present an integrated, real‑time QC system for AE33 Aethalometer equivalent black carbon (eBC) and Aurora 4000 nephelometer scattering coefficient (σsca) measurements. Built on the open-source SaQC framework and distributed through the actris_qc package, the system operationalizes community QA/QC guidelines through a structured, machine-readable rule hierarchy that performs device-control, channel-level, and derived-variable diagnostics. The workflow is configured using an anomaly catalogue from the urban TROPOS site and validated at the contrasting rural Melpitz station, confirming robust adaptability across diverse environments. It consistently detects outliers, noise, plateaus and instrument failures while preserving plausible atmospheric variability, reaching real-time execution on standard computing platforms. Its modular and declarative architecture facilitates seamless extension to further instruments and network infrastructures, enabling harmonized QC flagging, traceable provenance, and FAIR‑compliant, AI‑ready data streams for next‑generation atmospheric monitoring systems.

How to cite: Bumberger, J., Müller, T., Lünenschloss, P., Voigtländer, J., Trabert, T., Vosgerau, E., Schäfer, D., and Houben, T.: Automated quality control of atmospheric aerosol time series in near real-time, EGU General Assembly 2026, Vienna, Austria, 3–8 May 2026, EGU26-16395, https://doi.org/10.5194/egusphere-egu26-16395, 2026.

EGU26-16500 | ECS | Posters on site | AS3.43

Evaluation and Intercalibration of Various Low-Cost Sun-Photometers During the RACE-EarthCARE Validation Experimental Field Campaign in Thessaloniki, Greece 

Athina Savva, Stelios Kazadzis, Christodoulos Biskas, Georgia Charalampous, Kyriaki Papachristopoulou, Maria Poutli, Dimitra Kouklaki, Dimitrios Balis, Argyro Nisantzi, Diofantos Hadjimitsis, and Rodanthi-Elisavet Mamouri

Accurate and harmonized aerosol observations are essential for climate studies, validation of satellite products, and assessment of aerosol impacts on surface solar radiation. Low-cost hand-held sun-photometer sensors facilitate a high monitoring density, providing near-real time and spatially distributed information. Their compact design and portability make them ideal for mobile monitoring observations. They can complement global monitoring networks by enabling aerosol observations in data-sparse regions, where conventional sun-photometric observations are limited. These capabilities are particularly valuable for target field campaigns, as they enable spatially and temporally collocated aerosol observations that support the validation of satellite-derived aerosol products.

This study presents results from the RACE-ECV (Radiation closure experiments for EarthCARE Validation) field campaign conducted in Thessaloniki, Greece between 24 April and 21 May 2025. The campaign included coordinated calibration and validation activities focusing on low-cost, hand-held sun-sky photometers and the evaluation of Aerosol Optical Thickness (AOT) products from the EarthCARE mission, with particular emphasis on the EarthCARE Multi-Spectral Imager (MSI) and Atmospheric Lidar (ATLID) AOT satellite products.

Six hand-held sun-photometers, three Microtops II and three Calitoos, participated in the campaign. Measurements were performed at three locations: a central urban site of the city at the Laboratory of Atmospheric Physics (LAP) of the Aristotle University of Thessaloniki (AUTH) (40.38° N, 22.57° E, 60 m a.s.l.), an urban-suburban location at Center for Interdisciplinary Research and Innovation (KEDEK) (40.33° N, 22.59° E, 63 m a.s.l.) of AUTH and a rural location in Epanomi (40.20° N, 22.58° E, 17 m a.s.l.).

Cloud-free measurements were conducted on 17–18 May 2025 at the Laboratory of Atmospheric Physics (LAP) station of (AUTH), Greece, using these handheld sun photometers. These observations were part of a coordinated calibration exercise, where the hand-held instruments were calibrated against a reference Cimel sun–sky photometer which is regularly maintained and calibrated according to AERONET standards. New calibration factors for the instruments were also derived from AOD measurements obtained with a collocated Global Atmosphere Watch precision-filter radiometer (GAW-PFR) at the KEDEK station in multiple wavelengths.

Finally, for the validation of the EarthCARE Aerosol Optical Thickness (AOT) from MSI and ATLID, mobile observations were conducted at six locations along the EarthCARE overpass tracks on 25 April and 20 May 2025 in Thessaloniki district with Microtops II and Calitoo instruments. These measurements complemented the fixed-station observations, enhancing the spatial coverage of the campaign. Results regarding the calibration of the hand-held instruments and validation of EarthCARE AOT products will be presented.

Acknowledgements: The authors acknowledge the project RACE-ECV, (SBFI-633.4-2021-2024/PMOD - EarthCARE 202/2) supported by SBFI the CERTAINTY project funded from Horizon Europe programme under Grant Agreement No 101137680. The study is supported by the ATARRI project funded by the European Union’s Horizon Europe Twinning Call (HORIZON-WIDERA-2023-ACCESS-02) under the grant agreement No 101160258 and the ‘EXCELSIOR’: ERATOSTHENES: H2020 Widespread Teaming project. This work supported by HARMONIA COST Action CA21119 - International network for harmonization of atmospheric aerosol retrievals from ground based photometers, supported by COST (European Cooperation in Science and Technology).


How to cite: Savva, A., Kazadzis, S., Biskas, C., Charalampous, G., Papachristopoulou, K., Poutli, M., Kouklaki, D., Balis, D., Nisantzi, A., Hadjimitsis, D., and Mamouri, R.-E.: Evaluation and Intercalibration of Various Low-Cost Sun-Photometers During the RACE-EarthCARE Validation Experimental Field Campaign in Thessaloniki, Greece, EGU General Assembly 2026, Vienna, Austria, 3–8 May 2026, EGU26-16500, https://doi.org/10.5194/egusphere-egu26-16500, 2026.

EGU26-17011 | ECS | Posters on site | AS3.43

3D cloud reconstruction from all-sky camera images for the analysis of their impact on sky radiances and retrieved aerosol properties 

Sara Herrero Anta, Roberto Román, Daniel Gonzalez-Fernández, Celia Herrero del Barrio, Javier Gatón, Bruno Longarela, David Mateos, Ramiro González, Carlos Toledano, Abel Calle, Victoria E. Cachorro, Bernhard Mayer, and Ángel M. de Frutos

Atmospheric aerosols influence the Earth’s energy balance through direct (aerosol-radiation) and indirect (aerosol-clouds) effects. Aerosol properties are very variable in space, time and type. An accurate knowledge of the microphysical and optical properties is key to assess their impact on climate. The sky radiances contain information about the aerosol properties and are commonly used in inversion algorithms to retrieve them, like the one from AERONET (Sinyuk et al., 2020). However, the inversion algorithms commonly used employ a RTM which only considers cloud-free conditions. Therefore, the input measurements used for the inversion algorithm are previously filtered using a cloud-screening to remove sky radiances at points where clouds are located.

However, the synthetic study conducted by Herrero-Anta et al. (2025) showed that even the points which are not removed by the cloud-screening are affected by the presence of clouds, showing an enhancement in the sky radiances with respect to the cloud-free situation. When the enhanced sky radiances are used as input for an inversion algorithm, a bias is observed in the aerosol properties with respect to the aerosol properties retrieved under cloud-free conditions.

To evaluate this effect in real conditions, a new methodology has been proposed to reconstruct clouds in 3D using images from all-sky cameras. For this study, we have used data from a camera installed in Valladolid, where a CE318-T sun photometer from AERONET is co-located.

Once the 3D cloud maps are obtained, they have been used as input for the radiative transfer model MYSTIC (Emde et al., 2016) to simulate the sky radiances under cloudy and cloud-free conditions, to calculate the enhancement. This enhancement has been used to correct the sky radiance measurements from the CE318-T and retrieve the corrected aerosol properties using GRASP (Generalized Retrieval of Atmosphere and Surface Properties; Dubovik et al., 2021).


This work was supported by Ministerio de Ciencia e Innovación (MICINN), with the grant no. PID2024-157697OB-I00. This work is part of the project TED2021-131211B-I00375 funded by MCIN/AEI/10.13039/501100011033 and European Union, “NextGenerationEU”/PRTR and is based on work from COST Action CA21119 HARMONIA. Financial support of the Department of Education, Junta de Castilla y León, and FEDER Funds is gratefully acknowledged (Reference: CLU-2023-1-05). This work was funded by European Comision through the EUBURN-RISK project (INTERREG-SUDOE; S2/2.4/F0327). The authors acknowledge support of the Spanish Ministry for Science and Innovation to ACTRIS ERIC and the Marie Sklodowska-Curie Staff Exchange Actions with the project GRASP-SYNERGY (grant no. 10101131631).

Dubovik, Oleg, et al. "A comprehensive description of multi-term LSM for applying multiple a priori constraints in problems of atmospheric remote sensing: GRASP algorithm, concept, and applications." Frontiers in Remote Sensing 2 (2021): 706851. Emde, Claudia, et al. "The libRadtran software package for radiative transfer calculations (version 2.0. 1)." Geoscientific Model Development 9.5 (2016): 1647-1672. Herrero-Anta, Sara, et al. "Impact of cloud presence on sky radiances and the retrieval of aerosol properties." Atmospheric Research 317 (2025): 107938.  Sinyuk, Alexander, et al. "The AERONET Version 3 aerosol retrieval algorithm, associated uncertainties and comparisons to Version 2." Atmospheric Measurement Techniques 13.6 (2020): 3375-3411.

How to cite: Herrero Anta, S., Román, R., Gonzalez-Fernández, D., Herrero del Barrio, C., Gatón, J., Longarela, B., Mateos, D., González, R., Toledano, C., Calle, A., Cachorro, V. E., Mayer, B., and de Frutos, Á. M.: 3D cloud reconstruction from all-sky camera images for the analysis of their impact on sky radiances and retrieved aerosol properties, EGU General Assembly 2026, Vienna, Austria, 3–8 May 2026, EGU26-17011, https://doi.org/10.5194/egusphere-egu26-17011, 2026.

EGU26-17282 | Orals | AS3.43

Beyond aerosol extinction: dominant indirect effects of Saharan dust on photovoltaic energy production in Central Europe 

György Varga, Fruzsina Gresina, András Gelencsér, Adrienn Csávics, and Ágnes Rostási

Saharan dust outbreaks are increasingly affecting Europe, yet their impact on photovoltaic (PV) energy production is still predominantly interpreted through the lens of direct aerosol radiative attenuation. This study demonstrates that such an approach substantially underestimates the other influence of dust on solar energy generation, as the dominant mechanism operates indirectly through dust-induced modifications of cirrus clouds.

We analyse six years (2019-2024) of national-scale PV generation data from Hungary, a Central European country where solar power accounted for approximately 25% of total electricity generation by 2024. PV production data are combined with reanalysis- and satellite-based atmospheric datasets, including dust column mass density from MERRA-2, cirrus cloud properties from MODIS, and surface irradiance from the CAMS Radiation Service. PV performance is quantified using a dynamically fitted production envelope, allowing generation losses to be assessed independently of capacity growth and seasonal variability.

Our results reveal that the largest PV yield reductions occur not during high-dust conditions alone, but when elevated dust loads coincide with enhanced cirrus cloud coverage and reflectance. Under such combined conditions, PV performance ratios fall to approximately 46%, compared to values exceeding 75% during low-dust, low-cirrus periods. During high-dust episodes, cirrus reflectance increases by about 55%, while cirrus coverage rises by 60-85%, providing clear observational evidence of strong aerosol-cloud interactions. Seasonal analysis shows that these indirect effects peak during the transitional seasons (spring and autumn), when thermodynamic conditions favour heterogeneous ice nucleation on mineral dust particles.

To disentangle direct and indirect pathways, we apply both linear and non-linear (quadratic) mediation frameworks, supported by block bootstrap resampling to ensure robust statistical inference. The bootstrap analysis consistently demonstrates that the indirect, cirrus-mediated pathway is statistically significant and more stable than the direct dust effect. While direct aerosol extinction can be strong during extreme dust events, its influence is episodic and highly state-dependent. In contrast, dust-induced cirrus enhancement represents a persistent and dominant mechanism governing PV efficiency losses across dust regimes.

These findings indicate that the radiative impact of Saharan dust on solar energy production is fundamentally a coupled dust-cirrus phenomenon rather than a simple aerosol-extinction problem. As the frequency and intensity of transcontinental dust intrusions are projected to increase under future climate conditions, explicitly accounting for aerosol-cloud interactions is essential for reliable PV performance assessment, energy planning, and the stability of increasingly solar-dominated power systems.

The research was supported by the Sustainable Development and Technologies National Programme of the Hungarian Academy of Sciences (FFT NP FTA) and NRDI projects TKP2021-NKTA-21 and RRF-2.3.1-21-2021.

How to cite: Varga, G., Gresina, F., Gelencsér, A., Csávics, A., and Rostási, Á.: Beyond aerosol extinction: dominant indirect effects of Saharan dust on photovoltaic energy production in Central Europe, EGU General Assembly 2026, Vienna, Austria, 3–8 May 2026, EGU26-17282, https://doi.org/10.5194/egusphere-egu26-17282, 2026.

EGU26-17752 | ECS | Posters on site | AS3.43

Retrieval of Aerosol Optical Properties from Spectral Solar Irradiance Using Radiative Transfer Modelling in Mountain and Coastal Environments 

Nadia Kairaktidi, Stavros-Andreas Logothetis, Georgios Kosmopoulos, Panagiotis Ioannidis, Stelios Kazadzis, Natalia Kouremeti, Alexandros Papayannis, and Andreas Kazantzidis

Ground-based spectral observations of solar radiation provide a powerful constraint on aerosol–radiation interactions and support the validation of satellite aerosol products. This study presents a radiative transfer modelling and inversion framework for the retrieval of aerosol optical depth (AOD) and single scattering albedo (SSA) from spectrally resolved direct normal irradiance (DNI) and global horizontal irradiance (GHI) measurements in the 300–1100 nm wavelength range.

The methodology exploits the complementary sensitivity of DNI and GHI to aerosol extinction and absorption across the measured spectral region. Forward simulations are performed using a radiative transfer model, while an optimal estimation inversion scheme is applied to retrieve aerosol optical properties by minimizing the spectral residuals between modelled and measured irradiances.

The approach is applied at two contrasting environments in Greece: a high-altitude continental background site at Kalavryta and a coastal site at Epanomi. These locations represent distinct aerosol regimes influenced by long-range transport, boundary-layer dynamics, and marine contributions. Site-specific atmospheric profiles, surface albedo, and solar geometry are explicitly accounted for in the simulations.

Independent validation is performed using co-located Sun photometer measurements providing reference AOD and SSA products. For cloud-free conditions, retrieved AOD at 500 nm shows a mean bias below 0.05 and a root-mean-square error of 0.04–0.06, depending on site and aerosol load. SSA retrievals exhibit mean deviations below 0.05 in the visible range, with increased sensitivity under moderate to high aerosol loading. The coastal site demonstrates enhanced absorption variability linked to mixed marine-continental aerosol, while the mountain site is dominated by aged continental and transported aerosol.

The results demonstrate that combined spectral DNI and GHI measurements can robustly constrain aerosol optical properties with high temporal resolution, offering a complementary ground-based observational capability for aerosol monitoring, radiative studies, and satellite validation activities.

How to cite: Kairaktidi, N., Logothetis, S.-A., Kosmopoulos, G., Ioannidis, P., Kazadzis, S., Kouremeti, N., Papayannis, A., and Kazantzidis, A.: Retrieval of Aerosol Optical Properties from Spectral Solar Irradiance Using Radiative Transfer Modelling in Mountain and Coastal Environments, EGU General Assembly 2026, Vienna, Austria, 3–8 May 2026, EGU26-17752, https://doi.org/10.5194/egusphere-egu26-17752, 2026.

EGU26-18332 | ECS | Posters on site | AS3.43

AOD long term comparisons of CIMEL and PFR measurements at the ACTRIS sun-photometer calibration sites 

Angelos Karanikolas, Natalia Kouremeti, Africa Barreto, Carlos Toledano, Philip Goloub, Julian Gröbner, and Stelios Kazadzis

Aerosol optical depth (AOD) describes the overall direct effect of the aerosol column direct on solar radiation, which makes it a particularly important parameter for Earth energy budget related studies. Various instrument networks measure AOD worldwide such as the Aerosol RObotic NETwork (AERONET), the Global Atmospheric Watch Precision Filter Radiometer (GAW-PFR) network (Kazadzis et al., 2018) and SKYNET.

PMOD/WRC is designated from the World Meteorological Organization (WMO) and the International Bureau of Weights and Measures to maintain the world reference AOD standards and serve as the central calibration laboratory under the WMO’s Global Atmosphere Watch Program. The reference AOD dataset is provided by three precision filter radiometers (PFR). PMOD/WRC aims at standardisation and homogenisation of AOD reference scales. Also to improve the calibration, processing algorithms and consistency of long‐term measurements. Under CARS (Calibration of Aerosol Remote Sensing) of ACTRIS, PMOD/WRC aims to establish the traceability link between the AOD measured by ACTRIS instruments to the WMO reference and thereby to the SI.

In accordance with this goal, in this work we focus on the comparison of AOD measurements from CIMEL and PFR traveling reference standards at the three ACTRIS/CARS and AERONET calibration sites:

  • Izaña Observatory, Tenerife, Spain (28.3 N, 16.5 W, 2401 m above sea level). Parallel measurements at Izaña started in 2002.
  • The Observatoire de Haute-Provence (43.93 N, 5.71 E, 680 m a.s.l.), France. The PFR observations started in 2020.
  • The University of Valladolid, Spain (41.66 N, 4.70 W, 705m a.s.l.). PFR observations started in June of 2022.

We also assess the performance of the intercomparisons according to the WMO limits for traceability and the AOD instrument uncertainties.


Acknowledgements

This work was supported by the ACTRIS-CH (Aerosol, Clouds and Trace Gases Research Infrastructure – Swiss contribution) funded by the State Secretariat for Education, Research, and Innovation, Switzerland.

The authors acknowledge the support of the Spanish Ministry for Science and Innovation to ACTRIS ERIC.


References

Kazadzis, S., Kouremeti, N., Nyeki, S., Gröbner, J., and Wehrli, C.: The World Optical Depth Research and Calibration Center (WORCC) quality assurance and quality control of GAW-PFR AOD measurements, Geosci. Instrum. Method. Data Syst., 2018.

WMO: Aerosol Measurement Procedures, Guidelines and Recommendations, WMO No 1177, 2016.

How to cite: Karanikolas, A., Kouremeti, N., Barreto, A., Toledano, C., Goloub, P., Gröbner, J., and Kazadzis, S.: AOD long term comparisons of CIMEL and PFR measurements at the ACTRIS sun-photometer calibration sites, EGU General Assembly 2026, Vienna, Austria, 3–8 May 2026, EGU26-18332, https://doi.org/10.5194/egusphere-egu26-18332, 2026.

Photometric measurement parameters such as Single Scattering Albedo (SSA), Aerosol Optical Depth (AOD), and Angstrom Exponent (AE) can be used for aerosol classification and source identification using artificial intelligence mechanisms or simplified classification trees. Sometimes these methods are difficult to apply in incomplete datasets or when using vaguely defined classification algorithms that provide ambiguous responses about their origin. In such cases, the origin of atmospheric aerosols may be identified using air-mass trajectory models of atmospheric pollution. This study uses a NOAA HYSPLIT model, which, in addition to atmospheric photometric properties, significantly improves the analysis of results in discutable situations and may, by its nature, even replace the measurement of aerosol chemical composition when profiling sources is performed. The experimental part was developed using the AERONET dataset for Lampedusa (Italy) for the period 2020-2024.

How to cite: Steinberga, I. and Kupca, V.: Complementary air mass analysis and aerosol classification for improved source apportionment, EGU General Assembly 2026, Vienna, Austria, 3–8 May 2026, EGU26-18648, https://doi.org/10.5194/egusphere-egu26-18648, 2026.

EGU26-18785 | ECS | Posters on site | AS3.43

Validation of L2 EarthCARE Aerosol Products with co-located SKYNET and AERONET photometers observation complemented by lidar profilers at the Rome Tor Vergata atmospheric observatory (Italy)  

Stefano Sensi, Elisa Adirosi, Sabina Angeloni, Luca Baldini, Francesca Barnaba, Alessandro Bracci, Monica Campanelli, Giampietro Casasanta, Davide Dionisi, Marco Di Palantonio, Giovanni Giuliano, Gian Luigi Liberti, Lorenza Masi, and Matteo Picchiani

This work presents preliminary results of the validation of ESA EarthCARE (EC) Level-2 aerosol products using ground-based observations in Rome–Tor Vergata (Italy), where a suite of instruments continuously measures aerosols, clouds, gases, and precipitation. The study is carried out within the EC-VALMED.it project funded by the Italian Space Agency (ASI), aiming to assess the accuracy of EC aerosol, cloud, and precipitation products over the Mediterranean. Here, we focus on aerosol columnar properties  comparing EC satellite products with observations from ground-based photometers (AERONET and SKYNET) complemented by vertical profiles from high- and low-power lidar measurements operating within ACTRIS and ALICENET/E-PROFILE.  

Satellite validation is challenging due to differences in observation geometry, mismatches in spatial and temporal resolution, and high spatiotemporal variability of aerosol optical properties. To address these issues, we defined specific match-up criteria between satellite and ground-based measurements. For EC MSI (Multi Spectral Imager) Aerosol Optical Thickness (AOT), spatial averages over 3×3, 9×9, 25×25, and 51×51 pixel areas around the Rome-Tor Vergata observatory were computed. For EC ATLID (Atmospheric Lidar), both AOT and vertical profiles were averaged over different temporal windows (i.e., along-track path-length), centered at the time of minimum distance between the satellite ground track and the Rome-Tor Vergata observatory. Only ATLID overpasses within 100 km and MSI-AOT overpasses within 150 km of the station were considered. Ground-based photometer data were also temporally averaged over different intervals, and only high-quality satellite retrievals (status 0/1) were retained. 

First results indicate a good agreement between EC-ATLID AOT at 355 nm and 15-min averaged AERONET/SKYNET data at 340 nm (R = 0.86), with the best match obtained using ATLID 20-s averages. MSI-AOT shows a  lower correlation at 670 nm (R = 0.65), though improvements were observed moving from EC product baseline BA to BB. In specific cases, reasons for satellite-photometers disagreements are disclosed based on vertical profiles. 

This work is supported by the Italian Space Agency (ASI, ECVALMED project, agreement n. 2024-1-HB.0). 

How to cite: Sensi, S., Adirosi, E., Angeloni, S., Baldini, L., Barnaba, F., Bracci, A., Campanelli, M., Casasanta, G., Dionisi, D., Di Palantonio, M., Giuliano, G., Liberti, G. L., Masi, L., and Picchiani, M.: Validation of L2 EarthCARE Aerosol Products with co-located SKYNET and AERONET photometers observation complemented by lidar profilers at the Rome Tor Vergata atmospheric observatory (Italy) , EGU General Assembly 2026, Vienna, Austria, 3–8 May 2026, EGU26-18785, https://doi.org/10.5194/egusphere-egu26-18785, 2026.

EGU26-20184 | ECS | Posters on site | AS3.43

Assessing Aerosol Impact on Digital Twin Solar Irradiance Forecasts and on PV Power Prediction 

Angelos Georgakis, Rizos-Theodoros Chadoulis, Stelios Kazadzis, Kyriaki Papachristopoulou, David Casalieri, and Charalampos Kontoes

For many critical energy-related applications, such as reliable PV power production, accurate Global Horizontal Irradiance (GHI) short-term forecasts are crucial. Forecasts of GHI, as analyzed in this study, are produced by the state-of-the-art, high-resolution forecasts developed within the Destination Earth initiative, the ECMWF Digital Twin Engine using the ExtremeDT (Weather-Induced Extremes Digital Twin) dataset, that produces daily global simulations at resolutions of 4.4 km kilometres up to four days ahead. However the GHI ExtremesDT forecasts do not take into account the aerosol effects, which may introduce systematic biases, especially during periods of high aerosol load events. We investigated the impact of aerosols on DT GHI forecasts and the associated PV power predictions within the context of the DestinE Destination Renewable Energy (DRE) use case.
We analyze almost one year of data comprising two-day-ahead DT GHI forecasts and the corresponding aerosol optical depth (AOD) forecasts from the Copernicus Atmosphere Monitoring Service (CAMS). The DT GHI forecasts are corrected for aerosol effects using fast radiative transfer model techniques utilising the lidRadtran [1, 2] package.

Within the DRE project,  and based on co-design activities with the project's end user, site-specific PV power production forecasts tailored to the user’s needs and infrastructure were developed, using DT GHI forecasts and a machine learning (ML) model that was trained on the user’s historical data. The impact of aerosol correction was also evaluated by comparing PV power production forecasts derived from GHI forecasts with and without aerosol correction against the actual PV power production of the plant.

A machine learning (ML) model, trained on historical, site-specific production data from the QUEST PV park, was created within the DRE project to convert predicted solar irradiance into PV park power output in order to evaluate the impact on power production. The ML model propagates the original and aerosol-corrected GHI forecasts, which are then compared to actual production.

The results show how CAMS-based aerosol correction of GHI forecasts can reduce bias  and consistently improve PV power prediction. Results show the value of incorporating atmospheric composition data with ML-based power conversion models for operational energy applications, as well as the significance of aerosol representation in solar forecasting.

Acknowledgments

DRE project has received funding from the European Space Agency under the DESTINATION EARTH USE CASES – DESP USE CASES - ROUND 1. The duration of the project is 12 months (November 2023 - November 2024).

We would like also to acknowledge the COST Action HARMONIA (International network for harmonization of atmospheric aerosol retrievals from ground based photometers), CA21119.

Bibliography

(1) Mayer, B.; Kylling, A. Atmospheric Chemistry and Physics 2005, 5, 1855–1877.
(2) Emde, C.; Buras-Schnell, R.; Kylling, A.; Mayer, B.; Gasteiger, J.; Hamann, U.; Kylling, J.; Richter, B.; Pause, C.; Dowling, T.; Bugliaro, L. Geoscientific Model Development 2016, 9, 1647–1672.

How to cite: Georgakis, A., Chadoulis, R.-T., Kazadzis, S., Papachristopoulou, K., Casalieri, D., and Kontoes, C.: Assessing Aerosol Impact on Digital Twin Solar Irradiance Forecasts and on PV Power Prediction, EGU General Assembly 2026, Vienna, Austria, 3–8 May 2026, EGU26-20184, https://doi.org/10.5194/egusphere-egu26-20184, 2026.

EGU26-21168 | Orals | AS3.43

Homogenization activities of ground-based aerosol optical depth measurements within WMO Filterradiometers Campaign (FRC-VI)  

Natalia Kouremeti, Stelios Kazadzis, Julian Gröbner, Gregor Hülsen, Angelos Karanikolas, Miguel Huerta, and Saulius Nevas

Aerosol optical depth (AOD) is the single most comprehensive variable to assess the columnar aerosol load of the atmosphere. Several studies have investigated long-term AOD from ground-based observation using multiple instruments. The accuracy of AOD measurements and trends from ground-based instruments have a particular significance since they are used for satellite validation, climate model validation and modelling assimilation etc.


To ensure consistency across different networks, continuous intercomparisons are used to homogenize multi-wavelength AOD measurements. The World Optical depth Research and Calibration Center (WORCC) at PMOD/WRC operates and maintains the World Meteorological Organization (WMO) AOD reference, known as GAWPFR-TRIAD. This reference consists of three Precision Filter Radiometer (PFR) instruments. PMOD/WRC disseminates the GAWPFR-TRIAD scale through Filter Radiometer Campaigns (FRC) organized every five years on behalf of WMO. These campaigns play a crucial role in harmonizing ground-based AOD measurements globally.


The most recent Filter Radiometer Campaign (FRC) took place in September-October 2025 in Davos. This campaign brought together 33 instruments, including both filter radiometers and spectroradiometers, representing nine international and national AOD networks. The intercomparison results of spectral AOD will be presented, and the level of agreement between the networks will be assessed and compared to previous FRC campaigns (GAW Report No. 231 and 280).

 An uncertainty analysis based on the information provided by each instrument will be performed and compared to the WMO traceability level of agreement, which represents calibration uncertainties of 1%. Numerous projects (e.g., ACTRIS/CARS, 19ENV04 MAPP) are focused on the optimization, standardization, and harmonization of AOD products, leading to a reduction in AOD differences to better than 0.01 at least at some wavelengths. FRC provides  an  opportunity to access this  assumption in a  global scale.     


Furthermore, building on the work of the EMPIR 19ENV04 MAPP project, which focuses on AOD retrievals based on laboratory calibration of spectroradiometers (Gröbner et al., 2023) and filter radiometers (Kouremeti et al., 2022), emphasis is placed on these comparisons since the methodology has been operationally adapted by a few commercial instruments. In addition, the reference spectroradiometer QASUME is used to validate extrapolation techniques for AOD outside the spectral range of 368 nm to 863 nm covered by the GAWPFR-TRIAD reference instruments.

Acknowledgments: The authors would like to thank all the participants for the FRC-VI campaign for their contributions, time and efforts.  This work was supported by GAW program of WMO and by the joint research project EMPIR 19ENV04 MAPP “Metrology for aerosol optical properties”.

 References 

Fourth WMO Filter Radiometer Comparison (FRC-IV), World Meteorological Organization (WMO), GAW Report No. 231, https://library.wmo.int/idurl/4/55417

Fifth WMO Filter Radiometer Comparison (FRC-V), World Meteorological Organization (WMO), GAW Report No. 280, https://library.wmo.int/idurl/4/66263

Gröbner, J., et al. (2023). Atmos. Meas. Tech., 16,4667-4680. 

Kouremeti, N., et al. (2022). Metrologia, 59,044001. 

How to cite: Kouremeti, N., Kazadzis, S., Gröbner, J., Hülsen, G., Karanikolas, A., Huerta, M., and Nevas, S.: Homogenization activities of ground-based aerosol optical depth measurements within WMO Filterradiometers Campaign (FRC-VI) , EGU General Assembly 2026, Vienna, Austria, 3–8 May 2026, EGU26-21168, https://doi.org/10.5194/egusphere-egu26-21168, 2026.

EGU26-377 | ECS | Posters on site | BG1.1

Control or destroy: Wildfire as a response mechanism 

Bikem Ekberzade and Tolga Görüm

The role of wildfire as a controller in wildland ecosystems is well researched. However, much uncertainty is present with climate change. Will this morphing force turn into a game breaker in the longevity of terrestrial ecosystems? Or will it continue its role as the ultimate controller of vegetation composition, and for certain taxa, fecundity? This study aims to answer these questions for a study region situated in the northern segment of Eastern Mediterranean Basin – Anatolian Peninsula and its immediate surroundings. It considers the historical and potential future changes in biomass and fuel capacity in the region with respect to the changes in amplitudes of climate variability due to climate change in two distinct time periods (present and future). Changes in fire severity and fire return interval (FRI) are simulated using a dynamic vegetation model (LPJ-GUESS v.4.1) coupled with wildfire modules (SIMFIRE and BLAZE), and high-resolution climate datasets. For 1961-2025, the model is forced with ERA5-Land reanalysis data, and for 1961-2100, an ensemble of 5 CMIP6 datasets under the SSP 5-8.5 global warming scenario are used which are resized to 0.1°. While the historical trend analyses of the climate indices (such as SPEI) indicate strong drying for the region overall, simulation results signal an increase in burned area, the frequency of wildfire incidents, while highlighting important changes in vegetation composition and biomass under a changing climate, as wildfire turns into a response mechanism under increasing temperatures and changing rainfall patterns. 

How to cite: Ekberzade, B. and Görüm, T.: Control or destroy: Wildfire as a response mechanism, EGU General Assembly 2026, Vienna, Austria, 3–8 May 2026, EGU26-377, https://doi.org/10.5194/egusphere-egu26-377, 2026.

EGU26-2363 | ECS | Orals | BG1.1

Extratropical lightning fires burn increasingly more severe than human-ignited fires 

Hongxuan Su, Kairui Qiu, Yan Yu, Yunxiao Tang, Shuoqing Wang, Xianglei Meng, and Wei Guo

Fires ignited by human and lightning occur at distinct environments and thus diverge during their developing processes. A global characterization of fires by their ignition cause will inform fire forecast and prediction but is currently prohibited by a lack of ignition cause in global fire inventories. Here we develop a machine-learning classification system and ascribe the ignition cause of 65.17 million global, satellite-detected fire events during 2012-2024. According to this fire inventory, extratropical lightning fires exhibit longer duration, larger burned area and hotter flame, compared with human fires. Despite their contribution to only 2.4% of fire occurrence, lightning fires are responsible for 10.9% of extratropical burned area and 47.6% of that consumed by large fires over 100 km2. This disproportionate abundance of lightning fires in the regime of most severe burning is attributable to synchronized seasonality of lightning ignition and burning conditions, as well as their scarcer accessibility to firefighting practices. Due to their closer linkage to the elongating fire-favorable weather, extratropical lightning fires has elongated by about 0.24 days decade-1, outpacing human fires. With projected hotter, dryer, and stormier extratropical summers, our results provide a direct support for a future of severer lightning fires.

How to cite: Su, H., Qiu, K., Yu, Y., Tang, Y., Wang, S., Meng, X., and Guo, W.: Extratropical lightning fires burn increasingly more severe than human-ignited fires, EGU General Assembly 2026, Vienna, Austria, 3–8 May 2026, EGU26-2363, https://doi.org/10.5194/egusphere-egu26-2363, 2026.

EGU26-3494 | ECS | Posters on site | BG1.1

Climate-cooling impacts from post-fire snow-albedo for the 2023 Canadian fires season 

Max J. van Gerrevink, Alemu Gonsamo, Brendan M. Rogers, Stefano Potter, Zilong Zhong, and Sander Veraverbeke

The 2023 Canadian fire season was record-breaking in terms of burned area and carbon emissions.  Yet, the climate impacts of these fires extend far beyond the immediate carbon emissions and can persist for decades. Post-fire changes in vegetation and surface properties prolong snow exposure during winter and spring, increasing surface albedo and producing long-lasting regional cooling impacts. Historically, the surface albedo-driven cooling has offset the warming influences of carbon emissions by boreal fires. However, with ongoing high-latitude warming, fire seasons are expected to become longer and more intense while spring snow cover declines. This combination may weaken the climate-cooling effect of post-fire surface-albedo changes and reduce the offset potential.

Here, we quantified and mapped the climate-cooling effects from post-fire surface albedo changes for the 2023 Canadian fire season under shared socioeconomic pathway SSP2-4.5 for a 70-year period. We estimate that the 2023 Canadian fires resulted in a time-integrated climate-cooling of –3.67 W m-2 of burned area (95% CI: −4.83 to −2.51) over a 70-year period. Our analysis further shows that the climate-cooling impact of boreal fires has weakened by approximately 30% due to changes in snow cover and duration. This has significant implications for the ability of albedo-driven cooling to offset warming from fire emissions. As a result, we conclude that contemporary boreal fires are, on average, twice as likely to result in a net climate-warming effect relative to the 1960s.

How to cite: van Gerrevink, M. J., Gonsamo, A., Rogers, B. M., Potter, S., Zhong, Z., and Veraverbeke, S.: Climate-cooling impacts from post-fire snow-albedo for the 2023 Canadian fires season, EGU General Assembly 2026, Vienna, Austria, 3–8 May 2026, EGU26-3494, https://doi.org/10.5194/egusphere-egu26-3494, 2026.

Biomass burning (BB) emissions in the Indo-China Peninsula (ICP) can be transported to southern China, perturbing the atmospheric environment and climate in southern China. However, the impact of these fire emissions transports on the terrestrial ecosystems in southern China remains unclear. Here we combine several state-of-the-art models and multiple measurement datasets to quantify the impacts of ICP fire-induced aerosol radiation and O3 damage effect on gross primary productivity (GPP) in southern China during ICP fire seasons (March and April) in 2013-2019. Our results demonstrate that ICP fire-derived aerosols and O₃ collectively reduce annual mean GPP in southern China by 5.4% (13.86 TgC per burning season) under all-sky and 3.4% (12.87 TgC per burning season) under clear-sky conditions. In all-sky, fire aerosols decreased direct photosynthetically active radiation (PAR) by 2.68 W m⁻² while increased diffuse PAR marginally (+0.03 W m⁻²), driving a GPP reduction of 13.36 TgC per burning season across southern China. Concurrently, fire-induced O₃ reduces regional GPP by 0.54 TgC per burning season. In clear-sky, aerosols reduce direct PAR more sharply (−3.22 W m⁻²) but enhance diffuse PAR (+1.51 W m⁻²), resulting the GPP loss to 12.18 TgC, while O₃ damage effect is increased (−0.69 TgC). The fire aerosols contributed to 96.4% of the GPP reduction in all-sky and 94.6% in clear-sky, whereas ozone played a minor role (3.9% in all-sky and 5.4% in clear-sky). This study highlights ICP fire emissions as a significant driver of ecosystem productivity declines in downwind regions, influencing the regional land carbon cycle.

How to cite: Zhu, J.: Quantifying the multi-year impacts of Indo-China Peninsula biomass burning on vegetation gross primary productivity in southern China, EGU General Assembly 2026, Vienna, Austria, 3–8 May 2026, EGU26-3711, https://doi.org/10.5194/egusphere-egu26-3711, 2026.

EGU26-4207 | Posters on site | BG1.1

The Fire Modeling Intercomparison Project (FireMIP) for CMIP7 

Fang Li and the CMIP7 FireMIP group

Fire is a global phenomenon and a key Earth system process. Extreme fire events have increased in recent years, and fire frequency and intensity are projected to rise across most regions and biomes, posing substantial challenges for ecosystems, the carbon cycle, and society. The Fire Model Intercomparison Project (FireMIP), launched in 2014, has contributed to advancing global fire modeling in Dynamic Global Vegetation Models (DGVMs) and improving understanding of fire's local drivers and local impacts on vegetation and land carbon budgets through land offline (i.e., uncoupled from the atmosphere) simulations. We now bring FireMIP into Coupled Model Intercomparison Project Phase 7 (CMIP7) to: (1) evaluate fire simulations in state-of-the-art fully coupled Earth system models (ESMs); (2) assess fire regime changes in the past, present, and future, and identify their primary natural and anthropogenic forcings and causal pathways within the Earth system, including the associated uncertainties; and (3) quantify the impacts of fires and fire changes on climate, ecosystems, and society across Earth system components, regions, and timescales, and elucidate the underlying mechanisms. FireMIP in CMIP7 will advance the fire and fire-related modeling in fully coupled ESMs, and provide a quantitative, detailed, and process-based understanding of fire's role in the Earth system by using models that incorporate critical climate feedbacks and multi-model, multi-initial-condition, and CMIP7 multi-scenario ensembles. Here, we presents the motivation, scientific questions, experimental design and its rationale, model inputs and outputs, and the analysis framework for FireMIP in CMIP7, providing guidance for Earth system modeling teams conducting simulations and informing communities studying fire, climate change, and climate solutions.

How to cite: Li, F. and the CMIP7 FireMIP group: The Fire Modeling Intercomparison Project (FireMIP) for CMIP7, EGU General Assembly 2026, Vienna, Austria, 3–8 May 2026, EGU26-4207, https://doi.org/10.5194/egusphere-egu26-4207, 2026.

EGU26-4268 | Orals | BG1.1

Increasing global human exposure to wildland fires despite declining burned area 

Mojtaba Sadegh, Seyd Teymoor Seydi, John Abatzoglou, Matthew Jones, and Amir AghaKouchak

Although half of Earth’s population resides in the wildland-urban interface, human exposure to wildland fires remains unquantified. We show that the population directly exposed to wildland fires increased 40% globally from 2002 to 2021 despite a 26% decline in burned area. Increased exposure was mainly driven by enhanced colocation of wildland fires and human settlements, doubling the exposure per unit burned area. We show that population dynamics accounted for 25% of the 440 million human exposures to wildland fires. Although wildfire disasters in North America, Europe, and Oceania have garnered the most attention, 85% of global exposures occurred in Africa. The top 0.01% of fires by intensity accounted for 0.6 and 5% of global exposures and burned area, respectively, warranting enhanced efforts to increase fire resilience in disaster-prone regions.

How to cite: Sadegh, M., Seydi, S. T., Abatzoglou, J., Jones, M., and AghaKouchak, A.: Increasing global human exposure to wildland fires despite declining burned area, EGU General Assembly 2026, Vienna, Austria, 3–8 May 2026, EGU26-4268, https://doi.org/10.5194/egusphere-egu26-4268, 2026.

EGU26-4614 | ECS | Orals | BG1.1

Strong Shortwave Absorption by Wildfire Brown Carbon from Global Observations and Modeling 

Lulu Xu, Guangxing Lin, and Xiaohong Liu

Wildfires emit large quantities of brown carbon (BrC), a class of light-absorbing organic aerosols with poorly constrained climate effects. BrC exhibits highly variable absorptivity, from weakly absorbing chromophores in the near-ultraviolet to strongly absorbing "dark BrC" (d-BrC) extending into the visible spectrum, yet the optical properties, global prevalence, and radiative impact of d-BrC remain poorly understood.  Here we show that d-BrC is widespread in wildfire plumes globally, based on integrated analyses of aircraft, ground-based, and satellite observations. We found d-BrC mass absorption efficiencies of 0.5–1.5 m²/g at 500 nm, with absorption often comparable to or exceeding that of black carbon (BC). Implementing these observationally constrained optical properties in a global aerosol-climate model, we estimate a direct radiative effect (DRE) of +0.097 W/m² (range: +0.050 to +0.276 W/m²) from wildfire-derived BrC, with the upper bound surpassing BC and extending into mid- and high-latitude regions including the Arctic These findings position d-BrC as a critical but overlooked driver of wildfire radiative forcing, underscoring the need to account for its strong radiative effects on climate.

How to cite: Xu, L., Lin, G., and Liu, X.: Strong Shortwave Absorption by Wildfire Brown Carbon from Global Observations and Modeling, EGU General Assembly 2026, Vienna, Austria, 3–8 May 2026, EGU26-4614, https://doi.org/10.5194/egusphere-egu26-4614, 2026.

The Fire INventory from NCAR (FINN) is a daily, high resolution (1 km) fire emissions inventory designed for use in atmospheric chemistry models. FINN uses a ‘bottom-up’ approach to estimate fire emissions. Satellite observations of active fires from MODIS (and VIIRS) are combined with land cover, emission factors and fuel loadings to predict fire emissions of key air pollutants. However, one of the key limitations of FINN is lack of peat fire emissions in the dataset, which only accounts above ground vegetation fires. Therefore, neglecting an important emissions source given the extensive abundance of peat in key tropical regions. Fires that occur on the surface of peatland can burn into the below-ground organic layers (up to 0.6 m). Peat fires can smoulder for weeks after the surface fire has extinguished, resulting in substantially greater emissions compared to surface vegetation fires. Therefore, it is essential to include peat fires in FINN.

Globally, peatlands cover >4 million km2 (3 %) of the global land area. However, emissions from the combustion of tropical and Arctic-boreal peat alone account for a disproportionately large fraction of total global carbon emissions (13 %). This is driven by above ground fires burning into the carbon rich peat below.

We first focus on tropical peatlands in Indonesia since these have well documented impacts on air quality. Indonesia is home to a large proportion (36 %) of total tropical peatlands, and a large fraction of fires in Indonesia occur on peatlands. For example, in 2015 53 % of fires in Indonesia occurred on peatland, accounting for only 12 % of the land area. Peat fires contributed 71-95 % of the particulate matter (PM2.5) fire emissions, though emissions are uncertain.

Our work builds upon previous work, which estimated Indonesian peat fire emissions for FINN.  Previously, satellite-derived soil moisture was used to determine a straightforward linear relationship with burn depth of fires that occurred on peatlands. We further develop this method adding additional complexity by using ground-based measurements of burn depth collocated with satellite soil moisture. We also consider canal density and fire frequency maps to account for changes in burn depth with drainage and fire history.

We plan to apply this method to other tropical peatland and boreal regions, so we welcome any discussions on our current work so far and/or future plans.

How to cite: Graham, A. M., Pope, R. J., and Chipperfield, M. P.: Accounting for peat fires in the Fire INventory from NCAR (FINN): Improved air pollutant emissions estimates for tropical peatlands using soil moisture, drainage density and fire history., EGU General Assembly 2026, Vienna, Austria, 3–8 May 2026, EGU26-5608, https://doi.org/10.5194/egusphere-egu26-5608, 2026.

EGU26-5840 | Orals | BG1.1

Quantifying Downwind Deposition of Wildfire-Emitted Particles to Ecosystems 

Facundo Scordo, Majid Bavandpour, Dani Or, Hamed Ebrahimian, Sudeep Chandra, and Janice Brahney

Pyrogenic airborne particle deposition downwind of active wildfires has traditionally been examined primarily as near-term hazards of fire spotting by firebrands or long-range transport of smoke particles (<10 µm). However, wildfires also emit substantial quantities of intermediate-sized airborne particles (10-2000 µm) that carry nutrients and contaminants affecting ecosystems downwind of the fire perimeter. The production, transport, and deposition of these intermediate-sized particles remain understudied. Here we develop a physics-based modeling framework for particle generation at fire lines, lofting by fire-driven convection, transport by prevailing winds, and subsequent ballistic settling. The framework enables characterization of this largely overlooked wildfire deposition footprint. Sensible heat flux from the fire feeds a convective plume capable of lofting particles to heights governed by fire intensity, particle size, shape, and density. Once aloft, particles are carried by ambient winds and ultimately ballistically deposited. The model performance was assessed using a unique dataset of particle deposition measured 3-40 km downwind of the fire front during the 2021 Caldor Fire. Supplemental observations of fire behavior, fuel properties, and meteorological conditions serve as inputs for model evaluation. The framework relies on various assumptions and constraints regarding unknown variables, including the mass fraction of emitted particles (5-7%), particle density (150-300 kg/m³), and drag coefficient formulation (fixed versus size-dependent), whose values were selected based on existing literature and physical plausibility. Over a 16-day sampling period, measured particle deposition ranged from 0.35 to 11.1 g/m². The largest deposition values (9.12-11.10 g/m²) occurred at collection sites closest to the fire (4-8 km), with progressively lower deposition (0.58-2.62 g/m²) observed at distant sites (10-40 km). When extrapolated to the landscape scale, a deposition rate of 10 g/m² over 1 km² corresponds to approximately 10 metric tons of pyrogenic material delivered to ecosystems for two weeks, an amount comparable to inputs from volcanic ashfall events. Within the modeling framework, simulations assuming a particle density of 300 kg/m³ and a pyrogenic emission fraction of 7% most closely matched field observations (RMSE < 1.8 g/m²; modest positive bias 0.8 g/m²; R > 0.90; p > 0.2). This configuration successfully reproduced both the magnitude and spatial gradients of observed pyrogenic mass deposition, demonstrating the framework’s potential to predict and quantify downwind delivery of wildfire-emitted particulate material to ecosystems.

How to cite: Scordo, F., Bavandpour, M., Or, D., Ebrahimian, H., Chandra, S., and Brahney, J.: Quantifying Downwind Deposition of Wildfire-Emitted Particles to Ecosystems, EGU General Assembly 2026, Vienna, Austria, 3–8 May 2026, EGU26-5840, https://doi.org/10.5194/egusphere-egu26-5840, 2026.

EGU26-5864 | ECS | Orals | BG1.1

Prescribed Fire Opportunities in the European Mediterranean under Climate Change 

Alice Hsu, John Abatzoglou, Paulo Fernandes, Davide Ascoli, Hamish Clarke, Cristina Santin, Marco Turco, Crystal Kolden, Juan Felipe Patino, Eric Rigolot, Rachel Carmenta, and Matthew Jones

Prescribed fire is the intentional use of fire under specific environmental conditions used to achieve specific land management objectives. Across the European Mediterranean basin, it is used for hazardous fuel reduction, pastoralism, habitat restoration, and silviculture. However, the ability to conduct prescribed burns is limited by meteorological conditions that facilitate the desired fire behavior to achieve the burns’ objectives, or the “burning window”. Under climate change, the continued availability of these conditions is highly uncertain as changes in the frequency and timing of these conditions are expected to occur. This presents a major challenge to future fire management planning. Here, we use projections of future climate based on scaling factors derived from the Coupled Model Intercomparison Project (CMIP6) and applied to ERA5 meteorology to quantify future changes in days suitable for prescribed burns (RxB days) across Mediterranean Europe. We find a 14% (-12 days) decrease in the number of RxB days across the region at a global warming level of 3.0°C, with losses most pronounced from April to October, particularly at the end of the spring burning window (May-June) and the beginning of the fall burning window (September-October). While some regions see an increase in winter burn days, these gains are outweighed by reduced burn days throughout the year. Future reductions in burn days were limited to 5% at 1.5°C, consistent with the commitments made in the Paris Agreement. Our results suggest that fire managers can expect a decline in opportunities to conduct prescribed burns, especially under higher warming scenarios. Thus, its continued use under these conditions will likely require significant investments and changes to current fire management policies to utilize and scale up remaining prescribed burning opportunities.

How to cite: Hsu, A., Abatzoglou, J., Fernandes, P., Ascoli, D., Clarke, H., Santin, C., Turco, M., Kolden, C., Patino, J. F., Rigolot, E., Carmenta, R., and Jones, M.: Prescribed Fire Opportunities in the European Mediterranean under Climate Change, EGU General Assembly 2026, Vienna, Austria, 3–8 May 2026, EGU26-5864, https://doi.org/10.5194/egusphere-egu26-5864, 2026.

EGU26-8017 | ECS | Orals | BG1.1

Annual Litter Fuel Load Estimation from Optimality-Derived Litterfall and Decomposition Dynamics 

Sophia Cain, Boya Zhou, I. Colin Prentice, and Sandy P. Harrison

Fine fuel loads ignite easily because they dry rapidly and are therefore an important driver of wildfire occurrence and spread. Accurate modelling of fine fuel load dynamics is crucial not only for current and future wildfire prediction, but also carbon cycling. Current fire-enabled dynamic global vegetation models simulate fine fuel accumulation and decomposition, but using parameters that vary with plant functional types (PFTs). Observationally derived models from satellite products provide good estimates of fine fuel loads but cannot be used to predict how these will change in response to ongoing climate changes. We have combined an eco-evolutionary modelling approach to simulate litterfall with a simple empirical model of decomposition rate to predict fine litter loads. The litterfall model predicts the amount of leaf mass that is shed using leaf economics principles and predictions of optimal leaf area index to predict litterfall for evergreen and broadleaf trees and C3 and C4 grasses. The model of decomposition rate uses a generalised linear mixed model to fit a large available dataset of decomposition rate to three variables: C:N ratio representing the litter quality and growing degree days and dry days representing local climate. Both models were independently validated using field observations collated from the literature. We show that the combined model predicts the spatial and temporal variation in fine fuel loads reasonably well when compared to field observations and existing products. This new approach provides a robust framework to derive environmentally driven changes in fine fuel loads in the context of prognostic modelling of wildfires.

How to cite: Cain, S., Zhou, B., Prentice, I. C., and Harrison, S. P.: Annual Litter Fuel Load Estimation from Optimality-Derived Litterfall and Decomposition Dynamics, EGU General Assembly 2026, Vienna, Austria, 3–8 May 2026, EGU26-8017, https://doi.org/10.5194/egusphere-egu26-8017, 2026.

The current methods to systematically validate Earth Observation (EO) products capturing transitory events such as fire activity rely mostly on the intercomparison between Near-real-time products without clearly identifying one as the reference dataset. In addition, due to the highly dynamic and ephemeral nature of such events, comparisons are restricted to near-simultaneous measurements which significantly limits the sample size of any intercomparison. In this study, we propose a new comparison framework that overcomes these limitations. This novel approach is based on a robust analysis of the frequency density (f-D) distributions of each product’s assessment of the event. We start by defining the concepts associated for distribution fitting and performance, temporal and spatial requirements, comparison metrics, and then provide an overview of the various sources of uncertainty contributing to the intercomparison exercise, and how and what uncertainties are propagated.

In this study we inter-compare eight operational remotely sensed active fire detections and fire radiative power (FRP) retrieval products: the polar-orbiter products derived from active fires detected using the Moderate Resolution Imaging Spectroradiometer data (MCD14ML), the Visible Infrared Imaging Radiometer Suite (VNP14IMGML), and the Sea and Land Surface Temperature Radiometer (SLSTR) Non-time critical product from European Space Agency (SLSTR-NTC), and the geostationary products derived from data collected by Meteosat’s Spinning Enhanced Visible and Infrared Imager (LSA-SAF FRP-PIXEL), and the three available products based on Advanced Baseline Imager (KCL/IPMA-GOES16, KCL/IPMA-GOES17, and KCL/IPMA-Himawari). We focus on annual detections and perform the analysis at 0.5° grid cell resolution, for the overlapping product’s time-series. The results are analysed for their temporal and spatial consistency, and inter-product differences are analysed in the context the product’s metadata.

The results show that an Inverse-gamma distribution can be used to characterize the fire ‘statistical signature’ and provide a reference baseline on to which all FRP products can be compared to, and their ‘representation uncertainty’ assessed. Individually, the fitting results show the degree of under representation of each sensor’s detections, namely the identification of minimum FRP detection limit, which typically precludes the detection of a proportion of the highly numerous but individually relatively small and/or low intensity fires. Furthermore, inter-comparison differences allowed for the identification, and assess the impact, of some of the key non-fire effects such as: pixel size, off-nadir pixel area growth, algorithm limitations, quality information, and the impacts of low temporal resolution of polar-orbiting sensors.

This proposed framework is a useful tool to compare EO-based FRP products and transferable to any product measuring transitory event properties that do not rely on simultaneous observations. It complements existent comparison exercises by identifying additional sources of uncertainty, the conditions under which these occur and how these translate into product inconsistencies. It is an essential tool, providing users with product-specific information on measurement limitations that, in principle, can be corrected and assimilated to higher level products and downstream applications such as GHG emission estimates from biomass burning, providing better quality information used for adaptation and mitigation policies.

How to cite: Mota, B.: Validation framework for EO measurements of transitory events based on robust statistics retrieved from non-simultaneous observations: A case study applied to Fire Radiative Power (FRP) products. , EGU General Assembly 2026, Vienna, Austria, 3–8 May 2026, EGU26-8037, https://doi.org/10.5194/egusphere-egu26-8037, 2026.

EGU26-8718 | ECS | Orals | BG1.1

Global Patterns of Post-Fire Vegetation Productivity Recovery 

Zhengyang Lin, Anping Chen, and Xuhui Wang

Fire is a major ecosystem disturbance impacting the global carbon cycle, with its frequency and severity projected to increase. The time required for ecosystems to recover productivity after fire (recovery time) is an important metric for resilience, yet its global patterns remain poorly quantified. Here, we conduct a global analysis using Moderate Resolution Imaging Spectroradiometer (MODIS) observations from 2001 to 2024. We employ satellite-derived burned area data and the near-infrared reflectance of vegetation (NIRv) as a robust proxy for Gross Primary Production (GPP) to track recovery, which is defined as the duration to recover 90% of pre-fire productivity. Our analysis focuses on single-fire events, filtering out areas with recurrent disturbances, and defines recovery as the point when at least 90% of pre-fire productivity is regained.

Our results reveal that the global mean post-fire recovery time is 3.9 ± 0.3 years. This average is masked by strong geographical disparities: recovery follows a pronounced latitudinal gradient, with boreal ecosystems (≥50°N) requiring nearly twice as long to recover (5.6 ± 0.5 years) compared to tropical regions (3.0 ± 0.2 years). Evergreen needleleaf forests exhibit the longest recovery times (6.3 ± 0.9 years), while savannas and grasslands recover fastest. Statistical machine learning modeling identifies the magnitude of the immediate fire-induced GPP loss as the dominant factor controlling recovery duration, with burn severity and pre-fire productivity acting as important secondary drivers.

We show that CMIP6 Earth System Models (ESMs) significantly underestimate these recovery periods (simulating a global mean of 1.8 ± 0.1 years) and fail to capture the observed spatial heterogeneity, particularly in high-latitude regions. This suggests that current models may overestimate the carbon sink capacity of regenerating post-fire landscapes and underestimate positive fire-vegetation feedbacks. Our findings provide a new observational benchmark for improving the representation of post-disturbance dynamics in land surface models and refining global carbon budget assessments.

How to cite: Lin, Z., Chen, A., and Wang, X.: Global Patterns of Post-Fire Vegetation Productivity Recovery, EGU General Assembly 2026, Vienna, Austria, 3–8 May 2026, EGU26-8718, https://doi.org/10.5194/egusphere-egu26-8718, 2026.

Variability in cloud droplet number concentrations (Nd) within the large subtropical stratocumulus decks can strongly impact outgoing shortwave radiation. The southeast Atlantic subtropical stratocumulus deck is particularly prone to elevated Nd, attributed to continental African fire emissions.  The highest stratocumulus Nd occur when Angolan agricultural fires coincide with weak surface warming during the austral winter months (June-early August). Dry convection fills a shallow continental boundary layer with smoke and a nighttime land breeze advects the aerosol into or slightly above the marine boundary layer. The offshore transport is strengthened by low-level easterlies from a continental high to the southeast of Angola that is stronger when the Angolan land is cooler. Simultaneously, the south Atlantic subtropical high (SASH) is weaker when Angolan land warming is more muted, allowing the biomass-burning aerosol to also disperse further south. The shortwave-absorbing aerosol can either reach the remote boundary layer by direct low-lying easterly transport, or through entrainment over longer time scales after being transported south. While the weak Angolan land heating in June-July correlates with higher offshore Nd, these coincide with lower cloud fractions and thinner clouds, primarily because the SASH is also weaker. This meteorological co-variation fully compensates for any aerosol brightening of the cloud deck. Marine cloud brightening by emissions from a southeast Atlantic shipping lane is more evident when Angolan land heating is stronger, coinciding with a stronger SASH, as the background Nd is less and the background cloud fraction is higher. Most of the year-to-year variability from 2003 to 2023 in the June-July marine shortwave cloud radiative effect can be constrained using the surface-level temperature over Angola (r2 = 0.4). While Angolan land has warmed slightly in June-July since 1980 in reanalysis, no trend is evident in synoptic variations of warmer versus cooler heating. Fire emissions have slightly increased since 2003. A continuing warming trend would deepen the continental boundary layer, and could place more of the transported smoke above the marine boundary layer, stabilizing the lower atmosphere through shortwave absorption.

How to cite: Zuidema, P. and Tatro, T.: Weak, low-level dry convection over Angola determines biomass-burning aerosol entry into the marine boundary layer, EGU General Assembly 2026, Vienna, Austria, 3–8 May 2026, EGU26-8759, https://doi.org/10.5194/egusphere-egu26-8759, 2026.

EGU26-9005 | ECS | Orals | BG1.1

Impacts of 2023 Canadian wildfire emissions on solar power over North America and Europe 

Iulian-Alin Rosu, Matthew W. Jones, Manolis Grillakis, Manolis P. Petrakis, Matthew Kasoar, Rafaila-Nikola Mourgela, and Apostolos Voulgarakis

Wildfires are unpredictable combustion events that significantly drive atmospheric emissions and modulate global cloud cover. An extreme example of such an event is the case of the 2023 Canadian wildfires, wherein nearly 5% of Canada’s forested area was burned between May and September 2023 [1]. This event produced the largest wildfire emissions ever recorded in Canada, with plumes extending across the Northern Hemisphere [2]. Aerosol intrusions and associated modifications absorbing and/or scattering can cause variability of solar irradiance [3], while reductions in photovoltaic power anywhere between 13% and 22% can take place because of aerosol optical depth (AOD) increases [4]. Consequently, the plumes resultant from the 2023 Canadian wildfires might have caused significant photovoltaic power losses over North America and Europe.

In this work, the global and local atmospheric impacts of this historic wildfire event are investigated using the EC‑Earth3 Earth system model in the interactive aerosols and atmospheric chemistry configuration (AerChem) [5]. BB emissions from the Copernicus Atmosphere Monitoring Service (CAMS) Global Fire Assimilation System (GFAS) were used through the model to produce two 10-member ensemble simulations, with and without the 2023 Canadian wildfire emissions respectively. The main parameter of interest is the modelled surface downwelling flux anomaly, which enables direct inference of modelled reductions in solar power output.

Model results have shown substantial radiative anomalies during May–September 2023 mainly in North America and Europe, with an average hemispheric shortwave radiation reduction of −4.18 W/m2 leading to PV production deficits. Secondary analyses suggest that surface cooling, which amounted to an average hemispheric temperature anomaly of −0.91 °C and which impacts PV performance, compensated 8–21% of the PV losses, varying by region. The results indicate a total 5-monthly modelled PV generation loss of 6.38 TWh, and the emitted carbon burden equivalent to this reduction in energy production is estimated at 2083 tons of CO2, with a total associated economic deficit of 1.33 billion euros. These findings emphasize the need for integrated transnational strategies in extreme event prediction and wildfire prevention to ensure the continued resilience of renewable energy production.


[1] Roșu, I. A., Mourgela, R. N., Kasoar, M., Boleti, E., Parrington, M., & Voulgarakis, A. (2025). Large-scale impacts of the 2023 Canadian wildfires on the Northern Hemisphere atmosphere. npj Clean Air, 1(1), 22.

[2] Byrne, B., Liu, J., Bowman, K. W., Pascolini-Campbell, M., Chatterjee, A., Pandey, S., ... & Sinha, S. (2024). Carbon emissions from the 2023 Canadian wildfires. Nature, 633(8031), 835-839.

[3] Wendisch, M., & Yang, P. (2012). Theory of atmospheric radiative transfer: a comprehensive introduction. John Wiley & Sons.

[4] Neher I., Buchmann T., Crewell S., Pospichal B. & Meilinger S. (2019). Impact of atmospheric aerosols on solar power. Meteorologische Zeitschrift, 4, 28.

[5] Van Noije, T., Bergman, T., Le Sager, P., O'Donnell, D., Makkonen, R., Gonçalves-Ageitos, M., ... & Yang, S. (2020). EC-Earth3-AerChem, a global climate model with interactive aerosols and atmospheric chemistry participating in CMIP6. Geoscientific Model Development Discussions, 1-46.

How to cite: Rosu, I.-A., Jones, M. W., Grillakis, M., Petrakis, M. P., Kasoar, M., Mourgela, R.-N., and Voulgarakis, A.: Impacts of 2023 Canadian wildfire emissions on solar power over North America and Europe, EGU General Assembly 2026, Vienna, Austria, 3–8 May 2026, EGU26-9005, https://doi.org/10.5194/egusphere-egu26-9005, 2026.

EGU26-9056 | ECS | Orals | BG1.1

Fire as a Catalyst for Carbon Sequestration: Respiration Suppression and Regeneration Feedback in South African Fynbos Shrubland 

Jonathan D. Muller, Warren Joubert, Abri de Buys, Erin Ramsay, Richard Carkeek, and Guy F. Midgley

Wildfires are mainly considered to be CO2-releasing events, while their long-term impact on biogeochemical carbon sequestration remains a major source of uncertainty. We analysed five years of ecosystem-scale eddy covariance data in a South African Fynbos shrubland that experienced a wildfire in the middle of the measurement period and combined it with leaf-scale ecophysiological measurements to quantify the ecosystem-scale carbon feedbacks and energy flux shifts following wildfire.

Unexpectedly, wildfire doubled the annual net carbon sink from 5.36 to 10.55 tC ha-1 yr-1. This increase was driven by a ca. 50% suppression of ecosystem respiration while ecosystem energy exchange remained stable. These findings reveal a significant missing carbon pool of ca. 110 tC ha-1 over the course of the fire return interval of 15-20 years. Likely explanations for this discrepancy are either a below-ground carbon pool protected from volatilization through fire or a potential sink into dissolved carbon, potentially leading to eventual long-term ocean storage.

To identify the biological drivers of this carbon sequestration, we measured gas exchange in the two main regeneration plant types of this fire-dominated ecosystem, i.e. obligate reseeders, whose seedlings must achieve reproduction before the next fire to persist, and resprouting species that invest into fire tolerance traits at the cost of slower growth. Stomatal conductance (gsw) was the primary trait distinguishing the two strategies. Reseeders initiated photosynthesis earlier in spring and exhibited gsw that was highly responsive to changes in ambient CO2 and light, while resprouters exhibited stronger resilience to drought but no response to ambient CO2 fluctuations. This difference in response to CO2 suggests that current climate trends may preferentially boost reseeders, potentially partially offsetting the impacts of shortened fire return intervals. Conversely, resprouter resilience may prove crucial under a higher drought intensity and duration scenario.

Our unexpected findings for this Mediterranean-climate shrubland (typically considered to be a low carbon sink ecosystem) underscore the necessity for ground-based ecophysiological data to constrain Earth system models, and challenge biomass-centric climate policies, particularly in fire-prone, naturally tree-free ecosystems.

How to cite: Muller, J. D., Joubert, W., de Buys, A., Ramsay, E., Carkeek, R., and Midgley, G. F.: Fire as a Catalyst for Carbon Sequestration: Respiration Suppression and Regeneration Feedback in South African Fynbos Shrubland, EGU General Assembly 2026, Vienna, Austria, 3–8 May 2026, EGU26-9056, https://doi.org/10.5194/egusphere-egu26-9056, 2026.

The late dry season of 2019 featured one of the most severe Indonesian wildfire events of the past decade, driven by persistent drought and extensive peatland burning. These extreme wildfires emitted large amounts of carbonaceous aerosols, substantially degrading air quality and posing risks to human health. However, the impacts of extreme wildfire events on black carbon (BC) across Southeast Asia remain poorly quantified. Here, we evaluate the influence of Indonesian wildfires during August–October 2019 using the GEOS-Chem chemical transport model at 0.25° × 0.3125° resolution. Sensitivity simulations with and without Indonesian fire emissions are conducted to isolate fire-driven contributions to BC. Results indicate dominant wildfire control over BC across Southeast Asia. Fire contributions reach about 91% over both Borneo and Sumatra during peak burning. Comparable fire influence extends to nearby seas, particularly the South China Sea, with contributions exceeding 90% over the southern South China Sea. Contributions remain near 70% over the Sulu and Celebes Seas and still reach about 50% over the Philippine Sea. In contrast, impacts over the East China Sea are episodic, occurring only during short-lived northeastward outflow events. These findings demonstrate the strong and spatially heterogeneous influence of Indonesian wildfires on regional BC across Southeast Asia, highlighting the role of extreme wildfire events in shaping air quality through fire-driven transboundary transport.

How to cite: Zheng, H.: Impacts of the 2019 extreme Indonesian wildfires on black carbon across Southeast Asia, EGU General Assembly 2026, Vienna, Austria, 3–8 May 2026, EGU26-9088, https://doi.org/10.5194/egusphere-egu26-9088, 2026.

EGU26-9452 | Posters on site | BG1.1

How asynchronous is fire burning in Iberia and the Central–Eastern Mediterranean? A dependence analysis of burned area, fire activity, and teleconnection forcing to inform shared European suppression fleets 

Ana Russo, Célia Gouveia, Virgílio Bento, João M. N. Silva, Carlos DaCamara, Ricardo M. Trigo, and José M. C. Pereira

European wildfire response systems are increasingly challenged by the simultaneous demand for aerial and ground suppression assets. If major fire-prone regions burn asynchronously, Europe could benefit from risk-diversified deployment of shared suppression fleets and more efficient cross-border mutual-aid strategies. We test the hypothesis that fire activity in (1) the Iberian Peninsula (Portugal and Spain) and (2) Central–Eastern Mediterranean (Italy and Greece) exhibits identifiable and temporally stable dependence patterns modulated by large-scale climate variability.
Annual burned-area time series covering 1980–2023 are compiled from the European Forest Fire Information System (EFFIS). These are complemented by satellite-derived indicators of fire activity from MODIS, namely Fire Radiative Power (FRP), enabling joint assessment of burned area extent and fire intensity. Climate-fires’ dependence is quantified through correlations of annual and seasonal anomalies and joint-extreme metrics focused on tail co-exceedance probability. The relationship between fire activity (burned area, FRP, FRE) and large-scale climate variability is assessed following established teleconnection-based frameworks, combining seasonal aggregation, lagged cross-correlation analysis, and composite analysis of extreme fire years. Teleconnection indices considered include the North Atlantic Oscillation (NAO), East Atlantic pattern (EA), Mediterranean Oscillation Index (MOI), Arctic Oscillation (AO), and ENSO. Analyses explicitly account for the non-stationary and scale-dependent nature of teleconnection–fire relationships, and are conditioned on regional temperature and precipitation anomalies to isolate circulation-driven effects.

The analysis aims to identify: (i) the frequency and persistence of synchrony versus compensatory (negative) dependence in burned area and fire activity between the two macro-regions, (ii) the teleconnections most strongly associated with synchronous extreme fire seasons, and (iii) multi-decadal periods offering potential for suppression-fleet diversification. Owing to its direct control on Mediterranean-scale pressure gradients and precipitation contrasts, MOI provides the primary explanatory signal for synchronous versus compensatory fire activity between the two macro-regions.

Results are interpreted within an operational risk-pooling framework, where weak or negative dependence supports climate-informed scheduling of shared European suppression fleets and enhanced cross-border mutual aid, while strong positive dependence indicates heightened likelihood of concurrent continental-scale resource strain.


This work is partially supported by FCT, I.P./MCTES through national funds (PIDDAC): LA/P/0068/2020 – https://doi.org/10.54499/LA/P/0068/2020, UID/50019/2025 – https://doi.org/10.54499/UID/PRR/50019/2025, UID/PRR2/50019/2025 and Dhefeus (https://doi.org/10.54499/2022.09185.PTDC). AR, JMCP and JMNS also thank the FCT by supporting UIDB/00239/2020 (https://doi.org/10.54499/UIDB/00239/2020), UIDP/00239/2020 (https://doi.org/10.54499/UIDP/00239/2020), and through project references UIDB/00239/2020 (https://doi.org/10.54499/UIDB/00239/2020) and UIDP/00239/2020 (https://doi.org/10.54499/UIDP/00239/2020) and European Space Agency Climate Change Initiative (ESA-CCI9 Tipping Elements SIRENE project (Contract No. 4000146954/24/I-LR). 

How to cite: Russo, A., Gouveia, C., Bento, V., Silva, J. M. N., DaCamara, C., Trigo, R. M., and Pereira, J. M. C.: How asynchronous is fire burning in Iberia and the Central–Eastern Mediterranean? A dependence analysis of burned area, fire activity, and teleconnection forcing to inform shared European suppression fleets, EGU General Assembly 2026, Vienna, Austria, 3–8 May 2026, EGU26-9452, https://doi.org/10.5194/egusphere-egu26-9452, 2026.

EGU26-10271 | Orals | BG1.1

First results from INFLAMES - Interdisciplinary Network for Fire research from Low Earth Orbit Atmospheric Measurements 

K. Folkert Boersma, Martin de Graaf, Otto Hasekamp, Marloes Penning de Vries, Anton Vrieling, Nick Schutgens, Gerbrand Koren, Peter van Bodegom, Dimitra Kollia, Manouk Geurts, and Annabel Chantry

Wildfires are powerful forces of nature, shaping ecosystems, degrading air quality, and influencing the climate. Human activities intensify fires through land use change, accidental ignitions, and droughts driven by climate change. However, the complex interactions between climate change, vegetation shifts, and human behavior—and their consequences for wildfires—remain poorly understood. The Dutch innovations in atmospheric satellite sensors SPEXone, EarthCARE and TROPOMI now allow detailed studies of wildfires and their nearby and far-reaching consequences. The recently funded and started INFLAMES-project (Interdisciplinary Network for Fire research from Low Earth Orbit Atmospheric Measurements) aims to combine cutting-edge satellite data with state-of-the-art modeling techniques to unravel how wildfires alter air quality and climate, with a special focus on vegetation’s evolving role—both as a fuel source and a carbon sink in fire-affected regions. 

In this presentation, we demonstrate the scientific ambition of the INFLAMES-project. We then show the first scientific results from INFLAMES, including satellite-derived trace gas (NOx, VOCs) and aerosol emission estimates for severe fires in Les Landes, France (August 2022), based on TROPOMI and MODIS observations and evaluated against the GFED emission inventory. We further show the first coincident EarthCARE, PACE and TROPOMI observations of wildfire plume heating-rate profiles over the Pantanal, demonstrating the potential of combined active–passive satellite measurements to directly constrain aerosol radiative effects. Together, these results establish a pathway toward improved quantification of the Aerosol Direct Radiative Effect (ADRE), a major remaining uncertainty in present-day radiative forcing, which will be further addressed using aerosol microphysical constraints from SPEXone on PACE. We conclude by highlighting opportunities for broader community engagement through dedicated workshops and an international summer school.

How to cite: Boersma, K. F., de Graaf, M., Hasekamp, O., Penning de Vries, M., Vrieling, A., Schutgens, N., Koren, G., van Bodegom, P., Kollia, D., Geurts, M., and Chantry, A.: First results from INFLAMES - Interdisciplinary Network for Fire research from Low Earth Orbit Atmospheric Measurements, EGU General Assembly 2026, Vienna, Austria, 3–8 May 2026, EGU26-10271, https://doi.org/10.5194/egusphere-egu26-10271, 2026.

EGU26-10325 | ECS | Orals | BG1.1 | Highlight

Tropical Small-Scale Nuclear War Fire Emissions Cause Greater Ozone Depletion Than Extratropical Large-Scale Conflicts 

Zhihong Zhuo, Francesco S. R. Pausata, Kushner J. Paul, and Anson K. H. Cheung

Nuclear conflict can ignite widespread fires that inject massive quantities of smoke particles into the atmosphere. Using the chemistry–climate model CESM2-WACCM6, we simulate idealized nuclear war scenarios with varying emission magnitudes of black carbon (BC) and primary organic matter (POM) released at 150~300 hPa over a 7-day period. Model results show that absorption of solar radiation by BC and POM leads to stratospheric temperature increases exceeding 50 K. This intense heating enhances the vertical lofting of smoke particles, enabling their transport even into the lower mesosphere and significantly extending their atmospheric residence time to over 4 years, thus leading to long-term environmental and climatic impacts. Even a regional nuclear conflict between India and Pakistan, emitting 5 Tg of BC (IP-5B scenario), results in a global total column ozone reduction exceeding 400 Tg (~12%), comparable in magnitude to that simulated for a large-scale nuclear war between USA and Russia with 16 Tg of BC emissions (UR-16B scenario). The co-emission of POM further amplifying stratospheric ozone depletion, leading to increased ultraviolet (UV) radiation at the surface. This heightened UV exposure poses serious risks to ecosystems and human health.

How to cite: Zhuo, Z., Pausata, F. S. R., Paul, K. J., and Cheung, A. K. H.: Tropical Small-Scale Nuclear War Fire Emissions Cause Greater Ozone Depletion Than Extratropical Large-Scale Conflicts, EGU General Assembly 2026, Vienna, Austria, 3–8 May 2026, EGU26-10325, https://doi.org/10.5194/egusphere-egu26-10325, 2026.

EGU26-11040 | Orals | BG1.1

Linking Air Quality and Marine Ecosystem Responses to Biomass Burning Aerosols in the Adriatic Coastal Zone 

Sanja Frka, Ana Depolo, Jasna Arapov, Sanda Skejić, Danijela Šantić, Ana Cvitešić Kušan, Fred Chaux, Estela Vicente, Célia Alves, and Lara Bubola

Climate change projections point to a sustained rise in emissions from biomass burning (BB), highlighting the need for a comprehensive evaluation of the environmental impacts of BB-derived aerosols (BBA). Of particular importance is the organic aerosol fraction (BBOA), which is chemically reactive and undergoes complex transformations during atmospheric ageing. These processes are especially critical in coastal regions, where strong coupling between atmospheric and marine systems can amplify environmental and ecological risks. In this study, we apply a multidisciplinary framework combining atmospheric chemistry, aerosol characterization, modeling, marine science, and toxicology to investigate the physicochemical properties of BBA, with emphasis on BBOA, and to assess how their atmospheric evolution affects air quality and marine ecosystems.

A comprehensive field campaign was conducted in the central Adriatic region, an area frequently impacted by intense wildfire events yet still poorly characterized in terms of BB influences. During controlled pinewood biomass burning experiments in April 2025, real-time measurements were conducted using state-of-the-art instrumentation, including a Scanning Mobility Particle Sizer (SMPS), an Optical Particle Counter (OPC), gas analyzers, and a CASS system combining an Aethalometer and a Total Carbon Analyzer. In parallel, fine particulate matter (PM2.5), volatile organic compounds (VOCs), and size-resolved aerosols (0.010–32 µm) were collected for comprehensive offline analyses, including the determination of trace metals, major ions, anhydrosugars, polyols, organic carbon, and aerosol oxidative potential.

To link atmospheric processes with marine impacts, laboratory exposure experiments were performed to evaluate the effects of ambient BB aerosols and model black carbon materials on the growth of representative marine phytoplankton species (such as Emiliania huxleyi, Cylindrotheca closterium, Melosira nummuloides, Synechococcus sp.) under controlled conditions (18 °C; 16 h light/8 h dark). These experiments reveal species-specific physiological responses to BB aerosol exposure. Overall, the integrated dataset provides new insights into the properties and evolution of BB aerosols and their cascading impacts on coastal air quality and marine ecosystem health in the Adriatic region, with broader implications for other vulnerable coastal environments.

This work was supported by Croatian Science Foundation project IP-2024-05-6224 ADRIAirBURN.

How to cite: Frka, S., Depolo, A., Arapov, J., Skejić, S., Šantić, D., Cvitešić Kušan, A., Chaux, F., Vicente, E., Alves, C., and Bubola, L.: Linking Air Quality and Marine Ecosystem Responses to Biomass Burning Aerosols in the Adriatic Coastal Zone, EGU General Assembly 2026, Vienna, Austria, 3–8 May 2026, EGU26-11040, https://doi.org/10.5194/egusphere-egu26-11040, 2026.

EGU26-11423 | Posters on site | BG1.1

Integrating the Global Forest Fire Emissions Prediction System version 1.0 to GEOS-Chem  

Timothé Payette, Samaneh Ashraf, Patrick Hayes, and Jack Chen

Wildfire smoke is an increasingly important driver of regional air-quality degradation, with well-established impacts on public health and visibility. Although emission controls have reduced many anthropogenic air pollutants over recent decades, wildfire activity has intensified in many regions, increasing the contribution of fine particulate matter (PM2.5; aerodynamic diameter < 2.5 μm) to surface pollution episodes. A key limitation in simulating wildfire smoke in chemical transport models is uncertainty in biomass-burning emissions, as inventories can have different mythologies and assumptions, such as fire occurrence, intensity, burn area, fuel characterization, and emission factors. These discrepancies can translate into substantial variability in modeled PM2.5 and related co-emitted species, complicating both forecasting and attribution of smoke impacts. Here, we implement and evaluate the Global Forest Fire Emissions Prediction System (GFFEPS), a wildfire emissions framework developed by Environment and Climate Change Canada (ECCC), within the GEOS-Chem chemical transport model. We perform simulations for Canada, the United States, and Europe in 2019, and for Australia in 2019–2020, to quantify the sensitivity of simulated smoke to fire emissions and to assess model skill against observations. GFFEPS-driven simulations are compared with those using widely applied global biomass-burning inventories (the Global Fire Emissions Database (GFED), the Global Fire Assimilation System (GFAS), and the Quick Fire Emissions Dataset (QFED2)) and evaluated using ground-based PM2.5 monitoring data across each region. Inventory choice strongly influences both the magnitude and timing of simulated PM2.5 enhancements, with clear regional dependence and the largest inter-inventory spread during extreme fire events. Over North America, GFFEPS shows the best overall performance among the four inventories based on the mean error metric. Over Australia, GFFEPS generally underestimates PM2.5 concentrations but remains a strong performer, ranking second behind GFAS using the same evaluation metric. Over Europe, GFFEPS ranks third, following GFAS and GFED, and is closely comparable to QFED2. These results highlight the need to better constrain fire detection and fuel consumption estimates, and demonstrate the value of GFFEPS within GEOS-Chem for diagnosing key drivers of inter-inventory differences and improving confidence in regional wildfire smoke simulations.

How to cite: Payette, T., Ashraf, S., Hayes, P., and Chen, J.: Integrating the Global Forest Fire Emissions Prediction System version 1.0 to GEOS-Chem , EGU General Assembly 2026, Vienna, Austria, 3–8 May 2026, EGU26-11423, https://doi.org/10.5194/egusphere-egu26-11423, 2026.

EGU26-11440 | Orals | BG1.1

A global CO fire emissions assessment and its connection with drought events 

Hélène Peiro, Ivar van der Velde, Guido van der Werf, Sander Houweling, Pieter Rijsdijk, and Ilse Aben

Fire is a dominant terrestrial ecosystem disturbance and a major driver of atmospheric composition. Quantifying fire emissions and their variability remains a key challenge, particularly as fire frequency and intensity vary and increase under climate change. Inverse modeling provides a powerful framework to estimate fire emissions by constraining chemistry transport models (CTMs) with satellite observations, while simultaneously delivering three-dimensional information on the transport and distribution of fire-related pollutants.

In this study, we use the global CTM TM5 coupled with a four-dimensional variational data assimilation system (TM5-4DVar) to better constrain fire-related carbon monoxide (CO) emissions using satellite observations. We assimilate CO column super-observations from the Measurements of Pollution In The Troposphere (MOPITT) instrument aboard NASA’s Terra satellite (version 9) and, separately, higher spatiotemporal resolution CO observations from the TROPOspheric Monitoring Instrument (TROPOMI) aboard ESA’s Sentinel-5P. The assimilations are performed globally at 3° × 2° horizontal resolution over multiple years (2019–2024).

The posterior simulations provide insights into both regional fire emissions and the horizontal and vertical transport of CO, enabling assessment of downwind pollution impacts, evaluated against independent ground-based observations. Results show bias reductions with posterior simulated mixing ratios in comparison to prior simulations based on bottom-up emission inventories. We further investigate the influence of regional drought conditions on fire-related CO emissions and examine correlations with key environmental variables, including climate and vegetation indicators. Our results contribute to an improved understanding of interactions among fire emissions, climate, and atmospheric composition, and demonstrate the value of remote sensing data assimilation for reducing uncertainties and advancing fire emission monitoring.

How to cite: Peiro, H., van der Velde, I., van der Werf, G., Houweling, S., Rijsdijk, P., and Aben, I.: A global CO fire emissions assessment and its connection with drought events, EGU General Assembly 2026, Vienna, Austria, 3–8 May 2026, EGU26-11440, https://doi.org/10.5194/egusphere-egu26-11440, 2026.

EGU26-11975 | Orals | BG1.1

Impacts of wildfire plumes from Northern America on atmospheric composition as observed by permanent observatories in Italy during June 2025 

Paolo Cristofanelli, Francesca Barnaba, Alessandro Bracci, Claudia Roberta Calidonna, Rita Cesari, Daniele Contini, Luca Diliberto, Francesco d'Amico, Stefano Decesari, Adelaide Dinoi, Leonardo Gori, Angela Marinoni, Lucia Mona, Davide Putero, Isabella Zaccardo, and Marco Zanatta

In May and June 2025, wildfires in Canada produced atmospheric effects extending beyond North America. Large quantities of gases and aerosols emitted by biomass combustion were transported across the Atlantic and reached Europe. Here, our aim is to investigate how these events affect the variability of climate-altering species in Italy using observations from permanent observatories.

Clear evidences of this long-range transport were observed from 8th June 2025 at the GAW/WMO Global Station “O. Vittori” at Monte Cimone (2165 m a.s.l., northern Italy) and at the Potenza CIAO observatory (760 m a.s.l., southern Italy), two co-located sites for the Research Infrastructures ICOS and ACTRIS. It was also observed, albeit with weaker intensity, at the ACTRIS Environmental-Climate Observatory (ECO) in Lecce (37 m a.s.l., southern Italy). Atmospheric transport modelling (LAGRANTO and HYSPLIT back-trajectories) confirmed that the air masses affecting the sites originated in North America.

Average daily carbon monoxide (CO) values peaked to 207 ppb on 9th June at CMN and to 247 ppb at ECO, nearly doubling the levels measured during the preceding 7 days. Also, black carbon (BC) showed marked increases, with values more than doubling the average of the preceding days at both sites.

Additional confirmation of the plume’s arrival and vertical evolution was provided by the ALICE-Net ceilometer at CMN: between 6th and 8th June, aerosol-rich layers were detected at high altitudes before gradually descending to the measurement site. At CIAO, the aerosol lidar observed smoke layers between 11 and 14 km from 5th to 10th June.

CO and ozone (O₃) remained high until 13th June at CMN (average values: 188 ppb and 70 ppb), and at ECO (average CO value of 232 ppb, O3 data not available). Subsequently, intermediate values have been observed from 14th to 21st June. At CIAO, CO increased between 8th and 17th June, reaching up to 250 ppb.

No corresponding increases in carbon dioxide (CO₂) have been observed during the wildfire plume event. During the days characterized by the peaks in CO and O3 (8th  – 13th June), daily mean CO2 values showed a – 6.4 ppm and – 3.4 ppm decrease with respect to the previous 7 days at CMN and ECO. The analysis of back-trajectories showed air masses travelling at pressure levels representative of the European PBL, where active ecosystems could take up CO₂, in the 24 hours before the arrival at CMN.

The analysis of the day-to-day variability of nighttime/daytime N2O, CO2 and δ13CO2, pointed to a significant influence of air masses from the regional PBL to CMN during the daytime on 9th – 14th and 18th – 19th June. This suggests that emissions occurring at regional scale could contribute to the observed atmospheric composition variability. Together with the role of air mass mixing and in-plume chemical processes along transport, this implies that attributing the observed enhancements to wildfire emissions requires careful and critical evaluation.

Acknowledgments: Observations/analyses are supported by the ITINERIS (PE0000021, NRRP – NextGenerationEU) and PRO-ICOS MED (PON 2014–2020) projects, funded by the Italian Ministry of University and Research and the European Union.

How to cite: Cristofanelli, P., Barnaba, F., Bracci, A., Calidonna, C. R., Cesari, R., Contini, D., Diliberto, L., d'Amico, F., Decesari, S., Dinoi, A., Gori, L., Marinoni, A., Mona, L., Putero, D., Zaccardo, I., and Zanatta, M.: Impacts of wildfire plumes from Northern America on atmospheric composition as observed by permanent observatories in Italy during June 2025, EGU General Assembly 2026, Vienna, Austria, 3–8 May 2026, EGU26-11975, https://doi.org/10.5194/egusphere-egu26-11975, 2026.

The 2019–2020 Australian Black Summer megafires burned over eight million hectares of vegetation and constituted an extreme perturbation to terrestrial carbon cycling, releasing an unprecedented quantity of greenhouse gases to the atmosphere. Quantifying fire-driven emissions remains a key challenge, as emission inventories typically fall into one of two categories; bottom-up approaches (such as with the Global Fire Emission Database, GFED) that rely on burned area, fuel load, and combustion completeness estimates, or top-down approaches, (such as the Global Fire Assimilation System, or GFAS) which scale Fire Radiative Power (FRP) observations to emissions using emission coefficients. Currently, the two most widely used inventories (GFED and GFAS) ultimately rely heavily on uncertain modelled estimates of broad scale biome-specific combustion completeness, which remains a major limitation in constraining carbon fluxes from fires. We apply the Fire Radiative Energy Emission (FREM) approach, a top-down framework that directly links observed Fire Radiative Energy (FRE) to trace gas emissions, thereby reducing reliance on poorly constrained fuel and combustion assumptions. FREM is derived from co-located observations of FRP from the geostationary Himawari satellite and carbon monoxide (CO) from TROPOMI aboard Sentinel-5P. A dataset of 580 cloud-free landscape fires and associated plumes across six major Australian biomes (low woodland savanna, grassland, shrubland, evergreen and deciduous broadleaf forests, and sparse vegetation) was assembled for 2019 to derive biome-specific emission coefficients relating FRE to excess CO. These coefficients, combined with a calculated small-fire correction factor and hourly FRE observations from Himawari, were used to estimate emissions from the Black Summer megafires and to compare FREM-derived fluxes with those from existing inventories (GFAS v1.2, GFED v4.1s, GFED v5.1, and the Fire Energetics and Emissions Research, or FEER). The FREM estimates exhibit coherent spatial and temporal patterns and fall within the spread of emissions reported by these inventories, indicating consistency at regional scales while retaining sensitivity to fire intensity and temporal variability. By utilizing the geostationary FRP observations from Himawari, the FREM approach provides high-temporal-resolution, near-real-time estimates of fire emissions across Australia that are directly linked to observed radiative energy release, and bypasses the need for fuel load and combustion completeness estimations.

How to cite: Maslanka, W., Xu, W., Wooster, M., and He, J.: Quantifying Greenhouse Gas emissions from the Australian Black Summer Megafires using the Fire Radiative Energy Emission (FREM) Approach, EGU General Assembly 2026, Vienna, Austria, 3–8 May 2026, EGU26-12220, https://doi.org/10.5194/egusphere-egu26-12220, 2026.

EGU26-12251 | Orals | BG1.1

Feedback Loop between fire and land degradation 

Diana Vieira, Pasquale Borrelli, and Panos Panagos

Wildfires are increasingly shaping terrestrial ecosystems, with profound implications for land degradation processes across fire-prone regions.

This work advances the assessment of post-fire land degradation by jointly analysing fire occurrence, burn severity and vegetation recovery as key indicators of ecosystem vulnerability. By integrating multi-temporal fire records (2001-2019) the study captures both the frequency of disturbances and its immediate ecological impact, enabling another view on the evaluation of degradation trajectories globally (Vieira et al., 2026) .

Results indicate that recurrent fires, particularly when combined with high-severity events, substantially exacerbate vegetation loss, and erosion risk, thereby accelerating land degradation processes. Preliminary results indicate that areas experiencing short fire-return intervals show limited recovery capacity, leading to cumulative impacts on soil health, which on turn might be leading to alternate states (McGuire et al., 2024) . The analysis further highlights strong spatial variability, where land cover, and pre-fire conditions influence degradation response.

Overall, this work underscores the importance of moving beyond binary burned–unburned classifications and incorporating fire severity and recurrence into land degradation assessments. Such an approach provides critical insights for post-fire management, restoration prioritisation, and the development of adaptive strategies aimed at mitigating long-term degradation under a changing fire regime.


McGuire, L. A., Ebel, B. A., Rengers, F. K., Vieira, D. C. S., and Nyman, P.: Fire effects on geomorphic processes, Nat Rev Earth Environ, 1–18, https://doi.org/10.1038/s43017-024-00557-7, 2024.

Vieira, D. C. S., Borrelli, P., Scarpa, S., Liakos, L., Ballabio, C., and Panagos, P.: Global estimation of post-fire soil erosion, Nat. Geosci., 19, 59–67, https://doi.org/10.1038/s41561-025-01876-0, 2026.

How to cite: Vieira, D., Borrelli, P., and Panagos, P.: Feedback Loop between fire and land degradation, EGU General Assembly 2026, Vienna, Austria, 3–8 May 2026, EGU26-12251, https://doi.org/10.5194/egusphere-egu26-12251, 2026.

EGU26-13135 | ECS | Orals | BG1.1

Benefits and limits of Integrated Fire Management for climate change adaptation: a global quantitative assessment  

Oliver Perkins, Matthew Kasoar, Olivia Haas, Cathy Smith, Joao Teixeira, Apostolos Voulgarakis, Jay Mistry, and James Millington

Wildfires are increasing in severity and harm to humans, creating a pressing climate change adaptation challenge. Current firefighting-focused management approaches in the Global North can drive fuel accumulation and increased fire intensity. In contrast, Indigenous peoples and local communities have used controlled burning to successfully co-exist with fire for at least 50,000 years. Consequently, intentional and controlled burning of landscape vegetation has been suggested as a strategy to adapt to climate-altered fire regimes in an approach known as Integrated Fire Management.  

Here, we present the first quantitative global assessment of controlled burning in Integrated Fire Management (IFM) for climate change adaptation, using the JULES-INFERNO dynamic global vegetation model coupled to the WHAM! agent-based model of human fire use and management. WHAM! has agent types to represent both fire exclusionary, suppression-oriented and pyro-inclusive, controlled burning (IFM) land manager approaches. This new online coupling includes novel representations of human fire use seasonality and fireline intensity. Modelled fireline intensity, accounting for climate, fuel and human management now drives fire-induced vegetation mortality in JULES. Hence, the WHAM-JULES-INFERNO ensemble can assess the human and climate drivers of future fire intensity, and also fire-vegetation feedbacks resulting from contrasting management approaches.  

We explored two Shared Socio-Economic Pathways (SSP1.26 and SSP3.70), using gridded socio-economic capitals consistent with the SSP scenarios and biophysical forcings from three ISIMIP 3b ESMs. Additionally, we drew on WHAM! functionality to complement the SSPs scenarios with two IFM scenarios: “IFM-max”, in which the world turns increases controlled burning through IFM; and “Suppression-max”, in which IFM is abandoned and the world focuses on fire exclusion and suppression. 

We find that IFM can play an important role in constraining future fire hazard and intensity. However, we also identify barriers and confounding factors that may limit implementation. Notably, even in a low emissions-scenario (SSP1.26) with increased adoption of IFM, fire hazard is still 40.0% [32.1%-49.6%] higher in 2100 than in 2015. Importantly, we find that the impact of IFM is smaller than general land management changes resulting from economic conditions of the SSPs. For example, for both IFM scenarios mean 2100 fire intensity is higher in SSP1.26 than SSP3.70 because changes in fire management do not offset increases in intensity due to reduced human fire use between the SSPs. Specifically, in SSP1, rapid economic growth in low-income countries (e.g. sub-Saharan Africa) sees fire use in agriculture and forestry increasingly replaced by chemicals and machinery.  

Our results suggest that incremental changes in land and fire management may be an insufficient response to the combined impacts of socio-economic and climate change. Transformative approaches that change fundamental relationships between economic development and fire suppression could in principle address this adaptation shortfall, but will need to grapple with how to integrate and maintain low-intensity fire in capital-intensive land systems on an increasingly flammable planet. 

How to cite: Perkins, O., Kasoar, M., Haas, O., Smith, C., Teixeira, J., Voulgarakis, A., Mistry, J., and Millington, J.: Benefits and limits of Integrated Fire Management for climate change adaptation: a global quantitative assessment , EGU General Assembly 2026, Vienna, Austria, 3–8 May 2026, EGU26-13135, https://doi.org/10.5194/egusphere-egu26-13135, 2026.

EGU26-13146 | Orals | BG1.1

Global near-real time burned area mapping with Sentinel-2 based on reflectance modelling and deep learning 

Marc Padilla, Ruben Ramo, Jose Luis Gomez-Dans, Sergio Sierra, Bernardo Mota, Roselyne Lacaze, and Kevin Tansey

Global burned area (BA) products are commonly available at a Non-Time Critical (NTC) basis, several months or even several years from the present date; i.e. they are unavailable for Near-Real Time (NRT) applications. The Copernicus Land Monitoring Service (CLMS) delivers the only global BA product in NRT, since recently, at very high accuracy, comparable to the most accurate non-CLMS NTC product (FIRECCIS311). However, global BA products are generated from coarse >= 300 m reflectance observations. Despite the Sentinel-2 mission having been in operation since 2017, providing decadal resolution 10-50 m reflectance data every ~5 days, and despite the well-known benefits of using decadal resolution data to estimate BA, a global Sentinel-2 NRT BA algorithm does not exist. The purpose of this study is to adapt and apply the latest developments in NRT detection, as implemented in the CLMS, to Sentinel-2 L2A imagery. The mapping method uses a neural network (NN) with 2D convolutional layers, followed by a Long Short-Term Memory (LSTM) layer. The NN processes the time series of reflectance images on a per-pixel basis, with convolutional layers applied along the spectral and temporal dimensions. The time series of fractional BA maps, predicted by the NN, are combined with time series of spatio-temporal density of VIIRS active fire detections. Such a combination consists of a logistic model and allows the reduction of false positives (such as cloud shadows). The NN is trained on a sample dataset automatically generated from time series reflectance observations (Sentinel-2 data in this case), extracted over locations of VIIRS active fire detections across the Globe for the year 2020, and corresponding estimates of fractional BA, derived from physically-based radiative transfer modelling. The mapping method generates one BA map for each new Sentinel-2 image available (referred to as BAS2nrt0), which is updated with images from the following 5 days (referred to as BAS2nrt5) and the following 10 days (referred to as BAS2nrt10). The additional images available after the mapping day are expected to reduce false positives due to cloud shadows. The mapping method also generates an NTC BA map for each calendar month (referred to as BAS2ntc), with images available for a buffer of 45 days around the month. The algorithm results are validated against an independent global reference dataset for the year 2019, which includes long time series of Landsat-derived BA maps covering 105 sampling units distributed across the Globe. The analysis of the 2019 validation results shows that the accuracy of the proposed Sentinel-2 products is high regardless of estimation timeliness. As expected, (1) the accuracy of the NTC product, Dice coefficient (DC) of 87.2%, is higher than the NRT products, DC 82.7–85.4%, and (2) the accuracy of the NRT product is increased with each update. Such accuracy levels are remarkably high: the accuracy of NRT estimates is comparable to a precedent global non-CLMS NTC Sentinel-2 BA mapping (DC 81.8%).

How to cite: Padilla, M., Ramo, R., Gomez-Dans, J. L., Sierra, S., Mota, B., Lacaze, R., and Tansey, K.: Global near-real time burned area mapping with Sentinel-2 based on reflectance modelling and deep learning, EGU General Assembly 2026, Vienna, Austria, 3–8 May 2026, EGU26-13146, https://doi.org/10.5194/egusphere-egu26-13146, 2026.

EGU26-14942 | ECS | Orals | BG1.1

Wildfire-driven Stratospheric Perturbations:Modelling Insights from the Australian Wildfires 

Meghna Soni, Ben Johnson, and Jim Haywood

The rising frequency and intensity of wildfire-driven pyro-cumulonimbus (pyroCb) events constitute an important atmospheric perturbation, injecting massive amounts of smoke into the stratosphere. The Australian Black Summer wildfires of 2019–2020 released about a million tonnes of smoke and gases, causing the most significant stratospheric temperature perturbation since 1991 Pinatubo eruption. This study simulates the evolution of smoke plumes from the Australian wildfires using the UKESM1.1 model. The aerosol and greenhouse gas follow the CMIP6 SSP245 scenario, with 0.62 Tg of total smoke injected into the upper troposphere/lower stratosphere based on estimates from Global Fire Emissions Database (GFED). The simulated aerosol layer expands both vertically and horizontally, with significant lofting in the first month following injection, reaching altitudes of ~30 kms, consistent with CALIPSO observations. The modelled zonal-mean aerosol extinction agrees well with OMPS retrievals, with peak values of around 0.006 km⁻¹. However, the modelled stratospheric AOD is higher (up to ~2 times) than the observations showing the aerosols in the model are more optically efficient. Additional sensitivity tests are ongoing to examine whether a higher initial injection altitude in these simulations might be causing the aerosols to remain in the stratosphere longer and decay more slowly. These findings highlight the need for improved observational constraints and modelling strategies to better quantify the global impacts of wildfire-induced stratospheric smoke.

How to cite: Soni, M., Johnson, B., and Haywood, J.: Wildfire-driven Stratospheric Perturbations:Modelling Insights from the Australian Wildfires, EGU General Assembly 2026, Vienna, Austria, 3–8 May 2026, EGU26-14942, https://doi.org/10.5194/egusphere-egu26-14942, 2026.

Fire is a major driver of forest change worldwide. In tropical regions, it is primarily used by local populations to clear forested land for human activities such as agriculture and infrastructure development. Here, we use three decades of Landsat-based observations to analyse fire-related forest loss over a broad temporal scale across a major tropical region in South America, spanning more than 2 million km² and encompassing a wide range of ecosystems. This long-term assessment provides a comprehensive view of post-fire forest cover dynamics, with strong potential to capture deforestation trends, forest fate, and the roles of protection status and landscape history. Over the study period, the newly generated medium-resolution dataset of burned area detected a cumulative total of approximately 345 million hectares burned, equivalent to an average annual burned fraction of 5.65%, with pronounced interannual variability and the period between 1999 and 2010 being the most extreme. During the same timeframe, more than 24.5 million hectares of forest were lost, representing nearly one-quarter of the 1990 forest extent, with fires accounting for 26% of this loss. Most of these losses have not recovered over time and were subsequently followed by deforestation, with 99% of affected areas converted to pastures and croplands, while recovery rates have remained negligible. Fragmentation and fire history legacy emerged as critical factors influencing the trajectory of forest loss.

How to cite: Khairoun, A. and Salinero, E.: Analysis of long-term fire-related deforestation and cover change dynamics in South American ecosystems, EGU General Assembly 2026, Vienna, Austria, 3–8 May 2026, EGU26-15336, https://doi.org/10.5194/egusphere-egu26-15336, 2026.

EGU26-15696 | ECS | Orals | BG1.1

Changes in biomass burning in Africa since the last glacial maximum: a new continental-scale paleo-synthesis and interrogation of the climatic and human drivers of shifting fire regimes 

Nicholas O’Mara, Esther Githumbi, Patrick Bartlein, Marie Norwood, Oriol Teruel, Julie Aleman, Carla Staver, and Jennifer Marlon

Fires on Earth are changing in response to human activities, both through direct ecosystem management and indirect climate change-induced warming and associated shifts in regional rainfall patterns. While increased burning in forested systems often captures international media attention, the decline in burning in grassy systems––especially African savannas––receives less focus, despite their dominant contribution to total global burned area and fire emissions. Forecasting future fire activity and its impacts on local ecology and livelihoods, as well as global climate feedbacks, requires a robust mechanistic understanding of the complex interactions between climatic conditions, ecosystem functioning, human activities, and fire across a range of climate states not captured by modern satellite-based observations.

This study focuses on Africa, whose environments span a diversity of climates and ecologies, from some of the driest and most sparsely vegetated regions on Earth (such as the Sahara) to some of the wettest and most biologically productive (such as the Congo Rainforest). These two ends of the rainfall gradient experience non-existent to infrequent burning. However, the most expansive biomes in Africa are tropical savannas and grasslands where precipitation is intermediate and highly seasonal, supporting rapid vegetation growth during wet seasons and drying and abundant fires in the dry season. As a result, burning in Africa constitutes more than half of all global burned area each year. Robust histories of how fires have changed in Africa through time are therefore essential to understanding changes in biomass burning at a global scale. In addition to its broad scope of environments and outmatched contributions to total global burning, Africa also has the longest history of human fire use and land-use change, making it an ideal testing ground for interrogating the combined roles climate shifts and human behaviors play in shaping fire regimes through time.

Here, we present a new synthesis of African paleofire activity inferred from the accumulation of both physical and molecular proxies (e.g., charcoal and polycyclic aromatic hydrocarbons) within climate archives spanning multiple depositional contexts (e.g., lacustrine, marine, and peat sediments) which record biomass burning across a host of ecosystems. Our new reconstruction spans the last 24 thousand years, within which we focus on four key time periods: the Last Glacial Maximum and deglaciation, the mid-Holocene African Humid Period, the late-Holocene rise of metallurgy and agriculture, and the post-industrial era. We evaluate trends in biomass burning during these intervals, and, by comparison to paleoclimate and archeological datasets, we assess the extent to which these patterns are driven by climatic and/or human influences at continental, regional, and biome scales.

How to cite: O’Mara, N., Githumbi, E., Bartlein, P., Norwood, M., Teruel, O., Aleman, J., Staver, C., and Marlon, J.: Changes in biomass burning in Africa since the last glacial maximum: a new continental-scale paleo-synthesis and interrogation of the climatic and human drivers of shifting fire regimes, EGU General Assembly 2026, Vienna, Austria, 3–8 May 2026, EGU26-15696, https://doi.org/10.5194/egusphere-egu26-15696, 2026.

EGU26-16499 | Orals | BG1.1

Ancient carbon released in Arctic-boreal wildfires 

Meri Ruppel, Sonja Granqvist, Lucas Diaz, Negar Haghipour, Olli Sippula, Rienk Smittenberg, Markus Somero, Sander Veraverbeke, and Minna Väliranta

Wildfires are rapidly increasing in boreal forests and are extending to Arctic environments at an unforeseen scale. Above-ground biomass burning may be compensated by regrowth in the years following a wildfire, impacting atmospheric CO2 levels only temporarily.  However, high-latitude wildfires characteristically combust deep into carbon-rich soils accumulated over centuries to millennia and thereby risk transforming these long-term carbon sinks into net sources into the atmosphere. Hitherto, research on Arctic-boreal fires has largely focused on their surface impacts, including the burned area, severity, and forest recovery, while many of their underground characteristics are poorly understood. For instance, observations of the age of carbon released in the fires remain scarce, resulting in incomplete understanding of the climate impact of high-latitude fires.

To determine the age of carbon released in recent Arctic-boreal fires, we collected charred organic material for radiocarbon dating from a tundra fire in Greenland, and two boreal forest and one tundra fire site in northwestern Canada. Our results indicate that, contrary to previous observations, up to centennial to millennial-aged carbon was released in these arctic and boreal wildfires. Moreover, laboratory combustion experiments of Arctic-boreal biomass collected from fire-susceptible surface layers (0-30 cm depth) from Svalbard, Russia, Norway and Finland, demonstrate that the combustion mode, and thus the phase of the emitted carbon, depend on the age of the combusted material. Above-ground modern vegetation combusts flamingly emitting mainly gases, while below-surface older and partly decomposed organic material smoulders, producing increasing carbonaceous particle/gas ratios with increasing age of the combusted material. Similar to the studied Greenland and Canadian wildfires, the laboratory combustion of the Arctic-boreal biomasses show up to millennia-aged carbon emissions.

Our results indicate that centennial to millennial-aged carbon is released in Arctic-boreal wildfires, thereby causing long-lasting feedback to the global climate system. Currently, climate models do not consider the potential release of ancient carbon from wildfires. Thus, our results indicate that increasing Arctic-boreal wildfires may exacerbate global warming more than previously estimated.  

How to cite: Ruppel, M., Granqvist, S., Diaz, L., Haghipour, N., Sippula, O., Smittenberg, R., Somero, M., Veraverbeke, S., and Väliranta, M.: Ancient carbon released in Arctic-boreal wildfires, EGU General Assembly 2026, Vienna, Austria, 3–8 May 2026, EGU26-16499, https://doi.org/10.5194/egusphere-egu26-16499, 2026.

EGU26-16685 | Orals | BG1.1

Reconstructing the last 60,000 years climate-driven interactions of fire, vegetation, and megaherbivores at Fish Lake, Utah, USA 

Jesse Morris, Vachel Carter-Kraklow, Brian Codding, Natalie Winward, Andrea Brunelle-Runberg, Jamie Vornlacher, Josef Werne, Dave Marchetti, Kurt Wilson, Lesleigh Anderson, Mark Abbott, and Mitchell Power

Fish Lake is located at 2700 m (a.s.l.) on the boundary of the Colorado Plateau and Great Basin geologic provinces in western North America. Climate forecast models suggest that this region will become warmer and drier during the 21st Century, which will likely intensify fire regimes and threaten biodiversity in this region, including the ancient Pando aspen clone located next to Fish Lake. Here we present a paleoenvironmental reconstruction from an 80-meter lake sediment core spanning the last 60,000 years. At the Last Glacial Maximum (LGM), the upland areas near Fish Lake (3200-3500 m asl) were heavily glaciated and plant communities were open and dominated mainly by herbs and conifers, such as grasses (Poaceae) and spruce (Picea spp.). During the LGM fire activity was low due to cold temperatures, low woody fuel abundance and connectivity, and the presence of megaherbivores (e.g., Mammuthus) as reconstructed from nearby fossil sites and the presence of coprophilous fungal spores (Sporormiella) in the Fish Lake sediments. In the Late Glacial Period, the demise of upland glaciers and megaherbivores was accompanied by a ‘release’ in woody vegetation, especially spruce and pine (Pinus spp.) and a rise in charcoal accumulation. During the Early Holocene, this rise in burning sustained and was likely enhanced by warming temperatures and the establishment of closed-canopy forests similar to modern composed of Engelmann spruce (Picea engelmannii), aspen (Populus tremuloides), and subalpine fir (Abies lasiocarpa). Fire activity in the Middle Holocene remained high, with a stepwise increase observed during the Late Holocene that occurred with increasing evidence of human activities and amplification of El Nino-Southern Oscillation (ENSO). Throughout the 60,000 record, aspen pollen is consistently present. While pollen alone does not provide direct evidence of the long-lived Pando aspen clone, this record does confer the presence of aspen growing near Fish Lake through contrasting climate periods and fire regimes. This long-term reconstruction offers new insights into the interactions of climate, vegetation, and herbivory in shaping wildfire in western North America to help support land management policies.

How to cite: Morris, J., Carter-Kraklow, V., Codding, B., Winward, N., Brunelle-Runberg, A., Vornlacher, J., Werne, J., Marchetti, D., Wilson, K., Anderson, L., Abbott, M., and Power, M.: Reconstructing the last 60,000 years climate-driven interactions of fire, vegetation, and megaherbivores at Fish Lake, Utah, USA, EGU General Assembly 2026, Vienna, Austria, 3–8 May 2026, EGU26-16685, https://doi.org/10.5194/egusphere-egu26-16685, 2026.

EGU26-17500 | Orals | BG1.1

Environmental factors disrupting the adaptive advantage of fire-trait syndromes 

José Maria Costa-Saura, Costantino Sirca, Donatella Spano, and Teresa Valor

Fire regimes show substantial variability among ecosystems, with a fundamental contrast between surface and crown fires. While surface fires predominantly consume understory vegetation, crown fires involve the combustion of canopy fuels. This distinction is therefore central to understanding fire-driven ecosystem dynamics and to designing effective wildfire risk management strategies.

Ongoing climate change is expected to further reshape fire regimes by altering temperature and moisture conditions and by driving shifts in species distributions. These processes may indirectly modify fire behaviour by changing fuel structure, continuity, and overall landscape flammability.

Within this context, plant functional traits provide a valuable lens through which to interpret fire–vegetation interactions. They not only respond to environmental filtering but also actively shape ecosystem functioning. Two traits in particular—branch shedding (the ability to shed dead lower branches) and serotiny (the retention of mature cones that open after exposure to high temperatures)—have been proposed as key adaptive strategies influencing fire regimes. However, there is limited understanding of whether environmental factors can effectively cancel the adaptive advantages conferred by these traits, which, if occurring frequently, might substantially alter ecosystem dynamics.

To explore these issues, we integrated forest information from the Spanish Forest Map with fire severity data from the European Forest Fire Information System (EFFIS). Our analysis focused on pine species dominating coniferous forests across the western Mediterranean region. We examined how branch shedding and serotiny relate to crown fire occurrence, and how these relationships are modulated by stand-level attributes such as successional stage, shrubs abundance, and the occurrence of extreme drought during the fire season.

Our results indicate that the effectiveness of these trait-based strategies is, at least in the western Mediterranean, strongly contingent on forest stand conditions and suggests that climate change might disrupt the current spatial consistency of these long-established  fire-traits relationships.

How to cite: Costa-Saura, J. M., Sirca, C., Spano, D., and Valor, T.: Environmental factors disrupting the adaptive advantage of fire-trait syndromes, EGU General Assembly 2026, Vienna, Austria, 3–8 May 2026, EGU26-17500, https://doi.org/10.5194/egusphere-egu26-17500, 2026.

EGU26-18115 | ECS | Posters on site | BG1.1

Top-down carbon monoxide fire emissions over South America correlated with global climate indices 

Ben Bradley, Chris Wilson, Martyn Chipperfield, Carly Reddington, Ailish Graham, and Fiona O'Connor

South America (SA) has suffered a multitude of extreme, drought-induced fires in recent years, including 2024 which saw fire emissions across the continent 263 Tg C (84%) above average[1]. Burned area and fire carbon emissions in SA are projected to increase over the coming decades due to higher temperatures and drier conditions associated with climate change[2]. These effects are already being seen in the Amazon, where fire is driving the rainforest towards being a net carbon source[3] and threatening existential climate tipping points. Meanwhile to the South, the ecologically diverse Pantanal wetlands have undergone a step-change in wildfire activity, with 2019–2021 experiencing a 408% increase in annual carbon monoxide (CO) emissions relative to the 2013–2018 average.

CO is a major trace gas released from fires. Its emissions can be used to quantify wildfire carbon impacts and investigate correlations between fire activity and global climate indices. Despite this, there remains considerable disagreement between fire inventory products, with mean annual CO emissions ranging from 284–625 Tg yr-1 globally, and predictions diverging further at smaller spatial scales. These large uncertainties originate from the underlying assumptions of the inventory methodologies and the imperfect sensitivity of their satellite data inputs. Satellite observations of atmospheric total column CO, combined with inverse modelling techniques, provide a direct, top-down method to constrain these estimates, allowing more accurate CO emissions to be determined.

Here, we derive fire emission estimates between 2019–2024 for SA using the INVICAT 4D-Var inverse chemical transport model, assimilating TROPOspheric Monitoring Instrument (TROPOMI) total column CO satellite observations into the model for the first time. Six fire inventories (GFEDv4.1s, GFEDv5.1, GFASv1.2, QFEDv2.6r1, FINNv1.5, FINNv2.5) are used as priors in separate CO inversions, from which posterior result sensitivity is quantified and prior biases are assessed. We use emission ratios to determine, spatially and temporally, the total carbon flux into the atmosphere from fires in SA. We find that the 2024 extreme fire season in SA is poorly captured by the fire inventory products currently available, with peak atmospheric CO over SA observed to be 12.8 Tg (46%) larger than forward-modelled inventory emissions predict. Additionally, we create a multilinear regression model to predict the spatial distribution of CO anomalies across tropical SA by correlating the inversion posterior emissions to key global climate indices at various lag times. This novel method can provide spatial forecasts of the wildfire vulnerability arising from the global state of the climate months in advance.


[1] Kelley et al., 2025, State of Wildfires 2024–2025, Earth System Science Data

[2] Burton et al., 2021, South American fires and their impacts on ecosystems increase with continued emissions, Climate Resilience and Sustainability

[3] Basso et al., 2022, Atmospheric CO2 inversion reveals the Amazon as a minor carbon source caused by fire emissions, with forest uptake offsetting about half of these emissions, Atmospheric Chemistry and Physics

How to cite: Bradley, B., Wilson, C., Chipperfield, M., Reddington, C., Graham, A., and O'Connor, F.: Top-down carbon monoxide fire emissions over South America correlated with global climate indices, EGU General Assembly 2026, Vienna, Austria, 3–8 May 2026, EGU26-18115, https://doi.org/10.5194/egusphere-egu26-18115, 2026.

EGU26-18182 | ECS | Orals | BG1.1

How forest management, land abandonment, and protected areas affect wildfire occurrence 

Gian Luca Spadoni, Jose V. Moris, Judith Kirschner, Sergio de Miguel, Imma Oliveras Menor, Cinzia Passamani, Gilles Le Moguedec, Davide Ascoli, and Renzo Motta

Forest management at the landscape scale is increasingly regarded as a key instrument for maintaining and improving the supply of multiple forest ecosystem services. Contemporary policy agendas, including the EU Forest and Biodiversity Strategies for 2030, together with management paradigms such as sustainable forest management, closer-to-nature forestry and rewilding, promote markedly different pathways. Some approaches rely on targeted silvicultural interventions, while others emphasise non-intervention and natural dynamics. Despite their growing relevance, the spatial prevalence of these contrasting strategies and their implications for ecosystem service provision at regional scales remain insufficiently explored. In this study, we assessed how alternative forest management trajectories affect ecosystem services across the entire forested landscape of the Piedmont region (Italy). Drawing on information from regional forest management plans, we categorised planned management into two broad classes: active management, encompassing silvicultural interventions of varying intensity, and passive management, characterised by the absence of direct interventions. We quantified the spatial extent of each management type and analysed their relationships with three key ecosystem services—carbon storage, fire hazard reduction and tree-species diversity—using principal component analysis and generalised linear models. Additionally, we investigated the association between management strategies and Protected Areas, and whether protection status modulates ecosystem service outcomes. Our results indicate that approximately 60% of Piedmont’s forests are designated for active management, although actual implementation is increasingly constrained by widespread forest abandonment. Active management was consistently associated with higher levels of carbon stocks, reduced fire hazard and greater tree-species diversity. Protected Areas were more frequently linked to passive management, yet their contribution to enhancing ecosystem services appeared limited. Based on these findings, we highlight the importance of: (i) reactivating forest management in abandoned areas, (ii) prioritising active management strategies to strengthen ecosystem service delivery, and (iii) using currently unprotected, passively managed forests as strategic candidates for expanding the Protected Area network, in line with EU2030 policy objectives.

How to cite: Spadoni, G. L., V. Moris, J., Kirschner, J., de Miguel, S., Oliveras Menor, I., Passamani, C., Le Moguedec, G., Ascoli, D., and Motta, R.: How forest management, land abandonment, and protected areas affect wildfire occurrence, EGU General Assembly 2026, Vienna, Austria, 3–8 May 2026, EGU26-18182, https://doi.org/10.5194/egusphere-egu26-18182, 2026.

Vegetation fires emit a wide variety of aerosol particles. Most originate from the combustion of carbonaceous material, however, fire-induced pyro-convective updrafts can modify the near-surface wind field in a way that mobilizes soil-dust particles from the ground and inject them into the atmosphere. Mineral dust particles are well known as efficient cloud condensation nuclei (CCN) and ice nucleating particles (INPs), thereby substantially altering cloud microphysics and influencing the Earth’s radiation budget through scattering and absorption of solar radiation. When emitted during wildfires, these dust particles are likely mixed with smoke aerosols, which modifies their physio-chemical properties and consequently their impacts on the atmosphere and climate. Therefore, a precise characterization of this emission pathway and robust knowledge of its global abundance are essential.

The fire-driven emission of soil-dust particles has already been incorporated into the global aerosol–climate model ICON-HAM through the development of a sophisticated parameterization that describes fire-induced dust emission fluxes as a function of fire intensity and some soil-surface properties, such as the soil type and the vegetation class at the fire location. Multi-year model simulations have indicated that fire-related dust emissions can account for a significant fraction of the global atmospheric dust load, exhibiting strong regional and seasonal variability driven by a varying fire activity and the local soil-surface conditions.

However, global fire activity has changed substantially over the recent decades due to both climatic and socioeconomic factors, resulting in significant shifts in the magnitude and regional distribution of fire-related dust emissions. Here, trends in fire-induced dust emissions over the past 20 years are analyzed and changes across different continental regions are contrasted. Furthermore, projections of fire activity under future climate scenarios can be used to assess the strength and regional distribution of fire-related dust emissions under changing climate conditions and mitigation strategies. This analysis can contribute to improved estimates of the future global aerosol burden, in particular with respect to the changing fire occurrence in a warmer world.

How to cite: Wagner, R. and Tegen, I.: Trends in fire activity and associated fire-induced soil-dust emissions over the last two decades, EGU General Assembly 2026, Vienna, Austria, 3–8 May 2026, EGU26-18932, https://doi.org/10.5194/egusphere-egu26-18932, 2026.

EGU26-19168 | Posters on site | BG1.1

Wildfire Hot Spot Mapping in the Alps - Austria Fire Futures 

Andrey Krasovskiy, Hyun-Woo Jo, Harald Vacik, Mariana Silva Andrade, Herbert Formayer, Johannes Laimighofer, Arne Arnberger, Tobias Schadauer, Mortimer Müller, Eunbeen Park, Johanna San-Pedro, and Florian Kraxner

The main objective of the Austria Fire Futures study is to develop a unique and innovative framework for fire risk assessment by producing high-resolution fire risk hotspot maps under multiple climate change scenarios. These maps integrate novel insights on local fuel types into forest and wildfire risk models, including mountain-specific variables such as topography, morphology, and recreational activities.

To generate fire risk information at the local scale, advanced fire hazard modeling is required to identify vulnerable forest types in combination with topographic effects. Recent wildfire events in the Austrian Alps have demonstrated that social factors—particularly hiking tourism—are currently underrepresented in fire risk assessments. In response, this study aims to advance fire risk hotspot mapping as a foundational element for forest and wildfire prevention. Such mapping is essential for integrated fire management, encompassing prevention, suppression, and post-fire measures, while contributing to climate change mitigation and minimizing impacts on ecosystems, ecosystem services, and human well-being.

We present modeling results from the Wildfire Climate Impacts and Adaptation Model (FLAM), a process-based fire risk model operating at a daily time step. FLAM employs machine learning techniques to calibrate extended suppression efficiency based on spatial segmentation of landscapes. Historical ground data on burned areas in Austria were used for model calibration and validation. The results include historical simulations (2001–2020) and future projections (2021–2100) of burned area across Austria at 1 km spatial resolution, based on an ensemble of downscaled climate change scenarios. In addition, FLAM was applied to Lower Austria at 250 m resolution, using the most recent high-resolution datasets on fuels, forest cover, human ignition probability, and response times.

The results improve our understanding of fire-vulnerable forest areas in the Alpine region and how these vulnerabilities may shift over time and space under changing climate and fuel conditions. This knowledge enables experts, practitioners, and the broader public to explore plausible future fire regimes and to derive robust short-, medium-, and long-term recommendations for fire-resilient and sustainable forest management, as well as for wildfire preparedness and emergency planning.

How to cite: Krasovskiy, A., Jo, H.-W., Vacik, H., Silva Andrade, M., Formayer, H., Laimighofer, J., Arnberger, A., Schadauer, T., Müller, M., Park, E., San-Pedro, J., and Kraxner, F.: Wildfire Hot Spot Mapping in the Alps - Austria Fire Futures, EGU General Assembly 2026, Vienna, Austria, 3–8 May 2026, EGU26-19168, https://doi.org/10.5194/egusphere-egu26-19168, 2026.

EGU26-19257 | Posters on site | BG1.1

Critical analysis of Fire Radiaive Power derived by hyperspectral sensors from space 

Stefania Amici and Bernardo Mota

Fire Radiative Power (FRP) is a quantitative measure of the instantaneous rate of radiant heat energy emitted by a fire during the combustion process. It is usually retrieved via satellite remote sensing and serves as a key indicator of fire intensity and the rate of fuel consumption. FRP is generally estimated by measuring the thermal radiation (radiances) emitted by wildfires, in the Middle Infrared (MIR) spectral range (3.9- 4.0) where the Planck function peaks for sources at 1000K and the contrast between the fire and the cooler background is most pronounced.

A number of satellite imaging systems, at LEO (i.e. MODIS-TERRA and AQUA, VIIRS-Suomi NPP, SLSTR-Sentinel 3A and 3B) and GEO (i.e. SEVIRI-MSG, ABI-GOES, ABI-HIMAWARI) orbits provide FRP retrievals. However, due to their coarse spatial resolution (1-2 km/px) and wide spectral bands, small fires detection and associated FRP retrieval is limited, representing a potential source of omission error.

While currently available high-resolution sensors lack coverage in the Mid-Infrared (MIR) spectral range, recent research has investigated the potential of Short-Wave Infrared (SWIR) sensors as an option. By analyzing airborne data from the AVIRIS, EMAS, and MASTER sensors, studies have established a robust correlation between MIR-derived and SWIR-derived FRP. Furthermore, the SWIR band on Sentinel-3 is already being effectively utilized to estimate FRP for gas flares monitoring.

In this study we retrieve FRP by using two similar hyperspectral sensors, Precursore IperSpettrale della Missione Applicativa (PRISMA) and Environmental Mapping and Analysis Program (EnMAP).  We compare the results with operational FRP products, namely the Sentinel-3 L2 NRT FRP and the CAMS-GOES-W FRP product and evaluate potentials and limitations for mapping the intensity of wildfires and gas flares.

How to cite: Amici, S. and Mota, B.: Critical analysis of Fire Radiaive Power derived by hyperspectral sensors from space, EGU General Assembly 2026, Vienna, Austria, 3–8 May 2026, EGU26-19257, https://doi.org/10.5194/egusphere-egu26-19257, 2026.

EGU26-19404 | ECS | Posters on site | BG1.1

Modelling burned area and emissions with deep learning 

Seppe Lampe, Lukas Gudmundsson, Basil Kraft, Stijn Hantson, Emilio Chuvieco, and Wim Thiery

Wildfires play a key role in the Earth system by shaping ecosystem dynamics and influencing the carbon cycle and atmospheric composition. Data-driven models have recently emerged as powerful tools for reproducing observed fire activity, particularly burned area, across a range of spatial and temporal scales. The first version of BuRNN (Burned area and emissions modelling through Recurrent Neural Networks) focused solely on burned area and outperformed all process-based fire-coupled DGVMs from ISIMIP over a wide range of spatial, temporal and spatio-temporal skill metrics. Here we present the 2nd version of BuRNN, a data-driven model that now jointly represents burned area and fire-related emissions.

How to cite: Lampe, S., Gudmundsson, L., Kraft, B., Hantson, S., Chuvieco, E., and Thiery, W.: Modelling burned area and emissions with deep learning, EGU General Assembly 2026, Vienna, Austria, 3–8 May 2026, EGU26-19404, https://doi.org/10.5194/egusphere-egu26-19404, 2026.

EGU26-19990 | Orals | BG1.1

A European Initiative on Wildfire Risk and Atmospheric Impacts 

Cyrielle Denjean, Ronan Paugam, Sophie Pelletier, Agnès Borbon, Isabelle Chiapello, Maria João Costa, Francisco Senra Rivero, Mélanie Rochoux, Rui Salgado, Pierre Tulet, Eva Marino, Roberto Roman, Yolanda Luna, Gisèle Tong, Xavier Ceamanos, Arnaud cambre, Francesca Di Giuseppe, Jean Baptiste Filippi, Hervé Petetin, and Julien Ruffault and the Cyrielle Denjean

A new wildfire regime is emerging in Southern Europe, characterised by larger and more intense fires, and by a fire season that now extends beyond the traditional summer months. In this region, climate projections indicate that fire occurrence and severity will increase faster than the global average due to an increased risk of heatwaves and droughts, as well as the evolution of biodiversity towards more resilient and less fire-prone plant species. These changes in wildfire regimes reveal significant gaps in the tools and technologies needed for implementing comprehensive fire management approaches. The community still faces challenges in predicting which wildfires may escalate into extreme events, and the environmental, climate and health impacts of such events remain poorly understood.

The Southern Europe Biomass BURNing (EUBURN) programme emerged as a concerted response to the need to improve the prevention, monitoring and prediction of wildfire risks in southern Europe. EUBURN integrates a series of multi-year and multi-scale field campaigns, lab studies, satellite remote sensing, and advanced modeling to build the research foundations for understanding the complex interactions between wildfires and the atmosphere. Based on this fundamental research, the EUBURN programme aims to support fire responders, ecosystems and air quality management, while addressing specific climate research requirements by developing new or enhanced operational products, tools and services for monitoring and predicting wildfires and their atmospheric impacts.

The first field campaign SILEX (Smoke from European Wildfire Experiment) of the EUBURN programme took place in southern France from 15 July to 3 August 2025. It had three specific objectives: (i) characterising the interactions between fuel, fire, gases, aerosols, radiation and clouds; (ii) contributing to the development of numerical prediction tools for fire behaviour and atmospheric plume dynamics; and (iii) assessing the uncertainties, biases and limitations of fire and smoke products from ground-based and satellite remote sensing. Ten scientific flights were carried out with the ATR-42 research aircraft equipped with state-of-the-art remote-sensing and in situ instruments to characterise wildfires occurring in southern France, as well as their associated smoke plumes, from the onset of emissions to their regional transport. The main purpose of the presentation is to familiarize the broader scientific community with the EUBURN programme and the SILEX dataset it produced. New findings on fire characteristics, gas and aerosol emissions, physical and chemical aging and cloud condensation nuclei will be emphasized.

How to cite: Denjean, C., Paugam, R., Pelletier, S., Borbon, A., Chiapello, I., Costa, M. J., Senra Rivero, F., Rochoux, M., Salgado, R., Tulet, P., Marino, E., Roman, R., Luna, Y., Tong, G., Ceamanos, X., cambre, A., Di Giuseppe, F., Filippi, J. B., Petetin, H., and Ruffault, J. and the Cyrielle Denjean: A European Initiative on Wildfire Risk and Atmospheric Impacts, EGU General Assembly 2026, Vienna, Austria, 3–8 May 2026, EGU26-19990, https://doi.org/10.5194/egusphere-egu26-19990, 2026.

EGU26-20208 | Orals | BG1.1

Process-Based Attribution of the 2025 Iberian Wildfire Season Using a Storyline Framework 

István Dunkl, Julia Mindlin, Marco Turco, and Sebastian Sippel

An enduring heatwave over the Iberian Peninsula in July and August 2025 led to exceptionally extensive wildfires, resulting in the fifth-largest burned area in Spain since 2001 and the fourth-largest in Portugal. Hot and dry fire weather conditions are a key driver of large wildfires in the Mediterranean, and are intensifying rapidly under anthropogenic climate change. However, strong interannual variability of burned area and changes in multiple non-climatic drivers (e.g., land management) complicate the attribution of individual fire seasons.

Methods for attributing climate impacts to anthropogenic forcing are commonly divided into statistical and storyline approaches. Statistical methods quantify changes in the probability of exceeding predefined thresholds across climate states with different forcing levels, whereas storyline approaches examine how a specific historical event might have unfolded in the absence of anthropogenic climate change. Such counterfactual storylines can be generated with Earth system models (ESMs) constrained by observed historical conditions, enabling a process-based interpretation of climate impacts. However, this type of storyline method has not been applied to the attribution of complex ecosystem processes such as fires.

Here, we use the 2025 Iberian wildfire season as a case study to evaluate our nudged circulation storyline simulation with the Community Earth System Model 2 (CESM2) and compare it to statistical attribution. The ESM-based storyline enables a process-based quantification of thermodynamic influences on fire weather and of biological factors controlling fuel load. However, the approaches differ on the role of thermodynamic climate change in intensifying the 2025 fire season. Statistical attribution suggests a large thermodynamic contribution but indicates that events of comparable intensity are not exceptional under present-day climate. In contrast, the storyline approach identifies the 2025 circulation anomaly as unprecedented in magnitude. We show that this discrepancy arises from decadal Mediterranean circulation trends, which are implicitly absorbed into the thermodynamic response in the statistical attribution framework.

Our results demonstrate the utility of a storyline framework in the causal attribution of complex processes such as fires, and highlight the need for caution when applying attribution methods in regions characterized by strong dynamical trends.

How to cite: Dunkl, I., Mindlin, J., Turco, M., and Sippel, S.: Process-Based Attribution of the 2025 Iberian Wildfire Season Using a Storyline Framework, EGU General Assembly 2026, Vienna, Austria, 3–8 May 2026, EGU26-20208, https://doi.org/10.5194/egusphere-egu26-20208, 2026.

Tropical montane forests have historically not been prone to large-scale forest fires as a result of their high humidity and rainfall. Yet, current increased frequencies and intensity of these fires are making them an increasingly pressing area of study, especially in the context of increasing climate variability and land use changes.  To understand present and future fire dynamics, it is, however, essential to look at the origins and factors behind trends in fire frequency and intensity. To explore this, long-term assessment of the dynamics of montane forest fire, and their relationships to anthropogenic and climate changes, are essential.

Such work has been largely lacking in montane ecosystems due to a paucity of available quantitative data, and a general perception that fire has played a minimal role in shaping biodiversity in these areas. Here we combine historical forest fire records and remote sensing to investigate the evolution and dynamics of montane forest fires in Kenya since the 1920s in response to changes in forest fire management, land use changes and climate variability.  We argue that historically, indigenous communities used their traditional knowledge and practices in managing local fires and limiting them to manageable intensities. However, the introduction of colonial rule shifted their role in forest management and ultimately their relationship in using fire within forest areas.

Our research and datasets highlight that changes in fire dynamics can be linked to extensive colonial prohibition of fire controls by traditional communities and the imposition of fines to deter their use. In addition, introduction of new fire sources through the development of the railway systems along forest areas, introduction of exotic tree species and largescale agricultural expansions exacerbated forest fire dynamics within the montane forests. Meanwhile, the colonial government introduced fire lines as a form of forest fire controls, which were meant as fire control measure and required sophisticated management plans, that were adopted in forest management.

We suggest that these changes have left legacies for contemporary fire issues as a loss of traditional fire management knowledge, smallholder relocation and land restrictions, and industrial pressures have accumulated to intensify fire risk in montane forest ecosystems. Looking into the future, we argue that, as with other regions of the latitudinal tropics, it is essential to understand traditional ecological knowledge and historical path dependencies in order to chart more effective and just conservation strategies including active use of fire and restoration of fire-resistant species. 

How to cite: Gitau, P., Kinyanjui, R., and Roberts, P.: Evolution of tropical montane forest fires in response to shifts in historical forest management, climate variability and land use changes., EGU General Assembly 2026, Vienna, Austria, 3–8 May 2026, EGU26-20289, https://doi.org/10.5194/egusphere-egu26-20289, 2026.

EGU26-20299 | Orals | BG1.1

Regional to global impacts of boreal biomass burning emissions changes 

Marianne T. Lund, Zosia Staniszek, Bjørn H. Samset, Olivia Linke, and Annica Ekman

High latitude wildfire regimes are changing, and boreal regions have seen unprecedented fire activity in recent years. Given the high climate sensitivity of the Arctic and boreal regions, it is important to explore the impacts of these changes. There are also region-specific impacts of biomass burning particular to high latitude regions, such as black carbon (BC) deposition on snow. While many sources of atmospheric pollution are being mitigated, fires are emerging as a growing contributor to poor air quality, both locally to the fire emissions source and across wider regions.

Here we investigate the climate and atmospheric effects of increased biomass burning emissions, including the sensitivity to emission region, focusing on aerosols. We perform idealized emission perturbation experiments in two Earth System Models (CESM2 and NorESM2), where we perturb first all boreal biomass burning emissions and then emissions in smaller regions of interest (boreal North America, East Siberia and West Siberia). These experiments use 2005-2014 as a baseline period, and use the sum of this period as the perturbation, giving an approximately x10 perturbation in the regions of interest, in both fixed SST (30 years) and coupled (200 years) simulations. The strength and location of the aerosol changes studied here (when comparing aerosol optical depth) are comparable to the recent trends in aerosols between 2015-2024 and 2005-2014.

We investigate subsequent effects on modelled atmospheric composition with a focus on the high latitudes, including air quality implications, and climate response, including effective radiative forcing (ERF) and fully-coupled climate response estimates. The preliminary analysis highlights the role of boreal forests in enhancing aerosol optical depth, over the source regions but also extending into the central Arctic, as well as local air pollution levels. Global and Arctic mean ERFs of 0.5 Wm-2 are estimated, with some distinct differences depending on the region of emission, at least for the Arctic average forcing.

How to cite: Lund, M. T., Staniszek, Z., Samset, B. H., Linke, O., and Ekman, A.: Regional to global impacts of boreal biomass burning emissions changes, EGU General Assembly 2026, Vienna, Austria, 3–8 May 2026, EGU26-20299, https://doi.org/10.5194/egusphere-egu26-20299, 2026.

EGU26-22880 | ECS | Posters on site | BG1.1

Dimensions of forest fires in Poland, 2019-2024 

Patrycja Kowalczyk, Ewa Zin, Łukasz Tyburski, Przemysław Śleszyński, Sandra Słowińska, Adrian Kaszkiel, Damian Czubak, Marcin Klisz, Kamil Pilch, Jan Kaczmarowski, and Michał Słowiński

Changing climatic conditions are amplifying the frequency and intensity of hydroclimatic extremes across Europe. Droughts, heatwaves, intense precipitation and floods increasingly co-occur and cascade, creating compound risks for ecosystems and societies. One of the most visible and severe consequences of these interconnected crises is the growing global threat of forest fires, which are more often facilitated by favorable weather conditions, as well as forest structure and fuel properties. However, the most important cause of fires is related to human pressure, resulting from intentional or unintentional activities that contribute to the outbreak of fires.

Forests are an assemblage of diverse habitats, each of which may differ markedly in fire risk and fire behaviour. Here, we examine how fire occurrence in Poland varies among forest habitat types, land-use patterns and management functions, and how these relationships are shaped by interannual meteorological variability and regional context. We compile (i) forest fire records for Poland for 2019-2024, (ii) a 2024 state forest administration database of forest divisions (i.e., basic forest management units) including habitat type, dominant tree species and main forest function, (iii) a database of socio-economic indicators for country's administrative units, and (iv) annual meteorological characteristics relevant to fire weather. This enables a spatially explicit analysis of fire frequency and (where available) burnt area across heterogeneous forest landscapes, while accounting for administrative-region differences and socio-economic factors that may reflect contrasting management practices, accessibility, and human ignition pressure.

We quantify fire occurrences in 2019-2024 for distinct forest area types (classified by habitat, dominant tree species and function) and evaluate their sensitivity to meteorological conditions across years. The analysis is designed to identify which combinations of forest habitat, tree species, forest function, and local socio-economic structure show consistently elevated fire incidence, whether observed changes between 2019 and 2024 are uniform or regionally differentiated across Poland, and to determine which meteorological characteristics best explain interannual variability in forest fire occurrence. By integrating ecological and forest management attributes with fire records and meteorological context, the study provides an empirical basis for stratified fire-risk assessment in Polish forests and supports targeted prevention and management measures. This research is conducted as part of the NCN project 2023/49/N/ST10/04035 "Fire, burnt area and charcoal - charcoal-data modeling of burnt area, cross-validation of fires and charcoal signal".

How to cite: Kowalczyk, P., Zin, E., Tyburski, Ł., Śleszyński, P., Słowińska, S., Kaszkiel, A., Czubak, D., Klisz, M., Pilch, K., Kaczmarowski, J., and Słowiński, M.: Dimensions of forest fires in Poland, 2019-2024, EGU General Assembly 2026, Vienna, Austria, 3–8 May 2026, EGU26-22880, https://doi.org/10.5194/egusphere-egu26-22880, 2026.

EGU26-1778 | ECS | Orals | BG1.10

Untangling root and microbial volatile organic compound emissions from soils of two different temperate tree species 

Mirjam Meischner, Alexej Steuerle, Riikka Rinnan, and Christiane Werner

The main sources of volatile organic compounds (VOCs) emitted from forest soils are roots and soil microorganisms. However, quantifying the relative contributions of these sources to net soil VOC emissions and the proportion of root VOCs degraded by soil microorganisms is challenging.

In order to partition soil VOC emissions into root and microbial VOC emissions, we conducted a controlled mesocosm experiment using Picea abies and Fagus sylvatica saplings, as well as soil (Cambisol) collected from a temperate forest dominated by these two species. VOC emissions from the soil surface (combined root and soil emissions), as well as from excavated roots and root-free bulk soil (sieved to 2 mm), were analyzed using PTR-TOF-MS and GC-MS. To evaluate the role of microorganisms as a source or sink of VOCs in the rhizosphere, microbial colonization of roots was modified by applying three washing treatments: (1) no washing (intact rhizosphere, high colonization), (2) water washing (partial removal of root microbiome, intermediate colonization), and (3) washing with 70% (v/v) ethanol (disinfection, reduced colonization), with 6 replicates per species and treatment.

This study aims to improve our understanding of the soil VOC fluxes in forest ecosystems by quantifying the contributions of roots and microorganisms to net soil VOC emissions, as well as the uptake of root VOCs by soil microorganisms.

How to cite: Meischner, M., Steuerle, A., Rinnan, R., and Werner, C.: Untangling root and microbial volatile organic compound emissions from soils of two different temperate tree species, EGU General Assembly 2026, Vienna, Austria, 3–8 May 2026, EGU26-1778, https://doi.org/10.5194/egusphere-egu26-1778, 2026.

EGU26-3031 | Posters on site | BG1.10

Soil compaction by forest management creates hotspots of BVOC emissions in a temperate mixed forest 

Hojin Lee, Tim Stippich, Jan Petersen, David Meine, Julian Brzozon, Markus Sulzer, Andreas Christen, Teja Kattenborn, Lea Dedden, Christiane Werner, and Jürgen Kreuzwieser

Soil emissions of biogenic volatile organic compounds (BVOCs) and their impacts at the ecosystem scale have been intensively studied. However, less attention has been paid to how forest management practices alter soil BVOC exchange by modifying soil physical and biogeochemical properties. In managed forests, timber harvesting operations frequently create skid trails, where repeated machine traffic leads to soil compaction and impaired drainage, potentially altering oxygen availability and microbial processes.

In this study, we investigated how soil property changes associated with skid trails influence BVOC exchange from the forest floor of the ECOSENSE forest, a temperate mixed forest. We combined field measurements of soil–atmosphere BVOC exchange at waterlogged skid trails and adjacent undisturbed forest floor with laboratory incubations of intact soil cores under controlled oxic and anoxic conditions.

Our results show that skid trail soils exhibit distinct BVOC emission patterns compared to well-drained forest soils. In particular, emissions of aromatic compounds, including toluene and the aromatic monoterpene p-cymene, increased markedly under waterlogged and oxygen-limited conditions. Emissions of several monoterpenes, such as α-pinene, camphene, limonene, and δ-3-carene were also enhanced.

Although skid trails cover only a small fraction of the forest area, our findings indicate that they can act as BVOC emission hotspots within forest ecosystems. This highlights that small-scale heterogeneity introduced by forest management can substantially influence ecosystem-level BVOC budgets and forest–atmosphere interactions.

How to cite: Lee, H., Stippich, T., Petersen, J., Meine, D., Brzozon, J., Sulzer, M., Christen, A., Kattenborn, T., Dedden, L., Werner, C., and Kreuzwieser, J.: Soil compaction by forest management creates hotspots of BVOC emissions in a temperate mixed forest, EGU General Assembly 2026, Vienna, Austria, 3–8 May 2026, EGU26-3031, https://doi.org/10.5194/egusphere-egu26-3031, 2026.

EGU26-3307 | ECS | Posters on site | BG1.10

Five months of BVOC flux measurements above a Pinus sylvestris forest stand in the Austrian Alps 

Judith Schmack, Werner Jud, Thomas Karl, Felix M. Spielmann, Georg Wohlfahrt, and Albin Hammerle

Biogenic Volatile Organic Compounds (BVOCs) are a group of highly reactive chemical compounds that are emitted by the terrestrial biosphere. They play a crucial role in atmospheric chemistry by contributing to the formation of tropospheric ozone, secondary organic aerosols (SOA) and cloud condensation nuclei, thereby influencing both air quality and climate processes. However, quantifying their exchange between ecosystems and the atmosphere remains challenging due to the interplay of measurement complexities, heterogeneous surface properties and vegetation variability.

For about five months from summer to autumn 2025, we conducted an intensive measurement campaign to study the BVOC fluxes at the University of Innsbruck’s Forest Atmosphere Interaction Research (FAIR) field site in Mieming, Tirol, Austria. The site is characterized by a Pinus sylvestris canopy with Juniperus communis understory and is equipped with a 30 m tall flux tower, a heated Teflon sampling line, and an air-conditioned instrument container. BVOC concentrations were measured using Proton-Transfer-Reaction Time-of-Flight Mass Spectrometry (PTR-ToF-MS), and turbulent fluxes were calculated via the eddy covariance technique.

Here, we investigate the temporal variability and environmental controls of BVOC fluxes with a focus on mono- and sesquiterpenes at the ecosystem scale. We further evaluate how well emission patterns align with findings from a laboratory study conducted in 2024 on saplings of the dominant species at the FAIR site, and plan to assess the performance of the MEGAN 2.1 emission model in reproducing the observed flux dynamics.

Our results provide new insights into the drivers of BVOC fluxes in an alpine forest and support the improvement of biosphere–atmosphere exchange parameterizations in emission models.

How to cite: Schmack, J., Jud, W., Karl, T., Spielmann, F. M., Wohlfahrt, G., and Hammerle, A.: Five months of BVOC flux measurements above a Pinus sylvestris forest stand in the Austrian Alps, EGU General Assembly 2026, Vienna, Austria, 3–8 May 2026, EGU26-3307, https://doi.org/10.5194/egusphere-egu26-3307, 2026.

EGU26-3388 | ECS | Posters on site | BG1.10

Ozone alters heat-driven Biogenic VOC responses: evidence from forest and urban tree species under sequential stress 

Biplob Dey, Clémence Depp, Yichen Gu, Toke Due Sjøgren, Peeyush Khare, Georgios Ι. Gkatzelis, Yizhen Wu, Sindhu Vasireddy, Alexander Knohl, Riikka Rinnan, Anna Novelli, Hendrik Fuchs, Thorsten Hohaus, and Eva Y. Pfannerstill

Predicting plant responses to changing climate, particularly to heat extremes and elevated near-ground ozone, is a key obstacle in robustly quantifying future biogenic volatile organic emissions (BVOCs) and understanding the climate feedback loop. Scaling BVOC emissions from leaf to landscape level and identifying stress-specific emission fingerprints require controlled-chamber experiments with sequential stress exposure that realistically mimic natural events.

In a climate-controlled chamber, periodic stress exposures were applied to forest (Fagus sylvatica L., Quercus robur L.) and urban tree species (Castanea sativa Mill., Tilia cordata Mill.) during summer 2024 and 2025. The forest species were exposed to heat (~40°C) and nocturnal ozone stress (100-120 ppb), while urban species experienced heat stress (~40°C) and a 72h simultaneous ozone exposure (100-120 ppb). BVOC emission fluxes were measured using proton-transfer reaction time-of-flight mass spectrometry and compared across pre-stress, heat, and combined heat–ozone conditions.

Heat stress strongly increased BVOC emissions, with urban tree species showing 2–8-fold increases in isoprene and ~3-fold increases in monoterpenes, along with elevated sesquiterpenes and green leaf volatiles. Forest species showed more selective heat-induced emissions, primarily in monoterpenes and green leaf volatiles. In contrast, combined ozone–heat stress following ozone exposure suppressed most BVOC emissions by 30–60%, largely independent of species, despite differing ozone treatments. The concurrent increase of methyl salicylate, a stress-alarm compound, emissions under combined stress compared to heat alone showed a non-additive physiological response. Heat stress consistently yielded the highest OH reactivity of BVOCs across all species and decreased by 10–30% following ozone-mixed heat exposure. A cross-investigation using machine learning and positive matrix factorization identified stress- and species-specific VOC fingerprints, with a good agreement.

These multi-stress experiments provide mechanistic insight into stress-induced BVOC emissions and could improve parameterizations of BVOC emissions in Earth system and air-quality models under increasing pollution and heat events.

How to cite: Dey, B., Depp, C., Gu, Y., Sjøgren, T. D., Khare, P., Gkatzelis, G. Ι., Wu, Y., Vasireddy, S., Knohl, A., Rinnan, R., Novelli, A., Fuchs, H., Hohaus, T., and Pfannerstill, E. Y.: Ozone alters heat-driven Biogenic VOC responses: evidence from forest and urban tree species under sequential stress, EGU General Assembly 2026, Vienna, Austria, 3–8 May 2026, EGU26-3388, https://doi.org/10.5194/egusphere-egu26-3388, 2026.

EGU26-4871 | ECS | Orals | BG1.10 | Highlight

Volatile compounds in cave ecosystems and their roles in subterranean carbon cycling 

Kajsa Roslund, Ana Sofia Reboleira, Kasun Bodawatta, Luka Civa, Anders Sommer, Michael Poulsen, and Riikka Rinnan

The composition of cave atmospheres is unknown beyond ventilation studies on carbon dioxide (CO2) and methane (CH4). The identities, concentrations, and roles of volatile organic compounds (VOCs) and their link to CO2 and CH4 – although crucial for understanding subterranean carbon cycling – remains unexplored. Caves also take part in gas exchange with terrestrial ecosystems and the atmosphere, acting as sources and sinks of reactive gases. However, the magnitude of this gas exchange, and the potential effects on local and global carbon budgets, has not yet been characterized.

We analyzed VOCs, CO2, CH4, and oxygen in situ from the air of two caves (in Loulé and Torres Novas) in the main karst massifs of Portugal, along with cave microbiomes in sediment samples. Additionally, we isolated bacterial and fungal species from the sediment samples and investigated their volatile fingerprints in vitro. We used headspace vials and sorbent tubes for the in situ and in vitro volatile sampling combined with analysis via mass spectrometric and optical spectroscopy methods. Cave microbial compositions were analyzed with metabarcoding of 16S rRNA (bacteria) and ITS (fungi) genes.

We will present novel data connecting cave atmospheric compositions to cave microbial carbon cycling, including analysis of the origin of volatiles through stable isotope analysis (13C). We also present data for seasonal and spatial variation in the cave atmospheric compositions. Our results suggest that cave atmospheres are dynamic rather than stable, affected by outside conditions, and therefore, potentially compromised by climate change. Conversely, we confirm that caves can act as sources and sinks for some reactive gases, suggesting that they can also impact the surrounding environment.

How to cite: Roslund, K., Reboleira, A. S., Bodawatta, K., Civa, L., Sommer, A., Poulsen, M., and Rinnan, R.: Volatile compounds in cave ecosystems and their roles in subterranean carbon cycling, EGU General Assembly 2026, Vienna, Austria, 3–8 May 2026, EGU26-4871, https://doi.org/10.5194/egusphere-egu26-4871, 2026.

EGU26-4991 | ECS | Posters on site | BG1.10

How does European beech smell under drought stress? Volatile responses across genetically diverse backgrounds 

Ting Tang, Toja Guerra, Domitille L. Coq—Etchegaray, Bernhard Schimd, Sergio R. Castro, Linus Reichert, Meredith C. Schuman, and Sofia van Moorsel

European beech (Fagus sylvatica) is widespread and dominant in many central European forests. Increasing drought stress due to climate change has caused severe damage in beech stands across the continent (Geßler et al., 2007; Leuschner, 2020). Volatile organic compounds (VOCs) are key ecological signals during drought, mediating within-plant responses and interactions with other plants and trophic levels (Baldwin, 2010). Understanding VOC responses in European beech is therefore important for future forest management under climate change. However, the volatile profiles of European beech under drought stress remain poorly studied.

In this study, we used 72 four-year-old European beech trees from seven provenances and 12 seed families (same maternal trees), assigning them to drought and control groups in a common garden located in Zurich, Switzerland. Drought-treated trees received no water for a total of 14 days, while the control group remained well watered throughout the experiment. VOCs were sampled at three time points for both groups: before drought, after 7 days of drought treatment, and after 14 days of re-watering. A “push–pull” system was used to actively collect headspace volatiles around each whole tree into Tenax tubes, and samples were analyzed using gas chromatography–mass spectrometry (GC–MS). Features were detected and aligned among samples using MZmine (Heuckeroth et al., 2024), and peak heights were analyzed with linear models and variance partitioning to identify VOC signals related to genetic background and drought stress.

We found that several monoterpenes displayed genetically specific emission patterns under well-watered conditions, reflecting underlying genetic differentiation in VOC physiology. During drought, a large proportion of the variation in VOCs was explained by drought treatment, while the variation attributed to seed family decreased substantially. In particular, monoterpenes and green leaf volatiles indicated strong activation of stress-response pathways. Notably, a subset of drought-induced VOCs remained elevated even after re-watering, suggesting a legacy effect of drought stress. Our results show that drought-related VOC signals can serve as valuable biomarkers for assessing drought stress in European beech, thereby improving our ability to monitor tree health under climate change.

How to cite: Tang, T., Guerra, T., L. Coq—Etchegaray, D., Schimd, B., R. Castro, S., Reichert, L., C. Schuman, M., and van Moorsel, S.: How does European beech smell under drought stress? Volatile responses across genetically diverse backgrounds, EGU General Assembly 2026, Vienna, Austria, 3–8 May 2026, EGU26-4991, https://doi.org/10.5194/egusphere-egu26-4991, 2026.

EGU26-5389 | ECS | Orals | BG1.10

Stress is in the air: BVOC emissions from beech and oak trees under combined heat stress and herbivory feeding 

Clémence Depp, Biplob Dey, Yichen Gu, Anna Novelli, Thorsten Hohaus, and Eva Pfannerstill

Biogenic Volatile Organic Compound (BVOC) emissions account for more than 70% of VOC global emissions and play a significant role in atmospheric chemistry due to their high reactivity. These compounds are naturally emitted by trees as they are involved in ecological processes such as plant communication and defense against biotic and abiotic stressors. However, climate change has increased those stress factors for trees, altering both magnitude and composition of BVOC emissions. Once oxidized in the atmosphere, BVOCs contribute to the production of Secondary Organic Aerosols (SOA) which are involved in cloud formation, mitigating the Earth’s radiative balance and impacting air quality. Investigating how emission rates and compositions are impacted by such stressors is essential in understanding how atmospheric chemistry is affected.

So far, most studies focused on coniferous trees and isolated stress factors, leaving broad-leaved trees and combined stress impacts understudied, although common. To address the gap, this study sheds light on the BVOC emissions from two common deciduous tree species in Europe: English oak (Quercus Robur), an isoprene emitter, and European beech (Fagus Sylvatica), a monoterpene emitter. They were successively exposed to herbivory feeding of gypsy moth larvae (Lymantria Dispar Dispar) then both herbivory and heat stress (up to ~40°C).

To quantify BVOC fluxes, the emissions were sampled from a climate-controlled plant-chamber (SAPHIR-PLUS) by PTR-TOF-MS coupled to a fastGC. Temperature ramp experiments were conducted under each condition to study the temperature sensitivity of terpenoid emissions in response to the different stressors.

Here, we present results from an intensive two-month campaign with focus on the main primary BVOC emissions. Preliminary results indicate that herbivory feeding increased monoterpenes emissions, but heat stress induced a stronger burst in emissions for both tree species, highlighting their role in plant defense response.

How to cite: Depp, C., Dey, B., Gu, Y., Novelli, A., Hohaus, T., and Pfannerstill, E.: Stress is in the air: BVOC emissions from beech and oak trees under combined heat stress and herbivory feeding, EGU General Assembly 2026, Vienna, Austria, 3–8 May 2026, EGU26-5389, https://doi.org/10.5194/egusphere-egu26-5389, 2026.

EGU26-6225 | ECS | Posters on site | BG1.10

Improving East Asian BVOC Emission Estimates via Machine Learning-Based Plant Functional Types Mapping  

jimin jung, Minjoong J. Kim, Dae-Ryun Choi, Sung-Chul Hong, Jae-Bum Lee, and Yonghee Lee

Biogenic volatile organic compounds (BVOCs) are dominant precursors of tropospheric ozone and secondary organic aerosols, making their accurate representation critical for air quality modeling. Current BVOC emission estimates rely heavily on satellite-derived Plant Functional Type (PFT) maps, which often exhibit substantial discrepancies and fail to capture detailed land-use characteristics in heterogeneous agricultural and urban landscapes. To address these limitations, this study developed a new regional PFT dataset by integrating field-surveyed forest information from the Korea Forest Service’s Forest Geographic Information System (FGIS). We applied a machine learning approach to extrapolate the high-resolution, observation-based PFT characteristics of the Korean Peninsula to the broader East Asian region, utilizing meteorological variables and satellite land-cover products as predictors. The generated PFT dataset was implemented into the biogenic emission module of the Community Multiscale Air Quality (CMAQ) model to evaluate its impact on air quality simulations. We validated the model performance by comparing simulated BVOC mixing ratios with airborne observations from the ASIA-AQ campaign. The results demonstrate that the proposed PFT dataset yields distinct spatial emission patterns compared to conventional satellite-based maps. Notably, the simulation showed improved consistency with observations, particularly over complex terrain and mixed land-use areas. These findings suggest that regionally optimized PFT inputs, grounded in field observations and machine learning, significantly reduce uncertainties in BVOC emission inventories and subsequent chemical transport modeling over East Asia.

Acknowledgment: This work was supported by the National Research Foundation of Korea(NRF) grant funded by the Korea government (MSIT) (No. RS-2025-16070879).

How to cite: jung, J., Kim, M. J., Choi, D.-R., Hong, S.-C., Lee, J.-B., and Lee, Y.: Improving East Asian BVOC Emission Estimates via Machine Learning-Based Plant Functional Types Mapping , EGU General Assembly 2026, Vienna, Austria, 3–8 May 2026, EGU26-6225, https://doi.org/10.5194/egusphere-egu26-6225, 2026.

EGU26-6630 | Orals | BG1.10

Environmental change is reshaping the temperature sensitivity of sesquiterpene emissions and their atmospheric impacts 

Efstratios Bourtsoukidis, Alex Guenther, Hui Wang, Theo Economou, Georgia Lazoglou, Aliki Christodoulou, Theo Christoudias, Anke Nölscher, Ana Maria Yañez-Serrano, and Josep Peñuelas

Air temperature is a critical regulator of ecosystem functions, including the release of biogenic volatile organic compounds (BVOCs) that mediate biosphere-atmosphere interactions. Among these, sesquiterpenes (SQTs) stand out for their dual role as ecologically significant compounds and highly reactive atmospheric constituents. Despite the inherently complex relationship between temperature and biogenic emissions, global emission estimates rely on simplistic parameterizations, assuming a fixed exponential response across all ecosystems and environmental conditions. Here, we synthesize two decades (1997–2019) of SQT emission studies, uncovering significant variability in temperature responses and basal emission rates driven by plant functional types (PFTs) and diverse environmental co-factors. When PFT-dependent parameterizations are integrated into emission-chemistry simulations, the results reveal sensitive feedbacks on atmospheric processes, including ground-level ozone (O₃) production and secondary organic aerosol (SOA) formation. Surprisingly, we identify a statistically significant decline in SQT temperature responses over time, suggesting that evolving environmental changes are reshaping the fundamental relationship between temperature and SQT emissions. This meta-analysis highlights the temperature sensitivity of sesquiterpenes (βSQT) as a key parameter at the interface of the biosphere, abiotic and biotic environmental change, and atmospheric processes, with cascading effects on air quality and climate.  Our findings emphasize the potential to consider βSQT as a "volatile stressometer" for ecosystem-atmosphere interactions, where environmental stresses regulate the emission responses, with cascading effects on atmospheric chemistry and wider implications for future climate-vegetation feedbacks.

How to cite: Bourtsoukidis, E., Guenther, A., Wang, H., Economou, T., Lazoglou, G., Christodoulou, A., Christoudias, T., Nölscher, A., Yañez-Serrano, A. M., and Peñuelas, J.: Environmental change is reshaping the temperature sensitivity of sesquiterpene emissions and their atmospheric impacts, EGU General Assembly 2026, Vienna, Austria, 3–8 May 2026, EGU26-6630, https://doi.org/10.5194/egusphere-egu26-6630, 2026.

EGU26-6635 | ECS | Posters on site | BG1.10

Quantifying BVOC emission rates and variability of three temperate marine macrophytes  

Max Gräfnings, Yuanyuan Luo, Jian Zhao, Kirsten Fossum, Frans Graeffe, Lu Lei, Jurgita Ovadnevaite, Mikael Ehn, and Camilla Gustafsson

Biogenic Volatile Organic Compounds (BVOC), emitted by Earth’s ecosystems, affect several chemical processes in the atmosphere that have profound climate impacts. Despite their climate relevance, global BVOC-budget estimations are still inaccurate and especially emissions originating from our oceans are poorly constrained. Marine macrophytes (i.e. macroalgae and seagrass) are a large and widespread organismal group whose BVOC emission rates are especially poorly quantified. In this study we set out to shorten this knowledge gap by quantifying ex situ with a PTR-TOF-MS the BVOC emission rates of three temperate macrophytes (Zostera marina, Fucus vesiculosus and Ulva intestinalis). To capture and increase our understanding of the variability of macrophyte BVOC-emissions, our quantifications were duplicated in two marine regions that vastly differ from each other, the eastern Atlantic (Ireland) and northern Baltic Sea (Finland). The three macrophytes emitted a large variety of BVOCs as 166 compounds were in total identified. Although many BVOCS were emitted by all macrophytes, significant differences were found in the total emission profiles, both between and within-species. Interestingly, the seagrass Zostera exhibited significantly higher overall BVOC emission rates per unit weight than the two macroalgae but also revealed clearly differing within-species emission profiles between the two regions. Of individual compounds, dimethyl sulfide (DMS) was emitted at the highest rates, but many other compounds (e.g., sesquiterpenes, C10H21O+) also showed notable emission rates. Although the most emitted BVOCs are commonly investigated compounds (e.g., DMS and terpenoids), our results show that the BVOC emissions are spread out over a large number of different compounds, suggesting that future studies would benefit from targeting a wider range of BVOCs than currently. Our results highlight macrophytes as highly variable sources of BVOCs, whose better inclusion into marine BVOC budgets should be strived for. However, more reliable data is needed, and future research should also focus on investigating the dynamics driving macrophyte BVOC emissions, their variability and eventual fate in the environment.

How to cite: Gräfnings, M., Luo, Y., Zhao, J., Fossum, K., Graeffe, F., Lei, L., Ovadnevaite, J., Ehn, M., and Gustafsson, C.: Quantifying BVOC emission rates and variability of three temperate marine macrophytes , EGU General Assembly 2026, Vienna, Austria, 3–8 May 2026, EGU26-6635, https://doi.org/10.5194/egusphere-egu26-6635, 2026.

EGU26-7499 | ECS | Posters on site | BG1.10

Combined Warming and Herbivory Stress Intensifies Isoprene Emissions and Alters CO2 Exchange in Arctic Shrubs 

Marta Contreras-Serrano, Riikka Rinnan, Jing Tang, and Tao Li

Arctic regions are experiencing rapid and disproportionate warming, with consequences for plant ecophysiology and the frequency and severity of insect herbivory outbreaks. Although the individual effects of warming and herbivory on Arctic vegetation and associated biosphere–atmosphere feedbacks have received increasing attention, their combined impacts remain insufficiently understood. Because climatic and biotic stressors frequently co‑occur, identifying whether their effects are additive, synergistic, or antagonistic is critical for predicting future ecosystem functioning.

We conducted a 13-week mesocosm experiment in controlled climate chambers using shrub-dominated plant communities (Salix spp.). The experiment included a 2-week acclimation, an 8-week treatment phase, and a 3-week recovery period. During the treatment phase, we applied four conditions: (1) ambient control, (2) warming (+5 °C, including a +5 °C heat wave in week 8), (3) herbivory by geometrid moth larvae (15 larvae added between weeks 5–7), and (4) combined warming and herbivory. CO₂ exchange was measured continuously throughout the experiment, while volatile organic compound (VOC) emissions via sorbent cartridges were quantified at four time points: weeks 8, 9, and 10 during treatments, and once in week 12, during the recovery period. Plant phenology was continuously monitored using greenness indices before, during, and after the 13-week experimental period.

Combined warming and herbivory strongly enhanced isoprene emissions by ~13-fold, whereas neither stressor alone produced a significant effect on VOC emissions. Isoprene emissions were highest in week 8, followed by a gradual decline during the following weeks, suggesting a transient stress-induced response. Phenological dynamics showed limited treatment sensitivity, although control plants exhibited a slower decline in greenness late in the season, suggesting that stressed plants may enter senescence earlier. CO₂ flux measurements indicated treatment-related trends in carbon exchange, though further analysis is ongoing.

Our results demonstrate that simultaneous climatic and biotic stressors can intensify VOC emissions and influence CO₂ exchange in Arctic shrubs, with potential consequences for atmospheric chemistry and carbon cycling. Incorporating multi‑stressor interactions into ecosystem models will be essential for accurately predicting vegetation–atmosphere feedbacks in a rapidly changing Arctic.

How to cite: Contreras-Serrano, M., Rinnan, R., Tang, J., and Li, T.: Combined Warming and Herbivory Stress Intensifies Isoprene Emissions and Alters CO2 Exchange in Arctic Shrubs, EGU General Assembly 2026, Vienna, Austria, 3–8 May 2026, EGU26-7499, https://doi.org/10.5194/egusphere-egu26-7499, 2026.

EGU26-11434 | ECS | Posters on site | BG1.10

Assessing the size-resolved chemical composition of 10-50 nm particles with an online DMA-VIA-MION-Orbitrap setup 

Henning Finkenzeller, Arttu Yli-Kujala, Ella Hirvensalo, Jian Zhao, Michel Attoui, Runlong Cai, Mrisha Koirala, Anna Bengs, Paxton Juuti, Aleksei Shcherbinin, Mikael Ehn, and Juha Kangasluoma

Measuring the molecular composition of small aerosol particles that have not yet grown to sizes of several 10 nm is difficult, predominately because of the little mass constituted by the particles. At the same time, composition measurements of the early particles would directly reveal the condensable species. Additionally, the chemical composition of these early particles controls the fate of the aerosol particles as it controls their robustness against evaporation. 
    The vaporization inlet for aerosols (VIA), coupled to an Eisele-type chemical ionisation (NO3-) inlet and a time-of-flight mass spectrometer, has been successfully demonstrated previously (Häkkinen et al 2023, Zhao et al 2023, Zhao et al 2023). Particles from a sample gas are first size selected by a differential mobility analyzer. Trace gases present in the gas phase are stripped by an active charcoal denuder. The particles are then evaporated in a sulfinert-coated stainless steel tube (OD ¼”) at temperatures up to 300 °C. The evaporated molecules are then delivered to a chemical ionization mass spectrometer. The concentration of particles entering the setup are monitored by a scanning mobility particle sizer. 
    Amending the experimental setup of the previous studies by a DMA for size selection before analysis, in this study we investigate how the aerosol composition differs between different particle sizes. Here, particles are first size-selected in a DMA, then vaporized in VIA. The resulting gases are ionized in a MION atmospheric pressure interface chemical ionization inlet using both positively and negatively charged reagent ions and detected in a polarity-switching high-resolution Orbitrap mass spectrometer. We demonstrate the general feasibility of the experimental approach in laboratory measurements using ammonium sulfate and a-pinene derived particles. 
    In ambient measurements, we show the ability to reach mass closure between the detected concentration of vaporized trace gases even at low particle sizes and low atmospheric particle concentration. We further present first results from a deployment of the novel approach to Mace Head, Ireland, where marine VOC emissions and the composition of 10-20 nm particles were targeted. Coordinated measurements of the gas and particle phase are used to constrain what species contribute to particle formation under the local conditions.  The work presents a step towards closing the measurement gap of nano-particle composition and contributes to a more complete understanding of aerosol formation from more complex gas mixtures.

How to cite: Finkenzeller, H., Yli-Kujala, A., Hirvensalo, E., Zhao, J., Attoui, M., Cai, R., Koirala, M., Bengs, A., Juuti, P., Shcherbinin, A., Ehn, M., and Kangasluoma, J.: Assessing the size-resolved chemical composition of 10-50 nm particles with an online DMA-VIA-MION-Orbitrap setup, EGU General Assembly 2026, Vienna, Austria, 3–8 May 2026, EGU26-11434, https://doi.org/10.5194/egusphere-egu26-11434, 2026.

EGU26-11489 | ECS | Posters on site | BG1.10

High Monoterpenoid Emissions from Scots Pine Litter Controlled by Moisture 

Yi Jiao, Sana M. James, Zhiyang Zhang, Kajsa Roslund, Irene Lehner, Tobias Biermann, Jing Tang, and Riikka Rinnan

Biogenic volatile organic compounds (VOCs) play important roles in atmospheric chemistry, yet most studies have focused on canopy emissions. Decomposition of forest litter, a major below-canopy VOC source, can substantially influence atmospheric oxidation and aerosol formation. Scots pine (Pinus sylvestris L.), one of the most widely distributed tree species across the boreal zone, produces terpene-rich litter that may represent a significant but understudied VOC source. Here, we incubated fresh needle litter under controlled temperature and moisture levels to quantify VOC and CO2 fluxes. Monoterpenoids overwhelmingly dominated emissions (91%), with oxygenated species such as camphor and 2,5-bornanedione being most abundant. Moisture was the main control: water addition increased monoterpenoid fluxes five- to seven-fold relative to drier treatments, consistent with stimulation of microbial activity. Temperature had a weaker but compound-specific influence, strongest for sesquiterpenoids. Isoprene increased while oxygenated VOCs declined over time, indicating a transition from stored-pool release to microbial processes. Specifically, the strong correlation between monoterpenoid and CO2 fluxes points to shared microbial processes and highlights the key role of moisture in VOC release from decomposing pine litter. This relationship may also offer a potential practical basis for estimating monoterpenoid emissions from pine-dominated forest floors using CO2 flux data.

How to cite: Jiao, Y., James, S. M., Zhang, Z., Roslund, K., Lehner, I., Biermann, T., Tang, J., and Rinnan, R.: High Monoterpenoid Emissions from Scots Pine Litter Controlled by Moisture, EGU General Assembly 2026, Vienna, Austria, 3–8 May 2026, EGU26-11489, https://doi.org/10.5194/egusphere-egu26-11489, 2026.

EGU26-11544 | Orals | BG1.10

Mirror image molecules and low volatility organic compounds emissions expose state ofrainforest stress 

Joseph Byron, Giovanni Pugliese, Carolina de A. Monteiro, Michelle Robin, Eliane Gomes Alves, Johanna Schuettler, S. Christoph Hartmann, Achim Edtbauer, Bianca Krumm, Nora Zannoni, Denisi Hall, Anywhere Tsokankunku, Cléo Q. Dias-Junior, Carlos A. Quesada, Hartwig Harder, Eftstratios Bourtsoukidis, Jos Lelieveld, and Jonathan Williams

Climate change is increasing the frequency and severity of Amazonian droughts, and El Niño events are predicted to become more intense and persistent. Despite this, the effects of drought on biogenic volatile organic compound (BVOC) emissions from tropical rainforests remain poorly understood. Chiral BVOCs like alpha-pinene, exist as mirror image pairs, known as enantiomers. Enantiomers have the same atmospheric reactivity, but are produced and emitted by different enzymes and internal leaf mechanisms. Abiotic stress can alter their relative emissions, suggesting enantiomer ratios could indicate stress severity. Here we present ambient concentrations from within the Amazon rainforest canopy of methyl salicylate, isoprene, monoterpenoids, and sesquiterpenoids from the Amazon rainforest spanning the 2023–2024 El Niño, the most severe drought ever recorded in the basin. Correlations between alpha-pinene enantiomers shifted with stress, aligning with weakening carbon dioxide uptake by vegetation and transition between de novo and storage emissions. Low- and high-stress zones, along with a recovery zone, were defined through alpha-pinene enantiomer correlations, revealing a metric for ecosystem stress. Isoprene and total monoterpenoid abundances showed little influence from El Niño, while total sesquiterpenoids increased by 122% across the El Niño duration. Unexpected emissions of lower-volatility sesquiterpene alcohols, including beta-eudesmol, alpha-eudesmol, and gamma-eudesmol, occurred during the wet season following the peak drought revealing an adaptation to adverse conditions linked to oxidative stress defence. Our results show how severe drought drives shifts in enantiomer ratios and isoprenoid composition in the atmosphere, reflecting underlying physiological changes as vegetation responds to abiotic stress.

How to cite: Byron, J., Pugliese, G., de A. Monteiro, C., Robin, M., Gomes Alves, E., Schuettler, J., Hartmann, S. C., Edtbauer, A., Krumm, B., Zannoni, N., Hall, D., Tsokankunku, A., Q. Dias-Junior, C., A. Quesada, C., Harder, H., Bourtsoukidis, E., Lelieveld, J., and Williams, J.: Mirror image molecules and low volatility organic compounds emissions expose state ofrainforest stress, EGU General Assembly 2026, Vienna, Austria, 3–8 May 2026, EGU26-11544, https://doi.org/10.5194/egusphere-egu26-11544, 2026.

EGU26-11845 | Posters on site | BG1.10

Geogenic and Biogenic Volatile Organic Compounds in an Arctic Permafrost Landscape 

Jesper Christiansen, Getachew Agmuas Adnew, Moritz Schroll, Christian Juncher Jørgensen, and Kajsa Roslund

Future warming of the Arctic may increase emissions of VOCs and GHGs, such as methane (CH4), into the atmosphere. Disintegration of cryospheric caps (permafrost and glaciers) can lead to increase in geogenic carbon emissions, alongside active layer biogenic emissions, and geogenic sources represent an overlooked feedback of atmospheric forcing from permafrost melting. However, the magnitudes, diversity, and partitioning of geogenic and biogenic VOCs and associated CH4 remain unknown, and therefore, we have limited understanding of how important different VOC and CH4 sources are for atmospheric interactions of melting Arctic permafrost landscapes.

We studied VOC and CH4 emissions in Nuussuaq (70°29′57.16″ N, 54°10′35.91″ W) in west Greenland with known natural geogenic gas and oil seeps. During a 10-day period, we collected gas samples from in situ gas seeps at lakes on top of geological fault zones, springs, and permafrost thaw ponds to capture the variation in VOC and CH4 compositions and emission rates in areas with different geogenic impacts. Furthermore, we measured net fluxes of VOCs, CH4, N2O and CO2 across a geomorphological and soil gradient (alluvial fan with sand to hydromorphic palsa rich in organic matter) underlain by permafrost, to gain insight into spatial drivers of diversity and partitioning of VOC and GHG fluxes in an Arctic landscape.

Preliminary results for VOCs across the geomorphological gradient show significant contribution to terrestrial emissions from vegetation, dominated by moss and Arctic shrubs, especially from the terpenes (+)-α-longipinene and (+)-camphor. Emission rates from waterbodies and wetland were smaller compared to terrestrial emissions, but VOC diversity was high, including compounds like acetone, 2-methylbutane, 2-ethyl-1-hexanol, benzaldehyde, and benzonitrile – potentially originating from both geogenic and biogenic sources. However, terpenes dominating terrestrial emissions were also observed abundantly in the water samples. In addition to VOCs, we will also present the flux data on CH4, N2O and CO2 and VOC data for lakes and springs to corroborate whether geogenic VOC’s are emitted. 

How to cite: Christiansen, J., Adnew, G. A., Schroll, M., Juncher Jørgensen, C., and Roslund, K.: Geogenic and Biogenic Volatile Organic Compounds in an Arctic Permafrost Landscape, EGU General Assembly 2026, Vienna, Austria, 3–8 May 2026, EGU26-11845, https://doi.org/10.5194/egusphere-egu26-11845, 2026.

EGU26-12967 | Orals | BG1.10

European Biogenic Volatile Organic Compound Emissions Based on Land Surface Modelling and Satellite Data Assimilation 

Paul Hamer, Miha Markelj, Oscar Rojas-Munoz, Bertrand Bonan, Jean-Christophe Calvet, Virginie Marécal, Alex Guenther, Heidi Trimmel, Islen Vallejo, Sabine Eckhardt, Gabriela Sousa Santos, Katerina Sindelarova, David Simpson, Norbert Schmidbauer, and Leonor Tarrasón

Biogenic volatile organic compound (BVOC) emissions from European vegetation are a major precursor of tropospheric ozone and remain a key uncertainty in regional air-quality modelling. We present two high-resolution (0.1° × 0.1°) European BVOC emission datasets developed within the EU SEEDS project aimed at supporting scientific development within Copernicus Atmospheric Monitoring Service (CAMS). The datasets include BVOC species consistent with the RACM chemical mechanism and are generated by coupling the SURFEX land surface model with the MEGAN3.0 emission model.

Emissions based on two land surface model simulations were analysed: (i) an open-loop SURFEX simulation available for 2018–2022, and (ii) a data-assimilation simulation in which satellite leaf area index (LAI) observations are assimilated, available for 2018–2020. In both cases, SURFEX is configured to allow vegetation phenological responses to meteorological variability, enabling a realistic representation of phenology. Evaluation against independent datasets shows that both simulations capture temporal variability in LAI and root-zone soil moisture, with improved skill in the analysis configuration.

Given its importance for atmospheric chemistry, we focus on isoprene emissions. Interannual and seasonal variability in isoprene emissions is shown to be primarily driven by LAI variability, with specific events (e.g. summer 2019) linked to drought-induced vegetation stress simulated by SURFEX. Daily variability in isoprene emissions is evaluated against in-situ online isoprene concentration measurements at eight western European sites, revealing moderate to strong correlations across most site-year combinations. Comparisons with other bottom-up European isoprene inventories show that SURFEX-MEGAN3.0 emissions lie between the lower CAMS-GLOB-BIOv3.1 and higher MEGAN-MACC estimates, with differences in seasonality attributable largely to the underlying LAI datasets.

These results highlight the important role of vegetation phenology, particularly LAI variability, in controlling BVOC emissions on monthly to interannual timescales, and demonstrate the added value of an Earth-system approach for BVOC emission modelling in support of air-quality assessments.

References

Hamer, . D., Markelj, M., Rojas-Munoz, O., Bonan, B., Calvet, J.-C., Marécal, V., Guenther, A., Trimmel, H., Vallejo, I., Eckhardt, S., Sousa Santos, G., Sindelarova, K., Simpson, D., Schmidbauer, N., and Tarrasón, L.: Two Biogenic Volatile Organic Compound Emission Datasets over Europe Based on Land Surface Modelling and Satellite Data Assimilation, Earth Syst. Sci. Data Discuss. [preprint], https://doi.org/10.5194/essd-2025-442, in review, 2025.

How to cite: Hamer, P., Markelj, M., Rojas-Munoz, O., Bonan, B., Calvet, J.-C., Marécal, V., Guenther, A., Trimmel, H., Vallejo, I., Eckhardt, S., Sousa Santos, G., Sindelarova, K., Simpson, D., Schmidbauer, N., and Tarrasón, L.: European Biogenic Volatile Organic Compound Emissions Based on Land Surface Modelling and Satellite Data Assimilation, EGU General Assembly 2026, Vienna, Austria, 3–8 May 2026, EGU26-12967, https://doi.org/10.5194/egusphere-egu26-12967, 2026.

EGU26-13173 | ECS | Posters on site | BG1.10

BVOCs and CO₂ fluxes under an herbivory outbreak in a Subarctic Birch Forest 

Albert Egea Guevara, Thomas Holst, Cleo L. Davie-Martin, Jolanta Rieksta, Amy Smart, Riikka Rinnan, and Roger Seco

Subarctic forests act as major emitters of biogenic VOCs and important carbon sinks whose balance can be rapidly altered by biotic and abiotic stressors. We analyzed the diel cycles of major VOCs during the growing seasons of 2021, 2022, and 2023 in a subarctic mountain birch forest (Betula pubescens) near Abisko, northern Sweden. Herbivory stress caused by caterpillar outbreaks was associated with changes in VOC emissions, particularly during the complete defoliation event in 2023, highlighting the importance of incorporating VOC dynamics into assessments of ecosystem responses to disturbance and climate change.
Complementing VOC observations, we examined CO₂ fluxes using four years (2021-2024) of eddy covariance data. The 2023 outbreak transformed the forest from a near-neutral carbon balance to a strong source (annual NEE = +150.147 gC m⁻²), compared to modeled undisturbed conditions predicted by RandomForest (+0.195 gC m⁻²) and LPJ-GUESS (−102.637 gC m⁻²). In the recovery year (2024), the observed balance returned to +5.168 gC m⁻². These findings demonstrate that insect outbreaks simultaneously disrupt carbon dynamics and biogenic VOC emissions, reinforcing the need to integrate both processes into models of northern ecosystems under climate change.

How to cite: Egea Guevara, A., Holst, T., Davie-Martin, C. L., Rieksta, J., Smart, A., Rinnan, R., and Seco, R.: BVOCs and CO₂ fluxes under an herbivory outbreak in a Subarctic Birch Forest, EGU General Assembly 2026, Vienna, Austria, 3–8 May 2026, EGU26-13173, https://doi.org/10.5194/egusphere-egu26-13173, 2026.

EGU26-13216 | ECS | Posters on site | BG1.10

Effects of temperature and soil water parameterization improvements in MEGAN-CLM Isoprene emissions: a model-observations assessment. 

Matteo Mastropierro, Bárbara Cardeli, and Daniele Peano

Isoprene accounts for half of the global BVOC emissions from terrestrial ecosystems. Consequently, refining its representation in numerical models is essential for accurately assessing its effects on Ozone and Secondary Organic Aerosols and, more generally, on the role of vegetation in modulating atmospheric physico-chemical processes. Here, we present an analysis and preliminary results of an improved parameterization of Isoprene emissions factor sensitivity to water availability and surface air temperature within the MEGAN model coupled with the Community Land Model (CLM-4.5). Overall, by comparing our results with three (quasi-)observational datasets, the new parameterization yielded more accurate estimates of global annual Isoprene emissions, despite still exhibiting less pronounced seasonal variability. Notably, more realistic values are obtained in the Arctic during boreal summer, as well as stronger emission reductions occur during periods of droughts in the tropics and in subtropical latitudes. Although uncertainties still persist in specific geographic regions, we investigate the specific model and environmental factors contributing to these discrepancies.

How to cite: Mastropierro, M., Cardeli, B., and Peano, D.: Effects of temperature and soil water parameterization improvements in MEGAN-CLM Isoprene emissions: a model-observations assessment., EGU General Assembly 2026, Vienna, Austria, 3–8 May 2026, EGU26-13216, https://doi.org/10.5194/egusphere-egu26-13216, 2026.

EGU26-16671 | Posters on site | BG1.10

Total ozone reactivity measurements indicate unidentified biogenic emissions 

Arnaud P. Praplan, Steven J. Thomas, Ryan W. Daly, Jeong-Hoo Park, Wei Wang, Anssi Liikanen, Hélène Angot, Jacques Hueber, Federico Bianchi, Alex Guenther, and Detlev Helmig

Total ozone (O3) reactivity measurements are rare, even though they are an important tool to assess the extent of the identification and quantification of volatile organic compounds (VOCs) reacting with ozone. This includes a large fraction of VOCs from biogenic sources such as trees and other vegetation. So far, only a few studies have investigated total O3 reactivity from biogenic emissions under controlled conditions (Matsumoto, 2014; Sommariva et al., 2020) or in situ (Thomas et al., 2023). In the present study, we compile previously unreported measurements of total O3 reactivity made during four distinct campaigns conducted between 2010 and 2020.

Two total ozone (O3) reactivity monitors (TORMs; Helmig et al., 2022) were used. The first one at the University of Michigan Biological Station (UMBS) during the 2010 CABINEX campaign to study emissions from red oak, white pine, red maple, and bigtooth aspen, and at the Alabama Aquatic Biodiversity Center (AABC) during the 2013 Southeast Oxidant Aerosol Study (SOAS) campaign to study emissions from sweetgum, white oak and loblolly pine. The second TORM was used at the University of Alaska Toolik lake field station (TFS) in 2019 to study emissions from tundra surface vegetation and at a boreal fen in Finnish Lapland (Lompolojänkkä) in 2020 to study emissions from the fen’s surface. Simultaneously, the chemical composition of the emissions was analysed by chromatographic methods.

TORM directly measures the amount of ozone lost in its reactor when O3 is mixed with sampled air. However, the derivation of total O3 reactivity from the measured O3 loss is not straightforward, particularly in the presence of fast-reacting compounds, such as β-caryophyllene. This invalidates the assumptions made in the equation used to calculate total O3 reactivity. For a more straightforward approach, we compared the measured O3 loss in the reactor against the expected O3 loss, which is modelled from identified VOCs and their reaction rate coefficients with O3. In most cases, the measured O3 loss was found to be higher than the expected one. Even after considering the uncertainties related to the quantification of VOCs, uncertainties of reaction rate coefficients, and uncertainties related to the direct measurement of O3 in TORM, unexplained O3 losses were consistently found during daytime, indicating unidentified biogenic VOC emissions.

References

Helmig, D., A. Guenther, J. Hueber, R. W. Daly, W. Wang, J.-H. Park, A. Liikanen, and A. P. Praplan. (2022). Ozone reactivity measurement of biogenic volatile organic compound emissions, Atmos. Meas. Tech., 15, 5439.

Matsumoto, J. (2014). Measuring Biogenic Volatile Organic Compounds (BVOCs) from Vegetation in Terms of Ozone Reactivity, Aerosol Air Qual. Res., 14, 197.

Sommariva, R., L. J. Kramer, L. R. Crilley, M. S. Alam and W. J. Bloss. (2020). An instrument for in situ measurement of total ozone reactivity, Atmos. Meas. Tech., 13, 1655.

Thomas, S. J., T. Tykkä, H. Hellén, F. Bianchi and A. P. Praplan. (2023). Undetected biogenic volatile organic compounds from Norway spruce drive total ozone reactivity measurements, Atmos. Chem. Phys., 23, 14627.

How to cite: Praplan, A. P., Thomas, S. J., Daly, R. W., Park, J.-H., Wang, W., Liikanen, A., Angot, H., Hueber, J., Bianchi, F., Guenther, A., and Helmig, D.: Total ozone reactivity measurements indicate unidentified biogenic emissions, EGU General Assembly 2026, Vienna, Austria, 3–8 May 2026, EGU26-16671, https://doi.org/10.5194/egusphere-egu26-16671, 2026.

EGU26-16883 | ECS | Posters on site | BG1.10

BVOC Emissions from Mediterranean Urban Shrubs: Implications for Ozone Formation and Air Quality 

Mame Fatou Ndoye Paye, Manon Rocco, Amandine Durand, Anne Monod, and Julien Kammer

Urban greening strategies are increasingly implemented to mitigate urban heat island, restore biodiversity, improve urban carbon balance and improve air quality. Yet vegetation can emit biogenic volatile organic compounds (BVOCs) that influence atmospheric chemistry. BVOCs react with oxidants such as ·OH and NO₃· radicals and O₃, contributing to secondary air pollutants such as tropospheric ozone and secondary organic aerosol (SOA). While emissions from trees in forest ecosystems are well documented, urban environments feature diverse plant types, with shrubs being the most planted type of plants in greening strategies but rarely studied in terms of VOC emissions. The few studies on mediterranean shrubs mostly focused on rosemary and thyme, and were limited to terpene emissions (isoprene, monoterpenes and sesquiterpenes, (Malik et al., 2023; Duan et al., 2023; Bourtsoukidis et al., 2024; Pei et al., 2025)) while their volatilome is probably more complex as for other plant species (Gonzaga Gomez et al., 2019; Furnell et al., 2024).

This study is aimed at providing a complete characterization of BVOC emissions from six common Mediterranean shrub species in Marseille (France), and at evaluating their potential contribution to secondary air pollution. Six species were investigated, and selected based on their abundance and their potential use in vegetation initiative : Rosmarinus officinalis, Thymus vulgaris, Photinia fraseri, Euphorbia characias, Viburnum tinus and Ligustrum vulgare. Dynamic enclosure measurements were used to collect BVOCs for 3 different commercial plants. A non-target approach combining online and offline measurement techniques was used to characterise BVOC emissions. Proton Transfer Reaction Time of Flight Mass Spectrometry (PTR-ToF-MS) was used for online measurements, complemented by VOC sampling on TENAX tubes, analyzed by GC-MS, mainly for monoterpene speciation.

Emission profiles revealed high chemical diversity, ranging from 45 compounds in Ligustrum vulgare to 91 VOCs in Thymus vulgaris emissions. Oxygenated VOCs (OVOCs) dominated the emissions of all species (60–66%) including Thymus vulgaris and Rosmarinus officinalis, which have previously only been considered monoterpene emitters (Gros et al., 2022; Francolino et al., 2023). The emissions of OVOCs such as methanol, acetone, and acetic acid often exceeded those of monoterpenes. The non-target approach used here enabled the detection of unexpected compounds, such as dimethyl sulfide (DMS, C2H6S), typically associated with marine sources, suggesting specific processes that will be discussed.

Ozone Formation Potential (OFP) varied over several orders of magnitude among the 6 species: Rosmarinus officinalis (43.7 g O₃ g VOC⁻¹), Thymus vulgaris (13.1 g O₃ g VOC⁻¹), Photinia fraseri (6.8 g O₃ g VOC⁻¹), Euphorbia characias (3.5 g O₃ g VOC⁻¹), Viburnum tinus (1.7 g O₃ g VOC⁻¹), and Ligustrum vulgare (0.2 g O₃ g VOC⁻¹). The SOA formation potential of these emissions also warrants further investigation to fully assess their contribution to urban atmospheric reactivity. These results indicate that species selection in urban greening projects can strongly influence air quality outcomes. Our findings provide emission factors for Mediterranean shrubs and highlight the need to integrate BVOC data into urban vegetation planning to minimize the formation of secondary pollutant.

How to cite: Paye, M. F. N., Rocco, M., Durand, A., Monod, A., and Kammer, J.: BVOC Emissions from Mediterranean Urban Shrubs: Implications for Ozone Formation and Air Quality, EGU General Assembly 2026, Vienna, Austria, 3–8 May 2026, EGU26-16883, https://doi.org/10.5194/egusphere-egu26-16883, 2026.

EGU26-17178 | ECS | Orals | BG1.10

 Impact of phytoplankton blooms on marine VOCs emission  

Cecilia Costas Selas, Mehrshad Foroughan, Suman Som, Eve Galen, Joseph Donald Martin, Ane Helberg, Simon Rohard, Klara Li Termansen, Riikka Rinnan, and Lasse Riemann

Volatile organic compounds (VOCs) are diverse bioactive molecules of low molecular weight and high vapor pressure. VOCs are produced by biotic and abiotic processes and are important for atmospheric chemistry as main biogenic precursors of secondary organic aerosols. In marine environments, the phytoplankton are the main source of marine VOCs, which appear to be an important source of organic compounds fueling bacterioplankton growth. Increased eutrophication and rising temperatures will likely increase intensity of coastal phytoplankton blooms in the coming decades with the potential cascading consequence of elevated VOC production rates and emissions. To assess VOC production by a phytoplankton bloom, we conducted a mesocosm experiment where VOC production by natural, unaltered microbial communities were compared to that by a phytoplankton bloom induced by nutrient amendment. VOCs were measured by combining a purge-and-trap system with a high-sensitivity proton-transfer reaction time-of-flight mass spectrometer (PTR-TOF-MS). Using 16S rRNA and 18S rRNA sequencing data, we analyzed the prokaryote and eukaryote community composition and the effect of their relationships on the VOC composition and concentration. The concentration and composition of VOCs changed over the course of the phytoplankton bloom, and some VOCs were significantly higher in the phytoplankton bloom than in the unaltered microbial communities.  A strong and significant correlation was found between the bacterial and eukaryotic communities, and VOCs. In addition, permutation analysis showed how the relationships between phytoplankton and bacteria can modify the composition of VOCs. These results evidence the effect of phytoplankton-bacteria relationships in marine VOC emissions.

How to cite: Costas Selas, C., Foroughan, M., Som, S., Galen, E., Martin, J. D., Helberg, A., Rohard, S., Termansen, K. L., Rinnan, R., and Riemann, L.:  Impact of phytoplankton blooms on marine VOCs emission , EGU General Assembly 2026, Vienna, Austria, 3–8 May 2026, EGU26-17178, https://doi.org/10.5194/egusphere-egu26-17178, 2026.

EGU26-17215 | Posters on site | BG1.10

Forest floor VOC emissions in a mountain pine–juniper stand: magnitudes, composition, and implications for ecosystem-scale fluxes 

Werner Jud, Lea Mika Götz, Albin Hammerle, Thomas Karl, Judith Sophie Schmack, Felix Spielmann, and Georg Wohlfahrt

Volatile organic compound (VOC) emissions from forests are typically attributed to tree canopies, while the forest floor remains comparatively understudied despite its complex mixture of litter, soil microbes, and understory vegetation. Here we report first results from a pilot study, in which we measured forest-floor VOC fluxes in a mountain pine–juniper (Pinus sylvestris, Juniperus communis) stand, at the Forest Atmosphere Interaction Research (FAIR) site of the University of Innsbruck in Mieming, Austria. The site is characterized by a relatively open tree canopy dominated by pines, and a forest floor that is almost completely covered by vegetation, including dominant juniper individuals. We compared mean soil emissions with ecosystem-scale VOC fluxes obtained at the same site during a period shortly after the soil measurements, to assess the relative contribution of the forest floor to whole-ecosystem VOC exchange.

Using a dynamic chamber approach coupled to online VOC detection using Proton Transfer Reaction Mass Spectrometry (PTR-MS), we quantified forest floor emissions at two locations: (i) a site dominated by pine needle litter and mosses, and (ii) a site where moss and litter co-occurred with heather (Erica herbacea), some Polygala chamaebuxus and various grasses (Sesleria ssp., Carex ssp.) understory.

Both sites emitted substantial amounts of terpenoid compounds, such as monoterpenes and sesquiterpenes, but also isoprene, as well as oxygenated compounds such as methanol, acetaldehyde and acetone. The emissions were temporally variable and differed between the two micro-sites, consistent with differences in biological composition, substrate and meteorological conditions. While the exact sources cannot be resolved from these measurements alone, plausible contributors include microbial activity within soil and the litter–moss layer, as well as root and shoot emissions from understory shrubs.

A comparison of the forest floor VOC fluxes with the total ecosystem exchange revealed that the mean soil fluxes of many VOCs were on the order of a few to about 40 % of the respective ecosystem fluxes. Strikingly, for sesquiterpenes the soil emissions at both microsites exceeded ecosystem-scale fluxes by about a factor three and seven, respectively. This discrepancy suggests substantial within-canopy loss processes (e.g., rapid oxidation or deposition) and/or differences in temporal representativeness between the datasets.

These findings expand the known role of the forest floor as an active VOC source and suggest that bottom-up budgets that focus solely on canopy emissions may underestimate ecosystem-scale fluxes, especially under conditions favorable to microbial or understory vegetation activity.

How to cite: Jud, W., Götz, L. M., Hammerle, A., Karl, T., Schmack, J. S., Spielmann, F., and Wohlfahrt, G.: Forest floor VOC emissions in a mountain pine–juniper stand: magnitudes, composition, and implications for ecosystem-scale fluxes, EGU General Assembly 2026, Vienna, Austria, 3–8 May 2026, EGU26-17215, https://doi.org/10.5194/egusphere-egu26-17215, 2026.

EGU26-17295 | Posters on site | BG1.10

Coupled insect-outbreak and microclimatic forcing suppresses BVOC emissions in subarctic understory plants 

Simon Nyboe Laursen, Shunan Feng, Amy Smart, Federico Grillini, Jolanta Rieksta, Yi Jao, Cleo Lisa Davie-Martin, Riikka Rinnan, and Andreas Westergaard-Nielsen

Insect herbivory is a major disturbance in subarctic ecosystems, yet its impact on biogenic volatile organic compound (BVOC) emissions from understory vegetation remains poorly understood. Here, we use a severe, natural geometrid moth outbreak in a mountain birch forest in northern Fennoscandia to quantify i) outbreak-associated changes in understory vegetation and ii) indirect effects of mountain birch canopy loss on understory microclimate and BVOC emissions. Across two growing seasons (moderate herbivory vs. peak outbreak), we combined enclosure BVOC measurements (n = 131) from three dominant understory plant species with near-surface spectral proxies of vegetation greenness and microclimatic data.  

The geometrid outbreak caused widespread mountain birch canopy defoliation and reduced understory greenness. Moreover, mountain birch canopy loss increased incident solar radiation in the understory, raised understory canopy surface temperature, and reduced soil moisture. Despite these warmer and brighter conditions, which typically promote BVOC release, understory BVOC emissions declined in the outbreak year, indicating that loss of photosynthetic tissue constrained emission capacity. Empetrum nigrum showed the strongest reduction in total BVOC emissions (72%) despite a pronounced shift toward stress-induced blends during the outbreak year.  Total emissions of Vaccinium myrtillus were reduced by 55% and showed modest compositional change including late-season increases in isoprene under warm, high-PAR conditions in the outbreak year. Graminoids were comparatively resilient, showing limited compositional shifts and only minor reductions in total BVOC emissions. 

Together, these results indicate that BVOC emissions from subarctic understories are jointly controlled by direct herbivory and canopy-mediated microclimatic feedbacks, and that large-scale insect outbreaks can directly or indirectly suppress, rather than enhance, BVOC emissions when green leaf loss outweighs biochemical induction. Accounting for these coupled pathways is essential for predicting biosphere–atmosphere interactions in a warming Arctic where insect outbreaks are expected to intensify. 

How to cite: Laursen, S. N., Feng, S., Smart, A., Grillini, F., Rieksta, J., Jao, Y., Davie-Martin, C. L., Rinnan, R., and Westergaard-Nielsen, A.: Coupled insect-outbreak and microclimatic forcing suppresses BVOC emissions in subarctic understory plants, EGU General Assembly 2026, Vienna, Austria, 3–8 May 2026, EGU26-17295, https://doi.org/10.5194/egusphere-egu26-17295, 2026.

EGU26-17304 | ECS | Orals | BG1.10

Links between Solar-Induced chlorophyll Fluorescence and isoprenoid emissions from field spectroscopy in low Arctic tundra 

Federico Grillini, Simon Nyboe Laursen, Amy Smart, Peiyan Wang, Shunan Feng, Juliane Bendig, and Andreas Westergaard-Nielsen

As climate warming is expected to extend the growing season and enhance vegetation productivity in the Arctic, a consequent increase in emissions of Biogenic Volatile Organic Compounds (BVOC) is forecasted.

Isoprenoid emissions are known to be driven, among other factors, by photosynthetic processes. Our hypothesis is then that the emissions of particularly isoprenoids can be linked to remotely sensed proxies of photosynthetic activity in typical vegetation of low Arctic tundra.

We tested this hypothesis by examining the relationship between Solar-Induced chlorophyll Fluorescence (SIF) in the O2-A absorption band and BVOC emission rates in a field spectroscopy framework, to further investigate the relationship between the reflectance properties of vegetation and total BVOC/isoprenoid emission rates. The study sitis located in the area oKobbefjord, Greenland.

The results of our analysis demonstrate that SIF and other spectral indices (Enhanced Vegetation Index – EVI, Photochemical Reflectance Index – PRI, MERIS Terrestrial Chlorophyll Index – MTCI) explain a substantial share of the variation in isoprenoid and total BVOC emissions. These findings can potentially be of aid in opening new avenues to model BVOC emissions at larger scales, as SIF and other relevant indices can be directly derived from new-generation UAV and satellite imagery.


How to cite: Grillini, F., Laursen, S. N., Smart, A., Wang, P., Feng, S., Bendig, J., and Westergaard-Nielsen, A.: Links between Solar-Induced chlorophyll Fluorescence and isoprenoid emissions from field spectroscopy in low Arctic tundra, EGU General Assembly 2026, Vienna, Austria, 3–8 May 2026, EGU26-17304, https://doi.org/10.5194/egusphere-egu26-17304, 2026.

EGU26-17720 | ECS | Posters on site | BG1.10

Beyond water solubility: physicochemical controls on VOC dry deposition in a mixed temperate forest 

Clément Dumont, Bert Verreyken, Niels Schoon, Benjamin Loubet, Crist Amelynck, and Bernard Heinesch

Volatile organic compounds (VOCs) play a key role in atmospheric chemistry by contributing to tropospheric ozone and secondary organic aerosol formation and by modulating the atmospheric lifetime of methane. Although the majority of atmospheric VOCs originate from biogenic emissions, dry deposition to ecosystems is increasingly recognized as an important sink influencing global budgets. While deposition processes have been quantified for a limited number of highly water-soluble VOCs, they remain poorly constrained for many other compounds.

Using a PTR-ToF-MS instrument, we measured VOC concentrations and fluxes above and below the canopy at the mixed temperate forest ICOS station of Vielsalm (Belgium) over three growing seasons (spring to autumn) between 2022 and 2024 (Dumont et al., 2026). Minimal deposition velocities were derived from negative net fluxes, and a two-layer (canopy and soil) big-leaf resistive model was applied for conceptual interpretation.

Above the canopy, significant deposition was detected for 47 VOC groups, identified by their mass-to-charge ratio (m/z) and spanning a wide range of physicochemical properties. Median deposition velocities ranged from 0.4 cm s⁻¹ for formic acid to 1.5 cm s⁻¹ for m/z 137.060 (C₈H₈O₂H⁺, aromatic OVOCs). Aerodynamic and quasi-laminar boundary layer resistances were negligible compared to the total resistance, while below-canopy uptake contributed only about 10% of the above-canopy deposition. This indicates that canopy processes represent the dominant regulation to VOC uptake.

The widely used Wesely (1989) deposition scheme reproduced the observed deposition velocities only for a subset of highly water-soluble compounds, as indicated by their high Henry’s law constants (e.g. formaldehyde, formic acid, acetic acid, hydroxymethyl hydroperoxide). For most of these low-molecular-weight OVOCs, deposition increased with relative humidity and peaked in autumn, when humid conditions were most frequent.

For many other VOCs, however, the Wesely model underestimated deposition by up to three orders of magnitude. Additional physicochemical properties were examined to account for the high deposition velocities of hydrophobic VOCs. Under dry conditions, deposition velocities were positively correlated with the octanol–air partition coefficient, used here as a proxy for solubility in lipid phases. This suggests uptake pathways not captured by current deposition models, such as dissolution into the waxy leaf cuticle or lipid membranes. Under wet conditions, this relationship weakened, and the Henry’s law constant emerged as the strongest predictor of deposition. These findings were supported by an independent VOC flux dataset acquired over a winter wheat field in the Paris region (Loubet et al., 2022), where a similar dependence on the octanol–air partition coefficient was observed.

Overall, our results indicate that both aqueous and lipid reservoirs within vegetation can contribute to VOC dry deposition and should be treated as complementary uptake pathways. Building on these findings, this ongoing work will aim to extend existing deposition models to predict the uptake of both hydrophilic and hydrophobic organic compounds by ecosystems.

How to cite: Dumont, C., Verreyken, B., Schoon, N., Loubet, B., Amelynck, C., and Heinesch, B.: Beyond water solubility: physicochemical controls on VOC dry deposition in a mixed temperate forest, EGU General Assembly 2026, Vienna, Austria, 3–8 May 2026, EGU26-17720, https://doi.org/10.5194/egusphere-egu26-17720, 2026.

EGU26-17790 | ECS | Posters on site | BG1.10

Effects of Vegetation and Microhabitats on Peatland VOC Emissions and Seasonal Dynamics across one Summer 

Mathilda Bloch Carlsson, Yi Jiao, Riikka Rinnan, and Bjorn Robroek

Peatlands store the largest carbon stocks per unit area and are key regulators of climate. Carbon cycling and emissions to the atmosphere from peatlands are of critical importance and responsive climate change, with changing precipitations patterns and temperatures causing a shift in plant community composition. Yet the underlying drivers for volatile organic compound (VOC) exchange remain poorly understood. This study aims to assess the influence of different functional plant groups and environmental drivers on peatland VOC emissions.

A field study was conducted utilizing an established long-term plant removal experimental setup with 40 plots evenly distributed across four plant removal treatments (control, removal of ericoid plants, removal of graminoid plants and removal of both groups) and two microsite types (hummocks and hollows). VOC emissions were measured twice each month in the summer of 2025 using flow chambers connected to sorbent tubes analyzed by GC-MS. We measured environmental variables; PAR-light, soil and air water content/humidity and temperature concurrently with vegetation VOC measurements. We also collected species cover data on plot level.

A PCA analysis across all VOC emissions uncovered the sampling months to explain multivariate distribution with clustering of all months and especially June standing out. The emission profiles were dominated by isoprene in July (80.7%) and August (87.8%) while in June oxygenated VOCs dominated the total emission (66.8 %). Linear mixed models showed a significant effect of month, treatment, microsite and the interactive effects of month and treatment and month and microsite on isoprene emissions. The highest mean isoprene emission appeared in July; the emissions were higher from hollow microsites than hummocks and the treatments with removal of graminoid plants had lower isoprene emissions compared to both other treatments. Only difference in month had a significant effect on the oxygenated VOC emissions, with OVOC emissions in June being more than tenfold than in the other months. Difference in month also significantly affected all other VOC groups. PLS models showed emissions of all groups except sesquiterpenes to significantly increase with air temperature, while soil temperature, water table depth and soil moisture significantly influenced emissions of isoprene, sesquiterpenoids, and OVOCs. The presence of ericoid plant species correlated negatively with sesquiterpene emissions while graminoid species increased isoprene emissions.

The study supports the understanding that VOC emission abundance and composition are influenced by environmental drivers and plant species composition, while the seasonal variation, even within summer months can be of significant size. Especially OVOC emissions seem responsive to a change in soil moisture, dominating the total emissions in the driest month.

How to cite: Bloch Carlsson, M., Jiao, Y., Rinnan, R., and Robroek, B.: Effects of Vegetation and Microhabitats on Peatland VOC Emissions and Seasonal Dynamics across one Summer, EGU General Assembly 2026, Vienna, Austria, 3–8 May 2026, EGU26-17790, https://doi.org/10.5194/egusphere-egu26-17790, 2026.

EGU26-17831 | ECS | Posters on site | BG1.10

Does Parental Environment Prime Offspring bVOC Responses to Heat and Drought in Scots Pine? 

Simone M. Pieber, Ugo Molteni, Na Luo, Stefan Hunziker, Arun Bose, Celia Faiola, Markus Kalberer, and Arthur Gessler

Biogenic volatile organic compounds (bVOCs) constitute a highly complex and diverse group of chemicals emitted into the atmosphere by the Earth’s biosphere. Through atmospheric oxidation, they alter the mixing ratios of trace gases such as methane, carbon monoxide, and tropospheric ozone. Moreover, oxidation products contribute to aerosol formation, which plays a crucial role in Earth’s radiative balance and air‑quality regulation.

Projected rises in global temperatures over the coming decades are expected to produce warmer and drier conditions in Alpine regions, resulting in combined heat‑ and drought‑stress for forest ecosystems. Understanding how trees respond to these co-occurring abiotic changes is essential for assessing impacts on atmospheric chemistry and secondary organic aerosol (SOA) properties.

We conducted controlled laboratory experiments spanning the peak growing season (July to October) to examine the effects of elevated temperature (heat, +4°C above average), reduced water availability (drought, 50% decrease in volumetric soil water content), and their combination on conifer seedlings grown from seeds collected in the Pfynwald Long‑Term Irrigation Experiment (established in 2003). By using offspring from Scots pine mother trees that experienced contrasting water regimes (naturally dry versus artificially irrigated), we assessed both immediate stress responses and potential maternal‑priming effects on bVOC emissions. Specifically, we investigated (i) bVOC precursors in conifer needles (secondary metabolites) and (ii) bVOC emissions in the gas phase.

To achieve this, we (i) developed an analytical method for extracting and chromatographically separating terpenes and terpenoids from conifer needles, and (ii) designed and built a novel plant chamber for bVOC gas‑phase measurements - online with a PTR‑ToF‑MS and offline with thermodesorption‑GC‑MS.

We present results illustrating terpenes and terpenoid in conifer needles and in the gas-phase from seedlings under different maternal water availability and compare baseline conditions to heat and drought stress. We hypothesize that parental environmental history influences offspring stress responses, and that incorporating these mechanisms into Earth‑system models will improve predictions of bVOC emissions and their feedbacks on atmospheric chemistry under future climate scenarios.

How to cite: Pieber, S. M., Molteni, U., Luo, N., Hunziker, S., Bose, A., Faiola, C., Kalberer, M., and Gessler, A.: Does Parental Environment Prime Offspring bVOC Responses to Heat and Drought in Scots Pine?, EGU General Assembly 2026, Vienna, Austria, 3–8 May 2026, EGU26-17831, https://doi.org/10.5194/egusphere-egu26-17831, 2026.

EGU26-18517 | Posters on site | BG1.10

Speciation of monoterpenes at atmospheric relevant concentrations without sample preconcentration 

Martin Graus, Klaus Winkler, Markus Leiminger, Tobias Reinecke, and Markus Müller

Volatile organic compounds (VOC) are exchanged between the Earth’s surface and the atmosphere. Their role in biosphere-atmosphere-climate interactions have been extensively studied in various and often inherently interdisciplinary research topics. Crucial to the understanding of these processes is the fast quantification of VOCs both primarily emitted as well as products and intermediates. Monoterpenes are an important class of VOCs contributing 15% to the global VOC emissions from terrestrial ecosystems. The most dominant isomeres of monoterpenes in the atmosphere are α-pinene, β-pinene, limonene, myrcene, camphene, and sabinene that are emitted in variable fractions depending on sources and conditions. In the atmosphere, monoterpenes may undergo rapid conversion via reactions with hydroxyl- and nitrate-radicals and ozone, forming oxidation products that eventually condense to secondary organic aerosol at high yields. Reaction rates of the different isomers with OH, O3 and NO3 spread up to orders of magnitude (0.8, 4.4 and 2.3 orders, respectively). Therefore it is of uttermost importance to quantify individual isomers to understand the reactivity of the mix of monoterpenes in an air mass.    

Proton-transfer-reaction mass-spectrometry (PTR-MS) is a well characterized analytical method for the real-time quantification of VOCs including monoterpenes. The drawback of PTR-MS is the detection of VOCs on a chemical composition level, hence, only the sum of monoterpenes can be measured. To solve this problem, we herein introduce an optimized fast gas-chromatographic pre-separation solution (fast-GC) that is seamlessly integrated to an ultrasensitive FUSION PTR-TOF 10 (IONICON Analytik, Austria). 

The improved fast-GC design allows for fast and precise heating rates leading to highest stability and repeatability of GC-runs. A temperature ramp can be completed as quick as 90 s providing  resolutions sufficient for a good separation of several monoterpene isomeres. A fast-GC run can be triggered approximately every 5-10 min; the time in between runs is used to measure the ambient sample without GC separation in real-time PTR-MS mode. With the high sensitivity (> 40 000 cps/ppbV) and lowermost limit of detection (< 1 pptV in 1 s) of FUSION PTR-TOF 10, no preconcentration prior to injection of the sample into the fast-GC is required.

In this presentation we show a thorough characterization of this fast-GC FUSION PTR-TOF 10. To demonstrate the capabilities of the system in a real-world application we sampled ambient air in Innsbruck, Austria, with fast-GC runs triggered every 10 minutes continuously over the course of several weeks. Despite the low ambient concentrations of the sum of monoterpenes in sub-ppbV levels, the presented method was able to separate and quantify 7 monoterpenes.

How to cite: Graus, M., Winkler, K., Leiminger, M., Reinecke, T., and Müller, M.: Speciation of monoterpenes at atmospheric relevant concentrations without sample preconcentration, EGU General Assembly 2026, Vienna, Austria, 3–8 May 2026, EGU26-18517, https://doi.org/10.5194/egusphere-egu26-18517, 2026.

EGU26-21092 | Posters on site | BG1.10

Effects of desiccation dynamics on petrichor emissions in Negev Desert soils 

Hai Anh Nguyen, Hayk Gevogyan, Benjamin Poodiack, Baris Weber, Jörg-Peter Schnitzler, Hagar Siebner, Osnat Gillor, Michael Bonkowski, and Andrea Ghirardo

Petrichor – a strong scent released from desiccated soil upon rewetting – is a mixture of volatile organic compounds (VOCs) that impact atmospheric chemistry and originates from the abiotic desorption of stored compounds and the de novo microbial production. The aridity gradient of the Negev Desert soils provides a particularly suitable system for studying petrichor emissions due to their distinctive and well-studied microbial communities (e.g., Actinobacteria and Cyanobacteria) but similar physical properties that control VOC physical evaporation, and absence of plant material as confounding sources of VOCs. While the chemical and microbial origins of petrichor are relatively well described, the controlling factors of its emission remain unclear. This study investigated the influences of desiccation dynamics on petrichor emissions and microbial succession in soils from an aridity gradient of the Negev Desert in Israel. Soil cores were subjected to three sequential rain events followed by contrasting desiccation regimes (long drought, rapid desiccation and slow desiccation) in a realistic climate simulation. Their VOC emissions and microbial metatranscriptomics were studied at five time points, including three upon rewetting and two during slow desiccation. The results showed that VOCs were produced during soil drying, with compound-specific release patterns occurring either during desiccation or upon rehydration. Despite having a common biosynthetic pathway, monoterpenoid and sesquiterpenoid emissions exhibited distinct temporal dynamics, suggesting different underlying physical control or microbial activity. The abundances and chemical diversity of petrichor decreased with increasing aridity, closely following the decline in microbial diversity. The microbial communities varied among rewetting scenarios and exhibited clear temporal succession during slow desiccation, likely regulating petrichor emissions through microbial activation. Greater community dispersion at 24 hours after rewetting indicated rapid and heterogeneous microbial reactivation, potentially contributing to increased variability and reduced predictability of early petrichor emissions. These findings highlighted the importance of desiccation rate in controlling petrichor emissions in desert ecosystems. Further field measurements and functional microbial analyses will be essential to understand how changing desiccation regimes will reshape petrichor emissions and the microbial communities in desert ecosystems.

How to cite: Nguyen, H. A., Gevogyan, H., Poodiack, B., Weber, B., Schnitzler, J.-P., Siebner, H., Gillor, O., Bonkowski, M., and Ghirardo, A.: Effects of desiccation dynamics on petrichor emissions in Negev Desert soils, EGU General Assembly 2026, Vienna, Austria, 3–8 May 2026, EGU26-21092, https://doi.org/10.5194/egusphere-egu26-21092, 2026.

EGU26-21725 | Orals | BG1.10

Dryland soil rewetting induces strong VOC emissions with potential to form ozone and aerosol 

Andrea Ghirardo, Benjamin Poodiack, Hagar Siebner, Matan Kalman Jaffe, Baris Weber, Jörg-Peter Schnitzler, Michael Bonkowski, Osnat Gillor, and Alex B. Guenther

Biogenic volatile organic compounds (VOCs) significantly influence atmospheric chemistry, yet the importance of microbial VOC emissions remains understudied. We investigate petrichor VOC emissions, the characteristic scent following rainfall after prolonged drought, across Israel’s aridity gradient, by simulating soil rewetting events. Rewetting triggered strong VOC fluxes (1-3.5 nmol m-2 s-1 ground area) dominated by sesquiterpenes and benzenoids, with emission patterns linked to climate-regions, soil aridity, and microbial community composition. Petrichor was composed of a complex bouquet of 58 VOCs, and the initial VOC burst resembled the CO2 pulse of the Birch effect. Petrichor emissions showed ozone and secondary organic aerosol formation potentials comparable to anthropogenic VOC sources in Israel. Despite compositional differences, emission magnitudes were of similar order across the aridity gradient. Given that drylands cover nearly half of Earth's land and are expanding, these episodic microbial VOC emissions may represent a significant, previously overlooked source of reactive carbon with potential implications for regional and global atmospheric chemistry.

How to cite: Ghirardo, A., Poodiack, B., Siebner, H., Jaffe, M. K., Weber, B., Schnitzler, J.-P., Bonkowski, M., Gillor, O., and Guenther, A. B.: Dryland soil rewetting induces strong VOC emissions with potential to form ozone and aerosol, EGU General Assembly 2026, Vienna, Austria, 3–8 May 2026, EGU26-21725, https://doi.org/10.5194/egusphere-egu26-21725, 2026.

EGU26-22882 | Orals | BG1.10

Light and High Temperature Dependent Decline in Photosystem II Efficiency in Holcus Is Associated with Photoprotective Roles of Volatile Signals Methyl Salicylate and cis-β-Ocimene 

Kolby Jardine, Asa Elliott, Hunter Seubert, Suzanne Kosina, Elaine Pegoraro, Kelsey Crutchfield-Peters, Erik Brown, Erica Grasberger, Shelly Benson, and Margaret Torn

Leaves must sustain high rates of photosynthesis to support growth while avoiding over-reduction of the chloroplast electron transport chain and the formation of damaging reactive oxygen species during daily exposure to high light and temperature. This challenge is particularly acute for C₃ species such as Holcus lanatus, which experience high rates of photorespiration under the warm, high-light conditions typical of grassland ecosystems.

In leaves of H. lanatus at the Point Reyes Field Station (California, USA), we observed a pronounced midday decline (approximately ten-fold) in the quantum efficiency of photosystem II (ΦPSII) despite elevated electron transport rates (ETR), temperature, and incident light, followed by full recovery in the evening. Controlled light- and temperature-response experiments revealed that net CO₂ assimilation, ETR, and volatile organic compound (VOC) emissions remained tightly coupled during periods of ΦPSII suppression, indicating sustained biosynthetic activity even as photochemical efficiency declined.

Among emitted VOCs, methyl salicylate (MeSA) and cis-β-ocimene—derived from the shikimate and isoprenoid pathways and linked to the Calvin–Benson cycle through carbon skeleton supply—showed strong light and temperature responsiveness. In contrast, α-pinene and sabinene emissions were largely light-independent and negatively temperature-sensitive. Given their established roles as potent phytohormones, these observations raise the possibility that photosynthesis-derived compounds such as MeSA and cis-β-ocimene act as internal feedback signals regulating the photosynthetic light reactions.

Although trans-β-ocimene is widely regarded as the dominant isomer in plant emissions, particularly under biotic stress, our sequence analysis predicts that approximately 18% of β-ocimene-producing species possess a cis-β-ocimene synthase, including a validated plastid-localized example in Cannabis sativa. By comparison, UniProt currently annotates cis-β-ocimene synthases in only ~7% of species. Together, these findings suggest three paradigm shifts: (i) photosynthetic products such as MeSA may directly regulate light reactions; (ii) MeSA may stimulate β-ocimene production, enhancing thermoprotection of photosynthesis; and (iii) cis-β-ocimene is likely far more abundant in nature than previously assumed. This dynamic decoupling of ΦPSII from electron transport, CO₂ assimilation, and biosynthesis under thermal and light stress has important implications for photosynthesis modeling and the interpretation of solar-induced fluorescence.

How to cite: Jardine, K., Elliott, A., Seubert, H., Kosina, S., Pegoraro, E., Crutchfield-Peters, K., Brown, E., Grasberger, E., Benson, S., and Torn, M.: Light and High Temperature Dependent Decline in Photosystem II Efficiency in Holcus Is Associated with Photoprotective Roles of Volatile Signals Methyl Salicylate and cis-β-Ocimene, EGU General Assembly 2026, Vienna, Austria, 3–8 May 2026, EGU26-22882, https://doi.org/10.5194/egusphere-egu26-22882, 2026.

EGU26-2319 | PICO | SM8.2

Evidence for virtual source-receiver refractions in cross correlations of infrasonic ambient noise 

Läslo G. Evers, Jelle D. Assink, and Julius T. Fricke

Seasonal variability in source activity and atmospheric temperature were retrieved from 11 years of infrasonic ambient noise. Variable lag times between an array (IMS array I53US) and single microbarometer (POKR, AK) were obtained from envelopes of cross-correlation functions. Beamforming and one-bit normalization significantly enhanced the stationary phase. Both microbaroms and surf appeared abundantly present, in the 0.1 to 2.0 Hz frequency band. Modeling revealed both tropospheric and stratospheric propagation of the infrasound, following traditional and more unconventional propagation mechanisms. Virtual source-receiver refractions from stratospheric altitudes appeared a plausible explanation for the unusual short lag times, which allows for new ways to passively probe the stratosphere.

Keypoints:

  • The cross correlation of infrasonic ambient revealed coherent energy from microbaroms and surf from a broad-band analysis
  • Seasonal variability was retrieved in source and medium variations in 11 years of microbarometer data
  • Stratospheric virtual source-receiver refractions can explain the unusual short lag times, providing new means to probe the upper atmosphere 

How to cite: Evers, L. G., Assink, J. D., and Fricke, J. T.: Evidence for virtual source-receiver refractions in cross correlations of infrasonic ambient noise, EGU General Assembly 2026, Vienna, Austria, 3–8 May 2026, EGU26-2319, https://doi.org/10.5194/egusphere-egu26-2319, 2026.

A graph of body-wave magnitude (mb) against the logarithm of the announced yield was prepared for a subset of the Soviet peaceful nuclear explosions (PNEs) featured in Sultanov et al. (1999).  A magnitude-log(yield) relation was derived using linear regression. Explosions detonated in cavities or near the surface in cratering experiments were not used, so the resulting relation is for confined explosions in competent rock of various types.  The mb used was the robust network mb derived by the International Seismological Centre (ISC)’s revised procedures (Bondàr and Storchak 2011).  The effect of relocation of some of the epicentres by up to 90 km (difference between ISC revised location and ground truth from Mackey et al. 2017) on network mb values was found to be negligible at one decimal place.  The magnitude-log(yield) relation was determined by orthogonal regression, accounting for errors in both mb and yield.


UK Ministry of Defence © Crown Owned Copyright 2026/AWE.

How to cite: Peacock, S.: Magnitude-yield relation for Soviet Peaceful Nuclear Explosions, EGU General Assembly 2026, Vienna, Austria, 3–8 May 2026, EGU26-2533, https://doi.org/10.5194/egusphere-egu26-2533, 2026.

EGU26-2618 | PICO | SM8.2

Weak-shock analysis of the acoustic signals generated by the OSIRIS-REx re-entry 

Elizabeth Silber and Vedant Sawal

The OSIRIS-REx sample return capsule re-entry provided a unique, controlled opportunity to study atmospheric shock wave propagation from a high-altitude source. Unlike natural meteoroids, which often undergo complex fragmentation and ablation, the capsule offered a stable source for characterizing specific acoustic generation mechanisms. We utilize infrasound data recorded by a regional network of ground-based sensors to analyze the acoustic signature associated with the descent. This study employs a semi-analytical weak-shock approach developed for a cylindrical line source to evaluate signal evolution as the wavefront propagates through the atmosphere. We examine the applicability of established shock theories to the recorded data, comparing theoretical predictions with the observed waveforms. The analysis explores the relationship between source characteristics and observations, providing a framework for better understanding the physics of non-fragmenting and non-ablating entries. These findings have broader implications for the monitoring and characterization of space debris, artificial re-entries, and meteoroids using infrasound stations. 
SNL is managed and operated by NTESS under DOE NNSA contract DE-NA0003525. Cleared for release.

How to cite: Silber, E. and Sawal, V.: Weak-shock analysis of the acoustic signals generated by the OSIRIS-REx re-entry, EGU General Assembly 2026, Vienna, Austria, 3–8 May 2026, EGU26-2618, https://doi.org/10.5194/egusphere-egu26-2618, 2026.

EGU26-4824 | PICO | SM8.2

Infrasound detection highlights of rockets from and to space 

Christoph Pilger and Patrick Hupe

This study focuses on the infrasound observation and case-based event analysis of recent and exceptional rocket launches for and reentries from space missions. Highlight cases of powerful launches and remarkable reentries are:

  • NASA’s Artemis 1 maiden flight in 2022 (and probably Artemis 2 in early 2026)
  • SpaceX’s Starship flight tests 1 to 11 from 2023 to 2025 (and probably Starship 12 in early 2026)
  • ESA’s Ariane 6 maiden flight in 2024 (and further launches in 2025+)
  • Blue Origin’s New Glenn maiden flight in 2025 (and further launches in 2025+)
  • Selected and detected reentries from Starship, New Glenn and Falcon 9 rockets

Rocket launches and reentries are powerful atmospheric noise sources detectable at infrasound arrays in hundreds to thousands of kilometers distance. Recorded signatures originate from the ignition, launch, supersonic movement, stage separation and reentry of rockets within the first about 100 kilometers of altitude of the atmosphere. Using microbarometer arrays of national observation networks and the International Monitoring System for the Comprehensive Nuclear-Test-Ban Treaty, such infrasound events can be remotely identified, localized and characterized.

How to cite: Pilger, C. and Hupe, P.: Infrasound detection highlights of rockets from and to space, EGU General Assembly 2026, Vienna, Austria, 3–8 May 2026, EGU26-4824, https://doi.org/10.5194/egusphere-egu26-4824, 2026.

Mitigating Seismic Ground Vibration (SGV) near the EKA/AS104 array at Eskdalemuir is increasingly important as Scotland expands wind farm development to meet its 2045 Net Zero commitments. Based on concerns about potential impacts on CTBT monitoring, the UK MoD currently restricts wind farm development near the EKA array, based on an empirical seismic forecasting model. This model assumes a single point source and relies on empirical attenuation and seismic velocity models. In 2004, via a student research paper the UK-MoD also set a limit on the maximum rms ground displacement of 0.336 nm for wind farm development within 50km of EKA array. Our results show that background seismic noise has significantly increased in the last 20 years due to the development of commercial forestry and anthropogenic activity.

To provide an evidence based assessment, two independent studies were commissioned . The first deployed surface seismic stations in a linear array up to 10 km from an existing wind farm and measured SGV across wind speeds from 0 to over 20 m/s. The data show that no detectable turbine related background seismic noise beyond approximately 5.0 km, demonstrating that real-world conditions differ substantially from the assumptions in the MoD’s model.

A second study drilled and cased a 200 m borehole near the EKR4 array element and installed a modern broadband seismometer, along with two additional sensors at the wellhead for comparison. It is well known that borehole sensors—already standard at many CTBT stations—significantly reduce SGV noise and improves signal quality. Data collected throughout 2025 show reductions of ~10 dB on calm days, and up to 25 dB on windy days within the MoD bandwidth of interest (2 to 8 Hz). The borehole sensor shows a clear improvement in signal-to-noise ratios, resulting in clear P-wave arrivals for teleseismic events. Importantly, the study also found that the original MoD threshold of 0.336 nm limit is routinely exceeded due to forestry activities and other man-made sources.

Thus, these findings demonstrate that wind farms have minimal seismic impact beyond ~5 km of such wind farm and that borehole sensors can substantially enhance the array’s resilience to environmental noise. This evidence supports revising the current MoD moratorium to allow unrestricted wind farm development at distances of not less than ~5 km from the Array. The wind industry has offered to drill and install borehole seismic sensors to supplement EKA elements, further strengthening the array’s capability to detect clandestine nuclear tests in support of the CTBT and reducing SGV from other anthropogenic sources, ensuring the long-term operational integrity of the array.

How to cite: Hasting, M. and Suárez, G.: Evidence-Based Seismic Impact of Wind Farms and Borehole Sensor Performance at the EKA Array, EGU General Assembly 2026, Vienna, Austria, 3–8 May 2026, EGU26-7897, https://doi.org/10.5194/egusphere-egu26-7897, 2026.

Through a cooperation between Korea Institute of Geoscience and Mineral Resources (KIGAM) and Institute of Astronomy and Geophysics (IAG), a seismo-acoustic array was installed in Umnugovi area of the southern Govi, Mongolia in September, 2025 for studying regional earthquakes. The study area experienced two big magnitude earthquakes in 1903 and 1960. The magnitude of the former event was 7.5 and the later one was 7.0. Since the 1903 event occurred, lots of small and middle magnitude events have struck the area but the calculation for attaining precise information of seismic parameters such as epicenter, depth of event, origin time, magnitude was partially limited due to poor seismic network in the area. As an initial step to constrain the solutions for the parameters, a single array process is applied with a seismo-acoustic array named HEXAR which is composed of 10 seismometers, 4 Chaparral M21 acoustic sensors, and hose arrays for reducing background wind noise. HEXAR consists of a relatively large array of 2 km aperture as a hexagonal shape and a small seismo-acoustic array of 0.5 km-aperture inner triangular shape. The Progressive Multi-Channel Correlation (PMCC) method is used for the detection and analysis of regional earthquakes and artificial events. For a preliminary stage of the analysis, separating artificial events from natural earthquakes is processed with a discriminant utilizing short period Rayleigh wave and infrasound signal. In this study, clear features of man-made events from two mines in Umnugovi area is presented with the analysis on the detected Rg phase, infrasound signal and epicenter.

How to cite: Kim, T. S.: An analysis on the artificial events in Umnugovi area, Mongolia, EGU General Assembly 2026, Vienna, Austria, 3–8 May 2026, EGU26-8756, https://doi.org/10.5194/egusphere-egu26-8756, 2026.

A combined analysis of seismic and acoustic signal observations for tracking explosive sources generated by the bombardment and shelling during the Russia-Ukraine conflict is presented. Events reported in the bulletins provided by IDC/CTBTO are used to identifying and associating detections of stations of the Central east European Infrsound Network (CEEIN). Seismo-acoustic signature (signal shape and amplitude, frequency content), as well as the propagation path of infrasonic signals, were analysed. As direction and speed of stratospheric winds are subject to change with time, selected events were analysed regarding their yield equivalents under various atmospheric conditions. By using infraGA 2D ray tracer through NRL-G2S atmospheric model, stratospheric and thermosphere infrasonic phases were identified and the energy release, which is described by the equivalent of TNT yield, is estimated by the empirical scaling of Los Alamos National Laboratory, published by Whitaker et al. (2003).

How to cite: Mitterbauer, U. and Ghica, D.: Assessment of yield equivalents from seismo-acoustic records under various atmospheric conditions, EGU General Assembly 2026, Vienna, Austria, 3–8 May 2026, EGU26-9736, https://doi.org/10.5194/egusphere-egu26-9736, 2026.

EGU26-13766 * | ECS | PICO | SM8.2 | Highlight

Detection of Explosive Volcanic Activity through Infrasound: A Global Assessment Using the IMS Network (2011–2020) 

Sandro Matos, Paola Campus, Maurizio Ripepe, and Nicolau Wallenstein

According to the Global Volcanism Program (GVP) of the Smithsonian Institution 1,281 volcanoes are currently considered potentially active, although only a small fraction is monitored in real time. For distant or inaccessible volcanoes, remote monitoring techniques are the only effective mean for continuous observation.

This study assesses the effectiveness of remote detection of explosive volcanic activity through infrasound observations between 2011 and 2020. A detection algorithm has been developed and applied to eruptions recorded in the GVP database with a Volcanic Explosivity Index (VEI) ≥ 3. The analysis has used data collected from 43 infrasound stations of the Comprehensive Nuclear-Test-Ban Treaty (CTBT) International Monitoring System (IMS) worldwide network, with distances up to 4,500 km from the selected volcanoes.

The approach has combined event compilation, infrasound data processing and spatio-temporal correlation analysis to associate detections with explosive volcanic activity. The algorithm has been developed based on the Progressive Multi-Channel Correlation (PMCC) method, integrated with the atmospheric profile calculated at the time of each event: this has been realized by incorporating meteorological data from the European Centre for Medium-Range Weather Forecasts (ECMWF) models ERA-Interim and ERA5 and the Ground-to-Space (G2S) empirical model.

Validation with event reports from the Comprehensive Nuclear-Test-Ban Treaty Organization (CTBTO) International Data Centre (IDC) has demonstrated the robustness of the method. The algorithm has successfully identified 50 of the 67 eruptions and 128 of the 186 distinct explosive events (with VEI ≥ 3) at 30 volcanoes, representing detection efficiencies of 75% and 69%, respectively.

The results highlight that the described method, joint to the IMS global infrasound network capability of provide a reliable tool for remote monitoring of explosive volcanic activities: this, enhances the global early warning potential, in particular in remote areas where local monitoring networks are not available.

How to cite: Matos, S., Campus, P., Ripepe, M., and Wallenstein, N.: Detection of Explosive Volcanic Activity through Infrasound: A Global Assessment Using the IMS Network (2011–2020), EGU General Assembly 2026, Vienna, Austria, 3–8 May 2026, EGU26-13766, https://doi.org/10.5194/egusphere-egu26-13766, 2026.

EGU26-13924 | PICO | SM8.2

Explosive yield estimates for shallow water explosions from moment magnitudes 

Andreas Steinberg, Christian Weidle, Trine Dahl-Jensen, and Björn Lund

The explosive yield- seismic magnitude relation of shallow submarine explosions are not well confined. Local agencies often use local seismic magnitude, such as the traditional richter scale, which are often not calibrated for submarine environments. The importance of an estimated explosive yield in TnT equivalent becomes obvious when security concerns arise. After the North Stream events a number of very differing magnitude were presented by several seismological surveys and therefore the related yield estimates varied a lot. This lead to derived estimates ranging from tens of kg to hundreds of kg TnT equivalent explosive used in the North Stream explosions, giving different plausible scenarios for potential perpetrators.

We present an relatively simple and fast approach to use the comparison of recorded and forward modelled envelope and cepstral information to derive the moment magnitude of several large and small submarine explosion in the Baltic sea. Moment magnitudes are more robust in comparison to local magnitudes. We asses the performance of this approach by relating the moment magnitudes to yield estimates from known explosive eventsWe use events from the Baltic sea, including events from offshore Bornholm from September 2025 with around 400kg TnT yield, recorded at local and regional distances up to 500km.

Infrasound recordings of stations in Germany are in good correlation with the seismic recordings, showing the possibility of combined energy release estimates. The strong importance of the source depth and shallow submarine geology is highlighted by the modelling results, providing still a large uncertainty range for unknown sources. We do find in general a good agreement between the estimated yield and actual yield for the known sources.

How to cite: Steinberg, A., Weidle, C., Dahl-Jensen, T., and Lund, B.: Explosive yield estimates for shallow water explosions from moment magnitudes, EGU General Assembly 2026, Vienna, Austria, 3–8 May 2026, EGU26-13924, https://doi.org/10.5194/egusphere-egu26-13924, 2026.

EGU26-17363 | ECS | PICO | SM8.2

Spatio-Temporal Variability of the Earthquake-Generated Ocean Soundscape: Decoupling Source Magnitude from Acoustic Conversion Efficiency 

Tolulope Olugboji, Tushar Mittal, Sayan Swar, and Kevin Heaney

Ocean soundscape analysis frequently relies on time-averaged metrics, treating geophony as a quasi-stationary background component. This approach obscures the stochastic, high-amplitude variability introduced by solid Earth seismicity, which dominates the low-frequency spectrum (<100 Hz) and exerts significant, transient environmental forcing. A fundamental knowledge gap remains regarding the transfer function between seismic ground motion and the resulting hydroacoustic pressure field. While T-phase excitation is known to occur via scattering at rough fluid-solid interfaces, the global scaling relationship between seismic source parameters (magnitude, depth, focal mechanism) and far-field acoustic intensity remains unconstrained. Specifically, it is unknown whether seismic-to-acoustic coupling is a globally constant scalar or a spatially variance function of local boundary conditions.


We present a comprehensive, data-driven analysis of the global earthquake soundscape, utilizing ten years (2015–2025) of continuous hydrophone records from the CTBTO International Monitoring System (Pacific, Atlantic, and Indian Oceans). Integrating IRIS seismic catalogs, we analyze over 10,000 events to quantify T-phase energy flux and duration. To isolate source mechanics from propagation effects, we correct for transmission loss using 3D ocean acoustic models and apply backprojection techniques to verify source azimuths. We employ a machine-learning framework to regress acoustic observations against high-resolution geophysical constraints, including Slab 2.0 geometry, slab thermal structure (controlling attenuation), global sediment thickness maps, and seafloor roughness metrics.


Our results challenge the assumption of a linear magnitude-loudness relationship. We identify significant spatial heterogeneity in T-phase generation, governed by a "Tectonic Efficiency" factor unique to specific margins. We demonstrate that acoustic amplitude and signal duration are strongly modulated by the incidence angle of P- and S-waves relative to the seafloor slope (conversion efficiency) and the scattering potential of the bathymetric interface. Furthermore, we find that thermal structure and sediment cover significantly damp high-frequency injection into the SOFAR channel at specific subduction zones. By resolving the physics of this coupling, we transform earthquake geophony from noise into a deterministic signal. This framework allows for the inversion of far-field hydroacoustic records to monitor changes in seafloor roughness and near-surface crustal properties, providing a novel remote sensing modality for the ocean floor.

How to cite: Olugboji, T., Mittal, T., Swar, S., and Heaney, K.: Spatio-Temporal Variability of the Earthquake-Generated Ocean Soundscape: Decoupling Source Magnitude from Acoustic Conversion Efficiency, EGU General Assembly 2026, Vienna, Austria, 3–8 May 2026, EGU26-17363, https://doi.org/10.5194/egusphere-egu26-17363, 2026.

The estimation of seismic moment tensors for shallow sources is known to be highly sensitive to near-source conditions, including surface topography and shallow geological structure, which are often poorly constrained. In this contribution, we present a sensitivity analysis as part of a uncertainty quantification effort, aimed at assessing how uncertainties in near-source parameters propagate into uncertainties in inferred seismic moment tensors.
The study focuses on the Degelen Mountains dataset, which provides a well-documented setting with shallow explosive sources and complex near-surface geology.

Our methodology relies on high-fidelity 3D forward simulations of seismic wave propagation using the spectral element method, allowing accurate modeling of topographic effects and strong near-surface heterogeneities. Uncertainties in geological properties in the immediate vicinity of the source are represented using perturbations from stochastic parameterizations based on a correlation length setting, enabling the generation of physically consistent
realizations of the near-source medium. For each realization, synthetic waveforms are computed and used to perform moment tensor inversions, from which the variability of source parameters is quantified.

This framework allows us to systematically explore the sensitivity of moment tensor solutions to localized uncertainties and to identify the dominant contributors to source-related ambiguity and provide new insights into the robustness and limitations of moment tensor inversion for shallow seismic sources in complex environments.

How to cite: Burgos, G. and Guilllot, L.: Quantifying the impact of near-source uncertainties on seismic moment tensor inference, EGU General Assembly 2026, Vienna, Austria, 3–8 May 2026, EGU26-17929, https://doi.org/10.5194/egusphere-egu26-17929, 2026.

Oceanic T-waves are sensitive to weak seismic and acoustic signals and hold significant advantages for constraining earthquake and tsunami characteristics, monitoring ocean temperature changes, and other marine environmental observations. However, the quantitative relationship between T-wave features and seismic source parameters remains unclear. This study analyzes the characteristics (e.g., arrival time, duration, energy) of T-waves excited by the 3 April 2024 Mw 7.3 Hualien, Taiwan mainshock and its aftershock sequence, using records from Pacific CTBTO hydrophone arrays and island-based seismic stations. The results indicate that the Hualien earthquake sequence generated prominent T-wave signals, whose excitation strength correlates positively with earthquake magnitude. Furthermore, systematic differences in energy were observed between T-waves excited by near-shore earthquakes and those from typical submarine earthquakes, suggesting that source location and mechanism play a critical role in T-wave generation efficiency. The analysis confirms that T-waves, even after long-distance propagation, retain high-frequency information from the source process. Their waveform characteristics can provide independent constraints on source parameters, offering valuable insights for utilizing T-waves in source parameter inversion.

How to cite: Zhou, Y., Zhang, Y., Xu, M., Ni, S., and Chu, R.: Characteristics of T-waves Excited by the 3 April 2024 Mw 7.3 Hualien, Taiwan, China Earthquake Sequence and Their Relationship with Source Parameters, EGU General Assembly 2026, Vienna, Austria, 3–8 May 2026, EGU26-20149, https://doi.org/10.5194/egusphere-egu26-20149, 2026.

A network of radionuclide stations forms one part of the International Monitoring System (IMS) for the Comprehensive Nuclear-Test-Ban Treaty (CTBT). These radionuclide stations are highly sensitive and continuously monitor the atmosphere for tiny traces of radioactive fission and activation products.  All IMS radionuclide stations have a high-volume sampler for detecting particulate radionuclides; some are also equipped with noble gas systems for measuring radioxenon. Specific radioactive xenon isotopes are more likely to escape from underground nuclear explosions and exhibit less complex atmospheric transport characteristics.

A central challenge of radioxenon monitoring for the CTBT is attributing and classifying detections originating from reactor sources. As was seen in the aftermath of the announced North Korean nuclear test explosions, atmospheric transport modelling is crucial for interpreting the spatial and temporal relevance of radioxenon detections in the context of potential CTBT non-compliance.

In this respect, the IMS noble gas system at RN38 in Takasaki, Japan, is very important due to its location downwind of the Korean Peninsula, particularly during the northern winter months. In summer, the influence of the East Asian monsoon leads to dynamic patterns that extend further north and north-east.

Several episodes of considerably high radioxenon activity concentrations in the range of tens of mBq/m³ were observed at RN38 in the years 2024 and 2025. These activity concentrations are ten to twenty times higher than those usually observed at comparable stations, but are still several orders of magnitude below levels of radiological concern. Backward atmospheric transport modelling investigates the potential source region of these detections by identifying areas of coincident atmospheric sensitivity. This enables a clear attribution to a common source region around Yongbyon. In particular, the North Korean nuclear test site can be excluded as the origin of the recurring detections. However, the potential blinding effect for telltale traces from nuclear tests, as well as their impact on other monitoring stations in the region and the IMS, is estimated by evaluation of forward ATM forecasts for hypothetical emissions from the North Korean test-site. 

How to cite: Ross, J. O., Brander, S., and Hupe, P.: Coincidence source localization by backward atmospheric transport modelling for a series of radioxenon detections at the IMS station RN 38, Takasaki, EGU General Assembly 2026, Vienna, Austria, 3–8 May 2026, EGU26-21180, https://doi.org/10.5194/egusphere-egu26-21180, 2026.

Wildfires in radioactively contaminated regions, such as the Chernobyl Exclusion Zone, pose a growing environmental threat by resuspending long-lived radionuclides into the atmosphere. However, accurately quantifying the redistribution of these radionuclides remains challenging. Existing top-down inversion studies often oversimplify source terms by assuming fixed particle sizes and release altitudes, which hinders the precise evaluation of transport mechanisms and deposition footprints.

To address this gap, this study proposes a novel multi-component source term inversion framework to simultaneously reconstruct the time-varying release profiles of 137Cs across multiple particle sizes (0.4, 8, and 16 μm) and seven vertical layers (0-3000 m). We improved the Projected Alternating Minimization with L1-norm and Total variation regularization (PAMILT) algorithm by incorporating a TV-regularized initialization and a Bayesian optimization scheme for hyperparameter tuning to ensure robust convergence. These retrieved source terms were then coupled with the WRF-Chem model using size-resolved microphysics to conduct a high-resolution simulation of the April 2020 Chernobyl wildfires.

Validation results demonstrated exceptional agreement between the simulated and observed concentrations, achieving a Pearson correlation coefficient of 0.996 and reducing maximum relative biases from over 106 to generally below 102. The inversion estimates a total 137Cs release of approximately 836 GBq. This release was dominated by fine particles (0.4 μm, ~54%) and low-altitude injections, with 58.1% occurring below 1 km. Crucially, our WRF-CHEM simulations reveal a decoupling between emission abundance and deposition impact. Although fine particles dominate the source term, coarse particles (16 μm) control the near-field deposition flux due to rapid gravitational settling. These coarse particles exhibit a "transport plateau" beyond roughly 800 km, whereas fine particles show a linear growth in transport distance constrained only by meteorological dispersion. Furthermore, we identified distinct deposition signatures. Dry deposition manifests as a continuous spatial accumulation or "creeping" effect. In contrast, wet deposition drives "step-wise" long-range transport, triggering sudden and pulse-like removal events far from the source.

These findings provide critical insights into the complex mechanics of radionuclide redistribution and offer a refined methodology for assessing the environmental impact of future wildfire events in contaminated zones.

How to cite: Xu, Y. and Fang, S.: Unraveling size-resolved 137Cs resuspension and deposition from the 2020 Chernobyl Wildfires via multi-component inversion and WRF-Chem simulation, EGU General Assembly 2026, Vienna, Austria, 3–8 May 2026, EGU26-2436, https://doi.org/10.5194/egusphere-egu26-2436, 2026.

The discharge of ALPS-treated water from the Fukushima Daiichi Nuclear Power Plant (FDNPP) in August 2023 renewed concerns regarding radionuclide dispersion in the North Pacific, particularly in the waters surrounding Taiwan. This event highlighted the need to assess not only releases from Fukushima but also the cumulative influence of multiple nuclear power plants operating within the region. To investigate potential dispersion patterns under simultaneous multi-source discharges, this study employed a particle tracking model coupled with the Semi-implicit Cross-scale Hydroscience Integrated System Model (SCHISM), together with a two-dimensional Gaussian diffusion model, to simulate tritium dispersion in surface seawater from six facilities located in the western North Pacific region during 2023–2024: FDNPP, Wolsong, Qinshan, Fuqing, Daya Bay, and the Maanshan Nuclear Power Plant (NPP3 in Taiwan). Also, the modeled tritium concentrations in the Pacific area were compared with background seawater levels reported in the IAEA Marine Radioactivity Information System (MARIS) database. This comparison provided a baseline consistency check to examine whether the simulated tritium distributions were influenced by large-scale ocean circulation and cumulative multi-source discharges.

To further evaluate potential local impacts around Taiwan, seven representative monitoring sites were selected to capture spatial variability across different coastal sectors and offshore regions, including Kinmen, Matsu, the Tamsui River Estuary, Cijin, the Zhuoshui River Estuary, Guishan Island, and FRI-ST-15 (a Fisheries Research Institute monitoring station). These sites were used to examine seasonal concentration responses associated with eastern, western, northern, and southern waters, as well as offshore island environments. The results indicate that tritium released from multiple sources was transported northward by the Kuroshio Current, reaching southern Japan and extending eastward to approximately 180°E. In the northwestern waters of Taiwan, including Kinmen and Matsu, contributions from Fuqing and Qinshan were dominant. At Kinmen, Fuqing’s contribution reached maximum values immediately after discharge and remained significant into early spring, whereas the contribution from Qinshan was comparatively smaller. At Matsu, Qinshan’s contribution increased approximately one month after discharge, decreased by late winter, and reached a secondary maximum in the subsequent winter, while Fuqing’s contribution increased during late winter and maintained a moderate influence thereafter.

Finally, some sensitivity analyses assuming a 50-fold increase in discharge concentrations were conducted to assess potential variability and relative influence among sources. The results indicated negligible influence from Wolsong and FDNPP, whereas discharges from Qinshan, Fuqing, Daya Bay, and NPP3 produced more pronounced, seasonally modulated signals that diminished with increasing distance from Taiwan.

How to cite: Chiang, Y. and Huang, P.-C.: Modeling the Regional Dispersion of Continuous Multi-Source Tritiated Water Discharges in Surface Waters Around Taiwan, EGU General Assembly 2026, Vienna, Austria, 3–8 May 2026, EGU26-3203, https://doi.org/10.5194/egusphere-egu26-3203, 2026.

EGU26-3623 | ECS | Posters on site | GI2.5

Transport of Particulate ¹³⁷Cs in the Coastal Area off Fukushima Based on Long-Term Continuous Measurement 

Shun Satoh, Kazuya Yoshimura, Toshiharu Misonou, and Daisuke Tsumune

Since the accident at the Fukushima Daiichi Nuclear Power Station in March 2011, numerous studies have examined the behavior of radioactive cesium (¹³⁷Cs) in the ocean. Recent studies suggest that large amounts of particulate ¹³⁷Cs deposited on land are transported to coastal waters via rivers, becoming a major source of coastal ¹³⁷Cs input. Although numerical simulations and conceptual studies indicate that particulate ¹³⁷Cs entering coastal waters can be transported offshore through sedimentation, resuspension, and lateral transport, long-term, high-frequency observational studies remain limited. In this study, we evaluated the transport of particulate ¹³⁷Cs in coastal area off Fukushima using one year of continuous measurement data from multiple moored systems.

Moored systems were deployed at three sites near the mouth of the Ukedo River, where current velocity, current direction, and turbidity were continuously measured from February 2017 to February 2018. These data were combined with regularly collected measurements of suspended solid concentrations (mg/L) and particulate ¹³⁷Cs concentrations (Bq/L) to estimate hourly lateral fluxes of particulate ¹³⁷Cs (Bq/h). The study area is influenced by ¹³⁷Cs inputs transported via the Ukedo River, and the relationships between particulate ¹³⁷Cs fluxes and seasonal variability, meteorological conditions (waves, precipitation, and wind), and river discharge were analyzed. Furthermore, by focusing on differences in fluxes among the observation sites, we examined the factors controlling riverine input and transport variability from the coastal area toward offshore.

This study uses long-term monitoring data off Fukushima to improve understanding of particulate ¹³⁷Cs transport processes in coastal waters and to provide observational constraints for future numerical modeling studies.

How to cite: Satoh, S., Yoshimura, K., Misonou, T., and Tsumune, D.: Transport of Particulate ¹³⁷Cs in the Coastal Area off Fukushima Based on Long-Term Continuous Measurement, EGU General Assembly 2026, Vienna, Austria, 3–8 May 2026, EGU26-3623, https://doi.org/10.5194/egusphere-egu26-3623, 2026.

Since the commencement of the ALPS-treated water discharge from Fukushima Daiichi on 23 August 2023, an operational forecasting system developed in Taiwan has been established to provide daily seven-day predictions of tritium dispersion in the North Pacific. The system integrates the real-time CWA-OCM with particle tracking and grid-based concentration diffusion modules, driven by hourly discharge data reported by TEPCO. The computational domain covers the Kuroshio–Kuroshio Extension and adjacent marginal seas, with refined resolution near the outlet to capture dispersion within approximately 3 km. Validation against TEPCO tritium monitoring data at 12 sites across three representative batches (1, 2 and 12) demonstrated that the system successfully reproduced both the spatial distribution and temporal evolution of tritium concentrations, with modeled maxima typically within the observed range of 10–20 Bq/L. However, the model slightly underestimated the peak values, and simulated concentrations decreased more rapidly than observed during the five-day post-discharge period. This discrepancy is likely attributed to the absence of the jet effect in the current model. Therefore, we will continue to refine the model and integrate these improvements into our operational forecasting system.

How to cite: Zeng, H.-T., Teng, J.-H., and Chiang, Y.: Validation of the Refined Daily Forecasting System for ALPS Treated Water Dispersion Against Observation Data near the Fukushima Outlet, EGU General Assembly 2026, Vienna, Austria, 3–8 May 2026, EGU26-4581, https://doi.org/10.5194/egusphere-egu26-4581, 2026.

EGU26-5031 | Posters on site | GI2.5

Assessment of the Kuroshio Large Meander’s Impact on the Dispersion Pathways of Fukushima Tritium-treated Water 

Yen-Ju Chu, Hui-Ting Zeng, Jen-Hsin Teng, and Chi-Hung Wang

The discharge of ALPS treated water from the Fukushima Daiichi Nuclear Power Station into the North Pacific Ocean has necessitated a detailed assessment of long-term dispersion pathways. The transport of this ALPS treated water is primarily governed by the Kuroshio Extension (KE) system. However, the upstream Kuroshio has been experiencing a persistent “Kuroshio Large Meander (KLM)” event since August 2017. Since the variability of the KE is dynamically linked to the path of the Kuroshio south of Japan, understanding how the KLM modulates the downstream flow field is critical for evaluating environmental impacts.

In this study, we investigate the influence of the KLM on the dispersion of tritium-treated water by Lagrangian particle tracking model with a continuous release scheme. The model was forced by ocean current data from the Hybrid Coordinate Ocean Model (HYCOM) to capture the spatiotemporal variability of the Kuroshio Current. We specifically examined the differences in transport patterns during the KLM period (2017–2022) versus non-meander period (2011–2016).

Preliminary results indicate that the presence of the upstream Large Meander induces specific downstream responses in the Kuroshio Extension that distinctively deviate from the reference non-meander period. We focus on how the KLM modulates the stability and position of the KE jet, thereby altering the initial advection pathways of the ALPS treated water. The analysis aims to clarify whether these KLM-induced changes in the KE system act to retard zonal transport or enhance regional retention, creating significant discrepancies in tracer arrival times and concentration fields between the two periods.

This study quantifies these deviations and discusses the implications of the “Kuroshio-Kuroshio Extension coupling” mechanism in determining the dispersion patterns and concentration distributions of passive tracers. The findings highlight the necessity of incorporating low-frequency climate variability into environmental risk assessments for oceanic discharges.

How to cite: Chu, Y.-J., Zeng, H.-T., Teng, J.-H., and Wang, C.-H.: Assessment of the Kuroshio Large Meander’s Impact on the Dispersion Pathways of Fukushima Tritium-treated Water, EGU General Assembly 2026, Vienna, Austria, 3–8 May 2026, EGU26-5031, https://doi.org/10.5194/egusphere-egu26-5031, 2026.

Overview of the observation and simulation studies regarding radiocesium resuspension from contaminated land surfaces in Fukushima is presented based on our previous papers, Kajino et al., ACP (2016), Kajino et al., ACP (2022), Watanabe et al., ACP (2022). The long-term atmospheric behaviors of radiocesium have been understood based on the long-term measurements of concentration and deposition of radiocesium in Fukushima city (Watanabe et al., 2022) and numerical simulations considering radiocesium resuspension from soil and vegetation (Kajino et al., 2022). However, there is still one unresolved issue remains: exceptionally high monthly cumulative deposition amounts in January in Fukushima city even though the monthly atmospheric concentrations are not very large. We therefore hypothesized that the giant aerosol resuspension due to snow removal work or passing vehicles that carried radiocesium deposited in the vicinity of the observation site into the deposition sampler, but not into the air sampler, since the gravitational velocity of such giant aerosols is too high to collect by the air sampler. This additional source is referred to as secondary resuspension. The numerical assessment and field observations of the secondary resuspension will also be presented at the conference. 

How to cite: Kajino, M.: Resuspension of radiocesium from contaminated land surfaces in Fukushima: source contributions from soil, vegetation, and other sources, EGU General Assembly 2026, Vienna, Austria, 3–8 May 2026, EGU26-8529, https://doi.org/10.5194/egusphere-egu26-8529, 2026.

EGU26-8971 | Posters on site | GI2.5

Four decades after Chornobyl: long-lived radionuclide legacy and sustainable land and resource use   

Yasunori Igarashi, Vasyl Yoschenko, Yuichi Onda, Valentyn Protsak, Gennady Laptev, Dmytrii Holiaka, Dmitry Samoilov, Serhii Kirieiev, Alexei Konoplev, and Jim Smith

Chornobyl remains the world’s longest-running field-scale experiment of how societies and ecosystems respond to persistent, spatially heterogeneous contamination. Yet sustainability-relevant synthesis across environmental compartments—soils, forests, surface waters, groundwater, and the evolving exposure landscape—remains fragmented, often separated into radiological, ecological, or regulatory discussions. Here we integrate four decades of observations in and around the Chornobyl Exclusion Zone to evaluate what has changed, what has not, and what this implies for sustainable land and resource use under long-lived hazards. We assess four compartment-linked insights: (isoils as the primary long-term reservoir of fallout: inventories of 137Cs and 90Sr have declined but remain highly heterogeneous, while vertical redistribution and particle-associated processes increasingly govern mobility and bioavailability; (ii) forests as both sink and pathway: radionuclides are continuously recycled through litter and biomass, and contrasting within-tree distributions of 137Cs versus 90Sr impose distinct constraints on wood utilization and circular-economy strategies; (iii) aquatic systems as delayed but persistent exporters: multi-decadal river records exhibit long tails and sensitivity to disturbances (e.g., floods, fires), while groundwater pathways—especially for 90Sr—represent enduring, often weakly observed legacy with clear management relevance; and (iv) exposure landscapes that evolve nonlinearly: spatiotemporal changes in dose fields complicate re-zoning decisions that depend on both scientific evidence and societal acceptance. We synthesize these findings into a sustainability framework that links environmental dynamics to governance choices, including conditional resource use, monitoring prioritization, and intergenerational risk trade-offs. These lessons generalize to other nuclear accidents and to broader classes of persistent contaminants where returning to baseline is unrealistic and sustainability must be designed under enduring constraints. 

How to cite: Igarashi, Y., Yoschenko, V., Onda, Y., Protsak, V., Laptev, G., Holiaka, D., Samoilov, D., Kirieiev, S., Konoplev, A., and Smith, J.: Four decades after Chornobyl: long-lived radionuclide legacy and sustainable land and resource use  , EGU General Assembly 2026, Vienna, Austria, 3–8 May 2026, EGU26-8971, https://doi.org/10.5194/egusphere-egu26-8971, 2026.

The Fukushima Daiichi Nuclear Power Plant (FDNPP) accident contaminated large areas of the Pacific Ocean with different radionuclides. However, not all areas are studied equally. For example, the Sea of Okhotsk is one of the least studied regions, with almost no measurement data available. In the current study, we applied the Lagrangian particle tracking model Parcels V3.0 to simulate the trajectories of virtual particles containing radionuclides in the Pacific Ocean. Here, the output from the KIOST-MOM circulation model is used. It includes monthly mean climatic data for 3D currents (U, V, W components of water velocity) and vertical diffusivity coefficients. Coefficients for horizontal diffusion are calculated using the Smagorinsky formula.

Virtual particles were emitted at the location of the FDNPP during 31 days (26 Mar to 25 Apr 2011), when 96.6% of the total amount of radionuclides was released directly to the ocean. Each particle initially contained a certain activity of radionuclides (137Cs, 134Cs, 90Sr, 3H, 129I) proportionally to the estimated total release of each radionuclide. The activity of each radionuclide inside the particle decreased according to radioactive decay with the corresponding half-life. The atmospheric deposition of radionuclides on the sea surface was not considered here.

Model results were validated on the 134Cs concentrations in the Northeastern Pacific in areas with measurement data after 2012, when the impact of atmospheric deposition decreased. For the Sea of Okhotsk, the concentrations of 5 radionuclides were calculated and analyzed. For particles that reached the Sea of Okhotsk, we calculated statistical characteristics based on Lagrangian trajectories: visitation frequency, mean age, and representative trajectory, which demonstrated the pathways of water masses transporting radioactivity from FDNPP to the Sea of Okhotsk.

How to cite: Bezhenar, R., Tateda, Y., Inomata, Y., Kim, K. O., and Kim, H.: Lagrangian trajectories of Fukushima Daiichi NPP originated water, transported by large-scale circulation in the North Pacific Ocean, and reached the Sea of Okhotsk, EGU General Assembly 2026, Vienna, Austria, 3–8 May 2026, EGU26-9903, https://doi.org/10.5194/egusphere-egu26-9903, 2026.

Validating the reproducibility of ocean dispersion models used in prior environmental impact assessments of ALPS-treated water release is essential for evaluating their applicability. In this study, we conducted reproduction simulations using actual release records together with observed meteorological and oceanographic conditions, and quantitatively compared the results with seawater monitoring data.

Model results were compared with tritium monitoring data collected by TEPCO, the Ministry of the Environment, the Nuclear Regulation Authority, and Fukushima Prefecture. The release was assumed to instantaneously disperse within a model grid (147 m × 186 m), with release scenarios prescribed for both the surface layer and the near-bottom layer at a depth of 10 m. As the actual discharged water is expected to rise upward from the seabed, results from the surface-release simulation are mainly discussed. Geometric means were used for model–observation comparisons to reduce the influence of outliers. Since background tritium concentration is not explicitly represented in the model, a constant background of 100 Bq m⁻³ was added to the modeled concentrations to ensure consistency with observations.

For the entire one-year period, the correlation coefficient between annual geometric means of modeled and observed concentrations was R = 0.30, indicating moderate reproducibility of temporal variability. In contrast, the mean log(Model/Obs) was −0.035, corresponding to a Model/Obs ratio of 0.92, demonstrating very good agreement in annual mean concentration levels. When the comparison was restricted to release periods, the correlation improved (R = 0.64), while the mean Model/Obs ratio increased to 1.37, suggesting a tendency toward overestimation associated with uncertainties in local release representation and model resolution near the outlet.

These results indicate that, although the model has limitations in reproducing short-term concentration variability, it reliably reproduces annual mean tritium concentrations that are critical for radiological dose assessment. The present validation demonstrates that the ocean dispersion model used in the prior environmental impact assessment has sufficient reliability for evaluating the dispersion behavior of ALPS-treated water, while highlighting the need for further improvements in the treatment of background concentrations and near-field processes.

How to cite: Tsumune, D., Misumi, K., and Tsubono, T.: Reproducibility of ocean dispersion simulations for ALPS-treated water release off Fukushima: comparison with one-year monitoring data, EGU General Assembly 2026, Vienna, Austria, 3–8 May 2026, EGU26-10166, https://doi.org/10.5194/egusphere-egu26-10166, 2026.

The Fukushima Daiichi Nuclear Power Plant (FDNPP) disaster, triggered by the tsunami after the massive earthquake on March 11, 2011, which led to the accumulation of vast quantities of contaminated water used for emergency cooling. Although containment measures were implemented to prevent leakage, the on-site storage facilities approached full capacity. Consequently, Japan announced plans to disposal the Advanced Liquid Processing System (ALPS) treated wastewater, which removes most radionuclides except tritium. TEPCO officially began discharging the treated water on August 24, 2023, diluted with seawater, into the Pacific Coast via a submerged outfall located 1 km offshore at a depth of 13 meters. This decision raised significant concerns among the publics of neighboring countries regarding marine safety. In response, Taiwan established a specialized task force to monitor and to predict the consequences by developing an operational forecast model system to monitor the discharge and provide daily predictions of radioactive dispersion in the Western North Pacific.

The system integrates a three-dimensional hydrodynamic model (CWA-OCM-FH), an extension of the existing operational model CWA-OCM, with a transport model driven by the simulated currents. In order to capture the influence of the Kuroshio Current and the Extension on the transport of tritiated water, the model domain was expanded to 180°E. An unstructured mesh is employed to resolve complex topographic features. The grid resolution varies from approximately 1 km in the coastal zone to less than 20 meters near the discharge outfall, ensuring a representation of spatiotemporal variations in the near-field flow.

To ensure the reliability of the flow fields driving the dispersion, the hydrodynamic model underwent rigorous validation using tide gauge data and ADCP observations. Harmonic analysis on both the observed and simulated data for data for calibration and verification.

Driven by the verified flow fields, a 3D Lagrangian particle tracking model simulates the dispersion pathways of the tritiated water. These computed trajectories provide the essential spatial distribution data required for calculating subsequent concentration. Simulation results indicate that while the primary transport direction follows the Kuroshio Extension and North Pacific Current eastward, mesoscale eddies induce significant cross-stream transport. Therefore, the contaminated particles could potentially influencing waters near Taiwan. 

The model has been verified with observations utilize quantitative metrics such as the Pearson correlation coefficient (R value), coefficient of determination (R²), and Root Mean Square Error (RMSE) over a period exceeding one year. Validation using data from tide gauge stations, ARGO drifter profiles, AVISO satellite altimetry geostrophic currents, and GHRSST sea surface temperature satellite data will be presented and discussed in the paper.

How to cite: Wang, C.-H., Cheng, H.-Y., Yu, J. C. S., Zeng, H.-T., and Teng, J.-H.: An Operational Modeling System Forecasting the Disposal of Fukushima Tritiated Water and Transport: A Lagrangian Particle Tracking System Driven by High-Resolution Hydrodynamics., EGU General Assembly 2026, Vienna, Austria, 3–8 May 2026, EGU26-14564, https://doi.org/10.5194/egusphere-egu26-14564, 2026.

EGU26-15000 | Posters on site | GI2.5

The Role of Subtropical Mode Water in the Subsurface Transport of Fukushima-derived 137Cs into the South China Sea 

Seung-Tae Lee, Yang-Ki Cho, Kyeong Ok Kim, and Seongbong Seo

The Luzon Strait serves as a critical conduit between the Western North Pacific and the South China Sea (SCS), through which water-mass exchange plays a key role in regulating regional heat budgets and primary productivity. While surface exchange processes have been known well, subsurface intrusion dynamics—particularly those associated with Subtropical Mode Water (STMW)—remain poorly understood. In this study, we investigate the pathways and transport timescales of STMW intrusion through the Luzon Strait by employing radiocesium 137Cs released during the 2011 Fukushima Dai-ichi Nuclear Power Plant (FDNPP) accident as a transient tracer. A three-dimensional Regional Ocean Modeling System (ROMS) was used to simulate the long-term dispersion of 137Cs from the North Pacific into the SCS. The results show that the 137Cs within the STMW layer reached the Luzon Strait approximately seven years after the accident, notably earlier than surface circulation. The net flux of 137Cs into the SCS exhibits seasonal variability, with enhanced inflow during winter, primarily driven by horizontal advection and variations in Kuroshio intrusion behavior. A comparison of different intrusion modes indicates that the leaking path yields a substantially larger net inflow of radiocesium into the SCS than either the looping or leaping paths. Given that the SCS serves as a gateway to downstream marginal seas—including the East China Sea, Yellow Sea, and Japan/East Sea—these findings provide important insights into basin-scale transport processes of Pacific-derived tracers and their potential ecological implications.

How to cite: Lee, S.-T., Cho, Y.-K., Kim, K. O., and Seo, S.: The Role of Subtropical Mode Water in the Subsurface Transport of Fukushima-derived 137Cs into the South China Sea, EGU General Assembly 2026, Vienna, Austria, 3–8 May 2026, EGU26-15000, https://doi.org/10.5194/egusphere-egu26-15000, 2026.

EGU26-15352 | Orals | GI2.5

Possibility of radionuclide originated from the Fukushima accident as oceanic tracer by fish muscle as bio-indicator 

Yutaka Tateda, Hyoe Takata, Yayoi Inomata, Yasunori Hamajima, and Roman Bezhenar

The Fukushima Dai-ichi Nuclear Power Station (F1NPS) accident released radionuclide was believed to circulate in the North Pacific Ocean and was suggested to arrive at East China Sea ECS (Aoyama et al., 2022). Temporal fraction of 137Cs from F1NPS was estimated to be 0.5 mBq l-1 at ECS in 2023 (Inomata et al., 2023). Appeared 137Cs radioactivity 1.4 mBq l-1 off Okinawa seawater in 2025 seems to suggest still having contribution of 0.6 mBq l-1 as F1NPS originated fraction even after 14 years of the accident, compared to assumed global fallout originated level 0.8 mBql-1 in ECS at 2025 (ENVRDB, 2025). This level was suggested to be caused by recirculation of 137Cs within the north western Pacific waters by Subtropical Mode Water (STMW) and Central Mode Water (CMW)(Kumamoto et al., 2025). Similarly, F1NPS-137Cs may be brought by North Equatorial Current (NEC) within 10-18 years (Chen et al., 2023). However, in contrast, there is other possibility as depuration delay of global fallout-137Cs in surface water by depression of vertical mixing to deeper layer due to high surface water temperature after 2010 as observed global warming. Since F1NPS-orginated 134Cs originated F1NPS almost decayed and being difficult to detect, it is still unknown the precise contribution rate of F1NPS-137Cs compared to global fallout 137Cs fractions. Possible method to derive F1NPS fraction may be using fish muscle which has approximately 50-100 times greater radioactivity in equivalent sample size. Successful detection of F1NPS-originated radio-caesium will is expected not to understand up-to date ocean circulation environment, but also to find the usefulness of bioindicator as oceanic tracer.

How to cite: Tateda, Y., Takata, H., Inomata, Y., Hamajima, Y., and Bezhenar, R.: Possibility of radionuclide originated from the Fukushima accident as oceanic tracer by fish muscle as bio-indicator, EGU General Assembly 2026, Vienna, Austria, 3–8 May 2026, EGU26-15352, https://doi.org/10.5194/egusphere-egu26-15352, 2026.

EGU26-15358 | ECS | Posters on site | GI2.5

Quantifying groundwater-derived 137Cs fluxes to surrounding coastal waters using radium isotope 

Hiroumi Iino, Daisuke Tsumune, Hiroaki Kato, Nimish Godse, Yuichi Onda, and Shigeyoshi Otosaka

Large amounts of radioactive cesium (134Cs and 137Cs) were released as a result of the Fukushima Daiichi Nuclear Power Plant (F1NPP) accident. Even 15 years after the accident, 137Cs concentrations in the marine environment have not returned to pre-accident levels, indicating that leakage from areas outside of the F1NPP site may still be ongoing.[1] Although 137Cs concentrations in sandy beach groundwater outside the F1NPP site have been reported to be higher than those in seawater, suggesting groundwater as a major leakage pathway, no observational data are available from areas in close proximity to the plant.[2] Based on these considerations, this study aims to estimate discharge flux of 137Cs originating from groundwater in the coastal waters surrounding the F1NPP.

Groundwater-derived 137Cs discharge flux (Bq day-1) was estimated by dividing the inventory (Bq) by the residence time of groundwater (day). Residence times following groundwater discharge to the coastal ocean were estimated using changes in the short-lived radium isotope activity ratios (223Ra/224Ra) between groundwater and seawater. Radium isotopes were selected as groundwater tracers for three reasons: (i) they were scarcely released from the F1NPP, such that the influence of the accident on Ra isotopes can be considered negligible[3]; (ii) radium isotopes (223Ra, 224Ra, 226Ra, and 228Ra) exhibit pronounced concentration differences between groundwater and seawater; and (iii) the wide range of half-lives and multiple isotopes enables their application to the estimation of water residence times as well as to the quantification of nutrient fluxes transported via submarine groundwater discharge.[4] In addition, the spatial area representative of 137Cs leakage for inventory estimation was defined based on the variability of Ra isotopes and 3H. The mean 137Cs concentration within the target domain was determined using seawater sampling data of 137Cs concentrations conducted by Tokyo Electric Power Company Holdings, Inc. (TEPCO HD). The 137Cs inventory (Bq) was then calculated by multiplying the mean 137Cs concentration (Bq m⁻³) by the volume (m³) of the target domain.

The calculated discharge flux is from 2.1×10⁹ to 8.6×10⁹ (Bq day⁻¹). These values are comparable to the flux required to sustain coastal ¹³⁷Cs concentrations (2.0 × 10⁹ Bq day⁻¹)[1], indicating that submarine groundwater discharge may explain why 137Cs concentrations in the vicinity of the FDNPP have not returned to pre-accident levels.


[1]Tsumune et al., J Environ Radioact , 2024

[2]Sanial et al., Proc Natl Acad Sci, 2017

[3]Buesselar et al., Ann Rev Mar Sci , 2017

[4]Garcia-Orellana et al., Earth-Science Review, 2021

How to cite: Iino, H., Tsumune, D., Kato, H., Godse, N., Onda, Y., and Otosaka, S.: Quantifying groundwater-derived 137Cs fluxes to surrounding coastal waters using radium isotope, EGU General Assembly 2026, Vienna, Austria, 3–8 May 2026, EGU26-15358, https://doi.org/10.5194/egusphere-egu26-15358, 2026.

EGU26-15360 | ECS | Posters on site | GI2.5

Radionuclide Dynamics in the Coastal Ocean off the Fukushima Daiichi Nuclear Power Plant Using Radioactivity Ratios. 

Nimish Sudhir Godse, Daisuke Tsumune, Hiroaki Kato, Hiroumi Iino, Yuichi Onda, and Shigeyoshi Otosaka

Fifteen years after the Fukushima Daiichi Nuclear Power Plant (F1NPP) accident, 137Cs and 3H activities in coastal waters near the plant remain elevated compared to surrounding regions, indicating persistent radioactive inputs. While concentrations within the port are highest, recent estimates suggest that the leakage rate outside the port exceeds that inside, implying the presence of an additional or previously unrecognized source outside the F1NPP site. However, the mechanisms governing these releases remain unclear.

The 3H/137Cs activity ratio is a useful tracer for identifying contamination sources, as it remains relatively stable in seawater over short timescales. Since approximately 2016, 137Csconcentrations near the FDNPP have shown little decline, while spatial contrasts in the 3H/137Cs ratio have become more pronounced. Although both radionuclides’ concentrations peak within the port, the ratio is consistently lower there and higher offshore. This suggests the potential existence of sources outside the harbor governing the distribution pattern of the radionuclides.

To investigate these patterns, we applied a color-classified 3H/137Cs ratio analysis and conducted release-rate estimations for the port and adjacent coastal waters. In addition, we collected independent samples of seawater, river water, groundwater, and spring water near the F1NPP. The 3H/137Cs ratios of river water, groundwater, and spring water were used in an end-member mixing analysis to evaluate potential terrestrial and subsurface contributions. Preliminary results indicate that the end members for groundwater and spring water (excluding river water) show trends similar to the 3H/137Csratio in seawater, potentially explaining the observed increase in the ratio offshore.

This integrated analysis improves constraints on radionuclide sources and transport pathways in the F1NPP coastal environment and contributes to a better understanding of long-term radioactive contamination dynamics.

How to cite: Godse, N. S., Tsumune, D., Kato, H., Iino, H., Onda, Y., and Otosaka, S.: Radionuclide Dynamics in the Coastal Ocean off the Fukushima Daiichi Nuclear Power Plant Using Radioactivity Ratios., EGU General Assembly 2026, Vienna, Austria, 3–8 May 2026, EGU26-15360, https://doi.org/10.5194/egusphere-egu26-15360, 2026.

 The size distribution (SZ) of radioactive aerosols emitted after nuclear accident at nuclear power plants plays a crucial role in assessment of the subsequent atmospheric transport and deposition. However, in reality this distribution in the source is usually unknown. The SZ of particles in the plume also changes with travel time of the plume, because the coarser particles fall out more rapidly than the finer particles. Hence when the measurements of SZ are undertaken at certain distances from the source the SZ could be already altered by plume travel time while it is SZ in the source which is required by atmospheric transport models (ATMs) for simulation of radionuclides atmospheric dispersion and deposition. Also, SZ measurements are usually not available in real time during the accident. More readily available measurements are airborne concentrations. Hence when concentration measurements are available, the SZ parameters of ATMs could be fitted to achieve better agreement between model and measurements.

 In this work, the inverse problem is stated to identify the optimal set of size distribution parameters of the Fukushima source term – activity-averaged mean aerodynamic diameter (d) and geometric standard deviation (σ) which best fit results of FLEXPART ATM to both, local and global measurements datasets. The problem is formulated as multi-objective optimization in which two objective functions. The first objective function J1 corresponds to model deviations from measurements in the territory of Japan, while the second objective function J2 corresponds to model deviations from the global observations of CTBTO measurement stations. The combined cost function J=J1J2 , characterizing model deviation against measurements in both datasets was also considered. In this way, the estimate of the unknown SZ parameters, which fits both local and global concentration observations is to be found. The method of finding Pareto solution of such multi-objective optimization problem was developed and preliminary results of comparisons of the estimated SZ parameters with SZ measurements, performed following Fukushima accident were obtained.

 The solution of the stated problem leads to reasonable results. The simulations with small values of 1≤σ≤2 led to excellent agreement of estimated mean aerodynamic diameter d of emitted particles between 2 and 3 μm with available measurements of SZ. At the same time if large values of σ were allowed the resulting estimated mean aerodynamic diameter could significantly deviate from the observed values. The use of the small values of mean aerodynamic diameter (d <1μm) in turn did not allow for the minimization of the combined cost function J.

How to cite: Jung, K. T., Kim, J.-H., and Kovalets, I.: Inverse estimation of size-distribution parameters of emitted aerosols following the Fukushima accident using FLEXPART simulations and measurements, EGU General Assembly 2026, Vienna, Austria, 3–8 May 2026, EGU26-15588, https://doi.org/10.5194/egusphere-egu26-15588, 2026.

EGU26-16674 | Posters on site | GI2.5

Deposition of 129I in the forests of Koriyama and 129I/137Cs ratio originated from the Fukushima Daichi Nuclear Power Plant 

Tomoko Ohta, Yasunori Mahara, Hiroyuki Matsuzaki, Hiroshi Hayami, and Daisuke Tsumune

The radionuclides 129I and 137Cs released during the 2011 Fukushima nuclear accident led to contamination of forested environments. The concentrations of these nuclides in precipitation, as well as their subsequent environmental behavior, are critical for assessing internal radiation exposure. In this study, deposition records of atmospheric 129I and 137Cs following the accident were reconstructed using a borehole drilled between 2012 and 2014 at Koriyama, located approximately 60 km from the accident site. After subtraction of contributions from global fallout and nuclear reprocessing facilities, the inventories of 129I and 137Cs in forest soil at Koriyama, integrated to a depth of 50 cm, were estimated to be 4.80 × 10⁵ and 81.7 mBq m−2, respectively. The 129I/137Cs radioactivity ratio derived from Fukushima-derived deposition in litter and soil (0–50-cm depth) was 1.71 × 10⁻⁷, which is consistent with the ratio observed in atmospheric aerosols at the time of the accident. The 129I/137Cs radioactivity ratio in the litter layer was marginally lower than that in the underlying topsoil. This difference is attributed to the higher solubility and mobility of 129I relative to 137Cs in litter, resulting in preferential washout from the surface layer. It is therefore inferred that a fraction of 129I originally retained in the litter layer has migrated from the forest surface toward riverine systems.

How to cite: Ohta, T., Mahara, Y., Matsuzaki, H., Hayami, H., and Tsumune, D.: Deposition of 129I in the forests of Koriyama and 129I/137Cs ratio originated from the Fukushima Daichi Nuclear Power Plant, EGU General Assembly 2026, Vienna, Austria, 3–8 May 2026, EGU26-16674, https://doi.org/10.5194/egusphere-egu26-16674, 2026.

EGU26-17315 | ECS | Orals | GI2.5

Performance Variability of Mid-Infrared Spectroscopy–Based Predictions of Soil Radiocaesium Dynamics across Diverse Soil and Land Use Conditions 

Kazuki Murashima, Jumpei Iwai, Gerd Dercon, Mariana Vezzone, Magdeline Vlasimsky, Franck Albinet, Hayato Maruyama, and Takuro Shinano

Following the Fukushima Daiichi Nuclear Power Plant accident, radioactive substances such as radiocaesium (137Cs) were widely dispersed and contaminated soils, raising concerns about their transfer from soil to crops. 137Cs transfer is primarily regulated by exchangeable potassium (KEx), a chemically analogous element, but its effectiveness varies across environmental conditions such as soil type and land-use. Recent studies suggest that soil exchangeable 137Cs (137CsEx) dynamics and its solid–liquid partitioning play key roles in predicting 137Cs transfer irrespective of regional differences. In contrast, current direct methods for measuring 137Cs are costly and time-consuming, making them unsuitable for rapid risk assessment. As an alternative approach for risk management, mid-infrared spectroscopy (MIRS) may provide a rapid and cost-effective means of estimating soil properties. Recently, models for predicting soil KEx concentrations from spectral data have been reported. However, their applicability to 137Cs transfer remains unclear. In this study, we aimed to construct prediction models for the ratio of soil 137CsEx to soil total 137Cs (137CsTotal) using MIRS spectra and to evaluate the variability of model performance among soil or land-use categories.

1249 soil samples collected in Fukushima Prefecture, Japan, from 2015 to 2020, were analyzed for soil properties, including soil total C, 137CsEx, and 137CsTotal, through MAFF and NARO in Japan. Each soil sample was analysed after drying at 37°C for at least 12 hours and being sieved to less than 0.2 mm before measurement. Mid-infrared spectra for these samples were obtained at the FAO/IAEA Soil and Water Management and Crop Nutrition Laboratory over the wavenumber range of 650–4000 cm–1 using four replicate measurements per sample. Using noise-removed spectral data, partial least squares regression models were developed to predict the ratio of soil 137CsEx to 137CsTotal. In addition, prediction models were constructed for different soil types (andosol, brown forest soil, lowland soil, and peat soil) and land-use categories (upland fields and paddy fields), and their differences in model performance were evaluated.

Prediction models were constructed and achieved moderate predictive performance (R² around 0.6). In contrast, by stratifying prediction models by soil type, prediction accuracy improved for all soil types except for peat soil relative to the non-stratified model. In particular, andosol showed the highest prediction accuracy. Comparison of variable importance in projection (VIP) scores among these models showed that the contributions of specific wavenumber ranges to model performance differed among soil types. In andosols, VIP scores were higher in wavenumber ranges associated with carbohydrates, quartz, and clay minerals compared with the model constructed using all data. These results suggest that soil type specific mineralogical composition and carbon content may play roles in improving prediction performance. Furthermore, predictions stratified by land-use showed higher accuracy in upland fields than in paddy fields. Differences of VIP scores between them were also observed in wavenumber ranges associated with carbohydrates and clay minerals. These results suggest that environmental conditions, such as soil redox status, may influence prediction accuracy through their effects on soil minerals and carbon.

How to cite: Murashima, K., Iwai, J., Dercon, G., Vezzone, M., Vlasimsky, M., Albinet, F., Maruyama, H., and Shinano, T.: Performance Variability of Mid-Infrared Spectroscopy–Based Predictions of Soil Radiocaesium Dynamics across Diverse Soil and Land Use Conditions, EGU General Assembly 2026, Vienna, Austria, 3–8 May 2026, EGU26-17315, https://doi.org/10.5194/egusphere-egu26-17315, 2026.

EGU26-18568 | Orals | GI2.5

Why Are Dissolved ¹³⁷Cs Concentrations Lower in Fukushima Rivers? A Comparative Study with European Catchments 

Yuichi Onda, Yasunori Igarashi, Jim Smith, Aya Sakaguchi, Shaoyan Fan, and Junko Takahashi

Nuclear accidents contaminate large terrestrial areas with long-lived radionuclides, and river systems play a key role in their redistribution. The concentration of dissolved radiocaesium (¹³⁷Cs) in river water is influenced by catchment-scale physical and geochemical characteristics. After the Chernobyl accident, environmental radionuclide concentrations generally declined over time; however, systematic inter-river comparisons remain limited, and the key factors controlling long-term differences in dissolved ¹³⁷Cs concentrations are still poorly understood.

In this study, we investigated the environmental behavior of dissolved ¹³⁷Cs in river systems affected by the Fukushima Daiichi Nuclear Power Plant accident and compared it with long-term observations from major European rivers impacted by the Chernobyl accident. In Fukushima, river water samples were seasonally collected between 2021 and 2024 from headwater catchments in the Yamakiya and Kuchibuto River basins. Samples were filtered through 0.22 µm membranes, and dissolved ¹³⁷Cs was measured using high-purity germanium detectors. Major ions (K⁺, NH₄⁺), stable ¹³³Cs, and dissolved organic carbon (DOC) were also analyzed. Univariate and multivariate regression analyses were applied to identify dominant release mechanisms. Catchment land cover, topographic gradients, and precipitation were analyzed using GIS, and groundwater residence times were estimated. These results were compared with long-term monitoring data and additional field measurements from nine European river catchments in Ukraine, Finland, Austria, and Italy, incorporating climatic, vegetation, and anthropogenic factors into an international comparison framework.

In Fukushima headwater catchments, dissolved ¹³⁷Cs concentrations increased from summer to autumn, coinciding with rising temperatures, enhanced organic matter decomposition, and increased K⁺ availability. Multiple regression analysis identified ¹³³Cs and K⁺ as significant explanatory variables, indicating that ion exchange plays a key role in ¹³⁷Cs mobilization. In contrast, DOC showed only a weak relationship with ¹³⁷Cs in Fukushima rivers. Comparative analysis of dissolved ¹³⁷Cs trends since 1986 revealed that European rivers have maintained higher concentrations over longer periods. Correlation analysis demonstrated that DOC and ¹³³Cs were significant scaling factors controlling dissolved ¹³⁷Cs concentrations across European river systems, whereas K⁺ and NH₄⁺ contributed little to concentration variability.

These results indicate that differences in the long-term behavior of dissolved ¹³⁷Cs between Fukushima and European rivers are associated with contrasting DOC- and ¹³³Cs-related controls at the catchment scale. This study suggests that accounting for regional variability in biogeochemical controls should be useful for long-term river environment and also can inform environmental modeling of radionuclide transport under nuclear emergency conditions, contributing to improved preparedness and long-term risk assessment.

How to cite: Onda, Y., Igarashi, Y., Smith, J., Sakaguchi, A., Fan, S., and Takahashi, J.: Why Are Dissolved ¹³⁷Cs Concentrations Lower in Fukushima Rivers? A Comparative Study with European Catchments, EGU General Assembly 2026, Vienna, Austria, 3–8 May 2026, EGU26-18568, https://doi.org/10.5194/egusphere-egu26-18568, 2026.

EGU26-22532 | Posters on site | GI2.5

Developing Ontology-Based Nuclear Accident Knowledge Base 

Misa Yasumiishi and Thoma Bittner

The society acquired vast amounts of data from past major nuclear accidents, then learned the causes of those accidents, the methods to mitigate their adverse effects, and accident-prevention measures. However, it is challenging to store and organize highly technical knowledge related to nuclear accidents and share it in ways that meet our purposes. That is one reason we still do not have a centralized public database of nuclear incidents, despite efforts by international organizations such as the IAEA and academic institutions. Internet searches and AI queries return answers based on publicly available data sources without curation, thereby posing a risk of biased knowledge representation.

We aim to develop a prototype nuclear accident knowledge base using an ontology-based approach to establish the structured management system of nuclear accident-related knowledge. The top-level classes of the Basic Formal Ontology (BFO) are reviewed and utilized to design the base ontology hierarchy of the entities involved in nuclear accidents. The past ontology work in the nuclear and non-nuclear industries is reviewed, and some of their proposed classes and relationships were imported into the nuclear accident knowledge base structure. The classes, entities, and relations among those entities, and data properties relevant to the knowledge base are defined and are entered in protégé ontology editing software, whose ontology design can be shared digitally with interested parties.

During the development of the ontology structure, five knowledge-ambiguity factors were identified as potential focal points for developing the nuclear accident knowledge base. The ambiguity factors include: 1) terminology definition, 2) location definition, 3) temporal change in knowledge needs, 4) contamination definition, and 5) accident cause definition. When sharing nuclear accident knowledge, these factors must be considered to minimize confusion during the user’s knowledge-finding endeavour. By dissecting those ambiguity factors and providing a logical structure for nuclear accident-related data, this prototype knowledge base will assist in developing a public centralized nuclear accident knowledge base that can serve as a trustworthy data depository for preventing future accidents as well as enabling prompt recovery from the adverse effects of those accidents.


References.

Arp, R., Smith, B., Spear, A.D., 2015. Building ontologies with basic formal ontology. Mit Press. https://doi.org/10.7551/mitpress/8743.003.0011

Booshehri, M., Emele, L., Flügel, S., Förster, H., Frey, J., Frey, U., 2021. Introducing the open energy ontology: Enhancing data interpretation and interfacing in energy systems analysis. Energy and AI 2021; 5: 100074. https://doi.org/10.1016/j.egyai.2021.100074

Rashdan, A., Browning, J., Ritter, C., 2019. Data Integration Aggregated Model and Ontology for Nuclear Deployment (DIAMOND): Preliminary Model and Ontology. Idaho National Laboratory. https://doi.org/10.2172/2439922

Sorokine, A., Schlicher, B.G., Ward, R.C., Wright, M.C., Kruse, K.L., Bhaduri, B., Slepoy, A., 2015. An interactive ontology-driven information system for simulating background radiation and generating scenarios for testing special nuclear materials detection algorithms. Engineering Applications of Artificial Intelligence 43. 157-165. https://doi.org/10.1016/j.engappai.2015.04.010

U.S. Department of Energy, 2022. Environmental Radiological Effluent Monitoring and Environmental Surveillance.

How to cite: Yasumiishi, M. and Bittner, T.: Developing Ontology-Based Nuclear Accident Knowledge Base, EGU General Assembly 2026, Vienna, Austria, 3–8 May 2026, EGU26-22532, https://doi.org/10.5194/egusphere-egu26-22532, 2026.

AS4 – Interdisciplinary Processes

Precipitation in the Yellow River Basin (YRB) shows contrasting decadal changes from 1961 to 2022, with the northern part becoming drier and the southern part becoming wetter. Based on ensemble empirical mode decomposition (EEMD) method, this study finds that the Pacific Decadal Oscillation (PDO) is a key moderator of the decadal variability of precipitation across the YRB. Specifically, precipitation decreases significantly over most parts of the YRB during positive PDO phase, while it increases during negative phase. Further studies revealed that this distribution is closely related to water vapor transport and atmospheric circulation. During the positive PDO phase, the core of the westerly jet (20°N-60°N, 80°E-160°E) is located over the northwest of the YRB, generating a cyclonic circulation at its southeastern periphery. Meanwhile, the water vapor is dominated by divergence, resulting in insufficient water vapor conditions. This configuration inhibits upward movement and suppresses precipitation in the basin. In contrast, during the negative phase of the PDO, the westerly jet receded to the west and weakened, resulting in increased transport of warm moist air from the ocean to the YRB. Multi-model simulation results from the Coupled Model Intercomparison Project Phase 6 (CMIP6) show that the decadal trends of precipitation in the YRB show opposite patterns during the positive and negative phases of the PDO. The YRB precipitation phase reverses under the SSP585 scenario with respect to the historical period, the SSP126, and SSP245 scenarios, which has a profound impact on the future socio-economic development of the YRB. This study provides new insights into the physical drivers of decadal precipitation variability over the YRB, offering a valuable reference for improving future climate projections and regional water resource management.

How to cite: Ma, T. and Guan, X.: Influence of pacific decadal oscillation on decadal precipitation variation over the Yellow River Basin, EGU General Assembly 2026, Vienna, Austria, 3–8 May 2026, EGU26-1933, https://doi.org/10.5194/egusphere-egu26-1933, 2026.

EGU26-2186 | Posters on site | AS4.1 | Highlight

Ecological Barriers Against Desertification 

Xiaodan Guan, Jianping Huang, and Pengcheng Qiu

Arid and semi-arid regions constitute 42% of global land area and house nearly half the world's population. Recent decades have witnessed their expansion, with semi-arid areas accounting for over half of this growth. Their inherently low soil fertility makes them highly vulnerable to warming and human activity, driving widespread desertification. Analyzing the Global Desertification Vulnerability Index (GDVI) reveals divergent regional trends. While GDVI is rising in areas like western North America, it shows a significant and sustained decline in China's Yellow River Basin since 1999. This contrast highlights the positive impact of active ecological restoration. Policies like China's "Grain for Green" program, by building ecological barriers, have effectively reduced desertification risk in the basin. This case demonstrates that targeted ecological restoration is a viable strategy to combat desertification, offering a model for addressing water scarcity and ecosystem fragility in semi-arid regions globally.

How to cite: Guan, X., Huang, J., and Qiu, P.: Ecological Barriers Against Desertification, EGU General Assembly 2026, Vienna, Austria, 3–8 May 2026, EGU26-2186, https://doi.org/10.5194/egusphere-egu26-2186, 2026.

EGU26-2444 | ECS | Posters on site | AS4.1

Simultaneous Megapluvials in Southwestern North and South America During the Last Millennium 

Ehud Berger, Nathan J. Steiger, Jason E. Smerdon, and Benjamin I. Cook

Decadal-scale droughts, known as megadroughts, occurred repeatedly in the North and South American Southwest (NASW and SASW) over the past millennium, including simultaneous events. Similarly, these regions experienced prolonged wet periods, megapluvials, including well-documented episodes over the 20th century. Using a paleoclimate data assimilation product, we identify 18 megapluvials in each region (12 overlapping), 13 NASW and 15 SASW megadroughts (9 overlapping). Both phenomena show similar duration and severity, with 122 years of simultaneous megapluvial conditions and 113 years of simultaneous megadroughts. We find that megapluvials in both regions are driven by a reduction in drying La Niña-like states and not solely by an increase in wetting El Niño-like states; while both changes are statistically significant, the decrease in La Niña-like conditions is greater than the increase in El Niño-like conditions. Megadroughts exhibit an analogous asymmetric mechanism: they are characterized by increased La Niña-like states accompanied by a stronger reduction in wetting El Niño-like states. We also find volcanic forcing influences these events through the El Niño-Southern Oscillation (ENSO): large eruptions reduce the frequency of La Niña-like states, causing overall wetting. This mechanism is most clearly seen in the SASW where ENSO teleconnections are stronger in the paleoclimate reconstruction. These findings demonstrate that megapluvials exhibit interhemispheric synchronization that is similar to megadroughts and are similarly influenced by Pacific variability on decadal timescales. Our results highlight the need for better understanding and representation of ENSO's response to external forcing, including anthropogenic climate change, to improve projections of decadal hydroclimate variability in the NASW and SASW.

How to cite: Berger, E., Steiger, N. J., Smerdon, J. E., and Cook, B. I.: Simultaneous Megapluvials in Southwestern North and South America During the Last Millennium, EGU General Assembly 2026, Vienna, Austria, 3–8 May 2026, EGU26-2444, https://doi.org/10.5194/egusphere-egu26-2444, 2026.

EGU26-3501 | ECS | Posters on site | AS4.1

Decadal Oceanic Variability Amplified Recent Heatwave in the Northern Hemisphere 

Nan Lei, Xiaodan Guan, and Yongkun Xie

The persistent increase in heatwaves has caused substantial economic and ecological damage. However, the contribution of decadal oceanic variability to the recent surge in heatwaves remains unclear. Here, using observations and simulations, we demonstrate that oceanic modulation drives decadal heatwave swings and trends. We quantify that the decadal component of heatwave cumulative intensity (HWCI) accounts for 57% of the observed increase in HWCI across the Northern Hemisphere from 2013–2021, with 44% attributed to increases in the smoothed component (HWCIS) and 13% to enhancements in the anomaly component (HWCIA). Notably, decadal oceanic variability contributed to 63% of the HWCI increase in the Northern Hemisphere during 2013–2021 and to 26% over 1985–2021. Regionally, oceanic modulation amplified HWCI by 58% in Europe, and contributed more than 20% in North Africa, southern North America, eastern China, and northern Central Asia during 2013–2021. The positive-to-negative phase transitions of the Atlantic Multidecadal Oscillation (AMO) and Interdecadal Pacific Oscillation (IPO) were identified as key drivers of this recent intensification. Model simulations incorporating AMO and IPO forcings closely align with observed HWCI decadal oscillations since 1940, further supporting these findings. Our results highlight that oceanic modulation can significantly amplify or dampen human-induced long-term heatwave trends, suggesting a potential slowdown in heatwave intensification in the coming decades as oceanic variability transitions to a new phase.

How to cite: Lei, N., Guan, X., and Xie, Y.: Decadal Oceanic Variability Amplified Recent Heatwave in the Northern Hemisphere, EGU General Assembly 2026, Vienna, Austria, 3–8 May 2026, EGU26-3501, https://doi.org/10.5194/egusphere-egu26-3501, 2026.

Extreme wildfires have devastating impacts on multiple fronts, and associated carbon greatly heat earth climate. The important meteorological conditions for the wildfires include high temperatures and drought. The climate state in the semi-arid regions further provide a favorable background condition. The southern part of the West Siberia is a crucial semi-arid area, yet the research on the climate driving mechanisms of wildfires in this region is still limited. West Siberia faces severe wildfire risks and carbon emissions in the future. Therefore, how to effectively predict wildfires in this region also become a critical problem.

In this study, we find that the preceding-winter “warm Arctic-cold Eurasia” (WACE) pattern significantly enlarges the spring burned area in West Siberia. The winter WACE and accompanying snow reduction result in a dry and exposed-vegetation West Siberia in spring. The January stratospheric variability over mid-high latitude Eurasia also can modulate the tropospheric atmospheric circulation anomalies through downward propagation of signals, causing the reduced winter snow and increasing the spring wildfire risk. Apart from the influence of the Arctic, the tropical sea-air interaction is also of great significance. The March Maritime Continent SST anomaly can cause an earlier retreat of the spring snowline through a Rossby wave, and leads to vegetation exposure and surface drying, which favors wildfire occurrence.

These three factors provide the prediction information for the spring wildfire burned area in West Siberia. A multiple linear regression model is constructed to successfully predict the spring burned area in West Siberia (R=0.90), evaluating by “leave-one-out” cross validation. The same predictors also well predict the corresponding fire carbon emissions (R=0.73). Findings of this study provide a possibility for guarding human against extreme wildfires and foreknowing sharp rises in carbon emissions.


How to cite: Zhang, Y. and Yin, Z.: Impacts of Arctic and tropical climate variability on spring wildfires in West Siberia and the predictive role, EGU General Assembly 2026, Vienna, Austria, 3–8 May 2026, EGU26-3743, https://doi.org/10.5194/egusphere-egu26-3743, 2026.

EGU26-3783 | ECS | Posters on site | AS4.1

Positive AMO–La Niña synergy enhances recent East Asian dust activity via hydrothermal anomalies 

Ruibo Zhao, Xiaoming Feng, Changjia Li, Yun Yang, and Lindsay Stringer

Despite weakening mid-latitude winds under global warming suggesting a decline, East Asian dust activity has unexpectedly rebounded since 2000. We demonstrate this resurgence is driven by the synergy between the Atlantic Multidecadal Oscillation (AMO) positive phase and La Niña, explaining 78% of dust variance. Integrating observations and simulations, we reveal that the dominant driver of recent dust enhancement has shifted from dynamical factors (wind) to hydrothermal anomalies. The cross-basin synergy of the AMO positive phase and La Niña creates a hydrothermal background in the East Asian interior characterized by a "cold winter, warm spring" pattern accompanied by persistent drought. This pattern intensifies the soil freeze-thaw cycle and surface drying, significantly enhancing surface erodibility, thereby becoming the dominant factor for extreme dust outbreaks. Through a closed-loop evidence chain (phenomenon identification, mechanism attribution, and model verification), we clarify how cross-basin climate synergy affects regional dust. These findings provide a robust foundation for seasonal-to-decadal prediction of East Asian dust activity.

How to cite: Zhao, R., Feng, X., Li, C., Yang, Y., and Stringer, L.: Positive AMO–La Niña synergy enhances recent East Asian dust activity via hydrothermal anomalies, EGU General Assembly 2026, Vienna, Austria, 3–8 May 2026, EGU26-3783, https://doi.org/10.5194/egusphere-egu26-3783, 2026.

EGU26-3904 | ECS | Posters on site | AS4.1

Analysis of the Impact of Urbanization on Groundwater in the Arid and Semi-Arid Yellow River Basin 

Xiaohan Shen and Xiaodan Guan

The Yellow River Basin (YRB) serves as a vital ecological barrier and a primary grain-producing region in China. Characterized predominantly by an arid and semi-arid climate, the basin’s water resources are highly sensitive to human activities. In recent years, rapid urbanization has significantly altered the regional water resource distribution, making it essential to clarify the resulting changes in the hydrological cycle for informed policy-making. This study analyzes the spatial-temporal characteristics of groundwater changes throughout the urbanization process across the basin. The results show that urbanization levels in the YRB exhibit significant spatial heterogeneity, with a marked intensification of urban expansion and population growth in the lower reaches. While groundwater levels across the entire basin show a declining trend, with the most severe depletion occurring downstream, a comparative analysis of different urban transition types reveals nuanced impacts. Specifically, the decline in groundwater is least pronounced in areas of urban contraction, while newly urbanized areas show a smaller reduction in groundwater compared to long-standing, stable urban zones. These findings suggest that while urbanization inherently exerts pressure on groundwater in this water-scarce region, the relatively moderated decline in newly developed areas reflects the effectiveness of recent groundwater protection policies integrated into the urbanization process.

How to cite: Shen, X. and Guan, X.: Analysis of the Impact of Urbanization on Groundwater in the Arid and Semi-Arid Yellow River Basin, EGU General Assembly 2026, Vienna, Austria, 3–8 May 2026, EGU26-3904, https://doi.org/10.5194/egusphere-egu26-3904, 2026.

EGU26-5232 | ECS | Posters on site | AS4.1

Enhanced global extreme droughts driven by the Indian Ocean and Pacific Ocean on decadal timescales 

Yihui Xu, Xiaodan Guan, and Jianping Huang

In the 21st century, two record-breaking years of extreme drought coverage swept across the globe. These resulted in billions of agriculture losses and led to hunger and poverty in those developing countries. Recent decadal increasing extreme droughts are closely associated with the decadal modulated oscillation (DMO) signal, majorly in charge by the Indian Ocean Dipole (IOD) and Pacific Decadal Oscillation (PDO). Meanwhile, the DMO significantly influences global wet-dry variations through phase changes, leading to an increase in the probability of extreme droughts in the positive phase. Composite analysis shows that high probability of extreme drought corresponds to positive anomalies of 500 hPa geopotential height and low-level anticyclonic conditions. Under future climate scenarios, DMO is expected to intensify in most regions, leading to an increased risk of extreme droughts, especially in Australia. As anthropogenic warming intensifies, the coming spatial coverage of extreme droughts will continue creating new records.

How to cite: Xu, Y., Guan, X., and Huang, J.: Enhanced global extreme droughts driven by the Indian Ocean and Pacific Ocean on decadal timescales, EGU General Assembly 2026, Vienna, Austria, 3–8 May 2026, EGU26-5232, https://doi.org/10.5194/egusphere-egu26-5232, 2026.

The anomalous hydrothermal conditions during growing seasons, i.e. less precipitation and high temperature, could induce an unstable water resource supply and pose great threats to regional agro-pastoral production, particularly in water-scarce drylands. Owing to the biases in the simulations of global climate models, quantifying the anthropogenic influences on such high-impact hot–dry extremes and future risks in the arid and semi-arid areas remains challenging. Based on CN05.1 observations and statistically downscaled simulations from the Coupled Model Intercomparison Project Phase 6, we conducted a comprehensive attribution and projection on the 2022- and 2023-like growing-season hot–dry extremes in Northwest China (NWC). Observations reveal that NWC experienced a fourfold increase in the occurrence of anomalously hot–dry growing seasons during 1991–2023 relative to that in 1961–1990. Attribution indicates that anthropogenic forcings have doubled/tripled the likelihood of 2022/2023-like hot–dry growing seasons in NWC largely due to human-induced warming. NWC is expected to experience increasingly hot growing seasons but with slight precipitation changes in the 21st century under the intermediate greenhouse gas emission (SSP2-4.5) scenario. The likelihood of 2022/2023-like hot–dry growing seasons in NWC will be more than 1–5 times that in the present-day (1991–2020), which is still dominated by rising temperature. To alleviate the stress of hot–dry growing seasons on agro-pastoral systems, we underscore the urgency of developing effective adaptation and mitigation strategies for water resource management in water-limited drylands.

How to cite: Yu, X. and Dong, S.: Escalating risks of anomalously hot–dry growing seasons in arid Northwest China under human influence, EGU General Assembly 2026, Vienna, Austria, 3–8 May 2026, EGU26-8387, https://doi.org/10.5194/egusphere-egu26-8387, 2026.

EGU26-8996 | ECS | Posters on site | AS4.1

External and internal controls on decadal precipitation variability over North America 

Xiaolu Fan and Janping Huang

Precipitation variability across North America (NA) substantially impacts regional water security, agricultural productivity, ecosystem stability, and the frequency of extreme climatic events. Variations in annual precipitation play a critical role in drought occurrence and dryland expansion. The southwestern NA, a typical semi-arid region, has experienced rising agricultural and industrial water demands in recent decades, increasing its vulnerability to droughts. Since 1980, this region has grown drier, intensifying risks of moisture deficits and wildfires. Previous studies have identified both anthropogenic forcing and internal variability as key factors driving NA precipitation changes. External forcing from greenhouse gas and aerosol emissions has influenced regional precipitation patterns, while internal variability associated with large-scale teleconnection patterns plays a crucial role in modulating these changes, particularly on interannual to decadal timescales. However, most studies have focused on either external forcing or internal variability in specific NA regions, neglecting their combined effects across the entire continent.

Here, we combine long-term observational data and CMIP6 simulations to find the distinct roles of anthropogenic forcing and low-frequency internal variability. Our results identify a long-term wetting trend primarily driven by greenhouse gas forcing, though state-of-the-art climate models tend to underestimate the influence of external forcing on NA precipitation. Decadal precipitation oscillations are modulated by internal variability, especially the Interdecadal Pacific Oscillation (IPO), whose sea surface temperature anomalies trigger large-scale Rossby waves. The wave train originating from the Pacific propagates downstream, influencing atmospheric circulation and moisture transport, ultimately shaping the tripolar precipitation pattern observed in NA. Climate model simulations confirm that the impact of the Atlantic Multidecadal Oscillation (AMO) on NA precipitation is significantly weaker than that of the IPO. This tripolar precipitation pattern dominates NA precipitation variability at decadal scales, surpassing anthropogenic influences. From 2021 to 2050, the tripolar pattern is projected to persist, contingent on IPO phase. By 2100, constrained projections under the SSP2-4.5 and SSP5-8.5 scenarios suggest a further intensification of precipitation increases. This study shows how NA rainfall responds differently to human influence and natural oscillations over decades, with implications for improving our ability to predict and attribute regional climate changes.

How to cite: Fan, X. and Huang, J.: External and internal controls on decadal precipitation variability over North America, EGU General Assembly 2026, Vienna, Austria, 3–8 May 2026, EGU26-8996, https://doi.org/10.5194/egusphere-egu26-8996, 2026.

EGU26-10245 | ECS | Posters on site | AS4.1

Modeling the multi-scale temporal variability of fog harvesting potential in the coastal Atacama region 

Felipe Lobos-Roco, Klaus Keim-Vera, and Javiera Boada

The inland advection of the well-formed marine stratocumulus cloud deck in the tropical Southeast Pacific produces semi-permanent fog banks in the hyperarid coastal mountains of the Atacama Desert. These fog banks represent the sole water input to highly adapted xeric ecosystems and can serve as a potentially tappable water resource for human consumption. Whether to sustain ecosystems or domestic water consumption, our understanding of long-term fog-harvesting variability is very limited, as observations are short-term and intermittent. This observational gap makes it difficult to understand what is driving fog-harvesting variability at interannual (relation with ENSO), seasonal, and sub-diurnal scales. Therefore, hindering our ability to assess the feasibility of exploiting this natural resource at the long term. In this work, we propose using the Advective fog Model for Arid and semi-arid Regions Under climate change (AMARU; Lobos-Roco et al., 2025) to study the long-term variability of harvesting potential resulting from the interaction of stratocumulus clouds with coastal topography. The model inputs are ERA5 reanalysis time series between 1950 to 2023, which have been downscaled to meteorological observations using artificial neural networks. Model outputs are compared with historical fog water harvesting observations from 1997 to 2023 in Alto Patache fog oases (20.8°S; -70.1°W), showing R2~0.8 and a regression slope~1. Our modelling results show that the coastal Atacama Desert is a promising site for fog harvesting, with water volumes ranging from 2.9 L m-2 per day to 9.5 L m-2 per day over seven decades, and a subtle trend toward an increase of 3.46 L m-2 pear year. At the interannual scale, fog harvesting is modulated by the (in)harmonization between the El Niño Southern Oscillation (ENSO) and the Pacific Decadal Oscillation (PDO) phases. For example, during warm PDO, ENSO correlates positively with fog harvesting, while during cool PDO, ENSO correlates negatively with fog harvesting. The modulation of ENSO-PDO in fog harvesting has decreased over the decades, probably due to climate change. From 1950 to 2023, fog-harvesting seasonality has been narrowing, with the fog-harvesting season starting later and ending earlier, but with higher water volumes during the fog season. Finally, at the diurnal scale, our model results demonstrate that fog harvesting is more controlled by air-liquid water content (cloud density) at night and by wind speed (cloud density transport) in the afternoon. Our study contributes to disentangle fog-harvesting variability across multiple temporal scales, thereby enhancing our capacity to assess ongoing and future multipurpose and large-scale fog-harvesting projects in coastal deserts.

How to cite: Lobos-Roco, F., Keim-Vera, K., and Boada, J.: Modeling the multi-scale temporal variability of fog harvesting potential in the coastal Atacama region, EGU General Assembly 2026, Vienna, Austria, 3–8 May 2026, EGU26-10245, https://doi.org/10.5194/egusphere-egu26-10245, 2026.

Tianshan Mountains are the headwater regions for the central Asia rivers, providing water resources for ecological protection and economic development in semiarid regions. Due to scarce observations, the hydroclimatic characteristics of the Tianshan Mountains Precipitation (TMP) measured over highland (>1,500m) regions remain to be revealed. Here, we show the TMP belongs to a monsoon-like climate regime, with a distinct annual range and a high ratio of summer-to-yearly rainfall, and exhibits six abrupt changes, dividing the annual cycle into six precipitation sub-seasons. Over the past 60 years, the yearly TMP has significantly increased by 17.3%, with a dramatic increase in winter (135.7%). The TMP displays a significant 40-day climatological intra-seasonal oscillation (CISO) in summer. The TMP CISO’s wet phase results from the confrontation of the eastward propagating mid-tropospheric Balkhash Lake Low and the southward migrating Mongolian High. The sudden changes in the two climatological circulation systems trigger TMP’s changes, shaping the 40-day CISO. Emerging scientific issues are also discussed.

How to cite: Jin, C.: How much we know about precipitation climatology over Tianshan Mountains––the Central Asian water tower, EGU General Assembly 2026, Vienna, Austria, 3–8 May 2026, EGU26-11720, https://doi.org/10.5194/egusphere-egu26-11720, 2026.

EGU26-21717 | ECS | Posters on site | AS4.1

Elevation-dependent wheat yields variations under climate changes 

Xing Wang, Qiang Zhang, Hong Zhao, and Dihua Cai

A continuing warming trend has been revealed at most regions around the world during the last 60 years. In order to assess the impact of the climate change on crop production, it is necessary to study the impact of observed climate change on crop development. In this study, we compared the impacts of climate warming on growth and yields of spring wheat at different elevation in northwest arid region by using observation data obtained in Zhangye (representative low-elevation) and Minle (representative high-elevation) agricultural meteorological station from 1981 to 2020. We analyzed temperature and precipitation data to determine climate trends, also analyzed surface observation data and potential evapotranspiration(PET) from agricultural meteorological stations to determine phenology and yields of spring wheat. The relationshipsbetween spring wheat growth, yields and the temperature, PET were also examined by SPSS24.0. The results showed that the climate change patterns and their impacts in these two stations were diverse during the study period. Warmer climate trends were observed both in low-elevation and high-elevation region, but the magnitude of warming at high-elevation was greater than that of low-elevation. The response of phenology of spring wheat to climate warming took the form that the sowing date had advanced in high-elevation and the growth duration had shortened in these two stations. The growth duration would shorten by 7.2d at high-elevation and by 4.0d at low-elevation for each 1oC rising in daily mean temperature during spring wheat growth, and the sowing date would advance by 0.04d for each 100m rising in elevation. However, the response of the yields of spring wheat were different in these two stations. The yields showed a trend of increasing first and then decreasing, at high-elevation, but the yields had decreased at low-elevation. Such response was related to the critical temperature—30.1 oC at high elevation, and which was related to PET at low elevation. In case the maximum temperature during the spring wheat growth was less than 30.1 oC, a rising in temperature would increase yields. When the maximum temperature was beyond 30.1 oC, then a rising in temperature would decrease yields at high elevation, the response of PET is similar in low elevation. The continuous increase in temperature in future may result in the maximum temperature of spring wheat growth period to exceed the critical temperature, thus leading to declining of spring wheat yields. So we expect that with the climate further warming, it will continuately impact spring wheat growth and yields in arid region, especially the negative influence at low-elevation region.

How to cite: Wang, X., Zhang, Q., Zhao, H., and Cai, D.: Elevation-dependent wheat yields variations under climate changes, EGU General Assembly 2026, Vienna, Austria, 3–8 May 2026, EGU26-21717, https://doi.org/10.5194/egusphere-egu26-21717, 2026.

EGU26-2998 | Orals | AS4.2

Mountain-wave influence on polar stratospheric ice clouds: evidence from MIPAS–ERA5 analysis 

Ling Zou, Reinhold Spang, Sabine Griessbach, Lars Hoffmann, Farahnaz Khosrawi, Rolf Müller, and Ines Tritscher

Mountain-wave-induced temperature perturbations can locally enable the formation of polar stratospheric clouds (PSCs). We examine a decade-long (2002–2012) record of ice PSCs derived from MIPAS/Envisat measurements. The points with the smallest temperature difference (ΔTice_min) between the frost point temperature (Tice) and the environmental temperature along the line of sight have been proposed and shown to provide a better estimate of the location of ice PSC observation from MIPAS. The temperature for the ice PSC observations is analyzed based on ERA5. Following this, we investigated the temperature history of the ice PSCs detected above Tice at the observation points along 24 h backward trajectories.

We find that 52 % of Arctic and 26 % of Antarctic ice PSCs are detected above Tice, with pronounced clustering over mountainous terrain and in downstream regions. The backward trajectories were calculated by using the MPTRAC model,  initialized at the ΔTice_min locations. Analysis of the temperature evolution along these trajectories shows that the fraction of ice PSCs at a temperature above Tice along the trajectory decreases, with the strongest decrease within the 6 h before observation. Accounting for temperature fluctuations along the air-mass histories, reduces the fractions of too warm ice PSCs at observation to 33 % in the Arctic and 9 % in the Antarctic.

These results demonstrate the substantial role of orographic waves in ice PSC formation and provide observational constraints for chemistry–climate model evaluation. This contribution is based on the published analysis of Zou et al. (2024, Atmos. Chem. Phys., 24, 11759–11774, https://doi.org/10.5194/acp-24-11759-2024) .

How to cite: Zou, L., Spang, R., Griessbach, S., Hoffmann, L., Khosrawi, F., Müller, R., and Tritscher, I.: Mountain-wave influence on polar stratospheric ice clouds: evidence from MIPAS–ERA5 analysis, EGU General Assembly 2026, Vienna, Austria, 3–8 May 2026, EGU26-2998, https://doi.org/10.5194/egusphere-egu26-2998, 2026.

EGU26-3966 | ECS | Orals | AS4.2

Climatology and trends of fog in the Svalbard region 

shubham singh and Moa K. Sporre

Fog is a common feature of the lower atmosphere in the Arctic, yet its long-term variability, seasonal changes, and sensitivity to rapid climate warming remain poorly known. Using meteorological data from five Svalbard stations from 1970 to 2020, we analyse seasonal fog occurrence, fog type (advection versus radiation), temperature, wind patterns. We also use sulphate aerosol data from one Svalbard station to investigate aerosol conditions.

High fog frequencies (7-15 %) are seen at the stations located on smaller islands in the vicinity of Svalbard (Janmayen, Bjørnøya, Hopen). The other two sites, located at Spitsbergen (Svalbard Airport, Ny-Ålesund), show substantially lower fog frequencies (0-4%). During summer, the fog frequency is highest for all stations, with radiation fog dominating at Spitsbergen sites while on the island stations, both advection fog and radiation fog is types are common. During winter, advection fog is predominant from cold, northerly to northeasterly marine airflows at most sites. The temperature during advection fog in winter is colder than during the formation of radiation fog. Spring and autumn seasonal represent transitional periods, with both fog types occurring but at lower overall frequencies. The wind direction during fog change seasonally, shifting from northerly/easterly in winter to southerly/westerly in summer.

Fog occurrence has decreased at most sites between 1970 and 2020. The drop is especially noticeable at Janmayen and Bjørnøya. The fog frequency at the Spitsbergen sites is also declining but with a weaker decreasing trend. The analysis shows that it is advection fog that is decreasing and not radiation fog. Regional warming, reduced sea-ice extent, and lower Arctic aerosol loading could be responsible for this decreasing trends. These results indicate that fog is sensitive to climate change in the Arctic. It changes visibility, the local radiation budget, and the way air and sea interact in an environment that is changing quickly.

How to cite: singh, S. and Sporre, M. K.: Climatology and trends of fog in the Svalbard region, EGU General Assembly 2026, Vienna, Austria, 3–8 May 2026, EGU26-3966, https://doi.org/10.5194/egusphere-egu26-3966, 2026.

EGU26-6771 | ECS | Orals | AS4.2

Spatial and temporal patterns of fog and low clouds in the Polar regions 

Olimpia Bruno and Jan Cermak

Low-level clouds and fog play a crucial role in the surface energy balance of polar regions, where even small perturbations in radiative fluxes can trigger amplified climatic responses. In these environments, the frequent presence of fog and stratiform low clouds strongly modulates both shortwave and longwave radiation, exerting a dominant control on near-surface temperature. The radiative effect of these clouds is highly sensitive to their thermodynamic phase: liquid-containing clouds generally enhance downwelling longwave radiation, promoting surface warming, whereas ice-dominated clouds are more transparent in the infrared and can contribute to surface cooling, particularly during polar night. As both the Arctic and Antarctic undergo rapid warming accompanied by shifts in cloud phase partitioning, understanding the occurrence and temporal variability of liquid and ice fog and low clouds is essential for accurately representing polar climate feedbacks and their role in ongoing climate change.

Using 11 years of cloud observations from the active satellite sensor CALIPSO, we characterize the spatial and temporal patterns of fog and low clouds (FLCs) across the polar regions, stratified by season and light conditions. Our results show a pronounced reduction in ice FLCs over Antarctica (~1% per year), while the Southern Ocean exhibits a decrease in liquid FLCs during winter under both daytime and nighttime conditions. In the Arctic, both liquid and ice FLCs decrease over land and sea-ice-covered regions from fall to spring. Over the Arctic Ocean, however, we find an increase in liquid FLCs during these seasons regardless of solar angle, whereas ice FLCs increase only under conditions of available solar radiation.

Overall, the observed trends in fog and low-level clouds suggest a potentially important role in modulating polar surface energy budgets.

How to cite: Bruno, O. and Cermak, J.: Spatial and temporal patterns of fog and low clouds in the Polar regions, EGU General Assembly 2026, Vienna, Austria, 3–8 May 2026, EGU26-6771, https://doi.org/10.5194/egusphere-egu26-6771, 2026.

EGU26-7721 | Orals | AS4.2

Constraints on Southern Ocean Mesoscale Cellular Convective Cell Growth 

Anna Possner, Jessica Danker, Isabel McCoy, and Odran Sourdeval

Mesoscale cellular convection (MCC), which can be found in- and outside marine cold air outbreaks (MCAOs) over the Southern Ocean (SO), has been shown to influence the cloud radiative effect and potentially shortwave cloud feedbacks. While MCC morphology and cell-size scaling have been studied extensively in the subtropics and North Atlantic MCAOs, far less is known about how these relationships behave in the SO, where mixed-phase clouds dominate. In this study, we investigate the physical controls on MCC cell size and its variability during SO MCAOs based on collocated active and passive remote sensing products and reanalysis fields.

Specifically we combine MODIS retrievals of liquid water path and 0.86 μm reflectance for MCC classification and cell identification, ERA5 reanalysis for dynamical and thermodynamic fields, and DARDAR-v2 radar–lidar profiles to determine cloud-top height, cloud-top temperature, and cloud phase. Image segmentation applied to 200 × 200 km² scenes along DARDAR overpasses yields a catalogue of 19,500 MCC cells, 86% of which are supercooled—a clear reflection of the high prevalence of mixed-phase clouds in the SO.

Contrary to established behaviour in shallow NH boundary layers, we find no evidence of a constant aspect-ratio regime and no systematic deepening of the BL during MCAO evolution. Open and closed cells exhibit similar median diameters (~36–37 km), although open cells display a longer tail toward larger sizes. Thermodynamic and dynamic conditions—including stability parameter M, BL depth, and surface forcing—show minimal influence on cell-size variability. Approximately half of all mixed-phase open cells occur within MCAO regimes defined by M > –5 K, yet cell diameter remains largely insensitive to the strength of the outbreak.

Backward trajectory analysis indicates that time since cold air mass formation may play a more decisive role: larger cells tend to reside in older, more mature MCAO air masses. Our findings suggest that, in the SO, MCC cell growth is primarily constrained by air-mass age rather than boundary-layer deepening or thermodynamic forcing.

How to cite: Possner, A., Danker, J., McCoy, I., and Sourdeval, O.: Constraints on Southern Ocean Mesoscale Cellular Convective Cell Growth, EGU General Assembly 2026, Vienna, Austria, 3–8 May 2026, EGU26-7721, https://doi.org/10.5194/egusphere-egu26-7721, 2026.

EGU26-10742 | ECS | Orals | AS4.2

How can EarthCARE satellite observations help improve Greenland’s clouds in the regional climate model RACMO? 

Thirza Feenstra, Willem Jan van den Berg, Gerd-Jan van Zadelhoff, David P. Donovan, Christiaan T. van Dalum, and Michiel R. van den Broeke

Clouds play an important role in Greenland’s surface mass balance, as they govern accumulation through precipitation and influence surface melt by altering the radiative balance. Therefore, correctly representing clouds in polar regional climate models is crucial for obtaining reliable surface mass balance estimates and projections. However, the complex, small-scale cloud microphysical processes involved in cloud formation, dissipation, and phase changes are often poorly represented in models. As in-situ observations of polar clouds are sparse, satellite observations can be an effective tool for evaluating and improving climate models. The new EarthCARE satellite, launched in May 2024, provides high-resolution co-located observations of the vertical structure of clouds and aerosols, and top-of-atmosphere radiation. Here, we show how these observations can be used to evaluate cloud representation in climate models by comparing them with output of the polar regional climate model RACMO (version 2.4p1).

We will present a comparison of over one year of multi-instrument EarthCARE observations of clouds and radiation for the Greenland region with model output that is co-located in time and space. We find that for clouds in all phases (solid, liquid, and mixed), RACMO tends to miss clouds at higher altitudes and underestimates water content for most locations and vertical levels. As a result, in RACMO, snowfall is less often generated at higher altitudes but more often at lower altitudes. However, the simulated snowfall rates are underestimated. Rainfall shows similar patterns, with rainfall modeled more frequently, but with lower rainfall rates. We will use these comparisons, along with EarthCARE’s radiation observations and retrieved cloud microphysical properties, to work towards improved cloud representation, surface radiation, and surface mass balance estimates in RACMO.

How to cite: Feenstra, T., van den Berg, W. J., van Zadelhoff, G.-J., Donovan, D. P., van Dalum, C. T., and van den Broeke, M. R.: How can EarthCARE satellite observations help improve Greenland’s clouds in the regional climate model RACMO?, EGU General Assembly 2026, Vienna, Austria, 3–8 May 2026, EGU26-10742, https://doi.org/10.5194/egusphere-egu26-10742, 2026.

EGU26-11006 | ECS | Posters on site | AS4.2

Quantifying drivers of the thermal-infrared radiative effect of Arctic low-level clouds in cold air outbreaks 

Sophie Rosenburg, Michael Schäfer, André Ehrlich, Anna Luebke, Marcus Klingebiel, Joshua Müller, and Manfred Wendisch

Marine cold air outbreaks (CAOs) represent an important meridional transport mechanism out of the Arctic towards lower latitudes. The cloud field properties change with the air mass transformation, and the thermal-infrared all-sky cloud radiative effect (CRE) is increasing in the downstream direction during the initial stages of a CAO. These evolution processes are important to understand current and future CAOs in a warming Arctic, which will favor weaker events.

Here, we aim to identify the driving factors of this downstream increase for different CAO events of varying intensity, which were observed during the HALO-(AC)3 campaign in spring 2022. The High Altitude and LOng range research aircraft (HALO) sampled CAOs in a quasi-Lagrangian way with a remote sensing payload. The thermal-infrared imager VELOX (Video airbornE Longwave Observations within siX channels) provided 2D broadband (7.7 µm to 12.0 µm) brightness temperature fields of cloud tops and the surface with a spatial resolution of 10 m for a 10 km target distance. First, a cloud mask is applied to those brightness temperature fields to determine cloud fractions. In a next step, two types of CRE are calculated. A cloud-only CRE is derived for all identified cloud pixels while an all-sky CRE is calculated for cloud-free as well as cloud pixels. The comparison of the cloud-only and all-sky VELOX CREs enables a determination of the all-sky CRE driver, i.e., cloud top temperature or cloud fraction. In addition, lidar cloud top heights and a large-scale all-sky CRE, based on measurements by a broadband radiometer and radiative transfer simulations, are analyzed to provide further context for the analyzed cases. The results imply that the strength of the all-sky CRE increase depends on the CAO intensity and is in general driven by increasing cloud fraction. Thus, this analysis provides a TOA-like perspective on the thermal-infrared radiative impact of a low-level cloud field, which is (trans-)forming during the initial stages of a CAO.

How to cite: Rosenburg, S., Schäfer, M., Ehrlich, A., Luebke, A., Klingebiel, M., Müller, J., and Wendisch, M.: Quantifying drivers of the thermal-infrared radiative effect of Arctic low-level clouds in cold air outbreaks, EGU General Assembly 2026, Vienna, Austria, 3–8 May 2026, EGU26-11006, https://doi.org/10.5194/egusphere-egu26-11006, 2026.

EGU26-12413 | ECS | Posters on site | AS4.2

Atmospheric transport characteristics during warm-air intrusions – focusing on aerosol, energy, and moisture transport 

Andreas Plach, Sabine Eckhardt, Nikolaos Evangeliou, and Annica M. L. Ekman

Arctic Amplification is not well understood. It is the result of a complicated interplay between remote and local forcing and feedback processes. Therefore, it is crucial to enhance our understanding of the transport of energy and moisture from lower latitudes. The amount of aerosol in the Arctic is also an important quantity as their role in Arctic Amplification, via direct radiative forcing and aerosol-cloud interactions, remain poorly quantified.

In this work, we aim to better quantify how aerosols, energy, and moisture are transported to and distributed within the Arctic. We investigate observations at Arctic stations, including, Villum and Zeppelin, and perform backward-in-time simulations with the Lagrangian atmospheric transport model FLEXPART (Pisso et al., 2019; Bakels et al., 2024) to derive so-called emission sensitivities and use these sensitivities to better quantify source regions of aerosols, energy, and moisture.

In general, we aim to better describe the spatial and temporal atmospheric transport characteristics into the Arctic and how these characteristics have changed in recent years. We focus on the transport during warm-air intrusions, since almost 30% of the total poleward transport of moisture (during winter) occurs during such events (Woods et al., 2013). Warm-air intrusions are often associated with large-scale atmospheric blocking patterns forcing a change in transport direction from east to more poleward, bringing warm, moist, and cloudy air into the Arctic. Warm-air intrusions can also be favourable for an enhanced transport of aerosols (e.g., Dada et al., 2022).

Since climate models show large biases in moisture flux during these events (Woods et al., 2017), there is clearly a need to better quantify the transport of moisture, energy, and aerosols during these events. This will also help to provide better forcing for climate simulations.

Bakels et al. (2024): 10.5194/gmd-17-7595-2024; Dada et al. (2022): 10.1038/s41467-022-32872-2; Lapere et al. (2024): 10.1029/2023JD039606; Pisso et al. (2019): 10.5194/gmd-12-4955-2019; Woods et al. (2013): 10.1002/grl.50912; Woods et al. (2017): 10.1175/JCLI-D-16-0710.1

How to cite: Plach, A., Eckhardt, S., Evangeliou, N., and Ekman, A. M. L.: Atmospheric transport characteristics during warm-air intrusions – focusing on aerosol, energy, and moisture transport, EGU General Assembly 2026, Vienna, Austria, 3–8 May 2026, EGU26-12413, https://doi.org/10.5194/egusphere-egu26-12413, 2026.

EGU26-12546 | ECS | Orals | AS4.2

Quantifying the temporal variability of water vapor in Ny-Ålesund and its relation to weather systems 

Christian Buhren, Susanne Crewell, Claire Pettersen, Phillip Eisenhuth, Christoph Ritter, and Kerstin Ebell

The role of Water Vapor (WV) in Arctic amplification remains uncertain and is under investigation (Wendisch and coauthors, 2023). Understanding its role in the mechanisms driving Arctic amplification requires detailed information on its spatio-temporal variability. However, WV variability in the Arctic has rarely been examined. Temporally highly resolved integrated water vapor (IWV) data from ground-based MWR observations are ideally suited for the analysis of WV temporal variability. In this study, we make use of 13 years of measurements of the Humidity and Temperature PROfiler (HATPRO) at the AWIPEV atmospheric observatory (Ny-Ålesund, Svalbard). Extreme events of atmospheric moistening and drying are identified, characterized, and further related to the prevailing circulation weather systems. Since WV transport into the Arctic is episodic and primarily occurs through brief, intense events typically associated with cyclones (Henderson et al., 2021), it is essential to analyze these events in further detail. To analyze these events, we identify minima and maxima in the IWV time series. We define “extreme” using a threshold in IWV amplitudes within a respective time interval. An event can either consist of only one maximum (moistening) or minimum (drying) or of multiple maxima/minima.

When focusing on extreme atmospheric moistening and drying events, we find that absolute IWV amplitudes are highest in summer and lowest in winter. The events last between 2 and 142 hours. By contrast, winter shows a greater relative variability (with respect to the monthly mean) than summer, with IWV changes exceeding 250% within a few hours in some cases. Events with only one maximum (moistening) or one minimum (drying) are short-lived (75% last less than 24 hours), while those with multiple maxima/minima last longer, with a mean of 48 hours. We find that extreme atmospheric moistening and drying at Ny-Ålesund proceed differently: drying happens more rapidly but with smaller amplitudes than moistening. Also, the synoptic regimes favoring moistening and drying differ. For moistening the weather types ASW, AW, AS, and CSE account for half of the extreme moistening events, with the anticyclonic types transporting moisture over the North Atlantic. In contrast, CSE is associated with moisture transport over Scandinavia and West Russia, spanning the Barents and Kara Seas. For drying, significantly different weather systems can be responsible. Other studies found a positive trend in cyclone activity over the Barents Sea (e.g., Wickström et al., 2019), which could favor greater moisture transport driven by CSE.

We gratefully acknowledge the funding by the Deutsche Forschungsgemeinschaft (DFG, German Research Foundation) – Project Number 268020496 – TRR 172, within the framework of the Transregional Collaborative Research Center “ArctiC Amplification: Climate Relevant Atmospheric and SurfaCe Processes, and Feedback Mechanisms (AC)³”.  We thank the AWIPEV team for their support in operating our instruments at AWIPEV within the project AWIPEV_0016.

How to cite: Buhren, C., Crewell, S., Pettersen, C., Eisenhuth, P., Ritter, C., and Ebell, K.: Quantifying the temporal variability of water vapor in Ny-Ålesund and its relation to weather systems, EGU General Assembly 2026, Vienna, Austria, 3–8 May 2026, EGU26-12546, https://doi.org/10.5194/egusphere-egu26-12546, 2026.

EGU26-14343 | ECS | Posters on site | AS4.2

New insights into Arctic mixed-phase clouds from airborne and EarthCARE observations 

Lars van Gelder, Pavlos Kollias, Mario Mech, Lukas Pfitzenmaier, and Susanne Crewell

Low-level Arctic clouds, especially mixed-phase clouds, are key drivers of regional climate and Arctic amplification, yet their microphysical and dynamical properties remain difficult to observe in data-sparse regions. EarthCARE offers new opportunities to address this observational gap; however, its measurements require validation using independent reference data. As a contribution to these validation activities, the Polar 5 research aircraft of the Alfred Wegener Institute has been equipped with an EarthCARE-like instrument suite and operated during the COMPEX-EC (Clouds over cOMPlEX environment – EarthCARE) in April 2025 from Kiruna, Sweden. During seven research flights, we collected more than 5 hours of along-track airborne radar measurements collocated with EarthCARE overpasses, covering diverse Arctic conditions from marine cold-air outbreaks (CAO) over the Norwegian Sea to cloud fields over northern Scandinavia. For moving platforms, such as aircraft, corrections addressing horizontal and vertical motion, as well as attitude, need to be applied to some of the measurements. Hereby, the Doppler velocity is especially challenging, and this is further complicated by the installation of the W-band Microwave Radar/radiometer for Arctic Clouds (MiRAC) on Polar 5 in a belly pod with a 25° inclination under the aircraft, which enhances the complexity. MiRAC is complemented by a microwave radiometer, an Airborne Mobile Aerosol Lidar for Arctic research (AMALi), spectral and broadband radiative sensors, and dropsondes. The collected data provide a unique basis for evaluating EarthCARE cloud products, with a particular focus on cloud geometric properties and vertical cloud structure. Cloud-top heights are derived from AMALi and MiRAC and compared to spaceborne retrievals from EarthCARE ATLID and CPR across different Arctic cloud regimes. We exploit the complementary sensitivities of lidar and radar to assess the detectability of thin liquid-topped clouds and mixed-phase cloud layers. Dropsondes released during EarthCARE overpasses provide thermodynamic and wind profiles that support the interpretation of observed cloud structures and precipitation occurrence. Beyond EarthCARE validation, the dataset contributes to an enhanced understanding of Arctic cloud vertical structure and its relevance to precipitation development under different synoptic conditions. Ongoing work aims to extend the analysis towards Doppler-based interpretations of cloud dynamics.

This work was supported by the DFG funded Transregio-project TRR 172 "Arctic Amplification (AC)³".

How to cite: van Gelder, L., Kollias, P., Mech, M., Pfitzenmaier, L., and Crewell, S.: New insights into Arctic mixed-phase clouds from airborne and EarthCARE observations, EGU General Assembly 2026, Vienna, Austria, 3–8 May 2026, EGU26-14343, https://doi.org/10.5194/egusphere-egu26-14343, 2026.

EGU26-14797 | Posters on site | AS4.2

Toward enhanced retrievals of supercooled droplet properties in Antarctic clouds  

Martin Radenz, Michael Lonardi, Yolanda Temel, Teresa Vogl, Ronny Engelmann, Julia Schmale, and Patric Seifert

Clouds containing supercooled liquid are common over the Southern Ocean and coastal Antarctica. The liquid phase not only has strong influence on the surface energy budget, but also cloud microphysics and precipitation formation. Often, the droplets occur in thin layers stacked on top of each other and/or coexisting with ice particles. Both of these aspects pose a significant challenge for observations. Cloud radar Doppler spectra can contain this information in the form of individual peaks for different particle populations, but extracting useful data is challenging for automated retrievals.

Combining advanced Doppler spectra analysis techniques with established retrieval methods, such as ACTRIS-Cloudnet, can provide cloud microphysical properties even under complex conditions. This approach has been applied to observations from Neumayer Station III, Antarctica (70.67°S, 8.27°W), where synergistic remote sensing instruments are operated since 2023. During the 2024/25 austral summer, tethered-balloon in-situ observations provided complementary information on cloud droplet properties.

Two aspects will be presented: Firstly, properties of liquid layers in geometrically thick snowfall clouds. Spatiotemporal coinciding balloon-borne observations provide independent verification. Secondly, observations of seeder-feeder situations, in which ice crystals sediment into a supercooled – potentially drizzling – layer. It is envisaged that the Doppler spectral analysis will be implemented as a new method in ACTRIS-Cloudnet in the future.

How to cite: Radenz, M., Lonardi, M., Temel, Y., Vogl, T., Engelmann, R., Schmale, J., and Seifert, P.: Toward enhanced retrievals of supercooled droplet properties in Antarctic clouds , EGU General Assembly 2026, Vienna, Austria, 3–8 May 2026, EGU26-14797, https://doi.org/10.5194/egusphere-egu26-14797, 2026.

EGU26-14927 | Posters on site | AS4.2

Unpacking Global Drivers of Extreme Precipitation over West Antarctica, using a Variable-Resolution Earth Systems Model with Explicit Moisture Tagging 

Rajashree Datta, Adam Herrington, Jesse Nusbaumer, and Luke Trusel

The overall gain and loss of snow and ice on the surface of the Antarctic ice sheet is strongly driven by rare extreme events, some of which result from atmospheric rivers transporting both moisture and heat from the tropics towards the south pole. Moisture transport is strongly driven by large-scale patterns, e.g. the El Niño Southern Oscillation, the Southern Annular Mode, PSA1 and PSA2 patterns. Additionally, in recent years, the Southern Ocean region has witnessed major changes, including sequential record lows for sea ice extent and warming oceans, with direct impacts on the Antarctic ice sheet and Southern Ocean. Previous research has highlighted the strong sensitivity of precipitation in West Antarctica to large-scale patterns, and especially the importance of atmospheric rivers. However, atmospheric rivers are only one mechanism of transport, and estimates are subject to the reliability of detection algorithms. Additionally, the ability to fully-capture drivers and impacts of extreme events are limited by spatiotemporal resolution in Earth Systems Models.

Here, we employ a variable-resolution version of the global Community Earth Systems Model (VR-CESM2) with enhanced resolution over Antarctica over the historical period (1990-2020), run at a high time-resolution capable of capturing extremes and calculating atmospheric rivers. We additionally employ moisture-tagging (linking precipitation to a moisture source region), which can quantify links between sources and sinks of extreme precipitation directly and identify mechanisms which drive transport. Here, we will focus on drivers of extremes in West Antarctica, comparing mechanisms identified via direct moisture tagging with those concurrent with atmospheric rivers.


How to cite: Datta, R., Herrington, A., Nusbaumer, J., and Trusel, L.: Unpacking Global Drivers of Extreme Precipitation over West Antarctica, using a Variable-Resolution Earth Systems Model with Explicit Moisture Tagging, EGU General Assembly 2026, Vienna, Austria, 3–8 May 2026, EGU26-14927, https://doi.org/10.5194/egusphere-egu26-14927, 2026.

EGU26-15936 | ECS | Orals | AS4.2 | Highlight

Observed cloud and atmospheric drivers of surface radiation change 2001-2023 on the North Slope of Alaska 

Leah Bertrand, Jennifer Kay, and Gijs de Boer

Arctic surface warming is driven by a changing surface energy budget. However, sparse observations in the Arctic limit our ability to identify drivers of surface energy budget change. Here, we leverage detailed long-term observations at the Atmospheric Radiation Measurement (ARM) program's North Slope of Alaska (NSA) facility to constrain and attribute drivers of surface radiation change 2001-2023. We combine cloud and atmospheric observations with radiative transfer calculations, allowing us to quantify the relative impact of clouds, temperature, and water vapor on surface radiation trends and variability. At the ARM NSA facility, downwelling longwave radiation is increasing year-round and downwelling shortwave radiation is decreasing during summer. We find that cloud changes intensify the downwelling longwave radiation trend, which is largely due to warming. We also find that cloud changes drive decreasing downwelling shortwave radiation during summer. These results reveal the important role of clouds in driving surface radiation trends along the North Slope of Alaska.

How to cite: Bertrand, L., Kay, J., and de Boer, G.: Observed cloud and atmospheric drivers of surface radiation change 2001-2023 on the North Slope of Alaska, EGU General Assembly 2026, Vienna, Austria, 3–8 May 2026, EGU26-15936, https://doi.org/10.5194/egusphere-egu26-15936, 2026.

EGU26-16990 | ECS | Posters on site | AS4.2

Model analysis of convective precipitation in the Arctic 

Sophie Vliegen and Johannes Quaas

The strong warming of the Arctic has profound implications for the atmospheric energy budget. Recent studies indicate that the Arctic energy balance is transitioning from a predominantly radiative-advective equilibrium towards a radiative-advective convective regime.

Using monthly CMIP6 model output from an idealized CO2-forcing scenario, we analyze changes in the occurrence of convective precipitation relative to total precipitation. Our results show a pronounced seasonal and surface-dependent signal. This pattern is also reflected in the associated trend estimates. However, the inter-model spread across the CMIP6 models is substantial, with individual models even exhibiting opposing trend signs. This large spread is consistent with pronounced differences in simulated sea ice extent among the models, suggesting potential linkages to other key variables.

How to cite: Vliegen, S. and Quaas, J.: Model analysis of convective precipitation in the Arctic, EGU General Assembly 2026, Vienna, Austria, 3–8 May 2026, EGU26-16990, https://doi.org/10.5194/egusphere-egu26-16990, 2026.

EGU26-17535 | ECS | Posters on site | AS4.2

Cloud state transitions at Ny-Ålesund: A machine learning supported statistical analysis 

Andreas Walbröl, Nils Risse, Dwaipayan Chatterjee, Susanne Crewell, and Kerstin Ebell

Clouds are still a major source of uncertainty in projections of the future climate because of complex feedback mechanisms and their interplay with other atmospheric and surface properties (i.e., through solar and thermal-infrared radiation and precipitation). In the Arctic, where the climate is projected to warm the strongest, clouds pose a particular challenge to current climate and weather forecast models because of the difficulties in simulating the frequently occurring mixed-phase clouds and the sparsity of observational data.

In this study, we aim to improve our understanding of Arctic clouds on multi-annual time scales by performing statistical analyses of cloud states and their transitions using cloud radar data from the research site Ny-Ålesund, Svalbard. We have gathered nine years of comprehensive cloud and precipitation observations with the 94-GHz cloud radars, which were operated at the German-French Arctic Research Base AWIPEV observatory in synthesis with other in-situ and remote sensing instruments (i.e., microwave radiometers, lidar, disdrometers, ...). The additional meteorological measurements also allow us to study how atmospheric conditions affect the cloud states and transitions.

Modern machine learning algorithms are well suited to analyse big data sets and reveal features imperceptible to the human eye because of the complexity of the problem. We train a Vision Transformer [1-3] with height-resolved cloud radar reflectivities, Doppler velocities, ceilometer data and liquid water path-sensitive brightness temperatures at 89 GHz in a self-supervised framework. The Vision Transformer learns to identify distinct features in the training data and therefore find different cloud states without direct human intervention.

Here, we present our first steps focussing on the interpretation of the machine learning model output and fine tune the settings to better discern the cloud states. Different cloud macro- and microphysical properties are tested to understand the nature of each cluster the machine learning algorithm produced.

Later, we will apply the trained machine learning algorithm to synthetic radar data simulated with the Passive and Active Microwave radiative TRAnsfer (PAMTRA, [4]) model based on the output of the ICOsahedral Non-hydrostatic (ICON, [5]) model in large-eddy configuration. By comparing the observation-based analysis with the one performed on the simulated radar data we aim to further shed light on the strengths and weaknesses of ICON regarding cloud states and transitions.


We gratefully acknowledge the funding by the Deutsche Forschungsgemeinschaft (DFG, German Research Foundation) - Project Number 268020496 - TRR 172, within the framework of the Transregional Collaborative Research Center "ArctiC Amplification: Climate Relevant Atmospheric and Surface Processes, and Feedback Mechanisms (AC)³". We also acknowledge the support of AWIPEV for the project AWIPEV_0016.

[1]: Vaswani, A., et al., 2017, Inc. arXiv, 1706.03762, https://arxiv.org/abs/1706.03762.

[2]: Caron, M., et al., 2021, arXiv, 2104.14294, https://arxiv.org/abs/2104.14294.

[3]: Chatterjee, D., et al., 2024, Geophys. Res. Lett., 51, 12, e2024GL108889, doi: 10.1029/2024GL108889.

[4]: Mech, M. et al., 2020, Geosci. Model Dev., 13, 4229-4251, doi: 10.5194/gmd-13-4229-2020.

[5]: Zängl, G. et al., 2015, Q. J. R. Meteorolog. Soc., 141, 563-579, doi: 10.1002/qj.2378.


How to cite: Walbröl, A., Risse, N., Chatterjee, D., Crewell, S., and Ebell, K.: Cloud state transitions at Ny-Ålesund: A machine learning supported statistical analysis, EGU General Assembly 2026, Vienna, Austria, 3–8 May 2026, EGU26-17535, https://doi.org/10.5194/egusphere-egu26-17535, 2026.

EGU26-17911 | Posters on site | AS4.2

A decade beneath Arctic clouds: Continuous radar observations at Ny-Ålesund, Svalbard 

Kerstin Ebell, Mario Mech, Andreas Walbröl, Christian Buhren, Pavel Krobot, Christoph Ritter, and Marion Maturilli

Climate change signals are especially strong in the Arctic, where warming from 1979 to 2021 proceeded at nearly four times the global average rate (Rantanen et al., 2022). The magnitude of this warming varies across the region, and the Svalbard archipelago, located in the warmest part of the Arctic, has experienced particularly intense temperature increases (Dahlke and Maturilli, 2017).

The influence of clouds on the rapidly evolving Arctic climate system, as well as the processes governing their behavior, remains a key research challenge. Although detailed cloud observations are essential, only a limited number of Arctic sites provide continuous, high-resolution vertical measurements of cloud properties. One such site is the German-French Arctic Research Base AWIPEV at the Ny-Ålesund Research Station on Svalbard. Since 2016, a 94 GHz cloud radar has been operating at this location as part of the Transregional Collaborative Research Centre TR172 on Arctic Amplification (AC)³ (http://www.ac3-tr.de; Wendisch et al., 2023). In combination with complementary remote-sensing instruments, including ceilometers and microwave radiometers, this observational setup allows for continuous cloud monitoring with high temporal and vertical resolution. This presentation highlights key results derived from a decade of cloud radar observations.

Clouds are present at Ny-Ålesund during roughly 78% of the time, most frequently at low levels between 0.5 and 1.5 km. While pure liquid clouds show a distinct seasonal variability, mixed-phase clouds occur year-round and account for about 42% of all cloud observations. These liquid-containing clouds have a significant influence on the Arctic surface energy budget, leading to an overall warming at Ny-Ålesund due to the enhanced longwave downward radiation flux.

Based on the 10-year-long dataset, we will examine the interannual variability of clouds and precipitation at Ny-Ålesund, as well as their impact on surface radiation.

Acknowledgment: We gratefully acknowledge the funding by the Deutsche Forschungsgemeinschaft (DFG, German Research Foundation) – Project Number 268020496 – TRR 172, within the framework of the Transregional Collaborative Research Center “ArctiC Amplification: Climate Relevant Atmospheric and SurfaCe Processes, and Feedback Mechanisms (AC)³”. We also acknowledge the support of AWIPEV for the project AWIPEV_0016.

How to cite: Ebell, K., Mech, M., Walbröl, A., Buhren, C., Krobot, P., Ritter, C., and Maturilli, M.: A decade beneath Arctic clouds: Continuous radar observations at Ny-Ålesund, Svalbard, EGU General Assembly 2026, Vienna, Austria, 3–8 May 2026, EGU26-17911, https://doi.org/10.5194/egusphere-egu26-17911, 2026.

EGU26-18004 | ECS | Orals | AS4.2

Quantifying the Evolution of Cloud Street Structures During Arctic Marine Cold Air Outbreaks Using Satellite Observations 

Hannah Sundermann, Marcus Klingebiel, André Ehrlich, and Hartwig Deneke

The clouds associated with Marine Cold Air Outbreaks (MCAOs) exhibit characteristic structures, initially forming as roll clouds or cloud streets parallel to the wind direction, and eventually breaking up into a cellular cloud field.

Here, a novel correlation-based metric, the Correlation clOud Street Index (COSI) is introduced. It is defined as the Pearson correlation coefficient between an image and an optimally oriented and scaled Gabor kernel, providing a quantitative measure of cloud street presence and distinctness. The calculation of this index also extracts cloud street spacing (wavelength) and orientation as structural properties.

Applied to satellite observations with extensive spatial and temporal coverage, we utilise the COSI to get novel insights into the spatio-temporal evolution of cloud street structures in marine cold air outbreaks. By analysing sequences of consecutive satellite images for individual events, we capture the cloud evolution for both the overall MCAO and along quasi-Lagrangian trajectories. We quantify the systematic increase in cloud street wavelength with increasing distance from the ice edge and assess the aspect ratio (wavelength divided by cloud top height) across a larger dataset. The dependence on the MCAO strength is also evaluated. The cases analysed correspond to periods with (AC)3 aircraft campaigns, allowing the aircraft observations to be placed in a broader context and providing more detailed observations of meteorological conditions along flight trajectories.

This work was supported by the DFG funded Transregio-project TRR 172 “Arctic Amplification (AC)3“.

How to cite: Sundermann, H., Klingebiel, M., Ehrlich, A., and Deneke, H.: Quantifying the Evolution of Cloud Street Structures During Arctic Marine Cold Air Outbreaks Using Satellite Observations, EGU General Assembly 2026, Vienna, Austria, 3–8 May 2026, EGU26-18004, https://doi.org/10.5194/egusphere-egu26-18004, 2026.

EGU26-18430 | ECS | Posters on site | AS4.2

Exploring Aerosol-Cloud Interactions in Arctic Mixed-Phase Clouds Using ICON-LEM 

Lena Bruder, Christoph Ritter, Naruki Hiranuma, Hyojin Kang, and Vera Schemann

The contribution of Arctic mixed-phase clouds (MPCs) to the accelerated climate warming in the Arctic, known as Arctic amplification, remains uncertain due to complex microphysical and environmental interactions. Cloud condensation nuclei (CCN) concentrations influence MPC properties; however, current models often prescribe CCN levels much higher than Arctic observations suggest. To address this, we investigate the sensitivity of MPC properties to CCN concentrations using 600-m ICON-LEM simulations around Ny-Ålesund. The CCN sensitivity studies are based on typical CCN concentrations observed at the Zeppelin Observatory, serving as a benchmark for Ny-Ålesund conditions. We select simulation days by analyzing aerosol optical depth (AOD) measurements in Ny-Ålesund to represent high and low aerosol loading regimes, which are confirmed by Micro-Pulse Lidar (MPL) observations. Our initial studies, spanning mimicked Arctic, maritime, and polluted CCN regimes, reveal clear CCN effects: lower CCN concentrations reduce liquid water path (LWP) and increase radar reflectivity (Ze), mainly due to enhanced rain and graupel formation. However, the model underestimates the observed Ze, indicating shortcomings in the representation of phase partitioning. The results suggest that microphysical sensitivity varies with cloud height, with low-level MPCs responding more strongly than higher layers. We further explore this by separating cloud layers relative to the melting layer and analyzing their CCN sensitivity. To increase robustness, additional summer and winter low-level MPC cases are included. Complementing CCN sensitivity, ice nucleating particle (INP) sensitivity studies constrained by observed INP concentrations from the Gruvebadet observatory assess INP influence on phase-partitioning and precipitation in low-level MPCs. Identifying suitable CCN–INP combinations may improve MPC representation in ICON-LEM and deepen understanding of the aerosol-cloud interactions driving Arctic amplification.

This work was supported by the DFG-funded Transregio-project TRR 172 ”Arctic Amplification (AC)³”.

How to cite: Bruder, L., Ritter, C., Hiranuma, N., Kang, H., and Schemann, V.: Exploring Aerosol-Cloud Interactions in Arctic Mixed-Phase Clouds Using ICON-LEM, EGU General Assembly 2026, Vienna, Austria, 3–8 May 2026, EGU26-18430, https://doi.org/10.5194/egusphere-egu26-18430, 2026.

EGU26-19611 | ECS | Orals | AS4.2

Precipitation processes in an Antarctic moist air intrusion: insights from multi-frequency radar observations over a 1100-km transect 

Heather Corden, Julien Delanoë, Felipe Toledo Bittner, and Alexis Berne

The ERC Synergy funded project AWACA aims to understand the atmospheric branch of the water cycle over Antarctica. It relies on innovative observations of the tropospheric meteorological conditions and the isotopic composition of water vapor and hydrometeors along a 1100-km transect between Dumont d’Urville station at the coast and Concordia station on the high inner Antarctic plateau. The deployment of instruments was completed in the austral summer season from November 2024 to February 2025. The instruments will remain in place for three years. At four locations along the transect, temporary container-stations were deployed. Each container includes, among other instruments, a Metek MIRA 35 GHz cloud radar, an MRR-PRO 24 GHz precipitation radar, and a BASTA 95 GHz cloud radar. Adjacent to each container is a comprehensive surface weather station.

This contribution will present a case study of a coastal cyclone and resulting moist air intrusion in February 2025, focusing on the radar data. Trajectory analysis confirmed that air parcels within the same intrusion traveled inland over multiple sites of the observational transect. However, the mechanisms by which the moisture of the intrusion is converted into precipitation differ between the coast and the high plateau. Taking advantage of the multi-frequency, spectral, polarimetric radar dataset, differences in the microphysics of snowfall along the transect have been investigated. On the coastal slope of the ice sheet, uplift, turbulence and the presence of liquid water lead to riming and aggregation of snowflakes. On the high plateau, dry and cold conditions lead to smaller snow particles, for which the variation in the radar signal appears to arise from variations in primary production and ice crystal habit.

How to cite: Corden, H., Delanoë, J., Toledo Bittner, F., and Berne, A.: Precipitation processes in an Antarctic moist air intrusion: insights from multi-frequency radar observations over a 1100-km transect, EGU General Assembly 2026, Vienna, Austria, 3–8 May 2026, EGU26-19611, https://doi.org/10.5194/egusphere-egu26-19611, 2026.

EGU26-353 | ECS | Orals | CL4.4

A westward shift of heatwave hotspotscaused by warming-enhanced land–aircoupling 

Kaiwen Zhang, Zhiyan Zuo, Wei Mei, Renhe Zhang, and Aiguo Dai

Heatwaves pose serious risks to human health and lives, but how their occurrence patterns may change under global warming remains unclear. Here we reveal a systematic westward shift of heatwave hotspots across the northern mid-latitudes around the late 1990s. Both observational analysis and numerical simulation show that this shift is caused by intensified soil moisture–atmosphere coupling (SAC) in eastern Europe, Northeast Asia and western North America under recent background warming. The strengthened SAC shifted the atmospheric high-amplitude Rossby wavenumber-5 pattern westwards to a preferred phase position, which increased the probability of the occurrence of high-pressure ridges over these 3 hotspots by a factor of up to 39. Our results highlight the importance of SAC in shaping heatwave patterns and large-scale atmospheric circulation and challenge the conventional view that the land surface only passively responds to atmospheric forcing.

How to cite: Zhang, K., Zuo, Z., Mei, W., Zhang, R., and Dai, A.: A westward shift of heatwave hotspotscaused by warming-enhanced land–aircoupling, EGU General Assembly 2026, Vienna, Austria, 3–8 May 2026, EGU26-353, https://doi.org/10.5194/egusphere-egu26-353, 2026.

EGU26-700 | ECS | Orals | CL4.4

Fluxes, Feedbacks, and Memory: Untangling Chamoli’s Seasonal Land–Atmosphere Coupling 

Rahul Jaiswal, Manish Kumar Pandey, and Sunita Verma

Chamoli district, located in the Garhwal Himalaya of Uttarakhand, functions as a critical ecological buffer connecting mountain environments with downstream river systems. Its complex terrain, diverse biota, and glacier-fed rivers play an essential role in sustaining regional water resources and enhancing climate resilience. Despite its importance, studies exploring the land–atmosphere coupling processes in this climate-resilient region remain scarce.

In this work, we employ an information-theoretic approach to examine seasonal land–atmosphere interaction networks using key variables: precipitation (P), temperature (T), latent heat flux (LH), sensible heat flux (SH), wind speed (WS), incoming shortwave radiation (SWL), and relative humidity (Q). The analysis is conducted for four seasons: pre-monsoon (MAM), monsoon (JJAS), post-monsoon (ON), and winter (DJF). The derived networks distinguish between two types of links: instantaneous (real-time) and lagged (memory-controlled). Entropy-based diagnostics indicate that MAM and JJAS exhibit the highest dynamical variability, DJF represents the most quiescent period, and ON behaves as a transitional regime for Chamoli. Wind speed exerts a dominant real-time control on precipitation and also shows delayed influences at higher altitudes. In general, real-time coupling is strongest during the monsoon season, whereas comparatively enhanced memory-driven relationships mark winter.

The pre-COVID and post-COVID periods are compared to assess changes in information flow; we find that entropy deviation decreased around 2019, then increased after 2021. These findings refine our understanding of land–atmosphere dynamics over Chamoli and provide a reference state for evaluating future changes arising from natural climate variability and anthropogenic forcing.

Keywords—Land-atmospheric interaction; information-centric method; real-time interaction; entropy.

How to cite: Jaiswal, R., Pandey, M. K., and Verma, S.: Fluxes, Feedbacks, and Memory: Untangling Chamoli’s Seasonal Land–Atmosphere Coupling, EGU General Assembly 2026, Vienna, Austria, 3–8 May 2026, EGU26-700, https://doi.org/10.5194/egusphere-egu26-700, 2026.

Vegetation plays a crucial role during heatwaves by altering surface energy partitioning and influencing local to regional climate. In addition to the thermodynamic response of vegetation, the differential heating caused by sensible heat gradients across adjacent regions of vegetation and dry, bare soil can generate a mesoscale circulation akin to sea breeze-like circulation, known as a ‘vegetation breeze’1, which redistributes heat and moisture and affects downwind regions. While the impacts of large‑scale heterogeneities such as land-sea contrasts and topography are well established, the influence of finer‑scale vegetation heterogeneity remains uncertain. This gap is critical because semi‑arid forests, covering nearly 18% of Earth’s land surface, are highly sensitive to heat extremes. Differences in their Bowen ratios can substantially alter surface energy budgets, producing varying levels of hydroclimatic stress under similar atmospheric forcing. Yet, their potential to amplify or mitigate the impacts of extreme heat events is still poorly understood.

This study focuses on the semi-arid deciduous forests of the Eastern Ghats in Peninsular India, which are part of the Nagarjulam Srisilam Tiger Reserve and neighbouring protected areas  located along the ecotone between the dry Deccan Plateau and the Eastern coast.  It is spread over 5 districts in Andhra Pradesh and Telangana which are known to experience extreme heatwaves. Our previous observational analyses show that these transitional forests are highly sensitive to climatic stressors, particularly through their land surface temperature (LST) and evapotranspiration responses. During heatwave events, we observed pronounced LST gradients between forested and adjacent non-forested areas, indicating strong surface thermal contrasts arising from vegetation-atmosphere interactions. Given the heightened climate sensitivity of these transitional ecosystems, it is essential to understand not only how these ecosystems respond to extreme heat but also how they may influence local atmospheric dynamics.

To address this, we investigate how vegetation driven circulations such as the ‘vegetation breeze’ and the canopy convector effect2 emerge from land surface heterogeneity, and how these processes affect boundary layer processes and downwind thermal anomalies during heatwaves. Our approach combines atmospheric reanalysis data for large‑scale boundary conditions, satellite observations to characterize land surface and vegetation, and high‑resolution WRF simulations to resolve fine‑scale forest-atmosphere feedbacks. Through a series of forest‑configuration experiments, we assess the capacity of semi‑arid forests to alter boundary layer processes and explore the implications for local and regional modification of extreme events as well as downwind impacts. By isolating the role of semi‑arid forests during heatwaves, these experiments contribute to the mechanistic understanding of semi-arid forest-atmosphere interactions and their role in shaping hydroclimatic extremes under a changing climate.


References

[1] McPherson, R. A. (2007). A review of vegetation—atmosphere interactions and their influences on mesoscale phenomena. Progress in Physical Geography, 31(3), 261-285.

[2] Banerjee, T., De Roo, F., and Mauder, M.: Explaining the convector effect in canopy turbulence by means of large-eddy simulation, Hydrol. Earth Syst. Sci., 21, 2987–3000, https://doi.org/10.5194/hess-21-2987-2017, 2017. 


How to cite: Sen, D. and Monteiro, J.: Vegetation-Driven Circulations and Their Modification During Heatwaves: Insights into the Downwind Impacts of Semi-Arid Forests in Peninsular India, EGU General Assembly 2026, Vienna, Austria, 3–8 May 2026, EGU26-945, https://doi.org/10.5194/egusphere-egu26-945, 2026.

EGU26-1052 | ECS | Posters on site | CL4.4

Analysis of the Relationship Between Soil Moisture and Precipitation Across Heat Stress Categories 

Manali Saha, Vishal Dixit, and Karthikeyan Lanka

Extreme heat stress events are marked by significant deviations in surface air temperature that surpass the typical climatological range, coupled with increased atmospheric humidity. These events are characterised by their intensity, duration, and spatial extent, often crossing thresholds critical for both human and terrestrial ecosystem functioning. At the local scale, land-atmosphere interactions during these heat extremes modulate stress on soil and vegetation by altering energy partitioning, boundary layer feedbacks, and soil moisture memory. During these episodes, evapotranspiration is constrained due to low soil moisture (SM) conditions, leading to increased sensible heat and temperatures, which serve as the primary thermodynamic pathway for heat amplification. In conditions characterized by high soil moisture (SM), light precipitation (P) occurs, with an increase in latent heat flux may elevate atmospheric humidity and exacerbate heat stress, underscoring the nonlinear and stress-dependent nature of SM–P interactions. Despite the centrality of these processes, the relationship between SM and P across diverse heat stress regimes in South Asia remains insufficiently explored.

In this study, the Weather Research and Forecasting (WRF) model is employed to simulate an extreme heat stress event that occurred in May 2015 in the Indo-Gangetic Plains of India, utilizing initial and boundary conditions from the ERA5 dataset. To examine the SM-P feedback relationship, the initial SM is perturbed by 25% and 50% to represent a full spectrum of heat stress conditions (no stress, caution, danger, and extreme danger). Under no-stress conditions, the SM-P feedback exhibits a typical convex-concave relationship on the E[PSM] curve. However, as the heat stress intensifies, this relationship is broken. Extremely hot and deeply mixed boundary layers inhibit the development of moist convection, raising the lifting condensation level (LCL). Although cloud formation may still occur, the environmental conditions are insufficient to trigger heavy precipitation. The presence of upper-level anticyclones during this time period further suppresses vertical motion, reinforcing atmospheric stability and preventing convective initiation. Overall, the analysis highlights that an intermediate soil moisture range of approximately 0.25–0.35 m³/m³ maximizes land–atmosphere coupling strength in the IGP during extreme heat events. Within this range, the surface is sufficiently moist to sustain strong evapotranspiration yet dry enough to produce high surface temperatures, creating a feedback loop that exacerbates heat stress. These findings underscore the importance of accurately representing soil moisture dynamics in regional climate models to improve predictions of heat extremes in South Asia.

How to cite: Saha, M., Dixit, V., and Lanka, K.: Analysis of the Relationship Between Soil Moisture and Precipitation Across Heat Stress Categories, EGU General Assembly 2026, Vienna, Austria, 3–8 May 2026, EGU26-1052, https://doi.org/10.5194/egusphere-egu26-1052, 2026.

EGU26-1932 | Orals | CL4.4

Oceanic-versus-terrestrial influences on land humidity: simulations and theory 

Michael Byrne, Andrew Chingos, Joshua Duffield, Marysa Laguë, and Paul O'Gorman

Humidity over land is a key climate variable that is strongly coupled to mean and extreme temperatures, to precipitation and evapotranspiration, and to wildfires. Understanding the processes controlling the climatology of land humidity and its response to a changing climate is a fundamental scientific question with important societal implications. Here we use a global climate model with tagged water tracers to directly diagnose the sources of land specific humidity over a range of climate states. The simulations isolate the contributions to land humidity from water evaporated: (i) from the land surface ("terrestrial source"); and (ii) from the ocean surface ("oceanic source"). The control simulation reveals that land humidity in most regions and for most months of the year is dominated by the oceanic source, i.e. water evaporated from the ocean and advected over land. The terrestrial source is important in some inland regions, for example Eurasia, and during Jun-Jul-Aug, when advection is weaker in the northern hemisphere. Under climate change, the oceanic source dominates changes in land humidity at all latitudes but with a non-negligible contribution from the terrestrial source. The results are interpreted using a conceptual box model which predicts that the terrestrial and oceanic moisture sources scale equally with warming, implying equal fractional changes in land and ocean humidity. Implications of these new results for understanding the large biases in observed versus simulated land humidity trends over the historical period are discussed.

How to cite: Byrne, M., Chingos, A., Duffield, J., Laguë, M., and O'Gorman, P.: Oceanic-versus-terrestrial influences on land humidity: simulations and theory, EGU General Assembly 2026, Vienna, Austria, 3–8 May 2026, EGU26-1932, https://doi.org/10.5194/egusphere-egu26-1932, 2026.

The El Niño event exerts a profound influence on the global carbon cycle by perturbing terrestrial photosynthesis through environmental stress. Plant isoprene emissions respond rapidly to such environmental stress, yet it remains unclear whether isoprene can capture the spatiotemporal evolution of El Niño. Here, we used satellite-derived global isoprene emissions for the first time to assess their dynamical response to the 2015–2016 El Niño. We observed that isoprene emissions increase by up to ~30% relative to the climatological mean, with pronounced anomalies emerging across tropical ecosystems. The spatiotemporal evolution of these anomalies closely aligns with the El Niño progression, as indicated by sea surface temperature anomalies in the equatorial Pacific. In contrast, commonly used satellite vegetation products, including leaf area index (LAI) and solar-induced chlorophyll fluorescence (SIF), exhibit weaker and spatially incoherent responses. These results demonstrate that satellite-derived isoprene provides a sensitive and mechanistically grounded tracer of ecosystem stress, offering a complementary perspective for monitoring the impacts and propagation of extreme climate events on terrestrial ecosystems.

How to cite: Liu, H., Prentice, I. C., and Morfopoulos, C.: Satellite‐derived isoprene emissions trace the spatiotemporal evolution of the 2015-2016 El Niño across terrestrial ecosystems, EGU General Assembly 2026, Vienna, Austria, 3–8 May 2026, EGU26-2949, https://doi.org/10.5194/egusphere-egu26-2949, 2026.

EGU26-3005 | Orals | CL4.4 | Highlight

Climate extremes and ecosystem disturbance feedbacks 

Ana Bastos, Francisco José Cuesta-Valero, Albert Jornet Puig, Nora Linscheid, Yimian Ma, Laura Mayer, João Martins Basso, and Johannes Quaas


Climate extremes have direct impacts on ecosystems, for example reduced productivity during heat-drought events, but often their impact is amplified by compounding ecosystem disturbances, such as wildfires or insect outbreaks.  Through their impact on ecosystem functioning and structure, compound climate extremes and ecosystem disturbances modulate land-atmosphere exchanges of water, energy, and greenhouse-gases, which in turn influence atmospheric properties from local to global scales, thus feeding-back to climate change.  Recent observations indicate that such feedbacks are, however, non-negligible and might result in a much weaker role of the biosphere in climate change mitigation, especially under high emission scenarios.

Currently, ecosystem disturbances are not appropriately represented in most Earth System Models, which implies that extreme-event induced climate-biosphere feedbacks are likely overlooked in future climate simulations. Here, we will examine observation-based evidence for extreme-event induced climate-biosphere feedbacks through CO2 and land-atmosphere water and energy exchanges at different scales. We will then showcase recent developments in simulating some of these feedbacks in a global land-surface model and discuss the resulting implications for climate change adaptation and mitigation.  

How to cite: Bastos, A., Cuesta-Valero, F. J., Jornet Puig, A., Linscheid, N., Ma, Y., Mayer, L., Martins Basso, J., and Quaas, J.: Climate extremes and ecosystem disturbance feedbacks, EGU General Assembly 2026, Vienna, Austria, 3–8 May 2026, EGU26-3005, https://doi.org/10.5194/egusphere-egu26-3005, 2026.

EGU26-4152 | ECS | Orals | CL4.4

Tropical Forest Canopy Thermoregulation Observed from Space 

Akash Verma and Iain Colin Prentice

Canopy temperature (Tc) is a key regulator of plant physiological processes, growth, and productivity, and serves as an indicator of surface energy partitioning and plant water status. Despite its importance, many dynamic vegetation models implicitly assume Tc to be equal to air temperature (Tair); while land surface models calculate an effective surface temperature based on energy balance, but typically have not evaluated this calculation against data. Using satellite-derived land surface temperature as a proxy for Tc, in combination with ERA5-Land Tair, we assessed whether tropical rainforests actively thermoregulate Tc relative to Tair. We find that ΔT (Tc – Tair) follows a consistent diurnal cycle, which is primarily controlled by diurnal variations in net radiation. Forest canopies are cooler than air at night, warm early in the morning and cool again below Tair in late afternoon. During the hottest part of the day, the slope (β) of the canopy-air relationship indicates strong megathermy in dry forests, while humid forests show responses ranging from limited homeothermy to megathermy depending on their capacity to dissipate heat. Humid forests with sufficient water availability show buffering of Tc against Tair variability through evaporative cooling, whereas dry forests frequently experience canopy warming as aridity constrains evaporative cooling. In humid forests, this evaporative cooling persists through the wet season but weakens—or reverses to canopy warming—during the dry season as water stress intensifies. Together, these findings provide an observational benchmark for improving the representation of canopy temperature, evaporative cooling, and vegetation–atmosphere energy and water exchanges in land-surface models.

How to cite: Verma, A. and Prentice, I. C.: Tropical Forest Canopy Thermoregulation Observed from Space, EGU General Assembly 2026, Vienna, Austria, 3–8 May 2026, EGU26-4152, https://doi.org/10.5194/egusphere-egu26-4152, 2026.

EGU26-4364 | ECS | Posters on site | CL4.4

Urban irrigation reduces moist heat stress in Beijing, China 

Shuai Sun, Chunxiang Shi, Qiang Zhang, Tao Zhang, and Junxia Gu

Although urban irrigation can modulate local hydrothermal conditions and mitigate urban heat island effects, its impact on moist heat stress (MHS) is poorly understood. Employing the Weather Research and Forecasting Single-Layer Urban Canopy Model (WRF-SLUCM), we evaluated the effect of urban irrigation on the MHS in Beijing, China Using the CMA-RA V1.5 reanalysis dataset and CLDAS-V3.0 soil moisture as boundary conditions. Taking the hot and humid weather events that occurred in Beijing in May and August 2022 as examples,we found that the updated initial soil moisture (SM) field improved the simulation of temperature, relative humidity, and wind speed. Besides, urban irrigation reduced urban and rural MHS, and particularly reduced afternoon and evening MHS by up to 1.2 °C but increased morning MHS by up to 0.4 °C. In addition, the effect of different irrigation times on MHS showed that irrigation at 02 and 20 h increased urban and rural MHS, with the best cooling effect at 00 and 13 h, which reduced the MHS by up to 2.65 °C in urban areas and 0.71 °C in rural areas. The findings highlighted mechanistically the effect of urban irrigation on MHS and shed light on how to mitigate urban heat island effects on urban sustainable development.

How to cite: Sun, S., Shi, C., Zhang, Q., Zhang, T., and Gu, J.: Urban irrigation reduces moist heat stress in Beijing, China, EGU General Assembly 2026, Vienna, Austria, 3–8 May 2026, EGU26-4364, https://doi.org/10.5194/egusphere-egu26-4364, 2026.

The impacts of deforestation over the Maritime Continent (MC) have increasingly raised concerns due to its potential influence on extreme rainfall during the early summer monsoon. This study investigates how MC deforestation modifies extreme rainfall characteristics and associated large-scale circulation responses during May–June (MJ) using 100-year simulations from the Community Earth System Model (CESM1). A control simulation is compared with a deforestation experiment in which MC forests are replaced by grassland, and rainfall changes are quantified using indices defined by the Expert Team on Climate Change Detection and Indices (ETCCDI). Results show that deforestation substantially enhances extreme rainfall over the MC and induces a pronounced rainfall regime shift from weakened light rainfall toward strengthened heavy rainfall, driven by increased atmospheric instability and intensified deep convection. In contrast, rainfall over South China-Taiwan (SCTW) decreases significantly, with both light and extreme rainfall being suppressed. Mechanism analyses indicate that enhanced MC convection induces a meridional circulation response, characterized by anomalous ascent over the tropics and subsidence over SCTW. This subsidence causes tropospheric stabilization, reduced cloud cover, and weakened southwesterly monsoon moisture transport, creating unfavorable conditions for rainfall development over SCTW. Overall, MC deforestation drives a coherent redistribution of early summer monsoon rainfall, featuring an extreme rainfall-dominated regime shift over the MC and circulation-induced rainfall suppression over subtropical East Asia, highlighting the role of tropical land-use change in modulating extreme rainfall and monsoon circulation during the early summer monsoon.

How to cite: Chen, Y.-C. and Huang, W.-R.: Maritime Continent Deforestation-Induced Extreme Rainfall Regime Shifts During the Early Summer Monsoon Season, EGU General Assembly 2026, Vienna, Austria, 3–8 May 2026, EGU26-4627, https://doi.org/10.5194/egusphere-egu26-4627, 2026.

EGU26-4802 | ECS | Orals | CL4.4

Mesoscale soil moisture heterogeneity can locally amplify humid heat 

Guillaume Chagnaud, Chris M Taylor, Lawrence S Jackson, Anne Barber, Helen L Burns, John Marsham, and Cathryn E Birch

Soil moisture is a key ingredient of humid heat through supplying moisture and modifying boundary layer properties. Soil moisture heterogeneity due to for example, antecedent rainfall, can strongly influence weather patterns; yet, its effect on humid heat is poorly understood. Idealized numerical simulations are performed with a cloud-resolving (Δx = 500 m), coupled land-atmosphere model wherein circular wet patches with diameter λ ∈ 25-150 km are prescribed. Compared to experiments with uniform soil moisture, humid heat is locally amplified by 1 to 4°C in experiments with heterogeneous soil moisture, with maximum amplification for the critical soil moisture length-scale λc = 50 km. Subsidence associated with a soil moisture-induced mesoscale circulation concentrates warm, humid air in a shallower boundary layer. Additional pairs of uniform-heterogeneous soil moisture simulations are performed to assess the influence of the background wind, the strength of the soil moisture contrast, and the vertical structure of the atmosphere, on the relationship between soil moisture length-scales and humid heat amplification. This study provides process-based insights into the effects of soil moisture heterogeneity on humid heat in various environments at fine time and space scales, challenging extreme humid heat outputs from coarser-resolution weather and climate models. Furthermore, these results will help to predict extreme humid heat at city and county scales across the Tropics based on observed soil moisture patterns.

How to cite: Chagnaud, G., M Taylor, C., S Jackson, L., Barber, A., L Burns, H., Marsham, J., and E Birch, C.: Mesoscale soil moisture heterogeneity can locally amplify humid heat, EGU General Assembly 2026, Vienna, Austria, 3–8 May 2026, EGU26-4802, https://doi.org/10.5194/egusphere-egu26-4802, 2026.

EGU26-4968 | Orals | CL4.4

How basic physical constraints shape land-atmosphere interactions 

Axel Kleidon, Sarosh Alam Ghausi, and Tejasvi Ashish Chauhan

Climate over land is strongly shaped by the conditions at the land surface, particularly regarding the partitioning of energy, the availability of water, and the presence of vegetation. What we show here is that a number of key climatological fluxes and variables can be estimated quite accurately simply by applying basic physical constraints. First, heat fluxes are associated mostly with convective motion, which requires work to be done in the form of buoyancy. The generation of this work is subject to a first, physical constraint, the thermodynamic limit of a heat engine. Second, on land, the large differences in solar heating over the course of the day are buffered within the lower atmosphere, and not below the surface as is the case over open water surfaces.  This sets a second constraint. Third, when hydrological aspects are involved, saturation, that is, the thermodynamic equilibrium state, sets another constraint to evaporation and the humidity of air.  We focus on diurnal variations of the surface energy balance, temperature, and humidity over land and compare these to observations to show that these three constraints dominantly shape climatological variations across regions.  What this implies is that physical constraints dominate the functioning of climate over land, and much of this is shaped by the prevalent radiative conditions, with secondary effects relating to soil water availability and advection.  This, in turn, should help us to better distinguish between the important drivers from mere responses in shaping land-atmosphere interactions.

How to cite: Kleidon, A., Ghausi, S. A., and Chauhan, T. A.: How basic physical constraints shape land-atmosphere interactions, EGU General Assembly 2026, Vienna, Austria, 3–8 May 2026, EGU26-4968, https://doi.org/10.5194/egusphere-egu26-4968, 2026.

EGU26-5957 | ECS | Orals | CL4.4

Amplified future drying of tropical land constrained by physical theory 

Andrew Chingos, Graeme MacGilchrist, and Michael Byrne

Near-surface relative humidity (RH) over land is a key mediator of land-atmosphere interactions, influencing surface energy partitioning, evapotranspiration, wildfire risk, and both temperature and precipitation extremes. Despite its central role in regulating land climate, the response of land RH to climate change remains highly uncertain, with climate models projecting a wide range of historical and future trends. Notably, many models struggle to reproduce the observed decline in land RH over the recent warming period, raising concerns about their representation of land climate processes and future projections. 

Here we develop a simple physical theory to constrain changes in land RH, grounded in an ocean-influence perspective on boundary layer moisture over land. The theory links fractional changes in tropical land RH to the land–ocean warming contrast. As land warms more rapidly than the ocean, the increase in the water-holding capacity of land air outpaces the supply of moisture imported from oceanic regions, leading to a systematic decline in land RH. This mechanism highlights how large-scale land-atmosphere interactions can be regulated by ocean-driven constraints on land boundary layer moisture. 

The theory explains much of the inter-model spread in historical tropical land RH trends, as well as the drying evident in reanalysis data. Combining the theory with observational estimates of the radiatively forced land–ocean warming contrast, we obtain constrained projections of future tropical land RH change (-6.4 %/K and -4.4 %/K) which indicate substantially stronger drying compared to the unconstrained projections (-1.5 %/K). This emergent constraint highlights a systematic underestimation of future land drying by climate models and its physical basis, with important implications for land-climate impacts in a warming world. 

How to cite: Chingos, A., MacGilchrist, G., and Byrne, M.: Amplified future drying of tropical land constrained by physical theory, EGU General Assembly 2026, Vienna, Austria, 3–8 May 2026, EGU26-5957, https://doi.org/10.5194/egusphere-egu26-5957, 2026.

EGU26-5979 | Posters on site | CL4.4

Impacts of Rural-Urban Surface Heterogeneity on Precipitation Events in the Central Great Plains 

Liang Chen, Ifeanyi Achugbu, and Rezaul Mahmood

In the U.S. Central Great Plains, intensive agriculture is not the only human activity that has modified the natural landscape and subsequently influenced the atmosphere. With rapid urban population growth, major cities in this region have undergone significant expansion over the past few decades. Urban surfaces interact with the lower atmosphere by altering radiative and turbulent fluxes due to their unique thermal and radiative properties, thereby affecting the urban boundary layer and precipitation processes. However, the collective influence of urbanization and surrounding irrigation on regional weather and climate remains poorly understood. In this study, we investigate the impacts of irrigation and urbanization on precipitation processes over the Central Great Plains, focusing on selected precipitation events near Omaha, Nebraska, which is the largest city in the state and one that lies adjacent to extensively irrigated agricultural regions to the west. The Weather Research and Forecasting (WRF) model is used to conduct sensitivity experiments for more than 20 summer precipitation events, when irrigation is most active, and land-atmosphere coupling is strongest. Results show that upwind irrigation significantly enhances precipitation intensity, while urbanization primarily affects the spatial distribution of precipitation. The magnitude of these impacts varies with synoptic conditions across events. Additionally, land-surface influences on the thermodynamic environment before and during storms highlight the role of rural-urban heterogeneity in shaping precipitation extremes in this region.

How to cite: Chen, L., Achugbu, I., and Mahmood, R.: Impacts of Rural-Urban Surface Heterogeneity on Precipitation Events in the Central Great Plains, EGU General Assembly 2026, Vienna, Austria, 3–8 May 2026, EGU26-5979, https://doi.org/10.5194/egusphere-egu26-5979, 2026.

Heatwaves are becoming more frequent and intense worldwide under ongoing climate warming, posing substantial risks to the terrestrial ecosystem carbon sink. Although heatwave impacts on gross primary productivity (GPP) and ecosystem respiration (ER) have been widely investigated, their causal interactions remain poorly understood, particularly the physiological and biochemical mechanisms underlying these responses. Here, we combine near-surface air temperature from the ERA5-Land reanalysis with long-term carbon flux estimates from FLUXCOM-X to investigate ecosystem carbon responses to heatwaves across biome-diverse sites globally. We identify bidirectional causal relationships between GPP and ER using convergent cross mapping and apply multivariate causal inference to quantify heatwave-induced changes in ecosystem physiological and biochemical traits. Results suggest that the bidirectional causal coupling between GPP and ER is significantly strengthened during heatwaves but weakens during the post-heatwave recovery, indicating a transient reorganization of ecosystem carbon dynamics as a legacy effect of heatwaves. Correspondingly, net ecosystem productivity (NEP) typically declines during heatwaves, reflecting a widespread transient loss of carbon sink strength, driven by a disproportionately stronger increase in ER relative to GPP. Our findings illustrate the vulnerability of the land carbon sink to heatwaves consistent with previous studies, while explicitly unravelling the causal processes that govern ecosystem carbon responses and recovery. These results provide important insights for the management of the global carbon budget and for advancing the representation of terrestrial processes in land surface models.

How to cite: Ping, J., Lee, S.-C., and Li, W.: Asymmetric causal coupling between ecosystem photosynthesis and respiration underlies ecosystem carbon sink losses during heatwaves, EGU General Assembly 2026, Vienna, Austria, 3–8 May 2026, EGU26-6000, https://doi.org/10.5194/egusphere-egu26-6000, 2026.

EGU26-7376 | Orals | CL4.4

The underestimated thirst: detectability of atmospheric water vapor uptake in ecosystem measurements and global models 

Sinikka J. Paulus, Mirco Migliavacca, Anke Hildebrandt, Rene Orth, Sung-Ching Lee, Arnaud Carrara, Markus Reichstein, Yijian Zeng, and Jacob A. Nelson

In this contribution, we aim at assessing the detectability of atmospheric water vapor uptake by dry soils at a variety of spatial scales and methodologies, from the ecosystem scale via eddy covariance, through larger scales via earth system models, and gridded products. 

Water vapor fluxes in the soil and at the soil-atmosphere interface are driven by vapor concentration gradients. Until today, it is mostly assumed that the soil pore air is roughly at 100% relative humidity (RH), resulting in vapor fluxes that are almost always towards the atmosphere. However, the vapor state in soil pore air is linked to the soil water (matric) potential. As the water potential becomes more negative, the equilibrium RH within the soil decreases substantially. Under these conditions, the soil behaves like a ‘thirsty material’: when the atmospheric vapor pressure exceeds that of the soil pores, vapor is adsorbed onto the solid soil particle surfaces, and the net vapor flux is directed towards the soil. 

Using subdaily measurement data from a globally distributed network of eddy covariance stations, we show an emergent functional relationship between volumetric water content (VWC), RH, and latent heat (λE) flux direction at the ecosystem scale. Vapor fluxes towards the soil under dry conditions can be explained by the soil's sorptive forces inducing very low water potentials. Based on eddy covariance data, we find that soil vapor adsorption most frequently occurred in arid and semi-arid regions, particularly in ecosystems with sparse vegetation such as savannas and dry shrublands. On average, soil vapor adsorption occurs for 4 ± 1.1 hours per night, and may last up to 7 hours and on more than 150 nights per year in some drylands.

Furthermore, we demonstrate that the relationship between VWC, RH, and the vapor flux direction is evident in a wide range of in situ measurements in drylands, including lysimeter and humidity profile data. However, this relationship is absent in site-level runs of gridded observation-based data products and land surface models.

We demonstrate for the first time that the effect of adsorptive forces can be detected at the ecosystem scale, several meters above the ground. Our findings at the operating scale of flux towers can be used to evaluate and improve model representation of land-atmosphere exchange in dry conditions. Additionally, the results highlight the influence of sorptive forces on sub-daily soil-atmosphere interactions, particularly in sparsely vegetated drylands.

How to cite: Paulus, S. J., Migliavacca, M., Hildebrandt, A., Orth, R., Lee, S.-C., Carrara, A., Reichstein, M., Zeng, Y., and Nelson, J. A.: The underestimated thirst: detectability of atmospheric water vapor uptake in ecosystem measurements and global models, EGU General Assembly 2026, Vienna, Austria, 3–8 May 2026, EGU26-7376, https://doi.org/10.5194/egusphere-egu26-7376, 2026.

EGU26-7512 | ECS | Posters on site | CL4.4

Climate Warming Favors the Early Emergence of Rapid Flash Drought 

Phynodocle Vecchia Ravinandrasana, Christian Franzke, and Christoph Raible

Global warming is expected to increase the likelihood of the rapid onset of drought development. Yet the timescale and region of the emergence and disappearance of the anthropogenic flash drought remain poorly constrained. Here, we assess the time of emergence and disappearance of soil-moisture-based flash drought across five onset timescales using a large ensemble of climate simulations. Anthropogenic influence is quantified through the Signal-to-Noise Ratio, defined as the forced response relative to internal climate variability. Rapid-onset FDs of 1 and 2 pentads onset timescale emerge earliest, in the mid-20th century, and expand over increasing land areas by the late century under SSP3-7.0. In contrast, moderate- to slow-onset FD, 3 to 5 pentads onset timescale emerge later in more spatially confined regions and disappear by 2100. The Time of disappearance patterns show broader regional variability, especially for slow-onset flash drought. Globally, median ToE occurs in the 2020s for rapid-onset flash drought and in later decades for longer-onset events, while disappearance occurs between the 2000s and 2050s, depending on onset timescales. Both emergence and disappearance exhibit strong regional variability and occur earlier under higher forcing. Mechanistically, Flash drought onset is governed by region-specific land–atmosphere processes, driven either by short-term precipitation deficits or rapid increases in evaporative demand. These results indicate an increasing tendency toward rapid, climate-driven flash drought emergence, emphasizing the need for region-specific early-warning strategies.

How to cite: Ravinandrasana, P. V., Franzke, C., and Raible, C.: Climate Warming Favors the Early Emergence of Rapid Flash Drought, EGU General Assembly 2026, Vienna, Austria, 3–8 May 2026, EGU26-7512, https://doi.org/10.5194/egusphere-egu26-7512, 2026.

EGU26-8187 | ECS | Posters on site | CL4.4

How stomatal function shapes evapotranspiration in a rising CO2 world 

Amy X. Liu, Abigail L.S. Swann, and Gabriel J. Kooperman

Evapotranspiration (ET) is a key process in the land water cycle, with plant transpiration accounting for ~60% of land ET. Transpiration is regulated through both stomatal functioning and total leaf area. Stomata control the diffusion of water vapor from leaves to the atmosphere, while leaf area determines the total surface over which transpiration occurs. Both processes are expected to change under elevated CO2 (eCO2), with increased CO2 availability allowing plants to optimize carbon gain to water loss by closing their stomata and decreasing transpiration per leaf. At the same time, CO2 fertilization increases leaf area, which can contribute to increasing total transpiration, as well as increasing rain water interception and reevaporation. The combined influence of these opposite physiological responses creates uncertainty in the total plant-driven ET response to eCO2. Observations also reveal a range of stomatal function across and within plant types in varying environments, much of which is not represented in Earth system models, contributing to uncertainty in the magnitude of stomatal closure under eCO2 and its impact on future ET. We quantify how uncertainty in stomatal functioning propagates into ET responses under eCO2 using Community Earth System Model (CESM2) simulations, where we perturb stomatal function across the observed range for each plant type at preindustrial and doubled preindustrial CO2. We also compare ET responses driven by stomatal uncertainty with those from leaf area growth and identify regions where ET is most sensitive to stomatal function assumptions. The total plant-driven ET response to eCO2 is a combination of the opposing contributions from stomatal closure and leaf area growth. Of the two contributors, leaf area growth tends to have a larger ET response to eCO2 compared with stomatal closure in CESM2. However, we find that stomatal uncertainty drives ET changes of comparable magnitude to the total combined plant-driven ET response to eCO2. Further, about 32% of land has greater ET sensitivity to stomatal uncertainty than the ET response to eCO2 driven leaf area growth. This occurs particularly in wet regions where stomata can strongly regulate transpiration yet remain sensitive to water availability. These results improve understanding of how uncertainty in plant physiological processes propagates into future water cycle responses and climate projections, and identify where uncertainties may be most influential.

How to cite: Liu, A. X., Swann, A. L. S., and Kooperman, G. J.: How stomatal function shapes evapotranspiration in a rising CO2 world, EGU General Assembly 2026, Vienna, Austria, 3–8 May 2026, EGU26-8187, https://doi.org/10.5194/egusphere-egu26-8187, 2026.

EGU26-8398 | ECS | Orals | CL4.4

Land-atmosphere Teleconnections Between Spring Soil Moisture and Summertime Climate 

Lily Zhang and David Battisti

Year-to-year variability in summertime temperature has a large impact on drought, wildfire, and extreme heat across the Western United States. A recent study showed that warmer-than-average summertime temperatures in the Western US are often preceded by drier-than-average springtime soil moisture over the Southwest US. To examine the possibility that land-atmosphere coupling modulates summertime temperature variability over this region, we perform an ensemble of soil moisture depletion experiments within the Community Earth System Model (CESM2) and find that reducing March surface soil moisture over the Southwest US causes positive May-June temperature anomalies throughout the Western US and precipitation anomalies in the Northwest that are consistent with observations. In our experiments, daytime diabatic heating over anomalously dry land surfaces in early spring excites circulation anomalies that evolve into a hemispheric-scale pattern similar to that observed following anomalously dry springtime in the Southwest US. We show that the subsequent late spring and early summer circulation anomalies are associated with large-scale reductions in atmospheric moisture and cloudiness that contribute to the near-surface warming. Our results suggest that spring soil moisture variations are a source of seasonal predictability for summertime climate extremes, through their non-local impact on summertime temperature variability over the Western US.

How to cite: Zhang, L. and Battisti, D.: Land-atmosphere Teleconnections Between Spring Soil Moisture and Summertime Climate, EGU General Assembly 2026, Vienna, Austria, 3–8 May 2026, EGU26-8398, https://doi.org/10.5194/egusphere-egu26-8398, 2026.

EGU26-8485 | ECS | Orals | CL4.4

Has agricultural irrigation masked intense warming in the central United States? 

Sofia Menemenlis, Gabriel Vecchi, Stephan Fueglistaler, Wenchang Yang, and Qinlan Yang

Since the 1980s, the central United States and southern-central Canada have experienced a notable lack of high temperature extremes, with many temperature record highs from the 1930s Dust Bowl period still standing. By contrast, atmospheric general circulation models (AGCMs) forced with observed sea surface temperatures consistently simulate exceptional warming over the central US during this period. What accounts for this discrepancy between observed and simulated temperature trends? We use ensembles of coupled and atmosphere-only climate model experiments to disentangle the influences of remote sea surface temperatures and local land-atmosphere interactions on historical temperature change in the central United States. Tropical Pacific teleconnections strongly impact central US temperatures: coupled general circulation models, which cannot reproduce observed trends in the tropical Pacific SST gradient, produce a moderate central US warming trend that is closer to observations than AGCMs prescribed with observed SSTs. Comparing seasonal latent and sensible heat fluxes in these experiments, we describe the central role of turbulent exchanges at the land surface on temperature trends. In a heavily irrigated area whose climate is known to be sensitive to changes in soil moisture, our results point to a possible role for agricultural irrigation in alleviating historical heat extremes, and in explaining the large difference between models and observations. We highlight the importance of understanding model-data discrepancies in tropical SST patterns and local land temperatures for predicting future climate extremes in the central US. 

How to cite: Menemenlis, S., Vecchi, G., Fueglistaler, S., Yang, W., and Yang, Q.: Has agricultural irrigation masked intense warming in the central United States?, EGU General Assembly 2026, Vienna, Austria, 3–8 May 2026, EGU26-8485, https://doi.org/10.5194/egusphere-egu26-8485, 2026.

EGU26-8630 | ECS | Posters on site | CL4.4

Identifying the Restructuring of Forced Responses and Internal Variability in Soil Moisture–Precipitation Coupling Mechanisms 

Mengxue Zhang, Feini Huang, Andrei Gavrilov, Nathan Mankovich, Miguel-Ángel Fernández-Torres, and Gustau Camps-Valls

The spatiotemporal coupling between soil moisture and precipitation is a fundamental pillar of the global hydrological cycle. With the escalating risk of severe droughts and pluvial extremes, a critical question arises: whether observed variations in soil moisture and precipitation coupling are the result of anthropogenic Forced Response (FR) or Internal Variability (IV). While recent benchmarks, such as the Forced Component Estimation Statistical Method Intercomparison Project, have advanced the estimation of forced components from observational data, a significant gap remains: how to leverage these diagnostic tools to elucidate the non-stationary and non-linear interactions across the full moisture spectrum.

This study introduces a statistical attribution framework that reconciles stationary and non-stationary coupling regimes, allowing for a more robust characterization of shifting climate dynamics. We extend the analysis of direct impacts—where FR and IV drivers linearly alter coupled variables—to the assessment of indirect impacts, where drivers exert non-linear influence on mediating variables, which modulate the dynamic sensitivity and strength of the coupling mechanisms. By decoupling these pathways, we move beyond the simple attribution of trends in moisture states; instead, we identify how anthropogenic forcing and internal variability are fundamentally restructuring the feedback mechanisms of the hydrological cycle.

How to cite: Zhang, M., Huang, F., Gavrilov, A., Mankovich, N., Fernández-Torres, M.-Á., and Camps-Valls, G.: Identifying the Restructuring of Forced Responses and Internal Variability in Soil Moisture–Precipitation Coupling Mechanisms, EGU General Assembly 2026, Vienna, Austria, 3–8 May 2026, EGU26-8630, https://doi.org/10.5194/egusphere-egu26-8630, 2026.

EGU26-8794 | ECS | Posters on site | CL4.4

Hydro-thermal heterogeneity contributes to the asymmetry of vegetation sensitivity to precipitation across northern mid-latitudes 

Taohui Li, Peng Zi, Wenxiang Zhang, and Ruowen Yang

A notable ecological phenomenon in northern terrestrial ecosystems, known as "the asymmetric response of vegetation to precipitation", has emerged over the past 20-plus years. However, it remains uncertain whether the response of northern terrestrial ecosystems to driving factors are temporally synchronous or has exhibit heterogeneity, and whether these impacts have been quantitatively evaluated. Here, we analyze the spatio-temporal patterns of vegetation sensitivity to precipitation (Sppt) across the NTML from 2001 to 2023, using two independent proxies of vegetation productivity–gross primary productivity (GPP) and solar-induced chlorophyll fluorescence (SIF). We confirm a pronounced asymmetry in Sppt trends between Eurasia and North America. Sppt increased significantly across Eurasia (GPP: +3.2×10⁻³ g·C·m-2·mm-1·yr-1) but decreased in North America (GPP: -3.8×10⁻³ g·C·m-2·mm-1·yr-1). Moisture budget diagnostics reveal asymmetric roles of zonal moisture transport in shaping precipitation trends over the two regions. This asymmetry is primarily driven by changes in hydro-thermal heterogeneity, which collectively modulate moisture availability and plant physiological processes. Crucially, further results from machine learning attribution analysis indicate that diurnal temperature range dominates Sppt changes across more than 23.5% of Eurasia, while precipitation is the key driver over 22.5% of North America. Our findings highlight the critical role of hydro-thermal heterogeneity in regulating vegetation–climate feedback and underscore the necessity of incorporate regional asymmetries into future Earth system models.

How to cite: Li, T., Zi, P., Zhang, W., and Yang, R.: Hydro-thermal heterogeneity contributes to the asymmetry of vegetation sensitivity to precipitation across northern mid-latitudes, EGU General Assembly 2026, Vienna, Austria, 3–8 May 2026, EGU26-8794, https://doi.org/10.5194/egusphere-egu26-8794, 2026.

Irrigation represents one of the most critical human interventions on the coupled water and energy cycles, driving substantial climate impacts via modifying surface energy balance and biogeochemical process. As irrigated farmland continues to expand, understanding the climate impact of extensive irrigation becomes increasingly important. Yet, the effect of irrigation on rainfall patterns, particularly extreme rainfall, at global scale remains poorly unclear. Here, using the “space-for-time” approach and global satellite precipitation datasets, we show that extreme rainfall events occur more often over irrigated lands than in surrounding rainfed areas. This signal is more pronounced in regions with more extensive irrigation, warmer temperatures, and higher precipitation. Our results improve mechanistic understanding of irrigation-precipitation interactions, which remain uncertain in climate and weather forecasting models.

How to cite: Liu, Y. and Li, Y.: Observational evidence of increased extreme rainfall due to irrigation practice, EGU General Assembly 2026, Vienna, Austria, 3–8 May 2026, EGU26-8906, https://doi.org/10.5194/egusphere-egu26-8906, 2026.

EGU26-10059 | Posters on site | CL4.4

Impacts of insect-driven tree mortality on land-surface water and energy exchanges 

João Luiz Martins Basso, Francisco José Cuesta-Valero, Johannes Quaas, and Ana Bastos

Insect-driven forest disturbances are important contributors to tree mortality and biomass losses in temperate and boreal regions. With the rising temperatures and shifting precipitation patterns, insect induced tree mortality is expected to increase in many regions. Insect outbreaks not only influence tree cover and carbon stocks, but , through their impact on tree functioning, also influence land-atmosphere exchanges of water and energy, which in turn can impact atmospheric properties. While insect outbreaks can impact very large regions, most observational studies focus on small regions and individual events.


Here, we aim to provide an observation-based regional synthesis of the impact of insect-driven tree mortality on land-atmosphere water and energy exchanges, focusing on western USA. For this, we analyse satellite-based data (MODIS) on evapotranspiration (ET), albedo, land-surface temperature (LST) and snow cover for insect-affected regions between 2001-2022. Preliminary results indicate an increase in summer LST in areas affected by more severe insect-driven tree mortality, along with a decrease in ET, compared to the years before the mortality events. These differences can be partly explained by reduced snow cover in winter, which contributes to decreased winter albedo in insect-affected areas. These effects are not only limited to the outbreak event, but also show persistent trends in the subsequent years.

How to cite: Martins Basso, J. L., Cuesta-Valero, F. J., Quaas, J., and Bastos, A.: Impacts of insect-driven tree mortality on land-surface water and energy exchanges, EGU General Assembly 2026, Vienna, Austria, 3–8 May 2026, EGU26-10059, https://doi.org/10.5194/egusphere-egu26-10059, 2026.

EGU26-10354 | ECS | Orals | CL4.4

Inter-annually varying vegetation improves seasonal forecasts of near-surface temperature in East Africa 

Daria Gangardt, Bethan Harris, Joshua Talib, Christopher Taylor, and Sonja Folwell

  Interactions between vegetation and the overlying atmosphere, mediated by changes in surface moisture availability and energy flux partitioning, exert significant influence on near-surface temperature and other atmospheric variables. At seasonal timescales, these vegetation-atmosphere interactions have the potential to enhance forecast predictability. However, current operational seasonal forecast systems, such as ECMWF’s SEAS5, prescribe vegetation to a fixed climatological state. This does not fully capture vegetation-atmosphere interactions and thus the potential predictability is not fully exploited. In this presentation, we investigate the atmospheric response to prescribing inter-annually varying Leaf Area Index (LAI) in seasonal hindcasts and assess its effect on seasonal forecast skill.  This work focuses on Africa, where seasonal forecasts are crucial for agricultural planning and extreme weather preparedness.

  A series of seasonal hindcasts run for the period 1993-2019 using ECMWF’s coupled Integrated Forecasting System are used. We compare two experiments – a control experiment, which uses climatological LAI and a non-varying land cover map, and an experiment which implements a dataset of inter-annually varying LAI and land cover maps produced by merging multiple satellite products. In general, prescribing inter-annually varying LAI increases African near-surface air temperatures by up to 0.2K compared to a fixed climatological LAI across Africa. To evaluate temperature changes associated with LAI variations, we perform a Seasonal-reliant Empirical Orthogonal Function analysis (see Wang and An, 2005) on the driving LAI dataset. We find a mode of variation that is correlated with the Indian Ocean Dipole (IOD) index for the September-November-December season (correlation coefficient of ~0.75); thus, we view this mode of LAI variation as the vegetation response to increased East African rainfall during active IOD events. Results show a consistent near-surface temperature response across East Africa when inter-annually varying LAI is prescribed. The temperature response is shown to be consistent with simulated changes in the surface energy balance. Forecast skill of temperature, measured as bias compared to ERA5 values, is shown to be improved when vegetation varies inter-annually. Improvements in bias are largest following extreme IOD events and for areas where the control hindcasts’ bias is largest, with a maximum in temperature bias reduction of 0.6K and an average bias reduction of 0.2K. Thus, we find that increased complexity in vegetation representation in seasonal forecasts leads to improvements in forecasted temperature through better representation of land-atmosphere interactions influenced by the IOD.

How to cite: Gangardt, D., Harris, B., Talib, J., Taylor, C., and Folwell, S.: Inter-annually varying vegetation improves seasonal forecasts of near-surface temperature in East Africa, EGU General Assembly 2026, Vienna, Austria, 3–8 May 2026, EGU26-10354, https://doi.org/10.5194/egusphere-egu26-10354, 2026.

Land surface conditions are known to strongly influence the intensity and frequency of heatwaves; however, their role in governing the temporal evolution and spatial propagation of heatwaves remains insufficiently explored. This study investigates the impact of land surface conditions on the temporal evolution and spatial propagation of pre-monsoon heatwaves in northwest and central India. Analysis of surface energy budget components during heatwave events reveals two dominant patterns of land surface flux evolution. In northwest India, the development of heatwaves is typically associated with weak near-surface winds that promote localized heat buildup. This phase is often followed by a strengthening of winds, which enhances sensible heat fluxes and facilitates horizontal heat transport. The resulting advection of warm air from the upwind northwest region plays a crucial role in triggering heatwave conditions over downwind areas of northern and central India. We further find that the downwind propagation of heatwaves is strongly dependent on the initial land surface temperature in the upwind region. Elevated land surface temperatures in northwest India induce anomalously low surface pressures, resulting in intensified wind speeds that enhance heat transport. As a result, heatwaves having high initial land surface conditions propagate more rapidly and are more likely to extend into central India. These results highlight the predictive potential of upwind land surface temperatures for the occurrence of heatwaves in downwind regions.

How to cite: Dar, J. A. and Apurv, T.: Understanding the influence of land surface conditions on the temporal evolution and spatial propagation of heatwaves in India, EGU General Assembly 2026, Vienna, Austria, 3–8 May 2026, EGU26-10671, https://doi.org/10.5194/egusphere-egu26-10671, 2026.

EGU26-10824 | Posters on site | CL4.4

Enhanced Representation of Landscape Heterogeneities in ICON-LAND: Implications for Hydrology and Carbon Processes 

Tobias Stacke, Philipp de Vrese, Veronika Gayler, Helena Bergstedt, Clemens von Baeckmann, Thomas Kleinen, and Victor Brovkin

Carbon fluxes play an important role in the Earth System, influencing climate, vegetation dynamics, and biogeochemical cycles. Accurately simulating these fluxes using Earth System Models is essential to understand and predict future climate change. However, these simulations depend on often poorly represented characteristics like small-scale landscape heterogeneities as well as small-scale variations in surface hydrology and temperature, which can impact carbon processes.

In this study, we analyze simulations performed with the ICON climate model, focusing on recent enhancements to its land surface component, ICON-Land. The modifications aim for a better represention of  small-scale heterogeneities by introducing distinct tiles within each grid cell that represent local states of moisture and temperature and can exchange water and heat fluxes between each other. The characteristics of these tiles are derived from high resolution topographical data. These improvements are expected to capture soil moisture and temperature dynamics - which are key drivers of carbon processes - in a more realistic way.

Our preliminary results, which are derived from simulations with prescribed atmospheric forcing, indicate that the improved representation of landscape heterogeneities in ICON-Land affects its hydrology and carbon processes. Specifically, we see an increase in soil moisture and evapotranspiration as well as Gross Primary Productivity and soil respiration in our simulations. These changes demonstrate that the improved model has a significant effect on interactions between the land surface and the atmosphere, and thereby might affect the global carbon cycle.

This study highlights the importance of representing small-scale landscape features in climate models and demonstrates the potential of the enhanced ICON-Land model to improve the simulation of carbon processes. Further analysis is underway to comprehensively assess the impacts of these modifications on the global carbon budget and fully-coupled climate projections.

How to cite: Stacke, T., de Vrese, P., Gayler, V., Bergstedt, H., von Baeckmann, C., Kleinen, T., and Brovkin, V.: Enhanced Representation of Landscape Heterogeneities in ICON-LAND: Implications for Hydrology and Carbon Processes, EGU General Assembly 2026, Vienna, Austria, 3–8 May 2026, EGU26-10824, https://doi.org/10.5194/egusphere-egu26-10824, 2026.

EGU26-12254 | ECS | Posters on site | CL4.4

Regional perspective of terrestrial carbon dioxide removal on land-atmosphere coupling and heat extremes 

Shraddha Gupta, Yiannis Moustakis, Felix Havermann, and Julia Pongratz

Terrestrial carbon dioxide removal (CDR), including afforestation and reforestation (A/R) and other land-based approaches, is a key element of climate mitigation pathways consistent with the Paris Agreement. While the mitigation potential and Earth system responses to terrestrial CDR deployment have been increasingly explored, its influence on land–atmosphere coupling and temperature extremes remains underexplored, particularly at regional scales. Understanding these processes is essential for evaluating both synergies and trade-offs associated with land-based mitigation strategies, including potential implications for biogeophysical co-benefits, resilience, and permanence.

Here, we present a spatio-temporal explicit analysis of how terrestrial CDR pathways modify land–atmosphere coupling and associated hot extremes across regions and seasons. The analysis is based on emission-driven simulations from the fully coupled MPI Earth System Model and considers a range of future scenarios that include both stylized large-scale terrestrial CDR deployment and more realistic mitigation pathways developed within CDRSynTra, LAMACLIMA, and RESCUE projects. This scenario diversity allows us to explore the robustness, plausibility, and potential non-linearities of land–atmosphere responses to terrestrial CDR. The scenarios considered include large-scale A/R aligned with national pledges, transformation pathways characterized by global sustainability and global inequality, and climate stabilization pathways with and without temperature overshoot that rely on portfolios of multiple CDR approaches. 

We apply various land–atmosphere coupling diagnostics, such as measures of soil-moisture control on latent and sensible heat fluxes, and relate these to hot-day and heatwave metrics over land to assess the processes linking surface fluxes, moisture availability, and temperature extremes. By explicitly focusing on regional responses, the analysis captures spatial heterogeneity in land–atmosphere feedbacks that is not apparent in global-mean assessments. Seasonal variability (e.g., during spring and summer) and different future time horizons (near-, mid-, and late-century; before and after overshoot), are considered to assess the sensitivity of land–atmosphere coupling processes to the timing and magnitude of the application of terrestrial CDR. 

Identifying regions where terrestrial CDR strongly modifies land–atmosphere coupling and heat extremes can help highlight hotspots for targeted monitoring and evaluation by indicating where observations and diagnostics are most relevant for tracking biophysical responses and emerging risks. Analyses indicate that regions such as Scandinavia, West Asia, and Northeast China exhibit contrasting responses, where changes in heat extremes coincide with shifts in soil-moisture control and evaporative cooling, and where observational coverage of surface fluxes remains limited. Such regional insights can also inform the assessment of where terrestrial CDR deployment may be associated with co-benefits, and where land–atmosphere feedbacks could pose challenges or limitations, including adaptation-relevant impacts on heat stress and labor productivity. Overall, this work helps fill a key gap in current assessments by explicitly linking terrestrial CDR deployment to land–atmosphere coupling and heat extremes at regional scales, and by providing a process-based assessment framework that can support risk-aware evaluation of land-based CDR strategies and be extended to other terrestrial CDR approaches.

How to cite: Gupta, S., Moustakis, Y., Havermann, F., and Pongratz, J.: Regional perspective of terrestrial carbon dioxide removal on land-atmosphere coupling and heat extremes, EGU General Assembly 2026, Vienna, Austria, 3–8 May 2026, EGU26-12254, https://doi.org/10.5194/egusphere-egu26-12254, 2026.

EGU26-12361 | ECS | Orals | CL4.4

Causal disentangling of soil moisture and temperature feedbacks on surface climate extremes under vegetation change 

Feini Huang, Gustau Camps-Valls, Alexander Winkler, Christian Reimers, Nuno Carvalhais, and Andrei Gavrilov

Land-atmosphere interactions are key drivers of climate extremes, mediating the influence of soil moisture, vegetation, and surface energy exchanges on droughts, heatwaves, and compound events. Observed vegetation changes such as climate-induced tree mortality, phenological shifts, and large-scale deforestation can substantially alter these interactions by modifying surface energy and water fluxes. A critical challenge is to understand how soil water-energy feedbacks propagate through the atmosphere, which is essential for both predicting extremes and evaluating Earth System Models (ESMs).

To address this, we propose a unified causal and explainable framework to disentangle soil water-energy feedbacks from observational data, creating a benchmark for ESM evaluation. First, we construct machine learning emulators to represent the dynamical responses of land and atmosphere modules to external forcings, consistent with a structural causal model (SCM). These emulators act as efficient, process-aware surrogates, enabling the reconstruction of causal pathways (e.g., soil moisture/temperature → near-surface states) in a computationally tractable way. Using do-calculus combined with explainable AI (XAI), we then estimate the causal coupling strengths of water-energy feedbacks, isolating the direct effects of soil states from confounding atmospheric influences. By comparing these causal estimates against observational constraints, we can evaluate and benchmark ESM representations, revealing structural biases, deficiencies, and uncertainties in simulated pathways.

Bridging causal inference, machine learning, and observations, our framework provides a robust tool for process-level diagnosis, model benchmarking, and ultimately improving the physical fidelity of complex ESMs. It advances the mechanistic understanding of how land states drive atmospheric extremes, offering actionable insights for predicting droughts and heatwaves under current and future climates.

How to cite: Huang, F., Camps-Valls, G., Winkler, A., Reimers, C., Carvalhais, N., and Gavrilov, A.: Causal disentangling of soil moisture and temperature feedbacks on surface climate extremes under vegetation change, EGU General Assembly 2026, Vienna, Austria, 3–8 May 2026, EGU26-12361, https://doi.org/10.5194/egusphere-egu26-12361, 2026.

EGU26-12389 | ECS | Orals | CL4.4

Revisiting Land-Atmosphere Coupling Across Spatial Scales: From Coarse to Kilometer-Scale Simulations 

Shuping Li, Daisuke Tokuda, Hsin Hsu, Ching-Hung Shih, Jie Hsu, Min-Hui Lo, and Kei Yoshimura

Soil moisture–precipitation (SM–P) coupling is a key component of land–atmosphere interactions, but its strength and sign remain highly uncertain in large-scale models. While high-resolution models that explicitly resolve convection offer a way to reduce these uncertainties, their impact on SM–P coupling is not yet fully understood. Here, we investigate global SM–P coupling across different spatial resolutions using the Nonhydrostatic Icosahedral Atmospheric Model (NICAM). We find that SM–P coupling strongly depends on model resolution. As resolution increases, precipitation becomes more localized, leading to a smaller rainy area and a more heterogeneous spatial structure of the coupling. These changes involve significant regional variations in both coupling strength and sign. At high resolution, coupling is strengthened in major land–atmosphere hotspots, driven by enhanced convection that produces higher precipitation and more active moisture exchange. Meanwhile, high-resolution simulations exhibit widespread sign reversals in SM–P coupling. These reversals are caused by the convection-driven redistribution of precipitation, where localized moisture convergence and divergence reshape the coupling relationships. Compared to FLUXNET and ERA5 data, increasing model resolution systematically reduces negative biases in SM–P coupling, bringing the simulation closer to observations. Our results show that high-resolution modeling helps reconcile simulations with observations and emphasize the importance of using high-resolution frameworks to represent land–atmosphere interactions accurately.

How to cite: Li, S., Tokuda, D., Hsu, H., Shih, C.-H., Hsu, J., Lo, M.-H., and Yoshimura, K.: Revisiting Land-Atmosphere Coupling Across Spatial Scales: From Coarse to Kilometer-Scale Simulations, EGU General Assembly 2026, Vienna, Austria, 3–8 May 2026, EGU26-12389, https://doi.org/10.5194/egusphere-egu26-12389, 2026.

EGU26-13031 | ECS | Orals | CL4.4

Amplification of soil moisture seasonality and compound warm–dry conditions over the Mediterranean under future climate scenarios 

Daniela C.A. Lima, Virgílio A. Bento, Ana Russo, and Pedro M.M. Soares

The Mediterranean region is widely recognized as a climate-change hotspot, where rising temperatures and declining precipitation are expected to intensify hydroclimatic stress. Most Mediterranean countries already experience increasing drought frequency and persistent soil moisture deficits leading to changes in terrestrial water storage. However, projected changes in the seasonal structure of soil moisture and its joint behaviour with temperature and precipitation remain insufficiently quantified.

Here, we assess future projections of soil moisture dynamics and compound warm–dry conditions across the Mediterranean using a multi-model ensemble of EURO-CORDEX regional climate simulations. We analyse daily total soil moisture, precipitation, 2-m temperature, and potential evapotranspiration for a historical baseline period (1971–2000), and three future periods (2011–2040, 2041–2070, 2071–2100) under three emission scenarios (RCP2.6, 4.5 and 8.5). Seasonal amplitude and phase changes in soil moisture are examined, and joint probability density functions are used to quantify compound warm–dry conditions and their drivers.

The projections show a clear reduction of soil moisture throughout the entire annual cycle, in response to a significant decrease in precipitation and an increase in temperature, leading to a substantial rise in potential evapotranspiration. The overall total soil moisture decreases ranges from -5% for the RCP2.6 to -20% (-10%) for the RCP8.5 (RCP4.5), with relation to the present climate. Projections reveal that for the RCP4.5 (RCP8.5) for the mid-century soil moisture deficits up to 5x (6x) are projected to occur, and for the end-of-century even 7x for the RCP8.5. Our results show a robust amplification of soil moisture seasonal amplitude across all Mediterranean sub-regions, increasing with higher greenhouse gas emissions and toward the end of the century. The largest increases are projected over the eastern Mediterranean, reflecting enhanced seasonal contrasts driven by intensified summer drying. Despite these amplitude changes, the phase of the soil moisture annual cycle remains stable across scenarios, indicating that climate change primarily intensifies existing seasonal dynamics rather than shifting their timing. Joint probability analyses show a substantial increase in the likelihood of compound warm–dry conditions, particularly under RCP4.5 and, more pronounced under RCP8.5, during mid- and late-century periods.

Overall, our findings highlight that future Mediterranean hydroclimatic risk is driven not only by mean drying but also by a pronounced intensification of soil moisture variability and compound extremes. These projections have important implications for ecosystem, water resources, and climate adaptation strategies.


This work is supported by FCT, I.P./MCTES through national funds (PIDDAC): LA/P/0068/2020 - https://doi.org/10.54499/LA/P/0068/2020, UID/50019/2025, https://doi.org /10.54499/UID/PRR/50019/2025, UID/PRR2/50019/2025. The authors would like also to acknowledge the project “Elaboração do Plano Municipal de Ação Climática de Barcelos (PMACB). This work was performed under the scope of project https://doi.org/10.54499/2022.09185.PTDC (DHEFEUS). DCAL acknowledge FCT I.P./MCTES (Fundação para a Ciência e a Tecnologia) for the FCT https://doi.org/10.54499/2022.03183.CEECIND/CP1715/CT0004.

How to cite: Lima, D. C. A., Bento, V. A., Russo, A., and Soares, P. M. M.: Amplification of soil moisture seasonality and compound warm–dry conditions over the Mediterranean under future climate scenarios, EGU General Assembly 2026, Vienna, Austria, 3–8 May 2026, EGU26-13031, https://doi.org/10.5194/egusphere-egu26-13031, 2026.

EGU26-13692 | Orals | CL4.4

An insufficient subsurface depth biases the long-term surface energy balance in Land Surface Models 

Fidel González-Rouco, Félix García-Pereira, Nagore Meabe-Yanguas, Johann Jungclaus, Stephan Lorenz, Stefan Hagemann, Carlos Yagüe, Francisco José Cuesta-Valero, Almudena García-García, and Hugo Beltrami

The land subsurface stored around 6% of the Earth’s energy imbalance in the last five decades (of around 0.5 Wm-2, equivalent to 380 ZJ), being the second contributor to the energy partitioning after the ocean (90%). Previous studies have shown that state-of-the-art Earth System Models (ESMs) remarkably underestimate the observational land heat uptake values. This underestimation stems from Land Surface Models (LSMs) within ESMs imposing too shallow zero-flux bottom boundary conditions to correctly represent the conductive propagation and land heat uptake with depth. When realistically deep boundary conditions are prescribed, land heat uptake increases by a factor of five. However, changes in ground surface temperature are negligible. The reasons for this lack of impact of the LSM depth on surface temperatures are assessed herein.

An ensemble of eight historical and RCP8.5 land-only simulations with different subsurface depths was conducted with the LSM of the Max Planck Institute for Meteorology ESM (MPI-ESM), JSBACH. Simulation-derived latent (LHF), sensible (SHF), and ground heat fluxes (GHF) were compared across simulations, and GHF was additionally evaluated against estimates from a one-dimensional heat conduction forward model. Results show that, for a global warming of 1.5 ºC with respect to 1850-1900, GHF increases from 0.04 to 0.07 Wm-2 when deepening the LSM from 10 to 22 m, saturating at around 0.12 Wm-2 when the boundary condition is placed at approximately 100 m. The increase in the incoming GHF is mainly compensated by a global decrease in the outgoing SHF, a small decrease of the LHF in wet regions, and a decrease in the surface net radiation in arid and semi-arid regions. These quantities, yet small, evidence that an insufficient LSM depth induces to an inaccurate resolution of the long-term surface energy balance, which may have implications for land-atmosphere interaction. Their accumulation over time also produces biases in the terrestrial energy partitioning.

How to cite: González-Rouco, F., García-Pereira, F., Meabe-Yanguas, N., Jungclaus, J., Lorenz, S., Hagemann, S., Yagüe, C., Cuesta-Valero, F. J., García-García, A., and Beltrami, H.: An insufficient subsurface depth biases the long-term surface energy balance in Land Surface Models, EGU General Assembly 2026, Vienna, Austria, 3–8 May 2026, EGU26-13692, https://doi.org/10.5194/egusphere-egu26-13692, 2026.

EGU26-13807 | ECS | Posters on site | CL4.4

Contribution of evaporative sources and atmospheric circulation to the spatiotemporal variability of moisture transport 

Vittorio Giordano, Arie Staal, Marta Tuninetti, Francesco Laio, and Luca Ridolfi
The coupling between land evaporation and precipitation is central to land-atmosphere interactions, yet remains one of the most poorly understood processes in the hydrological cycle. While evaporation is often viewed as having a predominantly local effect, growing evidence suggests that the land surface can significantly influence remote precipitation through atmospheric circulation and moisture transport. However, the sensitivity of precipitation to the interannual variability of its evaporative sources and atmospheric transport pathways remains largely unexplored.
 
Here, we employ the UTrack Lagrangian model driven by ERA5 reanalysis to perform a multi-annual moisture tracking analysis, identifying evaporative sources of precipitation and characterizing their variability over time. We develop statistical relationships to quantify the sensitivity of precipitation patterns to anomalies in both evaporative source strength and atmospheric moisture transport. Additionally, we investigate the correlation structure connecting evaporated moisture at the source, its transport through the atmosphere, and its contribution to precipitation at target locations.
 
Understanding the dominant factors driving moisture transport variability is crucial, as fluctuations in these pathways play a key role in the onset of droughts and extreme events and can be influenced by land uses and human activities. Furthermore, this work provides critical insights into the limitations of using climatological mean transport patterns compared to year-to-year analyses.

How to cite: Giordano, V., Staal, A., Tuninetti, M., Laio, F., and Ridolfi, L.: Contribution of evaporative sources and atmospheric circulation to the spatiotemporal variability of moisture transport, EGU General Assembly 2026, Vienna, Austria, 3–8 May 2026, EGU26-13807, https://doi.org/10.5194/egusphere-egu26-13807, 2026.

EGU26-13817 | ECS | Orals | CL4.4

Simulating Indian Monsoon Rainfall over irrigation intensive regions using updated LULC and irrigation representation in WRF model 

Prachi Khobragade, Kirthiga Murugesan, and Balaji Narasimhan

Accurate representation of land surface characteristics plays a crucial role in improving regional monsoon simulations. Recent studies demonstrate that irrigation in croplands positively influences rainfall; therefore, explicitly representing irrigated regions can lead to more accurate rainfall simulations. In this study, we employ the Weather Research and Forecasting (WRF v4.5) model to evaluate the performance of two land surface models (LSMs), Noah and Noah-MP, in simulating Southwest (SW) and Northeast (NE) monsoon rainfall over an irrigation-intensive region of India. Here, three simulations were conducted Noah, Noah-MP without irrigation, and Noah-MP with irrigation, using the National Remote Sensing Centre (NRSC) land use land cover (LULC) dataset for 2018-2019, which provides an updated representation of land cover over India. We implement the FAO irrigated fraction map, which serves as the default irrigation dataset in WRF v4.5. The model outputs were compared with the high-resolution regional reanalysis from the Indian Monsoon Data Assimilation and Analysis (IMDAA) of 12km resolution using statistical metrics such as root mean square error (RMSE) and mean bias. The results indicate that both LSMs reasonably capture the broad spatial and temporal characteristics of monsoon rainfall, albeit with varying levels of accuracy. These findings underscore the strong sensitivity of WRF rainfall simulations to both the land surface parameterization and the underlying land use representation, highlighting the importance of accurate region specific high resolution LULC data and LSMs for accurate monsoon rainfall modeling. The results demonstrate that irrigation alters land atmospheric interactions by inducing surface cooling and atmospheric moistening, which modify upper-level humidity, geopotential height, and wind patterns. These changes regulate convective activity differently across space and seasons, leading to regionally and temporally complex rainfall responses. This study provides guidance on selecting appropriate modeling schemes for irrigation-intensive, monsoon-focused simulations over the Indian region.

How to cite: Khobragade, P., Murugesan, K., and Narasimhan, B.: Simulating Indian Monsoon Rainfall over irrigation intensive regions using updated LULC and irrigation representation in WRF model, EGU General Assembly 2026, Vienna, Austria, 3–8 May 2026, EGU26-13817, https://doi.org/10.5194/egusphere-egu26-13817, 2026.

EGU26-15125 | ECS | Posters on site | CL4.4

How do land-use changes shape future extreme temperatures across Europe? 

Luana C. Santos, Rita M. Cardoso, Jorge Navarro Montesinos, Elena García Bustamante, J. Fidel González Rouco, Carlos DaCamara, and Pedro M. M. Soares

In recent decades, Europe has experienced a clear increase in the frequency and intensity of heatwaves, a trend projected to intensify under future climate change. Understanding the processes that modulate extreme heat is therefore critical. While land-use and land-cover changes (LULC) strongly affect surface energy and water exchanges, their role in shaping extreme temperatures at regional scales remains insufficiently explored, particularly under future climate scenarios.

Here, we investigate how LUC modulates extreme temperatures and heatwaves over Europe under the SSP3-7.0 scenario using high-resolution regional climate simulations performed with the Weather Research and Forecasting (WRF v4.5.1.4) model. The simulations analyzed contribute to both the EURO-CORDEX framework and the Flagship Pilot Study LUCAS (Land Use and Climate Across Scales). A standard EURO-CORDEX future experiment with fixed LULC is compared with a corresponding simulation following LUCAS Phase 2, in which LULC evolves annually, allowing the assessment of transient LULC effects under future climate conditions.

Extreme temperature days are identified using percentile-based thresholds of daily maximum temperature, and heatwaves are defined as periods of consecutive exceedances with varying durations. To enable a consistent comparison of event intensity across experiments, temperature and land-surface variables are normalized using seasonal interquartile ranges. Changes in the frequency, duration, and magnitude of extreme heat events are analyzed over Europe and across sub-regional domains.

This analysis aims to quantify the sensitivity of future extreme temperatures to LULC change and to assess the role of land-atmosphere interactions in modulating heat extremes under climate change conditions. The results will contribute to a better understanding of how land management choices may influence future extreme heat risk across Europe.


Acknowledgements

The authors wish to acknowledge the financial support from the Portuguese Fundação para a Ciência e Tecnologia (FCT, I.P./MCTES) through national funds (PIDDAC): LA/P/0068/2020 - https://doi.org/10.54499/LA/P/0068/2020, UID/50019/2025, https://doi.org/10.54499/UID/PRR/50019/2025, UID/PRR2/50019/2025.

L.C.S. and R.M.C. also acknowledge individual funding from FCT, I.P./MCTES grants https://doi.org/10.54499/UI/BD/154675/2023, and https://doi.org/10.54499/2021.01280.CEECIND/CP1650/CT0006.

How to cite: Santos, L. C., Cardoso, R. M., Navarro Montesinos, J., García Bustamante, E., González Rouco, J. F., DaCamara, C., and Soares, P. M. M.: How do land-use changes shape future extreme temperatures across Europe?, EGU General Assembly 2026, Vienna, Austria, 3–8 May 2026, EGU26-15125, https://doi.org/10.5194/egusphere-egu26-15125, 2026.

EGU26-16256 | ECS | Posters on site | CL4.4

Evaluating land-atmosphere interactions controlling precipitation over Central Africa in CESM 

Margo Cabuy, Jessica Ruijsch, Steven De Hertog, Diego Miralles, and Wim Thiery

Tropical precipitation is closely linked to the land surface through the exchange of water and energy between the surface and atmosphere, regulating boundary layer moistening and convective instability. In Central Africa, particularly the Congo Basin, the extensive rainforest contributes a substantial amount of moisture to the atmosphere through evaporation, enhancing convective activity and shaping the region’s seasonal and daily rainfall. In this study, we evaluate the ability of the Community Earth System Model (CESM) can represent these coupled land-atmosphere-convection processes and their control on precipitation across Central Africa.


CESM estimates of rainfall over the past 30 years are compared with multiple observational products (including IMERG, CHIRPS, and MSWEP) to assess whether the model reproduces the magnitude, variability, and spatial distribution of rainfall at daily and seasonal timescales. The same evaluation framework is applied to evaporation, with CESM estimates assessed against L-SAF, CERES, X-base, and GLEAM across consistent spatial and temporal scales. Beyond surface rainfall and evaporation, we analyse CESM’s column-integrated atmospheric moisture budget over the Congo Basin, including diagnostics of convective mass flux, against ERA5, to quantify the contributions of local evaporation, large-scale moisture convergence, and convective transport to precipitation. This approach allows us to identify whether CESM rainfall biases originate from misrepresented land surface fluxes, deficiencies in hydrometeorological parameterisation, or errors in large-scale moisture transport.


The analysis is conducted on both daily and seasonal timescales, to separate fast land-atmosphere coupling from slower circulation-driven controls. By combining evaluations of precipitation and evaporation with a process-oriented decomposition of moisture supply and convective response, this work assesses whether CESM can reliably represent land-driven rainfall variability, moisture recycling, and the emergence of hydroclimatic extremes in Central Africa.

How to cite: Cabuy, M., Ruijsch, J., De Hertog, S., Miralles, D., and Thiery, W.: Evaluating land-atmosphere interactions controlling precipitation over Central Africa in CESM, EGU General Assembly 2026, Vienna, Austria, 3–8 May 2026, EGU26-16256, https://doi.org/10.5194/egusphere-egu26-16256, 2026.

EGU26-17132 | ECS | Orals | CL4.4

Quantifying Land-Surface Effects on Cloud Occurrence Using Neural Networks 

Eva Pauli, Hendrik Andersen, Peer Nowack, and Jan Cermak

The aim of this study is to investigate the effect of land surface conditions on cloud occurrence by quantifying how they modulate the influence of large-scale meteorological conditions.
The land surface can modulate clouds through its influence on surface heat fluxes, local moisture availability, and surface roughness. However, quantifying these effects from observations remains challenging, as the temporal and spatial variability of cloud occurrence is large and influencing factors covary.
Here, we employ a convolutional neural network (CNN) to predict satellite-observed cloud fraction over Europe for the period 1983–2020. Cloud fraction is taken from the CM SAF Cloud Fractional Cover dataset based on Meteosat First and Second Generation observations (COMET). Predictors are derived from the ERA5 reanalysis, including ERA5-Land as well as ERA5 fields on single and pressure levels. To delineate the land surface impact on cloud occurrence predictability, we develop two model configurations: one driven solely by large-scale meteorological conditions, and a second one that additionally incorporates land surface variables. Both models achieve high predictive skill (R² > 0.8), with a slight increase in performance when land surface conditions are included. Sensitivity analyses using permutation feature importance and partial dependency indicates that cloud occurrence is primarily controlled by large-scale meteorological drivers, while soil moisture and surface sensible heat flux emerge as the most influential land surface variables.
Future work will use this framework to quantify the impact of land cover change on cloud occurrence and extend the framework beyond Europe.

How to cite: Pauli, E., Andersen, H., Nowack, P., and Cermak, J.: Quantifying Land-Surface Effects on Cloud Occurrence Using Neural Networks, EGU General Assembly 2026, Vienna, Austria, 3–8 May 2026, EGU26-17132, https://doi.org/10.5194/egusphere-egu26-17132, 2026.

EGU26-17634 | Posters on site | CL4.4

Vegetation–atmosphere feedback in the Mediterranean region from Regional Climate Model simulations: the Apulia case study 

Roberta D'Agostino, Roberto Ingrosso, Francesco Cozzoli, Gregorio Sgrigna, Enrica Nestola, Francesco Pausata, Piero Lionello, and Simona Bordoni

Over the past three decades, the Mediterranean region has experienced an increasing frequency and duration of drought events, a trend that is projected to intensify as anthropogenic emissions continue to rise. Available evidence indicates that drought conditions can trigger extensive tree mortality, amplify wildfire risk, and drive a progressive shift from Mediterranean ecosystems toward vegetation characteristic of semi-arid regions. The role of vegetation and land-use change in climate modelling is fundamental for estimating surface energy fluxes and carbon budgets. Land-use and land-cover changes (LULCCs) can alter surface energy and water fluxes, potentially leading to different responses in mean and extreme temperature and precipitation based on different representation of the vegetationApulia, in southeastern Italy, is an ideal case study, having experienced massive olive tree die-off due to Xylella fastidiosa, an invasive pathogen detected in 2008. This vegetation loss is compounded by increasing drought impacts. This case offers a unique case study to assess the consequences of extensive olive trees die-off after the spread of the pathogen/bacteria Xylella fastidiosa. In order to assess potential impacts of significant change in vegetation covers, winvestigated the effect of die-off and of massive replanting on the regional climate. The study involves two vegetation scenarios (deforestation and reforestation) performed with four sensitivity experiments at 12 km horizontal resolution with two different regional models: RegCM5 and CRCM/GEM4.8. Two experiments will serve as references for present-day (PD, 1990-2019) and future (2071-2100), while other two future experiments will be performed under both vegetation change scenarios. The percentage of plant functional types in the land component (CLM4.5) of RegCM was replaced with that used in the CRCM/GEM4.8 simulations. Preliminary results show that while temperature extremes can be exhacerbated by rewilding, increasing tree cover can help to keep soil moisturised, acting against the progressive aridification of the area. On the other hand, the deforested case leads to a decrease in daily maximum temperature, particularly in Fall and Winter and an increase in daily minimum temperature in Summer. These changes are driven by albedo feedback related to the land-use modification.

How to cite: D'Agostino, R., Ingrosso, R., Cozzoli, F., Sgrigna, G., Nestola, E., Pausata, F., Lionello, P., and Bordoni, S.: Vegetation–atmosphere feedback in the Mediterranean region from Regional Climate Model simulations: the Apulia case study, EGU General Assembly 2026, Vienna, Austria, 3–8 May 2026, EGU26-17634, https://doi.org/10.5194/egusphere-egu26-17634, 2026.

EGU26-17817 | ECS | Orals | CL4.4

Summer Land-Atmosphere Coupling over Europe: A Comparative Evaluation of Observation-based Datasets 

Monalisa Sahoo, Stefano Materia, and Markus Donat

Land–atmosphere coupling has long been recognized to modulate the surface fluxes partition in transitional evaporative regimes, where soil moisture anomalies control evapotranspiration. However, globally available in-situ observations for these variables remain limited. This study provides, for the first time, a comprehensive assessment of the similarities, dissimilarities, and limitations among observation-based datasets of surface soil moisture, evapotranspiration, potential evapotranspiration, and 2-meter mean air temperature across Europe. The analysis focuses on the IPCC-defined regions of Northern Europe, Eastern Europe, Western-Central Europe, and the Mediterranean during summer (June–August) for the recent 20-year period (2003–2022). In addition, the study evaluates and compares the representation of land–atmosphere coupling across the different datasets. The results show that most datasets exhibit strong agreement across most regions and effectively capture land–atmosphere interactions. The coupling analysis further reveals a clear north–south contrast: Northern Europe is energy-limited, where atmospheric coupling dominates, whereas the Mediterranean is water-limited, with stronger terrestrial coupling. Central and Eastern Europe show more variability within the season and across years. Overall, the findings highlight reasonable consistency among datasets in representing land–atmosphere processes, despite existing uncertainties.

Keywords: surface soil moisture, evapotranspiration, land-atmosphere coupling, summer

How to cite: Sahoo, M., Materia, S., and Donat, M.: Summer Land-Atmosphere Coupling over Europe: A Comparative Evaluation of Observation-based Datasets, EGU General Assembly 2026, Vienna, Austria, 3–8 May 2026, EGU26-17817, https://doi.org/10.5194/egusphere-egu26-17817, 2026.

EGU26-17995 | Posters on site | CL4.4

Impacts of high temperatures with varied hit timing on soil moisture drought 

Ye Zhu, Xinyu Zhang, Yi Liu, Bingwei Xu, and Linqi Zhang

High temepratures can impose different effects on soil mositure drought development depending on their hit timing. Based on the reanalysis soil moisture data, we identified the duration of soil moisture drought onset (defined as the time period for moisture to transition from a normal state to below-average condition), and designed a random forest based experimental framework to measure how rapidly soil mositure drought develops under varied high temeprature conditions in China. Results show that the duration of soil mositure drought onset would be shorten by 10-50 days under high temperatures in relative to that of annual mean temperature scenarios. With regard to the timing of high temepratures, the associated impacts were the greatest for high temperatures  of 1 month prior to soil moisture drought occurrence. In densely vegetated areas, pre-drought high temperatures played positively in accelerating the formation of soil moisture drought. In sparse vegetated areas by contrast, post-drought high temperatures contributed to the ongoing development of soil drought. The findings show the asymmetrical impacts of pre-drought and post-drought high temperatures on soil drought development, which may provide some references for improving the understanding of soil moisture drought mechanism in a warming future.

How to cite: Zhu, Y., Zhang, X., Liu, Y., Xu, B., and Zhang, L.: Impacts of high temperatures with varied hit timing on soil moisture drought, EGU General Assembly 2026, Vienna, Austria, 3–8 May 2026, EGU26-17995, https://doi.org/10.5194/egusphere-egu26-17995, 2026.

EGU26-19185 | ECS | Posters on site | CL4.4

Multivariate Climate Extremes and Their Impacts on Arctic Land–Atmosphere Carbon Exchange under Future Climate Change 

Lukas Fiedler, Armineh Barkhordarian, Victor Brovkin, and Johanna Baehr

Rapid warming of the Arctic is increasingly being linked to climate extremes such as heat waves, droughts, and wildfires, which are fundamentally altering the functioning of ecosystems, the dynamics of the carbon cycle, and the interactions between land and atmosphere in the Arctic. Increasing evidence suggests that high-latitude extreme events rarely occur in isolation but are frequently embedded within compound climate extremes. These multivariate events can strongly modify land surface states, through changes in soil moisture, vegetation structure, surface energy balance, and fire disturbance, and thereby influence carbon exchanges between the land and atmosphere. However, the extent to which compound climate extremes amplify or modulate Arctic carbon-cycle extremes in the future remains poorly constrained.

In this study, we investigate how compound climate extreme events shape the evolution of Arctic carbon-cycle extremes under future Arctic warming. Using large ensemble simulations with the Community Earth System Model version 2 (CESM2), which has demonstrated skill in representing Arctic climate processes, fire dynamics, and fire-weather interactions, we assess the evolution of extreme events in gross primary productivity, ecosystem respiration, and net ecosystem carbon balance throughout the 21st century. A multivariate statistical framework is applied to explicitly characterise compound extremes involving fire activity, heat waves, and droughts, and to qualify and quantify their combined impacts on land-atmosphere carbon flux variability in the Arctic. By linking compound climate drivers to ecosystem carbon responses, this work advances our understanding of how land surface conditions regulate extreme carbon-cycle behaviour in a rapidly changing Arctic.

How to cite: Fiedler, L., Barkhordarian, A., Brovkin, V., and Baehr, J.: Multivariate Climate Extremes and Their Impacts on Arctic Land–Atmosphere Carbon Exchange under Future Climate Change, EGU General Assembly 2026, Vienna, Austria, 3–8 May 2026, EGU26-19185, https://doi.org/10.5194/egusphere-egu26-19185, 2026.

EGU26-19261 | ECS | Orals | CL4.4

Uncertainties in land-atmosphere coupling still a big obstacle for accurate climate projections 

Almudena García-García, Francisco José Cuesta-Valero, Ana Bastos, René Orth, and Jian Peng

Terrestrial energy, water and carbon exchanges are regulated by the strength and sign of the coupling between the land surface and the atmosphere. Simulating this land-atmosphere coupling is crucial for realistic weather and climate projections and, especially, to anticipate the evolution of extreme events. After an exploration of the metrics and datasets available for studying land-atmosphere coupling at different temporal and spatial scales, we demonstrate that uncertainties in data products based on in-situ measurements, remote sensing data, and Earth System Model simulations remain large. The evaluation of model simulations according to a variety of land-atmosphere coupling metrics reveals large structural uncertainties in comparison with the small effect of internal variability on land-atmosphere coupling. We show that reducing uncertainties in available Earth Observations (EO) products for studying land-atmosphere coupling is also necessary. This could be done by collecting long-term measurements at the land surface and implementing more observational and physical constraints in the algorithms used to derive EO products. The availability of more accurate, physically consistent EO products with an accurate representation of land-atmosphere coupling will in turn help to develop the future generation of Earth System Models.

How to cite: García-García, A., Cuesta-Valero, F. J., Bastos, A., Orth, R., and Peng, J.: Uncertainties in land-atmosphere coupling still a big obstacle for accurate climate projections, EGU General Assembly 2026, Vienna, Austria, 3–8 May 2026, EGU26-19261, https://doi.org/10.5194/egusphere-egu26-19261, 2026.

EGU26-19934 | Orals | CL4.4

The Role of Land-Surface Dynamics in Climate Persistence and Convective Extremes 

Elizabeth Cultra, J s Nanditha, Jun Yin, Mark S Bartlett Jr, and Amilcare Porporato
The properties governing atmospheric convection, which can produce heavy rainfall and severe weather events, depend on both land-surface characteristics and atmospheric conditions. This work develops a stochastic, coupled plant–soil–atmosphere model that treats atmospheric drivers of moist convection, such as convective available potential energy (CAPE), as functions of the soil–vegetation surface. Further, we link trajectories of these atmospheric and surface variables, including rainfall intensity, to changes in functional plant type (i.e., response to drought stress) and soil type. This enables the realization of steady-state probability distributions of relevant ecohydrological quantities, including soil moisture, plant water potential, and CAPE. From this dynamical systems perspective, the probability of rainfall is conditioned on the terrestrial surface state. Therefore, the wet–dry switching that influences climatic persistence in convection-dominated regions can be directly related to soil moisture. This formulation provides a framework for understanding how very large CAPE and intense rainfall can emerge under specific combinations of antecedent soil moisture, land-surface fluxes, and free-atmospheric conditions.

How to cite: Cultra, E., Nanditha, J. S., Yin, J., Bartlett Jr, M. S., and Porporato, A.: The Role of Land-Surface Dynamics in Climate Persistence and Convective Extremes, EGU General Assembly 2026, Vienna, Austria, 3–8 May 2026, EGU26-19934, https://doi.org/10.5194/egusphere-egu26-19934, 2026.

Energy fluxes between the surface and the atmosphere are known contributors to the genesis and the amplification of temperature extremes: a classic example is the enhancement of land-to-atmosphere sensible heat fluxes during heatwaves over dry soils, boosting the already high surface temperatures to extreme values. Recent work on the Lagrangian analysis of temperature extremes has pinpointed that, in some specific continental regions, diabatic processes do not just act as amplifiers, but play a dominant role in the genesis of positive and negative extreme temperature anomalies. This observation suggests a distinction between world regions where extremely warm or cold air masses are locally generated by non-adiabatic processes, acting as warm or cold air "reservoirs", and other neighboring regions where such extreme air masses are exported adiabatically by the large-scale circulation.

In this work we propose a methodology to identify, in the ERA5 reanalysis data set, the surface energy balance regimes that correspond to the local generation of hot and cold air during summer and winter, respectively, and to separate them from cold/warm air advection regimes. The generation of cold air during winter is favored during clear, calm nights over continental or ice-covered regions, that leads to sustained radiative cooling. The regions where such conditions are most frequent are Siberia and the Canadian Arctic, which can be depicted as the two "boreal cold air reservoirs" of the northern hemisphere. Hot air generation during summer is more geographically spread than cold air, but occurs more frequently in subtropical areas including regions surrounding the Mediterranean Sea.

The framework is illustrated in detail through two case studies. The first is a cold air outbreak that affected eastern Asia during January 2023, which led to the new absolute negative temperature record for China. This event was preceded by particularly favorable conditions for cold air generation over northern Siberia. The second is the July 2022 heatwave, that led to temperatures exceeding 40°C over central England. In this case, a Lagrangian analysis suggests that the extremely high temperatures were related to strong diabatic heating not over the British Isles, but over the Iberian Peninsula in the days preceding the event.

How to cite: Riboldi, J. and Schnyder, F.: A framework to characterize the contribution of upstream land-atmosphere interactions to cold spells and heatwaves, EGU General Assembly 2026, Vienna, Austria, 3–8 May 2026, EGU26-20181, https://doi.org/10.5194/egusphere-egu26-20181, 2026.

EGU26-20768 | Orals | CL4.4

How do future land-use changes jointly influence summer land–atmosphere coupling and fire danger across Europe? 

Rita M. Cardoso, Luana C. Santos, Jorge Navarro, Elena García Bustamante, J. Fidel González Rouco, Carlos C. Camara, and Pedro M M Soares

Land use/land cover changes (LUC) modify local land surface properties that control the land-atmosphere mass, energy, and momentum exchanges. Through soil moisture and vegetation exchanges, land-atmosphere coupling contributes significantly to the evolution of extreme events like heat waves and forest fires. However, these interactions are still unsatisfactorily explored at regional scales under future climate scenarios.

Here, we investigate these processes using newly performed Weather Research and Forecasting (WRF v4.5.1.4) simulations under the SSP3-7.0 scenario, conducted within the EURO-CORDEX and LUCAS Phase 2 regional climate simulation ensembles. Both simulations use the LANDMATE Plant Functional Type (PFT) land cover dataset for Europe, in the first the landcover is kept constant using the 2015 map, while in the second, the land-use evolves annually according to the Land Use Harmonization dataset protocol for SSP3-7.0 scenario.

The impact of temperature–evapotranspiration coupling is assessed using a coupling metric defined as the product of normalised variables, allowing differences across regions and simulations to be examined consistently. The analysis focuses on the coupling between extreme heat (TX90p) or heat waves (defined as TX90p persisting for at least five consecutive days) and evapotranspiration (LH) or soil moisture (SMOIS), expressed through the metrics TX90p×LH and TX90p×SMOIS. Values lower than −1 indicate concurrent deficits in LH (or SMOIS), corresponding to a decoupled land–atmosphere regime. Conversely, values greater than 1 indicate strong land–atmosphere coupling.

The compound effects of extreme coupled and uncoupled events on future meteorological fire danger indices (FWI and FWIe) are analysed for both simulations, enabling a quantitative assessment of the sensitivity of future fire danger to combined climate and land-use changes.

Acknowledgements

The authors wish to acknowledge the financial support from the Portuguese Fundação para a Ciência e Tecnologia (FCT, I.P./MCTES) through national funds (PIDDAC): LA/P/0068/2020 - https://doi.org/10.54499/LA/P/0068/2020, UID/50019/2025, https://doi.org/10.54499/UID/PRR/50019/2025, UID/PRR2/50019/2025.

L.C.S. and R.M.C. also acknowledge individual funding from FCT, I.P./MCTES grants https://doi.org/10.54499/UI/BD/154675/2023, and https://doi.org/10.54499/2021.01280.CEECIND/CP1650/CT0006.

How to cite: Cardoso, R. M., Santos, L. C., Navarro, J., Bustamante, E. G., González Rouco, J. F., Camara, C. C., and Soares, P. M. M.: How do future land-use changes jointly influence summer land–atmosphere coupling and fire danger across Europe?, EGU General Assembly 2026, Vienna, Austria, 3–8 May 2026, EGU26-20768, https://doi.org/10.5194/egusphere-egu26-20768, 2026.

EGU26-20958 | Orals | CL4.4

Revisiting irrigation impacts on the North China Plain: Accounting for water resource limitations 

Hongbin Liang, Shulei Zhang, and Yongjiu Dai

Agricultural irrigation can strongly modify land–atmosphere interactions and regional climate, especially in densely irrigated areas. The North China Plain, the largest irrigated region in China, has experienced significant irrigation-driven changes in local temperature, precipitation, and extreme events. Previous studies often oversimplify irrigation by assuming constant application rates or neglecting water resource limitations, which can lead to biased estimates of irrigation-induced climate effects. To address this, we developed an enhanced irrigation module within a land surface model (Common Land Model, CoLM), coupled with the Community Regional Earth System Model (CRESM), explicitly representing irrigation demand, water availability constraints, and application methods. Using this framework, we successfully reproduced observed surface temperature, precipitation, irrigation amounts, and crop yields across the North China Plain. Our results show that accounting for water-limited irrigation reduces the overestimation of the intensity and frequency of extreme events found in simulations that ignore resource constraints. Furthermore, considering irrigation water limitations alters the simulated regional temperature and precipitation patterns, which in turn affects projections of future agricultural water demand. This study demonstrates that explicitly accounting for water–agriculture interactions is essential for accurately simulating irrigation impacts, supporting more informed strategies for sustainable water and agricultural management under climate change.

How to cite: Liang, H., Zhang, S., and Dai, Y.: Revisiting irrigation impacts on the North China Plain: Accounting for water resource limitations, EGU General Assembly 2026, Vienna, Austria, 3–8 May 2026, EGU26-20958, https://doi.org/10.5194/egusphere-egu26-20958, 2026.

Potential evapotranspiration (ETp) is a variable driven by many factors and one which is heavily affected by climate change. In many cases, the observed increase in ETp is attributed to rising air temperatures in the past and temperature is used as the main prediction variable for future developments of ETp in climate change projections.

The climate station at the lysimeter station Brandis (Saxony, Germany) has been recording a wide range of climate variables since 1980.  From the observations it is evident that, in addition to the increase in air temperature at the site, there has also been a significant increase of sunshine duration (average increase of 0,29h d⁻¹ decade⁻¹) and global radiation (average increase of 47,45 J cm⁻2 d⁻¹ decade⁻¹). This combination of higher temperature levels and increased energy availability leads to significant increases in ETP (average increase of 0,11 mm d⁻¹ decade⁻¹), which is a mayor driver of the local water balance and an important variable in describing the atmospheric demand in modeling studies. Based on the observed trend in sunshine durations we provide an analysis of the individual contributions of increases in global radiation and air temperature, to assess:

  • the individual contributions to the overall increase in potential evapotranspiration (according to Turc-Wendling)
  • the influence of global radiation and air temperature on the intra-annual course?

The individual contributions of increases in radiation and air temperature on the ETP was calculated using trend analysis over the period from 1980 to 2025. It shows that, according to the Turc-Wendling approach, 69% of the ETP increase at the site is radiation-driven, while air temperature only has an influence of 28%. Additionally, clear seasonal patterns are found in the individual contributions.  Overall, the results show that global radiation increases are a mayor driver for the increase in potential evapotranspiration at the site and future developments of potential trends in global radiation should be considered in projections of potential evapotranspiration.

How to cite: Tiedke, A. and Werisch, S.: The influence of increasing radiation (sunshine duration and global radiation) on the increase in potential evapotranspiration, EGU General Assembly 2026, Vienna, Austria, 3–8 May 2026, EGU26-21187, https://doi.org/10.5194/egusphere-egu26-21187, 2026.

EGU26-1986 | ECS | PICO | AS4.6

Aerial Pathways of Microbial Connectivity Between Waterbodies 

Vibhaw Shrivastava, Ariel Weinstock, Sarit Avrani, Shira Ninio, Oded Beja, Uri Gophna, Yohay Carmel, and Naama Lang-Yona

Microorganisms play a significant role in ecological and geochemical processes in aquatic ecosystems, which may also impact water quality and ecosystem health. Understanding the ecological dynamics and evolution of microbial populations in terrestrial water bodies is crucial for evaluating their resilience and adaptability to environmental changes driven by climate change and anthropogenic activities. This research examines inter-environmental connectivity of microorganisms across different terrestrial water bodies to elucidate potential ecosystem implications under changing climatic conditions. To study aerial transmission, connectivity, and microbial survivability, air samples were collected from different water bodies across Israel, including the Dead Sea, Lake Kinneret, and the Mediterranean Sea, using two different air sampling methods and processed using culture-dependent and independent techniques. We will present our findings on airborne microbial dispersal patterns, diversity, and abundance, focusing on aerial transport, viability, and subsequent adaptations. Additional results on bacteria-phage lysogeny in the aerosolized bacterial fraction will be presented, and implications discussed. Our results demonstrate a high presence of viable aquatic bacteria in air samples from various water bodies under different growth conditions, highlighting their adaptability and resilience to environmental changes.

Keywords: Aerial transport, microbial connectivity, climate change, aquatic environments.

How to cite: Shrivastava, V., Weinstock, A., Avrani, S., Ninio, S., Beja, O., Gophna, U., Carmel, Y., and Lang-Yona, N.: Aerial Pathways of Microbial Connectivity Between Waterbodies, EGU General Assembly 2026, Vienna, Austria, 3–8 May 2026, EGU26-1986, https://doi.org/10.5194/egusphere-egu26-1986, 2026.

EGU26-4593 | ECS | PICO | AS4.6

Environmental sensitivity and resilience of airborne bacteria and fungi with time-scale variation under stress of air pollution and snowfall 

Sujian Zhang, Ning Wang, Xiang Chen, Fengkui Duan, Yongliang Ma, Qinqin Zhang, Lidan Zhu, Jingkun Jiang, Shuxiao Wang, and Kebin He

Microbes contained in bioaerosols are a significant component of organic aerosols owing to their unique biological characteristics, which pose health risks and have undeniable meteorological effects. However, the diurnal variation and health risks of microbes in PM2.5 and their responses to atmospheric factors are not well understood. In this study, we conducted a high-time-resolution analysis of near-surface atmospheric microbial communities in PM2.5 at an urban site in Beijing, focusing on microbial composition, seasonal and diurnal distribution patterns, and feedback mechanisms of microbes to environmental factors during typical PM2.5 pollution episodes across different seasons. Additionally, the effects of snowfall on airborne microbes were investigated. This study revealed distinct seasonal and environmental dynamics in atmospheric fungal and bacterial communities. Fungi exhibit stronger seasonal sensitivity and are primarily influenced by meteorological factors, whereas bacteria display consistent temporal heterogeneity driven by fixed emission sources and environmental resilience. Niche differentiation occurred between fungi and bacteria in autumn, whereas summer bacterial communities were notably affected by ozone. Key bacterial genera are reliable biological markers of pollution. The composition of PM2.5, rather than its concentration, significantly affects microbial communities, with bacteria being more susceptible to the formation of secondary inorganic aerosols. The presence of pathogenic microbes in the atmosphere cannot be overlooked. Pathogenic microorganisms show temporal heterogeneity, with fungal pathogens being more diverse but inhibited by SO2 and OC, whereas pathogenic bacteria thrive in cleaner conditions. Snowfall does not efficiently remove airborne microbes but acts as a depositional sink for atmospheric micro-organisms. This study provides a profile of microbial communities in atmospheric aerosols during typical pollution periods and offers a new perspective for understanding the health effects associated with PM2.5 exposure.

How to cite: Zhang, S., Wang, N., Chen, X., Duan, F., Ma, Y., Zhang, Q., Zhu, L., Jiang, J., Wang, S., and He, K.: Environmental sensitivity and resilience of airborne bacteria and fungi with time-scale variation under stress of air pollution and snowfall, EGU General Assembly 2026, Vienna, Austria, 3–8 May 2026, EGU26-4593, https://doi.org/10.5194/egusphere-egu26-4593, 2026.

EGU26-7534 | ECS | PICO | AS4.6

Vertical profiling of airborne microbial communities across the atmospheric boundary layer 

Sofía Galbán, Ana Justel, Sergi González, Pablo Sanz, Manuel Bañón, Juan Antonio Higuera, Javier Méndez, Woo Young Kim, and Antonio Quesada

Aerobiological studies have traditionally focused on near-surface sampling and horizontal biogeographic patterns, while vertical microbial structuring within the atmospheric boundary layer (ABL) remains poorly characterized. This knowledge gap is largely due to logistical constraints, including limited accessibility, the need for aerial platforms, and technological challenges in collecting sufficient biomass over short sampling periods.

Here, we present an integrated approach to investigate airborne microbial communities across different levels of the ABL in a coastal Antarctic environment. Microbial samples were collected simultaneously at lower and higher atmospheric levels using aerial and ground-based platforms, and microbial community composition and abundance, as well as morphometry were analysed using metabarcoding and microscopy-based techniques. The study was conducted at a low-orography coastal site in Antarctic Peninsula, what is representative of air masses from the Southern Ocean, and supported by atmospheric observations and air-mass trajectory analyses.

Our results reveal a clear vertical differentiation in airborne microbial communities. Air sampled at higher atmospheric levels showed microbial communities with reduced diversity and distinct taxonomic signatures compared to those closer to the surface, consistent with selective processes acting during vertical transport and atmospheric residence. Samples from near-surface showed comparatively more homogeneous communities, reflecting strong mixing of local biological sources, whereas communities from higher-altitude samples exhibited greater variability among the samples, influenced by broader-scale atmospheric transport. Despite these differences, partial overlap in community composition between atmospheric layers suggests vertical connectivity within the ABL. Variations in microbial abundance and morphometric cell characteristics further support the role of atmospheric structure and stability in shaping airborne microbial assemblages.

How to cite: Galbán, S., Justel, A., González, S., Sanz, P., Bañón, M., Higuera, J. A., Méndez, J., Kim, W. Y., and Quesada, A.: Vertical profiling of airborne microbial communities across the atmospheric boundary layer, EGU General Assembly 2026, Vienna, Austria, 3–8 May 2026, EGU26-7534, https://doi.org/10.5194/egusphere-egu26-7534, 2026.

The number of aerobiological studies is increasing and whilst patterns are starting to emerge, it is also clear that the results tend to be study or site specific. This is not really surprising given the inherent complexity of the natural world and the continuously changing nature of the environment, with weather patterns, atmospheric layers, surface interactions, biogeographic distribution and temporal change all contributing to the challenge. For the Polar regions, overall complexity and environmental heterogeneity remain the greatest challenge in aerobiology having resolved detection limits, sample resolution and remote access issues. Hence, it is probably not surprising that where we look also tends to dictate what we find. Indeed, through work in both Polar regions, we have found that while there is both high heterogeneity and variability, there also might be patterns and an underlying core microbiome. However, one way to unlock this complexity further might be to focus on functional rather than taxonomic markers. In attempting such a transition, we found the underlying patterns were very different. With one eye on the forthcoming IPY in 2032-33, it might be worth considering a shift of emphasis towards specific functional marker genes and maybe develop a coordinated effort to look at a suite of such genes that could be important in the structure of the atmospheric microbiome and in atmospheric function.

How to cite: Pearce, D.: The Atmospheric Microbiome – untangling complexity in the Polar regions, EGU General Assembly 2026, Vienna, Austria, 3–8 May 2026, EGU26-8028, https://doi.org/10.5194/egusphere-egu26-8028, 2026.

EGU26-8047 | ECS | PICO | AS4.6

Temporal surveillance of Coccidioides in soils and aerosols at a single location in Arizona 

Amelia Stout, Marieke L. Ramsey, Daniel R. Kollath, Bridget M. Barker, Pierre Herckes, and Matthew Fraser

Valley fever is a lung infection caused by the inhalation of infectious spores from the fungi Coccidioides spp., a genus of soil dwelling fungal pathogen endemic to the arid regions of the southwestern United States, Mexico, Central and South America. Valley fever can exclusively be acquired through environmental reservoirs and is non-communicable from host to host. Very few Valley fever studies have focused on detecting Coccidioides spores in airborne respirable particles, which is the vector to infection. This study looks at the presence of Coccidioides in the air, soil, and burrow systems at a highly positive site in Mesa, Arizona. Monthly soil samples were taken from 14 animal burrows and 2 – 40 meter transects. Aerosol samples were collected for 24 hours every 6 days, following the Environmental Protection Agency sampling schedule. Two types of filter media were used for aerosol sampling: quartz fiber filters were used to determine gravimetric PM10, key ions, and organic and elemental carbon, and cellulose filters were used to analyze key elements. Meteorological data, including relative humidity, wind speeds, wind direction, and temperature were collected from a nearby weather station. Temporal soil sampling showed that C. posadasii stayed present at the site during the entire duration of the study however, temporal fluctuations of fungal burden occurred with decreases in detection occurring in the early spring and mid-summer months. Spatial variation was also detected, with certain burrow systems maintaining a high fungal burden throughout the year while others transiently housing the pathogen. We also showed that the pathogen was detected in rodent burrows significantly more frequency than in our surface soil transects. The temporal patterns of positivity for all the burrows were consistent over three years of sampling. Coccidioides were detected in ~68% of aerosol samples. Bulk PM10 did not have a statistically significant relationship with presence of Coccidioides, however, there was a statistically significant relationship between the amount of crustal material in the aerosols and presence of Coccidioides. Crustal material was reconstructed using the primary elements that make up earth’s crust (Al, Si, Fe, Ca, and Ti). Previous studies often link the presence of Coccidioides in the air with bulk PM10 concentrations; however, we found that looking at bulk PM10 concentrations gives an incomplete story. Additionally, there were statistically significant relationships with presence of Coccidioides and meteorological parameters, such as relative humidity and wind speed. This study emphasizes the importance of dust entrainment in the aerosolization and transport of Coccidioides

How to cite: Stout, A., Ramsey, M. L., Kollath, D. R., Barker, B. M., Herckes, P., and Fraser, M.: Temporal surveillance of Coccidioides in soils and aerosols at a single location in Arizona, EGU General Assembly 2026, Vienna, Austria, 3–8 May 2026, EGU26-8047, https://doi.org/10.5194/egusphere-egu26-8047, 2026.

EGU26-8073 | ECS | PICO | AS4.6

Particle Size Determines the Distribution of Chemical Composition and Antibiotic Resistance Genes in Urban Atmospheric Bioaerosols. 

Haajira Beevi Habeebrahuman, Youfen Qian, Vibhaw Shrivastava, Shamil Rafeeq, Emre Dikmen, Eda Sağırlı, Aşkın Birgül, Perihan Karakuş, Konstantina Oikonomou, Maria Tsagkaraki, Jean Sciare, Nikolaos Mihalopoulos, Fatma Öztürk*, and Naama Lang-Yona*

Airborne aerosols impact urban air quality and public health through transport and inhalation of chemical pollutants and microbial agents, including antibiotic-resistant bacteria. However, relationships between particle size, environmental parameters, chemical and microbial composition, and antibiotic-resistance dispersion remain poorly understood. This study examined the interplay between these parameters for size-segregated airborne particles collected in a mid-sized urban area. Fine particles (<1.5 µm) contained elevated K⁺, NH₄⁺, Cl⁻, and anthropogenic carbonaceous compounds, with predominant Proteobacteria. Coarse fractions (>1.5 µm) mainly contained mineral-derived components (Mg²⁺, Ca²⁺) and carbonate carbon from natural sources, with greater microbial diversity dominated by Firmicutes (29%) and Actinobacteriota (25%). Key opportunistic pathogens (Acinetobacter, Staphylococcus, Lactobacillus) and antibiotic resistance genes with tetW and sul1 being the most abundant, followed by blaTEM and intl1 were significantly more abundant in coarse fractions. Particle size, rather than seasonality, was found to primarily determine chemical composition and microbial community structure. Key genera (Acinetobacter, Delftia, Paucibacter, Pseudomonas) positively correlated with anthropogenic chemicals but negatively with ARGs, while ARG-harboring genera associated strongly with mineral nutrients. These findings suggest coarse urban aerosols function as reservoirs of antibiotic resistance genes and opportunistic pathogens, with abundance peaking in warmer months, raising public health concerns through inhalation exposure.

How to cite: Habeebrahuman, H. B., Qian, Y., Shrivastava, V., Rafeeq, S., Dikmen, E., Sağırlı, E., Birgül, A., Karakuş, P., Oikonomou, K., Tsagkaraki, M., Sciare, J., Mihalopoulos, N., Öztürk*, F., and Lang-Yona*, N.: Particle Size Determines the Distribution of Chemical Composition and Antibiotic Resistance Genes in Urban Atmospheric Bioaerosols., EGU General Assembly 2026, Vienna, Austria, 3–8 May 2026, EGU26-8073, https://doi.org/10.5194/egusphere-egu26-8073, 2026.

EGU26-8509 | ECS | PICO | AS4.6

Energetic constraints to the survival and activity of microbial life in Earth’s atmosphere 

Eloi Martinez-Rabert, Laura Molares Moncayo, Begum Nisa Kasapli, Elizabeth Trembath-Reichert, Rachael Lappan, Chris Greening, Jacqueline Goordial, and James A. Bradley

The atmosphere could be one of Earth’s largest and most interconnected ecosystems. It is an environment characterized by low temperatures, low nutrient availability, aridity, and high ultraviolet radiation. Nevertheless, research in cold, arid and oligotrophic extreme environments have demonstrated that the conditions of the atmosphere are within the boundaries currently considered to support microbial life. Moreover, certain microorganisms are capable of gaining energy by oxidizing atmospheric gasses (hydrogen (H2), carbon monoxide (CO) and methane (CH4)) at trace concentrations. Measurement and experimental investigations of the atmospheric microbiome (the aeromicrobiome) are extremely challenging due to the compounding difficulties of low biomass samples, contamination issues, and lack of standardized sampling procedures. Numerical modelling can advance aeromicrobiology research by providing a complementary means to evaluate the habitability of the atmosphere and the potential activity of atmospheric microorganisms. We developed a theoretical framework combining the state-of-the-art knowledge of potential atmospheric-dwelling microorganisms, thermodynamic principles, and global climate and atmospheric gas composition data from MERRA2 (Modern-Era Retrospective analysis for Research and Applications, v2) and CAMS (Copernicus Atmosphere Monitoring Service). Our modelling analysis demonstrates that hydrogen oxidation, carbon monoxide oxidation, and methane oxidation are energy yielding catabolisms (ΔGr < 0, i.e. thermodynamically feasible) under atmospheric conditions, throughout the entire troposphere, all year round. It is therefore possible that these catabolisms are a viable source of energy to microorganisms in the atmosphere.  We also reveal spatially and temporal energetic ‘hot spots’ where catabolic energy yield is greater, due to localized atmospheric gas concentrations and temperatures. In addition to supplying energy, atmospheric methane oxidation and hydrogen oxidation generate water as a catabolic byproduct, potentially alleviating limitations to microbial survival and activity that are imposed by the extreme aridity of the atmosphere. Theoretical modelling can accelerate aerobiology research by generating theory-informed hypotheses about which microbial cohorts are more probable to be metabolically active in the Earth’s atmosphere and guiding experimental research to where and how we may find and study them.

How to cite: Martinez-Rabert, E., Molares Moncayo, L., Nisa Kasapli, B., Trembath-Reichert, E., Lappan, R., Greening, C., Goordial, J., and A. Bradley, J.: Energetic constraints to the survival and activity of microbial life in Earth’s atmosphere, EGU General Assembly 2026, Vienna, Austria, 3–8 May 2026, EGU26-8509, https://doi.org/10.5194/egusphere-egu26-8509, 2026.

EGU26-14699 | ECS | PICO | AS4.6

Bioaerosol and ice-nucleating particle responses to convective storm processes at a semiarid grassland area in Colorado 

Claudia Mignani, Russell J. Perkins, Teresa K. Feldman, Charles M. Davis, Leah D. Grant, Susan C. van den Heever, Elizabeth A. Stone, Paul J. DeMott, and Sonia M. Kreidenweis and the BACS and BROADN team members as well as collaborators

Biological aerosol particles influence atmospheric processes, including cloud ice nucleation through action as ice-nucleating particles (INPs). Their abundance is altered by convective storm processes such as precipitation and cold pools. To improve the understanding of bioaerosol characteristics, sources, and variability during convective storms, we conducted two intensive field campaigns in May–June 2022 and 2023 at a semiarid grassland area in Colorado. The two seasons had contrasting environmental conditions, with exceptionally dry conditions in 2022 and unusually wet conditions in 2023. Bioaerosols were characterized using fluorescence and chemical tracers, while INPs were measured in air (before, during, and after rainfall), precipitation water, and terrestrial source samples; these measurements were aligned with disdrometer- and drone-based observations. Peak fluorescent particle concentrations correlated significantly with cold pool strength (rs=0.81, p<0.05, n=12), indicating that cold pools increase local bioaerosol concentration. Near-surface warm-temperature INP concentrations reached very high values during rainfall, with a maximum value across 15 events of 2.4 INP standard L-1 active at –10 °C. Much of the observed variability in during-precipitation concentration of INPs active between –8 °C and –25 °C was explained by cumulative rainfall kinetic energy (rs=0.71-0.91, p<0.006, n=14), suggesting that raindrops and hailstone impacts on land surfaces aerosolize bioaerosols and INPs. These rain-induced INPs were associated with particles <10 µm, based on size-segregated samples. Heat-treatment experiments (50 °C and 95 °C) revealed that INP properties in during-precipitation air were more similar to plants than to soil. Overall, the results indicate that rain-induced INPs are most likely dominated by fungi that reside on plant surfaces. Finally, cloud-resolving model simulations further suggest that a small fraction of rain-sourced tracers of bioaerosols reaches the upper levels of the parent storms, where INPs could influence cloud ice fraction and initiate precipitation, contributing to an aerosol-cloud-precipitation feedback.

How to cite: Mignani, C., Perkins, R. J., Feldman, T. K., Davis, C. M., Grant, L. D., van den Heever, S. C., Stone, E. A., DeMott, P. J., and Kreidenweis, S. M. and the BACS and BROADN team members as well as collaborators: Bioaerosol and ice-nucleating particle responses to convective storm processes at a semiarid grassland area in Colorado, EGU General Assembly 2026, Vienna, Austria, 3–8 May 2026, EGU26-14699, https://doi.org/10.5194/egusphere-egu26-14699, 2026.

EGU26-16337 | PICO | AS4.6

Biogenic ice nucleating particles in agricultural soils: Microbial drivers across different management practices and contribution to bioaerosol emissions 

Tina Šantl-Temkiv, Anne Ellebæk, Caroline Fonager Langhoff, Ea Marie Løfstedt, Christian Ditlev Funder Castenschiold, Mette Balslev Greve, Torben Sigsgaasd, Lars Elsgaard, and Lasse Z. Jensen

Atmospheric ice nucleating particles (INP) trigger ice formation in supercooled water, influencing cloud microphysics and precipitation. While mineral particles are abundant in the atmosphere, microbially produced compounds have been linked to INP with an ability to nucleate ice at temperatures >-10°C. Agricultural soils, which cover roughly 37% of Earth’s land surface, have been identified as reservoirs of these potent biological INP (bioINP). However, it remains unclear how site conditions and common agricultural practices, such as tillage, cover cropping, and liming, influence the abundance of bioINP and whether these effects are linked to changes in microbial community composition. To address this, we quantified INP concentrations and properties in soils from five Danish long-term agricultural field trials (LT sites) and characterized microbial communities using high-throughput sequencing of 16S rRNA and ITS marker genes. In addition, we established two aerosol sampling sites (AE sites) in agricultural areas in Denmark to monitor soil-derived bioaerosol emissions. We collected aerosol, soil, plant, and faecal samples at these two sites and used high-throughput 16S rRNA sequencing to quantify the fraction of bioaerosols derived from soils.

BioINP concentrations varied over several orders of magnitude between sites, with particularly high levels observed in Flakkebjerg, the most clay-rich of the five LT sites. Soil management practices influenced microbial community composition but had limited and inconsistent effects on bioINP abundance. Bacterial taxa previously reported as ice nucleation active, including Pseudomonas and Lysinibacillus, were detected only at low relative abundances and showed weak correlations with BioINP activity. In contrast, fungal community composition was a stronger predictor, with the relative abundance of Fusarium spp. and taxa like Linnemannia significantly associated with elevated BioINP concentrations. At the AE sites, we applied the source-tracking tool FEAST and found that 8% of the bioaerosols could be tracked to agricultural soils regardless of the season. This suggests that soil-derived particles are efficiently transferred into the atmosphere, even when soils are not directly exposed due to vegetation cover.

Our results suggest that fungi, particularly Fusarium, are the dominant contributors to warm-temperature bioINP activity in agricultural soils and that agricultural soils serve as an important source of airborne bioaerosol particles. This study, therefore, highlights the need to consider fungal ecology when linking agricultural management to atmospheric processes. Future work will quantify the absolute abundance of Fusarium using qPCR, determine fluxes of soil-derived BioINPs under different wind and rainfall conditions, and assess their impacts on cloud dynamics and climate.

How to cite: Šantl-Temkiv, T., Ellebæk, A., Langhoff, C. F., Løfstedt, E. M., Castenschiold, C. D. F., Greve, M. B., Sigsgaasd, T., Elsgaard, L., and Jensen, L. Z.: Biogenic ice nucleating particles in agricultural soils: Microbial drivers across different management practices and contribution to bioaerosol emissions, EGU General Assembly 2026, Vienna, Austria, 3–8 May 2026, EGU26-16337, https://doi.org/10.5194/egusphere-egu26-16337, 2026.

EGU26-16384 | PICO | AS4.6

Development a Laboratory Based Sub-Sampling Methodology for Sea Surface Microlayer Biological Characterization 

Or Argaman Meirovich, Ariel C. Tastassa, Yael Dubowski, Jonathan Blaustein, and Naama Lang-Yona

The Sea Surface Microlayer (SML) is a unique chemical and biological interface between the ocean and the atmosphere, playing a fundamental role in global biogeochemical cycles. Notably, the SML acts as the primary gateway for the emission of marine bacteria from the water column into the atmosphere and therefore serves as a critical interface between the ocean and the atmosphere. Despite its importance, direct biological sampling in the open sea remains technically challenging due to physical disturbances and the inherent fragility of the microlayer. To address these limitations, we developed and validated a dedicated biological sub-sampling methodology designed to facilitate SML collection and analysis in a controlled environment. The technique utilizes laboratory-based SML reformation from surface-water (SW) subsamples. To determine the optimal sampling window, 24-hour incubation experiments and 16S rRNA gene quantification were conducted using field samples and enriched marine bacteria. Results showed that while the SML exhibited compositional instability during the first two hours post-sampling, a consistent steady state in bacterial abundance was achieved between 3 and 6 hours. Consequently, a 4-hour stabilization period was established as the optimal timeframe for representative SML collection. Further results on the stability of the SML microbial composition will be discussed. The methodology was validated via comparative assessments against in situ sampling in the Mediterranean and Red Seas. Statistical analyses confirmed no significant differences in 16S rRNA gene copy numbers between field-collected and laboratory-reformed samples (p > 0.05). Application of this protocol across a Pacific Ocean latitude gradient revealed distinct microbial signatures in SW, the SML, and the atmosphere. Genomic data positioned the SML as a transitional mediator between the ocean and air, while 16S rRNA transcript analysis showed tight clustering in the SML and atmosphere, suggesting selective environmental control over active communities. Collectively, this stabilization approach provides a robust and standardized alternative to traditional sampling, particularly in rough sea conditions. By enabling stable biological characterization of the SML, this research enhances our understanding of the mechanisms controlling marine-atmosphere microbial exchange and their impact on global ecological networks and nutrient cycling.

How to cite: Argaman Meirovich, O., Tastassa, A. C., Dubowski, Y., Blaustein, J., and Lang-Yona, N.: Development a Laboratory Based Sub-Sampling Methodology for Sea Surface Microlayer Biological Characterization, EGU General Assembly 2026, Vienna, Austria, 3–8 May 2026, EGU26-16384, https://doi.org/10.5194/egusphere-egu26-16384, 2026.

EGU26-19882 | ECS | PICO | AS4.6

Highly Active Biogenic Ice-Nucleating Particles of the West Greenland Phyllosphere may Impact Arctic Weather and Climate 

Christian Ditlev Funder Castenschiold, Sibylle Lebert, Thea Holm Graversen, Shashi Prabha Kumari, Kai Finster, and Tina Šantl-Temkiv

Biogenic ice-nucleating particles (INPs) are widely detected in the Arctic atmosphere, where they potentially modulate Arctic mixed-phase clouds and consequently impact the regional climate. However, limited data on source environments, abundance, diversity, and atmospheric concentrations of biogenic INPs give rise to substantial uncertainties in aerosol-cloud interactions. As Arctic warming reduces snow and ice cover, accelerates greening, and increases periods of vegetation exposure, the aerosolization of plant-associated biogenic INPs may be enhanced. To better constrain the role of the phyllosphere microbiota and INPs in Arctic mixed-phase clouds, we collected quantitative data on INP and microbial community composition across three sites in western Greenland (Kangerlussuaq, Ilulissat, and Disko Island). Sampling was conducted from June to September, with each site visited two to three times. We combined freezing assays with bacterial community profiling and cultivation-based approaches. In addition, atmospheric samples were collected on filters (0.8 pore size) continuously from May to September on Disko Island to monitor variation in bioaerosol types and concentrations across the summer season. We further investigated phyllosphere-associated microbial communities and biogenic INPs. Highly active INPs were detected across all locations, with onset freezing temperatures ranging from -3°C to -7°C. The highest INP concentration per gram of plant material active at -10°C was observed in Kangerlussuaq in September, when temperatures drop to subzero degrees, suggesting that environmental factors, such as temperature, trigger INP production. Members of the genus Pseudomonas were consistently present in the plant samples, and cultivation studies yielded eight ice-nucleation active (INA) isolates, all affiliated with this genus. Whole genome sequencing revealed that the isolates represented novel species and contained genes that encode ice-nucleation active proteins (INpro). Our findings show that the Arctic phyllosphere can serve as a source of highly active biogenic INPs and thus may contribute to regional atmospheric INP levels and further impact cloud processes. We conclude that biogenic INPs derived from the Arctic phyllosphere need to be included in atmospheric models to improve predictions of Arctic climate feedback.

How to cite: Castenschiold, C. D. F., Lebert, S., Graversen, T. H., Kumari, S. P., Finster, K., and Šantl-Temkiv, T.: Highly Active Biogenic Ice-Nucleating Particles of the West Greenland Phyllosphere may Impact Arctic Weather and Climate, EGU General Assembly 2026, Vienna, Austria, 3–8 May 2026, EGU26-19882, https://doi.org/10.5194/egusphere-egu26-19882, 2026.

EGU26-20342 | PICO | AS4.6

Key Model Parameters for Constraining Biodegradation as an Atmospheric Sink for Organic Compounds 

Barbara Ervens, Leslie Nuñez López, and Pierre Amato

Biodegradation by airborne bacteria in clouds represents a potential sink for C1 and C2 monofunctional organic compounds in the atmosphere [1,2], yet this sink remains largely unaccounted for in atmospheric chemistry models. Several factors contribute to this gap: (i) Biodegradation rates are available for only a limited number of atmospheric bacteria strains and organic substrates, and (ii) systematic measurements of ambient bacteria concentration and diversity, which are needed for model initialization, are sparse.  

To identify compounds for which biodegradation may represent an efficient sink in the atmosphere, we performed model sensitivity studies to identify key parameters that most significantly influence the biodegradation rates for organics in the atmospheric multiphase system, where biodegradation occurs in a small subset (0.1%) of cloud droplets. These parameters include bacterial cell concentration (Nbact) and diversity, and biodegradation rate constants (kbact), as well as the physicochemical properties of the biodegraded substrates, such as Henry’s law constants (KH) and chemical reactivity.

Our findings indicate that the amount of biodegraded material (ΔC) scales approximately with the number of active bacteria cells (ΔC ∝ Nbact). Sensitivity of ΔC to the Henry’s law constants of the organic substrate and to biodegradation rate constants are lower, with ΔC ∝  0.9 KH and ΔC ∝  0.4 kbact, respectively. However, we find that biodegradation is unlikely to be a significant sink for highly soluble and/or quickly biodegraded compounds that exceed KH ~ 105 M atm-1 and kbact ~ 2·10-13 L cell-1 s-1. For these compounds, biodegradation in individual cloud droplets proceeds so efficiently that the substrate replenishment from the gas phase is not sufficiently fast. Comparing biodegradation rate constants for major organics in cloud water to those derived from measurements in other aquatic environments, such as rivers [3], shows good agreement. Based on this, we suggest that a general rate constant (kbact = 2·10-13 L cell-1 s-1) can be used to estimate the loss of total water-soluble organic carbon in clouds.   

In conclusion, our model sensitivity studies provide guidance for future lab and field measurements to constrain the data needed to assess the role of biodegradation as a sink for organics in the atmosphere. The identified sensitivities across wide parameter ranges will help to identify conditions and substrates for which atmospheric biodegradation may be significant.


[1] Nuñez López, L., Amato, P., and Ervens, B.: Bacteria in clouds biodegrade atmospheric formic and acetic acids, Atmos. Chem. Phys., 24, 5181–5198, https://doi.org/10.5194/acp-24-5181-2024, 2024.

[2] Khaled, A., Zhang, M., Amato, P., Delort, A.-M., and Ervens, B.: Biodegradation by bacteria in clouds: An underestimated sink for some organics in the atmospheric multiphase system, Atmos. Chem. Phys. 21, 3123–3141, https://doi.org/10.5194/acp-21-3123-2021, 2021.

[3] Catalán, N., J. P. Casas-Ruiz, D. von Schiller, L. Proia, B. Obrador, E. Zwirnmann and R. Marcé, Biodegradation kinetics of dissolved organic matter chromatographic fractions in an intermittent river, J. Geophys. Res. Biogeosci., 122, 131– 144, https://doi.org/10.1002/2016JG003512, 2017.


How to cite: Ervens, B., Nuñez López, L., and Amato, P.: Key Model Parameters for Constraining Biodegradation as an Atmospheric Sink for Organic Compounds, EGU General Assembly 2026, Vienna, Austria, 3–8 May 2026, EGU26-20342, https://doi.org/10.5194/egusphere-egu26-20342, 2026.

Fires are a significant disturbance in Earth's systems. Smoke aerosols emitted from fires can cause environmental degradation and climatic perturbations, leading to exacerbated air pollution and posing hazards to public health. However, research on the climatic and health impacts of fire emissions is severely limited by the scarcity of air pollution data directly attributed to these emissions. Here, we develop a global daily fire-sourced PM2.5 concentration ([PM2.5]) dataset at a spatial resolution of 0.25° for the period 2000–2023, using the GEOS-Chem chemical transport model driven with two fire emission inventories, the Global Fire Emissions Database version 4.1 with small fires (GFED4.1s) and the Quick Fire Emission Dataset version 2.5r1 (QFED2.5). Simulated all-source [PM2.5] is bias-corrected using a machine learning algorithm, which incorporates ground observations from over 9000 monitoring sites worldwide. Then the simulated ratios between fire-sourced and all-source [PM2.5] at individual grids are applied to derive fire-sourced [PM2.5]. Globally, the average fire-sourced [PM2.5] is estimated to be 2.04 µg m−3 with GFED4.1s and 3.96 µg m−3 with QFED2.5. Both datasets show consistent spatial distributions with regional hotspots in central Africa and widespread decreasing trends over most areas. While the mean levels of fire-sourced [PM2.5] are much higher at low latitudes, fire episodes in the boreal regions can cause PM2.5 levels that are comparable to those of the tropics. This dataset serves as a valuable tool for exploring the impacts of fire-related air pollutants on climate, ecosystems, and public health, enabling accurate assessments and support for decision-making in environmental management and policy.

How to cite: Tian, C.: Global high-resolution fire-sourced PM2.5 concentrations for 2000–2023, EGU General Assembly 2026, Vienna, Austria, 3–8 May 2026, EGU26-741, https://doi.org/10.5194/egusphere-egu26-741, 2026.

EGU26-1836 | Posters on site | AS4.7

Microbial regulation of soil carbon stabilization shapes soil carbon projections 

Dan Liu and Zhang Yichen

Enhancing SOC accumulation is considered as a pathway for mitigating climate change. However, projection of soil organic carbon (SOC) exhibits large uncertainties, and microbial activities, the key regulator of SOC dynamics, are omitted in most Earth System Models (ESMs). Here, we compare the traditional SOC scheme in ESMs (CENURY) with two microbial-explicit models, through constraining SOC stock and its stable component. Unlike net gains of SOC projected by CENTURY, the two microbial models consistently projected turning points of SOC change, and net loss of SOC for 21.9 ~ 61.4PgC were projected under SSP5-8.5 by 2100. SOC loss originates primarily from unprotected SOC in northern high-latitudes. SOC stabilization pathways, instead of the temperature sensitivity of SOC mineralization, drive the divergence among model projections. Our results indicate strong risk of SOC loss in northern high-latitudes, and ESMs should incorporate microbial-regulated SOC stabilization mechanisms as the priority to improve SOC projections.

How to cite: Liu, D. and Yichen, Z.: Microbial regulation of soil carbon stabilization shapes soil carbon projections, EGU General Assembly 2026, Vienna, Austria, 3–8 May 2026, EGU26-1836, https://doi.org/10.5194/egusphere-egu26-1836, 2026.

EGU26-2185 | ECS | Orals | AS4.7

Supporting Blue Carbon Accounting: A Process-Based Productivity Model for Global Salt Marshes 

Zhuoya Zhou, Tingting Li, Xiu­-Qun Yang, Deliang Chen, Guangxuan Han, Xingwang Fan, Xiaosong Zhao, Siyu Wei, Bin He, and Guocheng Wang

Coastal salt marshes (CSMs) are vital blue carbon (BC) reservoirs, yet accurately quantifying their gross primary productivity (GPP) remains challenging due to limitations in terrestrial biosphere models (TBMs), which often overlook coastal-specific processes. Here, we present SAL-GPP, a process-based model that incorporates coastal-specific modules to capture the effects of salinity and temperature stress on photosynthesis, as well as light-use efficiency across salinity gradients in diverse CSM plant species. Model validation showed strong agreement with observations, with R² of 0.82 and model efficiencies of 0.82 and 0.74 for daily and seasonal GPP, respectively. Driven with global inputs, SAL-GPP produced high-resolution global simulations, yielding a mean annual GPP of 66.89 ± 11.68 TgC yr–1 (2011–2020), with 64% concentrated in key hotspots across the southeastern United States, western Europe, southeastern China, and Australia. From 2011 to 2016, global CSM GPP increased by 1.56 TgC yr–1, then declined, rebounded after 2018, and peaked at 71.45 ± 12.02 TgC yr–1 in 2020. Model evaluation showed that SAL-GPP outperformed existing remote sensing-based GPP products and TBMs at both site and grid levels. By explicitly incorporating coastal ecosystem dynamics, SAL-GPP supports global BC accounting and climate mitigation strategies aligned with nature-based solutions for carbon neutrality.

How to cite: Zhou, Z., Li, T., Yang, X.-Q., Chen, D., Han, G., Fan, X., Zhao, X., Wei, S., He, B., and Wang, G.: Supporting Blue Carbon Accounting: A Process-Based Productivity Model for Global Salt Marshes, EGU General Assembly 2026, Vienna, Austria, 3–8 May 2026, EGU26-2185, https://doi.org/10.5194/egusphere-egu26-2185, 2026.

Most existing studies simulate ecosystem influences on atmospheric pollutants using prescribed vegetation datasets, while feedbacks from atmospheric chemistry to terrestrial ecosystems are rarely represented. Here, we couple the chemistry-climate model ECHAM6.3–HAM2.3–MOZ1.0 (ECHAM-HAMMOZ) with the interactive Model for Air Pollution and Land Ecosystems (iMAPLE) to enable fully dynamic, two-way interactions between atmospheric chemistry and terrestrial ecosystems. Biogenic volatile organic compounds, including isoprene (IPP) and monoterpenes (MTP), are simulated by iMAPLE and interactively participate in chemical reactions in HAMMOZ. Simulated leaf area index and stomatal conductance modulate dry deposition velocities, thereby influencing atmospheric chemical concentrations. In turn, the modeled ozone affects vegetation productivity through stomatal uptake. Relative to the original model, the coupled system exhibits notable changes in atmospheric composition and ecosystem productivity. Enhanced IPP and MTP emissions reduce surface ozone concentrations in high-latitude regions, while dynamically simulated ozone variability induces a seasonal reduction in terrestrial gross primary productivity (GPP). In addition, spatial heterogeneity in stomatal conductance alters ozone dry deposition patterns. By explicitly representing these coupled feedback processes, the integrated ECHAM–HAMMOZ–iMAPLE framework improves the realism of biosphere–atmosphere interactions and provides a useful tool for studying atmosphere–terrestrial ecosystem coupling.

How to cite: Zhao, Y. and Yue, X.: Development and evaluation of ecosystem-atmospheric chemistry interactions in the ECHAM-HAMMOZ-iMAPLE model, EGU General Assembly 2026, Vienna, Austria, 3–8 May 2026, EGU26-3305, https://doi.org/10.5194/egusphere-egu26-3305, 2026.

Severe air pollution reduces ecosystem carbon assimilation by damaging vegetation with ozone (O3) and altering climate through aerosol effects, thereby exacerbating global warming. In response, China implemented the Clean Air Action (CAA) plan in 2013 to reduce anthropogenic emissions. Here we assessed the impact of CAA-induced air pollution reductions on net primary productivity (NPP) in China during 2014-2020 using multiple measurements, process-based models, and machine learning algorithms. The CAA plan led to a national NPP increase of 26.3±27.9 Tg C yr-1, with 20.1±10.9 Tg C yr-1 attributed to aerosol reductions, mainly driven by enhanced light availability from decreased black carbon and increased precipitation due to weakened aerosol climatic effects. The impact of O3 amelioration became more significant over time, surpassing the effects of aerosol reduction by 2020. Two machine learning models showed similar NPP recoveries of 42.8±26.8 Tg C yr-1 and 43.4±30.1 Tg C yr-1. Our study highlights significant carbon gains from controlling aerosols and surface O3, underscoring the co-benefits of air pollution regulation for public health and carbon neutrality in China.

How to cite: Yue, X. and Zhou, H.: Improved ecosystem productivity in China driven by declining aerosols and surface ozone, EGU General Assembly 2026, Vienna, Austria, 3–8 May 2026, EGU26-3443, https://doi.org/10.5194/egusphere-egu26-3443, 2026.

Abstract:  Sulfur dioxide (SO₂) is a major air pollutant that damages terrestrial vegetation. It can suppress photosynthesis through sulfite/bisulfite toxicity and ROS-mediated oxidative stress, promoting stomatal closure and impairing chloroplast photochemistry and carbon fixation, as documented in laboratory and field fumigation studies. Here we develop, to our knowledge, the first observation-based parameterization of SO₂-induced photosynthetic damage, derived from 858 measurements compiled from peer-reviewed SO₂ fumigation experiments. The scheme captures observed relationships between accumulated SO₂ exposure above a concentration threshold, ASTα (α, nmol mol⁻¹), and relative leaf photosynthetic rate across broadleaf trees, needleleaf trees, shrubs, C₃ crops, C₄ crops, C₃ grasses, and C₄ grasses. We implement the parameterization in the Common Land Model (CoLM2024). Global simulations for 2003–2021 indicate that, relative to simulations without SO₂ damage, contemporary SO₂ exposure reduces global photosynthetic rate by ~10%. These results highlight the importance of representing SO₂-induced physiological stress in process-based large-scale models to improve assessment and projection of the global carbon cycle.

Keywords: sulfur dioxide (SO2); photosynthesis; terrestrial ecosystem; fumigation experiments; parameterization, land surface model

How to cite: Yuan, X. and Li, F.: Incorporating Experiment-Based SO₂ Damage to Photosynthesis into Regional and Global Land Process Models, EGU General Assembly 2026, Vienna, Austria, 3–8 May 2026, EGU26-4365, https://doi.org/10.5194/egusphere-egu26-4365, 2026.

EGU26-4584 | ECS | Posters on site | AS4.7

Mitigating global drought extremes through stratospheric aerosol geoengineering: spatial and socioeconomic disparities 

Weijie Fu, Chenguang Tian, Rongbin Xu, and Yuming Guo

As global temperature rises, the severity and frequency of droughts are projected to increase. Stratospheric aerosol injection (SAI) has been proposed as a potential solution to reduce surface temperatures, but its effectiveness in alleviating drought extremes remains unclear. Here, we assess the global impacts of SAI on drought extremes based on experiments from the Geoengineering Model Intercomparison Project phase 6 (GeoMIP6) and the Geoengineering Large Ensemble Project (GLENS). By 2100, the frequency of extreme droughts is projected to increase by 7.33 % under the high-emission Shared Socioeconomic Pathways 5 (SSP5-8.5) scenario relative to present day. SAI reduces this increase by 1.99 % in GeoMIP6, and by 1.80 % in GLENS compared with Representative Concentration Pathways 8.5 (RCP8.5). Attribution analyses show that SAI-induced cooling alone reduces extreme drought frequency by 3.42 % in GeoMIP6 and 4.28 % in GLENS relative to their respective high-emission scenarios, outweighing the 2.12 % increase driven by SAI-induced precipitation reductions under the same conditions. However, these rainfall deficits lead to substantial inequities in drought exposures. Compared to developed nations, countries with less development experience smaller reductions, or even increases, in economic and population exposure to extreme drought under SAI relative to SSP5-8.5 or RCP8.5. These findings suggest that the current SAI strategies in GeoMIP6 and GLENS may induce the risk of unintentionally worsening regional hydroclimatic disparities.

How to cite: Fu, W., Tian, C., Xu, R., and Guo, Y.: Mitigating global drought extremes through stratospheric aerosol geoengineering: spatial and socioeconomic disparities, EGU General Assembly 2026, Vienna, Austria, 3–8 May 2026, EGU26-4584, https://doi.org/10.5194/egusphere-egu26-4584, 2026.

EGU26-4794 | Posters on site | AS4.7

Variations and drivers of CO2 fluxes at multiple temporal scales of subtropical agricultural systems in the Huaihe river Basin 

Kaidi Zhang, Yanyu Lu, Yuan Gong, Chunfeng Duan, and Fangmin Zhang

Understanding of the crop carbon balance across different time scales and corresponding responses to abiotic and biotic factors is crucial for improving carbon cycle models in the context of future climate change and management practices. In this study, we employed the Random Forest (RF) algorithm, Kolmogorov-Zurbenko filtering method and structural equation modeling (SEM) to quantify the effects of abiotic and biotic factors on CO2 fluxes at various time scales based on 7-years measurements. Our results revealed that O3 primarily manifested indirect effects on NEE and GPP via altering LAI on the daily and monthly scale, and that overall regulatory effect on CO2 fluxes developed greater as the time scale increased. Net radiation (Rn) was the most critical abiotic factor altering net ecosystem exchange (NEE) and gross primary productivity (GPP) at the half-hourly, daily, and monthly scales, with the exception of photosynthetically active radiation (PAR) controlling daily NEE and GPP in the rice system. It was innovatively found that LAI had little control on detrended daily CO2 fluxes, which was much lower than the monthly CO2 fluxes. Air temperature (Ta) was the most important abiotic factor for ecosystem respiration (Reco) at half-hourly and daily scale.  For NEE, Reco, and GPP, the maximum explanation of SEM models was 70.10%, 79.60% and 76.20%, respectively. The SEM results indicated that at multiple time scales, Rn exerted significant direct and indirect effects on both NEE and GPP. LAI only showed a strong direct leading effect on NEE and GPP on the monthly scale. The findings we reported have the potential to further develop carbon cycle models of cropland ecosystems under climate change by clarifying the influence path of O3 on CO2 fluxes and highlighting the factors that dominate CO2 fluxes on various time scales.

How to cite: Zhang, K., Lu, Y., Gong, Y., Duan, C., and Zhang, F.: Variations and drivers of CO2 fluxes at multiple temporal scales of subtropical agricultural systems in the Huaihe river Basin, EGU General Assembly 2026, Vienna, Austria, 3–8 May 2026, EGU26-4794, https://doi.org/10.5194/egusphere-egu26-4794, 2026.

EGU26-4840 | ECS | Posters on site | AS4.7

Diurnal Ammonia Mapping based on Deep Learning from Geostationary Hyperspectral Infrared Sounder Observations 

Xinran Xia, Min Min, Jun Li, and Ling Gao

Atmospheric ammonia (NH₃) is a key air pollutant with high spatiotemporal variability, challenging the observation of its diurnal cycle. The Fengyun-4B Geostationary Interferometric Infrared Sounder (FY-4B/GIIRS) offers high-frequency measurements that capture this variability. We introduce a novel Multi-modal Fusion Transformer (MF-Transformer) to retrieve NH₃ total columns directly from hyperspectral radiances, meteorology, and ancillary data, circumventing costly radiative transfer simulations. Our retrievals are consistent with the IASI (Infrared Atmospheric Sounding Interferometer) NH₃ product (correlation coefficient, R=0.79) and Optimal Estimation (OE) retrievals (R=0.75), outperform benchmark machine learning models by ~20% in accuracy, and eliminate unphysical negative values. The method is orders of magnitude faster than OE approach, enabling global full-disk processing in tens of seconds. This advance allows the resolution of rapid NH₃ variations, demonstrating a transformative capability for operational monitoring.

How to cite: Xia, X., Min, M., Li, J., and Gao, L.: Diurnal Ammonia Mapping based on Deep Learning from Geostationary Hyperspectral Infrared Sounder Observations, EGU General Assembly 2026, Vienna, Austria, 3–8 May 2026, EGU26-4840, https://doi.org/10.5194/egusphere-egu26-4840, 2026.

EGU26-4888 | ECS | Posters on site | AS4.7

Centennial-scale decline in global fire emissions driven by land use and population growth 

HaiXiao Zhang, Bin He, Jun Zhu, and Chenguang Tian

Fires and their carbon emissions have substantial impacts on land surface, climate systems, and air quality. However, long-term datasets with detailed spatiotemporal fire records remain limited, due to insufficient understanding of the climatic, ecosystem, and societal drivers of fire processes in current process-based models. Here, we employ a data-driven approach that integrates machine learning algorithms with outputs from eight fire models within the Fire Model Intercomparison Project (FireMIP) to reconstruct fire CO2 emissions from 1901 to 2012 and to assess the respective impacts of human activities, climate, and land cover change. Our MLA-based dataset reveals a global decline in fire-emitted CO2 at -7.45 ± 0.12 Tg C yr-2 (-0.29% yr-1), mainly in South America and Africa. Land use change emerges as the primary driver, reducing fire CO2 emissions by -6.07 ± 0.23 Tg C yr-2, followed by population growth, which contributes -3.60 ± 0.54 Tg C yr-2. Population growth typically suppresses fires in agricultural and urban areas but raises fire risks at rainforest edges where deforestation occurs. Although climate change has a limited impact on global fire CO2 reduction (-0.39 ± 0.19 Tg C yr-2), it remains a key driver for boreal fires, strongly influenced by precipitation changes. These findings underscore the need for robust data and informed management to support fire prevention and climate change mitigation efforts.

How to cite: Zhang, H., He, B., Zhu, J., and Tian, C.: Centennial-scale decline in global fire emissions driven by land use and population growth, EGU General Assembly 2026, Vienna, Austria, 3–8 May 2026, EGU26-4888, https://doi.org/10.5194/egusphere-egu26-4888, 2026.

Atmospheric Motion Vector (AMV) provides essential wind field information, playing a key role in typhoon path prediction and intensity analysis. However, the spatial resolution of current mainstream AMV products is relatively low, limiting their ability to meet the high-precision demands of meteorological services. While the China Meteorological Administration's visible channel AMV product achieves a relatively high spatial resolution of 6 km, its long computational time prevents it from being applied in real-time operational scenarios.In this study, we propose a GPU-accelerated high-resolution wind field retrieval algorithm, designed to address the computational bottleneck of the target tracking component within the AMV retrieval process. By decomposing the core calculations into parallel tasks, we leverage OpenACC to efficiently implement parallel computing. Additionally, to overcome the memory limitations of a single GPU, we design a block-based computational strategy, enabling multi-GPU processing for handling larger datasets.Experimental results show that the proposed algorithm achieves significant acceleration, with computational efficiency improved by more than ten times compared to traditional CPU implementations, while maintaining the retrieval accuracy. The algorithm also demonstrates excellent scalability, supporting a wide range of remote sensing data resolutions, from 4000 m down to 500 m. This work presents a feasible technical solution for real-time operational high-resolution AMV retrieval, enhancing the timeliness of typhoon monitoring and numerical weather prediction assimilation.

How to cite: Zhou, R.: Accelerating Target Tracking in Atmospheric Motion Vector Retrieval Using Openacc, EGU General Assembly 2026, Vienna, Austria, 3–8 May 2026, EGU26-6062, https://doi.org/10.5194/egusphere-egu26-6062, 2026.

EGU26-6233 | ECS | Posters on site | AS4.7

Understanding terrestrial ecosystems response to solar radiation modification 

Yuan Zhang, Wenping Yuan, Xiyan Xu, and Dan Liu

Solar Radiation Modification (SRM) ranks among the most promising geoengineering approaches. Given that SRM scenarios are plausible, current understanding of its impacts relies heavily on model projections. However, significant risks emerge from limited knowledge and substantial model uncertainties, especially regarding terrestrial ecosystems, which are intrinsically linked to human well-being. Ecosystem response uncertainties stem from scenarios, atmospheric models, land surface models, etc. Fully coupled simulations make it impossible to disentangle these contributing factors for further refinement. To address this gap, we designed a new set of offline simulations using multiple land surface models to isolate uncertainty sources and refine the ecosystem response to SRM. We will present preliminary results from these experiments.

How to cite: Zhang, Y., Yuan, W., Xu, X., and Liu, D.: Understanding terrestrial ecosystems response to solar radiation modification, EGU General Assembly 2026, Vienna, Austria, 3–8 May 2026, EGU26-6233, https://doi.org/10.5194/egusphere-egu26-6233, 2026.

EGU26-6811 | ECS | Orals | AS4.7

When wuthering winds create fluttering fields: plant canopies under diffuse and fluctuating light 

Maxime Durand, Santa Neimane-Šroma, Alexandra J. Gibbs, Xin Zhuang, Anna Lintunen, Ekaterina Ezhova, Nicole M. Hughes, Yann Salmon, Jonathon A. Gibbs, Erik H. Murchie, and T. Matthew Robson

Natural vegetation is exposed to highly dynamic light environments driven by wind-induced canopy motion, cloud cover, and atmospheric aerosols. These processes generate diffuse radiation and rapid irradiance fluctuations, ranging from sub-second windflecks to hour-long cloudflecks. This variability strongly regulates photosynthesis and transpiration, yet most vegetation models still assume static canopies and instantaneous responses.

At the ecosystem scale, we present long-term observations from a boreal Scots pine forest showing that productivity is most strongly related to the absolute amount of diffuse light rather than diffuse fraction alone. Enhanced ecosystem uptake across both shoots and forest-floor vegetation emphasizes that diffuse radiation not only reorganizes light distribution throughout the canopy but may also modify leaf-level photosynthesis through canopy-mediated effects.

Controlled-environment experiments under defined fluctuating or diffuse irradiance regimes reveal that developmental acclimation to light variability represents a physiological compromise. This trade-off between carbon gain and water loss under realistic light dynamics has direct implications for water-use efficiency and drought responses in a warming climate. In parallel, field measurements reveal order-of-magnitude differences in wind-driven canopy motion among wheat cultivars under comparable wind speeds. Light fluctuations are thus not solely imposed by the atmosphere but are co-determined by plant structure and biomechanics.

Finally, we present new analyses of cloudfleck properties derived from multi-year, high-frequency measurements, revealing cloud-driven spectral irradiance fluctuations in temperate and boreal forests. These data stress that diffuse and direct radiation differ fundamentally in both directionality and spectral composition, extending beyond a simple binary and challenging the traditional direct–diffuse dichotomy used in models. Dynamic light is not noise around a mean state but a fundamental driver of ecosystem function. Accounting for its temporal, structural, and spectral complexity is essential for realistic predictions of vegetation responses to climate change.

How to cite: Durand, M., Neimane-Šroma, S., Gibbs, A. J., Zhuang, X., Lintunen, A., Ezhova, E., Hughes, N. M., Salmon, Y., Gibbs, J. A., Murchie, E. H., and Robson, T. M.: When wuthering winds create fluttering fields: plant canopies under diffuse and fluctuating light, EGU General Assembly 2026, Vienna, Austria, 3–8 May 2026, EGU26-6811, https://doi.org/10.5194/egusphere-egu26-6811, 2026.

EGU26-7447 | ECS | Orals | AS4.7

Interactive versus inventory-based BVOC emissions reshape regional cloud-radiative and ozone feedbacks in EC-Earth3-AerChem-BVOC 

Zhenqian Wang, Twan van Noije, Paul Miller, Philippe Le Sager, and Jing Tang

Biogenic Volatile Organic Compounds (BVOCs) influence aerosol-cloud interactions and climate radiative impacts by changing the formation of Secondary Organic Aerosols (SOA) and atmospheric oxidation capacity. Current Earth System Models (ESMs) typically employ two approaches to BVOC emissions: prescribed offline emission inventories (e.g., MEGAN) or online calculated emissions that do not link to plant physiological processes or vegetation dynamics. To date, most ESMs generally lack a fully interactive coupling of plant BVOC emissions with photosynthesis-based ecosystem processes, vegetation dynamics, meteorology, and atmospheric chemistry, thus the quantified impacts on global/regional radiative forcing and climate patterns remain insufficiently understood.
In this study, we integrated a process-based vegetation BVOC emission scheme that is fully coupled with the TM5 atmospheric chemistry component within EC-Earth3-AerChem. Leveraging this interactive capability, we evaluate the impact by contrasting a simulation driven by prescribed offline inventories against this online experiment. Results for the boreal summer (JJA) indicate that while the online-coupled BVOC scheme captures the general global distribution of BVOCs, it significantly reshapes regional emission hotspots. Specifically, tropical forest source regions exhibit distinct spatial heterogeneity, characterized by an east-west dipole in the Amazon and a core-periphery contrast in the Congo Basin. This emission redistribution caused by online coupling further induces significant changes in SOA optical depth (diagnosed at 550 nm) and Cloud Condensation Nuclei (CCN) concentrations, accompanied by a widespread increase in mid-tropospheric (500 hPa) ozone across the tropics and subtropics.
With an online coupled BVOC scheme, the Shortwave Cloud Radiative Effect (SWCRE) becomes more negative (enhanced cloud cooling) over large areas, consistent with the spatial patterns of net Top-of-Atmosphere (TOA) radiation differences. The surface temperature response presents significant regional divergence, consistent with competing contributions in the radiative budget. Over the Congo Basin, warming signals are linked to widespread reductions in SOA and CCN, which weaken the aerosol cooling effect. In contrast, over parts of the Eastern Amazon, warming occurs despite increased SOA loading, suggesting that the greenhouse effect from enhanced tropospheric ozone overrides the local aerosol cooling potential. Meanwhile, cooling signals appear over ocean regions such as the North Atlantic, consistent with enhanced SWCRE. This suggests that interactive BVOC emissions reshape regional temperature responses primarily through combined BVOC–SOA–cloud and ozone feedbacks.
Overall, compared with the offline inventory approach, online coupled BVOC emissions in EC-Earth3-AerChem significantly change spatial patterns of regional radiative impact and temperature response, indicating that the dynamics in BVOC emissions themselves may be an important source of regional uncertainty in chemistry-coupled climate simulations.

How to cite: Wang, Z., Noije, T. V., Miller, P., Sager, P. L., and Tang, J.: Interactive versus inventory-based BVOC emissions reshape regional cloud-radiative and ozone feedbacks in EC-Earth3-AerChem-BVOC, EGU General Assembly 2026, Vienna, Austria, 3–8 May 2026, EGU26-7447, https://doi.org/10.5194/egusphere-egu26-7447, 2026.

Vegetation plays a fundamental role in the terrestrial carbon-oxygen cycle, with gross primary productivity (GPP) coupled to biospheric O₂ release. Ongoing warming and increasing human activity may perturb this coupling by altering productivity, respiration, and land-surface processes. These effects are of particular concern on the Qinghai–Tibetan Plateau, where such high-elevation regions are highly sensitive to climatic forcing and anthropogenic changes. As a proxy for O2 exchange, near-surface relative oxygen concentration (ROC) reflects the combined effects of biogeochemical processes, anthropogenic activities, and atmospheric transport. Here, we integrate satellite-derived GPP estimates, reanalysis meteorological data, and land-cover classifications to quantify the variability of GPP and ROC across the Qinghai–Tibetan Plateau from 2001 to 2024. We find clear land-use-dependent patterns in the co-variation of GPP and ROC. In natural ecosystems such as grasslands and forests, GPP and ROC increase synchronously, whereas in built-up areas both GPP and ROC decrease. We also find that near-surface air temperature increases across all land-use classes and is strongly correlated with GPP and ROC variability in natural ecosystems. Overall, our results suggest that intensifying human activity simultaneously increase oxygen consumption and reduce the biospheric contribution to O2 production by constraining vegetation productivity. These patterns provide observational evidence of increasingly challenging conditions for livestock in high-elevation regions and of weakened ecosystem functioning under growing human impacts.

How to cite: Zhang, Y., Lee, S., and Zhang, W.: Contrasting productivity–oxygen co-variation in natural and human-influenced areas of the Qinghai–Tibetan Plateau, EGU General Assembly 2026, Vienna, Austria, 3–8 May 2026, EGU26-8267, https://doi.org/10.5194/egusphere-egu26-8267, 2026.

EGU26-8408 | Posters on site | AS4.7

Reliability Assessment and Statistical Calibration of SAI Ensemble Projections in Southeast Asia 

Heri Kuswanto, Hakan Ahmad Fatahillah, Candra Rezzining Utomo, Kartika Fithriasari, and Tintrim Dwi Ary Widhianingsih

Stratospheric Aerosol Injection (SAI) has been widely investigated as a potential Solar Radiation Management (SRM) strategy to offset global warming, with ensemble-based Earth System Model simulations such as the Geoengineering Large Ensemble Simulation (GLENS) providing key evidence for its climatic impacts. However, the reliability of these ensemble projections, particularly at regional scales, remains insufficiently assessed. This study presents a joint evaluation of the projection skill and statistical calibration of GLENS ensemble outputs over Southeast Asia, focusing on precipitation and near-surface temperature variables. First, ensemble skill is assessed against ERA5 reanalysis using rank histograms, confidence interval coverage, Continuous Ranked Probability Score (CRPS), and Brier Score. Results show that raw GLENS projections are systematically underdispersive and biased, with overly narrow uncertainty ranges that frequently fail to capture observations. Projection skill exhibits strong regional contrasts, with poorer precipitation performance over the Maritime Continent and weaker temperature skill over mainland Southeast Asia. These deficiencies indicate overconfident ensemble behavior and limit the direct usability of raw GLENS outputs for impact assessment and decision support. To address these limitations, Bayesian Model Averaging (BMA) is applied as a probabilistic post-processing method to calibrate monthly mean temperature projections. BMA substantially reduces systematic bias, corrects ensemble dispersion, and improves probabilistic reliability across most countries. Post-calibration CRPS values consistently decrease, and predictive distributions better represent observed variability. Overall, the combined results demonstrate that while GLENS captures large-scale climatic signals of SAI, statistical calibration is essential to reduce uncertainty and obtain reliable regional projections. This study highlights the importance of integrating ensemble verification and calibration to support robust interpretation of SRM impacts in climate-sensitive regions such as Southeast Asia.

How to cite: Kuswanto, H., Fatahillah, H. A., Utomo, C. R., Fithriasari, K., and Widhianingsih, T. D. A.: Reliability Assessment and Statistical Calibration of SAI Ensemble Projections in Southeast Asia, EGU General Assembly 2026, Vienna, Austria, 3–8 May 2026, EGU26-8408, https://doi.org/10.5194/egusphere-egu26-8408, 2026.

In this study, we applied the monthly mean near-surface temperatures from the historical and future projections under the SSP585 and G6 sulfur scenarios. The bias-correction and multi-model ensemble averaging were applied to the monthly mean near-surface temperatures from four models and then used to investigate the impact of Stratospheric Aerosol Injection (SAI) on species migration to thermal environments similar to their historical adaptations. Thermal connectivity was used to quantify the migration capacity, with thermal exposure (TE) representing the cumulative temperature difference (°C) along the migration path and thermal velocity (TV) characterizing the minimum migration velocity (km yr⁻¹) required for species to track their historically adapted thermal environments. The results show that SAI exhibits a complex dual effect under the SSP585 scenario. SAI can successfully mitigate thermal stress in more than 80% global land area and provide an additional about 2% of the migratory zone globally. The mitigation effect was most significant in high-latitude regions. On the other hand, implementing SAI under the SSP585 scenario can lead to increased thermal stress in 4% of the land area increasing migration pressure in these regions. The results highlight that temperature response of SAI exhibits heterogeneous impact on thermal environments, necessitating the development of customized adaptation strategies tailored to different geographical regions in the future.

How to cite: Xu, X.: Impact of stratospheric aerosol injection on thermal environment shift, EGU General Assembly 2026, Vienna, Austria, 3–8 May 2026, EGU26-8627, https://doi.org/10.5194/egusphere-egu26-8627, 2026.

EGU26-12802 | Orals | AS4.7

Effects of Warm and Dry Conditions on Ozone Deposition and Biogenic VOC Emissions in the Eastern Mediterranean 

Eran Tas, Qian Li, Maor Gabay, Daniel Choi, and Chen Dayan

Climate change is expected to significantly alter photochemical activity through its impact on biosphere–atmosphere gas exchange. In particular, higher air temperatures and lower relative humidity (RH) over land are projected to enhance biogenic volatile organic compound (BVOC) emissions and surface ozone (O₃) concentrations, while simultaneously suppressing dry ozone deposition via both stomatal and non-stomatal pathways.

This study investigates the effects of warm and dry conditions on dry ozone deposition and BVOC emissions from terrestrial vegetation by synthesizing results from multiple field campaigns conducted between 2013 and 2023 in the eastern Mediterranean. Using eddy covariance and branch-level enclosure measurements, we quantified fluxes and mixing ratios of O₃, VOCs (dominated by BVOCs and measured using PTR-ToF-MS), and nitrogen oxides (NOₓ) across forested, urban, and coastal environments.

Our observations show that under very dry conditions (RH < 30%), the occurrence of positive (upward) O₃ fluxes increases, while the downward ozone deposition velocity increases logarithmically with RH in both urban and rural settings, driven by enhanced surface evaporation and dry air intrusion events from the upper troposphere¹,². Canopy- and branch-level measurements further reveal that under severe drought, instantaneous intraday variations in meteorological parameters serve as better proxies for BVOC emission rates than absolute meteorological values³,⁴. Additional coastal observations indicate substantial marine contributions to isoprene mixing ratios inland, consistent with recent increases in sea surface temperature in the Levantine Basin ⁵.

Collectively, these results point toward enhanced ozone formation and reduced surface removal under future warmer and drier climates, while providing new insights into the modeling of dry ozone deposition and BVOC emissions under warm and dry conditions.


References

1. Choi, D. et al., Sci. Total Environ., 2025. https://doi.org/10.1016/j.scitotenv.2025.180347

2. Li, Q. et al., Sci. Total Environ., 2019. https://doi.org/10.1016/j.scitotenv.2018.12.272

3. Li, Q. et al., Biogeosciences, 2024. https://doi.org/10.5194/bg-21-4133-2024, 2024

4. Li, Q. et al., Sci. Total Environ., 2025. https://doi.org/10.1016/j.scitotenv.2025.180423

5. Dayan, Chen, et al., Atmos. Chem. Phys.,2020. https://doi.org/10.5194/acp-20-12741-2020

How to cite: Tas, E., Li, Q., Gabay, M., Choi, D., and Dayan, C.: Effects of Warm and Dry Conditions on Ozone Deposition and Biogenic VOC Emissions in the Eastern Mediterranean, EGU General Assembly 2026, Vienna, Austria, 3–8 May 2026, EGU26-12802, https://doi.org/10.5194/egusphere-egu26-12802, 2026.

EGU26-16938 | ECS | Orals | AS4.7

Integrating Ozone–vegetation Damage Schemes into SSiB4/TRIFFID: Evaluation of Six Parameterizations and Refinement of Ozone Decay Process Across Plant Functional Types 

Lingfeng Li, Bo Qiu, Siwen Zhao, Xin Miao, Chaorong Chen, Jiuyi Chen, Yueyang Ni, and Weidong Guo

Tropospheric ozone (O3) is a major air pollutant in China that threatens vegetation productivity and ecosystem functions. Quantifying O3-induced impacts on photosynthesis and stomatal conductance is crucial for understanding changes in carbon, water, and energy fluxes between the biosphere and atmosphere on regional and global scales. In recent decades, several parameterization schemes have been developed to describe the photosynthetic and stomatal responses to O3 exposure. However, a significant spread remains when applying different schemes in various model frameworks. In this study, we integrated six flux-based O3-vegetation damage parameterizations into SSiB4/TRIFFID, a well-established land surface model coupled with a dynamic vegetation model, to assess the impacts of O3 pollution on terrestrial ecosystems in China during the 2010s. Our results show that O3 pollution led to approximately a 20% reduction in GPP during the 2010s, with discrepancies ranging from 15% to 31% across different schemes. Comparison of the O3 damage schemes revealed substantial differences in vegetation O3 sensitivity across schemes and plant functional types (PFTs). When compared with observations, the newly developed schemes, such as L2024 and LMA-based approaches, showed more reliable O3 sensitivity, as evidenced by smaller biases relative to peer-reviewed observations. This improved performance can be attributed to the inclusion of a broader range of observational and experimental data, as well as key physiological parameters (e.g., LMA) to better capture O3 sensitivity. Furthermore, we found that the L2024 scheme exhibited strong inhibition of photosynthesis in the late growing season due to cumulative O3 exposure. By refining the "decay" process of O3 accumulation using leaf lifespan parameters and applying the "decay" and "heal" processes across all PFTs, we improved the spatial and temporal distribution of Gross Primary Productivity (GPP) simulations. This study highlights the importance of observational evidence and physiological insights in developing O3-vegetation damage parameterizations. Future efforts should focus on expanding observational and experimental data on O3 responses in China’s natural ecosystems to enhance O3 damage assessment and model development.

How to cite: Li, L., Qiu, B., Zhao, S., Miao, X., Chen, C., Chen, J., Ni, Y., and Guo, W.: Integrating Ozone–vegetation Damage Schemes into SSiB4/TRIFFID: Evaluation of Six Parameterizations and Refinement of Ozone Decay Process Across Plant Functional Types, EGU General Assembly 2026, Vienna, Austria, 3–8 May 2026, EGU26-16938, https://doi.org/10.5194/egusphere-egu26-16938, 2026.

Leaf area index (LAI) is a key indicator of vegetation structure and plays a crucial role in global ecological and climate systems. The accuracy of satellite-based LAI retrievals critically depends on the effective separation of land surface and atmospheric signals in radiation measurements. Most traditional remote sensing algorithms retrieve LAI from land surface reflectance (LSR) products after atmospheric correction. In such schemes, uncertainties in aerosol optical depth (AOD) retrievals are implicitly propagated into LSR and subsequently into LAI estimates, leading to degraded accuracy and reduced spatiotemporal consistency, particularly under conditions of rapidly varying or heavy aerosol loadings.

In this study, we propose a joint retrieval framework that simultaneously estimates AOD, LSR, and LAI directly from FY-3D/MERSI top-of-atmosphere (TOA) reflectance observations. The approach employs an ensemble machine learning–based model, thereby avoiding the conventional decoupled treatment of atmospheric correction and vegetation parameter retrieval. By jointly optimizing atmospheric state variables and land surface biophysical parameters under a unified observational constraint, the method effectively suppresses the propagation of atmospheric correction uncertainties into LAI estimates.

Global retrievals for the period 2020–2023 demonstrate robust performance across a wide range of aerosol loading and observation conditions. The retrieved LAI captures reasonable spatial patterns and seasonal dynamics and shows good consistency with GLASS and MODIS LAI products. This study advances a novel land–atmosphere integrated inversion strategy and establishes a global-scale coupled aerosol-vegetation remote sensing dataset, which can serve as an important technique and data source for improving Earth system models and investigating ecosystem responses to global climate change.

How to cite: Dong, Y. and Li, J.: Joint retrieval of aerosol optical depth and leaf area index from FY-3D/MERSI measurements, EGU General Assembly 2026, Vienna, Austria, 3–8 May 2026, EGU26-17021, https://doi.org/10.5194/egusphere-egu26-17021, 2026.

EGU26-18063 | ECS | Posters on site | AS4.7

Straw-based bioenergy for carbon-neutral agriculture with sustained soil carbon growth 

Xinqing Lu, Yifan Xu, Ziqi Lin, Guocheng Wang, and Rastislav Skalsky

Crop straw management presents a critical trade-off in climate mitigation: balancing straw return for carbon sequestration against conversion into carbon-neutral bioenergy. The potential for agricultural systems to synergistically achieve both ambitious soil carbon growth and substantial greenhouse gas (GHG) reductions remains not fully understood. The integration of the Rothamsted Carbon Model (RothC) and a Bioenergy-Emission-Economic Model (BEE) enabled a systematic evaluation of the carbon balance effects of straw management in China (2021–2100) under varying soil organic carbon (SOC) targets. The results demonstrate that even under an ambitious 4 per mille SOC target, allocating a substantial share of straw resources to bioenergy production still yields robust climate mitigation benefits for the agricultural system. Under this target, the agricultural system exhibits significant climate mitigation potential, capable of fully offsetting China’s total agricultural GHG emissions. Spatial analysis further identifies East and Central China as priority regions for implementing this synergistic pathway, due to their abundant straw resources and relatively high carbon sequestration efficiency. These findings indicate that enhancing soil carbon and deploying straw-based bioenergy are not mutually exclusive, but can act as synergistic pillars for achieving agricultural carbon neutrality through spatially optimized allocation. The agricultural sector has the potential to evolve into a reliable system for climate mitigation that supports carbon neutrality while safeguarding soil health.

How to cite: Lu, X., Xu, Y., Lin, Z., Wang, G., and Skalsky, R.: Straw-based bioenergy for carbon-neutral agriculture with sustained soil carbon growth, EGU General Assembly 2026, Vienna, Austria, 3–8 May 2026, EGU26-18063, https://doi.org/10.5194/egusphere-egu26-18063, 2026.

EGU26-19855 | ECS | Orals | AS4.7 | Highlight

Diffuse radiation and climate feedback effects on the land carbon sink 

Sarah McClory, Andy Wiltshire, Lina Mercado, Steven Hancock, Dominick Spracklen, and Alexandru Rap

Clouds and aerosols influence land carbon uptake by modifying the quantity and quality of light (direct vs diffuse). Diffuse light tends to enhance canopy photosynthesis and vegetation carbon uptake via the diffuse radiation fertilisation effect, but the net response depends on a balance with the concurrent reduction in total radiation. Global and regional effects remain poorly understood, with modelling studies disagreeing on the magnitude, sign, and spatial variability of impacts. One key source of uncertainty lies in ecosystem-climate feedbacks, which are triggered by the initial photosynthesis response to diffuse radiation and can initiate a cascade of effects that further modulate carbon fluxes and light conditions. Despite this potential importance, very few studies have implemented fully coupled simulations.

Here, we use the UK Earth System Model (UKESM), implemented with a coupled interactive diffuse radiation scheme, to investigate global and regional impacts of diffuse radiation on gross primary productivity (GPP). Between 1984-2008, diffuse radiation enhances global GPP by 557.6 PgC. The diffuse radiation effect of the 1991 Mount Pinatubo eruption resulted in substantial productivity effects compared to simulations driven by climatological mean volcanic aerosol. The interactive scheme resulted in similar global GPP compared to the standard UKESM configuration with a fixed diffuse fraction of 0.4, but with important regional differences including greater diffuse radiation fraction and GPP in boreal regions but reductions in the tropics. Climate feedbacks also show considerable regional variation, acting to either enhance or suppress the initial photosynthesis response to diffuse radiation. For example, in the tropics, reduced diffuse fraction leads to lower ET resulting in warming and drying trends that amplify reductions in GPP.

These results highlight how diffuse radiation and resulting climate feedbacks can significantly influence land carbon uptake. These effects may become even more important under potential solar radiation modification (SRM) scenarios. While our results imply that diffuse radiation effects of SRM may increase global GPP, the varying regional impacts indicate that the extent of this influence is likely to be sensitive to how and where additional aerosol forcing is applied. We therefore recommend that fully coupled simulations which include representation of diffuse radiation processes are needed to better evaluate potential ecosystem impacts of SRM, and to improve understanding of the complex relationship between clouds and aerosols and the global carbon cycle.

How to cite: McClory, S., Wiltshire, A., Mercado, L., Hancock, S., Spracklen, D., and Rap, A.: Diffuse radiation and climate feedback effects on the land carbon sink, EGU General Assembly 2026, Vienna, Austria, 3–8 May 2026, EGU26-19855, https://doi.org/10.5194/egusphere-egu26-19855, 2026.

EGU26-3727 | Posters on site | ITS1.19/AS4.8

From Pandemic to Other Emergencies: A New Index Reflects Reduction of Air-Pollution Due to Changes in Mobility Pattern  

Pinhas Alpert, Nitsa Haikin, and Silvia Trini-Castelli

During February-March of 2020 the majority of the world experienced an accelerating pandemic outbreak, driving the authorities to employ social distancing measures (lockdown) in order to slow the SARS-CoV2 spreading. While the pandemic restriction measures were implemented for health reasons, environmental implications became evident, as the social distancing restrictions escalated. A new quantitative index was developed as a ratio assigned to represent the severity of restriction measures on population mobility with respect to non-pandemic “business as usual” in the two greater-cities of Milan (Italy) and Tel-Aviv (Israel). Our index which we named as COVID19 Restrictions Index (C.R.I), was found to be following fairly well the trends and intensity of the apparent transportation-related NOx changes due to authorities’ measures. Although the C.R.I  was developed based on the pandemic “first wave”, a further evaluation of the C.R.I. conducted with data from a later moderated pandemic-measures period (late 2020) and with post-lockdowns data (2021), confirmed the consistency of the C.R.I. as an indicator for air-pollution changes related to public mobility indicators.

The new index is unique by its independence of population or monitoring databases. Therefore, it may be used to represent the potential impacts of restriction measures implemented upon populated areas, either for environmental assessments or planning, or for epidemiological models, air-pollution models or multi-factor analysis, in a broad scenario and not only for pandemic situation (an occurrence of a natural disaster, for example).


Haikin et al 2025 Environ. Res. Commun. https://doi.org/10.1088/2515-7620/ae0875


How to cite: Alpert, P., Haikin, N., and Trini-Castelli, S.: From Pandemic to Other Emergencies: A New Index Reflects Reduction of Air-Pollution Due to Changes in Mobility Pattern , EGU General Assembly 2026, Vienna, Austria, 3–8 May 2026, EGU26-3727, https://doi.org/10.5194/egusphere-egu26-3727, 2026.

EGU26-5747 | ECS | Orals | ITS1.19/AS4.8

AgroServ: an integrated multi-RI platform supporting agroecological transition 

Perrine Florent, Janko Arsic, Jose Manuel Avila, Daniele Baldo, Rene Baumont, Michel Boer, Ivana Cavoski, Sarah Drame, Katharina F Heil, Heba Ibrahim, Roland Pieruschka, Cyril Pommier, Iria Soto, Tiziana Tota, and Claudia Zoani

Agriculture today faces a complex set of challenges, with agricultural lands threatened in two aspects: the impact of climate change and the environmental and social consequences of current agricultural practices. To address this urgent need for more sustainable and resilient food production systems, AgroServ was established as a collaborative project designed to support transdisciplinary solutions. AgroServ brings together researchers, cutting-edge research facilities, industry stakeholders, policymakers, and the farming community into a collaborative ecosystem to accelerate agroecological research and innovation, and knowledge exchange.

With 73 partners across more than 20 countries, AgroServ provides 143 research services distributed within 12 RIs that address areas ranging from molecular processes to ecosystems and social sciences, designed to advance sustainable agriculture practices. Funded by the European Union under the Horizon Europe program (grant agreement No. 101058020), AgroServ has been operating from 2022 to 2027, creating a unique ecosystem that enables cross-sector collaboration through the excellence-based selection of transdisciplinary research projects combining several research services. These services are open to a global agroecology community, including researchers, industry representatives, advisors, innovators, and farmers’ organisations, both within and outside Europe.

To date, AgroServ has successfully launched and completed four Transnational and Virtual Access (TA/VA) calls, with two more calls planned in 2026. Initial findings indicate a balanced mix of early-career and established researchers (57.9% and 42.1%, respectively) among the principal applicants. In addition, data from applications across the 49 selected projects from the first three calls reflected a diverse range of institutions, including universities (64%), applied research centres (26%), industry (9%) and government (2%). The geographical reach of the proposals was also broad, with submissions from across the EU, associated countries, and some non-EU participants, including several low- and mid-income countries.

Beyond its operational period, AgroServ aims to leave a lasting legacy for the global agroecology community. The networks, research services, and insights developed during the project are designed to continue supporting sustainable agriculture. By connecting researchers, policymakers, industry, and farmers, AgroServ envisions a future where knowledge flows seamlessly across borders, accelerating the adoption of resilient, environmentally sound food systems and empowering agricultural communities for years to come.

How to cite: Florent, P., Arsic, J., Avila, J. M., Baldo, D., Baumont, R., Boer, M., Cavoski, I., Drame, S., Heil, K. F., Ibrahim, H., Pieruschka, R., Pommier, C., Soto, I., Tota, T., and Zoani, C.: AgroServ: an integrated multi-RI platform supporting agroecological transition, EGU General Assembly 2026, Vienna, Austria, 3–8 May 2026, EGU26-5747, https://doi.org/10.5194/egusphere-egu26-5747, 2026.

Research Infrastructures (RIs) and Observatories (Obs) are essential to the advancement of environmental and water sciences as they offer facilities, services, and data that foster innovative and high-quality research. However, their effective application beyond institutional or national borders is frequently prevented by fragmentation, low visibility, and complicated access mechanisms. In order to promote multidisciplinary research, maximize the benefits of current research infrastructures, and support evidence-based decision-making, these issues must be resolved.

In this context, as part of the European Partnership WATER4ALL, a comprehensive repository of Research Infrastructures and Observatories (RIs/Obs) is being developed to enhance the connections, use, and accessibility of water-related RIs throughout Europe and beyond. With a focus on their services, data provisioning methods, and their ability to provide remote access to their data and services to users outside of the hosting institution itself, the repository offers an organized and effectively categorized overview of a large number of water-related research infrastructures and observatories across Europe and beyond, that is being continually updated.

The WATER4ALL RIs/Obs repository's added value lies in its ability to include as many as possible freshwater-related RIs & Obs in a fully detailed catalogue, enhancing their connectivity and visibility and acting as a major catalyst of the needs and gaps of the European water sector. The repository serves as a link between data producers, academics, researchers and stakeholders by providing data and metadata, encouraging interoperability, and connecting research with policy and innovation. It improves the effective reuse of current investments in research infrastructures, fosters capacity growth, and makes cross-domain research easier. Additionally, it supports coordinated European and worldwide initiatives, including contributions to global water-related policy processes, and helps to strengthen collaboration across RIs.

This paper presets how the WATER4ALL RIs/Obs repository supports research, innovation, collaboration, and excellence in environmental and water sciences by outlining its design principles, implementation status, and expected impact aligned with European water policy directives, SDGs, and key water priorities.

How to cite: Villa, I. and Mimikou, M.: Enhancing Access, Interoperability and Innovation in Water Research through the WATER4ALL Research Infrastructures and Observatories Repository , EGU General Assembly 2026, Vienna, Austria, 3–8 May 2026, EGU26-6695, https://doi.org/10.5194/egusphere-egu26-6695, 2026.

EGU26-8300 | ECS | Posters on site | ITS1.19/AS4.8

From Field to Cloud: a LoRa IoT System for Mangrove Environmental Monitoring  

Márcio Teixeira, Viktor Miranda, Eduardo Kougem, and José Santos-Junior

Mangroves play a critical role in coastal protection, carbon sequestration, and biodiversity support, yet they are increasingly threatened by anthropogenic activities and climate-induced changes. Long-term environmental monitoring can help to understand the spatial and temporal dynamics of these fragile systems. However, field instrumentation in mangrove environments faces severe operational challenges, including high humidity, salinity, heat, and the absence of reliable power and/or communications infrastructure.

In this work, we present the implementation of a LoRa-based Internet of Things (IoT) network designed to support continuous, autonomous monitoring in five mangrove sites located in southern Brazil—one of the most endangered coastal regions in South America. The system integrates low-power sensors and multi-hop communication nodes capable of maintaining connectivity through harsh and dynamic conditions. To ensure efficient deployment, a radio propagation model specific to mangrove vegetation and canopy density was developed, allowing optimization of transmitter locations and link performance. The network employs a custom communication protocol designed to enhance data resilience and self-diagnose node failures, minimizing maintenance requirements.

All field data are synchronized to a web-based platform enabling real-time visualization, analysis, and integration with other geospatial datasets. This study demonstrates the potential of LoRa IoT networks as a cost-effective tool for continuous monitoring of coastal ecosystems, supporting geoscientific research and conservation efforts in remote and data-scarce environments.

How to cite: Teixeira, M., Miranda, V., Kougem, E., and Santos-Junior, J.: From Field to Cloud: a LoRa IoT System for Mangrove Environmental Monitoring , EGU General Assembly 2026, Vienna, Austria, 3–8 May 2026, EGU26-8300, https://doi.org/10.5194/egusphere-egu26-8300, 2026.

EGU26-8306 | Posters on site | ITS1.19/AS4.8

Calling for a National Model Benchmarking Facility 

Benjamin Ruddell

The modern world uses predictive computer models for many important purposes, including weather predictions, epidemic management, flood forecasting and warnings, and economic policymaking. We need to know how much we can trust the projections of these models, not only to achieve more accurate projections for systems, but also to undertake scientific learning about systems by incrementally testing hypotheses using models. But we routinely fail to adequately benchmark the performance of our complicated models of systems due to the cost and complexity of the task and owing to social and institutional barriers. Decades of lessons learned from Model Intercomparison Projects (MIPs) and similar community modeling efforts have yielded understanding of both the challenge and the opportunity facing 21st century model benchmarking efforts. To implement this understanding at scale, we call for the establishment of a major national research facility for scientific computer model benchmarking- a new class of "environmental research infrastructure". Such a research infrastructure will institutionalize and properly resource the technically challenging and laborious work of computer model benchmarking, thereby establishing a firm foundation for 21st century science and prediction. This facility would advance basic science, overcome many of the social barriers to benchmarking, and improve projections and decisions.

How to cite: Ruddell, B.: Calling for a National Model Benchmarking Facility, EGU General Assembly 2026, Vienna, Austria, 3–8 May 2026, EGU26-8306, https://doi.org/10.5194/egusphere-egu26-8306, 2026.

  The ocean plays a central role in regulating Earth’s climate system, driving the global carbon cycle, and sustaining marine ecosystems. However, substantial data gaps persist in deep and remote ocean regions due to extreme operating conditions, limited underwater acoustic communication capabilities, and the high cost of long-term deployment and maintenance.With the ENVRI community’s growing demand for long-term, distributed, and autonomous observations, current networking architectures—typically centralized, strictly synchronized, and statically configured—are increasingly inadequate to support next-generation marine observatory research infrastructures.

  We propose an intelligent underwater communication and collaborative observation networking framework to support autonomous operation of marine environmental research infrastructures , with a focus on unmanned underwater cluster observation scenarios. The framework elevates the communication network from a passive data-transfer layer to an intrinsic infrastructure capability, enabling distributed underwater observing units to self-organize and operate collaboratively under long propagation delays and limited local information.

  From a system-design perspective, the framework introduces a multi-segment, multi-orthogonal resource-block time–frequency structure, and formulates underwater link scheduling as a conflict-constrained Maximum Weighted Independent Set (MWIS) problem. Link weights jointly capture mission load, information freshness, historical resource utilization, and node-level credibility, thereby reflecting fairness and stability requirements under long-term operation. In contrast to conventional multi-round contention-based or centralized scheduling schemes, we develop a distributed, asynchronous, and consensus-oriented scheduling mechanism: lightweight contention is performed only at transmitters, while receivers act as local consensus anchors to enable conflict-free selection. This design supports concurrent scheduling of multiple links across multiple resource blocks within a single control cycle.

  To improve nodes’ awareness of local conflict structures and traffic dynamics, we incorporate graph neural networks (GNNs) as cognitive components to compute link priority scores on locally constructed conflict subgraphs. This enables an approximation of global scheduling relevance without requiring global topology knowledge or centralized control. 

  Simulation studies and underwater acoustic sensor-network experiments conducted in realistic marine environments show that the proposed framework outperforms conventional approaches in clustered underwater communication scenarios. It effectively prevents individual observation nodes from monopolizing communication resources, enables conflict-free data exchange among unmanned underwater clusters, and improves fairness and operational stability under long-term deployment conditions. Overall, the framework provides a scalable, autonomous, and service-oriented communication and collaborative observation capability for marine environmental research infrastructures (RIs). It can operate in conjunction with advanced sensors, autonomous observation platforms, and cloud-based data services, supporting long-term observations of marine carbon cycling, ecological change, and climate-driven processes.

How to cite: Ji, X., Zhou, F., and Liu, Z.: A Service-Oriented Intelligent Underwater Networking Framework for Autonomous Marine Research Infrastructures, EGU General Assembly 2026, Vienna, Austria, 3–8 May 2026, EGU26-9027, https://doi.org/10.5194/egusphere-egu26-9027, 2026.

EGU26-10638 | Posters on site | ITS1.19/AS4.8

Beacon: A FAIR high-performance, ARCO data lake technology supporting interoperable environmental research 

Robin Kooyman, Peter Thijsse, Dick Schaap, Tjerk Krijger, and Paul Weerheim

Environmental science increasingly relies on large, heterogeneous, and rapidly growing data collections that must be accessed, subsetted, and harmonised efficiently for use in models, digital twins, AI pipelines, and Virtual Research Environments (VREs). The open-source (AGPLv3) Beacon software developed by MARIS addresses this challenge by enabling cloud-native, high-performance data lakes that are easy and fast to access (user) and set-up (provider).

Beacon is designed for very fast real-time access to data subsets from large collections, returning one harmonised file on-the-fly. The software can read datasets stored in a wide variety of file formats (NetCDF, Parquet, Zarr, and Beacon Binary Format) stored locally or stored on S3 compatible Object Stores. Subsetting by users can be done using SQL or JSON queries on individual datasets, multiple datasets at the same time, or entire collections of datasets.

It is written in Rust and C, chosen for their low-level control and superior performance compared to Python-based or traditional database systems. It runs on any platform via Docker containers and consists of a REST API for data querying and index management, combined with core libraries that enable fast data indexing and search. Next to this, Beacon supports making your data collection more interoperable, by including mappings and allowing for harmonisation with other sources on the fly.  

From a provider perspective it is very simple to set-up a Beacon instance containing your data collection. The easiest and fastest way to get a Beacon Instance up and running is through using the Beacon docker compose file. To enable Beacon to connect to an existing S3 bucket requires only 2 additional environment variables to be set. The “AWS_ENDPOINT” which tells Beacon what the URL to the S3 provider is, and the “BEACON_S3_BUCKET” which tells Beacon which Bucket to use as data collection to enable subsetting on. This means it can be set up in less than a minute. 

After setting up your Beacon instance, it is immediately accessible via various entries, such as Jupyter Notebooks or a newly developed User Interface called Beacon Studio. Beacon Studio enables users to easily query, explore, download, and visualise data from a Beacon instance through a User Interface, without requiring programming skills. It allows users to build and execute queries against a Beacon instance using simplified menus that describe the contents of the collection. After running a query, users can download the resulting dataset in multiple formats or display the data directly on an interactive map.

This presentation will highlight Beacon’s technological innovations, cloud-ready deployment pathways, successful implementations in BlueCloud2026 context, and practical and simple applications from a user’s perspective. With its domain-agnostic and scalable architecture, Beacon is now being adopted in national and European initiatives, showcasing its value for a wide variety of different use cases.

How to cite: Kooyman, R., Thijsse, P., Schaap, D., Krijger, T., and Weerheim, P.: Beacon: A FAIR high-performance, ARCO data lake technology supporting interoperable environmental research, EGU General Assembly 2026, Vienna, Austria, 3–8 May 2026, EGU26-10638, https://doi.org/10.5194/egusphere-egu26-10638, 2026.

EGU26-12369 | ECS | Posters on site | ITS1.19/AS4.8

The FAAM Airborne Laboratory - The UK National Capability Research Infrastructure for Airborne Atmospheric Measurements 

Patryk Lakomiec, Stéphane Bauguitte, Oleg Kozhura, Dave Sproson, and Alan Woolley

The FAAM Airborne Laboratory is a national capability research facility dedicated to the advancement of atmospheric science, funded by the United Kingdom Research and Innovation agency. The facility employs 25 full time staff, composed of a multi-disciplinary team of instrumentation and data scientists.  

The FAAM Airborne Laboratory and its partners from the university sector offers its users – academic and commercial – a complete package of support and access to state-of-the art measurement technology. 

The FAAM aircraft is a specially adapted BAe-146-301 Atmospheric Research Aircraft designed to support atmospheric measurements for various applications, thanks to its configurable scientific payload.

We present FAAM's measurements capability for meteorology, greenhouse and reactive gases, aerosols, cloud physics, radiation and remote sensing. FAAM data scientists also support its users community by providing digital tools to guide missions, visualise online data, analyse and interpret observations.

Recent results from deployments of our airborne laboratory to study methane emissions from off- and on-shore oil and gas facilities, sulphur emissions from shipping, and aircraft emissions (air corridors NOx), including the first UK chase flight of a sustainable aviation fuelled aircraft, are summarised in this presentation. The calibration and evaluation of the EarthCARE satellite retrieval products performed by in-situ sampling in various cloud conditions was funded by ESA. 

We finally present the concept of a digital twin to improve the operational flights of the FAAM aircraft, and the first results of an In-Situ Observations Simulator toolkit developed in collaboration with University partners to assimilate airborne observations in geophysical models.

For the past five years, the FAAM Airborne Laboratory has been undergoing a significant upgrade programme of its airframe, scientific infrastructure and services, to safeguard the UK’s research capability, provide frontier science capability and reduce our environmental impact. Some of the upgrades are presented. 

How to cite: Lakomiec, P., Bauguitte, S., Kozhura, O., Sproson, D., and Woolley, A.: The FAAM Airborne Laboratory - The UK National Capability Research Infrastructure for Airborne Atmospheric Measurements, EGU General Assembly 2026, Vienna, Austria, 3–8 May 2026, EGU26-12369, https://doi.org/10.5194/egusphere-egu26-12369, 2026.

Methane emission measurements are crucial in emerging reporting frameworks such as UNEP’s Oil and Gas Methane Partnership (OGMP) 2.0 Standards and the European Union Methane Regulation. Whilst aerial platforms increasingly provide site-level quantification for upstream operations, advanced mobile leak detection (AMLD) remains the dominant methodology for municipal natural gas distribution networks. A growing number of service providers commercialize this methodology, but open-source academic models remain essential to promote transparency and harmonize quantification across regions. Colorado State University introduced an algorithm that correlates leak rates with the methane mole fraction peak maxima measured when driving downwind methane plumes; Utrecht University improved this method by focusing on the peak-integrated area to reduce instrument-specific bias. However, the area quantification is sensitive to the errors in the detection of the peak bases and currently requires substantial human-based (HB) quality control; thus, limiting scalability of this algorithm and opening up to bias introduction by the individual operator’s HB actions.

This study refines the original algorithm by revising detection logic to reduce the need for HB intervention. Unlike the previous single-step approach, the revised version leverages the benefits of signal smoothing to improve peak detection while mitigating the delays introduced by the high-frequency component filtering. Performances have been evaluated on two replication datasets from the original study (November 2022 and June 2024), observing recall ranging from 93.0% - 95.7%, enabling a clear one-to-one matching of algorithm-detected and HB-validated peaks. For 83.6% of the peaks, the algorithm-integrated area was within 20% from the HB-validated counterpart, with precision losses being attributed to the faulted detection of the peak bases at small peaks close to the validation threshold of the method. Finally, the revised algorithm is used on public AMLD data collected in several municipalities across Europe to benchmark similarities and differences across regions and assess usability potential and challenges of integrating AMLD data to support robust methane emission reporting within city networks.

Our findings suggest that the revised algorithm can evolve into a practical proxy for HB area quantification, reducing HB effort by focusing only on peaks characterized by target features such as anomalous duration. This would preserve the overall transparency and reproducibility of the algorithm across different data sources, enabling scalability and benchmarking across different operators and regions, and promote harmonization in city network methane emission reporting initiatives.  

How to cite: Paglini, R. and Röckmann, T.: Advancing Automated Methane Peak Detection for Mobile Surveys: Accuracy, Robustness and Implications for Scalable Deployment, EGU General Assembly 2026, Vienna, Austria, 3–8 May 2026, EGU26-12568, https://doi.org/10.5194/egusphere-egu26-12568, 2026.

EGU26-13825 | Posters on site | ITS1.19/AS4.8

Delta-ENIGMA: an integrated large-scale research infrastructure for delta dynamics 

Smriti Dutta, Hans Middelkoop, and Gerben Ruessink

Understanding and predicting how deltas change under accelerating climate change requires research infrastructures that can capture complex processes across spatial scales, environmental compartments, and disciplinary boundaries. Delta systems are distributed systems, spanning rivers, estuaries, coasts, and dunes, and they emerge from interactions between hydrodynamics, sediment transport, ecological processes, and human interventions. To address this complexity, Delta-ENIGMA is a new, fully distributed research infrastructure in which field instruments, experimental laboratories, knowledge interaction facilities, and data services are spatially and institutionally dispersed, yet functionally integrated within a coherent framework. Delta-ENIGMA is embedded within the pan-European Danubius-RI.

Delta-ENIGMA is a 10+ year research infrastructure (2023-2032) of state-of-art instruments placed across river, estuary, and coastal environments in the Dutch delta. Instead of focusing on one location, the network uses a distributed design with fixed monitoring transects and mobile systems that can be deployed quickly. Advanced tools such as current profilers, seabed mapping systems, laser scanners, wave and turbidity sensors, vegetation cameras and drone observations are used at multiple sites to measure changes along the river-sea continuum. This approach will track both gradual morphological change and short-lived extreme events, which are important for understanding how deltas evolve. Along with the field network, are our experimental laboratory facilities that are hosted at multiple partner institutions. These laboratories include advanced flume systems, wind tunnels, mesocosm setups, and bio-morphodynamic experimental environments that enable controlled investigation of processes that cannot be isolated or sufficiently resolved in the field. By distributing laboratory facilities rather than centralizing them, Delta-ENIGMA leverages existing expertise and infrastructure while ensuring methodological diversity and flexibility. Experimental results can be linked to field observations, enabling systematic cross-scale comparison and model development.

Delta-ENIGMA’s distributed infrastructure also includes a Productive Knowledge Interaction (PROD) facility that extends research beyond measurement and experiments. The PROD facility is a network of thematic labs, such as design labs, serious gaming labs, and interactive decision-support environments. The PROD facility facilitates structured collaboration among researchers, policymakers, practitioners, and other stakeholders. By integrating these facilities within the broader infrastructure, Delta-ENIGMA ensures that scientific insights are translated into usable knowledge and that societal questions actively guide the research directions.

The distributed nature of Delta-ENIGMA is unified through a centralized, open data platform that functions as the digital backbone to the infrastructure. Sensor data from field instruments and laboratories are standardized, documented with metadata, and integrated into a federated data environment based on iRODS and the Yoda repository. This platform supports long-term data storage, interoperability, and open access, enabling researchers to combine datasets across sites, disciplines, and time scales.

Together the distributed set-up of instruments, laboratories, interaction facilities, and data services establish Delta-ENIGMA as a coherent large-scale research infrastructure open to an international community of researchers, practitioners, stakeholders and policy makers. The infrastructure provides a robust foundation for advancing biogeomorphological science, improving predictive capacity, and supporting adaptive delta management in a changing world.

How to cite: Dutta, S., Middelkoop, H., and Ruessink, G.: Delta-ENIGMA: an integrated large-scale research infrastructure for delta dynamics, EGU General Assembly 2026, Vienna, Austria, 3–8 May 2026, EGU26-13825, https://doi.org/10.5194/egusphere-egu26-13825, 2026.

EGU26-14079 | Orals | ITS1.19/AS4.8

AQUANAVI: A New Navigation Tool for Aquatic Mesocosm-Based Research To Address Grand Challenges and Their Mitigation 

Peter Kraker, Stella A. Berger, Jens C. Nejstgaard, Katharina Makower, Tina Heger, Jonathan M. Jeschke, Christopher Kittel, Daniel Mietchen, Maxi Schramm, and Steph Tyszka

Critical environmental changes challenge aquatic ecosystems worldwide. Therefore, coordinating research efforts is increasingly urgent. Mesocosm experiments offer controlled yet realistic settings, and are crucial for understanding the impact of various, often combined stressors on complex aquatic ecosystems and to test mitigation efforts. The AQUACOSM-RI (Research Infrastructure) consortium, comprising over 60 state-of-the-art mesocosm facilities at 28 host institutions across Europe, has been instrumental in advancing aquatic research across climate zones including marine, brackish and freshwater ecosystems.

We will introduce a new tool that enables a highly tailored exploration of existing mesocosm research knowledge to individual search parameters, thereby allowing more collaboration and efficient use of research efforts and resources. Within the  EU OSCARS funded AQUANAVI project (Navigating Grand Challenges and their Mitigation using Aquatic Experimental Ris), we created an interactive atlas of aquatic mesocosm-based experimental research information including the data, publications, reports and further information on mesocosm facilities and research generated by the AQUACOSM consortium and other mesocosm facilities worldwide. Expert knowledge is integrated into a single, accessible platform incorporating Open Knowledge Maps' AI-driven visual discovery tools. AQUANAVI will foster international collaborations, facilitate coordinated mesocosm experiments, knowledge exchange and efficient use of aquatic RIs globally to accelerate the development of environmental mitigation strategies.

How to cite: Kraker, P., Berger, S. A., Nejstgaard, J. C., Makower, K., Heger, T., Jeschke, J. M., Kittel, C., Mietchen, D., Schramm, M., and Tyszka, S.: AQUANAVI: A New Navigation Tool for Aquatic Mesocosm-Based Research To Address Grand Challenges and Their Mitigation, EGU General Assembly 2026, Vienna, Austria, 3–8 May 2026, EGU26-14079, https://doi.org/10.5194/egusphere-egu26-14079, 2026.

Accurate assessment of forest structure, biomass, and carbon stocks is critical for understanding terrestrial ecosystem dynamics and supporting climate change mitigation strategies. Recent advances in remote sensing technologies and artificial intelligence offer opportunities to improve the spatial detail, temporal frequency, and predictive capacity of forest monitoring systems. This study presents an integrated, AI-driven framework that combines multi-source remote sensing data to generate detailed forest inventories and support biomass and carbon stock estimation. LiDAR-derived structural parameters enable the characterization of individual trees, including height, crown dimensions, and canopy density. Elevation and terrain variables are further considered to derive site-specific environmental parameters influencing forest growth and productivity. Deep learning models are employed to harmonize heterogeneous data streams, automate tree-level parameter extraction, and predict forest biomass and carbon stocks across spatial and temporal scales. The approach supports continuous monitoring, uncertainty reduction, and growth prediction, enabling improved detection of changes due to management practices, disturbance events, and climate variability. By linking advanced sensing technologies with AI-based methods and service-oriented data processing pipelines, this work demonstrates how emerging technologies can enhance the operation and value of environmental observation systems. The proposed framework aligns with ENVRI objectives by contributing scalable, reproducible, and FAIR-compatible solutions that bridge in-situ and remote sensing data, supporting science-driven policy development and long-term ecosystem monitoring.

How to cite: Zenonos, A., Sciare, J., and Ciais, P.: An AI-driven multi-source remote sensing framework for forest structure, biomass, and carbon monitoring, EGU General Assembly 2026, Vienna, Austria, 3–8 May 2026, EGU26-14143, https://doi.org/10.5194/egusphere-egu26-14143, 2026.

EGU26-16946 | Orals | ITS1.19/AS4.8

ACTRIS in the Earth system landscape: interoperable observations from research to services 

Giulia Saponaro and the ACTRIS RI Committee Members and ACTRIS Experts

Environmental challenges require Research Infrastructures (RIs) that combine long-term observations with innovation in technologies and services. The Aerosol, Clouds and Trace Gases Research Infrastructure (ACTRIS) addresses this need within the atmospheric domain by integrating advanced observational platforms with user-oriented, interoperable services that enhance scientific and societal impact.

ACTRIS supports technological innovation through state-of-the-art in situ and remote sensing instrumentation, mobile platforms and atmospheric simulation chambers. These Exploratory and Observational Platforms enable process-oriented studies, instrument and methodological developments, while FAIR, long-term and high-quality datasets contribute to international frameworks, ensuring scientific robustness and continuity. ACTRIS observations are also key in the development, evaluation and validation of climate and atmospheric composition models, such as those used by the Copernicus Atmosphere Monitoring Service (CAMS), as well as in the calibration and validation of satellite missions, including EarthCARE.

In parallel, ACTRIS offers virtual, physical and hybrid Trans-National Access (TNA) to advanced facilities, data and expertise, fostering collaboration, experimentation and co-creation across Europe. Engagement within the ENVRI community and the ERIC Forum further supports shared innovation pathways and user-oriented approaches.

How to cite: Saponaro, G. and the ACTRIS RI Committee Members and ACTRIS Experts: ACTRIS in the Earth system landscape: interoperable observations from research to services, EGU General Assembly 2026, Vienna, Austria, 3–8 May 2026, EGU26-16946, https://doi.org/10.5194/egusphere-egu26-16946, 2026.

EGU26-19449 | Posters on site | ITS1.19/AS4.8

FAST – coordinating access to world-class imaging facilities in Europe and beyond 

Richard Wessels, Reinder de Vries, and Geertje ter Maat

Open science extends beyond open access to journal publications and datasets, and into the realm of services, instrumentation, and facilities. Of particular interest to the European research infrastructure landscape is transnational access (TNA), where users obtain free-of-charge physical or remote access to infrastructure, facilities, or equipment. The European Commission has recognised the vital nature of TNA in stimulating research and collaboration within Europe, by funding projects through dedicated EC Horizon calls, and harmonising access policies and regulations.

EXCITE and EXCITE2 are examples of successful EC-funded TNA projects, which provide free-of-charge access to advanced electron microscopy, X-ray tomography, and complimentary imaging and data processing systems, enabling research into Earth and Environmental materials at 22 European partners institutes. To manage the combined total of 7500 days of access for 1500 projects to 40 installations, we have developed the Facility Access SysTem (FAST - https://fast.geo.uu.nl/) as our dedicated access management application.

FAST streamlines the call-for-proposals access process and includes call setup and advertisement, proposal submission, technical feasibility check, scientific review, and reporting. FAST has a database component in which facility and equipment information is stored alongside GDPR-compliant metadata about users, facility managers, reviewers, coordinators, and database managers. The FAST stack consists of an HTML/JS front-end (Tailwind), and a Slim, Laravel/Eloquent and Postgres back-end, while the webserver infrastructure is hosted at Utrecht University. The FAST database can be queried by REST/JSON API, which is used by EPOS ERIC and EPOS MSL to extract facility information that is subsequently displayed in their data portals. FAST integrates ROR-identifiers for facilities and institutions and ORCID for natural persons. This enables linking datasets (DOI) to the facilities and researchers who created them, thereby contributing to the FAIR open science landscape.

Based on user feedback and project requirements FAST is continuously developed further under EXCITE2. Our ambition is to make this robust and user-friendly access system available to the broader ESFRI Environmental community by aligning with ongoing efforts to consolidate the European transnational access research infrastructure landscape. We actively engage with, and are open to, other ERICs/ESFRI landmarks to strengthen collaborations and coordinate shared access policies, technical interoperability, and other synergies. As such, we aim to make FAST the central access system for the Earth and Environmental sciences in Europe.

How to cite: Wessels, R., de Vries, R., and ter Maat, G.: FAST – coordinating access to world-class imaging facilities in Europe and beyond, EGU General Assembly 2026, Vienna, Austria, 3–8 May 2026, EGU26-19449, https://doi.org/10.5194/egusphere-egu26-19449, 2026.

EGU26-20352 | Posters on site | ITS1.19/AS4.8

Advancing Earth system science through innovation – the SIOS innovation award programme  

Christiane Hübner, Andrew Hodson, Massimo Santarelli, Marius Jonassen, and Luca Teruzzi

The Svalbard Integrated Arctic Earth Observing System (SIOS) is a regional observing system for long-term measurements in and around Svalbard, Norway, addressing Earth System Science (ESS) questions related to Global Change. The observing system builds on the extensive and diverse world class research infrastructure already established in Svalbard by institutions from many nations. This includes a substantial capability for utilising remote sensing resources to complement ground-based observations. SIOS currently has 29 members from 10 countries who collaborate to develop the observing system and share infrastructure, data and knowledge.

SIOS has established an innovation award programme for initiatives that develop an innovative technology or method to improve observation capability or decrease the environmental footprint of research and monitoring in the field of Earth System Science in Svalbard.

Up to now, four projects have received the award, whereof one project has been implemented and three are currently being developed. This talk will present the concept of the innovation award and the winning projects.

Hodson, A et al. "A Terrestrial methane seepage observatory" - the project implemented real-time, continuous methane emission monitoring from a representative coastal hotspot for methane emission: the Lagoon Pingo near Longyearbyen.

Santarelli M et al. "Develop an Automatic Climate Station prototype for remote sites observations in the Arctic" - the project aims to increase the observational capacity of standard automated weather stations used for monitoring atmospheric variables. It will develop  and test an integrated solution with a hydrogen-based energy storage system for storing available power from renewable sources (photovoltaics and wind energy). The solution will demonstrate advantages of the hydrogen-based storage system as compared to traditional battery storage in terms of compactness, energy storage efficiency, environmental sustainability, and long-term storage under intermittent energy sources.

Jonassen M et al. "Mobile Atmospheric Observations in Svalbard" - the projects aims to develop a prototype atmospheric boundary layer observing system to increase the coverage of in-situ observations in the Arctic. The idea is to mount meteorological sensors on snowmobiles and belt wagons that are regularly used during field operations. These mobile platforms represent a great untapped potential for filling data gaps in the operational network of weather stations.

Teruzzi L et al. “Snow Physical properties and Assessment of Radiative transfer in the snowpacK” (SPARK) - the project will design and validate a custom optical probe for measurement of light propagation, snow stratigraphy and grain size directly in the field. This is a completely new experimental approach which will help scientists to understand the complex interplay between light, ice, photochemical and biological activity: critical knowledge for predicting Arctic climate feedbacks, ecosystem responses, and broader Earth-system dynamics.

How to cite: Hübner, C., Hodson, A., Santarelli, M., Jonassen, M., and Teruzzi, L.: Advancing Earth system science through innovation – the SIOS innovation award programme , EGU General Assembly 2026, Vienna, Austria, 3–8 May 2026, EGU26-20352, https://doi.org/10.5194/egusphere-egu26-20352, 2026.

EGU26-20594 | Orals | ITS1.19/AS4.8

Obs4Clim: A Collaborative Innovation Project for an Integrated Atmospheric Observing System  in France 

Peyre Galane, Sauvage Stéphane, Dubost Ariane, Oliveri Matilde, Philippin Sabine, Valérie Thouret, and Michel Ramonet

Addressing environmental challenges related to climate change and air quality requires high-quality observations and data services. The Obs4Clim project is a joint initiative of the three French components of European Research Infrastructures (RIs) in the atmospheric domain: ACTRIS, IAGOS, and ICOS. OBS4CLIM aims at developing innovative services to meet the evolving needs of research communities and stakeholders. The objectives and outcomes of the Obs4Clim project include the development of advanced data services, expansion of spatial and temporal coverage of atmospheric observations, and establishment of a mature access framework for users.


Obs4Clim provides atmospheric RIs with adequate investment to keep serving the users at the highest level of quality over the next 15 years and to engage in developments to further respond to emerging needs, e.g. enhancing the networks in their four dimensions (longer and uninterrupted time-series, synergies with space-based observations, expanding global, denser network in specific areas, smart specializations). The 8-year investment plan has three main objectives: fostering attractiveness of atmospheric facilities, enhancing the capacity of atmospheric RIs to provide state-of-the-art data services, and expanding spatial and temporal coverage.

Significant progress has been made in the investment phase of the project, with a substantial portion of equipment expenditures already realized. Adjustments to technical choices and budget reallocations have been made to accommodate specific operations and facilitate co-financing opportunities. Implementation of acquired instruments has advanced significantly, with innovative developments in new observation variables. For example, the use of fluorescence on Lidars now provides new information on aerosol characteristics. High-performance instruments have been developed to better quantify greenhouse gases. ICOS and ACTRIS observation platforms have been equipped with new observation capabilities to measure variables of interest, such as bioaerosols and ammonia. The IAGOS equipment project has shifted towards a new type of aircraft, the Airbus Beluga, to enhance geographic and temporal coverage of vertical profiles. The onboard instruments are currently undergoing certification.

The Obs4Clim project is developing unique services to remain a hub for innovation in research and technology. It is integrated into a mature framework for access, recognized at both national and international levels, which includes physical and remote access to atmospheric facilities as an integral part of the RI service portfolios. By strengthening the capacity to translate the wealth of climate and atmospheric data into actionable insights, Obs4Clim supports decision-makers in finding ways to achieve a clean-air, climate-resilient, and low-carbon society.

How to cite: Galane, P., Stéphane, S., Ariane, D., Matilde, O., Sabine, P., Thouret, V., and Ramonet, M.: Obs4Clim: A Collaborative Innovation Project for an Integrated Atmospheric Observing System  in France, EGU General Assembly 2026, Vienna, Austria, 3–8 May 2026, EGU26-20594, https://doi.org/10.5194/egusphere-egu26-20594, 2026.

EGU26-20972 | Orals | ITS1.19/AS4.8

The Portable Ice Nucleation Experiment PINE: Current activities and new developments 

Ottmar Möhler, Ben J. Murray, Michael Gehring, Joachim Curtius, Pia Bogert, Alexander Böhmländer, Nicole Büttner, Martin Daily, Achim Hobl, Larissa Lacher, Jack Macklin, Joseph Robinson, Romy Ullrich, and Alexander Vatagin

Atmospheric ice-nucleating particles (INP) play an important role for primary ice formation in clouds, and by that often initiate the formation of precipitation, influence the phase of clouds, and also impact their albedo and lifetime. A lack of data on the spatial and temporal variation of INPs around the globe limits our predictive capacity and understanding of clouds containing ice. Automated instrumentation that can robustly and accurately measure INP concentrations across the full range of tropospheric temperatures is needed to address this knowledge gap.

The Portable Ice Nucleation Experiment PINE was developed to close this gap. It became available in 2019, and an increasing number of instruments is producing a quickly growing database of INP number concentrations around the world (see https://zenodo.org/records/16745515). The measurements of immersion freezing INP cover a temperature range from about -15°C to -33°C and deliver longer term continuous data records for months or years with a time resolution of up to 5 minutes.

Of particular interest are INP measurements in the free troposphere which are ice-active at temperatures below -40°C and contribute to the formation of ice crystals in cirrus clouds. This led to the development of the two new PINE versions called PINEair and PINEtri, which are optimized for measuring INPs at controlled cirrus formation temperatures between -40°C and -65 °C and at controlled ice supersaturations. PINEair was successfully tested and operated onboard the German HALO research aircraft during the HALO-South campaign, the first versions of PINEtri are currently built. PINEtri can be operated like PINEair but is developed for laboratory or ground-based measurements e.g. at high-altitude observatories for measurements in the free troposphere.

The latest innovation is the development of another PINE version called PINEmon. This instrument version will especially be optimized and suitable for longer-term and continuous monitoring of immersion freezing INP at global atmospheric observatories, e.g. as part of the ACTRIS Research Infrastructure or the Global Atmospheric Watch program.

This contribution will explain the working principle of the PINE instruments and shows highlights of previous and ongoing measurements and applications.

How to cite: Möhler, O., Murray, B. J., Gehring, M., Curtius, J., Bogert, P., Böhmländer, A., Büttner, N., Daily, M., Hobl, A., Lacher, L., Macklin, J., Robinson, J., Ullrich, R., and Vatagin, A.: The Portable Ice Nucleation Experiment PINE: Current activities and new developments, EGU General Assembly 2026, Vienna, Austria, 3–8 May 2026, EGU26-20972, https://doi.org/10.5194/egusphere-egu26-20972, 2026.

Environmental research infrastructures increasingly rely on in-situ Earth observations to address complex challenges such as climate change, biodiversity loss, water scarcity, air pollution, etc. While the availability of observing systems and data services continue to increase, the effective use of in-situ geospatial data remains fragmented due to the lack of common data management practices and limited interoperable mechanisms to align user demands with data provisions.

This contribution presents the G-REQS (Geospatial in-situ Requirements), a database and methodology developed within the Group on Earth Observations (GEO) to systematically capture, manage, and analyse user needs and requirements for in-situ observations. G-REQS enables the identification of technical barriers to data access and use, as well as gaps in spatial and temporal coverages, and supports a structured matchmaking process between data users, data providers and data intermediary actors or networks that supply or could supply that data. Through this process, opportunities for improved data access can be identified, while recurring requirements can reveal systemic gaps that can be escalated within GEO to inform coordinated actions and future data production.

Building on the G-REQS experience, the Geospatial Observation Needs and Requirements (GONAR) Standards Working Group has been established within the Open Geospatial Consortium (OGC). GONAR aims to standardize the capture of user needs and requirements for geospatial observations through a common data model and a proposed “OGC API – Requirements”, enabling exploitation, interoperability, and reuse of requirements across systems. By establishing open, interoperable, and machine-actionable representations of observational requirements, this approach sets the foundation for more automated, user-cantered, and fit-for-purpose environmental data services.

This work is funded by the European Environment Agency (EEA) under the EEA-RTD SLA on "Enhancing the access to in situ Earth observation data in support of climate change adaptation policies and activities" know as GEO-IDEA project (Framework Contract No EEA/DIS/R0/24/007), as a continuation of the EEA-RTD SLA on "Mainstreaming GEOSS Data Sharing and Management Principles in support of Europe's environment" known as InCASE project (Framework Contract No EEA/DIS/R0/21/016).

How to cite: Brobia, A. and Masó, J.: Aligning user requirements and in-situ Earth observations: from G-REQS to interoperable standards in OGC GONAR, EGU General Assembly 2026, Vienna, Austria, 3–8 May 2026, EGU26-21471, https://doi.org/10.5194/egusphere-egu26-21471, 2026.

European environmental research infrastructures (ENVRIs) such as ACTRIS, ICOS and eLTER provide long-term, high-quality observations that underpin our understanding of atmospheric composition, greenhouse gas budgets and ecosystem processes. While these infrastructures deliver indispensable reference data, their observing systems are primarily based on fixed stations and plots, which limits the ability to resolve fine-scale spatial variability, short-term dynamics and vertical gradients in the atmospheric boundary layer and across ecosystem canopies. Addressing these gaps is increasingly critical in the context of climate change, air quality, land–atmosphere interactions and anthropogenic emission monitoring.

Unmanned Aerial Systems (UAS) have rapidly matured as scientific platforms capable of carrying lightweight atmospheric and environmental sensors with high spatial and temporal flexibility. Drones enable targeted measurements above and within ecosystems, around existing observation sites, and in heterogeneous or rapidly changing environments that are difficult to capture using traditional infrastructure alone. At the same time, UAS operations offer a relatively low environmental footprint and can complement fixed infrastructures without compromising long-term measurement continuity.

Despite their growing use in individual research projects, the integration of drone-based measurements into ENVRIs remains fragmented. Challenges include sensor integration, data interoperability, regulatory constraints, operational standardisation, and alignment with existing RI data quality and governance frameworks. As a result, the potential of drones to systematically enhance ENVRI observing capabilities has not yet been fully realised.

This contribution outlines the scientific and infrastructural motivation for a coordinated approach to drone-based environmental observations within European ENVRIs. We discuss how UAS can complement atmospheric, greenhouse gas and ecosystem measurements by bridging spatial scales, supporting process-level studies, and improving the interpretation of long-term observations. The presentation highlights key requirements for successful integration, including sensor traceability, interoperability with RI data systems, and operational concepts compatible with routine RI use. By bringing together perspectives from atmospheric, carbon cycle and ecosystem research communities, this work aims to stimulate discussion and engagement around the role of drones as enabling platforms for the next generation of environmental research infrastructures in Europe.

How to cite: sciare, J.: Unmanned Aerial Systems (UAS) as Enabling Platforms for Next-Generation Environmental Research Infrastructures, EGU General Assembly 2026, Vienna, Austria, 3–8 May 2026, EGU26-22327, https://doi.org/10.5194/egusphere-egu26-22327, 2026.

EGU26-22424 | ECS | Orals | ITS1.19/AS4.8

AERŌTAPE®: a novel technology for real-time quantification and characterization of dust and its sources 

Eleni Kolintziki and the ANR-AERODUST / DUST-DN team

EU Member states are allowed to subtract the PM10 contribution from natural sources (such as desert dust or sea salts) from the observations when verifying compliance with air quality standards. However, they must do so with pertinent data, which can be sometimes challenging. The recent EU Air Quality Directive enforces a drastic reduction of PM10 annual limit values (from 40 to 20µg/m3) and daily limit values (from 35 times above 50µg/m3 to 18 times above 45µg/m3) by 2030. These constraints will increase the need to apportion carefully natural and anthropogenic PM sources in the coarse fraction, with particular attention to traffic sites. In fact, the latter exhibit high PM concentrations and are exposed to various local (road traffic resuspension) and regional (long-range transported) dust sources.

AERŌTAPE®, a novel cost-effective instrument developed by Oberon Sciences (France), enables real-time (down to a few seconds), in-situ characterization of supermicron aerosols by integrating impaction-based aerosol sampling, onboard microscopy, and AI-driven image analysis. AERŌTAPE® produces high-resolution pictures with detailed single particle-resolved data, including number, size, shape, and color, enabling accurate information of supermicron aerosols (with no hypotheses on their shape or optical properties) and allowing to capture the dynamic of the various coarse PM sources. Compared to Optical Particle Counters (OPCs), AERŌTAPE® provides added value through (i) camera-based real-time counting, (ii) acquisition of geometric shape information, and (iii) color capture via RGB arrays. This enhances differentiation between particle types such as dust, pollen, and combustion ash, thus enabling a more accurate assessment of natural contributions to PM levels.

Field measurements at urban background sites in Cyprus (Eastern Mediterranean) allowed to demonstrate the instrument’s robustness (1-year continuous outdoor deployment), and its high precision and reproducibility against regulatory PM reference instruments (TEOM-FDMS and FIDAS), while providing useful additional high-time resolution information on aerosol properties. These results highlight the potential of AERŌTAPE® to deliver unattended stable and reliable measurements of coarse PM (PM2.5-10) together with a comprehensive single particle characterization, thereby supporting regulatory compliance, air quality management, and potentially improved source apportionment in response to increasingly stringent air quality standards.

Further field campaigns in Athens, Cairo, Beirut, Paris, and Abu Dhabi will provide region-specific samples for training and validating particle classification methods. These data will support the development of a robust PM dust database and enhance characterization of dust sources, including quantification of local versus regional contributions.

Funding:

This research is supported by the AERODUST project, funded by the Agence Nationale pour la Recherche (grant agreement ANR 24 CE04 0814 01).

This research is supported by the Dust-DN project, funded by the European Union under the Marie Skłodowska-Curie Actions (grant agreement 101168425), and by the corresponding national agencies of the United Kingdom (UKRI) and Switzerland (SERI). Views and opinions expressed are however those of the author(s) only and do not necessarily reflect those of the European Union and Marie Skłodowska-Curie Actions (MSCA). Neither the European Union nor MSCA can be held responsible for them.

How to cite: Kolintziki, E. and the ANR-AERODUST / DUST-DN team: AERŌTAPE®: a novel technology for real-time quantification and characterization of dust and its sources, EGU General Assembly 2026, Vienna, Austria, 3–8 May 2026, EGU26-22424, https://doi.org/10.5194/egusphere-egu26-22424, 2026.

EGU26-59 | ECS | Posters on site | AS4.9

High-resolution inventories for Reactive Nitrogen Emissions fromChina’s livestock during 2005–2022 

Youfan Chen, Yuanhong Zhao, Lin Zhang, Yixin Guo, Mi Zhou, Lulu Chen, Yu Yan, Tingkun Li, Yinju Zhang, Yunfan Xu, and Bin Luo

China is a global hotspot for reactive nitrogen (Nr) emissions driven by its large livestock sector, which contribute to air pollution, climate change, and biodiversity losses. Despite their importance, current emission inventory development efforts often address singular Nr species, lacking a comprehensive presentation of all Nr species together and their interconnected features. This may jeopardize China’s achievements of carbon neutrality and clean air. In this study, we developed a high-resolution (0.1° × 0.1°) inventory of monthly Nr emissions from livestock manure in China for 23 livestock typesfrom 2005 to 2022. Based on a unified dataset, our inventory provides detailed estimates of multiple emissions from livestock, including ammonia, nitrogen oxides, and nitrous oxide. The inventory can serve as a valuable resource for atmospheric modelling and support integrated nitrogen management strategies in response to China’s evolving agricultural landscape, facilitating future decision-making to tackle environmental challenges associated with the agriculture sector.

How to cite: Chen, Y., Zhao, Y., Zhang, L., Guo, Y., Zhou, M., Chen, L., Yan, Y., Li, T., Zhang, Y., Xu, Y., and Luo, B.: High-resolution inventories for Reactive Nitrogen Emissions fromChina’s livestock during 2005–2022, EGU General Assembly 2026, Vienna, Austria, 3–8 May 2026, EGU26-59, https://doi.org/10.5194/egusphere-egu26-59, 2026.

EGU26-1055 | ECS | Orals | AS4.9

Estimating high-resolution top-down nitrogen oxides emissions for improving air quality and public health in China 

Gongda Lu, Yu He, Clarissa Baldo, Yifan Li, Jiantao Dong, Qishuai Zhang, Linhan Chen, Hui Chen, Guolei Chen, Jialin Li, Yi Yang, Jingxuan Zhao, Yue Huang, Zongyao Wang, Li Fang, Lijuan Zhang, and Pengfei Ma

Nitrogen oxides (NOx) are key air pollutants that directly affect health and are precursors of health-harming fine particulate matter (PM2.5) and ozone. China has implemented stringent emission control measures over the past decades, leading to significant declines in air pollution. To further improve air quality and protect public health, more precise and timely tools are needed for pinpointing emission sources and assessing changes in emissions. While bottom-up emission inventories are essential, they often suffer from reporting lags, coarse resolutions, and potential systematic biases. Here we use satellite NO2 observations from the TROPOspheric Monitoring Instrument (TROPOMI), ERA5 meteorological reanalysis products and a divergence-flux method to derive high-resolution (0.025° × 0.025°) NOx emissions across China in 2019-2024. We independently evaluate bottom-up emission inventories, identify emission sources, and report on emission trends in China. Our top-down estimates show good spatial correlations (r ≥ 0.7) with widely-used national and global bottom-up inventories, but there is a systematic underestimation in bottom-up emissions (~60% at the city level and ~70% at the provincial level). Top-down emission estimates effectively pinpoint large point sources (e.g., industrial clusters and ports) that are either missing or underrepresented in bottom-up emission invntories. The 2019-2024 trend analysis shows a significant decline in NOx emissions across many of China's populated and industrialized regions, despite increases in some rapidly developing areas. Currently underway is the use of our top-down emission estimates to improve air pollution modeling and enable more accurate health burden assessments in China. Our results will also enhance the understanding of regional air quality and atmospheric chemistry.

How to cite: Lu, G., He, Y., Baldo, C., Li, Y., Dong, J., Zhang, Q., Chen, L., Chen, H., Chen, G., Li, J., Yang, Y., Zhao, J., Huang, Y., Wang, Z., Fang, L., Zhang, L., and Ma, P.: Estimating high-resolution top-down nitrogen oxides emissions for improving air quality and public health in China, EGU General Assembly 2026, Vienna, Austria, 3–8 May 2026, EGU26-1055, https://doi.org/10.5194/egusphere-egu26-1055, 2026.

EGU26-1098 | ECS | Posters on site | AS4.9

Linking Volatile Organic Compounds (VOCs) in the Ambient Air of Malaysia with its Sources, Environmental Impacts, and Potential Health Risks 

Nor Syamimi Sufiera Limi Hawari, Mohd Talib Latif, Norfazrin Mohd Hanif, Murnira Othman, and Matthew J. Ashfold

Volatile organic compounds (VOCs) are significant air pollutants emitted from both anthropogenic and biogenic sources, impacting atmospheric photochemical processes and human health. This study aimed to determine the variations and potential sources of VOCs concentration in ambient air across various land-use types, including urban, industrial, and background areas in Malaysia. It also evaluated the impact of VOCs on photochemical processes and assessed health risks. The concentrations of ∑30 VOCs were measured between January 2018 and December 2019 at ten continuous air quality monitoring (CAQM) stations operated by the Malaysian Department of Environment (DOE). The positive matrix factorisation (PMF) model was used to identify the VOCs source apportionment. The VOCs contributions to ozone formation potential (OFP) and secondary organic aerosol formation potential (SOAFP) were quantified. Non-carcinogenic and carcinogenic risks of specific VOCs species were assessed using the health risk assessments (HRA) for both children and adults. The results revealed the highest VOCs concentrations in urban areas (125 ± 116 µg m-3 at the S3 station), followed by industrial (112 ± 112 µg m-3 at the S4 station and 95.4 ± 87.1 µg m-3 at the S1 station), while the lowest concentrations were recorded at the background site (55.5 ± 65.4 µg m-3 at the S9 station). Fuel evaporation (28.5%) was the major contributor in both urban (S3 station) and industrial (S4 station) areas, whereas combustion and biogenic sources (29.7%) dominated in background areas (S9). For the VOCs photochemical reactivity, alkenes (182 µg m-3, 59.0%) and aromatics (79.8 µg m-3, 25.9%) had the highest mean contributions to ozone (O3)formation across all monitoring stations. Aromatic VOCs recorded the highest SOAFP levels at all stations, ranging from 351 µg m-3 (88.1%) to 2312 µg m-3 (96.7%). The hazard quotient (HQ) and hazard index (∑HI) for non-carcinogenic risk were below 1.00 for both children and adults. The excess lifetime cancer risk (ELCR) for adults was above the regulatory threshold of 1.00 × 10-⁶ at all monitoring stations, indicating potential carcinogenic risk due to benzene exposure. Given the limited research on VOCs in Malaysia, the outcomes of this study will be vital for informing nationwide policy and standards for ambient VOCs monitoring.

How to cite: Limi Hawari, N. S. S., Latif, M. T., Mohd Hanif, N., Othman, M., and Ashfold, M. J.: Linking Volatile Organic Compounds (VOCs) in the Ambient Air of Malaysia with its Sources, Environmental Impacts, and Potential Health Risks, EGU General Assembly 2026, Vienna, Austria, 3–8 May 2026, EGU26-1098, https://doi.org/10.5194/egusphere-egu26-1098, 2026.

EGU26-1145 | ECS | Orals | AS4.9

Is air pollution mitigation enough? When adaptation is needed to protect health 

Stefania Renna, Carlos Rodriguez-Pardo, and Lara Aleluia Reis

The 2021 update to the World Health Organization (WHO) Global Air Quality Guidelines (AQGs) for Fine Particulate Matter (PM2.5) presents ambitious targets that may not be achievable worldwide by 2030 and beyond. Regions influenced by biogenic sources, hard-to-abate sectors, or unique orographic and meteorological conditions may face persistent challenges to meet healthy targets. This research aims to evaluate the feasibility of the WHO’s AQGs for PM2.5 on a global scale based on recent historical data, complementing evidence from simulations. Through a comprehensive review of the existing literature and analysis of recent data, we use a variety of methods to show that natural sources and background concentration levels of PM2.5 constitute a significant share of overall concentrations and a source of inequality in exposure. Our study includes reanalysis data, high-resolution empirical estimates, and measurements from ground-level monitoring stations around the world. Using 1-km data we analyze inequality in exposure to air pollution across age, gender and income. We find that the recommended AQGs are widely exceeded globally, and show substantial heterogeneity between regions. Exceedances are particularly pronounced in many parts of Asia and Africa, where populations are exposed to unhealthy PM2.5 levels for most of the year. In roughly a third of the analyzed areas, desert dust and sea salt aerosols alone cause exceedances of the guidelines, indicating that mitigation is not sufficient and adaptation is required. Globally, only a small share of the population currently breathes air within the recommended limits, yet we find that spatial resolution matters when assessing exposure. Income is the main source of inequality in exposure, while differences by age and gender are minimal when considering ambient air levels.

How to cite: Renna, S., Rodriguez-Pardo, C., and Aleluia Reis, L.: Is air pollution mitigation enough? When adaptation is needed to protect health, EGU General Assembly 2026, Vienna, Austria, 3–8 May 2026, EGU26-1145, https://doi.org/10.5194/egusphere-egu26-1145, 2026.

EGU26-1203 | ECS | Orals | AS4.9

Urban Heat–Health Risk assessment over Ahmedabad city, India: A Hyperlocal approach using WRF Model and Satellite Data 

Viral Patel, Anurag Kandya, Shubham Kela, Shruti Uphale, and Kaivalya Gadekar

Heat–health risk assessment forms a cornerstone of climate-resilient urban planning and is essential for advancing the United Nations Sustainable Development Goals (SDGs 3, 11, 13, and 15). In this study, a hyperlocal, high-resolution analysis was carried out for Ahmedabad—one of India’s fastest-growing metropolitan regions with a population exceeding 8.2 million. Using the Weather Research and Forecasting (WRF) model, key meteorological variables including 2-m air temperature and relative humidity were simulated at an hourly timestep and 1 km × 1 km spatial resolution for an extreme-heat episode from 18 to 25 May 2024.
The Heat Index was computed for each grid cell and subsequently integrated with population density and vegetation scarcity (derived from satellite-based greenness indicators) to develop a Heat-Health Risk Index (HHRI). The HHRI was classified into five categories—very low (0–0.1), low (0.1–0.2), moderate (0.2–0.3), high (0.3–0.4), and very high (>0.4). A unique component of this study is the computation of occurrence frequency of each HHRI class at every grid cell across all heat-wave hours, generating the first spatially continuous temporal–risk map for the city at this granularity.
Results reveal that approximately 6% of Ahmedabad experienced very-high heat-health risk during 10–40% of all heat-wave hours, while about 17% of the city encountered high risk for 30–45% of the period. At the ward level, Khokhra, Khadia, Amraiwadi, and Bhaipura-Hatkeshwar emerged as persistent heat-stress hotspots, spending nearly 15% of the time in the very-high-risk category. Fifteen additional wards faced high or very-high risk for at least one-third of the event. In contrast, peri-urban wards such as Gota, Chandlodia, Chandkheda, Thaltej, and Bodakdev exhibited very-low risk for more than 90% of the period, attributed to lower population density and higher vegetation cover.
This hyperlocal heat-health risk framework provides actionable insights for strengthening Ahmedabad's Heat Action Plan. By revealing fine-scale spatial and temporal variations in vulnerability, the study offers a robust evidence base for targeted interventions, resource prioritisation, and long-term climate and public-health planning. The approach can be replicated for other Indian and global cities seeking data-driven strategies to build resilience against intensifying heatwaves.

keywords:Heat Health Risk Assessment, Urban Heat, Ahmedabad, WRF Model, Heat Action Plan, SDGs

How to cite: Patel, V., Kandya, A., Kela, S., Uphale, S., and Gadekar, K.: Urban Heat–Health Risk assessment over Ahmedabad city, India: A Hyperlocal approach using WRF Model and Satellite Data, EGU General Assembly 2026, Vienna, Austria, 3–8 May 2026, EGU26-1203, https://doi.org/10.5194/egusphere-egu26-1203, 2026.

EGU26-1765 | ECS | Orals | AS4.9

Health Implications and Deployment Potential of Post-Combustion CCS in the U.S. Power Sector 

Wilson McNeil, Robert Harley, Chelsea Preble, and Corinne Scown

Post-combustion carbon capture and storage (CCS) can substantially reduce CO2 emissions from coal and natural gas combined cycle (NGCC) power plants before entering the atmosphere. Little is known about the maximum potential of CCS across U.S. thermoelectric power plants or the potential air pollution and resulting human health effects associated with its retrofit. Integrating CCS affects other air pollutant emissions as well. The flue gas must be adequately pretreated to remove air pollutants that react with solvents to cause losses, while solvents can break down and lead to ammonia (NH3) emissions. In this study, we explore the air pollution and CO2 emissions impacts of national-scale post-combustion CCS adoption at coal and NGCC plants in the U.S. using monoethanolamine (MEA) and CESAR1 as representative first- and second-generation solvents, respectively. We quantify the effects of CCS on human health using the InMAP Source-Receptor Matrix (ISRM), which transforms emissions of primary PM2.5 and precursors of secondary PM2.5 into total changes in concentrations. This analysis brings together four main components in an integrated assessment model: (1) power plant CCS retrofit scenarios for coal and NGCC plants, (2) grid mix and generation scenario modeling, (3) plant-level emissions changes, and (4) the quantification of human health and greenhouse gas (GHG) emissions impacts.

If CCS retrofits are only viable on newer facilities, 97% of NGCC plant emissions are addressable compared to only 27% of coal plant emissions. Potential human health benefits of CCS retrofits are concentrated at coal plants, where the net benefits of added flue gas pretreatment are substantial, regardless of solvent. NGCC plants, however, require NH3 emissions controls and/or modern solvents, as using MEA without NH3 emissions controls could increase net human health burdens fourfold. This study shows that post-combustion CCS using amine-based solvents can have human health co-benefits or co-burdens depending on the solvent choice, fuel type, existing flue gas concentration, and presence of NH3 emission controls. Further, we provide policy-relevant recommendations for achieving greenhouse gas reduction benefits while limiting air pollution-related human health effects.

How to cite: McNeil, W., Harley, R., Preble, C., and Scown, C.: Health Implications and Deployment Potential of Post-Combustion CCS in the U.S. Power Sector, EGU General Assembly 2026, Vienna, Austria, 3–8 May 2026, EGU26-1765, https://doi.org/10.5194/egusphere-egu26-1765, 2026.

EGU26-2396 | Posters on site | AS4.9

Improved bottom-up approach for estimating HCFC-141b emissions and reduction potential in China from 2000 to 2060 

Jing Wu, Tong Wang, Dayu Zhang, Bo Yao, Pallav Purohit, and Lin Peng

Accurate assessment of HCFC-141b emission trends is critical for compliance with the Montreal Protocol and climate mitigation. However, substantial gaps persist between top-down and bottom-up estimates, and systematic methods for gridded emission calculation and validation remain lacking. To address these gaps, we refine the emission estimation methodology for polyurethane foams during the waste disposal stage and establish a framework for calculating and validating gridded HCFC-141b emissions based on emission factor method and NAME model. Using China as a case study, we develop and verify a gridded inventory during 2000-2024. Estimated cumulative emissions are 294.0 kt, 133.7 kt lower than the latest bottom-up estimate and align more closely with top-down emissions, narrowing the gap between the two methods to some extent. The refined method reduced the normalized maximum benefit between simulated and observed atmospheric concentrations, from -7.94% to -1.65%. China’s 2024 banks (560 kt) far exceed cumulative emission, indicating substantial future potential. Gridded results show emissions concentrated in eastern coastal regions. Under an accelerated phase-out scenario, cumulative HCFC-141b emissions during 2025-2060 could be reduced by 4,266.9 kt, equivalent to 469.4 kt CFC-11-eq and 3,336.7 Mt CO2-eq, underscoring the importance of early phase-out measures. This framework supports more accurate regional assessments of halogenated compound emissions and their environmental impacts.

How to cite: Wu, J., Wang, T., Zhang, D., Yao, B., Purohit, P., and Peng, L.: Improved bottom-up approach for estimating HCFC-141b emissions and reduction potential in China from 2000 to 2060, EGU General Assembly 2026, Vienna, Austria, 3–8 May 2026, EGU26-2396, https://doi.org/10.5194/egusphere-egu26-2396, 2026.

EGU26-2646 | Posters on site | AS4.9

From Surface Ozone Risk Assessment to Climate Adaptation-Oriented Air Quality Policy 

Pei-Yuan Hsieh, Min-Hua Shen, and I-Chun Tsai

Surface ozone has become a major air quality concern in Taiwan as particulate matter concentrations have declined, while climate warming is expected to intensify high-temperature and high-ozone compound events. These changes increase health risks and challenge the effectiveness of existing air pollution control strategies, highlighting the need for atmospheric science that directly informs climate adaptation planning.

This study integrates source-oriented ozone analyses and warming-scenario simulations to link ozone formation processes with policy-relevant adaptation needs in southern Taiwan, focusing on the Linyuan industrial region and surrounding townships. Source apportionment and ozone formation potential analyses indicate that highly reactive volatile organic compounds associated with petrochemical activities play a dominant role in ozone enhancement during high-temperature episodes, identifying clear targets for emission-oriented mitigation strategies.

To assess how climate change may alter air quality risks, ozone hazards were evaluated under baseline, +2 °C, and +4 °C warming scenarios. Results show a pronounced increase in the frequency and spatial extent of high-ozone hazard days under warming conditions, suggesting that climate change can amplify ozone exposure even under existing emission control frameworks.

Beyond hazard characterization, this study develops a spatially explicit ozone risk assessment framework that integrates hazard, exposure, and vulnerability components to support climate adaptation planning. Exposure indicators reflect local ventilation conditions, while vulnerability metrics incorporate demographic structure and healthcare accessibility. The analysis identifies emerging ozone risk hotspots, including Meinong and Yanpu townships, where elevated hazards coincide with higher exposure and limited adaptive capacity.

By translating atmospheric science results into both mitigation-oriented and adaptation-oriented policy options, this study demonstrates how integrated air quality and climate analyses can inform effective public health protection and climate adaptation strategies. The proposed framework provides a transferable approach for supporting evidence-based air quality adaptation planning in subtropical industrial regions.

How to cite: Hsieh, P.-Y., Shen, M.-H., and Tsai, I.-C.: From Surface Ozone Risk Assessment to Climate Adaptation-Oriented Air Quality Policy, EGU General Assembly 2026, Vienna, Austria, 3–8 May 2026, EGU26-2646, https://doi.org/10.5194/egusphere-egu26-2646, 2026.

EGU26-3054 | Posters on site | AS4.9

Particulate matter–related mortality in the 21st century: disparities between rural and urban areas and across income groups 

Aristeidis K. Georgoulias, Jos Lelieveld, Andrea Pozzer, Brendan Steffens, Klaus Klingmüller, Dimitris Akritidis, Georgia Alexandri, Prodromos Zanis, and Jean Sciare

We present a global assessment of excess mortality attributable to long-term exposure to fine particulate matter (PM2.5) over the period 2000–2021, using satellite-derived PM2.5 concentration estimates. Mortality burdens attributable to PM2.5 exposure are quantified for this period using the FUSION relative risk model for non-communicable diseases (NCDs) and lower respiratory infections (LRIs). We analyze global and regional trends in PM2.5 exposure and associated excess mortality and assess the contribution of key driving factors. By integrating population-based thresholds with gross domestic product (GDP) data, we examine disparities between rural and urban areas as well as between low- and high-income regions. Our findings reveal substantial cross-country heterogeneity in the mitigation of PM2.5-related health impacts and identify potential pathways for reducing pollution-induced mortality.

Funded by the European Union and the Swiss State Secretariat for Education, Research and Innovation (SERI). Views and opinions expressed are however those of the author(s) only and do not necessarily reflect those of the European Union, or the European Health and Digital Executive Agency (HADEA) or the SERI. Neither the European Union nor the granting authorities can be held responsible for them, MARKOPOLO project GA No:101156161.

How to cite: Georgoulias, A. K., Lelieveld, J., Pozzer, A., Steffens, B., Klingmüller, K., Akritidis, D., Alexandri, G., Zanis, P., and Sciare, J.: Particulate matter–related mortality in the 21st century: disparities between rural and urban areas and across income groups, EGU General Assembly 2026, Vienna, Austria, 3–8 May 2026, EGU26-3054, https://doi.org/10.5194/egusphere-egu26-3054, 2026.

EGU26-3168 | Orals | AS4.9

Contrasting Sources of Air Pollution Exposure and Associated Mortality in Rural and Urban India 

Dewashish Tiwari, Srinidhi Balasubramanian, Sujit Maji, and Chandra Venkataraman

Air pollution, specifically PM2.5 (Particulate matter with a diameter ≤ 2.5 μm), is a  leading environmental stressor, contributing to ~1.05 million premature deaths annually in India. Unlike other western regions of the world where higher population densities are concentrated in urban sprawls, India features a majority of its population (two-thirds) concentrated in non-urban (rural) regions. Studies have shown a comparable PM2.5-associated mortality in urban and rural regions at a national scale for India. The contributions of source sectors to regional mortality specifically in urban and non-urban regions, essential for effective policy interventions, are discussed here.

    In this study, we performed district-level, source-sector specific PM2.5 attributable mortality analysis for urban and rural populations for India for the year 2019. We first performed a baseline (all-sector combined) and sectoral zero-out WRF-Chem simulations using the SMoG-India emission inventory, gap-filled with CEDS and GFED, for the year 2019 covering the South Asia Cordex Domain with a 27 km horizontal resolution. The sectoral runs were performed for agriculture, residential combustion, industry, energy, and transport sectors. For the mortality calculations, we utilized relative risk curves generated using Meta Regression Bayesian Regularized, trimmed (MR-BRT) splines cause-specific for 6 diseases, developed over baseline PM2.5 concentration; cause-specific baseline mortality rates (BMR) from IHME (https://ghdx.healthdata.org/); and gridded population from SEDAC, segregated into urban and rural grids using VIIRS nighttime light radiance datasets. We scaled the fraction of sectoral PM2.5 contributions with baseline mortality to determine the mortality of each source sector at the grid level.

      Relying on a model simulated PM2.5, we estimate population-weighted mean PM2.5 exposure of 42.7 µg/m³ and related mortality of 1.08 million. Our findings suggest that total premature deaths from PM2.5 exposures in India’s rural population are approximately 2 times larger than those in the urban population (Figure 1), similar to previous work. However, contributing emission sectors in both geographies are significantly different. The residential combustion sector contributes the most, approximately 44% of total premature deaths, out of which ~29% are  borne by the rural population. Much larger impacts from the residential and agricultural sectors are seen in rural populations. Interestingly, energy emissions (from thermal power plants) have more than twice the impact on rural than on urban populations, indicating a regional scale of impact from an interplay of sulphate chemistry and atmospheric transport. Industry and transport sector emissions have 1.2 times larger mortality in rural than urban populations, indicating their more local-scale impact in urban regions. Sectorally, interventions to reduce residential biomass fuel use can yield the largest health benefits in both the rural and urban populations across India. For energy and industry sectors, regulatory interventions are needed at central and state government levels, since these emissions too impact both rural and urban populations. There is an urgent need for air quality management beyond the city scales and for expansion of air quality monitoring to rural areas in India.

Figure 1. Source sector contribution to mortality in rural and urban population across India

How to cite: Tiwari, D., Balasubramanian, S., Maji, S., and Venkataraman, C.: Contrasting Sources of Air Pollution Exposure and Associated Mortality in Rural and Urban India, EGU General Assembly 2026, Vienna, Austria, 3–8 May 2026, EGU26-3168, https://doi.org/10.5194/egusphere-egu26-3168, 2026.

Over the last two decades there have been diverse variabilities and trends in anthropogenic, pyrogenic, and biogenic emissions, resulting in varied responses of net ozone production rates (PO₃) to their precursors. A quantitative understanding of the underlying ozone precursor sources and the extent to which they influence PO₃ typically requires running computationally demanding chemical transport models, often constrained by satellite observations, under various modeling scenarios.

Instead, we provide a much more efficient approach to predicting PO₃ using a deep neural network trained on more than 6 million observationally constrained data points collected from suborbital atmospheric composition missions. The parameterization meaningfully captures the non-linear relationships between O₃-NOX-VOC, as well as photolysis rates and water vapor. The parameterization inputs are constrained by various datasets including reanalysis models, ground remote sensing, TROPOMI and OMI retrievals, enabling us to provide a long-term record of global net ozone production rates along with magnitude-dependent sensitivity maps that advance beyond the conventionally binary maps (i.e., NOX-sensitive or VOC-sensitive) obtained from ozone indicators such HCHO/NO₂.

We reveal predominantly positive trends in PO₃ over Asia and the Middle East (>30% relative to 2005) and negative trends across the eastern U.S., Europe, and parts of Africa during 2005-2019, based on stable long-term records from OMI. We demonstrate how rapid evolution of heat waves can substantially increase PO₃ and its sensitivity to NOₓ and VOC. Our high-resolution TROPOMI-based product reveals high locally-produced ozone in less-documented regions such as Johannesburg (South Africa), Rio de Janeiro (Brazil), São Paulo (Brazil), Santiago (Chile), Hanoi (Vietnam), Cairo (Egypt), and Tehran (Iran). This product, along with a comprehensive error budget, is freely available to our community (https://www.ozonerates.space)

How to cite: Souri, A., Gonzalez Abad, G., Duncan, B., and Oman, L.: Two Decades from Space: Satellite-Constrained Parameterization Delivers Computationally Efficient Global Ozone Production Rates and Sensitivity Records, EGU General Assembly 2026, Vienna, Austria, 3–8 May 2026, EGU26-3172, https://doi.org/10.5194/egusphere-egu26-3172, 2026.

EGU26-3196 | ECS | Orals | AS4.9

Exploring inequalities in experiencing the double burden of thermal discomfort and ultrafine particle exposure across urban communities  

Jiaoyang Li, Arman Ganji, Alessya Venuta, Marshall Llyod, Scott Weichenthal, and Marianne Hatzopoulou

The combined impact of the urban heat island (UHI) and the urban pollutant island can increase the risk of respiratory and cardiovascular illness, in addition to heat stress, thereby elevating morbidity and mortality by intensifying vulnerability, particularly among population groups already facing social disadvantage.

This study develops a method to investigate co-exposure to summer heat and ultrafine particles (UFP, < 0.1 um) in Toronto using high-resolution datasets for temperature and air quality derived from spatially extensive monitoring campaigns conducted in 2022 and 2023. The temperature data is used to derive three indicators of thermal discomfort (Apparent Temperature, Discomfort Index, and a composite Hotspot Index), which are subsequently used to generate exposure surfaces using a Machine-Learning based land-use regression model. Similarly, the UFP data is used to generate a model and an exposure surface.  

Heat and UFP exposure surfaces are combined and analyzed using a multivariate Local Indicators of Spatial Association (LISA) approach, to identify clusters where both burdens are simultaneously elevated. These co-exposure hotspots were then linked with four dimensions of the Ontario Marginalization Index to evaluate disparities across socioeconomic and ethnocultural population groups.

Results show that combined heat–pollution hotspots are concentrated in Toronto’s central and southern neighbourhoods, particularly along major traffic corridors, and exposure levels rise consistently from the least to the most marginalized areas. In the most marginalized areas, up to nearly 90% of residents live in High–High co-exposure zones. These findings show that areas with higher levels of social marginalization consistently have higher combined heat and air pollution exposure, meaning that residents of these neighbourhoods are more likely to experience multiple environmental stresses at the same time. The results provide actionable evidence to support climate and air-quality policy aimed at reducing environmental health inequities.

How to cite: Li, J., Ganji, A., Venuta, A., Llyod, M., Weichenthal, S., and Hatzopoulou, M.: Exploring inequalities in experiencing the double burden of thermal discomfort and ultrafine particle exposure across urban communities , EGU General Assembly 2026, Vienna, Austria, 3–8 May 2026, EGU26-3196, https://doi.org/10.5194/egusphere-egu26-3196, 2026.

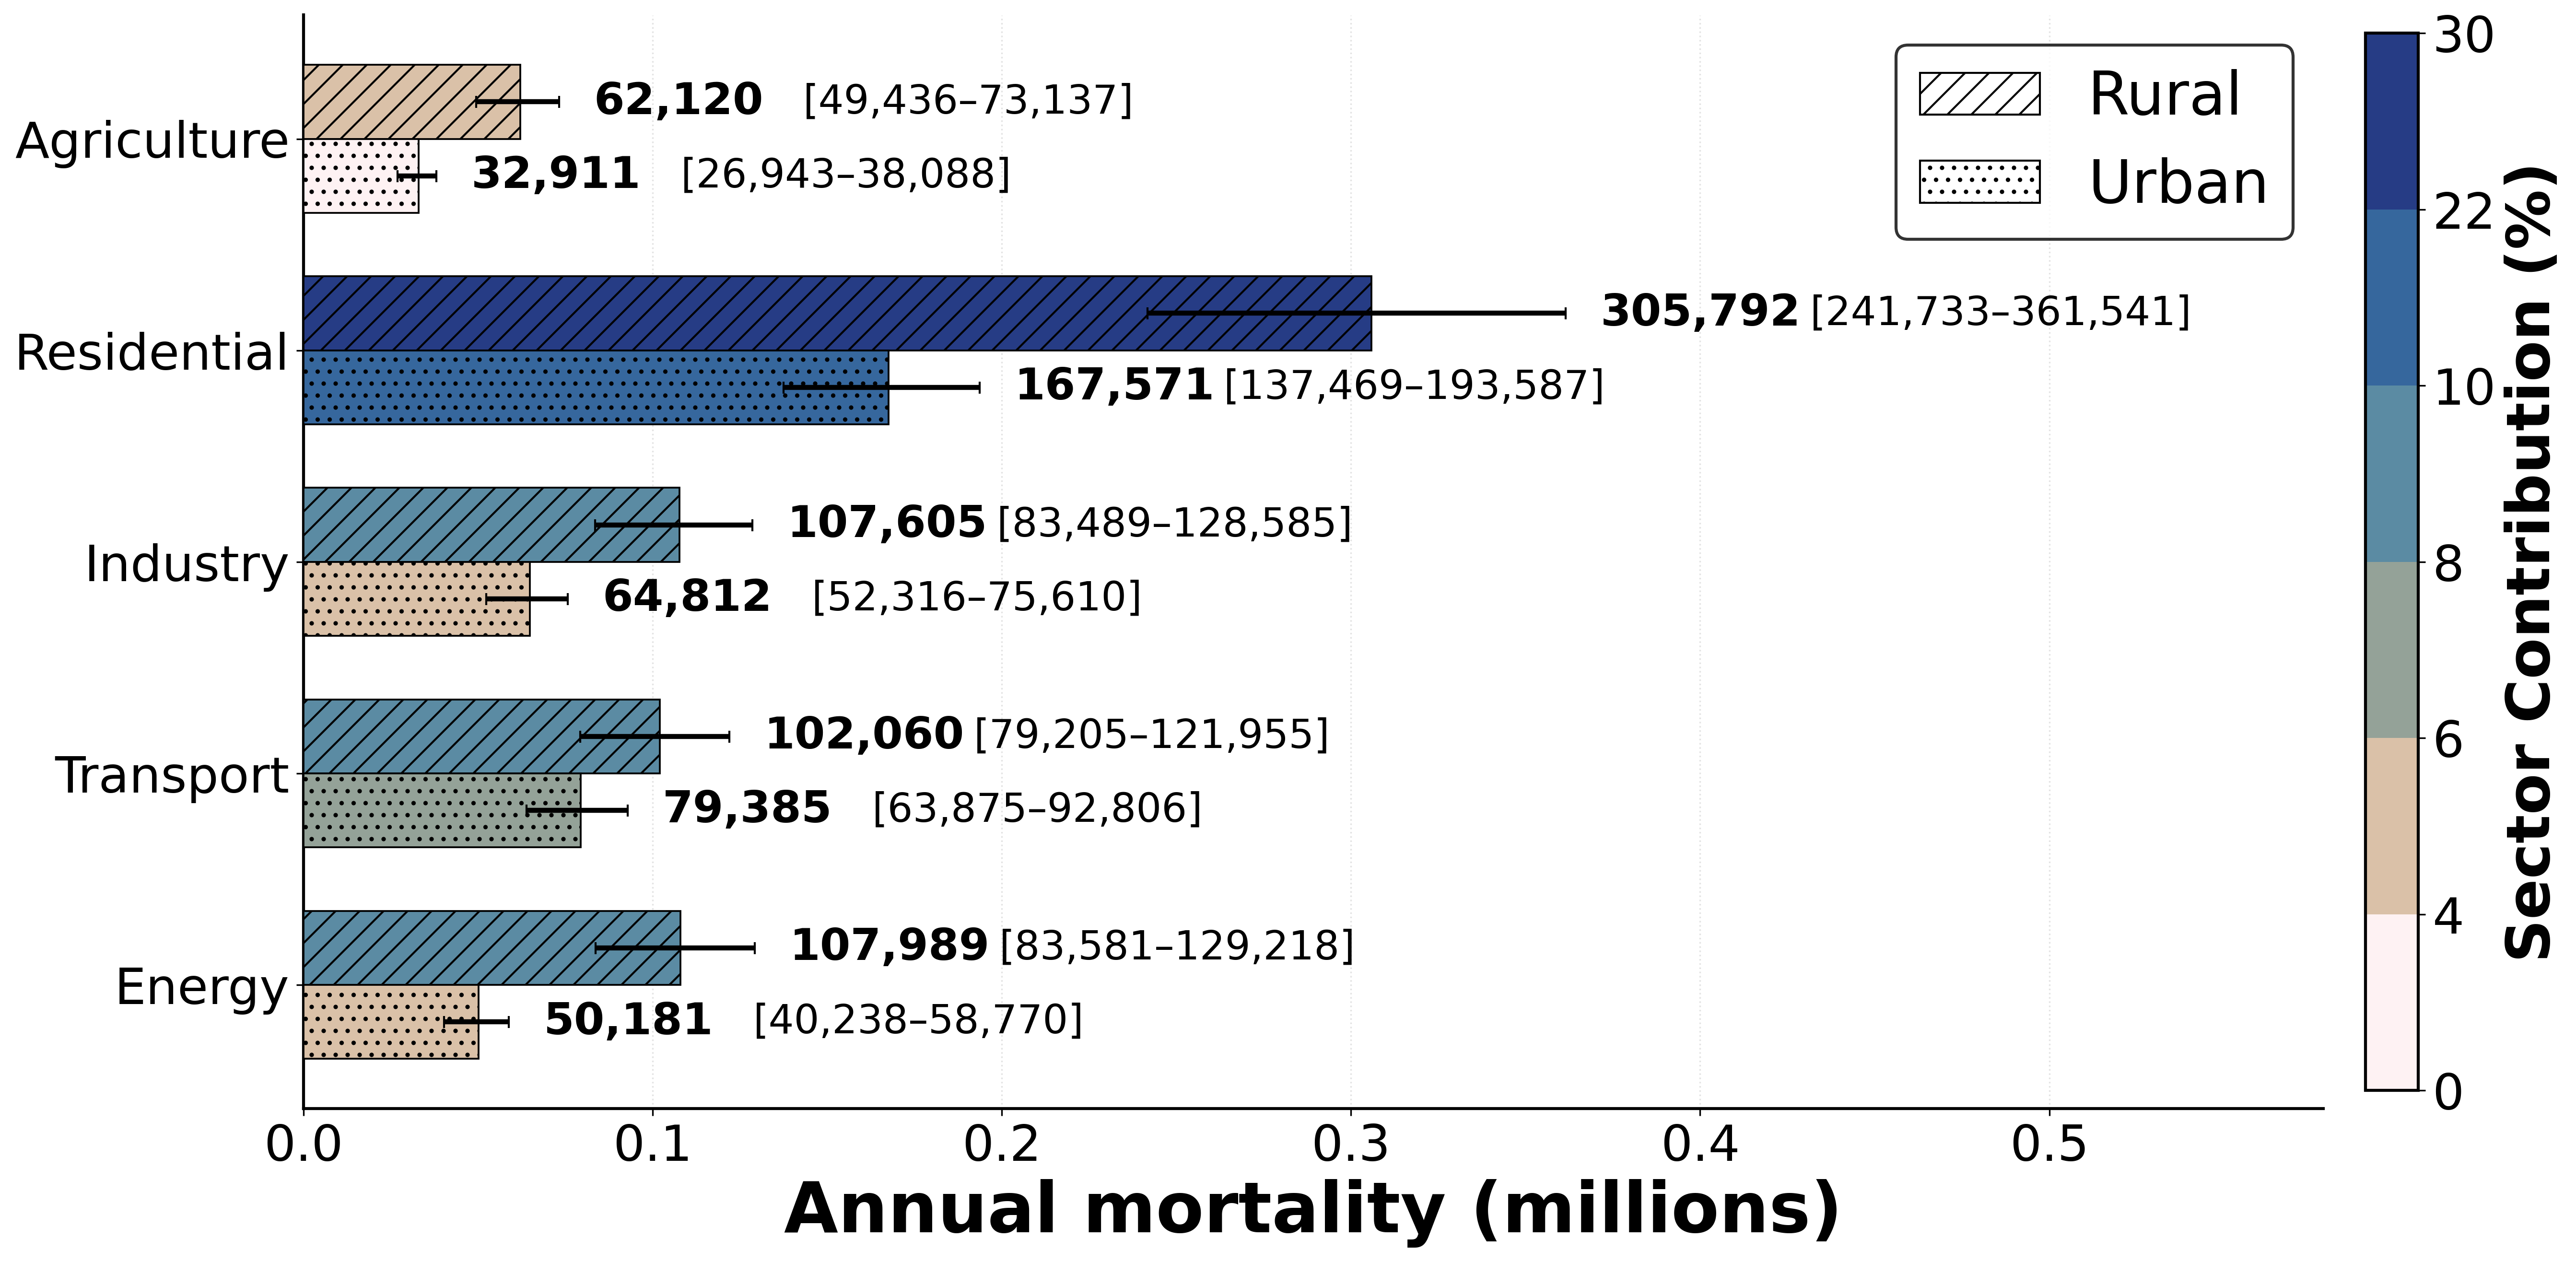
EGU26-3398 | ECS | Orals | AS4.9

Recent reductions in UK PM2.5: The role of NO2 and transboundary sources 

Daniel J Bryant, Alastair Lewis, and Sarah Moller

Fine particulate matter (PM2.5) remains the UK's most harmful air pollutant, contributing to approximately 29,000 premature deaths annually. This study investigates the drivers of recent UK PM2.5 improvements, with particular focus on the role of European transboundary pollution and atmospheric chemistry controlling secondary inorganic aerosol formation.

Analysis of UK Automatic Urban and Rural Network (AURN) monitoring data from 2016-2024 demonstrates a 25% reduction in annual average PM2.5 concentrations, with a pronounced step-change across 2019 to 2020 that has been sustained through 2024. In 2024, 98.6% of monitoring sites achieved the UK's 2040 target of 10 μg/m³, compared to just 60.5% in 2019. Wind sector analysis demonstrates that the highest PM2.5 concentrations and largest reductions are associated with easterly and south-easterly air masses originating from continental Europe, with median concentrations under easterly flow declining by approximately 5 μg/m³ between the 2016-2019 and 2020-2024 periods.

To quantify regional source contributions, we employed Simplified Quantitative Transport Bias Analysis (SQTBA) using HYSPLIT 72-hour back-trajectories generated every 3 hours at 11 urban and rural background sites across the UK. This approach accounts for meteorological transport and dispersion effects on observed concentrations. Results indicate that the highest PM2.5 concentrations are associated with air masses from central and eastern Europe, particularly Germany, Belgium, Netherlands and Poland. Comparison between 2016-2019 and 2020-2024 periods reveals that the largest reductions in PM2.5 are associated with these same European source regions, particularly during winter and spring when secondary inorganic aerosol formation is most efficient. European contributions to UK PM2.5 declined from approximately 2 μg/m³ to 1 μg/m³ between the two periods, representing a 50% reduction in the transboundary component.

Measurements from UK rural monitoring networks (NAMN, AGANet) and high-temporal-resolution supersites demonstrate that ammonium nitrate concentrations have declined by 44-54% since 2016, closely tracking observed PM2.5 reductions. Thermodynamic modeling using ISORROPIA-II at two contrasting UK sites highlights that ammonium-nitrate formation throughout the study period is “NOx limited”, meaning ammonium-nitrate concentrations are more sensitive to changes in NOx than ammonia. This regime means that NOx emission reductions associated with COVID-19 and vehicle fleet turnover will have had a pronounced effect on ammonium-nitrate in the UK and Europe.

This work suggests that recent UK PM2.5 improvements result from both domestic emission controls and reductions in transboundary sources from Europe. Due to ammonium-nitrates sensitivity to NOx over ammonia, NOx controls emerge as the primary driver of the recent PM2.5 reductions observed in the UK. Overall, this highlights the benefits of NOx emissions reductions on human health.

How to cite: Bryant, D. J., Lewis, A., and Moller, S.: Recent reductions in UK PM2.5: The role of NO2 and transboundary sources, EGU General Assembly 2026, Vienna, Austria, 3–8 May 2026, EGU26-3398, https://doi.org/10.5194/egusphere-egu26-3398, 2026.

EGU26-4376 | Posters on site | AS4.9

Exposure to fine particulate matter and inequalities across countries  

Dimitris Akritidis, Darrel Moellendorf, Aristeidis K. Georgoulias, and Andrea Pozzer

Exposure to fine particulate matter (PM2.5) is a major risk for human health. Over recent decades, air-quality standards have become progressively more stringent, reflecting growing evidence of PM2.5 as a public health concern. At the country level, differences in PM2.5 exposure experienced and caused by countries, combined with differences in economic and social characteristics, shape inequalities in exposure to air pollution. We exploit a set of roughly 180 global simulations with the ECHAM/MESSy2 Atmospheric Chemistry model (EMAC) for the period 2014–2019, in which anthropogenic emissions from each country are excluded to quantify country-to-country contributions to PM2.5 levels. Within this framework, we assess the role of domestic and transboundary anthropogenic pollution in shaping PM2.5 exposure at global and national scales under different air-quality standards. Combining the country-to-country air pollution exchanges with socioeconomic indicators, we aim to identify disparities in the way countries experience and shape exposure to PM2.5, thereby unraveling air pollution inequalities across nations

How to cite: Akritidis, D., Moellendorf, D., Georgoulias, A. K., and Pozzer, A.: Exposure to fine particulate matter and inequalities across countries , EGU General Assembly 2026, Vienna, Austria, 3–8 May 2026, EGU26-4376, https://doi.org/10.5194/egusphere-egu26-4376, 2026.

EGU26-4952 | Posters on site | AS4.9

Precipitation chemistry: Long-term Changes in Central Europe 

Iva Hunova

Precipitation is an important mediator between the atmosphere and the Earth's surface. As a wet-only part of atmospheric deposition, it maintains transfer of water, nutrients and air pollutants into ecosystems. Precipitation chemistry reflects ongoing atmospheric processes (Seinfeld and Pandis, 2006), and given its importance, its composition is regularly observed and measured at global, regional and national scales.

This contribution presents long-term changes in precipitation chemistry observed within a nationwide monitoring network in the Czech Republic, which is run by the Czech Hydrometeorological Institute. Point-wise data from station measurements from 1990 to 2024 were analysed, and nationwide averages from stations with simultaneous major ion measurements were explored.

Our results clearly demonstrate significant changes over the past three decades, evident in the relative proportions of major pollutants such as sulphates, nitrates and ammonium ions. These changes (i) reveal substantial changes in atmospheric composition with respect to changing emission levels; (ii) suggest changes in atmospheric chemistry; and (iii) indicate potential impacts on ecosystems and the environment.

Changes in precipitation chemistry are driven by changes in the absolute amounts and relative proportions of pollutant emissions and ongoing climate change.  Due to uneven reductions in SO₂ and NOx emissions, the relative proportions of SO₄²⁻, NO₃⁻ and NH₄⁺ in precipitation have changed. These changes are evident not only in the levels of individual pollutants, but also in the ratios of these pollutants over time.

Further detailed information can be found, for example, in Hůnová et al. (2024) and Hůnová and Škáchová (2025).


Hůnová, I., Brabec, M., Malý, M., 2024. Major ions in Central European precipitation: Insight into changes in NO3−/SO42−, NH4+/NO3 and NH4+/SO42− ratios over the last four decades. Chemosphere 349, 140986.

Hůnová, I., Škáchová, H., 2025. Chemické složení atmosférických srážek je indikátorem výrazných změn v našem ovzduší, Chemické listy, 119, 533–540.

Seinfeld, J.H., Pandis, S.N., 2006. Atmospheric Chemistry and Physics. From Air Pollution to Climate change. Second edition. John Wiley & Sons, Inc., Hoboken.


How to cite: Hunova, I.: Precipitation chemistry: Long-term Changes in Central Europe, EGU General Assembly 2026, Vienna, Austria, 3–8 May 2026, EGU26-4952, https://doi.org/10.5194/egusphere-egu26-4952, 2026.

EGU26-5574 | Posters on site | AS4.9

Integration of Earth Observation into the UK Met Office Air Quality Forecasting System 

Richard Pope and Ailish Graham

Poor air quality (AQ) is one of the largest environmental stresses on human health. In the UK, poor AQ results in 28,000-36,000 premature deaths per year and annual socioeconomic costs of ~£20 billion. To help address this, the UK Met Office (UKMO) provides critical national daily AQ forecasts of key pollutants (e.g. ozone (O3), nitrogen dioxide (NO2) and aerosols) to provide the public and government bodies (e.g. Defra) with prior warning of hazardous AQ events.

To evaluate the skill of their forecast model (AQUM – Air Quality in the Unified Model), and to bias-correct the forecasts, the UKMO use AQ measurements from the UK Automated Urban and Rural Network (AURN) of surface sites. The AURN observations are used in the “Statistical Post Processing of Observations (SPPO)” step to correct the forecasts (known as “hybrid-forecasts”) before release. However, sparse surface monitoring sites are often unrepresentative of widespread pollution.

Satellite AQ data provides a powerful resource to help address this issue with daily UK spatial coverage, detection of pollution hotspots and transboundary pollution gradients. Therefore, this project described here (AIRSAT) aims to integrate key satellite AQ products (e.g. tropospheric NO2 & O3) into the UKMO’s SPPO framework to improve these “hybrid-forecasts”, thus benefiting the downstream users of this service.

Analysis of multiple satellite AQ products concludes that tropospheric column NO2 (TCNO2), total column ammonia (TCNH3) and lower (0-6 km) tropospheric column O3 (LTCO3) from the TROPOspheric Monitoring Instrument (TropOMI), the Cross-track Infrared Sounder (CrIS) and the Infrared Atmospheric Sounding Interferometer (IASI), respectively, are the most suitable datasets for UK AQ monitoring and for comparison with AQUM.

AQUM showed good agreement with TropOMI TCNO2 but has substantial (i.e. absolute model-satellite bias is greater than the satellite uncertainty) negative biases over London. Consistent with other studies, this indicates that the nitrogen oxide (NOx) emissions from the official bottom-up inventory (National Atmospheric Emissions Inventory – NAEI) are too low over London. Comparisons between AQUM and CrIS in summer indicate that the model substantially underestimates NH3 over broad rural regions of the UK. Primary NH3 emissions are linked to agricultural processes and the model biases co-locate with the regions, which is supported by surface model-observational comparisons. These findings are consistent with previous research but building on it taking account of key factors like satellite vertical sensitivities and errors.

Investigation of the 2-week air pollution episode (24th June – 7th July 2018) shows widespread enhancements in NO2 and O3 surface concentrations and satellite integrated columns. By using AQUM, O3 enhancements are detected throughout the lower-mid troposphere across the UK. This is a novel result as it confirms that IASI retrieved LTCO3 is detecting O3 originating from the surface / boundary layer (i.e. suitable for AQ applications) despite having peak measurement capabilities in the mid-troposphere.

Overall, I will present these results from the AIRSAT project (i.e. Work Package (WP) 1) and new developments in WP2 utilising TropOMI TCNO2 and AQUM to infer surface NO2 concentrations for evaluation of the modelled forecasts suitable for the SPPO approach.


How to cite: Pope, R. and Graham, A.: Integration of Earth Observation into the UK Met Office Air Quality Forecasting System, EGU General Assembly 2026, Vienna, Austria, 3–8 May 2026, EGU26-5574, https://doi.org/10.5194/egusphere-egu26-5574, 2026.

EGU26-6350 | Orals | AS4.9

Integrated assessment of cost-effective air quality mitigation pathways for Uttar Pradesh, India 

Parul Srivastava, Pallav Purohit, Wolfgang Schöpp, Fabian Wagner, Zbigniew Klimont, Gregor Kiesewetter, Sagnik Dey, Jostein Nygard, Ashish Tiwari, Mukesh Sharma, and Markus Amann

Severe air pollution across the Indo-Gangetic Plain (IGP) remains a critical environmental governance challenge in South Asia, with ambient fine particulate matter (PM₂.₅) concentrations persistently exceeding national and international air quality standards. Uttar Pradesh (UP), India’s most populous state, lies at the center of this highly interconnected region and experiences chronically elevated PM₂.₅ exposure driven by a combination of local emissions and substantial transboundary pollution. In such settings, effective air quality management requires policy-relevant analytical tools that integrate emissions, atmospheric transport, population exposure, and mitigation costs across administrative boundaries. This study applies an integrated assessment modeling framework to evaluate cost-effective policy pathways for reducing PM₂.₅ exposure in UP from a regional perspective.

We employ the GAINS-IGP (Greenhouse gas–Air pollution Interactions and Synergies) model to develop a region-specific, multi-sectoral emissions inventory for UP and the wider IGP for the base year 2020 and to project air quality outcomes to 2035. The model represents emission sources across the residential, industrial, transport, agriculture, power generation, and waste sectors, accounting for both primary PM₂.₅ emissions and key gaseous precursors (SO₂, NOₓ, NH₃, and NMVOCs). Atmospheric transport and secondary aerosol formation are simulated using reduced-form source–receptor relationships derived from chemical transport modeling, enabling estimation of population-weighted PM₂.₅ exposure at high spatial resolution. The GAINS optimization module is used to rank more than 300 emission control measures according to their marginal cost per unit reduction in population exposure.

Three policy-relevant scenarios are evaluated for 2035. The Current Legislation scenario assumes full implementation of all national and state regulations in force as of 2020. Frozen Legislation counterfactually illustrates air quality outcomes in the absence of policy advances beyond 2015, thereby isolating the contribution of recent regulatory efforts. A Coordinated Action scenario assesses the effects of harmonized implementation of additional, widely applied mitigation measures across the IGP. This scenario framework enables a systematic comparison of the effectiveness and cost-efficiency of state-level interventions versus regionally coordinated strategies.

Results indicate that while existing regulations partially decouple emissions from economic growth, they remain insufficient to achieve either India’s National Ambient Air Quality Standards (40 µg m⁻³) or the WHO Interim Target-1 (35 µg m⁻³) in UP. Approximately 44% of PM₂.₅ exposure in the base year originates from sources outside the state and from natural dust, while secondary PM₂.₅ formation contributes about 40% of total exposure. These structural characteristics substantially limit the effectiveness of unilateral mitigation policies. Cost-effectiveness analysis identifies high-impact measures across multiple sectors, including clean cooking transitions, improved fertilizer management, control of road and construction dust, elimination of open burning, industrial emission controls, and stricter vehicle standards. Achieving WHO-aligned targets at a reasonable cost, however, requires coordinated implementation of these measures across neighboring IGP states to reduce regional background pollution.

From a policy perspective, the findings highlight the importance of complementing city- and state-level clean air action plans with formal mechanisms for inter-state coordination. Integrated assessment modeling provides a transparent, quantitative basis for prioritizing measures, sequencing policies, and sharing mitigation efforts and benefits across jurisdictions in highly interconnected regions.

How to cite: Srivastava, P., Purohit, P., Schöpp, W., Wagner, F., Klimont, Z., Kiesewetter, G., Dey, S., Nygard, J., Tiwari, A., Sharma, M., and Amann, M.: Integrated assessment of cost-effective air quality mitigation pathways for Uttar Pradesh, India, EGU General Assembly 2026, Vienna, Austria, 3–8 May 2026, EGU26-6350, https://doi.org/10.5194/egusphere-egu26-6350, 2026.

EGU26-7495 | ECS | Posters on site | AS4.9

Mid-century Air Quality and Public Health Responses to Future Agricultural Ammonia Emission Pathways 

Stephen Y. T. Shek, Amos P. K. Tai, Xueyao Chen, and Biao Luo

Agricultural ammonia (NH3) emissions, primarily released from livestock waste and synthetic fertilizer application, are a major precursor of fine particulate matter (PM2.5), imposing considerable public health burdens worldwide. Although these emissions are strongly linked to socioeconomic factors and agricultural development pathways, a comprehensive mid-century assessment of air quality and health benefits under different agricultural futures has yet to be fully established. In this study, we scaled NH3 emissions from various crop and livestock species under three scenarios developed by the Food and Agriculture Organization: Business as Usual (BAU), Stratified Societies (SSS), and Toward Sustainability (TSS), using documented and projected agricultural data. PM2.5-attributable health outcomes were quantified via a hybrid approach integrating the GEOS-Chem High Performance (GCHP) model, machine learning bias correction, and the Global Exposure Mortality Model (GEMM). Results indicate that global NH3 emissions substantially increase under BAU and SSS (+50–51% relative to the 2012 baseline), but remain nearly stable under TSS, where growth in livestock emissions is offset by fertilizer phase-out. Global population-weighted PM2.5 concentrations are projected to rise by 1.2 μg m−3 under BAU and 1.3 μg m−3 under SSS, but decline by 1.0 μg m−3 under TSS. Under baseline conditions, PM2.5 is estimated to cause 4.3 million premature deaths annually. Projections suggest that premature deaths would rise by more than 80000 under BAU and SSS, affecting Europe, India, and East China in particular, where equitable development is essential to mitigate the future mortality. Although TSS – characterized by equal access to basic services, universal food availability, and widespread conservation – could reduce premature deaths by nearly 50000, increases are still expected in Sub-Saharan Africa due to elevated emissions and worsened PM2.5 air quality driven by population growth and economic development. Our findings underscore the need for further agricultural transformations – towards crops with higher nitrogen use efficiency, livestock with lower emission factors, and less meat-intensive diets – to prevent disproportionate public health burden. This scenario-based analysis highlights the benefits of sustainable agricultural pathways, demonstrating that strategies ensuring nutritious and sustainable food production can simultaneously improve air quality and reduce global mortality.

How to cite: Shek, S. Y. T., Tai, A. P. K., Chen, X., and Luo, B.: Mid-century Air Quality and Public Health Responses to Future Agricultural Ammonia Emission Pathways, EGU General Assembly 2026, Vienna, Austria, 3–8 May 2026, EGU26-7495, https://doi.org/10.5194/egusphere-egu26-7495, 2026.

EGU26-8282 | ECS | Posters on site | AS4.9

Regional Sensitivity of Ozone Formation to Emissions and Meteorology in India 

Gopalakrishna Pillai Gopikrishnan, Daniel M Westervelt, and Jayanarayanan Kuttippurath

Atmospheric aerosols play a key role in air pollution and atmospheric chemistry, with important consequences for air quality and public health. Variations in aerosol loading influence heterogeneous chemistry by regulating the uptake of HO₂ radicals on particle surfaces; a reduction in aerosols weakens this sink, enhances NOx and OH concentrations, and consequently increases surface ozone. This study investigates the seasonal variability of PM₁₀ and aerosol surface area and their impact on surface ozone over India using the GEOS-Chem chemical transport model for 2018 and 2022, representing years with high and low simulated PM₁₀ concentrations, respectively. The results show pronounced seasonal variations in both PM₁₀ and aerosol surface area. During winter (DJF), elevated PM₁₀ and aerosol surface area are observed over the Indo-Gangetic Plain and western Central India, mainly driven by biomass burning and industrial activities, while coastal regions show relatively lower aerosol surface area. Aerosol surface area decreases during the pre-monsoon (MAM) and monsoon (JJAS) seasons, followed by an increase during the post-monsoon (ON) period. Enhanced aerosol surface area during winter and post-monsoon leads to stronger aerosol-induced HO₂ uptake, suppressing surface ozone by approximately 5–10 μg/m³ in 2022 compared to 2018. In contrast, during the monsoon season, the reduced aerosol surface area in 2022 results in an increase in surface ozone of about 5–7.5 μg/m³ relative to 2018. On average, this aerosol-driven enhancement in surface ozone can be mitigated by reducing anthropogenic NOx emissions by roughly 25–50%. These findings emphasise the importance of integrated air quality management strategies that jointly address aerosol levels, precursor emissions, and regional meteorological conditions to effectively control ozone pollution over India.

How to cite: Gopikrishnan, G. P., Westervelt, D. M., and Kuttippurath, J.: Regional Sensitivity of Ozone Formation to Emissions and Meteorology in India, EGU General Assembly 2026, Vienna, Austria, 3–8 May 2026, EGU26-8282, https://doi.org/10.5194/egusphere-egu26-8282, 2026.

The ambient fine particle (PM2.5) pollution in China has declined over the past decade, as a consequence of stringent clean air actions from 2013 to 2023. The sustained policy interventions have not only reduced the magnitude of PM2.5 concentrations but also reshaped the source profile, i.e., the contribution from different emission sources. PM2.5 toxicity varies markedly across emission sources, complicating the identification of dominant contributors and the robust quantification of associated health risks. The existing health risk assessments tend to rely primarily on PM2.5 mass concentrations and therefore neglect toxicity differences by emission source. By contrast, oxidative potential (OP), which reflects the capacity of particles to induce oxidative stress, may provide a more mechanistically grounded metric for toxicity assessment. Here, we developed a method to estimate the OP of PM2.5 in China, integrating direct ambient sample measurements with the GEOS-Chem model simulations and satellite observations, enabling nationwide, long-term reconstruction of aerosol toxicity at high spatiotemporal resolution. Using population-weighted mean exposure estimate (i.e., PWM-PM2.5 concentrations and PWM-OP) as the exposure metric, we systematically track the evolution of PM2.5 toxicity across China under policy-driven changes in emission sources and air pollution situations. The preliminary results show that, PWM-PM2.5 between 2013 and 2023 declined from 62.8 to 33.9 μg m-3 (−46%). Over the same period, PWM-OP declined from 2.48 to 1.17 nmol min-1 m-3 (−53%). Reductions were primarily attributed to control of coal combustion, underscoring the importance of energy-structure transitions and pollution control in reducing population health risks. In contrast, meteorological variability exerted a comparatively minor influence on these improvements; over 2013-2023, meteorological changes increased PWM-PM2.5 by 0.4 μg m-3 and PWM-OP by 0.62 nmol min-1 m-3, only partially offsetting the benefits of emission reductions. Our findings suggest that air quality improvements cannot be understood solely through PM2.5 mass concentrations and that toxicity metrics can offer additional insights relevant to health. The future clean air policies need to shift from concentration-oriented targets to toxicity-oriented emission source control strategies, prioritizing the reduction of high-risk sources to achieve great health benefits.


Keywords: PM2.5; Oxidative potential; Policy-driven; Coal combustion; Health benefits

How to cite: Liu, J. and Zheng, B.: Oxidative potential of atmospheric fine particles in China from 2013 to 2023: trends, drivers, and mitigation implications, EGU General Assembly 2026, Vienna, Austria, 3–8 May 2026, EGU26-8796, https://doi.org/10.5194/egusphere-egu26-8796, 2026.

EGU26-8805 | ECS | Posters on site | AS4.9

Top-down Estimates of HFC-134a and HCFC-142b Emissions in East Asia in 2022 and 2023 Using a Bayesian Inversion Framework 

Xiangyunong Cao, Dasa Gu, and Wai Ming Chan

Long‑lived halocarbons have been subject to progressive international regulation due to their significant impacts on stratospheric ozone depletion and climate forcing. Following the phase‑out of chlorofluorocarbons (CFCs) under the Montreal Protocol, hydrochlorofluorocarbons (HCFCs) and hydrofluorocarbons (HFCs) were introduced as transitional and long‑term substitutes. While HCFCs are being phased out globally, legacy emissions still persist, and HFCs, despite their zero ozone‑depletion potential, have become a growing concern because of their high global warming potentials, prompting further controls under the Kigali Amendment.

Within this regulatory and scientific context, emissions of HFCs and HCFCs in East Asia have attracted substantial attention over the past decades. This region hosts some of the world’s most intensive production, consumption, and use of fluorinated refrigerants, with southeastern China in particular representing a major hotspot of anthropogenic activity. Previous studies have identified the Pearl River Delta (PRD) and Yangtze River Delta (YRD) as key source regions for multiple halocarbon species, making East Asia a focal area for evaluating emission trends, inventory accuracy, and policy effectiveness.

The Hong Kong University of Science and Technology (UST) atmospheric observatory plays a key role in monitoring halocarbon mole fractions across East Asia. Owing to its coastal location and favorable meteorological conditions, the site is sensitive to air masses originating from a broad swath of the region, including the highly developed areas of southeastern China such as the PRD and YRD. Leveraging continuous observations from the UST site together with background measurements, we applied a FLEXPART‑based Bayesian inversion framework to quantify emissions of HFC‑134a and HCFC‑142b over East Asia. This approach provides regional‑scale emission constraints that are directly relevant for assessing long‑lived halocarbon emissions under current control policies.

How to cite: Cao, X., Gu, D., and Chan, W. M.: Top-down Estimates of HFC-134a and HCFC-142b Emissions in East Asia in 2022 and 2023 Using a Bayesian Inversion Framework, EGU General Assembly 2026, Vienna, Austria, 3–8 May 2026, EGU26-8805, https://doi.org/10.5194/egusphere-egu26-8805, 2026.

EGU26-9863 | Orals | AS4.9

Refining the CAMS Global Anthropogenic Emissions Inventory with Regional Datasets: Advances in the Mosaic Approach and Remaining Uncertainties 

Idir Bouarar, Claire Granier, Hugo Denier van der Gon, Thierno Doumbia, Marc Guevara, Jukka-Pekka Jalkanen, Jeroen Kuenen, Elisa Majamäki, Nicolas Zilbermann, and Guy Brasseur

The CAMS-GLOB-ANT global emissions inventory, developed within the Copernicus Atmosphere Monitoring Service (CAMS) framework, provides monthly emissions for 36 chemical species, including CO, NOx, SO₂, NMVOC, NH₃, black carbon (BC), organic carbon (OC), CO₂, CH₄, N2O, and several individual VOCs, at a spatial resolution of 0.1° × 0.1° for the period 2000–2026. Alongside the officially released v6.2 dataset, which is used in the CAMS global air pollution forecasting system, a so-called mosaic emissions inventory is constructed. This mosaic product integrates official regional emission datasets based on nationally reported data for Europe, the United States, and China with the CAMS-GLOB-ANT global inventory. The resulting M1.0 mosaic inventory is being further enhanced through the incorporation of the PAPILA dataset, which provides a regional inventory of reactive gases for selected countries in South America.

In this study, we first intercompare the CAMS-GLOB-ANT v6.2 and M1.0 inventories and highlight the importance of refining global datasets with locally derived information to improve the accuracy of emission estimates, their temporal trends, and ultimately the performance of air quality models. We then evaluate both inventories against other available global and regional emission datasets. Finally, we conduct an in-depth assessment by examining discrepancies among existing inventories in terms of emission magnitude, spatial distribution, and temporal evolution. This assessment aims to identify species, sectors, and regions where emissions are robustly characterized, as well as those where substantial uncertainties remain.

How to cite: Bouarar, I., Granier, C., Denier van der Gon, H., Doumbia, T., Guevara, M., Jalkanen, J.-P., Kuenen, J., Majamäki, E., Zilbermann, N., and Brasseur, G.: Refining the CAMS Global Anthropogenic Emissions Inventory with Regional Datasets: Advances in the Mosaic Approach and Remaining Uncertainties, EGU General Assembly 2026, Vienna, Austria, 3–8 May 2026, EGU26-9863, https://doi.org/10.5194/egusphere-egu26-9863, 2026.

EGU26-10562 | Orals | AS4.9

Air Quality Management on the island of Crete: A Collaborative Initiative Between Academia and Regional Authorities  

Nikos Kalivitis, Phaedra Kozonaki, Evangelos Stergiou, Kyriaki Papoutsidaki, Kalliopi Tavernaraki, Maria Tsagkaraki, Giorgos Kouvarakis, Nikolaos Mihalopoulos, Sofia-Eirini Chatoutsidou, Eleftheria Chalvatzaki, Mihalis Lazaridis, Eleni Kargaki, Maria Kandilogiannaki, and Maria Kanakidou

In recent decades, substantial progress has been made in reducing emissions of major regulated air pollutants across Europe. Nevertheless, despite overall improvements in air quality, current EU standards are still not met, with approximately 96% of the urban population exposed to unsafe levels of fine particulate matter. In response to the World Health Organization’s more stringent air quality guidelines, the EU has adopted a revised Ambient Air Quality Directive with more ambitious standards, which is scheduled to enter into force in 2030 ((EU) 2024/2881).

Robust Air Quality Monitoring Stations (AQMSs) are essential for evaluating the effectiveness of air quality legislation. These stations provide reliable, real-time data needed to track pollution levels, support warning systems, identify long-term trends, and assess whether implemented policies achieve their intended objectives. On the island of Crete, a joint Action Plan for Addressing Air Pollution in the Region of Crete (ACAP-Crete) has been developed through close collaboration between academic institutions-the University of Crete (UOC) and the Technical University of Crete (TUC)-and regional authorities, namely the Region of Crete. A network of AQMSs has been established that currently comprises five AQMSs: two newly established urban/traffic stations in the major cities of Heraklion and Chania; two urban background stations (one newly established at Voutes-UOC and the Akrotiri station operated by TUC); and one regional background station (the Finokalia station operated by UOC). Three additional stations are planned to be established by 2026. The ACAP-Crete network is complemented by the development of low-cost sensor networks across the island.

In anticipation of the requirements of Directive (EU) 2024/2881, the ACAP-Crete network is preparing to monitor newly regulated pollutants, including Black Carbon (BC), Ultrafine Particles (UFP), ammonia (NH₃), as well as the chemical composition of PM₁. Meanwhile, the transport sector on the island is undergoing rapid transformation due to the construction of a new international airport and the island’s primary motorway. These developments are expected to substantially alter air pollutant emission patterns and their associated impacts, thereby increasing the need for comprehensive and adaptive air quality monitoring. ACAP-Crete contributes to transparency and public awareness by making air quality data accessible to both citizens and decision-makers. The official web platform (airquality.crete.gov.gr) was recently launched to support this objective.

Overall, the AQMS network on Crete represents a successful example of cooperation between academia and regional authorities, providing a distributed air quality monitoring infrastructure that addresses current challenges while proactively preparing for future regulatory and environmental requirements.

 Financial support from Region of Crete through the project “Action Plan for Addressing Air Pollution in the Region of Crete” is greatly acknowledged. We acknowledge support by Horizon Europe project Net4Cities Contract No. 101138405

How to cite: Kalivitis, N., Kozonaki, P., Stergiou, E., Papoutsidaki, K., Tavernaraki, K., Tsagkaraki, M., Kouvarakis, G., Mihalopoulos, N., Chatoutsidou, S.-E., Chalvatzaki, E., Lazaridis, M., Kargaki, E., Kandilogiannaki, M., and Kanakidou, M.: Air Quality Management on the island of Crete: A Collaborative Initiative Between Academia and Regional Authorities , EGU General Assembly 2026, Vienna, Austria, 3–8 May 2026, EGU26-10562, https://doi.org/10.5194/egusphere-egu26-10562, 2026.

EGU26-13354 | ECS | Orals | AS4.9

A Bayesian Inverse Modeling Approach to Achieving Triple Wins in Air Quality, Climate, and Equity 

Libby Koolik, Chirag Manchanda, Alper Ünal, Inez Y. Fung, Julian D. Marshall, Rachel Morello-Frosch, Alexander J. Turner, Robert A. Harley, and Joshua S. Apte

With increasing urgency to mitigate air pollution, climate change, and racialized exposure disparities, decision-makers in the United States (US) are faced with three distinct challenges that arise from the same sources but are often managed separately. This is in part because traditional environmental policies are generally designed based on a forward simulation approach: formulating an idea, estimating emission-changes, and modeling the resulting changes to air pollution, climate mitigation, and environmental justice. This process is computationally inefficient for testing multiple strategies and poorly suited for optimizing outcomes that address multiple objectives. Here, we reverse this pipeline to derive emission-reduction pathways that represent the optimal “triple win” strategy for mitigating air pollution exposure, climate change, and exposure inequity across the contiguous US.

To do this, we build upon our novel receptor-oriented, Bayesian optimization method by incorporating an additional cost function that reweights reductions for other priorities. Our approach begins from an atmospheric inverse modeling framework, whereby we set an idealized concentration surface — meeting the US National Ambient Air Quality Standard for particulate matter (PM2.5) everywhere — as the target variable. Using an alternating gradient descent algorithm, we perturb this optimal solution to find the co- or triple-benefits associated with advancing climate or equity goals. We consider four optimal emission reduction scenarios representing distinct combinations of policy goals:  PM2.5 Exposure Alone, Climate Priority, Equity Priority, and Triple Win. Our solutions are discretized in space, by precursor pollutant, and by the economic sector of emission.

Although all scenarios meet the PM2.5 standard, preliminary results suggest that meeting different combinations of goals requires attention to diverse locations, chemical species, and sectors. While the difference in total aggregate emissions reduction is small when comparing the PM2.5 Exposure Alone case with the other priorities, incorporating additional priorities up front enables the direct identification of distinct mitigation pathways in space and by sector (e.g., marine vessels are important for climate mitigation). We demonstrate how a non-optimal emission reduction pathway results in lesser or neutral air quality and climate benefits; however, the non-optimal reduction pathway can also result in significant harms in terms of environmental injustices. 

This framework could have strong implications for how we think about the challenge of how environmental policy can advance action against compounding risks. Our approach provides a data-driven and scalable strategy for simultaneously achieving a triple win across exposure, climate, and equity goals.

How to cite: Koolik, L., Manchanda, C., Ünal, A., Fung, I. Y., Marshall, J. D., Morello-Frosch, R., Turner, A. J., Harley, R. A., and Apte, J. S.: A Bayesian Inverse Modeling Approach to Achieving Triple Wins in Air Quality, Climate, and Equity, EGU General Assembly 2026, Vienna, Austria, 3–8 May 2026, EGU26-13354, https://doi.org/10.5194/egusphere-egu26-13354, 2026.

EGU26-13710 | Posters on site | AS4.9

Air Quality Alerts, Health Impacts, and Adaptation Implications Under Varying Climate Policy 

Rebecca Saari, Matt Sparks, James East, Fernando Garcia-Menendez, and Erwan Monier

Without emission reductions, climate change may increase ozone and PM2.5 air pollution in the United States; however, we do not know how this will affect air quality alerts that prompt people to stay indoors. Here, we use an integrated modeling framework to find distributions of daily Air Quality Index (AQI) during the smog season at the start, middle, and end-of-century. Considering natural variability, climate change may cause air quality alerts to double (increase by a factor of 2 ± 0.2) by 2100. Days when both ozone and PM2.5 exceed alert thresholds quadruple (4.3 ± 1.2). More than 100,000,000 (± 45,000,000) people experience mean air pollution deemed “Unhealthy for Sensitive Groups”, a growth of 7 (±3) times compared to 2000. If people follow alerts by staying inside, they reduce exposure to outdoor-generated pollutants. Their health benefits are similar whether the alert is caused by ozone or PM2.5. Senior (age 65+) populations receive much higher benefits per day by adapting (95CI across ozone and PM2.5: $2.80 to $147) as young adults (age 18-35; 95CI: $0.11 to $4.22) – more than 45 times higher on average. This disproportionate impact requires targeted messaging and guidance, especially as climate-related risks rise.  

How to cite: Saari, R., Sparks, M., East, J., Garcia-Menendez, F., and Monier, E.: Air Quality Alerts, Health Impacts, and Adaptation Implications Under Varying Climate Policy, EGU General Assembly 2026, Vienna, Austria, 3–8 May 2026, EGU26-13710, https://doi.org/10.5194/egusphere-egu26-13710, 2026.

EGU26-14261 | ECS | Orals | AS4.9 | Highlight

Equity and societal capacity for action in climate change scenarios 

Marina Andrijevic

Climate change research relies heavily on scenarios to explore possible futures, yet they are still too often used as purely emissions or temperature trajectories. In this presentation, I showcase scenario-based studies and conceptual advances with scenario frameworks to argue that scenarios can and should be used for joint assessments of climate impacts and the evolving capacities of societies to adapt and mitigate, while placing equity, vulnerability, and feasibility at the center.

I will first discuss scenarios as representations of alternative socioeconomic development pathways, not just climate outcomes. By systematically varying progress in areas such education, health, poverty reduction, governance, scenario analysis can illuminate how different “worlds” of human development translate into very different levels of climate risk, even under similar global warming levels. This work shows that indicators of adaptive capacity (i.e., societies' or individuals' ability to implement adaptation actions, which depends on access to resources and decision-making power) are key for assessing future impacts.

A second focus will be on using scenarios to assess the capacity of societies to undertake mitigation. This strand of research highlights how scenario frameworks can incorporate multiple dimensions of feasibility—social, economic, technological, institutional, and political—rather than treating all mitigation pathways as equally implementable. This allows us to ask where and under what conditions rapid emissions reductions are more feasible, where feasibility constraints are most binding, and how these constraints interact with development and equity.

A particular focus will be on incorporating gender inequality into scenario design and assessment. Drawing on studies that link gender gaps in education, labor force participation, political representation, and access to resources with vulnerability to climate extremes and air quality impacts, I will discuss how gendered power structures shape both the exposure and the capacity to respond.

Finally, I will outline a research agenda for the next generation of scenarios: ones that place societal capacity, equity, and feasibility on equal footing with emissions and temperature, and that are explicitly designed to inform debates on loss and damage, just transitions, climate finance, and development planning in a warming world.

How to cite: Andrijevic, M.: Equity and societal capacity for action in climate change scenarios, EGU General Assembly 2026, Vienna, Austria, 3–8 May 2026, EGU26-14261, https://doi.org/10.5194/egusphere-egu26-14261, 2026.

EGU26-14333 | ECS | Orals | AS4.9

Spatial Decomposition of Socioeconomic Inequalities in PM2.5 Exposure Across Europe 

Muhammed Denizoğlu, Yusuf Aydın, and Alper Ünal

Despite discernible improvements in ambient air quality across the European Union in recent years, income-based inequalities in exposure to fine particulate matter (PM2.5) have remained remarkably persistent. Populations residing in the most socioeconomically disadvantaged regions continue to experience disproportionately higher PM2.5 concentrations compared to those in the wealthiest areas. However, the spatial scales at which these disparities are generated and the structural mechanisms sustaining them remain insufficiently understood.

This study quantifies the PM2.5 exposure gap between the lowest and highest socioeconomic strata across Europe and decomposes this disparity across its constituent spatial scales. The analysis integrates satellite-derived annual mean PM2.5 concentrations from the Atmospheric Composition Analysis Group (V6.GL.02), high-resolution population distributions from the Global Human Settlement Layer (GHS-POP), and settlement typologies from the GHS Settlement Model (GHS-SMOD). These are combined with gridded GDP per capita adjusted for Purchasing Power Parity (PPP) to stratify the European population into socioeconomic quintiles. Europe-wide exposure disparities are then systematically partitioned using a sequential spatial decomposition framework.

This approach isolates three fundamental components of total inequality: (1) inter-country economic disparities, (2) the urban–rural divide, and (3) intra-urban socioeconomic segregation. By disentangling these spatial scales, the study identifies whether observed inequalities primarily arise from regional contrasts across Europe or from localized patterns of urban structure and socioeconomic segregation.

Quantitative results for the 2013–2022 period indicate that regional differences are the dominant contributor to PM2.5 exposure inequality across Europe. Mean concentrations in Southern Europe exceed those in Northern Europe by approximately 9 µgm-3 on avarage, while the lowest socioeconomic quintile experiences PM2.5 levels about 15–20% higher than the highest quintile. Urban–rural contrasts are comparatively smaller, on the order of 1–2 µgm-3.

The findings highlight the necessity of aligning air quality and equity-oriented policies with the spatial scales at which pollution-related inequalities are produced, providing a robust atmospheric science–based foundation for scale-appropriate policy design.

How to cite: Denizoğlu, M., Aydın, Y., and Ünal, A.: Spatial Decomposition of Socioeconomic Inequalities in PM2.5 Exposure Across Europe, EGU General Assembly 2026, Vienna, Austria, 3–8 May 2026, EGU26-14333, https://doi.org/10.5194/egusphere-egu26-14333, 2026.

EGU26-15281 | ECS | Orals | AS4.9

From residence-based to mobility-based exposure assessment: a comparison of urban air pollution exposure modelling approaches for environmental health equity 

Shuoqi Ren, Amanda Giang, Seyed Hamid Delbari, Manvi Bhalla, and Vahid Hosseini

Air pollution is a significant environmental risk for premature mortality and disease. Previous research has documented inequitable air pollution exposure and health outcomes among marginalized and biologically susceptible populations. Characterizing air pollution exposure levels is a key component of assessing public health risks to inform urban policies and planning decisions; however, traditional, residence-based approaches to exposure assessment can fail to capture real-world variability in exposure across space and time, and between households. In this work, we investigate the impact of considering mobility patterns and microenvironments on exposure variability across households.

In urban environments, air pollutant concentrations show strong spatial patterns with fine-scale heterogeneity across diverse microenvironments. For example, traffic-related air pollution (TRAP) often decays by approximately 50% within 150 meters of emission sources (e.g., major roads) and returns to the local background within 500 meters. Still, the decay is context-dependent, shaped by local meteorology and urban-modified flow. Indoor exposure differs further from outdoor concentrations, which are determined by factors such as indoor emissions, building characteristics, and air exchange rates. Individual routines also influence their exposure levels, as reflected in daily activity locations (origins/destinations), the travel trajectories between them, and mobility modes.

To better capture air pollution exposure and assess health risks by accounting for these sources of variability and uncertainty, our study utilizes hourly, 1-km resolution air pollution estimates (NO₂, PM₂.₅, and O₃) for Metro Vancouver, Canada, generated by the coupled WRF-CMAQ modelling system.  The high temporal resolution allows us to assess health risks associated with both short- and long-term exposure to air pollution. Beyond assigning exposure based on residential location, the fine resolution enables us to characterize concentration variability across microenvironments and to link exposures with individuals’ daily time-activity patterns and commuting trajectories. There is a wide range of microenvironment types relevant to air pollution exposure. For example, the U.S. EPA’s Hazardous Air Pollutant Exposure Model defines 18 microenvironments within broader categories such as indoor, outdoor, and in-vehicle, including residences, offices, public transit, and transit-waiting areas. Air pollution exposure within these microenvironments can be estimated using inputs such as the penetration of outdoor pollutants indoors and proximity to emission sources.

As a next step to explore exposure disparities, we will estimate exposures using developed, narrative household archetypes that are grounded in residents' lived experiences. These archetypes are designed to capture intersecting marginalization and disadvantage, reflecting mobility inequities (e.g., barriers to travel, mode choice constraints, and differences in commuting routes).

Together, we will compare and discuss: (1) differences in exposure estimates and their associated uncertainties across modelling methods; and (2) exposure disparities across groups that may contribute to health inequities. We hypothesize that mobility-based approaches offer higher granularity and therefore better capture exposure variability across households and populations than residence-based approaches. We further expect larger exposure differences between households after explicitly accounting for time-activity patterns and travel modes. By evaluating exposures under alternative policy and planning scenarios, our findings can inform sustainable travel mode shift as well as land-use and transportation planning to reduce exposures and enhance environmental health benefits.

How to cite: Ren, S., Giang, A., Delbari, S. H., Bhalla, M., and Hosseini, V.: From residence-based to mobility-based exposure assessment: a comparison of urban air pollution exposure modelling approaches for environmental health equity, EGU General Assembly 2026, Vienna, Austria, 3–8 May 2026, EGU26-15281, https://doi.org/10.5194/egusphere-egu26-15281, 2026.

EGU26-16021 | ECS | Posters on site | AS4.9

A Rapid-Response  Model for Facility-Level Assessment of Air Pollution and Health Impacts   

Qian Song, Shuxiao Wang, and Bin Zhao

To enable scientifically  targeted reductions of atmospheric pollutant emissions, policymakers require robust quantification of the impacts of facility-specific emissions on air quality and associated health benefits. In this study, we couple the chemical transport model CMAQ with the atmospheric dispersion model CALPUFF to develop a grid-scale emission–concentration rapid response framework, termed the Air-quality Intervention for Source-Directed Emission Control Model (AISEC). Using this rapid response model, we conduct a comprehensive assessment of the health burdens attributable to point-source emissions from multiple sectors, such as power plants, across the North China Plain. The results reveal pronounced facility-level heterogeneity in air quality and health impacts in the region. This study provides a computationally efficient and policy-relevant tool for prioritizing emission control strategies based on facility-specific health or other benefits. 

How to cite: Song, Q., Wang, S., and Zhao, B.: A Rapid-Response  Model for Facility-Level Assessment of Air Pollution and Health Impacts  , EGU General Assembly 2026, Vienna, Austria, 3–8 May 2026, EGU26-16021, https://doi.org/10.5194/egusphere-egu26-16021, 2026.

EGU26-16023 | ECS | Posters on site | AS4.9

Revisiting the airshed concept in the tropics for assimilative capacity characterization.  

Juan Cely, Carlos M. González, German Rueda-Saa, and Rodrigo Jimenez

Air pollution has become a serious problem in developing countries due to industrial growth, poor understanding of the atmospheric circulation, weakly planned land use, and weakly enforced air pollution regulation. As part of this, the location of industrial emission clusters frequently does not account for air mass transport, pollutant dispersion, and topographic considerations. This leads to increased regional air pollution; furthermore, regulation remains inadequately focused on urban planning challenges and environmental impact assessments to allow future emissions. Simpler regulatory methodologies usually do not consider regional atmospheric characteristics governed by meteorology, topography, and current pollution load. Ignoring the impact of complex meteorological and topographic features on industrial cluster location leads to an incomplete framework for air quality governance and management. There are two conceptual approaches to regional air pollution management from physical and regulatory / governance perspectives. First, the airshed is defined as a geographic area (also known as an air quality control region), where the air pollutant emissions impact a common group of receptors independent of the administrative / jurisdictional boundaries. Second, the air basin concept refers to a volume of atmosphere in a region within the boundary layer where an airflow phenomenon occurs with similar meteorological and topographic characteristics. The application of this concept in tropical regions is further complicated due to their unique characteristics: complex airflow dynamics, including ventilation, stagnation, recirculation, vertical mixing within the tropical atmospheric boundary layer (ABL), and deep moist convection phenomena. For this reasons, air basins are fundamentally dynamic, with spatial and seasonal variability that can be addressed using the assimilative capacity concept, i.e., the allowable pollutant load under acceptable ambient air concentrations (emissions limits). We argue that the air basin and airshed definitions are currently poorly founded on meteorological and physical region characteristics, particularly in the tropics. In addition, assimilative capacity daily and seasonal variations are usually ignored, and air ventilation maps are not considered as tools for environmental licensing and emissions permitting assessment. Framing air basins is essential to properly estimating assimilative capacity and environmental and land use policies, potentially applicable to tropics. Moreover, an integral definition of an air basin applied to the tropics would cement the basis for the development of appropriate air quality regulations, approval of emission permits, interjurisdictional coordination for mitigation of air pollutants in regions. These concepts will be discussed along with a case example in an inter-Andean in Colombia.

How to cite: Cely, J., González, C. M., Rueda-Saa, G., and Jimenez, R.: Revisiting the airshed concept in the tropics for assimilative capacity characterization. , EGU General Assembly 2026, Vienna, Austria, 3–8 May 2026, EGU26-16023, https://doi.org/10.5194/egusphere-egu26-16023, 2026.

Ambient PM2.5 exposure remains the most critical environmental risk to public health in India; however, exposure to PM2.5 species remains poorly quantified due to the absence of a systematic network for measuring PM2.5 composition. This has limited our understanding of the differential health impacts of PM2.5 species. Here, we developed a novel high-resolution (1-km x 1-km) dataset of concentrations of six aerosol species (BC, OC, sulfate, nitrate, ammonium, dust) and assessed exposure inequality by integrating sociodemographic data from the National Family Health Surveys (NFHS-4 and NFHS-5) across urban and rural India, focusing on gender and wealth.

We trained machine learning models to predict the mass fractions of six PM2.5 species derived from a chemical transport model (CTM), using four predictor variable types: (1) Multi-angle Imaging Spectro-Radiometer-retrieved size- and shape-segregated AODs, (2) sectoral emissions, (3) meteorology, and (4) geospatial variables. These predicted mass fractions were combined with satellite-derived PM2.5 data to estimate monthly mass concentrations across South Asia. The model shows robust performance against ground-based observations (R2 = 0.61; RMSE = 4.23 mg/m3). 

Population-weighted exposure to BC, OC, sulfate, nitrate, ammonium, and dust in India for the NHFS-4 (NFHS-5) was estimated to be 4.22 (4.19), 10.51 (11.02), 5.99 (5.85), 6.97 (7.07), 5.65 (5.58), and 15.97 (16.40) mg/m3, respectively. Exposure was highest in low-SDI states (the Indo-Gangetic Plain and Central India), driven by persistent reliance on biomass and solid fuels. Middle-SDI states achieved the largest reductions in overall exposure from NHFS-4 to NHFS-5, likely due to high clean-fuel conversion rates. In these regions, the urban poor faced a disproportionate relative burden from OC exposure (Z-score of -1.001 in NFHS-5), suggesting that air quality improvements primarily benefited the wealthy. While relative disparities narrowed in urban clusters between the two survey rounds, they widened in rural clusters. Women in rural regions were consistently exposed to elevated levels of carbonaceous aerosols (BC and OC), highlighting the gendered impacts of residential air pollution. In high-SDI urban areas, the relative disparity shifted from positive to negative. This shows that vulnerability patterns change as states progress to higher levels of development. These results underscore the dynamic nature of human exposure throughout economic changes. The study further emphasises the essential need for gender- and wealth-stratified exposure tracking to ensure that national clean air programs do not neglect disadvantaged people as they progress.

How to cite: Srivastava, S. and Dey, S.: Disparity in exposure to PM2.5 species in India reveals the importance of considering PM2.5 composition in epidemiology studies  , EGU General Assembly 2026, Vienna, Austria, 3–8 May 2026, EGU26-16418, https://doi.org/10.5194/egusphere-egu26-16418, 2026.

EGU26-16508 | Posters on site | AS4.9

Investigation of factors that drive the extremely high summertime ozone pollution over the north-west Indo-Gangetic Plain using in-situ measurements and a chemical box model 

Vinayak Sinha, Arpit Awasthi, Sachin Mishra, Raj Singh, Gurmanjot Singh, Rahul Kant Yadav, Mummidivarapu Varkrishna, and Charanpreet Kaur

Every year in May, the north-west Indo-Gangetic Plain experiences its worst ozone pollution with ambient hourly ozone frequently exceeding 100 ppb. Till date however, a mechanistic study of the oxidant and radical chemistry during these periods has been lacking. Here using a novel in-situ dataset of measured ozone precursors, including isoprene and acetaldehyde and nitrogen oxides, we investigate three contrasting ambient ozone periods experienced in May 2023. While two periods had lower NOx (~10 ppb) but contrasting ozone levels of ~50 ppb (period I) and 90 ppb (period III), respectively, period II was impacted strongly by wheat residue-fire plumes and associated with high ambient average daytime ozone (~90 ppb) and higher NOx (~20 ppb). Using a detailed chemical box model, we investigated these three periods in terms of the Leighton ratio, total OH reactivity, radical concentrations and photo-chemically formed oxidation products for mechanistic insights. Furthermore, the ozone production regime and rates were investigated for all three periods. With climate change likely to increase regional temperatures, our results will also present insights on implications for ozone pollution with future climate change.

How to cite: Sinha, V., Awasthi, A., Mishra, S., Singh, R., Singh, G., Yadav, R. K., Varkrishna, M., and Kaur, C.: Investigation of factors that drive the extremely high summertime ozone pollution over the north-west Indo-Gangetic Plain using in-situ measurements and a chemical box model, EGU General Assembly 2026, Vienna, Austria, 3–8 May 2026, EGU26-16508, https://doi.org/10.5194/egusphere-egu26-16508, 2026.

EGU26-18181 | ECS | Orals | AS4.9

Historical Changes and Drivers of Aerosol Acidity in Switzerland under emission reduction and its implication of regulation policies 

Jun Zhang, Ali Waseem, Andrea Baccarini, Stylianos Kakavas, Christoph Hüglin, and Athanasios Nenes

Emission controls in Europe have substantially reduced SOx and NOx but left NH3 largely unchanged. This imbalance between acidic and basic species may shift aerosol acidity and its impacts, including toxicity, particulate matter (PM) composition, and the deposition of reactive nitrogen (Nr). The atmospheric deposition of Nr plays a critical role in ecosystem productivity and PM formation, with impacts that vary across spatial and temporal scales.

In this study, long-term observations (2008–2024) of atmospheric gases and aerosols from Swiss monitoring sites ware analyzed to assess changes under current emission reductions. Aerosol pH was estimated using the ISORROPIA-lite thermodynamic model1 and interpreted using SHapley Additive exPlanations (SHAP) to quantify key drivers. Annual mean aerosol pH shows a slight increasing trend, with consistently lower values in summer than in winter. SHAP results indicate that temperature controls seasonal pH variability at agricultural sites, whereas total ammonia (NH3T) dominates at the semi-alpine site.

Dry deposition regimes of HNO3 and NH3 were investigated in relation to aerosol liquid water content and acidity following the approach of Nenes et al. (2021).2 The findings indicate that NH3 deposition is rapid across both the lowland and Alpine regions, suggesting localized nitrogen burdens near emission sources. In contrast, PM has become increasingly insensitive to NH3 and more sensitive to HNO3, particularly in the agricultural sites. These results highlight that, although HNO3 precursor controls have effectively reduced PM pollution without the need for NH3 reductions, evermore significant ecological concerns remain from a lack of NH3 control. This underscores the need for coordinated reductions in both NOx and NH3 emissions.

References:

1 Kakavas, S., Pandis, S. N., and Nenes, A.: ISORROPIA-Lite: A Comprehensive Atmospheric Aerosol Thermodynamics Module for Earth System Models, Tellus B: Chemical and Physical Meteorology, 74, DOI: 10.16993/tellusb.33, 2022.

2 Nenes, A., Pandis, S. N., Kanakidou, M., Russell, A. G., Song, S., Vasilakos, P., and Weber, R. J.: Aerosol acidity and liquid water content regulate the dry deposition of inorganic reactive nitrogen, Atmospheric Chemistry and Physics, 21, 6023–6033 DOI:10.5194/acp-21-6023-2021, 2021.

How to cite: Zhang, J., Waseem, A., Baccarini, A., Kakavas, S., Hüglin, C., and Nenes, A.: Historical Changes and Drivers of Aerosol Acidity in Switzerland under emission reduction and its implication of regulation policies, EGU General Assembly 2026, Vienna, Austria, 3–8 May 2026, EGU26-18181, https://doi.org/10.5194/egusphere-egu26-18181, 2026.

EGU26-18243 | ECS | Posters on site | AS4.9

Development of a UV Index Estimation Model Using Global Horizontal Irradiance from the GK-2A Satellite 

Sunju Park, Jaemin Kim, and Yun Gon Lee

 Ultraviolet(UV; 100–400 nm) radiation represents the short-wavelength portion of the solar spectrum and poses significant risks to human health, including skin aging, erythema, and skin cancer. Because excessive UV exposure induces erythemal responses of the skin, the UV Index(UVI), derived from erythemally weighted UV irradiance(EUV), is widely used as a public health indicator to communicate UV-related risk levels. Accurate estimation of UVI is therefore essential for both environmental monitoring and public health applications.

 In this study, we develop an empirical model to estimate UVI over South Korea using global horizontal irradiance(GHI) observations from the GK-2A geostationary satellite. The model incorporates key radiative and atmospheric parameters, including the clearness index derived from GK-2A GHI data, total ozone column, and solar zenith angle, in order to account for atmospheric attenuation processes and solar geometric effects governing surface UV radiation.

 The GK-2A GHI–based UVI estimates are evaluated against satellite-derived UVI products from the Geostationary Environment Monitoring Spectrometer(GEMS) onboard the GK-2B satellite. The comparison reveals a strong agreement between the two datasets, with a correlation coefficient(R) of 0.95, demonstrating that the proposed UVI estimation algorithm based on GK-2A GHI is physically consistent with spectrally resolved UV observations from GEMS. This high level of consistency indicates that broadband solar radiation measurements can be effectively utilized to reproduce biologically relevant UV metrics.

 These results highlight the potential of GHI-based UVI estimation as a robust complementary approach to conventional UV retrieval methods, particularly in regions with limited ground-based UV monitoring networks. Furthermore, the proposed framework enables high-resolution and continuous UVI monitoring, supporting applications in public health risk communication, climate studies, and operational UV exposure assessment. This study demonstrates that satellite-based GHI products can play a critical role in expanding the practical use of geostationary satellite observations for UV-related environmental and societal applications.

How to cite: Park, S., Kim, J., and Lee, Y. G.: Development of a UV Index Estimation Model Using Global Horizontal Irradiance from the GK-2A Satellite, EGU General Assembly 2026, Vienna, Austria, 3–8 May 2026, EGU26-18243, https://doi.org/10.5194/egusphere-egu26-18243, 2026.

PM2.5 governance in Taiwan has largely emphasized macro-scale source control, while high-exposure micro-environments embedded in everyday life, such as temple incense burning, often lack actionable, comprehensible information for residents. This study examines the Jianguo Li Tudigong (Earth God) Temple in Yingge District, New Taipei City, as a community-scale “informational nudge” intervention: micro-sensors and a real-time air-quality dashboard were installed, complemented by two temple-festival environmental awareness campaigns to encourage voluntary incense-reduction without constraining religious practice. 

We treat the two environmental awareness campaigns as intervention points and construct four monitoring periods (Periods 1–4) to enable pre- and post-comparisons under similar seasonal conditions, thereby reducing meteorological confounding. Measurement validity is strengthened through regular cross-calibration with reference-grade instruments and by subtracting the background PM2.5 from nearby regulatory stations to isolate local emissions attributable to on-site ritual activities. To account for fluctuations in visitor volume, donation income (incense-offering money) is used as a proxy for attendance and applied in normalization, helping distinguish behavioral change from simple crowd variation. Findings indicate an overall decline in PM2.5 following both environmental awareness campaigns, with the first intervention producing the largest reductions during peak visiting windows (9–11 a.m. and ~3 p.m.); the top 5% extreme concentrations decreased by 40-70 percent, demonstrating substantial mitigation of peak exposure risk. After the second campaign, the timing of high-concentration peaks shifted from the morning toward midday, consistent with behavioral responses, such as the temporal redistribution of visits to avoid higher-pollution hours.

Overall, the case provides empirical support for transparency-based green nudges as a culturally sensitive, low-cost, and replicable framework for improving air quality and reducing exposure risk in small-temple community settings.

How to cite: Chien, S.-S., Chen, W.-J., and Lin, C.-E.: Informational Green Nudges via Air-Quality Transparency: PM2.5 Monitoring, Environmental Awareness Campaigns, and Incense-Reduction Behavior at the Jianguo Li Tudigong Temple , EGU General Assembly 2026, Vienna, Austria, 3–8 May 2026, EGU26-18807, https://doi.org/10.5194/egusphere-egu26-18807, 2026.

EGU26-18901 | ECS | Orals | AS4.9

Updated PM2.5  Mortality Estimates for Europe in Coming Decades via the CATALYSE Project 

Brendan Steffens, Andrea Pozzer, Cathryn Tonne, and Jos Lelieveld

The EU’s CATALYSE project (Climate Action to Advance Healthy Societies in Europe) aims to close the knowledge-to-action gap concerning environmental hazards linked to climate change and their effects on human health in Europe. In doing so, CATALYSE will fortify the science-to-policy interface by providing actionable policy scenarios for Europe for the coming decades. Four such policy scenarios for Europe (spanning 2020 to 2050) have been developed under CATALYSE, each with differing assumptions concerning energy use, agricultural practices, and air quality controls and policies: [1] a business-as-usual Reference Scenario, [2] a Green Deal Scenario, which incorporates the climate targets of the EU's Green Deal, [3] a Beyond Green Deal Scenario, which adds behavioural change policies associated with buildings, transport, and food sectors, and [4] a Beyond Green Deal - 90% Optimization Scenario, which adds enhanced end-of-pipe air pollution control measures. Each of the four scenarios results in differing PM2.5 -precursor emissions between 2020 and 2050.


We have implemented the emissions output from the four CATALYSE scenarios as input in the EMAC atmospheric model (Jöckel et al. 2006), simulating the years 2020, 2030, 2040, and 2050, in order to evaluate each scenario’s impact on PM2.5 concentrations in Europe specifically. We estimate the European mortality burden from these PM2.5 concentrations in each scenario across the coming decades using a suite of exposure response functions. With the FUSION global exposure response function (Burnett et al. 2022), we find that compared to the Reference scenario, annual mortality due to PM2.5  in Europe in the Green Deal scenario is reduced by more than 20,000 deaths in 2030, 30,000 deaths in 2040, and almost 40,000 deaths in 2050. In the more ambitious policy scenarios, those numbers are enhanced by up to a factor of two. Using the European ELAPSE exposure response function (Strak et a. 2021), the Green Deal scenario saves over 50,000, 80,000, and 90,000 lives in 2030, 2040, and 2050, respectively, with the more ambitious policy scenarios once again enhancing those numbers by up to a factor of two.


We conclude that even modest, realistic pollution-mitigation approaches in Europe can significantly reduce the mortality burden due to PM2.5 in the coming decades.

How to cite: Steffens, B., Pozzer, A., Tonne, C., and Lelieveld, J.: Updated PM2.5  Mortality Estimates for Europe in Coming Decades via the CATALYSE Project, EGU General Assembly 2026, Vienna, Austria, 3–8 May 2026, EGU26-18901, https://doi.org/10.5194/egusphere-egu26-18901, 2026.

EGU26-20070 | ECS | Posters on site | AS4.9

Characterizing and visualizing air pollution mixtures for air quality management decision-making in Canada 

Lisa Warum, Briana Pavey, Leah Fernandez, Selene Kutarna, Zoe Davis, Elisabeth Galarneau, and Amanda Giang

While air quality policy has traditionally focused on individual pollutants, in a real-world context, we are exposed to a mixture of pollutants simultaneously. Therefore, current air quality management approaches can fail to capture the synergistic effects of real-world exposures, which often disproportionately impact marginalized communities. This work examines existing approaches used for assessing air pollution mixtures in Canadian decision-making for air quality management and air quality research, to inform the pilot design of fit-to-purpose multi-pollutant analytical and visualization tools.

We collected data from a variety of sources to inform the design of more action-oriented mixture visualizations. These sources included decision-maker interviews and a scoping literature review. Through interviews we investigated the decision context of various decision-informing actors, focusing on data formats, availability and presentation. Interview participants have included municipal, provincial and federal environmental policy-makers and researchers, representatives of health authorities and (frontline) community advocates and researchers. The study collected the questions that these actors are seeking to answer, as well as their perceptions of the limitations of available data, including regarding data format or potential insights. As a next step, this work then combined the insights gained with technical methods for interpreting complex multipollutant data sets from the literature review. Many analysis techniques for multipollutant data sets are effective in reducing the complexity of high-dimensional data sets and produce informative multivariate patterns (e.g. dimensionality reduction techniques, clustering, correlation, and cumulative indicators). However, these methods often generate abstract, technical outputs, which can be difficult for non-expert audiences to interpret, and lack context or place-specific variables.

In a pilot demonstration, multivariate data analyses combined with situated knowledge of the decision context were translated into understandable measures of cumulative exposures to air pollutants. This synthesis is visually represented in a user-friendly, interactive dashboard and will be evaluated through user testing. The objective of the dashboard is to provide insights into the data to help answer user questions given their respective decision context. Examples of questions include: ‘What are the multipollutant profiles in the area? What are the major emission sources contributing to these profiles? What are the characteristics of the population most impacted by these multipollutant exposures?' The pilot dashboard will be tested with users to determine how the multivariate insight can best be communicated and to identify possible limitations and uncertainties. We hypothesize that the dashboard will be positively received if it supports users in answering their relevant questions, while clearly communicating how data insights are generated.
These findings contribute to ongoing efforts to refine analytical tools for multipollutant datasets and situate them within the complexities of local decision-making contexts. These approaches aim to better reflect real-world exposure patterns while balancing analytical complexity with interpretability.

How to cite: Warum, L., Pavey, B., Fernandez, L., Kutarna, S., Davis, Z., Galarneau, E., and Giang, A.: Characterizing and visualizing air pollution mixtures for air quality management decision-making in Canada, EGU General Assembly 2026, Vienna, Austria, 3–8 May 2026, EGU26-20070, https://doi.org/10.5194/egusphere-egu26-20070, 2026.

EGU26-20384 | Orals | AS4.9

Investigating inequalities in exposure to PM2.5 from wood burning 

W. Joe Acton, Deepchandra Srivastava, Siqi Hou, Thomas Wynn, Vipul Lalchandani, Lara Dunn, Zongbo Shi, and William Bloss

Poor air quality is one of the largest environmental threats to human health, with a broad range of pollutants contributing to air pollution. Of these, fine particulate matter, defined here as particles with an aerodynamic diameter of less than 2.5 micrometres (PM2.5), is especially important with respect to human health. Globally, exposure to ambient PM2.5 is estimated to cause 4.2 million early deaths a year (WHO, 2024) and in the UK 30,422-42,640 early deaths were attributable to ambient PM2.5 exposure in 2018 (Flower et al., 2025).

PM2.5 is emitted from a broad range of primary sources and secondary aerosol is formed in the atmosphere from gaseous precursors. In the UK wood smoke from domestic heating has been shown to be an important source of PM2.5 in urban areas, accounting for 20% of annual average PM2.5 mass and up to 50% of PM2.5 mass in the winter heating season (Srivastava et al., 2025). This has led to policy interventions designed to reduce the emission of PM2.5 from domestic combustion. To ensure policy is led by evidence, the source locations and communities exposed to PM2.5 from wood burning need to be better understood.

Here, the spatial distribution of PM2.5­ from wood burning was investigated in the West Midlands, the third largest conurbation in the UK. Black carbon concentrations were determined using an aethalometer mounted in a car and the Aethalometer model (Sandradewi et al., 2008) was used to estimate PM2.5 from wood smoke in the winter heating season. Large spatial variations in PM2.5 from wood smoke were observed and combining these measurements with socio-economic data shows that deprived communities are exposed to the highest concentrations of PM2.5­ from wood burning. However, once population density is considered the data suggest that emissions per household may be higher in less deprived areas.


References

Flower G, Schneider R., Exley K., Mitsakou C., Masselot P. and Gasparrini A.: Mortality impacts of long-term PM2.5 and NO2 exposure in Great Britain under national and international air quality limits. Atmospheric Pollution Research, https://doi.org/10.1016/j.apr.2025.102827

Sandradewi J., Prevot A.S.H., Szidat S., Perron N., Rami Alfarra M., Lanz V.A., Weingartner E., and Baltensperger U.: Using aerosol light absorption measurements for the quantitative determination of wood burning and traffic emission contributions to particulate matter, Environ. Sci. Technol., 42, 33163323, 2008

Srivastava D., Saksakulkrai S., Acton W.J.F., Rooney D.J., Hall J., Hou S., Wolstencroft M., Bartington S., Harrison R.M., Shi Z., Bloss W.J.: Comparative receptor modelling for the sources of fine particulate matter PM2.5 at urban sites in the UK, Atmos. Environ., 343, 2025

World Health Organisation (WHO): Ambient (Outdoor) Air Pollution, 2024. Available at: https://www.who.int/news-room/fact-sheets/detail/ambient-(outdoor)-air-quality-and-health (Last accessed 18th Dec 2025)

How to cite: Acton, W. J., Srivastava, D., Hou, S., Wynn, T., Lalchandani, V., Dunn, L., Shi, Z., and Bloss, W.: Investigating inequalities in exposure to PM2.5 from wood burning, EGU General Assembly 2026, Vienna, Austria, 3–8 May 2026, EGU26-20384, https://doi.org/10.5194/egusphere-egu26-20384, 2026.

EGU26-20525 | ECS | Orals | AS4.9

Health benefits of climate and air pollution policies in the ASEAN region 

Susanna Dedring, Thiago Brito, Adriana Gomez Sanabria, Katrin Kaltenegger, Gregor Kiesewetter, Zbigniew Klimont, Pallav Purohit, Peter Rafaj, Robert Sander, and Fabian Wagner

Economic and social development in the Association of Southeast Asian Nations (ASEAN) region has led to increased greenhouse gas (GHG) emissions and elevated levels of fine particulate matter (PM2.5), contributing to global warming and severe health impacts. More than 75 percent of population (about 500 million) is exposed to PM2.5 levels above WHO guidelines with over 17 percent of urban residents experiencing concentrations above 35 µg/m3. Despite national and regional commitments on emission reductions, their current and future impacts on air quality and health remain poorly understood.

Using the Greenhouse Gases - Air Pollution Interactions and Synergies (GAINS) modelling framework, we projected CO2 and PM2.5 precursor emissions (primary PM2.5, SO2, NOX, NH3 and VOC), PM2.5 population exposure and associated premature mortality from 2020 to 2040 under different policy scenarios. We also identified the contributing sectors with the largest mitigation potential.

We estimate CO2 emissions of around 1,685 Mt in 2020 in the ASEAN region, and ASEAN-wide mean PM2.5 exposure levels around 15 µg/m3, leading to 210,000 premature deaths. In a counterfactual scenario without further mitigation measures beyond those implemented in 2015, CO2 emissions are projected to double and PM2.5 levels increase by 33 percent by 2040 and doubling the number of urban residents exposed to PM2.5 levels above 35 µg/m3.

While committed climate policies in power and transportation sectors achieve substantial CO2 emission reductions (25 percent by 2040), they lead only to marginal improvements on PM2.5 exposure and health co-benefits. The effective implementation of current legislation on air pollution on top of the climate measures reduces 2040 PM2.5 exposure to about 2020 levels, however, premature mortality still exceeds current levels due to a higher share of exposure to very high levels especially in cities and to population aging.

Ample potential exists to reduce PM2.5 exposure with existing technologies. Our maximum emission control scenario suggests that tightening air pollution controls could reduce health impacts by over two-thirds across ASEAN region, with largest emission reduction potential identified in the transport, industry and agriculture sectors.

These findings show that significant co-benefits of climate policies for air pollution related health impacts are not achieved without stringent measures beyond existing policies in the ASEAN region. The assessment lays the basis for developing regional strategies integrating climate and air pollution policies.

How to cite: Dedring, S., Brito, T., Gomez Sanabria, A., Kaltenegger, K., Kiesewetter, G., Klimont, Z., Purohit, P., Rafaj, P., Sander, R., and Wagner, F.: Health benefits of climate and air pollution policies in the ASEAN region, EGU General Assembly 2026, Vienna, Austria, 3–8 May 2026, EGU26-20525, https://doi.org/10.5194/egusphere-egu26-20525, 2026.

On 3 May 2025, a severe hailstorm affected Paris and parts of western Europe. We assess whether anthropogenic climate change contributed to its intensity using ERA5 reanalyses and an analogue-based attribution framework. The synoptic pattern featured a cut-off low and a surface cold front following several warmer-than-normal days. We identify circulation analogues to 3 May 2025 in two periods, namely a cooler “past” (1974–1999) and a warmer “present” (1999–2024). We then compare thermodynamic conditions under otherwise similar large-scale flow. Hail probability and size are estimated with two models: (i) a logistic formulation using Convective Available Potential Energy (CAPE), deep-layer wind shear, and convective precipitation, and (ii) an extended model including freezing-level height and 850 hPa temperature, tailored to European hail environments. Models are calibrated with ˆIle-de-France observations and validated independently. Present-day analogues exhibit significantly higher CAPE, a higher freezing level, and similar deep-layer shear, yielding larger hail probability and size. These results indicate that human-induced warming likely enhanced the hailstorm severity in this synoptic setting.

How to cite: Faranda, D. and Alberti, T.:   Investigating the Role of Climate Change in the 3 May 2025 Western Europe Hailstorm Using Atmospheric Analogues, EGU General Assembly 2026, Vienna, Austria, 3–8 May 2026, EGU26-2862, https://doi.org/10.5194/egusphere-egu26-2862, 2026.

Thunderstorm activity and associated turbulence pose significant operational challenges for major airports, especially in the context of a changing climate. This study analyzes a high impact winter convective event that forced delays and cancellations at the Rome-Fiumicino airport. We investigate how the synoptic conditions of similar events have evolved over the past five decades (1974–2024) using reanalysis data and a pattern analog approach. We compare atmospheric configurations from the past (1974-1999) and recent (1999-2024), focusing on key parameters related to convection and turbulence. For similar synoptic configurations, our results show an increase in Convective Available Potential Energy (up to 20%), low-level vertical wind shear (up to 20–25%), and turbulence (up to 25-30 %) near Rome-Fiumicino airport in the more recent period, indicating a greater potential for organized convection and turbulence. The analysis of vertical atmospheric profiles reveals enhanced wind shear and turbulence especially in the lower troposphere (0-3 km), with implications for mechanical turbulence during aircraft approach and departure. At Rome-Fiumicino airport, the number of fog and thunderstorms during similar synoptic patterns is increased (from 1 to 4), average approaching visibility decreased from 10 to 7 km, stronger surface winds (from 10 to 15 km/h) are observed, with also increases in average temperatures (from 11 to 13 °C). Finally, using a multinomial logistic model we show that hazardous weather events, particularly thunderstorms and hail, are becoming more frequent for similar recent events (from 2% to 6% annual occurrence). These trends are linked to both human-driven climate change and long-term variations in large-scale modes of natural variability. 

How to cite: Alberti, T. and Faranda, D.: Was the 13 December 2024 severe thunderstorm over Rome-Fiumicino airport intensified by climate change?, EGU General Assembly 2026, Vienna, Austria, 3–8 May 2026, EGU26-2952, https://doi.org/10.5194/egusphere-egu26-2952, 2026.

EGU26-3128 | ECS | Orals | NP1.3

Heatwave-generating Rossby waves and the persistence of temperature extremes in a changing climate 

Wolfgang Wicker, Emmanuele Russo, and Daniela Domeisen

The frequency and duration of hot extremes is projected to increase over the coming decades. It remains, however, unclear to what extent persistent surface temperature extremes require an anomalously persistent circulation in the upper troposphere. To shed more light on this relationship, we combine idealized model experiments with reanalysis data and assess the zonal phase speed of Rossby waves as a proxy for circulation persistence. In particular, we compare the climatological-mean phase speed spectrum to the properties of heatwave-generating Rossby wave packets.

In the idealized model without thermodynamic feedbacks, a phase speed increase in response to a localized thermal forcing reduces the frequency of heatwaves. Reanalysis data for the Southern hemisphere mid-latitudes shows a similar and significant phase speed increase from the 1980s until today. However, the observed mean phase speed increase does not apply to heatwave-generating Rossby waves and hence does not contribute to a change in heatwave frequency. The Northern hemisphere, on the other hand, does not yet show a clear phase speed trend in reanalysis. But with continued global warming, we expect an acceleration of heatwave-generating Rossby waves and a reduced upper-tropospheric forcing to persistent temperature extremes in the future.

How to cite: Wicker, W., Russo, E., and Domeisen, D.: Heatwave-generating Rossby waves and the persistence of temperature extremes in a changing climate, EGU General Assembly 2026, Vienna, Austria, 3–8 May 2026, EGU26-3128, https://doi.org/10.5194/egusphere-egu26-3128, 2026.

EGU26-3562 | ECS | Orals | NP1.3

Validation of reanalysis products for extreme event attribution at regional and national levels 

Claire Bergin, Clair Barnes, Lionel Swan, Friederike Otto, and Peter Thorne

The WASITUS project was established to build towards an operational event attribution capability for Ireland. The project’s aim is to deep dive into the effect climate change has on extreme weather events at a national level, while also providing additional support to international attribution groups such as project collaborators; World Weather Attribution. 

By focusing on smaller national scales, and investigating data products used in event attribution, attribution studies can become more accurate and offer deeper insight for local responders and policy makers. A main focus of the WASITUS project is to take advantage of the small geographical size of Ireland and work directly with end-users to better understand how event attribution can help them prepare for future changes in extreme weather. These end-users include members of the public, local representatives, and national policy makers. This directly links attribution with real-world planning and damage mitigation measures.

Focusing on the data side of event attribution, most datasets used, whether reanalysis or models, have been tested at large regional or continental scales. However, we have found that the reanalysis data for Ireland, an island nation on the western boundary of most European datasets, is not as accurate as the data over continental Europe. This is quite possibly the case for other nations globally, where a variety of geographical and observational factors may have led to reanalysis products inaccurately representing the weather and climatology. As Ireland sits on the East of the Atlantic ocean, it is prone to weather threats of marine origin. Therefore, it is important to question the data used in creating the reanalysis and model products for Ireland as changing climate trends impact Ireland in different ways to the rest of Europe. 

A particular issue found for reanalysis products is their retrospective extension to earlier decades. To combat this potential issue, we are developing a toolbox to ascertain if reanalysis products reliably characterise the temperatures experienced in a given region for the entirety of the available time-series. The toolbox also aims to identify if shorter subsets of the entire reanalysis timeseries better represent the changing climate than the full dataset. Focusing on ERA5 daily maximum and minimum temperature data over the Republic of Ireland, station observations are being statistically compared to location-specific reanalysis data. While the initial focus will be temperature in Ireland, this toolbox should be readily adaptable for use in different regions globally, as well as on different meteorological parameters, provided sufficient long-term records are available.

In future, it is hoped that other national attribution capabilities, which are being newly formed, can collaborate and aid one another in conducting analysis and report writing. National groups also allow for further research into the methods used for extreme event attribution, where a focus can be placed on improving and expanding the existing attribution capability. In addition, time and focus placed on smaller geographical regions allows for data used in attribution analysis to be thoroughly quality controlled and checked.

How to cite: Bergin, C., Barnes, C., Swan, L., Otto, F., and Thorne, P.: Validation of reanalysis products for extreme event attribution at regional and national levels, EGU General Assembly 2026, Vienna, Austria, 3–8 May 2026, EGU26-3562, https://doi.org/10.5194/egusphere-egu26-3562, 2026.

EGU26-3580 | Orals | NP1.3

Atmospheric drivers and thermodynamic controls of precipitation variability in North Africa 

Meryem Tanarhte, Andries-Jan De Vries, Georgios Zittis, Moshe Armon, Assaf Hochman, Andreas Karpasitis, Dimitris Kaskaoutis, and Samira Khodayar

Precipitation variability across North Africa spans a wide range of timescales and climatic regimes, from Mediterranean winter precipitation to Saharan convective systems, yet its underlying drivers remain incompletely understood. This contribution synthesizes current knowledge on the atmospheric and surface drivers of precipitation variability in North Africa, drawing on evidence from observations, reanalyses and climate simulations from the Holocene to future projections.

We review the role of large-scale circulation modes, together with synoptic-scale processes such as Rossby wave breaking, cut-off lows, and cyclogenesis, in shaping interannual variability and extreme precipitation events along the Mediterranean coast. Further south, seasonal dynamics linked to the Saharan Heat Low, moisture transport, and land–atmosphere coupling modulate the intermittency and intensity of precipitation in arid regions. Holocene evidence highlights the sensitivity of North African hydroclimate to external forcing and land-surface feedbacks, while also illustrating limits to direct analogy with anthropogenic greenhouse-gas forcing. Future projections indicate that uncertainty in precipitation change is dominated by internal variability and circulation responses, with more robust signals emerging in variability and extremes than in mean precipitation.

As precipitation variability constitutes a climate hazard in its own right, understanding its atmospheric and thermodynamic drivers is central to assessing drought–flood dynamics and their implications for water resources, ecosystems, and human systems across North Africa.

How to cite: Tanarhte, M., De Vries, A.-J., Zittis, G., Armon, M., Hochman, A., Karpasitis, A., Kaskaoutis, D., and Khodayar, S.: Atmospheric drivers and thermodynamic controls of precipitation variability in North Africa, EGU General Assembly 2026, Vienna, Austria, 3–8 May 2026, EGU26-3580, https://doi.org/10.5194/egusphere-egu26-3580, 2026.

EGU26-5518 | Orals | NP1.3

Can tropospheric configurations linked to the onset or aftermath of polar vortex decelerations be distinguished from climatology? 

David Gallego, Carmen Álvarez-Castro, Davide Faranda, and Cristina Peña-Ortiz

Wintertime stratospheric circulation in the Northern Hemisphere is dominated by a strong and persistent westerly polar vortex. However, every one to two years, this system undergoes a strong disruption associated with a fast deceleration or even a reversal, accompanied by a massive warming of the polar stratosphere. The tropospheric impacts of these extreme events, commonly referred to as “sudden stratospheric warmings” (SSWs) are well documented, but their precursors and subsequent responses in the troposphere remain frustratingly difficult to categorize systematically. Using recent advances in dynamical systems theory applied to the atmosphere, we analyze from a general point of view, the relationship between very anomalous stratospheric states and tropospheric configurations. We find that highly anomalous geopotential configurations at 10 hPa are unequivocally associated with the occurrence of a strong stratospheric vortex deceleration. However, no distinctive tropospheric patterns can be identified either prior to or following these events. This suggests that both tropospheric precursors and responses to extreme vortex decelerations are fundamentally nonspecific and in consequence, they could be statistically indistinguishable from the background tropospheric variability.

How to cite: Gallego, D., Álvarez-Castro, C., Faranda, D., and Peña-Ortiz, C.: Can tropospheric configurations linked to the onset or aftermath of polar vortex decelerations be distinguished from climatology?, EGU General Assembly 2026, Vienna, Austria, 3–8 May 2026, EGU26-5518, https://doi.org/10.5194/egusphere-egu26-5518, 2026.

EGU26-7152 | ECS | Orals | NP1.3

Extreme precipitation changes in relation to urbanization 

Alice Guccione, Paolo Bassi, Fabien Desbiolles, Matteo Borgnino, Fabio D'Andrea, and Claudia Pasquero

The rising frequency of extreme precipitation is a major concern linked to climate change, commonly associated with increased atmospheric water vapor due to global warming. In densely populated areas, intense rainfall has particularly severe impacts, with urbanization amplifying extreme weather through changes in land surface and local atmospheric conditions.  As attribution science increasingly informs climate policy, it is crucial to discern the extent to which shifts in extreme event probability stem from global versus local anthropogenic drivers. This study analyzes multi-decadal daily precipitation records alongside urbanization indices. In line with previous research, results show a general rise in extreme rainfall frequency, with more intense events exhibiting a larger increase. Analysis of population and urban development metrics reveals that the increase is notably smaller in rural areas, suggesting that the rise attributable to local urban development is of the same order of magnitude as that resulting from global warming. This result is shown to be associated with the urban amplification of convective updraft intensification.

How to cite: Guccione, A., Bassi, P., Desbiolles, F., Borgnino, M., D'Andrea, F., and Pasquero, C.: Extreme precipitation changes in relation to urbanization, EGU General Assembly 2026, Vienna, Austria, 3–8 May 2026, EGU26-7152, https://doi.org/10.5194/egusphere-egu26-7152, 2026.

EGU26-7744 | Orals | NP1.3

Scale-by-scale two-point statistics in WRF Hybrid LES model 

Kazim Sayeed, Clement Blervacq, Manuel Fossa, Nicolas Massei, and Luminita Danaila

Atmospheric variability spans interacting regimes set by rotation, stratification, and diabatic forcing. One open question is that diagnosing scale-to-scale energy transfer remains challenging because observations rarely provide complete budget closure. We analyze the June 2019 European heatwave using the Weather Research and Forecasting (WRF) model with a hybrid, scale-adaptive LES closure and five nested domains, resolving horizontal separations from O(102) m to O(106)–O(107) m.

Starting from the governing equations of motion in WRF hybrid vertical coordinate, we derive and appraise generalized two-point, Scale-by-Scale (SbS) budget equations for the second-order moments of horizontal velocity increments, reflecting the kinetic energy at each scale. Whilst equations are written for all scales and any point of the considered domains, their assessment against data is performed in a plane parallel to the ground. SbS energy budget equations account for the inhomogeneity, anisotropy, and all effects present in the first principles. We complement these diagnostics with height-dependent characteristic length scales (Kolmogorov, Taylor, Ozmidov, buoyancy, Rhines and Rossby deformation).
We show results for two cases:
i) In the free troposphere, where the SbS kinetic-energy budget is dominated by the advective term (reflecting non-linear interactions and energy transfer), which is balanced by the pressure-gradient contributions. Radial integration of the advective term reproduces the third-order structure function and exhibits a sign reversal near r ∼ 105 m, reflecting transitions between downscale and upscale kinetic energy transfer across mesoscale–synoptic ranges.
ii) In the lower troposphere, we investigate daytime and nocturnal conditions. First, in daytime conditions, the boundary layer exhibits a classical behavior, in which energy is transferred across scales mainly by advective, non-linear effects. Second, for stable stratification during the night, the pressure contribution increases significantly, and the advective transfer adjusts to the pressure-imposed scale dependence, as already noted in the free atmosphere.

These results provide a physically interpretable framework for diagnosing atmospheric cascades across scales and motivate extending SbS budgets to include thermodynamic variables, such as the moist potential temperature and the water vapor content. The latter would allow us to quantify the contributions of radiative and diabatic forcings over short- and long-term timescales, relevant to climate variability.

How to cite: Sayeed, K., Blervacq, C., Fossa, M., Massei, N., and Danaila, L.: Scale-by-scale two-point statistics in WRF Hybrid LES model, EGU General Assembly 2026, Vienna, Austria, 3–8 May 2026, EGU26-7744, https://doi.org/10.5194/egusphere-egu26-7744, 2026.

EGU26-9126 | Posters on site | NP1.3

Cold extremes enduring in a much warmer world 

Eva Holtanova, Senne Van Loon, and Maria Rugenstein

It is the combination of internally induced oscillations and externally forced climate change signals that we observe and feel every day as climate conditions. External forcing can change not only the mean state, but also the internal variability. One of the most important and impactful aspects of variability is the frequency and magnitude of extremes. Even though the cold extremes are expected to warm, they can still have severe impacts on society and ecosystems, which have adapted to a warmer climate. We investigate how the internal variability of winter temperature might change under stronger radiative forcing. For this purpose, we utilize two different datasets: a set of LongRunMIP simulations, analyzing near-equilibrium conditions under preindustrial and abrupt 4xCO2 forcings, and transient large ensemble simulations comparing the historical and scenario periods (the end of the 21st century under RCP8.5/SSP5-8.5 socio-economic pathways). We focus on northern middle latitudes (40 – 70 ° of latitude). In this region, the near-surface climate is largely influenced by atmospheric circulation, including various large-scale modes of variability. A change in the shape of the temperature distribution can then point to a fundamental change in climate-governing processes. It has been argued that increasing winter mean temperatures would be accompanied by a decrease in variance, as day-to-day temperature variations are induced by the occurrence of synoptic-scale weather systems, and in warmer climates, this is expected to decline. Our study provides new insights, showing that the variance shrinking is spatially heterogeneous. We further concentrate on the skewness of the temperature distribution and investigate the changes in the lengths of the cold and hot tails, which are related to the changes in variance. In many mid-latitude regions, the skewness is decreasing, and the cold tail is shrinking at a slower rate than the hot tail, implying enduring cold extremes, even in climatic states much warmer than those we are familiar with.  

How to cite: Holtanova, E., Van Loon, S., and Rugenstein, M.: Cold extremes enduring in a much warmer world, EGU General Assembly 2026, Vienna, Austria, 3–8 May 2026, EGU26-9126, https://doi.org/10.5194/egusphere-egu26-9126, 2026.

EGU26-9245 | Orals | NP1.3

How to compute extreme cold levels to design power plants in the climate change context?  

Sylvie Parey, Thi Thu Huong Hoang, and Benoit Guisnel

 The expected impact of climate change on temperature extremes is an increase in both the frequency and intensity of heat waves, while cold waves are expected to become less frequent and associated with milder cold temperatures. However, cold waves cannot be ruled out, as cold temperatures similar to those experienced in the past can still occur, at least in the near future, albeit with a lower probability.

While many studies have focused on estimating hot extremes in the context of non-stationary climate change, fewer have addressed the estimation of cold extremes, which must be considered for the design of new installations. Unlike hot extremes, which will intensify over time, the coldest values that might affect existing or planned installations are expected to occur now or in the very near future.

Temperature extremes exhibit different types of non-stationarities: a seasonal cycle, the human-induced climate change trend, and interannual to decadal variability. The seasonal cycle is commonly handled by selecting the season prone to the analyzed extremes. Various methods have been proposed to account for the trend due to human-induced climate change in extreme value estimations, either by considering trends in the parameters of statistical extreme value distributions (Coles, 2001; Parey et al., 2007; Gilleland and Katz, 2016; Barbaux et al., 2025, among others) or by computing a reduced variable whose extremes can be considered stationary and then back-transformed (Parey et al., 2013, 2019; Mentachi et al., 2016). However, for cold extremes, interannual variability generally plays a more significant role.

Therefore, in this study, we propose and test an approach to infer extreme cold values representative of the current climate by combining extreme deviations from the average winter mean and variance, as observed during the coldest winters in the past, with the average conditions of current winters. The methodology will first be described then illustrated with examples.


References:

Coles S (2001) An introduction to statistical modelling of extreme values, Springer Series in Statistics. Springer, London

Parey S, Malek F, Laurent C, Dacunha-Castelle D (2007) Trends and climate evolution: statistical approach for very high temperatures in France. Clim Change 81:331–352. https://doi.org/10.1007/s10584-006-9116-4

Gilleland, E., & Katz, R. W. (2016). extRemes 2.0: An Extreme Value Analysis Package in R. Journal of Statistical Software72(8), 1–39. https://doi.org/10.18637/jss.v072.i08

Occitane Barbaux, Philippe Naveau, Nathalie Bertrand, Aurélien Ribes, Integrating non-stationarity and uncertainty in design life levels based on climatological time series, Weather and Climate Extremes, Volume 50, 2025,100807, ISSN 2212-0947, https://doi.org/10.1016/j.wace.2025.100807.

Parey S, Hoang TTH, Dacunha-Castelle D (2013) The importance of mean and variance in predicting changes in temperature extremes. J Geophys Res Atmos 118:8285–8296. https://doi.org/10.1002/jgrd.50629

Parey, S., Hoang, T.T.H. & Dacunha-Castelle, D. Future high-temperature extremes and stationarity. Nat Hazards 98, 1115–1134 (2019). https://doi.org/10.1007/s11069-018-3499-1

Mentaschi, L., Vousdoukas, M. I., Voukouvalas, E., Sartini, L., Feyen, L., Besio, G., & Alfieri, L. (2016). The transformed-stationary approach: a generic and simplified methodology for non-stationary extreme value analysis. Hydrology and Earth System Sciences, 20(9), 3527–3547. https://doi.org/10.5194/hess-20-3527-2016


How to cite: Parey, S., Hoang, T. T. H., and Guisnel, B.: How to compute extreme cold levels to design power plants in the climate change context? , EGU General Assembly 2026, Vienna, Austria, 3–8 May 2026, EGU26-9245, https://doi.org/10.5194/egusphere-egu26-9245, 2026.

EGU26-11777 | Orals | NP1.3

Understanding Complexity to Anticipate Maladaptation: A System Dynamics Approach to Climate Extremes Adaptation with Climate Services 

Riccardo Biella, Luigia Brandimarte, Maurizio Mazzoleni, and Giuliano Di Baldassarre

The risk of extreme climate events is increasing due to the compounding effects of climate change and the increasing dependence on natural resources, with impacts that cascade through ecosystems, livelihoods, and institutions long after the event itself. Climate services are therefore increasingly central to adaptation, providing information that helps anticipate hazards, guide preparedness, and support response. Yet, adaptation can often turn maladaptive when it unintentionally shifts risk to other groups, degrades ecological buffers, or locks systems into trajectories that increase their long-term vulnerability. Climate services rarely account for these unintended consequences, despite their centrality in what decisions can be taken and by whom. Against this backdrop, our contribution presents a methodological framework that integrates system thinking and system dynamics modelling to anticipate how climate services shape long-term socio-ecological outcomes of climate extremes, including the risk of maladaptation.

Our framework combines four elements. First, we use system archetypes to identify recurring maladaptive patterns relevant to extremes’ impacts, such as risk shifting across space or social groups, and “fixes” that reduce immediate losses while degrading ecological resilience. Second, these dynamics are refined through a stakeholder-led iterative process. Third, maladaptation risk and adaptation trade-offs are evaluated and described. Fourth, these dynamics are formalized in a system dynamics model to test different climate information scenarios.

Our application of this framework shows that different typologies of climate services can influence long-term impact trajectories by influencing what risks are prioritized, which measures are selected, and who is able to act. Additionally, under increasing climate variability and compounding shocks, these dynamics become more pronounced, increasing the likelihood that short-term coping undermines long-term resilience. Consequently, accessible and long-term climate services become pivotal in ensuring sustainable adaptive strategies benefitting all stakeholders.

By linking climate services to the complex, socio-ecological impact of climate extremes, this approach lays the groundwork for testing the risk of maladaptation in the development of climate services and adaptation strategies, supporting equitable and durable disaster impact reductions.

How to cite: Biella, R., Brandimarte, L., Mazzoleni, M., and Di Baldassarre, G.: Understanding Complexity to Anticipate Maladaptation: A System Dynamics Approach to Climate Extremes Adaptation with Climate Services, EGU General Assembly 2026, Vienna, Austria, 3–8 May 2026, EGU26-11777, https://doi.org/10.5194/egusphere-egu26-11777, 2026.

EGU26-12488 | ECS | Orals | NP1.3

Characterization of aviation turbulence associated with Mediterranean tropical-like cyclones (Medicanes) 

Marialuisa Simone, Sergio Servidio, Mario Marcello Miglietta, and Tommaso Alberti

The Mediterranean is a climatologically sensitive region due to its transitional position between the arid subtropics and the wetter mid-latitudes. In recent years, Mediterranean tropical-like cyclones, or Medicanes, have gained increasing attention. These rare baroclinic cyclones that evolve in their mature stage into vortices with structural characteristics similar to tropical cyclones. Although they occur only a few times per decade, Medicanes can produce severe socio-economic impacts through intense precipitation, strong winds, and coastal flooding. 

Observational and modeling studies indicate that rising sea surface temperatures may affect Medicane evolution, potentially leading to stronger storms. Understanding their dynamics is therefore important not only for climatology but also for operational sectors such as aviation, which are directly exposed to atmospheric hazards. While the surface impacts of Medicanes have been widely studied, their influence on upper-tropospheric conditions, particularly turbulence relevant to aviation, remains poorly documented. In-flight encounters with turbulent eddies represent a major aviation hazard, often resulting in injuries, aircraft damage, and economic losses to airlines. 

This study presents the first systematic investigation of aviation-scale turbulence associated with eleven Medicanes that occurred between 1996 and 2023. The analysis is based on three empirical turbulence diagnostics (TI1, TI2, and TI3), commonly used to identify synoptic-scale patterns conducive to shear-induced turbulence. These indices, derived from the ERA5 reanalysis dataset, are computed for each Medicane across the 900–200 hPa layer and as a function of radial distance from the cyclone center, with the aim of assessing how turbulence conditions within Medicanes evolve in a changing climate.

How to cite: Simone, M., Servidio, S., Miglietta, M. M., and Alberti, T.: Characterization of aviation turbulence associated with Mediterranean tropical-like cyclones (Medicanes), EGU General Assembly 2026, Vienna, Austria, 3–8 May 2026, EGU26-12488, https://doi.org/10.5194/egusphere-egu26-12488, 2026.

EGU26-12606 | ECS | Posters on site | NP1.3

Attribution of the Impacts of the 2024 Extreme Floods in Rio Grande do Sul, Brazil, to Climate Change  

Mireia Ginesta, Leonardo Laipelt, Benjamin Franta, and Rupert F. Stuart-Smith

Extreme flood events are among the most damaging climate-related hazards, with significant human and socio-economic impacts. Understanding the extent to which anthropogenic climate change influences both the physical characteristics and impacts of such events is important for supporting policymakers in risk management and adaptation, informing loss and damage mechanisms, and raising public awareness of the impacts of climate change. Here, we apply a circulation-analogue attribution approach to quantify the impacts of climate change on flooding, extending the use of dynamical analogues from hazard attribution to impact analysis. The framework is designed to work with limited data, making it particularly relevant for data-scarce regions, including much of the Global South.

In late April and early May 2024, extreme flooding affected large parts of the state of Rio Grande do Sul in southern Brazil, being the largest floods ever observed along several regional rivers. The event caused at least 183 fatalities and affected more than 2.3 million people, making it one of the most severe climate-related disasters in Brazil’s history. Weekly rainfall totals exceeded 300 mm across much of the state and 500 mm locally.

In this study, we assess the influence of anthropogenic climate change on the socio-economic impacts of this extreme flood event using a three-step attribution framework. First, we attribute the total event rainfall to climate change by identifying dynamical analogues—events with similar large-scale atmospheric circulation—in single-model initial-condition large ensembles under factual and counterfactual climate conditions. Second, the resulting precipitation signals are used to force a hydrological flood model to quantify climate-induced changes in flood magnitude and spatial extent. Finally, we evaluate the associated socio-economic impacts based on the climate-attributed flood signal.

How to cite: Ginesta, M., Laipelt, L., Franta, B., and Stuart-Smith, R. F.: Attribution of the Impacts of the 2024 Extreme Floods in Rio Grande do Sul, Brazil, to Climate Change , EGU General Assembly 2026, Vienna, Austria, 3–8 May 2026, EGU26-12606, https://doi.org/10.5194/egusphere-egu26-12606, 2026.

EGU26-13596 | ECS | Orals | NP1.3

Impact of Sudden Stratospheric Warming on the Genesis of Mediterranean Cyclones and Associated Precipitation 

Babita Jangir, Carmen Álvarez-Castro, Cristina Peña Ortiz, David Gallego Puyol, Shira Raveh-Rubin, and Ehud Strobach

Extreme stratospheric polar vortex events, including sudden stratospheric warmings (SSWs) and episodes of strong polar vortex, are known to influence wintertime surface weather by modulating large-scale circulation patterns. While previous studies have primarily focused on their impacts over the North Atlantic and northern Europe, the effects on Mediterranean storm activity remain less well quantified. In this study, we examine the tropospheric response to SSW events from 1979 to 2020, with a particular focus on the associated changes in cyclone activity over the Mediterranean region.

Using a composite analysis of 28 SSW events within the study period, we examine the temporal and spatial evolution of cyclone frequency, genesis density, and associated dynamical fields before and after SSW onset. Seasonal and daily climatological signals are removed to isolate anomalies directly linked to stratosphere-troposphere coupling. Our results show a clear increase in cyclone activity over North Africa and the Atlantic coast of the Iberian Peninsula, associated with increased precipitation over western and southern Europe following SSW events. This is consistent with a southward displacement of the midlatitude jet and storm track. This shift is supported by enhanced upper-level wind speeds, divergence, and potential vorticity anomalies over the region during the post-SSW 2-month period.  Despite the robust composited signal, substantial inter-event variability is observed, indicating that not all SSWs lead to an identical response. These findings highlight the importance of event-to-event differences in determining regional storm impacts.

Overall, this study demonstrates that stratospheric polar vortex disruptions can significantly modulate Mediterranean storms on subseasonal timescales, highlighting the potential value of stratospheric information for enhancing the predictability of wintertime extreme weather over southern Europe and the Mediterranean Basin.

Keywords: Sudden stratospheric warming; polar vortex; Mediterranean cyclones; jet stream; stratosphere–troposphere coupling; subseasonal variability

How to cite: Jangir, B., Álvarez-Castro, C., Peña Ortiz, C., Gallego Puyol, D., Raveh-Rubin, S., and Strobach, E.: Impact of Sudden Stratospheric Warming on the Genesis of Mediterranean Cyclones and Associated Precipitation, EGU General Assembly 2026, Vienna, Austria, 3–8 May 2026, EGU26-13596, https://doi.org/10.5194/egusphere-egu26-13596, 2026.

EGU26-13622 | Orals | NP1.3

Surface temperature extremes mirrored in top of atmosphere radiative fluxes 

Doris Folini and Daniela Domeisen

Using ERA5 re-analysis data, 1950 to 2024, we look at surface temperature extremes, which we define as regions of at least 0.5 million square kilometers where the monthly mean 2m temperature exceeds its 25 year climatological mean by at least 1.5 standard deviations. While heat extremes are overall a topic of intense research, we here target a facet of such extreme events that has been less examined so far: how they manifest in terms of top of atmosphere (TOA) radiative fluxes. For the short- and long-wave TOA fluxes associated with such extreme events, we find typically enhanced values. This may be expected, given that mid-latitude heat waves are often accompanied by clear skies. For the TOA net energy flux, we find typically negative values. Spatially more extended extreme events tend to be associated with stronger temperature anomalies. Individual extreme events may deviate from these general tendencies. For selected extremes, daily ERA5 re-analysis data are examined. For the period 2001 to 2024, TOA fluxes from ERA5 re-analysis are compared to CERES satellite data.

How to cite: Folini, D. and Domeisen, D.: Surface temperature extremes mirrored in top of atmosphere radiative fluxes, EGU General Assembly 2026, Vienna, Austria, 3–8 May 2026, EGU26-13622, https://doi.org/10.5194/egusphere-egu26-13622, 2026.

EGU26-14086 | Orals | NP1.3 | Highlight

Emerging evidence of Greenland Ice Sheet melt influence on recent Euro-Mediterranean record-breaking heat and convective storms 

Juan Jesús González-Alemán, Marilena Oltmanns, Sergi González-Herrero, Frederic Vitard, Markus Donat, Francisco Doblas-Reyes, David Barriopedro, Jacopo Riboldi, Carlos Calvo-Sancho, Bernat Jiménez-Esteve, Pep Cos, and Michael Wehner

In recent decades, the Euro–Mediterranean region has experienced a marked increase in catastrophic summer climate extremes, including persistent record-breaking atmospheric and marine heatwaves, and destructive convective events such as long-lived mesoscale convective systems (derecho) and supercells with unparalleled hail-size. All these have provoked severe socioeconomic, ecological and human impacts. While these phenomena are often studied separately, their frequent co-occurrence suggests the influence of common large-scale circulation drivers, which remain actively debated.  

Building on recent work linking North Atlantic freshwater anomalies to downstream atmospheric circulation responses, this ongoing study explores whether part of the recent European summer climate signal may be influenced by remote hemispheric-scale forcing associated with Greenland Ice Sheet mass loss, which has also coincidentally accelerated in recent decades due to anthropogenic influences. This linkage was not initially targeted but emerged unexpectedly from exploratory diagnostics motivated by broader investigations of North Atlantic variability. Preliminary results indicate that periods of enhanced summer Greenland melt tend to coincide with subsequent anomalous spring–summer circulation patterns over the Euro-Atlantic sector that favour persistent ridging and blocking-like conditions over the Euro-Mediterranean region. Such circulation states are consistent with environments conducive to prolonged heat stress, the development of marine heatwaves, and subsequent severe convective outbreaks.

Initial comparisons with global climate models from CMIP6 suggest that this potential pathway is poorly represented, possibly due to limitations in simulating localized freshwater forcing and its coupled atmosphere–ocean effects, which indicates that current projections of future climate may be underestimating these impacts. Our findings would point out Greenland melting as a previously unreported major driver of spring-summer large-scale circulation changes. Incorporating these processes could then be essential for forecasts systems and long-term projections, likely posing a significant gap in our ability to project future risk. Ongoing work focuses on testing the robustness of this emerging signal, clarifying its relevance relative to other known drivers of European summer extremes and exploring its hemispheric-scale reach.

How to cite: González-Alemán, J. J., Oltmanns, M., González-Herrero, S., Vitard, F., Donat, M., Doblas-Reyes, F., Barriopedro, D., Riboldi, J., Calvo-Sancho, C., Jiménez-Esteve, B., Cos, P., and Wehner, M.: Emerging evidence of Greenland Ice Sheet melt influence on recent Euro-Mediterranean record-breaking heat and convective storms, EGU General Assembly 2026, Vienna, Austria, 3–8 May 2026, EGU26-14086, https://doi.org/10.5194/egusphere-egu26-14086, 2026.

EGU26-14429 | ECS | Orals | NP1.3

From Mapping to Action: ADAPT-TOOLS and What We Learn from the Mediterranean CCA Toolscape 

Athanasios Tsilimigkras, Christian Pagé, Milica Tošić, Irida Lazić, Elisa Savelli, and Aristeidis Koutroulis and the FutureMed WG2

Climate change adaptation (CCA) is supported by a rapidly expanding ecosystem of decision-support systems, risk and vulnerability assessments, data portals, guidance frameworks, and early-warning services. Yet selecting an appropriate tool for a specific decision context remains difficult because tool information is often fragmented, inconsistently described, and not searchable using the metadata that practitioners actually need (e.g., sector, scale, user group, methods, outputs, usability, cost, and geographic scope). Within the FutureMed COST Action, WG2 has compiled a structured inventory of Mediterranean-relevant CCA tools and developed a shared criteria systematization to describe who tools are intended to serve, what they support, and how they are applied in practice. Insights emerging from this collaborative effort highlight that availability is not the only challenge: tool–context alignment is frequently unclear, tools often operate in isolation with limited guidance for selection, and the way tools define their spatial applicability may follow administrative rather than physical boundaries. Multilingual support and pathways for incorporating local data and knowledge are uneven. These patterns motivate the need for an operational resource that makes tools legible, comparable, and easier to navigate for real-world use.

We present ADAPT-TOOLS, a live database and web platform that translates a fragmented inventory into actionable discovery through structured metadata and faceted exploration. Tools are organized using a harmonized taxonomy spanning several aspects: intended user groups (policy, local government, private sector, NGOs, academia), sector focus, tool type, political and physical target scales, temporal horizon and resolution, methodological approach, data utilization, output types, accessibility/usability, validation and reliability signals, cost and support characteristics, and geographic applicability. Users can combine filters (OR within filters, AND across filters) to rapidly narrow from broad categories to tools matching their constraints, while dedicated tool pages support transparent comparison and adoption.

Technically, the platform is implemented as a containerized stack with a relational backend and a web interface. A reproducible ingestion pipeline converts structured inventories into relational tables, enabling systematic updates and maintainable curation workflows. To support sustained evolution and community engagement, ADAPT-TOOLS includes a moderated “Suggest a Tool” workflow that collects structured submissions for review before integration, enabling continuous expansion while preserving data quality. The platform is publicly deployed at adapt-tools.org. By linking community mapping to an operational platform, ADAPT-TOOLS supports evidence-informed and more context-aware adaptation planning across the Mediterranean and beyond.

Acknowledgments

This study is based on work from COST Action CA22162 “FutureMed: A Transdisciplinary Network to Bridge Climate Science and Impacts on Society” (FutureMed), supported by COST (European Cooperation in Science and Technology).

How to cite: Tsilimigkras, A., Pagé, C., Tošić, M., Lazić, I., Savelli, E., and Koutroulis, A. and the FutureMed WG2: From Mapping to Action: ADAPT-TOOLS and What We Learn from the Mediterranean CCA Toolscape, EGU General Assembly 2026, Vienna, Austria, 3–8 May 2026, EGU26-14429, https://doi.org/10.5194/egusphere-egu26-14429, 2026.

EGU26-14636 | Orals | NP1.3

EO4Multihazards: Earth Observation for high-impact multi-hazard science 

Egor Prikaziuk, Jacopo Furlanetto, Bastian van den Bout, Giuliano Boscarin, Margarita Huesca, Edoardo Albergo, Marinella Masina, Davide Mauro Ferrario, Margherita Maraschini, Silvia Torresan, Cees van Westen, Irene Manzella, and Carlos Domenech

Earth Observation for high-impact multi-hazard science (EO4Multihazards) was a European Space Agency (ESA) project that developed methodologies for risk (hazard, vulnerability, exposure) and impact assessment with the help of Earth Observation (EO) data. We assessed cascading and compound events and developed impact chains for four case studies in Italy (upper and lower Adige river basin), the United Kingdom and Dominica, a Caribbean Small Island Developing State. This abstract presents the fifth, so-called “transferability”, case study, where developed methodologies were applied in an area with limited ground validation data, Senegal. Droughts, heatwaves, floods and fires were analysed for the regions specified by stakeholders. The risk for the population and the impact on agricultural yields were assessed in the riskchanges.org platform. The vulnerability components were shown to be the most challenging and ground-data demanding. Visit our website to explore other outputs, such as a whole Europe event database and case study geostories https://eo4multihazards.gmv.com/.

We acknowledge support from the EO4Multihazards project (Earth Observation for high-impact multi-hazards science), contract number 4000141754/23/I-DT, funded by the European Space Agency and launched as part of the joint ESA-European Commission Earth System Science Initiative.

How to cite: Prikaziuk, E., Furlanetto, J., van den Bout, B., Boscarin, G., Huesca, M., Albergo, E., Masina, M., Mauro Ferrario, D., Maraschini, M., Torresan, S., van Westen, C., Manzella, I., and Domenech, C.: EO4Multihazards: Earth Observation for high-impact multi-hazard science, EGU General Assembly 2026, Vienna, Austria, 3–8 May 2026, EGU26-14636, https://doi.org/10.5194/egusphere-egu26-14636, 2026.

EGU26-14907 | Posters on site | NP1.3

Exploring Sudden Stratospheric Warming Dynamics: A Data-Driven Analysis Using a Low-Dimensional Stochastic Model 

Carmen Alvarez-Castro, Cristina Peña-Ortiz, David Gallego, and Davide Faranda

Sudden Stratospheric Warmings (SSWs) are extreme atmospheric events characterized by a rapid weakening or breakdown of the polar vortex, often followed by profound impacts on surface weather. These include abrupt temperature anomalies, shifts in large-scale circulation patterns, modulation of jet streams, and an increased likelihood of cold-air outbreaks and altered storm tracks at mid-latitudes. As a result, SSWs play a pivotal role in shaping the occurrence and intensity of extreme weather events across the Northern Hemisphere. Although low-dimensional models have proven instrumental in elucidating the fundamental wave–mean flow interactions underlying SSWs, their ability to faithfully reproduce the full complexity, variability, and predictability of real atmospheric dynamics remains limited.

In this study, developed within the framework of the VORTEX project, we introduce a novel data-driven methodology to systematically assess the realism and predictive skill of low-dimensional models in simulating SSW dynamics. Our approach is based on two complementary metrics, dimension and persistence, which quantify, respectively, the effective dynamical complexity and the temporal coherence of the system. Together, these metrics provide a robust framework to evaluate how well simplified models capture the essential features of observed stratospheric variability.

Using this methodology, we investigate the sensitivity of SSW dynamics to large-scale tropospheric forcing and stochastic variability, both of which are known to be key contributors to vortex destabilization. To this end, we propose a stochastic low-order model that couples the Holton–Mass equations, representing wave–mean flow interactions, with a Langevin formulation that accounts for the bistable nature of the polar vortex.

Our results demonstrate that both the frequency and dynamical characteristics of SSWs exhibit a pronounced sensitivity to changes in tropospheric wave forcing and noise intensity. We identify critical thresholds beyond which the probability of vortex breakdown increases sharply, offering a mechanistic interpretation of the observed intermittency and variability of SSW events. These findings provide new insight into stratosphere–troposphere coupling and highlight the potential of data-driven diagnostics to bridge the gap between conceptual models and the complexity of the real atmosphere.

How to cite: Alvarez-Castro, C., Peña-Ortiz, C., Gallego, D., and Faranda, D.: Exploring Sudden Stratospheric Warming Dynamics: A Data-Driven Analysis Using a Low-Dimensional Stochastic Model, EGU General Assembly 2026, Vienna, Austria, 3–8 May 2026, EGU26-14907, https://doi.org/10.5194/egusphere-egu26-14907, 2026.

The Eastern Mediterranean is a well-established climate change hotspot, where intensifying hydrological extremes increasingly translate into high-impact weather conditions with cascading societal consequences. While long-term changes in mean atmospheric moisture are relatively well documented, much less is known about the evolution of extreme moisture states that act as precursors to severe precipitation, flooding, and compound hydroclimatic hazards.

In this study, we investigate the extreme behaviour of precipitable water vapour (PWV) using homogenised, high-frequency GNSS-derived observations from a dense network located in the Eastern Mediterranean transition zone. To ensure climate-quality consistency, the dataset was processed following internationally recognised standards, including IGS Repro3 strategies, covering the period 2000–2019. Moving beyond conventional trend-based analyses, we employ a non-stationary Extreme Value Theory (EVT) framework, combining Generalised Extreme Value (GEV) and Peak-Over-Threshold (POT) approaches to characterise the tails of the PWV distribution. This enables an assessment of changes in the magnitude, frequency, and persistence of rare moisture extremes under ongoing warming, independent of mean climatological shifts.

Return levels corresponding to different recurrence intervals are estimated to provide observational constraints on extreme atmospheric moisture scaling and its consistency with theoretical Clausius–Clapeyron expectations. The statistical results are further interpreted in the context of large-scale atmospheric drivers using ERA5 reanalysis data, shifting the focus from describing atmospheric states to identifying weather conditions conducive to high-impact hydroclimatic outcomes.

This contribution directly aligns with the objectives of the FutureMed COST Action (CA22162) by bridging physical climate processes, advanced statistical characterisation of extremes, and impact-relevant indicators of risk. By focusing on extreme moisture states rather than mean conditions, the study supports a shift from describing what the atmosphere is to assessing what weather conditions are likely to do in terms of hydroclimatic impacts, thereby improving the understanding and predictability of high-impact weather in the Eastern Mediterranean region.

How to cite: Zengin Kazancı, S.: Unveiling the Tails of Atmospheric Moisture Extremes in the Eastern Mediterranean: Non-Stationary GNSS-Based Evidence for High-Impact Hydroclimatic Conditions, EGU General Assembly 2026, Vienna, Austria, 3–8 May 2026, EGU26-16534, https://doi.org/10.5194/egusphere-egu26-16534, 2026.

EGU26-17367 | Posters on site | NP1.3

Mediterranean Extreme Events in a changing climate on multiple spatiotemporal scales 

Tommaso Alberti, Johannes de Leeuw, Giovanni Scardino, Federico Siciliano, and Natalia Zazulie

Climate change is changing the statistics and the physics of extreme weather events, leading to increasing impacts from heavy precipitation, floods, droughts, heatwaves, and so on. Thus, attribution of extremes requires a process-based understanding of how large-scale forcing interacts with regional dynamics and thermodynamics. Despite significant progress at global scales, attribution of extremes at regional and local scales remains challenging, particularly in regions where small-scale processes dominate the generation of high-impact events.

The Mediterranean basin is a hotspot for climate change, characterized by land–sea interactions, complex orography, and convective activity. Extreme events in this region are often controlled by small-scale (1–10 km) processes, including atmospheric instability and convective organization. These processes are poorly represented in coarse-resolution climate models, limiting our ability to attribute observed impacts and to assess future risks.

The Mediterranean Extreme Events and Tipping elements in a changing climate on multiple spatiotemporal scales (MEET) project addresses this challenge through a process-oriented, high-resolution framework focused on Mediterranean extremes and their impacts. MEET will identify and classify historical and recent extreme events based on their impacts on key meteorological variables, such as precipitation intensity, near-surface temperature extremes, and damaging winds, and on associated societal and environmental consequences. Physics-informed decomposition techniques combined with advanced statistical methods will be applied to identify analog events across multiple spatiotemporal scales, enabling the detection of changes in event frequency, intensity, and spatial structure. A central component of MEET is the use of convection-permitting climate simulations to explicitly resolve the small-scale dynamics and thermodynamics underlying extreme events in both past and future climates. By linking high-resolution physical processes to observed impacts, MEET aims to advance the attribution of Mediterranean extreme events and to provide a physically consistent basis for improved regional risk assessment under ongoing climate change.


Acknowledgements

This research has been carried out with funding from the Italian Ministry of University and Research under the FIS-2 Call.

How to cite: Alberti, T., de Leeuw, J., Scardino, G., Siciliano, F., and Zazulie, N.: Mediterranean Extreme Events in a changing climate on multiple spatiotemporal scales, EGU General Assembly 2026, Vienna, Austria, 3–8 May 2026, EGU26-17367, https://doi.org/10.5194/egusphere-egu26-17367, 2026.

EGU26-17874 | ECS | Posters on site | NP1.3

Satellite-Based Analysis of Urban Heat Island Dynamics under Extreme Heatwave Conditions and Mitigation Strategies in Thessaloniki 

Marco Falda, Giannis Adamos, Tamara Radenovic, and Chrysi Laspidou

Heatwaves are among the most impactful and rapidly intensifying climate extremes in the Mediterranean region, where rising mean temperatures and the increasing frequency of extreme events interact with urban environments, exacerbating thermal stress. In densely populated cities, the Urban Heat Island (UHI) effect acts as a local amplification mechanism, transforming large-scale atmospheric heatwaves into compound extreme events with significant societal and environmental consequences. This study analyzes the spatial distribution and main controlling factors of extreme surface temperatures during three intense summer heatwaves in Thessaloniki, Greece, with the aim of linking observed geophysical extremes to urban configuration and assessing the potential of mitigation measures. For this aim, we employ LANDSAT 8–9 satellite imagery processed in QGIS to derive high spatial resolution Land Surface Temperature (LST) fields, together with key land-cover indicators such as the Normalized Difference Vegetation Index (NDVI) and the Normalized Difference Built-up Index (NDBI). These remote-sensing products are integrated with urban morphology and land-use data derived from OpenStreetMap (OSM), enabling a detailed characterization of how vegetation cover, building density, and surface materials modulate the urban thermal response under conditions of extreme atmospheric forcing. The results reveal pronounced spatial heterogeneity in LST across the metropolitan area, with persistent hotspots associated with compact historic districts, industrial zones, and highly impervious surfaces. In contrast, urban parks, coastal areas, and neighborhoods with a higher fraction of vegetation exhibit significantly lower surface temperatures, highlighting the role of land–atmosphere interactions and surface energy balance feedbacks in shaping urban-scale thermal extremes. The inverse relationship between NDVI and LST, together with the positive relationship between NDBI and LST, indicates the strong sensitivity of urban surface temperatures to land-cover composition during heatwave conditions. By framing the UHI as an intrinsic component of compound heat extremes, this work bridges observational geophysical analysis with the assessment of urban impacts. We further explore the potential of targeted mitigation strategies, such as the large-scale implementation of green roofs and high-albedo pavements, demonstrating their ability to reduce extreme surface temperatures and to moderate thermal exposure. The findings emphasize the importance of integrating physically grounded, data-driven mitigation measures into standardized urban planning frameworks in order to enhance resilience to future thermal extremes. More broadly, the study contributes to the understanding of how local-scale processes interact with large-scale climate extremes, offering transferable insights for Mediterranean and European cities increasingly exposed to heatwave risk under climate change.

How to cite: Falda, M., Adamos, G., Radenovic, T., and Laspidou, C.: Satellite-Based Analysis of Urban Heat Island Dynamics under Extreme Heatwave Conditions and Mitigation Strategies in Thessaloniki, EGU General Assembly 2026, Vienna, Austria, 3–8 May 2026, EGU26-17874, https://doi.org/10.5194/egusphere-egu26-17874, 2026.

Extreme precipitation over Europe is often linked to large-scale atmospheric circulation anomalies, yet it remains unclear which dynamical features recur systematically across many independent events, and how their influence evolves with time and altitude. In particular, the extent to which coherent, large-scale dynamical structures act as precursors to extreme rainfall has not been quantified so far beyond traditional composite-based approaches.

Here, we introduce a lagged coupled climate-network framework to investigate the interdependency between extreme precipitation events and atmospheric circulation from a functional climate network perspective. Extreme precipitation events are identified from ERA5 precipitation data by applying a local percentile threshold to daily precipitation sums and represented as binary event series, while two-dimensional fields of additional variables in different atmospheric layers—including geopotential height, relative vorticity, and temperature at multiple pressure levels—are treated as continuous variables. Using point-biserial correlation as statistical association measure between these different types of time series, we construct lagged event–field coupled networks that explicitly distinguish positive and negative statistical associations. Network connectivity is quantified through the cross-degree, which measures how many grid points of surface extreme events are significantly linked to a given atmospheric grid point (and vice versa), thereby emphasizing the recurrence and spatial relevance of circulation features rather than their correlation strength alone.

Our analysis reveals a coherent temporal evolution and vertical structure of circulation coupling to hydrometeorological extremes at the surface. At negative lags, cross-degree patterns are dominated by mid- to upper-tropospheric geopotential height and vorticity anomalies, indicating the recurrent presence of large-scale dynamical features prior to extreme precipitation events. With increasing lag, the coupling progressively shifts toward lower tropospheric levels, suggesting a transition from large-scale circulation influences before the events to near-surface circulation imprints afterward. Spatially, regions of enhanced cross-degree exhibit a systematic west-to-east displacement with changing lag, extending from the western North Atlantic and Greenland sector toward continental Europe. This spatial progression is consistent with downstream evolution along the North Atlantic–European circulation corridor. A pronounced and recurrent signal over the British Isles emerges across multiple variables, highlighting this region as a dynamically relevant area in the large-scale circulation context of European precipitation extremes.

By explicitly quantifying where, when, and at which vertical levels circulation anomalies of the same type recur across many extreme events, our coupled network approach provides a complementary perspective to conventional correlation and composite analyses. Our results demonstrate the potential of coupled functional climate networks to identify robust, recurring circulation patterns associated with extreme precipitation, offering new insights into precursor dynamics, vertical coupling, and large-scale organization of midlatitude extremes without assuming a specific underlying mechanism.

How to cite: Bishnoi, G. and V. Donner, R.: Lagged Coupled Climate Networks for Identifying Recurrent Circulation Patterns Behind Extreme Rainfall in Europe, EGU General Assembly 2026, Vienna, Austria, 3–8 May 2026, EGU26-18041, https://doi.org/10.5194/egusphere-egu26-18041, 2026.

EGU26-18062 | ECS | Orals | NP1.3

Attribution of Austral Summer Extreme Temperature Events in Antarctica Using a Circulation Analogue Method  

Yuiko Ichikawa, Neven S. Fuckar, Thomas Bracegirdle, and Mireia Ginesta

The global climate system is undergoing rapid changes unprecedented in human history, with increasingly extreme weather events observed across the world. Antarctica is particularly exposed to these changes, with some of the highest warming rates on the planet recorded over West Antarctica in recent decades and emerging warming trends now evident in East Antarctica. Despite this, relatively few studies have focused on the attribution of extreme temperature events in Antarctica, where near-surface temperatures are strongly conditioned by large-scale atmospheric circulation over the continent and the Southern Ocean. 

Here, we apply a circulation-analogue technique for extreme-event attribution to assess how dynamically similar warm extremes have changed over time. We focus on three recent austral-summer warm extremes: the February 2020 heatwave over the Antarctic Peninsula, the March 2022 warm anomaly across East Antarctica, and the March 2015 warm spell on the Peninsula. These short-duration events produced exceptional near-surface temperature anomalies. 

Circulation analogues associated with these events are analysed across two climatic periods: a “past’’ baseline (1948–1986) and a “present’’ period (1987–2025), using two independently developed atmospheric reanalysis products, ERA5 and JRA-3Q. Changes in the occurrence frequency of analogue weather types and in their associated near-surface temperature anomalies provide insight into the influence of anthropogenic climate change on these extremes. The dual-dataset approach offers a more robust basis for attribution, particularly for the pre-satellite era when reanalysis uncertainties and dataset discrepancies are considerable. 

How to cite: Ichikawa, Y., S. Fuckar, N., Bracegirdle, T., and Ginesta, M.: Attribution of Austral Summer Extreme Temperature Events in Antarctica Using a Circulation Analogue Method , EGU General Assembly 2026, Vienna, Austria, 3–8 May 2026, EGU26-18062, https://doi.org/10.5194/egusphere-egu26-18062, 2026.

EGU26-18393 | ECS | Orals | NP1.3

Interdisciplinary Approaches in the Study of Climate Extremes 

Chenyu Dong and Gianmarco Mengaldo

Climate extremes, including heatwaves, extreme precipitation, tropical cyclones, and related hazards, pose significant risks to society and ecosystems.
Recent advancements in observational techniques, numerical modeling, theoretical frameworks, and AI methods have greatly improved our understanding and prediction of these extremes. However, despite significant progress, key challenges remain unresolved, particularly in achieving a thorough understanding of the physical drivers of extreme events, improving the transparency of AI-based prediction methods, and evaluating the vulnerability and resilience of cities to their impacts. To address these challenges, we present various approaches drawn from different fields, including dynamical systems theory, explainable AI, and NLP-based methods. Given the flexible and generalizable nature of these methods, we believe they may pave the way toward more robust solutions for addressing the challenges posed by climate extremes.

How to cite: Dong, C. and Mengaldo, G.: Interdisciplinary Approaches in the Study of Climate Extremes, EGU General Assembly 2026, Vienna, Austria, 3–8 May 2026, EGU26-18393, https://doi.org/10.5194/egusphere-egu26-18393, 2026.

EGU26-18626 | ECS | Orals | NP1.3

Understanding Shifts in Extreme Precipitation and Synoptic Forces in a Regionalized Framework: The Iberian Peninsula 

Pau Benetó, Jose Antonio Valiente, and Samira Khodayar

Extreme precipitation exhibits pronounced local variations associated with dynamic and thermodynamic changes on synoptic and regional scales under global warming inducing important impacts over main socioeconomic sectors such as agriculture, tourism, health and energy. Local-to-regional variations in extreme precipitation are especially marked on climate change hotspots, such as the Iberian Peninsula, reflecting the complex transition between Atlantic and Mediterranean climate influences and further hindering an accurate assessment of climate change impacts and the development of effective adaptation strategies. Therefore, it is crucial to identify variations in atmospheric dynamics as main drivers of changes in the characteristics of extreme precipitation events (EPEs) on subregional scales to better determine the areas subject to specific changes and improve our understanding of extreme weather events to enhance predictability.

In this context, this study conducted a comprehensive analysis using a precipitation regionalization approach with a high resolution (~5 km) gridded dataset for the period 1951-2021 obtaining 8 precipitation-coherent regions in the Iberian Peninsula. EPEs were characterized over each region, and their evolving atmospheric drivers were identified using an objective synoptic classification method with ERA5 data. Besides, an analysis of variations in EPEs intensity and frequency, as well as changes in the associated synoptic conditions and atmospheric water vapor distributions were assessed.

Our results revealed a generalized mean intensification of EPEs for the study period. Nevertheless, we highlight two different pathways: (i) Atlantic regions presenting a moderate (5-10 %) intensification of extreme precipitation linked to an increase of surface flows and counterposing the observed weakening or northward displacement of upper-level perturbations, and (ii) Mediterranean regions showing a marked (15-25 %) extremization of EPEs associated with vorticity intensification at 500 hPa.  Besides, these variations occur alongside an atmospheric moistening (up to 6 mm in the Ebro region) of the moistest air masses denoting the highly complex interplay between thermodynamic and dynamic factors. We emphasize the importance of regionalized approaches to enhance our comprehension on extreme precipitation over regions with complex topography and, more importantly, the corresponding implications on early warning systems and efficient climate adaptation strategies in climate change hotspots.

How to cite: Benetó, P., Valiente, J. A., and Khodayar, S.: Understanding Shifts in Extreme Precipitation and Synoptic Forces in a Regionalized Framework: The Iberian Peninsula, EGU General Assembly 2026, Vienna, Austria, 3–8 May 2026, EGU26-18626, https://doi.org/10.5194/egusphere-egu26-18626, 2026.

The analysis of the impacts due to climate extremes, such as extreme precipitation, heatwaves, and tropical cyclones, needs to rely on multimodal data, ranging from complex geophysical fields to textual and visual data.

While recent advances in vision-language models (VLMs) have stimulated interest in multimodal-driven climate analysis, their application to natural hazard analysis is still relatively limited.

In this work, we focus on tropical cyclones, and construct a new framework, namely Visual Object Representation for Tropical Cyclone Extremes and eXtent (VORTEX), a physics-aware, visual abstraction designed to support interpretable vision-language reasoning over hazard fields for tropical cyclones.

VORTEX transforms spatiotemporal reanalysis data associated to tropical cyclones into structured, visually identifiable representations by explicitly encoding cyclone-specific physical properties, including pressure-anchored storm geometry, wind and precipitation intensity extrema, spatial asymmetry, and field-scale footprint.

Building on VORTEX, we construct ClimateFieldQA, a structured evaluation framework for diagnosing VLM reasoning over tropical cyclone hazard fields. ClimateFieldQA comprises 4,978 high-resolution reanalysis heatmaps and 243,922 instruction samples spanning spatial localization, intensity estimation, structural pattern recognition, field-scale extent reasoning, and physical impact analysis.

ClimateFieldQA is designed to expose strengths, limitations, and failure modes of VLM-based reasoning under physically constrained geoscientific settings.

Using ClimateFieldQA, we show that physics-aware visual abstractions systematically improve structure-sensitive reasoning and reduce common interpretation errors observed when VLMs operate on raw hazard fields, highlighting the methodological importance of representation design for climate impact analysis and natural hazard assessment in Earth system science.

How to cite: Xiao, L. and Mengaldo, G.: ClimateFieldQA: Evaluating Vision–Language Models on Tropical Cyclone Hazard Fields with Physics-Aware Visual Abstractions, EGU General Assembly 2026, Vienna, Austria, 3–8 May 2026, EGU26-18916, https://doi.org/10.5194/egusphere-egu26-18916, 2026.

EGU26-18955 | Orals | NP1.3

Sea surface temperature anomalies associated with Mediterranean tropical-like cyclones  

Francisco Pastor, Daniel Pardo-García, and Samira Khodayar

Mediterranean tropical-like cyclones, known as medicanes, are mesoscale systems that develop over the Mediterranean Sea and exhibit structural similarities to tropical cyclones, despite forming under markedly different environmental conditions. Air–sea interactions play a key role in their development and intensification, yet the behaviour of sea surface temperature (SST) before, during, and after medicane events remains insufficiently quantified. 

In this study, we analyse SST anomalies and daily SST variability associated with medicane events using the Copernicus high-resolution Level-4 reprocessed Sea Surface Temperature dataset. Daily SST fields and their day-to-day variations are examined along medicane tracks and surrounding areas and compared against climatological references to assess the SST response to medicane passage. The analysis accounts for differences related to seasonality, medicane development stage, and formation region within the Mediterranean basin. 

Results reveal marked SST anomalies associated with medicane events, with a consistent reduction in daily SST and a pronounced negative anomaly in daily SST variation along the medicane track. The magnitude and spatial extent of these anomalies vary depending on the season and phase of the medicane life cycle, indicating distinct air–sea interaction regimes across different Mediterranean sub-basins. The observed SST cooling is consistent with enhanced surface fluxes and upper-ocean mixing induced by medicane-related wind forcing. 

These findings highlight the role of SST anomalies and short-term SST variability in the evolution and intensification of medicanes and provide new insights into the coupled ocean–atmosphere processes governing these systems. Improved understanding of SST–medicane interactions is essential for better representation of medicane-related hazards and for assessing their potential impacts in a warming Mediterranean, where socio-economic exposure and vulnerability are increasing. 


How to cite: Pastor, F., Pardo-García, D., and Khodayar, S.: Sea surface temperature anomalies associated with Mediterranean tropical-like cyclones , EGU General Assembly 2026, Vienna, Austria, 3–8 May 2026, EGU26-18955, https://doi.org/10.5194/egusphere-egu26-18955, 2026.

EGU26-18974 | ECS | Posters on site | NP1.3

Future Warm–Dry and Warm–Wet Compound Climate Extremes in Mediterranean Metropolitan Areas under Climate Change 

Iliana Polychroni, Maria Hatzaki, Platon Patlakas, and Panagiotis Nastos

The Mediterranean region is widely recognized as a climate change hotspot, as anthropogenic warming is projected to substantially increase air temperatures by the end of the 21st century, together with longer periods of reduced rainfall. The region is likely to experience warmer and drier conditions with significant consequences for human societies, while the intensification of heatwaves is likely to trigger cascading hazards. At the same time, heavy precipitation events during hot periods may become more common, increasing the likelihood of urban flash floods, especially in densely populated metropolitan areas.

Instead of focusing only on single climate extremes,, compound extremes offer a complementary perspective for assessing future climate risks. We analyze two compound climate indices: Warm/Dry (WD) and Warm/Wet (WW) days. The analysis focuses on representative Mediterranean metropolitan areas characterized by high population density and climatic relevance.

The indices are derived from daily mean temperature and precipitation data obtained from an ensemble of CMIP6 climate model simulations. Annual and seasonal frequencies of compound extremes are evaluated for the mid-century (2041–2060) and late-century (2081–2100) periods, relative to a 1995–2014 reference period, under the SSP2-4.5 and SSP5-8.5 scenarios. Results indicate a robust increase in the frequency of Warm/Dry days across all future scenarios, suggesting that Mediterranean climates will increasingly experience concurrent warming and drying. In contrast, Warm/Wet days are scenario-dependent. These findings highlight a dual climate risk for Mediterranean cities, where more frequent prolonged hot and dry conditions coexist with a higher chance of compound heat and heavy precipitation events under high-emission scenarios.

How to cite: Polychroni, I., Hatzaki, M., Patlakas, P., and Nastos, P.: Future Warm–Dry and Warm–Wet Compound Climate Extremes in Mediterranean Metropolitan Areas under Climate Change, EGU General Assembly 2026, Vienna, Austria, 3–8 May 2026, EGU26-18974, https://doi.org/10.5194/egusphere-egu26-18974, 2026.

EGU26-19076 | ECS | Orals | NP1.3

The exceptional October 2024 flooding in Valencia (Spain): meteorological drivers of an extreme precipitation event 

David Espín, Pau Benetó, and Samira Khodayar

The late-October 2024 flooding in Valencia (eastern Spain) was triggered by an exceptional extreme precipitation event (EPE) associated with a quasi-stationary cut-off low over the western Mediterranean. In this study, we assess the meteorological exceptionality of the October 2024 event by combining a basin-scale, percentile-based catalogue of rainfall extremes with a multi-level diagnosis of thermodynamic and dynamical atmospheric drivers.

Extreme precipitation is analysed using the dense SAIH rain-gauge network covering the Júcar River Basin at hourly and 5-minute temporal resolution for the period 1990–2024. Hourly p99 precipitation thresholds are computed for each station using an autumn (September–November) rolling-hour climatology. Local exceedances above p99 are aggregated into a basin-wide “overall magnitude” index (M), which integrates intensity and spatial footprint. EPEs are identified as continuous periods with M > 0 and ranked according to duration, peak intensities at 1-, 3-, 6-, 12- and 24-hour accumulation periods, cumulative local magnitude, mean excess above threshold, and the number of affected stations. The October 2024 event is contextualised against (i) the seven most extreme autumn EPEs (>p99) over the last three decades and (ii) a broader set of extreme but non-record events (p90–p99).

To link hydrometeorological extremeness with atmospheric drivers, we analyse the 1–96 h period preceding peak precipitation using 3-hourly CERRA reanalysis fields from 1000 to 100 hPa. Diagnostics include integrated water vapour (IWV), vertical humidity and water vapour profiles over peak-impact areas, absolute vorticity, and wind shear across multiple pressure-layer pairs.

Results show that the October 2024 event ranks as the most extreme autumn EPE in the record, with an unprecedented cumulative local magnitude of 4392 mm, nearly twice that of the second-ranked event (2275 mm in October 2000). The event is characterised by exceptionally high IWV values (~40 mm) over the affected region and a rapid IWV increase of approximately 0.4 mm h⁻¹ (around 25 mm in less than 72 h) prior to peak intensity. In addition, very strong vertical wind shear exceeding 25 m s⁻¹ between the surface and 400 hPa favoured sustained convective organisation and quasi-stationarity. Together, these results point to a compound thermodynamic–dynamic anomaly rather than a purely moisture- or dynamics-driven extreme. The proposed framework provides a physically consistent, basin-relevant benchmark for diagnosing exceptional Mediterranean flood-producing precipitation events using high-resolution observations and reanalysis-based process indicators.

How to cite: Espín, D., Benetó, P., and Khodayar, S.: The exceptional October 2024 flooding in Valencia (Spain): meteorological drivers of an extreme precipitation event, EGU General Assembly 2026, Vienna, Austria, 3–8 May 2026, EGU26-19076, https://doi.org/10.5194/egusphere-egu26-19076, 2026.

EGU26-19395 | Orals | NP1.3

Heatwave response in quasi-equilibrium versus transient climate scenarios 

Susanna Corti, Claudia Simolo, Lea Rozenberg, Virna Meccia, and Federico Fabiano

Future changes in mean climate and extremes have been extensively assessed using model simulations of the 21st century under varying levels of anthropogenic greenhouse gas (GHG) forcing. Here, we examine the long-term climate legacy of an idealized abrupt stabilization of present-day and near-future GHG concentrations, with a focus on summer heatwaves across the Northern Hemisphere. Our analysis is based on multicentennial simulations performed with the EC-Earth3 model, in which external forcing is held fixed in time. After several centuries of internal adjustment, the climate system approaches a quasi-equilibrium state characterized by a stable level of global warming that depends strongly on the timing of forcing stabilization. Crucially, far-future quasi-equilibrium conditions can differ substantially from those that would arise if the same warming levels were reached by the end of the century, reflecting the distinct roles of fast and slow components of the Earth system. A key feature of the quasi-equilibrium response is a partial recovery of the Atlantic Meridional Overturning Circulation relative to transient simulations, which influences regional climate and leads to a pronounced amplification of heatwave frequency and intensity over the North Atlantic sector. Conversely, many land areas ultimately experience less severe heatwaves than in transient scenarios, owing to the slower warming rates in the stabilization experiments. Results show that the long-term response of extremes is shaped by the magnitude of global warming, as well as the pathway and timescale over which that warming is realized, highlighting the need for equilibrium-focused experiments in future climate risk assessments.

How to cite: Corti, S., Simolo, C., Rozenberg, L., Meccia, V., and Fabiano, F.: Heatwave response in quasi-equilibrium versus transient climate scenarios, EGU General Assembly 2026, Vienna, Austria, 3–8 May 2026, EGU26-19395, https://doi.org/10.5194/egusphere-egu26-19395, 2026.

EGU26-19415 | ECS | Orals | NP1.3

Rareness Amplified INtensification of Extreme rainfall (RAINE): how the worst events get worse the fastest 

Iris de Vries, Frederic Castruccio, Dan Fu, and Paul O'Gorman

Floods associated with extreme precipitation cause tremendous damage and losses every year, and are projected to become more frequent and more severe with climate change in most land regions. Events of much higher intensities than previously observed can cause unforeseeably large impacts due to their unprecedentedness. The changing occurrence probability of such “surprise events” is closely related to changes in the statistical distribution of extreme precipitation: while a constant scaling with temperature (such as Clausius-Clapeyron) causes a constant fractional increase for all return levels, strong increases in the variability of extreme precipitation (distribution width) lead to relatively stronger intensification of the most extreme events. The latter change is indicative of increasing high-impact surprise event probabilities. Regions where rare extremes exhibit a faster relative intensification than moderate extremes (skewed intensification) are subject to RAINE: Rareness-Amplified INtensification of Extremes. In other words, RAINE means the worst events get worse the fastest.

We present a statistical framework based on extreme value theory to diagnose RAINE in annual maximum daily precipitation (Rx1d) from observations and simulations. We focus in particular on results from the 10-member high-resolution (0.25° atmosphere/land and 0.1° ocean) CESM1 ensemble (MESACLIP, historical+RCP8.5), which has been shown to simulate Rx1d quite accurately. We identify a strong RAINE-effect for most of the global land over the 21st century under RCP8.5. We categorise the data based on region and Rx1d-causing weather phenomenon, and find that a physical scaling based on vertical updraft and relative humidity explains the RAINE pattern. Different seasons, regions and phenomena feature different relative contributions of vertical updraft and relative humidity to RAINE, which can be linked to different environmental conditions and climate change effects governing Rx1d changes. In observations, robust distributional changes are difficult to detect due to high variability of extreme precipitation. Our combined statistical and physical characterisation of RAINE can help explain and constrain uncertainties in future risks posed by unprecedented extreme precipitation.

How to cite: de Vries, I., Castruccio, F., Fu, D., and O'Gorman, P.: Rareness Amplified INtensification of Extreme rainfall (RAINE): how the worst events get worse the fastest, EGU General Assembly 2026, Vienna, Austria, 3–8 May 2026, EGU26-19415, https://doi.org/10.5194/egusphere-egu26-19415, 2026.

EGU26-19524 | Orals | NP1.3

Are we closing in on true ‘end-to-end’ attribution? 

Rupert Stuart-Smith

Two decades of climate change attribution research have shed light on the impacts of climate change occurring worldwide. The first wave of attribution research quantified climate change impacts on the intensity and probability of extreme weather events and slow-onset changes in glaciers and sea levels. Over the past decade, impact attribution studies have extended these methods to assess the attributable impacts of extreme events on agriculture, health, economic losses and biodiversity. Concurrently, source attribution research quantified individual emitters’ contributions to climate change impacts.

The emissions of individual actors cause climate change impacts. The approximately linear relationship between cumulative CO2 emissions and global temperature rise, combined with the fact that many climate change impacts become progressively worse with rising global temperatures, provides a conceptual basis for this claim. Steady progress towards being able to quantify individual emitters’ contributions to specific losses has brought us closer to true ‘end-to-end’ attribution. However, while studies have quantified emitters’ contributions to aggregate impacts such as regional economic losses, are there circumstances in which we might be able to attribute specific, individual losses to individual actors? This presentation will discuss the scientific possibility of achieving this objective and the legal consequences that may follow.

How to cite: Stuart-Smith, R.: Are we closing in on true ‘end-to-end’ attribution?, EGU General Assembly 2026, Vienna, Austria, 3–8 May 2026, EGU26-19524, https://doi.org/10.5194/egusphere-egu26-19524, 2026.

EGU26-20508 | ECS | Orals | NP1.3

 Predicting extreme events by identifying precursors on the chaotic attractor manifold 

Kevin R. Schuurman, Richard P. Dwight, and Nguyen Anh Khoa Doan

Predicting spatiotemporal extreme events using dynamical systems theory poses several major challenges. One of these is the phase space dimensionality of spatiotemporal systems. Extreme events are rare, while the number of variables that could potentially drive them is large. Often, a subset of the phase space is sampled, or features are engineered based on previous research on drivers, to predict spatiotemporal extreme events. On the other hand, the background attractors are often assumed to be of much smaller dimensionality than the phase space. Therefore, we propose a novel framework that approximates the background attractor of chaotic systems using an autoencoder. On this lower-dimensional attractor representation, precursor densities are created from historical analogues. Based on these precursor densities, predictions of extreme events are made. This framework proves to be efficient in predicting extreme events in a simplified turbulent flow and a climate model. Without engineering-specific predictor feature sets, this lower-dimensional representation of the attractor allows for more efficient and accurate analog prediction of extreme events in large chaotic systems.

How to cite: Schuurman, K. R., Dwight, R. P., and Doan, N. A. K.:  Predicting extreme events by identifying precursors on the chaotic attractor manifold, EGU General Assembly 2026, Vienna, Austria, 3–8 May 2026, EGU26-20508, https://doi.org/10.5194/egusphere-egu26-20508, 2026.

Climate change has impacts on natural systems and populations, which can be analysed in attribution studies and attempted to be predicted in forward-looking analyses. Climate extremes in particular can be very impactful, be it in in terms of extreme individual climate hazards, extreme combinations of climate hazards, or less extreme climatic conditions combined with particular settings of exposure and vulnerability resulting in severe impacts. As the field of impact attribution is burgeoning, different perspectives on these complexities become apparent in different study designs, with implications for the research questions they address and the potential role they might play beyond science.

Here, we will give an overview over different climate change impact approaches, including how they each do (or don’t) consider climate extremes. Besides different attribution framings and impact modelling approaches, we will present a discussion of the climate data types typically used in impact attribution, and their implication for capturing impacts of extreme weather and climate. We will especially talk about extreme event attribution framings, and how ‘event’ can be defined in different ways from climate and impact standpoints, respectively. The differences will be illustrated using references to existing literature as well as works in progress, particularly from the field of agriculture-related impacts on food security and nutrition-related health.

How to cite: Undorf, S.: Defining events and extremes in climate change impact attribution, EGU General Assembly 2026, Vienna, Austria, 3–8 May 2026, EGU26-21133, https://doi.org/10.5194/egusphere-egu26-21133, 2026.

EGU26-21503 | ECS | Orals | NP1.3

Source attribution: From national emissions to global loss in working hours due to climate-change increased heat 

Paula Romanovska, Mark New, Christoph Gornott, Audrey Brouillet, and Sabine Undorf

Human-induced climate change has increased heat stress, leading to significant losses in work productivity and subsequent economic repercussions. Not only are the climate change-related losses in work productivity due to heat unequally distributed around the globe, but the contributions of individual nations to these losses through greenhouse gas emissions are also disproportionate. Here, we present a source attribution approach that links historical national emissions to global lost working hours resulting from increased heat exposure.

Following the framework of Callahan & Mankin (2022 & 2025), we conduct the source attribution study in three steps: First, we calculate the contribution of past national emissions to the change in global mean surface temperature (GMST) using the reduced-complexity climate model Finite amplitude Impulse Response (FaIR). Second, we apply a pattern scaling technique, trained on outputs from general circulation models, to translate GMST changes into grid-level heat stress metrics, here the wet bulb globe temperature (WBGT). Third, we use the simulated GMST changes due to national emissions, the pattern scaling coefficients, and two literature-based exposure-response functions to estimate the potential loss of working hours attributable to national emissions at grid level. By integrating demographic data on population and employment, we derive estimates of total potential losses in working hours linked to specific nations' emissions. Additionally, we thoroughly assess uncertainties arising from global climate models, the FaIR model, and the exposure-response functions.

Our preliminary results highlight the different responsibilities of nations for the costs associated with increased occupational heat stress. The study thereby contributes to the growing body of literature linking individual emitters with experienced harms, providing critical insight into climate liability and national accountability for climate policy.


Callahan, C. W., & Mankin, J. S. (2022). National attribution of historical climate damages. Climatic Change, 172(3–4), 1–19. https://doi.org/10.1007/S10584-022-03387-Y/FIGURES/4

Callahan, C. W., & Mankin, J. S. (2025). Carbon majors and the scientific case for climate liability. Nature 2025 640:8060, 640(8060), 893–901. https://doi.org/10.1038/s41586-025-08751-3

How to cite: Romanovska, P., New, M., Gornott, C., Brouillet, A., and Undorf, S.: Source attribution: From national emissions to global loss in working hours due to climate-change increased heat, EGU General Assembly 2026, Vienna, Austria, 3–8 May 2026, EGU26-21503, https://doi.org/10.5194/egusphere-egu26-21503, 2026.

EGU26-21564 | ECS | Orals | NP1.3

Worst-Case European Heat and Drought Storylines generated using Ensemble Boosting 

Laura Suarez-Gutierrez, Urs Beyerle, Magdalena Mittermeier, Robert Vautard, and Erich M. Fischer

Heat and drought extremes pose escalating socio-economic and ecological risks, yet the most severe combinations of these high-impact extremes possible today remain poorly understood. Using thousands of plausible ensemble-boosting current climate storylines, we reveal the risk for more intense drought compounding with far more extreme heat and fire weather than ever experienced over Europe in the recent past. The most extreme boosted heatwaves surpass historical extremes in both intensity and particularly in persistence, and also exceed levels considered extreme in a 3°C warmer world by large margins. Some of the most extreme heatwaves arise under severe soil moisture depletion, while others develop under strong surface temperature gradients in the North Atlantic and extreme heat in the nearby Mediterranean and Atlantic basins, underscoring the diversity of pathways to worst-case conditions. Furthermore, our work reveals an additional risk: worst-case heatwaves occur predominantly after another extreme heatwave. This highlights the potential for aggravated impacts due to decreased recovery times and intensified heat stress on humans, ecosystems and infrastructure made more vulnerable by the first event. Given the scale, intensity, and unprecedented successive and compounding nature of these worst-case storylines, we underscore the urgent need for well-informed adaptation strategies that sufficiently reflect these risks. 

How to cite: Suarez-Gutierrez, L., Beyerle, U., Mittermeier, M., Vautard, R., and Fischer, E. M.: Worst-Case European Heat and Drought Storylines generated using Ensemble Boosting, EGU General Assembly 2026, Vienna, Austria, 3–8 May 2026, EGU26-21564, https://doi.org/10.5194/egusphere-egu26-21564, 2026.

EGU26-22751 | Orals | NP1.3

Scaling of Rainfall Intensity and Frequency with Rising Temperatures 

Jun Yin, Bei Gao, and Amilcare Porporato

Global warming is projected to intensify the hydrological cycle, amplifying risks to ecosystems and society. While extreme rainfall appears to exhibit stronger sensitivity to global warming compared to mean rainfall rates, a unifying physical mechanism​ capable of explaining this systematic divergence has remained elusive. Here, we integrate theory and data from a global network of nearly 50,000 rain-gauge stations to unravel the rainfall intensity and frequency response to rising temperatures. We show that the distributions of wet-day rainfall depth exhibit self-similar shapes across diverse geographical regions and time periods. Combined with the temperature response of rainfall frequency, this consistently links mean and extreme precipitation at both local and global scales. We find that the most probable change in rainfall intensity follows Clausius-Clapeyron (CC) scaling with variations shaped by a fundamental hydrological constraint. This behavior reflects a dynamic intensification of updrafts in space and time, which produces localized heavy precipitation events enhancing atmospheric moisture depletion and hydrologic losses through runoff and percolation. The resulting reduction in evaporative fluxes slows the replenishment of atmospheric moisture, giving rise to the observed trade-off between rainfall frequency and intensity. These robust scaling laws for rainfall shifts with temperature are essential for climate projection and adaptation planning.

How to cite: Yin, J., Gao, B., and Porporato, A.: Scaling of Rainfall Intensity and Frequency with Rising Temperatures, EGU General Assembly 2026, Vienna, Austria, 3–8 May 2026, EGU26-22751, https://doi.org/10.5194/egusphere-egu26-22751, 2026.

EGU26-23150 | Posters on site | NP1.3

Attribution study of the 2023-2024 Drought on the South of Africa. 

Sarah Sparrow, Iago Perez-Fernandez, and Simon Tett
In 2023-2024 austral summer (Dec-Mar), an intense drought caused severe economical and human losses in the South of Africa, resulting in a loss of 1/3 of the total crop harvest. Here we report on a fairly standard attribution study for the drought of 2023/24 summer to assess if human influence increased the occurrence and intensity of droughts in the region. We used HadGEM-GA6 data to assess the likelihood of observing these events in scenarios with/without anthropogenic activity using 3 month Standardized Precipitation Evapotranspiration index (SPEI3) to quantify drought intensity. The sensitivity to region choice was explored using definitions of South of 20S, South of 15S, the region analyzed in the last World Weather Attribution report as well as individual countries. Simulations (with and without human activity) for the climatological period (1970-2010) as well as for 2023-2024 specifically were compared. The influence of the El Niño Southern Oscillation (ENSO) on SPEI3 and associated attribution statements was considered by compositing simulations by year into El Niño and La Niña phases. When using HadGEM simulations for the historical period (1970-2010), results showed that simulations with human activity showed lower SPEI values compared to natural simulations, hence implying that South African is drier compared to a natural scenario. Nonetheless the probability of drought is sensitive to the region chosen for the analysis, for example, for the south of 20S the probability of drought is mostly between 1.1 - 2 times more likely in simulations with human activity, whereas in the WWA area this probability rises to 5.9 - 16.9. By contrast, in HadGEM simulations with the prescribed conditions of 2023-2024, the probability of drought is much higher but also shows more uncertainty.
In addition, human activity strengthened the intensity and frequency of the dry periods set up by El Niño conditions in most countries located in the South of Africa, but the occurrence of droughts changes with the region. For example, in Zimbabwe, drought occurrence is 1.8 more likely in simulations with human influence during El Niño events, whereas in South Africa and Zambia the drought occurrence is 1.6 and 3.2 times more likely respectively whereas in Malawi it remains unchanged. In addition, when considering the prescribed conditions of 2023-2024 the probability of drought rises drastically for all countries.

How to cite: Sparrow, S., Perez-Fernandez, I., and Tett, S.: Attribution study of the 2023-2024 Drought on the South of Africa., EGU General Assembly 2026, Vienna, Austria, 3–8 May 2026, EGU26-23150, https://doi.org/10.5194/egusphere-egu26-23150, 2026.

EGU26-673 | PICO | NP2.1

Critical Transitions at Campi Flegrei Resurgent Caldera: A Novel Approach to Systemic and Retrospective Signals Analysis 

Andrea Vitale, Andrea Barone, Enrica Marotta, Dino Franco Vitale, Susi Pepe, Rosario Peluso, Raffaele Castaldo, Rosario Avino, Francesco Mercogliano, Antonio Pepe, Filippo Accomando, Gala Avvisati, Pasquale Belviso, Eliana Bellucci Sessa, Carandente Antonio, Perrini Maddalena, Fabio Sansivero, and Pietro Tizzani

This study investigates how complex volcanic systems undergo major behavioral shifts, focusing on the Solfatara–Pisciarelli (SP) hydrothermal-magmatic area within the Campi Flegrei caldera (Southern Italy). The SP system is one of the most active zones of the caldera, characterized by persistent degassing, seismic swarms, strong hydrothermal circulation and long-term ground uplift. These processes arise from nonlinear interactions between magmatic inputs, fluid migration, and shallow hydrothermal pressurization, making the identification of critical transitions particularly challenging.

To address this, we developed an integrated analytical framework combining Multivariable Fractional Polynomial Analysis (MFPA) and Global Critical Point Analysis (GCPA). MFPA models nonlinear and time-lagged associations among key monitoring parameters—vertical ground deformation, seismicity, CO₂ flux, geochemical equilibrium variables, and thermal signals—while GCPA identifies the temporal moments when multiple variables collectively show systemic reorganization.

Analysis of multi-year (2018–2024) geophysical and geochemical datasets revealed that deformation is strongly associated with seismicity, equilibrium pressures of hydrothermal gases, heat flow, and CO₂ flux. Incorporating time-lagged deformation improved model accuracy and reduced unexplained variance, highlighting delayed cause–effect couplings between deformation and fluid-dynamic processes. The model confirms seismicity as the most stable explanatory parameter, consistent with sustained fracturing and fluid pressurization in the shallow system.

GCPA identified two major critical transitions:

  • CP1 – 30 November 2020, dominated by thermal–chemical reorganization and increased gas-system pressurization.
  • CP2 – 1 April 2023, reflecting a more open and multiparametric regime where deformation, temperature, seismicity, heat flux, and CO₂ emissions contribute comparably to system evolution.

These transitions align with independent geodetic evidence suggesting migration and reconfiguration of the shallow overpressure source beneath the SP area. The integrated MFPA–GCPA approach thus reconstructs how systemic changes propagate across geophysical and geochemical variables, providing retrospective insight into the onset and progression of unrest phases.

This framework offers several advantages over classical or non-parametric approaches: interpretability of functional relationships, explicit treatment of nonlinearities and time lags, and the ability to detect collective regime shifts rather than isolated anomalies. Although not predictive, the method provides a quantitative basis for identifying critical phases in volcanic systems and may be adapted to other densely monitored calderas. With higher-resolution and real-time data streams, it could support early indications of evolving unrest and enrich next-generation volcano-monitoring strategies.

How to cite: Vitale, A., Barone, A., Marotta, E., Vitale, D. F., Pepe, S., Peluso, R., Castaldo, R., Avino, R., Mercogliano, F., Pepe, A., Accomando, F., Avvisati, G., Belviso, P., Bellucci Sessa, E., Antonio, C., Maddalena, P., Sansivero, F., and Tizzani, P.: Critical Transitions at Campi Flegrei Resurgent Caldera: A Novel Approach to Systemic and Retrospective Signals Analysis, EGU General Assembly 2026, Vienna, Austria, 3–8 May 2026, EGU26-673, https://doi.org/10.5194/egusphere-egu26-673, 2026.

EGU26-2991 | ECS | PICO | NP2.1

How different are parameterisation packages really and how can we interpret stochastic perturbations? 

Edward Groot, Hannah Christensen, Xia Sun, Kathryn Newman, Wahiba Lfarh, Romain Roehrig, Lisa Bengtsson, and Julia Simonson

In the Model Uncertainty-Model Intercomparison Project (MUMIP) we compare parameterisation packages from different modelling centres using their single-column modelling (SCM) frameworks. We will showcase the dataset from an Indian Ocean experiment at a 0.2 degrees grid covering one month, with about 10 million simulations of each model. These parametrised models are compared against a convection-permitting benchmark from DYAMOND under common dynamical constraints. We will show differences and similarities in precipitation patterns and physics tendencies among four models and show how these differences can be generalised. Following earlier works, we find that at coarse grids that do not resolve convection, parameterisation packages tend to produce overconfident tendencies compared to the convection-permitting benchmark. Furthermore, we test several hypotheses on the MUMIP dataset to explain the differences. We use the data to explore the foundations of stochastic physical parametrisations. Would stochastic physics effectively overcome the overconfidence for good reasons? May the stochastic perturbations actually have a physically meaningful quantitative interpretation? Can stochastic physics be used to partially overcome truncation and grid spacing limitations?

How to cite: Groot, E., Christensen, H., Sun, X., Newman, K., Lfarh, W., Roehrig, R., Bengtsson, L., and Simonson, J.: How different are parameterisation packages really and how can we interpret stochastic perturbations?, EGU General Assembly 2026, Vienna, Austria, 3–8 May 2026, EGU26-2991, https://doi.org/10.5194/egusphere-egu26-2991, 2026.

EGU26-3111 | ECS | PICO | NP2.1

New insights into decadal climate variability in the North Atlantic revealed by data-driven dynamical models 

Andrew Nicoll, Hannah Christensen, Chris Huntingford, and Doug Smith

The Atlantic Multidecadal Variability (AMV) and the North Atlantic Oscillation (NAO) are the dominant modes of oceanic and atmospheric variability in the North Atlantic, respectively, and are key sources of predictability from seasonal to decadal timescales. However, the physical processes and feedback mechanisms linking the AMV and NAO, and the role of diabatic processes in these feedbacks, remain debated. We present a data-driven dynamical modelling framework which captures coupled decadal variability in AMV, NAO, and North Atlantic precipitation. Applying equation discovery methods to observational data, we identify deterministic low-order dynamical models consisting of three coupled ordinary differential equations. These models reproduce observed North Atlantic decadal variability and show robust out-of-sample predictive skill on multi-annual to decadal lead times. The resulting model dynamics include a distinct quasi-periodic 20-year oscillation consistent with a damped oceanic mode of variability. Notably, precipitation-related terms feature prominently in the low-order models, suggesting an important role for latent heat release and freshwater fluxes in mediating ocean–atmosphere interactions. We propose new feedback mechanisms between North Atlantic sea surface temperature and the NAO, with precipitation acting as a dynamical bridge. By linearising the low-order models and computing finite-time Lyapunov exponents, we find that North Atlantic precipitation is more predictable in a positive AMV phase. We then analyse several decadal prediction ensemble experiments based on initialised hindcasts and find comparable state-dependent predictability of precipitation. Overall, these results illustrate how data-driven equation discovery can provide mechanistic hypotheses and new insight beyond conventional analyses of observations and climate model simulations.

How to cite: Nicoll, A., Christensen, H., Huntingford, C., and Smith, D.: New insights into decadal climate variability in the North Atlantic revealed by data-driven dynamical models, EGU General Assembly 2026, Vienna, Austria, 3–8 May 2026, EGU26-3111, https://doi.org/10.5194/egusphere-egu26-3111, 2026.

Ensemble forecast generate multiple predictions from a set of initial conditions, thereby producing the probability density distribution (PDF) of a variable and quantifying forecast uncertainty beyond a single deterministic forecast. However, studies focusing on the predictable lead time of ensemble forecast remain limited. In this study, orthogonal conditional nonlinear optimal perturbations (O-CNOPs) are applied to the Lorenz-96 model to investigate the predictable lead time of ensemble forecast, which is then compared with that obtained from a single deterministic forecast. Results show that the maximum predictable lead time revealed by the ensemble distribution generated with O-CNOPs is 18.5 days, 2.5 days longer than that revealed by the ensemble distribution generated with singular vectors (SVs), which is 16 days. Consistent results are obtained from the ensemble mean analysis, which reveals a longer predictable lead time for O-CNOPs (21.75 days) than for SVs (18 days). In addition, compared with ensemble forecasts generated with SVs, the ensemble forecasts generated with O-CNOPs exhibit higher deterministic forecast skill, probabilistic forecast skill, reliability, and resolution over the same forecast periods. These results collectively highlight the advantage of O-CNOPs in constructing physically consistent nonlinear ensemble distributions and provide a methodological framework for more accurate quantification of ensemble forecast lead time.

How to cite: Zhu, Y. and Duan, W.: Exploring the Predictable Lead Time of Ensemble Forecast Based on Conditional Nonlinear Optimal Perturbation, EGU General Assembly 2026, Vienna, Austria, 3–8 May 2026, EGU26-3320, https://doi.org/10.5194/egusphere-egu26-3320, 2026.

The skill of forecasting Tropical Cyclone (TC) Rapid Intensification (RI) is limited by inherent uncertainties in initial conditions and model physics. To address this, the C-NFSVs method integrates initial and model perturbations, accounting for their collective effects through the nonlinear forcing singular vector (NFSV; also known as CNOP-F) approach. In this study, we applied C-NFSVs to the Weather Research and Forecasting (WRF) model for TC ensemble forecasting across three resolutions, comparing it against O-NFSVs, which has proven superior to traditional stochastic physics schemes. Results reveal a significant resolution dependence, with the superiority of C-NFSVs maximizing at the convection-permitting scale. At this resolution, the C-NFSVs ensemble outperforms O-NFSVs for both deterministic and probabilistic metrics, and demonstrates significantly improved reliability. Notably, for the challenging prediction of RI events, C-NFSVs exhibits high discriminative skill, achieving an Area Under the ROC Curve (ROCA) of 0.80. A detailed examination of TC Hato attributes this success to capturing the evolution of the critical physical error chain, which progresses from thermodynamic priming and convective organization to the structural and dynamic response. Mechanistically, the results highlight the complementary roles of the two components: the initial component of C-NFSVs dominates the uncertainty of the dynamic structure in the early forecast stage, while the model component plays a primary role in maintaining the thermodynamic uncertainty of moisture and temperature fields throughout the forecast. This study validates the effectiveness and physical rationality of C-NFSVs in high-resolution ensembles, offering a promising strategy for enhancing the predictability of extreme weather events at convection-permitting scales.


How to cite: You, C. and Duan, W.: Enhancing Tropical Cyclone Ensemble Forecast Skill via the Collective Effect of Initial and Model Perturbations: The C-NFSVs Method, EGU General Assembly 2026, Vienna, Austria, 3–8 May 2026, EGU26-3326, https://doi.org/10.5194/egusphere-egu26-3326, 2026.

EGU26-4547 | ECS | PICO | NP2.1

Reconstruction of Global Forest Aboveground Carbon Dynamics with Probabilistic Deep Learning 

Zhen Qian, Sebastian Bathiany, Teng Liu, Lana Blaschke, Hoong Chen Teo, and Niklas Boers

Understanding the long-term dynamics of forest aboveground carbon (AGC) is critical for constraining the terrestrial carbon cycle. However, accurately reconstructing historical AGC spatiotemporal patterns remains a challenge due to the complex, nonlinear relationships between vegetation proxies and biomass, as well as the stochastic uncertainties inherent in multi-source satellite observations.

In this study, we propose a probabilistic deep learning framework to reconstruct harmonized, high-resolution (0.25°) global forest AGC stocks and fluxes from 1988 to 2021. By integrating multi-source optical (e.g., NDVI, LAI) and microwave (e.g., VOD) remote sensing data, our approach utilizes Probabilistic Convolutional Neural Networks (CNNs) to simultaneously estimate AGC dynamics and quantify associated predictive uncertainties (decomposing aleatoric and epistemic components). This data-driven model effectively captures the nonlinear spatial dependencies and texture features that traditional empirical methods often miss.

Our reconstruction reveals significant decadal-scale regime shifts in the global forest carbon sink. While global forests remained a net sink of 6.2 PgC over the past three decades, we identify a pronounced transition in moist tropical and boreal forests, which have shifted from carbon sinks to sources since the early 2000s. Furthermore, our analysis uncovers an intensifying negative coupling between interannual tropical AGC fluxes and atmospheric CO2 growth rates (r=-0.63 in the last decade), suggesting a growing complexity in the climate-carbon feedback. Spatially explicit partitioning in the Amazon further indicates a dynamical shift where AGC losses are increasingly driven by indirect climate stressors in previously "untouched" forests, rather than direct deforestation alone.

In conclusion, this study elucidates the state-dependent responses of global forests to changing disturbance regimes. The probabilistic framework provides a necessary basis for distinguishing genuine regime shifts, such as the structural decline of the tropical carbon sink, from observation noise, thereby enhancing our predictive understanding of terrestrial carbon resilience in a warming climate.

How to cite: Qian, Z., Bathiany, S., Liu, T., Blaschke, L., Teo, H. C., and Boers, N.: Reconstruction of Global Forest Aboveground Carbon Dynamics with Probabilistic Deep Learning, EGU General Assembly 2026, Vienna, Austria, 3–8 May 2026, EGU26-4547, https://doi.org/10.5194/egusphere-egu26-4547, 2026.

EGU26-5335 | PICO | NP2.1

Low-dimensional stochastic amplitude equations for a precessing rotating cylinder 

Uwe Harlander and Carsten Hartmann

The magnetic field of planets and stars is generated by the movement of conductive fluids inside these bodies. The precession and libration of these astrophysical bodies play a central role in the excitation of the internal turbulent fluid motion. In our laboratory, we have developed an experiment that allows the investigation of precession-driven inertial waves and their instability (Xu and Harlander, 2020). Wave triads play a very important role in this instability (Lagrange et al., 2011). As the Ekman number decreases, an increasing number of interacting triads arise, ultimately leading to turbulence. This process can be experimentally reproduced in the laboratory. In this experiment, precession is simulated using a slightly tilted cavity with a free fluid surface and is therefore simpler in design than a real precession experiment. 

The dynamics of fluids can be described by PDEs. However, often deeper insights can be gained from a corresponding low-dimensional dynamical system. An example is the large family of Lorenz-type models, which have led to a fundamental understanding of predictability in atmospheric dynamics (Majda et al., 1999). Also, for the problem of a precessing rotating cylinder, low-dimensional models exist. Such models are obtained from spectral discretizations of the Navier-Stokes equations and truncating the resulting hierarchy of coupled equations at low order. Truncation, however, eliminates the quadratic coupling between the resolved modes and the (unresolved) smaller scales, which can lead to unrealistic characteristics of turbulence. 

We suggest another closure to systematically derive low-order amplitude equations for rotating fluids, based on stochastic modeling of the unresolved small scales in accordance with the available experimental data. Specifically, we first remodel the small scales by an appropriate stochastic process that has a multivariate Gaussian law when conditioned on the resolved variables and, in a second step, apply a projection operator to the coupled system. In doing so, we derive closed, averaged equations for the resolved variables that retain the quadratic nonlinearities and so capture the small-scale contributions to the low-order wave dynamics. For a projection operator in the form of a conditional expectation (i.e., a projection on function space), we have recently studied necessary and sufficient conditions under which the projection operator formalism yields an approximation for nonreversible (e.g. driven) systems (Duong et al., 2025). Measuring the distance between the marginal distributions of the resolved variables for the full- and the low-order models, the accuracy of the low-order model can be measured (Hartmann et al., 2020).  

By comparing the low-order stochastic model results with data from the precession experiment, the hope is not only to capture the wave interactions correctly and develop a stochastic extension of the existing amplitude equations, but also to reduce the order of the existing model even further. 

M.H Duong, C. Hartmann, and M. Ottobre, arXiv preprint,  arXiv:2506.14939, 2025.

C. Hartmann, L. Neureither, and U. Sharma, SIAM J. Math. Anal. 52(3), 2689-2733, 2020.

R. Lagrange, P. Meunier, F. Nadal, C Eloy, J. Fluids Mech. 666, 104–145, 2011.

A.J. Majda, I. Tomofeyev, E. Vanden Eijnden, PNAS, 96(26), 14687-14691, 1999.

W. Xu, U. Harlander, Rev. Phys. Fluids., 5(9), 094801-21, 2020.


How to cite: Harlander, U. and Hartmann, C.: Low-dimensional stochastic amplitude equations for a precessing rotating cylinder, EGU General Assembly 2026, Vienna, Austria, 3–8 May 2026, EGU26-5335, https://doi.org/10.5194/egusphere-egu26-5335, 2026.

EGU26-8143 | PICO | NP2.1

Climate Oscillations and Linear Gaussian Nonequilibrium Steady-States 

Jeffrey Weiss, Roberta Benincasa, Dann Du, and Gregory Duane

Climate oscillations such as the El Niño–Southern Oscillation (ENSO) and the Madden–Julien Oscillation (MJO) dominate aspects of climate variability, yet they are often challenging to accurately capture in climate models. Due to their disparate underlying physical processes, any potential commonality between different climate oscillations is obscured. Common underlying dynamics is suggested by the success of relatively low-dimensional linear inverse modeling (LIM). LIMs represent climate oscillations as linear Gaussian nonequilibrium steady states (LG-NESS) defined by stochastic differential equations. Here we develop the theory of LG-NESS’s and compare with observations and models of climate oscillations.

ENSO and the MJO are often described by two-dimensional indices such as the leading SST EOFs for ENSO, or the Realtime Multivariate MJO index. The LIM algorithm parameterizes the dynamics in the index coordinate system as a two-dimensional LG-NESS specified by seven parameters. We decompose the parameter space into four parameters that define the coordinate system of the index, and three parameters that define its intrinsic dynamics. This allows us to transform all 2d LG-NESS’s to a common three-dimensional dynamical parameter space. Coordinate-invariant quantities depend only on the three dynamical parameters, while coordinate-dependent quantities can be transformed back to the original index coordinate system and depend on all seven parameters.

We parameterize ENSO and the MJO in this three-dimensional dynamical parameter space and find that, despite their distinct physical mechanisms and timescales, they lie within a narrow region of parameter space, indicating a similarity in the underlying phase-space dynamics. We compare observed and modeled dynamics with those of their parameterized LG-NESS, evaluating predictability, thermodynamic properties, and event statistics. We find this minimal three-parameter model reproduces many features of climate oscillations, revealing a deep dynamical similarity  among climate oscillations.


How to cite: Weiss, J., Benincasa, R., Du, D., and Duane, G.: Climate Oscillations and Linear Gaussian Nonequilibrium Steady-States, EGU General Assembly 2026, Vienna, Austria, 3–8 May 2026, EGU26-8143, https://doi.org/10.5194/egusphere-egu26-8143, 2026.

EGU26-8761 | ECS | PICO | NP2.1

Whiplash weather in ENSO Transition Years Identified by A Novel Cascading Extremes Index 

Qimin Deng, Louise Slater, Christian Franzke, Yixuan Guo, and Zuntao Fu

Cascading extreme weather events, characterized by sequential occurrences of distinct extremes such as heatwaves, floods or droughts, pose increasing risks in a warming climate. However, existing approaches for identifying such events focus either on temporal persistence or spatial coherence alone, and are thus unable to identify the most severe events with both characteristics. Here, we propose a new approach based in dynamical systems theory that treats variables as coupled systems, with a view to enable their mechanistic understanding. We illustrate the application of the method to temperature and relative humidity data during the period 1979-2020, identifying cascading heat-drought extremes over the Mississippi, southeastern China and France. While these events are controlled by different large-scale climate modes and blocking patterns, nine of the events occurred during rapid transitions (<12 months) from El Niño to La Niña. In China, these transitional events were consistently preceded by heavy rainfall approximately two weeks earlier. Key drivers include the prolonged presence of the western north Pacific subtropical high and land-atmosphere feedbacks. Our findings uncover the speed and severity of cascading wet-dry transitions within as little as two weeks during El Niño transition years, and the need for a greater understanding of their driving mechanisms.

How to cite: Deng, Q., Slater, L., Franzke, C., Guo, Y., and Fu, Z.: Whiplash weather in ENSO Transition Years Identified by A Novel Cascading Extremes Index, EGU General Assembly 2026, Vienna, Austria, 3–8 May 2026, EGU26-8761, https://doi.org/10.5194/egusphere-egu26-8761, 2026.

EGU26-10698 | PICO | NP2.1

Evaluation of CMIP6 Models in Simulating Network-Based Early Warning Signals of El Niño 

Naiming Yuan, Jiangxue Han, and Josef Ludescher

Network-based early warning signals of El Niño have been recognized for more than a decade, however, it remains unclear whether current climate models can reproduce these signals. Here, we evaluate simulations from both the pre-industrial control and historical experiments of CMIP6 models. While none of the models exhibited skill in either experiment, performance was generally better in the historical runs, suggesting that the inclusion of external forcing may improve model simulations of the early warning signals. Further analysis indicates that some models such as CESM2, FGOALS-g3, and MRI-ESM2-0 may provide potentially useful early warning information for El Niño events, but their warning signals tended to emerge later than those in reanalysis data. Using a new network-based evaluation metric to assess air-sea interactions in the tropical Pacific, we find that model performance in simulating early warning signals is generally linked to their ability to simulate these interactions. This highlights the importance of improving representations of air-sea coupling in current models. For future investigations into the physical mechanisms underlying the network-based early warning signals, CESM2, FGOALS-g3, and MRI-ESM2-0 are recommended due to their relatively better performance compared to the other models considered in this work, although the causes of their delayed signal emergence require further exploration.

How to cite: Yuan, N., Han, J., and Ludescher, J.: Evaluation of CMIP6 Models in Simulating Network-Based Early Warning Signals of El Niño, EGU General Assembly 2026, Vienna, Austria, 3–8 May 2026, EGU26-10698, https://doi.org/10.5194/egusphere-egu26-10698, 2026.

The growing availability of multiple operational ocean data services provides unprecedented opportunities for applications such as environmental incident response, search and rescue operations, and maritime management. At the same time, despite their widespread use, most ocean datasets offer limited information regarding their performance and consistency with real-world observations.

In this presentation, I address this gap by introducing a methodology to assess uncertainty in ocean transport predictions derived from different ocean data products. Building on recent work that links transport uncertainty—understood here as deviations from ground truth—to invariant dynamical structures in the ocean [1–3], the proposed approach, discussed in [4], exploits these links to guide statistical averaging strategies. We examine how well model-predicted material transport aligns with observational evidence across different dynamical scales, including scales above the mesoscale, the mesoscale, and the submesoscale. This perspective provides a systematic pathway for quantifying the performance of different data sources and assessing their overall quality and reliability.

References:

[1] G. García-Sánchez, A. M. Mancho, A. G. Ramos, J. Coca, B. Pérez-Gómez, E. Alvarez-Fanjul, M. G. Sotillo, M. García-León, V. J. García-Garrido, S. Wiggins. Very High Resolution Tools for the Monitoring and Assessment of Environmental Hazards in Coastal Areas. Frontiers in Marine 7, 605804 (2021).

[2] G. García-Sánchez, A. M. Mancho, S. Wiggins. A bridge between invariant dynamical structures and uncertainty quantification. Commun. Nonlinear Sci. Numer. Simul. 104, 106016 (2022).

[3] G. García-Sánchez, A. M. Mancho, M. Agaoglou, S. Wiggins. New links between invariant dynamical structures and uncertainty quantification. Physica D 453 133826 (2023).

[4] G. García-Sánchez, M. Agaoglou, E.M.C Smith, A. M. Mancho. A Lagrangian uncertainty quantification approach to validate ocean model datasets. Physica D 475 134690 (2025).

Acknowledgments:

Support from PIE project Ref. 202250E001 funded by CSIC, from grant PID2021-123348OB-I00 funded by MCIN/ AEI /10.13039/501100011033/ and by FEDER A way for making Europe.

How to cite: Mancho, A. M.: Understanding Uncertainty in Ocean Transport Inferred from Multiple Data Sources, EGU General Assembly 2026, Vienna, Austria, 3–8 May 2026, EGU26-13663, https://doi.org/10.5194/egusphere-egu26-13663, 2026.

While understanding systemic risk in complex systems has gained growing attention, less effort is often dedicated to understanding the system itself.  Particularly, the typology of complex systems and collapse mechanisms that are consistent across domains remains understudied. Hence, critical questions arise, such as what do we need to know about the system’s characteristics to predict systemwide collapse, identify leverage points, or design resilience interventions? What system properties allow knowledge gained from one system to be generalized to other taxonomically similar systems? What signals can be deduced from a few systems’ global parameters to determine whether a system is in a stable, unstable, or critical region of its adjacent becoming?"


Answering these questions requires determining the typology of complex systems, which enables the study of system-level behaviors independently of the specific details of individual agents. This leads to universality, facilitating the study of collapse mechanisms transferable to other typologically similar systems, thereby providing insight into systemic risk.


This presentation introduces a novel typology of complex systems based on the concept of “adjacent becoming,” drawing on works of Stuart Kaufmann, C.S. Holling, and Marten Scheffer, among others which have established the language of attractors, regime shifts, evolution, and panarchical resilience in complex systems. The System’s Adjacent Becoming (SAB) is what the system is positioned to become while appearing to be in a stable condition, i.e., potential for a critical transition in deep stability. Such a proximal transformation potential can be characterized by four interrelated components consisting of a) the system's location in phase space and proximity to the most accessible alternative attractors, b) the topography of the current boundary basin, c) the system's current momentum and energy state, and d) the prospective trajectory and regime that a transition to a given alternative attractor would induce. These four components collectively determine the SAB potential, and thus the likelihood and qualitative characteristics of an imminent regime shift.


To assess SAB, what system has, what system does, and what system could become are the critical questions.  For such an assessment, a SAB-informed typology would be the first step. Therefore, the four SAB components lead to types based on nine interconnected system variables: (1) micro-macro dynamic type; (2) state of information processing and memory capacity; (3) degree of teleonomic coherence across levels and panarchical organization; (4) degree of agent heterogeneity; (5) type and intensity of emergence; (6) functional and computational efficiency rate; (7) initial condition and presence of path dependency; (8) manifestation of critical slowing down indicators and bifurcation proximity signals and (9) the existing geometric attractor landscape. 

This SAB-informed typology is phenomenologic-mechanistic in nature, which helps to learn about the structural and dynamical signatures of critical transitions and the quality of the new becoming, offering a unified language for understanding how complex adaptive systems of any kind approach their adjacent becoming and what determines whether they persist, transform, or collapse. This framework remains theoretical with operationalization challenges; future work must advance toward measurable proxies for the nine categories to quantify SAB of real-world systems.

How to cite: Zamanifar, M. and Samaro, N.: Systemic risk in complex systems: understanding the system based on the system’s adjacent becoming, EGU General Assembly 2026, Vienna, Austria, 3–8 May 2026, EGU26-21170, https://doi.org/10.5194/egusphere-egu26-21170, 2026.

EGU26-372 | ECS | Orals | BG10.12

Hyperspectral satellite imagery for urban climate applications 

Matej Žgela, Alberto Vavassori, and Maria Antonia Brovelli

Urban climate research relies on multispectral (MS) satellite imagery because of its global coverage and relatively high spatial and temporal resolution. However, its coarse spectral detail limits the analysis of complex urban surfaces. New hyperspectral (HS) satellite missions provide much finer spectral information, supporting detailed analysis of urban microclimates. Here, we present an overview of current HS satellite products and examine the potential of PRISMA (PRecursore IperSpettrale della Missione Applicativa) and DESIS (German Aerospace Center (DLR) Earth Sensing Imaging Spectrometer) missions for two key applications in urban environments: material abundance estimation and local climate zone (LCZ) mapping. To estimate material abundances, we apply constrained spectral unmixing to HS imagery over Milan, Italy. Results are compared with near-simultaneous MS data and validated against the local geotopographic database. The derived abundances are also linked to high-resolution air temperature maps predicted using a machine learning-based regression approach. Secondly, LCZs are mapped using a combined RS and GIS-based method, integrating spectral and spatial information for improved classification of urban areas.

Our results show that HS imagery supports sub-pixel material estimation, opening the possibility for a transition from single land-cover labels to multi-material representations within each pixel. Thermal assessment further validated these estimates, with natural materials reducing heat and artificial surfaces increasing it. Finally, LCZ mapping resulted in higher accuracy with HS imagery compared to MS products.

HS imagery provides a promising path for applications in urban climate research and other urban studies. Thanks to its technical advantages over MS imagery, HS data enable the generation of data suitable for microclimate modelling, heat mitigation assessment or urban management. Although HS imagery is not yet as widely available as MS, upcoming missions are steadily expanding access for scientific use in urban monitoring.

How to cite: Žgela, M., Vavassori, A., and Brovelli, M. A.: Hyperspectral satellite imagery for urban climate applications, EGU General Assembly 2026, Vienna, Austria, 3–8 May 2026, EGU26-372, https://doi.org/10.5194/egusphere-egu26-372, 2026.

Understanding the impacts of urbanization and environmental transitions in rapidly developing regions such as Aligarh District, Uttar Pradesh, requires a comprehensive assessment of land use/land cover (LULC) and land surface temperature (LST). For this study, a semi-automated hybrid classification approach, integrating maximum likelihood classification with object-based image analysis, was applied to Landsat-8 OLI imagery from 30 May 2022 to map LULC. LST was derived from thermal band 10 using a four-step procedure that converted the satellite-recorded digital numbers (DNs) into accurate land surface temperature values. Accuracy assessment using 250 reference sites yielded an overall accuracy of 94.4% and a Kappa coefficient of 0.93, confirming high reliability. LST analysis revealed considerable spatial and thermal variability, with summer temperatures ranging from 26.48°C to 46.40°C (mean: 36.32°C). Pearson’s correlation results indicated consistent relationships between LST and key remote sensing indices. NDVI and SAVI showed moderately negative correlations with LST, demonstrating the cooling influence of vegetation, while NDBI exhibited a strong positive correlation, highlighting the urban heat island effect. NDWI showed a negative relationship with LST, and NDBaI displayed a weaker positive correlation, underscoring the moderating effect of water bodies on surface temperature. The Ordinary Least Squares (OLS) regression model explained 70.06% of LST variance, with an Akaike Information Criterion (AICc) value of 3792.15. Coefficient patterns indicated that NDBI contributed to LST intensification, whereas NDVI, NDWI, and SAVI significantly reduced surface temperatures. The Geographically Weighted Regression (GWR) model substantially improved explanatory power, achieving an R² of 0.9405 and reducing residual spatial autocorrelation, as reflected by the decline in Moran’s I from 0.30 (OLS) to 0.02 (GWR). Overall, the findings demonstrate that LULC dynamics drive surface temperature fluctuations in the Aligarh district, and GWR's ability to capture geographical variations makes it highly effective for environmental modelling.

Keywords: Land surface temperature (LST), Geographically weighted regression (GWR), Spatial regression, Ordinary least squares (OLS), Geospatial analysis.

How to cite: Khan, M. A. and said, S.: Geospatial and Regression-Based Modelling of Land Surface Temperature in Aligarh: A Comparative Study of OLS and GWR, EGU General Assembly 2026, Vienna, Austria, 3–8 May 2026, EGU26-699, https://doi.org/10.5194/egusphere-egu26-699, 2026.

With climate change on the rise, increasing the frequency and intensity of drought stress, we aim to define drought tolerance by assessing the plasticity of several physiological parameters in urban trees. Urban trees face unique sets of challenges compared to trees in the forest, leading them to be more exposed to extreme conditions, as they are restricted to tree pits surrounded by impervious structures (e.g., size, depth, morphology, surface cover and connectedness to other trees). Understanding the impacts of tree pit surface cover can help gain better insights for planting a more resilient urban forest.

To advance our understanding of urban European tree species, we investigate the plasticity of the turgor loss point (TLP), xylem potential when 50% conductivity is lost (P50), specific leaf area (SLA) and Huber Values (HV) for four widespread urban tree species, Acer platanoides (L., Sapindaceae), Ginkgo biloba (L.), Platanus x hispanica (Münichh.) and Tilia cordata (Mill., Malvaceae), growing in different tree pit surface cover conditions (e.g., concrete, exposed soil, grass or vegetation) in the city of Munich, Germany. We used different growing periods of the 2025 growing season for 70 individuals; TLP was measured in July and September, while P50, SLA and HV were measured in August.

Our results indicate that the TLP did not change between early and late season sampling for any of the species or tree pit surface cover types. Moreover, TLP varied between species, while tree pit surface cover influenced TLP only within species. P50, however, was strongly related to species identity and was also affected by tree pit surface cover within species. In particular, A.platanoides P50 was less negative in the concrete tree pit surface cover type, while the other tree pit surface covers have more negative P50’s, suggesting that A.platanoides growing in a concrete tree pit surface cover is less drought tolerant, than when A.platanoides is growing in a tree pit with exposed soil, grass or vegetation surface cover.

When assessing drought tolerance of urban trees, the TLP and P50 provides insights on how different tree species respond to different tree pit surface cover growing conditions. To strengthen urban forests’ resilience to drought stress, our work suggests that tree pit surface covers should be taken into consideration when designing urban forests for specific tree species.  

How to cite: McKinney, S. Q. and Peters, R. L.: Assessing the plasticity of drought tolerance in urban trees growing in different tree pit surface cover conditions in Munich, Germany, EGU General Assembly 2026, Vienna, Austria, 3–8 May 2026, EGU26-970, https://doi.org/10.5194/egusphere-egu26-970, 2026.

EGU26-1562 | ECS | Orals | BG10.12

Tree shade as a nature-based strategy for mitigating heat exposure but effectiveness varies 

Anisha Aryal, Konlavach Mengsuwan, and Masahiro Ryo

Tree shade is widely recognized as an effective nature-based cooling solution to mitigate thermal exposure under a warming climate. However, factors modulating the intensity of shade-related cooling remain poorly understood, particularly beyond urban settings where most prior studies have focused on individual tree traits and local land use. This study examines whether shading effect varies across different landscapes and identifies key temporal and spatial drivers of shade-induced cooling across three survey sites: urban, post-mining, and lakeside environments in Lusatia, Germany. More than 100 trees were assessed for their shading effects. Surface temperature of shaded and adjacent non-shaded surfaces were measured using a handheld thermal camera during heat events in August 2023 and 2024, when daily maximum temperatures exceeded 30°C. Land-use information was derived from field-collected RGB imagery. Additional variables including distance to water and forest, vegetation index and canopy height were extracted from remote-sensing datasets. Shading effects were quantified using paired statistical tests, and an XGBoost regression model combined with post-hoc interpretability analyses was applied to identify key predictors and their influence on cooling intensity. Across all survey sites, shaded surfaces were significantly cooler than non-shaded surfaces, with non-urban areas exhibiting larger cooling effect. The predictive model achieved moderate performance (R2 = 0.34). Temporal factors, particularly year and time of day, emerged as the most influential predictors, indicating substantial temporal variability in shade-induced cooling. Spatial configuration also played a critical role: shade-induced cooling increased with distance from forested areas and decreased with distance to water bodies. The relative importance of spatial variables varied by landscape type. Canopy height showed a negative relationship with cooling magnitude, suggesting that areas dominated by shorter trees may enhance shading effectiveness. Vegetation greenness and land-use categories had comparatively minor effects, while landscape type itself exerted no substantial influence. These findings demonstrate that shade-related cooling is governed not only by local tree or land-use characteristics but also by broader environmental context, including surrounding vegetation and landscape configuration. Incorporating multiscale geospatial predictors into microclimate assessments can therefore improve the design of climate-resilient landscapes and heat-mitigation strategies.

How to cite: Aryal, A., Mengsuwan, K., and Ryo, M.: Tree shade as a nature-based strategy for mitigating heat exposure but effectiveness varies, EGU General Assembly 2026, Vienna, Austria, 3–8 May 2026, EGU26-1562, https://doi.org/10.5194/egusphere-egu26-1562, 2026.

Vehicular traffic is a major contributor to anthropogenic heat flux (AHF) in urban areas, amplifying urban heat island effects. However, few Earth system models explicitly represent traffic conditions and their associated heat emissions. This study introduces a new urban traffic module into the Community Earth System Model (CESM), enabling interactive simulation of traffic-related heat in urban areas. The module adopts a bottom-up approach to estimate traffic heat flux (Qtraffic) based on time-varying traffic volume and vehicle type distributions, while dynamically responding to meteorological conditions such as snow, rain, and low temperatures. Model validation was performed using observational data from two urban sites: Capitole of Toulouse, France (FR-Capitole), and Manchester, UK (UK-Manchester). At the FR-Capitole site, an annual mean Qtraffic of 22.23 W/m2 in 2004 resulted in a simulated annual mean canopy air temperature increase of 0.4K, improving the simulated turbulent heat flux compared to observations. At the UK-Manchester site, the simulation with a yearly mean Qtraffic of 16.27 W/m2 showed a 0.25K air temperature increase in 2022. These traffic-induced canopy warming also influenced the indoor environment, contributing to increased air conditioning use in summer and reduced building space heating demand in winter. This new functionality offers potential applications such as simulating traffic-induced AHF and its impacts on the climate system under future climate changes and transport transition scenarios.

How to cite: Sun, Y., Oleson, K., and Zheng, Z.: Modeling urban traffic heat flux in the Community Earth System Model: Formulation and validation for two sites, EGU General Assembly 2026, Vienna, Austria, 3–8 May 2026, EGU26-2014, https://doi.org/10.5194/egusphere-egu26-2014, 2026.

Fine-resolution urban weather nowcasting is crucial for urban resilience, yet it is fundamentally limited by the sparse and irregular distribution of monitoring stations. To overcome this, we introduce an inductive, physics-informed spatio-temporal graph network that transforms discrete sensor data into a continuous, on-demand forecast field. Our framework uniquely synergizes multi-source data: point-scale station observations, grid-scale numerical weather predictions, and high-resolution urban morphological features. The model core is a novel encoder-decoder architecture designed for deep feature extraction. A hybrid temporal encoder captures complex weather dynamics, while a multi-graph attention mechanism learns heterogeneous spatial interactions based on physical similarity (e.g., thermal or wind-driven connections), moving beyond simple geographic proximity. These multi-faceted features are then fused via a subsequent attention layer. Critically, we enforce physical consistency by integrating a thermodynamics-aware loss function, which ensures physics-informed predictions of key variables like temperature and humidity. Evaluated on a comprehensive dataset from Wuhan, China, our model demonstrated high accuracy and strong correlation with observational data for 6-hour ahead nowcasting. Its inductive design is a key advantage, enabling reliable predictions for arbitrary, unmonitored locations by leveraging their local morphological context. This work presents a scalable and robust framework for generating physically plausible, high-resolution urban weather intelligence, essential for proactive applications in energy systems, public safety, and climate-adaptive urban planning.

How to cite: Zhang, Q. and Song, J.: An Inductive Spatio-Temporal Graph Network for Fine-Resolution Urban Weather Nowcasting Integrating Multi-Source Data and Physical Constraints, EGU General Assembly 2026, Vienna, Austria, 3–8 May 2026, EGU26-2288, https://doi.org/10.5194/egusphere-egu26-2288, 2026.

Urban green infrastructure (e.g., lawns, trees, green roofs) is a critical nature-based solution for mitigating urban heat island effect and reducing building cooling energy demand. While its biophysical processes, such as evapotranspiration, shading, and photosynthesis, are known to modify local microclimate and surface-atmosphere exchanges, most existing assessments rely on simplified, static representations of vegetation. This overlooks essential dynamic processes such as seasonal growth, phenological changes, greening-browning shifts due to heat and moisture stress responses, leading to uncertainties in quantifying its full cooling and energy-saving potential. To address this gap, we develop and apply an enhanced Urban Canopy Model (UCM) that integrates a dynamic ecohydrological module for vegetation with a building energy model capable of simulating outdoor thermal conditions and anthropogenic heat emissions. We first conducted comprehensive field campaigns in Wuhan, China, using a newly established urban eddy covariance tower and a green roof monitoring system, coupled with data on irrigation and other anthropogenic activities within the flux footprint. The model was rigorously validated against measurements of air/soil temperature, moisture, and turbulent heat fluxes. We then performed sensitivity analyses to evaluate how dynamic vegetation parameters (e.g., soil moisture, vegetation greenness, irrigation regimes) and building properties interactively affect outdoor microclimate and indoor energy demand. Our findings demonstrate that accounting for vegetation dynamics significantly improves the accuracy of microclimate and energy simulations, providing actionable insights for the planning and optimization of green infrastructure towards energy-efficient and climate-resilient cities.


How to cite: Zhang, J. and Song, J.: Modeling the Impact of Vegetation Dynamics on Urban Microclimate and Building Energy Demand, EGU General Assembly 2026, Vienna, Austria, 3–8 May 2026, EGU26-2289, https://doi.org/10.5194/egusphere-egu26-2289, 2026.

The successful implementation of marine spatial planning (MSP) and mitigation against coastal hazards needs to have access to a variety of quality data. Critical marine information, such as bathymetry, fisheries, biodiversity, aquaculture, coastal infrastructure, and oceanographic models, in the Sultanate of Oman is usually divided among ministries and institutions, is in a wide range of formats, and is not standardised in terms of metadata. This type of insulation would add to the absence of interoperability, discoverability, and reuse, which has a direct effect on evidence-based policy and sustainable development of a blue economy. This study fills this gap by designing and testing a conceptual model of a national Marine Spatial Data Infrastructure (MSDI), which is clearly designed to be founded on the FAIR (Findable, Accessible, Interoperable, Reusable) guiding principles. Going beyond a generic SDI model, the framework offers a customised way of implementation in the Omani context. The methodology will integrate an in-depth examination of the best practices of international MSDI, as well as a stakeholder requirements analysis of the main Omani government and research institutions. The suggested framework explains architectural elements, metadata profiles, semantic interoperability protocols, and a governance model in order to achieve long-term sustainability. This framework, as applied to the case study, can revolutionise the marine data situation in the Sultanate of Oman. Some major products are the prototype metadata catalogue, the semantic ontology of alignment between national data and international vocabularies, and a policy roadmap. The study also provides a generalisable template to other coastal countries and illustrates that FAIR-based MSDIs are not the technical systems and structures but the basic support systems of transdisciplinary ocean science, climate resilience and efficient maritime spatial governance.

How to cite: Al-Subhi, N., Al-Suqri, M., and Hamad, F.: Bridging the Data Gulf: Designing a FAIR-Compliant Marine Spatial Data Infrastructure for Sustainable Coastal Governance in The Sultanate of Oman, EGU General Assembly 2026, Vienna, Austria, 3–8 May 2026, EGU26-2356, https://doi.org/10.5194/egusphere-egu26-2356, 2026.

Xitou is a mid-elevation mountain forest region (1000–1200 m a.s.l.) in central Taiwan where intensive tourism infrastructure is embedded within an otherwise continuous forest ecosystem. This setting provides a rare opportunity to apply a spatially explicit monitoring framework to characterize urban heat island (UHI) effects using an ecologically meaningful forest reference state, rather than conventional urban–rural comparisons.

This study establishes a forest temperature gradient baseline based on year-long in-situ thermal observations from elevation-differentiated forest sites. The derived forest lapse rate exhibits pronounced diurnal asymmetry, with weaker daytime cooling and stronger nocturnal cooling, reflecting the combined influence of evapotranspiration, radiative processes, and boundary-layer stability. Expected forest temperatures at hotel elevations were then reconstructed from this baseline and compared with observed temperatures to isolate tourism-driven UHI intensity.

Results show that hotel developments generate a persistent warming of approximately 0.9–1.3 °C relative to the forest baseline. UHI intensity exhibits strong diurnal contrasts: one hotel shows pronounced nocturnal dominance, with nighttime warming nearly 1.8 times daytime values, indicating the importance of building heat storage and nighttime heating, while another shows comparable daytime and nighttime warming, suggesting substantial daytime anthropogenic heat emissions from tourism activities. Seasonally, UHI intensity is significantly stronger in winter and weaker in summer, contrary to typical urban patterns, highlighting seasonal modulation by forest evapotranspiration, which partially offsets anthropogenic heat during the growing season.

Despite the forest’s strong thermal buffering capacity, the results demonstrate that conversion of forest land to tourism facilities measurably intensifies local UHI, altering near-surface atmospheric stability and potentially affecting fog formation, boundary-layer processes, and forest microclimates. These thermal changes imply broader ecological impacts, including increased nighttime heat stress and disruption of forest–atmosphere energy exchanges.

How to cite: Lai, Y.-J. and Lin, P.-H.: Quantifying Urban Heat Island Effects in a Mountain Forest Tourism Area Using a Forest Reference Baseline, EGU General Assembly 2026, Vienna, Austria, 3–8 May 2026, EGU26-2402, https://doi.org/10.5194/egusphere-egu26-2402, 2026.

With the acceleration of urbanization, the urban heat island effect has become a critical issue in the context of global climate change. As a representative city in southwestern China, Chengdu has experienced pronounced changes in land surface temperature (LST) and near-surface air temperature (T2) as a result of urbanization. To investigate the spatiotemporal characteristics of the discrepancies between LST and T2 in Chengdu under an urbanization background and to elucidate the underlying physical mechanisms, this study integrates meteorological station observations, the MODIS land surface temperature/emissivity monthly product (MYD11C2), and the ERA5-Land reanalysis dataset with numerical simulations from the Weather Research and Forecasting (WRF) model. The variations in land surface temperature and their associated surface energy balance processes are examined across multiple temporal scales and spatial resolutions.

First, this study compares daytime and nighttime land surface temperatures in Chengdu for the years 2003 and 2023. The results indicate that daytime LST derived from MYD11C2 is generally higher than that from ERA5-Land and exhibits a larger range of variability. Secondly, the performance of the WSM6 and Thompson microphysics schemes in simulating air temperature and precipitation over Chengdu was evaluated. By comparing the root mean square errors (RMSEs) against meteorological station observations, the results show that the WSM6 scheme performs slightly better than the Thompson scheme in air temperature simulations, whereas the Thompson scheme exhibits a clear advantage over WSM6 in precipitation simulations. These findings indicate that the choice of microphysics scheme exerts a significant influence on model performance for different meteorological variables, and that an appropriate scheme should be selected according to the specific research objectives.

To further elucidate the mechanisms underlying the divergence between land surface temperature and air temperature, this study integrates a surface energy balance analysis based on the WRF model to investigate the primary drivers of the LST–T2 differences. The results demonstrate that variations in surface energy partitioning—particularly changes in net radiation, sensible heat flux, and latent heat flux—are key factors governing the formation of discrepancies between LST and T2. In addition, urban surface characteristics, such as the proportion of impervious surfaces and building density, play an important role in modulating the differences between land surface temperature and near-surface air temperature.

How to cite: Zhang, Y.: Investigating the Spatiotemporal Characteristics and Energy Balance Physical Mechanisms of the Difference between Land Surface Temperature and Air Temperature in Chengdu Based on the WRF Model, EGU General Assembly 2026, Vienna, Austria, 3–8 May 2026, EGU26-6406, https://doi.org/10.5194/egusphere-egu26-6406, 2026.

EGU26-7250 | ECS | Posters on site | BG10.12

Scaling urban tree cooling and its socioeconomic distribution 

Josephine Reek, Constantin Zohner, Vincent Jonsson, and Loïc Pelissier

Urban greening with trees and other vegetation is gaining popularity as a means to benefit urban populations, particularly by mitigating heat exposure. At the same time, concerns about equity in the distribution of urban greenspaces and their benefits have become central to urban climate planning and research. A persistent challenge in the field is the trade-off between data accuracy and scale. Detailed, empirical ground data is typically only available for individual cities, whereas broader comparative or global analyses must rely on satellite data and extrapolated or heavily aggregated socioeconomic data. Here, we compare these approaches in the context of the socioeconomic distribution of urban tree-related cooling benefits. We derive multiple metrics using ground-based temperature measurements, satellite data, and census-based socioeconomic indicators. By benchmarking analyses based on broadly available datasets against those using detailed local measurements, we assess the extent to which large-scale, data-sparse approaches reproduce patterns observed in high-resolution ground data. Using several US and European cities as case studies, we then assess the spatial distribution of cooling effects in relation to socio-economic conditions of the neighbourhood. Our results provide guidance on the reliability and limitations of commonly used data sources for assessing equity in urban heat mitigation benefits across cities and regions.

How to cite: Reek, J., Zohner, C., Jonsson, V., and Pelissier, L.: Scaling urban tree cooling and its socioeconomic distribution, EGU General Assembly 2026, Vienna, Austria, 3–8 May 2026, EGU26-7250, https://doi.org/10.5194/egusphere-egu26-7250, 2026.

EGU26-7382 | ECS | Orals | BG10.12

Modeling of rooftop mitigation strategies in arid climates based on local climate zones using WRF  

Amjad Azmeer, Buri Vinodhkumar, Furqan Tahir, and Sami Al-Ghamdi

Rapid urbanization and extreme heat pose growing energy and thermal comfort challenges for citizens living in arid cities such as Riyadh. Rooftop-based heat mitigation strategies are being deployed across cities as potential mitigation solutions to extreme heat. However, the city-wide temperature reduction achieved by rooftop strategies under arid conditions remains inadequately quantified across different urban morphologies. This study employs Weather Research and Forecasting (WRF) with the urban canopy model (UCM) to evaluate the cooling potential of cool roofs, green roofs, and rooftop photovoltaic (PV) systems during a six-day heatwave event in Riyadh. The Local Climate Zone (LCZ) framework is used to differentiate rooftop mitigation performance across urban morphologies. The post-processing analysis evaluates air temperature, surface temperature, and surface energy fluxes across the different scenarios. Results indicate that daytime surface temperatures are reduced by up to 1.23 °C for green roofs and up to 4.62 °C for super cool roofs relative to the base case, with the strongest cooling observed over compact low-rise LCZs. Cool roofs also produce substantially lower sensible heat fluxes than green roofs across all urban LCZ Categories. Green roofs provide localized evaporative cooling benefits but are less effective than cool roofs at reducing city-wide temperatures under arid conditions. The results also show that cooling benefits vary across LCZs, with compact low-rise neighborhoods showing the greatest temperature reductions. Overall, the findings demonstrate that modeling frameworks that integrate LCZs and WRF simulations can inform evidence-based rooftop mitigation strategies to enhance heat resilience in arid climates.

How to cite: Azmeer, A., Vinodhkumar, B., Tahir, F., and Al-Ghamdi, S.: Modeling of rooftop mitigation strategies in arid climates based on local climate zones using WRF , EGU General Assembly 2026, Vienna, Austria, 3–8 May 2026, EGU26-7382, https://doi.org/10.5194/egusphere-egu26-7382, 2026.

EGU26-10235 | ECS | Posters on site | BG10.12

Regional downscaling for extreme events 

Emmanuel Francisco Alcantara, Vlad Stefan Barbu, and Luminita Danaila

Urban heat islands (UHIs) are areas within urban environments where air temperatures are consistently higher than those in surrounding rural areas. UHIs arise from urban morphology, anthropogenic heat emissions, and altered radiative and evapotranspiration balances. 

The local effects of urban heat islands during extreme events (e.g., heat waves) are difficult to predict, in great part due to the mismatch between large-scale atmospheric processes and small-scale urban physics, and the mechanisms involved in the overall energy transfer during the formation, persistence, and decay of UHIs under these circumstances still remain unclear. The objective of this study is to determine the triggering factors that influence these mechanisms and to better understand the onset of this phenomenon.

We use experimental observations from a network of meteorological stations with a 10-minute sampling rate, deployed between March and December 2025 in six cities near the Rouen metropolitan area in Normandy (France), along the Seine River. The dataset obtained by these stations is complemented by publicly available data from local operational stations.

We calculate urban–rural temperature differences and their temporal variability under different general and local conditions of paired urban–rural sites, using a combination of physical and statistical analyses, such as moment analysis, auto- and cross-correlation analysis, and temporal evolution of the probability density function for temperature measurements. Preliminary results indicate that urban temperatures are on average about 1°C higher than those in neighboring rural areas, with peaks reaching up to 5°C in four cities along the Seine Valley, near Rouen, between June 19 and July 4 and between August 8 and 18, 2025, periods during which heat waves were reported in France. During these periods, we found that most stations reached these peak values at night, consistent with the normal UHI behavior reported in the literature.

Future work will focus on reproducing observed UHI patterns through high-temporal- and spatial-resolution numerical simulations with the Weather Research and Forecasting (WRF) model. Subsequently, Markov processes will be explored to develop a UHI prediction model based on experimental data from the stations and results from numerical simulations.

How to cite: Francisco Alcantara, E., Barbu, V. S., and Danaila, L.: Regional downscaling for extreme events, EGU General Assembly 2026, Vienna, Austria, 3–8 May 2026, EGU26-10235, https://doi.org/10.5194/egusphere-egu26-10235, 2026.

Accelerating climate change has intensified urban heat risks, particularly in coastal cities where urban heat island effects interact with maritime climatic influences, yet spatially explicit frameworks that diagnose heterogeneous vulnerability mechanisms remain limited. Busan, a representative coastal metropolis in South Korea, faces high heatwave vulnerability due to dense urban development, rapid population aging, and limited green space.

This study develops a spatial heat vulnerability assessment framework for Busan that integrates physical thermal conditions and social vulnerability to classify high-risk areas into distinct typologies representing different vulnerability pathways, and to inform tailored resilience strategies.

Satellite-derived thermal indicators, demographic characteristics, infrastructure accessibility, and building conditions were combined to construct composite indices of exposure, sensitivity, and adaptive capacity.  These indices were then jointly analyzed to derive typology-based vulnerability patterns, and spatial clustering analysis using Local Indicators of Spatial Association was applied to identify statistically significant spatial concentrations.

The results highlight Jung-gu and Sasang-gu as representative high-vulnerability districts characterized by structurally distinct vulnerability mechanisms. Jung-gu exhibits high exposure and sensitivity driven by dense commercial development and limited vegetation, whereas Sasang-gu shows low adaptive capacity due to aging buildings and insufficient green infrastructure, illustrating different pathways through which heatwave vulnerability is produced.

These findings demonstrate that heatwave vulnerability emerges from coupled social and environmental structures, and indicate that typology-specific interventions provide an evidence-based foundation for climate adaptation planning and urban resilience in coastal metropolitan cities facing intensifying heatwave risks.

†This research was supported by "Development of living shoreline technology based on blue carbon science toward climate change adaptation" of Korea Institute of Marine Science & Technology Promotion (KIMST) funded by the Ministry of Oceans and Fisheries (KIMST-20220526)

How to cite: Tae, M. and Chon, J.: Spatial Assessment of Urban Heat Vulnerability and Typology-Based Diagnostic Framework for Resilience Strategies in Busan, South Korea, EGU General Assembly 2026, Vienna, Austria, 3–8 May 2026, EGU26-10502, https://doi.org/10.5194/egusphere-egu26-10502, 2026.

Urban heat represents a growing environmental and societal challenge, particularly during heatwave events, when the interaction between climate extremes and urban form amplifies thermal exposure. Advancing the characterization of urban heat therefore requires geospatial approaches capable of capturing both temporal dynamics and fine-scale spatial heterogeneity. This study investigates Surface Urban Heat Island (SUHI) intensity and intra-urban land surface temperature (LST) patterns during heatwaves in three climatically contrasting Argentine cities: Posadas (humid subtropical city), Buenos Aires (temperate coastal megacity), and Neuquén (semi-arid Patagonian city).

We apply an integrated geospatial framework combining high-temporal-resolution MODIS LST data with high-spatial-resolution Landsat 8 and Sentinel-2 imagery. Heatwave periods are analysed to quantify daytime and nighttime SUHI across urban, peri-urban, and rural zones, while Local Climate Zones (LCZs) are mapped to assess how urban morphology, land cover, and vegetation modulate thermal patterns at the intra-urban scale. Statistical analyses are used to evaluate significant temperature differences among zones and urban typologies under extreme heat conditions.

Results reveal strong inter-city contrasts and complex spatial responses. Posadas and Buenos Aires exhibit pronounced nocturnal SUHI, reflecting urban heat retention during heatwaves, whereas daytime patterns differ substantially depending on regional context. In Neuquén, a heterogeneous thermal response emerges, including a negative daytime SUHI relative to the surrounding semi-arid plateau, highlighting the influence of soil moisture, vegetation scarcity, and topography. Across all cities, compact and densely built LCZs consistently show higher LST, while vegetated areas, river corridors, and water bodies act as persistent cooling zones during heat extremes.

By integrating multi-source geospatial data within an LCZ-based analytical framework, this study advances the characterization of urban heat under extreme conditions and provides transferable insights for climate-resilient urban planning, heat risk mitigation, and spatially targeted adaptation strategies.

How to cite: Cimolai, C. and Aguilar, E.: Characterizing heatwave-driven urban heat patterns using multi-source geospatial data: SUHI dynamics and intra-urban thermal variability in Argentine cities, EGU General Assembly 2026, Vienna, Austria, 3–8 May 2026, EGU26-12717, https://doi.org/10.5194/egusphere-egu26-12717, 2026.

Surface Heat Island (SUHI) is a result of complex and non-linear interactions between atmospheric processes and urban surface features. These interactions operate at different spatiotemporal scales. Research shows that surface coverage and urban morphology affect the urban thermal environment; however, most SUHI modeling approaches still rely on surface features and mostly ignore important parameters such as atmospheric humidity and precipitation. This problem limits the ability of existing SUHI models to accurately represent interactions between the surface and atmosphere and thermal variability.

This research presents a deep learning-based framework for SUHI modeling which is developed based on integrating urban, atmospheric, and environmental features. The proposed framework integrates Landsat-derived land surface indicators, including Land Surface Temperature (LST), the Normalized Difference Vegetation Index (NDVI), which represents vegetation cover, the Normalized Difference Built-up Index (NDBI) and Night Time Light (NTL), which  characterize built-up areas, and the Normalized Difference Water Index (NDWI), which represents surface water bodies, with GNSS-derived Precipitable Water Vapor (PWV) as a measure of atmospheric humidity and Global Precipitation Measurement (GPM) data. Other effective parameters include topography from the Advanced Spaceborne Thermal Emission and Reflection Radiometer (ASTER) digital elevation model and population density in different part of the city.

A Convolutional Neural Network (CNN) architecture is developed to capture spatial dependencies in urban areas and to understand the non-linear interactions between surface, atmospheric, social, and environmental features. This model is composed of many stacked convolutional layers with regularization and pooling algorithms to maintain generalization and preserving spatial structure. SUHI intensity, defined as the contrast between LST in urban and rural areas, is used as the target for prediction. Model training and validation are based on cross-validation to assess robustness and transferability across different temporal subsets.

The case study is Wrocław, Poland that has been experiencing rapid urban development and has undergone substantial land-use and structural transformation over the past decade. Comparisons between results from models that include and exclude humidity and precipitation demonstrate that GNSS-derived PWV and precipitation play a significant role in SUHI modeling.

The results highlight the importance of accounting for urban–atmosphere interactions in SUHI modeling. This deep learning framework provides a practical basis for subsequent eXplainable Artificial Intelligence (XAI) analyses. XAI analysis can identify SUHI drivers and support climate-resilient urban planning and heat mitigation strategies.

How to cite: Tasan, M. and Dąbrowska, J.: Deep Learning–Based Modeling of Surface Urban Heat Island Integrating GNSS-Derived Atmospheric Humidity and Multi-Source Urban Data, EGU General Assembly 2026, Vienna, Austria, 3–8 May 2026, EGU26-12749, https://doi.org/10.5194/egusphere-egu26-12749, 2026.

EGU26-12756 | Orals | BG10.12

Satellite-derived Land Surface Temperatures Strongly Mischaracterise Urban Heat Hazard 

Benjamin Bechtel, Simone Kotthaus, Wenfeng Zhan, Huilin Du, Negin Nazarian, Tirthankar Chakraborty, Scott Krayenhoff, Alberto Martilli, Marzie Naserikia, Matthias Roth, Panagiotis Sismanidis, Iain Stewart, and James Voogt

Escalating urban heat, driven by the convergence of global warming and rapid urbanization, is a profound threat to billions of city dwellers. Effective action to address this challenge requires reliable metrics and data, which are often not readily available. Consequently, the science directing urban heat adaptation is strongly influenced by studies that use satellite-based land surface temperature (LST), which is globally available and address data gaps in cities, particularly in the Global South. Hence, LST now often serves as the default lens through which many cities view their heat realities. Yet this lens is fundamentally misfocused. LST, is a poor surrogate for near-surface air temperature, physiologically relevant human thermal comfort, or direct human heat exposure. This flawed practice leads to issues for several downstream use cases by inflating adaptation benefits, distorting the magnitude and variability of urban heat signals across scales, and thus misguiding urban adaptation policy. Drawing on remote sensing, climate science, and governance theory, we clarify what LST does and does not represent and expose where its use drifts most dangerously across disciplines. We argue that satellite-based LST must be treated as a distinct indicator of surface climate, which, though relevant to the urban surface energy budget, is frequently decoupled from human-relevant thermal impacts. We then advance practical guardrails and principles for using LST wisely, alongside a Surface-to-Society framework to re-align urban heat governance with metrics grounded in human heat exposure. We argue that the global community must urgently pivot from cooling pixels to cooling people.

How to cite: Bechtel, B., Kotthaus, S., Zhan, W., Du, H., Nazarian, N., Chakraborty, T., Krayenhoff, S., Martilli, A., Naserikia, M., Roth, M., Sismanidis, P., Stewart, I., and Voogt, J.: Satellite-derived Land Surface Temperatures Strongly Mischaracterise Urban Heat Hazard, EGU General Assembly 2026, Vienna, Austria, 3–8 May 2026, EGU26-12756, https://doi.org/10.5194/egusphere-egu26-12756, 2026.

Abstract: Global warming and rapid urbanization are intensifying the complexity of urban thermal environments, exacerbating heat exposure disparities across diverse scales and demographics. Within the IPCC framework, urban heat risk emerges from the dynamic interaction of hazard, exposure, and vulnerability. While significant progress has been made in quantifying these components—leveraging remote sensing for hazards, human mobility for exposure, and socioeconomic indices for vulnerability—a large-scale synthesis evaluating the global evolution and integration of these research paradigms remains absent.

To bridge this gap, this study conducted a comprehensive search on the Web of Science using a Boolean strategy encompassing three core dimensions: urban thermal hazards, population exposure, and social vulnerability. This process yielded a corpus of over 7,000 peer-reviewed papers published between 2000 and 2025. Leveraging a Large Language Model (LLM), we autonomously extracted geographical metadata and thematic focus from the abstracts. Furthermore, this study analyzed the research dynamics and epistemological shifts in urban heat risk research based on searching results. Our findings reveal: (1) An unprecedented explosion in academic interest, with annual publications surging 150-fold, reflecting the urgency of heat adaptation. (2) A clear paradigm shift from a historical preoccupation with physical hazards toward holistic, multidimensional risk frameworks, particularly over the last five years. (3) A persistent thematic imbalance; hazard assessments still dominate (accounting for over 85% of literature), while human exposure and social vulnerability remain significantly underrepresented. (4) A pronounced "digital divide" in knowledge production, with research heavily concentrated in China and the United States. This leaves critical data voids in highly vulnerable regions of the Global South, including parts of Africa and Southeast Asia. This study underscores the necessity of bridging thematic and geographic divides to foster equitable global urban heat resilience.

Keywords: Urban heat risk, Hazard-exposure-vulnerability, Spatial inequality, Research evolution

How to cite: Tong, M.: From Hazards to Integrated Risks: Decoding Disparities in Global Urban Heat Research, EGU General Assembly 2026, Vienna, Austria, 3–8 May 2026, EGU26-12805, https://doi.org/10.5194/egusphere-egu26-12805, 2026.

EGU26-12814 | ECS | Orals | BG10.12

Daily Air Temperature Mapping in Urban Areas from Satellite Land Surface Temperature and ERA5 Data 

Daniele Settembre, Davide De Santis, Dario Cappelli, and Fabio Del Frate

Urban areas are increasingly affected by environmental and public health challenges driven by rising temperatures. Due to ongoing climate change and the increased presence of greenhouse gases in the atmosphere, the frequency and duration of heatwaves are expanding. These phenomena have serious implications for human health, particularly among vulnerable populations such as the elderly, individuals with pre-existing cardiovascular or respiratory conditions, and disadvantaged socio-economic communities.

Air temperature at 2 meters above the surface is a critical variable for assessing climate change impacts and thermal stress, especially in densely populated urban environments. However, ground-based observations of air temperature are often sparse, mostly concentrated in developed regions, and frequently suffer from temporal gaps. This spatial and temporal inconsistency limits our ability to monitor urban thermal conditions effectively. On the other hand, satellite data provide continuous and global measurements of land surface temperature (LST), but do not directly measure air temperature. Since LST and air temperature are not equivalent, translating satellite-based LST into reliable air temperature estimates remains challenging.

In this work, we developed a statistical approach that leverages MODIS satellite observations and ERA5-Land model data across the 70 largest and most populous cities worldwide, geographically distributed with a maximum of three cities per country to prevent national over-representation and ensure global balance. The dataset spans from 2012 to 2023 and is categorized by three latitudinal zones equatorial (0 to ±15°), tropical-temperate (±15° to ±45°), and temperate-subpolar (±45° to ±75°) and by month, distinguishing between day and night observations.

For each geographical and temporal class, we fit the parameters of the equation:

Tair = a * LSTday + b * LSTnight + c   [1]

This resulted in parameter triplets (a, b, c) specific to each month and latitude band. These parameters were then applied to MODIS and VIIRS data, for the year 2024, to assess the inter-sensor scalability. The resulting air temperature estimates are obtained at the native spatial resolution of the input datasets (1 kilometer). The method operates on a daily basis, leveraging both daytime and nighttime satellite acquisitions to ensure consistent and temporally detailed air temperature estimates, an essential feature for capturing urban thermal dynamics and short-term variability, such as the urban heat island effect.

The model was validated using data from the year 2024 for the same cities, with the ERA5-Land dataset (https://cds.climate.copernicus.eu/datasets/reanalysis-era5-land?tab=overview) serving as a reference. Pearson correlation coefficients ranged from 84% to 93% for daytime temperatures and from 77% to 93% for nighttime temperatures.

The approach is also adaptable to ongoing and future satellite missions with improved spatial resolution (e.g. ECOSTRESS). Looking toward future developments, the integration of Artificial Intelligence could further enhance this methodology by incorporating additional weather variables, improving the representation of complex ambient conditions. This work represents a promising advancement in the field of high-resolution, daily thermal comfort assessments across urban areas, offering a scalable and flexible tool for heat-related stress monitoring.

[1] Hooker, J. et al., A. A global dataset of air temperature derived from satellite remote sensing and weather stations. (2018). https://doi.org/10.1038/sdata.2018.246

How to cite: Settembre, D., De Santis, D., Cappelli, D., and Del Frate, F.: Daily Air Temperature Mapping in Urban Areas from Satellite Land Surface Temperature and ERA5 Data, EGU General Assembly 2026, Vienna, Austria, 3–8 May 2026, EGU26-12814, https://doi.org/10.5194/egusphere-egu26-12814, 2026.

EGU26-13195 | ECS | Orals | BG10.12

Satellite high-resolution thermal infrared imagery for UHI monitoring 

Mattia Pecci, Alessia Scalabrini, Maria Fabrizia Buongiorno, Massimo Musacchio, Malvina Silvestri, and Federico Rabuffi

Climate change is driving a sustained increase in global temperatures and an intensification of extreme events, including heatwaves. Urban areas are particularly vulnerable, as they are characterized by higher temperatures compared to surrounding suburban and rural environments, a phenomenon known as the Urban Heat Island (UHI). This effect is primarily associated with the presence of buildings and inhomogeneous surfaces, which modify surface energy and water exchanges as well as local wind circulation. Additional factors, such as land-use changes, reduction of vegetated areas, local anthropogenic heat emissions (e.g. traffic and air conditioning), and air pollution, further alter the urban heat balance.

The UHI strongly affects urban climate, ecosystems, air quality, and human thermal comfort, and its impact is exacerbated during heatwaves, posing significant risks to human health. Therefore, monitoring and characterizing UHI is crucial for climate mitigation and adaptation strategies.

Satellite-derived Land Surface Temperature (LST) provides an effective means to investigate the Surface Urban Heat Island (SUHI), enabling comprehensive spatial and temporal analyses of urban thermal patterns, identification of hot- and cold-spots, and assessment of mitigation measures such as high-albedo materials and urban green areas.

In this study, thermal infrared satellite observations are used to analyze LST over selected urban areas in Central and Southern Italy, with the aim of characterizing SUHI dynamics. Long-term variations (>10 years) are investigated using Landsat 8 data (100 m spatial resolution, 16-day revisit time, available since 2013). For recent years, Landsat 8 and 9 observations (8-days revisit time when used in combination) are combined with ECOSTRESS data (70 m spatial resolution, variable overpass times, 1–2 day revisit), significantly enhancing temporal sampling. This multi-sensor approach enables an improved assessment of urban temperature evolution and its response to climate change.

This work was supported by the ASI SpaceItUp contract N. 2024-5-E.0, CUP

I53D24000060005., SPOKE 5 and SPOKE 7 activities.

How to cite: Pecci, M., Scalabrini, A., Buongiorno, M. F., Musacchio, M., Silvestri, M., and Rabuffi, F.: Satellite high-resolution thermal infrared imagery for UHI monitoring, EGU General Assembly 2026, Vienna, Austria, 3–8 May 2026, EGU26-13195, https://doi.org/10.5194/egusphere-egu26-13195, 2026.

EGU26-13264 | ECS | Orals | BG10.12

Understanding urban tree shade: characterizing direct shortwave transmissivity through urban tree canopies using Terrestrial LiDAR Scanning 

Todi Daelman, Hans Verbeeck, Matthias Demuzere, and Frieke Vancoillie

Tree shading is one of the most effective mechanisms to improve daytime human thermal comfort, specifically in urban contexts where exposure to direct shortwave radiation dominates heat stress. The quality and quantity of tree shading are heavily controlled by canopy closure and crown architecture. However, with limited data on the link between tree structure in different tree species and their shade quality, these relationships are frequently overlooked both in practice and in urban microclimate modelling.

In this study, we present a new framework to quantify tree shading potential using Terrestrial Laser Scanning (TLS). The TLS scan of a tree is used to derive its canopy gap fraction, which represents a proxy for direct shortwave radiation transmissivity. We evaluate different processing methods (laser pulse-based and point-based) and perform a digital validation of the different approaches. After validating and selecting the most appropriate method, the transmissivity values are linked back to the tree’s structural characteristics which can be derived from the TLS point cloud information. By including indices such as tree height, crown volume, and leaf area density, we investigate the link between tree structure and shading behavior.

The proposed framework is applied to a database of over 50 individually scanned urban trees, all measured in summer across multiple cities in Belgium. This allows for a comparison of shading capabilities between different tree species and morphologies. In addition to the expected differences in overall transmissivity between trees, preliminary results reveal strong variations in gap fraction across different zenith angles, with transmissivity values ranging from 3 to 28% at low and high zenith angles, respectively. This indicates not only a variation in shading intensity between individual trees, but also potential differences throughout the day.

These results are informative for comparing urban tree species and their management strategies when the goal is to optimize pedestrian shading and thermal comfort. Additionally, they provide empirically derived parameters to improve the representation of tree structure and shading effects in urban microclimate models.

How to cite: Daelman, T., Verbeeck, H., Demuzere, M., and Vancoillie, F.: Understanding urban tree shade: characterizing direct shortwave transmissivity through urban tree canopies using Terrestrial LiDAR Scanning, EGU General Assembly 2026, Vienna, Austria, 3–8 May 2026, EGU26-13264, https://doi.org/10.5194/egusphere-egu26-13264, 2026.

EGU26-13567 | ECS | Orals | BG10.12

Developing a Historical Building Classification for Mapping Urban Thermal and Morphology Parameters in Urban Climate Models 

Bianca Eline Sandvik, Dragan Milošević, Peter Kalverla, Claire Donnelly, and Gert-Jan Steeneveld

Historic variations in building regulations and construction practices have shaped the thermal properties of today’s urban fabric, yet these differences are often neglected or oversimplified in urban weather and climate models. Building materials, insulation levels, and construction techniques vary strongly across construction periods, leading to spatial differences in heat storage and release, energy demand, and vulnerability to temperature extremes. Most current urban mesoscale models rely on generic classifications, such as Local Climate Zones (LCZs), which limits their ability to capture this heterogeneity and reduces the accuracy and reliability of weather and climate forecasts.

Using Amsterdam (The Netherlands) as a case study, we present a novel geospatial modeling framework that explicitly incorporates historical building characteristics into numerical weather and climate simulations. Based on detailed cadastral data and an extensive review of historical building regulations and practices in The Netherlands, we define ten “heritage building classes” representing distinct construction periods and their typical thermal properties. These classes are mapped across the city using GIS techniques, producing high-resolution heritage building maps. For each class, representative thermal parameters are derived and implemented into the Weather Research and Forecasting (WRF) model.

We assess the sensitivity of simulated urban temperatures to these period-specific building properties and evaluate model performance against in-situ meteorological observations from the Amsterdam Atmospheric Monitoring Supersite (AAMS). This approach provides a scalable pathway for integrating historically informed building characteristics into urban climate models, creating a foundation for future improvements in urban climate simulation.

How to cite: Sandvik, B. E., Milošević, D., Kalverla, P., Donnelly, C., and Steeneveld, G.-J.: Developing a Historical Building Classification for Mapping Urban Thermal and Morphology Parameters in Urban Climate Models, EGU General Assembly 2026, Vienna, Austria, 3–8 May 2026, EGU26-13567, https://doi.org/10.5194/egusphere-egu26-13567, 2026.

EGU26-14736 | ECS | Posters on site | BG10.12

Scalable Mapping of Urban Green Cooling Services Using AlphaEarth Foundations 

Hanyu Li, Alby Duarte Rocha, and Christine Wallis

Under the combined influence of global warming and rapid urbanization, extreme heat has become a major challenge for urban resilience and public health. Urban green infrastructure provides important cooling benefits through evapotranspiration and shading, yet spatially explicit assessment of these services remains challenging. Existing approaches rely heavily on computationally expensive physical models and dense input data, which limits their applicability beyond well-studied regions. In this study, we present a scalable approach for mapping urban green cooling services by combining Earth observation foundation models with insights from process-based modeling. We use the Green Cooling Services Index (GCoS) as the core metric, which is derived from simulations of the Soil-Canopy-Observation of Photosynthesis and Energy Fluxes (SCOPE) model. To enable large-scale applications, we build a surrogate model that maps annual multimodal satellite embedding vectors from AlphaEarth Foundations to GCoS reference data. These embeddings integrate multisource Earth observation information across the full year, capturing key vegetation phenology and climate dynamics. The analysis covers 14 Functional Urban Areas across Europe and surrounding regions. Model performance is evaluated through three complementary experiments: a continent-scale assessment, a leave-one-city-out test, and stratified error analyses in representative cities. Results show that the surrogate approach can reproduce vegetation cooling effects with high accuracy while requiring substantially fewer data and computational resources than conventional physical models. Importantly, the model maintains stable performance when applied to cities not included in training. This framework addresses a key scalability gap in urban heat assessments and enables consistent mapping of green cooling services in data limited regions.

How to cite: Li, H., Duarte Rocha, A., and Wallis, C.: Scalable Mapping of Urban Green Cooling Services Using AlphaEarth Foundations, EGU General Assembly 2026, Vienna, Austria, 3–8 May 2026, EGU26-14736, https://doi.org/10.5194/egusphere-egu26-14736, 2026.

Cities around the world, including those located in predominantly cold climates that were once thought to be relatively immune to warming, are experiencing rapid temperature increases and more frequent heatwave events, with substantial impacts on people’s well-being and critical urban infrastructure. Green infrastructure (GI) can help mitigate these impacts by cooling through shade and evapotranspiration, but expanding vegetation cover is increasingly difficult because of land competition driven by urbanization. This makes it critical to understand how to maximize the cooling effect of a given amount of vegetation. Key considerations include the fact that different types of vegetation can confer varying levels of cooling and that the spatial distribution of vegetation can influence its cooling impact.

In this presentation, we report preliminary findings from a large ongoing study comparing 12 cities in Southern Ontario, Canada. We mapped two types of vegetation (i.e., trees and shrubs/grass) using Sentinel satellite imagery, and examined how different aspects of their spatial patterns, quantified using landscape metrics, affect land surface temperature (LST) derived from Landsat imagery averaged over summer months. We evaluate and compare these relationships across cities of different sizes, from small cities with fewer than 500,000 residents to large metropolitan areas such as Toronto. We also investigate how the relationship between GI spatial patterns and LST varies across spatial scales, and we evaluate multiple modelling approaches, including spatial regression models, as well as advanced machine learning (ML) and deep learning (DL) models, including random forest and convolutional neural networks.

Our findings to date yield several insights:

  • In all cities, the spatial pattern of GI exerts a significant influence on LST even after controlling for the total amount of vegetation. However, the relative importance of specific spatial pattern characteristics (e.g., connectivity, geometric complexity of patches) varies across cities, with distinct differences between larger and smaller urban areas.
  • Consistent with existing literature, trees provide substantially greater cooling effects than shrubs/grass, although the magnitude of cooling varies meaningfully across cities.
  • The influence of spatial pattern on LST is strongly scale-dependent, with relationships generally strengthening from finer to intermediate spatial scales, and also varying with the shape of analytical units.
  • Spatial regression models prove essential for accurately characterizing vegetation–temperature relationships, as non-spatial models tend to overestimate effect sizes and increase the likelihood of falsely identifying significant relationships.
  • While machine learning and deep learning models excel at prediction, spatial regression models continue to offer interpretative insights not captured by ML and DL models. We provide recommendations on the appropriate use of each model.

We believe these findings help fill an important knowledge gap on cold-climate cities, particularly in the Canadian context, where urban morphology may differ from that of other cold-region cities. Our results provide a more nuanced understanding of how vegetation type, spatial configuration, and scale interact to shape cooling, and they offer practical guidance for policymakers and practitioners on strategically deploying GI to maximize cooling benefits.

How to cite: Masoudi, M. and Mahdianpari, M.: Understanding Green Infrastructure-Temperature Relationships in Cold-Climate Cities: Evidence from 12 Canadian Urban Areas, EGU General Assembly 2026, Vienna, Austria, 3–8 May 2026, EGU26-15300, https://doi.org/10.5194/egusphere-egu26-15300, 2026.

Severe PM2.5 pollution (particles with an aerodynamic diameter ≤ 2.5 μm) and the urban heat island (UHI) effect pose serious threats to human health and living environments in densely populated cities. However, the specific role of aerosols in shortwave and longwave radiation transfer, as well as the mechanisms through which radiation processes affect urban heat island intensity (UHII), remain insufficiently understood. In this study, the WRF-Chem model was employed to simulate several typical pollution episodes during 2016–2017. We quantitatively assessed aerosol radiative forcing and further distinguished the contributions of different aerosol components to shortwave and longwave radiation, systematically analyzing their impacts on surface UHI, canopy-layer UHI, and boundary-layer UHI. The results show that, overall, boundary-layer UHI increases with worsening pollution, while the peak intensities of surface and canopy-layer UHIs are significantly weakened under polluted conditions. However, during sustained pollution episodes, as pollution intensifies, the maximum UHI intensities of both tend to increase. To exclude the influence of indirect aerosol radiative effects, periods with high pollution but low cloud cover were selected for further analysis. Comparative sensitivity experiments reveal that absorbing aerosols enhance UHIs at all levels, particularly daytime canopy-layer UHI (by 14.65%) and nighttime boundary-layer UHI (by 20.04%). In contrast, scattering aerosols weaken boundary-layer UHI and daytime surface UHI, while strengthening canopy-layer UHI and nighttime surface UHI. By comparing radiative heating profiles in urban and rural areas, we found that absorbing aerosols absorb more radiation in urban areas during the day, resulting in a markedly higher heating rate than in rural areas; at night, urban areas also exhibit slightly stronger heat retention. Decomposing the radiative heating profiles into shortwave and longwave components further indicates that absorbing aerosols strongly absorb shortwave radiation during the day and subsequently heat the near-surface layer via longwave radiation at night. Scattering aerosols reduce radiation received by the surface and boundary layer during the day, while at night they intercept longwave radiation in the upper boundary layer, leading to warming above and cooling below the boundary layer. In summary, absorbing aerosols enhance UHIs at all levels by absorbing shortwave radiation during the day and continue to intensify UHI through longwave radiation release at night. Scattering aerosols, by scattering solar radiation, weaken boundary-layer UHI and reduce daytime surface heating, while scattering radiation toward the canopy enhances canopy-layer UHI. This study distinguishes between the radiative effects of absorbing and scattering aerosols, revealing their differential impacts on multi-layer urban heat islands and providing new insights into pollution-climate interactions. The findings offer relevant implications for urban climate adaptation planning and synergistic air quality management.

How to cite: Qian, C. and Yang, Y.: Mechanisms of Aerosol Composition Effects on Multi‑Layer Urban Heat Islands: A Case Study of Beijing, EGU General Assembly 2026, Vienna, Austria, 3–8 May 2026, EGU26-15720, https://doi.org/10.5194/egusphere-egu26-15720, 2026.

EGU26-16094 | ECS | Orals | BG10.12

Impacts of VPD Stress on the Interaction Between Urban Heat Islands and Heat Waves Over CONUS 

Linying Wang, Dan Li, and Xing Yuan
Although both urban and rural temperatures are expected to increase under heat waves (HWs), whether the urban heat island (UHI) intensity becomes stronger under HWs remains unknown especially at the daily mean and large spatial scales. Using an urbanized land surface model, we quantify the interactions between UHIs and HWs over the Contiguous United States (CONUS). Synergistic interactions (i.e., increased UHI intensities under HWs) are observed over the eastern and western U.S. However, negative interactions are found in the Central U.S. due to the stronger inhibition of rural evapotranspiration by vapor pressure deficit (VPD) stresses. The interactions between UHIs and HWs in the Central U.S. will be further reduced along with the elevated VPD stresses in a hotter future. The results highlight the importance of properly parameterizing the sensitivity of urban and rural evapotranspiration to various environmental stresses in climate and earth system models.

How to cite: Wang, L., Li, D., and Yuan, X.: Impacts of VPD Stress on the Interaction Between Urban Heat Islands and Heat Waves Over CONUS, EGU General Assembly 2026, Vienna, Austria, 3–8 May 2026, EGU26-16094, https://doi.org/10.5194/egusphere-egu26-16094, 2026.

EGU26-16140 | ECS | Posters on site | BG10.12

Diurnal Surface Urban Heat Island Variability Across Local Climate Zones in South Asian Cities 

Akanksha Pandey and Tirthankar Banerjee

Urban morphology exerts a fundamental control on land surface temperature (LST), governing the spatial and temporal variability of urban thermal environments. In South Asia, rapid urban expansion coupled with the increasing frequency and intensity of extreme heat events has amplified surface urban heat island (SUHI) effects, posing serious challenges to urban livability and thermal comfort. This study investigates the diurnal and spatial variability of LST across local climate zones (LCZs) in three major South Asian cities, Delhi, Bangalore, and Lahore, using multi-year Moderate Resolution Imaging Spectroradiometer (MODIS) LST observations.  Summer-specific urban LST data were analyzed to characterize grid-based diurnal thermal contrasts and intra-LCZ thermal heterogeneity under daytime and nighttime conditions. The results reveal robust diurnal thermal differentiation among LCZs, with distinct surface thermal responses across the three cities. Water-dominated LCZs consistently exhibited the lowest surface temperatures due to high thermal inertia and evaporative cooling, whereas sparsely vegetated and bare surface zones emerged as the primary contributors to elevated SUHI intensity, driven by enhanced solar absorption and limited moisture availability. Vegetated and built-up LCZs displayed intermediate thermal behavior, reflecting the combined influences of surface materials, vegetation cover, and urban forms. Spatial analyses further identified persistent thermal hotspots and coldspots, strongly regulated by underlying LCZ characteristics. The geographically weighted random forest approach revealed spatially varying controls on urban thermal extremes. Overall, the findings highlight the critical role of urban surface composition and structural configuration in modulating SUHI dynamics across South Asian cities. Our analysis provide new insights into the spatiotemporal behavior of urban thermal patterns under extreme heat conditions and offers a robust scientific basis for climate-responsive urban planning and heat-mitigation strategies.


How to cite: Pandey, A. and Banerjee, T.: Diurnal Surface Urban Heat Island Variability Across Local Climate Zones in South Asian Cities, EGU General Assembly 2026, Vienna, Austria, 3–8 May 2026, EGU26-16140, https://doi.org/10.5194/egusphere-egu26-16140, 2026.

EGU26-16717 | Orals | BG10.12 | Highlight

On the role of urban trees in reducing building energy consumption  

Simone Fatichi and Naika Meili

Urban greening is a primary strategy for mitigating the Urban Heat Island (UHI) effect, yet quantifying its impact on building energy consumption remains challenging due to the complex reciprocal feedbacks between the urban microclimate and building systems. This study investigates the influence of urban trees on air-conditioning (AC) energy demand across seven climatically diverse cities (Riyadh, Phoenix, Dubai, New Delhi, Singapore, Lagos, and Tokyo) during the hot season. We employ a coupled urban ecohydrological and building energy model (Urban Tethys-Chloris - BEM) to simulate varying urban densities, tree cover scenarios, and plant physiological properties. Our analysis isolates the relative contributions of shading, temperature reduction, and humidity alterations on AC loads. Results indicate that well-watered trees yield the highest average summer AC reduction (-17%) in hot-dry climates, driven predominantly by shading. In humid climates, AC demand decreased by 6% to 9%; however, vegetation-induced humidity increased dehumidification loads, particularly under high ventilation rates. In these regions, optimal energy savings were achieved at 40% tree cover. These findings provide critical insights for tailoring urban greening strategies aimed at minimizing AC energy demand to specific regional climates.

How to cite: Fatichi, S. and Meili, N.: On the role of urban trees in reducing building energy consumption , EGU General Assembly 2026, Vienna, Austria, 3–8 May 2026, EGU26-16717, https://doi.org/10.5194/egusphere-egu26-16717, 2026.

EGU26-16832 | ECS | Orals | BG10.12

Urban thermal variability from satellite and ground observations: a case study over Valencia (Spain) 

Lluís Pérez-Planells, Sara Gavilà-Lloret, Jose Antonio Valiente, and Samira Khodayar

As world mean temperature arises, the Urban Heat Island (UHI) phenomenon is intensifying in most cities worldwide and is frequently exacerbated by heatwave events. It directly affects citizens’ health, thermal comfort and daily activities. A detailed understanding of the spatial and temporal variability of the UHI is therefore increasingly necessary for urban planning and the development of heat mitigation strategies. UHI intensity is commonly evaluated using localized air temperature observations, which often provide limited spatial coverage of the urban area in the absence of a sufficiently extensive sensor network. In this context, thermal infrared (TIR) remote sensing data with high spatial and temporal resolution are considered as a valuable tool for assessing the urban thermal environment. Several studies have used satellite data to investigate Surface Urban Heat Island (SUHI) and to analyse urban thermal behaviour. However, the accuracy of satellite-derived measurements depends on observation geometry and the properties of surface endmembers within the satellite field of view, and these measurements can differ substantially from near-surface air temperature observations. Since the relationship between surface and near-surface temperatures remains insufficiently determined, it is essential to investigate the link between both variables to enhance the use of satellite data in urban climate studies.

In this work, the thermal variability of land surface temperature (LST) derived from Landsat 8 and 9 (30 m resampled spatial resolution) over the city of Valencia (Spain) is compared with near-surface air temperature observations from the VITUclim thermal sensor network. The VITUclim network comprises more than 80 thermohydrometer sensors distributed across the urban area of Valencia and represents one of the densest urban thermal monitoring networks in Europe. Sensors are installed at 3 m above ground level following a systematic deployment strategy to ensure observational consistency. This study represents the first application of VITUclim data for urban climate studies. Results reveal notable discrepancies between LST and air temperature, reaching up to 10 K during daytime conditions. Further analyses will be conducted to improve the understanding of the relationship between these two variables in the study area.

How to cite: Pérez-Planells, L., Gavilà-Lloret, S., Valiente, J. A., and Khodayar, S.: Urban thermal variability from satellite and ground observations: a case study over Valencia (Spain), EGU General Assembly 2026, Vienna, Austria, 3–8 May 2026, EGU26-16832, https://doi.org/10.5194/egusphere-egu26-16832, 2026.

EGU26-16879 | ECS | Posters on site | BG10.12

Quantifying Causal Drivers of Urban Heat through Geospatial Analytics: Evidence from Three East African Cities 

Gerverse Kamukama Ebaju and Fangmin Zhang

Rapid urbanization in East Africa profoundly transforms landscapes, yet a critical understanding of the causal mechanisms behind associated land surface warming remains limited. This study quantifies the spatiotemporal dynamics and causal drivers of urban expansion and its thermal impacts in three East African cities; Wakiso-Kampala (Uganda), Nairobi (Kenya), and Bujumbura (Burundi) from 1995 to 2024. Using Landsat imagery, we derived land use/land cover (LULC), Land Surface Temperature (LST), the Normalized Difference Vegetation Index (NDVI), and the Normalized Difference Built-up Index (NDBI). A Land Cover Thermal Impact (LCTI) metric was introduced to quantify per-unit-area warming contributions, while advanced computational methods Convergent Cross Mapping (CCM, with causal strength measured by ρ) and its spatial extension, Geographical CCM (GCCM) were applied to distinguish causal links from mere correlation, moving beyond traditional statistical approaches. Results show built-up areas tripled in Wakiso-Kampala and Nairobi and quadrupled in Bujumbura, displacing 35-80% of natural vegetation and croplands. This expansion drove a mean LST increase of 5.1°C, 3.3°C, and 2.7°C, respectively. The LCTI revealed that water bodies provided the most efficient per-unit-area cooling in Wakiso-Kampala (LCTI = -1.49 °C km⁻²) and Bujumbura, while forest gains and bare-land conversion were the primary cooling mechanisms in Nairobi. Crucially, causal analysis revealed an asymmetric relationship: NDBI consistently acted as a driver of LST (ρ up to 0.77), while NDVI exerted a cooling causal influence (ρ down to -0.57). These findings confirm that urban expansion and vegetation loss are fundamental, causal drivers of rising surface temperatures. Our geospatial analytics framework demonstrates how data-driven causal inference can inform climate adaptation strategies in rapidly urbanizing regions. The spatial mapping of causal relationships provides actionable insights for urban planners to prioritize locations for blue-green infrastructure expansion, optimize nature-based cooling interventions, and develop targeted heat mitigation strategies that address the specific thermal dynamics of East African cities.

Keywords: Urban Heat Island, Geospatial Analytics, Causal Analysis, Nature-based Solutions, Climate Adaptation, East Africa

How to cite: Ebaju, G. K. and Zhang, F.: Quantifying Causal Drivers of Urban Heat through Geospatial Analytics: Evidence from Three East African Cities, EGU General Assembly 2026, Vienna, Austria, 3–8 May 2026, EGU26-16879, https://doi.org/10.5194/egusphere-egu26-16879, 2026.

EGU26-16909 | Posters on site | BG10.12

Numerical Modeling of the Urban Heat Island of Almaty Using the WRF Model 

Tatyana Dedova and Kairat Bostanbekov

This study presents the results of numerical modeling of the urban heat island (UHI) of Almaty using the Weather Research and Forecasting (WRF) model adapted to local climate zones (LCZ). The simulations were performed for a period characterized by pronounced anticyclonic conditions and, consequently, unfavorable atmospheric ventilation.
To assess model performance, verification was carried out using data from ground-based meteorological stations and satellite observations. The results demonstrate that WRF adequately reproduces the diurnal temperature variation and weak wind regime within the urban agglomeration. The model successfully simulated the dynamics of inversion layers and local circulations, which play a key role in the development of stagnation conditions.
The UHI was analyzed using the “virtual rural landscape” approach, in which the thermal field was calculated as the difference between scenarios with and without urban development. The modeling results show that the maximum UHI intensity occurs under nighttime conditions in the flat northwestern part of the city. Daytime UHI is characterized by lower intensity but a larger spatial extent compared to nighttime conditions. This pattern is explained by nocturnal katabatic flows of cold air from the mountains in the southern part of the city, which reduce the UHI intensity.
A joint analysis of the UHI and wind fields at different times indicates that wind speeds exceeding 2 m/s lead to the transport of thermal pollution. The configuration of the heat island reveals that at night, katabatic flows displace warm air from the southern part of the city, while in the northern part it is captured by a zonal wind that bypasses the mountain range and blows in a northeasterly direction. During daytime, heat transport occurs toward the southeast, resulting in the advection of heat emitted by surrounding settlements into the urban area and toward the mountainous regions.
The performed simulations demonstrate that the formation and evolution of the urban heat island in Almaty strongly depend on the time of day and the wind regime. The WRF model has proven to be an effective tool for analyzing urban microclimatic conditions and can be used in the development of adaptation strategies and air quality management, taking into account regional and local meteorological conditions.

How to cite: Dedova, T. and Bostanbekov, K.: Numerical Modeling of the Urban Heat Island of Almaty Using the WRF Model, EGU General Assembly 2026, Vienna, Austria, 3–8 May 2026, EGU26-16909, https://doi.org/10.5194/egusphere-egu26-16909, 2026.

EGU26-17541 | Posters on site | BG10.12

Spatiotemporal Variability of the Urban Heat Island of Almaty Based on Satellite Monitoring Data 

Larissa Balakay and Oxana Kuznetsova

The urban heat island (UHI) effect represents a significant environmental challenge for cities located in regions with complex topography and a continental climate, such as Almaty. This study analyzes the spatiotemporal variability of the urban heat island of Almaty using satellite observations and geographic information system (GIS) analysis methods.
Land surface temperature fields were derived from VIIRS (daytime and nighttime observations), MODIS, and Landsat satellite data in the thermal infrared range. Satellite data processing was performed using cloud-based technologies within the Google Earth Engine platform, enabling a consistent analysis of monthly, seasonal, and diurnal characteristics, as well as a long-term analysis based on MODIS data. To enhance the robustness of the results, temperature fields were normalized relative to two reference cold areas located within urban green zones, allowing the identification of relative thermal anomalies across the urban area.
The results indicate pronounced spatial heterogeneity of the urban heat island, characterized by persistent high-temperature zones associated with dense urban development, industrial areas, and extensive impervious surfaces. Park areas, river corridors, and mountainous regions form stable low-temperature zones. Despite its limited temporal resolution, Landsat data enable detailed identification of local thermal anomalies, while VIIRS and MODIS data provide reliable representation of the overall UHI structure and its seasonal evolution.
The identified spatiotemporal patterns provide a basis for further analysis of the relationship between the urban heat island, synoptic conditions, and urban morphology, and may also be used as input data for numerical modeling and the development of adaptation strategies aimed at improving the urban climate of Almaty.

How to cite: Balakay, L. and Kuznetsova, O.: Spatiotemporal Variability of the Urban Heat Island of Almaty Based on Satellite Monitoring Data, EGU General Assembly 2026, Vienna, Austria, 3–8 May 2026, EGU26-17541, https://doi.org/10.5194/egusphere-egu26-17541, 2026.

EGU26-17781 | ECS | Orals | BG10.12

High-resolution multi-sensor fusion for urban temperature downscaling: integrating physical covariates and stochastic extremes for health impact assessment 

Sven Berendsen, Xueqin Li, Chuleekorn Tanathitikorn, Steve Blenkinsop, Phil James, Anil Namdeo, and Justin Sheffield

Under the impact of ongoing climate change, urban environments exhibit warming rates significantly exceeding those of surrounding rural areas. Assessing the resulting impacts on human health requires high-resolution data that current Earth Observation (EO) products struggle to provide. We address the inherent trade-off between temporal frequency and spatial detail by integrating a multisensor data suite, comprising SEVIRI (high temporal), MODIS (daily), and Landsat LST (high spatial) EO data, weather reanalysis and dense urban station network data, to train a machine learning-based downscaling framework. 

Our methodology generates city-wide temperature maps at 100m resolution every hour. To capture the complex physical drivers of the urban canopy layer, the model incorporates a diverse array of covariates, including land cover, spectral indices, sky view factor, and building morphology. The model also accounts for energy balance variables such as anthropogenic heat emissions and utilizes a precipitation proxy to simulate the effects of evaporative cooling on surface temperatures. 

We validate this framework across the city of Newcastle (UK), utilizing the high-density Urban Observatory sensor network to train and benchmark model accuracy against ground-truth data. We further evaluate the model’s transferability through case studies in the cities of London (high-density metropolitan landscape) and Southampton (coastal-urban interactions), representing environments with sparse ground networks. 

A key aspect is the generation of design heatwaves and cold snaps. Rather than relying solely on historical records, we employ stochastic modeling to produce extreme weather series that allow for the high-resolution quantification of the full spectrum of thermal risk, including unprecedented events. These outputs serve as the primary forcing data for indoor thermal simulations and population exposure models within the ETHOS project. Ultimately, this framework provides clinicians and local authorities with the precise spatial risk information needed to protect vulnerable populations during thermal extremes. 

How to cite: Berendsen, S., Li, X., Tanathitikorn, C., Blenkinsop, S., James, P., Namdeo, A., and Sheffield, J.: High-resolution multi-sensor fusion for urban temperature downscaling: integrating physical covariates and stochastic extremes for health impact assessment, EGU General Assembly 2026, Vienna, Austria, 3–8 May 2026, EGU26-17781, https://doi.org/10.5194/egusphere-egu26-17781, 2026.

EGU26-18535 | Orals | BG10.12 | Highlight

Simulation of the cooling effect of a lightweight vegetated structure 

Gabriele Manoli, Aldo Brandi, Julie Varupenne, Seiichi Suzuki, Marc Vonlanthen, and Mark Pauly

The prevalence of built structures in urban areas has led to the emergence of heat islands, intensifying the impact of climate change. Hence, introducing vegetation in cities is key to regulate urban micro-climates, reduce heat-risks, and improve the physical and mental well-being of urban residents. Green infrastructures can help mitigate urban overheating via two main mechanisms: (1) direct shading, which reduces the amount of solar radiation absorbed by the urban surfaces, and (2) evapotranspiration, which regulates the partitioning of latent and sensible heat fluxes within the urban fabric. Yet, planting and managing vegetation in cities face several challenges, from limited space, to plant damages, and conflicts with other infrastructure (e.g., pipes, cables).

To address these problems, we investigate the potential cooling effect of an innovative lightweight structure (bamX) made of bamboo canes weaved together and vegetated with hops. We use the PALM model to run high resolution (0.5 m) computational fluid dynamics simulations in idealized conditions and for different stages of plant maturity. Preliminary results show that the greatest cooling potential of these lightweight vegetated structures is associated with shading and depends on the leaf area density of vegetation. Evapotranspiration processes, despite slightly increasing relative and specific humidity locally, do not significantly alter human thermal comfort within and around the structure.

How to cite: Manoli, G., Brandi, A., Varupenne, J., Suzuki, S., Vonlanthen, M., and Pauly, M.: Simulation of the cooling effect of a lightweight vegetated structure, EGU General Assembly 2026, Vienna, Austria, 3–8 May 2026, EGU26-18535, https://doi.org/10.5194/egusphere-egu26-18535, 2026.

EGU26-18851 | ECS | Orals | BG10.12

Urban Resilience: Framework and Policy for Heat Mitigation by addressing UHI Effects, Lucknow 

Aditi Yadav, Saikat Kumar Paul, and Diya Bala

Lucknow's urban footprint has expanded significantly in a relatively short time. The city's built-up area essentially doubled, leaping from approximately 521 km² in 2014 to over 1,041 km² by 2019. This surge was fueled by both urban sprawl and a rising population. From 2002 to 2014, the city's urban area experienced a 39% increase, while the average temperature rose by 0.75 °C. This swift transformation has altered land use patterns, reduced green and permeable spaces, and intensified the Urban Heat Island (UHI) effect across the city. Heat stress has extended outside the downtown area. Increased surface temperatures are recorded at multiple locations along the Gomti River, with industrial areas routinely displaying the highest measurements.

This study presents a planning-centric methodology that utilizes spatial analysis, focused modelling, and localized observations to tackle urban heat in Lucknow. Multi-temporal satellite data were employed to derive land surface temperature and relevant indices of land-use change, vegetation cover, and built-up area density. A model based on U-Net architecture was developed to refine the identification of built-up and surface material patterns, while key morphological parameters including building height, density, shape complexity, and contiguity were incorporated to capture the influence of urban form on thermal behavior. These inputs enabled the delineation of priority heat zones across the city.

Site investigations and preliminary surveys revealed unique thermal profiles associated with pavement materials, surface treatments, and urban patterns, especially in the historic regions of Old Lucknow. Industrial regions that encounter heightened solar radiation and substantial exposure require mitigation strategies. These initiatives should concentrate on materials and energy-positive solutions while simultaneously reducing adverse environmental effects. This study presents a zonal heat mitigation framework, which classifies urban areas based on land use, material characteristics, and morphological attributes, thus enabling context-specific planning and design approaches.

By linking urban climate assessment with statutory planning instruments, the proposed framework demonstrates a transferable approach for integrating heat resilience into urban planning in rapidly urbanising cities of the Global South.


Keywords: Urban Heat Island (UHI); Urban Resilience; Land Surface Temperature; Microclimate Simulation; Urban Greening; Solar Potential; Heat Mitigation Policy Framework

How to cite: Yadav, A., Paul, S. K., and Bala, D.: Urban Resilience: Framework and Policy for Heat Mitigation by addressing UHI Effects, Lucknow, EGU General Assembly 2026, Vienna, Austria, 3–8 May 2026, EGU26-18851, https://doi.org/10.5194/egusphere-egu26-18851, 2026.

EGU26-18880 | Orals | BG10.12

Rainwater-irrigated greenroofs as climate change adaptation in urban areas 

Oleg Panferov, Elke Hietel, Ute Rössner, Jonas Alef, and Joseph Newton

Urban greening plays an important role as a tool for climate change mitigation, adaptation and environmental protection. An extensive green roof is one the most favorite methods of urban greening as it does not require additional area and intensive maintenance and is also efficient as a rain water retention during extreme events and for the deposition of particulate matter. However, it is not very efficient for cooling at pedestrian level, for CO2 sequestration and biodiversity. The suggested solution is to convert the extensive green roofs into semi-intensive using automatic solar-powered irrigation system with collected rainwater. The model green roof was built and experiment was carried out starting in 2020. The roof was irrigated during the summer months with 2 mm day-1. The green roof effects on microclimate, WBGT index, water balance, particulate matter binding, greenhouse gas fluxes and biodiversity are measured continuously and compared to a reference area of a parking lot. In addition albedo and surface temperature measurements were carried out using manual instruments and different drone-borne thermal cameras. The results show higher albedo of irrigated roof than parking lot. The microclimatic effects of semi-intensive roof on the microclimate are quite variable. The surface temperatures differences within the roof are more extreme than on the parking lot. However, the air temperature extremes are lower. The air temperature reduction comparing to parking lot is more pronounced during the night time and under calm conditions, with minimal external influences. During the daytime the warming effects of the roof are well-expressed depending on the weather conditions. The effects of different plant species and substrate to total cooling or warming of green roof were also quantified.

How to cite: Panferov, O., Hietel, E., Rössner, U., Alef, J., and Newton, J.: Rainwater-irrigated greenroofs as climate change adaptation in urban areas, EGU General Assembly 2026, Vienna, Austria, 3–8 May 2026, EGU26-18880, https://doi.org/10.5194/egusphere-egu26-18880, 2026.

EGU26-19642 | Posters on site | BG10.12

Combined effects of climate and urban morphology on global urban heat 

Siwoo Lee, Cheolhee Yoo, Bokyung Son, Dongjin Cho, Jungho Im, and Tirthankar Chakraborty

Urban structures are essential for human habitation, yet they profoundly alter surface energy balances, with significant environmental and health implications. Although urban heat island phenomenon is well recognized, the thermal influence of surrounding urban structures and its interaction with climate remain insufficiently understood. This study presents a global analytical framework that quantifies the thermal impact of surrounding structures, analyzes the combined effects of climate and urban morphology, and projects future thermal trajectories across 967 cities worldwide. By integrating climate variables and local climate zones with machine learning, we assess the thermal impacts of surrounding urban structures. Through a comprehensive weighting of the constituent thermal influences, we introduce the city-scale thermal impact of surrounding urban structures (TBE), revealing that climate and morphology jointly contribute to global urban heat. Across climate zones, cities exhibiting high daytime TBE are characterized by low- and mid-rise built form, whereas sparsely built types prevail in cities with low TBE. These patterns persist at night. Future projections show that the spatial patterns of TBE will be distinct from current conditions, with combined climate-structure effects will dominate urban thermal environment in almost half of global cities. These projections also reveal significant regional disparities between the Global South and the Global North. Our findings highlight the role of combined effects in shaping present and future urban heat, informing the need for adaptation strategies tailored to individual cities.

How to cite: Lee, S., Yoo, C., Son, B., Cho, D., Im, J., and Chakraborty, T.: Combined effects of climate and urban morphology on global urban heat, EGU General Assembly 2026, Vienna, Austria, 3–8 May 2026, EGU26-19642, https://doi.org/10.5194/egusphere-egu26-19642, 2026.

Urban air quality and heat island effect are major concerns for human health and thermal comfort, particularly under the increasing trend of extreme heat events. But traditional networks of stationary monitoring stations provide limited spatial representativeness of intra-urban microclimate variability at the scales where citizens experience thermal stress and are exposed to air pollution.

To address this observational gap, we have developed a mobile monitoring system integrating a number of compact sensors mounted on an electrical bicycle platform. This setup enables high-density geolocated sampling along pedestrian areas, walkways and bike lanes -where citizens are truly exposed to the urban environment- while minimizing perturbations to the environmental conditions. It also presents advantages over other mobile platforms, such as UAVs or electric vehicles, in terms of operation permissions, accessibility to pedestrian areas, and time endurance.

The system simultaneously records: (i) meteorological variables (air temperature, relative humidity, wind speed and direction) (ii) radiative components including, sun/shade discrimination, shortwave hemispherical irradiance (sunlight), directional radiometric temperature (from six directions), enabling estimation of the standard Wet Bulb Globe Temperature (WBGT) for outdoor thermal comfort assessment; and (iii) environmental pollution indicators (suspended black carbon, PM2.5, PM10 and ambient noise). The data is geolocated by GNSS and recorded by a datalogger every second, providing approximately 3m spatial resolution at 10km/h cycling speed.

The mobile monitoring system has been tested during a summer heat wave in Valencia, Spain, performing mobile transects at solar noon and after sunset to capture differential cooling dynamics across urban morphologies. The 20 km routes were designed to pass through different types of neighbourhoods and densities of green-blue spaces. 

The geolocated measurements are integrated within a Geographic Information System (GIS) framework together with several layers of geospatial city information, like distribution of buildings, pavement types, urban green and blue spaces, individual tree inventory, vegetation density indices from satellite imagery, and building height (DEM). This set of multisource data enables advanced geospatial analytics combining spatial statistical and deep-learning to: (i) generate informative maps of thermal comfort and air quality at high spatial resolution; (ii)  identify urban hot and cold spots; and (iii) quantitatively evaluate the effectiveness of different nature-based solutions (NbS) for UHI mitigation.

This novel mobile monitoring approach, delivering unprecedented spatial density of CUHI observations combined with multi-source geospatial data, provides a scalable methodology for microscale air quality mapping and evaluating urban planning strategies and nature-based cooling interventions.

How to cite: Alonso-Chorda, L., Torrenti-Salom, F., and Calatayud-Lorente, V.: Microscale Urban Heat Island and Air Quality Assessment Through Multi-sensor E-Bike Monitoring: Integrating High-Density Observations with Geospatial Analytics, EGU General Assembly 2026, Vienna, Austria, 3–8 May 2026, EGU26-19719, https://doi.org/10.5194/egusphere-egu26-19719, 2026.

EGU26-19722 | ECS | Posters on site | BG10.12

Diurnal Microclimate Patterns in Munich’s Public Squares: The Role of Vegetation Complexity 

Antonia Hostlowsky, Azharul Islam, Nayanesh Pattnaik, Andreas Hanzl, and Stephan Pauleit

With climate change, the frequency of extreme heat days is projected to increase, highlighting the need for climate-resilient urban design. Nature-based solutions, such as urban forestry, can help mitigate heat-related stress in cities.
Over the past few years, studies have investigated the role that vegetation complexity plays in various climatic contexts, including urban forests. However, uncertainties remain regarding the effect of vegetation complexity on the microclimate of urban public squares. Thus, we investigate the relationship between the diurnal microclimate of urban public squares and the complexity of vegetation. We define the latter as the vertical arrangement of different vegetation layers, such as shrubs and trees.
We captured the vegetation structure of six public squares in Munich using terrestrial laser scanning (TLS) during the summer of 2025. The squares were selected based on qualitative criteria indicating differences in vertical structure, specifically whether they contained a small hedge or tall understorey plants. We then used the resulting point clouds to understand how the complexity of vegetation in public squares can be quantified. We further measured several weather parameters on-site during July and August for the six squares, as well as on two non-vegetated public squares as controls.
The preliminary analysis of the weather data shows differences between the control group and the squares with more complex vegetation structure. The latter group shows lower maximum temperatures, higher humidity, and lower wind speed. Further, the first metrics calculated from the point cloud indicate quantifiable differences between the squares.
The final results will provide insights into the potential benefits and drawbacks of complex vegetation structures in creating climate-resilient public squares.

How to cite: Hostlowsky, A., Islam, A., Pattnaik, N., Hanzl, A., and Pauleit, S.: Diurnal Microclimate Patterns in Munich’s Public Squares: The Role of Vegetation Complexity, EGU General Assembly 2026, Vienna, Austria, 3–8 May 2026, EGU26-19722, https://doi.org/10.5194/egusphere-egu26-19722, 2026.

EGU26-20485 | Posters on site | BG10.12

Urban trees as heat mitigator-Investigating physiological and anatomical  traits across street and park microhabitats 

Aviad Dekel, Einat Shemesh-Mayer, and Yakir Preisler

Urban areas experience higher temperatures than their rural surroundings due to the Urban Heat Island (UHI) effect, primarily caused by heat-absorbing surfaces and human activities. Urban forests help mitigate UHI through shading and transpiration. However, street trees in cities face high abiotic stress, such as compacted soil and increased pollution exposure. Their effectiveness depends on their suitability to the specific geoclimatic and microhabitat conditions where they are planted.

In this study we examine the rate of adaptability of four local urban tree species as expressed by their anatomical and physiological adjustments. We ask how stressed are street trees and if there are certain tree species that exhibit lower stress and greater suitability for urban street environments.

Surprisingly, our initial results suggest that despite the more challenging conditions of street trees, their stress levels are not as expected as expressed by key physiological and anatomical traits - A promising path for further research.

How to cite: Dekel, A., Shemesh-Mayer, E., and Preisler, Y.: Urban trees as heat mitigator-Investigating physiological and anatomical  traits across street and park microhabitats, EGU General Assembly 2026, Vienna, Austria, 3–8 May 2026, EGU26-20485, https://doi.org/10.5194/egusphere-egu26-20485, 2026.

EGU26-20703 | Orals | BG10.12

Heat and the City: How urban agglomerations devise adaptation measures to protect human health 

Umberto Fracassi, Walter Leal Filho, Maria Alzira Pimenta Dinis, and Gustavo J. Nagy

Over the last few years, climate change has intensified heat effects across broad swaths globally. In 2024, for the first time, global temperatures remained at least 1.5°C above the pre-industrial average for one year. In 2025, persistent heat caused record-setting European heatwaves, which have been recurrent since 2022. The spatial distribution of such effects clearly includes areas where human life is concentrated: cities, megacities, and urban agglomerations at large, rendering cities dangerously hotter and necessitating urgent, specific adaptation measures. We examine the increasing trend in summer temperatures in cities, a key driver of environmental and health issues, to identify the major risks posed by extreme heat, particularly for vulnerable communities. We also evaluate how well current measures across cities worldwide address this growing, ubiquitous issue, with a focus on European cities.

We analyse and compare specific measures and strategies used across cities worldwide to address rising urban heat. We review real-world examples from 2023 and 2024 to examine how cities (such as those in the C40 alliance) are coping with extreme temperatures, employing solutions ranging from urban greening to early warning systems, from water management strategies to population sheltering. We find that, while some cities have made considerable progress in enhancing their heat resilience, a pressing need remains for more refined measures to address urban heat effectively and strategically protect human health. Metropolitan areas across Europe and expanding megacities worldwide thus need comprehensive strategies and shared best practices to manage summer heatwaves and adapt to the impacts of a changing climate that poses novel, compounded hazards to human health.

We argue that public urban spaces are central to climate adaptation in cities because they are highly vulnerable to extreme heat. However, those very spaces can also be pivotal for implementing innovative solutions to improve citizens' well-being. We thus underscore the urgency for cities to adopt adaptive strategies to cope with rising temperatures, given the foreseeable trajectory of heatwaves through time. In analysing the pressing global urban heat challenge, we urge policymakers and urban planners to prioritise sustainable and effective interventions demanded by populations across the complex spectrum of contemporary societies and the compounded hazards that these face.

How to cite: Fracassi, U., Leal Filho, W., Dinis, M. A. P., and Nagy, G. J.: Heat and the City: How urban agglomerations devise adaptation measures to protect human health, EGU General Assembly 2026, Vienna, Austria, 3–8 May 2026, EGU26-20703, https://doi.org/10.5194/egusphere-egu26-20703, 2026.

EGU26-20874 | ECS | Orals | BG10.12

Is shade all there is to it? Quantifying the contribution of tree transpiration to cooling cities 

Ron Linder, Yakir Preisler, and Daniel Orenstein

Tree planting is a leading strategy for mitigating the Urban Heat Island (UHI) effect. However, current urban climate models often conflate the physiological transpiration cooling of trees with their physical shading effects. To isolate and quantify this specific "biological bonus," we introduced the “Living Control” framework.

In a controlled field experiment on mature trees in a Mediterranean climate, we applied chemical anti-transpirants to inhibit stomatal conductance (gs) and transpiration (E), while maintaining identical canopy geometry and aerodynamic properties. This effectively decoupled latent heat flux from radiative shading.

Our results demonstrate the efficacy of the manipulation: the application of auxinic herbicides significantly reduced gs by 32% and E by 23% compared to untreated controls. This suppression of physiological activity led to a statistically significant rise in leaf surface temperature. However, this distinct physiological warming revealed an intriguing contrast: it did not translate into significant differences in human thermal comfort metrics, specifically Mean Radiant Temperature (MRT) and the Universal Thermal Climate Index (UTCI).

These findings challenge the prevailing assumption that canopy cooling linearly improves pedestrian comfort. They suggest that in water-limited environments, the primary contribution of trees to thermal comfort is static shading rather than active transpiration. This study highlights the complexity of microclimatic interactions and provides a vital baseline for future experiments evaluating Nature-Based Solutions (NBS) and water-wise strategies for urban heat mitigation.


How to cite: Linder, R., Preisler, Y., and Orenstein, D.: Is shade all there is to it? Quantifying the contribution of tree transpiration to cooling cities, EGU General Assembly 2026, Vienna, Austria, 3–8 May 2026, EGU26-20874, https://doi.org/10.5194/egusphere-egu26-20874, 2026.

EGU26-21145 | ECS | Posters on site | BG10.12

Urban Form and Climate Resilience: Understanding the Heat Island of Patras, Greece  

Ioannis Vafeiadis, Christos Pantazis, Panagiotis Nastos, and Christoforos Pappas

The rapid expansion of cities, combined with the increased frequency and intensity of droughts and heatwaves in the Mediterranean region, have made Urban Heat Islands (UHI) widespread. Here, focusing on the city of Patras, the third largest city of Greece, we analyzed the spatiotemporal patterns of urban land surface temperature during summertime, and we quantified the relationships between temperature and geomorphological (e.g., elevation, slope) and urban (e.g., building height, road network density) features. The delineation of UHI was maded using Land Surface Temperature (LST) data from 2018 to 2025 based on the NASA’s ECOSTRESS mission. This dataset provides high-resolution (70 x 70m) thermal infrared imagery with diurnal coverage, thanks to its irregular temporal sampling. In-situ air temperature data available from a network of urban meteorological stations were also used to verify the spatiotemporal patterns of temperature variability. At the daily time scale, no clear links were found between daily summer-time temperature and urban and topographic features. However, when data were analyzed at the diurnal time scale, clear dependences between hourly temperature variability and urban features were revealed. More specifically, building and road density, as well building height, exerted low correlation with temperature during morning hours, with this cross-correlation becoming positive during late afternoon and evening hours, i.e., areas with denser urban fabric showed higher evening temperature values. Regarding green spaces, as quantified with the values of the NDVI index, the correlation with hourly temperature was low during daytime, yet, this cross-correlation became significantly negative during nighttime, i.e., areas with higher values of NDVI showed a rapid decrease in nighttime temperature values. The obtained results link the spatiotemporal variability of land surface temperature over the city of Patras with key urban and topographic features and provide valuable insights towards targeted interventions enhancing the overall resilience of the city to future climatic stressors.

How to cite: Vafeiadis, I., Pantazis, C., Nastos, P., and Pappas, C.: Urban Form and Climate Resilience: Understanding the Heat Island of Patras, Greece , EGU General Assembly 2026, Vienna, Austria, 3–8 May 2026, EGU26-21145, https://doi.org/10.5194/egusphere-egu26-21145, 2026.

AS5 – Methods and Techniques

EGU26-719 | ECS | Posters on site | AS5.1

Does AI Learn Physics? Assessing the Physical Fidelity of Data-Driven Tropical Cyclone Forecasts 

Pankaj Sahu, Sukumaran Sandeep, and Hariprasad Kodamana

Machine Learning Weather Prediction (MLWP) models—specifically GraphCast, PanguWeather, Aurora, and FourCastNet—show great promise for competing with physics-based Numerical Weather Prediction (NWP) models by providing global forecasts at a low computational cost. However, a thorough physical evaluation is needed before they can be used in place of NWP models. Our comprehensive study comparing these four leading MLWP models with NWP and observations in Tropical Cyclone (TC) forecasting across all tropical basins uncovers a significant duality: MLWP models are very good at predicting the TC track (with an average error of less than 200 km at a 96-hour lead time) because they accurately capture the underlying dynamics. However, they always underestimate the maximum sustained wind speeds (intensity). This systematic low intensity bias is directly related to biases that come from their ERA5 training data and are made worse by penalties. Even with this limitation, the models accurately depict important physical structures, such as low-level convergence and the vertical warm core, while also keeping different physical fields consistent. This suggests that the models learn how different dynamical and thermodynamical processes are related to each other in a way that makes sense. Ultimately, although MLWPs, especially Aurora, exhibit an implicit comprehension of TC dynamics, their enduring intensity bias requires additional refinement prior to their complete substitution of NWP models.

How to cite: Sahu, P., Sandeep, S., and Kodamana, H.: Does AI Learn Physics? Assessing the Physical Fidelity of Data-Driven Tropical Cyclone Forecasts, EGU General Assembly 2026, Vienna, Austria, 3–8 May 2026, EGU26-719, https://doi.org/10.5194/egusphere-egu26-719, 2026.

EGU26-2452 | ECS | Posters on site | AS5.1

Climate Grey-Box Flow Matching for Robust Climate and Weather Prediction 

Gurjeet Singh, Frantzeska Lavda, and Alexandros Kalousis
Deep generative models such as flow matching and diffusion models have great potential for learning complex dynamical systems, but they typically act as black boxes, neglecting underlying physical structure. In contrast, physics-based models governed by ODEs and PDEs provide interpretability and physical consistency, yet are often incomplete due to unresolved processes, missing source terms, or uncertain parameterisations. Bridging these two paradigms is a central challenge in data-driven weather and climate modelling.

We propose a Climate Grey-Box Dynamics Matching framework designed for weather and climate systems, that explicitly combines existing physical models with data-driven learning to capture unresolved dynamics where known physical operators are directly embedded into the learned dynamics. Our framework learns from observational trajectories alone and operates in a simulation-free manner inspired by gradient matching and flow matching methods. By avoiding numerical solvers, it eliminates the memory overhead, computational cost, and numerical instability associated with Neural ODE–based approaches.

To capture temporal dependencies in our simulation-free method, we introduce a lightweight attention-based temporal encoder that aggregates short-term history in a physically consistent manner. This design enables the model to represent unresolved dynamics without increasing computational complexity, making it well-suited for high-dimensional spatiotemporal climate systems. We apply this framework to weather and climate forecasting and demonstrate its effectiveness against ClimODE, a state-of-the-art solver-based grey-box model. Reformulating ClimODE as a simulation-free grey-box model reduces training complexity from Ο(L) to Ο(1), where L denotes the number of solver steps. Beyond computational gains, the simulation-free formulation yields substantial memory efficiency: training is possible on a single RTX 3060 (12 GB), whereas ClimODE requires at least 25 GB of GPU memory with a small batch size. This enables efficient training on commodity hardware and improves accessibility for large-scale climate modelling.

Experiments on weather and climate benchmarks show that the proposed method achieves improved forecast accuracy and faster convergence compared to simulation-based and fully data-driven baselines. The method demonstrates particular robustness to long horizons, as performance gains become more pronounced with extended forecast times—indicating enhanced temporal stability and resistance to error accumulation, an essential property for reliable long-range climate prediction.

How to cite: Singh, G., Lavda, F., and Kalousis, A.: Climate Grey-Box Flow Matching for Robust Climate and Weather Prediction, EGU General Assembly 2026, Vienna, Austria, 3–8 May 2026, EGU26-2452, https://doi.org/10.5194/egusphere-egu26-2452, 2026.

Artificial intelligence (AI)-based data-driven weather prediction (AIWP) models have experienced rapid progress over the last years. They achieve impressive results and demonstrate substantial improvements over state-of-the-art physics-based numerical weather prediction (NWP) models across a range of variables and evaluation metrics. However, most efforts in data-driven weather forecasting have been limited to deterministic, point-valued predictions, making it impossible to quantify forecast uncertainties, which is crucial in research and for optimal decision making in applications.

I will present recent work on uncertainty quantification (UQ) methods in the context of data-driven weather prediction. The post-hoc use of UQ methods enables the generation of skillful probabilistic weather forecasts from a state-of-the-art deterministic AIWP model [1]. Further, by subjecting the deterministic backbone of physics-based and data-driven models post hoc to the same UQ technique, and computing the in-sample mean continuous ranked probability score of the resulting forecast, we propose a new measure that enables fair and meaningful comparisons of single-valued output from AIWP and NWP models, called potential continuous ranked probability score [2].

References

[1] Bülte, C., Horat, N., Quinting, J. and Lerch, S. (2025). Uncertainty quantification for data-driven weather models. Artificial Intelligence for the Earth System, in press. DOI:10.1175/AIES-D-24-0049.1

[2] Gneiting, T., Biegert, T., Kraus, K., Walz, E.-M., Jordan, A. I., and Lerch, S. (2025). Probabilistic measures afford fair comparisons of AIWP and NWP model output. Preprint, arXiv:2506.03744. DOI:10.48550/arXiv.2506.03744

How to cite: Lerch, S.: Uncertainty quantification for data-driven weather prediction: From probabilistic forecasts to fair model comparisons, EGU General Assembly 2026, Vienna, Austria, 3–8 May 2026, EGU26-2971, https://doi.org/10.5194/egusphere-egu26-2971, 2026.

EGU26-3091 | ECS | Posters on site | AS5.1

Learning to sample unprecedented atmospheric rivers 

Tim Whittaker and Alejandro Di Luca

Atmospheric rivers (ARs) are the dominant drivers of hydrological extremes along the western coast of North America, yet the physical upper limits of their intensity remain poorly understood and weakly constrained by the short observational record. While thermodynamic amplification of ARs under climate change is well-documented, the potential for dynamical amplification driven by the wind field remains uncertain and computationally expensive to sample using conventional techniques such as large ensembles of simulations. Here, we address this sampling barrier by leveraging techniques from machine learning, specifically combining a differentiable global climate model with high-resolution regional downscaling to generate storylines of unprecedented AR events in western Canada. By formulating the event generation as an optimal control problem, we compute the gradients of the model’s output to learn minimal, physically plausible perturbations to historical initial states that maximize AR’s associated integrated vapour transport at landfall. These optimized storylines are further dynamically downscaled using a high-resolution regional climate model, producing extreme precipitation events that significantly exceed historical benchmarks. 

How to cite: Whittaker, T. and Di Luca, A.: Learning to sample unprecedented atmospheric rivers, EGU General Assembly 2026, Vienna, Austria, 3–8 May 2026, EGU26-3091, https://doi.org/10.5194/egusphere-egu26-3091, 2026.

EGU26-3927 | Posters on site | AS5.1

Few-shot learning for mid-latitude climate forecasts 

Yoo-Geun Ham, Seol-Hee Oh, and Gyuhui Kwon

Reliable prediction of climate variables and high-impact extremes in the midlatitudes is crucial for climate risk assessment, agricultural planning, water resource management, and disaster preparedness. However, conventional deep learning–based approaches for midlatitude climate prediction trained with dynamical climate models (e.g., CMIP models) can cause systematic errors in capturing the observed climate-relevant signals, ultimately limiting prediction skill. These limitations highlight the need to improve midlatitude prediction by detecting climate signals solely from the limited numbers of reliable observational climate data. To address the challenge of limited training samples, we employ the model-agnostic meta-learning (MAML) algorithm along with domain-knowledge-based data augmentation to predict mid-latitude winter temperatures. The proposed data augmentation is purely based on the observed data by defining the labels using large-scale climate variabilities associated with the target variable. The MAML-applied convolutional neural network (CNN) demonstrates superior correlation skills for winter temperature anomalies compared to a reference model (i.e., the CNN without MAML) and state-of-the-art dynamical forecast models across all target lead months during the boreal winter seasons. Moreover, occlusion sensitivity results reveal that the MAML model better captures the physical precursors that influence mid-latitude winter temperatures, resulting in more accurate predictions.

How to cite: Ham, Y.-G., Oh, S.-H., and Kwon, G.: Few-shot learning for mid-latitude climate forecasts, EGU General Assembly 2026, Vienna, Austria, 3–8 May 2026, EGU26-3927, https://doi.org/10.5194/egusphere-egu26-3927, 2026.

EGU26-4301 * | Orals | AS5.1 | Highlight

Numerical models outperform AI weather forecasts of record-breaking extremes 

Zhongwei Zhang, Erich Fischer, Jakob Zscheischler, and Sebastian Engelke

Artificial intelligence (AI)-based models are revolutionizing weather forecasting and have surpassed leading numerical weather prediction systems on various benchmark tasks. However, their ability to extrapolate and reliably forecast unprecedented extreme events remains unclear. Here, we show that for record-breaking weather extremes, the numerical model High RESolution forecast (HRES) from the European Centre for Medium-Range Weather Forecasts still consistently outperforms state-of-the-art AI models GraphCast, GraphCast operational, Pangu-Weather, Pangu-Weather operational, and Fuxi. We demonstrate that forecast errors in AI models are consistently larger for record-breaking heat, cold, and wind than in HRES across nearly all lead times. We further find that the examined AI models tend to underestimate both the frequency and intensity of record-breaking events, and they underpredict hot records and overestimate cold records with growing errors for larger record exceedance. Our findings underscore the current limitations of AI weather models in extrapolating beyond their training domain and in forecasting the potentially most impactful record-breaking weather events that are particularly frequent in a rapidly warming climate. Further rigorous verification and model development is needed before these models can be solely relied upon for high-stakes applications such as early warning systems and disaster management.

How to cite: Zhang, Z., Fischer, E., Zscheischler, J., and Engelke, S.: Numerical models outperform AI weather forecasts of record-breaking extremes, EGU General Assembly 2026, Vienna, Austria, 3–8 May 2026, EGU26-4301, https://doi.org/10.5194/egusphere-egu26-4301, 2026.

EGU26-5719 | ECS | Posters on site | AS5.1

An AI-based framework for high-resolution climate dataset over Italy: from historical reconstruction to an operational chain 

Ilenia Manco, Otavio Medeiros Feitosa, Mario Raffa, and Paola Mercogliano

High-resolution climate datasets are fundamental for monitoring extreme events, assessing climate variability, and supporting climate adaptation strategies. However, producing high-resolution climate reanalyses usually requires computationally expensive dynamical downscaling. As a result, near–real-time high-resolution climate services remain limited, since most downscaling products are generated retrospectively with delays of months to years (Hersbach et al., 2020; Harris et al., 2022). Recent advances in generative machine learning enable realistic fine-scale atmospheric fields that preserve spatial coherence and key statistics, including extremes (Rampal et al., 2025; Camps-Valls et al., 2025). Hybrid statistical–dynamical approaches therefore provide an efficient and physically consistent pathway for operational high-resolution dataset production (Glawion et al., 2025; Schmidt et al., 2025). This work presents the progress achieved in the development of a high-resolution climate datasets over the Italian Peninsula at 2.2 km resolution, exploiting a conditional Generative Adversarial Network (cGAN) model developed in Manco et al. (2025). The framework follows a hybrid statistical–dynamical downscaling strategy, in which ERA5 reanalysis data at 0.25° resolution are downscaled using cGANs trained against the very-high-resolution dynamical product VHR-REA_IT (Raffa et al., 2021). The system has been extended to multiple near-surface atmospheric variables, including mean, minimum, and maximum 2 m temperature, relative surface humidity, cumulative precipitation, and 10 m wind (speed and direction), the latter two representing particularly challenging targets (Fig. 1). Each variable is downscaled using a dedicated cGAN trained independently to learn the non-linear spatial relationships between coarse-resolution ERA5 predictors and high-resolution VHR-REA_IT targets, while employing a common network architecture and loss function to ensure methodological consistency. This enabled the production of a high-resolution historical dataset covering the period 1990–2024 at daily frequency, with 1990–2000 used for training. Since January 2025, the framework (Fig. 2) has been integrated into an operational chain and used to generate high-resolution fields in near real time, automatically updating the dataset as new ERA5 data become available, with an average latency of approximately six days. All data are distributed in NetCDF format through the CMCC Data Delivery System (https://dds.cmcc.it/) within the FAIR (Fast AI Reanalysis) product, with daily maps accessible via the Dataclime dashboard (https://www.dataclime.com/). Both deterministic and probabilistic configurations of the cGAN framework are presented. Results, evaluated against the dynamically downscaled fields available at the same resolution over the common historical period, show that the proposed approach robustly reproduces spatial patterns (Fig. 3), mean values, and variability across all variables. The probabilistic configuration improves uncertainty representation and shows skill in capturing both mean conditions and extremes. Overall, the framework represents a versatile and robust solution for the generation of high-resolution climate datasets in both historical and operational contexts. Remaining limitations primarily concern the representation of extreme precipitation percentiles in regions characterized by complex orography, which will be the focus of future developments.

Fig. 1 – Wind speed at 10 m for a random day.

Fig. 2 - c-GAN Training Framework

Fig. 3 – Seasonal Analysis. 2-m minimum temperature.


How to cite: Manco, I., Feitosa, O. M., Raffa, M., and Mercogliano, P.: An AI-based framework for high-resolution climate dataset over Italy: from historical reconstruction to an operational chain, EGU General Assembly 2026, Vienna, Austria, 3–8 May 2026, EGU26-5719, https://doi.org/10.5194/egusphere-egu26-5719, 2026.

EGU26-6394 | ECS | Orals | AS5.1

A review of spatially explicit climate emulators for enhancing modelling agility 

Sarah Schöngart, Lukas Gudmunsson, Chris Womack, Carl-Friedrich Schleussner, and Sonia Seneviratne

Machine-learning-based weather and climate emulators are rapidly transforming how climate information is generated and applied by enabling fast scenario exploration, large ensemble analysis, and the generation of decision-relevant climate data at scales beyond the reach of traditional climate models. Emulators are increasingly integrated into policy-relevant assessments and are expected to play a growing role in upcoming IPCC reports. Yet the field remains fragmented as task definitions and evaluation standards differ across communities, and frameworks for connecting short-term weather emulation to long-term climate projections are missing..

Here, we synthesise 77 studies on spatially explicit climate, hybrid weather-climate, and weather emulators within a unified conceptual framework, mapping inputs and outputs, methodological choices, validation practices, and computational requirements. Three structural patterns emerge. First, most climate emulators prioritise computational speed and scenario agility but offer limited output flexibility, typically generating gridded fields for a narrow set of variables. Second, the emulator landscape is fragmented: weather and hybrid weather-climate emulators form a coherent, machine-learning-driven cluster, whereas climate emulators are more heterogeneous, less connected to machine-learning advances, and validated inconsistently. Third, state-of-the-art weather emulators often rely on specialised hardware and institutional resources concentrated in a few organisations, raising questions of computational equity and “agility for whom”.

Our findings suggest that realizing genuine agility will require future research to focus on user-tailored outputs, rigorous evaluation across forcing scenarios, cross-domain methodological integration, and equitable access to computational resources. These priorities will help the field transition from methodological innovation toward policy-relevant application.

How to cite: Schöngart, S., Gudmunsson, L., Womack, C., Schleussner, C.-F., and Seneviratne, S.: A review of spatially explicit climate emulators for enhancing modelling agility, EGU General Assembly 2026, Vienna, Austria, 3–8 May 2026, EGU26-6394, https://doi.org/10.5194/egusphere-egu26-6394, 2026.

EGU26-7801 | Posters on site | AS5.1

Bridging Physics and Machine Learning to Enhance Weather Forecasting at ECCC 

Emilia Diaconescu, Jean-François Caron, Valentin Dallerit, Stéphane Gaudreault, Syed Husain, Shoyon Panday, Carlos Pereira Frontado, Leo Separovic, Christopher Subich, Siqi Wei, and Sasa Zhang

Environment and Climate Change Canada (ECCC) is actively advancing the integration of artificial intelligence (AI) into numerical weather prediction (NWP) through a coordinated research-to-operations strategy that combines state-of-the-art machine learning approaches with established physical modeling frameworks. This presentation summarizes the progress achieved to date.

We first describe the development of GEML (Global Environmental eMuLator), a global AI forecast model, based on Google DeepMind’s GraphCast, trained and fine-tuned in-house using ERA5 reanalysis and ECMWF operational analyses. Building on GEML, ECCC has implemented an experimental hybrid AI–NWP global forecasting system, GDPS-SN, which applies large-scale spectral nudging to improve the operational Global Deterministic Prediction System (GDPS) by leveraging the large-scale accuracy of GEML.

The presentation also introduces a description of PARADIS, a fully Canadian, physically inspired, AI-based weather forecast model, developed by ECCC and its partners. These activities illustrate ECCC’s strategic vision for AI-enabled weather prediction by combining scientific rigor, collaboration and  operational relevance to deliver more accurate forecasting systems.


How to cite: Diaconescu, E., Caron, J.-F., Dallerit, V., Gaudreault, S., Husain, S., Panday, S., Pereira Frontado, C., Separovic, L., Subich, C., Wei, S., and Zhang, S.: Bridging Physics and Machine Learning to Enhance Weather Forecasting at ECCC, EGU General Assembly 2026, Vienna, Austria, 3–8 May 2026, EGU26-7801, https://doi.org/10.5194/egusphere-egu26-7801, 2026.

EGU26-8656 | Posters on site | AS5.1

Harnessing Data-Driven Weather Prediction (DWP) Model for Climate Modeling 

Chia-Ying Tu, Yu-Chi Wang, Chung-Cheh Chou, and Zheng-Yu Yan

Recent advancements in AI/ML-based Data-Driven Weather Prediction (DWP) have revolutionized meteorological forecasting. By leveraging deep learning architectures trained on the ECMWF ERA5 reanalysis, DWP models can iteratively predict atmospheric states with accuracy comparable to traditional Numerical Weather Prediction (NWP) while requiring orders of magnitude less computational power. However, DWP’s reliance on historical training data poses challenges for climate-scale simulations, particularly in representing evolving phenomena influenced by non-stationary climate change. This study investigates the applicability of the GraphCast DWP model for climate research, specifically focusing on its potential for global climate downscaling and bias correction.

To evaluate performance across varying initial conditions, we conducted three distinct 72-hour GraphCast integration experiments. The first experiment utilized high-resolution (0.25°) ERA5 data from 2000–2010 to assess model reproducibility (H-ERA5), while the second experiment employed low-resolution (1.0°) ERA5 data to quantify sensitivity to initial horizontal grid spacing (L-ERA5). In the third experiment, we utilized 36 years (1979–2014) of HiRAM climate simulations as initial conditions to evaluate a novel DWP-based climate modeling framework (GC-HiRAM).

Results from the H-ERA5 and L-ERA5 experiments demonstrate that GraphCast effectively reproduces the climate mean state and variance of the ERA5 dataset. However, both experiments exhibited an underestimation of tropical cyclone (TC) frequency and intensity, consistent with known TC climatology biases in ERA5. Notably, the GC-HiRAM experiment closely aligned with the mean states and long-term trends of the original HiRAM simulations while yielding precipitation and surface temperature variances comparable to ERA5. Interestingly, the inherent TC underestimation in GraphCast served as a functional bias correction for HiRAM, which traditionally overestimates TC frequency, thereby improving overall simulation skill. Our findings suggest that this innovative DWP-driven approach provides a computationally efficient and robust framework for global climate modeling, effectively capturing essential climate phenomena while introducing a viable pathway for high-resolution climate downscaling and ensemble simulations.

How to cite: Tu, C.-Y., Wang, Y.-C., Chou, C.-C., and Yan, Z.-Y.: Harnessing Data-Driven Weather Prediction (DWP) Model for Climate Modeling, EGU General Assembly 2026, Vienna, Austria, 3–8 May 2026, EGU26-8656, https://doi.org/10.5194/egusphere-egu26-8656, 2026.

Recently developed AI weather models have been widely recognized for revolutionizing weather prediction, producing forecasts more skillful than traditional models at a fraction of the computational cost. Here I will argue that the next phase of the revolution involves the adjoints of these models, applied to a wide range of problems, including novel exploration of dynamical process in weather and climate variability, extreme events, and new data assimilation systems. Adjoints are derived from gradient operations on the forward model, and are useful for measuring the sensitivity of model outputs to inputs and parameters. Historically adjoints have been derived for a limited set of traditional models, and mainly applied to problems in data assimilation. The ubiquitous availability of adjoints for AI models makes these tools easily accessible and available for a much wider range of applications. Specific examples I will discuss include shadowing trajectories for predictability, "gray swans" and a factory for out-of-sample extreme events, and mechanistic interpretability of specific phenomena.

How to cite: Hakim, G.: Using Adjoints of AI-based Weather Models to Study Predictability and Extreme Events, EGU General Assembly 2026, Vienna, Austria, 3–8 May 2026, EGU26-8870, https://doi.org/10.5194/egusphere-egu26-8870, 2026.

EGU26-9387 | Orals | AS5.1

Evaluating emergent climate behaviour in a hybrid machine learned atmosphere -- dynamical ocean model 

Hannah Christensen, Bobby Antonio, and Kristian Strommen

Understanding how fast atmospheric variability shapes slow climate variability and sensitivity is a central challenge in Earth-system science. Recent advances in machine-learned (ML) atmospheric models have demonstrated remarkable skill on weather timescales, but their emergent behaviour in a fully coupled climate system is largely unexplored. We present results from a new hybrid modelling framework that couples a machine-learned atmosphere to a dynamical ocean model. We report on a set of 70-year coupled simulations (1950–2020 historical forcing and fixed-1950s control) in which the ACE2 ML climate emulator is interactively coupled to the NEMO ocean model. These experiments represent, to our knowledge, the first multi-decadal integrations of a machine-learned atmosphere interacting with a full-depth dynamical ocean. We assess the behaviour of the coupled system, with particular focus on low-frequency tropical variability and the climate response to greenhouse-gas forcing. Preliminary results indicate realistic emergent El Nino-like variability and a physically plausible climate sensitivity, suggesting that key atmosphere–ocean feedbacks can be captured within a hybrid ML–dynamical framework. These results evaluate the possible role of entirely machine-learned components in next-generation Earth-system models.

How to cite: Christensen, H., Antonio, B., and Strommen, K.: Evaluating emergent climate behaviour in a hybrid machine learned atmosphere -- dynamical ocean model, EGU General Assembly 2026, Vienna, Austria, 3–8 May 2026, EGU26-9387, https://doi.org/10.5194/egusphere-egu26-9387, 2026.

EGU26-9811 | ECS | Posters on site | AS5.1

Explaining neural networks for detection of atmospheric features in gridded data 

Tim Radke, Susanne Fuchs, Iuliia Polkova, Christian Wilms, Johanna Baehr, and Marc Rautenhaus

Detection of atmospheric features in gridded datasets is typically done by means of rule-based algorithms. Recently, the feasibility of learning feature detection tasks using supervised learning with convolutional neural networks (CNNs) has been demonstrated. This approach corresponds to semantic segmentation tasks widely investigated in computer vision. However, while in recent studies the performance of CNNs was shown to be comparable to human experts, CNNs are largely treated as a “black box”, and it remains unclear whether they learn the features for physically plausible reasons. Here, we build on recently published studies that discuss datasets containing features of tropical cyclones (TCs), atmospheric rivers (ARs), and atmospheric surface fronts (SFs) as detected by human experts. We adapt the explainable artificial intelligence technique “Layer-wise Relevance Propagation” to the semantic segmentation task and investigate which input information CNNs with the Context-Guided Network (CGNet) and U-Net architectures use for feature detection. We find that for the detection of TCs and ARs, both CNNs indeed consider plausible patterns in the input fields of atmospheric variables. For instance, relevant patterns include point-shaped extrema in vertically integrated precipitable water (TMQ) and circular wind motion for TCs. For ARs, relevant patterns include elongated bands of high TMQ and eastward winds. Such results help to build trust in the CNN approach. In contrast, for the detection of SFs, we find only partially physically plausible patterns. While U-Net uses regions of changing temperature and humidity as well as strong wind shears to detect SFs, we also find noisy patterns relating to spurious correlations with the background data. To assess whether these implausible patterns reduce U-Net's generalizability, we evaluate it on a different SF dataset. Here, depending on the domain, SFs are often erroneously detected, especially in the Tropics and Arctic, highlighting the importance of analyzing whether patterns learned by a CNN are physically plausible. We also demonstrate application of the approach for finding the most relevant input variables and evaluating detection robustness when changing the input domain.

How to cite: Radke, T., Fuchs, S., Polkova, I., Wilms, C., Baehr, J., and Rautenhaus, M.: Explaining neural networks for detection of atmospheric features in gridded data, EGU General Assembly 2026, Vienna, Austria, 3–8 May 2026, EGU26-9811, https://doi.org/10.5194/egusphere-egu26-9811, 2026.

EGU26-12464 | Posters on site | AS5.1

Attribution of convective rainfall events using AI-downscaling – how extreme can we go? 

Georgie Logan, Daniel Cotterill, Mark McCarthy, Andrew Ciavarella, Henry Addison, Peter Watson, and Tomas Wetherell

Probabilistic attribution of extreme events requires large-ensemble climate model simulations, for both present and counterfactual climates, to adequately capture the tails of the distribution. Accurately modelling rainfall extremes, particularly those involving convection, or rainfall over regions with complex topography, requires high-resolution climate models. High-resolution climate data is particularly important for impact attribution to simulate realistic flood inundation as input to flood models.

Large ensembles of climate model runs for pre-industrial climates do not currently exist at convection-permitting resolution, as conventional convection-permitting models are computationally expensive to run. Therefore, attribution studies on extreme localised convective rainfall events are limited, despite the large impacts these events have on society.

To address this, we create a convective-permitting-resolution, large-ensemble dataset for England and Wales using a generative AI approach to downscale a pre-existing large ensemble of attribution runs from the HadGEM3 climate model. We use the diffusion model CPMGEM from Addison et al. (2025), which is trained and tested on the convection-permitting-resolution UK local Climate Projections data. We use CPMGEM, which enables stochastic generation of multiple samples per coarse model input, to generate multiple high-resolution precipitation samples from our original large-ensemble dataset. This process is relatively computationally cheap and enables creation of a high-resolution dataset that is larger than the input dataset.

We first investigate the ability of CPMGEM to be applied to a different configuration of the model it was trained on, and on an alternative set of counterfactuals. We also explore its ability to conserve climate trends and reproduce realistic values for the extremes.

We then assess the validity of using the downscaled dataset for attribution studies. If suitable, we will revisit a number of relevant attribution studies of extreme rainfall events and compare the original results from the coarse climate model HadGEM3-A to our new results using the high-resolution downscaled CPMGEM output. Overall, this could significantly extend the capability to attribute localised extreme rainfall events.

How to cite: Logan, G., Cotterill, D., McCarthy, M., Ciavarella, A., Addison, H., Watson, P., and Wetherell, T.: Attribution of convective rainfall events using AI-downscaling – how extreme can we go?, EGU General Assembly 2026, Vienna, Austria, 3–8 May 2026, EGU26-12464, https://doi.org/10.5194/egusphere-egu26-12464, 2026.

EGU26-13814 | ECS | Orals | AS5.1

Statistical Calibration of ArchesWeatherGen for Enhanced Sub-Seasonal and Longer Predictions 

Robert Brunstein and Christian Lessig

The capabilities and skill of emerging data-driven weather forecasting and climate models are steadily increasing and significant progress has been made in terms of their quality in the last years. Data-driven weather forecasting models predict the state of the atmosphere for a single step, e.g. 6h. Longer lead times are obtained using time-stepping where predictions are fed back into the model for the next step. Although many models exhibit stable behaviour for long rollouts, the training only considers short trajectories. The trained models are therefore statistically not well calibrated at longer lead times and for phenomena like blocking patterns or teleconnections, which happen on time scales larger than a few days, the predictions are poorly constrained by the training. To address this issue, the training of data-driven models needs to consider information about the atmospheric conditions from several days up to several weeks. 

We approach this problem by using ArchesWeather and ArchesWeatherGen. ArchesWeather provides a deterministic prediction of the next state of the atmosphere. ArchesWeatherGen, a probabilistic flow-matching model, corrects  the deterministic prediction to obtain a probabilistic prediction that matches the ground truth state. We tackle the long lead time calibration problem by applying ArchesWeatherGen after a large number of deterministic forecasting steps, in contrast to the single step used for ArchesWeatherGen for medium-range weather forecasting. We therefore condition ArchesWeatherGen on an entire long forecast trajectory produced by the deterministic model. Through this, ArchesWeatherGen obtains more temporal information about the atmosphere as well as the error development and can explicitly learn longer-time correlation patterns in the atmospheric dynamics. This leads to a better calibrated model at longer lead times. It also reduces the number of diffusion steps, and hence the computational costs, as we only correct the mean prediction after a larger number of deterministic autoregressive forecasting steps. For our study, we examine the influence of the length of the input trajectory and evaluate the improvement of our approach compared to the results obtained with a single step model correction.

How to cite: Brunstein, R. and Lessig, C.: Statistical Calibration of ArchesWeatherGen for Enhanced Sub-Seasonal and Longer Predictions, EGU General Assembly 2026, Vienna, Austria, 3–8 May 2026, EGU26-13814, https://doi.org/10.5194/egusphere-egu26-13814, 2026.

EGU26-15037 | ECS | Orals | AS5.1

Evaluating ArchesWeather and ArchesWeatherGen under Multi-Decadal AMIP-style climate simulations 

Renu Singh, Robert Brunstein, Antonia Anna Jost, Yana Hasson, Guillaume Couairon, Christian Lessig, and Claire Monteleoni

The last 5 years have seen an AI revolution in weather forecasting with data-driven models trained on ERA5 (such as Pangu-Weather, GraphCast) surpassing the skill of numerical models at a fraction of the compute costs . Furthermore, stochastic modeling approaches are now state-of-the-art as they can model the uncertainty in the dynamics of the earth system (GenCast, FGN). Similarly, there have been recent advances in long-term climate emulation using data-driven methods, although they either use deterministic models (ACE2, Lucie) or are trained on simulated climate data from physical models (ArchesClimate). Here, we evaluate a stochastic modeling approach, ArchesWeatherGen, on historical climate timescales (last 40 years) and its response to ocean forcings in an AMIP run setup (atmospheric model forced with sea surface temperature and sea ice). These simulations contribute to AIMIP (AI Model Intercomparison Project), an initiative to organize and compare the current state-of-the-art AI climate models. 

ArchesWeather and ArchesWeatherGen are efficient data-driven models built for medium-range weather forecasting. ArchesWeather is a deterministic transformer-based model and ArchesWeatherGen is a probabilistic generative model based on flow matching, with the same transformer backbone, that corrects the deterministic model prediction and accounts for variability in the time evolution.

In adherence to the AIMIP Stage 1 protocol, we adapt the models to serve as an atmospheric climate model for AMIP climate simulations on the historical period of 1979-2024. ArchesWeather and ArchesWeatherGen are extended to take into account monthly mean forcings for sea surface temperature (SST) and sea ice cover computed from ERA5. These models are trained on daily averaged 1-degree ERA5 data and they predict the state of the atmosphere at a forecast lead time of 24 hours given initial conditions.

We examine the ability of both models to stably emulate the current climate by quantitatively and qualitatively comparing them to the ERA5 climatology. Our results show that the models are able to emulate the current climate faithfully and reproduce many teleconnections as well as modes of annular variability correctly. We ablate different model configurations against each other and investigate the influence of the residual predictions of ArchesWeatherGen on the quality of the climate simulations compared to the deterministic predictions of ArchesWeather. We also analyse the models' capability to reproduce extreme weather statistics. Lastly, we examine the models’ response to forcings by evaluating the stability, trend, and physical correlations when running the model in different forcing scenarios, such as no forcings, annually repeating forcings, and increased SST.

How to cite: Singh, R., Brunstein, R., Jost, A. A., Hasson, Y., Couairon, G., Lessig, C., and Monteleoni, C.: Evaluating ArchesWeather and ArchesWeatherGen under Multi-Decadal AMIP-style climate simulations, EGU General Assembly 2026, Vienna, Austria, 3–8 May 2026, EGU26-15037, https://doi.org/10.5194/egusphere-egu26-15037, 2026.

EGU26-15189 | ECS | Posters on site | AS5.1

How can AI tools be used to explore unprecedented future climate and weather extremes? 

Tom Wood and Tom Matthews

This study addresses recent calls for greater focus on understanding unprecedented extreme events (e.g. Kelder et al., 2025; Matthews et al., in review) by exploring the potential to use downscaled ‘synthetic data’ from climate model projections to train cutting-edge, computationally efficient deep learning models and generate very large ensembles of high-resolution extreme weather events under future perturbed climates. The study seeks to advance understanding of plausible upper limits in extreme high-impact, low-likelihood (HILL), record-shattering extremes and unprecedented tail risks, focusing initially on the threat of uncompensable heat with the potential to result in catastrophic mass mortality impacts. We address a number of open questions in this nascent field by testing a set of recently developed tools in new and innovative ways to understand the benefits and limitations of this approach. 

Can we generate new insights beyond what can be achieved using traditional methods, such as large ensembles of physics-based models and advances such as ensemble boosting? What are the benefits of producing very large stochastic ensembles of plausible extreme weather systems and how does this complement (or otherwise) other approaches with similar motivations (e.g. emulators)? Can we identify and validate plausible physical climate storylines leading to unprecedented extreme events e.g., by identifying and clustering meteorological setups leading to very large, compound, or concurrent non-contiguous regional extremes? Can we robustly constrain this method to ensure physical plausibility in unprecedented climates? Can we advance understanding of rare event probability under a non-stationary climate from various emissions pathways? What are the limitations due to aleatoric and epistemic uncertainty? How do we mitigate biases and limit their propagation? Can we investigate downward counterfactuals and identify meteorological conditions aligning with imagined worst-case scenarios?

By addressing these questions, this study seeks to advance knowledge of the threats posed by the most extreme plausible weather events posing potentially catastrophic risks to society.

How to cite: Wood, T. and Matthews, T.: How can AI tools be used to explore unprecedented future climate and weather extremes?, EGU General Assembly 2026, Vienna, Austria, 3–8 May 2026, EGU26-15189, https://doi.org/10.5194/egusphere-egu26-15189, 2026.

The Western North Pacific Subtropical High (WNPSH) is one of the dominant subtropical anticyclonic circulations over the western North Pacific during boreal summer, strongly influencing East Asian extremes such as tropical cyclone tracks, heatwaves, and the Baiu/Meiyu front. WNPSH variability reflects both midlatitude teleconnections and tropical intraseasonal oscillations (BSISO). Therefore, to clarify predictability, it is essential to identify and quantify how individual events contribute to forecast skill and uncertainty.

We develop a probabilistic deep learning framework to predict a WNPSH index with explicit uncertainty, represented as Gaussian regression outputs (μ, σ), and assess its predictability up to a 1-month lead. We adopt a model that combines a three-dimensional convolutional neural network with self-attention. To capture diverse representations, we pretrain the model using a millennial-scale ensemble dataset from d4PDF and then fine-tune it with the ERA5 reanalysis. As a result, the prediction skill reaches ACC = 0.6 at 10-day lead time. With deep learning models, the prediction problem can be formulated as an explainable AI (XAI) task, in which precursor signals relevant to the forecast can be estimated directly from spatial patterns and input variables (Maeda and Satoh, 2025). Here, we analyze the predictability using a combination of XAI and the concept of windows of opportunity. During opportunity events, forecast skill improves to about a 15-day lead time. Clear precursor patterns emerge in the initial conditions, including signatures of intraseasonal oscillations and midlatitude wave trains. These signals are consistent with heatmap-based interpretations from XAI, providing quantitative statistics on the sources of predictability for prominent events.

How to cite: Maeda, Y. and Satoh, M.: Probabilistic Deep Learning Identifies Windows of Opportunity and Precursors for Western North Pacific Subtropical High Prediction, EGU General Assembly 2026, Vienna, Austria, 3–8 May 2026, EGU26-16518, https://doi.org/10.5194/egusphere-egu26-16518, 2026.

EGU26-16579 | ECS | Posters on site | AS5.1

Data-driven global ocean model resolving atmospherically forced ocean dynamics 

Jeong-Hwan Kim, Daehyun Kang, Young-Min Yang, Jae-Heung Park, and Yoo-Geun Ham

Artificial intelligence has advanced global weather forecasting, outperforming traditional numerical models in both accuracy and computational efficiency. Nevertheless, extending predictions beyond subseasonal timescales requires the development of deep learning (DL)–based ocean–atmosphere coupled models that can realistically simulate complex oceanic responses to atmospheric forcing. This study presents KIST-Ocean, a DL-based global three-dimensional ocean general circulation model. Comprehensive evaluations confirmed the model’s robust ocean predictive skill and efficiency. Moreover, it accurately reproduces realistic ocean responses, such as Kelvin and Rossby wave propagation, and vertical motions induced by rotational wind stress, demonstrating its ability to represent key ocean–atmosphere interactions underlying climate phenomena, including the El Niño–Southern Oscillation. These findings reinforce confidence in DL-based global weather and climate models by demonstrating their capacity to capture essential ocean-atmosphere relationships. Building upon this foundation, the present study paves the way for extending DL-based modeling frameworks toward integrated Earth system simulations, thereby offering substantial potential for advancing long-range climate prediction capabilities.

How to cite: Kim, J.-H., Kang, D., Yang, Y.-M., Park, J.-H., and Ham, Y.-G.: Data-driven global ocean model resolving atmospherically forced ocean dynamics, EGU General Assembly 2026, Vienna, Austria, 3–8 May 2026, EGU26-16579, https://doi.org/10.5194/egusphere-egu26-16579, 2026.

EGU26-16636 | Posters on site | AS5.1

How can climate model emulators be aligned more closely with the needs of applied researchers? 

Nina Effenberger and Luca Schmidt

Earth System Models (ESMs) represent our most comprehensive tools for understanding and projecting climate change impacts; yet, they are highly computationally demanding and technically complex. Climate model emulators offer an alternative approach by approximating components or full ESM outputs at a reduced computational cost. Such emulators can range from reduced-order climate models to fully data-driven machine learning surrogates. As the demand for climate information increases, interest in climate model emulation has grown across both climate science and machine learning research, leading to rapid methodological development. Despite this shared interest, the two research fields remain largely disconnected and the application of machine learning climate emulators in climate science remains challenging [1]. Many emulators, therefore, remain unused in decision-making contexts--not because they lack value, but because methodological developers and users lack a shared framework for communication, evaluation, and practical guidance. 
This work examines this disconnect and takes a step towards facilitating the use of machine learning–based climate emulators in applied research and decision-making. We analyze and contrast methodological and applied perspectives on emulators, identify points of misalignment, and highlight opportunities for improved interaction. Building on these insights, we propose a tutorial-style framework that connects the two perspectives and provides practical guidance for developing, evaluating, and using climate emulators in research and decision-making contexts.

[1] Fowler, H. J., Mearns, L. O. and Wilby, R. L. [2025], Downscaling future climate projections: Compound-
ing uncertainty but adding value?, in ‘Uncertainty in Climate Change Research: An Integrated Approach’,
Springer, pp. 185–197.

How to cite: Effenberger, N. and Schmidt, L.: How can climate model emulators be aligned more closely with the needs of applied researchers?, EGU General Assembly 2026, Vienna, Austria, 3–8 May 2026, EGU26-16636, https://doi.org/10.5194/egusphere-egu26-16636, 2026.

EGU26-17080 | Posters on site | AS5.1

Deep learning-Based Global Ocean prediction model on the HEALPix Mesh 

Seonyu Kang, Yoo-Geun Ham, and Dongjin Cho

While deep learning-based atmospheric have been actively developed, in contrast, the development of ocean prediction models which allows multi-decade simulations through the autoregressive operation has been largely limited. This study developed a deep learning-based global ocean prediction model using the HEALPix grid system that capable of multi-decades integration in daily time step by successfully reproducing the observed global ocean statistics. Model training uses Fourier amplitude and phase losses to preserve low-frequency spatial structure and phase consistency, batch anomaly loss to learn anomalous variability, and sequentially ingests past-to-present atmospheric forcing to enable physically consistent coupled atmosphere–ocean dynamics in long-term integration. Long-term ocean model integration experiments with the observed atmospheric forcing demonstrate drift-free stable climatology for 20-yr simulations, with realistic Niño3.4 variations and ENSO-related global oceanic anomaly patterns consistent with observations. Furthermore, oceanic subsurface temperature responses to the westerly wind bursts (WWBs) over the equatorial western Pacific successfully capture the eastward propagation properties associated with the oceanic Kelvin waves.

How to cite: Kang, S., Ham, Y.-G., and Cho, D.: Deep learning-Based Global Ocean prediction model on the HEALPix Mesh, EGU General Assembly 2026, Vienna, Austria, 3–8 May 2026, EGU26-17080, https://doi.org/10.5194/egusphere-egu26-17080, 2026.

EGU26-17113 | ECS | Posters on site | AS5.1

Evaluating machine learning approaches to improve observational daily precipitation datasets 

Skye Williams-Kelly, Lisa Alexander, Steefan Contractor, and Sahani Pathiraja

Accurate precipitation predictions are vital for water resource management and risk mitigation. Interpolated precipitation estimates derived from in situ observations are frequently used to evaluate climate models and analyse trends. However, these inadequately represent its spatio-temporal characteristics and significantly smooth out extremes, inhibiting effective evaluation of dynamical models and analysis of trends. Machine learning methods may be suited to addressing these limitations due to their ability to identify patterns in large datasets and use of GPU acceleration. Therefore, we compare three ML-based approaches for improving observational daily precipitation datasets: Gaussian Processes, Bayesian Neural Fields, and Neural Processes. Their performance is evaluated using traditional and distributional metrics, including on out-of-sample prediction, enabling an objective assessment of generalisation skill and representation of extremes. Results are further compared against existing precipitation products to identify the relative strengths and limitations of each method.

How to cite: Williams-Kelly, S., Alexander, L., Contractor, S., and Pathiraja, S.: Evaluating machine learning approaches to improve observational daily precipitation datasets, EGU General Assembly 2026, Vienna, Austria, 3–8 May 2026, EGU26-17113, https://doi.org/10.5194/egusphere-egu26-17113, 2026.

EGU26-17600 | Orals | AS5.1

Rare event simulations, emulators, machine learning, and Bayesian GEV estimation, for predicting extreme heat waves and extremes of renewable electricity production 

Freddy Bouchet, Dorian Abbot, Laurent Dubus, Pedram Hassanzadeh, Amaury Lancelin, Jonathan Weare, Peter Werner, and Alexander Wikner

In the climate system, extreme events and tipping points (transitions between climate attractors) are of primary importance for understanding the impacts of climate change and for designing effective adaptation and mitigation strategies. Recent extreme heat waves with severe societal consequences, as well as prolonged periods of very low renewable energy production in electricity systems, are striking examples. A key challenge in studying such phenomena is the lack of available data: these events are inherently rare, and realistic climate models are computationally expensive and highly complex. This data scarcity severely limits the applicability of traditional approaches, whether based on modelling, physics, or statistical analysis.

In this talk, I will present new algorithms and theoretical approaches based on rare-event simulations, climate-model emulators, machine-learning methods for stochastic processes, and up to date blend of data and model use to estimate generalized extreme value (GEV) distribution. These methods are specifically designed to predict the probability that an extremely rare event will occur, to produce huge catalogues of dynamical trajectories leading to the event, and to use the best available historical and model data. The rare event simulation/emulator approach combines, on the one hand, state-of-the-art AI-based emulators that reproduce the full atmospheric dynamics of climate models, and, on the other hand, rare-event simulation techniques that reduce by several orders of magnitude the computational cost of sampling extremely rare events. In parallel the Bayesian GEV approach mix information from historical observation and CMIP model output to produce the best possible estimate of extreme event probabilities.

To illustrate the performance of these tools, I will present results on midlatitude extreme heat waves and on extremes of renewable energy production, with a particular focus on their implications for the resilience of electricity systems.

How to cite: Bouchet, F., Abbot, D., Dubus, L., Hassanzadeh, P., Lancelin, A., Weare, J., Werner, P., and Wikner, A.: Rare event simulations, emulators, machine learning, and Bayesian GEV estimation, for predicting extreme heat waves and extremes of renewable electricity production, EGU General Assembly 2026, Vienna, Austria, 3–8 May 2026, EGU26-17600, https://doi.org/10.5194/egusphere-egu26-17600, 2026.

EGU26-18038 | ECS | Posters on site | AS5.1

Architectural Sensitivity of AI Weather Prediction Models to 3D Structural and Seasonal Climate Forcing 

Mozhgan Amiramjadi, Christopher Roth, and Peer Nowack

Data-driven weather prediction models have demonstrated remarkable skill, yet their ability to maintain a physically consistent three-dimensional atmospheric structure under out-of-distribution (OOD) conditions remains poorly understood. If OOD performance criteria could be met approximately, AI models would open up entirely new possibilities to generate large AI weather ensembles under future climate scenarios—for example, if initialized from climate model simulations (Rackow et al., 2024). This study conducts a multi-scale diagnostic evaluation of four state-of-the-art models—NeuralGCM (a deterministic hybrid model), GraphCast (a deterministic graph neural-network model), AIFS (a deterministic transformer-based model), and GenCast (an ensemble generative and diffusion-based model)—initialized across three distinct climate states: 1955 (cold), 2023 (neutral), sourced from ERA5 reanalysis, and 2049 (warm) simulated by the nextGEMS climate model (Segura et al., 2025).

Over 1–10-day leads, we find no detectable resolution-dependence for NeuralGCM's global skill, though the 1.4° configuration minimizes mean drift. A dominant spatial signature emerges across all models: a robust land–ocean contrast where oceans maintain smaller biases and slower Anomaly Correlation Coefficient (ACC) decay. Cross-hemispheric skill comparisons reveal that this contrast drives a significant asymmetry in error characteristics. In the 2049 warming scenario, the land-heavy Northern Hemisphere (NH, 39% land coverage) is the primary site of GraphCast's systematic "cool-drift" toward its training distribution, which peaks during boreal summer (JJA). In contrast, the generative GenCast model develops a pronounced warm bias localized in the oceanic Southern Hemisphere (SH, with about 20% land coverage).

For all three climate states, we further evaluate model performance across the entire troposphere and, as far as available, the stratosphere. While all four models maintain high variance-explained in the present-day mid-troposphere, performance degrades non-linearly under OOD forcing elsewhere, particularly within the stratosphere (< 200 hPa) and the boundary layer (> 900 hPa). Latitudinal R2-score cross-sections reveal that this degradation is most severe at polar latitudes; notably, in the 2049 scenario, GenCast exhibits a near-total collapse of skill by day 10, whereas NeuralGCM and GraphCast maintain localized predictive skill within the tropical troposphere.

The architecture-dependence of these simulated ensembles is confirmed by projecting day-10 drifts onto inter-climate "fingerprints" (T2049 - T2023 and T1955 - T2023). While AIFS and NeuralGCM show superior stability, GraphCast exhibits a systematic "cool-drift" toward its training climatology, and GenCast develops a distinct warm ocean drift. Beyond evaluating skill in surface variables, our results underline the need to assess data-driven models comprehensively across vertical, hemispheric, and seasonal diagnostics when applied to climate science scenarios, with implications for future AI model development.

References:

Rackow, T., et al (2024). Robustness of AI-based weather forecasts in a changing climate. arXiv preprint  arXiv:2409.18529. https://doi.org/10.48550/arXiv.2409.18529

Segura, H., et al. (2025). nextGEMS: entering the era of kilometer-scale Earth system modeling. Earth system modeling, Geosci. Model Dev., 18, 7735–7761, https://doi.org/10.5194/gmd-18-7735-2025

How to cite: Amiramjadi, M., Roth, C., and Nowack, P.: Architectural Sensitivity of AI Weather Prediction Models to 3D Structural and Seasonal Climate Forcing, EGU General Assembly 2026, Vienna, Austria, 3–8 May 2026, EGU26-18038, https://doi.org/10.5194/egusphere-egu26-18038, 2026.

EGU26-18557 | ECS | Posters on site | AS5.1

Bias-Correcting Arctic ERA5 Surface Air Temperatures using Deep Learning  

Sabine Scholle and Felix Pithan

Bias-Correcting Arctic ERA5 Surface Air Temperatures using Deep Learning 

Fine-tuning AtmoRep, a climate dynamics foundational model for improved Arctic 2m temperature predictions 

Due to the Arctic's harsh environment, comprehensive observational networks remain incomplete, leading to a reliance on biased reanalysis datasets such as ERA5. [1] This study investigates the potential of fine-tuning AtmoRep, a pre-trained transformer model for global atmospheric dynamics, to improve bias correction of Arctic 2-meter temperature (t2m) predictions. [2] 

Our methodology involves fine-tuning AtmoRep using ERA5 fields as input and bias-corrected Arctic t2m synthetic data, from a parallel project, as a target. [3] The project goal is to leverage AtmoReps global climate representations to further push the bias-corrected synthetic Arctic t2m data, given ERA5 as input (evaluated against observational data).

Preliminary results demonstrate stable validation performance of AtmoRep over the Arctic, achieving a t2m RMSE of 0.27 K during fine-tuning. Model robustness was further evaluated under severely masked target fields (up to 90% masking), and comparing BERT-style reconstruction with a forecasting-based training strategy. 

This study represents a novel application of foundation pretrained climate models for bias correction in sparsely observed Arctic regions, highlighting the potential of machine learning approaches to advance atmospheric science. 

  • Tian, T., Yang, S., Høyer, J. L., Nielsen-Englyst, P., & Singha, S. (2024). Cooler Arctic surface temperatures simulated by climate models are closer to satellite-based data than the ERA5 reanalysis. Communications Earth & Environment, 5(1). https://doi.org/10.1038/s43247-024-01276-z 
  • Lessig, C., Luise, I., Gong, B., Langguth, M., Stadtler, S., & Schultz, M. (2023b, August 25). AtmoRep: A stochastic model of atmosphere dynamics using large scale representation learning. arXiv.org. https://arxiv.org/abs/2308.13280 
  • Hossain, A., Keil, P., Grover, H., et al. Machine Learning Eliminates Reanalysis Warm Bias and Reveals Weaker Winter Surface Cooling over Arctic Sea Ice. ESS Open Archive . December 24, 2025.  https://doi.org/10.22541/essoar.176659533.30384251/v1 

How to cite: Scholle, S. and Pithan, F.: Bias-Correcting Arctic ERA5 Surface Air Temperatures using Deep Learning , EGU General Assembly 2026, Vienna, Austria, 3–8 May 2026, EGU26-18557, https://doi.org/10.5194/egusphere-egu26-18557, 2026.

EGU26-19650 | ECS | Posters on site | AS5.1

Global Evaluation of Probabilistic AI Weather Forecasts Across Extremes and Regimes 

Marc Girona-Mata, Andrew Orr, and Richard Turner

Recent probabilistic machine learning weather forecasting models have demonstrated competitive skill relative to state-of-the-art (SOTA) numerical weather prediction ensemble systems. However, a rigorous global assessment of their skill, particularly in the distribution tails relevant for extremes as well as across different geographical regions, remains limited. Here, we present a systematic evaluation of various SOTA probabilistic AI weather forecasting systems against ECMWF’s Integrated Forecasting System Ensemble (IFS ENS), focusing on forecast skill across the full range of event intensities.

We analyse global forecasts at 24- and 72-hour lead times for near-surface temperature, 10 m wind speed, and total precipitation at 0.25° resolution over the 2024-2025 period. Forecasts are evaluated using the fair Continuous Ranked Probability Score (fCRPS) to account for differing ensemble sizes, as well as other complementary metrics. We also employ the threshold-weighted CRPS (twCRPS) computed for different quantiles ranging from the median up to the one-in-a-million extreme event. Scores are area-weighted and analysed both i) globally, ii) over land only, and iii) for different regions.

AI-based forecasts demonstrate comparable or improved probabilistic skill relative to the IFS ensemble in the bulk of the distribution, with particularly strong performance over tropical and mid-latitude oceans. However, skill systematically degrades at high quantiles for most variables, with more pronounced losses over land and at short lead times. Both diffusion- and CRPS-based probabilistic forecasts are competitive, but their relative skill varies across variables. Spatial diagnostics reveal coherent regime-dependent behaviour, with AI models underperforming in complex terrain and coastal regions where the IFS ENS retains a clear advantage. 

These results highlight both the promise and current limitations of probabilistic AI weather forecasting models, emphasising that headline global skill can mask substantial degradation in extreme-event and regional reliability.

How to cite: Girona-Mata, M., Orr, A., and Turner, R.: Global Evaluation of Probabilistic AI Weather Forecasts Across Extremes and Regimes, EGU General Assembly 2026, Vienna, Austria, 3–8 May 2026, EGU26-19650, https://doi.org/10.5194/egusphere-egu26-19650, 2026.

EGU26-19652 | ECS | Orals | AS5.1

Using process-based model simulations to develop and validate a data-driven approach for identifying climate drivers of maize yield failure 

Lily-belle Sweet, Christoph Müller, Jonas Jägermeyr, Weston Anderson, and Jakob Zscheischler

Climate impacts such as crop yield failure arise from complex combinations of weather conditions acting across multiple time scales, making it challenging to identify the most relevant climate drivers from high-resolution weather data. However, with data limitations, and the existence of complex and interacting relationships between growing-season climate conditions and plant growth, complex machine learning models that show high performance in predicting crop yield are often ‘right for the wrong reasons’. Process-based crop model simulations, which embody known functional relationships, could provide a useful testbed for developing and evaluating more trustworthy and robust methods. We present a novel two-stage, data-driven framework designed to extract a parsimonious set of climate drivers from multivariate daily meteorological inputs by systematically generating, evaluating and discarding candidate features using machine learning and then producing a set of drivers that are robust across locations, years and predictive feature combinations. We first validate the method using simulated U.S. maize yield failure data from two global gridded crop models, using rigorous out-of-sample testing: training on only early 20th-century data and holding out over 70 subsequent years for evaluation. The drivers identified using our approach align with known crop model mechanisms and rely solely on model input variables. Parsimonious logistic regression models built from these drivers achieve strong predictive skill under non-stationary climate conditions.

After validating the methodology on simulated data, we apply the same approach to observed county-level yields and daily multivariate weather data in rainfed and irrigated US maize systems. We identify compact sets of five climate drivers that effectively reproduce interannual variability and major historic failure events, including the 1993 Midwest floods and the 2012 drought. In rainfed systems, yield failure risk is strongly associated with extended periods of high soil moisture conditions after establishment, seasonal precipitation levels and vapor pressure deficit (VPD), with more than 40 high-VPD days between flowering and maturity markedly increasing odds of yield failure. In irrigated systems, critical drivers include soil moisture conditions surrounding planting, hot or dry days after establishment, and dewpoint temperatures near harvest. Our results demonstrate the transferability of the method from simulations to observations, and suggest its applicability to other crops, locations and further climate-related impacts. By avoiding reliance on post-hoc interpretability of black-box models, this framework enables the use of inherently interpretable, statistical models while still leveraging the predictive power of high-dimensional meteorological datasets.

How to cite: Sweet, L., Müller, C., Jägermeyr, J., Anderson, W., and Zscheischler, J.: Using process-based model simulations to develop and validate a data-driven approach for identifying climate drivers of maize yield failure, EGU General Assembly 2026, Vienna, Austria, 3–8 May 2026, EGU26-19652, https://doi.org/10.5194/egusphere-egu26-19652, 2026.

EGU26-20173 | ECS | Posters on site | AS5.1

Exploring Adversarial Attacks in AI Weather Models for Generation of High-resolution Tropical Cyclones 

Marco Froelich and Sebastian Engelke

There has been recent interest in the advantage of differentiability of AI-weather models to enable direct computation of model sensitivities to initial conditions. In the field of machine learning, adversarial attacks leverage these sensitivities to influence the output of the prediction system by finding optimal initial condition perturbations. In weather forecasting, this methodology can be seen under two lenses: differentiable models are susceptible to malicious attacks aimed at distorting operational forecasts [1], while having access to sensitivities is an opportunity to further our understanding of real events through the generation of synthetic forecasts. Adversarial examples - perturbed initial conditions obtained from adversarial attacks - have been used in [2] to create even more extreme forecasts of a heatwave, providing a storyline approach to understanding black swan heatwave events. 

We further this effort by exploring adversarial attacks of tropical cyclone predictions at 0.25° resolution using Operational GraphCast. Although AI-weather models are known to improve tropical cyclone track predictions against numerical systems it remains challenging to forecast high intensities, particularly at high-resolution. Indeed, AI-weather models trained with MSE-type losses on reanalysis are known to suffer from 'blurred' forecasts due to the implicit down-weighing of small scale features. We find that while standard adversarial attacks of tropical cyclone forecasts are effective in controlling tropical cyclone tracks, they fail to reproduce realistic gradients of temperature, geopotential and wind fields, effectively worsening blurring effects. This is true also for attacks on the AMSE-finetuned Operational GraphCast model [3] which otherwise shows significant improvements in representing small scale features. We then borrow insights from the machine learning literature on the impact of the low-frequency bias of neural networks and its relationship to adversarial examples to improve this limitation and explore the capabilities of AI-weather models in global high-resolution tropical cyclone forecasting. 


References: 
[1] Imgrund, E., Eisenhofer, T., Rieck, K., 2025. Adversarial Observations in Weather Forecasting.
[2] Whittaker, T., Luca, A.D., 2025. Constructing Extreme Heatwave Storylines with Differentiable Climate Models.
[3] Subich, C., Husain, S.Z., Separovic, L., Yang, J., 2025. Fixing the Double Penalty in Data-Driven Weather Forecasting Through a Modified Spherical Harmonic Loss Function.

How to cite: Froelich, M. and Engelke, S.: Exploring Adversarial Attacks in AI Weather Models for Generation of High-resolution Tropical Cyclones, EGU General Assembly 2026, Vienna, Austria, 3–8 May 2026, EGU26-20173, https://doi.org/10.5194/egusphere-egu26-20173, 2026.

EGU26-21303 | Posters on site | AS5.1

Multiscale Graph Neural Networks for Climate Data Analysis 

Étienne Plésiat, Maximilian Witte, Johannes Meuer, and Christopher Kadow

We present a flexible deep learning framework for climate data analysis that leverages message-passing graph neural networks.

The framework is fully configurable and allows users to construct diverse architectures. In particular, it supports encoder-processor-decoder configurations in which geophysical fields are mapped onto a hierarchy of multi-icosahedral meshes, enabling information to propagate across scales before being mapped back to the original spatial grid. The model architecture is defined through a set of graph operators, including transformer-based graph convolutions. The framework operates on both regular and irregular grids, and enables flexible multivariate processing with spatial consistency. It further incorporates adaptive graph connectivity, enabling robust handling of missing data through dynamic edge construction. Additionally, several explainable AI (XAI) techniques are integrated to facilitate interpretation and physical attribution.

These features make the framework suitable for a broad range of climate and Earth-system applications, including data infilling, downscaling and process attribution. Its capabilities are illustrated through two case studies: (i) the reconstruction of global precipitation fields from incomplete observations, with comparison to established statistical and deep learning methods, and (ii) the attribution of large-scale drivers contributing to an extreme heatwave event.

The framework is currently being deployed as a web processing service that supports operational inference for selected climate applications.

How to cite: Plésiat, É., Witte, M., Meuer, J., and Kadow, C.: Multiscale Graph Neural Networks for Climate Data Analysis, EGU General Assembly 2026, Vienna, Austria, 3–8 May 2026, EGU26-21303, https://doi.org/10.5194/egusphere-egu26-21303, 2026.

EGU26-37 | Posters on site | AS5.2

Smart Monitoring and Ozone Precursor Analysis in the Port Area of Central Taiwan 

Guan-Yu Lin, Yi-Ming Lee, and Gung-Hwa Hong

This study focuses on volatile organic compound (VOC) emissions at the western terminal of Taichung Port, where 15 advanced air quality sensors were deployed to establish an intelligent monitoring network. Site selection was based on historical pollution hotspots, prevailing wind directions, and the presence of high-emission industrial facilities. The deployment employed a “smart fence” strategy, featuring sensors equipped with wind speed and direction modules to identify pollutant sources and transport dynamics, thereby providing real-time data to support air quality management. To ensure data reliability, sensor calibration and validation were conducted for O₃, NO₂, CO, VOCs, temperature, and humidity. The temperature and humidity sensors demonstrated strong correlations (R² > 0.8) and were effectively corrected using linear regression. O₃ sensors showed high correlation (R² > 0.9) and were successfully adjusted (RMSE reduced to 4.63 ppb).

From September to December 2024, VOC concentrations were further monitored across 13 industrial parks in Taichung City. Results revealed considerable spatial and temporal variability, as well as short-term high concentration events. Parks such as Renhua, Wufeng, Central Taiwan Science Park, and Fengzhou exhibited notably high VOC levels and standard deviations, indicating the presence of occasional emission sources. Many monitoring sites displayed standard deviations 3–5 times greater than the mean, highlighting frequent transient pollution events. It is recommended that local authorities intensify source tracking and real-time control measures in identified hotspots.

Additionally, a Positive Matrix Factorization (PMF) analysis identified six major VOC sources: vehicle emissions, biomass burning, fuel evaporation, industrial emissions, background pollutants, and solvent use. The study’s finding of 28.3% for vehicle emissions in Taichung Port aligns with existing literature, indicating consistency in source profiles. An O₃ prediction model was also developed using data from Dali Traffic Station and the advanced sensors, applying both XGBoost and ANN algorithms. XGBoost demonstrated superior performance (R² up to 0.88). SHAP analysis identified relative humidity, temperature, and NOₓ as the most influential variables. This model supports real-time O₃ prediction and hotspot identification.

How to cite: Lin, G.-Y., Lee, Y.-M., and Hong, G.-H.: Smart Monitoring and Ozone Precursor Analysis in the Port Area of Central Taiwan, EGU General Assembly 2026, Vienna, Austria, 3–8 May 2026, EGU26-37, https://doi.org/10.5194/egusphere-egu26-37, 2026.

EGU26-248 | ECS | Orals | AS5.2

Classification and Attribution of Low-Visibility Events Using Deep Learning 

Yuting Liang and Dantong Liu

Abstract: The accurate detection of low-visibility events such as fog, haze, and fog-haze is a persistent challenge for satellite remote sensing, hindered by poor spatial generalization in existing models and unreliable aerosol retrievals. This study introduces a unified deep learning framework that integrates geostationary satellite data, meteorological reanalysis, and fine particulate matter (PM₂.₅) observations to identify these events. The model is able to produce the intensity of different low-visibility events and can be linked to visibility reduction. By incorporating PM2.5, the polluted fog-haze can be discriminated from clean fog. The method can be extended to sea fog. To isolate the impact of PM₂.₅ on fog-haze formation, sensitivity experiments were conducted. The findings reveal that the high frequency of winter fog-haze is primarily driven by elevated pollution; reducing winter PM₂.₅ concentrations to summer-like levels (a 60% reduction) causes the simulated fog-haze distribution to align with summer observations. This response is linked to the microphysical role of aerosols, where the primary effect of reducing PM₂.₅ is to cause a transition of fog-haze to fog, rather than to suppress the formation of low-visibility events entirely. We are able to investigate the mitigation of PM2.5 in reducing the hazardous fog-haze. By reducing the overall concentration of PM2.5 by 40% can reduce 75% of fog-haze area. For the first time, this work dynamically attributes the seasonal characteristics of fog-haze to pollution levels, providing a quantitative framework for evaluating the visibility co-benefits of air quality policies.

Keywords: Deep Learning; Satellite Remote Sensing; Low-Visibility Events

How to cite: Liang, Y. and Liu, D.: Classification and Attribution of Low-Visibility Events Using Deep Learning, EGU General Assembly 2026, Vienna, Austria, 3–8 May 2026, EGU26-248, https://doi.org/10.5194/egusphere-egu26-248, 2026.

EGU26-369 | Orals | AS5.2

Developing deep-learning models for weather-climate forecasts 

Jing-Jia Luo and Fenghua Ling

AI and deep learning are rapidly becoming essential tools in weather and climate science. This presentation will cover our recent work using these techniques to enhance predictions across various timescales and phenomena. We have successfully applied architectures like convolutional neural networks, transformers, and generative models to forecast events like ENSO and the Indian Ocean Dipole, as well as to correct biases in traditional climate models and to downscale coarse-resolution outputs using diffusion framework. Looking ahead, I will also discuss our efforts in building AI large models for ensemble subseasonal-to-decadal forecasting and the exciting prospect of creating AI agents dedicated to climate research.

How to cite: Luo, J.-J. and Ling, F.: Developing deep-learning models for weather-climate forecasts, EGU General Assembly 2026, Vienna, Austria, 3–8 May 2026, EGU26-369, https://doi.org/10.5194/egusphere-egu26-369, 2026.

EGU26-833 | Posters on site | AS5.2

Spatiotemporal Estimation of PM2.5 Across Pakistan Using Machine Learning Methods 

Mahad Naveed, Rehan Ahmad, and Abid Omar

Exposure to fine particulate matter (PM2.5​) poses a significant environmental health risk, particularly in regions with limited ground-based monitoring infrastructure like Pakistan. This study presents a machine learning framework that generates hourly PM2.5​ concentration maps at a high spatial resolution. We integrate meterological features from ERA5-Land reanalysis hourly data published by the European Center for Medium-range Weather Forecasts (ECMWF) with ground-based observations from a citizen science network of low-cost sensors. 

Our approach uses model ensembling techniques with multiple tree-based gradient boosted algorithms to improve predictive accuracy of the framework. The ensemble technique captures the complex, non-linear relationships between meteorological variables and surface PM2.5​ concentrations, while improving generalizability and predictive variance.

Preliminary results from cross-validation on an independent test set indicate strong predictive performance, confirming the framework’s capability to reliably estimate pollution concentrations in areas lacking direct measurements. The framework produces spatially complete, high-resolution pollution maps, offering datasets for visualizing and analyzing particulate matter. This work provides a scalable foundation for enhanced exposure assessment, future epidemiological studies, and evidence-based policy-making to mitigate the health impacts of air pollution in data-sparse regions of Pakistan.

How to cite: Naveed, M., Ahmad, R., and Omar, A.: Spatiotemporal Estimation of PM2.5 Across Pakistan Using Machine Learning Methods, EGU General Assembly 2026, Vienna, Austria, 3–8 May 2026, EGU26-833, https://doi.org/10.5194/egusphere-egu26-833, 2026.

EGU26-1154 | ECS | Posters on site | AS5.2

LSTM model for multi-day forecasting of Air Quality Index in urban areas  

Laurel Molina-Párraga, Adrián Canella-Ortiz, Sonia Castillo, Fátima Mirza-Montoro, Juan Andrés Casquero-Vera, Lucas Alados-Arboledas, and Ana del Águila

Air quality forecasting is crucial for assessing population exposure to pollutants and avoid health complications. The Air Quality Index (AQI) is a scale of air pollution that indicates how clean is the air and helps to evaluate these complications. However, predictive models for air quality in European urban environments remain limited.

This index is calculated from air quality monitored data related to different pollutants such as PM2.5, PM10, CO, NO2 and O3 and there are six categories for the AQI: Good, Moderate, Fair, Poor, Very Poor and Hazardous. This work focuses on the implementation and evaluation of AQI forecast models for Spanish metropolitan areas such as Granada, Madrid and Barcelona. This study provides one of the first applications of LSTM-based AQI forecasting with extended horizons in a southern European environment.

The input data used are pollutant concentrations (PM2.5, PM10, CO, NO2 and O3) from an urban background station and meteorological variables (T, RH, P, wind direction, wind velocity and precipitation) from the nearest available station. Missing values were imputed to address short-term gaps, and all input variables were scaled to ensure stable training. The dataset was then split into 70/15/15 for training, validation and testing, respectively. The model used is a Long Short-Term Memory (LSTM) neural network, implemented to forecast AQI levels for 1 to 3-day horizons. Two AQI formulations were tested: a continuous index and the discrete version defined in national guidelines. Both were used to evaluate the model, and the continuous AQI consistently outperformed the discrete one. Thus, the continuous AQI was selected for 1-, 2- and 3-day forecasts. In order to improve model performance, additional features were included to capture temporal patterns, and backtesting was applied to obtain a robust performance estimate.

Preliminary conducted for the city of Granada and hourly AQI of PM10 have shown an accuracy in the range of 0.86 to 0.73 for horizons of 1 to 3 days, decreasing with the forecast horizon. The model reproduces the main AQI variability and most index transitions, although its performance is limited by the lack of high AQI levels (<1 %). In sum, these results highlight the potential of LSTM models to support air-quality forecasting in Spanish urban environments, enabling synergistic work with local authorities for early warnings. Future work will focus on improving the 3-day forecast, extending it to other cities with transfer learning.

Acknowledgements:

This work is part of the project funded by the 2024 Leonardo Grant for Researchers and Cultural Creators from the BBVA Foundation and grant JDC2022-048231-I, funded by MICIU/AEI/10.13039/501100011033 and the EU NextGenerationEU/PRTR. The authors also acknowledge the Junta de Andalucía for providing the air quality data.

How to cite: Molina-Párraga, L., Canella-Ortiz, A., Castillo, S., Mirza-Montoro, F., Casquero-Vera, J. A., Alados-Arboledas, L., and del Águila, A.: LSTM model for multi-day forecasting of Air Quality Index in urban areas , EGU General Assembly 2026, Vienna, Austria, 3–8 May 2026, EGU26-1154, https://doi.org/10.5194/egusphere-egu26-1154, 2026.

EGU26-1459 | ECS | Posters on site | AS5.2

Transformers for Air Quality: Enhancing PM2.5 Modelling with Deep Attention Mechanisms 

Pu-Yun Kow and Pu-Ern Kow

In recent years, sustainability has become a global priority, making the mitigation of air pollution—particularly hazardous Particulate Matter (PM)—a paramount societal task. Leveraging air quality data from the Taiwan EPA, this study employs a fine-tuned, pre-trained transformer model to capture the complex, non-linear relationships between various pollutants and PM concentrations. Our results demonstrate that this approach significantly outperforms traditional ANN benchmarks in one-day-ahead predictions. Furthermore, we validate the model’s practical applicability by evaluating its performance under conditions of spatial variability and extreme events. From a statistical and stochastic perspective, the proposed framework can be interpreted as a data-driven approximation of latent stochastic dynamical systems governing pollutant transport and dispersion. This enables probabilistic characterization of forecast uncertainty, tail risks, and rare extreme pollution events, which are critical for risk-sensitive urban environmental governance.

The study offers two main contributions. It applies a large-scale transformer model to capture complex temporal patterns and achieve markedly better PM forecasts than traditional baselines. It also demonstrates strong generalizability through evaluation across varied environmental contexts in Taiwan. The work supports UN SDGs 3, 11,  and 13 by enabling more sustainable urban management, improving public health protection, and strengthening climate resilience, thereby linking advanced AI forecasting with sustainability policy.

How to cite: Kow, P.-Y. and Kow, P.-E.: Transformers for Air Quality: Enhancing PM2.5 Modelling with Deep Attention Mechanisms, EGU General Assembly 2026, Vienna, Austria, 3–8 May 2026, EGU26-1459, https://doi.org/10.5194/egusphere-egu26-1459, 2026.

EGU26-1484 | Posters on site | AS5.2

Toward efficient and physically consistent collision parameterizations using ML methods 

Jen-Ping Chen, Li-Jia Wang, Pei-Chun Tsai, Chi-Shuin Liao, Tsu-Chin Tsai, and Yu-Tze Hong

The representation of hydrometeor collision processes remains a significant source of inaccuracy in bulk microphysics schemes. This work reduces these uncertainties through a unified framework that incorporates theoretical refinements of collision kernels together with machine-learning (ML) parameterizations capable of emulating high-resolution kernel behavior with markedly lower computational expense. The theoretical component incorporates realistic liquid–ice collision efficiencies, terminal velocities, and coalescence or sticking efficiencies derived from laboratory studies, together with turbulence-induced enhancements to cloud-drop collision efficiency based on direct particle simulations. The resulting dataset includes the rate of change of the 0th, 2nd, 3rd, and 6th moments for gamma-type size distributions, along with predicted changes in the shape and density of ice particles. Using Latin Hypercube sampling, 100,000 samples were generated for each collision process and used to train XGBoost-based ML parameterizations.

The ML parameterizations were implemented in a two-moment bulk microphysics scheme within the WRF model and evaluated in an idealized squall-line simulation. Execution-time analyses demonstrate substantial performance gains, with runtime reductions of up to 40% relative to the baseline configuration, while maintaining or improving the physical fidelity of the simulated microphysical processes. These results indicate that the proposed ML-based parameterization framework enhances both physical realism and computational efficiency, offering a promising pathway for next-generation microphysics schemes.

How to cite: Chen, J.-P., Wang, L.-J., Tsai, P.-C., Liao, C.-S., Tsai, T.-C., and Hong, Y.-T.: Toward efficient and physically consistent collision parameterizations using ML methods, EGU General Assembly 2026, Vienna, Austria, 3–8 May 2026, EGU26-1484, https://doi.org/10.5194/egusphere-egu26-1484, 2026.

Lead-containing fine particles (Pb-FPs) from industrial emissions pose significant health risks, but their source-specific characteristics and traceability remain significant knowledge gaps. This study constructed a nationwide Pb-FP multi-metal fingerprint dataset and developed a machine learning–based source apportionment approach for efficient and accurate source attribution of atmospheric Pb-containing particles. Specifically, we presented a comprehensive investigation of Pb-FPs derived from four major industrial sectors in China, i.e. coal-fired power (CFP), iron and steel smelting (ISS), waste incineration power (WIP), and biomass power generation (BP), through systematic analysis of 134 PM samples collected nationwide using single-particle inductively coupled plasma time-of-flight mass spectrometry (spICP-TOF-MS). Our results showed that WIP (5 ×107 particles/mg) and ISS (3.9 ×107 particles/mg) activities emitted significantly higher number concentrations of Pb-FPs compared to CFP and BP sources. Across all sources, Pb–multi-metal FPs accounted for 66.7–81.2 % of total Pb-FPs number concentrations, with the mass fraction of Pb was predominantly ≤ 10 %.

Hierarchical clustering resolved 36 elemental fingerprint clusters with distinct source signatures (e.g., Fe/Mn/Zn-enriched ISS particles versus Si/Al-dominated CFP particles). Building on these fingerprints, we evaluated five machine learning algorithms for source apportionment, with XGBoost emerging as the optimal classifier (F1 score = 0.76, accuracy = 0.77) after intra-fold parameter optimization and cross-validation strategies. Application of the model to PM2.5 samples from Beijing and Shanghai revealed persistent and substantial contributions from ISS-derived Pb-FPs (6.7–38.1 % in Beijing, 10.5–33.7 % in Shanghai), with additional average inputs from CFP (7.4 %), WIP (5.8 %), and BP (12.1 %). These results highlight the dominant role of ISS in atmospheric Pb pollution across industrialized regions of China and provide a basis for explainable source-attribution analysis and future transfer-learning applications.

How to cite: Zhao, X.: Source Apportionment of Lead-Containing Fine Particles from Typical Industrial Emissions: A Machine Learning Approach Based on Source-specific Fingerprints, EGU General Assembly 2026, Vienna, Austria, 3–8 May 2026, EGU26-1718, https://doi.org/10.5194/egusphere-egu26-1718, 2026.

EGU26-1970 | ECS | Orals | AS5.2

Urban height-Aerosol synergy drives globally dampened urban rainfall 

Yuyang Han and Meng Gao

Urbanization modulates precipitation through thermodynamic, dynamical, and aerosol pathways, yet how the rapidly increasing three-dimensional urban height interacts with rising aerosol pollution to shape urban precipitation at the global scale remains unresolved. Here, we quantify the global urban imprint on precipitation using high-resolution satellite precipitation products and attribute its drivers with a glass-box explainable artificial intelligence (XAI) model, the Explainable Boosting Machine (EBM). After controlling for other factors, we find that higher aerosol burden and greater built-up height each tends to enhance urban precipitation when considered individually, but their interaction is antagonistic: at simultaneously high aerosol concentrations and urban heights, their combined effect suppresses precipitation. Simulations with the Weather Research and Forecasting model coupled with chemistry (WRF-Chem) for Delhi, Dakar, and Oklahoma City corroborate this pattern and indicate that the suppression arises primarily because the urban-height–aerosol interaction damps the circulation response associated with the aerosol direct effect. These results address a key gap in understanding how urban vertical growth and air pollution jointly regulate precipitation. They further suggest that, under continued vertical densification and anticipated emission reductions, the urban precipitation enhancement could intensify, with implications for future urban flood-risk management.

How to cite: Han, Y. and Gao, M.: Urban height-Aerosol synergy drives globally dampened urban rainfall, EGU General Assembly 2026, Vienna, Austria, 3–8 May 2026, EGU26-1970, https://doi.org/10.5194/egusphere-egu26-1970, 2026.

EGU26-2027 | ECS | Posters on site | AS5.2

Bulk Phase Dominates Sulfur Dioxide Hydrolysis over Interfacial Processes 

Mile Du, Manyi Yang, Han Wang, Yu Song, and Tong Zhu

Sulfur dioxide (SO2) hydrolysis is a critical step in secondary sulfate formation, which significantly affects air quality and climate change. Since the 1980s, debate has persisted over whether this reaction occurs mainly at the air–water interface or in the bulk phase. In this study, we investigate SO2 hydrolysis in heterogeneous systems using molecular dynamics simulations that are driven by a deep neural network potential with ab initio accuracy. In previous studies, rapid interfacial reactions have been proposed to account for the unexpectedly high SO2 uptake coefficients. In contrast, our results reproduce the observed uptake coefficients but show that interfacial hydrolysis contributes only 1%. We find that hydrolysis is accelerated in the bulk phase, where the denser hydrogen-bond network enhances SO2 electrophilicity and lowers the reaction barrier. The theoretical simulations in this work help to improve the understanding of aqueous sulfate aerosol formation and microdroplet chemistry.

How to cite: Du, M., Yang, M., Wang, H., Song, Y., and Zhu, T.: Bulk Phase Dominates Sulfur Dioxide Hydrolysis over Interfacial Processes, EGU General Assembly 2026, Vienna, Austria, 3–8 May 2026, EGU26-2027, https://doi.org/10.5194/egusphere-egu26-2027, 2026.

Conventional satellite-based aerosol optical depth (AOD) products typically offer coarse spatial resolutions, suitable for large-scale atmospheric studies but inadequate for localized applications such as urban air quality assessments. To address this limitation, we developed a Physics-Informed Convolutional Neural Network (PI-CNN) that estimates AOD at 30m resolution using Top-of-Atmosphere (ToA) reflectance from Landsat imagery over the Delhi and Kanpur regions of the Indo-Gangetic Plain (IGP). The architecture incorporates the Radiative Transfer Model (RTM) equations into the CNN structure, ensuring physically consistent retrievals. The model was trained over Kanpur using physics-based AOD estimates as training targets, and fine-tuned to Delhi through transfer learning. Evaluation against AERONET observations yielded correlation coefficients of 0.81 and 0.78 for Kanpur and Delhi, respectively, with corresponding MAE/RMSE values of 0.046/0.21 and 0.066/0.25. Furthermore, PI-CNN was compared with the traditional SEMARA retrieval method, which captured extreme values more effectively. In contrast, PI-CNN provided smoother, more generalized outputs with higher spatial variability than SEMARA. PI-CNN effectively reproduced the spatial distribution of AOD across different land use land cover (LULC), showing strong consistency with SEMARA and demonstrating its reliability in capturing spatial variations. These findings highlight the potential of PI-CNN as a flexible and scalable framework for retrieving high-resolution, physics-consistent AOD datasets across local to global scales.

How to cite: Kumar Singh, R. and Satyanarayana, A. N. V.: Development of Physics-Informed Convolutional Neural Network (PI-CNN) Model for Retrieval of High-resolution AOD over Cities of Indo-Gangetic Plain, EGU General Assembly 2026, Vienna, Austria, 3–8 May 2026, EGU26-2321, https://doi.org/10.5194/egusphere-egu26-2321, 2026.

For small island developing states (SIDS), the high upfront cost of battery storage hinders investment in renewable energy microgrids. This study proposes that AI-driven, carbon-aware demand-side management can improve project economics by aligning flexible loads (e.g., water pumping) with renewable generation. We introduce a simulation framework for a community-owned microgrid, utilizing a transfer-learned AI model to forecast carbon intensity and a deep reinforcement learning agent to optimize load scheduling. Our techno-economic analysis for a Pacific Island community shows that this AI-optimized approach significantly reduces diesel consumption and battery use. Compared to conventional operation, it lowers the Levelized Cost of Energy (LCOE) and shortens the investment payback period, while quantifying CO₂ reductions. This demonstrates AI's role as a financial catalyst for sustainable, inclusive energy access in data-scarce island settings.

How to cite: Xu, Q., Zhang, H., and Sui, Q.: Accelerating Investment Returns in Island Community Microgrids: An AI-Driven, Carbon-Aware Demand Response Framework with Techno-Economic and Environmental Analysis, EGU General Assembly 2026, Vienna, Austria, 3–8 May 2026, EGU26-2511, https://doi.org/10.5194/egusphere-egu26-2511, 2026.

Fine particulate matter (PM2.5) oxidative potential (OP) is an important indicator of health risk, and it varies substantially across different emission sources. Although concentration–response functions (CRFs) exist that relate PM2.5 mass to its OP, the absence of source-specific OP  CRFs has limited accurate global risk assessment.

In this study, we developed global source-resolved OP CRFs by combining machine learning, statistical modeling, and extensive datasets on PM2.5 concentrations, source apportionment across 50 countries, and more than 10,000 OP measurements from 29 countries. Our results show clear differences in the intrinsic OP per unit mass for major emission sectors, with the following ranking: energy > transportation > industry > agriculture and residential combustion.

Using these CRFs with 2017 PM2.5 source data for 203 countries, we estimated a global average source-resolved OP of 0.78 nmol min⁻¹ m⁻³ (95% confidence interval: 0.39–1.2). The energy sector (33%) and the combined agriculture and residential combustion sector (31%) were the largest contributors at the global scale, though contributions vary widely among countries.

Poisson regression analysis shows that source-resolved OP is a substantially stronger predictor of mortality attributable to PM2.5 than either PM2.5 mass concentration or bulk PM2.5 OP. These findings demonstrate that source-resolved OP provides a more accurate and policy-relevant metric for evaluating mortality risks and guiding targeted air quality interventions.

A full version of this work has been published in the Journal of Environmental Management (2026).

How to cite: Esu, C. O. and Cho, K.: Explainable Machine Learning for Source-Resolved PM2.5 Oxidative Potential: Implications for Global Mortality Burden, EGU General Assembly 2026, Vienna, Austria, 3–8 May 2026, EGU26-2686, https://doi.org/10.5194/egusphere-egu26-2686, 2026.

EGU26-2695 | Posters on site | AS5.2

A Spatiotemporal Deep Learning Framework for Correcting Bias in Global Atmospheric Core Variables 

Yuze Sun, Xiao Zhou, and Xiaomeng Huang

This study introduces ReSA-ConvLSTM, an artificial intelligence (AI) framework for systematic bias correction in numerical weather prediction (NWP). We propose three innovations by integrating dynamic climatological normalization, ConvLSTM with temporal causality constraints, and residual self-attention mechanisms. The model establishes a physics-aware nonlinear mapping between ECMWF forecasts and ERA5 reanalysis data. Using 41 years (1981–2021) of global atmospheric data, the framework reduces systematic biases in 2-m air temperature (T2m), 10-m winds (U10/V10), and sea-level pressure (SLP), achieving a maximum reduction in RMSE of up to 20% for the 7-day T2m forecasts compared to operational ECMWF outputs. The lightweight architecture (10.6M parameters) enables efficient generalization to multiple variables and downstream applications, reducing retraining time by 85% for cross-variable correction while improving ocean model skill through bias-corrected boundary conditions. The ablation experiments demonstrate that our innovations significantly improve the model's correction performance, suggesting that incorporating variable characteristics into the model helps enhance forecasting skills.

How to cite: Sun, Y., Zhou, X., and Huang, X.: A Spatiotemporal Deep Learning Framework for Correcting Bias in Global Atmospheric Core Variables, EGU General Assembly 2026, Vienna, Austria, 3–8 May 2026, EGU26-2695, https://doi.org/10.5194/egusphere-egu26-2695, 2026.

Accurate visibility prediction faces challenges from extreme data imbalance and complex spatiotemporal dependencies. This study develops an enhanced deep learning framework based on Informer architecture for short-term visibility prediction, trained on station-based observations in 2019-2024. To address extreme sample imbalance in visibility data, we have optimized data preprocessing and implemented physical constraints to the Informer architecture, specifically targeting improved prediction of low-visibility events like fog that hold significant public safety implications. First, visibility values were confined to a threshold range of 0.01 to 15 km, followed by a logarithmic-reciprocal transformation to nonlinearly expand the value interval for low-visibility conditions and inherently enhance their weighting within the model. Correspondingly, the activate function at the final output layer was also constrained to this threshold range to ensure physically realistic predictions. In addition, we propose a differentiable Threat Score-based loss function (TSLoss) that complements the mean squared error (MSE) loss, strategically weighting errors in rare low-visibility events. This approach resolves the non-differentiability of regression-to-binary conversion through sigmoid-activated thresholds. For comparative analysis, three models were trained: LSTM, standard Informer, and our modified Informer_TS. Evaluated against two baseline models, the optimized Informer_TS achieves superior performance for rare low-visibility events (≤1 km TS = 0.3, peaking at 0.55 at t+0) especially for significant reduction in false alarms. It performs especially well at coastal fog-prone sites and effectively captures nocturnal low-visibility events with better stability. Interpretability analyses highlight visibility autocorrelation, diurnal cycles, and meridional wind as key features. The algorithm demonstrates significant operational value for maritime and aviation safety through nowcasting of rapid-onset fog.

How to cite: Xia, Y.: A Physics-Informed Deep Learning Framework for Enhancing Rare Low-Visibility Event Prediction, EGU General Assembly 2026, Vienna, Austria, 3–8 May 2026, EGU26-2929, https://doi.org/10.5194/egusphere-egu26-2929, 2026.

This study addresses a critical challenge in AI-based weather forecasting by developing a physics-informed ensemble system (Orthogonal Conditional Nonlinear Optimal Perturbations, O-CNOPs) that bridges the gap between computational efficiency and physical consistency for tropical cyclone (TC) forecasting. Unlike conventional NWP ensembles constrained by computational costs or current AI ensembles limited by inadequate perturbation methods, O-CNOPs generates dynamically optimized perturbations that both capture fastest-growing errors of AI model and maintain physical plausibility. The key innovation lies in its ability to produce orthogonal perturbations that respect the nonlinear dynamics of AI model, yielding physically interpretable probability forecasting and structure of perturbations reflecting dominant dynamical controls. Demonstrating superior deterministic and probabilistic forecasting skills over operational Integrated Forecasting System ensemble prediction system, this work establishes a new paradigm for ensemble forecasting that combines AI's computational advantages with rigorous dynamical constraints. The success in TC track forecasting paves the way for reliable ensemble forecasting across other high-impact weather systems, marking a significant step toward operational AI-based ensemble forecasting system.

How to cite: Duan, W. and Li, Y.: A Synergistic Approach: Dynamics-AI Ensemble in Tropical Cyclone Forecasting, EGU General Assembly 2026, Vienna, Austria, 3–8 May 2026, EGU26-3321, https://doi.org/10.5194/egusphere-egu26-3321, 2026.

This study presents a novel approach for conducting all-day retrieval of cloud macro-physical
properties (single-layer cloud phase, cloud top height, and cloud base height for optical thickness less than 10)
using the Advanced Geostationary Radiation Imager (AGRI) and the Geostationary Interferometric Infrared
Sounder (GIIRS) onboard the geostationary meteorological satellite Fengyun-4A based on machine learning
methods. Model accuracy was compared after integrating ECMWF Reanalysis v5 (ERA-5) data, atmospheric
temperature and moisture profiles, and GIIRS clear-column radiance. Results demonstrate that integrating
GIIRS clear-column radiances can enhance the precision of cloud phase classification and the retrieval of cloud
macro-physical properties. This effectively replaces the role of atmospheric temperature and humidity profiles,
which are typically required for thermal infrared remote sensing retrieval. Moreover, the issue of delayed
acquisition of ERA-5 atmospheric temperature and humidity profiles is mitigated, enabling near real-time and
all-day retrieval of cloud macro-physical properties.

How to cite: Guo, B., Zhang, F., Zhao, Z., Guo, J., and Li, W.: Retrieval of Cloud Macro-Physical Properties Using the FY-4A Advanced Geostationary Radiation Imager (AGRI)and the Geostationary Interferometric Infrared Sounder(GIIRS), EGU General Assembly 2026, Vienna, Austria, 3–8 May 2026, EGU26-3451, https://doi.org/10.5194/egusphere-egu26-3451, 2026.

EGU26-3669 | ECS | Orals | AS5.2

Retrieval of All-Day Cloud Physical Properties from Geostationary Satellite Measurements and Its Application to the Tibetan Plateau 

Zhijun Zhao, Feng Zhang, Wenwen Li, Ben Yang, Qianshan He, and Miao Cai

Clouds play a crucial role in the global water cycle and the balance of the energy budget. The unique topographic and thermal conditions of the Tibetan Plateau (TP) have a profound impact on the formation of regional extreme weather and global climate change. However, existing official cloud products from geostationary satellites suffer from the spatiotemporal discontinuity over the TP.

Therefore, this study develops an all‑day retrieval algorithm of cloud physical properties (CPP) from geostationary satellite measurements using a deep learning model, achieving high-precision retrieval of cloud phase (CLP), cloud top height (CTH), cloud effective radius (CER), and cloud optical thickness (COT). This algorithm not only leverages the spatial structural information of clouds to compensate for the limitations of retrieving thick clouds from thermal infrared channels caused by their weak penetration ability, but also effectively combines the observed advantages of geostationary satellites with a wide coverage and polar-orbiting satellites with high precision.

Based on the retrieved CPP products with spatiotemporal continuity, we further adopted a Tracking Of Organized Convection Algorithm through a three-dimensional segmentatioN (TOOCAN-CPP) method to automatically identify and track the deep convection system (DCS) over the TP and its surrounding areas. The results show that, influenced by the South Asian Summer Monsoon and topographic conditions, DCSs are primarily concentrated in the Southern TP, the Southern Himalayas Front, and the Ganges Plain. The diurnal variation of DCS number follows a unimodal pattern, with a phase difference of approximately 2 hours between the two areas. Additionally, diurnal variation in cloud properties of DCSs and their internal regions is revealed for the first time. Quantitative analysis of the DCS properties with different sizes and lifetimes indicates that these two areas are dominated by small-sized DCS with initial DCS lifetimes under 6 hours. These discoveries provide valuable insights into understanding the development and evolution of DCSs and their climatic effects.

How to cite: Zhao, Z., Zhang, F., Li, W., Yang, B., He, Q., and Cai, M.: Retrieval of All-Day Cloud Physical Properties from Geostationary Satellite Measurements and Its Application to the Tibetan Plateau, EGU General Assembly 2026, Vienna, Austria, 3–8 May 2026, EGU26-3669, https://doi.org/10.5194/egusphere-egu26-3669, 2026.

EGU26-3688 | ECS | Posters on site | AS5.2

Development of a GCN–CALPUFF Hybrid Model for High-Resolution Simulation of PM2.5 and NO2 

Seung-Hee Han, Kwon Jang, Jeong-Bum Lee, Jin-Goo Kang, Hui-Young Yoon, and Dae-ryun Choi

Urban air pollution is characterized by significant spatio-temporal heterogeneity resulting from the complex interplay between regional long-range transport and localized emission sources, posing a major source of uncertainty in exposure assessment and policy formulation. In particular, fine particulate matter (PM2.5) and nitrogen dioxide (NO2) are representative pollutants simultaneously influenced by regional background levels and urban traffic/industrial emissions, necessitating the generation of high-resolution concentration fields. While conventional chemical transport models (CTMs) effectively capture regional-scale distribution and transport processes, they are limited in resolving micro-scale variability driven by complex urban terrain, traffic networks, and localized emission characteristics. Conversely, local dispersion models can precisely depict concentration gradients at fine scales but struggle to consistently incorporate background concentrations transported from outside the domain. Thus, hybrid approach that integrates the strengths of both models is essential.

In this study, we propose a hybrid air quality modeling framework that couples a Graph Convolutional Network (GCN) with the CALPUFF dispersion model. Focusing on Seoul, South Korea, in November 2022, the GCN leverages CMAQ data assimilation outputs to estimate high-resolution (1km⨯1h) regional background fields for PM2.5 and NO2 across the metropolitan area. By integrating these background fields with CALPUFF simulation results, we simulated PM2.5 and NO2 variations at a 100-meter resolution, explicitly accounting for road traffic and localized emission characteristics.

The proposed GCN–CALPUFF hybrid approach overcomes the inherent limitations of single-model frameworks and provides a robust methodology for high-resolution air pollution prediction, with broad applications in urban air quality forecasting, high-resolution exposure and health impact assessments, and evidence-based policy monitoring.

Acknowledgments

"This research was supported by Particulate Matter Management Specialized Graduate Program through the Korea Environmental Industry & Technology Institute(KEITI) funded by the Ministry of Environment(MOE)“


How to cite: Han, S.-H., Jang, K., Lee, J.-B., Kang, J.-G., Yoon, H.-Y., and Choi, D.: Development of a GCN–CALPUFF Hybrid Model for High-Resolution Simulation of PM2.5 and NO2, EGU General Assembly 2026, Vienna, Austria, 3–8 May 2026, EGU26-3688, https://doi.org/10.5194/egusphere-egu26-3688, 2026.

EGU26-3690 | ECS | Posters on site | AS5.2

Sensitivity of Transformer-Based PM2.5 Forecasting to Input Sequence Length 

Kwon Jang, Seung-Hee Han, Kyung-Hui Wang, and Hui-Young Yun

Transformer-based time series models are already widely used in PM2.5 prediction studies due to their ability to learn long-term dependencies. However, despite input sequence length being a key design factor governing prediction performance, systematic evaluations that independently control this factor and examine how its effects vary across forecast lead times and atmospheric conditions remain limited. In particular, quantitative evidence is lacking on whether extending the input sequence length consistently improves long-term forecasting skill, or whether, under certain conditions, excessive historical information can instead degrade forecast stability.

In this study, Seoul—characterized by frequent high-pollution episodes and pronounced seasonal variability—is selected as a case study region. Using hourly observational data from 2018 to 2024, we quantitatively analyze the effects of input sequence length (3, 7, and 15 days) on Transformer-based PM2.5 prediction performance. Vanilla Transformer, Informer, and Autoformer models are evaluated under identical data partitioning, preprocessing, input variable configuration, training strategies, and output structures, allowing the effects of input sequence length to be isolated from other modeling factors. Prediction performance is assessed for short-term (24 h) and long-term (72 h) forecast horizons using MAE and RMSE, enabling joint analysis of error reduction, error accumulation, and forecast stability as input sequence length increases.

The results show that extending the input sequence length from 3 to 7 days leads to reduced short-term prediction errors and improved stability in long-term forecasts across all models. However, further extension to 15 days yields diminishing returns and, in some cases, increased errors for long-term forecasts. In particular, differences in MAE associated with input sequence length reach up to approximately 10–15% for 72 h predictions, indicating that longer input sequences can introduce not only useful long-term dependencies but also redundant or irrelevant historical patterns. Seasonal analyses further reveal that sensitivity to input sequence length is amplified during wintertime conditions with frequent high-pollution events, suggesting that the utilization of accumulated historical information plays a more critical role under stagnant atmospheric regimes.

This study demonstrates that longer input sequences are not universally optimal across all forecast horizons and highlights the need to tailor input sequence length according to forecast lead time and environmental context, even within the same Transformer architecture. By reframing input sequence length as a purpose-driven design parameter rather than a fixed hyperparameter, this work provides empirical guidance for the development and application of Transformer-based PM2.5 forecasting models.

Acknowledgments
"This research was supported by Particulate Matter Management Specialized Graduate Program through the Korea Environmental Industry & Technology Institute(KEITI) funded by the Ministry of Environment(MOE)“
 

How to cite: Jang, K., Han, S.-H., Wang, K.-H., and Yun, H.-Y.: Sensitivity of Transformer-Based PM2.5 Forecasting to Input Sequence Length, EGU General Assembly 2026, Vienna, Austria, 3–8 May 2026, EGU26-3690, https://doi.org/10.5194/egusphere-egu26-3690, 2026.

EGU26-3803 | ECS | Posters on site | AS5.2

Learning Aerosol Particle Size by Embedding Airmass Historical Pathways in Multi-Model Deep Learning 

Yuhan Cheng, Xiaoyu Xu, Liwen Wang, Yuanlong Huang, Hui Chen, Xing Wei, Saidur Rahaman, Dongmei Cai, Bing Qi, Ying Chen, Chaopeng Shen, Minghuai Wang, and Xianda Gong

Particle number size distribution (PNSD) is a cornerstone property of atmospheric aerosols and is essential for quantifying aerosol–cloud interactions. Although PNSD over continents has been studied comprehensively in the past decades via an extensive in-situ observational network worldwide, estimating marine PNSD (where clouds are more susceptible to aerosol and exert larger climate forcing) remains highly uncertain because of sparse observations, and PNSD varies strongly in space and time during the transport of air parcels. Here, we introduce a framework that integrates air-parcel location history with co-located aerosol, cloud, meteorological, and gas-phase information into deep learning (DL) approaches to constrain aerosol size distributions better. We employ three DL models: two Long Short-Term Memory (LSTM) models and one Bidirectional Long Short-Term Memory (BiLSTM) model. Evaluated against measured PNSD at the Cape Verde Atmospheric Observatory (CVAO) in the central Atlantic over 10 years, all three models achieve a mean fractional error (MFE) below 0.17. We further transfer the well-trained models to Ascension Island (ASI) in the South Atlantic; the predicted PNSD agrees with measurements with an MFE below 0.14, demonstrating strong model transferability. These DL models can therefore be used to project PNSD in remote marine environments. We also assess feature importance across the three models using the SHapley Additive exPlanations (SHAP) method. The models yield inconsistent interpretations of input features, suggesting they do not capture the mechanisms of aerosol formation pathways during transport. We therefore caution that, when using deep learning for mechanistic interpretation, multiple models should be applied for cross-validation to ensure the stability and reproducibility of the results.

How to cite: Cheng, Y., Xu, X., Wang, L., Huang, Y., Chen, H., Wei, X., Rahaman, S., Cai, D., Qi, B., Chen, Y., Shen, C., Wang, M., and Gong, X.: Learning Aerosol Particle Size by Embedding Airmass Historical Pathways in Multi-Model Deep Learning, EGU General Assembly 2026, Vienna, Austria, 3–8 May 2026, EGU26-3803, https://doi.org/10.5194/egusphere-egu26-3803, 2026.

EGU26-3888 | ECS | Posters on site | AS5.2

Generation of Nighttime Visible Reflectance and Its Applications 

Tingting Zhou, Feng Zhang, Haoyang Fu, and Bin Guo

Visible-band satellite observations provide critical information on cloud structure and organization but are fundamentally unavailable at night, creating a long-standing gap in all-day Earth system monitoring. This limitation restricts the use of visible-band information in tracking cloud evolution, characterizing diurnal variability, and assessing nighttime tropical cyclone (TC) intensity and structure. Here, we present RefDiff, a diffusion-based probabilistic generative framework that generates nighttime visible reflectance by learning the statistical mapping between thermal infrared brightness temperature (BT) and daytime visible reflectance from geostationary satellites. Trained exclusively on daytime data and applied to nighttime conditions without nighttime supervision, the proposed approach generates spatially coherent, daytime-consistent visible reflectance and enables uncertainty estimation. Quantitative evaluation shows that RefDiff achieves clear accuracy improvements relative to deterministic deep-learning baselines, with the most pronounced gains for cloud systems characterized by complex structures and high optical thickness. We further show that the generated visible reflectance (GVR) significantly improves the accuracy of TC intensity estimation during nighttime. These results establish a new paradigm for all-day visible satellite observations, enabling continuous monitoring of clouds and storms across the diurnal cycle.

How to cite: Zhou, T., Zhang, F., Fu, H., and Guo, B.: Generation of Nighttime Visible Reflectance and Its Applications, EGU General Assembly 2026, Vienna, Austria, 3–8 May 2026, EGU26-3888, https://doi.org/10.5194/egusphere-egu26-3888, 2026.

Machine learning (ML), particularly deep learning (DL), is becoming increasingly central to geophysical data assimilation (DA), serving to enhance classical methods, complement them, or potentially replace parts of the DA cycle altogether. This talk reviews recent developments and outlines promising directions for integrating ML into DA, and ultimately improve forecasting in the geosciences. For instance, ML can be used to develop auto-differentiable emulators for dynamics, parametrisations, or model-error corrections, which can be seamlessly incorporated into variational DA frameworks. ML also enables adaptive and efficient exchanges of information among the state, observation, and latent spaces in which DA analysis computations occur. In ensemble DA, ML can improve forecast ensemble generation and facilitate the efficient tuning of hyperparameters through auto-differentiable DA implementations. Moreover, ML opens the possibility of learning and replacing the analysis step, or even the full DA and forecast cycle, in an end-to-end manner. I will illustrate these opportunities with two examples: one in which DL is used to discover new and efficient analysis operators, and another in which generative AI is embedded within classical DA schemes.

How to cite: Bocquet, M.: Machine learning–driven advances in geophysical data assimilation, EGU General Assembly 2026, Vienna, Austria, 3–8 May 2026, EGU26-3932, https://doi.org/10.5194/egusphere-egu26-3932, 2026.

EGU26-3959 | ECS | Orals | AS5.2

Cloud Property Retrieval and Uncertainty Estimation from FY-4B AGRI Using Conditional Diffusion 

Wenwen Li, Dawei Zhang, Feng Zhang, Renhe Zhang, and Feng Lu

Generative models are increasingly used for quantitative remote-sensing retrievals, yet the physical interpretability and reliability of their ensemble-based uncertainty estimates remain insufficiently assessed. We introduce RTMDiff, a retrieval framework that couples a conditional diffusion model with radiative transfer model (RTM) simulations to retrieve cloud properties and associated uncertainties from multi-channel thermal infrared (TIR) observations of FY-4B AGRI, enabling consistent day–night retrievals. RTMDiff is evaluated against a Bayesian optimal-estimation (OE) baseline using the same forward RTM, showing that the diffusion-based ensembles yield stable uncertainty estimates while preserving physical consistency. Comparisons with independent MODIS and CALIPSO products further support the realism of the retrieved cloud fields, with particularly clear improvements for low-level, optically thick clouds where pixel-wise OE is constrained by limited spectral sensitivity in TIR.

How to cite: Li, W., Zhang, D., Zhang, F., Zhang, R., and Lu, F.: Cloud Property Retrieval and Uncertainty Estimation from FY-4B AGRI Using Conditional Diffusion, EGU General Assembly 2026, Vienna, Austria, 3–8 May 2026, EGU26-3959, https://doi.org/10.5194/egusphere-egu26-3959, 2026.

EGU26-4034 | ECS | Posters on site | AS5.2

Machine Learning Calibration of Cloud Parameterization in a Numerical Weather Prediction Model 

Yutong Chen and Johannes Quaas

Cloud parameterization introduces uncertainty in numerical weather prediction (NWP), partly arising from the “tunable parameters”. However, the selection of the parameter values, namely calibration, has long been criticized for its arbitrariness, its tendency to induce error compensation, and its high computational cost. The development of machine learning (ML) methods in geoscientific research offers new tools to improve traditional calibration approach. Here, we propose a new framework for the objective calibration of cloud parameterization in the state-of-art ICON-NWP model. A trained machine learning model based on Gaussian Process Regression (GPR) will serve as a surrogate model for the numerical model, which allows sufficiently large ensembles under limited computation resources. History matching is adopted to quantify a plausible range for parameter values. We expect this framework to reveal the spatiotemporal distribution and cloud-regime dependency of paramters, which will provide us with a new insight into cloud parameterization and the underlying physics. In the future, we will further analyse the calibration results, especially regarding its impacts on aerosol-cloud radiative forcing and cloud–climate feedback.

How to cite: Chen, Y. and Quaas, J.: Machine Learning Calibration of Cloud Parameterization in a Numerical Weather Prediction Model, EGU General Assembly 2026, Vienna, Austria, 3–8 May 2026, EGU26-4034, https://doi.org/10.5194/egusphere-egu26-4034, 2026.

EGU26-4881 | ECS | Posters on site | AS5.2

AI-Augmented High-Frequency Reconstruction of Online VOC Observations and Implications for Atmospheric Chemistry Mechanism Modeling 

Yong Cheng, Xiao-Feng Huang, Yan Peng, and Ling-Yan He

The growing integration of artificial intelligence (AI) and atmospheric observations is opening new opportunities to resolve fast, nonlinear processes in atmospheric chemistry. A key bottleneck is the limited temporal resolution of routine volatile organic compound (VOC) monitoring, which weakens observational constraints on rapid chemical evolution and can bias process-based simulations of secondary pollution. Current VOC measurements rely primarily on gas chromatography–mass spectrometry (GC–MS) and proton-transfer-reaction time-of-flight mass spectrometry (PTR-ToF-MS). GC–MS is favored for accurate compound identification but is limited by relatively low temporal resolution. Conversely, PTR-ToF-MS can achieve minute-scale resolution by directly ionizing samples, yet it struggles to detect compounds with low proton affinity. Here, based on five years of long-term online monitoring data, we propose an Adaptive Convolutional Tree Ensemble (ACTE) model to overcome the limitations of current instruments and reconstruct VOC concentrations at 5-minute resolution. Our results indicate that ACTE consistently achieves robust predictive accuracy across major chemical classes, with R2 values of 0.92 and 0.89 for alkanes and alkenes, respectively, many of which have relatively low proton affinity. Furthermore, using ozone photochemical simulations driven by VOC inputs at different temporal resolutions, we find that higher-resolution inputs more accurately capture rapidly evolving photochemical reactions, whereas hourly inputs tend to overlook short-term variability, potentially biasing mechanistic interpretation. Our findings demonstrate how machine learning (ML)-enabled temporal super-resolution can bridge routine monitoring and mechanism-based modeling, improving process-level diagnosis of atmospheric chemical evolution.

How to cite: Cheng, Y., Huang, X.-F., Peng, Y., and He, L.-Y.: AI-Augmented High-Frequency Reconstruction of Online VOC Observations and Implications for Atmospheric Chemistry Mechanism Modeling, EGU General Assembly 2026, Vienna, Austria, 3–8 May 2026, EGU26-4881, https://doi.org/10.5194/egusphere-egu26-4881, 2026.

Seasonal droughts and floods are among the world’s most severe natural disasters, threatening socioeconomic development and human life and property, making accurate seasonal prediction a key need for disaster risk reduction. Yet, the high complexity of precipitation anomalies driven by multi-scale variations, multiple factors, and atmospheric nonlinear chaos, which makes such forecasts a global challenge. Climate modes (e.g., ENSO), as major drivers of seasonal precipitation anomalies, are essential predictors. Systematically assessing their contributions to predictability and developing prediction methods based on their influence are therefore of great scientific and practical value for understanding and forecasting seasonal droughts and floods.

Addressing seasonal rainfall prediction challenges, the SMART, the acronym for Singular predictable climate Modes (SM) and Anomalous Relative Tendency (ART), climate prediction principle is proposed by Prof. Xiu-Qun Yang from Nanjing University. It contains 4 major steps: 1. Online temporal-scale separation (ART); 2. Extracting optimal singular climate modes (SM); 3. Constructing SMART model based on SM and ART; 4. Predicting with ART and Recent Background Anomalous (RBA). This study develops two ensemble prediction methods based on SMART principle, which combine the impacts of climate modes on China’s flood-season precipitation anomalous relative tendencies (ART) with multiple artificial intelligence (AI) models and multi-parameter perturbation scheme, including the SMART Optimal combined Multiple AI Method (OMAI) and SMART Ensemble AI Method (EAI). These two methods demonstrate significant predictive skill improvements over MME direct predictions. For example, using 160 stations historical precipitation data in China and historical circulation datasets, multiple key tropical and extratropical climate modes affecting to the ART of China’s flood-season (JJA) precipitation are extracted by SVD method. The SMART-OMAI method integrates these modes with multiple AI models, while SMART-EAI incorporates multi-parameter perturbations with LSTM model. Independent validation for flood-season precipitation anomalies in China during 1994-2016 via these two methods, yields PS scores of 76.5 and 76.4, respectively over 5% higher than dynamical-statistical models (73.2) and over 20% better than direct MME direct predictions (63.5). Anomaly correlation coefficients reach 0.16 and 0.14, marking qualitative improvements over MME direct predictions (0.01), with notable temporal correlation enhancements in North China and Northeast China. By merging the physical basis of the climate modes with non-linear predictive strengths of AI models, these two AI-based prediction methods offer a scientifically robust and practical solution, that is, a SMART solution for seasonal rainfall prediction in China.

Prediction skill evaluation for SMART-AI, SMART-LR (combined with linear regression model) and C3S

How to cite: Wang, Y., Yang, X.-Q., and Sun, X.: SMART-AI: A High-Performance Prediction Method for Seasonal Rainfall in China Based on the Impacts of Climate Modes and the Artificial Intelligence, EGU General Assembly 2026, Vienna, Austria, 3–8 May 2026, EGU26-6177, https://doi.org/10.5194/egusphere-egu26-6177, 2026.

Large-scale vegetation restoration has been performed to improve the fragile ecological environment of the Loess Plateau in the last decades. At present, the effects and mechanism of long-term vegetation restoration on soil properties in ecosystems require further exploration to provide a reference for rational ecological construction. Hence, we investigated the differences in vegetation attributes and soil properties between three typical vegetation types (Pinus tabulaeformis plantation forest, PTPF; Robinia pseudoacacia plantation forest, RPPF; natural secondary forest, NSF) after long-term (30–40 years) vegetation restoration in the western Loess Region, China. Our results showed that (1) the arborous synusia biomass of the plantation forests was twice that of NSF, whereas NSF had almost 50% higher near-surface synusia biomass than the plantation forests; (2) the soil nutrient contents of the plantation forests were lower (30%) than those of NSF; (3) the soil bulk density, organic matter, total nitrogen, and phosphorus were positively related to arborous and shrub synusia biomass; (4) the coupling effects of four biological synusiae (with the contribution of 47.67%) were the dominant factors affecting soil physicochemical properties. Natural forests have the better vegetation attributes and soil properties than plantation forests, indicating that the close-to-nature restoration should be considered in ecological restoration. These findings can provide scientific support and theoretical basis for reforestation and ecological restoration in the Loess Plateau region and similar areas in the future.

How to cite: Zhang, Y.: Effects of long-term vegetation restoration on soil physicochemical properties mainly achieved by the coupling contributions of biological synusiae to the Loess Plateau, EGU General Assembly 2026, Vienna, Austria, 3–8 May 2026, EGU26-6482, https://doi.org/10.5194/egusphere-egu26-6482, 2026.

EGU26-6773 | ECS | Posters on site | AS5.2

Boosting Arctic Air Quality Forecasts with Deep Learning 

Ilaria Crotti, Alice Cuzzucoli, Antonello Pasini, and Srdjan Dobricic

Air pollution poses a critical risk to both human health and the environment, particularly in the Arctic and Northern Europe, where pollutants are primarily transported from mid-latitudes by atmospheric circulation. Also, local sources further contribute to pollution levels in Arctic communities. Accurate short-term forecasts of atmospheric pollutant concentrations are vital for enabling adaptive measures and protecting public health during pollution episodes.

The Copernicus Atmospheric Monitoring Service (CAMS) provides 96-hour forecasts for key pollutants across Europe using 11 state-of-the-art models and an ensemble approach. However, these forecasts exhibit significant errors in Northern Europe and the Arctic. To address this, we investigate the applicability of deep learning (Transformer-based) models for 48-hour PM10 concentration forecasting at monitoring stations in Northern Europe. Our approach integrates in situ PM10 observations with CAMS model outputs and forecasted meteorological parameters as input features. We evaluated four time-series specialized models—Informer, Autoformer, FEDformer, and Crossformer—to identify the most effective architecture for this task. The Crossformer model demonstrated superior performance, outperforming CAMS by 30% in Mean Squared Error (MSE) and 23% in Mean Absolute Error (MAE). It also surpassed the newly introduced CAMS Model Output Statistics (MOS), reducing MSE by 12% and MAE by 14%.

With its low computational complexity, fast execution time, and minimal resource requirements, the Crossformer presents a viable alternative to traditional numerical models for local-scale predictions. Future work will extend the forecasting window to 72 hours and incorporate additional pollutants, such as PM2.5, NO2, and O3, to enhance predictive capabilities for Arctic and Northern European communities.

How to cite: Crotti, I., Cuzzucoli, A., Pasini, A., and Dobricic, S.: Boosting Arctic Air Quality Forecasts with Deep Learning, EGU General Assembly 2026, Vienna, Austria, 3–8 May 2026, EGU26-6773, https://doi.org/10.5194/egusphere-egu26-6773, 2026.

EGU26-6806 | ECS | Posters on site | AS5.2

Super-Resolution Surrogate Downscaling of MRI-ESM2(CMIP6) Black Carbon Surface Concentration Using Attention Based Convolutional Neural Networks 

Kunal Mishra, Mizuo Kajino, Tsuyoshi Thomas Sekiyama, and Naga Oshima

Tropospheric Black Carbon (BC) aerosols are short lived positive radiative forcer with critical impacts on cardiovascular and pulmonary health. The MRI-ESM2(CMIP6) delivers the BC monthly global surface concentration from 1950-2100 at coarse special resolution of 1.875° × 1.875° which does not capture the city level BC hotspots at the global scale. The BC hotspots are essential for reducing the BC aerosols induced health burden, implementing air quality management policies and regional planning. The downscaling algorithm is an enhanced U-net with attention-based convolution neural network (Super Resolution Convolution Neural Network (SRCNN)). The SRCNN model executes downscaling of MRI-ESM2(CMIP6) BC monthly surface concentration with special resolution of 1.875° × 1.875° to NASA’s MERRA2 reanalysis BC monthly average surface concentration at a spatial resolution of 0.5° × 0.625°, thus achieving 3.6 times downscaling for identification city level BC-hotspots and cold spots at a global scale. The SRCNN model is trained on global monthly average BC surface concentration data from MRI-ESM2(CMIP6) and NASA’s MERRA2 reanalysis product. The model training is spread from 1980-2012(31 years) with validation from 2013-2016(4 years) and testing for 2017-2020(4 years). We have also examined the effects of Channel Based Attention Module (CBAM) with and without Residual Block (RB) and their effectiveness and efficacy in climate data downscaling with data-scarce condition. The training results showes that CBAM with RB based CNN outperforms then both (CNN without CBAM and without CBAM & RB) in the benchmarks such as stability, overfitting, validation losses etc. The training results for SRCNN (with CBAM and RB) shows a final validation losses of 0.0028, final R² value of 0.7162, final Pearson-r value of 0.8467 with Structural Similarity Index Measure (SSIM) at 0.9954. The SRCNN (with CBAM & RB) model testing reveals it performs exceptionally well in the identification of hotspots and cold-spots, with final testing RSME at 0.0015, final R2 at 0.88, final Pearson-r values at 0.94 and final SSIM at 0.99. Furthermore, testing outputs of SRCNN with attention module and residual blocks shows close fidelity with MERRA2 reanalysis vis-à-vis MRI-ESM2(CMIP6) at both seasonal and annual temporal resolution thus reducing systematic bias between ground truth and global climate models.

How to cite: Mishra, K., Kajino, M., Sekiyama, T. T., and Oshima, N.: Super-Resolution Surrogate Downscaling of MRI-ESM2(CMIP6) Black Carbon Surface Concentration Using Attention Based Convolutional Neural Networks, EGU General Assembly 2026, Vienna, Austria, 3–8 May 2026, EGU26-6806, https://doi.org/10.5194/egusphere-egu26-6806, 2026.

EGU26-7029 | ECS | Orals | AS5.2

eMONARCH: a Deep Learning emission sensitive Chemical-Transport Model (CTM) for Air Quality planning 

Michael Orieux, David Mathas, Hervé Petetin, and Isidre Mas Magre

Air pollution is now the second highest risk factor globally, highlighting the importance of air quality simulations, policies, and pollution peaks mitigation. Chemical Transport Models (CTMs) such as MONARCH are essential tools for designing air pollution mitigation plans but are limited by their high computational cost.
In the frame of the AIRE Spanish national project, we are developing eMONARCH, an emission- and meteorology-sensitive deep-learning-based surrogate model of MONARCH. eMONARCH aims at providing a cost-effective tool for generating ensemble of atmospheric composition simulations, supporting needs of air quality planning and data assimilation. We chose to start using a U-Net type architecture as a baseline model for its simplicity. The training dataset is composed of an ensemble of multi-annual MONARCH simulations with pertirbued emissions. A high performance was obtained for one-hour predictions, and we are now engaged in investigating ways to reduce the error accumulation and instabilities in multi-days autoregressive predictions. The first implementation of the model focuses on surface NOₓ concentrations, while the following versions include PMs, and multiple pollutants across several layers of atmosphere. In parallel,  we are also developing a new Graph Neural Network (GNN) architecture composed of an encoder-processor-decoder structure whose preliminary results will also be presented.

How to cite: Orieux, M., Mathas, D., Petetin, H., and Mas Magre, I.: eMONARCH: a Deep Learning emission sensitive Chemical-Transport Model (CTM) for Air Quality planning, EGU General Assembly 2026, Vienna, Austria, 3–8 May 2026, EGU26-7029, https://doi.org/10.5194/egusphere-egu26-7029, 2026.

Reliable estimation of 10-hour dead fuel moisture content (10-h DFMC) is essential for forest fire risk forecasting, particularly in mountainous and fire-prone regions such as Gangwon Province, South Korea. This study presents a machine learning model trained on hourly observed 10-h DFMC data from 11 stations during 2024, using routine meteorological observations from Automatic Weather System (AWS) sensors as input. The goal was to estimate 10-h DFMC in real-time using standard operational inputs. The model inputs consisted of 1-h averages of 2 m air temperature, relative humidity, 10 m wind speed, and 1-h accumulated precipitation. As solar radiation data were unavailable, we included Julian day and hour of day (0–23) as proxy variables to partially account for diurnal and seasonal patterns in solar energy input. The observed 10-h DFMC data revealed distinct seasonal and spatial variation: spring and early winter showed persistently low moisture, consistent with peak fire seasons. High-elevation stations retained moisture longer due to snow cover, while coastal sites exhibited greater variability influenced by maritime air masses. The random forest model achieved high predictive accuracy (R² = 0.80; RMSE = 2.73%; MAE = 1.93%) on the test dataset. Station-level evaluation showed R² ranging from 0.76 to 0.86. Relative humidity was the most influential predictor, while precipitation had marginal impact, suggesting that 10-h DFMC is more sensitive to sustained atmospheric humidity than to short-term rainfall. Comparative experiments confirmed that the random forest approach outperformed linear regression and support vector regression and achieved similar performance to gradient boosting. Snow-affected high-altitude sites showed larger errors, indicating the need for future inclusion of snow-state and terrain-related covariates. This study offers a regionally calibrated, operationally feasible model for 10-h DFMC estimation based solely on widely available AWS data. Its structure is inherently transferable to other regions with localized training data, supporting scalable, real-time fire danger assessment systems under a changing climate. This abstract is based on findings from our peer-reviewed article published in December 2025 under the title: “Machine Learning–Based Analysis and Prediction of 10-h Dead Fuel Moisture Content Using Automated Weather Observations in Gangwon Province, South Korea.” This research was funded by the Korea Meteorological Administration Research and Development Program “Advanced Research on Bio- and Agricultural Meteorology” (Grant No. KMA2018-00626).

How to cite: Chae, S., Han, Y., and Kim, K. R.: Random Forest-Based Estimation of 10-h Dead Fuel Moisture Using Automatic Weather System Observations in Gangwon, Republic of Korea, EGU General Assembly 2026, Vienna, Austria, 3–8 May 2026, EGU26-8546, https://doi.org/10.5194/egusphere-egu26-8546, 2026.

EGU26-8765 | ECS | Posters on site | AS5.2

Skillful summer precipitation prediction in China using an attention-based Bayesian deep learning network 

Zihan Yang, Shu Gui, Zhiqiang Gong Gong, Guolin Feng, Peng Zi, Taohui Li, and Ruowen Yang Yang

Summer precipitation in China, primarily driven by the East Asian summer monsoon, holds significant socioeconomic implications. Skillful prediction of summer precipitation requires effective multi-model integration of operational climate models. To improve the model integration, this study proposes a novel Bayesian deep learning (BDL) network that integrates convolutional neural networks (CNNs) with attention mechanisms. The BDL network is evaluated using four operational climate models: ECMWF_SEAS51, JMA_CPS3, NCC_CSM11, and NCEP_CFS2. Compared to conventional Bayesian Model Averaging (BMA), the BDL network more accurately captures the spatiotemporal patterns of summer precipitation, improving the anomaly correlation coefficient (ACC), the prediction score (PS), and the root-mean-square error (RMSE). These improvements are primarily attributed to the adaptive weighting of individual model over time. Further analysis identifies NCEP_CFS2 and ECMWF_SEAS51 as the primary contributors to the integrated prediction. This study presents a new perspective for model integration via deep learning, providing an effective approach to enhance summer precipitation prediction.

How to cite: Yang, Z., Gui, S., Gong, Z. G., Feng, G., Zi, P., Li, T., and Yang, R. Y.: Skillful summer precipitation prediction in China using an attention-based Bayesian deep learning network, EGU General Assembly 2026, Vienna, Austria, 3–8 May 2026, EGU26-8765, https://doi.org/10.5194/egusphere-egu26-8765, 2026.

EGU26-8949 | ECS | Orals | AS5.2

Refine Extreme Hot Day Predictions with the Sea Surface Temperature Tendency 

Hui Tan and Zhiwei Zhu

The extreme high temperature in western North America (WNA) exerts profound impacts on industrial and agricultural production, and trigger catastrophic wildfires. Exploring the underlying mechanisms influencing extreme hot days over WNA (WEHDs) and improving the seasonal prediction are of great scientific and social significance. This study reveals that two independent precursor signals, the persistent negative sea surface temperature (SST) anomalies in tropical eastern Pacific and the cooling tendency in tropical North Atlantic SST during springtime exhibit significant influence on WEHDs. A physics-based empirical model constructed using these two predictors exhibits robust independent prediction skills. Guided by the underlying physical mechanisms, we integrate SST tendency fields as critical input features into convolutional neural network (CNN) to further enhance the prediction accuracy. The physically informed CNN achieves significantly improved performance and successfully predicts the extreme WEHD events of 2021. The results emphasize the pivotal role of physical cognition in advancing deep learning-based climate prediction.

How to cite: Tan, H. and Zhu, Z.: Refine Extreme Hot Day Predictions with the Sea Surface Temperature Tendency, EGU General Assembly 2026, Vienna, Austria, 3–8 May 2026, EGU26-8949, https://doi.org/10.5194/egusphere-egu26-8949, 2026.

       While the health impacts of air pollution are established, how public perception evolves with air quality remains unclear. Here, we analyze 180 million geotagged Weibo posts from China (2013–2023) using a natural language processing model to quantify public satisfaction with air quality and examine its relationship with monitored pollutant levels. We find that air quality improved significantly (PM2.5 concentration decreased by 51%), but public satisfaction increased only marginally (8.2%). This reflects progressively stricter subjective standards over time. Regional disparities reveal that economically developed areas exhibit lower tolerance for pollution, driven by heightened public awareness and media exposure. Annually, air pollution triggered negative emotions in 80 million people, influencing governance priorities. The findings underscore the dynamic interplay between air quality, public perception, and socioeconomic factors, advocating for adaptive policies integrating behavioral metrics to align with evolving public expectations. This work highlights the need for perception-aware environmental governance globally. 

How to cite: Cheng, Z.: Dynamic Public Perception of Air Quality in China: Implications for Adaptive Environmental Governance, EGU General Assembly 2026, Vienna, Austria, 3–8 May 2026, EGU26-9091, https://doi.org/10.5194/egusphere-egu26-9091, 2026.

EGU26-9209 | ECS | Posters on site | AS5.2

Employing Deep Learning to Quantify the Trends in Tropical Cyclones and Associated Extreme Precipitation Events in Southern China 

Yueya Wang, Xiaoming Shi, and Chi-hung, Jimmy Fung

Extreme wind and precipitation events result in signicant societal disruption in the South China coastal region, typically triggered by tropical cyclones (TCs) or mesoscale storms. The large-, meso-, and small-scale atmospheric circulation processes that can influence these high- impact weather events may be altered by climate change, potentially changing TC characteristics. However, quantifying the sensitivity of TCs and extreme precipitation to climate change is challenging, primarily due to the limited detail provided by global model simulations with coarse resolution. High-resolution simulations are essential to address such issues. We have developed a smart dynamical downscaling (SDD) model to downscale the climate simulations (100 km) to high-resolution simulations (15 km). The trained SDD model can be applied to ensemble climate simulations under the SSP585 scenario from 2020 to 2100 to explore the variations of the severe TC cases, regarding the spatial distribution, maximum surface wind, and precipitation, respond to global warming. We found the inland areas of China will be affected more by TC-induced extreme precipitation and the intense typhoons are increased in the future based on the ensemble downscale results. The high-resolution simulations are conducted for selected extreme precipitation events to further under the dynamical response to global warming.

How to cite: Wang, Y., Shi, X., and Fung, C.-J.: Employing Deep Learning to Quantify the Trends in Tropical Cyclones and Associated Extreme Precipitation Events in Southern China, EGU General Assembly 2026, Vienna, Austria, 3–8 May 2026, EGU26-9209, https://doi.org/10.5194/egusphere-egu26-9209, 2026.

EGU26-9358 | ECS | Orals | AS5.2

Data-driven global air quality model 

Danyue Zhao, Chenliang Tao, and Zhen Cheng

Operational global air quality forecasting often faces a critical trade-off between computational efficiency and the high spatial resolution required for effective pollution governance. Conventional numerical models are computationally expensive when resolving sub-grid processes, while standard data-driven approaches often struggle to capture global long-range dependencies effectively. In this work, we present a purely data-driven yet geometry-aware framework designed to predict and downscale global atmospheric composition fields. The framework operates in two stages to balance global dynamics with local fidelity. The first stage employs a Spherical Fourier Neural Operator (SFNO), trained on two decades of reanalysis data, meteorological fields, and emission fields. This model learns to evolve global concentrations of seven key pollutants (including PM2.5, PM10, O3, CO, NO2, SO2, and NO) at a 0.75° resolution. To provide finer spatial detail in regions of interest, the coarse-resolution predictions are downscaled to 0.1° × 0.1° using a Schrödinger Bridge–based stochastic super-resolution approach, while maintaining statistical consistency between the original and refined fields. This two-stage framework allows efficient generation of high-resolution global and regional air quality fields, while reducing the computational demands compared to conventional chemical transport models. The resulting model provides a practical tool for investigating pollutant transport and for supporting the evaluation of emission control strategies across multiple spatial scales.

How to cite: Zhao, D., Tao, C., and Cheng, Z.: Data-driven global air quality model, EGU General Assembly 2026, Vienna, Austria, 3–8 May 2026, EGU26-9358, https://doi.org/10.5194/egusphere-egu26-9358, 2026.

In 2024, the China Meteorological Administration (CMA), in collaboration with Tsinghua University, developed the “Fengqing” forecasting system following an innovative "AI-Physics" hybrid approach. Through designs such as a multi-scale latent space projection architecture and an energy-conservation loss function, the model has been equipped with global short-and medium-range weather forecasting capabilities and has been operationally implemented. This study comprehensively evaluated the forecasting ability of the Fengqing in China and its surrounding areas in 2024 from several metrics such as forecasting accuracy and bias distribution. It also focused on two kinds of typical synoptic processes, typhoons and rainstorms, to deeply explore the model's performance in forecasting of disastrous weather. The results show that the 500 hPa geopotential height forecasts maintain predictive skill beyond 10 days in Fenging. The Root Mean Square Error (RMSE) for the 2 m surface air temperature and the 850 hPa temperature in the upper air is significantly lower than that of the European Centre for Medium-Range Weather Forecasts (hereafter, ECMWF-IFS), with a maximum improvement of 37.66%. In terms of typical weather processes, the Fengqing model demonstrates marginally superior performance in typhoon track forecasting compared to ECMWF-IFS, though exhibits systematic underestimation in typhoon intensity prediction. In addition, the Fengqing model exhibits superior torrential rainfall forecasting capabilities, demonstrating precise prediction of typhoon-induced precipitation patterns and Mei-yu front rainfall belt positioning. The TS score for heavy rain forecasts in the medium-term (73-168h lead time) improvements reaching 43.53% compared to that of ECMWF-IFS forecasts. Overall, the Fengqing model demonstrates considerable potential in operational forecasting, although further improvements are needed in forecast activity and typhoon intensity prediction at medium- to long-range lead times.

How to cite: Li, N., Gong, Y., and Cao, Y.: Preliminary Evaluation the Operational Application Effect of "Fengqing", an AI-based Global Short and Medium Range Forecasting System  , EGU General Assembly 2026, Vienna, Austria, 3–8 May 2026, EGU26-9465, https://doi.org/10.5194/egusphere-egu26-9465, 2026.

EGU26-9795 | ECS | Posters on site | AS5.2

Winter-autumn air pollution control plan in North China modified the PM2.5 compositions and sources in Central China 

Shuning Jiang, Shaofei Kong, and Pingqing Fu

The additional impact of emission-reduction measures in North China (NC) during autumn and winter on the air quality of downwind regions is an interesting but less addressed topic. The mass concentrations of routine air pollutants, the chemical compositions, and sources of fine particles (PM2.5) for January 2018, 2019, and 2020 at a megacity of Central China were identified, and meteorology-isolated by a machine-learning technique. Their variations were classified according to air mass direction. An unexpectedly sharp increase in emission-related PM2.5 by 22.7% (18.0 μg m−3) and 25.7% (19.4 μg m−3) for air masses from local and NC in 2019 was observed compared to those of 2018. Organic materials exhibited the highest increase in PM2.5 compositions by 6.90 μg m−3 and 6.23 μg m−3 for the air masses from local and NC. PM2.5 source contributions related to emission showed an upsurge from 1.39 μg m−3 (biomass burning) to 24.9 μg m−3 (secondary inorganic aerosol) in 2019 except for industrial processes, while all reduced in 2020. From 2018 to 2020, the emission-related contribution of coal combustion to PM2.5 increased from 10.0% to 19.0% for air masses from the local area. To support the priority natural gas quotas in northern China, additional coal in cities of southern China was consumed, raising related emissions from transportation activities and road dust in urban regions, as well as additional biofuel consumption in suburban or rural regions. All these activities could explain the increased primary PM2.5 and related precursor NO2. This study gave substantial evidence of air pollution control measures impacting the downwind regions and promote the necessity of air pollution joint control across the administration.

How to cite: Jiang, S., Kong, S., and Fu, P.: Winter-autumn air pollution control plan in North China modified the PM2.5 compositions and sources in Central China, EGU General Assembly 2026, Vienna, Austria, 3–8 May 2026, EGU26-9795, https://doi.org/10.5194/egusphere-egu26-9795, 2026.

EGU26-9912 | Posters on site | AS5.2

Leveraging Artificial Intelligence for the automated processing and analysis of real-time atmospheric data 

Martha Arbayani Zaidan, Abdur Rahman, Hasan Sarwar, Samuel Chua, Dominik Rohal, Juha Kangasluoma, Katrianne Lehtipalo, Tuukka Petäjä, and Sasu Tarkoma

The volume and complexity of atmospheric data have expanded significantly, driven by the proliferation of low-cost sensor networks, high-fidelity research stations, and multi-platform remote sensing. However, the utility of these datasets is often hindered by inherent noise in low-cost hardware, the necessity for labor-intensive manual analysis, and limited spatial coverage. This work explores the integration of Artificial Intelligence (AI) and Machine Learning (ML) to automate data processing workflows, ensuring high-quality, scalable, and real-time atmospheric insights. 

We present several case studies demonstrating the effectiveness of AI in bridging data gaps and enhancing analytical accuracy. First, we discuss the development of "virtual sensors" for Ozone (O3) monitoring, designed for deployment within micro-measurement stations where physical chemical sensors may be impractical. Second, we introduce a novel, robust fitting algorithm for Particle Number Size Distributions (PNSD) that operates in near real-time, offering superior reliability over traditional iterative methods. Third, we showcase a predictive model that fuses satellite remote sensing data with ground-level observations to estimate and spatially scale PM2.5 concentrations, providing high-resolution coverage in previously unmonitored areas. 

Beyond traditional data processing, this work outlines the broader potential of emerging AI technologies to address remaining atmospheric challenges. We explore the implementation of EdgeAI for on-device sensor calibration and the use of Computer Vision to quantify traffic and human activity, thereby providing critical metadata for source apportionment. By integrating these automated technologies, we demonstrate a path toward a more responsive and comprehensive framework for air quality and atmospheric data analysis. 

How to cite: Zaidan, M. A., Rahman, A., Sarwar, H., Chua, S., Rohal, D., Kangasluoma, J., Lehtipalo, K., Petäjä, T., and Tarkoma, S.: Leveraging Artificial Intelligence for the automated processing and analysis of real-time atmospheric data, EGU General Assembly 2026, Vienna, Austria, 3–8 May 2026, EGU26-9912, https://doi.org/10.5194/egusphere-egu26-9912, 2026.

Currently, weather forecasting still relies primarily on Numerical Weather Prediction (NWP) models. While recent advances in machine learning (ML) have demonstrated the potential of ML-based forecasting models to revolutionize NWP, these models often struggle to accurately estimate the initial atmospheric states from raw observations and generate precise weather forecasts. To address this challenge, FuXi Weather introduces an innovative machine learning-based paradigm that integrates multi-source global observations to generate high-resolution analysis fields and medium-range forecasts. Notably, its performance across the vast majority of forecast targets is comparable to the ECMWF High-Resolution (HRES) model. This breakthrough signifies that AI-driven meteorological systems have evolved from experimental prototypes into mature, real-world solutions capable of competing with the most sophisticated traditional NWP frameworks.

How to cite: xu, X. and sun, X.: FuXi Weather-2: A unified neural paradigm for accurate global weather assimilation and forecasting, EGU General Assembly 2026, Vienna, Austria, 3–8 May 2026, EGU26-10666, https://doi.org/10.5194/egusphere-egu26-10666, 2026.

EGU26-11448 | ECS | Orals | AS5.2

FourCastNet 3: A geometric approach to probabilisticmachine-learning weather forecasting at scale 

Boris Bonev, Thorsten Kurth, Ankur Mahesh, Mauro Bisson, Marius Koch, Georg Ertl, Dallas Foster, Alberto Carpentieri, Jean Kossaifi, Karthik Kashinath, Anima Anandkumar, William D. Collins, Michael S. Pritchard, and Alexander Keller

FourCastNet 3 advances global weather modeling by implementing a scalable, geometric machine
learning (ML) approach to probabilistic ensemble forecasting. The approach is designed to respect
spherical geometry and to accurately model the spatially correlated probabilistic nature of the
problem, resulting in stable spectra and realistic dynamics across multiple scales. FourCastNet 3
delivers forecasting accuracy that surpasses leading conventional ensemble models and rivals the best
diffusion-based methods, while producing forecasts 8 to 60 times faster than these approaches. In
contrast to other ML approaches, FourCastNet 3 demonstrates excellent probabilistic calibration
and retains realistic spectra, even at extended lead times of up to 60 days. All of these advances
are realized using a purely convolutional neural network architecture tailored for spherical geometry.
Scalable and efficient large-scale training on 1024 GPUs and more is enabled by a novel training
paradigm for combined model- and data-parallelism, inspired by domain decomposition methods in
classical numerical models. Additionally, FourCastNet 3 enables rapid inference on a single GPU,
producing a 60-day global forecast at 0.25°, 6-hourly resolution in under 4 minutes. Its computational
efficiency, medium-range probabilistic skill, spectral fidelity, and rollout stability at subseasonal
timescales make it a strong candidate for improving meteorological forecasting and early warning
systems through large ensemble predictions.

How to cite: Bonev, B., Kurth, T., Mahesh, A., Bisson, M., Koch, M., Ertl, G., Foster, D., Carpentieri, A., Kossaifi, J., Kashinath, K., Anandkumar, A., Collins, W. D., Pritchard, M. S., and Keller, A.: FourCastNet 3: A geometric approach to probabilisticmachine-learning weather forecasting at scale, EGU General Assembly 2026, Vienna, Austria, 3–8 May 2026, EGU26-11448, https://doi.org/10.5194/egusphere-egu26-11448, 2026.

EGU26-11742 | Posters on site | AS5.2

Emulating tropospheric chemistry mechanisms with deep neural networks 

Hervé Petetin, Alessio Melli, Camille Mouchel-Vallon, Isidre Mas Magre, Oriol Jorba Casellas, Klaus Klingmüeller, Sergey Gromov, Leon Kuhn, Rolf Sander, Timothy Butler, Markus Thürkow, and Andrea Pozzer

Chemical transport models (CTMs) are essential tools for investigating the chemical processes at stake in the atmosphere and supporting needs on air quality assessment and planning. Yet, they typically require massive computational resources to solve the system of stiff ordinary differential equations governing atmospheric chemical kinetics (many reactions and species with highly variable abundances and kinetic time scales), which limits the resolution of simulations and/or the level of complexity of the chemistry representation. 

In the frame of the EACH (Emulating Atmospheric Chemistry) project involving the Barcelona Supercomputing Center, the Max Planck Institute for Chemistry,and Freie Universität Berlin, we are investigating the potential of deep learning to emulate the chemistry, focusing first on gas phase chemistry, with the ultimate goal of being able to accelerate CTM simulations. More specifically, we assess the performance and generalization capability of dense deep feedforward neural networks based on the multilayer perceptron (MLP) architecture using two test mechanisms: POLLU[1], a simplified tropospheric ozone formation mechanism (20 species, 25 reactions), and CB05[2], a condensed mechanism of atmospheric oxidant chemistry (59 species, 156 reactions) used in many CTMs. Training datasets were generated from millions of 0D chemical box-model simulations, with initial conditions sampled from uniform multidimensional distributions. For each experimental setup, a systematic hyper-parameter search was conducted to identify the optimal configuration. We trained several MLP variants incorporating physical consistency through both hard (architectural) and soft (loss-function-based) physical constraints designed to preserve stoichiometric relationships and enforce non-negativity of concentrations, and we assessed mass conservation using tailored evaluation metrics. The sensitivity of the MLPs performances to the number of training time series and their length was explored to examine the impact of data design on model performance.

[1] Verwer, J. G. (1994). Gauss–Seidel iteration for stiff ODEs from chemical kinetics. SIAM Journal on Scientific Computing, 15(5), 1243-1250.

[2] Yarwood, Greg, et al. (2005). Final report to the US EPA, RT-0400675 8: 13

How to cite: Petetin, H., Melli, A., Mouchel-Vallon, C., Mas Magre, I., Jorba Casellas, O., Klingmüeller, K., Gromov, S., Kuhn, L., Sander, R., Butler, T., Thürkow, M., and Pozzer, A.: Emulating tropospheric chemistry mechanisms with deep neural networks, EGU General Assembly 2026, Vienna, Austria, 3–8 May 2026, EGU26-11742, https://doi.org/10.5194/egusphere-egu26-11742, 2026.

EGU26-12848 | ECS | Orals | AS5.2

An AI-based downscaling tool to generate a large ensemble of high-resolution wind storm footprints over Europe 

Athul Rasheeda Satheesh, Lubos Sokol, Kim H. Stadelmaier, Lea Eisenstein, Patrick Ludwig, Alexandre M. Ramos, Lukas Braun, Aidan Brocklehurst, Alexandros Georgiadis, and Joaquim G. Pinto

Midlatitude winter storms are a major cause of economic loss and infrastructure damage across Europe. Although reanalysis datasets, such as ERA5, offer reliable near-surface wind gust fields from 1940 onwards, the limited set of winter storm events remains inadequate for catastrophe models. The LArge Ensemble of Regional climaTe modEl Simulations for EUrope (LAERTES-EU) dataset addresses this limitation by providing over 12,000 years of synthetic climate data, yielding a substantially larger catalogue of possible winter storm events. However, a closer analysis revealed that its coarse spatial resolution (~27 km) systematically underestimates extreme wind gusts, which are critical for catastrophe models. High-resolution regional climate model (RCM) simulations using the Icosahedral Nonhydrostatic (ICON) model at 2.5 km grid spacing can accurately capture these extremes. As dynamical downscaling of the entire LAERTES-EU dataset is computationally extortionate, other solutions are required. This study presents a deep learning-based approach, commonly known as Super Resolution (SR), as a cost-effective alternative. Specifically, a probabilistic Wasserstein Generative Adversarial Network with Gradient Penalty (WGAN-GP) was trained using pairs of coarse-resolution (ERA5, ~25 km) and high-resolution (ICON, ~2.5 km) data in order to downscale wind gust fields from approximately 300 historical winter storms. Our results show that the WGAN-GP model generates high-resolution wind gust fields that are statistically similar to the ICON simulations, but with much lower computational costs. The trained model is then employed to downscale wind gust fields of winter storm events from the LAERTES-EU ensemble, producing a large dataset of high-resolution synthetic storm events suitable for detailed risk assessment and climate impact studies.


How to cite: Rasheeda Satheesh, A., Sokol, L., Stadelmaier, K. H., Eisenstein, L., Ludwig, P., Ramos, A. M., Braun, L., Brocklehurst, A., Georgiadis, A., and Pinto, J. G.: An AI-based downscaling tool to generate a large ensemble of high-resolution wind storm footprints over Europe, EGU General Assembly 2026, Vienna, Austria, 3–8 May 2026, EGU26-12848, https://doi.org/10.5194/egusphere-egu26-12848, 2026.

EGU26-12926 | Orals | AS5.2

Anchored-Branched Steady-state WInd Flow Transformer (AB-SWIFT): a metamodel for 3D atmospheric flow in urban environments 

Armand de Villeroché, Vincent Le Guen, Rem-Sophia Mouradi, Patrick Massin, Marc Bocquet, Alban Farchi, Sibo Cheng, and Patrick Armand

In order to estimate pollutant plume dispersion at a local scale in accidental release scenarios, it is necessary to estimate the air flow behavior around the affected site. This flow can be computed using Computational Fluid Dynamics (CFD), but such an approach can be computationally intensive. As a promising alternative, deep learning surrogates learned on CFD-generated data usually require cheaper resources at inference time. However, local air flows depend strongly on urban geometry, which is challenging to take into account in deep learning surrogate models. Additionally, deep learning approaches tend to struggle to scale to large meshes required by real-case scenarios. Finally, flow behavior in the Atmospheric Boundary Layer is influenced by atmospheric stratification stability, which modifies the turbulence level in the flow and must be taken into account [2].

To tackle these challenges, we propose an Anchored Branched Steady-state WInd Flow Transformer (AB-SWIFT), a transformer-based model with an internal branched structure uniquely designed for atmospheric flow modeling. AB-SWIFT relies on the anchor attention mechanism [1], allowing scalability to hundreds of millions of mesh points. To the best of the authors’ knowledge, AB-SWIFT is among the first works to apply transformer-type neural networks to atmospheric modeling. It also explicitly accounts for variable atmospheric stratification stability, which is typically neglected in existing models.

We challenge our model on a specially designed database of atmospheric simulations around randomised urban geometries and with a mixture of unstable, neutral, and stable atmospheric stratification. Urban geometries are determined by randomly sampling buildings and positioning them in space. Additionally, for each simulation, the atmospheric stratification stability is varied by sampling values of the Monin-Obukhov length and of the ground roughness.  Our model reaches the best accuracy on all predicted fields compared to the state-of-the-art transformers and graph-based models.

Figure 1: Horizontal slice at h = 2m above ground of an AB-SWIFT prediction on an unseen geometry under stable atmospheric conditions.

[1] B. Alkin, M. Bleeker, R. Kurle, T. Kronlachner, R. Sonnleitner, M. Dorfer, and J. Brandstetter. Ab-upt: Scaling neural cfd surrogates for high-fidelity automotive aerodynamics simulations via anchored-branched universal physics transformers. arXiv preprint arXiv:2502.09692, 2025.
[2] S. R. Hanna, G. A. Briggs, and R. P. Hosker Jr. Handbook on atmospheric diffusion. Technical report, National Oceanic and Atmospheric Administration, Oak Ridge, TN (USA . . . ,) 1982

How to cite: de Villeroché, A., Le Guen, V., Mouradi, R.-S., Massin, P., Bocquet, M., Farchi, A., Cheng, S., and Armand, P.: Anchored-Branched Steady-state WInd Flow Transformer (AB-SWIFT): a metamodel for 3D atmospheric flow in urban environments, EGU General Assembly 2026, Vienna, Austria, 3–8 May 2026, EGU26-12926, https://doi.org/10.5194/egusphere-egu26-12926, 2026.

EGU26-13242 | Orals | AS5.2

Machine Learning and Statistical Modeling of Air Pollution and Hospitalizations in South America’s Largest Metropolitan Area 

Marco Aurélio Franco, Danilo Dias Cruz, Jorge Armando Piscoya Santibañez, Kátia Fernandes, Erick Giovani Sperandio Nascimento, Prashant Kumar, and Maria de Fátima Andrade

Air pollution is one of the main environmental and public health challenges in urban and rural areas, influenced by a wide range of factors, including traffic, biomass burning, and meteorology. In Brazil, about 326,478 deaths occurred between 2019 and 2021 due to exposure to air pollution. About 8,400 deaths per year are attributed to the Metropolitan Area of São Paulo (MASP), the largest metropolitan area of South America. Mitigating the effects of air pollution is only possible with a deep understanding of the spatial and temporal distributions of air pollutants at high resolution. We employed a machine learning framework based on Extreme Gradient Boosting (XGBoost) to spatialize particulate matter concentrations (PM2.5 and PM10) at MASP at 300 × 300 m². In addition, we developed a Ridge regression model to control multicollinearity and ensure stable estimates. We used this model to examine monthly hospitalizations associated with air pollution and heat exposure in MASP during 2023–2024, a period marked by severe biomass burning and heat waves. The study used integrated data from the Environmental Company of the State of São Paulo (CETESB), ERA5 reanalysis, land use and land cover (MapBiomas), emission inventories, terrain roughness and altitude, and hospitalizations (National Health Data Network, DATASUS) from 2022 to 2024. The XGBoost model has shown to be robust, with high R² values of 0.85 for PM2.5 and 0.88 for PM10, and RMSE of 3.3 µg/m³ and 5.2 µg/m³, respectively, for the test set (30% of the data). The analysis showed higher pollution levels in densely populated and industrialized areas, such as Guarulhos-Pimentas and Parque Don Pedro, while less urbanized regions, such as Pico do Jaraguá, had lower concentrations due to meteorological and topographical factors.  The Ridge distributed-lag hospitalization model exhibited high explanatory power (R² = 0.88; RMSE = 214 hospitalizations per month). Chronic cumulative exposure over three months revealed that ozone and nitrogen dioxide were the dominant drivers of hospitalizations, associated with increases of approximately 65% and 57%, respectively, in monthly hospitalizations, while PM10 showed a moderate effect (~16%). Carbon monoxide did not present a significant association. These findings indicate that photochemical pollution combined with seasonal and thermal variability plays a critical role in respiratory morbidity in MASP, providing a robust quantitative basis for environmental health surveillance and urban air-quality management.

How to cite: Franco, M. A., Cruz, D. D., Santibañez, J. A. P., Fernandes, K., Nascimento, E. G. S., Kumar, P., and Andrade, M. D. F.: Machine Learning and Statistical Modeling of Air Pollution and Hospitalizations in South America’s Largest Metropolitan Area, EGU General Assembly 2026, Vienna, Austria, 3–8 May 2026, EGU26-13242, https://doi.org/10.5194/egusphere-egu26-13242, 2026.

EGU26-13901 | Posters on site | AS5.2

Identifying Ice Crystal Chain Aggregates in Cold-Season Storms: Leveraging Machine Learning to Map Occurrence and Distribution 

Christian Nairy, David Delene, Shawn Wagner, Joseph Finlon, and John Yorks

In situ observations of electrically induced aggregation of cloud ice and frozen droplets have primarily been observed in mid- to upper-level clouds of summertime storms. These aggregates, distinguished by their elongated, quasi-linear structure, are specifically termed as chain aggregates. Cloud chamber experiments reveal that chain aggregation is temperature-dependent, and their formation is enhanced in an electric field exceeding approximately 60 kV m-1. However, various difficulties arise when connecting the laboratory experiments to in situ observations. While there is evidence that significant electric fields are required for chain aggregate formation, the precise locations and the mechanisms for chain aggregation within storms remain poorly understood. This knowledge gap hinders the accurate parameterization of chain aggregate formation processes in cloud models, impacting precipitation formation, radiative transfer, remote sensing retrievals, and precipitation forecasting. 

During NASA’s Investigation of Microphysics and Precipitation for Atlantic Coast-Threatening Snowstorms (IMPACTS) field campaign, chain aggregates were observed in 30 of 34 research flights, across temperatures from –38.2 to 2.5 °C and altitudes from 1.5 to 9.7 km, including in weakly electrified winter storms. These frequent observations challenge prevailing assumptions and underscore the need for comprehensive analysis. Given that the Cloud Particle Imager (CPI) captured millions of particle images during IMPACTS, manual classification is infeasible. To address this, we developed a supervised convolutional neural network (CNN) classifier using transfer learning to distinguish chain aggregates from non-chains directly from CPI images. We benchmarked several common CNN backbones (ResNet18/34/50/101 and VGG16/19) and selected the final model using a precision-first criterion supported by PR-AUC/ROC-AUC and calibration metrics (log-loss/Brier). The resulting ResNet34 model provides reliable separation of chain aggregates vs. non-chains and achieves strong performance on unseen data (≈95% precision and ≈80% recall for the chain class), enabling confident campaign-scale mapping of chain aggregate occurrence and more robust comparisons with collocated ER-2 radar and lidar observations.

How to cite: Nairy, C., Delene, D., Wagner, S., Finlon, J., and Yorks, J.: Identifying Ice Crystal Chain Aggregates in Cold-Season Storms: Leveraging Machine Learning to Map Occurrence and Distribution, EGU General Assembly 2026, Vienna, Austria, 3–8 May 2026, EGU26-13901, https://doi.org/10.5194/egusphere-egu26-13901, 2026.

EGU26-14147 | ECS | Orals | AS5.2

Unveiling In-Situ Ice Aggregation: Deep Learning, Causal Discovery, and Physics 

Huiying Zhang, Fabiola Ramelli, Christoper Fuchs, Anna J. Miller, Nadja Omanovic, Robert Spirig, Zhaolong Wu, Yunpei Chu, Xia Li, Ulrike Lohmann, and Jan Henneberger

Ice aggregation is a fundamental driver of cloud evolution and precipitation formation. However, quantifying its rate in natural environments remains challenging due to the difficulty of tracking particle history in a Lagrangian frame. To address this issue, we use a unique dataset from 21 targeted glaciogenic seeding experiments (CLOUDLAB, Henneberger et al., 2023) conducted in supercooled stratiform clouds ranging from -7.8 °C to -4.7 °C. This experimental design establishes a controlled initial state and advection time (5–10 minutes). Central to our methodology is IceDetectNet (Zhang et al., 2024), a deep learning architecture that applies in situ holographic imagery to detect and classify individual monomers within complex aggregates. Quantifying the number of collisions per aggregate at the monomer level allows us to reconstruct the initial ice crystal number concentration (ICNCt0) directly from downwind observations.

To disentangle the microphysical and environmental drivers of aggregation, we implemented a comprehensive analytical workflow that integrated three distinct paradigms: data-driven causal inference, a theoretically derived physical equation, and machine learning regressors. These independent approaches converge on the conclusion that ICNCt0 parameter is governing aggregation, significantly outweighing the influence of temperature, turbulence, or aspect ratio. Our analysis reveals a significant departure from classical collection theory: the aggregation rate exhibits sub-quadratic power-law dependence on initial concentration (mean exponent 0.92; 95% confidence interval CI: 0.88–0.97), contrasting with the traditional quadratic scaling assumed in kinetic collection kernels. We hypothesize that this scaling involves aggregation among smaller crystals, where subsequent diffusional growth masks the boundaries between monomers, making early collisions difficult to detect. Furthermore, benchmarking eleven machine learning architectures against the physically derived formulation revealed a clear trade-off. While CatBoost's gradient boosting ensembles achieved higher statistical accuracy (R² = 0.87), the theoretical model showed greater robustness and generalizability in sensitivity testing. This multi-perspective framework uses a combination of experimental atmospheric physics and AI-driven interpretation to demonstrate how data-driven plasticity and physically-based stability complement each other. It provides a practical approach to understanding complex microphysical processes.


Reference:

Henneberger J, Ramelli F, Spirig R, et al. Seeding of supercooled low stratus clouds with a UAV to study microphysical ice processes: an introduction to the CLOUDLAB project[J]. Bulletin of the American Meteorological Society, 2023, 104(11): E1962-E1979. https://doi.org/10.1175/BAMS-D-22-0178.1

Zhang H, Li X, Ramelli F, et al. IceDetectNet: a rotated object detection algorithm for classifying components of aggregated ice crystals with a multi-label classification scheme[J]. Atmospheric Measurement Techniques, 2024, 17(24): 7109-7128. https://doi.org/10.5194/amt-17-7109-2024

How to cite: Zhang, H., Ramelli, F., Fuchs, C., Miller, A. J., Omanovic, N., Spirig, R., Wu, Z., Chu, Y., Li, X., Lohmann, U., and Henneberger, J.: Unveiling In-Situ Ice Aggregation: Deep Learning, Causal Discovery, and Physics, EGU General Assembly 2026, Vienna, Austria, 3–8 May 2026, EGU26-14147, https://doi.org/10.5194/egusphere-egu26-14147, 2026.

EGU26-15004 | ECS | Posters on site | AS5.2

Convolutions, clusters, and characterizations: Using pretrained networks for back trajectory analysis 

Kayley Butler and Sam J. Silva

Image analysis is integral in understanding the increasing abundance of atmospheric science imagery
data. Whereas time-consuming analysis of individual images or simplified image processing techniques
were previously necessary, machine learning can now quickly learn trends in and distinctions between
images. However, training deep learning models on large datasets can be computationally expensive.
Leveraging the architectures and weights of pre-trained neural networks can alleviate some expense. In
this work, we apply pre-trained networks to back trajectory images generated for the NASA Aerosol
Cloud meTeorology Interactions oVer the western north ATlantic Experiment (ACTIVATE) campaign.
We find this method outperforms the principal component analysis baseline and results in four
geographically distinct clusters. Pairing these images with the host of measurements taken during the
ACTIVATE campaign, we find the regions to also be distinct in their bulk characteristics of chemical and
microphysical variables.

How to cite: Butler, K. and Silva, S. J.: Convolutions, clusters, and characterizations: Using pretrained networks for back trajectory analysis, EGU General Assembly 2026, Vienna, Austria, 3–8 May 2026, EGU26-15004, https://doi.org/10.5194/egusphere-egu26-15004, 2026.

Mesoscale convective systems(MCSs) can generate severe disasters, including extreme precipitation, hail, flooding, thunderstorms, and strong winds, and are significantly influenced by weather circulation and local geographical conditions. For MCSs occurring in urban areas, urban forcing plays a crucial role in regulating their activity, though the associated impacts are highly complex. Utilizing 15 years of high-resolution radar network products from the China Meteorological Administration, this study identifies and tracks MCSs across three major urban agglomerations, analyzing their spatiotemporal distribution characteristics. It is observed that MCSs in the Pearl River Delta predominantly occur from April to June, in the Yangtze River Delta from May to July, and in the Beijing-Tianjin-Hebei region from June to August. In the Yangtze River Delta and Beijing-Tianjin-Hebei regions, MCSs are more frequently initiated at night (20:00–08:00 Beijing Time), whereas in the Pearl River Delta, they are more commonly initiated during the day (08:00–20:00 Beijing Time). Moreover, the spatial distribution patterns and movement directions of MCSs in these three major urban agglomerations exhibit distinct variations and differences between the cold half-year (October–March) and warm half-year (April–September), as well as between daytime and nighttime. To assess urban impacts, MCSs traversing urban areas were further selected to analyze the spatiotemporal distribution characteristics of their trajectory points and changes before and after crossing cities. It is evident that trajectory points within Pearl River Delta cities exhibit higher numbers, larger areas, and greater intensity during daytime. In contrast, trajectory points within Yangtze River Delta cities show higher numbers but smaller areas and lower intensity during daytime. Trajectory points within Beijing-Tianjin-Hebei cities demonstrate higher numbers, smaller areas, and lower intensity during nighttime. Additionally, significant changes in trajectory point characteristics were observed before and after urban crossing. For instance, trajectory points in the Pearl River Delta and Beijing-Tianjin-Hebei regions expanded in area upon entering cities, whereas those in the Yangtze River Delta contracted. Finally, correlation coefficients were used to identify relationships between various environmental and urbanization factors and the characteristics of MCSs traversing urban clusters.

How to cite: Jin, Q. and Zhao, K.: Spatial and Temporal Characteristics of Mesoscale Convective Systems in China's Three Major Urban Agglomerations and the Urban Impact on Them, EGU General Assembly 2026, Vienna, Austria, 3–8 May 2026, EGU26-15637, https://doi.org/10.5194/egusphere-egu26-15637, 2026.

EGU26-15674 | Orals | AS5.2

Exploring the Atmospheric Responses to Arctic Sea-Ice Loss in Google's NeuralGCM 

Yu-Chiao Liang, Nicholas Lutsko, and Young-Oh Kwon

The rapid loss of Arctic sea ice is a striking consequence of anthropogenic global warming. Itsremote impacts on mid‐latitude weather and climate have attracted scientific and media attention. In this study,we use a hybrid (dynamical plus machine‐learning) atmospheric model—Google's NeuralGCM—to investigatethe mid‐latitude atmospheric circulation responses to Arctic sea‐ice loss for the first time. We conductexperiments in which NeuralGCM is forced with pre‐industrial and future sea‐ice concentrations following theprotocol of the Polar Amplification Model Intercomparisom Project. To assess the performance of NeuralGCM,we compare the results with those simulated by two physics‐based climate models. NeuralGCM produces acomparable response of near‐surface warming to sea‐ice loss and the subsequent weakened zonal wind in mid‐latitudes. However, there is a substantial discrepancy between the two models' stratospheric responses, wheredifferent temperature responses in these models are associated with different zonal wind and geopotential heightresponses. Further investigation of North Atlantic blocking shows that NeuralGCM produces stronger, morefrequent, and more realistic blocking events. Our results demonstrate the capability of NeuralGCM insimulating the tropospheric responses to Arctic sea‐ice loss, but improvements may be needed for thestratospheric representation.

How to cite: Liang, Y.-C., Lutsko, N., and Kwon, Y.-O.: Exploring the Atmospheric Responses to Arctic Sea-Ice Loss in Google's NeuralGCM, EGU General Assembly 2026, Vienna, Austria, 3–8 May 2026, EGU26-15674, https://doi.org/10.5194/egusphere-egu26-15674, 2026.

Traditional numerical weather models struggle with predicting the planetary boundary layer (PBL) in urban areas and during the morning transition. Accurately predicting this part of the atmosphere is crucial because of its downstream impacts, such as accurate air quality forecasts and the representation of convection-based processes. The rapid growth of information technology has increased the capability of machine learning, but several limitations and sensitivities arise when using it to predict the PBL. In this work, aircraft observations from the Aircraft Meteorological Data Relay Program are compiled into half-hourly temperature profiles of the PBL. Dallas-Fort Worth, TX, USA is chosen because it is far from topographical and coastal influences, and there are two large airports near the center of the city. Profiles are compiled into daily bins of five half-hourly profiles prior to and including sunrise as the inputs and eight half-hourly profiles after sunrise as the outputs. This provides the opportunity to test the performance of machine learning models under a variety of stability classifications and PBL heights. To determine the sensitivity of the model configuration, five machine learning model types are tested, learning rates from 0.01 to 0.000001, various training epochs, the order of the layers, the number of neurons in each layer, and eight optimizers. At the start, mean square error (MSE) is used as the loss function to find the optimal model configuration. However, standard summary statistics may not produce larger errors when the physically more important parts of the PBL are astray, such as near the surface and the inversion at the top of the PBL. To test the sensitivity of the loss function, MSE and correlation coefficient are used to gauge the performance of using loss functions of MSE, mean absolute error, Huber loss, and the logarithm of the hyperbolic cosine, in addition to several custom weighted profiles that place higher weights at different parts of the PBL. The optimal model configuration found using MSE as the loss function is a long-short term memory network layer with 2,000 nodes followed by two dense layers with 1,000 nodes, a learning rate of 0.0001, 100 epochs, and an AdamW optimizer, which had an overall MSE of 0.882°C. The MSE was larger for predictions further after sunrise, and the model generally underestimated (overestimated) the onset of mixing and near-surface temperature in the summer (winter). Mean absolute error was the most accurate loss function with an overall MSE of 0.538°C and a correlation coefficient of 0.958. The work shown here highlights the importance in methodically testing various machine learning configurations to back out the sensitivity of the model, which can influence the confidence of the conclusions. It also shows the potential of using a simple machine learning model to produce rapidly updated short-term weather forecasts that can be used in conjunction with traditional numerical weather models.

How to cite: Nielsen, K. and Rahn, D.: The Sensitivity of Machine Learning Configuration for Predicting Temperature Profiles in the Planetary Boundary Layer, EGU General Assembly 2026, Vienna, Austria, 3–8 May 2026, EGU26-16030, https://doi.org/10.5194/egusphere-egu26-16030, 2026.

EGU26-16275 | ECS | Posters on site | AS5.2

A Deep Learning Model Framework for High-Resolution Downscaling of ERA5 in the Austrian Alps 

Kelsey Ennis and Sebastian Scher

We present a deep learning model that regionally downscales relatively coarse (~25 km) ERA5 reanalysis data to a 1-km grid. The model is trained on hourly fields from GeoSphere Austria’s high-resolution INCA model, a regional data assimilation and nowcasting system. Once trained, it can generate hourly high-resolution climate fields using only coarse ERA5 data and a digital elevation model as input. Early results show the deep learning model outperforms simple interpolation of ERA5 data. By comparing our model with baseline models that apply only constant bias correction and lapse rate based elevation adjustment we can quantify how much skill comes from basic statistical corrections versus the additional skill provided by deep-learning downscaling. This comparison allows us to determine whether the deep learning model is capturing nonlinear terrain/flow effects beyond what bias and elevation corrections can provide.

How to cite: Ennis, K. and Scher, S.: A Deep Learning Model Framework for High-Resolution Downscaling of ERA5 in the Austrian Alps, EGU General Assembly 2026, Vienna, Austria, 3–8 May 2026, EGU26-16275, https://doi.org/10.5194/egusphere-egu26-16275, 2026.

 Biases in boundary-layer clouds and cloud–radiation interactions remain a leading source of uncertainty in Earth’s energy budget and global-model performance. Using multiple satellite datasets (MODIS, PATMOS-x, CLARA-AVHRR, and CERES-EBAF), we diagnose biases in cloud fraction and cloud–radiation interaction in the Korea Meteorological Administration’s global Korean Integrated Model (KIM; 8-km horizontal resolution). We further propose an observation-constrained approach to improve a cloud fraction parameterization by combining observations with machine-learning-based diagnostics. Evaluation of forecasts for July 2022 and January 2023 shows that KIM overestimates the global-mean low-level cloud fraction by about 30%, while underestimating cloud fraction over major marine stratocumulus decks. In the tropics, KIM simulates excessive high-level cloud fraction, consistent with overly vigorous deep convection. Neural-network-based permutation importance and sensitivity analyses indicate that temperature, relative humidity, and lower-tropospheric stability (e.g., inversion strength) are key controls on cloud fraction. However, KIM fails to capture the dependence of cloud fraction on these controls in stratus and stratocumulus regimes. To address this limitation, we retune the parameters of the previously developed symbolic regression based cloud-fraction diagnostic parameterization for the KIM grid scale. We retune it using a CloudSat–ERA5 matched dataset. Specifically, we sample ERA5 along CloudSat tracks, upscale the matched dataset to 8 km (horizontal) and 20 hPa (vertical), and optimize the diagnostic parameters using differential evolution. The retuned diagnostic formulation reduces low- and high-cloud biases across the low to mid-latitudes and correspondingly reduces biases in surface shortwave radiation and outgoing longwave radiation (OLR). Notably, cloud fraction in the cumulus regime within the stratocumulus-to-cumulus transition region decreases substantially and becomes much closer to observations. These improvements are accompanied by a more realistic thermodynamic structure near the planetary boundary-layer top.


How to cite: Suhan, K. and Jihoon, S.: Improving Cloud–Radiation Interaction Simulations with an Observation-Constrained Symbolic-Regression Cloud-Fraction Diagnostic, EGU General Assembly 2026, Vienna, Austria, 3–8 May 2026, EGU26-16584, https://doi.org/10.5194/egusphere-egu26-16584, 2026.

The intensity of tropical cyclones (TCs) is highly associated with their structure. Geostationary satellite cloud products provide rich information about the TCs’ structure like storm morphology, and can be used for estimating TC intensity. This study utilizes the Swin-Unet architecture as a backbone model for an objective deep learning (DL)-based TC intensity estimation method over the Western North Pacific. This model incorporates several key components, including the self-attention mechanism, shift-window mechanism, and Unet structure. The most important point in this study is that the model introduces a rotation index and a dispersion index as part of the loss function to characterize storm morphology. These two indexes can be computed based on the comprehensive feature extraction from time-series geostationary satellites imagery. The input of this model includes five cloud products from the Fengyun series geostationary satellites: sectional image (SEC), cloud top temperature (CTT), temperature of the brightness black-body (TBB), precipitation estimation (PRE), and humidity profile derived from cloud analysis (HPF). Results show that the model obtains an exceptionally low mean absolute error (MAE) of 3.71 m/s and root mean square error (RMSE) of 5.05 m/s. Furthermore, the ablation study (component-impact analysis) was conducted to quantify the contribution of the rotation index and dispersion index which enhance the model’s estimation performance to some extent. Finally, through an analysis of feature importance across the five cloud products, HPF, CTT, and TBB received higher importance scores, indicating the model concentrates on the thermodynamic and dynamic features that are strongly associated with TC convective activities. This study is expected to provide hydrometeorological departments with technical support for real-time TC intensity estimation in coastal regions and contribute to disaster warning systems.

How to cite: Chen, S. and Tan, J.: Estimating tropical cyclone intensity based on deep learning and satellite imagery, EGU General Assembly 2026, Vienna, Austria, 3–8 May 2026, EGU26-16605, https://doi.org/10.5194/egusphere-egu26-16605, 2026.

EGU26-16748 | Orals | AS5.2

Modelling complex atmospheric chemistry with artificial intelligence: data, constraints, and scalability 

Klaus Klingmüller, Timothy Butler, Sergey Gromov, Oriol Jorba, Leon Kuhn, Isidre Mas Magre, Alessio Melli, Camille Mouchel-Vallon, Hervé Petetin, Rolf Sander, Martijn Schaap, Markus Thürkow, Jos Lelieveld, and Andrea Pozzer

Chemical processes significantly impact air pollution and its effects on climate, human health, ecosystems, and food security. Therefore, accounting for atmospheric chemistry is essential for reliable air pollution assessments and effective mitigation strategies.

This is typically achieved through the use of chemistry-transport models, which involve solving large systems of ordinary differential equations (ODEs) derived from chemical kinetics. However, as more species and reactions are incorporated into the models, the chemical mechanisms considered become increasingly complex, and the computational burden of the ODE solvers limits atmospheric simulations. This calls for alternative approaches, with artificial intelligence (AI) emerging as one of the most promising.

The EACH (Emulating Atmospheric Chemistry) project, a collaboration between the Max Planck Institute for Chemistry, the Barcelona Supercomputing Center, and Freie Universität Berlin, investigates the potential of using artificial intelligence in atmospheric chemistry modelling. Key results of the project presented here include a comprehensive training and benchmark dataset for AI-driven chemistry models, which will be publicly available. We also address the integration of physical constraints into AI chemistry models, such as element conservation and the non-negativity of concentrations, which are crucial for realistic and stable simulations. While such constraints have been explored in simple chemical mechanisms, scaling their application to complex mechanisms presents new challenges.

How to cite: Klingmüller, K., Butler, T., Gromov, S., Jorba, O., Kuhn, L., Mas Magre, I., Melli, A., Mouchel-Vallon, C., Petetin, H., Sander, R., Schaap, M., Thürkow, M., Lelieveld, J., and Pozzer, A.: Modelling complex atmospheric chemistry with artificial intelligence: data, constraints, and scalability, EGU General Assembly 2026, Vienna, Austria, 3–8 May 2026, EGU26-16748, https://doi.org/10.5194/egusphere-egu26-16748, 2026.

EGU26-17084 | Posters on site | AS5.2

Unsupervised learning of background error covariance matrix for variational data assimilation 

Hyun-Jeong Lee and Yoo-Geun Ham

 The background error covariance matrix (B) plays a central role in variational data assimilation by controlling how observational and background information are combined and is therefore essential for producing an accurate analysis. However, explicitly constructing B and computing its inverse are severely constrained in practice due to the extremely high dimensionality and associated computational cost.

 To mitigate this limitation, this study proposes an unsupervised learning approach that directly estimates the inverse square root of the background error covariance (B⁻¹ᐟ²) from the forecast error patterns. A feedforward neural network that learns a linear matrix corresponding to B⁻¹ᐟ² is trained under whitening constraints, which are intrinsic properties of B⁻¹ᐟ². The learned operator satisfies symmetry and positive definiteness, and the inverse background error covariance (B⁻¹) is obtained in a numerically stable manner by squaring the learned B⁻¹ᐟ².

 The performance of the learned B⁻¹ᐟ² is evaluated through verification of its whitening properties and comparison with a reference B⁻¹ᐟ² constructed by the pseudo inversion of B using singular value decomposition, demonstrating that it reproduces the dominant structural characteristics and leading modes of the reference. The learned B⁻¹ is further implemented within a three-dimensional variational data assimilation (3D-Var) framework, where it stably controls the spatial structure of analysis increments without numerical instability. These results indicate that the proposed unsupervised approach provides a practical and effective alternative for estimating and applying the B⁻¹ in variational data assimilation.

How to cite: Lee, H.-J. and Ham, Y.-G.: Unsupervised learning of background error covariance matrix for variational data assimilation, EGU General Assembly 2026, Vienna, Austria, 3–8 May 2026, EGU26-17084, https://doi.org/10.5194/egusphere-egu26-17084, 2026.

EGU26-17520 | ECS | Orals | AS5.2

Global Shifts in PM2.5 Chemical Composition over decade (from 2010 to 2020) 

zhige wang, Qingyang Xiao, Guannan Geng, and Qiang Zhang

The chemical composition of fine particulate matter (PM2.5) critically shapes its impacts on climate, air quality and human health, yet its high-resolution spatiotemporal variability covering continental to global scales remains poorly constrained owing to sparse ground observations. Here we develop a 10-km-resolution global dataset of PM2.5 chemical composition for 2010-2020, including sulfate (SO42-), nitrate (NO3-), ammonium (NH4+), organic matter (OM) and black carbon (BC), using a physically constrained deep transfer learning framework. Model evaluation against surface observations yields high accuracies, with correlation coefficients ranging from 0.80 to 0.91 across compositions. We identify pronounced spatiotemporal heterogeneity in PM2.5 composition distribution and long-term evolution. During the study period, the global reduction in PM2.5 concentration was driven primarily by decreases in SO42-, with Europe and Asia contributing most prominently. The fractional contributions of BC and OM increased significantly and exhibited a sustained upward trend in North America (by 4.72% and 5.86%, respectively) and Africa (by 2.32% and 6.94%), whereas secondary inorganic aerosols declined in all the continents except Africa. Recent studies have reported substantial differences in toxicity among PM2.5 compositions. Composition-specific exposure data therefore enable more accurate assessments of PM2.5-related health risks and underscore the importance of sustained and comprehensive monitoring of PM2.5 composition.

How to cite: wang, Z., Xiao, Q., Geng, G., and Zhang, Q.: Global Shifts in PM2.5 Chemical Composition over decade (from 2010 to 2020), EGU General Assembly 2026, Vienna, Austria, 3–8 May 2026, EGU26-17520, https://doi.org/10.5194/egusphere-egu26-17520, 2026.

EGU26-18854 | ECS | Posters on site | AS5.2

Exceptional events detection using remote sensing and artificial intelligence 

Ángel Luque Lázaro, Anne Boynard, Sarah Safieddine, Juliette Hadji-Lazaro, and Pascal Prunet

Exceptional and extreme events like wildfires, pollution episodes, or volcanic eruptions require near-real-time (NRT) detection to enable effective mitigation and impact reduction. While satellite geophysical products provide valuable information, their NRT availability is limited to targeted atmospheric species. In contrast, radiances (raw satellite data) provide the full spectral information, within of which a wide variety of atmospheric compounds and geophysical parameters simultaneously exist. The IASI atmospheric sounders aboard the Metop satellites provide an extensive archive of such spectra, covering the spectral signature of stable greenhouse gases and highly variable trace gases relevant to extreme events.

This work builds on these observations to develop an AI-based automated detection system. By validating our approach on IASI’s long historical record, we aim to establish a robust framework capable of fully exploiting the higher spectral resolution and enhanced trace-gas sensitivity of the next-generation IASI-NG launched aboard the Metop-SG satellite in summer 2025.

The methodology is organized in two phases. First, the long-term IASI dataset (since 2007) is used to develop AI models for extreme event detection. An event "atlas" is built associating spectral signatures with documented events, and used to train supervised models, including neural networks, directly on radiance data. Unsupervised techniques are also applied to identify unlabeled anomalies and potential unknown atmospheric species.

In the second phase, these models will be adapted to IASI-NG, accounting for instrumental differences and ensuring consistency over the operational overlap period. An operational processing system will then be deployed to provide continuous and reliable monitoring of extreme events.

At this stage, we will focus on presenting the development and results of the fire event atlas produced in the first phase.

How to cite: Luque Lázaro, Á., Boynard, A., Safieddine, S., Hadji-Lazaro, J., and Prunet, P.: Exceptional events detection using remote sensing and artificial intelligence, EGU General Assembly 2026, Vienna, Austria, 3–8 May 2026, EGU26-18854, https://doi.org/10.5194/egusphere-egu26-18854, 2026.

EGU26-19262 | ECS | Posters on site | AS5.2

Interpretable Swin Transformer–Based Downscaling of PM2.5 Air Pollution Field 

Marcos Martínez-Roig, Francisco Granell-Haro, Kevin Monsalvez-Pozo, Nuria P. Plaza-Martin, Victor Galván Fraile, Paul Ramacher Martin Otto, Johannes Bieser, Johannes Flemming, Paula Harder, Miha Razinger, and Cesar Azorin-Molina

Fine particulate matter (PM2.5) is one of the most harmful air pollutants, posing severe risks to human health and contributing significantly to premature mortality worldwide. Accurate high-resolution monitoring and forecasting of PM2.5 are therefore essential for air quality management, public health assessment, and the design of effective mitigation policies. However, operational atmospheric composition models such as the Copernicus Atmosphere Monitoring Service (CAMS) provide global fields at relatively coarse spatial resolution (~40 km), limiting their ability to represent local-scale pollution patterns driven by complex interactions between emissions, meteorology, and topography. Higher-resolution regional CAMS products (~10 km) partly address this limitation but are computationally expensive and are restricted to specific geographical domains, mainly Europe. As a result, high-resolution information remains difficult to obtain consistently at the global scale.

In this work, we present a deep learning–based super-resolution approach to downscale PM2.5 concentration fields from 40 km to 10 km resolution, bridging the gap between global model outputs and regional-scale applications. The proposed approach is based on a SwinFIR architecture, a hierarchical Vision Transformer that leverages shifted window self-attention to efficiently capture multiscale spatial dependencies. The model ingests multiple low-resolution dynamic variables from CAMS, including PM2.5, 2-meter temperature (T2M), 10-meter wind speed components (U10, V10), dewpoint (D2M) and boundary layer height (BLH), providing both chemical and meteorological context. In addition, high-resolution static data, such as orography and population, are introduced through a secondary branch, enabling the model to condition the super-resolutionprocess on fine-scale geographical features that strongly influence pollutant distributions. The output consists of high-resolution (10 km) PM2.5 fields. Model performance is evaluated using both a held-out test period and independent ground-based PM2.5 observations from the European Environment Agency.

Results show that the model effectively reconstructs fine-scale PM2.5 structures and reduces biases present in the global forecasts. Verification against ground-based observations indicates that the model achieves performance comparable to high-resolution CAMS Europe regional forecasts. The proposed SwinFIR model consistently outperforms a carefully optimized state-of-the-art U-Net baseline across multiple evaluation criteria, including error metrics, spatial correlation, and structural consistency. These improvements reflect the ability of self-attention mechanisms to capture long-range spatial interactions that are difficult to model using purely convolutional approaches.

Beyond predictive performance, we also focus on interpretability. Feature importance analyses quantify the relative contribution of each input variable, demonstrating that static inputs used play a key role in the downscaling process. Attention maps further reveal that the model focuses on physically meaningful events, including high-concentration peaks and regions of strong wind, indicating physically consistent behavior.

Finally, transferability was assessed by applying the model to North America, a region unseen during training. Evaluation against AirNow observations shows reasonable generalization performance, while highlighting the need for further research to improve robustness and extrapolation to unseen regions.

Overall, this study demonstrates the potential of Transformer-based architectures for data-driven downscaling of atmospheric composition fields, providing both improved accuracy and enhanced physical interpretability. The proposed framework offers a promising tool for high-resolution air
quality applications based on global model outputs.

How to cite: Martínez-Roig, M., Granell-Haro, F., Monsalvez-Pozo, K., Plaza-Martin, N. P., Galván Fraile, V., Martin Otto, P. R., Bieser, J., Flemming, J., Harder, P., Razinger, M., and Azorin-Molina, C.: Interpretable Swin Transformer–Based Downscaling of PM2.5 Air Pollution Field, EGU General Assembly 2026, Vienna, Austria, 3–8 May 2026, EGU26-19262, https://doi.org/10.5194/egusphere-egu26-19262, 2026.

EGU26-19495 | ECS | Posters on site | AS5.2

Probabilistic forecasting of multiple air pollutants via latent dynamics modelling with deep learning 

Noah Gibbons, Prashant Kumar, Marco Aurélio de Menezes Franco, Kátia Fernandes, and Erick Giovani Sperandio Nascimento

Fine particulate matter (PM2.5), ozone (O3) and nitrogen dioxide (NO2) each pose significant risks to public health and are among the World Health Organisation (WHO) criteria pollutants. Operational air quality forecasting relies on computationally expensive Chemical Transport Models (CTMs), and recent deep learning methods focus on station-based forecasts, limiting usability to areas with station networks. We present a deep learning framework for probabilistic, gridded ambient air pollution forecasting to address both limitations. 

Our approach employs a latent dynamics architecture. A convolutional variational autoencoder (Conv-VAE) learns compressed latent representations of input channels. A temporal core block captures the dynamical evolution of ambient pollutants in the latent space, and a probabilistic decoder reconstructs forecasts with uncertainty intervals. Probabilistic forecasting allows for more trustworthy predictions, as stakeholders are also presented with relevant confidence. We systematically compare four latent cores: ConvLSTM, Mamba (state-space model), Transformer (attention) and Neural ODEs. This comparison will identify which inductive bias best represents the dynamics of ambient air pollution evolution.  

Experiments utilise a dataset of CAMS European reanalysis and ERA5 reanalysis (by ECMWF), as well as EDGAR emissions inventories over the UK (2015-2022), targeting 24–72 hour forecast horizons. Multi-pollutant settings test the framework's capacity to represent species with distinct atmospheric and chemical interactions in a unified latent representation. We will evaluate forecast skill, uncertainty quantification and computational efficiency of all models. Ongoing work is exploring physics-informed constraints, stochastic latent dynamics, and self-supervised pre-training for improved generalisation. 

How to cite: Gibbons, N., Kumar, P., Aurélio de Menezes Franco, M., Fernandes, K., and Giovani Sperandio Nascimento, E.: Probabilistic forecasting of multiple air pollutants via latent dynamics modelling with deep learning, EGU General Assembly 2026, Vienna, Austria, 3–8 May 2026, EGU26-19495, https://doi.org/10.5194/egusphere-egu26-19495, 2026.

EGU26-20381 | Orals | AS5.2

Retrieval of Cloud Properties for the Copernicus Atmospheric Missions Sentinel-4 (S4) and TROPOMI / Sentinel-5 Precursor (S5P) using deep neural networks 

Fabian Romahn, Diego Loyola, Víctor Molina García, Adrian Doicu, Ronny Lutz, and Athina Argyrouli

Due to their fast computational performance and accuracy, neural networks are nowadays commonly used in the context of remote sensing. The issue of performance is especially important in the context of big data and near-real-time (NRT) operational processing. Classical retrieval algorithms typically use a radiative transfer model (RTM) as a forward model to solve the inverse problem of inferring the quantities of interest from the measured spectra. However, these RTMs are often computationally very expensive and therefore replacing them by a NN is desirable to increase performance. But the application of NNs is not straightforward and there are at least two main approaches:

1. NNs used as forward model, where a NN accurately approximates the radiative transfer model and can thus replace it in the inversion algorithm

2. NNs for solving the inverse problem, where a NN is trained to infer the atmospheric parameters from the measurement directly

The first approach is more straightforward to apply. However, the inversion algorithm still faces many challenges, as the spectral fitting problem is generally ill-posed. Therefore, local minima are possible and the results often depend on the selection of the a-priori values for the retrieval parameters.

For the second case, some of these issues can be avoided: no a-priori values are necessary, and as the training of the NN is performed globally, i.e. for many training samples at once, this approach is potentially less affected by local minima. However, due to the black-box nature of a NN, no indication about the quality of the results is available. In order to address this issue, novel methods like Bayesian neural networks (BNNs), invertible neural networks (INNs) or also variational auto-encoders (VAEs) should be considered as they allow the characterization of the retrieved values by an estimate of uncertainty describing a range of values that are probable to produce the observed measurement.

We apply and evaluate both approaches for the retrieval of cloud properties and consider their potential as operational algorithms for the Copernicus atmospheric composition missions Sentinel-4 and Sentinel-5P.

How to cite: Romahn, F., Loyola, D., Molina García, V., Doicu, A., Lutz, R., and Argyrouli, A.: Retrieval of Cloud Properties for the Copernicus Atmospheric Missions Sentinel-4 (S4) and TROPOMI / Sentinel-5 Precursor (S5P) using deep neural networks, EGU General Assembly 2026, Vienna, Austria, 3–8 May 2026, EGU26-20381, https://doi.org/10.5194/egusphere-egu26-20381, 2026.

EGU26-20845 | Orals | AS5.2

Constructing statistical models for hailstorm occurrence in US and Europe.   

Diego Bueso, Alberto Sanchez-Marroquin, Alessandro Lovo, Foteini Baladima, and Mirta Rodríguez

Hailstorms are among the costliest extreme weather events, causing major damage to agriculture and infrastructure, and leading to substantial losses in the insurance sector.  

Hailstorm modeling is extremely challenging and requires computationally expensive high resolution physical modeling.   Machine Learning approaches have recently emerged as a way to bypass some limitations of physical models, combining hail reports as target data with meteorological predictors. Limitations to this approach appear from the scarcity of consistent observational data in most regions. 

In this study, we compare domain-shift adaptation methodologies to propose an optimal approach to produce hailstorm models in data scarce regions. Results show that models combining data from data-rich and data-scarce regions offer the best balance between regional skill and cross-domain generalization. 

Furthermore, we introduce a probability calibration methodology to improve interpretability of the model inferences and demonstrate how these models can be used to construct hailstorm hazard maps, providing valuable tools for stakeholders. 

In addition to historical climatology, we present results for hail climate projections. 

This work has been partially funded by the EDF Project KOIOS GA 101103770

How to cite: Bueso, D., Sanchez-Marroquin, A., Lovo, A., Baladima, F., and Rodríguez, M.: Constructing statistical models for hailstorm occurrence in US and Europe.  , EGU General Assembly 2026, Vienna, Austria, 3–8 May 2026, EGU26-20845, https://doi.org/10.5194/egusphere-egu26-20845, 2026.

EGU26-21787 | ECS | Orals | AS5.2

 Self-Supervised Super-Resolution for Sentinel-5P Hyperspectral Data 

Hyam Omar Ali, Antoine Crosnier, Romain Abraham, Baptiste Combelles, Fabrice Jegou, and Bruno Galerne

Sentinel-5P (S5P) plays a central role in global atmospheric and environmental monitoring, yet its coarse spatial resolution limits the analysis of localised emission sources and sharp concentration gradients. Super-resolution (SR) methods have been proposed to address this limitation, but most existing approaches rely on paired low and high-resolution data that are unavailable for S5P, restricting their applicability in real-world settings. In this work, we present a self-supervised hyperspectral SR framework specifically designed for S5P that enables training without high-resolution ground truth. The proposed framework integrates the S5P degradation operator and band-dependent noise characteristics derived from sensor signal-to-noise ratio metadata within a self-supervised learning strategy. Convolutional Neural Network (CNN) architectures tailored to S5P's spectral characteristics based on Depthwise Separable Convolutions (DSC) are introduced to efficiently enhance spatial detail while preserving spectral fidelity. The framework is evaluated across all S5P spectral bands under two settings: (i) reference experiments where supervised and self-supervised learning can be directly compared using synthetic ground truth, and (ii) fully self-supervised settings where high-resolution reference data are unavailable, and assessment relies on physics-based consistency metrics. Results show that the proposed self-supervised models achieve performance comparable to supervised counterparts and produce sharper spatial structures than standard bicubic interpolation. Additional validation using coincident EMIT hyperspectral observations demonstrates that the super-resolved outputs exhibit physically meaningful spatial enhancement, particularly along coastline regions. These findings highlight the potential of the proposed self-supervised framework to improve the effective spatial resolution of atmospheric satellite observations, enabling practical deployment in scenarios where high-resolution reference data are inherently unavailable.

How to cite: Omar Ali, H., Crosnier, A., Abraham, R., Combelles, B., Jegou, F., and Galerne, B.:  Self-Supervised Super-Resolution for Sentinel-5P Hyperspectral Data, EGU General Assembly 2026, Vienna, Austria, 3–8 May 2026, EGU26-21787, https://doi.org/10.5194/egusphere-egu26-21787, 2026.

EGU26-22203 | Orals | AS5.2

AI-powered models for air quality forecasts 

Joshua Fu and Jia Xing

Accurate and timely weather forecasting and air quality prediction are foundational to public safety, environmental policy, and sustainable urban planning. These forecasts are essential for mitigating the adverse impacts of extreme weather events, such as heatwaves, wildfires, or severe storms, and for managing chronic air pollution issues that affect human health, ecosystems, and climate. Moreover, they play a vital role in advancing our scientific understanding of aerosol–meteorology interactions, which influence cloud formation, precipitation patterns, and radiative forcing within weather and climate systems. Despite their value, traditional modeling approaches, most notably chemical transport models (CTMs), face significant limitations. CTMs simulate the transport, chemical transformation, and deposition of pollutants based on atmospheric dynamics and emissions data. While highly detailed, they are also extremely computationally demanding. Running CTMs at high spatial and temporal resolutions, especially over extended periods or across large regions, requires substantial computational infrastructure and time. These constraints limit their practicality for real-time forecasting and rapid policy evaluation, particularly in data-scarce or resource-limited settings. To overcome these challenges, we introduce DeepCTM4D, a novel deep learning–based modeling framework that emulates the functionality of CTMs while drastically enhancing computational efficiency. DeepCTM4D leverages modern neural network architectures to learn from historical CTM outputs, enabling it to replicate the dynamic behavior of atmospheric chemical concentrations across a four-dimensional domain (three spatial dimensions plus time). The model is trained on a rich set of input variables, including anthropogenic and natural precursor emissions, meteorological conditions (e.g., wind, temperature, humidity), and initial chemical states, allowing it to learn complex, nonlinear interactions that govern pollutant formation and dispersion. One of the key strengths of DeepCTM4D lies in its ability to retain interpretability and scientific relevance. The relationships it captures between emissions, meteorology, and pollutant concentrations are consistent with known atmospheric chemistry mechanisms, lending credibility to its predictions. Furthermore, the model enables sensitivity analyses to identify major pollution drivers under different scenarios making it a powerful tool for evaluating the impacts of emission control strategies, policy interventions, or changing meteorological conditions. Beyond accuracy and interpretability, DeepCTM4D offers a transformative reduction in computational cost. It can generate near-instantaneous forecasts once trained, making it well-suited for operational use in early-warning systems, daily air quality updates, and climate-health applications. This efficiency opens new opportunities for integrating high-resolution air quality simulations into coupled Earth system models, weather prediction platforms, and mobile or edge-based applications in real time. In summary, DeepCTM4D represents a significant advancement in atmospheric science and computational modeling. By blending domain knowledge with data-driven intelligence, it provides a scalable, adaptable, and scientifically robust alternative to traditional CTMs. As an AI-enhanced forecasting tool, DeepCTM4D holds great potential to support global environmental monitoring systems and equip decision-makers with timely, actionable insights for managing air quality and responding to weather-related risks.

How to cite: Fu, J. and Xing, J.: AI-powered models for air quality forecasts, EGU General Assembly 2026, Vienna, Austria, 3–8 May 2026, EGU26-22203, https://doi.org/10.5194/egusphere-egu26-22203, 2026.

EGU26-153 | ECS | Orals | NP5.1

WeGen FastEvaluation: An open-source tool for the evaluation and comparison of machine learning models in weather and climate applications 

Ilaria Luise, Savvas Melidonis, Julius Polz, Sorcha Owens, Timothee Hunter, Christian Lessig, and Michael Tarnawa

The next generation of machine learning (ML) weather and climate models is increasingly trained on a wide variety of datasets, including reanalyses, forecasts and observations . This diversity can typically not be handled by existing evaluation tools that are often limited to gridded data or fixed lead times Furthermore, many existing evaluation frameworks are developed internally by institutions, remain closed-source, and lack interoperability across platforms and high-performance computing (HPC) environments. This creates a gap in the ability to systematically assess model skill across different data streams, experiments, and computing infrastructures.

The WeGen FastEvaluation tool, developed within the WeatherGenerator project, aims to bridge this gap. It provides a flexible, open-source framework designed to evaluate machine learning–based weather prediction models across a wide range of dataset types and formats. Unlike most existing tools, WeGen FastEvaluation makes minimal assumptions about data structure, allowing consistent analysis of both gridded and unstructured inputs, deterministic and probabilistic outputs, and multiple forecast lead times. Built on xarray, the WeGenFastEvaluation supports multi-dimensional data handling, including probabilistic outputs and ensemble forecasts. The tool enables efficient computation of skill metrics and generation of 2D visualizations, allowing users to compare an arbitrary number of model runs across different data streams and forecast configurations.

The presentation will introduce the design and capabilities of the WeGen FastEvaluation, highlighting its integration within the WeatherGenerator workflow. Through examples, we demonstrate how the WeGen FastEvaluation tool enables consistent benchmarking, collaborative analysis across HPC systems, and reproducible ML-for-weather research.


How to cite: Luise, I., Melidonis, S., Polz, J., Owens, S., Hunter, T., Lessig, C., and Tarnawa, M.: WeGen FastEvaluation: An open-source tool for the evaluation and comparison of machine learning models in weather and climate applications, EGU General Assembly 2026, Vienna, Austria, 3–8 May 2026, EGU26-153, https://doi.org/10.5194/egusphere-egu26-153, 2026.

EGU26-1553 | ECS | Orals | NP5.1

Deriving meaning from metrics – a new approach for machine learning nowcasting verification 

Jakub Lewandowski, Leif Denby, and Andrew Ross

Nowcasting - the prediction of weather conditions over the next few hours - is critical for mitigating the impacts of severe convective storms. Machine learning offers new opportunities for improving nowcasting, particularly for convective precipitation, where traditional numerical models struggle. Yet, despite rapid progress in model development, evaluating these models remains a major challenge. Current verification practices typically rely on a narrow set of standard metrics that often fail to capture the complexity of atmospheric phenomena and cannot distinguish between different types of errors, providing limited insight into the specific weaknesses of the models.

This research introduces a comprehensive verification framework that combines carefully crafted datasets with sensitivity analyses, aiming to transform metric-based evaluation into a more informative process. Synthetic datasets are generated using ArtPrecip, a novel tool that randomly generates radar-like precipitation fields while allowing full control over properties such as motion, initiation, and evolution. Observational radar data are classified based on synoptic setting and observed precipitation properties, using different dimension-reduction methods. Sensitivity analyses examine how existing metrics respond to various error patterns, providing guidance on interpreting benchmark results.

The resulting system provides a well-defined and well-described set of benchmarks and enables reproducible, objective, and meaningful comparison of models. By addressing gaps in evaluation methodology, this work contributes to a more robust assessment of machine learning nowcasting skill and its applicability to severe weather forecasting.

How to cite: Lewandowski, J., Denby, L., and Ross, A.: Deriving meaning from metrics – a new approach for machine learning nowcasting verification, EGU General Assembly 2026, Vienna, Austria, 3–8 May 2026, EGU26-1553, https://doi.org/10.5194/egusphere-egu26-1553, 2026.

EGU26-1764 | ECS | Posters on site | NP5.1

Spectral representations for regional AI-based weather prediction 

Emily O'Riordan

Both dynamical and AI-based NWP have seen success in using spectral transformations to represent atmospheric variables efficiently. In particular, Fourier-based representations are widely adopted due to fast computational methods and compact encoding of large-scale structure. However, as the NWP community targets higher-resolution models, Fourier-bases may inadequately represent the sharp gradients and multi-scale features that often characterise extreme weather events. Furthermore, for limited-area domains, Fourier representations can impose artificial periodicity, making them less physically appropriate.

In this work, we investigate whether alternative spectral transformations better support AI-based NWP in regional, extreme-weather settings. We systematically compare neural forecasting models trained using Fourier, wavelet, and Legendre spectral representations, assessing their ability to predict multiple atmospheric variables over the Aotearoa New Zealand domain.  Wavelet and polynomial bases are explicitly designed for bounded domains and provide multi-scale, non-periodic representations, making these transformations more suitable for the regional forecasting task.

Aotearoa New Zealand provides an ideal test-bed for these methods, as a region with complex coastlines, steep orography, and frequent exposure to high-impact weather systems. Models are trained and evaluated on reanalysis datasets (ERA5 and BARRA-2), using standard verification metrics and case studies of major Aotearoa New Zealand storms such as Cyclones Gabrielle and Bola. Our results demonstrate that spectral choice has a measurable impact on forecast skill, particularly for extremes and fine-scale structure.

By analysing how different spectral representations influence AI-NWP performance in a regional context, this work provides guidance on the appropriate use of spectral methods for limited-area forecasting, and contributes to the development of more accurate and physically consistent AI-driven weather prediction systems for localised and extreme events.

How to cite: O'Riordan, E.: Spectral representations for regional AI-based weather prediction, EGU General Assembly 2026, Vienna, Austria, 3–8 May 2026, EGU26-1764, https://doi.org/10.5194/egusphere-egu26-1764, 2026.

EGU26-2056 | ECS | Posters on site | NP5.1

An NWP-Free, Observation-Driven Deep Learning Approach to Heavy-Rainfall Nowcasting Beyond the Three-Hour Limit  

Ryu Shimabukuro, Tomohiko Tomita, Tsuyoshi Yamaura, and Ken-ichi Fukui

Quasi-stationary convective bands over Kyushu, Japan, frequently trigger rainy-season disasters, and hours with ≥50 mm h−1 rainfall are increasing. Yet skillful nowcasts beyond 3 h remain limited. This study presents FlowsNet, an observation-based multi-sensor fusion model that learns directly from radar/rain gauge-analyzed precipitation, surface variables from ground stations, geostationary satellite imagery, and satellite-derived precipitation context. The model targets category-4 (C4; ≥50 mm h−1) rainfall and incorporates two attention mechanisms: a channel-wise module that weights informative modalities and a spatial module that aligns features with banded structures at multi-hour leads. Training uses a tail-aware ordinal loss that couples focal reweighting with Earth Mover’s Distance to highlight rare extremes. FlowsNet maintains a non-zero C4 Critical Success Index through 6 h. From 4 to 6 h, it matches or exceeds the Japan Meteorological Agency’s very-short-range forecast, and it outperforms a leading extrapolation method and current deep-learning nowcasters. Case studies show preserved band geometry and corridor placement at long lead over complex terrain. Ablation experiments identify satellite water-vapor context and near-surface humidity as key for long-lead C4 prediction; combining satellite context with surface observations stabilizes placement and reduces false alarms. By avoiding numerical weather prediction model state and objective analyses/reanalyzes, the approach reduces latency and hardware demand, improves portability and resilience when model cycles degrade, and offers a practical route to earlier and more transferable warnings for extreme rainfall events.

How to cite: Shimabukuro, R., Tomita, T., Yamaura, T., and Fukui, K.: An NWP-Free, Observation-Driven Deep Learning Approach to Heavy-Rainfall Nowcasting Beyond the Three-Hour Limit , EGU General Assembly 2026, Vienna, Austria, 3–8 May 2026, EGU26-2056, https://doi.org/10.5194/egusphere-egu26-2056, 2026.

Rapid population growth and the continuous restructuring of economic relationships have significantly increased global demand for efficient transportation systems. In this context, accurate prediction of the Rate of Penetration (ROP) of the Tunnel Boring Machine (TBM) is crucial for construction planning, cost estimation, and real-time operational decision-making in TBM tunneling. When TBMs are appropriately selected in terms of type and capacity according to route conditions and are operated in compliance with sound engineering principles, they enable the excavation of tunnels at very high rate of penetration while maintaining economic feasibility. Estimating tunnel completion time based on geological and geotechnical conditions along the tunnel alignment and the operational capacity of the TBM has been one of the most intensively studied topics in tunneling research over the past two decades. However, recent advances in artificial intelligence (AI) techniques offer significant potential for achieving higher predictive performance in ROP estimation. In light of these developments, this study evaluates the performance of various AI algorithms using data obtained from the T2 tunnel of the Bahçe–Nurdağ (Türkiye) twin tunnels, the longest railway tunnels in Türkiye. In addition, synthetic input parameters were generated to enhance prediction accuracy beyond that achieved in previous studies. The results demonstrate that incorporating these synthetic input parameters leads to improved model performance, with an increase of up to 2.65% in terms of the correlation coefficient. Given the already high predictive capability achieved without synthetic inputs (R² = 0.8637), the improvement obtained in this study (R² = 0.8866) is particularly noteworthy. Overall, the findings indicate that ensemble-based artificial intelligence models incorporating synthetic input data can predict ROP of TBM with very high accuracy, thereby offering a robust and reliable tool for estimating tunnel completion times in TBM tunneling projects.

How to cite: Gokceoglu, C. and Ozcan, A.: Use of Synthetic Input Parameters for Enhancing Prediction Performance of Rate of Penetration of TBM , EGU General Assembly 2026, Vienna, Austria, 3–8 May 2026, EGU26-2357, https://doi.org/10.5194/egusphere-egu26-2357, 2026.

EGU26-2503 | ECS | Posters on site | NP5.1

 Spatial aggregation of ROC and PR curves 

Romain Pic, Zhongwei Zhang, Johanna Ziegel, and Sebastian Engelke

Receiver Operating Characteristic (ROC) and Precision–Recall (PR) curves are widely used to assess the discrimination ability of forecasts for binary events, such as threshold exceedances or warnings of extreme events. In weather forecasting, forecasts are provided as spatial fields, yielding location-wise ROC and PR curves that are often aggregated to facilitate comparison, although the effect of the aggregation strategy on performance assessment remains poorly understood.

We investigate how different aggregation strategies for ROC and PR curves affect the assessment of discrimination ability. In particular, we identify conditions under which aggregation strategies satisfy two desirable properties for fair comparison: preservation of dominance between forecasts and preservation of concavity of the curves. We review commonly used aggregation approaches from the literature, analyze their theoretical properties, and highlight potential pitfalls that may lead to misleading interpretations. Based on these findings, we provide practical guidelines for the interpretation of aggregated ROC and PR curves. The proposed framework is illustrated using AI-based global weather forecasts, showing how different aggregation strategies can lead to different rankings.

How to cite: Pic, R., Zhang, Z., Ziegel, J., and Engelke, S.:  Spatial aggregation of ROC and PR curves, EGU General Assembly 2026, Vienna, Austria, 3–8 May 2026, EGU26-2503, https://doi.org/10.5194/egusphere-egu26-2503, 2026.

EGU26-4039 | ECS | Posters on site | NP5.1

A Framework for Explainable AI in Weather Forecasting: Diagnosing Deep Learning Models via Gradient-Based Attributions 

Younes Essafouri, Corentin Seznec, Luciano Drozda, Laure Raynaud, and Laurent Risser

Each day, potentially critical decisions made by governments and organizations depend on accurate weather forecasts, determining whether to evacuate for a storm or simply to carry an umbrella. In this context, Deep Learning (DL) models are becoming a popular and computationally efficient alternative to traditional Numerical Weather Prediction (NWP) models, offering the potential to capture complex data patterns which may be missed using physical explicit equations (Lam et al., 2023). However, their opaque (black-box) nature remains a barrier to operational trust.

Explainable AI (XAI) aim to address this opacity by revealing the decision process behind predictions. Indeed, classical XAI techniques reveal when DL models rely on spurious correlations rather than causal physical mechanisms to deliver predictions (Geirhos et al., 2020). However, their direct application to meteorological data often yields attribution maps that are noisy (Kim et al., 2019) and difficult to interpret due to their high dimensionality. It additionally remains unclear whether these tools can consistently identify the complex physical drivers inherent in NWP (Bommer et al., 2024).

Based on previous works (Bommer et al., 2024; Kim et al., 2023; Yang et al., 2024), we establish a framework to generate compact and interpretable explanations of local weather forecast predictions obtained using deep neural networks. These explanations build on the output of gradient-based methods like VanillaGrad and SmoothGrad (Smilkov et al., 2017), which are scalable to high-dimensional data. More specifically, our framework first allows for targeted analysis by selecting a region of interest (e.g., Paris area) and a target variable (e.g., accumulated precipitation). It therefore answers the question: "Why did the neural network predict this feature at this location?" To do so, it first computes dense attribution maps with respect to all input variables (e.g., wind components at varying altitudes). Traditionally, bounding boxes are used to define the region of importance in these maps (Kim et al., 2023). However, they are unable to provide detailed directional information. We therefore propose in our framework to determine regions of importance using "confidence ellipses" that summarize the center, main directions, and importance of the most concentrated regions. Unlike bounding boxes, the representation of these ellipses, with the raw attribution maps as a background, provides rich and easily interpretable information regarding the directionality and spatial spread of the model's focus.

Preliminary results on the hybrid transformer-convolutional-based model UNETR++ (Shaker et al., 2024) trained and tested on the TITAN dataset from Météo-France (comprising hourly surface and vertical profiles of wind, temperature, and geopotential over metropolitan France) demonstrate our framework's pertinence for explaining predictions from deep neural networks. We were able to verify that different trained models successfully capture the vertical hierarchy of atmospheric variables, evidenced by an effective receptive field that expands with increasing altitude. More interestingly, our framework allowed us to identify systematic biases learned during training that correlate with known physical occurrences. These findings serve as a foundational step for future work on developing novel explainability methods to detect whether trained models capture complex physical mechanisms.

How to cite: Essafouri, Y., Seznec, C., Drozda, L., Raynaud, L., and Risser, L.: A Framework for Explainable AI in Weather Forecasting: Diagnosing Deep Learning Models via Gradient-Based Attributions, EGU General Assembly 2026, Vienna, Austria, 3–8 May 2026, EGU26-4039, https://doi.org/10.5194/egusphere-egu26-4039, 2026.

Artificial intelligence (AI) and machine learning (ML) tools are rapidly growing in capability and application across the weather enterprise.  Fully AI-based numerical weather prediction (NWP) emulators are beginning to outperform traditional NWP, and many weather agencies have started to adopt ML-derived guidance products into the forecast process.  For example, the United States National Weather Service’s Storm Prediction Center (SPC) has implemented a number of ML models to aid in the prediction and detection of tornadoes, severe wind, hail, and wildfires.  However, the development of these AI/ML products and their subsequent transition into SPC operations revealed several challenges which potentially slowed their overall adoption into the forecasters’ workflow.  This presentation will discuss several factors that impacted the adoption of AI/ML into forecast operations and highlight some best practices used by SPC to help streamline the research-to-operations transition.  Case studies of AI/ML projects that were successfully transitioned into SPC operations will help illustrate the application of these best practices and showcase some of the common pitfalls faced by AI/ML development for operational applications.

How to cite: Harrison, D., Jirak, I., and Marsh, P.: Lessons Learned from the Development and Implementation of AI Forecast Guidance at the U.S. National Weather Service’s Storm Prediction Center, EGU General Assembly 2026, Vienna, Austria, 3–8 May 2026, EGU26-4103, https://doi.org/10.5194/egusphere-egu26-4103, 2026.

EGU26-4550 | ECS | Orals | NP5.1

From Forecast Skill to Forecast Value: Do AI Weather Forecasts Deliver Real-World Economic Benefits? 

Leonardo Olivetti, Gabriele Messori, Paolo Avner, and Stéphane Hallegatte
Recent years have witnessed rapid advances in data-driven weather forecasting, with an ever-increasing number of AI-based models reporting skill comparable to or exceeding that of physical models. Comparing AI and physical forecasting systems, however, remains challenging: these models often exhibit a different set of strengths and weaknesses, making their real-world value strongly dependent on the specific application. Yet, most existing comparisons of AI and physical models focus exclusively on meteorological skill, largely overlooking the question of forecast value in real-world decision-making.
 
In this talk, we tackle this question by proposing an application-dependent framework to evaluate the real-world value of AI weather forecasts. The framework is based on the classical concept of relative economic value, which we extend in several novel ways to better reflect realistic use cases. Besides allowing for varying cost–loss ratios to represent different protection and forecast costs, we introduce flexible penalty functions to account for compounding losses from sequential forecast misses as well as declining user trust due to repeated false alarms.
 
We apply the framework to a number of case studies, comprising cities exposed to high economic losses from weather-related natural hazards. We show that forecast value in these contexts depends not only on forecast and prevention costs, but also on the choice of penalty function and on whether compound losses from repeated misses or false alarms are considered. We thus advocate for evaluating real-world value alongside meteorological skill when developing and comparing forecasting models, to ensure that improvements in predictive accuracy translate into meaningful societal and economic benefits.

How to cite: Olivetti, L., Messori, G., Avner, P., and Hallegatte, S.: From Forecast Skill to Forecast Value: Do AI Weather Forecasts Deliver Real-World Economic Benefits?, EGU General Assembly 2026, Vienna, Austria, 3–8 May 2026, EGU26-4550, https://doi.org/10.5194/egusphere-egu26-4550, 2026.

Accurate real-time tracking of infectious diseases is often challenged by reporting delays. Existing nowcasting methods typically struggle with three major limitations: they either (1) oversimplify complex reporting delays; (2) ignore spatial connections by treating regions separately; or (3) are too computationally expensive when handling detailed spatio-temporal data, making them impractical for real-time use.

To solve these issues, we propose a flexible Bayesian spatio-temporal framework that incorporates a delay adjustment structure, allowing the framework to adapt to changing reporting behaviors while effectively capturing spatial dependencies. To ensure this complex model is fast enough for real-time applications, we implement it via inlabru using a novel linear approximation strategy. This method significantly improves computational efficiency, enabling scalable inference without the speed bottlenecks of traditional MCMC methods.

We validate the framework by monitoring dengue in Brazilian states during 2025. Our model outperforms the baseline model in 22 out of 26 states (85\% win rate), successfully capturing rapid trend shifts and providing more precise estimates compared to existing systems.

Our findings demonstrate that combining detailed delay dynamics with a spatio-temporal structure effectively balances model flexibility with computational speed. This offers a robust, scalable solution for monitoring epidemics in diverse geographical regions.

How to cite: Xiao, Y. and Moraga, P.: Bayesian spatio-temporal disease nowcasting using parametric time-varying functions of cumulative reporting probability, EGU General Assembly 2026, Vienna, Austria, 3–8 May 2026, EGU26-4713, https://doi.org/10.5194/egusphere-egu26-4713, 2026.

Multi-step time series forecasting is a fundamental problem across geoscientific applications, including meteorology, hydrology, climate analysis, and space and environmental sciences. A persistent challenge in such tasks is the progressive degradation of predictive accuracy as the forecast horizon increases. This phenomenon is primarily driven by the accumulation and temporal propagation of forecast errors, while most existing statistical and machine learning models lack explicit mechanisms to characterize, model, and correct the evolving dynamics of horizon-dependent residuals.

To address this limitation, we propose an adaptive error post-processing framework termed the Adaptive Residual Decay Mechanism (ARDM). ARDM is designed as an end-to-end predictive optimization strategy that enhances forecasting stability, robustness, and generalization across diverse temporal patterns and application scenarios. Rather than modifying the internal structure of forecasting models, ARDM operates as a residual-aware modification layer that can be seamlessly integrated with a wide range of statistical and machine-learning-based forecasting pipelines.

The proposed framework systematically integrates data preprocessing, initial multi-step forecasting, residual sequence construction, residual dependency modeling, dynamic error modification, and final output refinement. By explicitly constructing residual time series from preliminary forecasts, ARDM captures both short-term and long-term temporal dependencies in forecast errors, enabling structured modeling of error evolution across lead times. Within a symmetrical residual modeling architecture, a time-sensitive adaptive decay function is introduced to dynamically estimate and correct horizon-dependent forecast errors, allowing error adjustments to evolve consistently with increasing prediction horizons.

The decay function and its parameters are optimized through a joint multi-metric loss formulation evaluated across geoscientific and cross-domain time series forecasting datasets. This optimization strategy balances sensitivity to error magnitude with robustness to directional deviations, ensuring stable and reliable post-processing behavior, particularly for longer-range forecasts. Furthermore, ARDM systematically exploits historical residual information during the observation phase, enabling horizon-aware and dynamically consistent refinement of prediction errors through structured residual dependencies without increasing model complexity.

Extensive experiments conducted on multiple real-world geophysical time series datasets, including representative geomagnetic indices, demonstrate that ARDM consistently outperforms mainstream baseline statistical and machine learning methods across a range of standard evaluation metrics, including MAE, MSE, RMSE, MAPE, SSE, and the index of agreement (IA). Performance improvements are especially pronounced at longer prediction horizons, highlighting ARDM’s effectiveness in mitigating error accumulation in multi-step forecasting of geophysical processes. These results suggest that residual-aware, horizon-adaptive statistical post-processing provides a powerful and flexible pathway for improving the reliability of geophysical time series forecasting, with direct relevance to space weather and broader Earth system applications.

How to cite: zhang, Y., zou, Z., and liu, Y.: ARDM: Adaptive Residual Decay Mechanism for Dynamic Error Modification in Geophysical Time Series Forecasting, EGU General Assembly 2026, Vienna, Austria, 3–8 May 2026, EGU26-4804, https://doi.org/10.5194/egusphere-egu26-4804, 2026.

EGU26-5091 | Posters on site | NP5.1

Fair logarithmic score for multivariate Gaussian forecasts 

Sándor Baran and Martin Leutbecher

In evaluating multivariate probabilistic forecasts predicting vector quantities such as a weather variable at multiple locations or a wind vector, an important step is the assessment of their calibration and reliability. Here, we focus on the logarithmic score and are interested in the specific case when the density is multivariate normal with mean and covariance structure given by the ensemble mean and ensemble covariance matrix, respectively. Under the assumptions of multivariate normality and exchangeability of the ensemble members, a relationship is derived that describes the dependence on ensemble size. It is exploited to introduce a fair logarithmic score for multivariate ensemble forecasts [1].

An application to medium-range weather forecasts demonstrates the usefulness of the ensemble size adjustments when multivariate normality is only an approximation, where we consider ensemble predictions of sizes from 8 to 100 of vectors consisting of several different combinations of upper air variables. We show how the logarithmic score depends on ensemble size for various examples and to what extent the fair logarithmic score reduces this dependence.

References

1. Leutbecher, M. and Baran, S., Ensemble size dependence of the logarithmic score for forecasts issued as multivariate normal distributions. Q. J. R. Meteorol. Soc. 151 (2025), paper e4898, doi:10.1002/qj.4898.

*Research was supported by the Hungarian National Research, Development and Innovation Office under Grant No. K142849.

How to cite: Baran, S. and Leutbecher, M.: Fair logarithmic score for multivariate Gaussian forecasts, EGU General Assembly 2026, Vienna, Austria, 3–8 May 2026, EGU26-5091, https://doi.org/10.5194/egusphere-egu26-5091, 2026.

A widely recognized limitation of most post-processing methods is that they are typically applied independently for each forecast horizon, location, and variable, potentially neglecting important dependencies across these dimensions. Despite the development of numerous statistical and machine learning methods for modeling these dependencies, the topic remains the subject of ongoing research.
In this work, the proposed approach employs a graph neural network (GNN) trained with a composite loss function that combines the energy score (ES) and the variogram score (VS) for the multivariate postprocessing of ensemble forecasts. The method is evaluated using WRF-based solar irradiance forecasts over northern Chile and ECMWF visibility forecasts over Central Europe.
Across all multivariate verification metrics, the dual-loss GNN consistently outperforms empirical copula–based postprocessing methods as well as GNNs trained solely with CRPS or ES. For the WRF forecasts, the learned rank-order structure captures dependency information more effectively, leading to improved restoration of spatial relationships compared with both the raw ensemble and historical observational ranks. Moreover, incorporating VS into the training loss also improves univariate predictive performance for both forecast targets.

Lakatos, M. (in press). A composite-loss graph neural network for the multivariate post-processing of ensemble weather forecasts.
Quarterly Journal of the Royal Meteorological Society.

How to cite: Lakatos, M.: A Composite-Loss Graph Neural Network for the Multivariate Post-Processing of Ensemble Weather Forecasts , EGU General Assembly 2026, Vienna, Austria, 3–8 May 2026, EGU26-5377, https://doi.org/10.5194/egusphere-egu26-5377, 2026.

Fog and low stratus forecasting remains a challenge due to the high sensitivity of these phenomena to boundary layer processes. One-dimensional models, such as COBEL–ISBA, offer physical consistency but often lead to systematic errors in key surface variables. This work proposes a novel hybrid calibration framework combining physical modeling with machine learning (ML) to correct COBEL–ISBA forecasts at Nouasseur Airport, Morocco. Using two winter seasons of model outputs and SYNOP observations, we calibrate five variables (2-m temperature and humidity, 10-m wind components, visibility) for each forecast run and lead time (0–12 h).

Two ML architectures are tested: direct correction (ML–COBEL) and residual-learning approach (ML–Phys) using Random Forest and XGBoost. For visibility, a two-stage classification-regression model is implemented, and an oversampling technique is used to address class imbalance. Results are benchmarked against classical bias correction and quantile mapping.

The ML–Phys approach outperforms traditional methods across all variables and lead times, reducing errors (bias, RMSE) while preserving observed temporal variability. Furthermore, it improves also low-visibility event detection. In contrast, traditional methods show limited skill, often degrading beyond short lead times. This work demonstrates the potential of hybrid AI-physics strategies to mitigate 1D model limitations, providing a path toward more reliable operational fog and visibility forecasting.

How to cite: Oubouisk, M., Bari, D., and Mordane, S.: Hybrid AI-Physics Calibration of a 1D Fog Model: Improving Near-Surface and Visibility Forecasts at a Moroccan Airport, EGU General Assembly 2026, Vienna, Austria, 3–8 May 2026, EGU26-5760, https://doi.org/10.5194/egusphere-egu26-5760, 2026.

EGU26-7223 | ECS | Orals | NP5.1

How skilful are AI-based forecasts of 2023 Indian summer monsoon precipitation? 

Mehzooz Nizar, Reinhard Schiemann, Andrew G Turner, Kieran Hunt, and Steffen Tietsche

India relies on agriculture as one of its main sources of income. Therefore, reliable prediction of Indian summer monsoon
rainfall is crucial to the country’s policy making and development of crop management strategies. The recent development
of global AI Weather Prediction (AIWP) models has revolutionized weather forecasting. Owing to the very recent
emergence of AIWP models, their performance in simulating the Indian monsoon system is still insufficiently explored.
In this study, we verify the precipitation forecast skill of AIWP models GraphCast and FuXi at a lead time of 1-9 days
during Indian summer monsoon 2023 and compare their performance to the physics-based model ECMWF IFS-HRES
(IFS). Satellite-derived precipitation dataset IMERG is used as the ground truth to verify precipitation along with
ERA5 precipitation. Root mean squared error (RMSE), pattern correlation coefficient (PCC), structure (S)-amplitude
(A)-location error (L) and stable equitable error in probability space (SEEPS) were the metrics used to evaluate the
models.

A number of case studies, seasonal and intra-seasonal characteristics of precipitation forecast at various lead times were
analysed during June-September 2023. The case studies reveal that the AIWP models have lower RMSE and higher PCC
than IFS in general, while the AIWP models smoothen (positive S error) precipitation at longer leads. FuXi consistently
underestimates precipitation (negative A error) in the case studies. Analysing the daily mean rainfall for the country
as a whole and the precipitation bias at a lead time of 5 days, it is confirmed that FuXi shows a systematic dry bias in
forecasting monsoon rainfall. Non-parametric statistical tests were conducted to decide which model performs the best
at each metric in forecasting the entire season at various lead times. It is found that FuXi consistently achieved the
lowest RMSE, IFS delivered the best S, and GraphCast recorded the smallest SEEPS score at a lead time of 1, 5 and 9
days while no model shows a significant advantage in PCC, A and L. It was also seen that AIWP models outperformed
IFS in RMSE and PCC while AIWP models have larger S error than IFS corroborating the findings of case studies.
FuXi scored the largest A error across all lead times. The loss functions used to train AIWP models directly penalise
point-wise errors, which likely explains their RMSE advantage over IFS.

These results show us that even though AIWP models have good overall accuracy and correlation with observed precipi-
tation, exhibits a lack of realism in capturing the spatial distribution and the intensity of precipitation. Also, model skill
is metric dependent and choosing between an AIWP or physics-based model should hinge on the forecaster’s priority.

How to cite: Nizar, M., Schiemann, R., Turner, A. G., Hunt, K., and Tietsche, S.: How skilful are AI-based forecasts of 2023 Indian summer monsoon precipitation?, EGU General Assembly 2026, Vienna, Austria, 3–8 May 2026, EGU26-7223, https://doi.org/10.5194/egusphere-egu26-7223, 2026.

EGU26-7775 | ECS | Posters on site | NP5.1

Advancing Rainfall Nowcasting in Tropical Southeast Asia with Physics-Informed Deep Generative Models 

Zhixiao Niu, Song Chen, Zhihuo Xu, Joshua Lee, Hugh Zhang, Shuping Ma, Yaomin Wang, Xinyue Liu, and Xiaogang He

Rainfall nowcasting of deep convection in the tropics is extremely challenging, particularly in highly urbanized coastal regions such as Singapore, where high spatial resolution is required. Conventional optical flow-based nowcasting methods typically struggle with capturing the initiation, duration, and spatiotemporal evolution of deep convection and rainfall. When it comes to extreme rainfall, these existing methods cannot deliver skillful nowcasts due to rapid changes in localized features of individual deep convection events. Recent advances in AI-based data-driven models, particularly deep generative models utilizing high-resolution radar imagery, have improved nowcasting accuracy at longer lead times. However, they often serve as black boxes, neglecting the underlying physics, potentially missing unseen extremes, and underestimating their rainfall intensity. To better tackle convection onset prediction, we adopt a novel importance sampling strategy that targets convective initiation by identifying convective cells based on a 35 dBZ threshold and fitting a linear growth trend across frames. Samples with steeper growth and fewer initial convective cells are prioritized to emphasize early-stage development. To enhance physical realism in deep tropics, we further propose a physics-informed deep generative model that incorporates diurnal and seasonal cycles to reflect tropical weather variability. Moreover, the model includes three-dimensional physical information such as Doppler wind and multi-altitude reflectivity. With the incorporation of additional physical information, the proposed generative framework consistently outperforms baseline models, particularly at early forecast lead times. Relative to the original DGMR driven solely by precipitation inputs, the physics-informed model achieves substantially higher skill across multiple rainfall thresholds. Over a 90-min forecast horizon, the average probabilities of detection (POD) reach 0.70, 0.47, and 0.21 at 1.0, 4.0, and 16.0 mm h⁻¹, corresponding to relative improvements of 27%, 25%, and 25%, respectively, with associated critical success indices (CSI) of 0.47, 0.30, and 0.15. In addition, spatial correlation is enhanced across pooling scales of 0.5, 2.0, and 8.0 km, yielding average Pearson correlation coefficients (PCC) of 0.27, 0.32, and 0.46, representing relative gains of 15–16% compared with the baseline. Attribution analysis further indicates that multi-altitude reflectivity contributes most strongly to nowcasting skill, followed by composite reflectivity, while the influence of time-regime information increases with forecast lead time and the contribution of three-dimensional wind fields remains comparatively modest. Our novel physics-informed deep generative model provides valuable insight into convective precipitation processes, supports more reliable nowcasting, and helps guide future data collection in tropical regions.

How to cite: Niu, Z., Chen, S., Xu, Z., Lee, J., Zhang, H., Ma, S., Wang, Y., Liu, X., and He, X.: Advancing Rainfall Nowcasting in Tropical Southeast Asia with Physics-Informed Deep Generative Models, EGU General Assembly 2026, Vienna, Austria, 3–8 May 2026, EGU26-7775, https://doi.org/10.5194/egusphere-egu26-7775, 2026.

EGU26-7988 | ECS | Orals | NP5.1

Assessment of high-resolution physical and AI-based precipitation forecasts in the Ecuadorian Tropics 

Angela Iza-Wong, Gabriel Moldovan, Zied Ben Bouallegue, Becky Hemingway, Matthew Chantry, and David A. Lavers

Accurate precipitation forecasting remains challenging, particularly in regions with complex terrain and sparse observational networks. This study evaluates precipitation forecasts from the European Centre for Medium-Range Weather Forecasts (ECMWF), the Integrated Forecasting System (IFS), and Artificial Intelligence/Integrated Forecasting System (AIFS) (ECMWF, 2024, 2025)​, including experimental models trained on the Integrated Multi-satellite Retrievals for GPM (IMERG) and Multi-Source Weighted-Ensemble Precipitation (MSWEP) datasets, the high-resolution (4km) model developed within the Destination Earth (DestinE) initiative (ECMWF et al., 2025)​, and the GraphCast model (Lam et al., 2022)​. The evaluation is based on 2 years of observational data (2023–2024) from 30 Ecuadorian weather stations in coastal and Andean regions and considers forecast lead times of 1-10 days. Throughout the evaluation period, AIFS exhibits the highest overall predictive skill, whereas DestinE is most effective at identifying extreme precipitation events. Most models display a marked positive bias, particularly within the Andean region. AIFS models trained on IMERG and MSWEP demonstrate the lowest bias and highest skill, as indicated by the Stable Equitable Error in Probability Space (SEEPS) ​(Rodwell et al., 2010)​ and the Equitable Threat Score (ETS). The Frequency Bias Index (FBI) decreases across all models as thresholds increase from the 90th to the 99th percentile, with consistently elevated FBI values observed over mountainous terrain. AIFS (IMERG) achieves the best overall performance, while GraphCast demonstrates the lowest skill in both total and mountainous regions. Overall, in the Ecuadorian tropics, AI-based models generally outperform physical models, except during extreme precipitation events, when physical models remain more reliable. These results underscore the critical importance of training data for AI-based systems and the ongoing challenges of forecasting high-impact precipitation across both operational and experimental models.

Keywords: Precipitation forecasting, artificial intelligence, ECMWF, GraphCast, Ecuador, extreme rainfall

References

ECMWF. (2024). IFS Documentation CY49R1 - Part I: Observations. In IFS Documentation CY49R1. ECMWF. https://doi.org/10.21957/fd16c61484

ECMWF. (2025). ECMWF’s AI forecasts become operational ECMWF. https://www.ecmwf.int/en/about/media-centre/news/2025/ecmwfs-ai-forecasts-become-operational

ECMWF, EUMETSAT, & ESA. (2025). Destination Earth (DestinE)-digital model of the Earth. https://destination-earth.eu/

Lam, R., Sanchez-Gonzalez, A., Willson, M., Wirnsberger, P., Fortunato, M., Alet, F., Ravuri, S., Ewalds, T., Eaton-Rosen, Z., Hu, W., Merose, A., Hoyer, S., Holland, G., Vinyals, O., Stott, J., Pritzel, A., Mohamed, S., & Battaglia, P. (2022). GraphCast: Learning skillful medium-range global weather forecasting. http://arxiv.org/abs/2212.12794

Rodwell, M. J., Richardson, D. S., Hewson, T. D., & Haiden, T. (2010). A new equitable score suitable for verifying precipitation in numerical weather prediction. Quarterly Journal of the Royal Meteorological Society, 136(650), 1344–1363. https://doi.org/10.1002/qj.656

How to cite: Iza-Wong, A., Moldovan, G., Bouallegue, Z. B., Hemingway, B., Chantry, M., and Lavers, D. A.: Assessment of high-resolution physical and AI-based precipitation forecasts in the Ecuadorian Tropics, EGU General Assembly 2026, Vienna, Austria, 3–8 May 2026, EGU26-7988, https://doi.org/10.5194/egusphere-egu26-7988, 2026.

EGU26-8100 | Posters on site | NP5.1

COBASE: A new copula-based shuffling method for ensemble weather forecast postprocessing 

Elisa Perrone, Maurits Flos, Bastien François, Irene Schicker, and Kirien Whan

Weather predictions are often provided as ensembles generated by repeated runs of numerical weather prediction models. These forecasts typically exhibit bias and inaccurate dependence structures due to numerical and dispersion errors, requiring statistical postprocessing for improved precision. A common correction strategy is the two-step approach: first adjusting the univariate forecasts, then reconstructing the multivariate dependence. The second step is usually handled with nonparametric methods, which can underperform when historical data are limited. Parametric alternatives, such as the Gaussian Copula Approach (GCA), offer theoretical advantages but often produce poorly calibrated multivariate forecasts due to random sampling of the corrected univariate margins. In this work, we introduce COBASE, a novel copula-based postprocessing framework that preserves the flexibility of parametric modeling while mimicking the nonparametric techniques through a rank-shuffling mechanism. This design ensures calibrated margins and realistic dependence reconstruction. We evaluate COBASE on multi-site 2-meter temperature forecasts from the ALADIN-LAEF ensemble over Austria and on joint forecasts of temperature and dew point temperature from the ECMWF system in the Netherlands. Across all regions, COBASE variants consistently outperform traditional copula-based approaches, such as GCA, and achieve performance on par with state-of-the-art nonparametric methods like SimSchaake and ECC, with only minimal differences across settings. These results position COBASE as a competitive and robust alternative for multivariate ensemble postprocessing, offering a principled bridge between parametric and nonparametric dependence reconstruction.

How to cite: Perrone, E., Flos, M., François, B., Schicker, I., and Whan, K.: COBASE: A new copula-based shuffling method for ensemble weather forecast postprocessing, EGU General Assembly 2026, Vienna, Austria, 3–8 May 2026, EGU26-8100, https://doi.org/10.5194/egusphere-egu26-8100, 2026.

EGU26-8449 | Orals | NP5.1

High-resolution Probabilistic Forecasts of Fire Weather Conditions in California using Downscaling Machine Learning Models 

Charles Jones, Callum Thompson, David Siuta, Nathan Quinn, and Nicholas Sette

California is prone to extreme fire weather conditions characterized by high winds, elevated temperatures, and low humidity. Accurate predictions with high spatial resolution are critical for emergency operations to monitor and respond to fast-spreading wildfires. While current operational numerical weather prediction models, such as the NOAA Global Forecasting System GFS model, offer reliable probabilistic forecasts in the medium range (up to 15 days), their coarse spatial resolution (typically 0.25° latitude/longitude, ~25 km) limits their utility for localized fire risk assessment. This resolution is insufficient for capturing terrain-driven wind patterns and microclimate variations that drive fire behavior, especially in complex topography regions like the wildland–urban interface.

High-resolution probabilistic forecasts of fire weather conditions are generated by downscaling GFS ensemble outputs from a native resolution of 0.25° latitude/longitude to 1.5 km horizontal grid spacing over a domain encompassing California and Nevada. The downscaling framework integrates singular value decomposition (SVD), UNet-based convolutional neural networks, and diffusion models to capture both large-scale variability and fine-scale terrain-driven features. Models are trained using GFS initial conditions (00 UTC) and paired with 1.5 km Weather Research and Forecasting (WRF) simulations spanning the period 2015–2020. To evaluate forecast skill, ten high-impact case studies characterized by strong wind events in the Sierra Nevada and Southern California are analyzed. Probabilistic predictions of surface air temperature, relative humidity, and wind speed are validated against surface meteorological observations. The study includes a discussion of forecast skill metrics, operational applications, and ongoing research directions.

How to cite: Jones, C., Thompson, C., Siuta, D., Quinn, N., and Sette, N.: High-resolution Probabilistic Forecasts of Fire Weather Conditions in California using Downscaling Machine Learning Models, EGU General Assembly 2026, Vienna, Austria, 3–8 May 2026, EGU26-8449, https://doi.org/10.5194/egusphere-egu26-8449, 2026.

EGU26-8532 | ECS | Orals | NP5.1

Design, operation and validation of the ERA5-land Global Gridded Stochastic Weather Generator 

Alex Schuddeboom, Christian Zammit, David Plew, Piet Verburg, and Aidin Jabbari

The ERA5-land Global Gridded Stochastic Weather Generator (EGGS-WG) model was released to the public last year as an open source and freely accessible stochastic weather generator. The purpose of this model is to provide an easy to use, low resource and modern Stochastic Weather Generator that can produce rainfall, air temperature and dew point temperature. This model offers several advancements over existing freely available stochastic weather generators, including the ability to simulate any terrestrial region of the planet, moving from a single site simulation approach to an entire gridded domain and increasing the temporal resolution of temperature simulation from daily to hourly.

Validation case studies have been performed over a range of different regions that represent substantially different climates. In general, EGGS-WG shows a strong ability to recreate the statistical behaviour seen in the ERA5-Land dataset. Precipitation occurrence rates and daily rainfall amounts are shown to be reproduced accurately by the model. Several different aspects of these variables are validated, including seasonality, spatial correlations and rainfall spells. While the general quality of the simulation is high, there are some clear issues in the simulation of the most extreme precipitation values, as well as some unique issues in consistently wet climates. Analysis of the air temperature and dew point temperature simulations shows stronger agreement. In particular, the spatial distributions and diurnal cycles of temperature are shown to be well simulated.

Many future developments have been planned that build on the released software package. Most prominent amongst these is the expansion of the simulated variables to include winds and radiation, which introduces a unique set of challenges due to the strong diurnal patterns and spatial organisation. Additionally, integrated support for CMIP6 driven future warming simulation is a high priority. These extensions are in various stages of development and are likely to be released over the coming year.

How to cite: Schuddeboom, A., Zammit, C., Plew, D., Verburg, P., and Jabbari, A.: Design, operation and validation of the ERA5-land Global Gridded Stochastic Weather Generator, EGU General Assembly 2026, Vienna, Austria, 3–8 May 2026, EGU26-8532, https://doi.org/10.5194/egusphere-egu26-8532, 2026.

EGU26-8733 | Orals | NP5.1

Development of AI-based precipitation forecasting at KIAPS 

Tae-Jin Oh, In-Chae Na, and Woo-Yeon Park

This study outlines the development of an artificial intelligence (AI)-based precipitation forecasting system at the Korea Institute of Atmospheric Prediction Systems (KIAPS). The system is designed with three main components:  an observation-based model for very short-term forecasting (nowcasting), a post-processing model to correct numerical weather prediction (NWP) fields for longer lead times, and a hybrid model to integrate these approaches which is to be built. The nowcasting model utilizes a U-Net architecture incorporating ConvLSTM at the bottleneck. It uses radar and satellite data sequences to produce 6-hour forecasts; the training strategy involves pretraining on radar/satellite data followed by fine-tuning with 1-hour accumulated rainfall gauge data from Automatic Weather Stations (AWS). The post-processing model employs a ConvNeXt v2 U-Net to correct Korea Integrated Model (KIM) NWP fields for forecasts up to 24 hours. Performance evaluations show that the observation-based model excels at shorter lead times with 34% improvement in the Critical Success Index (CSI) for precipitation exceeding 8 mm/hr, averaged over the 1–6 hour forecast period, compared to the baseline KIM forecast. Meanwhile, the post-processing model, which incorporates a differentiable CSI loss function for robust heavy precipitation forecasting, averaged over the 24 hour forecast period, achieves 31% CSI improvement relative to KIM with reduced performance degradation at longer lead times. Future work will focus on developing the hybrid model to merge these outputs for optimal accuracy across all forecast lead times.

How to cite: Oh, T.-J., Na, I.-C., and Park, W.-Y.: Development of AI-based precipitation forecasting at KIAPS, EGU General Assembly 2026, Vienna, Austria, 3–8 May 2026, EGU26-8733, https://doi.org/10.5194/egusphere-egu26-8733, 2026.

EGU26-9336 | Posters on site | NP5.1

Environment-Specific Fog Detection over the Korean Peninsula Using GEO-KOMPSAT-2A and DeepLabV3+ 

Suhwan Kim, Dongjin Kim, and Jong-Min Yeom

Fog detection using geostationary satellite data has the advantage of monitoring large areas in a short period of time. However, because fog exhibits highly diverse optical characteristics in both space and time, it is difficult to achieve reliable detection with a single satellite-based detection strategy that does not consider environmental conditions. Therefore, this study utilized data from GEO-KOMPSAT-2A (GK2A) to pre-define fog occurrence environments, construct appropriate input data and labels for each environmental condition, and then applied a categorized deep learning-based fog detection system.

First, fog was identified when ground-station visibility was under 1 km. To create reliable training data, the ground-station visibility data was spatially aligned with fog labels from the Korea Meteorological Administration (KMA) for GK2A observations. Only areas consistently identified as fog by both ground-station observations and KMA fog labels were selected and cropped. In this process, a spatial grouping method was used to eliminate noise and ensure the fog regions had continuous spatial coverage.        

In constructing the input data, variables representing surface characteristics were chosen to optimize detection accuracy for each environmental condition. Using this high-quality dataset, data were organized into different groups based on four seasons, three time periods (daytime, nighttime, dawn/dusk), and two surface types (land, ocean). Separate DeepLabV3+ models were trained for each category, with 2022 data used for training and 2023 data for validation.

To evaluate the model's ability to generalize, the entire 2024 dataset not included in training was used as an independent test set. For accurate assessment, post-processing filtering with a cloud mask was applied to measure detection performance in cloud-free regions. The results revealed notable seasonal fluctuations in performance, indicating that detection efficiency depends on environmental conditions. Even with the same deep learning architecture, this suggests that careful data preprocessing and environment-specific strategies can help advance satellite-based fog detection technology.


This work was supported by the National Research Foundation of Korea(NRF) grant funded by the Korea government(MSIT)(RS-2025-00515357).

How to cite: Kim, S., Kim, D., and Yeom, J.-M.: Environment-Specific Fog Detection over the Korean Peninsula Using GEO-KOMPSAT-2A and DeepLabV3+, EGU General Assembly 2026, Vienna, Austria, 3–8 May 2026, EGU26-9336, https://doi.org/10.5194/egusphere-egu26-9336, 2026.

EGU26-9685 | ECS | Orals | NP5.1

Comparative Assessment of Predictor Variable Combinations within Data Driven Approaches for NWP based Precipitation Forecast Enhancement 

Sudhanyasree Prasanna Ravikumar, Sakila Saminathan, and Subhasis Mitra

Precipitation forecasts generated by Numerical Weather Prediction (NWP) models often exhibit systematic biases arising from limitations in model resolution, representation of sub-grid-scale processes, and uncertainties in initial conditions. This study systematically assesses different predictor combinations (PC) obtained from the European Centre for Medium-Range Weather Forecasts (ECMWF) model to improve short-range precipitation forecasts using data-driven approaches over the peninsular Indian region. Different data-driven formulations, comprising of four machine learning (ML) models and two deep learning (DL) models, were implemented and systematically compared. Further, the different PCs and data driven formulations are evaluated and compared against the traditional Bayesian Model Averaging (BMA) approach, widely adopted for precipitation forecast enhancement. The improvement in precipitation forecast skill was assessed using standard deterministic and probabilistic verification metrics. The results indicate that incorporating exogenous predictor variables leads to a slight improvement in precipitation forecast skill, while DL models exhibit performance comparable to that of traditional ML models. Overall, the exogenous variable PC achieved higher forecast skill than other PCs and the traditional BMA, yielding an approximate 20% improvement in RMSE compared to 14% for the traditional BMA. Feature importance analysis revealed that total precipitation, wind speed, and 2-m temperature consistently ranked among the top five most influential variables across the different data driven formulations, underscoring the interpretability of the models.

How to cite: Prasanna Ravikumar, S., Saminathan, S., and Mitra, S.: Comparative Assessment of Predictor Variable Combinations within Data Driven Approaches for NWP based Precipitation Forecast Enhancement, EGU General Assembly 2026, Vienna, Austria, 3–8 May 2026, EGU26-9685, https://doi.org/10.5194/egusphere-egu26-9685, 2026.

EGU26-10414 | Orals | NP5.1

Forecasting Cold Winter Temperatures in Finland with the Aila AI Weather Model 

Marko Laine, Leila Hieta, Tuukka Tuukka Himanka, Mikko Partio, and Olle Räty

Advances in data-driven artificial intelligence (AI) weather models are transforming how national meteorological services produce forecasts. The Finnish Meteorological Institute (FMI) has developed Aila, a regional AI model inspired by Met Norway's Bris AI model and built using the Anemoi framework - an open European initiative that integrates machine learning techniques with meteorology. Aila has been trained on 40 years of European Centre for Medium-Range Weather Forecasts (ECMWF) global historical ERA5 reanalysis data and about three years of high-resolution Harmonie analyses over the Scandinavian region, utilizing the computational power of the LUMI supercomputer. The model's graph-based neural network architecture enables enhanced spatial resolution and improved representation of atmospheric processes over Northern Europe. 

This study focuses on evaluating Aila's performance during cold winter conditions in Finland, a key challenge for numerical weather prediction models. Prolonged low-temperature episodes are often governed by persistent high-pressure systems and strong temperature inversions that prove difficult to forecast accurately. Using case studies from recent winters, we evaluate Aila’s skill in forecasting 2-meter temperatures during cold spells by comparing its predictions against FMI's operational forecast products and observations.

The results demonstrate that the AI-based Aila model achieves competitive accuracy in temperature forecasts during challenging cold weather conditions while providing substantial computational efficiency compared to traditional numerical approaches. Future development efforts will focus on implementing a multi-decoder approach where the Aila model will be fine-tuned using observational data to better capture extreme cold temperatures and improve forecast reliability.

How to cite: Laine, M., Hieta, L., Tuukka Himanka, T., Partio, M., and Räty, O.: Forecasting Cold Winter Temperatures in Finland with the Aila AI Weather Model, EGU General Assembly 2026, Vienna, Austria, 3–8 May 2026, EGU26-10414, https://doi.org/10.5194/egusphere-egu26-10414, 2026.

EGU26-11641 | ECS | Orals | NP5.1

Hybrid Neural Operator and Physics-Informed Learning for Renewable Energy Forecasting 

Andrejs Cvečkovskis, Juris Seņņikovs, and Uldis Bethers

Forecasting of local renewable energy variables such as solar irradiance and wind speed is critically important for operational grid management and energy markets. We present a hybrid machine learning model that combines Adaptive Fourier Neural Operator (AFNO) architectures with physics-informed loss constraints, designed to capture both learned spatial–temporal patterns and key physical relationships in atmospheric fields. The model is trained on reanalysis and high-resolution observational datasets over the Baltic region and evaluated in comparison with baseline statistical and numerical weather prediction benchmarks.

Our contributions include: (i) a hybrid modelling strategy that enforces approximate physical consistency via penalised residuals of key balance equations during training; (ii) a detailed benchmarking framework for lead-time dependent forecast skill on solar and wind energy generation targets; and (iii) an assessment of uncertainty and calibration properties using probabilistic scoring metrics. Results are evaluated against numerical weather prediction baselines, highlighting the strengths and limitations of the hybrid approach and outlining a viable pathway for future improvements in sub-daily renewable energy forecasting.

This work contributes to the session’s themes of advanced machine learning and statistical forecasting methods in geosciences and highlights the potential of hybrid approaches for enhancing short-term predictive skill.

How to cite: Cvečkovskis, A., Seņņikovs, J., and Bethers, U.: Hybrid Neural Operator and Physics-Informed Learning for Renewable Energy Forecasting, EGU General Assembly 2026, Vienna, Austria, 3–8 May 2026, EGU26-11641, https://doi.org/10.5194/egusphere-egu26-11641, 2026.

EGU26-11765 | ECS | Orals | NP5.1

Assessing the physical realism of AI-based weather forecasts: insights from extratropical storms and large-scale flow diagnostics. 

Soufiane Karmouche, Linus Magnusson, Tim Hewson, and Thomas Haiden

Standard scores such as the root mean squared error provide limited insight into whether Machine-learning (ML) weather prediction systems reproduce the physically consistent dynamical structures that underpin high-impact weather. Here, we present a multi-faceted assessment of the physical realism of ECMWF’s Artificial Intelligence Forecasting System (AIFS), combining case-study diagnostics of severe extratropical storms with conditional verification based on large-scale circulation.

We first examine two North Atlantic storms: Storm Amy (October 2025) and Storm Eowyn (January 2025). Using diagnostics inspired by Charlton-Perez et al. (2024), we analyse frontal structure, vorticity, and surface and upper-air wind fields in AIFS-Single and AIFS Ensemble Control forecasts, benchmarked against the IFS Control and analysis. While ML systems capture storm tracks and large-scale frontal geometry well, they systematically smooth sharp gradients, compact vorticity cores, and localized wind maxima, leading to underestimation of extreme winds. Probabilistic training in the ensemble configuration improves realism but does not fully overcome these structural limitations.

We then present ongoing work assessing the physical consistency of ML forecasts using diagnostics of the ageostrophic-to-geostrophic wind ratio at multiple pressure levels. These reveal systematic differences between ML-based and physics-based models, particularly in dynamically active midlatitude regions.

Finally, we present regime-based verification results highlighting improved AIFS performance for 2-m temperature forecasts during persistent wintertime anticyclonic conditions, illustrating ML strengths in stable large-scale regimes where physics-based forecasts suffer from long-standing systematic biases.

Overall, our results highlight the importance of moving beyond general verification scores toward diagnostic and physically interpretable evaluation frameworks when assessing AI-based weather forecasts, especially for high-impact weather events.

This work is funded by the Destination Earth project.

REFERENCES:

Charlton-Perez, A.J., Dacre, H.F., Driscoll, S. et al. Do AI models produce better weather forecasts than physics-based models? A quantitative evaluation case study of Storm Ciarán. npj Clim Atmos Sci 7, 93 (2024). https://doi.org/10.1038/s41612-024-00638-w

How to cite: Karmouche, S., Magnusson, L., Hewson, T., and Haiden, T.: Assessing the physical realism of AI-based weather forecasts: insights from extratropical storms and large-scale flow diagnostics., EGU General Assembly 2026, Vienna, Austria, 3–8 May 2026, EGU26-11765, https://doi.org/10.5194/egusphere-egu26-11765, 2026.

I present a data-driven forecast system applied to the Indian summer monsoon rain. By forecasting pentads, 5-day rain totals, the system is well suited to forecasting the monsoon onset/withdrawal as well as its progression, also known as intra-seasonal variability. I will provide a comparison of the forecast skill with those of other systems, both physics-based NWP and AI systems. The skill of the JJA seasonal forecast issued on 1 May in terms of the Pearson correlation coefficient far surpasses that of GLOSEA5. I will also discuss delicate questions about forecast skill, as to what is concepotually sound and what can be computed.

How to cite: Bodai, T.: Data-driven seasonal weather forecast: An application to the Indian summer monsoon rain, EGU General Assembly 2026, Vienna, Austria, 3–8 May 2026, EGU26-12477, https://doi.org/10.5194/egusphere-egu26-12477, 2026.

EGU26-12713 | ECS | Posters on site | NP5.1

Verifying the spatial structure of precipitation fields from a foundation model of the atmosphere 

Sebastian Buschow and Wael Almikaeel and the WeatherGenerator Team

Data driven weather models have proven their ability to learn various aspects of the weather prediction problem. While their point-to-point skill has been proven, the precise nature of their errors is not yet fully understood.

This contribution takes a first look at the spatial precipitation patterns simulated by the Weather Generator – a foundation model trained on diverse data sources with the goal of learning the underlying behavior of the atmosphere as a whole.  We analyze the correlation structure of the simulated precipitation fields using spatial verification techniques including two-dimensional wavelet transforms. Some attention is paid to the problem of applying these methods to global data on an irregular grid. The results can be compared to observations, reanalysis and potentially other data-driven forecast models.

How to cite: Buschow, S. and Almikaeel, W. and the WeatherGenerator Team: Verifying the spatial structure of precipitation fields from a foundation model of the atmosphere, EGU General Assembly 2026, Vienna, Austria, 3–8 May 2026, EGU26-12713, https://doi.org/10.5194/egusphere-egu26-12713, 2026.

EGU26-12781 | Orals | NP5.1

A Lagrangian blending of optical flow and ML-based radar precipitation nowcasts  

Dominique Brunet, Laura Huang, Jonathan Belletête, Ahmed Mahidjiba, and Sudesh Boodoo

Recent research and development at Environment and Climate Change Canada has been conducted on improving the current operational radar precipitation nowcasting by transitioning from an optical flow method (Farnebäck smoothed) to machine learning (ML)-based nowcasts. Two ML-based nowcasting models were trained on the Canadian radar composite: RainNet, a convolutional neural network based on the U-Net architecture, and NowcastNet, which combines a Generative Adversarial Network with an Evolution Network to explicitly model precipitation dynamics. Verification of radar precipitation nowcasts revealed that the optimal method depends on both lead time and precipitation threshold. RainNet performed best for low precipitation thresholds (0.1-1 mm/h) at all lead times, highlighting its ability to capture widespread, weak precipitation, while NowcastNet outperformed the others at longer lead times (beyond one hour) and for higher precipitation thresholds (4+ mm/h). Farnebäck smoothed remained the most skillful for nowcasting heavy precipitation (12+ mm/h) during the first hour, likely due to its robust short-term motion estimation. 

Building on these results, we propose a Lagrangian blending method that optimally combines the predicted motion paths and the growth and decay of precipitation intensity components of the different nowcasting methods.  While optical flow methods assume constant motion and intensity evolution, ML-based methods produce time-varying motion vectors and precipitation intensities, which are explicitly leveraged in the blending framework. For deterministic nowcasts, we apply a bias-correction followed by the blending of both motion paths and intensity, allowing the generation of time-evolving blended motion fields with growth and decay.  

We also generate probabilistic nowcasts of precipitation occurrence (0.1 mm/h) and extreme precipitation (50 mm/h) by determining the optimal spatial smoothing for each model and lead time based on the area under the ROC curve. We then calibrate the resulting probabilities using isotonic (i.e. monotonically increasing) regression. Experiments are conducted using both static and dynamically varying weighting strategies for both deterministic and probabilistic radar precipitation nowcasting. The goal is to produce a blended and post-processed nowcast that outperforms each individual method across all lead times and precipitation thresholds. 

How to cite: Brunet, D., Huang, L., Belletête, J., Mahidjiba, A., and Boodoo, S.: A Lagrangian blending of optical flow and ML-based radar precipitation nowcasts , EGU General Assembly 2026, Vienna, Austria, 3–8 May 2026, EGU26-12781, https://doi.org/10.5194/egusphere-egu26-12781, 2026.

EGU26-13223 | ECS | Orals | NP5.1

Scale-dependent analysis of the accuracy–activity trade-off in AI weather forecasts 

Britta Seegebrecht, Sabrina Wahl, Stefanie Hollborn, Erik Pavel, Wael Almikaeel, Michael Langguth, Martin Schultz, Christian Lessig, Ilaria Luise, Juergen Gall, Anas Al-Iahham, and Mohamad Hakam Shams Eddin

Data-driven weather prediction models based on artificial intelligence (AI) have rapidly advanced in recent years and are frequently reported to outperform traditional physics-based numerical weather prediction (NWP) models for selected verification scores. However, optimization with respect to a specific loss function can adversely affect other metrics, potentially leading to unrealistic forecast characteristics, such as overly smooth spatial structures when mean-squared or mean-absolute error–based loss functions are used.

A robust and meaningful comparison of AI-based and NWP models therefore requires a carefully chosen and diverse set of verification metrics that accounts for potential dependencies. The main focus is placed on the prominent forecast accuracy-activity tradeoff, associated with the double penalty problem of deterministic forecasts. Related questions include: How sensitive is the relationship between accuracy and activity metrics to the choice of verification measure? Are there systematic differences between AI-based and NWP models? What is the impact of the (in)dependence between the AI training loss function and the verification metrics on the assessment of forecast skill?

These questions are addressed using both scale-independent and scale-dependent verification metrics, allowing the quantification of forecast performance on individual spatial scales.

As a starting point, global deterministic forecasts are considered. The analysis is partly based on forecasts from the Weather Prediction Model Intercomparison Project (WP MIP), which provides a collection of NWP and AI-model forecasts from multiple national weather services and research institutions.

The work is conducted within the RAINA project, which aims to develop a foundation model for the atmosphere with a particular focus on reliable, high-resolution forecasts of extreme wind and precipitation events. Consequently, the relation between, e.g., forecast activity and the predictive capability for extreme weather are of special interest.

How to cite: Seegebrecht, B., Wahl, S., Hollborn, S., Pavel, E., Almikaeel, W., Langguth, M., Schultz, M., Lessig, C., Luise, I., Gall, J., Al-Iahham, A., and Shams Eddin, M. H.: Scale-dependent analysis of the accuracy–activity trade-off in AI weather forecasts, EGU General Assembly 2026, Vienna, Austria, 3–8 May 2026, EGU26-13223, https://doi.org/10.5194/egusphere-egu26-13223, 2026.

As meteorological organisations transition to high-resolution ensemble-based forecasting, they risk leaving behind downstream users who rely on deterministic data: a need that may arise from the inability to process large volumes of data, or difficulty integrating probabilistic information into decision-making processes. Current solutions for such users typically involve providing the control (unperturbed) member of the ensemble, or deriving a single-value forecast through the independent treatment of variables (e.g., taking a median). However, relying solely on the control member discards the valuable information encoded within the full ensemble, fundamentally undermining the purpose of the ensemble. Meanwhile, univariate approaches can result in forecasts that lack physical consistency across variables. This limitation becomes critical when variables are interpreted jointly in real‑world decision‑making. Wind speed and direction exemplify this: these variables are used together in sectors such as renewable energy, where they inform turbine operation and resource planning, and aviation, where they underpin safety‑critical decisions around take‑off and landing. For these users, unrealistic combinations of speed and direction can translate directly into flawed risk assessments. 


To address this gap, we present a novel ensemble post-processing technique that generates physically-consistent spot forecasts of wind speed and direction by exploiting the full ensemble distribution. The method constructs joint predictive probability density functions (PDFs) using a Gamma kernel for wind speed and a von Mises kernel for wind direction, accommodating the distinct statistical properties of these variables: non-negativity and skewness for speed, and circularity for direction. A single-value forecast is then obtained by selecting the ensemble member that maximizes its log-likelihood under the joint density across a specified forecast horizon. Because the selected forecast corresponds to one of the original ensemble members, it represents a physically plausible atmospheric state and maintains consistency across all variables, including those not directly analysed. This is critical for operational users: approaches that treat wind speed and direction separately (such as taking independent averages or applying separate post-processing to each variable) can produce unrealistic artefacts when passed through downstream physical or statistical models.  


This method was evaluated using the Met Office convective-scale ensemble, MOGREPS-UK, over the UK domain for a full calendar year, with verification at both the surface and aloft. Results are promising: the approach demonstrates the potential to outperform the control member, particularly at longer leadtimes where ensemble spread is greatest. These findings highlight an important step toward improving our offering to users and ensuring they remain supported as we transition to purely ensemble-based forecasting. Crucially, this work is not just theoretical; the next stage is to embed the technique into operational workflows and deliver it within user-facing products, ensuring these advances translate directly into improved real-world decision-making. 

How to cite: Lake, A.: Joint Forecasting of Wind Speed and Direction via Ensemble Post-Processing, EGU General Assembly 2026, Vienna, Austria, 3–8 May 2026, EGU26-13365, https://doi.org/10.5194/egusphere-egu26-13365, 2026.

Current state-of-the-art artificial-intelligence weather prediction (AI-WP) systems are trained on a large archive of atmospheric reanalysis data. The training objective is to replicate the analysis at a future time step using the previous time steps. Loss functions guide the model to minimize the prediction error on known data. An analysis-based verification of forecasts derived from unseen data will reveal the strength and weaknesses of the AI-WP model in reproducing the statistical and dynamical characteristics of the underlying reanalysis.

In contrast, the development and fine-tuning of traditional physics-based numerical weather prediction (NWP) systems relies on verification against observations, with the aim of reducing discrepancies relative to various observational systems. This fundamental difference raises the question of what to expect when applying observation-based verification to AI-WP models that are trained on reanalysis rather than directly on observations.

Reanalysis datasets have well-known errors with respect to observations which are documented in literature. Consequently, observation-based verification of AI-WP systems will inherently reflect the observational error characteristics of the reanalysis. Deviations from this expectation are particularly informative: a larger error than that of the reanalysis may indicate deficiencies in emulation, whereas a smaller error raises the question of whether, and from where, additional information beyond the reanalysis has been obtained.

To address these questions, we apply the multiple correlation decomposition based on partial correlations introduced by Glowienka-Hense et al. (2020). This method decomposes the explained variance of two different datasets with respect to the same observations into a component of information contained in both datasets (shared explained variance) and the respective added values, i.e., information present in one dataset but not in the other. This decomposition enables quantification of the information transferred from the reanalysis into the forecasts and reveals potential deficiencies, or improvements relative the reanalysis, in the training process. Furthermore, it facilitates comparison of different forecasting systems in terms of there shared and unique information content. The method is demonstrated using 2m-temperature station observations and global deterministic AI-WP and NWP forecasts.

Glowienka-Hense et al. (2020): Comparing forecast systems with multiple correlation decomposition based on partial correlation, ASCMO, 6, 103–113, https://doi.org/10.5194/ascmo-6-103-2020

How to cite: Wahl, S.: Observation-based verification of AI weather prediction models: What can we expect?, EGU General Assembly 2026, Vienna, Austria, 3–8 May 2026, EGU26-13910, https://doi.org/10.5194/egusphere-egu26-13910, 2026.

EGU26-14107 | Posters on site | NP5.1

Improvements to the Met Office operational Visibility diagnostic using Machine Learning  

Katharine Grant and Gavin Evans

Visibility forecasting is critical for aviation, transportation, and public safety, yet remains a challenging aspect of meteorology due to complex atmospheric processes and aerosol interactions. Accurate visibility prediction is essential for operational decision-making, but traditional approaches often struggle with physical realism and probabilistic reliability. 

This study addresses these challenges within the Met Office’s IMPROVER (Integrated Model post-PROcessing and VERification) framework, which provides probabilistic post-processing of Numerical Weather Prediction (NWP) output for customers including the UK Public Weather Service. Historically, visibility diagnostics in IMPROVER have been constrained by limitations in the underlying NWP model. To overcome this, two key enhancements were introduced. First, the integration of VERA (Visibility Employing Realistic Aerosols), an existing diagnostic within the Unified Model (UM), which incorporates polydisperse aerosol effects to deliver a more physically consistent representation of visibility.  
Second, building on this improved foundation, a statistical post-processing step was implemented using Quantile Regression Forests (QRF), marking the first application of machine learning within IMPROVER. QRF was chosen for its ability to capture complex, non-linear relationships and produce calibrated probabilistic forecasts. 

The primary objective was to improve forecast skill at operationally significant thresholds, particularly <7.5 km and <1 km, which are critical for aviation and road safety. Benchmarking on the EUPPBench dataset compared QRF against reliability calibration and Distribution Regression Networks (DRN). QRF demonstrated superior performance, achieving a 45% improvement in Ranked Probability Skill Score (RPSS) over the raw NWP output. Subsequent testing using Met Office data also showed significant improvement, with QRF delivering a 9% RPSS increase for thresholds <7.5 km and a 22% improvement in Continuous RPSS across all thresholds. 

This work demonstrates the value of combining physically realistic NWP diagnostics with machine learning techniques to enhance probabilistic visibility forecasts. These improvements pave the way for more reliable decision-making in sectors sensitive to visibility conditions. Putting this research into operational production as of early 2026 represents a significant step forward in the quality of our visibility forecasts. 

How to cite: Grant, K. and Evans, G.: Improvements to the Met Office operational Visibility diagnostic using Machine Learning , EGU General Assembly 2026, Vienna, Austria, 3–8 May 2026, EGU26-14107, https://doi.org/10.5194/egusphere-egu26-14107, 2026.

EGU26-14658 | ECS | Posters on site | NP5.1

Representation of equatorial waves in state-of-the-art data-driven weather prediction models 

Jasmin Haupt, Hyunju Jung, Marie Müller, Steffen Tietsche, Tobias Selz, Peter Knippertz, and Julian Quinting

Equatorial waves are a key process in shaping tropical weather and have been linked to tropical-extratropical teleconnections. Besides, they are one of the reasons for the higher predictability limit in the tropics compared to the extratropics. Yet, their correct representation in weather prediction models is a long-standing challenge, even at model resolutions on the km-scale, leaving substantial potential in global weather predictions unused.

In this study, we systematically quantify and compare the representation of equatorial waves in 10-day forecasts of operational deterministic state-of-the-art weather prediction models (numerical, hybrid, and data-driven). The forecast data initialized from 01 January 2020 to 16 December 2020 are provided by WeatherBench2 and dedicated experiments with AIFS from the European Centre for Medium-Range Weather Forecasts (ECMWF). Equatorial Kelvin, Rossby, and westward-moving mixed Rossby-Gravity waves have been identified based on 850-hPa winds and geopotential height using the approach of Yang et al. (2003). The filtered data-driven forecast data are evaluated against ERA5 and operational ECMWF analysis for wave amplitude and pattern correlation, and compared with the numerical weather prediction (NWP) model Integrated Forecasting System (IFS) from ECMWF.

The key finding is that for the period 2020, all data-driven weather prediction models outperform the NWP-based forecasts of the IFS model in representing equatorial wave patterns beyond 3 days lead time, evaluated with the Pearson Correlation Coefficient, except for the Rossby wave mode n=1, which is equally well represented by all models.  
For Kelvin waves, the difference in forecast skill is most remarkable with an extension of the forecast horizon in most models from 8 to 10 days. In terms of Kelvin wave activity bias, ML-models exhibit a smaller systematic error than the IFS model, which locally underestimates the Kelvin wave activity by up to 30 % when evaluated against ERA5, with the highest underestimation in the Pacific. Interestingly, the equatorial wave representation in the data-driven model Pangu-Weather depends on the initialization dataset. We currently investigate the reason for this difference by systematically comparing ML-forecasts initialized from ERA5 and operational ECMWF analysis.

How to cite: Haupt, J., Jung, H., Müller, M., Tietsche, S., Selz, T., Knippertz, P., and Quinting, J.: Representation of equatorial waves in state-of-the-art data-driven weather prediction models, EGU General Assembly 2026, Vienna, Austria, 3–8 May 2026, EGU26-14658, https://doi.org/10.5194/egusphere-egu26-14658, 2026.

This study aims to estimate the objective amount of the supercooled liquid water content (SLWC) using in situ aircraft observation data to construct an objective and consistent long-term dataset of aircraft icing intensity. SLWC was estimated using two conventional calibration methods and a newly proposed Gated Recurrent Unit (GRU) model, based on measurements from the Rosemount Icing Detector (RICE) and collocated in situ aircraft observations. The observations were collected by NARA research aircraft operated by the National Institute of Meteorological Sciences in South Korea, which has conducted regular atmospheric observations since February 2018. The GRU-based approach demonstrated substantially improved performance compared to the calibration methods, achieving a Pearson correlation coefficient of 0.945 and a Nash–Sutcliffe efficiency of 0.891 when evaluated against independent observations not used in model training. In particular, the proposed method enables a more detailed representation of SLWC evolution by providing time-series SLWC estimates, whereas calibration-based approaches typically provide a single representative value for each icing event. The GRU-based estimates closely reproduce the observed temporal variability of SLWC in NARA icing cases, further demonstrating the capability of the proposed method to capture realistic SLWC evolution. The estimated SLWC from the proposed model were subsequently used to classify icing intensity based on operationally established SLWC thresholds for each icing intensity category, resulting in a robust long-term icing intensity dataset spanning over six years. The outcomes of this study are expected to contribute not only to aircraft icing research but also to a broad spectrum of applications including remote-sensing-based hydrometeor detection, cloud microphysical processes, and numerical weather prediction model parameterizations.

Acknowledgement: This research is supported by the Korea Meteorological Administration Research and Development Program under Grant RS-2022-KM220310 and RS-2022-KM220410.

How to cite: Kim, E.-T. and Kim, J.-H.: A Novel Method for Estimating the Supercooled Liquid Water Content Using In Situ Aircraft Observation Data and Gated Recurrent Unit, EGU General Assembly 2026, Vienna, Austria, 3–8 May 2026, EGU26-15199, https://doi.org/10.5194/egusphere-egu26-15199, 2026.

EGU26-17204 | ECS | Orals | NP5.1

Dynamical evaluation of the error representation in the generative AI nowcasting model  LDCast 

Martin Bonte, Stéphane Vannitsem, and Lesley De Cruz

The variability in ensemble forecasts can either be generated dynamically - as is usually done with Numerical Weather Prediction (NWP) models -, stochastically or by using new approaches such as AI generative techniques. As these approaches are in their infancy for geophysical applications, the properties of the ensembles of generative models are still far from clear, especially if those models are to be used in operational activities. This aspect is investigated here for nowcasting models.

This work provides a predictability analysis over Belgium for the generative AI nowcasting model LDCast [1], as well as for the stochastic STEPS nowcasting algorithm (pysteps implementation [2]). Both models correctly estimate the error at almost all scales by means of their ensemble spread (i.e. good spread/error relationship), and they adapt the morphology of their ensembles depending on whether the event dynamics is convective or stratiform. Surrogate ensembles are also derived from the ensembles of STEPS and LDCast, and used as benchmarks with which to compare the spatial scores of the models. This reveals that both STEPS and LDCast ensembles struggle to provide added value for the spatial localization of the uncertainty associated with the growth and decay of rainfall. Therefore, STEPS and LDCast ensembles seem to be accurate statistically but not dynamically.

[1] Leinonen, J., et al. (2023). Latent diffusion models for generative precipitation nowcasting with accurate uncertainty quantification. arXiv preprint arXiv:2304.12891.

[2] Pulkkinen, S., et al. (2019). Pysteps: an open-source python library for probabilistic precipitation nowcasting (v1.0). GMD, 12(10):4185–4219.

How to cite: Bonte, M., Vannitsem, S., and De Cruz, L.: Dynamical evaluation of the error representation in the generative AI nowcasting model  LDCast, EGU General Assembly 2026, Vienna, Austria, 3–8 May 2026, EGU26-17204, https://doi.org/10.5194/egusphere-egu26-17204, 2026.

EGU26-17479 | Orals | NP5.1

From ERA5 to Precipitation Extremes: Global km-Scale, Sub-Hourly Downscaling with Generative AI 

Luca Glawion, Julius Polz, Harald Kunstmann, Benjamin Fersch, and Christian Chwala

Global reanalysis products such as ERA5 are indispensable for climate and hydrological studies, yet their coarse spatial and temporal resolution limits the representation of localised and short-lived precipitation extremes. Building on our earlier work [1], we now present the published and ready-to-use version of spateGAN-ERA5, a generative AI framework for global spatio-temporal downscaling of ERA5 precipitation to kilometre and sub-hourly scales (2 km, 10 min) [2].

The model, trained using gauge-adjusted radar observations over Germany, generates realistic high-resolution precipitation ensembles conditioned on ERA5 inputs. We demonstrate robust performance across multiple climate regimes through independent evaluations over Germany, the United States, and Australia, showing clear improvements in spatial structure, temporal coherence, and extreme rainfall representation compared to native ERA5 fields. Ensemble generation further enables probabilistic uncertainty quantification.

To facilitate broad adoption, we provide a public, easy-to-use downscaling tool [3] that enables on-demand generation of high-resolution precipitation for any region and time period worldwide. The approach is computationally efficient and applicable on modest GPU hardware, making it suitable for both regional studies and large-scale applications. spateGAN-ERA5 thus establishes a practical pathway toward global high-resolution precipitation products for climate impact analysis, hydrological modelling, and AI-based weather and climate research.

[1] Glawion, L., Polz, J., Kunstmann, H., Fersch, B., & Chwala, C. (2023). spateGAN: Spatio‑temporal downscaling of rainfall fields using a cGAN approach. Earth and Space Science, 10, e2023EA002906. https://doi.org/10.1029/2023EA002906

[2] Glawion, L., Polz, J., Kunstmann, H., Fersch, B., & Chwala, C. (2025). Global spatio‑temporal ERA5 precipitation downscaling to km and sub‑hourly scale using generative AI. npj Climate and Atmospheric Science, 8, 219. https://doi.org/10.1038/s41612-025-01103-y

[3] https://github.com/LGlawion/spateGAN_ERA5

How to cite: Glawion, L., Polz, J., Kunstmann, H., Fersch, B., and Chwala, C.: From ERA5 to Precipitation Extremes: Global km-Scale, Sub-Hourly Downscaling with Generative AI, EGU General Assembly 2026, Vienna, Austria, 3–8 May 2026, EGU26-17479, https://doi.org/10.5194/egusphere-egu26-17479, 2026.

EGU26-17711 | ECS | Orals | NP5.1

Probabilistic Benchmarks and Post-Processing for Data-Driven Weather Forecasting 

Tobias Biegert, Nils Koster, and Sebastian Lerch

In recent years, significant progress in machine learning technologies has enabled the development of various artificial intelligence weather prediction (AIWP) models, approaching, or even surpassing the skill of numerical weather prediction (NWP) models.

However, despite these advancements, several important questions remain open. Most data-driven models primarily focus on deterministic point forecasts and lack the capability to generate probabilistic predictions, which, however, is crucial for optimal decision making and quantifying weather risk in applications. Further, while it has been widely demonstrated that physics-based NWP models substantially benefit from post-processing methods, which aim to correct systematic errors, the use of post-processing for data-driven weather models has not been explored in detail.

Our overarching aim thus is to investigate the application of various post-processing techniques to potentially improve predictions, as well as to generate probabilistic forecasts from deterministic AIWP as well as NWP model outputs. We assess whether AI-based weather models benefit from post-processing to a similar extent as physics-based NWP, enabling a fair comparison between post-processed AIWP and NWP forecasts. The resulting post-processed AIWP forecasts also yield a relatively simple probabilistic benchmark for evaluating whether inherently probabilistic AIWP models deliver commensurate skill improvements given their increased computational cost.

Experiments are based on the WeatherBench 2 framework, which provides a standardized archive of prominent AIWP as well as operational NWP model outputs. Specifically, we apply a suite of established statistical and machine learning post-processing methods to model outputs for the eight variables defined as headline scores (Z500, T850, Q700, WV850, T2M, WS10, MSLP, TP24hr) in the WeatherBench 2 framework, and systematically evaluate the effectiveness of these methods for improving deterministic and probabilistic forecasts.

Results show that post-processed probabilistic forecasts can outperform the ensemble predictions from the European Centre for Medium-Range Weather Forecasts for shorter lead times of up to one week for selected variables, but the results vary across variables, lead times, post-processing methods and forecasting models.

How to cite: Biegert, T., Koster, N., and Lerch, S.: Probabilistic Benchmarks and Post-Processing for Data-Driven Weather Forecasting, EGU General Assembly 2026, Vienna, Austria, 3–8 May 2026, EGU26-17711, https://doi.org/10.5194/egusphere-egu26-17711, 2026.

Taiwan is located along the circum-Pacific seismic belt and is frequently affected by destructive earthquakes. Identifying reliable preseismic anomalies is therefore crucial for seismic hazard mitigation. Previous studies have demonstrated that groundwater levels are influenced not only by nontectonic factors—such as precipitation, atmospheric pressure, tides, and temperature—but also by stress redistribution associated with earthquake preparation processes. However, robust quantitative methods capable of separating nontectonic influences from tectonic anomalies remain limited. In this study, the 2016 Meinong earthquake in southern Taiwan was investigated as a case study. Support vector regression (SVR) models were developed using meteorological variables and groundwater level observations to construct predictive models of groundwater fluctuations and to identify preseismic anomalies related to crustal stress accumulation. Groundwater monitoring stations located west of the epicenter were first selected based on their clear coseismic responses and strong spatial correspondence with observed surface deformation. Using air temperature, precipitation, and atmospheric pressure as explanatory variables, the SVR model and the Akaike Information Criterion (AIC) were applied to determine optimal lag structures and to establish pre-earthquake groundwater prediction models. The trained models were then used to simulate groundwater levels over the two years preceding the earthquake, and residual analysis was performed to identify anomalous signals. Among the 12 analyzed stations, 9 exhibited coefficients of determination (R²) ranging from 0.18 to 0.79. Stations situated in coastal fine-sand aquifers showed substantially higher predictive performance (R² = 0.42–0.79) than those located in mountainous regions (R² = 0.18–0.49). Six stations displayed pronounced negative residual anomalies exceeding two standard deviations approximately one year prior to the earthquake, followed by a gradual recovery toward the event. This temporal pattern is consistent with deformation trends observed at nearby surface monitoring stations. In addition, three stations exhibited short-term residual anomalies exceeding two standard deviations within approximately one month before the earthquake. These results demonstrate that groundwater level anomalies derived from physically informed predictive models can be systematically linked to surface deformation and short-term precursory processes preceding earthquakes. Our findings highlight the potential of groundwater monitoring as a complementary indicator for earthquake precursor detection and seismic hazard assessment.

How to cite: Mai, Y.-L., Chen, X.-N., and Lu, T.-H.: Identification of Tectonic Anomalies Prior to the Meinong Earthquake in Taiwan Using a Support Vector Regression–Based Groundwater Level Model, EGU General Assembly 2026, Vienna, Austria, 3–8 May 2026, EGU26-18581, https://doi.org/10.5194/egusphere-egu26-18581, 2026.

EGU26-18999 | Posters on site | NP5.1

Machine learning sea-surface temperature forecasting based on empirical orthogonal functions 

Takeshi Enomoto, Aki Saito, and Saori Nakashita

Data-driven forecasting of the atmosphere and ocean is evolving rapidly. Recent reports on machine learning weather prediction (MLWP) demonstrate that these models rival or even outperform traditional numerical weather prediction (NWP) from leading operational centres. While the inference is faster than physics-based models, MLWP typically requires Graphical Processing Units (GPUs) or Tensor Processing Units (TPUs) with significant memory, and the computational requirements for training remain enormous.

Certain applications prioritize efficiency, such as sea-surface temperature (SST) prediction on research vessels with limited communication bandwidth. We address this problem by proposing a light-weight alternative to convolutional neural networks (CNNs) or vision transformers (ViTs). To this end, we utilize gradient boosting, specifically XGBoost, which is highly efficient for tabular data. To incorporate spatial patterns, we conduct the Singular Value Decomposition (SVD) to derive Empirical Orthogonal Functions (EOFs). We train the model on the four years of 0.1° SST data based on Himawari over the Western Pacific (120°E–150°E, 20°N–50°N). Preliminary 5-day forecasts show a median error improvement to −0.082 K from 0.10 K and a reduction in standard deviation to 0.68 K from 0.74 K compared to the persistence baseline.

Acknowledgements: This work was supported by JSPS KAKENHI 24H02226.

How to cite: Enomoto, T., Saito, A., and Nakashita, S.: Machine learning sea-surface temperature forecasting based on empirical orthogonal functions, EGU General Assembly 2026, Vienna, Austria, 3–8 May 2026, EGU26-18999, https://doi.org/10.5194/egusphere-egu26-18999, 2026.

Uncertainty remains a major challenge in typhoon rainfall forecasting over Taiwan, even when cloud-resolving numerical weather prediction models are employed. Individual forecasts often exhibit large variability in rainfall amount and spatial distribution, particularly at long lead times, while their credibility is generally unknown at forecast time.

This study presents a machine learning–based framework for the a priori diagnosis of uncertainty in typhoon rainfall forecasts. Approximately fifteen years of cloud-resolving regional model forecasts and corresponding precipitation observations are used to quantify forecast quality through a similarity skill score (SSS), which measures the spatial agreement between forecasted and observed accumulated rainfall during the typhoon impact period. The machine learning model is designed to predict the future SSS of individual forecasts using only information available at forecast time, including diagnostics from the regional model and large-scale environmental and track-related predictors derived from global forecasts.

To ensure robust evaluation, the dataset is split by independent typhoon cases and time periods to avoid information leakage. Preliminary analyses suggest that the proposed approach can capture variations in forecast credibility, with forecasts predicted to have high SSS exhibiting a substantially higher likelihood of achieving high observed SSS.

Rather than improving rainfall forecasts themselves, this study focuses on statistical post-processing and uncertainty diagnosis, demonstrating the potential of machine learning as an objective tool for assessing the credibility of high-resolution typhoon rainfall forecasts.

How to cite: Chen, S.-H. and Wang, C.-C.: A Priori Diagnosis of Uncertainty in Cloud-Resolving Typhoon Rainfall Forecasts over Taiwan Using Machine Learning, EGU General Assembly 2026, Vienna, Austria, 3–8 May 2026, EGU26-19403, https://doi.org/10.5194/egusphere-egu26-19403, 2026.

EGU26-19639 | Orals | NP5.1

Discrete Learning Algorithms for Precipitation Estimation from Commercial Microwave Links 

Guy Even, Andreas Karrenbauer, Rex Lei, Jonatan Ostrometzky, and Christian Sohler

Commercial microwave links (CMLs) are part of the infrastructure of wireless networks.  Their measured attenuations have been studied as an opportunistic source for monitoring spatiotemporal rainfall and other atmospheric phenomena. CML attenuation measurements can enhance the spatiotemporal accuracy and resolution of existing weather monitoring instruments. In addition, they serve as stand-alone weather monitoring devices in places where dedicated weather monitoring devices are scarce or do not exist.

Current techniques for 2D rainfall map reconstruction usually reduce CML measurements to virtual rain-gauges (i.e., point measurements) and rely on interpolation techniques such as inverse distance weighting or Kriging. While effective in many scenarios, these methods are suboptimal because they do not address the mis-modeling due to the reduction from a link-path attenuation integration to a single point rain-intensity measurement.

In this study, we revisit the rainfall map reconstruction problem from CML signal attenuation measurements as a principled optimization approach. We formulate the problem of the partial-to-complete field reconstruction as a physics-informed optimization problem. The reconstructed rainfall field is quantized and represented by pixel-rainfall variables whose values are constrained to agree with the observed CML signal attenuations. The resulting solution minimizes a weighted sum of the attenuation errors along the links, spatial differences between neighboring pixels, and the total rainfall in all the pixels of the map.

To evaluate our approach, we create a benchmark of hundreds of rainfall maps and CML locations and attenuations.
Rainfall maps are algorithmically extracted by identifying rain events in EURADCLIM rain maps (the European climatological high-resolution gauge-adjusted radar precipitation dataset). We identify rain events consisting of patches of about 50x50 km² over various terrain types and rain patterns.
We overlay CMLs on each patch using the free ``Four-year commercial microwave link dataset for the Netherlands'' (publicly available in the 4TU.ResearchData platfrom).
We then apply the ITU-R P.838 model at a pixel level to compute the CML attenuations based on the rainfall to obtain noiseless attenuation measurements.

We apply the inverse optimization procedure to the CML attenuations to reconstruct the rainfall maps. The accuracy of the reconstructed rainfall map is evaluated and compared with the inverse distance weighting approach.
Overall, this study reframes rainfall reconstruction from opportunistic sensing networks as a well-posed inverse problem with an explicit objective function.
Our reconstruction framework can also assist in explaining AI-solutions in the absence of ground truth.

How to cite: Even, G., Karrenbauer, A., Lei, R., Ostrometzky, J., and Sohler, C.: Discrete Learning Algorithms for Precipitation Estimation from Commercial Microwave Links, EGU General Assembly 2026, Vienna, Austria, 3–8 May 2026, EGU26-19639, https://doi.org/10.5194/egusphere-egu26-19639, 2026.

As a proper score, the continuous ranked probability score (CRPS) is widely used within the field of statistical postprocessing of ensemble forecasts, both for forecast verification and as a loss function for parameter estimation with distributional regression approaches. This includes standard ensemble model output statistics (EMOS) and machine learning (ML) based approaches such as distributional regression networks (DRN). It is known that the CRPS admits equivalent representations as an integral of the Brier score over probability thresholds or an integral of the quantile score over quantile levels. The CRPS can be further generalized with a weighting function to put more weight on certain regions of the predictive distribution (the threshold-weighted CRPS or twCRPS), or to put more weight on certain quantiles of the distribution (quantile-weighting, denoted qwCRPS). In this work, we consider a general 2-parameter class of weight functions that give rise to an analytical expression for the qwCRPS for certain predictive distributions such as the logistic distribution. This generalized version of the CRPS puts a different penalty on over- or underforecasting the meteorological variable, allowing tailored postprocessing for end users with specific cost-loss ratios. We apply a DRN approach using the qwCRPS as loss function to various use cases, including the postprocessing of wind power forecasts for the Belgian Offshore Zone, and compare with the use of the standard CRPS as loss function. We also perform validation using the quantile score and the continuous generalisation of the relative economic value.

How to cite: Van den Bergh, J. and Smet, G.: Tailored postprocessing of ensemble forecasts with distributional regression networks and a quantile-weighted version of the continuous ranked probability score, EGU General Assembly 2026, Vienna, Austria, 3–8 May 2026, EGU26-20150, https://doi.org/10.5194/egusphere-egu26-20150, 2026.

Weather forecasts are issued by numerical weather prediction models, which describe the dynamic behaviour of the atmosphere. Due to the chaotic nature of the atmospheric processes, assessing the uncertainty of forecasts is essential. The state-of-the-art method is to run the prediction models several times with different initialisation and/or parameterisation to obtain an ensemble of forecasts, better representing the possible scenarios.

In the last few years, AI-based models have become the centre of attention in weather forecasting due to their accuracy and efficiency. The European Centre for Medium-Range Weather Forecasts (ECMWF) has developed its Artificial Intelligence/Integrated Forecasting System (AIFS) model, which was first to provide data-driven ensemble forecasts in June 2024. Since July 2025, the AIFS ensemble model has been operational and runs in parallel with the physics-based Integrated Forecasting System (IFS) model of ECMWF, which is considered the gold standard in weather prediction. The new AIFS model can generate forecasts ten times faster than the classical physics-based one, while consuming approximately a thousand times less energy.

We present the results of our systematic comparison of the performances of the IFS and AIFS models by investigating the accuracy of raw and post-processed 10-metre wind-speed forecasts generated by the two models between July 2025 and November 2025 across several thousand station locations. The post-processed case involves the application of the parametric Ensemble Model Output Statistics method as well as a nonparametric quantile regression approach to correct any systematic biases and dispersion inaccuracies in the raw forecasts, which are usually detectable in the case of ensemble predictions.

How to cite: Kocsis, M. and Baran, S.: AI and Physics-Based Weather Forecasting: A Comparative Study of ECMWF's Operative AIFS and IFS Ensemble Wind Speed Predictions, EGU General Assembly 2026, Vienna, Austria, 3–8 May 2026, EGU26-20244, https://doi.org/10.5194/egusphere-egu26-20244, 2026.

EGU26-20598 | ECS | Posters on site | NP5.1

Efficient deep learning for radar precipitation nowcasting using spatiotemporal encoding and two-dimensional reconstruction  

Manasa Pawar, Nicoletta Noceti, and Antonella Galizia

Short-term precipitation nowcasting, the prediction of rainfall over lead times from a few minutes to about an hour, remains challenging because radar-derived precipitation fields evolve not only through motion but also through rapid, non-linear changes such as growth, decay, and structural reorganization. Classical extrapolation methods are efficient yet struggle to represent these intensity and morphology changes, while many learning-based approaches become costly when scaled to large, high-resolution radar grids. 

Our approach treats temporal learning and spatial reconstruction as two separate problems. A compact 3D convolutional encoder processes a short radar sequence to capture how precipitation structures evolve over time. We then convert the encoder feature volumes into 2D skip representations through depth aggregation and channel compression and use a lightweight 2D decoder to reconstruct full resolution forecasts. We benchmark against persistence and a strong 2D convolution baseline. 

The framework is evaluated on the RYDL dataset derived from the German Weather Service radar composite, providing 2D radar fields every five minutes over Germany at 1 × 1 km resolution on a 900 × 900 grid. Performance is benchmarked against persistence and a strong 2D convolutional baseline using complementary verification measures, including mean absolute error, critical success index at multiple intensity thresholds, and fractions skill score with spatial tolerance. Across benchmark lead times, the proposed approach reduces MAE from 0.22 to 0.20 at 5 min, from 0.35 to 0.28 at 30 min, and from 0.44 to 0.42 at 60 min relative to the 2D baseline, indicating improved robustness at intermediate horizons while retaining competitive short-range accuracy. These results suggest that combining explicit spatio-temporal encoding with efficient two-dimensional reconstruction offers a practical route to scalable radar nowcasting on large domains. 
Keywords: Radar nowcasting, precipitation forecasting, deep learning, spatio-temporal representation learning, forecast verification 

How to cite: Pawar, M., Noceti, N., and Galizia, A.: Efficient deep learning for radar precipitation nowcasting using spatiotemporal encoding and two-dimensional reconstruction , EGU General Assembly 2026, Vienna, Austria, 3–8 May 2026, EGU26-20598, https://doi.org/10.5194/egusphere-egu26-20598, 2026.

EGU26-21878 | Orals | NP5.1

ExtremeWeatherBench 1.0: A Flexible Evaluation Framework for Extreme Weather Events 

Amy McGovern, Taylor Mandelbaum, and Daniel Rothenberg

Properly evaluating AI and NWP models before deployment will help to ensure that the final models are trustworthy. Currently, most evaluation is done at a global scale, such as with WeatherBench, rather than focusing on high-impact events. While this global evaluation is important, it can obscure the results of how a model performs on high-impact events. For example, a heat wave may be poorly forecast by one model but the model may look promising overall when examining global Root Mean Squared Error. Only by examining specific case studies do we get the bigger picture of how the model performs on phenomena that impact humanity around the world.

We introduce Extreme Weather Bench (EWB), a new community driven benchmarking suite with almost 300 case studies of high-impact weather events across the globe. EWB facilitates model validation and verification on a variety of high-impact hazards that matter to people around the globe. EWB provides a standard set of case studies (spanning multiple spatial and temporal scales and different parts of the weather spectrum), observational data, impact-based metrics, and open-source code for users to evaluate their models. The case studies include tropical cyclones, atmospheric rivers, convective weather outbreaks, heat waves and major freeze events. To facilitate ease-of-use, EWB is distributed as a pure Python package, and integrates with either local data or data saved on the cloud.

EWB will help to drive the science forward for all weather models, enabling true comparisons across models and enabling people to evaluate their models on specific high-impact phenomena while diving deeply into case studies. EWB is a free open-source community-driven system and will be adding additional phenomena, test cases and metrics in collaboration with the worldwide weather and forecast verification community.

How to cite: McGovern, A., Mandelbaum, T., and Rothenberg, D.: ExtremeWeatherBench 1.0: A Flexible Evaluation Framework for Extreme Weather Events, EGU General Assembly 2026, Vienna, Austria, 3–8 May 2026, EGU26-21878, https://doi.org/10.5194/egusphere-egu26-21878, 2026.

EGU26-21929 | Posters on site | NP5.1

Estimation and spatial prediction methods for high-frequency space-time solar irradiance 

William Kleiber and Nicolas Coloma

As the power grid moves to a more renewable future, energy sources from weather-driven phenomena such as solar power will form an increasingly large portion of electricity generation.  The predicatibility, non-Gaussianity and intermittency of solar resources challenge current grid operation paradigms, and realistic data scenarios are required for grid planning and operational studies.  However, such data are not available at the space-time resolution needed for realistic grid models.  Given sparse spatial samples that are high-resolution in time, we introduce a framework for spatiotemporal prediction and downscaling in a functional data analysis framework when data exhibit nonstationary phase misalignment.  The approach is illustrated on a challenging irradiance dataset and compares favorably against existing methods.

How to cite: Kleiber, W. and Coloma, N.: Estimation and spatial prediction methods for high-frequency space-time solar irradiance, EGU General Assembly 2026, Vienna, Austria, 3–8 May 2026, EGU26-21929, https://doi.org/10.5194/egusphere-egu26-21929, 2026.

EGU26-647 | ECS | Posters on site | CL5.10

Recurrent Neural Networks and Geostatistics Applied to the Prediction of Severe Rainfall Events and Anomaly Detection 

Débora Rodrigues, Angélica Caseri, and Sinésio Pesco

The intensification of the frequency and severity of precipitation events has had a significant impact on densely populated urban areas, highlighting the need to improve traditional weather forecasting models. Due to the dynamic nature and interaction of atmospheric, oceanic, and terrestrial factors associated with these phenomena, forecasting these events is complex and challenging. Methods based on recurrent neural networks have surpassed traditional techniques in forecasting intense precipitation. However, challenges remain, such as measurement uncertainty and the high variability of events characterized by non-stationary phenomena. In this study, we propose a predictive model that employs recurrent neural networks trained exclusively with severe rainfall events.

The methodology developed incorporates Kriging for modeling the spatial structure of precipitation, allowing values to be estimated in locations without measurements and generating continuous rainfall fields that feed the forecast model. To capture the temporal evolution and abrupt variability associated with severe events, we use recurrent neural networks structured with sliding time windows of different sizes.  This combination seeks to exploit the spatial correlation of the data and the learning capacity of time series to refine anomaly detection. The proposed approach was applied to the Metropolitan Region of Rio de Janeiro, a scenario marked by strong geomorphological complexity and high recurrence of extreme events. The results show that the integration between geostatistical interpolation and neural networks substantially improves the system's ability to capture rapid spatiotemporal variations in precipitation, which can assist risk warning systems and mitigate the socioeconomic impacts associated with these events.

How to cite: Rodrigues, D., Caseri, A., and Pesco, S.: Recurrent Neural Networks and Geostatistics Applied to the Prediction of Severe Rainfall Events and Anomaly Detection, EGU General Assembly 2026, Vienna, Austria, 3–8 May 2026, EGU26-647, https://doi.org/10.5194/egusphere-egu26-647, 2026.

EGU26-1040 | ECS | Posters on site | CL5.10

Advanced Hybrid Deep Learning for Sub-Seasonal to Seasonal Forecasting of Soil Moisture Drought Over India 

Saurabh Verma and Karthikeyan Lanka

Soil Moisture drought (SMD), characterized by insufficient soil moisture, affects water resources, crop yields, and economic stability across various temporal scales. India is an agrarian nation with ~70% of population dependent on agriculture. Forecasting SMD at sub-seasonal to seasonal (S2S) scales will support crop and water management, optimizing yields and averting losses. Traditionally, dynamical models like North American Multi Model Ensemble (NMME), CFSv2, and ECMWF's SEAS5 provide S2S predictions up to ten months, predicting drought onset and intensity. These models require post-processing through bias correction and downscaling due to uncertainties in initial conditions and parameterizations. Although dynamical forecasts show considerable skill in predicting extremes, forecast accuracy needs refinement to improve reliability and utilization in operational systems. In recent years, advancements in deep learning have shown potential to meet or surpass the quality of dynamical forecasts.

Recognizing the skill of dynamical S2S forecasts, this study develops a hybrid deep learning framework to predict SMDs in India at 1-3-month lead times. We combined dynamical forecasts from CFSv2 and SEAS5 with antecedent land-atmosphere conditions, climate drivers, and static features to predict SMDs using Graph Neural Networks (GNNs) with an extreme-aware custom loss function. GNNs have a better ability to learn spatial and temporal patterns and offer advantages over conventional models like ConvLSTM. Land-atmosphere variables include precipitation, maximum-minimum temperature, vapour pressure deficit, evapotranspiration, vegetation index, soil moisture, and wind speed. Large-scale climate drivers that influence rainfall patterns over India include El Niño, NAO, IOD, PDO, and MJO. Static features comprise soil type, position vector, elevation, and land use for essential contextual information. The model training was performed from June 1981–May 2015, and testing from June 2015–May 2022. The model performance is evaluated using metrics like probability of detection, percentage correct, false alarm rate, and equitable threat score. We also compare the model with dynamical forecasts and other benchmark deep learning algorithms to develop functional drought early warning systems.

How to cite: Verma, S. and Lanka, K.: Advanced Hybrid Deep Learning for Sub-Seasonal to Seasonal Forecasting of Soil Moisture Drought Over India, EGU General Assembly 2026, Vienna, Austria, 3–8 May 2026, EGU26-1040, https://doi.org/10.5194/egusphere-egu26-1040, 2026.

EGU26-1388 | ECS | Posters on site | CL5.10

Sub-seasonal prediction of storminess in the North Sea with machine learning methods 

Proshonni Aziz, Birgit Hünicke, Eduardo Zorita, and Corinna Schrum

This research aims to predict storminess in the North Sea using machine learning methods, focusing on how the stratosphere and upper troposphere influence winter storms. Understanding what drives winter storminess is essential for improving sub-seasonal prediction skill in a region strongly affected by extratropical cyclones. Using ERA5 reanalysis data (1940–2024), we built a storminess index based on storm event frequency and examined its relationship with large-scale atmospheric fields.

We predict North Sea storminess using two approaches, one based on the ACE2 climate emulator and another on the Random Forest machine learning algorithm. For the ACE2 model, we used air temperature and zonal and meridional wind patterns at 70 hPa as predictors. For the Random Forest regression model, we used December air temperature, zonal wind at 70 hPa, and geopotential height at 200 hPa as predictors. In both cases, the predictand is North Sea storminess. The ACE2 simulations show that when we add the initial conditions of years with low January storminess, with the December 2015 (selected because December 2015 was followed by a stormy January) stratospheric anomalies (colder temperatures and stronger winds), January surface wind speeds increase generally about 0.5–3 m/s across much of the North Sea. This suggests a dynamical link between early winter stratospheric conditions and stronger surface storminess. The Random Forest model combined with PCA shows a correlation of 0.55–0.60 when the predictors are from December, and the predictand is from January (December–January). When we test other month pairs, the correlation is 0.20–0.36 for November–December and January–February, but it drops to negative values (–0.44 to –0.05) for October–November and February–March. This pattern follows the seasonal cycle of the polar vortex. The circumpolar westerly jet strengthens from autumn and peaks in winter, when predictability is highest. This higher skill is likely linked to stronger stratosphere–troposphere coupling between November and January, as polar vortex anomalies develop and begin to descend toward the surface.

Overall, this research shows that stratospheric conditions play an essential role in shaping North Sea winter storminess and that machine learning methods can improve sub-seasonal predictions in this region.

How to cite: Aziz, P., Hünicke, B., Zorita, E., and Schrum, C.: Sub-seasonal prediction of storminess in the North Sea with machine learning methods, EGU General Assembly 2026, Vienna, Austria, 3–8 May 2026, EGU26-1388, https://doi.org/10.5194/egusphere-egu26-1388, 2026.

EGU26-4211 | Posters on site | CL5.10

A Wavelet-Embedded AI Framework for Unified Representation of Sub-Grid Physics in NWP 

Hui-Ling Chang, Zoltan Toth, Yuan-Li Tai, Chang-Kai Weng, Shu-Chih Yang, and Pay-Liam Lin

The atmosphere is a complex, multiscale deterministic system in which processes across a wide range of spatial and temporal scales interact. Numerical weather prediction (NWP) models are designed to forecast the future state of the atmosphere. Processes operating at scales larger than a model’s grid spacing are explicitly represented through finite-difference approximations of the governing physical laws. In contrast, processes occurring at scales finer than the model’s numerical resolution cannot be explicitly resolved; their effects on the resolved scales are instead represented as a bulk forcing conditioned on the resolved state.

Traditionally, forcing from sub-grid scales is partitioned into several categories, such as convection, microphysics, and planetary boundary layer. The limitations of the physical parameterization schemes used for this purpose are well known. Although these schemes are physically motivated, they generally lack closed formulations, and their parameters must ultimately be tuned. Moreover, interactions among sub-grid physical processes, which are artificially separated into categories, remain largely unresolved. The development of such schemes is also labor-intensive. As a result, physical parameterizations have long been regarded as a major source of uncertainty in NWP models.

This study is motivated by the recognition that the influence of unresolved scales on the resolved flow is fundamentally a statistical problem. From this perspective, we seek a simple and efficient statistical framework to estimate sub-grid-scale forcing. We propose a novel approach that employs artificial intelligence (AI) to statistically emulate the combined effects of all sub-grid physical processes, rather than treating them separately as in traditional parameterization schemes. A key innovation of the proposed framework is the use of localized wavelet embedding to condition the statistical estimation of forcing on the relevant spatial scales influencing each model grid column. This wavelet-based representation captures both slowly evolving large-scale features and rapidly varying small-scale features.

In addition, a neural network (NN) model is trained to predict the difference between a dynamics-only model forecast and the corresponding verifying reanalysis. This trained NN can be interpreted as an AI-based all-physics model, as it effectively represents the stochastic effects of fine-scale processes unresolved by the NWP model on the resolved scales. By integrating information across scales and processes, this AI-based all-physics framework may enable even coarse-resolution global models to accurately simulate large-scale tropical waves arising from cross-scale interactions. This task remains challenging even for high-resolution global models. The proposed approach therefore offers a promising pathway toward more accurate and computationally efficient extended-range weather prediction.

How to cite: Chang, H.-L., Toth, Z., Tai, Y.-L., Weng, C.-K., Yang, S.-C., and Lin, P.-L.: A Wavelet-Embedded AI Framework for Unified Representation of Sub-Grid Physics in NWP, EGU General Assembly 2026, Vienna, Austria, 3–8 May 2026, EGU26-4211, https://doi.org/10.5194/egusphere-egu26-4211, 2026.

Extreme value theory provides effective approaches and methods for estimating return levels RL (with a typical return period >100 years) of extreme events. However, the lack of sufficiently representative observations to properly fit extreme value distributions (EVDs) is a recurring problem for any metocean engineer in situations where the number of observations is limited or of poor quality [1]. To overcome this problem, augmenting the set of observations with complementary information sources is an interesting option. In this paper, we address this problem by fitting EVDs to both observations and predictions from machine learning models using the approach developed by [2]. By design, however, the predictions of machine learning models are uncertain because they are learned from a limited number of training samples. We therefore propose to explicitly take this error into account when inferring the EVD parameters within an approximate Bayesian computation (ABC) scheme combined with the Wasserstein distance [3].

The added value of this ML approach, which takes prediction uncertainty into account, is shown for cyclone-induced waves in Guadeloupe (Lesser Antilles) using a large database of extreme waves (representative of 1,000 years of cyclonic activity) that were numerically calculated within [4]. A random forest (RF) regression model is trained to link cyclone characteristics (radius, atmospheric pressure, distance to the eye of the hurricane) to significant wave height, and the quantile variant of the RF model is then used to model prediction error within the ABC scheme. Comparison with the 100-year and 500-year RL reference solutions (calculated using the complete database) shows that the ML-based approach results in low bias and high reliability of RL estimates as well as gain in computational efficiency, even when the sample size is reduced by a factor up to 10 and even when the RF prediction error remains moderate with cross-validation coefficient of determination of 70–75%. The benefit of integrating the ML prediction error is shown in different contexts, both along Guadeloupe coasts and in deep ocean environments.

[1] Jonathan et al. (2021). Ocean Engineering, doi:10.1016/j.oceaneng.2020.107725

[2] Rohmer et al. (2023). Ocean Modelling, doi:10.1016/j.ocemod.2023.102275

[3] Bernton et al. (2019). Journal of the Royal Statistical Society Series B, https://doi.org/10.1111/rssb.12312

[4] Interreg Carib-Coast program, https://www.carib-coast.com/en/

How to cite: Rohmer, J., Filippini, A. G., and Pedreros, R.: Improved return level estimates of cyclone-induced extreme waves by combining extreme value distribution and probabilistic machine learning predictions, EGU General Assembly 2026, Vienna, Austria, 3–8 May 2026, EGU26-4874, https://doi.org/10.5194/egusphere-egu26-4874, 2026.

EGU26-5045 | ECS | Posters on site | CL5.10

A Self-Supervised Analogue Framework for Probabilistic Subseasonal Forecasting of Heat Extremes 

Thomas Mortier, Cas Decancq, Marc Lemus-Cánovas, Damián Insua-Costa, and Diego G. Miralles

Accurate forecasting of climate extremes such as droughts, heatwaves, and heat stress episodes at subseasonal-to-seasonal (S2S) timescales is of high importance for the public health, energy, water management, and agriculture sectors. However, there is a communis opinio that these scales, commonly referred to as the "predictability desert", represents a major scientific challenge for accurate forecasting. Indeed, despite recent progress, both state-of-the-art numerical and deep learning-based weather forecasting models still exhibit limited skill in forecasting extreme events beyond ten days (Bodnar et al., 2025; Bi et al., 2023; Chen et al., 2023; Lam et al., 2023; Chattopadhyay et al., 2020).

In this work, an alternative approach is considered by revisiting analogue forecasting methods (Marina et al., 2026; Pérez-Aracil et al., 2024). In the spirit of the K-nearest neighbor algorithm, these methods are built on the premise that atmospheric states with similar initial conditions tend to evolve in a similar manner (Zhao et al., 2016; Lorenz, 1969). As a result, they provide an interpretable and computationally efficient forecasting approach. However, the high dimensionality of the predictor space, combined with the choice of similarity metric, makes the identification of relevant analogues for forecasting extreme events non-trivial.

By drawing on architectural principles from state-of-the-art deep learning-based weather forecasting models, we propose a novel forecasting method that combines traditional analogue techniques with self-supervised learning. Global atmospheric, ocean, and land surface fields are first mapped into a low-dimensional latent space. Analogues are then identified in this learned space, enabling probabilistic reconstruction and forecasting of heat extremes. We evaluate our method in terms of analogue selection and forecast accuracy, with a particular emphasis on interpretability, physical consistency, and generalization to unseen heat extremes.

References:

Bodnar, C., et al. A Foundation Model for the Earth System. Nature, 2025.

Bi, K., et al. Accurate Medium-Range Global Weather Forecasting with 3D Neural Networks. Nature, 2023. 

Chattopadhyay, A., et al. Analog Forecasting of Extreme-Causing Weather Patterns Using Deep Learning. Journal of Advances in Modeling Earth Systems, 2020.

Chen, L., et al. FuXi: a Cascade Machine Learning Forecasting System for 15-day Global Weather Forecast. Npj Climate and Atmospheric Science, 2023.

Lam, R., et al. Learning Skillful Medium-Range Global Weather Forecasting. Science, 2023.

Lorenz, E. Atmospheric Predictability as Revealed by Naturally Occurring Analogues. Atmospheric Sciences, 1969. 

Marina, C. M., et al. Detection and Attribution of Heat Waves with the Multivariate Autoencoder Flow-Analogue Method (MvAE-AM). Atmospheric Research, 2026.

Pérez-Aracil, J., et al. Autoencoder-based Flow-Analogue Probabilistic Reconstruction of Heat Waves from Pressure Fields. Annals of the New York Academy of Sciences, 2024.

Zhao, Z., et al. Analog Forecasting with Dynamics-Adapted Kernels. Nonlinearity, 2016.

How to cite: Mortier, T., Decancq, C., Lemus-Cánovas, M., Insua-Costa, D., and G. Miralles, D.: A Self-Supervised Analogue Framework for Probabilistic Subseasonal Forecasting of Heat Extremes, EGU General Assembly 2026, Vienna, Austria, 3–8 May 2026, EGU26-5045, https://doi.org/10.5194/egusphere-egu26-5045, 2026.

 Climate change has intensified the frequency and severity of extreme meteorological events, placing growing pressure on the stable operation of wastewater treatment plants (WWTPs). Heavy rainfall and elevated temperatures can trigger abrupt changes in influent flow and pollutant loading, thereby challenging both hydraulic and operational stability of WWTPs. Although these responses are driven by meteorological forcing, their magnitude and manifestation differ across WWTPs. Such differences may be associated with non-climatic characteristics, including urbanization and plant capacity.

 Accordingly, this study aims to evaluate the climate vulnerability of WWTPs by (1) characterizing relationships between meteorological conditions and influent dynamics and quantifying their sensitivity under extreme and non-extreme climate clusters, and (2) projecting future influent conditions under climate change scenarios using predictive deep learning models.

 Daily operational and meteorological data collected from January 2016 to July 2025 were analyzed for four representative WWTPs located in a major metropolitan area in Republic of Korea. Meteorological variables were derived from Automated Weather System (AWS) observations and spatially aligned with service areas of each treatment plant. Meteorological conditions were classified using K-means clustering, and climate sensitivity was quantified by comparing extreme and non-extreme clusters using Cohen’s d effect size. Future influent conditions were projected by applying SSP5-8.5 climate scenario to a gated recurrent unit (GRU) trained on historical meteorological observations.

 Meteorological clustering identified five distinct climate clusters, among which hot–wet (extreme event) conditions exerted the strongest impacts across all WWTPs. Under hot–wet conditions, influent volumes increased by approximately 38–86% relative to cool–dry clusters. In contrast, influent concentrations (mg/L) of organic matter and nutrients generally decreased by 20–40%, reflecting dilution effects. Conversely, suspended solids (SS) loads (kg/d) increased by an average of approximately 80% across WWTPs, indicating a strong linkage between rainfall and sediment transport.

 In terms of treatment performance, nutrient removal efficiencies (total nitrogen (TN) and total phosphorus (TP)) declined markedly than those of organic matter and SS. Effect-size-based analysis revealed pronounced climate sensitivity, with very large effect sizes for influent flow (Cohen’s d ≈ 2.0–3.0) and consistently large sensitivities for SS load and nutrient removal (d > 1.0). In contrast, organic matter removal showed relatively smaller sensitivities. These response patterns were subsequently used to assess climate vulnerability across WWTPs with different levels of urbanization and plant capacities, highlighting substantial inter-plant variability in climate sensitivity.

 Building on the climate sensitivity patterns derived from historical observations, scenario-based projections suggest that increasing frequencies of extreme weather were likely to further amplify influent variability and pollutant loading under future climate conditions. Taken together, the historical analysis demonstrates that the vulnerability of WWTPs to climate change is influenced not only by extreme weather patterns but also by intrinsic system characteristics. The scenario-based projections extend these insights by highlighting potential future risks under climate forcing. By integrating meteorological clustering, effect-size-based sensitivity analysis, and scenario-driven influent projections, this study provides a practical framework for identifying vulnerable facilities and informing climate adaptation strategies, including capacity planning, nutrient management under extreme influent conditions, and prioritization of infrastructure upgrades.


How to cite: Park, H. and Kim, Y. M.: Climate Vulnerability of Wastewater Treatment Plants to Extreme Weather: An Effect-Size-Based Sensitivity Analysis of Influent and Performance, EGU General Assembly 2026, Vienna, Austria, 3–8 May 2026, EGU26-6433, https://doi.org/10.5194/egusphere-egu26-6433, 2026.

EGU26-7714 | ECS | Posters on site | CL5.10

AI-enhanced national-scale assessment of meteorological risk hotspots for wind and hydropower 

Raphael Spiekermann, Irene Schicker, Annemarie Lexer, and Sebastian Lehner

Austria’s expansion of renewable energy generation, together with projected increases in climate variability under climate change, is expected to substantially increase the vulnerability of the energy system to weather-driven disruptions. This challenge is particularly acute in the Alpine region, where complex topography and land–atmosphere interactions drive highly heterogeneous and rapidly evolving meteorological conditions. These Alpine-specific processes give rise to localized extreme events that are difficult to forecast and pose significant challenges for energy system operation, infrastructure planning, and grid stability.

The project EnergyProtect aims to identify present and future meteorological risk hotspots, defined as locations of renewable energy infrastructure with elevated exposure to weather conditions that can impair energy production or destabilize the electricity grid. We focus on hazardous meteorological phenomena relevant to wind and hydropower systems, including wind speed ramping, high wind and gust events, and high-precipitation episodes. Rapid wind speed changes can induce mechanical stress on wind turbines and other energy-related infrastructure, reduce operational efficiency, and trigger sudden power fluctuations that challenge grid balancing. Sustained high winds and gusts may lead to turbine cut-outs, structural damage, and pronounced power ramping events. In hydropower systems, extreme precipitation can increase tailwater levels, thereby reducing generation efficiency, while also elevating the risk of electrical faults and infrastructure damage in flood-prone areas.

The meteorological hazard assessment combines several advanced modelling approaches. Key components include (i) physics-informed machine learning techniques to detect and classify patterns of adverse weather, (ii) an ensemble of dynamically downscaled climate simulations at convection-permitting resolutions to capture Alpine-scale processes, and (iii) probabilistic estimates of event frequency, return periods, and future changes in intensity. This framework enables a consistent characterization of both present-day and future extreme weather hazards, while explicitly accounting for model and scenario uncertainty.

These meteorological datasets are subsequently integrated into a spatio-temporal exposure analysis of renewable energy assets to identify current and projected risk hotspots. We present preliminary results for multiple severity levels of wind speed and storm/gust ramping and high wind events with the potential to cause turbine cut-outs, efficiency losses, or grid destabilization. Using hourly meteorological datasets at spatial resolutions ranging from 1 to 30 km, we map the average annual occurrence of these risk events across Austria and quantify associated uncertainties. The results provide a robust basis for climate-resilient planning and adaptation strategies for Austria’s current and future energy system.

How to cite: Spiekermann, R., Schicker, I., Lexer, A., and Lehner, S.: AI-enhanced national-scale assessment of meteorological risk hotspots for wind and hydropower, EGU General Assembly 2026, Vienna, Austria, 3–8 May 2026, EGU26-7714, https://doi.org/10.5194/egusphere-egu26-7714, 2026.

Accurately forecasting extreme precipitation remains a longstanding challenge in numerical weather prediction (NWP). Recently, data-driven Artificial Intelligence (AI) models have shown promise in improving global weather forecast accuracy, but their potential to enhance moso-scale precipitation forecasts has not been fully explored. This study evaluates the effectiveness of using forecasts from three AI models (Fuxi, Pangu, and Fengwu) compared with those from the traditional Global Forecast System (GFS) to initialize the Weather Research and Forecasting (WRF) model for simulating the extreme rainfall associated with landfalling Typhoon Bebinca (2024), the strongest typhoon to make landfall in Shanghai since 1949. A total of twenty WRF experiments were conducted across multiple initialization times, enabling a systematic and homogenized comparison of forecast performance. Results show that forecasts from the Fuxi and Pangu models provided more reliable and stable initial conditions, leading to improved predictions of typhoon track and extreme precipitation, particularly at longer lead times. Among the three AI models, Fengwu-driven simulations yielded the lowest track errors and demonstrated superior skill at shorter lead times (within 72 hours). Further physical diagnosis revealed that AI-driven WRF simulations produced more realistic thermodynamic structures, including stronger frontogenesis and enhanced convective organization, which contributed to improved rainfall forecasts. These findings underscore that high-quality large-scale initial fields from AI models not only improve the forecasts of synoptic-scale features such as typhoon track and intensity but also exert critical influence on the location and intensity of precipitation associated with mesoscale convective systems.

How to cite: Wang, R.: Improving forecasts of extreme rainfall induced by landfalling typhoon Bebinca (2024): Evaluating Fuxi, Pangu and Fengwu AI-driven WRF simulations, EGU General Assembly 2026, Vienna, Austria, 3–8 May 2026, EGU26-9078, https://doi.org/10.5194/egusphere-egu26-9078, 2026.

EGU26-9693 | ECS | Orals | CL5.10

Improving Subseasonal Weather Forecast Using Tropical Weighting: A Fine-Tuned 2D Transformer 

Sonal Rami, Deifilia Kieckhefen, Lars Heyen, Charlotte Debus, and Julian Quinting

Subseasonal forecasts, targeting lead times from about 2 weeks to 2 months, remain challenging. This time range between medium-range weather and seasonal climate predictions is often described as a “predictability desert”, where both numerical weather prediction (NWP) models and machine learning (ML)-based systems tend to lose skill or have not been rigorously evaluated. In this work, we fine-tune a 2D Transformer-based model derived from the Pangu-Weather architecture for 30-day subseasonal forecasts. The focus is on improving week-3 and week-4 lead times by assigning extra weights to the tropics, which host slowly varying modes of variability that influence global weather. During model training, we apply region-based weighting using a smooth Gaussian function centered at the equator. This function assigns higher weights to tropical latitudes, with the width of the weighting controlled by a tunable standard deviation parameter. The model is trained on a multi-year subset of 6-hourly ERA5 reanalysis data and uses five upper-air variables (geopotential, temperature, zonal and meridional wind components, specific humidity) at 13 pressure levels, along with four surface variables (mean sea-level pressure, 2-meter temperature, 10-meter winds), totaling 69 input channels. For inference, we generate both deterministic and ensemble forecasts. The deterministic forecasts are initialized using ERA5 reanalysis fields, while the ensemble forecasts use 10 perturbed members from ECMWF’s Ensemble Data Assimilation (EDA), enabling probabilistic forecast evaluation. Forecast evaluation is conducted using both deterministic and probabilistic metrics. Compared to the 2D Transformer baseline, the fine-tuned model shows approximately 70% bias reduction and up to 50% RMSE improvement for temperature (T850 and T2m), particularly at week-3 and week-4 lead times. CRPS scores also generally improve, indicating better ensemble skill and reliability.

How to cite: Rami, S., Kieckhefen, D., Heyen, L., Debus, C., and Quinting, J.: Improving Subseasonal Weather Forecast Using Tropical Weighting: A Fine-Tuned 2D Transformer, EGU General Assembly 2026, Vienna, Austria, 3–8 May 2026, EGU26-9693, https://doi.org/10.5194/egusphere-egu26-9693, 2026.

EGU26-10341 | ECS | Orals | CL5.10

Analysis and comparison of extreme precipitation events between physical models and Artificial Intelligence models 

Ludovica Perilli, Sandro Calmanti, and Marcello Petitta

In recent decades, extreme meteorological events have increased in frequency and intensity, enhancing hydrogeological risk. This study evaluates the performance of a Machine Learning model based on a Latent Diffusion Network (Latent Diffusion Model, LDM), developed within the RETE project, a joint initiative of FBK and ENEA, in generating high-resolution precipitation fields over Italy. Four historical precipitation datasets produced by the LDM are compared with the main reanalysis products, ERA5 and CERRA, to assess their ability to reproduce precipitation climatology and extreme events. The analysis is based on standard climatological statistics and Extreme Value Theory (EVT). Climatological features are examined through daily mean and seasonal cumulative precipitation, while extremes are investigated by estimating precipitation levels associated with 10, 20, and 50-year return periods. The results provide insight into the reliability of LDM-based products as complementary tools to traditional reanalyses for climate studies and potential operational applications.

How to cite: Perilli, L., Calmanti, S., and Petitta, M.: Analysis and comparison of extreme precipitation events between physical models and Artificial Intelligence models, EGU General Assembly 2026, Vienna, Austria, 3–8 May 2026, EGU26-10341, https://doi.org/10.5194/egusphere-egu26-10341, 2026.

EGU26-10474 | Orals | CL5.10 | Highlight

Uncertainty-Aware AI Forecasting of European Droughts: The Role of Internal Climate Variability 

Henri Funk, Cornelia Gruber, Göran Kauermann, Helmut Küchenhoff, Ralf Ludwig, and Magdalena Mittermeier

Accurate subseasonal forecasting of drought indices across spatial and temporal domains in Europe remains a major challenge due to internal climate variability, the inherent uncertainty in AI-driven forecasts, and complex atmospheric interactions. These challenges are particularly pronounced for rare and severe drought events, which can have substantial societal and environmental consequences. Recent advances in machine learning have improved climate forecasting, but the contribution of internal climate variability to predictive uncertainty in drought forecasts remains insufficiently quantified.

This study investigates whether observed limitations in the predictive performance of AI-based subseasonal drought forecasts can be explained by internal climate variability. To address this, we develop a Temporal Fusion Transformer framework to forecast the Standardized Precipitation–Evapotranspiration Index for a single month (SPEI-1) over the European domain. We extract the internal variability of a regional climate model large ensemble and quantify the extent to which predictive imprecision is attributed to internal climate variability. This approach enables a systematic assessment of hot and dry extremes, forecast skill, and uncertainty characterization.

The proposed approach enhances existing forecasting methods, particularly in terms of uncertainty quantification and its effective communication. The Temporal Fusion Transformer captures key temporal and spatial characteristics of SPEI-1 variability across Europe, except for limitations over the complex terrain of the Alps. Analysis of forecast variability shows that a substantial fraction of predictive uncertainty can be attributed to internal climate variability rather than model deficiencies alone. 

The interpretable uncertainty bounds provide a tool supporting risk assessment and decision-relevant drought forecasting, because they highlight the important role of internal climate variability for drought prediction. Overall, this work emphasizes how merging AI-driven forecasting techniques with quantification of internal climate variability can support more reliable and decision-relevant assessments of drought risk.

How to cite: Funk, H., Gruber, C., Kauermann, G., Küchenhoff, H., Ludwig, R., and Mittermeier, M.: Uncertainty-Aware AI Forecasting of European Droughts: The Role of Internal Climate Variability, EGU General Assembly 2026, Vienna, Austria, 3–8 May 2026, EGU26-10474, https://doi.org/10.5194/egusphere-egu26-10474, 2026.

Despite AI-driven weather forecasting has made rapid progress, this progress has primarily focused on global models, which require processing planetary-scale data on low-resolution grids. To address this gap, given the need for high-resolution forecasts for specific regions in many research and applications, we propose a computationally efficient generative framework for short- to medium-term hourly regional forecasts. This framework ingests multi-resolution, multi-source geophysical inputs, combining 0.25° 3D atmospheric fields with 0.1° surface fields. To avoid simply stitching together heterogeneous grids, we design a coupled architecture to enable interaction between the evolving 3D atmospheric state and high-resolution surface and precipitation-related signals. The training process uses ERA5 data, satellite-derived products, and radar precipitation observations. We describe the end-to-end modeling pipeline and evaluation protocol and discuss uncertainty-aware regional forecasts achieved through generative methods.

How to cite: Ma, J.: Coupled Multi-Resolution Generative Modelling for High-Resolution Hourly Regional Weather Forecasting, EGU General Assembly 2026, Vienna, Austria, 3–8 May 2026, EGU26-12019, https://doi.org/10.5194/egusphere-egu26-12019, 2026.

Under changing climate conditions, it has been observed that the frequency of extreme events has increased significantly worldwide. India has also experienced numerous flash flood events over the past two decades, leading to substantial socio-economic losses. India receives 70-80% of its annual rainfall during the southwest monsoon, which affects almost all parts of the country except the southeastern coast of Tamil Nadu. Therefore, it is crucial to improve early warning systems, especially for short-term precipitation forecasts. Various national and international organizations publish forecasts for different weather parameters, such as precipitation, temperature, wind speed, etc., derived from Numerical Weather Prediction Models (NWP); these datasets often show significant spatial and temporal biases at different lead times. In this study, the goal has been to identify the spatial and temporal biases in forecast data from NCMRWF, ECMWF, and NCEP for the years 2018 to 2023, using IMD gridded rainfall data and CMORPH-NOAA satellite data as ground truth for the southwest monsoon (June to September). For each grid, the spatial correlation has been evaluated across eight neighbouring grids and the central grid, while temporal cross-correlation has been assessed over 12-hour, 24-hour, and 48-hour lead and lag periods to determine the temporal accuracy of each NWP product for 24-hour lead times, using 00:00 UTC as the reference for both ground truth accumulation and forecasts.

This study introduces a spatio-temporal deep learning–based integration framework that combines three separate NWP rainfall forecasts into a single, skill-enhanced 24-hour prediction by explicitly considering directional spatial dependence and temporal lead–lag relationships, with particular relevance for extreme rainfall detection during the monsoon season. The methodology employs a spatio-temporal deep learning framework in which three NWP precipitation forecasts are encoded separately using direction-aware neighbourhood information and lag–lead temporal context, allowing the model to learn model-specific spatial and temporal error characteristics. These encoded features are dynamically combined through an attention-based integration mechanism to produce an optimized 24-hour rainfall forecast. The combined forecast is evaluated solely at a 24-hour lead time during the South-West Monsoon season using high-resolution rainfall observations. Results indicate that the proposed directional–temporal integration consistently outperforms all individual NWP forecasts, showing significant improvements (20-50% across various parts) in various standard error metrics, including RMSE and correlation coefficient values.

 The study is expected to effectively reduce the local bias in short-term rainfall forecasts over India, ultimately leading to the development of more efficient weather forecasting technologies. Additionally, the future scope of the study aims to introduce a novel approach that combines both physics-based and AI-based predictions, with the goal of establishing a benchmark for improving India's weather forecast system.

How to cite: Majumder, A. and Narasimhan, B.: A Spatio-Temporal Deep Learning Framework for Integrating NWP Products to Improve Short-Range Monsoon Rainfall Forecasts over India, EGU General Assembly 2026, Vienna, Austria, 3–8 May 2026, EGU26-12958, https://doi.org/10.5194/egusphere-egu26-12958, 2026.

EGU26-14208 | ECS | Posters on site | CL5.10

Prediction of Tropical Easterly Waves Using Deep Learning 

William B. Downs and Sharanya Majumdar

Tropical easterly waves (TEWs) directly impact people through wind, rain, and tropical cyclone formation in the Pacific and Atlantic Oceans. The structure and intensity of a TEW can be affected by a myriad of internal and external factors during a wave’s lifetime. Most existing statistical models of TEW intensification have been specifically designed to predict tropical cyclone formation from these waves. Understanding TEW behavior across a wide range of intensities, timescales, and geographic regions would provide insight into the general framework of TEW evolution. We use a novel TEW dataset, ERA5 reanalysis, and GridSAT brightness temperature data to train a neural network to predict vorticity and convective intensity in TEWs at lead times of 1 to 5 days over Africa, in the tropical North Atlantic, and in the eastern North Pacific. This network uses TEW-centered input data to generate a 50-member ensemble of predictions for each output variable at each lead time. We verify the network's predictive performance against forecasts from operational modeling. We identify input variables that contribute most significantly to the network’s output predictions and associated mean errors and ensemble uncertainty, and show how these findings vary for waves in different locations and of different initial strengths. Physically intuitive mechanisms seen in this investigation can help us better understand how TEWs evolve along an intensity / organization spectrum ranging from weak, dry waves to full-fledged tropical cyclones.

How to cite: Downs, W. B. and Majumdar, S.: Prediction of Tropical Easterly Waves Using Deep Learning, EGU General Assembly 2026, Vienna, Austria, 3–8 May 2026, EGU26-14208, https://doi.org/10.5194/egusphere-egu26-14208, 2026.

EGU26-16083 | ECS | Orals | CL5.10

Decision-oriented benchmarking of AI weather models for subseasonal monsoon onset forecasts in India    

Rajat Masiwal, Colin Aitken, Adam Marchakitus, Mayank Gupta, Katherine Kowal, Hamid Pahlavan, Tyler Yang, Y. Qiang Sun, Amir Jina, William Boos, and Pedram Hassanzadeh

Rapid advances in artificial intelligence weather prediction (AIWP) have enabled AI models to potentially outperform traditional numerical weather prediction (NWP) models while requiring only a fraction of the computational resources. However, many AI forecast evaluation studies have compared models using global metrics over limited years without focusing on sector and region-specific applications. Operationally driven benchmarking is necessary to effectively deploy these models, informing both model selection and improvements for different decision-making needs. Such benchmarking has been instrumental in driving AI progress in areas like ImageNet and AlphaFold. In this work, we benchmark the performance of six state-of-the-art AIWP models (AIFS, FuXi, FuXi-S2S, GraphCast, GenCast, NeuralGCM) and an NWP model (IFS) in forecasting local-scale agriculturally relevant monsoon onset over India. The models’ onset forecasts are compared with over a century of rain gauge–based ground truth observations, using standard verification metrics for both deterministic and probabilistic forecasts. This multiperiod evaluation is specifically designed to align with how such forecasts will be disseminated to stakeholders. In this operationally oriented benchmarking, we find that most AIWP models outperform the climatological baseline forecasts at medium-range timescales (~15 days), but exhibit comparable skill at subseasonal timescales (~30 days) in the core monsoon zone. These models also achieve comparable performance to IFS, while enabling calibration of probabilistic forecasts through precisely controlled ensembles that can be efficiently generated for multiple past decades. The speed and open-source nature of AIWPs provide the additional advantage that one can localize such models. 

This benchmark guided model selection for large-scale AI-based generation and dissemination of the 2025 monsoon onset forecast to 38 million farmers in India. Our work presents a framework for developing operational, decision-oriented benchmarks that can accelerate the translation of the AI-driven second weather revolution into the democratization of weather forecasting worldwide.

How to cite: Masiwal, R., Aitken, C., Marchakitus, A., Gupta, M., Kowal, K., Pahlavan, H., Yang, T., Sun, Y. Q., Jina, A., Boos, W., and Hassanzadeh, P.: Decision-oriented benchmarking of AI weather models for subseasonal monsoon onset forecasts in India   , EGU General Assembly 2026, Vienna, Austria, 3–8 May 2026, EGU26-16083, https://doi.org/10.5194/egusphere-egu26-16083, 2026.

EGU26-18057 | ECS | Posters on site | CL5.10

Weather and Climate Foundation Models Enhance Subseasonal-to-Seasonal (S2S) Precipitation Prediction Using Multi-Source Satellite Observations 

Ebony Lee, Seulgi Kim, Donggeon Lee, Venkatesh Budamala, and Hyunglok Kim

Subseasonal-to-Seasonal (S2S) forecasts, which are weather forecasts over a period spanning two weeks to two months, are challenging due to the position between short-term forecasts driven by initial conditions and seasonal forecasts governed by boundary conditions. Improving S2S forecasts skill to predict hydrological disasters like floods enables the establishment of disaster preparedness plans and reduces socioeconomic losses. Consequently, as the frequency of extreme precipitation events increases due to climate change, S2S forecasts are playing an increasingly vital role in early warning systems. However, S2S precipitation forecasts using traditional physics-based models are considered to have significant limitations due to errors arising from resolution, parameterization, and model uncertainty. Recently, interest has grown in whether data driven weather and climate models can bridge this forecasting gap.

Therefore, this study compares the precipitation forecasting performance of ECMWF and Korea Meteorological Administration (KMA) models with weather and climate foundation models to assess whether AI models can extend the predictability in the regions where S2S forecasts from traditional numerical weather prediction models are limited. Pre-trained foundation model and Multi-Source Weighted-Ensemble Precipitation (MSWEP) datasets are used for training a lightweight decoder to forecast precipitation from latent representations. We compare precipitation forecasts for nine years (2017-2025) with the MSWEP dataset, and analyze 2022 flood cases over Asia to evaluate the predictability of S2S for extreme weather events. We will show that a comparison of S2S precipitation forecast skill and extreme rainfall predictability between physics-based and AI models highlights the potential of S2S forecasts for early warning.

How to cite: Lee, E., Kim, S., Lee, D., Budamala, V., and Kim, H.: Weather and Climate Foundation Models Enhance Subseasonal-to-Seasonal (S2S) Precipitation Prediction Using Multi-Source Satellite Observations, EGU General Assembly 2026, Vienna, Austria, 3–8 May 2026, EGU26-18057, https://doi.org/10.5194/egusphere-egu26-18057, 2026.

EGU26-18232 | ECS | Orals | CL5.10

MAR.ia: How diffusion-based approaches can reproduce extreme weather events 

Sacha Peters, Elise Faulx, Xavier Fettweis, and Gilles Louppe

MAR is a Regional Climate Model (RCM) used over Belgium that provides deterministic downscaling of reanalyses and Earth System Models (ESMs) at 5-km resolution (Doutreloup et al., 2019). These high-resolution fields are computationally expensive to produce as they require solving complex physical equations. Combined with its deterministic nature, this limits the use of MAR for assessing the frequency and intensity of extreme events and their future changes.

To address this limitation, we have developed MAR.ia, a diffusion-based emulator of MAR which provides probabilistic estimates of downscaled fields at a lower computational cost (from 0.25° and 1° ERA5 fields). This allows the direct generation of ensembles from which we can derive a range of possible weather outcomes and estimate their corresponding likelihood.

However, the reproduction of extreme events is expected to be more challenging for diffusion models because these events might be scattered or absent from the training set. This is due to the fact that they are rare, and also to climate change which induces a shift between the training and testing distributions.

We evaluate the MAR.ia reconstruction of extreme heatwaves, storms and heavy rainfall associated with several daily historical events in Belgium and compare these results  with those obtained on average over the testing period.

This evaluation enables us to critically assess the ability of  deep generative models, and more precisely diffusion models approaches, to faithfully reconstruct out-of-distribution events. 


Doutreloup, S., Wyard, C., Amory, C., Kittel, C., Erpicum, M., and Fettweis, X. (2019). Sensitivity to Convective Schemes on Precipitation Simulated by the Regional Climate Model MAR over Belgium (1987–2017), Atmosphere, 10, 34. https://doi.org/10.3390/atmos10010034.

How to cite: Peters, S., Faulx, E., Fettweis, X., and Louppe, G.: MAR.ia: How diffusion-based approaches can reproduce extreme weather events, EGU General Assembly 2026, Vienna, Austria, 3–8 May 2026, EGU26-18232, https://doi.org/10.5194/egusphere-egu26-18232, 2026.

Recent deep learning advances improve predictive performance but often increase computational and memory costs. This limits use in resource-constrained settings. Meanwhile, meteorological data exhibit strong multiscale characteristics. Training such signals with single-scale models can cause scale mixing and spectral bias, which degrade performance in extreme events and long-term forecasting.

Motivated by these challenges, this study explores an alternative strategy that enhances forecasting performance through scale-aware data preprocessing rather than increased model complexity. Multivariate Variational Mode Decomposition (MVMD) is integrated with graph neural networks (GNNs) to separate multi-scale temporal variability before spatial learning. Surface wind forecasting over Taiwan is characterized by complex atmospheric dynamics associated with typhoons, Meiyu fronts, and monsoon systems. It provides a challenging case for 72-hour wind speed forecasting.

ERA5 reanalysis data at a 0.25° spatial resolution and 12-hourly intervals over East Asia (5–40°N, 105–140°E) are used to construct a scale-aware spatio-temporal forecasting framework. The training dataset spans 2000 to 2016, the validation dataset spans 2016 to 2020, and the testing dataset spans 2020 to 2024. Raw surface wind fields are decomposed into five intrinsic mode functions (IMFs) using MVMD, with the number of modes selected based on a balance between root mean square error (RMSE), signal-to-noise ratio (SNR), and orthogonality index (OI). These scale-separated wind components with selected background meteorological variables (temperature, mean sea-level pressure, sea surface temperature, and 500-hPa variables) are incorporated into a three-layer Graph Attention Network (GATv2) model. The model is trained for one-step-ahead prediction, and multi-day forecasts are generated through an autoregressive rollout strategy that does not rely on additional temporal sequence encoders.

The MVMD–GATv2 model was compared with a baseline GATv2 trained directly on raw surface wind fields. Model performance is evaluated using mean absolute error (MAE), RMSE, and anomaly correlation coefficient (ACC). Preliminary results show that RMSE at the 12-hour forecast point decreased from 1.7 to 0.8. In addition to improved accuracy, ongoing analyses within this comparison framework focus on examining the evolution of errors across lead times and quantifying training costs. Further analyses assess the interpretability of scale-separated representations and explore boundary-related effects. In summary, these findings highlight the potential of MVMD as a scale-aware data preprocessing strategy that improves the accuracy, stability, and interpretability of graph-based regional wind predictions.

How to cite: Cheng, J. and Tsai, C. W.: A Scale-Aware Graph Neural Network Framework via Multivariate Variational Mode Decomposition for Multi-Day Wind Speed Forecasting, EGU General Assembly 2026, Vienna, Austria, 3–8 May 2026, EGU26-18249, https://doi.org/10.5194/egusphere-egu26-18249, 2026.

EGU26-18411 | Orals | CL5.10

A Turing test for physicality in AI weather models 

Sebastian Engelke, Nicola Gnecco, Marco Froelich, Manuel Hentschel, and Zhongwei Zhang

Recent AI weather models outperform traditional physics-based weather prediction models on many benchmarks. The evaluation is mostly restricted to point-wise metrics such as the mean squared error and therefore does not assess whether the joint multivariate behavior is well captured. Since AI weather models do not rely on any physical laws, there are strong concerns and first indications that the forecasted fields lack physical consistency in terms of spatial coherence and energy constraints. Verifying such constraints directly is however far from trivial.

We propose a Turing test for physicality that leverages the spread of an ensemble of pre-trained AI forecasting models. The main idea is that the epistemic uncertainty of these models is much larger when applied to non-physical conditions compared to physical conditions that have been part of the training data. We combine this intuition with the theory of conformal inference to obtain a statistical test for physicality with finite-sample guarantees. Case studies on the 1963 Lorenz system show the effectiveness of our proposed approach in identifying conditions that lie outside of its attractor. We then illustrate the applicability of our methodology to recent AI weather models.

How to cite: Engelke, S., Gnecco, N., Froelich, M., Hentschel, M., and Zhang, Z.: A Turing test for physicality in AI weather models, EGU General Assembly 2026, Vienna, Austria, 3–8 May 2026, EGU26-18411, https://doi.org/10.5194/egusphere-egu26-18411, 2026.

Tropical cyclone (TC) is one of the most hazardous and extreme weather events that permanently affect lives of all forms with increased severity over densely populated coastal regions. For decades, numerical weather prediction (NWP) models that solve complex mathematical equations to predict TC properties such as genesis, intensity and track, have been used with good effect. Due to climate change, TCs are set to become more frequent and intense, greatly endangering human lives and affecting biodiversity along the coastal regions. Thereby, multi-modal forecasts along with NWP predictions and strategic dissemination of information amongst the masses is required. Deep Learning (DL) models are yielding very good results across multiple domains on unstructured data including time series. Consequently, DL techniques are being developed to forecast various aspects of TCs too. In the current work, INSAT-3D satellite imagery in thermal infrared band TIR1 from Meteorological and Oceanographic Satellite Data Archival Centre (MOSDAC), Government of India, and best track data from India Meteorological Department (IMD) of 64 TCs that occurred over Bay of Bengal (BoB) from 2013 to 2023 are used to model the intensity and track. Intensity of TCs is represented using estimated central pressure (ECP) and maximum sustained surface wind speed (MSW) and tracks of TCs are represented using latitude (LAT) and longitude (LON) of the centre of the TCs. These data are collected from IMD annual reports. Since the INSAT-3D data represent satellite image time series, traditional Convolution Neural Network (CNN) alone would not suffice. A two-branch DL architecture based on Long Short-Term Memory (LSTM) (for processing intensity and track) and Convolution LSTM (ConvLSTM) (for processing the time series of satellite images) algorithms is modelled on the available data to obtain simultaneous short-term forecasting of both intensity and track of TCs. The best model predicts intensity with an error of 4.68±1.95 knots and 3.45±0.38 hPa and track with an error of 169.58±48.02 km for a lead time of six hours. However, the INSAT-3D data contains missing images for a large number of timestamps. A sub-field of DL known as generative artificial intelligence (GenAI) has excelled in generating new data from existing data. The fractured MOSDAC dataset is repaired to a large extent using a hybrid ConvLSTM-CNN architecture by generating images at the timestamps where satellite observations are unavailable. All gaps of 1-3 images are filled using this technique. The images are generated with an average structural similarity index measure (SSIM) of 0.96 and an average peak signal to noise ratio of 30.42 dB. The new augmented dataset is modelled for forecasting the intensity and track of TCs using the earlier architecture. The results improved significantly to give intensity with an error of 2.86±2.00 knots and 3.03±1.84 hPa and track with an error of 31.01±11.35 km for a lead time of six hours. Additionally, experiments for longer lead times also could be conducted. Thus, given a high-quality dataset, TC intensity and track can be forecast with good levels of accuracy and can be used to supplement the forecasts of traditional numerical techniques.

How to cite: Das, U., Pal, S., and Bandyopadhyay, O.: GenAI-assisted Intensity and Track Forecasting of Tropical Cyclones in Bay of Bengal using a hybrid Deep Learning architecture, EGU General Assembly 2026, Vienna, Austria, 3–8 May 2026, EGU26-19628, https://doi.org/10.5194/egusphere-egu26-19628, 2026.

EGU26-20210 | ECS | Orals | CL5.10

Masked Token Models as a paradigm for probabilistic forecasts in weather and climate 

Jannik Thümmel, Florian Ebmeier, Jakob Schlör, Nicole Ludwig, and Bedartha Goswami

Masked Token Models (MTMs) are a highly efficient paradigm for pre-training large-scale models in video and language domains. Designed to learn representations on inherently sparse or strongly subsampled data, MTMs can be a promising choice for weather and climate prediction over long horizons. Despite their advantageous design properties these models have not yet found widespread adoption in climate science. We partly attribute this to limitations of the prevalent choice to use masking strategies that are uniform over time, which biases the learned representations toward spatial interpolation rather than predictive dynamics.

By defining a time-aware prior over the masking distribution, we are able to control this bias in a principled manner, thereby elevating the forecasting capability of MTMs to be on par with other approaches while retaining their efficiency and flexibility in adapting to multiple downstream tasks. Furthermore, we show that the choice of prior has a strong effect on the predicted uncertainty, leading to substantial improvements in terms of calibration.

As an illustrative example we train MTMs to predict the El Niño–Southern Oscillation (ENSO)—a primary driver of inter-seasonal climate variability with extreme weather impacts across the globe. Our approach yields state-of-the-art probabilistic forecasts of the tropical Pacific up to 24 months ahead and produces uncertainty estimates with an almost perfect spread-to-skill ratio over the full horizon. The strong performance on both climate model simulations and observational datasets demonstrates that MTMs can be highly effective for seasonal-to-annual climate prediction.

How to cite: Thümmel, J., Ebmeier, F., Schlör, J., Ludwig, N., and Goswami, B.: Masked Token Models as a paradigm for probabilistic forecasts in weather and climate, EGU General Assembly 2026, Vienna, Austria, 3–8 May 2026, EGU26-20210, https://doi.org/10.5194/egusphere-egu26-20210, 2026.

Under the influence of global climate change and human activities, the frequency and intensity of extreme weather events—such as heavy precipitation and severe droughts—have increased markedly. Flood disasters triggered by intense rainfall have severely threatened lives, property, and regional socioeconomic development. To address the challenge of precise prevention and control of short‑duration rainstorm‑induced flash floods in the complex terrain of Northwest China, this study focuses on the Ningxia region, located within China’s arid‑semi‑arid transition zone. By integrating Water Internet technology, big data, and deep learning, we construct an intelligent flash flood disaster prevention and control system.

In rainfall forecasting, we have (1) developed a radar‑based precipitation retrieval model through data fusion and calibration, achieving a retrieval accuracy of R² > 0.75 and NMAE < 0.3; (2) proposed an attention‑mechanism‑driven radar echo extrapolation technique that attains over 80% accuracy for a 3‑hour lead time; and (3) built a rapid‑cycle, multi‑source data assimilation rainfall forecast model incorporating GNSS water vapor tomography.

For flood forecasting, we (1) introduced a forecasting technique that couples multi‑source rainfall predictions with a distributed hydrological model, yielding accuracy above 80%; and (2) constructed a runoff simulation model for mountainous basins by integrating radar and terrain data with adaptive pooling and attention mechanisms, achieving over 85% forecast accuracy.

In the domain of intelligent flood regulation, a real‑time operational model based on rainfall‑runoff forecasting has been developed. By combining flood forecasts with a simplified inundation model, the system enables large‑scale watershed flood analysis.

How to cite: zhen, Q., yuying, C., jiahua, W., and jieyu, J.: A Technical Framework for Whole-Process Forecasting of Rainstorm-Induced Flash Floods Coupling Artificial Intelligence and Physical Mechanisms, EGU General Assembly 2026, Vienna, Austria, 3–8 May 2026, EGU26-20578, https://doi.org/10.5194/egusphere-egu26-20578, 2026.

EGU26-20891 | ECS | Posters on site | CL5.10

Forecasting satellite-retrieved land surface temperature from reanalysis with multi-modal deep learning 

Marieke Wesselkamp, Vitus Benson, Sebastian Hoffmann, Markus Zehner, Gregory Duveiller, Christian Reimers, Nuno Carvalhais, and Markus Reichstein

Timely estimates of land surface temperature (LST) are critical in weather and climate prediction. Examples include assessing effects of extreme heat and drought on the biosphere and modelling transport processes in the atmospheric boundary layer. Yet, forecasting the spatiotemporal variability of LST remains challenging because the surface skin responds to forcing instantaneously and is controlled by multi-scale thermodynamic processes. Existing work on surface temperature forecasting largely follows two distinct paradigms: A) AI-driven and numerical weather prediction where large-scale skin temperature is simulated from Earth system models or their emulators, and B) geoscientific remote sensing where satellite-retrieved LST is extrapolated in time or space on small spatial scales, including site-scale experiments, often using statistical autoregression. While the goal of A) is to provide global estimates and atmospheric boundary conditions on coarse resolution with reduced complexity of subgrid processes, the goal of B) is often to obtain better forecasts over limited areas or local stations for downstream applications but these approaches rarely incorporate synoptic-scale meteorological context.

Large-scale approaches of medium-complexity to surface temperature forecasting that bridge these two ends and account for synoptic-scale surface meteorology while being sensitive to local land conditions remain underexplored. One reason for this is that modeling the tight coupling of spatial heterogeneity to multi-scale surface energy balance processes requires incorporation of multiple data sources at different spatiotemporal resolution. We cross these two paradigms and develop an observation-guided system that produces short-term forecasts of LST from reanalysed, coarse resolution surface meteorology and ancillary geostationary-resolution land surface properties. This system will cover the diurnal cycle and spatially larges scales at geostationary-resolution. We leverage the possibilities of multi-modal supervised learning and incorporate both reanalysis and observational data, explore memoryless and autoregressive approaches and outline opportunities to include high-resolution observations. Our approach is a first step towards effectively downscaling forecasts from the WeatherGenerator foundation model to high resolution surface conditions.

How to cite: Wesselkamp, M., Benson, V., Hoffmann, S., Zehner, M., Duveiller, G., Reimers, C., Carvalhais, N., and Reichstein, M.: Forecasting satellite-retrieved land surface temperature from reanalysis with multi-modal deep learning, EGU General Assembly 2026, Vienna, Austria, 3–8 May 2026, EGU26-20891, https://doi.org/10.5194/egusphere-egu26-20891, 2026.

EGU26-21263 | ECS | Posters on site | CL5.10

Assessing Stochastic Interpolants for Downscaling of Climate Extremes 

Erik Larsson, Ramón Fuentes-Franco, Mikhail Ivanov, and Fredrik Lindsten

Assessing Stochastic Interpolants for Downscaling of Climate Extremes


Erik Larsson, Ramón Fuentes-Franco, Mikhail Ivanov and Fredrik Lindsten


Assessing climate-related extremes at regional scales requires high-resolution information, typically obtained from dynamical regional climate models (RCMs). However, the computational expense of RCMs limits ensemble size and restricts the exploration of uncertainty. To address this challenge, we introduce a probabilistic machine-learning downscaling framework based on stochastic interpolants, trained to emulate 12 km HCLIM fields from coarse Earth System Model (ESM) output. By leveraging the stochastic interpolant framework, we construct a generative model that learns a direct mapping from coarse ESM inputs to high-resolution RCM simulations. This contrasts with standard diffusion-based approaches, where the model learns to transform Gaussian noise into RCM  states. Our preliminary results indicate that the stochastic interpolant formulation provides a more effective and stable learning objective for the downscaling task.


A comprehensive evaluation across Europe for 1985–2014 shows that the emulator accurately reproduces the climatological distribution and magnitude of daily precipitation extremes. Maximum daily precipitation fields capture orographic and coastal hotspots seen in HCLIM, such as the Alps, western Norway, the Dinaric Alps, and the western Iberian Peninsula.


For precipitation exceeding the local 95th percentile, the emulator achieves a domain-mean Matthews Correlation Coefficient (MCC) of 0.35. It maintains stronger spatiotemporal synchronisation with the ESM than the RCM itself, with an MCC of 0.46 against EC-Earth3-Veg compared to 0.35 for HCLIM. This indicates that the emulator follows the large-scale dynamics imposed by the driving ESM, while reproducing the fine-scale intensity and spatial structure of extremes characteristic of the RCM.


For temperature extremes, skill is even higher, with MCC values exceeding 0.7 across most of Europe, confirming robust reproduction of warm-event timing and spatial extent. The emulator also correctly represents daily temperature–precipitation covariability, including the transition from positive correlations in winter to negative correlations in summer, and reproduces the geographical pattern of compound hot-dry events, although with regional biases consistent with the driving model.


Overall, these results show that the stochastic interpolant downscaling framework provides a computationally efficient pathway to generate large, high-resolution ensembles that retain ESM dynamics while delivering RCM-like representations of climate extremes, offering new opportunities for climate-risk assessment, attribution studies, and impact modelling.

How to cite: Larsson, E., Fuentes-Franco, R., Ivanov, M., and Lindsten, F.: Assessing Stochastic Interpolants for Downscaling of Climate Extremes, EGU General Assembly 2026, Vienna, Austria, 3–8 May 2026, EGU26-21263, https://doi.org/10.5194/egusphere-egu26-21263, 2026.

EGU26-52 | ECS | Orals | ITS1.13/AS5.5 | Highlight

Generative spatiotemporal downscaling model improves projections of climate extremes 

Ruian Tie, Xiaohui Zhong, Zhengyu Shi, Hao Li, Bin Chen, Jun Liu, and Libo Wu

Climate change is amplifying extreme events, posing escalating risks to biodiversity, human health, and food security. Global climate models (GCMs) are essential for projecting future climate, yet their coarse resolution and high computational costs constrain their ability to represent extremes. Here, we introduce FuXi-CMIPAlign, a generative deep learning framework for downscaling Coupled Model Intercomparison Project (CMIP) outputs. The model integrates Flow Matching for generative modeling with domain adaptation via Maximum Mean Discrepancy loss to align feature distributions between training data (ERA5 reanalysis) and inference data (European Consortium-Earth), thereby mitigating input discrepancies and improving accuracy, stability, and generalization across emission scenarios. FuXi-CMIPAlign performs spatial, temporal, and multivariate downscaling, enabling more realistic simulation of compound extremes such as tropical cyclones (TCs). Applied to the historical period (2005–2014), it reduces global 99th-percentile mean absolute errors by 26%, 42%, and 33% for high temperature, extreme precipitation, and strong wind, respectively, and reproduces TC activity better aligned with ERA5. Under future scenarios (2015–2100), FuXi-CMIPAlign projects pronounced increases in land area affected by high temperature and frequency of extreme precipitation under high-emission scenarios, along with up to 60% rise in TC intensity and frequency over the Northwest and Northeast Pacific. In contrast, strong wind events over land shows a counterintuitive weakening trend. These results demonstrate that FuXi-CMIPAlign substantially improves CMIP6 projections of climate extremes, providing a robust generative framework for advancing climate risk assessment, mitigation and adaptation.

How to cite: Tie, R., Zhong, X., Shi, Z., Li, H., Chen, B., Liu, J., and Wu, L.: Generative spatiotemporal downscaling model improves projections of climate extremes, EGU General Assembly 2026, Vienna, Austria, 3–8 May 2026, EGU26-52, https://doi.org/10.5194/egusphere-egu26-52, 2026.

EGU26-549 | ECS | Posters on site | ITS1.13/AS5.5

Discrete Gaussian Vector Fields on Meshes and their Application to Downscaling 

Michael Gillan, Stefan Siegert, and Benjamin Youngman

Though the underlying fields associated with vector-valued environmental data are continuous, observations themselves are discrete. For example, climate models typically output grid-based representations of wind fields or ocean currents, and these are often downscaled to a discrete set of points. By treating the area of interest as a two-dimensional manifold that can be represented as a triangular mesh and embedded in Euclidean space, this work shows that discrete intrinsic Gaussian processes for vector-valued data can be developed from discrete differential operators defined with respect to the mesh. These Gaussian processes account for the geometry and curvature of the manifold whilst also providing a flexible and practical formulation that can be readily applied to any two-dimensional mesh. These models can capture harmonic flows, incorporate boundary conditions, and model non-stationary data and can be applied to downscaling stationary and non-stationary gridded wind data on the globe, and to inference of ocean currents from sparse observations in bounded domains.

How to cite: Gillan, M., Siegert, S., and Youngman, B.: Discrete Gaussian Vector Fields on Meshes and their Application to Downscaling, EGU General Assembly 2026, Vienna, Austria, 3–8 May 2026, EGU26-549, https://doi.org/10.5194/egusphere-egu26-549, 2026.

EGU26-1233 | ECS | Orals | ITS1.13/AS5.5

Disentangling the effect of bias adjustment on climate change projections of heat stress in Southeastern South America 

Rocio Balmaceda-Huarte, Ana Casanueva, and Maria Laura Bettolli

Climate impact assessment requires more detailed, sector-specific climate information, especially when impacts depend on crossing specific thresholds, such as heat-stress conditions. Regional climate models (RCMs) can provide such high-resolution climate projections, but systematic biases hinder their direct use. Therefore, bias adjustment (BA) methods are commonly applied in impact studies devoted to heat-stress, which, besides, is a multivariate hazard. Selecting an appropriate BA method for multivariable indices remains challenging due to the need to preserve inter-variable dependence structures and the climate change signal.

This study examines multiple BA methods to generate regional climate projections of two multivariable heat-stress indices—wet-bulb temperature (wbt) and a simplified version of the wet-bulb globe temperature (swbgt)—over southeastern South America (SESA). Both indices rely on temperature and humidity but differ in their sensitivity to these input climate variables. For this assessment, five BA methods were analysed, including trend-preserving and non-trend-preserving techniques as well as univariate and multivariate approaches. 

CORDEX and CORDEX-CORE RCM simulations available for SESA driven by three different global climate models were considered, and the MSWX dataset was used as reference. To adjust the indices, an indirect approach was adopted, with the individual input climate variables adjusted prior to index calculation. All methods were trained on austral summer days from the historical period and then applied to RCP8.5 future simulations. Future changes were assessed for the mean and maximum summer values, as well as for two frequency-based metrics using heat-stress thresholds in order to examine the contribution of the RCM and BA method to the overall uncertainty.

Climate change projections obtained from trend-preserving and non-trend-preserving methods considerably differed in magnitude and spatial distributions, with non–trend-preserving approaches typically underestimating the RCMs raw signal, clearly for the mean values. Multivariate methods enhanced the representation of heat-stress indices during training, better capturing the correlation between temperature and humidity, although no added value was identified in the projected delta changes.

Large uncertainties within RCMs raw outputs and BA methods were found in the magnitude of the change signal for the climate input variables, especially for humidity, which were considerably reduced after computing the indices. In particular, the differing sensitivities of the indices to temperature and humidity were highlighted: wbt closely reflected regions with large humidity-related uncertainties, whereas swbgt aligned more closely with the spatial patterns of temperature uncertainties.

This study provides valuable information on the use of BA methods in multivariable impact studies in SESA—a region where fine-scale climate projections remain limited—and underscores the importance of carefully evaluating BA methods prior to climate-impact applications, particularly in a multivariable, climate-change context.

How to cite: Balmaceda-Huarte, R., Casanueva, A., and Bettolli, M. L.: Disentangling the effect of bias adjustment on climate change projections of heat stress in Southeastern South America, EGU General Assembly 2026, Vienna, Austria, 3–8 May 2026, EGU26-1233, https://doi.org/10.5194/egusphere-egu26-1233, 2026.

EGU26-1470 | Posters on site | ITS1.13/AS5.5

Generative Diffusion Downscaling for the Alps: Benchmarking CorrDiff against MeteoSwiss Operational NWP Ensemble 

David Leutwyler, Petar Stamenkovic, Marco Arpagaus, Mary McGlohon, Siddhartha Mishra, Xavier Lapillonne, Sebastian Schemm, and Oliver Fuhrer

Kilometre-scale weather and climate datasets are invaluable for quantifying, forecasting and projecting hazards in areas of complex topography, such as the Alps. However, producing such datasets using traditional numerical weather prediction (NWP) models is becoming prohibitively expensive, particularly for climate-timescale simulations and large ensembles. Probabilistic generative downscaling offers a potential alternative, as it learns the conditional mapping from coarse global drivers to kilometre-scale regional fields.

Here, we evaluate a modified conditional generative correction–diffusion model (CorrDiff) for downscaling the ERA5 and IFS-ENS datasets over the Greater Alpine Region. The modified CorrDiff model was trained using a 20-year, 1-km resolution dataset produced with the ICON numerical model, with precipitation constrained to Swiss radar observations using a latent-heat nudging scheme. This setup allows us to make a direct comparison with MeteoSwiss' operational NWP ensemble.

Verification against observations and gridded products reveals that CorrDiff achieves competitive performance following substantial targeted adaptations to the model. Although not explicitly encoded in the loss function, the adapted model reproduces emergent climatological indices, including the diurnal cycle of land precipitation and exceedance probabilities for heavy precipitation. It also captures the spatial patterns of consecutive dry and wet days, as well as prevailing wind direction and directional variability.

How to cite: Leutwyler, D., Stamenkovic, P., Arpagaus, M., McGlohon, M., Mishra, S., Lapillonne, X., Schemm, S., and Fuhrer, O.: Generative Diffusion Downscaling for the Alps: Benchmarking CorrDiff against MeteoSwiss Operational NWP Ensemble, EGU General Assembly 2026, Vienna, Austria, 3–8 May 2026, EGU26-1470, https://doi.org/10.5194/egusphere-egu26-1470, 2026.

High-resolution emission data are essential for strategic environmental governance and accurate air quality modeling. However, fine-scale (i.e. 1-km) emission assessments remain challenging for traditional bottom-up inventories in Global South countries, including China, due to the lack of unit-level source information. Meanwhile, observation-based emission inversions are often limited in timeliness, spatial resolution, and/or sectoral discrimination. Here, we integrate a fast physics-based inversion framework, PHLET, with big Earth data to derive 1-km-resolution, sector-specific emissions from satellite observations. The resulting new framework, PHLET-BIG, achieves accurate emission positioning and sectoral attribution by incorporating spatial features linked to emission sources extracted from high-resolution Earth data.

Applying PHLET-BIG to China reveals unprecedented fine-scale distributions of NOX emissions and their recent sectoral spatiotemporal evolution during the summers of 2018–2024. Emissions span several orders of magnitude and show a clear decoupling from population density and nighttime light at the 1-km grid scale. While national total NOX emissions declined by 24.6% over this period, pronounced sectoral contrasts persist at individual locations, townships, and counties. PHLET-BIG enables unit-level emission tracking from space, demonstrates consistency with in situ flux observations, and reduces NO2 modeling errors by 20–60%. This framework provides a cost-effective foundation for refined emission control strategies and fine-scale air pollution analyses.

How to cite: Kong, H., Lin, J., and Hu, Y.: PHLET-BIG: 1-km resolution inversion of sectoral emissions based on satellite constrained by big Earth data, EGU General Assembly 2026, Vienna, Austria, 3–8 May 2026, EGU26-1918, https://doi.org/10.5194/egusphere-egu26-1918, 2026.

EGU26-2566 | ECS | Orals | ITS1.13/AS5.5

Diffusion downscaling for regional convective-scale weather prediction 

Eliott Lumet, Joffrey Dumont-le-Brazidec, Simon Lang, Benjamin Devillers, David Salas-y-Melia, and Laure Raynaud

Currently, operational weather forecasts rely on physically-based modeling approaches, with Numerical Weather Prediction (NWP) models used to determine atmospheric conditions over the coming hours to days. However, the configuration of NWP models is strongly constrained by computational resources, which notably limits, for instance, their horizontal resolution. Current operational systems typically run at resolutions of around 10 km at the global scale and, at best, around 1 km at the regional scale. A promising alternative to explicitly increasing resolution is statistical downscaling, which consists of learning the relationship between large-scale and fine-scale forecasts. This task, similar to super-resolution, can leverage recent advances in AI for computer vision.

The literature on downscaling approaches for weather and climate prediction is already extensive, with a wide range of AI methods proposed, from standard convolutional neural networks to more advanced generative approaches, including GANs and diffusion models. Generative methods learn a probabilistic representation of the data, which helps avoid the fine-scale blurring commonly encountered in standard AI approaches and naturally enables the generation of ensemble forecasts. However, most existing applications for weather or climate downscaling focus on a limited set of variables or treat each variable independently.

In this work, we develop a diffusion-based downscaling model, termed AROME-DS, to emulate high-resolution forecasts from the French regional model AROME (0.025°) from those of the French global model ARPEGE (0.1°). The model is based on a graph transformer encoder–processor–decoder architecture implemented within the Anemoi framework. It is trained on five years of hourly analyses produced by the French operational services at Météo-France. AROME-DS jointly predicts 70 atmospheric variables, including 11 vertical levels and multiple surface fields such as near-surface temperature, precipitation, and wind gusts, representing a significant increase in variable dimensionality compared to existing AI-based downscaling approaches.

We show that AROME-DS produces realistic high-resolution forecasts and successfully retrieves fine-scale features related to orography. We further investigate how ensemble forecasts obtained by sampling the distribution learned by the diffusion model can be used to represent uncertainty in specific weather situations. Finally, we compare this downscaling approach with an AI-based autoregressive regional NWP model, providing insights onto the best way to leverage AI in operational weather prediction.

How to cite: Lumet, E., Dumont-le-Brazidec, J., Lang, S., Devillers, B., Salas-y-Melia, D., and Raynaud, L.: Diffusion downscaling for regional convective-scale weather prediction, EGU General Assembly 2026, Vienna, Austria, 3–8 May 2026, EGU26-2566, https://doi.org/10.5194/egusphere-egu26-2566, 2026.

EGU26-3121 | ECS | Posters on site | ITS1.13/AS5.5

Ensuring spatiotemporal consistency in multivariate bias correction for climate projections using hierarchical vine copulas and GAMs 

Theresa Meier, Valérie Chavez-Demoulin, Erwan Koch, and Thibault Vatter

Univariate bias-correction methods adjust systematic errors in climate model outputs for individual variables but often fail to preserve inter-variable dependence, resulting in physically inconsistent multivariate projections. Multivariate bias-correction (MBC) methods address this limitation but are commonly applied independently at each location, thereby neglecting spatial dependence. Moreover, temporal dependencies are rarely modeled explicitly. Preserving spatiotemporal consistency is, however, essential for realistic climate dynamics and reliable regional impact assessments.

We propose a novel MBC framework that jointly accounts for inter-variable, spatial, and temporal dependence. The spatiotemporal structure is addressed by decomposing each time series using generalized additive models (GAMs) to remove deterministic components such as seasonality and spatial gradients. The resulting stochastic components are transformed via probability integral transforms into approximately independent and identically distributed variables, suitable for dependence modeling with vine copulas.

To construct a joint distribution across multiple variables and locations, we introduce CUVEE (Copulas Under Vine Extending Environment), a hierarchical vine-based merging strategy. CUVEE combines two dependence levels: (i) spatial dependence across locations modeled separately for each variable, and (ii) inter-variable dependence modeled at a selected reference location, which links the spatial models into a coherent multivariate and spatial structure. This approach enables flexible dependence modeling while remaining computationally tractable for regional applications.

We apply the proposed method to EURO-CORDEX simulations over the Swiss canton of Vaud, using gridded MeteoSwiss observations and ERA5 reanalysis data as reference. Results show substantial improvements in preserving inter-variable, temporal, and spatial dependence compared to standard quantile mapping and conventional MBC approaches, highlighting the potential of the method for physically consistent multivariate bias correction.

How to cite: Meier, T., Chavez-Demoulin, V., Koch, E., and Vatter, T.: Ensuring spatiotemporal consistency in multivariate bias correction for climate projections using hierarchical vine copulas and GAMs, EGU General Assembly 2026, Vienna, Austria, 3–8 May 2026, EGU26-3121, https://doi.org/10.5194/egusphere-egu26-3121, 2026.

EGU26-3645 | ECS | Posters on site | ITS1.13/AS5.5

Statistical Downscaling of PM2.5 and Gaseous Pollutants in East Asia Based on Graph Neural Network 

JeongBeom Lee, DaeRyun Choi, JinGoo Kang, and SeungHee Han

Abstract

Traditional data assimilation based on numerical models has been utilized for risk assessment and served as a basis for policy decision-making and regulatory establishment. However, data assimilation is constrained by the resolution of the underlying numerical models, presenting limitations in producing high resolution. In this study, we propose a statistical downscaling method to generate 1 km concentration fields for East Asia using a Graph Convolutional Network (GCN) model. The study was conducted in two phases. In Phase 1, the initial concentration fields were derived using the Community Multiscale Air Quality (CMAQ) model, driven by WRF-simulated meteorology and SMOKE-based emission inventories, with further refinement via surface observation data assimilation. In Phase 2, the GCN model was developed to downscale from 27 km to 1 km resolution, using the reanalysis fields from Phase 1, land-use data from WPS, and emission data from EDGAR as input features. The GCN model used semi-supervised learning by masking 70% of surface monitoring stations to separate training and validation data. The model evaluation indicated that the RMSE was 1.28 μg/m³ for PM2.5, 1.5 ppb for O3, and 0.8 ppb for NO2 in China. In the Korean Peninsula, the RMSE was 1.83 μg/m³ for PM2.5, 2.0 ppb for O3, and 1.3 ppb for NO2. The proposed GCN-based statistical downscaling methodology is expected to produce high-quality, high-resolution data that can contribute to risk assessment and policy development.

Acknowledgment

"This research was supported by Particulate Matter Management Speciallized Graduate Program throu the Korea Environmental Industry & Technology Institute(KEITI) funded by the Ministry of Environment(MOE)"

How to cite: Lee, J., Choi, D., Kang, J., and Han, S.: Statistical Downscaling of PM2.5 and Gaseous Pollutants in East Asia Based on Graph Neural Network, EGU General Assembly 2026, Vienna, Austria, 3–8 May 2026, EGU26-3645, https://doi.org/10.5194/egusphere-egu26-3645, 2026.

In this study, we developed SOFT CUBE, a scenario-based method to rapidly generate building-resolving three-dimensional wind and air temperature fields by combining a precomputed CFD database with operational mesoscale forecasts. For this, we constructed a CFD scenario library for a 2 km × 2 km urban domain by varying inflow wind speed and direction and surface thermal forcing, and supplemented it with auxiliary cases to represent background vertical wind structure and temperature stratification. Then, for each forecast time, we selected and linearly interpolated scenarios consistent with LDAPS boundary-layer conditions and synthesized the full 3D fields by performing layer-by-layer synthesis across the vertical levels. For validation of the developed method, we used LDAPS forecasts as background forcing and compared SOFT CUBE outputs with LDAPS-driven CFD simulations and observations from four urban stations during July–December 2021. The results showed that SOFT CUBE substantially improved near-surface wind-speed estimates compared with LDAPS, reduced air-temperature errors on average, and reproduced spatial patterns similar to those from the coupled LDAPS–CFD model for most cases. Finally, SOFT CUBE reduced the per-case runtime from 141 min for coupled CFD simulations to 3 min, supporting operational-scale high-resolution urban meteorological field production.

How to cite: Wang, J.-W., Lee, S.-H., and Kim, J.-J.: Development of SOFT CUBE: A synthesis framework for urban 3D flow and air temperature using precomputed CFD scenarios and mesoscale forecasts, EGU General Assembly 2026, Vienna, Austria, 3–8 May 2026, EGU26-3656, https://doi.org/10.5194/egusphere-egu26-3656, 2026.

EGU26-5950 | ECS | Orals | ITS1.13/AS5.5

Partitioning the sources of uncertainty in statistically downscaled and bias-adjusted climate simulations 

Juliette Lavoie, Louis-Philippe Caron, Travis Logan, Stephen Sobie, Richard Turcotte, Edouard Mailhot, and Jasmine Pelletier-Dumont

With the growing number of statistically downscaled datasets available, it can become difficult for users to choose what to focus on when selecting an ensemble and to understand the impact of this choice. To assist in this task, the authors use a systematic approach to quantify the uncertainty sources of statistically downscaled and bias-adjusted climate simulations. Classical uncertainty partitioning of climate simulations includes internal variability, greenhouse gases scenario and global climate model. Bias adjusted and statistically downscaled datasets descend a level deeper in the cascade of uncertainty. To study this, the authors include two new dimensions: observational reference used in bias-adjustment and bias-adjustment method itself. The fraction of uncertainty associated with each of these five dimensions is calculated for precipitation-based, temperature-based and multivariate indicators. Eastern Canada is used as a case study, focusing on three locations with contrasting climates and observational network densities. This analysis reveals that, while the method is only responsible for a small portion of the variance, the uncertainty associated with the observational reference dataset can play a major role, even becoming the leading source of uncertainty in many cases. This finding underscores the importance of this, often overlooked, dimension in the evaluation of datasets by users and impact modelers. Further, it highlights the ethical responsibility for data providers to clearly communicate the full uncertainty structure of their products.

How to cite: Lavoie, J., Caron, L.-P., Logan, T., Sobie, S., Turcotte, R., Mailhot, E., and Pelletier-Dumont, J.: Partitioning the sources of uncertainty in statistically downscaled and bias-adjusted climate simulations, EGU General Assembly 2026, Vienna, Austria, 3–8 May 2026, EGU26-5950, https://doi.org/10.5194/egusphere-egu26-5950, 2026.

EGU26-7377 | ECS | Posters on site | ITS1.13/AS5.5

Uncertainty aware Deep Learning for Downscaling Air Quality Concentrations 

Lauren Stella, Matthew Thomas, and David Topping

Poor air quality poses a major threat to public health globally. Fine particulate matter (PM2.5) is of particular concern due to its ability to penetrate deep into the lungs and enter the cardiovascular system, contributing to respiratory disease, cancer and early mortality. These health impacts underpin the critical need for accurate, high-resolution estimates of population exposure to support effective intervention strategies and safeguard public health.

There are many sources of information detailing air quality, including ground observations, remote sensing and atmospheric models (AM). Ground networks can provide accurate local measurements but are often spatially sparse, while satellite products and AMs often provide good spatial coverage but may lack local detail and may be affected by indirect measurement errors or model misspecification. Data integration modelling techniques can be employed to bring these complimentary data sources together and enable accurate, spatially continuous, high-resolution maps of air quality estimates.

Statistical downscaling approaches are commonly employed for this purpose, but often their high computational cost and limited scalability have motivated the adoption of downscaling through machine learning (ML) methods. However, ML models are traditionally deterministic, not providing explicit quantification of prediction uncertainty which is vital for risk-based decision making. We can address this gap by developing a probabilistic ML downscaling framework based on a Bayesian convolutional neural network (BCNN) where predictive uncertainty deriving from both model structure and random error is quantified using Monte Carlo dropout.

In this study, a BCNN is designed to enhance Copernicus Atmosphere Monitoring Service (CAMS) PM2.5 forecasts from their native 10 x 10 km resolution to 1 km in Western Europe. CAMS spatial data is spatially located with PM2.5 ground observations such that each extracted image corresponds to an observed concentration at a given time and location. The BCNN is trained to learn the relationships between largescale atmospheric patterns and local PM2.5 concentrations, enabling the creation of high-resolution prediction maps even in regions where ground monitoring in limited.  

The resulting framework produces spatially detailed, probabilistic PM2.5 estimates at relatively low computational cost compared to traditional statistical downscaling methods. The downscaled pollution data enables improved assessments of population exposure to poor air quality and the identification of pollution hotspots. This approach demonstrates strong potential for broader applications in data-sparse regions and for supporting urban-scale air quality planning.

How to cite: Stella, L., Thomas, M., and Topping, D.: Uncertainty aware Deep Learning for Downscaling Air Quality Concentrations, EGU General Assembly 2026, Vienna, Austria, 3–8 May 2026, EGU26-7377, https://doi.org/10.5194/egusphere-egu26-7377, 2026.

We present a novel downscaling methodology that addresses the critical challenge of spatial heterogeneity in coarse-scale Gravity Recovery and Climate Experiment (GRACE) and its Follow-On (GRACE-FO) data. Accurately capturing this heterogeneity is essential for local-scale hydrological applications. While machine learning approaches such as the global random forest (GRF) model have been used, the aspatial nature of the GRF model limits its ability to capture spatial heterogeneity when downscaling GRACE (-FO) data. To overcome this, we propose a Geographically Weighted Random Forest (GWRF) model, which integrates spatial weighting into the GRF algorithm to downscale groundwater storage anomalies (GWSAs) to 0.1° resolution over the North China Plain (2003-2025). The added value of this approach is rigorously quantified through benchmarking. We found that the GWRF model outperforms the GRF model, increasing R2 from 0.957 (GRF: training) and 0.73 (GRF: testing) to 0.999 (GWRF: training) and 0.897 (GWRF: testing). The high-resolution GWSAs output exhibits a strong correlation (r = 80) with independent in-situ groundwater observational measurements, thereby enhancing its credibility. The downscaled GWSAs data provide a tangible application, revealing significant groundwater depletion in the Piedmont Plain (PP: -13.42 mm/yr), Yellow River Plain (YRP: -13.25 mm/yr), Hai River Plain (HRP: -12.68), and a moderate depletion in the Coastal Plain (CP: 5.98 mm/yr) sub-regions of NCP. Using a two-stage Generalized Additive Model (GAM), we quantitatively attribute 69-83% of the GWSAs decline to anthropogenic drivers (primarily cropland expansion, NDVI, and population growth) and 7-12% to climatic factors (downward shortwave radiation, precipitation, and sea surface temperature). This work advances downscaling techniques by demonstrating how geographically-aware machine learning can unlock finer-scale insights from GRACE (-FO) satellite data, providing a valuable tool for climate impact assessments and water resource management.

How to cite: Ali, S., Chen, Q., and Wang, F.: Integrating Spatial Weights into Random Forest to Overcome Aspatial Limitations in GRACE data Downscaling: Tracking Groundwater Depletion in the North China Plain, EGU General Assembly 2026, Vienna, Austria, 3–8 May 2026, EGU26-8725, https://doi.org/10.5194/egusphere-egu26-8725, 2026.

EGU26-9122 | ECS | Posters on site | ITS1.13/AS5.5

Deep Learning Emulation of Convective Instability and Near-Surface Fields from ERA5 

Marc Benitez, Mirta Rodriguez, Tomas Margalef, Javier Panadero, and Omjyoti Dutta

As climate variability intensifies, extreme weather events are expected to change its frequency and severity, increasing the need for high-resolution meteorological data capable of resolving small-scale processes such as convective storms, urban heat islands, and extreme wind events. The ERA5 reanalysis produced by the European Centre for Medium-Range Weather Forecasts (ECMWF) is widely used for global and regional analyses, but its coarse spatial resolution limits its applicability for fine-scale impact studies. Dynamical downscaling using physical models can bridge this gap but this approach remains computationally expensive. As an alternative, machine learning based models that learn to map coarse data into data produced by physical models offer a computationally inexpensive solution.

Here, we present a multivariate deep learning framework based on a UNet architecture to emulate and downscale key near-surface and convective variables from ERA5 to convection-permitting resolution using limited data. Five low-resolution atmospheric predictors at three pressure levels (850, 700 and 500 hPa), together with five single level variables and a high-resolution elevation map is used as input for the model, which aims to emulate Most Unstable Convective Available Potential Energy (MUCAPE) and downscale 2m temperature and 10m wind components. The model is trained using ERA5 data at 25 km resolution as input and CONUS404, a WRF-based regional hydroclimate reanalysis at 4 km resolution over the contiguous United States, as the target.

Relative to ERA5, the downscaled fields exhibit substantial error reductions, with root-mean-square error improvements of 35.7% for MUCAPE, 20.0% for 2 m temperature, 23.0% for zonal wind, and 20.8% for meridional wind. The model reproduces fine-scale spatial structure, realistic value distributions, and seasonal and temporal variability, and demonstrates skill in representing extreme convective environments, including those associated with hurricanes.

These results highlight the ability of multivariate deep learning to capture complex inter-variable relationships in the atmosphere. In particular, deep learning–based MUCAPE emulation provides a computationally efficient alternative to traditional diagnostic calculations, enabling spatially detailed and readily accessible datasets for severe weather analysis and climate impact studies using a limited set of input variables.

How to cite: Benitez, M., Rodriguez, M., Margalef, T., Panadero, J., and Dutta, O.: Deep Learning Emulation of Convective Instability and Near-Surface Fields from ERA5, EGU General Assembly 2026, Vienna, Austria, 3–8 May 2026, EGU26-9122, https://doi.org/10.5194/egusphere-egu26-9122, 2026.

Chemical transport models (CTMs) are essential for assessing air quality and designing mitigation strategies, yet computational constraints typically limit their operational output to coarse resolutions (e.g., 10-15 km over regional domains). These resolutions are often insufficient to capture local pollution hotspots or neighborhood-scale variations required for accurate exposure assessment. In the frame of the Copernicus Atmospheric Monitoring Service (CAMS) National Collaboration Programme (NCP) contract and AIRE SPanish national project, we are investigating the application of deep learning-based super-resolution techniques to downscale atmospheric composition fields while enforcing physical constraints such as mass conservation.

Our research utilizes a large-scale dataset spanning three years (2021-2023) with hourly outputs covering the Iberian Peninsula. We employ the MONARCH chemical transport model to generate 72,000 paired samples, consisting of high-resolution (5 km) ground truth and synthetically coarsened (10 km) inputs for pollutants including NO2, O3, PM10, and PM2.5, alongside high-resolution meteorological fields and anthropogenic emissions (obtained with the HERMES emission module) as auxiliary inputs. We compare the performance of several architectures adapted from computer vision, specifically Convolutional Neural Networks (CNN), Residual Channel Attention Networks (RCAN), and Enhanced Deep Residual Networks (EDSR). A key methodological innovation in our approach is the integration of high-resolution auxiliary data directly into the learning process to guide the reconstruction of pollutant fields. Additionally, we explore architectural modifications such as renormalization layers to enforce hard physical constraints, including mass conservation and non-negativity.

Our results demonstrate that deep learning models significantly outperform traditional deterministic baselines. A primary finding is that the inclusion of high-resolution ancillary data is critical for performance, providing the necessary physical context to recover sharp spatial gradients. We observe that relatively compact models are capable of achieving impressive fidelity; we report Pearson correlation coefficients exceeding 0.988 and normalized Root Mean Square Error (nRMSE) below 20% across all target pollutants. Qualitative inspection confirms these quantitative gains, as the generated high-resolution maps are nearly indistinguishable from the ground-truth simulation fields. However, we also find that increasing model depth introduces training stability challenges, such as gradient explosions, which require careful optimization strategies.

Current efforts are now focused on reducing temporal biases and improving the robustness of the models across different atmospheric perturbations. Future work will extend this framework to higher scaling factors (i.e., downscaling to 2.5 km resolution) and transition from learning on synthetically degraded data to mapping native low-resolution simulation outputs directly to high-resolution targets. The latter is not trivial, as CTMs are not spatially consistent across resolutions due to information loss during the coarsening process. Finally, we aim to explore spatiotemporal architectures to leverage the temporal coherence inherent in atmospheric transport processes.

How to cite: d'Hondt, J. E. and Petetin, H.: Physics-Constrained Deep Learning for Downscaling Atmospheric Chemistry Simulations: The Role of Auxiliary Forcings and Model Architecture, EGU General Assembly 2026, Vienna, Austria, 3–8 May 2026, EGU26-9829, https://doi.org/10.5194/egusphere-egu26-9829, 2026.

EGU26-10207 | ECS | Posters on site | ITS1.13/AS5.5

Downscaling using Physics Informed Neural Networks for model evaluation at urban scale 

Nemo Malhomme and Giovanni Stabile

Cities contain a significant proportion of the global population. Because of their unique vulnerabilities to climate-related phenomena, such as the Urban Heat Island effect, understanding urban microclimates is essential to the durable safety and well-being of residents. However, global and regional climate models operate at scales too coarse to capture urban-scale processes. Accurately modeling urban microclimates requires resolving fine-scale details, such as the geometry and arrangement of buildings. Such high-resolution simulations entail substantial computational costs, which severely limit their applicability. Because of this, at this time, real-time prediction and design optimization problems remain mostly inaccessible. Therefore, there is a need for computationally efficient urban microclimate models.

The DANTE project aims to address this need by applying model order reduction techniques to high-resolution urban-scale simulations. Resulting models must undergo a rigorous validation process before any application is possible, to ensure accuracy and reliability for real-world applications. This validation process requires urban-scale ground truth data, which is not directly available. Instead, lower-resolution data must be downscaled to urban scale. As a result, downscaling is a critical part of developing reliable urban microclimate models.

The goal of our work is to construct a downscaling framework adapted to the context of weather data, leveraging regional model data, weather station measurements, as well as physical knowledge. In this context, pre-existing high-resolution data is very limited, rendering purely statistical downscaling approaches unsuitable. Since no models - other than those intended for evaluation - are available at the target scale, dynamical downscaling methods are also inadapted. Finally, the inhomogeneity of relevant scales, and the need to integrate data at arbitrary locations requires the use of irregular, variable grids.

A promising approach is to use Physics-Informed Neural Networks (PINNs). PINNs incorporate physical constraints into the learning process by including partial differential equation residuals into the loss function. By using networks that take coordinates as input and output the local system state, a fitted model can be evaluated at arbitrary locations, providing a way to downscale without need for a structured grid.

A major limitation of PINNs is their lack of robustness during training, as convergence can be difficult to achieve reliably. A contributing factor is that different loss terms can have wildly different scales and convergence rates, which can hinder optimization. Previous studies have explored strategies to make convergence more likely, but such results do not always generalize are are typically task and problem-specific.

In this work, we investigate the applicability of PINNs to the downscaling of weather data, formulated as a fluid dynamics problem on unstructured meshes. We assess the performance levels that can be achieved and examine the methodological choices that influence them, including network architecture, collocation point density, loss-term weighting strategies, data preprocessing, and training protocols. We also analyse the associated difficulties, computational costs, and practical requirements, and quantify the added value of the inclusion of physical knowledge.

How to cite: Malhomme, N. and Stabile, G.: Downscaling using Physics Informed Neural Networks for model evaluation at urban scale, EGU General Assembly 2026, Vienna, Austria, 3–8 May 2026, EGU26-10207, https://doi.org/10.5194/egusphere-egu26-10207, 2026.

EGU26-10424 | Orals | ITS1.13/AS5.5

A Novel Statistical Downscaling Methodfor Generating High-Resolution ClimateProjections for Europe from CMIP6 

Guido Fioravanti, Andrea Toreti, Danila Volpi, Arthur Hrast-Essenfelder, and Juan Acosta-Navarro

Reliable projections of Earth’s future climate are an essential source of information to better adapt to the impacts of climate change on societies and natural systems. Climate models provide information on the possible evolution of climate in the coming decades to centuries, however, this information has several limitations such as inadequate resolution to capture the fine-scale features that characterize hydroclimatic conditions at the local scale. Climate model output downscaling aims at partly addressing these limitations.

Here, we present a novel methodology to generate 5 km × 5 km climate information at the European scale based on CMIP6 model output, which not only corrects model biases locally, but also preserves large-scale climate features (spatial correlation) from the original climate model data.

Our approach builds from an existing downscaling technique: Bias-Corrected Constructed Analogues with Quantile Mapping Reordering. Compared to the BCCAQ implementation available in the well-known R package ClimDown, our methodology introduces two major differences:

Identification of Dynamically Coherent and Persistent Weather Regimes: We perform the daily analogue selection only for dynamically coherent and persistent days. This process begins by identifying large-scale circulation patterns. The first 10 principal components (PCs) of daily mean sea level pressure (MSLP) from both the CERRA reanalysis and the GCM are calculated. Then, a multivariate Hidden semi-Markov model (HSMM) is used to detect hidden states (representing meteorological regimes) in the GCM's data over the period 1950–2100. This allows for the identification of persistent blocks of at least five consecutive days characterized by a single dominant weather regime. Blocks shorter than five days, or those without a dominant regime, are excluded from the reordering step.

Targeted Analogue Search and Reordering: For each day within an identified block, the search for historical analogues in the CERRA data is conducted within a window of ±15 days from that calendar day, using a mean squared difference metric on the relevant variable. Finally, a "Schaake Shuffle" reranking of the corresponding Quantile Delta Mapping (QDM) daily outputs is performed within each identified block of continuous days using the identified climate analogues. This ensures the preservation of realistic temporal structure of the weather sequences across the coherent meteorological regimes.

Our downscaling method is calibrated with historical data (1985–2014) from the Copernicus European Regional Reanalysis (CERRA) and this calibration propagates the downscaling into the future for model simulations up to 2099 using the emission scenarios SSP245, SSP370 and SSP585 for the nine climate models and for the variables daily maximum (tasmax), minimum (tasmin), mean (tas) temperature and daily precipitation (pr).

The proposed methodology is portable and potentially applicable to any other region and/or set of input model data as well as an observational reference used to calibrate the model data.

How to cite: Fioravanti, G., Toreti, A., Volpi, D., Hrast-Essenfelder, A., and Acosta-Navarro, J.: A Novel Statistical Downscaling Methodfor Generating High-Resolution ClimateProjections for Europe from CMIP6, EGU General Assembly 2026, Vienna, Austria, 3–8 May 2026, EGU26-10424, https://doi.org/10.5194/egusphere-egu26-10424, 2026.

Deep learning (DL) models have become popular methods to downscale low resolution climate data into high resolution climate projections, with the goal of avoiding the high computational cost associated with dynamical models like Regional Climate Models (RCMs). These DL-based downscaling models when applied in the context of RCMs and their Global Climate Model (GCM) counterparts, are referred to as RCM emulators.Currently, most DL based RCM emulators are single variate, which presents several drawbacks. For example, actual RCM's are multivariate and thus an RCM emulator should be as well. Additionally, a goal of these models is capturing extreme weather events, which are often multivariate as well. As such, this work explores the added value of multivariate emulators by testing four different DL-based RCM emulators (plus a single-variate emulator as baseline) at recreating a daily time series of 2D maps representing the average, maximum and minimum temperature on a given day at surface. All of these models rely on a U-Net based architecture. Notably, two of these DL models are considered to be ''temporal" (one of which implements a ConvLSTM architecture) as they both use multiple days worth of input data to make their predictions. These models are evaluated against a true RCM via several evaluation metrics, including general numerical metrics (RMSE, Correlation, etc.) as well as through real world applications, like the emulators ability to accurately represent future climate or reproduce heatwave events. We also implement a scheme of statistical significance testing via the Kruskal-Wallis method (with Dunn’s as post-hoc). Our results show that the temporal emulators, especially the LSTM model, consistently outperform the other models on a variety of the metrics. The results here support the theory that there is added value in not only making RCM emulators multivariate, but also that temporality improves the emulator's ability to make its predictions.

How to cite: Carty, C.: Multivariate deep-learning based regional climate model emulators and the impact of temporal awareness, EGU General Assembly 2026, Vienna, Austria, 3–8 May 2026, EGU26-11428, https://doi.org/10.5194/egusphere-egu26-11428, 2026.

EGU26-13665 | ECS | Posters on site | ITS1.13/AS5.5

Uncertainty Quantification in Generative Climate Downscaling: A Multi-Ensemble DDPM Analysis 

Vivek Gupta, Shailesh Kumar Jha, Priyank J Sharma, Anurag Mishra, and Saksham Joshi

Deterministic deep learning models used for climate downscaling often exhibit spectral collapse, resulting in overly smoothed fields that underestimate extreme events. Although Generative Adversarial Networks (GANs) can preserve high-frequency details, their training instability limits the reliability of ensemble generation. Denoising Diffusion Probabilistic Models (DDPMs) offer a solution to both of these problems. They sample from learned probability distributions through iterative denoising, which introduces inherent randomness. This allows each inference to produce statistically different but physically plausible results, a feature that is essential for quantifying uncertainty in climate projections. This study presents the first systematic analysis of ensemble convergence for DDPM-based climate downscaling at a 10× spatial resolution (1.0° → 0.1°). We evaluated configurations with ensemble sizes ranging from 2 to 50 members, focusing on 30 extreme temperature events. Using the multi-modal sampling capabilities of DDPMs, achieved through different random initializations in the reverse diffusion process, we assessed the trade-offs between accuracy, uncertainty, and computational cost. This was done using a set of metrics: RMSE, MAE, Pearson R, SSIM, and PSNR. The research results demonstrate significant convergence trends: (1) ensemble mean predictions exhibit rapid saturation, with 5-member configurations attaining 96–98% of peak performance (RMSE: 0.459°C compared to 0.453°C for 25 members); (2) spatial uncertainty estimates (0.165–0.170°C) stabilize at 5–10 members, with only minor enhancements of less than 1% beyond this point; (3) computational costs increase substantially, a 50-member ensembles necessitate 35 hours, whereas 5-member ensembles require only 4 hours, indicating an 89% reduction in cost with minimal compromise in accuracy. The optimal range of 5–10 members provides strong uncertainty constraints and enables operational scalability in continental-scale applications. In contrast to deterministic models that provide only point estimates or GANs prone to mode collapse, DDPMs' generative sampling inherently quantifies prediction confidence via ensemble spread, thereby encompassing both epistemic model uncertainty and aleatoric variability. This research provides actionable guidance for uncertainty-aware climate downscaling, demonstrating that small DDPM ensembles effectively produce probabilistic projections, which are crucial for evaluating climate risk.

How to cite: Gupta, V., Jha, S. K., Sharma, P. J., Mishra, A., and Joshi, S.: Uncertainty Quantification in Generative Climate Downscaling: A Multi-Ensemble DDPM Analysis, EGU General Assembly 2026, Vienna, Austria, 3–8 May 2026, EGU26-13665, https://doi.org/10.5194/egusphere-egu26-13665, 2026.

Microclimate models are increasingly used to assess the effectiveness of climate change adaptation strategies against future heat stress. These models require high-resolution climate inputs for multiple variables, including precipitation, air temperature, wind, radiation, and humidity. While the highest spatial and temporal resolution climate information is typically provided by regional climate models, particularly convection-permitting models (CPMs), it remains unclear whether CPM outputs still require bias correction across all relevant variables and whether commonly applied methods such as quantile mapping are suitable in this context. 

In this study, we evaluated the performance of the convection permitting model, COSMO-CLM, against observations for three Swiss cities, Zurich, Geneva, and Lugano, across six climate variables: precipitation, air temperature, solar radiation, wind speed, surface pressure, and relative humidity. Delta quantile-mapping was applied to bias-correct these variables for a historical period (1998–2009) and a future period (2078–2089), using COSMO-CLM simulations driven by MPI-ESM-LR under the RCP8.5 scenario. Model performance was evaluated using cross-validation for the historical period and by comparing the climate change signal of selected climate indices (e.g., Maximum Daily Air Temperature and Annual Mean Precipitation) between raw and bias-corrected outputs for the future period. Additional analyses examined whether inter-variable correlation structures were preserved after bias-correction and whether diurnal temperature patterns were respected. 

The raw COSMO-CLM output exhibits systematic biases across all variables, with particularly pronounced biases in precipitation, temperature, reltaive humidity, and solar radiation. Delta quantile mapping cannnot substantially reducethese biases but can preserve inter-variable correlations.  However, climate change signals that are not explicitly represented in the model were incorporated for wind speed, relative humidity, surface pressure, and solar radiation, while climate change signals for precipitation and temperature are not well preserved. In addition, the method exhibits limitations in representing extreme events especially precipitation events above the 99th percentile and can shift the diurnal air temperature distribution. The latter is of particular concern in this context, as mitigation of heat stress during the hottest hours of the day is the primary focus of climate change adaptation against heat. Variable-specific bias-correction approaches may therefore be required; however, such tailoring can complicate the preservation of physically consistent inter-variable correlation structures. In general, it remainschallenging to identify appropriate evaluation metrics for assessing the usefulness and validity of bias-correction techniques when applied across multiple climate variables. Overall, this study presents a multi-variable assessment of the benefits and limitations of quantile mapping for high-resolution climate data used in urban microclimate modeling and climate change adaptation applications. 

How to cite: Liu, F., Yin, Y., and Cook, L.:  Challenges in Multivariate Bias Correction of Convection-Permitting Climate Models for Urban Microclimate Applications , EGU General Assembly 2026, Vienna, Austria, 3–8 May 2026, EGU26-18164, https://doi.org/10.5194/egusphere-egu26-18164, 2026.

EGU26-18397 | ECS | Orals | ITS1.13/AS5.5

MAR.ia: a diffusion-based emulator for high-resolution climate downscaling over Belgium 

Elise Faulx, Sacha Peters, Xavier Fettweis, and Gilles Louppe

Regional Climate Models (RCMs) provide high-resolution, physics-based fields, but they face three main limitations. First, they are computationally expensive and hence difficult to scale across scenarios or ensembles. Second, they lack uncertainty quantification. Third, they usually  take only coarse data from Earth System Models (ESMs) or reanalysis to predict fields, without assimilating real observations. In response to these problems, neural emulators of RCMs have been developed over different regions. 

In this work, we present MAR.ia, a  diffusion-based emulator of MAR, an RCM developed at ULiège tailored to Belgium (Doutreloup et al., 2019). Our approach maps coarse atmospheric and surface reanalysis variables (ERA5 at 0.25° and 1° resolution) to key surface variables (temperature, precipitation and wind speed) at the resolution of MAR (5 km). The emulator is conditioned on ERA5 reanalysis every six hours (as the forcing of MAR) in order to give hourly MAR-like fields. We assess the sensitivity of the emulator to the choice of ERA5 fields, identifying the key drivers to reproduce MAR dynamics. 

We solve the three main limitations initially stated: we reduce computational costs by several orders of magnitude, we estimate uncertainty by sampling several times for the same coarse inputs (generation of ensembles), and we incorporate observational constraints from ground stations and satellites directly during sampling, while showing competitive metrics, i.e. correlation of ~0.99 for the temperature at 2m. 

Future work will attempt to use ESM outputs (weather forecast or CMIP future projections) as context variables instead of reanalysis, enabling both short-term meteorological predictions and long-term climate projections up to 2100, over Belgium. 

Doutreloup, S., Wyard, C., Amory, C., Kittel, C., Erpicum, M., and Fettweis, X. (2019). Sensitivity to Convective Schemes on Precipitation Simulated by the Regional Climate Model MAR over Belgium (1987–2017), Atmosphere, 10( 1), 34. https://doi.org/10.3390/atmos10010034.


How to cite: Faulx, E., Peters, S., Fettweis, X., and Louppe, G.: MAR.ia: a diffusion-based emulator for high-resolution climate downscaling over Belgium, EGU General Assembly 2026, Vienna, Austria, 3–8 May 2026, EGU26-18397, https://doi.org/10.5194/egusphere-egu26-18397, 2026.

EGU26-18822 | ECS | Posters on site | ITS1.13/AS5.5

Deep learning–based downscaling of ERA5-Land surface air temperature using multisource auxiliary data 

Davide Parmeggiani, Sofia Costanzini, Francesca Despini, Grazia Ghermandi, and Sergio Teggi

Accurate characterization of surface air temperature at the urban scale is relevant for developing effective climate change adaptation and mitigation strategies in the context of global warming. However, reanalysis products such as ERA5-Land provide 2 m air temperature (T2m) at relatively coarse spatial resolutions, limiting their applicability for detailed urban-scale analyses. To address this limitation, this study focuses on the spatial downscaling of ERA5-Land T2m from 0.1° to 0.05° resolution using a deep learning–based approach. A specific type of Convolutional Neural Network (CNN), known as Super Resolution Deep Residual Network (SRDRN), is implemented to enhance the spatial detail of surface air temperature fields. The proposed framework integrates auxiliary variables derived from satellite observations and meteorological reanalysis data to better capture surface–atmosphere interactions and improve model performance. These auxiliary features include the Normalized Difference Vegetation Index (NDVI), Land Surface Temperature (LST), albedo, Normalized Difference Built-up Index (NDBI), as well as meteorological variables such as precipitation, solar radiation, and wind components. Model training and evaluation are performed following a supervised learning approach, with the fine-resolution MERIDA-HRES dataset used as reference data and split into training, validation, and testing subsets. The SRDRN configuration incorporating these multisource auxiliary features outperforms both a previous downscaling experiment based on T2m and baseline methods, including the classical statistical downscaling approach LOcalized Constructed Analog (LOCA) and bilinear interpolation (previous SRDRN: RMSE = 1.4 °C, R² = 0.74). In addition, an evaluation employing the SPHERA dataset at 0.02° spatial resolution further confirms the robustness and spatial consistency of the proposed approach. These results demonstrate that the inclusion of satellite-derived surface data and specific meteorological variables substantially improves the accuracy of downscaled T2m at spatial resolutions closer to the urban scale. By enhancing the spatial resolution of surface air temperature data, this work confirms the potential of deep learning approaches for temperature downscaling and subsequent urban climate analysis. Future work will focus on increasing the spatial resolution to 0.01° and validating the enhanced products against in-situ weather observations to further assess accuracy, robustness, and applicability for urban climate services.

How to cite: Parmeggiani, D., Costanzini, S., Despini, F., Ghermandi, G., and Teggi, S.: Deep learning–based downscaling of ERA5-Land surface air temperature using multisource auxiliary data, EGU General Assembly 2026, Vienna, Austria, 3–8 May 2026, EGU26-18822, https://doi.org/10.5194/egusphere-egu26-18822, 2026.

EGU26-19787 | ECS | Orals | ITS1.13/AS5.5

Generative Unsupervised Downscaling of Climate Models via Domain Alignment: Application to Wind Fields 

Julie Keisler, Boutheina Oueslati, Anastase Charantonis, Yannig Goude, and Claire Monteleoni

Global Climate Models (GCMs) are essential tools for climate projections, but their coarse spatial resolution (~100–200 km) and systematic biases limit their direct use for regional impact studies. This limitation is particularly critical for wind-related applications, such as wind energy assessments, which require spatially coherent, multivariate, and physically plausible near-surface wind fields. Classical statistical downscaling and bias correction methods partly address this issue, yet they often fail to preserve spatial structure, inter-variable consistency, and robustness under climate change, especially when applied to high-dimensional climate fields.

Recent advances in generative machine learning offer new opportunities for downscaling and bias correction without relying on explicitly paired low- and high-resolution datasets. Such methods can generate fine-scale, physically consistent fields conditioned on large-scale climate patterns. However, many existing approaches remain difficult to interpret and challenging to deploy in operational climate impact studies.

In this work, we apply SerpentFlow, an interpretable, generative, domain alignment framework, to the multivariate downscaling and bias correction of wind variables from the ACCESS Earth System Model over the French territory at a resolution of approximately 25 km, under the SSP2-4.5 scenario. The framework constructs pseudo low-/high-resolution pairs by explicitly separating large-scale spatial patterns from small-scale variability, aligning large-scale components between model outputs and observations, and learning conditional fine-scale variability via a flow-matching generative model. This approach enables the generation of realistic fine-scale wind fields while preserving physical plausibility and inter-variable correlations.

We evaluate the method on multiple near-surface wind variables, including wind speed, zonal and meridional components, and maximum wind speed, and compare its performance to widely used statistical downscaling and multivariate bias correction methods, such as CDF-t and R2D2. Evaluation metrics include the preservation of spatial structure, inter-variable correlation, extremes, and robustness under future climate conditions. We find that SerpentFlow significantly improves spatial coherence and consistency among wind components compared to baseline methods, while maintaining realistic distributions and extreme events. Ensemble simulations further illustrate the method’s ability to capture stochastic fine-scale variability, an important aspect for climate risk assessment and energy resource studies.

Our results demonstrate that interpretable generative domain adaptation methods can address critical limitations of classical downscaling techniques, providing high-resolution, physically consistent, and multivariate-consistent wind fields suitable for climate impact and energy applications. This work highlights the potential of SerpentFlow as a flexible tool for operational downscaling tasks, capable of adapting to different GCMs, resolutions, and scenarios without requiring paired training data. The framework thus represents a promising avenue for generating reliable, high-resolution climate information to support regional adaptation and wind energy planning.

How to cite: Keisler, J., Oueslati, B., Charantonis, A., Goude, Y., and Monteleoni, C.: Generative Unsupervised Downscaling of Climate Models via Domain Alignment: Application to Wind Fields, EGU General Assembly 2026, Vienna, Austria, 3–8 May 2026, EGU26-19787, https://doi.org/10.5194/egusphere-egu26-19787, 2026.

EGU26-19822 | Orals | ITS1.13/AS5.5

Generalizable Generative Downscaling: Maintaining Physical Consistency from Reanalysis to GCMs and Hydrological Applications 

Chris Lucas, Natalie Lord, Nans Addor, Sebastian Moraga, Jannis Hoch, Alex Marshall, and Ollie Wing

Bridging the scale gap between coarse General Circulation Models (GCMs) and high-resolution data, e.g. the type required for hydrological assessment, remains a significant challenge. While dynamic downscaling via Regional Climate Models (RCMs) offers guarantees of physical consistency, its computational cost prohibits creating the large-volume ensembles required for catastrophe risk assessment. This work presents a matured Generative Diffusion Model (DM) framework that achieves high-resolution (10 km) downscaling across Europe with significantly lower computational overhead than similar methods. Crucially, we demonstrate zero-shot transferability by downscaling the 100-member CESM2 Large Ensemble (CESM2-LENS), despite the model being trained exclusively on reanalysis data.

To move beyond traditional pixel-wise metrics, we employ a multi-scale validation strategy: (1) Distributional integrity, recovering extreme precipitation tails; (2) Spatial consistency, using Radially Averaged Log Spectral Density to confirm correct energy distribution from convective scales to synoptic systems; and (3) Temporal coherence, ensuring the chronological sequences required for realistic soil moisture evolution. Finally, we provide an "end-to-end" validation by forcing the Wflow distributed hydrological model. The resulting discharge simulations capture historical extremes across diverse European catchments, proving that the generative output is not merely visually plausible but physically functional. This framework offers a scalable, computationally efficient pathway for generating the massive synthetic event sets required for risk assessment in a non-stationary climate.

How to cite: Lucas, C., Lord, N., Addor, N., Moraga, S., Hoch, J., Marshall, A., and Wing, O.: Generalizable Generative Downscaling: Maintaining Physical Consistency from Reanalysis to GCMs and Hydrological Applications, EGU General Assembly 2026, Vienna, Austria, 3–8 May 2026, EGU26-19822, https://doi.org/10.5194/egusphere-egu26-19822, 2026.

EGU26-22472 | ECS | Posters on site | ITS1.13/AS5.5

Super-Resolving Coarse-Resolution Weather Forecasts with Flow Matching 

Aymeric Delefosse, Anastase Charantonis, and Dominique Béréziat

Machine learning-based weather forecasting models now surpass state-of-the-art numerical weather prediction systems, but training and operating these models at high spatial resolution remains computationally expensive. We present a modular framework that decouples forecasting from spatial resolution by applying learned generative super-resolution as a post-processing step to coarse-resolution forecast trajectories. We formulate super-resolution as a stochastic inverse problem, using a residual formulation to preserve large-scale structure while reconstructing unresolved variability. The model is trained with flow matching exclusively on reanalysis data and is applied to global medium-range forecasts. We evaluate (i) design consistency by re-coarsening super-resolved forecasts and comparing them to the original coarse trajectories, and (ii) high-resolution forecast quality using standard ensemble verification metrics and spectral diagnostics. Results show that super-resolution preserves large-scale structure and variance after re-coarsening, introduces physically consistent small-scale variability, and achieves competitive probabilistic forecast skill at 0.25° resolution relative to an operational ensemble baseline, while requiring only a modest additional training cost compared with end-to-end high-resolution forecasting.

How to cite: Delefosse, A., Charantonis, A., and Béréziat, D.: Super-Resolving Coarse-Resolution Weather Forecasts with Flow Matching, EGU General Assembly 2026, Vienna, Austria, 3–8 May 2026, EGU26-22472, https://doi.org/10.5194/egusphere-egu26-22472, 2026.

EGU26-923 | ECS | Orals | AS5.6

Lattice Boltzmann Method for Electromagnetic Scattering by Complex Atmospheric Particles 

Mohd Meraj Khan, Sumesh P Thampi, and Anubhab Roy

We develop and assess a Lattice Boltzmann Method (LBM) framework for modelling electromagnetic wave scattering by atmospheric particles, with a focus on complex and aspherical geometries relevant to climate science and optical remote sensing. In this formulation, mesoscopic distribution functions for the electric and magnetic fields evolve on a discrete lattice, from which the macroscopic Maxwell equations emerge through a Chapman–Enskog expansion. The method inherently accommodates irregular boundaries, making it well-suited for non-spherical particle shapes. Scattering computations are performed for circular and hexagonal cylinders, as well as spherical scatterers. The results are benchmarked against analytical and semi-analytical solutions, such as classical Mie theory and the Discretised Mie Formalism. Across the Rayleigh, Mie, and geometric-optics regimes, the LBM accurately captures key scattering features, including edge diffraction, interference structures, and far-field distributions, while retaining second-order accuracy in space and time. With its entirely local update rules, strong parallel scalability, and flexibility in representing complex geometries, the LBM provides a promising framework for simulating light scattering by atmospheric particles such as ice crystals and aerosol aggregates. These results highlight its potential to complement existing scattering models and support improved optical parameterizations for weather, climate, and remote sensing applications.

How to cite: Khan, M. M., Thampi, S. P., and Roy, A.: Lattice Boltzmann Method for Electromagnetic Scattering by Complex Atmospheric Particles, EGU General Assembly 2026, Vienna, Austria, 3–8 May 2026, EGU26-923, https://doi.org/10.5194/egusphere-egu26-923, 2026.

Atmospheric aerosols represent a critical component of the Earth–atmosphere system, modulating radiative climate forcing through both direct and indirect pathways. Consequently, accurate measurement of their physical and optical properties has long been a primary focus of international aerosol research. Nevertheless, substantial uncertainties persist in current observational techniques and numerical models, particularly with respect to aerosol size distribution, morphology, and optical characteristics. These uncertainties propagate through retrieval algorithms and radiative transfer calculations, ultimately compromising the reliability of radiative forcing estimates and climate projections.
In this study, we address the challenge of characterizing non-spherical aerosol particles through advanced in situ measurement techniques. We first present a high-resolution aerosol imaging system that integrates optical microscopy with real-time computer-vision analysis (Dong, et al., IEEE Trans. Instrum. Meas., 2025). Leveraging advanced image processing algorithms, this instrument delivers high spatiotemporal resolution measurements of particle size, morphology, and number concentration, thereby enabling precise quantification of complex, non-spherical geometries and their dynamic evolution.
Complementing the imaging system, we introduce a fully automated laser scattering measurement instrument designed to acquire aerosol scattering phase functions with exceptional angular coverage (5°–357°) and spectral versatility ranging from the ultraviolet to the near-infrared (Dong, et al., Chin. Opt. Lett., 2025). These high-fidelity phase function measurements provide robust constraints on the angular scattering behavior of non-spherical particles.
By integrating these two complementary platforms, we achieve comprehensive characterization of aerosol particles across a diameter range of 0.2-186 μm. The resulting dataset includes five size descriptors, four independent shape descriptors, scattering phase functions, scattering coefficients, asymmetry parameters, and number concentrations spanning 0 to 108 particles/cm3. Collectively, this synergistic observational framework yields concurrent, high-accuracy determinations of aerosol geometric and optical properties.
These laboratory- and field-validated observations obtained from our integrated systems are expected to substantially reduce uncertainties in radiative transfer simulations, improve estimates of aerosol radiative effects, and deepen our understanding of aerosol–radiation–cloud interactions.

Refs:
1. Li Dong, Yong Han, Maohai Hu, et al. Fast Atmospheric Aerosol Size and Shape Imaging Instrument: Design, Calibration, and Intelligent Interaction[J]. IEEE Transactions on Instrumentation and Measurement, 2025, 74: 1-17.
2. Li Dong, Yong Han, and Yurong Zhang. Development of a multi-wavelength near-full-angle aerosol scattering phase function laser measurement system[J]. Chinese Optics Letters, 2025, 23(11): 111203.

How to cite: Dong, L. and Han, Y.: A Synergistic Characterization Method for the Geometric Structure and Optical Response of Non-spherical Aerosols, EGU General Assembly 2026, Vienna, Austria, 3–8 May 2026, EGU26-1548, https://doi.org/10.5194/egusphere-egu26-1548, 2026.

A near-infrared external-cavity laser heterodyne radiometer (EC-LHR) with balanced detection was developed for remote sensing of water vapor/δD and CO213C in the atmospheric column. This tunable external cavity laser, with a center wavelength of 1.56 µm, serves as local oscillator and offers a tuning range of hundreds of wavenumbers by scanning work temperature and current. By optimizing the optical heterodyne balanced detection configuration, the EC-LHR achieved quasi-shot-noise-limited performance. High-resolution atmospheric transmission spectra of water vapor, HDO, CO₂, and ¹³CO₂ were simultaneously measured using the developed EC-LHR operating in ground-based solar occultation mode. Within the framework of the optimal estimation algorithm, three inversion strategies were employed: single peak retrieval, multiple peaks joint retrieval, and isotopic ratio-constrained retrieval. This approach allows for the determination of the column abundance and profiles of CO₂ and water vapor, as well as δD and δ13C. The reported EC-LHR has broad application potential in the fields of anthropogenic gas emission monitoring and water vapor transport research.

How to cite: Shen, F., Wang, J., Li, J., Chen, W., and Tan, T.: Development of a near-infrared external-cavity laser heterodyne radiometer with balanced detection for the measurement of atmospheric water vapor/δD and CO2/δ13C , EGU General Assembly 2026, Vienna, Austria, 3–8 May 2026, EGU26-2182, https://doi.org/10.5194/egusphere-egu26-2182, 2026.

EGU26-2225 | Orals | AS5.6

Refined laser heterodyne spectroscopy technology for precise greenhouse gas monitoring 

guishi wang, zhao chen, hao xiong, nianna fu, kun liu, and xiaoming gao

Carbon dioxide and methane are key greenhouse gases emitted by human activities, accounting for ~75% and ~18% of total greenhouse gases emissions at the global scale. However, current knowledge about the sources and sinks of both gases is still insufficient for reliable climate predictions. Space-based observations (such as GOSAT, OCO-2 and TANSAT), primary means for quantification of the sources and sinks on large scales, suffer from limited precision and sparse observational density. Whilst ground-based observations such as TCCON, equipped with high spectral resolution Fourier transform spectrometer (FTS, Bruker, IFS125HR), provide column-averaged abundances with high precision and accuracy, however the shortfalls (such as large dimensions and high cost of maintenance) limit further expansion of the observing network. Over the last decade, COCCON, which equipped with middle spectral resolution portable FTS (Bruker, EM27/SUN), has proven to be a promising complement to the ground-based observations. With the objective to develop a portable instrument maintained with high spectral resolution, a refined laser heterodyne radiometer (LHR) for precise remote sensing of greenhouse gases will be presented.

How to cite: wang, G., chen, Z., xiong, H., fu, N., liu, K., and gao, X.: Refined laser heterodyne spectroscopy technology for precise greenhouse gas monitoring, EGU General Assembly 2026, Vienna, Austria, 3–8 May 2026, EGU26-2225, https://doi.org/10.5194/egusphere-egu26-2225, 2026.

To address the limitations of conventional off-axis cavity-enhanced absorption spectroscopy (OA-CEAS) operated in a one-way transmission configuration-such as the low utilization efficiency of the optical integrated cavity and the difficulty in achieving simultaneous multi-species detection-an OA-CEAS system with an opposite two-way coupled detection configuration is proposed in this work. Ray-tracing simulations using TracePro and optical field analysis based on MATLAB were employed to optimize and determine key system parameters, including the cavity mirror spacing, incident aperture position, incident angle, as well as the position, radius of curvature, and relative orientation of the re-injection mirror. Based on these optimizations, a high-precision OA-CEAS optical integrated cavity with an opposite two-way configuration was constructed. Furthermore, by integrating frequency-division multiplexing (FDM)–assisted wavelength modulation spectroscopy (WMS), the output beams of four tunable diode lasers with center wavelengths of 1.567 µm, 1.571 µm, 1.620 µm, and 1.653 µm were coupled into a single optical integrated cavity. Simultaneous detection of CO, CO2, C2H4, and CH4 was achieved by extracting the second-harmonic (2f) signals of the corresponding absorption transitions.

In addition, comparative analysis with the conventional one-way OA-CEAS configuration demonstrates that the concave mirror used for reflecting and focusing the detected beam can also act as a re-injection mirror, effectively promoting light re-entry into the cavity and significantly enhancing the intracavity optical power. As a result, both the signal amplitude and the signal-to-noise ratio are improved by approximately a factor of 1.5, leading to enhanced detection sensitivity. This work highlights a new strategy for simultaneous multi-species detection using multiple lasers in a single optical integrated cavity, which improves cavity utilization efficiency, reduces system cost, and broadens the application prospects of OA-CEAS for complex gas mixture sensing.

How to cite: Cai, T. and Gao, G.: Simultaneous Multi-Species Detection Based on an Opposite Two-Way Off-Axis Cavity-Enhanced Absorption Spectroscopy , EGU General Assembly 2026, Vienna, Austria, 3–8 May 2026, EGU26-2479, https://doi.org/10.5194/egusphere-egu26-2479, 2026.

EGU26-3058 | Posters on site | AS5.6

Development of a frequency-stabilized cavity ring-down spectrometer for direct measurement of HO2 radicals 

Weixiong Zhao, Nuo Chen, Yaoshuai Li, Bo Fang, Weijun Zhang, and Weidong Chen

The hydroperoxyl radicals (HO2) play a crucial role in atmospheric chemistry. Direct in-situ measurement of HO2 concentration using laser spectroscopy has always been a challenge, requiring very high detection sensitivity. In this presentation, we report the development of a frequency-stabilized cavity ring-down spectrometer (FS-CRDS) for the direct measurement of HO2 concentration. The optical cavity of the spectrometer was made of perfluoroalkoxy (PFA) tube with an inner diameter of 9 mm. The distance between the two high reflectivity mirrors (double coated, with reflectivity R = 95% at λ = 632 nm and R = 99.998% at λ = 1506 nm) was about 51.4 cm, with one of the cavity mirrors mounted on a piezo-electric transducer (PZT). A stable red He-Ne laser with a frequency stability of ±2 MHz was used as the reference laser for the cavity length stabilization servo. A 1506 nm fiber laser was used as the probe laser. The probe laser beam was split into two beams: one beam was used to lock the probe laser to the stable cavity using Pound-Drever-Hall (PDH) locking method; the other beam passed sequentially through an acousto-optic modulator (AOM) and a fiber electro-optic modulator (EOM) for cavity ring down spectroscopy (CRDS) measurement. By tuning the frequency of the microwave source drive of the EOM, and using a frequency-agile, rapid scanning spectroscopy method, the laser sidebands were sequentially switched to different optical cavity models, thereby achieving rapid full-spectrum scanning. With a 1 s integration time, the spectrometer achieved a detection sensitivity of about 2.6×10⁻¹¹ cm-1, which was about 12 times improved compared with normal CRDS system without electronic locking. The corresponding detection limit for HO2 radicals was about 1.2×10⁸ molecule/cm3 (the absorption line for HO2 detection was located at 6638.207 cm-1, with a line strength of 7.09 × 10⁻²¹ cm-1/(molecule cm-2)). This work demonstrates that FS-CRDS is a feasible technique for high sensitivity direct measurement of HO2 radicals. Further improvements will be made in the future to enhance detection sensitivity.

How to cite: Zhao, W., Chen, N., Li, Y., Fang, B., Zhang, W., and Chen, W.: Development of a frequency-stabilized cavity ring-down spectrometer for direct measurement of HO2 radicals, EGU General Assembly 2026, Vienna, Austria, 3–8 May 2026, EGU26-3058, https://doi.org/10.5194/egusphere-egu26-3058, 2026.

EGU26-3214 | Orals | AS5.6

Highly sensitive detection of atmospheric HONO using mid-infrared spectroscopy combined with deep learning 

Xiaojuan Cui, Shuaikang Yin, Qizhi Zhu, Yutao Fang, Jing Wang, and Dunjun Li

Gaseous nitrous acid (HONO) is an important source of hydroxyl radicals (OH) in the atmosphere, significantly influencing atmospheric oxidation capacity and the formation of secondary pollution. However, its extremely low environmental concentration, combined with considerable spatial and temporal variations, presents challenges for high-precision monitoring. This study employs a quantum cascade laser (QCL) with a central wavelength of 1280 cm-1, utilizing highly sensitive Tunable Laser Absorption Spectroscopy (TLAS) and Cavity Ring-Down Spectroscopy (CRDS) techniques to measure HONO. Initially, high-precision calibration measurements were conducted on the HONO absorption lines within this wavelength range. Subsequently, the acquired spectral line data were used to carry out highly sensitive measurements and noise reduction on the HONO spectral lines, employing CRDS technology alongside time convolutional neural networks. The findings of this study indicate that mid-infrared spectroscopy, in combination with deep learning analysis, provides an efficient and reliable new technological approach for real-time, high-precision monitoring of atmospheric trace HONO.

How to cite: Cui, X., Yin, S., Zhu, Q., Fang, Y., Wang, J., and Li, D.: Highly sensitive detection of atmospheric HONO using mid-infrared spectroscopy combined with deep learning, EGU General Assembly 2026, Vienna, Austria, 3–8 May 2026, EGU26-3214, https://doi.org/10.5194/egusphere-egu26-3214, 2026.

Due to their high versatility, spheroids are commonly employed to model optical properties of mineral dust. However, they are usually considered to be of limited use when studying multispectral depolarisation ratios of mineral dust. An earlier study, in which a spheroidal model was fitted against measurements of the linear depolarisation ratio in near-backscattering direction from 131 dust samples [1], served as a starting point for single scattering calculations using the T-matrix method.

Calculations were performed for different log-normal size distributions at wavelengths of 355nm, 532nm, 1064nm, and 910.6nm. The former three wavelengths are commonly used in lidar remote sensing, while the fourth wavelengths is used in depolarisation-capable ceilometers. In addition, aspect ratios between 0.5 and 2.0 with linearly equidistant steps of 0.01 were considered. Multiple aspect ratios were identified, which yield the linear depolarisation ratios in backscattering direction at 355nm, 532nm, 1064nm consistent with reported lidar field observations and laboratory experiments.

When additionally considering ceilometer observations of dust plumes over the tropical Atlantic during February and March 2025 at a wavelength of 910.6nm, the number of aspect ratios yielding observationally consistent depolarisation ratios is reduced. These aspect ratios encompass both prolate and oblate spheroids. One of these aspects ratios (ε=1.46) corresponds to the median aspect ratio obtained from earlier electron microscopy analysis of freshly emitted dust in the Moroccan Sahara [2].


[1] M. Kahnert, F. Kanngießer, E. Järvinen, and M. Schnaiter, “Aerosol-optics model for the backscatter depolarisation ratio of mineral dust particles,” J. Quant. Spectrosc. Radiat. Transf. 254, 107177 (2020).

[2] A. Panta, K. Kandler, A. Alastuey, C. González-Flórez, A. González-Romero, M. Klose, X. Querol, C. Reche, J. Yus-Díez, and C. Pérez García-Pando, “Insights into the single-particle composition, size, mixing state, and aspect ratio of freshly emitted mineral dust from field measurements in the Moroccan Sahara using electron microscopy,” Atmos. Chem. Phys. 23, 3861–3885 (2023).

How to cite: Kanngiesser, F.: Calculating observationally consistent multi-spectral dust depolarisation ratios with spheroids, EGU General Assembly 2026, Vienna, Austria, 3–8 May 2026, EGU26-3522, https://doi.org/10.5194/egusphere-egu26-3522, 2026.

Mid-infrared time-resolved spectroscopy with high sensitivity and spectral resolution offers powerful opportunities to investigate transient light–matter interactions, as well as probing short-lived free radicals and unstable reaction intermediates. Dual-comb spectroscopy, as an emerging Fourier transform spectroscopic technique based on two frequency combs with slightly different repetition rates, enables rapid, broadband, and high-resolution spectral measurements. Here, a new approach to time-resolved infrared laser spectroscopy based on dual-comb interferometry will be presented. In addition to introducing the unique capabilities of time-resolved dual-comb spectrometers [1–3], applications including precision measurements of line strengths of important atmospheric radicals, as well as accurate determinations of reaction rate coefficients for key atmospheric chemical reactions, will be reported [4–7].

[1] P.-L. Luo and E.-C. Horng, Commun. Chem., 3, 95 (2020). [2] P-L. Luo, Opt. Lett., 45, 6791 (2020). [3] P.-L. Luo and I-Y. Chen, Anal. Chem. 94, 5752 (2022). [4] C.-W. Chang, I-Y. Chen, C. Fittschen, and P.-L. Luo, J. Chem. Phys., 159, 184203 (2023). [5] I-Y. Chen, C.-W. Chang, C. Fittschen, and P.-L. Luo, J. Phys. Chem. Lett., 15, 3733 (2024). [6] C.-W. Chang, I-Y. Chen, and P.-L. Luo, J. Chem. Phys., 162, 034302 (2025). [7] I-Y. Chen, C.-W. Chang, Q.-R. Huang, J.-L. Kuo, and P.-L. Luo, Phys. Chem. Chem. Phys., 27, 16123 (2025).

How to cite: Luo, P.-L.: Applications of Time-Resolved Mid-Infrared Dual-Comb Spectroscopy in Chemical Physics and Atmospheric Chemistry, EGU General Assembly 2026, Vienna, Austria, 3–8 May 2026, EGU26-3964, https://doi.org/10.5194/egusphere-egu26-3964, 2026.

Atmospheric aerosol particles, both organic and inorganic, play a critical role in driving climate change and pose significant risks to human health. Among the major sources of these particles are biomass burning and combustion processes, which release inorganic carbonaceous aerosols (IC) such as black carbon (BC), carbon nanotubes (CNT), and graphite. Despite their environmental and health impacts, the physicochemical properties of IC aerosols remain poorly understood, hindering accurate assessments of their effects on Earth’s radiative balance and public health. In this study, we introduce a novel approach for the in-situ, real-time quantitative analysis of IC aerosols, including their 3D size, shape, phase, and surface properties, along with 4D tracking. This is achieved using an advanced Nano-digital in-line holography microscope (AI-Nano-DIHM) in both air and water environments, under both stationary and dynamic conditions. This study highlights the potential of AI-Nano-DIHM as a cost-effective, rapid, and precise tool for real-time characterization of IC aerosols, offering significant advancements for environmental monitoring and health-related research.

How to cite: Nasreddine, Z., Pal, D., and Ariya, P.: Innovative AI-Driven Approach for Real-Time 4D Tracking and Physicochemical Analysis of Inorganic Carbonaceous Aerosols in Air and Water, EGU General Assembly 2026, Vienna, Austria, 3–8 May 2026, EGU26-4105, https://doi.org/10.5194/egusphere-egu26-4105, 2026.

EGU26-4560 | Orals | AS5.6

Cavity enhanced absorption spectroscopy for high precision measurement of greenhouse gases 

Kun Liu, Weidong Chen, and Xiaoming Gao

Greenhouse gases (GHGs) emissions from human activities provided the majority contribution towards global warming, which make our world is now warming faster than at any point in recorded history. High precision measurement of GHGs are very important for monitoring or scientific studies. Here, laser absorption spectroscopy, especially, high sensitivity optical cavity enhanced absorption spectroscopy techniques and instruments for measurement of greenhouse gases were developed. High precision of 0.25 ppm and 2ppb was achieved for measurement of CO2 and CH4, by employing off-axis integrated cavity output spectroscopy technique. Using multi-pass cell based mid-infrared absorption spectroscopy, a precision of 0.1 ppb was achieved for N2O measurement. Results of the developed instruments for applications in GHGs measurements will be presented.

How to cite: Liu, K., Chen, W., and Gao, X.: Cavity enhanced absorption spectroscopy for high precision measurement of greenhouse gases, EGU General Assembly 2026, Vienna, Austria, 3–8 May 2026, EGU26-4560, https://doi.org/10.5194/egusphere-egu26-4560, 2026.

Correspondence: Min Qin (mqin@aiofm.ac.cn)

Organic nitrates (ONs), including peroxy nitrates (PNs, RO2NO2) and alkyl nitrates (ANs, RONO2), are significant nitrogen-containing organic compounds in the atmosphere. ONs are primarily produced by the reaction of volatile organic compounds (VOCs) and atmospheric oxidants (OH radical, NO3 radical and O3) in the presence of nitrogen oxides (NOx = NO + NO2). The generation and removal of ONs play a critical role in atmospheric nitrogen cycling, secondary organic aerosol (SOA) formation and climate change. The thermal dissociation (TD) method is widely employed for quantifying total PNs (ΣPNs) and total ANs (ΣANs). It indirectly measures ΣPNs and ΣANs by selectively converting them into nitrogen dioxide (NO2) through TD inlets maintained at specific temperatures, followed by NO2 detection. However, the accuracy of TD method can be compromised by secondary chemical reactions between TD-generated radicals (e.g., RO2, RO) and other atmospheric components such as NOx. This study presents a dual-channel thermal dissociation-broadband cavity-enhanced absorption spectroscopy (TD-BBCEAS) system designed for the measurement of ΣPNs and ΣANs. Two TD inlets set at 180°C (decomposing ΣPNs to NO2 + RO2 radicals) and 360°C (decomposing ΣANs to NO2 + RO radicals), achieving > 99% TD efficiency while ensuring effective separation between ΣPNs and ΣANs. The NO2 was measured by BBCEAS within the 435 - 455 nm. Potential interferences were systematically evaluated through laboratory experiments and numerical simulations. To suppress interference from NO oxidation, O3 was introduced to convert all NO to NO2, enabling precise measurement of total NOx. The quantification of ΣPNs and ΣANs was then based on the differential NOₓ (ΔNOx) between specific inlets. Additionally, the addition of quartz wool enhanced the effective collision and consumption of RO2/RO radicals within the inlet, thereby preventing the recombination of TD products. Laboratory mixed-gas experiments confirmed stable ΣPNs/ΣANs responses under variable NOₓ levels, validating effective interference suppression. Field observations in Hefei showed excellent agreement (R2 = 0.92) between the sum of ΣPNs, ΣANs, and NOx measured by TD-BBCEAS and total reactive nitrogen (NOy) from a commercial analyzer, accounting for 96% of NOy. This result further validates the feasibility of measuring ΣPNs and ΣANs.


Acknowledgments: This work was supported by the National Natural Science Foundation of China (Grant No. 42175151), the National Key Research & Development Program of China (No.2022YFC3701100) and the Anhui Major Provincial Science & Technology Project (No.202203a07020003).


How to cite: Qin, M., Shao, D., Fang, W., Han, B., Xie, J., and Zhao, X.: Quantification of total peroxy nitrates (ΣPNs) and total alkyl nitrates (ΣANs) by a dual channel thermal dissociation broadband cavity-enhanced absorption spectroscopy (TD-BBCEAS), EGU General Assembly 2026, Vienna, Austria, 3–8 May 2026, EGU26-5094, https://doi.org/10.5194/egusphere-egu26-5094, 2026.

EGU26-5242 | ECS | Posters on site | AS5.6

Development and testing of a fluorescence-based UAV-mountable sensor for PBAP monitoring in the lower troposphere 

Matthäus Rupprecht, Florian Wieland, Peter J. Wlasits, Philipp Sterlich, Gerhard Peller, and Hinrich Grothe

Primary Biological Aerosol Particles (PBAPs) are ubiquitous in Earth’s atmosphere and have been repeatedly shown to affect human health in adverse ways as allergens or disease vectors. Their role in heterogenous freezing is also attracting increasing interest and many PBAPs are regarded as Ice Nucleating Particles (INPs) This makes PBAPs a crucial factor for Earth’s Climate. These phenomena emphasise the importance of spatially resolved information on PBAP concentrations. Current instruments use UV fluorescence spectroscopy to study PBAPs in ambient air samples, however the size and weight of these instruments limit this technique to ground- or plane-based measurements, leaving a blind spot to the lower troposphere. This highlights the need for miniaturised, UAV-mountable fluorescence spectrometers that can provide spatially resolved PBAP data from low altitudes.

To address this demand, a 3D-printed fluorescence chamber was developed and successfully tested under laboratory conditions. Due to its compact, lightweight and adaptable nature, it can be operated under UAV conditions. This was then coupled with an optical particle counter and expanded to include a wide range of different on- and offline instruments, to form a modular UAV-mountable measurement system capable of monitoring fluorescence information, particle size and mass distributions and a variety of meteorological data.

This setup was successfully used during a multi-day field campaign in Steinalpl, Styria, Austria in summer 2025. During the campaign the setup was flown consistently over an area consisting of meadows and a spruce forest suffering from heavy bark beetle infestation. The novel fluorescence spectrometer proved reliable, producing data on every flight without interruption. Preliminary results show that terrain changes can clearly be observed in the fluorescence data and that it shows correlation to other instruments from the setup, which underlines the quality of the data produced and demonstrates that the developed lightweight UAV-mountable spectrometer is an important step towards online monitoring of PBAPs in the lower troposphere.

How to cite: Rupprecht, M., Wieland, F., Wlasits, P. J., Sterlich, P., Peller, G., and Grothe, H.: Development and testing of a fluorescence-based UAV-mountable sensor for PBAP monitoring in the lower troposphere, EGU General Assembly 2026, Vienna, Austria, 3–8 May 2026, EGU26-5242, https://doi.org/10.5194/egusphere-egu26-5242, 2026.

EGU26-5300 | ECS | Posters on site | AS5.6

THz frequency comb high-resolution heterodyne detection coupled with fast Fourier spectrometer 

Ardhendu Pal, Fabien Simon, Francis Hindle, and Gaël Mouret

Terahertz (THz) frequency combs (THz-FCs) offer a new powerful route to high-resolution molecular spectroscopy, providing both a broad spectral coverage and inherently excellent frequency metrology and referencing. In this work, we demonstrate a THz spectroscopic system that exploits these advantages by combining a femtosecond-laser-based THz-FC with heterodyne detection coupled with a fast Fourier transform spectrometer (XFFTS) [1]. This configuration enables the rapid and simultaneous acquisition of more than 80 comb modes spanning a 7.5 GHz bandwidth. A complete spectrum can be recorded in under 12 minutes, achieving a uniform spectral resolution of 76 kHz, determined primarily by the native channel spacing of the XFFTS.

The setup addresses a fundamental challenge in THz spectroscopy, the inherent compromise between achieving high spectral resolution and maintaining large measurement bandwidth. By leveraging multiple, coherently spaced FC modes, our approach demonstrates that simultaneous multi-mode detection is a realistic and efficient solution. The current resolution and bandwidth are limited by the XFFTS baseband (0–2.5 GHz). This range can be extended by exploiting the second Nyquist band or by integrating multiple XFFTS units to increase instantaneous coverage without added acquisition time. The IF (intermediate frequency) bandwidth will ultimately be constrained by the heterodyne mixer, which has an electrical bandwidth up to 40 GHz so could allow an instantaneous spectral bandwidth of up to 80 GHz to be measured. With emerging new generation FFT spectrometers [2].

Our results highlight the significant potential of THz-FC-based spectroscopy for accelerating high-resolution molecular investigations. This approach provides the means to acquire detailed, accurate spectra at unprecedented speeds, enabling advanced studies in molecular physics, atmospheric science, and chemical analysis, including mixture identification and quantitative spectroscopy. The demonstrated system represents a promising step toward versatile, high-precision THz spectrometry for a wide range of scientific and technological applications.


Acknowledgments

The authors would also like to acknowledge the financial support of the French Agence Nationale de la Recherche via TIGER (ANR-21-CE30-0048) and HEROES (ANR-16-CE30 0020). Ardhendu Pal would like to acknowledge CPER WAVETECH PROGRAMME for his Postdoctoral Fellowship.

References

[1] F. Hindle, A. Khabbaz, A. Roucou, F.J. Lampin and G. Mouret 2025. Terahertz Frequency Comb High-Resolution Heterodyne Spectrometer. IEEE Transactions on Terahertz Science and Technology.

[2] www.mpifr-bonn.mpg.de/7081687/qffts4g

How to cite: Pal, A., Simon, F., Hindle, F., and Mouret, G.: THz frequency comb high-resolution heterodyne detection coupled with fast Fourier spectrometer, EGU General Assembly 2026, Vienna, Austria, 3–8 May 2026, EGU26-5300, https://doi.org/10.5194/egusphere-egu26-5300, 2026.

Nitrogen dioxide (NO2) is a major air pollutant and strongly associated with vehicle emissions.  At present, there are no fast and low-cost instruments suited to mobile measurements or measurements at roadside sites. In this work, we describe a low-cost Cavity-Enhanced Absorption Spectrometer (CEAS) system for portable, in-situ measurements of NO2 in urban environments. A blue LED centred at 440 nm was used as a light source with a 12 cm optical cavity, and transmitted light was detected with a silicon photomultiplier.  Sensitivity to NO2 at low ppb levels (3 ppb) was achieved at the instrument time resolution of 5 s. We discuss the application of the instrument to both stationary and mobile monitoring applications and present early work towards developing a backpack-mounted instrument.

How to cite: Dorney, C. W.: Development of a portable CEAS sensor for fast, inexpensive measurements of nitrogen dioxide in urban environments, EGU General Assembly 2026, Vienna, Austria, 3–8 May 2026, EGU26-7972, https://doi.org/10.5194/egusphere-egu26-7972, 2026.

EGU26-7989 | ECS | Posters on site | AS5.6

Remote sensing of nitrogen dioxide across Cork city using a Low- Cost Long Path DOAS system 

Rohit Vikas, Meng Wang, Conor W Dorney, and Dean S Venables

Differential Optical Absorption Spectroscopy (DOAS) is a long-standing remote sensing technique used to measure many absorbing trace gases. To attain the necessary sensitivity to weak absorptions from trace gases, conventional DOAS systems normally have kilometre- long path lengths and large telescopes to maximise the collected light. Such systems are expensive and largely limited to research applications. The work describes a low – cost, long path DOAS system with a 1.5 km path length in Cork city, Ireland specifically to measure nitrogen dioxide (NO2) for air quality monitoring. The system consists of a temperature-stabilised 0.8 W blue LED (peak wavelength at 435 nm), 5 cm diameter transmitting and receiving telescopes and a compact spectrometer. A band pass filter (420 nm – 460 nm) is used to eliminate stray light. The system is much smaller than conventional DOAS configurations and is relatively straightforward to assemble. The outlook for using long path DOAS as an affordable approach to monitor the contribution to NO2 to urban air quality is discussed.

How to cite: Vikas, R., Wang, M., Dorney, C. W., and Venables, D. S.: Remote sensing of nitrogen dioxide across Cork city using a Low- Cost Long Path DOAS system, EGU General Assembly 2026, Vienna, Austria, 3–8 May 2026, EGU26-7989, https://doi.org/10.5194/egusphere-egu26-7989, 2026.

Ammonia (NH₃) is the most abundant alkaline gas in the atmosphere and plays a significant role in secondary aerosol formation and nitrogen cycling, influencing regional air quality and ecosystem nitrogen deposition. Agricultural activities are the dominant sources of atmospheric NH₃. However, accurate quantification of NH₃ emissions from animal enclosures remains challenging owing to the high humidity, elevated particulate loading, and wide range of NH₃ concentrations in these settings.

In this study, we present an open-path deep-ultraviolet optical absorption spectroscopy system for in situ NH₃ measurements. The instrument measures absorption spectra from 199 to 213 nm, a region in which NH₃ exhibits intense and highly structured absorption features that enable selective and sensitive detection. The entire system is powered by a portable power bank bundle and can operate continuously for over 6 hours. Laboratory characterization experiments demonstrate a detection limit of 74 ppb at a 1 s integration time with an optical path length of 50 cm. Chamber experiments show that the instrument has an excellent dynamic range, exhibiting a robust and linear response to NH₃ from 0.1 to 100 ppm. We demonstrate the application of an early-prototype to monitoring and mapping NH3 in and around animal enclosures. The technique offers new opportunities for improving NH₃ monitoring in animal housing and supports the development of mitigation strategies for agricultural air quality management.

How to cite: Wang, M. and Venables, D.: Open-path deep-ultraviolet absorption spectroscopy for ammonia measurements in animal enclosures, EGU General Assembly 2026, Vienna, Austria, 3–8 May 2026, EGU26-7990, https://doi.org/10.5194/egusphere-egu26-7990, 2026.

EGU26-8501 | ECS | Orals | AS5.6

Development of an amplitude-modulated cavity-enhanced NOx analyzer and its application for flux measurement in a wheat field 

Jiacheng Zhou, Weixiong Zhao, Shichuan Ni, Qianqian Du, Weijun Zhang, and Weidong Chen

Nitrogen oxides (NOx) including nitric oxide (NO) and nitrogen dioxide (NO2), are significant reactive nitrogen compounds in the tropospheric atmosphere. The circulation of NOx and free radicals are coupled and interacted with each other, which has an important influence on atmospheric oxidation capacity and the formation of air pollution. Emissions from agricultural sources are the main source of atmospheric NOx. However, due to the limitations of high-precision measurement method of NOx and its flux measurement technique, the flux intensity of NOx emissions from agricultural sources and their effects on atmospheric oxidation are still unclear.

In this presentation, we will report the latest development of amplitude-modulated cavity-enhanced absorption spectroscopy (AM-CEAS) and its application to NOx flux measurement using eddy covariance (EC) method.

The new AM-CEAS based instrument was operated at 406 nm and TTL-modulated at 5 kHz, using phase-sensitive detection for ultra-sensitive absorption measurement. The detection precisions of the instrument were 78 pptv and 30 pptv, respectively, in 0.1 s and 1 s data acquisition time, for NO2 measurement. Combining with Cavity Ring-Down Spectroscopy (CRDS), the AM-CEAS method can eliminate the calibration process of mirror reflectivity, thus realizing NO2 absolute concentration measurements. Building upon single-channel system, a dual-channel NO2 detector has been developed. It utilizes ozone titration in one channel to convert NO to NO₂, allowing for NOx measurement by calculating the difference between the channels.

Using the NOx analyzer, an EC NOx flux observation system was constructed at a wheat field of Shouxian county, and was used for measuring the atmospheric NOx and its flux intensity in summer when ozone pollution is severe. The performance of the flux observation system was evaluated and the resulting NOx fluxes were also analyzed. Based on the advantages of high sensitivity, and minimal maintenance of AM-CEAS, the flux observation system demonstrated good performance, and provided the potential for investigating NOx flux using the EC method across diverse temporal scales.

How to cite: Zhou, J., Zhao, W., Ni, S., Du, Q., Zhang, W., and Chen, W.: Development of an amplitude-modulated cavity-enhanced NOx analyzer and its application for flux measurement in a wheat field, EGU General Assembly 2026, Vienna, Austria, 3–8 May 2026, EGU26-8501, https://doi.org/10.5194/egusphere-egu26-8501, 2026.

EGU26-9255 | ECS | Orals | AS5.6

Sensitivities of Mineral Dust Optical Properties to Surface Roughness 

Thomas Oppermann, Masanori Saito, and Moritz Haarig

Mineral dust is the most abundant aerosol in the atmosphere and hence has a strong impact on atmospheric processes (i.e., aerosol-cloud and aerosol-radiation interactions). To learn more about the microphysical properties of mineral dust, remote sensing techniques using ground- and spaceborne lidars have been developed. These retrievals typically depend on fundamental assumptions about the shape and composition of the mineral dust particles. Since mineral dust particles are exclusively non-spherical, it is not appropriate to use spherical particles for the optical calculations. In the past, spheroids (Dubovik et al., 2006) and, more recently, the irregular hexahedra ensemble model (Saito et al., 2021) have been used as dust shape models. However, these models still neglect small-scale surface irregularity or surface roughness, an important morphological characteristic of mineral dust, which may lead to biases in retrieved microphysical properties.

We present preliminary results of a new dust morphological model, a roughened irregular hexahedra model. By using the random Fourier method, we add geometric surface roughness to the irregular hexahedra model particles, creating a more realistic-looking particle morphology than previously used models. We study the sensitivity of the optical properties to the degree of surface roughness. In particular, we focus on the impact on the integrated properties (i.e., single scattering albedo and asymmetry parameter), and the backscattering properties (i.e., the extinction-to-backscatter ratio and depolarization ratio), which are highly relevant for active remote sensing, and integrated (single scattering albedo and asymmetry parameter) properties. The new model shows promising results for better explaining lidar measurements. Furthermore, we present our plans for a flexible scattering database for use in remote sensing, radiative transfer, etc., openly available to the community.

O. Dubovik et al., “Application of spheroid models to account for aerosol particle nonsphericity in remote sensing of desert dust,” Journal of Geophysical Research: Atmospheres,2006

M. Saito, et al., “A Comprehensive Database of the Optical Properties of Irregular Aerosol Particles for Radiative Transfer Simulations,”2021

How to cite: Oppermann, T., Saito, M., and Haarig, M.: Sensitivities of Mineral Dust Optical Properties to Surface Roughness, EGU General Assembly 2026, Vienna, Austria, 3–8 May 2026, EGU26-9255, https://doi.org/10.5194/egusphere-egu26-9255, 2026.

EGU26-9600 | ECS | Posters on site | AS5.6

How does the size of crystalline NaCl relate to the depolarization ratio? – First laboratory results compared to model calculations 

Moritz Haarig, Thomas Oppermann, Franz Kanngießer, Esha Semwal, Markus Hartmann, Ronny Engelmann, Dietrich Althausen, Heike Wex, and Masanori Saito

Sodium Chloride (NaCl) is a major component of sea salt in the atmosphere. In remote marine environments, sea salt aerosol dominates the formation of clouds. Under humid conditions often present in marine environments, sea salt exhibits a spherical shape. However, as relative humidity drops below the efflorescence point (around 45% RH), it exhibits a cubic-like shape, which leads to an enhanced depolarization ratio in lidar observations (Haarig et al., 2017). This transition was simulated by Kahnert & Kanngießer (2024), who created irregularly shaped dry sea salt crystals for single scattering calculations using Discrete Dipole Approximation (DDA) and then applied a brine coating to mimic the transition to wet, spherical sea salt particles.

We want to investigate the relation between particle size and the observed particle linear depolarization ratio of crystalline salt (NaCl) particles. For this purpose, we use the Optical Lab for Lidar Applications (OLALA) established for mineral dust research at TROPOS (see EGU 2026 contribution of Semwal et al.). The scattering laboratory is focused on the exact backscattering direction (180±0.2°) required for lidar applications. The NaCl particles are generated from wet dispersion with subsequent drying. A Differential Mobility Analyzer (DMA) ensures almost mono-modal size distributions for fine mode aerosol. Currently, we investigate NaCl particles in the size range of 250 to 800 nm in diameter at a laser wavelength of 532 nm. The extension to 1064 nm and 355 nm laser wavelengths is under construction. An increase in the depolarization ratio was observed with increasing size, reaching the maximum values of 0.16±0.04 for 800 nm dry NaCl particles.

The size-resolved laboratory results are compared to model calculations with perfect cubes and stacked cubes (different realizations) using DDA. Perfect cubes lead to lower depolarization ratios than observed in the laboratory. This finding indicates that the dry NaCl particles are not perfect cubes. Additionally, we intend to apply further particle shape models such as convex polyhedra (Kanngießer & Kahnert, 2021a), Gaussian random cubes (Kahnert & Kanngießer, 2021b) or super ellipsoids (Bi et al., 2018).

At the end, a better representation of cubic sea salt in the atmosphere will be achieved by constraining the optical particle shape models with the size-resolved laboratory results.

References:

Bi, L. et al., Optical Modeling of Sea Salt Aerosols: The Effects of Nonsphericity and Inhomogeneity, JGR, Vol. 123, No. 1, p. 543-558 (2018).

Haarig, M., et al., Dry versus wet marine particle optical properties: RH dependence of depolarization ratio, backscatter, and extinction from multiwavelength lidar measurements during SALTRACE, ACP, Vol. 17, No. 23, p. 14199-14217 (2017).

Kahnert, M.  and Kanngießer, F., Optical Characterization of Marine Aerosols Using a Morphologically Realistic Model with Varying Water Content: Implications for Lidar Applications and Passive Polarimetric Remote Sensing, GRL, Vol. 51, No. 5, p. e2023GL107541 (2024).

Kanngießer, Franz and Kahnert, Michael, Modeling Optical Properties of Non-Cubical Sea-Salt Particles, JGR, Vol. 126, No. 4, p. e2020JD033674 (2021a).

Kanngießer, Franz and Kahnert, Michael, Optical properties of water-coated sea salt model particles, OE, Vol. 29, No. 22, p. 34926-34950 (2021b).


How to cite: Haarig, M., Oppermann, T., Kanngießer, F., Semwal, E., Hartmann, M., Engelmann, R., Althausen, D., Wex, H., and Saito, M.: How does the size of crystalline NaCl relate to the depolarization ratio? – First laboratory results compared to model calculations, EGU General Assembly 2026, Vienna, Austria, 3–8 May 2026, EGU26-9600, https://doi.org/10.5194/egusphere-egu26-9600, 2026.

EGU26-9699 | Posters on site | AS5.6

Development of the broadband cavity-enhanced absorption spectrometer for in situ measurements of BrO 

Jun Duan, Juan Fu, and Pinhua Xie

Correspondence: Pinhua Xie (phxie@aiofm.ac.cn)

Atmospheric halogens, including fluorine (F), chlorine (Cl), bromine (Br), and iodine(I), significantly impact atmospheric chemistry and climate change. Especially BrO plays an important role in the processes of ozone destruction, disturbance of NOx and HOx chemistry, oxidation of dimethyl sulfide (DMS), and the deposition of elementary mercury. BrO can be measured using the Differential Optical Absorption Spectroscopy (DOAS) method owing to their structured absorption cross sections in the UV and visible parts of the spectrum. In the troposphere, BrO has been detected in polar regions, at salt lakes, in volcanic plumes, and in the marine boundary layer using optical remote sensing approaches including MAX-DOAS, LP-DOAS, and satellite observations. This study presents an in-situ measurement instrument for atmospheric BrO detection based on broadband cavity-enhanced absorption spectroscopy (BBCEAS). The instrument utilizes a 340 nm UV LED light source operating within the 333-347 nm spectral range, which encompasses three characteristic BrO absorption bands. Allan deviation analysis for BrO reveals a detection sensitivity of about 1 pptV and a custom-built BrO generation system was developed to characterize sampling losses. The system's field deployment at the salt lake successfully conducted ground-based direct observations of atmospheric reactive halogen species. This field validation demonstrates the instrument's capability for field applications in complex environmental conditions.

Acknowledgements:  This research was funded by the National Natural Science Foundation of China (No. 42175155, 42475141) , the Anhui Provincial Key R&D Program, China (No. 2023t07020016), the Youth Innovation Promotion Association of Chinese Academy of Sciences (No. 2023464), and the CASHIPS Director’s Fund (BJPY2024B10).

How to cite: Duan, J., Fu, J., and Xie, P.: Development of the broadband cavity-enhanced absorption spectrometer for in situ measurements of BrO, EGU General Assembly 2026, Vienna, Austria, 3–8 May 2026, EGU26-9699, https://doi.org/10.5194/egusphere-egu26-9699, 2026.

EGU26-9902 | Orals | AS5.6

Laboratory validation of a compact laser spectrometer for trace-level water vapor measurements  

Simone Brunamonti, Philipp Scheidegger, Tobias Bühlmann, Céline Pascale, Mélanie Ghysels, Harald Saathoff, Lukas Emmenegger, and Béla Tuzson

Accurate measurements of water vapor (H2O) in the upper troposphere-lower stratosphere (UTLS, ~8-25 km altitude) are still very challenging, due to the low abundance of H2O in this region (~5 ppm). The standard method for balloon-borne measurements of UTLS H2O in global monitoring networks (e.g., GRUAN, GCOS reference upper air network) is chilled-mirror hygrometry. However, this technique is currently undergoing a major reconception, with the introduction of Peltier-based instruments as well as alternative cooling agents to the phasing-out fluoroform (HFC-23). Therefore, alternative, high-accuracy methods for in-situ measurements of UTLS H2O are required.

To this aim, we developed ALBATROSS, a lightweight (< 3.5 kg) laser absorption spectrometer for balloon-borne measurements of UTLS H2O [1]. ALBATROSS is based on a continuous-wave (cw) distributed feedback quantum cascade laser (DFB-QCL) emitting at 6.014 μm, and a monolithic segmented circular multipass cell with an optical path length of 6 m and a cell diameter of 10.8 cm. The multipass cell is highly resistant to thermal and mechanical stress, and can be operated either in a closed-path (laboratory) or an open-path (flight) configuration.

The performance of the spectrometer at UTLS-relevant conditions was assessed by a series of laboratory-based validation experiements. These measurements require the generation of reference gases with H2O amount fractions in the low-ppm range (< 5 ppm), and their quantification at low pressures (< 100 mbar). At such conditions, artifacts due to the strong surface adsorption/desorption properties of H2O become critical. These "memory" effects must be minimized by a careful design of the gas handling system and of the experimental procedure. At the same time, to achieve the required accuracy of ~1-2 % (i.e., 50-100 ppb), high-order line shape models, beyond the standard Voigt profile, must be considered for the spectroscopic retrieval.

In this presentation, we focus on the technical challenges and the results achieved in two distinct activities performed with ALBATROSS: an SI-traceable validation, using reference gases generated by a dynamic-gravimetric permeation method [2], and the AquaVIT-4 intercomparison of atmospheric hygrometers, held at the AIDA cloud simulation chamber in Karlsruhe, Germany [3]. Particularly, we highlight the best practices to address surface effects and other artifacts related to the gas handling system, as well as the importance of using an advanced line shape model (namely, the quadratic speed-dependent Voigt profile, qSDVP), and how to empirically obtain the necessary parameters not contained in the HITRAN database. This provides a general blueprint for the validation of a laser spectrometer dealing with a highly adsorbing gas at very low concentrations and pressures, such as H2O at UTLS-relevant conditions, in a laboratory setting.

The instrument is currently deployed in a series of atmospheric test flights within the Swiss H2O-Hub GCOS-project. Overall, the results demonstrate the exceptional potential of mid-IR laser absorption spectroscopy as a new reference method for in situ measurements of UTLS H2O.


[1] Graf et al., Atmos. Meas. Tech., 14, 1365–1378, 2021.

[2] Brunamonti et al., Atmos. Meas. Tech., 16, 4391–4407, 2023.

[3] Brunamonti et al., Atmos. Meas. Tech., 18, 5321–5348, 2025.

How to cite: Brunamonti, S., Scheidegger, P., Bühlmann, T., Pascale, C., Ghysels, M., Saathoff, H., Emmenegger, L., and Tuzson, B.: Laboratory validation of a compact laser spectrometer for trace-level water vapor measurements , EGU General Assembly 2026, Vienna, Austria, 3–8 May 2026, EGU26-9902, https://doi.org/10.5194/egusphere-egu26-9902, 2026.

EGU26-9911 | ECS | Posters on site | AS5.6

A dual-comb spectrometer for open-path measurements of greenhouse gases in comparison with Fourier transform spectroscopy. 

Tobias D. Schmitt, Romain Dubroeucq, Moritz Sindram, Thomas Pfeifer, André Butz, and Markus K. Oberthaler

Path averaged measurements of greenhouse gases (GHG) on the kilometer scale can potentially improve measurement-based estimations of anthropogenic emissions. Path averages are less sensitive to local emission patterns than point-like in-situ measurements. As a result, they could provide more robust information in the face of uncertain prior emission fields, especially if these are highly structured. A typical case are urban areas, which are a major and growing contributor to anthropogenic GHG emissions, but their contribution is also subject to significant uncertainty [1].

Many different techniques are in theory available to perform these path averaged measurements. Between all of them, dual-comb spectroscopy (DCS) comes with a distinct set of features, which make it an ideal tool for the task at hand: high spectral radiance, resulting in high precision, broadband spectral coverage, allowing access to multiple species and a robust spectroscopic evaluation and an extremly high resolution, rendering the spectra basically free of any instrument line function, to name just a few. Additionally, DCS was already demonstrated to be field-deployable [2]. Finally, rapid developments on the commercial availability of DCS systems and their building blocks result in an increased accessibility to this technique, including users without a strong background in Laser Physics and metrology.

Our near-infrared dual comb spectrometer for open-path measurements of greenhouse gases over the city of Heidelberg is centered around two fully stabilized commercially available turn-key frequency combs. We present the results of the first nine months near continuous operation along a 1.55 km long path, including side-by-side measurements with an open-path Fourier transform spectroscopy (FTS) system [3]. With a xCO2 precision of 1 ppm on a one-minute timescale the DCS system proves five times more precise than the FTS, with a clear path to improvement by at least another factor of two. This puts our system at par with previous, fully home build systems of metrology expert groups [4], all achieved in less than a year after the arrival of the lasers, demonstrating the technological maturity.

References:
[1] Federal Environment Agency, "National Inventory Report for the German Greenhouse Gas Inventory 1990 – 2019" UNFCCC Submission (2021)
[2] Nathan Malarich, et al. "Evaluating CO2 and CH4 absorption models with open-path dual-comb spectroscopy at the Mauna Loa Observatory." Journal of Quantitative Spectroscopy and Radiative Transfer (2025): 109567. https://doi.org/10.1016/j.jqsrt.2025.109567
[3] Tobias D. Schmitt, et al. "An open-path observatory for greenhouse gases based on near-infrared Fourier transform spectroscopy" Atmos. Meas. Tech., 16, 6097-6110 (2023) https://doi.org/10.5194/amt-16-6097-2023
[4] Eleanor M. Waxman, et al. " Estimating vehicle carbon dioxide emissions from Boulder, Colorado" Atmos. Chem. Phys., 19, 4177–4192, (2019) https://doi.org/10.5194/acp-19-4177-2019

How to cite: Schmitt, T. D., Dubroeucq, R., Sindram, M., Pfeifer, T., Butz, A., and Oberthaler, M. K.: A dual-comb spectrometer for open-path measurements of greenhouse gases in comparison with Fourier transform spectroscopy., EGU General Assembly 2026, Vienna, Austria, 3–8 May 2026, EGU26-9911, https://doi.org/10.5194/egusphere-egu26-9911, 2026.

EGU26-10558 | ECS | Posters on site | AS5.6

Measurement of Rayleigh scattering cross sections using broadband cavity-enhanced absorption spectroscopy 

Juan Fu, Jun Duan, and Pinhua Xie

Correspondence: Jun Duan(jduan@aiofm.ac.cn) , Pinhua Xie (phxie@aiofm.ac.cn)

Broadband cavity-enhanced absorption spectroscopy (BBCEAS) is a highly sensitive in-situ optical gas detection technique. Leveraging multiple light reflections within an optical resonant cavity, this technique yields an effective absorption path length that significantly exceeds the physical length of the cavity. This enables highly sensitive detection of trace gases, even those with extremely weak absorption characteristics. The Rayleigh scattering cross section serves as the metrological foundation for achieving absolute concentration measurements in high-precision spectroscopic techniques. In this work, we attempted to measure the Rayleigh scattering cross sections of various gases in the ultraviolet-visible spectral range. First, the effective absorption path length of the BBCEAS system was precisely calibrated. By measuring the differences in Rayleigh scattering between various gases (such as argon, carbon dioxide, sulfur hexafluoride, etc.) and helium, the Rayleigh scattering cross sections of the target gases were inversely derived, yielding a high-precision experimental dataset of gas Rayleigh scattering cross sections. In addition, considering the variations in Rayleigh scattering cross sections among different gases, a method for identifying unknown gases was proposed. The extinction coefficient of an unknown gas is measured using BBCEAS and compared with databases of known Rayleigh scattering and absorption cross sections to determine its identity, and this study provides a new approach for the rapid optical measurement of gases with negligible absorption features.

Acknowledgements : This research was funded by the National Natural Science Foundation of China (No. 42175155, 42475141), the Anhui Provincial Key R&D Program, China (No. 2023t07020016), the Youth Innovation Promotion Association of Chinese Academy of Sciences (No. 2023464), and the CASHIPS Director’s Fund (BJPY2024B10).

How to cite: Fu, J., Duan, J., and Xie, P.: Measurement of Rayleigh scattering cross sections using broadband cavity-enhanced absorption spectroscopy, EGU General Assembly 2026, Vienna, Austria, 3–8 May 2026, EGU26-10558, https://doi.org/10.5194/egusphere-egu26-10558, 2026.

EGU26-10631 | ECS | Orals | AS5.6

Development of a Portable Mid-IR Spectrometer for Simultaneous Measurements of Six Trace Gases in the Atmosphere 

Sandra Dorfer, Iskander Gazizov, and Bernhard Lendl

Commercial gas sensing is traditionally performed using Fourier-transform infrared (FTIR) or non-dispersive infrared (NDIR) spectroscopy. Advances in interband cascade laser (ICL) technology now enable the development of compact, affordable, multi-gas laser spectrometers suitable for both industrial and atmospheric monitoring. In this work we present a portable mid-IR absorption spectrometer built around a compact laser module from NanoPlus that integrates three ICLs. The design supports an additional three-laser module, enabling up to six measurement channels and positioning this platform as a practical alternative to conventional instruments for a wide range of applications. 

Figure 1. Custom FPGA-based hardware platform, allowing for simultaneous control of up to six laser diodes.

The instrument is fully controlled by a custom-built, FPGA-based hardware platform responsible for high-speed data acquisition and signal generation (Fig. 1). The electronics provide six high-resolution input and six output channels, all operating at clock rates of up to 50 MHz, enabling precise, low-latency control and measurement of the optical system. An additional modular analog amplifier stage provides flexible signal conditioning for optical detectors and laser drivers. The spectrometer measures 52.5 × 35 × 19.1 cm, weighs 20 kg, and consumes 63 W of electrical power with active heating. An integrated heater stabilizes the optical bench at 32 °C, improving long-term stability. The instrument achieves 1σ precision of 160 ppb for CO2 (40 s), 200 ppt for CH4 (30 s), 180 ppt for CO (60 s), 1 ppb for N2O (60 s), 2.2 ppm for H2O (30 s), and 60 ppb for CS2 (10 s). We quantify the benefits of thermal control and validate concentration retrievals against certified gas mixtures. Field tests include vehicle-mounted mobile survey, a multi-day stationary deployment, and industrial monitoring of hydrogen impurities. Across these applications, the spectrometer demonstrates reliable, calibration-free retrievals of ambient greenhouse gas concentrations at up to 10 Hz refresh rate.

Acknowledgements

This work is part of the “Hydrogen Region East Austria Goes Live (H2REAL)” project and is funded by the Austrian Climate and Energy Fund as part of the “Energy Model Region” program, which is managed by the Österreichische Forschungsförderungsgesellschaft FFG.

How to cite: Dorfer, S., Gazizov, I., and Lendl, B.: Development of a Portable Mid-IR Spectrometer for Simultaneous Measurements of Six Trace Gases in the Atmosphere, EGU General Assembly 2026, Vienna, Austria, 3–8 May 2026, EGU26-10631, https://doi.org/10.5194/egusphere-egu26-10631, 2026.

EGU26-12180 | Posters on site | AS5.6

High precision laser-based N2O isotopologue analyser for environmental applications.   

Akshay Nataraj, Susan Fortson, Khaoula Fdil, and Kyle Owen

Nitrate contamination in water sources is a growing concern, primarily caused by agricultural runoff, animal manure, and wastewater. This pollution leads to severe environmental issues such as lake eutrophication and oceanic dead zones, impacting tourism and fisheries. It also poses significant public health risks due to elevated nitrate levels in drinking water. Stable isotopologues of N₂O (δ15N, δ18O, and δ17O) in nitrates serve as excellent tracers for distinguishing between anthropogenic sources of nitrate pollution. Understanding variations in isotopologue composition enables targeted strategies to mitigate these harmful effects[1],[2].

Conventional methods for isotopologue analysis require chemical conversion of nitrates to refined salts (KNO₃) or N₂O gas, followed by EA-IRMS or GC-IRMS measurements. These techniques are time-consuming, involve toxic chemicals, and, in the case of GC-IRMS, require cryogenic purge-and-trap steps. While IRMS remains the gold standard, its workflow is tedious and only provides limited throughput.

We present an automated, laser-based solution for simultaneous measurement of N₂O isotopologues with high precision and repeatability. The GLA451-N2OI3 spectrometer, based on ABB’s patented Off-Axis Integrated Cavity Output Spectroscopy (OA-ICOS) technology[3], achieves precisions of 0.3 ‰ (δ15N), 0.5 ‰ (δ18O), and 3 ‰ (δ17O) at 2 ppm N₂O with a 300 seconds integration time. OA-ICOS offers excellent long-term stability and a wide linear dynamic range.

A key advantage of the GLA451-N2OI3 is its compatibility with a headspace autosampler; enabling fully automated analysis of N₂O derived from nitrates at high throughput—up to 140 samples in 24 hours. The autosampler uses a 5 mL syringe for up to 15 mL injections (3 × 5 mL). Tests with 10 ppm N₂O demonstrate repeatability of 1.5 ‰ across 36 injections, further improved to <1 ‰ with drift and reference corrections[1].

In this presentation we demonstrate the simplicity, precision and accuracy of ABB’s OA-ICOS technology, offering a robust and user-friendly spectrometer to measure the triple isotopologues of nitrate. Crucially, its unique direct δ17O measurement capability provides the full triple-isotope fingerprint, including Δ17O-excess, which is critical for distinguishing atmospheric nitrate sources.  Collectively, these advancements make the GLA451-N2OI3 an invaluable tool for environmental and analytical scientists, empowering high-resolution monitoring, atmospheric nitrogen research and water quality assessments with unprecedented confidence and efficiency.

References

[1]         L. I. Wassenaar, , et. al, ‘Automated rapid triple-isotope (δ15N, δ18O, δ17O) analyses of nitrate by Ti(III) reduction and N2O laser spectrometry’, Isotopes Environ. Health Stud., vol. 59, no. 3, pp. 297–308, May 2023, doi: 10.1080/10256016.2023.2222222.

[2]         C. W. Kreitler, ‘Determining the source of nitrate in groundwater by nitrogen isotope studies’, 1974, Accessed: Jan. 09, 2026. [Online]. Available: http://hdl.handle.net/2152/65451

[3]         D. S. Baer, et. al, ‘Sensitive absorption measurements in the near-infrared region using off-axis integrated cavity output spectroscopy’, vol. 4817.

How to cite: Nataraj, A., Fortson, S., Fdil, K., and Owen, K.: High precision laser-based N2O isotopologue analyser for environmental applications.  , EGU General Assembly 2026, Vienna, Austria, 3–8 May 2026, EGU26-12180, https://doi.org/10.5194/egusphere-egu26-12180, 2026.

EGU26-14458 | ECS | Posters on site | AS5.6

A terahertz cavity for accurate spectroscopic measurements of atmospheric species 

Fabien Simon, Ardhendu Pal, Arnaud Cuisset, Francis Hindle, Gaël Mouret, Michael Rey, Vincent Boudon, and Cyril Richard

Terahertz (THz) spectroscopy can distinguish polar molecules in gas mixtures thanks to the narrow and intense transitions specific to this band. Thus, rotational transitions of many atmospheric species can be accurately measured. CF4, the most abundant perfluorocarbon in the atmosphere, is a highly stable greenhouse gas, with an atmospheric lifetime of 50,000 years and a warming potential much greater than that of CO2. Accurate quantification of CF4 is essential for understanding its contribution to the radiative forcing budget. However, this molecule has a very weak dipolar moment induced by centrifugal distortion, which makes its spectroscopic study challenging in the THz domain.

Here, we present the specific features of an ultrasensitive, high-finesse cavity spectrometer that enables both Cavity Enhanced Absorption Spectroscopy (CEAS) and Cavity Ring-Down Spectroscopy (CRDS) measurements. This setup has enabled highly resolved spectra of the weak transitions of CF4. More than 50 pure rotational ν3 − ν3 lines have been measured, yielding both position and intensity data with unequalled precision. CRDS enabled the absolute intensities, used in the global fit, to be determined. Finally, the updated TFMeCaSDa database is available for future spectroscopic and monitoring activities.

Further challenging work is underway with GeH4, a compound primarily used for manufacturing high-performance integrated circuits in the semiconductor industry. CEAS measurements of some transitions with very low intensities are presented here. Spectroscopic analysis is ongoing.

How to cite: Simon, F., Pal, A., Cuisset, A., Hindle, F., Mouret, G., Rey, M., Boudon, V., and Richard, C.: A terahertz cavity for accurate spectroscopic measurements of atmospheric species, EGU General Assembly 2026, Vienna, Austria, 3–8 May 2026, EGU26-14458, https://doi.org/10.5194/egusphere-egu26-14458, 2026.

EGU26-15054 | ECS | Posters on site | AS5.6

Long-range, open path CO2 measurements using tunable diode laser absorption spectroscopy: analytical, numerical, and experimental comparison 

Ahmad Assarenayati, Sheng Ye, Alexia Kotlarov, Mark Wenig, Christoph Haisch, Stefan Schmitt, Jan Poppe, Benjamin Doepke, and Folkard Wittrock


Tunable Diode Laser Absorption Spectroscopy (TDLAS) is a well-established technique for sensitive gas detection based on wavelength-selective absorption. In recent years, it has gained increasing relevance for long-range atmospheric measurements of greenhouse gases such as CO2. This work presents an analytical, numerical, and experimental investigation of wavelength-modulated TDLAS applied to long open-path CO2 sensing over kilometer-scale distances.

A distributed feedback diode laser is sinusoidally modulated in injection current to generate a periodic wavelength sweep across a selected CO2 absorption line. The transmitted signal, strongly attenuated after propagation over approximately 2 km, is detected and demodulated using phase-sensitive lock-in amplification to extract the first, second, and third harmonic components (1f, 2f, and 3f). This approach enables the reliable retrieval of extremely weak absorption signals under low signal-to-noise conditions. Harmonic amplitude ratios, particularly 2f/1f and 3f/1f, are analyzed as functions of the CO2 mixing ratio under controlled laboratory conditions.

To interpret the measured harmonic signals, an analytical formulation based on the Beer–Lambert law and a parameterized description of laser wavelength tuning and optical power modulation is developed, and it is compared with numerical simulations and experimental results. We demonstrate that at elevated CO2 concentrations, the commonly used 2f/1f ratio exhibits saturation, while higher-order ratios, such as 3f/1f, retain sensitivity and provide improved robustness for long-range measurements.

Furthermore, we illustrate that even small offsets between the modulation center and the absorption line center introduce systematic odd–even harmonic mixing, increase temperature sensitivity, and compromise the stability of harmonic-based retrievals. The combined analytical, numerical, and experimental analysis provides practical guidance for optimizing wavelength-modulated TDLAS systems that employ lock-in detection for long-range atmospheric CO2 monitoring.

How to cite: Assarenayati, A., Ye, S., Kotlarov, A., Wenig, M., Haisch, C., Schmitt, S., Poppe, J., Doepke, B., and Wittrock, F.: Long-range, open path CO2 measurements using tunable diode laser absorption spectroscopy: analytical, numerical, and experimental comparison, EGU General Assembly 2026, Vienna, Austria, 3–8 May 2026, EGU26-15054, https://doi.org/10.5194/egusphere-egu26-15054, 2026.

EGU26-15145 | Orals | AS5.6

Water as a Window: Application-Driven Design of Infrared Laser Spectrometers 

Scott Herndon, Elizabeth Lunny, Christoph Dyroff, Tara Yacovitch, Conner Daube, Joanne Shorter, Rick Wehr, John Budney, Rob Roscioli, and David Nelson

We present two infrared laser spectroscopic instrument developments that illustrate how optimized measurements of H₂O enable advanced atmospheric sensing across very different operating regimes. In both cases, instrument performance is driven by careful selection of absorption lines, infrared optical design, and measurement strategies tailored to the specific application.

The first instrument is an airborne water vapor probe designed for the low-H₂O regime relevant to persistent aviation contrail cirrus. The second application employs a more sensitive mid-infrared measurement scheme, coupled to a novel sampling manifold, to measure molecular hydrogen - after catalytic conversion to H₂O - with high speed and sensitivity. Both instruments are based on tunable infrared laser direct absorption spectroscopy (TILDAS), scanning isolated H₂O absorption lines near 7205 cm⁻¹ (1.39 µm) and 1558 cm⁻¹ (6.4 µm), respectively.

This presentation will discuss the design details of these two very different instruments, as well as the application-driven requirements that informed their hardware architectures. A comprehensive set of comparison and validation results will be presented for the system developed for contrail avoidance. For the second application, hydrogen spectrometer performance and a range of deployment scenarios will be discussed, including the novel CLAIR-H₂ system for localization and quantification of hydrogen emissions using tracer release and atmospheric inversion.

Together, these examples demonstrate the flexibility of infrared laser spectroscopic instrumentation for enabling both aviation-relevant water vapor measurements and emerging atmospheric hydrogen observations.

How to cite: Herndon, S., Lunny, E., Dyroff, C., Yacovitch, T., Daube, C., Shorter, J., Wehr, R., Budney, J., Roscioli, R., and Nelson, D.: Water as a Window: Application-Driven Design of Infrared Laser Spectrometers, EGU General Assembly 2026, Vienna, Austria, 3–8 May 2026, EGU26-15145, https://doi.org/10.5194/egusphere-egu26-15145, 2026.

EGU26-15479 | Posters on site | AS5.6

A Quasi-Synchronous Background Detection Laser Heterodyne Radiometer for Atmospheric Water Vapor Measurements 

Zhensong Cao, Yuan Meng, Jun Huang, Xingji Lu, and Yinbo Huang

We present a laser heterodyne radiometer (LHR) featuring a quasi-synchronous background detection scheme for column-integrated atmospheric water vapor measurements. The proposed scheme effectively suppresses relative background drift to within 0.8%, significantly enhancing measurement stability. The instrument achieves a high spectral resolution of 0.004 cm⁻¹ with a rapid acquisition time of 25 s per heterodyne spectrum. Field experiments were conducted in August 2024 in the Ali region of the Tibetan Plateau. Continuous observations on August 14 demonstrated stable retrievals of atmospheric H₂O column concentrations with a relative uncertainty of 1.37%. Additional measurements performed on August 16 and August 21 yielded relative uncertainties of 1.16% and 2.79%, respectively, confirming the repeatability and robustness of the system under varying atmospheric conditions.  Simultaneous measurements using a Fourier transform spectrometer (Bruker EM27/SUN) showed consistent temporal variability, with a correlation coefficient of 0.77. These results indicate that the developed LHR combines fast acquisition speed, high spectral resolution, and reliable precision, making it a promising instrument for long-term and stable atmospheric water vapor monitoring, particularly in remote and high-altitude regions.

How to cite: Cao, Z., Meng, Y., Huang, J., Lu, X., and Huang, Y.: A Quasi-Synchronous Background Detection Laser Heterodyne Radiometer for Atmospheric Water Vapor Measurements, EGU General Assembly 2026, Vienna, Austria, 3–8 May 2026, EGU26-15479, https://doi.org/10.5194/egusphere-egu26-15479, 2026.

EGU26-16048 | ECS | Posters on site | AS5.6

Influence of Ice Crystal Morphology on Simulated Longwave Infrared Polarized Radiance of Ice Clouds 

Edgardo I. Sepúlveda Araya, Sylvia Sullivan, Feng Xu, Dong Wu, Jie Gong, and Meredith Kupinski

Ice clouds are a key component in the atmospheric system because of their influence on atmospheric circulation and precipitation. However, studying ice cloud microphysical processes and radiative impact remains a challenge, in part because ice crystal non-sphericity is not well-represented in models. Remote sensing retrievals can help constrain and characterize the ice crystal complexity within high clouds, through measurements of polarized radiance. Although both previous and current satellite instruments have used polarization measurements to achieve this goal, their spectral ranges have been limited to the shortwave (SW) (e.g., POLDER, CALIPSO, and HARP2) or microwave (e.g., GPM-GMI) ranges. Polarization has not previously been remotely sensed in the longwave infrared (LWIR) spectral range, where ice clouds exhibit strong signatures from both emission and scattering.

Development of the CHanneled Infrared Polarimeter (CHIRP) instrument aims to characterize LWIR polarized radiances from ice clouds. Here, we provide a set of LWIR polarized radiative transfer simulations for various ice cloud configurations under tropical conditions. Using a polarized Markov chain radiative transfer model, we compute the polarization difference (PD), defined as the difference between the vertically and horizontally polarized brightness temperatures, at three LWIR wavelengths (8.5, 9.5, and 10.5 µm) and for a wide range of ice cloud optical depths (τ = 0.05–20), cloud-top heights (8.5–15.5 km), view zenith angles (0–70°), effective radii (reff = 5-90 µm), and randomly oriented ice crystal habits (droxtals, plates, solid columns, bullet rosettes, and 8-column aggregates). Relatively small but distinct negative PD signatures (> -1 K, horizontal polarization) are found in ice clouds across different ice habits at τ ~ 5–7 and for the smallest and largest crystals (reff < 20 µm, reff > 40 µm). Non-negligible PD signatures also emerge at oblique viewing angles (vza = 50º–70º) and from clouds at altitudes near the tropopause. Additionally, we discuss preliminary work to run analogous parameter sweeps in the LWIR for oriented ice crystals.

How to cite: Sepúlveda Araya, E. I., Sullivan, S., Xu, F., Wu, D., Gong, J., and Kupinski, M.: Influence of Ice Crystal Morphology on Simulated Longwave Infrared Polarized Radiance of Ice Clouds, EGU General Assembly 2026, Vienna, Austria, 3–8 May 2026, EGU26-16048, https://doi.org/10.5194/egusphere-egu26-16048, 2026.

EGU26-16125 | ECS | Orals | AS5.6

Millimeter-Wave Atmospheric Radiometry via Nonlinear Optical Upconversion 

Florian Sedlmeir, Randy Pollock, Betina Pavri, Hannah Kessenich, Annika Seppälä, Harald G. L. Schwefel, and Mallika Suresh

The monitoring of the Earth’s atmospheric composition requires very sensitive satellite-based measurements that detect the thermal radiation emitted in the millimeter-wave and sub-THz spectral region by the constituent gas molecules. For example, much-needed vertically-resolved global ozone profile observations covering both day and night conditions are currently being made by instruments such as the Microwave Limb Sounder on board the EOS-Aura satellite. Traditionally, such radiometers have a large form factor, high power requirements, require advanced electronics and often have a cooled front-end resulting in high mission costs.
Here we present early results from a novel idea to circumvent the cryogenic requirement, thereby decreasing the payload size, weight, and power (SWaP) requirements and making the radiometers suitable for deployment as passive limb sounders on CubeSats.
Our design converts the atmospheric thermal emission (at 100 GHz – 1 THz) into the optical domain (e.g., infrared - approximately 200 THz). The up-converted signals can be referenced and radiometrically interpreted to measure the temperature of the emitting area.
Having these atmospheric signatures in the infrared domain enables the use of ultra-low-noise optical detection techniques (such as filtered single photon counters or optical heterodyning with a quiet reference laser) that are not available at microwave frequencies. Optical detection methods avoid the fundamental added noise associated with phase-insensitive microwave amplification, with noise instead dominated by optical shot noise and conversion efficiency. On top of that, most of the required components can be integrated into a compact modular device which reduces the footprint dramatically and will allow the device to be packed onto a cost-efficient CubeSat platform.
In order to convert electromagnetic radiation from one spectral region to another, we use a second-order optical nonlinear process. To achieve sufficient efficiency of photon up-conversion, high-quality crystalline microresonators are found to be an ideal system that is consistent with the small footprint we aim for. These electro-optic upconverters can be designed to target the specific emission frequencies of molecules in the atmosphere and detect their weak microwave signatures at ambient temperature with a sensitivity projected to be comparable to direct microwave receivers. The initial results presented here are focused frequency ranges that can be used for detection of ozone, as recent studies indicate that it is more important than ever to monitor the recovery of the ozone layer, but the same principle could later be expanded to the detection of other atmospheric species.

How to cite: Sedlmeir, F., Pollock, R., Pavri, B., Kessenich, H., Seppälä, A., Schwefel, H. G. L., and Suresh, M.: Millimeter-Wave Atmospheric Radiometry via Nonlinear Optical Upconversion, EGU General Assembly 2026, Vienna, Austria, 3–8 May 2026, EGU26-16125, https://doi.org/10.5194/egusphere-egu26-16125, 2026.

EGU26-16336 | Posters on site | AS5.6

Accurate Laboratory Measurement of Collision-Induced Absorption of O2 near 1.06 µm 

Yinbo Huang, Hang Dong, Honghua Huang, Zhensong Cao, and Yingjian Wang

The O2 collision-induced absorption(CIA) band near 1.06 μm plays a crucial role in evaluating planetary habitability. This band consists of the    transition superimposed on a broad CIA structure. Although the O2 CIA in this band is much weaker than that near 1.27 μm and the A band (760 nm), accurate binary coefficients, , were measured using a custom designed, high-sensitivity cavity ring-down spectroscopy (CRDS) setup developed in our laboratory under low density (< 1 amagat) and at room temperature (296 K) for pure O2 and O2/N2 mixtures over the range 9120-9820 cm-1. As expected, excellent agreement, generally within 1%, was observed among measurements performed at different densities, benefiting from the use of Ar as a baseline reference and low-density measurements that suppress Rayleigh scattering and line mixing, thereby reducing the uncertainty of the retrieved results. The retrieved  were compared with the values from LBLRTM simulations, HITRAN, and ab initio calculations. The  reported here are found to be in good agreement with these values. In particular, excellent agreement within 0.2% is observed between our measurements and LBLRTM simulations at the band center. The integrated CIA band intensity, , exceeds the corresponding values in HITRAN, LBLRTM simulations, and the ab initio calculations by about 28.6%, 44.2%, and 16.5%, respectively.

How to cite: Huang, Y., Dong, H., Huang, H., Cao, Z., and Wang, Y.: Accurate Laboratory Measurement of Collision-Induced Absorption of O2 near 1.06 µm, EGU General Assembly 2026, Vienna, Austria, 3–8 May 2026, EGU26-16336, https://doi.org/10.5194/egusphere-egu26-16336, 2026.

EGU26-17210 | ECS | Posters on site | AS5.6

Quantitative determination of I2/IO using a dual-channel BBCEAS system and its laboratory validation 

Enbo Ren, Min Qin, Wu Fang, Jianye Xie, Baobin Han, Dou Shao, and Pinhua Xie

Correspondence: Min Qin(mqin@aiofm.ac.cn) , Pinhua Xie (phxie@aiofm.ac.cn)

Iodine (I) in the atmosphere not only provides an important source of iodine for mammals, but also affects the catalytic depletion of ozone in the atmosphere, the production of important free radicals such as OH, and the formation of marine aerosols. Its atmospheric chemical behavior has been an important topic in atmospheric chemistry research in recent years. Research has found that iodine oxide plays an important role in the formation process of ultrafine aerosol particles (particle size between 3-10 nm), especially in the oceanic boundary layer (i.e. iodine oxide particles, IOPs). The chemical composition analysis of new particles in the ocean boundary layer shows that the nucleation and growth of particles are mainly controlled by condensable iodine vapor. The ship measurement results of halogen oxides in the Arctic high boundary layer show that iodine will exacerbate the depletion of tropospheric ozone in spring. The chemical reaction between iodine and ozone is the second largest factor causing ozone loss, second only to the loss caused by ozone photolysis. Currently, most laboratories primarily rely on chemical methods for iodine analysis. However, the high cost of associated instruments makes it difficult to meet routine analytical demands. In the field of optical methods, various spectroscopic techniques have been developed and applied, such as long-path differential optical absorption spectroscopy (DOAS), cavity ring-down spectroscopy (CRDS), and cavity-enhanced absorption spectroscopy (CEAS).This study used Broadband cavity-enhanced absorption spectroscopy (BBCEAS) technology. A homemade dual-cavity BBCEAS system integrated with green and blue LEDs enables in situ simultaneous measurement of I₂ and IO (iodine monoxide). With a time resolution of 60 seconds, The limit of detection (2σ) of the measurement system reached 1.13 pptv for I₂ and 1.31 pptv for IO. It has already been applied in laboratory-based measurement experiments.

How to cite: Ren, E., Qin, M., Fang, W., Xie, J., Han, B., Shao, D., and Xie, P.: Quantitative determination of I2/IO using a dual-channel BBCEAS system and its laboratory validation, EGU General Assembly 2026, Vienna, Austria, 3–8 May 2026, EGU26-17210, https://doi.org/10.5194/egusphere-egu26-17210, 2026.

EGU26-18008 | Orals | AS5.6

A Microwave Scattering Database of Oriented Ice and Snow Particles: Supporting Habit-Dependent Growth Models and Radar Applications 

Leonie von Terzi, Stefan Kneifel, Davide Ori, Fabian Jakub, Axel Seifert, and Christoph Siewert

The optical properties of atmospheric hydrometeors are a key component of forward operators used in data assimilation and model evaluation. Recent advances in microphysical modelling, such as Lagrangian super-particle models with habit prediction, enable the continuous evolution of ice particle properties and therefore require scattering databases that cover a wide range of particle morphologies.

The discrete dipole approximation (DDA) provides highly accurate scattering calculations for arbitrarily shaped ice particles but is computationally expensive, which has limited the diversity of particle shapes or environmental conditions represented in existing databases. This restricts their applicability for models with complex and evolving microphysics.

We present a new DDA-based database of ice particle optical properties at 5.6, 9.6, 35.6, and 94 GHz, designed to support habit-evolving microphysical schemes. The database follows two complementary designs. The first includes approximately 2500 ice crystals and 450 aggregates with scattering properties computed for multiple orientations, allowing a flexible treatment of particle canting. The second design sacrifices orientation diversity to maximize particle variability, comprising scattering properties for about 10 million aggregates and 1 million ice crystals calculated for a single orientation.

This newly developed database allows to forward simulate the output of the Lagrangian Monte-Carlo particle model McSnow, in which a habit prediction for ice crystals and aggregates has recently been implemented. The simulations reproduce characteristic radar signatures in the ice phase and thus allow to study the ice microphysical processes responsible for these radar signatures. 

How to cite: von Terzi, L., Kneifel, S., Ori, D., Jakub, F., Seifert, A., and Siewert, C.: A Microwave Scattering Database of Oriented Ice and Snow Particles: Supporting Habit-Dependent Growth Models and Radar Applications, EGU General Assembly 2026, Vienna, Austria, 3–8 May 2026, EGU26-18008, https://doi.org/10.5194/egusphere-egu26-18008, 2026.

EGU26-18282 | ECS | Orals | AS5.6

Custom High-Resolution UV Laser Systems for new Accurate Ozone Absorption Cross Section measurements in the Huggins bands 

Coline Mahob, Gérard Ancellet, Ariane Bazureau, Marie-Renée Debacker, Hadj Elandaloussi, Sophie Godin-beekmann, Ruizhe Gu, Adèle Hilico, Pascal Jeseck, Patrick Marie-jeanne, Andrea Pazmiño, Christian Rouille, Giorgio Santarelli, Thomas Zanon, and Christof Janssen

Accurate and traceable observation of atmospheric ozone is a fundamental requirement for reliable analyses of climate evolution, air quality, and ultraviolet radiation exposure, as ozone simultaneously limits biologically harmful UV radiation and contributes to radiative forcing. Detecting and interpreting long-term ozone variability and trends requires spectroscopic inputs with high accuracy. However, ozone absorption cross sections in the UV Huggins bands (310–360 nm), used by ground-based lidars, Brewer and Dobson spectrometers, and UV-visible satellite instruments, remain a major source of uncertainty. It has been established that recommended and widely used datasets in this spectral region exhibit uncertainties exceeding 1 % at room temperature and rising above 3 % at low stratospheric temperatures. These inconsistencies introduce systematic biases when measurements from multiple platforms are combined. To address this limitation, a dedicated laser-based experimental approach was developed to determine ozone absorption cross sections with high spectral resolution and accurate frequency control across a significant part of the Huggins bands. Because continuous-wave UV laser sources are not commercially available in this wavelength range, ultraviolet radiation was produced through frequency doubling of tunable visible lasers derived from fiber-based infrared systems. These lasers were specifically designed and built for this experiment, providing narrow linewidths, stable tuning, and performance tailored to high-precision ozone spectroscopy. Two complementary laser systems were implemented: one operating between 307.8 and 308.2 nm, targeting wavelengths relevant for stratospheric lidar applications, and a second system covering 308–318 nm to match the spectral requirements of Brewer and Dobson spectrometers as well as satellite instruments. The experimental setup includes a purpose-built absorption cell that allows measurements over a controlled temperature range from −80 °C to +30 °C, thereby reproducing atmospheric conditions encountered from the ground to the lower stratosphere. Ozone used in the experiments is generated on site and has a purity of 99.8 %. In connection with simultaneous ozone measurements at 254 nm, this ensures traceability to the photometric ozone standard and minimizes contamination effects. The use of custom high-resolution laser sources and a temperature-controlled measurement cell significantly reduces biases associated with conventional broadband UV spectroscopy. The developed methodology provides a robust framework for improving existing ozone absorption datasets and for harmonizing measurements across different observing platforms.

How to cite: Mahob, C., Ancellet, G., Bazureau, A., Debacker, M.-R., Elandaloussi, H., Godin-beekmann, S., Gu, R., Hilico, A., Jeseck, P., Marie-jeanne, P., Pazmiño, A., Rouille, C., Santarelli, G., Zanon, T., and Janssen, C.: Custom High-Resolution UV Laser Systems for new Accurate Ozone Absorption Cross Section measurements in the Huggins bands, EGU General Assembly 2026, Vienna, Austria, 3–8 May 2026, EGU26-18282, https://doi.org/10.5194/egusphere-egu26-18282, 2026.

EGU26-18417 | ECS | Orals | AS5.6

Field-Deployable Ultraviolet Dual-Comb Spectrometer for Mobile Formaldehyde Sensing 

Christoph Gruber, Elias Ehl, Robert Di Vora, Armin Speletz, Mithun Pal, and Birgitta Bernhardt

We report, to the best of our knowledge, the first field-deployable ultraviolet (UV) dual-comb spectrometer (DCS) for environmental sensing of formaldehyde. By combining broadband UV spectroscopy with sub-second temporal resolution the instrument enables fast, sensitive, and species-selective measurements of trace gas concentrations. Formaldehyde is a significant atmospheric pollutant and photochemical precursor with adverse effects on human and environmental health.

Current observational capabilities are limited by a gap between satellite-based remote sensing, which provides large-scale coverage, but coarse spatial and temporal resolution, and stationary in-situ instruments, which offer high sensitivity but represent only localized sampling volumes with often a bad selectivity. The presented system addresses this gap by enabling measurements with spatial resolutions ranging from hundreds of meters to kilometres, making it well suited for mobile and regional-scale atmospheric studies. Preliminary tests resulted in a resolution of 35 ppb formaldehyde for a total pathlength of 1 km and a measurement time of 1s with potential improvement in sensitivity by one order of magnitude.

Leveraging recent advances in dual-comb laser technology, we developed a compact and mechanically robust spectrometer that generates coherent radiation in the ultraviolet spectral region around 350 nm without any moving optical components. This design ensures high stability and reliability under field conditions and makes the system particularly suitable for mobile deployments. The use of DCS allows for the integration of many measurements, each fast enough to be unimpeded by atmospheric turbulences, via coherent averaging.

These characteristics make UV dual-comb spectrometers especially promising for environmental monitoring and remote sensing applications. The demonstrated system operational in a car represents a significant step toward next-generation atmospheric sensing platforms capable of bridging observational scales and extending DCS environmental sensing to the ultraviolet.

How to cite: Gruber, C., Ehl, E., Di Vora, R., Speletz, A., Pal, M., and Bernhardt, B.: Field-Deployable Ultraviolet Dual-Comb Spectrometer for Mobile Formaldehyde Sensing, EGU General Assembly 2026, Vienna, Austria, 3–8 May 2026, EGU26-18417, https://doi.org/10.5194/egusphere-egu26-18417, 2026.

EGU26-18652 | ECS | Posters on site | AS5.6

OPALE: Reducing Aerosol Optical Property Uncertainty of Elemental Carbon and Mineral Dust in LOTOS-EUROS Using a Perturbed Parameter Ensemble  

Kaylee Elliott, Bas Henzing, Janot Tokaya, and Nick Schutgens

Aerosols are a key component of the atmosphere, influencing Earth’s climate through direct and indirect radiative effects, while also playing a major role in air quality and human health. Despite their importance, aerosols remain the largest source of uncertainty in estimates of climatic radiative forcing. This uncertainty arises from their complex chemical and physical properties, diverse sources, and strong spatio-temporal variability, all of which challenge accurate representation in atmospheric models. A crucial aspect of resolving model uncertainty of aerosols is the accurate representation of their microphysical properties, which control optical behavior and radiative effects.  This study aims to address this uncertainty by applying a perturbed parameter ensemble (PPE) approach using the LOTOS-EUROS chemistry transport model. The analysis focuses on elemental carbon (EC) and mineral dust aerosols. Key microphysical parameters such as particle radius, geometric standard deviation (sigma) in the assumed lognormal particle size distribution, real and imaginary parts of the refractive index, and mass concentrations will be perturbed within physically plausible ranges. Uncertainty ranges for the refractive index are sourced from the Models, In situ, and Remote sensing of Aerosols (MIRA) international working group. Emulators trained on the ensemble simulations will provide a fast, statistical representation of modeled absorbing aerosol optical depth (AAOD), enabling efficient sampling of high-dimensional parameter space. Model results will be constrained using surface measurements of black carbon and mineral dust mass concentrations from EBAS, together with AAOD observations from AERONET. These combined constraints help reduce compensating bias between aerosol amount and optical efficiency. Overall, this framework will enable a quantitative assessment of uncertainty in modeled aerosol optical properties, identify the parameters that most strongly influence AAOD, and constrain the most realistic parameter ranges. These constraints will improve the representation of the varied aerosol microphysical properties in LOTOS-EUROS, leading to more accurate assumed aerosol optical properties. This is crucial for a useful uptake of remote sensing aerosol data in model evaluations and assimilation approaches.

How to cite: Elliott, K., Henzing, B., Tokaya, J., and Schutgens, N.: OPALE: Reducing Aerosol Optical Property Uncertainty of Elemental Carbon and Mineral Dust in LOTOS-EUROS Using a Perturbed Parameter Ensemble , EGU General Assembly 2026, Vienna, Austria, 3–8 May 2026, EGU26-18652, https://doi.org/10.5194/egusphere-egu26-18652, 2026.

EGU26-18738 | ECS | Orals | AS5.6

Remote sensing of water vapour in the atmospheric column using laser heterodyne radiometer 

Aditya Saxena, Marie Thérèse El Kattar, Tingting Wei, Mélanie Ghysels-Dubois, Georges Durry, Nadir Amarouche, Michel Chartier, Gisèle Krysztofiak, Jean-Christophe Samake, Stéphane Chevrier, Thomas Lecas, Constance Paquet, Hervé Herbin, and Weidong Chen

Measurements of greenhouse gases (GHGs) in the atmospheric column are crucial because column-averaged mixing ratio integrate concentrations over the full vertical extent of the atmosphere, making them far less sensitive to local mixing and transport errors than surface in situ measurements. Water vapour (H₂O) is a very highly variable and most common greenhouse gas in the Earth’s atmosphere. Column measurements of water vapour provide robust information on the total atmospheric moisture content, which is essential for the study of Earth’s radiation budget. Complementing this, vertical concentration profiles remain essential for investigating regional water cycle and its role in climate variability and environmental change. Together, column measurements and vertical profiles provide a more complete and reliable understanding of atmospheric water vapour distribution and its relevance to climate processes [1].

A portable, fully fiber-coupled laser heterodyne radiometer (LHR) has been developed at the Laboratoire de Physico-Chimie de l’Atmosphère (LPCA) for ground-based remote sensing of atmospheric carbon dioxide (CO₂) [2] and water vapour (H₂O). The system employs a wide-band, tunable external-cavity diode laser operating in the 1520–1620 nm spectral range as the local oscillator. Field measurements were conducted during a dedicated campaign at the CNES balloon launch facility in Aire-sur-l’Adour, France, within the framework of the CNES ATMOSFER project.

This study demonstrates the capability of the LHR to sensitively retrieve vertical water vapour concentration profiles from ground-based measurements using optimal estimation method. The retrieved H₂O profiles were further validated against high-vertical-resolution in-situ balloon-borne observations, including measurements from the Pico-Light H₂O instrument and the Micro-hygrometer. In addition, a real-time intercomparison was performed using simultaneously radiosonde launches, providing an independent assessment of the temporal consistency of the LHR retrievals. Instrument sensitivity and information content were further evaluated through averaging kernel analysis, and the data inversion was carried out using the ARAHMIS (Atmospheric Radiation Algorithm for High-Spectral Resolution Measurements from Infrared Spectrometers) radiative transfer model [3]. Furthermore, the diurnal variation of water vapour concentration was investigated using successive LHR measurements, demonstrating the instrument’s capability for continuous daytime monitoring.

Acknowledgments

This work is supported by the CNES ATMOSFER project and partially supported by the French national research agency (ANR) under the Labex CaPPA (ANR-10-LABX-005) contract, the EU H2020-ATMOS project (Marie SkANR-10-L-Curie grant agreement No 872081), and the regional CPER ECRIN program.

Reference

[1] M. Held, B. J. Soden, “Water vapor feedback and global warming”, Annual Review of Energy and the Environment 25 (2000) 441–475.

[2] J. Wang, T. Tu, F. Zhang, F. Shen, J. Xu, Z. Cao, X. Gao, S. Plus, and W. Chen, "An external-cavity diode laser-based near-infrared broadband laser heterodyne radiometer for remote sensing of atmospheric CO2", Optics Express 31 (2023) 9251-9263.

[3] M. T. El Kattar, T. Wei, A. Saxena, H. Herbin, W. Chen, “Potential CO₂ measurement capabilities of a transportable Near Infrared Laser Heterodyne Radiometer (LHR)”, Atmospheric Measurement Techniques 18 (2025) 4515-4526.

How to cite: Saxena, A., El Kattar, M. T., Wei, T., Ghysels-Dubois, M., Durry, G., Amarouche, N., Chartier, M., Krysztofiak, G., Samake, J.-C., Chevrier, S., Lecas, T., Paquet, C., Herbin, H., and Chen, W.: Remote sensing of water vapour in the atmospheric column using laser heterodyne radiometer, EGU General Assembly 2026, Vienna, Austria, 3–8 May 2026, EGU26-18738, https://doi.org/10.5194/egusphere-egu26-18738, 2026.

EGU26-19391 | ECS | Posters on site | AS5.6

OLALA First Results: Depolarization Ratios of Fine Mode Aerosol Particles 

Esha Semwal, Moritz Haarig, Markus Hartmann, Ronny Engelmann, Dietrich Althausen, Heike Wex, and Thomas Oppermann

Mineral dust is a major component of atmospheric aerosol loading and typically shows high depolarization ratios because of its irregular particle shape. The depolarization ratio measurements make mineral dust easier to distinguish from other aerosols in lidar observations. However, the complex and diverse morphology of dust particles is difficult to represent accurately in scattering models used for lidar retrievals, which introduces uncertainties in the derived microphysical properties. To address these limitations a new scattering laboratory has been established under the course of the project OLALA (Optical Lab for Lidar Applications). The goal is to perform controlled measurements that will help to better constrain scattering models and improve aerosol property retrievals from lidar observations. Using this experimental setup, an extensive dataset of backscattering properties of size resolved mineral dust particles will be obtained at three standard lidar wavelengths: 355 nm, 532 nm, and 1064 nm.

At present, the laboratory setup is fully operational at a single wavelength of 532 nm. Our optical setup uses a continuous wave laser at 532 nm as the light source and a 50:50 beam splitter to acquire the exact backscattering geometry (180±0.2°). In the receiver section, a polarizing beam splitter cube separates the parallel and perpendicular component of backscattered light and directs them towards their respective detection channels. Our aerosol chamber is a vertically oriented 1 m long tube with an inner diameter of 1.5 cm. The total particle concentration entering the aerosol chamber is monitored with a condensation particle counter (CPC) and at the exit of the aerosol tube an optical particle sizer (OPS) measures the concentration and size distribution of aerosol particles. A differential mobility analyzer is used to select particles of a defined mobility diameter, producing monodisperse aerosols.

We have performed initial measurements with different types of aerosols to demonstrate the performance and potential of our setup. For spherical particles we used polystyrene latex particles of 1000 nm diameter and ammonium sulfate particles of 250 nm diameter and observed very low depolarization ratios of less than 2%. For non-spherical particles we used sodium chloride, Arizona Test Dust and German soil dust at four different sizes of 250 nm, 450 nm, 650 nm and 800 nm in diameter. We observed an increasing trend in the depolarization ratio with an increase in particle size for non-spherical fine mode aerosol samples.

After the successful implementation of the 532 nm setup, we are now focused on extending the optical setup by incorporating 1064 nm and 355 nm wavelengths. Once the triple wavelength setup is operational, we plan to perform measurements with natural mineral dust samples collected from different deserts around the globe.

How to cite: Semwal, E., Haarig, M., Hartmann, M., Engelmann, R., Althausen, D., Wex, H., and Oppermann, T.: OLALA First Results: Depolarization Ratios of Fine Mode Aerosol Particles, EGU General Assembly 2026, Vienna, Austria, 3–8 May 2026, EGU26-19391, https://doi.org/10.5194/egusphere-egu26-19391, 2026.

EGU26-20007 | Posters on site | AS5.6

Exploring Clear-Sky Longwave Radiative Closure: A downwelling case study 

Sophie Mosselmans, Helen Brindley, Caroline Cox, Edward Gryspeerdt, Jonathan Murray, Sanjeevani Panditharatne, Laura Warwick, Yi Huang, Benjamin Riot, and Ben Pery

Far-infrared (FIR) radiation plays a fundamental role in regulating the Earth’s greenhouse effect, particularly in cold and dry regions where a large fraction of the outgoing longwave radiation is emitted at FIR wavelengths. Measurements across this range are limited and previous studies have found it challenging to achieve radiative closure between different instruments across the mid-far infrared. In January and February 2025, ESA funded a campaign in the Gault Nature reserve (Canada) in support of the FORUM (Far-infrared Outgoing Radiation Understanding and Monitoring) Earth explorer mission. One of the campaign aims was investigate the consistencies between atmospheric states modelled and measured at the surface. This study exploits measurements taken by the Far INfrarEd Spectrometer for Surface Emissivity (FINESSE) instrument, a ground-based Fourier transform spectrometer, which was based at Gault.  

First, clear sky scenes were selected through local HALO Doppler lidar measurements and a bi-spectral method using the FINESSE radiances. The high-resolution downwelling spectra are compared to radiative transfer simulations (LBLRTM) run with atmospheric profiles from a local radiosonde (IMET4) and the 5th ECMWF atmospheric reanalysis (ERA5). These residuals were averaged over time and the different sources of uncertainty, including spectroscopic uncertainty, were combined.  

Preliminary results from this study indicate that simulations driven by ERA5 profiles generally show improved agreement with the observed radiances compared to those using IMET4 radiosonde inputs. This suggests that ERA5 more accurately captures the vertical structure of temperature and humidity during the campaign period. The radiosonde was launched very close to FINESSE, however there were strong winds and the sondes tended to fly east of FINESSE. The impact of the movement on the radiance residuals has been characterised.

The largest discrepancies in both cases are seen in the 400-600 cm-1 region and in the 𝜈2CO2 band wings between around 580 - 620 cm-1 and 710-750 cm-1. These are regions which are particularly sensitive to the water vapour and temperature profiles. Within these areas, there are sections where the residuals extend beyond the estimated combined uncertainties. The radiosonde residuals in the 400-600 cm-1 region indicate a possible dry bias. We conducted Sensitivity experiments exploring how variations in humidity within different atmospheric layers influences the simulated radiances. Furthermore, the impact of recent revisions to H₂O line parameters on the radiance residuals is explored.

How to cite: Mosselmans, S., Brindley, H., Cox, C., Gryspeerdt, E., Murray, J., Panditharatne, S., Warwick, L., Huang, Y., Riot, B., and Pery, B.: Exploring Clear-Sky Longwave Radiative Closure: A downwelling case study, EGU General Assembly 2026, Vienna, Austria, 3–8 May 2026, EGU26-20007, https://doi.org/10.5194/egusphere-egu26-20007, 2026.

EGU26-20291 | Posters on site | AS5.6

The development of a rugged, compact gas spectrometer using a sub-THz waveguide 

Elin McCormack, Ben Lane, Simon Blackshaw, Ali Obeed, Peter Hunyor, Robert McPheat, and Daniel Gerber

We present a novel low-cost and compact method for detecting trace gases using their absorption features in the sub-THz region. Conventionally, work in this area uses free space quasi-optics which have inconveniently large and potentially costly instrumentation. This is due to the drawbacks of the optical setup which require both long beam paths and large optics in this frequency range. Instead, we have developed a novel system that confines the radiation to a specially designed waveguide meaning long pathlengths (and therefore high SNR) can be achieved in a relatively small instrument and no optics or alignment are required. A flow of gas is introduced into the waveguide which changes the spectral transmission loss. This technology has been demonstrated in the lab and can be applied to any gases with absorption features in the sub-THz region. A deployable instrument has been completed, and we aim to engage in field testing in the near future.

How to cite: McCormack, E., Lane, B., Blackshaw, S., Obeed, A., Hunyor, P., McPheat, R., and Gerber, D.: The development of a rugged, compact gas spectrometer using a sub-THz waveguide, EGU General Assembly 2026, Vienna, Austria, 3–8 May 2026, EGU26-20291, https://doi.org/10.5194/egusphere-egu26-20291, 2026.

Accurately representing the optical properties of atmospheric ice particles remains a major challenge for climate simulations and remote sensing. A key limitation is the lack of experimental benchmark data that directly link ice crystal microphysics to angular light scattering, particularly at the level of individual atmospheric particles.

In this contribution I will give an overview of recent advances enabled by the Particle Habit Imaging and Polar Scattering (PHIPS) instrument. PHIPS provides unique aircraft-based, in situ measurements combining high-resolution stereo-microscopic imaging with simultaneous angular light-scattering observations of the same ice crystal. This capability enables a consistent investigation of scattering behavior from single, oriented particles to habit-averaged populations and cloud-averaged ensembles.

Single-particle analyses show that even ice crystals appearing pristine in microscopic images require a finite degree of mesoscopic surface roughness to reproduce their measured angular scattering functions. This demonstrates that sub-wavelength-scale surface irregularities fundamentally control the angular scattering properties of individual atmospheric ice crystals.

For habit-averaged crystal populations, PHIPS observations of atmospheric bullet rosette crystals reveal asymmetry parameters (g) that are substantially lower than predicted by ray-tracing models assuming idealized geometries, implying a significantly enhanced shortwave reflectivity of cirrus clouds. At the cloud-averaged scale, PHIPS measurements from mid-latitude and Arctic cirrus consistently yield low g values of about 0.74, with a systematic decrease toward larger particles.

Together, these results show that ice crystal complexity across scales must be explicitly represented in optical models and establish PHIPS data as a critical benchmark for advancing such models.

How to cite: Schnaiter, F. M.: An observational benchmark of ice crystal light scattering: insights from a decade of airborne in situ measurements with the PHIPS instrument, EGU General Assembly 2026, Vienna, Austria, 3–8 May 2026, EGU26-20374, https://doi.org/10.5194/egusphere-egu26-20374, 2026.

EGU26-21368 | ECS | Posters on site | AS5.6

Progress on a Flow-Through Integrating Cavity Optical Absorption Spectrometer for In-Situ Cloud Water Condensed Phase Ratio Measurement 

Benjamin Lang, Martin Medebach, and Alexander Bergmann

Accurate in-situ measurement of cloud microphysical properties, such as the water content, is essential in the research and modelling of cloud and precipitation formation, or the prediction of macrophysical properties, e.g., cloud radiative properties.

In mixed-phase clouds, where ice crystals coexist with supercooled liquid droplets on different scales and with varying mixing ratio, accurate knowledge of this mixing ratio of cloud liquid water content to ice water content is important, in particular for advancing radar, lidar and satellite retrievals.

Based on previously presented results demonstrating the possibility of measuring the mass concentration of liquid water droplet streams in an integrating sphere absorption meter [1][2], we present the progress made and first validation results of a novel optical instrument for bulk in-situ cloud water condensed phase ratio measurement. The proposed instrument features a flow-through type integrating cavity for differential, near-infrared optical absorption measurement. Such cavities, by nature of their light homogenizing property, largely eliminate particle scattering contributions, which typically prohibit simple optical absorption measurement of particles. This promises to allow direct and in-situ determination of the fractions of both condensed phases in mixed-phase clouds via their optical absorption. The current design is limited to drop and particle sizes below 200 µm due to absorption saturation, as determined from Mie calculations for the chosen optical wavelengths. The lower water content detection limit is determined by speckle noise generated by the integrating cavity, which is subject to presented optimization efforts. We also present numerical Monte-Carlo based ray tracing simulations of the integrating cavity geometry for sensitivity and signal-to-noise ratio optimization.


[1] Grafl, M., Bergmann, A., & Lang, B. (2021). Validation of Integrating Cavity Absorption Spectroscopy for Cloud and Aerosol Mass Concentration Measurement: 39th Annual Meeting of the American Association for Aerosol Research. 153.

[2] Lang, B.,, Bergmann, A. (2024). Flow-Through Integrating Cavity Optical Absorption Spectrometer for In-Situ Cloud Water Condensed Phase Composition Measurement: Design Constraints and Initial Validation. 42nd Annual Meeting of the American Association for Aerosol Research.

How to cite: Lang, B., Medebach, M., and Bergmann, A.: Progress on a Flow-Through Integrating Cavity Optical Absorption Spectrometer for In-Situ Cloud Water Condensed Phase Ratio Measurement, EGU General Assembly 2026, Vienna, Austria, 3–8 May 2026, EGU26-21368, https://doi.org/10.5194/egusphere-egu26-21368, 2026.

While optical techniques for fire detection have evolved from simple visual observation to more advanced hyperspectral imaging systems, there remains a need for compact, selective and field-deployable tools capable of quantifying and characterizing both intensity and spectral signatures of flames. This work introduces a novel approach to Fire Optical Measurements (FOM) that leverages spectral emissions from potassium, a key tracer of flaming biomass combustion.  We describe the development of a sensor platform operating in the near-infrared region to isolate potassium emission features (K-FOM) in both and simple “field-scale” demonstrations. By targeting radiative emission signatures specific to biomass burning, the system offers a promising method to differentiate wildfires from fossil fuel combustion, as well as to differentiate lower-temperature smoldering fires from intense crown fires.

The K-FOM system builds on our prior experience in developing Laser Heterodyne Radiometry (LHR) sensors used for greenhouse gas measurements via in solar occultation, employing a similar optical design.  In K-FOM, radiation from a potassium containing flame is collected (using a single-mode fiber or free-space collection optics). The collected radiation is mixed with light from a tunable diode laser operating near 770 nm.  The resulting radio frequency signal from the combined beam carries both broadband contributions from flame particulate and the sharp emission lines from excited potassium atoms.

This presentation focuses on testing this technique in a model, laboratory system. Conserved scalars are widely used in wildfire modeling to simplify complex thermochemistry by linking species concentrations or formation rates for species to a single, passively-advected quantity through a look-up library. Mixture fraction, which represents the local proportion of fuel mass (from the unburnt cold or gaseous fuel) relative to the total mixture mass, is a key conserved scalar used in wildfire models such as the NIST Fire Dynamics Simulator. To explore the validity of this approach to potassium fire chemistry, potassium chloride solutions are nebulized into a well-characterized laboratory flame system. By mapping  ground state potassium mixture fraction, using Tunable Diode Laser Absorption Spectroscopy (TDLAS), the spatial profile of potassium emission, and data from prior structural measurements and computations in this system, we refine detailed mechanisms for potassium fire chemistry and test mechanism reduction strategies. 

How to cite: Miller, J. H. and McCaughey, E.: Potassium Radiative Emissions for Wildfire Detection: Developing a Path Toward Laser Heterodyne Radiometry, EGU General Assembly 2026, Vienna, Austria, 3–8 May 2026, EGU26-21687, https://doi.org/10.5194/egusphere-egu26-21687, 2026.

EGU26-22480 | ECS | Posters on site | AS5.6

Thermospheric wind retrievals from the SOFPIT Fabry–Perot interferometer at 630 nm 

Arthur Gauthier, Christopher Geach, Claudia Borries, and Gunter Stober

Thermospheric winds play a crucial role in transporting momentum and energy in the upper atmosphere, influencing both its composition and dynamics, with direct implications for satellite operations and global communication systems. The Fabry–Perot interferometer (FPI) is a key remote-sensing instrument for measuring thermospheric winds by observing Doppler shifts and Doppler broadening of naturally occurring airglow emissions. In March 2024, DLR installed a 630 nm FPI (SOFPIT) on Tenerife (28.29° N, 16.63° W; 32.79° N, 60.75° E geomagnetic), enabling high-resolution observations of upper-atmosphere winds.

We implemented two retrieval methods tailored to the SOFPIT instrument. The first method, based on Shiokawa et al. (2012), compares images taken in opposite directions (east–west, north–south), assuming wind uniformity across the field of view. The second method, following Makela et al. (2011), uses a forward model simulating the instrument response for given wind and temperature values; observed images are then fitted to the model to infer winds, requiring a zero-wind reference for absolute calibration.

Both approaches have been successfully applied to the entire SOFPIT dataset since the start of observations, demonstrating the robustness and reliability of the retrieval techniques. These results confirm that the instrument can consistently measure thermospheric winds and provide a solid foundation for ongoing improvements in data processing and calibration.

Our study highlights the effectiveness of FPIs for detailed monitoring of upper-atmosphere dynamics. Such measurements are essential for improving our understanding of thermospheric behavior and supporting operational forecasting in space weather and satellite mission planning.

How to cite: Gauthier, A., Geach, C., Borries, C., and Stober, G.: Thermospheric wind retrievals from the SOFPIT Fabry–Perot interferometer at 630 nm, EGU General Assembly 2026, Vienna, Austria, 3–8 May 2026, EGU26-22480, https://doi.org/10.5194/egusphere-egu26-22480, 2026.

EGU26-22495 | ECS | Orals | AS5.6

Compact Trace Gas Sensing by Balanced-Detection Interferometric Cavity-Assisted Photothermal Spectroscopy (ICAPS) 

Johannes P. Waclawek, Harald Moser, and Bernhard Lendl

The miniaturization of sensitive as well as selective laser-based gas detectors is of big request among different fields of activity due to specific characteristics such as a fast sensor response or simply a small footprint. However, it still remains challenging. While methods based on direct absorption spectroscopy show a limited potential for miniaturization due to their dependence of sensitivity on the optical path length according to the Lambert-Beer law, indirect spectroscopic techniques of photothermal nature inherently exhibit high miniaturization potential, even down to integration onto a chip.
The Interferometric Cavity-Assisted Photothermal Spectroscopy (ICAPS) method has been proven highly suitable for sensitive and compact gas detection by application of a Fabry-Perot interferometer (FPI) as transducer for photothermal spectroscopy. The implementation of a balanced detection scheme to our developed system is a key improvement, which enhances the sensor’s performance by efficient cancellation of noise.
Within the presentation, recent results of a setup employing individual interferometers will be shown. Here, balanced-detection was realized by using two identical cavities having a path length of 1 mm and a total sample gas volume of a few mm³. The system uses an all fiber-coupled probe laser configuration, which detected the reflectance of the interferometers, enabling sensor operation close to the fundamental limit of shot noise. The metrological figures of merit were investigated by detection of different trace gases such as SO2, CO and NO using QCLs as powerful mid-infrared excitation sources. The induced refractive index changes were monitored by a near-infrared probe laser. For the targeted molecules a minimum detection limit down to the sub-ppbv level was achieved with a 1s integration time, corresponding to a normalized noise equivalent absorption of the order of 10−9 cm−1 W Hz−1/2.
Additionally, latest progress regarding sensor miniaturization will be discussed. FPIs made solely from single-crystalline silicon with Bragg mirrors consisting of silicon-air dielectric multilayers [2] were designed and fabricated. The FPIs allow easy coupling of the near-infrared beam by optical fibers positioned in the chip along aligned grooves. First demonstration of ICAPS gas sensing employing a silicon FPI will be shown.

References
[1] J. P. Waclawek, H. Moser, and B. Lendl, “Balanced-detection interferometric cavity-assisted photothermal spectroscopy employing an all-fiber-coupled probe laser configuration,” Opt. Express 29, 7794-7808 (2021).
[2] M. Malak Karam, et al., “Micromachined Fabry–Perot resonator combining submillimeter cavity length and high quality factor”, Appl. Phys. Lett., 21 (98), id. 211113 (2011).

How to cite: Waclawek, J. P., Moser, H., and Lendl, B.: Compact Trace Gas Sensing by Balanced-Detection Interferometric Cavity-Assisted Photothermal Spectroscopy (ICAPS), EGU General Assembly 2026, Vienna, Austria, 3–8 May 2026, EGU26-22495, https://doi.org/10.5194/egusphere-egu26-22495, 2026.

EGU26-1842 | ECS | Posters on site | CL4.14

Climate simulations with global storm-resolving models from transient states. 

Kai Keller, Marc Batlle, Pablo Ortega, Nuno Rocha, Cheng You, and Francisco Doblas-Reyes

Climate models are an important tool to address challenges we face due to the changing climate. The global warming of the atmosphere and ocean leads to an increase in energy accessible to foster more frequent and intense tropical cyclones, extreme precipitation, and heatwaves, causing increasingly larger economic and non-economic damage. Many of those events are caused or influenced by small-scale convective processes that are not resolved in the typical CMIP-style models with resolutions of about 100 km.

Models capable of resolving deep convection and large turbulent eddies in the atmosphere require horizontal resolutions between 1 km and 10 km. Turbulent processes in the atmosphere play a major role in distributing the energy within the atmosphere, and it has been shown that atmospheric models at resolutions of about 10 km or less significantly improve the resemblance to observations, for instance, regarding the magnitude of maximum wind gusts and the statistics and characteristics of tropical cyclones. Similarly, ocean models require resolutions in the order of 10 km or finer to explicitly resolve mesoscale ocean eddies and their contributions to the transport of salinity and heat and their effects upon the global system. 

Before we can make the transient historical simulations from which future projections are typically initialized with climate models, based on a certain emission scenario, the models need to achieve a climate state that is consistent with the boundary conditions at the initial time. For this, the model needs to be gradually spun up to reach a balanced state. Traditional approaches for model tuning and spinup used for coarse resolution models cannot be applied at very high resolutions. Typical spinup times to reach model equilibrium are around 1000 years, which remains unrealistic to achieve for km-scale models until today. 

This work presents the analysis of alternative cost-efficient spinup protocols and evaluates their associated initial shocks and drifts and how efficiently the coupled model approaches the equilibrium. We also contribute to answering the question of how reliable future projections are when initialized from a transient model state. The analysis is based on a series of ensemble simulations performed with the coupled IFS-NEMO climate model at about 25 km atmospheric and ocean resolution, i.e., Tco399/eORCA025 grids, and on different combinations of ocean-only spinup and coupled spinup lengths. Our analysis focuses on spinup designs that are optimized to initialize climate projections and historical simulations of 50 to 100 years with a minimal initial adjustment and “well-behaved” model trends, contrasting them to the existing multi-decadal km-scale simulations from initiatives like Destination Earth and EERIE.

How to cite: Keller, K., Batlle, M., Ortega, P., Rocha, N., You, C., and Doblas-Reyes, F.: Climate simulations with global storm-resolving models from transient states., EGU General Assembly 2026, Vienna, Austria, 3–8 May 2026, EGU26-1842, https://doi.org/10.5194/egusphere-egu26-1842, 2026.

EGU26-3999 | ECS | Orals | CL4.14 | Highlight

What do kilometre-scale global simulations add to our understanding of heatwaves? 

Edgar Dolores Tesillos and Daniela Domeisen

Heatwaves are a major threat worldwide, and improving their predictability and assessing their future changes are key priorities in climate research. Heatwave development arises from an interplay between large-scale atmospheric circulation, which governs persistent synoptic conditions, and smaller-scale mesoscale processes that modulate local temperature extremes. Current global climate models exhibit well-documented biases in the representation of persistent large-scale circulation patterns, such as atmospheric blocking, and are additionally unable to explicitly resolve mesoscale processes that contribute to heatwave intensity and persistence. Regional climate models can better represent some of these smaller-scale processes but remain limited in spatial coverage. Recent advances in computational capacity have enabled kilometre-scale global climate simulations, opening new opportunities to investigate heatwaves and their multi-scale drivers within a consistent global modelling framework.

Here, we analyse global kilometre-scale simulations from the EXCLAIM project using the Icosahedral Nonhydrostatic (ICON) climate model. The primary experiment consists of a global 2.5 km atmosphere-only simulation with explicit convection and prescribed daily sea surface temperatures. Companion simulations at 10 km resolution, employing both convection-permitting and convection-parameterized configurations, allow for a systematic assessment of the impacts of horizontal resolution and convection representation.

Using ICON output, we evaluate heatwave characteristics such as frequency and persistence, and examine their relationship with the associated large-scale circulation patterns. In particular, we assess the sensitivity of heatwave statistics to model resolution and convection representation. We further analyse how the well-established link between midlatitude anticyclonic blocking and heatwaves is represented across resolutions, and explore the extent to which mesoscale processes modify heatwave characteristics beyond the large-scale circulation control.

Our results provide first insights into the added value and remaining challenges of storm-resolving global climate models for understanding heatwaves, their multi-scale drivers, and their representation in a warming climate.

How to cite: Dolores Tesillos, E. and Domeisen, D.: What do kilometre-scale global simulations add to our understanding of heatwaves?, EGU General Assembly 2026, Vienna, Austria, 3–8 May 2026, EGU26-3999, https://doi.org/10.5194/egusphere-egu26-3999, 2026.

EGU26-5541 | ECS | Posters on site | CL4.14

 Ventilation by mesoscale eddies has a negligible impact on the rate at which anthropogenic carbon is sequestered within the global ocean 

Fraser Goldsworth, Jin-Song von Storch, Nils Brüggemann, and Helmuth Haak

In response to increasing concentrations of carbon dioxide in the atmosphere, the ocean is estimated to take up ~2.3 Pg C yr-1. Emerging evidence has shown that mesoscale eddies can act to significantly alter the rate of carbon uptake by the ocean; however, current model-based estimates of the anthropogenic carbon flux rely on empirically derived parameterisations of mesoscale eddies. Such parameterisations may affect modelled carbon fluxes differently to models which explicitly resolve mesoscale eddies. The rectified impact of explicitly resolved mesoscale eddies on the global anthropogenic carbon flux has not been quantified before.

We estimate how changes in ocean ventilation resulting from the explicit resolution of mesoscale eddies alter the global uptake of anthropogenic carbon by the ocean. We use the transit-time distribution approach to reconstruct the oceanic inventory of anthropogenic carbon in both an eddy-resolving (5 km resolution) and an eddy-parameterising (20 km resolution) configuration of the ICON-Ocean model. Each model is integrated using a perpetual year forcing and five boundary impulse response tracers, required for estimating the transit-time distribution.

The uptake of anthropogenic carbon in the eddy-resolving model exceeds that in the eddy-parameterising model by 0.1 Pg C yr-1 over the period 2005–2015, which is smaller than typical inter-model differences of around ±0.5 Pg C yr-1. The root mean square difference in column integrated inventories of anthropogenic carbon between the eddy-resolving and eddy-parameterising model is 4.3 mol m-2, which is slightly larger than uncertainties in observational estimates of column integrated anthropogenic carbon of around ±2 mol m-2.

Our results suggest that explicitly resolving mesoscale eddies is unlikely to produce large differences in globally integrated anthropogenic carbon inventories via ventilation changes alone. Further differences may arise from eddy-driven effects on the solubility of carbon dioxide, gas transfer velocities and the biological carbon pump — the transit-time distribution approach only describes the effects of ventilation in the physical carbon pump.

How to cite: Goldsworth, F., von Storch, J.-S., Brüggemann, N., and Haak, H.:  Ventilation by mesoscale eddies has a negligible impact on the rate at which anthropogenic carbon is sequestered within the global ocean, EGU General Assembly 2026, Vienna, Austria, 3–8 May 2026, EGU26-5541, https://doi.org/10.5194/egusphere-egu26-5541, 2026.

Aviation turbulence leads to safety, comfort, and economic risks. For example, a recent high-profile event of a severe turbulence encountered by Singapore Airlines flight SQ321 in 2024 led to a large number of injured passengers, showing the challenge of anticipating hazardous conditions in the tropics.

Multiple studies suggest that turbulence has already increased and will continue to intensify in a warming climate, particularly over the midlatitudes, driven by changes in upper-tropospheric wind shear. However, evidence for the tropics is inconclusive and largely based on climate models with a horizontal resolution of approximately 100 km, which cannot directly resolve key atmospheric processes. Basic theory indicates that the tropical upper troposphere becomes more stable on average as the climate warms, which could suppress clear‑air turbulence. At the same time, the most extreme thunderstorm updrafts are expected to strengthen, potentially increasing turbulence in and around storms and their outflow. Together, these opposing signals leave the net impact on tropical aviation uncertain.

We address this gap using a set of global simulations at 5 km horizontal resolution, which explicitly resolve many upper-tropospheric updrafts in both convective and nearby clear-air environments. We use 40-day long simulations for present-day conditions for uniform sea-surface temperature warming of +2 °C and +4 °C. Additional simulations isolate the impact of CO2 radiative forcing independent of SST warming, motivated by recent findings that CO2 direct radiative effects can strengthen upper-tropospheric updrafts and reduce the upper tropospheric static stability. We focus on altitudes of 9-13 km along major flight corridors in tropics and subtropics, where most commercial aviation occurs.

Our analysis examines how the distribution and extremes of vertical velocity change both near and far from deep convection. We use updraft probability density functions and exceedance fractions for aviation-relevant thresholds, together with shear and stability diagnostics. With a global, storm‑resolving framework, we clarify how tropical upper‑tropospheric turbulence is changing and provide evidence that can guide future forecasting and route‑planning decisions in a warming climate.

How to cite: Gasparini, B. and Voigt, A.: Does a warmer climate lead to more bumpy flights in the tropics? Insights from a global km-scale global model, EGU General Assembly 2026, Vienna, Austria, 3–8 May 2026, EGU26-5941, https://doi.org/10.5194/egusphere-egu26-5941, 2026.

EGU26-7340 | ECS | Posters on site | CL4.14

Excessive equatorial light rain causes modeling dry bias of Indian summer monsoon rainfall 

Gudongze Li, Chun Zhao, Jun Gu, Jiawang Feng, Mingyue Xu, Xiaoyu Hao, Junshi Chen, Hong An, Wenju Cai, and Tao Geng

Simulating accurately the South Asian summer monsoon is crucial for food security of several South Asian countries yet challenging for global climate models (GCMs). The GCMs suffer from some systematic biases including dry bias in mean monsoon rainfall over the India subcontinent and excessive equatorial light rain between which the relationship was rarely discussed. Numerical experiments are conducted for one month during active monsoon with global quasi-uniform resolution of 60 km (U60 km) and 3 km (U3 km) separately. Evaluation with observations shows that U3 km reduces the dry bias over northern India and excessive light rain over the equatorial Indian Ocean (EIO) that are both prominent in U60 km. Excessive light rain in U60km contributes critically to stronger rainfall and latent heating over the EIO. A Hadley-type anomalous circulation is thus induced, whose subsidence branch suppresses updrafts and reduces moisture transport into northern India, contributing to the dry bias. The findings highlight the importance of constraining excessive light rain for regional climate projection in GCMs.

How to cite: Li, G., Zhao, C., Gu, J., Feng, J., Xu, M., Hao, X., Chen, J., An, H., Cai, W., and Geng, T.: Excessive equatorial light rain causes modeling dry bias of Indian summer monsoon rainfall, EGU General Assembly 2026, Vienna, Austria, 3–8 May 2026, EGU26-7340, https://doi.org/10.5194/egusphere-egu26-7340, 2026.

EGU26-8180 | Orals | CL4.14

Ocean Dynamics in Kilometre-Scale ICON Simulations 

Nils Brüggemann, Moritz Epke, Helmuth Haak, Peter Korn, and Leonidas Linardakis

We present the rich and versatile ocean dynamics emerging from a novel set of ICON ocean simulations with grid spacings around and below 1 km. 
Such configurations not only permit the explicit formation of submesoscale eddies but also enable a substantially richer representation of internal wave dynamics. 
We discuss the implications of these newly resolved processes for tracer transport, both by the explicitly resolved flow and through parameterized mixing processes. 
In particular, we demonstrate that submesoscale overturning along ocean fronts is explicitly resolved in these simulations. 
We further show how this overturning modifies density stratification and thereby interacts with small-scale turbulent processes. 
In addition, we demonstrate that the resolved portion of the internal wave spectrum is substantially extended at this resolution. 
Finally, we present first results illustrating how the improved representation of physical processes affects marine biogeochemistry. 
We conclude with an outlook on how these advances can improve the simulation of tropical upwelling systems in this new generation of ocean model configurations.

How to cite: Brüggemann, N., Epke, M., Haak, H., Korn, P., and Linardakis, L.: Ocean Dynamics in Kilometre-Scale ICON Simulations, EGU General Assembly 2026, Vienna, Austria, 3–8 May 2026, EGU26-8180, https://doi.org/10.5194/egusphere-egu26-8180, 2026.

EGU26-8397 | Posters on site | CL4.14

Resolving regional climate change with global kilometer-scale climate simulations 

Sun-Seon Lee, Ja-Yeon Moon, Axel Timmermann, Eun-Byeol Cho, Jan Streffing, and Thomas Jung

Accurately assessing regional climate change and its associated risks, particularly over complex terrain and coastal regions, remains challenging due to large uncertainties in conventional global climate models. Kilometer-scale coupled climate modeling offers a promising pathway by explicitly resolving mesoscale atmospheric and oceanic processes, their interactions with large-scale circulation, and air-sea coupling at regional scales. Here, we present global warming simulations conducted with the coupled OpenIFS-FESOM2 climate model (AWI-CM3) at atmospheric resolutions of 31 km (TCo319), 9 km (TCo1279), and 4 km (TCo2559), combined with a variable-resolution ocean mesh ranging from 4 to 25 km. All km-scale-resolution simulations were initialized from the trajectory of the 31 km transient simulation with the same ocean configuration. Compared to 31 km simulations, the km-scale simulations exhibit substantially enhanced regional detail, including mesoscale circulation features such as sea-land breezes, their influence on coastal climate, and a clearer sensitivity of local climate responses to global warming. Our results highlight the potential of cloud-permitting, km-scale coupled modeling to improve projections of regional climate change and extremes, advance understanding of local climate sensitivity, and support climate impact assessments and adaptation strategies.

How to cite: Lee, S.-S., Moon, J.-Y., Timmermann, A., Cho, E.-B., Streffing, J., and Jung, T.: Resolving regional climate change with global kilometer-scale climate simulations, EGU General Assembly 2026, Vienna, Austria, 3–8 May 2026, EGU26-8397, https://doi.org/10.5194/egusphere-egu26-8397, 2026.

EGU26-8863 | ECS | Posters on site | CL4.14

The simulation of the South China Sea by the variable resolution version of the global ocean general circulation model LICOM3.0 

Jiangfeng Yu, Jingwei Xie, Hailong Liu, Pengfei Lin, Zipeng Yu, and Jiahui Bai

We develop a variable-resolution method based on the tripolar grid to achieve fine-resolution regional simulations with limited computational resources. Based on the global ocean general circulation model LICOM3.0, we select the South China Sea (SCS) as the refined area and design five experiments to assess the impact of the variable-resolution grid on oceanic simulation. The results show that the method can retain the model capacity for global ocean simulation and obtain results in the refined region comparable to the reference global high-resolution model. Improving the resolution in the SCS from 0.1◦ to 0.02◦ significantly enhances the model performance in simulating submesoscale phenomena. The model can effectively reproduce submesoscale processes generated by frontogenesis, topographic wakes, and their seasonal variation. We uncover the effect of the submesoscale vortex train near the Luzon Strait. In summer, the vortex train tends to carry positive vorticity westward into the SCS and constrain the negative vorticity along the Kuroshio Current. In winter, the vortex train is more intrusive into the SCS with enhanced filament activities.

How to cite: Yu, J., Xie, J., Liu, H., Lin, P., Yu, Z., and Bai, J.: The simulation of the South China Sea by the variable resolution version of the global ocean general circulation model LICOM3.0, EGU General Assembly 2026, Vienna, Austria, 3–8 May 2026, EGU26-8863, https://doi.org/10.5194/egusphere-egu26-8863, 2026.

EGU26-9431 | Orals | CL4.14

Resolution control on SST–precipitation coupling in Western Boundary Currents 

Eduardo Moreno-Chamarro, Dian Putrasahan, Marco Giorgetta, and Sarah M. Kang

Western Boundary Currents (WBCs) are key regions of air–sea interactions, where oceanic variability can strongly influence the atmospheric circulation and precipitation. Despite growing observational evidence of local covariability between SST and precipitation anomalies along these currents, climate models still differ markedly in their ability to represent this coupling. In particular, it remains unclear which elements of model resolution and physical parameterizations control the emergence, strength, and spatial organization of the SST–precipitation relationship.

Here, we examine the sensitivity of local SST–precipitation covariability to oceanic and atmospheric resolution and to the representation of moist convection. We analyze a coordinated hierarchy of global simulations, including coarse-resolution CMIP6 models, eddy-permitting and eddy-resolving configurations of ICON and EC-Earth3P, a convection-permitting ICON experiment, and atmosphere-only simulations forced with mesoscale-resolving and smoothed SSTs. Using a consistent diagnostic framework across four major WBC systems, we assess how model design shapes both the amplitude and structure of the atmospheric response.

Our results show that resolving mesoscale ocean variability is essential for reproducing a localized precipitation response to SST anomalies. However, increasing resolution alone does not guarantee realism: high-resolution configurations often produce overly broad coupling, while disabling the convective parameterization weakens the response despite fine grid spacing. These findings highlight the need for a physically consistent treatment of ocean mesoscale dynamics and atmospheric convection to capture realistic air–sea coupling along WBCs, with implications for simulating extratropical precipitation and storm-track variability.

How to cite: Moreno-Chamarro, E., Putrasahan, D., Giorgetta, M., and M. Kang, S.: Resolution control on SST–precipitation coupling in Western Boundary Currents, EGU General Assembly 2026, Vienna, Austria, 3–8 May 2026, EGU26-9431, https://doi.org/10.5194/egusphere-egu26-9431, 2026.

EGU26-9694 | Posters on site | CL4.14

A hierarchy of high-resolution IFS-NEMO configurations for analysing climate variability and change 

Marc Batlle, Tobias Becker, Silvia Caprioli, Paolo Davini, Francisco J. Dobas-Reyes, Aina Gaya-Àvila, Supriyo Ghosh, Jost Von Hardenberg, Shane Hearne, Kai Keller, Sebastian Milinski, Nuno Monteiro, Rebecca Murray-Watson, Matteo Nurisso, Pablo Ortega, Xabier Pedruzo-Bagazgoitia, Charles Pelletier, Carlos Peña, Ginka Van Thielen, and Cheng You

A suite of high-resolution configurations of the coupled climate model IFS-NEMO to investigate recent and future climate variability and change has been recently developed within the project EERIE (European Eddy-Rich Earth System Models) and the Destination Earth initiative. This contribution emphasises the climate responses emerging from these simulations and their sensitivity to spatial resolution and the experimental protocol considered.

The model hierarchy combines eddy-permitting (∼25 km) and eddy-rich (∼9 km) ocean components with convection-parameterised (∼25 km) and convection-permitting (∼4.5 km) atmospheric configurations, enabling a systematic assessment of resolution-dependent processes and feedbacks. Particular attention is given to how differences in model physics, resolution-aware tuning strategies, scenario forcing (i.e. SSP1-2.6 vs SSP3-7.0) and experimental design influence the simulated climate variability across configurations.

Ongoing analyses of historical simulations show enhanced performance for the higher-resolution configurations in the representation of mean-state properties, with especially clear improvements in dynamical fields. We further assess the extent to which the shorter spinup approach employed in Destination Earth, compared to EERIE, can reliably capture internal variability and externally forced responses while substantially reducing computational cost.

A systematically stronger future response of the Atlantic Meridional Overturning Circulation to external forcings is found in the eddy-resolving configurations compared to the eddy-permitting ones. Idealised control simulations with quadrupled CO2 forcing – inspired by the CMIP6 DECK experiments – also show a more pronounced temperature response at the highest resolution compared with the ∼25 km configuration, thus yielding stronger climate sensitivity.

More generally, we also briefly outline emerging applications of the kilometre-scale IFS-NEMO model in other European research projects, including TerraDT, which focuses on land–atmosphere coupling, and PREDDYCT, which investigates the role of mesoscale ocean eddies in seasonal-to-decadal climate prediction. Together, these efforts highlight the added scientific value of high-resolution climate modelling for understanding forced responses and informing future climate projections.

How to cite: Batlle, M., Becker, T., Caprioli, S., Davini, P., Dobas-Reyes, F. J., Gaya-Àvila, A., Ghosh, S., Von Hardenberg, J., Hearne, S., Keller, K., Milinski, S., Monteiro, N., Murray-Watson, R., Nurisso, M., Ortega, P., Pedruzo-Bagazgoitia, X., Pelletier, C., Peña, C., Van Thielen, G., and You, C.: A hierarchy of high-resolution IFS-NEMO configurations for analysing climate variability and change, EGU General Assembly 2026, Vienna, Austria, 3–8 May 2026, EGU26-9694, https://doi.org/10.5194/egusphere-egu26-9694, 2026.

EGU26-9952 | ECS | Posters on site | CL4.14

Do km-scale models better simulate near-surface winds? 

Sreedev Sreekumar, Alon Azoulay, Arne Leuzinger, and Stephanie Fiedler

Realistic simulations of near-surface wind speeds are important for many reasons, including an accurate characterisation of storm effects on dust-particle emissions. Km-scale models are expected to represent winds including their extremes more realistically by explicitly resolving mesoscale dynamics; however, the extent to which they outperform coarser-resolution models has not yet been systematically assessed. In this study, we conduct a multi-dataset, multi-resolution comparison of sub-daily near-surface wind speeds and the dust uplift potential (DUP) for North African dust regions for the period 1994–2014. The analysis integrates recently developed global km-scale climate simulations from ICON (Icosahedral Nonhydrostatic) and IFS (Integrated Forecasting System), reanalysis products including ERA5 (ECMWF Reanalysis v5) and MERRA-2 (Modern-Era Retrospective Analysis for Research and Applications, Version 2), historical climate simulations from CMIP5 and CMIP6 (Coupled Model Intercomparison Projects), as well as observational data from surface meteorological stations. In addition to statistical analyses of the sub-daily winds across these datasets, we have applied a machine-learning technique to pinpoint the weather patterns that drive wind differences across the models.

The results highlight that the two kilometre-scale models ICON and IFS show an overall improved representation of observed surface wind speed distributions, along with reanalysis products, compared to coarser-resolution CMIP models. However, the level of agreement varies with region, season, and time of day. For instance, winds in the Sahel region show higher consistency with observed wind speed distributions for all models, whereas substantially larger deviations occur over the Bodélé Depression, which is the world’s most active dust source, in the coarser-resolution simulations of CMIP compared to observations. The largest inter-model differences are seen during boreal winter (December–February), when northeasterly Harmattan winds often occur, and are most pronounced during the early morning hours (06 - 09 UTC), pointing to the breakdown of nocturnal low-level jets. This work provides an assessment of the strengths and limitations of contemporary global datasets for simulating dust-relevant winds over North Africa and provides a reference framework for evaluating upcoming model output from CMIP7 historical experiments.

How to cite: Sreekumar, S., Azoulay, A., Leuzinger, A., and Fiedler, S.: Do km-scale models better simulate near-surface winds?, EGU General Assembly 2026, Vienna, Austria, 3–8 May 2026, EGU26-9952, https://doi.org/10.5194/egusphere-egu26-9952, 2026.

EGU26-10714 | Orals | CL4.14

km Scales Hacked at Global Scale 

Florian Ziemen, Lukas Kluft, Tobias Kölling, Andrew Gettelman, Fabian Wachsmann, Mark Muetzefeldt, Thomas Rackow, and Tina Odaka

km-scale climate models promise unprecedented insights into fine-scale processes, but their massive data volumes and heterogeneous formats pose critical challenges for analysis or even multi-model intercomparison. We addressed these barriers through a global hackathon involving 600+ participants across 10 nodes who collaboratively analyzed outputs from diverse km-scale regional and global climate models, largely from the DYAMOND 3 intercomparison.

We enabled the intercomparison by standardizing all datasets to a common HEALPix grid, providing them as cloud-accessible Zarr stores indexed with Intake and deploying a unified Python environment via JupyterHub at the hackathon nodes. This infrastructure avoided the download-and-scan pattern common with large NetCDF collections, enabling faster interactive workflows.

Concise tutorials and this infrastructure enabled all participating teams—regardless of background or resources—to interactively explore km‑scale features such as extreme precipitation, mesoscale organization, and fine‑scale ocean–atmosphere coupling across models.

We present the technical workflow and lessons learned from rapidly deploying this infrastructure across distributed nodes and invite the community to explore these openly accessible datasets at https://digital-earths-global-hackathon.github.io/catalog .

How to cite: Ziemen, F., Kluft, L., Kölling, T., Gettelman, A., Wachsmann, F., Muetzefeldt, M., Rackow, T., and Odaka, T.: km Scales Hacked at Global Scale, EGU General Assembly 2026, Vienna, Austria, 3–8 May 2026, EGU26-10714, https://doi.org/10.5194/egusphere-egu26-10714, 2026.

EGU26-11190 | Orals | CL4.14

 Century-long global kilometre-scale climate simulations with the eddy-rich IFS–FESOM coupled model 

Rohit Ghosh, Suvarchal Kumar Cheedela, Sebastian Beyer, Nikolay Koldunov, Stella Berzina, Audrey Delpech, Chathurika Wikramage, Stephy Libera, Matthias Aengenheyster, Amal John, Armelle Remedio, Patrick Scholz, Dmitry Sidorenko, Jan Streffing, Fabian Wachsmann, and Thomas Jung

We present novel century-long global climate simulations at kilometre-scale resolution performed with the coupled IFS–FESOM climate model, featuring a ~9 km atmospheric component and an ocean with a minimum grid spacing of ~5 km. Following the HighResMIP protocol, the experimental design comprises a 50-year high-resolution coupled spin-up, a 65-year historical simulation (1950–2014), a future scenario simulation (SSP2-4.5, 2015–2050), and a 100-year control simulation using fixed 1950 radiative forcing. This framework enables the explicit representation of ocean mesoscale eddies within a long-term global climate context.

Compared to CMIP6-class models, the simulations exhibit an overall improved mean climate state and a reduction of long-standing systematic biases, with the exception of remaining deficiencies in the polar regions. Global performance metrics indicate reduced errors in near-surface temperature, winds, and cloud properties. The eddy-rich ocean configuration realistically captures boundary-current variability and mesoscale dynamics, leading to improved sea-surface salinity distributions and a strengthened Atlantic Meridional Overturning Circulation, with a peak transport of approximately 20 Sv. Internal climate variability is well represented, including a realistic El Niño–Southern Oscillation characterized by a quasi-periodicity of ~4–5 years and physically consistent teleconnection patterns.

Despite persistent sea-ice and high-latitude biases, the coupled system remains stable over centennial time scales with minimal long-term drift. These results demonstrate the feasibility and scientific value of global coupled climate simulations operating in the ocean eddy-rich regime at sub-10 km resolution. The IFS–FESOM kilometre-scale configuration thus represents a significant step forward in the development of next-generation Earth system models that robustly bridge global climate dynamics and regional-scale processes over multi-decadal to centennial periods.

How to cite: Ghosh, R., Cheedela, S. K., Beyer, S., Koldunov, N., Berzina, S., Delpech, A., Wikramage, C., Libera, S., Aengenheyster, M., John, A., Remedio, A., Scholz, P., Sidorenko, D., Streffing, J., Wachsmann, F., and Jung, T.:  Century-long global kilometre-scale climate simulations with the eddy-rich IFS–FESOM coupled model, EGU General Assembly 2026, Vienna, Austria, 3–8 May 2026, EGU26-11190, https://doi.org/10.5194/egusphere-egu26-11190, 2026.

EGU26-12354 | ECS | Orals | CL4.14

Upscale influences of tropical convection on atmospheric circulation in kilometre-scale climate simulations 

Ashar Aslam, John Marsham, Ben Maybee, Douglas Parker, Juliane Schwendike, James Bassford, Steven Böing, Lorenzo Tomassini, Richard Jones, and Huw Lewis

Deep moist convection within the Tropics plays an important role in the vertical transport and mixing of energy, heat, and moisture within the atmosphere, leading to notable upscale impacts on broader atmospheric circulation. However, the representation of moist convection and how it influences larger-scale atmospheric dynamics remains a challenge in weather and climate prediction, particularly within global models. The development of large-domain convection-permitting models (CPMs) at the kilometre-scale have transformed the way in which convection and its related processes and scale interactions can be both represented and investigated. Such simulations are now increasingly important for training machine-learning models, as well as for science and direct prediction. The UPSCALE project, funded by the UK Met Office, is evaluating a hierarchy of global and pan-tropical and limited area simulations of the Unified Model, and using this hierarchy to explore convection-driven scale-interactions. Here, we test the hypothesis that an improved representation of organisation of tropical convection in CPMs, primarily through mesoscale convective systems (MCSs) and their associated 'footprints', improves modelled upscale influences of convection on larger-scale atmospheric dynamics, such as those associated with Hadley and Walker circulations. We explore the role of MCSs in atmospheric heating and vertical transport, comparing various dynamical and thermodynamical relationships within large-domain convection-permitting climate simulations, relative to convection-parameterised counterparts and observations.

How to cite: Aslam, A., Marsham, J., Maybee, B., Parker, D., Schwendike, J., Bassford, J., Böing, S., Tomassini, L., Jones, R., and Lewis, H.: Upscale influences of tropical convection on atmospheric circulation in kilometre-scale climate simulations, EGU General Assembly 2026, Vienna, Austria, 3–8 May 2026, EGU26-12354, https://doi.org/10.5194/egusphere-egu26-12354, 2026.

EGU26-12740 | ECS | Orals | CL4.14

North Atlantic response to a quasi-realistic Greenland meltwater forcing in eddy-rich EC-Earth3P-VHR hosing simulations 

Eneko Martin-Martinez, Eduardo Moreno-Chamarro, Fraser William Goldsworth, Jin-Song von Storch, Cristina Arumí-Planas, Daria Kuznetsova, Saskia Loosveldt-Tomas, Pierre-Antoine Bretonnière, and Pablo Ortega

The vast majority of studies examining the impact of freshwater from ice sheet melting on the Atlantic Meridional Overturning Circulation (AMOC) use climate models that cannot resolve mesoscale ocean processes and do not include an accurate spatio-temporal distribution of the freshwater forcing. These two factors critically affect the nature of the AMOC response. Our study fills that gap with a set of three hosing experiments using a perpetual 1950 radiative forcing with the global configurations of the eddy-rich climate model EC-Earth3P-VHR. The model is forced for 21 years with a spatial and monthly distribution of Greenland meltwater fluxes derived from observations. An annual average close to 0.04 Sv is included, in addition to the model river runoff, which is spread in the upper ocean’s coastal points connected to each hydrological basin. 

Within the first year, we observe a response of reduced salinity in the Greenland and Labrador currents. Since the beginning of the experiments, these currents also suffer an acceleration and cooling due to the enhanced stratification produced by the freshwater. The impact of the freshwater induced changes also leads to a rapid weakening of the AMOC at subpolar latitudes.  Around year 7, deep mixing in the Labrador Sea begins to weaken due to as freshwater anomalies accumulate through lateral exchanges with the boundary currents. This shallowing of the mixed layer further weakens the AMOC, resulting in a stronger reduction that reaches also the subtropical latitudes. By the end of the simulation, the AMOC has weakened by almost 3 Sv at subpolar latitudes (i.e. a decrease of around 20 %), with an average relative decrease of 10 % for the whole Northern Hemisphere. The reduction in the AMOC is strong enough for some global climate impacts to emerge, such as the “bipolar seesaw” temperature response.

How to cite: Martin-Martinez, E., Moreno-Chamarro, E., Goldsworth, F. W., von Storch, J.-S., Arumí-Planas, C., Kuznetsova, D., Loosveldt-Tomas, S., Bretonnière, P.-A., and Ortega, P.: North Atlantic response to a quasi-realistic Greenland meltwater forcing in eddy-rich EC-Earth3P-VHR hosing simulations, EGU General Assembly 2026, Vienna, Austria, 3–8 May 2026, EGU26-12740, https://doi.org/10.5194/egusphere-egu26-12740, 2026.

Human-induced global warming manifests as a distinct spatial pattern of changes in temperature and precipitation extremes. IPCC assessments of such changes are primarily based on models of the latest Coupled Model Intercomparison Project (CMIP6), which are limited in their representation of local details due to their rather coarse resolution of 50-200km. Here, we test if the first multi-decadal simulations with two fully-coupled km-scale global climate models (ICON and IFS), project greater or smaller local changes in extremes in response to global warming, focusing on annual minimum and maximum temperature, as well as on extreme precipitation. 

Using spatially pooled rank histograms of changes, we find that IFS behaves remarkably similarly to the CMIP6 multi-model mean in many cases, indicating a very low range of local trends across the globe despite its high resolution. ICON, in turn, shows a much broader range with more strongly positive or negative local trends than any of the CMIP6 models. However, while this leads to ICON being more similar to the observation-based ERA5, further analysis also reveals that this behavior is, at least partly, caused by unrealistic change signals in some regions, where local extreme temperature changes can exceed 15K per degree of global warming even in the historical period. 

Notably, both km-scale models show a higher fraction of strong positive trends in extreme precipitation than CMIP6 models. This is a promising result as CMIP6 models have previously been shown to underestimate the area fraction experiencing a strong intensification in extreme precipitation. Both ICON and IFS also show considerably more spatial detail than CMIP6, in particular along coastlines and mountain ranges, and, in some cases, even capture the influence of large rivers on change signals. 

Our results clearly demonstrate the potential of km-scale models for resolving sharp gradients in change signals, but also reveal remaining shortcomings of this new model generation. In this first analysis, we, hence, find no robust evidence that changes in daily extremes are consistently different between CMIP6 and km-scale models, but our results highlight that more and longer model experiments are needed to robustly quantify extremes in this new generation of models. These findings are particularly relevant as km-scale models are envisioned to serve as the basis for Digital Twins of Earth, which, in turn, are supposed to inform impact assessments and support mitigation and adaptation decisions.

How to cite: Brunner, L. and Fischer, E. M.: Do km-scale global models reshape our understanding of local changes in temperature and precipitation extremes?, EGU General Assembly 2026, Vienna, Austria, 3–8 May 2026, EGU26-12773, https://doi.org/10.5194/egusphere-egu26-12773, 2026.

EGU26-14304 | Orals | CL4.14

Bridging mesoscale ocean dynamics and large-scale climate in 1° models 

Camille Li, Harikrishnan Ramesh, Aleksi Nummelin, and Ingo Bethke

Climate models are commonly run at resolutions too coarse to resolve mesoscale ocean dynamics, and therefore lack oceanic eddies and fronts that strongly influence air-sea exchange. This leads to an underestimation of the ocean’s role in driving atmosphere–ocean interactions in western boundary current regions, with implications for simulated climate variability and change. We explore whether the effects of mesoscale sea surface temperature (SST) features on large-scale circulation can be represented in a standard resolution climate model using a partially coupled “pacemaker” configuration of the Norwegian Earth System Model version 2 (NorESM2). The setup introduces mesoscale SST features from a high-resolution (0.125°) ocean into the standard-resolution coupled model grid (1° ocean and atmosphere). Focusing on the Kuroshio Current, we find that mesoscale SST features amplify ocean-to-atmosphere turbulent heat fluxes, as expected, and also produce notable free tropospheric responses (a robust local strengthening of the North Pacific storm track at low levels and a poleward shift aloft). The results offer a proof of concept that 1° climate models can capture the broader climate impacts of small-scale oceanic variability without explicitly resolving it, opening promising pathways to improve predictions and projections.

How to cite: Li, C., Ramesh, H., Nummelin, A., and Bethke, I.: Bridging mesoscale ocean dynamics and large-scale climate in 1° models, EGU General Assembly 2026, Vienna, Austria, 3–8 May 2026, EGU26-14304, https://doi.org/10.5194/egusphere-egu26-14304, 2026.

EGU26-14566 | Posters on site | CL4.14

Coupling techniques in the new high-resolution SHiELD: implicit land-atmosphere coupling. 

Joseph Mouallem, Sergey Malyshev, Kun Gao, Zhihong Tan, Lucas Harris, Rusty Benson, Elena Shevliakova, Linjiong Zhou, Niki Zadeh, and Jan-Huey Chen

As part of the development of GFDL’s new high resolution, seamless weather to S2S to climate timescale coupled model,  we present the integration of GFDL’s atmospheric model SHiELD and land model LM4, enabling a suite of Earth system interactions, including extreme hydroclimate events, ecological droughts, and fires. This work details the implementation strategy and technical challenges of integrating GFDL’s LM4 with dynamic subgrid tiling capabilities within SHiELD capable of kilometer-scale global and global-nested simulation. In addition, this effort demonstrates how GFDL terrestrial components designed for implicit flux coupling could be integrated with SHiELD  physics designed for an explicit atmospheric solver. The primary objective is to extend SHiELD from an uncoupled atmospheric model, in which land processes are treated as a part of the atmospheric physics package, to a fully coupled high resolution atmosphere-ocean-land-ice-wave model leveraging GFDL’s FMS full coupler infrastructure. This enhanced coupling enables more accurate simulations of land-surface feedbacks, cryosphere and hydrological processes, and extreme weather events such as flooding and abrupt changes in aerosols emissions from fires. We demonstrate the model’s capability through validation test cases. The results underscore the importance of robust land-atmosphere coupling for high-resolution prediction and provide a framework for future development of fully coupled Earth system models of high resolution for forecast and earth system prediction applications.

How to cite: Mouallem, J., Malyshev, S., Gao, K., Tan, Z., Harris, L., Benson, R., Shevliakova, E., Zhou, L., Zadeh, N., and Chen, J.-H.: Coupling techniques in the new high-resolution SHiELD: implicit land-atmosphere coupling., EGU General Assembly 2026, Vienna, Austria, 3–8 May 2026, EGU26-14566, https://doi.org/10.5194/egusphere-egu26-14566, 2026.

EGU26-15560 | Posters on site | CL4.14

UXarray: A Python package for the analysis of kilometer-scale atmosphere and ocean model outputs 

John Clyne, Hongyu chen, Orhan Eroglu, Robert Jacob, Rajeev Jain, Brian Medeiros, Paul Ullrich, and Colin Zarzycki

UXarray is a community-developed Python package that extends the widely used Xarray ecosystem with native support for horizontally unstructured meshes, eliminating the need for costly, problematic regridding prior to visualization and analysis. Designed to meet the growing demands of kilometer-scale climate and weather models, UXarray aims to become a preeminent tool for the analysis, visualization, and postprocessing of Earth system data on irregular grids. It has been used in practice across a wide range of high-resolution atmospheric and ocean models, including MPAS, CAM-SE, E3SM, FESOM2, IFS, and ICON.

Recently, UXarray played a key role in the 2025 WCRP Digital Earth – Global Hackathon (DEGH), where over 600 researchers, spanning four continents, collaborated to explore km-scale outputs, contributed from 11 different modeling centers from around the world. The use of UXarray was essential to fulfilling hackathon objectives, such as promoting global collaboration, sharing best-practice in process-based analysis of km-scale simulations, developing practical km-scale analysis workflows, and facilitating model intercomparison.

This presentation will highlight UXarray’s current capabilities—including visualization tools and foundational analysis operators—share insights from the DEGH experience, outline future development plans, and highlight ways that the community can engage to shape the package moving forward.

How to cite: Clyne, J., chen, H., Eroglu, O., Jacob, R., Jain, R., Medeiros, B., Ullrich, P., and Zarzycki, C.: UXarray: A Python package for the analysis of kilometer-scale atmosphere and ocean model outputs, EGU General Assembly 2026, Vienna, Austria, 3–8 May 2026, EGU26-15560, https://doi.org/10.5194/egusphere-egu26-15560, 2026.

EGU26-18545 | ECS | Posters on site | CL4.14

A model-based assessment of the climate impacts of the observed AMOC weakening and their sensitivity to model resolution 

Cristina Arumí-Planas, Eneko Martin-Martinez, Bernardo Maraldi, Marta Brotons, Eduardo Moreno-Chamarro, Rein Haarsma, Nuno Monteiro, Marvin Axness, Daria Kuznetsova, Artur Viñas, Pierre-Antoine Bretonnière, and Pablo Ortega

Current observations of the Atlantic Meridional Overturning Circulation (AMOC) from the RAPID array show a long-term weakening of nearly 2 Sv since 2004, which would be expected to have produced noticeable and widespread climate impacts. However, these impacts are challenging to isolate in  observations because they are confounded by concurrent global warming signals that also induce long-term trends. To study the impacts associated with persistent AMOC weakening, studies typically rely on long runs forced with freshwater perturbations. The highly idealized nature of these experiments, together with the primary use of low resolution models, limits their applicability to AMOC-related impacts over the recent historical period. 


Here, we propose an alternative approach based on the analysis of a large ensemble of control simulations, in which the confounding anthropogenic trends are avoided. We use a total of 14 global coupled simulations from the HighResMIP exercise and the EERIE project. Eight of these simulations were performed with eddy-rich ocean configurations (with a horizontal resolution of about 8 km in mid-latitudes), while the remaining simulations represent the low-resolution counterparts of six of the former. In these runs, we first select 19-year periods in which the AMOC trends are comparable in magnitude to that observed by the RAPID array for 2005-2023 and then produce the associated composites describing the concomitant trends in sea level pressure, surface atmospheric temperature, and precipitation. We compare the composites across resolutions to determine whether and how resolving mesoscale eddy interactions enable different climate impacts. We also repeat the analyses for the few cases in which the simulated trends are at least 50 % stronger than in RAPID, to learn about the potential future changes to come if the observed weakening trend intensifies.

How to cite: Arumí-Planas, C., Martin-Martinez, E., Maraldi, B., Brotons, M., Moreno-Chamarro, E., Haarsma, R., Monteiro, N., Axness, M., Kuznetsova, D., Viñas, A., Bretonnière, P.-A., and Ortega, P.: A model-based assessment of the climate impacts of the observed AMOC weakening and their sensitivity to model resolution, EGU General Assembly 2026, Vienna, Austria, 3–8 May 2026, EGU26-18545, https://doi.org/10.5194/egusphere-egu26-18545, 2026.

EGU26-19900 | Posters on site | CL4.14

Global 2.8 km coupled simulations with the Integrated Forecasting System 

Thomas Rackow, Matthias Aengenheyster, Tobias Becker, Xabier Pedruzo-Bagazgoitia, Nils-Arne Dreier, Manuel Reis, Fabian Wachsmann, and Florian Ziemen

Global kilometre‑scale modelling is advancing rapidly, supported by international efforts such as the 2025 global km‑scale hackathon (HK25) and the development of km-scale models in the nextGEMS, EERIE, and Destination Earth projects. As part of HK25, ECMWF produced two dedicated global coupled IFS–FESOM simulations and one atmosphere-only IFS (AMIP) simulation, representing one of the highest‑resolution global datasets currently available. Here we present the simulation setups, describe the creation of cloud and analysis-ready datasets, and showcase some initial results.

The simulations employ a fully coupled atmosphere–ocean–sea‑ice system at 2.8 km atmospheric resolution and around 5km in the ocean, explicitly resolving mesoscale ocean eddies, tropical cyclone cold wakes, and fine‑scale sea‑ice structures. The two coupled simulations differ only in their representation of atmospheric deep convection. Cloud‑ready Zarr output on the HEALPix grid enabled efficient analysis and remote access from the different HK25 nodes word-wide, and supported a number of case studies.

These 2.8 km simulations will form a core contribution to the DYAMOND3 intercomparison, providing some of the first fully coupled global simulations at this scale for coordinated intercomparison. Beyond this, the simulations enable unprecedented investigation of ocean–atmosphere interactions, including air–sea fluxes, mesoscale SST–atmosphere coupling, and the influence of ocean variability on extreme events.

How to cite: Rackow, T., Aengenheyster, M., Becker, T., Pedruzo-Bagazgoitia, X., Dreier, N.-A., Reis, M., Wachsmann, F., and Ziemen, F.: Global 2.8 km coupled simulations with the Integrated Forecasting System, EGU General Assembly 2026, Vienna, Austria, 3–8 May 2026, EGU26-19900, https://doi.org/10.5194/egusphere-egu26-19900, 2026.

EGU26-20852 | ECS | Orals | CL4.14

Increased Dry Spells in Response to Explicitly Resolved Convection in High-Resolution Earth System Models 

Jonathan Wille, Lukas Brunner, and Erich Fischer

A warming climate is increasing both the severity and extent of drought conditions globally. The economic, agricultural, and environmental impacts are far ranging with recent examples of European forest health deterioration and falling hydroelectric output in China. Recent observed trends reveal longer dry spell lengths by 1-2 days per decade across northeast South America, southern North American, southern Africa. Further increases in temperature and atmospheric moisture are projected to exacerbate hydrological extremes through enhanced soil desiccation and less precipitation spatial evenness.

While most climate model predict increases in drought frequency and duration in response to rising greenhouse gases, there is still much uncertainty in how CMIP5/CMIP6 models simulate sub-daily precipitation patterns and how that effects future dry spell projections. The relatively coarse resolution, lack of ocean-atmosphere coupling, and parameterization of convection leads to the simulation of precipitation that is overly frequent, yet weaker in intensity, thus leading to shorter simulated dry spells. However, simply increasing model resolution when at the kilometer-scale does not necessary ensure better accuracy in convective organization and precipitation intensity.

On a regional scale, increasing model resolution and explicitly resolving convection normally leads to an improvement in convective precipitation patterns and dry spells, yet this is still unproven at a global scale. Here, the Next Generation Earth Modelling Systems (nextGEMS) project aims to address these issues with the development of convection-permitting, fully-coupled, Earth-system models. Using the ECMWF Integrated Forecast System (IFS) and Icosahedral Nonhydrostatic Weather and Climate Model (ICON), we examine the spatial distribution on hourly and daily precipitation and how this influences the simulation of the longest annual dry spells across the global mid-latitudes, experimenting with various kilometer scale resolutions and convection schemes.

Using ICON and IFS at resolutions ranging from 2.8–9 km over a 30 year historical (1990-2020) and a 30 year future (2020-2050) period, we find that explicitly resolving convection leads to a greater spatial concentration of weak (0.1 mm/hr), hourly precipitation occurrences when compared with IMERG observations, particularly over land. Within IFS, increasing resolution has no effect on spatial precipitation coverage, but turning off convection parametrization at 2.8 km leads to the most accurate representation. In the mid-21st century simulations, IFS and ICON predict a greater increase in precipitation concentration compared to CESM2 simulations. This translates to a greater increase in projected longest annual dry spell trends globally, with hotspots in northeast South America, southern North American, southern Africa, and southern Europe having increased dry spell trends of 10-20 days per decade compared to 0-5 days in CESM2. While the single run nextGEMS simulations are unable to capture natural variability, these results indicate a potential underestimation in future drought projections that warrants further investigation.

How to cite: Wille, J., Brunner, L., and Fischer, E.: Increased Dry Spells in Response to Explicitly Resolved Convection in High-Resolution Earth System Models, EGU General Assembly 2026, Vienna, Austria, 3–8 May 2026, EGU26-20852, https://doi.org/10.5194/egusphere-egu26-20852, 2026.

EGU26-21481 | ECS | Orals | CL4.14

Eddies and Fronts: Distinct roles of mesoscale SST features in modulating the North Atlantic Atmosphere 

Robert Sasse, Florian Sevellec, Arthur Coquereau, Gildas Cambon, and Thierry Huck

Mesoscale ocean features with spatial scales on the order of 100 km, including transient eddies and fronts, play a critical role in ocean–atmosphere interactions. Sea surface temperature (SST) provides a common framework for representing mesoscale ocean variability, motivating an examination of how different SST structures influence the atmosphere. In this study we investigate the atmospheric response to mesoscale eddies and fronts using Weather Research and Forecasting (WRF) simulations, applying three different SST forcing regimes.


Simulations are conducted from September 2005 to September 2006, a year characterized by a neutral wintertime North Atlantic Oscillation (NAO) index. To isolate the contributions of distinct mesoscale features, we design three 30-member ensembles that differ only in their SST forcing. The first ensemble is forced with a full-resolution SST field. The second ensemble uses a spatially smoothed SST field, generated by applying a Gaussian filter that removes features smaller than 300 km. The third ensemble uses a temporally smoothed SST field, generated by applying a low-pass filter that removes SST variability persisting for less than 90 days. Comparing these ensembles allow us to separate the atmospheric responses to general small-scale SST variability, transient mesoscale eddies, and quasi-stationary fronts.


The results suggest that transient mesoscale eddies primarily influence the upper troposphere, where enhanced upward fluxes of heat and moisture strengthen the subtropical jet. In contrast, quasi-stationary SST fronts, such as within the Gulf Stream, exert their strongest influence in the lower troposphere, where increased moisture fluxes enhance midlatitude precipitation. Together, these findings highlight the related yet distinct roles of different mesoscale ocean features in the North Atlantic atmosphere: transient eddies intensify the zonal subtropical jet, while fronts modulate meridional-depth cell.

How to cite: Sasse, R., Sevellec, F., Coquereau, A., Cambon, G., and Huck, T.: Eddies and Fronts: Distinct roles of mesoscale SST features in modulating the North Atlantic Atmosphere, EGU General Assembly 2026, Vienna, Austria, 3–8 May 2026, EGU26-21481, https://doi.org/10.5194/egusphere-egu26-21481, 2026.

EGU26-3334 | ECS | Posters on site | AS5.9

Simulation and Validation of UV–Visible Limb-Scattered Imaging Spectroscopy Based on SASKTRAN-HR 

Yujun Zhao, Guorui Jia, Zengren Li, Xiaohang Ma, Jialu Xu, and Huijie Zhao

UV–visible limb-scattered observations provide key information on the vertical distributions of trace gases in the middle atmosphere. As Earth-observing satellites progressively acquire large off-nadir limb-imaging capability, imaging spectroscopy is expected to further enhance the spatiotemporal information content of limb observations. However, existing models typically focus on single line-of-sight spectral radiance calculations and do not explicitly incorporate the instrument imaging chain, which hinders end-to-end assessment and broader application of limb-imaging spectrometers. In this study, starting from atmospheric composition and including selected instrument parameters, we implement UV–visible Earth limb-imaging spectral simulations and perform validation with quantitative error analysis.

The proposed approach builds a forward-simulation framework for UV–visible limb-imaging spectroscopy based on the SASKTRAN-HR radiative transfer engine, generating physics-based limb images and hyperspectral three-dimensional data cubes over 300–800 nm and 6–97 km. A three-dimensional atmospheric scene is constructed using CAMS reanalysis data (deriving air number density from pressure and temperature and incorporating ozone and sulfate aerosols, among others), while the upper-atmospheric background state is extended using the CIRA-86 model. The instrument imaging chain is further coupled, including field of view (FOV), spectral response function (SRF), and point spread function (PSF), to represent pixel-level spectral–spatial coupling effects.

Validation is conducted in the spectral domain. Simulated radiances are convolved to the effective spectral resolution of OSIRIS, and a height-by-wavelength evaluation is performed against a single OSIRIS limb scan (scan No. 54300035). Over 300–800 nm and 6–97 km, the simulations exhibit an overall systematic underestimation, with a mean absolute relative error (MARE) of 31.5% (median 25.1%). The dominant error source is attributed to discrepancies between the constructed atmospheric scene and the actual atmospheric state. Within the 20–55 km altitude range commonly used for trace-gas profile retrievals, the MARE is 10.9% (median 8.5%). Errors increase substantially above 80 km (MARE = 63.1%), likely related to stray light and reduced signal-to-noise ratio due to weak scattering signals. In addition, the simulated results are converted into pseudo-color imagery using the CIE 1931 color matching functions to enable a qualitative consistency check of limb radiance gradients and chromaticity variations.

This imaging-spectroscopy simulation framework provides a testbed for limb-imaging instrument design, development and evaluation of trace-gas retrieval algorithms, and satellite validation activities for current and future limb-imaging missions (e.g., ALTIUS).

How to cite: Zhao, Y., Jia, G., Li, Z., Ma, X., Xu, J., and Zhao, H.: Simulation and Validation of UV–Visible Limb-Scattered Imaging Spectroscopy Based on SASKTRAN-HR, EGU General Assembly 2026, Vienna, Austria, 3–8 May 2026, EGU26-3334, https://doi.org/10.5194/egusphere-egu26-3334, 2026.

Nitrous acid (HONO) is a key precursor of hydroxyl radicals (OH·), exerting an important influence on regional atmospheric oxidation capacity and the formation of ozone (O₃) and secondary aerosols. However, its multiple sources and complex formation pathways lead to substantial uncertainties in source apportionment and process constraints. In agricultural regions in particular, the contributions of soil microbial emissions and heterogeneous conversion on soil/aerosol surfaces remain poorly constrained by long-term observations, resulting in systematic underestimation in models.

To this end, leveraging our self-developed 2D MAX-DOAS remote-sensing observation network spanning typical regions across China, we conducted a two-year continuous campaign (2022–2023) at an agricultural site in Shouxian County, Anhui Province (32.44 °N,116.79 °E). Vertical profiles of HONO, NO₂, and aerosols were retrieved with the PriAM algorithm. Data consistency and instrumental stability were evaluated via dual-instrument intercomparison, enabling an investigation of HONO spatiotemporal variability, formation mechanisms, and estimated emission fluxes in agricultural environments.

The two systems showed excellent agreement for HONO, NO₂, and aerosols, with R² up to 0.90, demonstrating robust long-term stability. HONO exhibited pronounced near-surface accumulation, being mainly confined below 0.5 km and decreasing exponentially with altitude. Diurnal variations displayed a clear morning–evening bimodal pattern in spring, autumn, and winter, typically peaking at 09:00 and 16:00 Beijing time (BJT). In summer, this bimodality weakened due to enhanced photolysis and dilution associated with a deeper boundary layer, leading to a much smaller diurnal amplitude.

Seasonally, HONO emission fluxes showed a pronounced winter maximum and summer minimum. Winter accumulation was promoted by low temperature, high humidity, a shallow boundary layer, and sustained NO₂ supply. Autumn was mainly influenced by residual nitrogen inputs during harvest and straw burning, whereas spring enhancements were closely linked to increased soil emissions following fertilization during wheat regreening. In summer, stronger photolysis and more efficient vertical mixing inhibited accumulation. High-HONO events predominantly occurred under RH>70 % and T<10 °C, indicating that moist reactive interfaces and stable stratification jointly favor HONO formation and accumulation. Within ±2 weeks of fertilization, near-surface HONO, NO₂, and aerosol concentrations increased synchronously, with maximum enhancements of 1500 %, 200 %, and 700 %, respectively. The HONO/NO₂ ratio increased markedly after fertilization and decreased with altitude, suggesting direct HONO release from reactive nitrogen in soils via microbial processes, with additional contributions from heterogeneous NO₂ reactions on soil and aerosol surfaces. Potential Source Contribution Function (PSCF) analysis further indicated that elevated HONO during the spring fertilization period was dominated by local sources, with limited influence from long-range transport.

This study provides key vertically resolved observational evidence to quantitatively constrain the magnitude and spatiotemporal evolution of agriculturally driven HONO sources, thereby supporting improved HONO parameterization in regional chemical models and assessments of its impact on atmospheric oxidation capacity.

How to cite: Hu, W., Li, A., and Hu, Z.: Spatiotemporal distribution and formation mechanisms of HONO in agricultural areas based on long-term 2D MAX-DOAS observations, EGU General Assembly 2026, Vienna, Austria, 3–8 May 2026, EGU26-4353, https://doi.org/10.5194/egusphere-egu26-4353, 2026.

EGU26-4644 | Orals | AS5.9

UAV-based method for measuring CO2 emissions in forest ecosystems 

Shaomeng Li, Haijiong Sun, Keyu Chen, and Kui Zhang

Accurate quantification of carbon dioxide (CO2) emissions in forest ecosystems remains challenging because of pronounced spatial heterogeneity, complex terrain, and the coexistence of vertical and horizontal transport processes in the lower atmosphere. Conventional approaches, including eddy covariance (EC) towers, satellite remote sensing, and manned aircraft measurements, are typically limited to two-dimensional or spatially constrained observations and therefore cannot fully resolve three-dimensional CO2 exchange. In this study, a UAV-based observational platform is developed and evaluated to quantify CO2 transport in both horizontal and vertical directions over forest ecosystems. The system integrates a high-precision closed-path CO2 analyzer with a calibrated ultrasonic anemometer and applies complementary box-pattern and profile-pattern flight strategies within a mass-balance framework. Field experiments were conducted at the Qianyanzhou Experimental Station in southern China between 2023 and 2024, and UAV-derived fluxes were compared with long-term EC tower measurements. Vertical CO2 fluxes derived from profile-pattern measurements using the gradient method show strong agreement with EC observations across all seasons, demonstrating the capability of the platform to capture canopy-scale turbulent exchange. Box-pattern measurements further enable direct estimation of horizontal CO2 transport and reveal pronounced diurnal contrasts, with lateral advection dominating during morning and evening periods and vertical uptake prevailing under well-mixed midday conditions. Sensitivity analyses using multiple box sizes indicate that area-normalized net CO2 emissions are robust with respect to control-volume dimensions. Overall, this study demonstrates that UAV-based measurements provide a reliable and flexible approach for resolving three-dimensional CO2 transport in forest ecosystems, offering a valuable complement to conventional flux-tower observations, particularly in heterogeneous and complex terrains.

How to cite: Li, S., Sun, H., Chen, K., and Zhang, K.: UAV-based method for measuring CO2 emissions in forest ecosystems, EGU General Assembly 2026, Vienna, Austria, 3–8 May 2026, EGU26-4644, https://doi.org/10.5194/egusphere-egu26-4644, 2026.

EGU26-4782 | Posters on site | AS5.9

The SWUF-3D Drone Fleet: A Tool for High-Resolution In Situ Measurements of Wind Farm Aerodynamics 

Norman Wildmann and Johannes Kistner

Accurate prediction of wind turbine performance and structural loads relies on understanding the complex, three-dimensional nature of wind farm flows. This encompasses not only atmospheric boundary layer turbulence in the inflow but also the wake dynamics critical for turbines operating in array configurations.
We present results from the SWUF-3D drone fleet, a novel measurement system deployed at the WiValdi research park in Krummendeich. Following validation against wind tunnel tests and meteorological masts, the drone swarm captured synchronized, multi-point measurements of the flow field surrounding operational turbines. The dataset reveals detailed profiles of mean wind speed deficits and wake turbulence, while also resolving the distinct signatures of tip vortex decay. These results highlight the potential of drone swarms to serve as flexible, high-precision references for validating wake models. Furthermore, they provide a crucial validation tool for Doppler wind lidar retrievals, bridging the gap between intensive in situ campaigns and continuous, long-term remote sensing.

How to cite: Wildmann, N. and Kistner, J.: The SWUF-3D Drone Fleet: A Tool for High-Resolution In Situ Measurements of Wind Farm Aerodynamics, EGU General Assembly 2026, Vienna, Austria, 3–8 May 2026, EGU26-4782, https://doi.org/10.5194/egusphere-egu26-4782, 2026.

EGU26-5557 | Posters on site | AS5.9

Controlled-release validation of a UAV-based mass balance approach for quantifying methane emissions at two sites. 

Maria Tsivlidou, Jamie McQuilkin, Hugo Ricketts, and Grant Allen

Quantifying methane emissions from diffuse sources, including landfills and agricultural systems, is essential for improving emission inventories and assessing the effectiveness of mitigation measures in near-real time. Unmanned aerial vehicles (UAVs) provide a flexible and cost-efficient platform for atmospheric methane measurements, particularly in complex or difficult-to-access environments. However, confidence in UAV-derived emission estimates depends on robust validation and transparent uncertainty characterization. Despite the growing use of UAV-based quantification methods, systematic validation remains limited, and the lack of standardized validation procedures and consistent uncertainty reporting continues to hinder comparability across studies and limits confidence in reported emission rates. 

Here we evaluate a UAV-based mass balance approach for methane emission quantification using controlled-release experiments operated by the National Physical Laboratory at two UK sites: an isolated aerodrome providing an idealised test environment, and an operational agricultural facility with measurement transects positioned downwind of the controlled release to avoid interference from background sources. Controlled methane releases spanned a wide range of emission rates (0.02–40 kg h⁻¹) and included both point and extended source configurations representative of agricultural (manure) and landfill emission scenarios. Release rates were blind to the researchers prior to flux calculation. Methane concentrations were measured in situ using a Los Gatos Research GLA-133 analyser mounted on a DJI M600 UAV, with emissions quantified using downwind horizontal transects within a mass balance framework. We also present wind measurements from an onboard 2D sonic anemometer, which were compared with an on-site high-precision anemometer mast after accounting for UAV motion/orientation and compass calibration. Together, these data were used in a mass balance framework to assess the accuracy and operational robustness of the approach. Overall, comparison between known and estimated fluxes showed very good agreement (slope = 0.998; Pearson’s r = 0.98), with a mean bias of −24.5%.

This study supports the development and validation of UAV-based techniques for methane monitoring and highlights their potential for use in regulatory contexts and emission inventory verification. We further examine how environmental conditions, source geometry, and release characteristics influence agreement between estimated and controlled emission rates.

How to cite: Tsivlidou, M., McQuilkin, J., Ricketts, H., and Allen, G.: Controlled-release validation of a UAV-based mass balance approach for quantifying methane emissions at two sites., EGU General Assembly 2026, Vienna, Austria, 3–8 May 2026, EGU26-5557, https://doi.org/10.5194/egusphere-egu26-5557, 2026.

EGU26-6647 | ECS | Orals | AS5.9

Aerial Mapping of (Bio)aerosols Using Dual UAV Platforms in an Austrian Spruce Forest. 

Florian Wieland, Matthäus Rupprecht, Jasper Cameron, Lucie Farell, Jürgen Gratzl, Regina Hanlon, Jordan Horral, Julia Lane, Pascal Langer, Jordan Lavey, Gerhard Peller, Cayden Smedley, Philipp Sterlich, Peter J. Wlasits, David Schmale III, and Hinrich Grothe

Forests are dynamic sources and sinks of primary biological aerosol particles (PBAPs) that influence ecosystem health, atmospheric chemistry, and climate. However, the spatial and temporal distribution of these particles in and above forest canopies remains poorly understood. In this study, we deployed two complementary UAV platforms to characterize bioaerosol concentrations, composition, and environmental drivers in a spruce forest in Wienerwald, Lower Austria.

Sampling campaigns in June and July 2024 utilized a suite of sensors on the UAVs, including portable optical particle counters (POPS, 0.16 – 3.37 µm), impingers, and PM-, VOC & meteorological sensors. These aerial measurements were referenced against a ground station including a Wideband Integrated Bioaerosol Sensor (WIBS-5/NEO, 0.5 – 30 µm) and a Grimm 11-D (0.25 – 35.15 µm) aerosol spectrometer, and the same set of PM-, VOC & meteorological sensors. Two additional sampling days were conducted in June 2025 with additional UAV-based aerosol- and VOC-sampling.

We observed higher overall particle number concentrations at near-canopy altitudes (<5 m above canopy) compared to higher altitudes, with concentrations negatively correlated with total-VOC trends. In addition, we saw elevated overall particle concentrations above the canopy during morning hours, followed by a midday decrease that coincided with rising temperatures and falling relative humidity. The fluorescence data from the ground-based WIBS indicated that a substantial fraction of supermicron (>2.5 μm) particles were biological. Their fluorescence signature and elevated concentration at high relative humidities suggest a large contribution of fungal spores, which was confirmed by microscopy of samples from ground-based and, in 2025, UAV-mounted cascade impactor sampling. PBAP concentrations generally increased with high relative humidity, consistent with well-documented humidity-driven enhancements in biological particle release.

This multi-platform UAV approach provides a robust framework for resolving forest-atmosphere exchange processes, yielding critical data to improve atmospheric models and our understanding of ecosystem-climate feedback loops.

How to cite: Wieland, F., Rupprecht, M., Cameron, J., Farell, L., Gratzl, J., Hanlon, R., Horral, J., Lane, J., Langer, P., Lavey, J., Peller, G., Smedley, C., Sterlich, P., Wlasits, P. J., Schmale III, D., and Grothe, H.: Aerial Mapping of (Bio)aerosols Using Dual UAV Platforms in an Austrian Spruce Forest., EGU General Assembly 2026, Vienna, Austria, 3–8 May 2026, EGU26-6647, https://doi.org/10.5194/egusphere-egu26-6647, 2026.

EGU26-7123 | ECS | Posters on site | AS5.9

Integrating UAV-based CO2 and CH4 fluxes into an atmospheric transport model for surface flux attribution 

Abdullah Bolek, Theresia Yazbeck, Elias Wahl, Judith Vogt, Nathalie Ylenia Triches, Mark Schlutow, Elliot Pratt, Lara Oxley, Kseniia Ivanova, Nicholas Eves, Snajid Becker Kanakkassery, Martin Heimann, and Mathias Göckede

Uncrewed aerial vehicles (UAVs) are becoming an essential tool to monitor greenhouse gases (GHGs) such as carbon dioxide (CO2) and methane (CH4), particularly over the known sources such as landfills and industrial sites. UAV-based flux quantification over these sources is generally practiced by flying vertical curtain patterns at certain downwind distances to constrain the whole plume originating from the source and applying either mass balance or Gaussian plume inversion techniques for constraining the source strength. Extending this technique over natural ecosystems, however, requires attribution of multiple sources and sinks that contribute to the observed GHG mixing ratios, as opposed to the single well-defined sources typical for single-plume applications.

The objective of this study is to develop a UAV-based approach for CO2 and CH4 flux estimations over natural ecosystems. In the context of the STORDALENX25 campaign, we conducted multiple vertical curtain pattern flights over a sub-Arctic wetland. Using a backward Langrangian stochastic model (bLSmodelR), we estimated the areal extent (i.e. footprint) of all vertical flux curtains. UAV-based CO2 and CH4 fluxes calculated by the mass balance technique were then normalized using the estimated footprint area to obtain flux values per square meter. A comparison was made against eddy-covariance-tower-based flux reference calculations whenever both platforms footprints were approximately overlapping. Subsequently, calculated areal fluxes were aggregated together with land cover classes using random forest regression to estimate surface fluxes across the mire. Overall, this study demonstrates a pathway towards UAV-based surface flux estimations over natural ecosystems, resolving patch-level variability and thus reducing uncertainties in flux upscaling to the ecosystem level.

How to cite: Bolek, A., Yazbeck, T., Wahl, E., Vogt, J., Triches, N. Y., Schlutow, M., Pratt, E., Oxley, L., Ivanova, K., Eves, N., Kanakkassery, S. B., Heimann, M., and Göckede, M.: Integrating UAV-based CO2 and CH4 fluxes into an atmospheric transport model for surface flux attribution, EGU General Assembly 2026, Vienna, Austria, 3–8 May 2026, EGU26-7123, https://doi.org/10.5194/egusphere-egu26-7123, 2026.

EGU26-9448 | ECS | Orals | AS5.9

Quantifying landcover-specific fluxes over a heterogeneous landscape through coupling UAV-measured mixing ratios with transport models and eddy-covariance measurements 

Theresia Yazbeck, Abdullah Bolek, Mark Schlutow, Kseniia Ivanova, Lara Oxley, Nathalie Ylenia Triches, Nicholas James Eves, Elias Wahl, Sanjid Kanakkassery, Judith Vogt, Elliot Pratt, Martin Heimann, and Mathias Göckede

Many natural ecosystems are composed of heterogeneous patches differentiated by e.g. topography, wetness levels, or vegetation composition, leading to strong small-scale variability in surface–atmosphere exchange fluxes. Quantifying this variability remains challenging, as traditional approaches rely either on episodic point-scale measurements (e.g. chambers) or on eddy-covariance (EC) observations that integrate fluxes over large and spatially mixed footprints. Unmanned Aerial Vehicles (UAV) offer a unique observational capability to bridge this scale gap by providing flexible, high-resolution measurements of atmospheric trace gas distributions.

Here, we present a case study based in Stordalen Mire in subarctic Sweden, where we set-up a site-level inversion method to differentiate the flux rate signatures from different patch types. We used the LES-model EULAG (EUlerian LAGrangian) to simulate high-resolution flow patterns and benchmark the spatial variability of modelled concentrations with data from UAV-based grid surveys of CO2 and CH4 mixing ratio. Model evaluation showed an R2 exceeding 0.60, with model uncertainties mostly related to the transport model uncertainty and the UAV sampling footprint that does not evenly sample landcover types. The inversion fluxes were subsequently compared to patch-level chamber measurements of carbon fluxes from palsa, bog, and fen, and showed a good agreement in flux patterns across those patch types dominating the UAV-sampled footprint. To reduce the computational requirements and make the workflow more efficient, bLSmodelR, a backward Lagrangian stochastic (bLS) dispersion model, was added as an alternative transport model to inform the inversion. Results based on bLS transport in a standard setup showed comparable results to the LES model, while the reduced computation time allowed more degrees of freedom for refining the optimization.

Our results demonstrate the potential of UAV-based atmospheric measurements, combined with transport modelling, to resolve surface–atmosphere exchange heterogeneity within complex landscapes. Ongoing efforts aim to derive patch-level fluxes over the mire by integrating UAV-measured mixing ratios with eddy-covariance and chamber measurements collected within nested footprints during the STORDALENX25 campaign in summer 2025.

How to cite: Yazbeck, T., Bolek, A., Schlutow, M., Ivanova, K., Oxley, L., Triches, N. Y., Eves, N. J., Wahl, E., Kanakkassery, S., Vogt, J., Pratt, E., Heimann, M., and Göckede, M.: Quantifying landcover-specific fluxes over a heterogeneous landscape through coupling UAV-measured mixing ratios with transport models and eddy-covariance measurements, EGU General Assembly 2026, Vienna, Austria, 3–8 May 2026, EGU26-9448, https://doi.org/10.5194/egusphere-egu26-9448, 2026.

EGU26-10250 | ECS | Posters on site | AS5.9

Analysis of Vibration-Induced Errors in UAV-Mounted Optical Particle Measurements 

Kjell zum Berge, Martin Schön, Jens Bange, and Andreas Platis

Uncrewed Aircraft Systems (UAS) are rapidly becoming essential tools for high-resolution air quality monitoring. However, integrating low-weight and low-power sensors on UAS platforms introduces specific challenges that can impact data integrity. This study addresses a critical measurement artifact observed using Alphasense OPC-N3 optical particle counters mounted on a DJI Matrice 300. Immediately upon take-off, a reproducible reduction in Particle Number Concentration (PNC) of up to 60 % was detected. Through systematic experimentation, we isolated the source of this error, investigating both rotor downwash and platform-induced vibrations. Contrary to common assumptions regarding downwash effects, our results conclusively identify high-frequency propulsion vibrations as the primary cause of the significant underestimation of particle concentrations. We demonstrate that implementing mechanical decoupling measures successfully eliminates this artifact, restoring measurement accuracy during flight. These findings underscore the necessity for rigorous sensor characterization and integration strategies to ensure reliable mobile air quality data.

How to cite: zum Berge, K., Schön, M., Bange, J., and Platis, A.: Analysis of Vibration-Induced Errors in UAV-Mounted Optical Particle Measurements, EGU General Assembly 2026, Vienna, Austria, 3–8 May 2026, EGU26-10250, https://doi.org/10.5194/egusphere-egu26-10250, 2026.

EGU26-10718 | ECS | Orals | AS5.9

Using the SWUF-3D UAS fleet to determine heat flux characteristics in an Alpine valley 

Francesca M. Lappin, Almut Alexa, Andrea Wiech, and Norman Wildmann

Single multirotor uncrewed aerial systems (UASs) are rapidly moving towards operational profiling in the atmospheric boundary layer (ABL) because of their low cost and ease of operation. At the same time, these features allow researchers to deploy such systems for advanced campaign-based sampling strategies. Using a fleet of UASs allows the flexibility to sample the spatiotemporal structure of turbulence in the ABL. Such observations are particularly useful in complex terrain where it is difficult to sample with classical approaches. During the TEAMx campaign, the DLR SWUF-3D fleet of UASs was operated in a remote Alpine valley. Each SWUF-3D UAS is outfitted with a rapid response temperature sensor and can determine the 3D wind field at 5 Hz; these measurements are calibrated in-field against a sonic anemometer. The 3D box-pattern configuration of a UAS fleet hovers up to 18 min at fixed-position across the valley and allows spatial gradients to be calculated. In July 2025, 88 box-pattern fleet flights were completed across a range of weather conditions. Valley heating mechanisms are unique due to contributions in all three dimensions but rarely have the observations to characterize the volume effects. The flexibility of UAS deployment provides the opportunity to analyze the heating budget terms with in-situ observations. In valleys, the horizontal heat flux contribution is no longer negligible and varies with proximity to valley walls. After verifying the UAS fleet observations of heat flux against a sonic anemometer, the range of uncertainty is demonstrated. Then the heterogeneity of heat flux observations will be related to atmospheric stability using vertical UAS profiles throughout the diurnal cycle.

How to cite: Lappin, F. M., Alexa, A., Wiech, A., and Wildmann, N.: Using the SWUF-3D UAS fleet to determine heat flux characteristics in an Alpine valley, EGU General Assembly 2026, Vienna, Austria, 3–8 May 2026, EGU26-10718, https://doi.org/10.5194/egusphere-egu26-10718, 2026.

EGU26-10756 | Posters on site | AS5.9

Tomographic DOAS retrieval of NO2 distributions in an urban setup 

Mark Wenig, Manuel Henning, and Sheng Ye

We present a new Bayesian retrieval algorithm for tomographic reconstruction of nitrogen dioxide (NO2) distributions in urban environments using scanning LP-DOAS instruments. The approach utilizes crossing light paths from multiple DOAS instruments scanning different retroreflectors, enabling the retrieval of three-dimensional trace gas fields in an urban setting. Rather than directly inverting measurements to obtain a single concentration field, the method formulates the problem probabilistically and estimates the full posterior distribution of the NO₂ concentration field given the observations. Bayesian inference is employed to combine measurement information with prior knowledge on spatial structures. The posterior probability is derived from a likelihood function describing the statistical properties of the DOAS measurements and a prior probability encoding assumptions about spatial correlations, using Bayes’ theorem.

Prior knowledge on the NO2 field is parameterized through correlation lengths represented in Fourier space by a power-law power spectrum. The field realizations are generated from latent Gaussian variables and transformed into real space via inverse Fourier transform, ensuring physically plausible spatial smoothness while retaining flexibility to resolve sharp gradients typical for urban pollution sources. The forward model links these concentration fields to line-integrated DOAS observations along the intersecting measurement paths.

How to cite: Wenig, M., Henning, M., and Ye, S.: Tomographic DOAS retrieval of NO2 distributions in an urban setup, EGU General Assembly 2026, Vienna, Austria, 3–8 May 2026, EGU26-10756, https://doi.org/10.5194/egusphere-egu26-10756, 2026.

EGU26-10813 | ECS | Posters on site | AS5.9

A lightweight laser-based gas sensor and balloon UAV for spatial quantification of greenhouse gas fluxes in peatlands 

Patrick Hogan, Manuel Helbig, and Torsten Sachs

Drained peatlands can act as significant sources of greenhouse gases (GHG), in contrast to undisturbed peatlands which act as long-term carbon sinks. Rewetting measures can help to reduce the GHG emissions, however, obtaining accurate GHG flux estimates to evaluate the effectiveness of these measures is complicated by the spatial heterogeneity of many peatland sites.

To improve the spatial coverage of GHG flux estimates in these sensitive ecosystems, a new lightweight laser-based sensor is being developed capable of measuring concentrations of CO2, CH4, and N2O plus water vapor down to the ppb level. This sensor has a low power consumption and a total mass of less than 1 kg, allowing it to be mounted on a steerable balloon-drone (lighter than air unmanned aerial vehicle, LTA-UAV).

This study focuses on the development and evaluation of a measurement and analysis framework that will be applied to the LTA-UAV-borne sensor observations. Surface-atmosphere GHG fluxes will be estimated using two approaches: a vertical flux-gradient method and a mass continuity method, both based on concentration profiles acquired along vertical and horizontal flight paths. Profile data for testing these approaches are obtained using a tower-based gas analyser at an eddy-covariance instrumented peatland site. These measurements are used to assess the methodologies and the potential of the LTA-UAV system for GHG flux estimation at heterogeneous peatland sites.

How to cite: Hogan, P., Helbig, M., and Sachs, T.: A lightweight laser-based gas sensor and balloon UAV for spatial quantification of greenhouse gas fluxes in peatlands, EGU General Assembly 2026, Vienna, Austria, 3–8 May 2026, EGU26-10813, https://doi.org/10.5194/egusphere-egu26-10813, 2026.

EGU26-10970 | ECS | Posters on site | AS5.9

Optimizing the spectral analysis of SO2 MAX-DOAS measurements near coal-fired power plants 

Nina Radloff, Lucas Reischmann, Steffen Ziegler, and Thomas Wagner

Ground-based MAX-DOAS (Multi-Axis Differential Optical Absorption Spectroscopy) measurements are widely used to monitor atmospheric pollutants like e.g. NO2, HCHO or SO2 (nitrogen dioxide, formaldehyde or sulfur dioxide). However, measurements of SO2 in plumes from strong emission sources like coal-fired power plants remain challenging due to difficulties in choosing the optimum spectral range for the data analysis. Fit windows at short wavelengths cover the strongest SO2 absorption bands, but suffer from low intensity signals and spectral interference with the strong O3 absorption. Alternative fit windows have higher intensity signals, but cover weaker SO2 absorptions. This study presents a systematic investigation of the SO2 data analysis in different spectral ranges for MAX-DOAS measurements performed close to power plant plumes. In the early plume, the SO2 concentrations can vary strongly and can reach extremely high values close to the stack. The focus lies on improving the quality of the resulting SO2 dSCDs (differential slant column densities) through an optimized selection of spectral fitting windows for SO2 and NO2 under highly polluted conditions. 

How to cite: Radloff, N., Reischmann, L., Ziegler, S., and Wagner, T.: Optimizing the spectral analysis of SO2 MAX-DOAS measurements near coal-fired power plants, EGU General Assembly 2026, Vienna, Austria, 3–8 May 2026, EGU26-10970, https://doi.org/10.5194/egusphere-egu26-10970, 2026.

EGU26-11071 | Posters on site | AS5.9

Retrieval of AOD Products from MAX-DOAS Measurements: Improvements and Sinergy with CIMEL 

Andre Achilli, Paolo Pettinari, Elisa Castelli, Enzo Papandrea, Luca Di Liberto, Angelo Lupi, and Valeri Massimo

The institute for the atmospheric and climate science of the Italian national research council (CNR-ISAC) operates a Multi AXis – Differential Optical Absorption Spectroscopy (MAX-DOAS) instrument, capable to measure diffuse solar spectra in the Visible (VIS) and Ultra-Violet (UV) spectral ranges. This instrument, a SkySpec-2D system (https://airyx.de/item/skyspec/), has been installed at the Giorgio Fea observatory in San Pietro Capofiume (SPC), in the middle of the Po Valley, since 1st October 2021. It represents the first Italian MAX-DOAS instrument compliant with the Fiducial Reference Measurements for ground-based DOAS (FRM4DOAS) requirements.

Its spectra are routinely provided to the FRM4DOAS central facility, where are processed using the reference retrieval codes Mexican MAX-DOAS Fit (MMF) and the MAinz Profile Algorithm (MAPA) to derive aerosol extinction and NO2 vertical profiles.


In the last couple of years, in the frame of a European Space Agency (ESA) funded project, we developed an independent retrieval code, the DOAS optimal Estimation Atmospheric Profile (DEAP), for the retrieval of aerosol extinction and trace gases profiles from MAX-DOAS spectra. The DEAP performances have been assessed through the comparisons with the MMF and MAPA reference codes. The MAX-DOAS VIS spectra acquired at SPC are routinely processed by the DEAP code to retrieve aerosol extinction at 477 nm and NO2tropospheric profiles. Both the profiles can be vertically integrated to obtain the tropospheric Aerosol Optical Depth (AOD) and NO2 Vertical Column Density (VCD).


Since 2023, the Giorgio Fea observatory has also been equipped with a Cimel CE-318-T Sun-Sky Lunar Multispectral photometer. Being part of the AErosol RObotic NETwork (AERONET), its measurements are centrally processed to derive aerosol information including AOD, with a higher accuracy compared to the MAX-DOAS ones. A comparison between the AERONET (Cimel) and DEAP (SkySpec-2D) AOD revealed a systematic underestimation of MAX-DOAS AOD, especially during the days with a high aerosol load.


In this work, we present updates to the DEAP code aimed at improving the AOD products from MAX-DOAS spectra, investigating the sources of the observed discrepancy with respect to the AERONET products.    

How to cite: Achilli, A., Pettinari, P., Castelli, E., Papandrea, E., Di Liberto, L., Lupi, A., and Massimo, V.: Retrieval of AOD Products from MAX-DOAS Measurements: Improvements and Sinergy with CIMEL, EGU General Assembly 2026, Vienna, Austria, 3–8 May 2026, EGU26-11071, https://doi.org/10.5194/egusphere-egu26-11071, 2026.

EGU26-11135 | Orals | AS5.9

UV/Vis Stratospheric Air Mass Factors considering photochemistry at Marambio and Belgrano Antarctic stations 

Laura Gómez Martín, Cristina Prados Roman, Martyn P. Chipperfield, Michel van Roozendael, Olga Puentedura, Monica Navarro-Comas, Hector Ochoa, and Margarita Yela

Nitrogen dioxide (NO₂), ozone (O₃), chlorine dioxide (OClO), and bromine monoxide (BrO) are key constituents in stratospheric ozone chemistry and have been routinely observed for several decades using Differential Optical Absorption Spectroscopy (DOAS). To convert DOAS differential slant column densities (dSCDs) into geometry-independent vertical column densities (VCDs), accurate Air Mass Factors (AMFs) are required.

In this study, stratospheric AMFs for these four trace gases were calculated with the fully spherical radiative transfer model MYSTIC [Mayer, 2009] for the Antarctic stations Belgrano (78°S) and Marambio (64°S). Twilight photochemical effects were taken into account through a photochemical box model coupled to the TOMCAT/SLIMCAT three-dimensional model [Chipperfield et al., 2006]. Vertical concentration profiles generated by this model, were averaged along the corresponding light paths using a ray-tracing approach and subsequently implemented in the spherical radiative transfer calculations.

For validation, the derived AMFs and SCDs were evaluated against results from a pseudo-spherical radiative transfer model and against observed slant column densities of NO₂, O₃, OClO, and BrO measured by INTA MAX-DOAS instruments at both Antarctic sites. The modelled SCDs successfully reproduce the measurements within the error bars for NO₂, O₃ and OClO. In the case of BrO, its tropospheric contribution, not considered in the photochemical model, has to be taken into account to find a good agreement.

References

Mayer, B.: Radiative transfer code in the cloudy atmosphere, European Phys. J. Conferences, 1, 75–99, doi: 10.1140/epjconf/e2009-00912-1, 2009.

Chipperfield, M. P.: New version of the TOMCAT/SLIMCAT offline chemical transport model: intercomparison of stratospheric tracer experiments, Q. J. Roy. Meteor. Soc., 132, 1179–1203, doi:10.1256/qj.05.51, 2006.

How to cite: Gómez Martín, L., Prados Roman, C., Chipperfield, M. P., van Roozendael, M., Puentedura, O., Navarro-Comas, M., Ochoa, H., and Yela, M.: UV/Vis Stratospheric Air Mass Factors considering photochemistry at Marambio and Belgrano Antarctic stations, EGU General Assembly 2026, Vienna, Austria, 3–8 May 2026, EGU26-11135, https://doi.org/10.5194/egusphere-egu26-11135, 2026.

EGU26-11140 | ECS | Orals | AS5.9

Investigating NO-to-NO2 conversion in power plant plumes using combined stationary and mobile DOAS measurements 

Lucas Reischmann, Steffen Ziegler, Steffen Beirle, Sebastian Donner, Bianca Lauster, Nina Radloff, and Thomas Wagner

Nitrogen oxides (NOx= NO + NO2) are air pollutants of relevance for human health and atmospheric chemistry.  As part of the DiNO campaign (DOAS measurements to investigate NO-to-NO2 conversion in power plants), NO2 was measured in the exhaust plumes of the Niederaußem and Neurath lignite power plants in the western part of Germany. Motivated by the rapid chemical conversion of emitted NO to NO2 and the subsequent evolution towards an NO-NO2 equilibrium as the plume ages, three stationary MAX-DOAS instruments (Multi-AXis Differential Optical Absorption Spectroscopy) scanned the plumes up to a distance of 3.8 km from the source. A mobile DOAS instrument complemented the stationary observations and provided real-time mapping of horizontal NO2 distributions. This combination captured temporal and spatial variabilities in the NO2 concentrations under changing wind conditions.

These measurements also enable the investigation of plume dispersion under different atmospheric stability conditions. In particular, the influence of atmospheric stability on plume spread and the entrainment of ozone-rich surrounding air is examined, as these processes impact the rate of NO-to-NO2 conversion. Furthermore, the potential effect of spectral saturation of the NO2 absorption in DOAS retrievals during the early plume development was investigated.

How to cite: Reischmann, L., Ziegler, S., Beirle, S., Donner, S., Lauster, B., Radloff, N., and Wagner, T.: Investigating NO-to-NO2 conversion in power plant plumes using combined stationary and mobile DOAS measurements, EGU General Assembly 2026, Vienna, Austria, 3–8 May 2026, EGU26-11140, https://doi.org/10.5194/egusphere-egu26-11140, 2026.

EGU26-11607 | ECS | Orals | AS5.9 | Highlight

Observation of a Rotterdam plume event during CINDI-3 

Cedric Busschots, Pierre Gramme, Emmanuel Dekemper, Gytha Mettepenningen, Michel Van Roozendael, Helge Haveresch, Andreas Richter, Anja Schönhardt, Attahir Mainika, Simon Bittner, Alexandros-Panagiotis Poulidis, and Mihalis Vrekoussis

Between 21 May and 24 June 2024, the third Cabauw Intercomparison of UV-Vis DOAS Instruments (CINDI-3) took place. In addition to conventional PANDORA and MAX-DOAS instruments, three imaging instruments participated: the IMPACT instrument from the University of Bremen, and SEMPAS and the NO2 camera from the Royal Belgian Institute for Space Aeronomy. While the first two instruments sweep a linear array of fibers to construct a hypercube of the scene, the NO2 camera is a native imager which builds a hypercube by scanning in the spectral domain. Still, these three instruments pursue the same objective of improving both the temporal and spatial resolution of NO2 measurements, enabling new applications such as monitoring ship emissions and urban pollution at a street-level scale.

From 14 June until the conclusion of the CINDI-3 campaign, the three imagers were operated synchronously, thereby capturing both the temporal and spatial dynamics of the NO2 field in the direction of Rotterdam. This coordinated operation allows for a comparison between the differential slant column densities of the three imagers. On 17 June 2024, during the afternoon, an NO2 plume originating from the Port of Rotterdam was observed by all three imagers. The measurements acquired both prior to and during the plume event show good correlation among the instruments.

Throughout the CINDI-3 campaign, daily NO2 forecasts were provided based on the E-PRTR emission database using the FLEXPART-WRF dispersion model based on dynamically-downscaled GFS forecast data. To provide further insight for the plume event on 17 June, an ensemble of simulations using different planetary boundary layer schemes was carried out based on downscaled GFS and ERA5 meteorological data. The simulated plume location and the horizontal SCDs show good agreement with the observational results from the imaging instruments.

This contribution will highlight how a fortuitous event (the blowing of industrial pollution in the direction of the CINDI-3 campaign site) became an excellent test case for intercomparing non-conventional DOAS instruments, and how a plume dispersion model could both confirm the hypothesis of the distant plume origin and be validated by remote sensing instruments.

How to cite: Busschots, C., Gramme, P., Dekemper, E., Mettepenningen, G., Van Roozendael, M., Haveresch, H., Richter, A., Schönhardt, A., Mainika, A., Bittner, S., Poulidis, A.-P., and Vrekoussis, M.: Observation of a Rotterdam plume event during CINDI-3, EGU General Assembly 2026, Vienna, Austria, 3–8 May 2026, EGU26-11607, https://doi.org/10.5194/egusphere-egu26-11607, 2026.

EGU26-13108 | Posters on site | AS5.9

Intercomparison of HCHO column and profile retrievals from ground-based MAX-DOAS, FTIR and Pandora instruments 

Gaia Pinardi, Michel Van Roozendael, Martina M. Friedrich, Caroline Fayt, Bavo Langerock, Corinne Vigouroux, Isabelle De Smedt, Martine De Mazière, Steffen Beirle, Thomas Wagner, Martin Tiefengraber, and Alexander Cede

Ground-based MAX-DOAS, FTIR and Pandora remote sensing techniques provide complementary information on formaldehyde (HCHO) vertical columns and profiles. However, differences in vertical sensitivity and retrieval strategies can lead to systematic inconsistencies that complicate intercomparisons and satellite validation. The centralized FRM4DOAS processing framework offers a harmonized approach for MAX-DOAS retrievals currently providing non-official HCHO datasets. However recent results at the Xianghe site (China) revealed a systematic underestimation of about 20 % relative to HCHO direct-sun measurements in the UV and IR, which themselves show excellent mutual agreement. This discrepancy largely disappears when accounting for differences in a priori profile assumptions and vertical sensitivities between MAX-DOAS and FTIR measurements. It is primarily attributed to the limited sensitivity of MAX-DOAS measurements above 2–4 km altitude combined to the use of a priori profiles that neglect the free-tropospheric HCHO contribution. Based on these findings, the use of model-based a priori profiles was recommended as an input for (MMF) optimal estimation retrievals.

In this work, we propose to test this approach at sites hosting co-located MAX-DOAS, FTIR and Pandora instruments. Target candidates are the Bremen, Toronto, Lauder and Ny-Ålesund stations. Where possible, selected Pandora data sets will be processed using the FRM4DOAS system and results will be compared with operationally produced column and profile data from the Pandonia Global Network (PGN). The aim is to report on the consistency between MAX-DOAS and PGN retrievals and investigate possible differences. Such investigations are crucial for robust satellite bias assessment and network interoperability in the context of current and upcoming satellite missions such as TROPOMI, TEMPO, GEMS, Sentinel-4 and Sentinel-5.

How to cite: Pinardi, G., Van Roozendael, M., Friedrich, M. M., Fayt, C., Langerock, B., Vigouroux, C., De Smedt, I., De Mazière, M., Beirle, S., Wagner, T., Tiefengraber, M., and Cede, A.: Intercomparison of HCHO column and profile retrievals from ground-based MAX-DOAS, FTIR and Pandora instruments, EGU General Assembly 2026, Vienna, Austria, 3–8 May 2026, EGU26-13108, https://doi.org/10.5194/egusphere-egu26-13108, 2026.

EGU26-13855 | ECS | Posters on site | AS5.9

Investigating the meteorological influence on the Glyoxal-to-Formaldehyde Ratio (RGF) 

Simon Bittner, Andreas Richter, Bianca Zilker, Sebastian Donner, Thomas Wagner, Leonardo M. A. Alvarado, and Mihalis Vrekoussis

A multitude of different processes (e.g. biogenic, anthropogenic, pyrogenic) couple the Earth’s surface and the atmosphere by releasing a large variety of trace species. These emissions can lead to air quality degradation and climate forcing amongst others. As the full atmospheric state is hard to capture because of the large number of different species, proxies are of particular interest in atmospheric science.

Two important species in atmospheric chemistry are formaldehyde (HCHO) and glyoxal (CHOCHO), both belonging to the family of volatile organic compounds (VOC). Their sources (direct emissions, secondary production from oxidation of other VOC) and their sinks (photolysis, oxidation by the hydroxyl radical) are similar but differ in importance. These marginally different yields of CHOCHO and HCHO in the individual emission processes can be utilized to discriminate between sources. It was proposed to use their ratio (RGF) as a proxy of the origin of VOC emissions. Multiple publications investigated this hypothesis and resulted in contradictory conclusions for various different conditions.

To gain additional insights into the drivers and limits of the RGF ratio, MAX-DOAS data from four stations with systematically different conditions (Orléans France, Athens Greece, Incheon South-Korea, ATTO-Tower Brazil) is analysed with the focus on the ratio and meteorological conditions.

We observe a consistent decrease of RGF with increasing temperature at all four sites. Accounting for the temperature relationship substantially reduces the annual variability of RGF and removes the influence of relative humidity on RGF while the diurnal variability of RGF remains largely unaffected. In contrast, changing shortwave radiation, boundary-layer height, and wind speed impact RGF only marginally.

How to cite: Bittner, S., Richter, A., Zilker, B., Donner, S., Wagner, T., Alvarado, L. M. A., and Vrekoussis, M.: Investigating the meteorological influence on the Glyoxal-to-Formaldehyde Ratio (RGF), EGU General Assembly 2026, Vienna, Austria, 3–8 May 2026, EGU26-13855, https://doi.org/10.5194/egusphere-egu26-13855, 2026.

EGU26-14421 | ECS | Posters on site | AS5.9

Tracking the Dynamics of Individual Ship Plumes Using Ground-Based Imaging DOAS 

Helge Haveresch, Anja Schönhardt, Andreas Richter, Folkard Wittrock, Simon Bittner, Alexandros P. Poulidis, Andreas Weigelt, Stefan Schmitt, Denis Pöhler, Mihalis Vrekoussis, and Hartmut Bösch

Ships contribute significantly to global NOx emissions. Especially in coastal cities they can become a relevant source of air pollution. Established approaches of monitoring ship emissions often rely on in-situ or LP-DOAS measurements and are subject to different limitations like spatial coverage. Therefore, emission estimates derived from such measurements are typically based on simplified transport models and do not fully account for the actual shape and movement of exhaust plumes.

Remote sensing techniques, such as imaging DOAS (iDOAS) measurements, can help to overcome these limitations. In this study, we present several months of iDOAS measurements of NO2 (nitrogen dioxide) plumes from individual ships at a major shipping lane near the harbor of Hamburg, using the instrument IMPACT (Imaging MaPper for AtmospheriC observaTions, Peters et al., 2019). The measurements were carried out within the framework of the SEICOR measurement campaign (Ship Emission Inspection with Calibration-free Optical Remote sensing), which started in April 2025.

By supplementing the measurements with Automatic Identification System (AIS) data containing information on passing ships, the NO2-column enhancements within the emission plume are detected reliably and calculated from the measured dSCDs in several hundred cases. The high spatial and temporal resolution of the dataset nicely enables a detailed view on plume structure, transport, and dispersion under varying meteorological conditions. The large number of observed plumes allows us to systematically relate plume shape and evolution to key meteorologic parameters (e.g. stability and boundary layer height). The dataset demonstrates that Gaussian plume modeling of single measurements typically is not sufficient to describe the development and emission strength of ship plumes accurately. At the same time, we show that in many cases a mass-balance approach can be used to quantify ship NOx emissions, which are in good agreement with previous studies.

How to cite: Haveresch, H., Schönhardt, A., Richter, A., Wittrock, F., Bittner, S., Poulidis, A. P., Weigelt, A., Schmitt, S., Pöhler, D., Vrekoussis, M., and Bösch, H.: Tracking the Dynamics of Individual Ship Plumes Using Ground-Based Imaging DOAS, EGU General Assembly 2026, Vienna, Austria, 3–8 May 2026, EGU26-14421, https://doi.org/10.5194/egusphere-egu26-14421, 2026.

Two important challenges with UAS-based measurements of greenhouse gases (GHGs) are large baseline drifts of gas sensors and source identification when there are several sources distributed within a footprint. Ambient conditions, such as temperature and humidity, known to influence the accuracy of gas sensors, change fast during flight at different altitudes and speeds. Big such drifts limit UAS-based measurements to high and often anthropogenic emissions as they cause strong gradients in concentration levels. Emissions across landscapes often generate much weaker concentration gradients and are also more extended, making fluxes and source areas more challenging to constrain.

We present a newly developed approach to reduce this instrument drift significantly, enabling flux measurements in natural environments. We have also developed the approach further to allow the matching of gas structures on vertical wall flight paths to sources and sinks in the footprint using an independent tracer of air movements across the scene. The new method produces drift-corrected simultaneous measurements of multiple GHGs (CO2, CH4, N2O) and wind data. We will present results using different flight strategies (e.g. single wall, two-wall, and rectangular walls) in both anthropogenic and natural environments.

How to cite: Gålfalk, M. and Bastviken, D.: A drone-based approach for measurements of multiple greenhouse gases with minimized gas sensor drift for increased sensitivity and improved source area identification, EGU General Assembly 2026, Vienna, Austria, 3–8 May 2026, EGU26-15107, https://doi.org/10.5194/egusphere-egu26-15107, 2026.

EGU26-15564 | ECS | Posters on site | AS5.9

Characterization of NO2 and HCHO trace gases in Montevideo during 2024  

Adriana Silva, Alejandro Agesta, Matías Osorio, Nicolás Casaballe, and Erna Frins

Montevideo is a coastal city on the Río de la Plata in South America, characterized by frequent and relatively intense winds, high relative humidity, and moderate urban emissions. Furthermore, the city experiences four seasons with well-defined temperature variations.

Nitrogen dioxide (NO2) and formaldehyde (HCHO) are atmospheric trace gases whose presence exhibit well-defined diurnal and seasonal variations. The joint analysis of NO2 and HCHO allows for the characterization of anthropogenic source influence, as well as the evaluation of the seasonal variability of the atmosphere.

We present an initial assessment of NO2 and HCHO detection in Montevideo in 2024. In this first step, we focused on the differential slant column densities (dSCDs) of both gases under clear skies conditions. The detection was performed using ground-based multi-axis differential optical absorption spectroscopy (MAX-DOAS) in the UV-Vis spectral range. To obtain the NO2 dSCDs we analyzed the spectral window 411–445 nm, and HCHO dSCDs determination in the range of 324.5–359 nm using the software QDOAS [1].

Spectral data were available for 312 of the 366 days in 2024. According to the color index, clear skies were identified on 103 of these days [2]. In approximately 85% of the samples, NO2 dSCDs showed typical behavior at sunrise and sunset, with its minima recorded around noon. In contrast, HCHO dSCDs showed a progressive increase, reaching their maximum around midday or in the early afternoon for all elevation angles (5°, 10°, 30°, 60°, and 90°). The remaining 15% of dSCDs exhibited pronounced behavior in one or both gases; these variations are the subject of the second stage of our investigation. Finally, we examine the obtained results and their relationship with wind direction.

[1]. Danckaert, T., Fayt, C., Roozendael, M. V., Smedt, I. D., Letocart, V., Merlaud, A., and Pinardi, G.: QDOAS Software user manual, http://uv-vis.aeronomie.be/software/QDOAS, 2017.

[2].  Wagner, T., Apituley, A., Beirle, S., Dörner, S., Friess, U., Remmers, J., and Shaiganfar, R.: Cloud detection an classification based on MAX-DOAS observations, Atmos. Meas. Tech., 7, 1289–1320, https://doi.org/10.5194/amt-7-1289-2014, 2014.

How to cite: Silva, A., Agesta, A., Osorio, M., Casaballe, N., and Frins, E.: Characterization of NO2 and HCHO trace gases in Montevideo during 2024 , EGU General Assembly 2026, Vienna, Austria, 3–8 May 2026, EGU26-15564, https://doi.org/10.5194/egusphere-egu26-15564, 2026.

EGU26-15678 | ECS | Posters on site | AS5.9

A High-Resolution MCMC Method for Aerosol and Trace Gas Profile Retrieval from MAX-DOAS Observations 

Zijun Yu, Pinhua Xie, Xin Tian, Jin Xu, and Zijie Wang

Correspondence to: Pinhua Xie (phxie@aiofm.ac.cn), Xin Tian (xtian@aiofm.ac.cn)

Boundary layer processes detected by Multi-Axis Differential Optical Absorption Spectroscopy (MAX-DOAS) often occur at fine vertical scales, which necessitates high-resolution profile retrieval. This study introduces a Markov Chain Monte Carlo (MCMC) approach that uses an Ensemble Sampler with dynamically adjusted parallel sampling chains to ensure effective mixing in high-dimensional spaces. MCMC globally explores the parameter space, directly evaluates the full nonlinear forward model, and generates complete posterior probability distributions. Meanwhile, the study uses a two-stage decoupling strategy based on O4 observations. In the first stage, to avoid under-constraint and overfitting issues, MCMC retrieves aerosol extinction profiles at 100-meter resolution from O4 slant column densities. In the second stage, the posterior aerosol field is used as a fixed constraint to retrieve trace gas concentration profiles at 50-meter resolution. This approach reduces the high-dimensional joint optimization to sequential low-dimensional subproblems, which decreases parameter correlations and enhances MCMC sampling efficiency. The two-stage decoupling also allows MCMC to adopt optimal parallel sampling chain configurations for each stage’s dimensional state vector, ensuring stable retrieval of high-dimensional posterior distributions at fine vertical grids. Comparison with CALIPSO satellite data shows that MCMC-retrieved aerosol profiles achieve an R² of 0.875 and an RMSE of 0.11 km-1. Validation against sun photometer CE318 observations reveals that the MCMC-retrieved aerosol optical depth (AOD) achieves an R² of 0.935 with a relative bias of 10.9%, confirming the algorithm's accuracy. Compared to algorithm model data from AIOFM, AUTH, and Suwon obtained from the CINDI-3 comparison activity, NO2 vertical profiles achieve an R2 of 0.9 with a relative bias of 11%. Further validation with ground-based near-surface NO2 concentration measurements reveals that MCMC-retrieved NO2 concentrations at 50-meter trace gas resolution result in an R2 of 0.912 and an RMSE of 2.95 ppb, compared to an R2 of 0.825 and an RMSE of 3.85 ppb at 200-meter resolution. Increasing the vertical resolution improves the NO2 correlation by 11% and reduces the RMSE by 23%. Therefore, MCMC effectively addresses challenges associated with nonlinearity, non-Gaussian posterior distributions, and high-dimensional sampling, leading to improved vertical resolution in MAX-DOAS profile retrieval.

How to cite: Yu, Z., Xie, P., Tian, X., Xu, J., and Wang, Z.: A High-Resolution MCMC Method for Aerosol and Trace Gas Profile Retrieval from MAX-DOAS Observations, EGU General Assembly 2026, Vienna, Austria, 3–8 May 2026, EGU26-15678, https://doi.org/10.5194/egusphere-egu26-15678, 2026.

EGU26-15831 | Posters on site | AS5.9

Validation of NO2 vertical profiles from PGN and MAX-DOAS using tethered-balloon measurements in Bangkok during the GEMS-AQ campaign 

Yongjoo Choi, Giyeol Lee, Lim-Seok Chang, Soi Ahn, Yugo Kanaya, Thomas Hanisco, Jonguk Park, Bryan Place, Apoorva Pandey, Hyeongseok Choi, and Minho Kim

In February 2026, a field campaign called the Geostationary Environment Monitoring Spectrometer - Air Quality (GEMS-AQ) was conducted in Bangkok, Thailand, to investigate the causes of worsening air quality in Southeast Asia. This campaign was part of a broader effort to combine satellite, aerial, and ground-based observations to better understand air pollution dynamics in the Bangkok megacity. One of our research objectives was to validate the diurnal variations of NO2 vertical profiles retrieved from ground-based multi-axis differential optical absorption spectroscopy (MAX-DOAS) using the JAMSTEC MAX-DOAS network algorithm (JMNet1) and Pandora official products by comparing them with in-situ measurements. To achieve this, we deployed a tethered balloon equipped with a Portable cavity-enhanced Absorption of Nitrogen Dioxide Analyzer (PANDA) based on incoherent broadband cavity-enhanced absorption spectroscopy (IBBCEAS), which is lightweight and suitable for vertical profiling measurements. One of the advantages of the tethered balloon system is its ability to capture the temporal evolution of the NO2 layer during daytime up to approximately 1.3 km, close to the planetary boundary layer (PBL) height. These results will help improve the accuracy of NO2 tropospheric vertical column density estimates from GEMS by updating a priori NO2 vertical profiles to better reflect real-world conditions.

How to cite: Choi, Y., Lee, G., Chang, L.-S., Ahn, S., Kanaya, Y., Hanisco, T., Park, J., Place, B., Pandey, A., Choi, H., and Kim, M.: Validation of NO2 vertical profiles from PGN and MAX-DOAS using tethered-balloon measurements in Bangkok during the GEMS-AQ campaign, EGU General Assembly 2026, Vienna, Austria, 3–8 May 2026, EGU26-15831, https://doi.org/10.5194/egusphere-egu26-15831, 2026.

EGU26-15864 | ECS | Orals | AS5.9

Investigating Polar Tropospheric Ozone with Novel BrO and IO Retrievals from Pandoras 

Kevin Joshy, Darby Bates, Ramina Alwarda, Ann Mari Fjæraa, Debora Griffin, Martin Tiefengraber, Peter Effertz, Pierre Fogal, Xiaoyi Zhao, and Kimberly Strong

Tropospheric and stratospheric ozone variability plays a critical role in controlling the polar radiation budget. Although the factors influencing stratospheric ozone variation are quite well researched, tropospheric and near-surface ozone are subject to both dynamical and photochemical constraints that are still poorly understood. Measurements from a Thermo Scientific TEI-49i in-situ ozone analyzer at the Polar Environment Atmospheric Research Laboratory (PEARL) at Eureka, Nunavut, Canada (80.05°N, 86.42°W) show that surface ozone in the Arctic is characterized by two major annual depletion events: (1) a primary depletion which occurs during the springtime following polar sunrise, and has been attributed to enhancements of BrO (bromine explosion events), as well as (2) a secondary depletion which occurs in the late summer and early fall period. The PEARL MAX-DOAS (Multi-Axis Differential Optical Absorption Spectroscopy) ultraviolet (UV)-visible Ground-Based Spectrometer (PEARL-GBS) results show tropospheric BrO enhancements correlated with periods of reduced ozone concentrations. Additionally, we also use several UV-visible Pandora spectrometers affiliated with the Pandonia Global Network (PGN) to evaluate the feasibility of retrieving BrO and IO, which are not currently among the standard PGN products. We present here preliminary results of polar Pandora BrO and IO retrievals and investigate the potential link between summertime IO and late summer ozone depletions detected at Eureka. For this investigation, we use the MAX-DOAS measurements made by three Pandora instruments: Pandora #144 which was located at the PEARL Ridge Lab from 2019-2023, Pandora #280 located at the Eureka 0-Altitude PEARL Auxiliary Laboratory (0PAL) since 2024, and Pandora #152 located at the Norwegian Polar Institute Sverdrup in Ny-Ålesund, Svalbard (78.92°N, 11.93°E) since 2019. We retrieve BrO and IO from the Pandora spectra and find good agreement between Pandora and PEARL-GBS BrO dSCDs (Differential Slant Column Densities). Although measured enhancements of BrO from the Eureka instruments coincide with periods of springtime reduced surface ozone, this is not as evident for the IO results in the context of the summer ozone depletions. We demonstrate the capability of using the Pandora instruments to retrieve these halogen species with MAX-DOAS measurements. These Pandora retrieval methods for BrO and IO will allow for further study of the role of these trace gases in the polar tropospheric ozone cycle. 

How to cite: Joshy, K., Bates, D., Alwarda, R., Fjæraa, A. M., Griffin, D., Tiefengraber, M., Effertz, P., Fogal, P., Zhao, X., and Strong, K.: Investigating Polar Tropospheric Ozone with Novel BrO and IO Retrievals from Pandoras, EGU General Assembly 2026, Vienna, Austria, 3–8 May 2026, EGU26-15864, https://doi.org/10.5194/egusphere-egu26-15864, 2026.

EGU26-16593 | Posters on site | AS5.9

Tomographic reconstruction of NO2 over Montevideo using ground-based MAX-DOAS observations 

Nicolás Casaballe, Erna Frins, Roberto Barragán, Selena Seidel, Adriana Silva Mejía, Alejandro Agesta, Matías Osorio, Lucía Velasco, and Marco Coronato

MAX-DOAS techniques provide reliable ground-based remote sensing of trace gas abundances by exploiting the spectral absorption signatures of atmospheric compounds in the UV and visible spectral ranges. From the integrated concentration along light paths corresponding to different viewing directions at a single observation site, vertical profiles can be retrieved. When measurements from multiple ground-based locations are combined, tomographic reconstruction techniques can be applied to estimate the spatial distribution of gas concentrations, accounting for horizontal inhomogeneities.

In this work, we combine measurements from two ground-based instruments scanning a vertical plane across a large urban region. Building on previous studies, we apply inversion algorithms that explicitly account for the sparse and inhomogeneous sampling of the vertical plane, allowing retrieval of the best-estimate concentration distribution consistent with the observations, with an effective horizontal resolution on the order of 50 m. At this spatial scale, previously used simplifying assumptions are no longer justified. Instead, we model the gas distribution as the superposition of a smoothly varying vertical background profile and localized fluctuations within the region of interest. Preliminary results are presented for the reconstruction of NO2 over Montevideo, Uruguay, covering several kilometres in a vertical plane over the city, based on measurements of scattered sunlight acquired between July 2024 and March 2025.

How to cite: Casaballe, N., Frins, E., Barragán, R., Seidel, S., Mejía, A. S., Agesta, A., Osorio, M., Velasco, L., and Coronato, M.: Tomographic reconstruction of NO2 over Montevideo using ground-based MAX-DOAS observations, EGU General Assembly 2026, Vienna, Austria, 3–8 May 2026, EGU26-16593, https://doi.org/10.5194/egusphere-egu26-16593, 2026.

EGU26-18071 | ECS | Posters on site | AS5.9

Long-Term Evolution of the Vertical Distribution of Key Atmospheric Pollutants Revealed by MAX-DOAS Observations in Hefei, China 

Zijie Wang, Pinhua Xie, Jin Xu, Xin Tian, Yinsheng Lyu, Youtao Li, Zijun Yu, Jiangtao Sun, Zhongtao Huang, and Yu Huang

Corresponding authors: Pinhua Xie (phxie@aiofm.ac.cn), Jin Xu (jxu@aiofm.ac.cn); Xin Tian (xtian@ahu.edu.cn);

Long-term observations of the vertical distribution of atmospheric pollutants provide critical insights into the temporal evolution and vertical structure of atmospheric pollutants, yet such datasets remain scarce. In this study, continuous MAX-DOAS measurements conducted from 2014 to 2025 (excluding 2019) at the Science Island site in Hefei, China provide information on the vertical distribution of aerosols and concentrations of NO2, HCHO, HONO, and SO2.

Long-term observations reveal pronounced seasonal and interannual variability across all species. Aerosol optical depth (AOD) from MAX-DOAS shows overall consistency with collocated CE318 sun photometer, while near-surface NO2 and SO2 concentrations are consistent with measurements from nearby national air quality monitoring stations, supporting the reliability of the MAX-DOAS retrievals. NO2 and SO2 consistently exhibit wintertime maxima, reflecting enhanced emissions combined with suppressed atmospheric dispersion under stable boundary-layer conditions, whereas HCHO shows pronounced summertime maxima driven by intensified photochemical production. Over the study period, SO2 displays a persistent long-term decline, consistent with sustained reductions in coal combustion and industrial emissions, while NO2 decreases until 2022 and rebounds in 2023, likely associated with the recovery of traffic and industrial activities following COVID-19 lockdowns. Distinct seasonal characteristics are evident in the vertical distributions of different pollutants. NO2 and SO2 exhibit strong near-surface gradients, particularly in winter, indicating the dominant influence of local emissions and limited vertical mixing. In contrast, HCHO shows weaker vertical gradients and enhanced concentrations aloft during summer, highlighting the importance of secondary formation and vertical transport processes. Across all species, strong exponential decreases in concentrations within the lowest 1 km emphasize the combined control of surface emissions and boundary-layer mixing on pollutant distributions in the lower troposphere.

To identify the dominant processes influencing pollutants at different altitudes, these datasets of the vertical distribution of multi-species were jointly analyzed using Positive Matrix Factorization (PMF). The results indicate that pollutant variability near the surface is mainly controlled by local primary emissions and surface-related chemical processes, whereas secondary formation and regional influences play an increasingly important role at elevated levels. Interannual PMF analysis further reveals a systematic shift around 2017-2019, with declining contributions from near-surface emission-related processes and a strengthened influence of secondary and regional processes, reflecting long-term changes in dominant pollution drivers.

Overall, these results demonstrate that long-term MAX-DOAS observations provide valuable insights on both the temporal evolution and vertical structure of key atmospheric pollutants, revealing distinct controlling mechanisms and long-term trends associated with changes in emissions reflected in the vertical distribution of atmospheric pollutants.

How to cite: Wang, Z., Xie, P., Xu, J., Tian, X., Lyu, Y., Li, Y., Yu, Z., Sun, J., Huang, Z., and Huang, Y.: Long-Term Evolution of the Vertical Distribution of Key Atmospheric Pollutants Revealed by MAX-DOAS Observations in Hefei, China, EGU General Assembly 2026, Vienna, Austria, 3–8 May 2026, EGU26-18071, https://doi.org/10.5194/egusphere-egu26-18071, 2026.

EGU26-18418 | ECS | Posters on site | AS5.9

Multirotor UAV observations of wind, thermodynamics, and shortwave radiation in proximity to eddy covariance towers 

Mohammadamin Soltaninezhad, Stefano Tondini, Roberto Mendicino, Gianluca Scuri, Sebastiano Carpentari, Nadia Vendrame, Dino Zardi, Lorenzo Giovannini, and Roberto Monsorno

Accurate quantification of the Surface Energy Balance (SEB) in complex terrains remains an open challenge due to high spatial heterogeneity and scale mismatches between surface fluxes and atmospheric observations. Eddy Covariance Towers (ECT) provide continuous flux monitoring, but their spatial representativeness is limited in environments where atmospheric conditions vary over short distances, particularly in Alpine regions. Uncrewed Aircraft Vehicles (UAV) represent a complementary observation strategy by enabling distributed measurements of the near-surface variables that affect turbulent and radiative exchanges in sub-mesoscale ranges.

This work reports on the development, validation, and field deployment of a UAV-based measurement platform and data aggregation workflow for the spatial acquisition of wind, air temperature, relative humidity, and shortwave radiation in proximity to ECTs, to estimate the role of local circulations and advection on the SEB closure.

At first, computational fluid dynamics (CFD) simulations using the k–ε turbulence model were performed to assess propeller-induced aerodynamic distortions and to guide sensor onboarding on a multirotor UAV. Then, wind-tunnel experiments were executed at the WindShape facility (Switzerland), using a dedicated UAV testing setup comprising a 6-degree-of-freedom robotic arm for controlling UAV attitude and orientation. Lastly, a field campaign including repeated flights and hovering stops at predefined locations was carried out in Mezzolombardo (Italy) within the framework of the TEAMx international research programme.

By comparing ECT and UAV data, some general remarks can be made. In the case of temperature (T) and relative humidity (RH) measurements, sensors with fast response time are crucial for exploiting at best the limited UAV flight endurance. Our field tests highlighted T and RH maximum differences between the ECT HMP155A Vaisala sensor and UAV Galltech PM15P sensor measurements of 1.0 °C and 7%, respectively in a range of 100 m from the tower. However, this data is very fragmented due to the long acquisition time needed to get to steady-state values. In the case of wind measurements, no issues with sensor response time were noticed. Horizontal wind gusts up to 3 m/s were recorded by a TriSonica Mini LI-550 mounted on the UAV, while wind gusts up to 2 m/s were recorded by the Gill HS-100 anemometer of the ECT. Our preliminary results aim at demonstrating that multirotor UAV platforms have the capability of capturing information that ECT observations alone cannot resolve, provided that high-res. / high-freq. sensors are onboarded and conditioned according to the aforementioned procedure. This strategy (possibly empowered by UAV swarms) is expected to greatly contribute to the interpretation of flux footprints and assessment of horizontal heterogeneity in ongoing and future SEB closure studies.

How to cite: Soltaninezhad, M., Tondini, S., Mendicino, R., Scuri, G., Carpentari, S., Vendrame, N., Zardi, D., Giovannini, L., and Monsorno, R.: Multirotor UAV observations of wind, thermodynamics, and shortwave radiation in proximity to eddy covariance towers, EGU General Assembly 2026, Vienna, Austria, 3–8 May 2026, EGU26-18418, https://doi.org/10.5194/egusphere-egu26-18418, 2026.

EGU26-19937 | ECS | Posters on site | AS5.9

A meteorological PARASITE: High-resolution 3D wind vector from off-the-shelf UAS 

Martin Schoen, Yann-Georg Büchau, Kjell zum Berge, Jens Bange, and Andreas Platis

Traditional in-situ and remote sensing methods leave observational gaps for the high-resolution 3D wind vector in the atmospheric boundary layer. We present PARASITE (Portable Aircraft Rucksack for Atmospheric Sensing and In-Situ Turbulence Estimation) a sensor and logging system to estimate the 3D wind vector using robust, off-the-shelf uncrewed aircraft systems (UAS) from internal avionics, independent of external flow sensors or calibration infrastructure. The approach combines a physics-based model combined with a neural network for residual error correction, both calibrated in a standalone process without requiring a reference sensor or wind tunnel. Validation campaigns took place at the German Meteorological Service (DWD) observatory in Falkenberg, Germany (Winter 2025) and Forschungszentrum Jülich, Germany (Summer 2024). The dataset includes 19 radiosonde ascents up to 2000 m above sea level and 8 flight hours adjacent to ultrasonic anemometers on a 99 m mast. Conditions ranged from 0.3 to 11 m s−1 under thermally stable stratification for the sonic anemometer comparison, and convective conditions with wind speeds ranging from 0.0 to 11 m s−1 for the radiosonde profiles. For 1 min averages compared to ultrasonic anemometer data, the UAS measurements show excellent correlation. Horizontal wind speed errors are low, with a root mean squared error (RMSE) of 0.30 m s−1 and a mean error (ME) of 0.01 m s−1. Wind direction shows an RMSE of 4and ME of 0.5. Analysis of raw 10 Hz vertical wind data yields an ME of−0.04 m s−1 and RMSE of 0.44 m s−1. Analysis of ensemble averaged power spectra and structure functions confirms the method resolves turbulence following the Kolmogorov −5/3 law up to ∼2 Hz, comparable to reference instrumentation. Furthermore, comparisons with radiosonde profiles indicate the measurement is independent of air density.

How to cite: Schoen, M., Büchau, Y.-G., zum Berge, K., Bange, J., and Platis, A.: A meteorological PARASITE: High-resolution 3D wind vector from off-the-shelf UAS, EGU General Assembly 2026, Vienna, Austria, 3–8 May 2026, EGU26-19937, https://doi.org/10.5194/egusphere-egu26-19937, 2026.

EGU26-20037 | ECS | Posters on site | AS5.9 | Highlight

Bias quantification and correction for meteorological sensors of an air-mass following drifting balloon 

Lisa Graßmel, Josua Schindewolf, Paul Voss, and Felix Pithan
The atmospheric temperature profile in Arctic winter is an essential driver for the observed Arctic amplification of global temperature changes. During the cold season, the atmospheric temperature and moisture profiles in the Arctic result from the advection and transformation of air masses from lower latitudes. While the air masses move polewards over multiple days, they lose much of their initial heat and moisture. Capturing the complete transition process is challenging with fixed-in-place (Eulerian) observations.
 
Altitude-controlled drifting (CMET) balloons enable vertical soundings of the lower boundary layer over periods of several days and distances on the order of 1000 kilometers from an air-mass-following (quasi-Lagrangian) perspective, which is considered necessary for understanding Arctic air-mass transformations. In data from previous deployments, the sensors have been found to be prone to radiative bias, lag, and hysteresis. Precise measurements require distinguishing between sensor-related errors, small-scale atmospheric variability between adjacent ascending/descending legs, and the observed processes.
 
We use experimental setups established for radiosonde calibration to quantify the radiative bias in temperature measurements, as well as the constant offsets across different reference humidities and the temperature-dependent time lag for the humidity sensor. While the measured parameters are comparable to those of commercial-grade radiosondes, the vertical speeds of CMET balloons are much lower, resulting in reduced sensor ventilation.  This and other Arctic in-flight conditions are reproduced in our calibration experiments.
 
The radiative bias depends on the solar irradiance at the balloon's position. We estimate the incident solar radiation using the output of the solar panels surrounding the balloon's payload.
 
Our findings from the calibration experiments and irradiance estimation are applied to flight measurements using a combined processing tool, thereby providing an improved understanding of the data.


How to cite: Graßmel, L., Schindewolf, J., Voss, P., and Pithan, F.: Bias quantification and correction for meteorological sensors of an air-mass following drifting balloon, EGU General Assembly 2026, Vienna, Austria, 3–8 May 2026, EGU26-20037, https://doi.org/10.5194/egusphere-egu26-20037, 2026.

EGU26-20366 | ECS | Posters on site | AS5.9

Quantifying methane emissions from mud volcanoes using in-situ fixed-wing drone measurements 

Manuel Moser, Alina Fiehn, Eric Förster, Halima Al-Hinaai, Lilli Zoller, Akper Feyzullayev, Orhan Abbasov, Giuseppe Etiope, Roxana Moga, Malika Menoud, and Anke Roiger

Azerbaijan hosts one of the largest global concentrations of mud volcanoes, which are natural geological formations that erupt mud, water, and gases, with methane (CH4) being the dominant component. Here, we present results from the recent METHANE-To-Go Azerbaijan field campaign, which aimed to quantify CH4 emissions from mud volcanoes using in-situ fixed-wing drone measurements.

The campaign was carried out mainly in two field phases in May and October 2025, supplemented by additional flights throughout the year, resulting in a total of 36 flight hours. Measurements were performed using a fixed-wing MAS DIHA 350 VTOL UAV equipped with a lightweight, high precision CH4 analyzer, along with wind measurements derived from pitot tube data. A dedicated measurement strategy was developed and optimized specifically for mud volcanoes in the Azerbaijani environment. The approach follows a mass balance framework based on Gauss’s divergence theorem, whereby the drone flies concentric circles around the emission source at multiple altitudes. Fluxes of CH4 are derived from upwind and downwind measurements, enabling the quantification of the total emission enclosed by the cylindrical flight pattern. To validate the applied methodology, five controlled release experiments were conducted, during which CH4 from bottles was released at a known rate. Additionally, two dedicated flights were conducted to calibrate and evaluate the in-situ wind measurements using the onboard pitot tube. In total, 38 measurement flights were conducted at five continuously emitting mud volcanoes, allowing for quantitative emission estimates for these sites. In addition to continuously emitting sources, the method was applied to an explosive eruption of the Otmanbozdagh mud volcano on 11 October 2025, which was surveyed shortly after the event.
In parallel to the flight measurements, ground based air samples were collected and analyzed for gas composition and CH4 carbon stable isotopes, supporting source attribution and the discrimination of mud volcano emissions from potential anthropogenic sources.

The dataset provides the first high resolution in-situ CH4 observations shortly after a mud volcano eruption, as well as quantitative emissions from active mud volcanoes using mass balance approach, indicating source dependent emission rates on the order of several tens to approximately one hundred kilograms per hour. These results contribute to a more robust assessment of the role of geological CH4 sources in the global climate system and demonstrate the potential of fixed-wing drone platforms for quantitative measurements of greenhouse gas fluxes.

How to cite: Moser, M., Fiehn, A., Förster, E., Al-Hinaai, H., Zoller, L., Feyzullayev, A., Abbasov, O., Etiope, G., Moga, R., Menoud, M., and Roiger, A.: Quantifying methane emissions from mud volcanoes using in-situ fixed-wing drone measurements, EGU General Assembly 2026, Vienna, Austria, 3–8 May 2026, EGU26-20366, https://doi.org/10.5194/egusphere-egu26-20366, 2026.

EGU26-21396 | ECS | Posters on site | AS5.9

Strategic scheme for optimal and automatic methane monitoring using UAVs (8lind-Date) 

David Matajira-Rueda, Charbel Abdallah, and Thomas Lauvaux

Since methane contributes significantly to global warming, the accurate monitoring and quantification of its emissions are both essential and a scientific challenge. Addressing this challenge requires an interdisciplinary approach that integrates multiple scientific fields.

Unmanned aerial vehicles (UAVs) have clearly become particularly ideal tools for monitoring and measuring methane emissions. However, to harness the potential and versatility of these tools, carefully structured and coupled procedures are required that contribute to the central goal of minimizing uncertainty in emission estimates. Therefore, this research presents 8lind-Date, a strategic scheme designed to ensure the necessary conditions for accurate and reliable methane emission estimation using UAVs.

The 8lind-Date strategic scheme provides a sequential integration of procedures that optimize both data preprocessing and postprocessing. For example, the sampling window dimensions are maximized and oriented, as much as possible, perpendicular to the main point source of emissions, considering altitude constraints and physical obstacles, all within the available volume. Furthermore, flight path planning is based on an initial diagnostic flight and supported by an automated Gaussian regression system. The learning mechanism of this system leverages a specialized subset of points derived from Lissajous-Bowditch curves, which also serve as optimal flight patterns.

Unlike conventional raster-based flight paths, the Lissajous-Bowditch paths proposed by 8lind-Date provide effective and efficient spatial and temporal coverage of the sampling window. This strategic approach enables the appropriate detection of methane concentrations in industrial facilities, agricultural areas, and other areas with limited access.

The 8lind-Date strategy offers substantial improvements over traditional UAV-based methane monitoring and measurement approaches. Key advantages include reduced flight time (maximizing battery life), reduced data processing time, and maximized extraction of information from measurements (observations). The strategic approach enables the automatic estimation of emissions with low uncertainty without the need for complex systems and models. Furthermore, it offers real-time processing and accurate estimates even in scenarios where the conventional assumption (that the entire gas column is contained within the sampling window) does not hold.

How to cite: Matajira-Rueda, D., Abdallah, C., and Lauvaux, T.: Strategic scheme for optimal and automatic methane monitoring using UAVs (8lind-Date), EGU General Assembly 2026, Vienna, Austria, 3–8 May 2026, EGU26-21396, https://doi.org/10.5194/egusphere-egu26-21396, 2026.

EGU26-22217 | Posters on site | AS5.9

A drone-based sampling platform for vertically resolved chemical characterization of aerosol particles using chemical ionization mass spectrometry 

Cheng Wu, Leo Håkansson, Epameinondas Tsiligiannis, and Mattias Hallquist

Understanding how aerosol chemical composition varies with height in the planetary boundary layer (PBL) is essential for interpreting aerosol sources, transformation pathways, and removal processes. Yet, observational constraints on vertically resolved particle-phase molecular composition are still limited, largely due to the lack of flexible sampling approaches. In this study, we introduce an unmanned aerial vehicle (UAV)–based aerosol filter sampling system that enables altitude-resolved particle collection within the PBL, accompanied by in situ measurements of key meteorological parameters, including temperature, relative humidity, and wind speed and direction. Collected aerosol samples are analysed using a chemical ionization time-of-flight mass spectrometer equipped with a Filter Inlet for Gases and AEROsols (FIGAERO-CIMS), allowing detailed characterization of particle-phase molecular composition and volatility.

The platform was tested during an urban deployment, where UAV-based meteorological observations were cross-validated against tower measurements, and aerosol collection performance was assessed through comparison with a co-located ground-based filter sampler. Despite low ambient particle mass loadings (PM₂.₅ ≈ 2 µg m⁻³), the UAV system achieved reliable particle collection, with sampling efficiencies comparable to ground-based measurements and no observable artefacts associated with flight operation. Consistent thermal desorption behaviour between airborne and ground-based samples further demonstrates the robustness of the approach.

We present first results revealing vertical gradients in aerosol molecular composition during PBL evolution, with a particular focus on night-time conditions. Observed compositional differences between altitudes highlight the influence of nocturnal stratification and limited mixing on aerosol chemical structure. Overall, this UAV-based filter sampling strategy expands the observational capability for aerosol chemical measurements and provides a new avenue for investigating PBL dynamics and aerosol processing in the lower atmosphere.

How to cite: Wu, C., Håkansson, L., Tsiligiannis, E., and Hallquist, M.: A drone-based sampling platform for vertically resolved chemical characterization of aerosol particles using chemical ionization mass spectrometry, EGU General Assembly 2026, Vienna, Austria, 3–8 May 2026, EGU26-22217, https://doi.org/10.5194/egusphere-egu26-22217, 2026.

EGU26-42 | ECS | Orals | AS5.11

Can low-cost sensor networks help industrial air quality? 

Mikko Poikkimäki, Anneli Kangas, Nicolas P. Winkler, Patrick P. Neumann, Matti Leikas, and Arto Säämänen

Industrial air pollutants pose safety and health risks to workers. This study aims to better understand the spatial and temporal distribution of air pollutants in industrial working environments. We developed and installed a novel low-cost sensor network in multiple workplaces: indoors at a steel factory, outdoors at a ferrochromium mill and on a cruise ship’s car deck. The stationary sensor networks are composed of multiple custom sensing nodes. Each node is equipped with low-cost sensors to assess gaseous components, particulate matter, temperature, and humidity. Air quality measurements using validated traditional occupational hygiene methods and high-end portable direct-reading instruments are performed stationary and mobile. Mobile devices carried by workers and unmanned aerial/ground vehicles complement the measurements by the stationary sensor network.  The results consist of evaluations carried out by combining the sensor data, contextual information, and the results obtained with traditional exposure assessment methods. Can this data fusion be used to assess exposure and target risk management measures? Can real time sensor measurements support the worker safety?  The short answer is YES!, but further steps are necessary to improve the sensor data reliability and applicability for detailed occupational exposure assessment. We present pollutant concentration maps and time series analysis, which are valuable for planning control measures and developing worker guidance to improve industrial safety. We further discuss the advantages and disadvantages of the available sensors for industrial air quality measurements and present the next steps of research needed for wider application of these safety technologies.

This research project, Robot-assisted Environmental Monitoring for Air Quality Assessment in Industrial Scenarios (RASEM), has received funding from the Finnish Work Environment Fund, Finnish Institute of Occupational Health, and Bundesanstalt für Materialforschung und –prüfung (BAM) under Saf€ra 2018 joint call: new technologies, new trends and monitoring safety performance. 

How to cite: Poikkimäki, M., Kangas, A., Winkler, N. P., Neumann, P. P., Leikas, M., and Säämänen, A.: Can low-cost sensor networks help industrial air quality?, EGU General Assembly 2026, Vienna, Austria, 3–8 May 2026, EGU26-42, https://doi.org/10.5194/egusphere-egu26-42, 2026.

To address the scarcity of high-time-resolution data on indoor pollutants, this study used low-cost air quality sensors for continuous monitoring in four typical indoor environments: an office, a residential heating room, a street kitchen, and a residential kitchen. Key pollutants (PM2.5, PM10, O3, NOx, CO, CO2, TVOC) and environmental factors (temperature, humidity, noise) were measured. Integrating wavelet analysis, peak/background decomposition, and the positive matrix factorization (PMF) model, three sources were identified: PM-related (particle intrusion/resuspension/oil aerosolization), noise-related (activity-ventilation coupling), and other-gases (combustion and material/surface processes). Wavelet analysis revealed obvious diurnal/semidiurnal cycles and multi-scale periodic characteristics dominated by human activities and ventilation. All environments exhibited distinct pollutant concentration variations linked to their specific functional uses and emission sources. The street kitchen had the highest PM and TVOC levels, while the residential heating room showed the highest CO and CO2. Health risk assessment revealed distinct drivers: office risks from particles and NO2, heating rooms from CO, street kitchens from cooking particles and near-road combustion, and residential kitchens from balanced particle and CO risks. The study confirms low-cost sensors effectively capture pollutant variations and source differences, providing scientific support for targeted indoor pollution control.

How to cite: Liu, D.: Application of Low-Cost Sensors for Pollutant Source Attribution in Various Indoor Environments, EGU General Assembly 2026, Vienna, Austria, 3–8 May 2026, EGU26-148, https://doi.org/10.5194/egusphere-egu26-148, 2026.

EGU26-976 | ECS | Posters on site | AS5.11

Evaluating Environmental and Temporal Performance of Machine Learning Calibration Models for Low-cost Particulate Matter Sensors: A Case Study Across 4 Indian Cities 

Roshan Wathore, Devishree Jadhao, Abhishek Chakraborty, and Nitin Labhasetwar

Low-cost particulate matter sensors (LCPMS) offer scalable and affordable capabilities that complement regulatory-grade monitoring networks by enabling high-resolution urban air quality monitoring. However, they frequently suffer from inaccuracies arising from environmental and temporal variability, necessitating robust calibration approaches to ensure measurement reliability. Co-location studies against reference-grade monitors, combined with machine learning (ML) calibration algorithms, have emerged as effective strategies to significantly improve LCPMS performance. In this study, a long-term co-location experiment was conducted in Vishakhapatnam, India from February 2018 to January 2020, incorporating environmental and temporal co-variates: temperature, relative humidity, hour-of-day, month-of-year. The baseline Linear Regression (LR) model used only raw sensor readings as input. Subsequent models incrementally incorporated environmental variables (temperature and relative humidity), temporal features (hour of day and month of year), and finally all covariates combined. The ML approaches included LR, Random Forest (RF), eXtreme Gradient Boosting (XGB), and a hybrid ensemble combining the best-performing models, with all comparisons made relative to the baseline LR model. Results demonstrate that ML models, particularly the hybrid ensemble, yielded substantial improvements in predictive accuracy. The baseline LR model exhibited an RMSE of 17.62 µg/m³. In comparison, the best-performing RF model achieved a 58% RMSE reduction, while the hybrid ensemble model attained a 63% reduction relative to baseline, satisfying the performance criteria recommended by USEPA. Additionally, we also explore the performance of the models across the temporal, environmental and the AQI category to identify potential performance variations and inform strategies for maintaining reliable measurements across changing environmental and pollution conditions. Although the hybrid model was overall the best, the analysis highlights that no single model consistently performs optimally across all conditions, suggesting that adaptive calibration strategies, such as using different models for different seasons or environmental conditions, are more effective than relying on a single model throughout the year.


To examine the generalizability of this ML-based calibration framework, we used a publicly available co-location dataset (Campmier et al., 2023) of three Indian cities- Delhi, Hamirpur, and Bangalore, wherein RMSE of the baseline model (factory calibration) is 90.5 µg/m³, 123 µg/m³, and 75.3 µg/m³ respectively and a physics-based Köhler theory calibration model reduced RMSE by 66%, 83% and 75% respectively. In comparison, our calibration framework outperformed these results with reductions of 77%, 95%, and 97% in the respective cities demonstrating strong generalizability across different urban contexts. These improvements highlight the advantages of ML-based methods in capturing nonlinear sensor-environment interactions and addressing the limitations of physics-based or factory-derived calibration algorithms, which assume fixed aerosol properties or rely on simplified empirical relationships. Collectively, our findings indicate that ML-based calibration frameworks enhance measurement accuracy and also generalize effectively across geographically diverse urban Indian environments, which are often characterized by high PM₂.₅ levels. The proposed framework demonstrates its potential to serve as a reliable and scalable solution for improving LCPMS performance in large-scale air quality monitoring efforts and is easy to incorporate, computationally less demanding, and agnostic to sensor models, target pollutants, and calibration approaches.

How to cite: Wathore, R., Jadhao, D., Chakraborty, A., and Labhasetwar, N.: Evaluating Environmental and Temporal Performance of Machine Learning Calibration Models for Low-cost Particulate Matter Sensors: A Case Study Across 4 Indian Cities, EGU General Assembly 2026, Vienna, Austria, 3–8 May 2026, EGU26-976, https://doi.org/10.5194/egusphere-egu26-976, 2026.

Air pollution remains a critical global challenge, disproportionately impacting vulnerable communities in low- and middle-income countries. Weak policies, fragmented institutions, limited financial and computational resources, and lack of comprehensive monitoring infrastructure hinder effective air quality (AQ) management. Dar es Salaam city with population of about 7 million, is among the world’s Megacities that is undergoing rapid urbanization with accompanying infrastructure development but with underdeveloped waste management.

Monitoring of ammonia concentration gas was made at urban and peri-urban sites in Dar es Salaam city to identify its spatial and temporal variability.  The monthly mean ammonia concentrations measured at two sub-urban sites (Buza Hospital and Temeke DMDP) were 34.9 and 16.6 ppm, respectively. The monthly mean ammonia concentrations at urban site (DIT, Kigamboni, Makuburi, Sinza Hospital and Mlimani city) were, 8.2, 8.85, 22.02, 16.5, and 7.2, respectively. Further, a comparison of the measured hourly data at urban and peri-urban sites showed its relative dominance at peri-urban sites during the evening hours while during the morning hours the dominance was to the urban sites. Different studies suggest that the trend of ammonia levels should be tightly affected by an increasing number of vehicles (morning traffic jams in urban areas) as well as agricultural and livestock activities (common in peri-urban areas). As such, the results of our statistical analysis point to the potentially significant role of agriculture and livestock activities in the elevation of ammonia levels in peri-urban areas of Dar es Salaam city.

How to cite: manyele, A.: Spatial and Temporal Variability of Ambient Ammonia (NH₃) and other Gas pollutants in Urban and Peri-Urban Dar es Salaam, Tanzania as Measured by Low cost Gas Sensors, EGU General Assembly 2026, Vienna, Austria, 3–8 May 2026, EGU26-1297, https://doi.org/10.5194/egusphere-egu26-1297, 2026.

EGU26-1368 | ECS | Posters on site | AS5.11

Modus+: A Probabilistic Machine Learning Framework for Calibration of Low-Cost Air Quality Sensor Networks 

Harry James, Stephen Stratton, and Adam Sykulski

Low-cost air quality sensors (LCS) are increasingly used to complement regulatory monitoring, but their wider adoption is constrained by challenges in data quality and calibration. To address this, we developed Modus+, a novel probabilistic machine learning framework for network calibration and quality assurance. Modus+ maintains indicative-class measurements suitable for public health communication and policy applications while eliminating the need for resource-intensive co-location with a reference.

Modus+ integrates diverse inputs including satellite data, nearby reference monitors, and local meteorology to generate probabilistic pollution predictions at each sensor location that serve as a proxy for a co-located reference. Where inputs lack predictive power, prediction intervals widen, providing an explicit quantification of uncertainty in space and time. Comparing predictions with LCS measurements, the system derives simple linear calibrations with confidence intervals on the slope, intercept and bias at the relevant limit value. This enables an evidence-based decision on whether and how to correct individual sensors, while preserving traceability to the underlying measurements. The framework is pollutant and sensor-agnostic and can be applied across diverse networks and operating conditions.

We validated Modus+ through a three-year co-location study and a case study of its operational deployment within the Transport for Greater Manchester (TfGM) sensor network. Twelve low-cost PM sensors were co-located at four reference sites between 2022 and 2025, and for rolling 12-week periods we compared relative expanded uncertainty from (i) uncorrected data, (ii) calibration using short-term co-location (10 days), (iii) calibration using full co-location data, and (iv) Modus+ network calibration. Modus+ significantly improves performance compared to uncorrected data and short-term co-location and achieves the 50% relative expanded uncertainty criterion for indicative measurements. Through our ongoing deployment across the TfGM network, stakeholders have gained a robust understanding of how pollution levels change across the region. This information is being used to explore the impact of local pollution sources, such as domestic wood burning, and aid public engagement.

How to cite: James, H., Stratton, S., and Sykulski, A.: Modus+: A Probabilistic Machine Learning Framework for Calibration of Low-Cost Air Quality Sensor Networks, EGU General Assembly 2026, Vienna, Austria, 3–8 May 2026, EGU26-1368, https://doi.org/10.5194/egusphere-egu26-1368, 2026.

Hospitals and public institutions often operate under significant financial constraints. When resources are insufficient to meet core service demands, as has been the case for the United Kingdom National Health Service (NHS), investment in air quality monitoring becomes even more challenging. This is despite clear evidence that healthcare settings are not insulated from the impacts of air pollution. Low-cost air quality sensors, which cost far less than reference grade instruments, offer a practical opportunity to generate meaningful environmental data in these environments.

At two major hospitals in Northeast England, the Royal Victoria Infirmary (RVI) and Freeman Hospital (FH) of Newcastle upon Tyne Hospitals NHS Foundation Trust, the deployment of 36 passive diffusion tubes, 9 indoor PurpleAir particulate monitors, and 3 ambient multisensor devices has enabled continuous monitoring of nitrogen dioxide (NO2), and particulate matter with aerodynamic diameters <10µm (PM10) and <2.5µm (PM2.5) over a three-year period. These data provide valuable temporal and spatial insights across two large modern hospital campuses.

Results show that although many hospital pollution hotspots reflect wider urban traffic patterns, vehicle movements within the hospital premises also contribute substantially. A change in parking policy resulted in marked reductions in ambient pollution concentrations. At one section of the RVI, the mean difference in NO2 concentration before and after the policy change showed a statistically significant reduction of 2.02µg/m3 with a two-sided p value of 0.007 based on a paired sample t test. This confirms that nitrogen dioxide levels decreased following the intervention. The t value of 2.722 indicates a moderate effect size.

The cleanest locations across both hospitals were consistently a staff and patient green space and a strictly managed no idling car park. Spatial analysis of diffusion tube data shows annual mean nitrogen dioxide concentrations of 19.4µg/m3 ±5.05 at FH, and 23.6µg/m3 ±5.33 at RVI in 2023. In 2024 both hospitals recorded reductions in annual mean concentrations of 4.1µg/m3 at FH and 4.4µg/m3 at RVI. Increased standard deviation in the same year highlights substantial site level variability. All ambient monitors demonstrated high variation in pollution levels within each hospital with annual mean values exceeding the World Health Organization guideline. This underscores the need for targeted interventions even within compact hospital settings of approximately 0.14 square kilometres.

Indoor PM2.5 concentrations also showed frequent exceedances of the World Health Organization one hour guideline of 15µg/m3 and the United Kingdom 24 hour guideline of 25µg/m3. For example, the New Victoria Wing reception at RVI recorded 281 hourly exceedances in 2024. In contrast, PM10 exceedances were rare and remained below the legal limit of 35 events per year.

Both hospitals have committed to achieving Excellent status within the Clean Air Hospital Framework as part of efforts to reduce emissions and protect patients, staff and the surrounding community. The Framework provides a set of actions across Travel, Procurement, Construction, Energy, Local Air Quality, Outreach and Leadership. Low-cost sensors support implementation by enabling hotspot identification, tracking the effectiveness of interventions and providing high resolution pollution insights at an accessible cost.

How to cite: Okeowo, B.: Monitoring and Mitigating Air Pollution in Healthcare: Characterising PM2.5 and NO2 Variability to Inform Sustainability Actions at Two UK Hospitals, EGU General Assembly 2026, Vienna, Austria, 3–8 May 2026, EGU26-2081, https://doi.org/10.5194/egusphere-egu26-2081, 2026.

EGU26-2252 | ECS | Orals | AS5.11

Regression Based Apportionment with Low-Cost Air Quality Sensors Using Machine Learning and Emission Inventories 

Rajat Sharma, Andry Razakamanantsoa, Erwann Rayssac, and Agnes Julian

Effective air quality management depends on the availability of reliable, locally resolved pollution data. Low-cost sensors (LCS) offer high spatial and temporal resolution but are often constrained by data reliability challenges, primarily due to their reliance on field calibration. Conventional calibration methods typically require colocation with reference stations, a limitation in regions with sparse monitoring infrastructure. This study presents a model that integrates emission inventory (EI) data with machine learning (ML) to achieve source apportionment (SA) using LCS, demonstrated through a case study in Fianarantsoa, Madagascar. Unlike conventional ML calibration approaches benchmarked solely against collocated reference monitors, the proposed method exploits a distributed sensor network in which each device is cross-validated by at least two neighbouring sensors within 500 m. Conventional calibrations frequently suffer from sensor- and site-specific biases, provide limited source-specific information, and are often hindered by proprietary algorithms. To address these issues, a Data Reliability Indicator (DRI) is introduced to evaluate LCS performance across high-, middle-, and low-income country contexts. The findings demonstrate that LCS, when supported by emission inventories and network-based cross-validation, can deliver reliable source apportionment and high-resolution air quality insights, even in regions with minimal reference-grade monitoring.

How to cite: Sharma, R., Razakamanantsoa, A., Rayssac, E., and Julian, A.: Regression Based Apportionment with Low-Cost Air Quality Sensors Using Machine Learning and Emission Inventories, EGU General Assembly 2026, Vienna, Austria, 3–8 May 2026, EGU26-2252, https://doi.org/10.5194/egusphere-egu26-2252, 2026.

Solar-powered low-cost sensors revolutionize aerosol tracking and air quality monitoring in quarries, where dust from blasting, crushing, and hauling creates health and environmental hazards. These autonomous systems integrate compact sensors for particulate matter (PM2.5, PM10) and gases with photovoltaic panels and batteries, enabling grid-independent operation in remote, harsh sites lacking power infrastructure.

The study is aimed at addresses critical needs in environmental monitoring for high-pollution industrial sites like quarries. Quarries generate significant aerosol dust and pollutants from blasting, crushing, and hauling, posing health risks to workers and nearby communities, which traditional monitoring often misses due to sparse, expensive stations.

Challenges in emissions monitoring for quarrying include sensor drift from dust and humidity needing periodic calibration, power fluctuations causing data gaps in low sunlight, and high costs for ruggedized units with remote maintenance, while opportunities revealed that solar panels combined with low-cost sensors offer significant prospects for quarry aerosol tracking and air quality monitoring by enabling reliable, off-grid deployment in harsh environments. These systems address power limitations, data gaps, and compliance needs in dusty, remote quarry operations. They support proactive pollution management and regulatory adherence.

This study is necessary because Low-cost solar-powered sensors for quarry aerosol tracking and air quality monitoring offer significant advantages through affordability, scalability, and sustainability. It also spans health/safety gains by reducing worker exposure, regulatory compliance, environmental protection toward zero-emissions, and economic savings via scalability.

How to cite: Aleh, U. I.: Applications of Solar Panels Low-Cost Sensors in Quarry Aerosol Tracking, and Air Quality Monitoring: Challenges and Opportunities, EGU General Assembly 2026, Vienna, Austria, 3–8 May 2026, EGU26-2326, https://doi.org/10.5194/egusphere-egu26-2326, 2026.

For air quality monitoring, especially at those locations where regulatory networks and challenging infrastructure often affect data collection, remote air quality sensors are an affordable ultimatum.

Clarity Movement provides advanced, IoT-enabled air quality monitoring solutions that combine precision sensing with global connectivity. The Clarity Node-S, integrates solar power, cellular communication, and weatherproof design to deliver reliable air quality data.

Two calibration systems are available: global pre-calibration and custom collocation calibration. The global calibration, applied at the factory using an extensive dataset of over six million measurements, provides consistent baseline performance across PM2.5 and NO2 monitoring meanwhile, custom collocation calibration fine-tunes sensor output can further correct for local conditions, improving measurement precision (R2 > 0.9 in optimal settings) by accounting for regional temperature, humidity, and pollution profiles.

Their ability to maintain accurate performance in remote and variable environments makes them ideal for expanding measurement coverage across urban and rural areas alike. By combining flexible calibration and autonomous operation, Clarity`s system supports accessible and reliable air quality data, advancing public health and environmental research across the world.

How to cite: O`Brien, M.: Global and custom calibration approaches for Clarity`s Node-S air quality measurements., EGU General Assembly 2026, Vienna, Austria, 3–8 May 2026, EGU26-3436, https://doi.org/10.5194/egusphere-egu26-3436, 2026.

EGU26-3600 | Orals | AS5.11

The Community of Practice for Air Quality Systems (COMPASS) Open-Source Data Management System 

Chris Hagerbaumer, Khurshed Alimov, Glynda Bathan-Baterina, Russell Biggs, Carlo Bontia, Samara Carbone, Jennifer DeWinter, Sebastian Diez, Sarah Elkotbeid, Dang Espita-Casanova, Elizabeth Friedman, Ikromjon Mamadov, Beto Martinez, Gerphas Opondo, Nathan Pavlovic, Everlyn Gayle Tamayo, and Matthew Tejada

Air pollution concentration data collected by low-cost sensors and other types of monitors requires a Data Management System (DMS) for data collection and storage, quality assurance, and analysis. Currently, organizations that measure air pollution must either purchase a proprietary system or develop a custom DMS, which can lead to duplication of effort, runaway costs, systems that are not built-for-purpose, and constrained data sharing. Organizations with fewer financial resources and/or less technical capacity are particularly challenged. The Community of Practice for Air Quality Systems (COMPASS) Open Data Management System project is creating a collaboratively developed, open-source DMS to address these challenges. 

The COMPASS project convenes core stakeholders representing different geographies and constituencies to develop an open-source DMS that meets the needs of organizations that collect air data or aim to do so. Core functions related to data ingestion, aggregation, harmonisation, storage, quality control, validation, and data sharing have been identified through extensive global stakeholder engagement, and a prototype DMS is now being piloted. 

This presentation will describe the collaborative process underway to develop and launch, by the end of 2026, a sustainable open-source DMS for practitioners and managers who need to efficiently manage the air pollution measurements they collect.

How to cite: Hagerbaumer, C., Alimov, K., Bathan-Baterina, G., Biggs, R., Bontia, C., Carbone, S., DeWinter, J., Diez, S., Elkotbeid, S., Espita-Casanova, D., Friedman, E., Mamadov, I., Martinez, B., Opondo, G., Pavlovic, N., Tamayo, E. G., and Tejada, M.: The Community of Practice for Air Quality Systems (COMPASS) Open-Source Data Management System, EGU General Assembly 2026, Vienna, Austria, 3–8 May 2026, EGU26-3600, https://doi.org/10.5194/egusphere-egu26-3600, 2026.

Recent advances in low-cost air quality sensors have substantially expanded the capacity to monitor air pollution at fine spatial and temporal scales, enabling analyses that are not feasible with sparse regulatory networks. Here, we use a dense network of low-cost PM2.5 sensors to investigate neighborhood-scale variability in winter air pollution and its relationship with urban land-cover patterns in Santiago, Chile, a highly polluted metropolitan area.

We deployed 55 sensors across four residential neighborhoods during winter 2021, generating high-resolution PM2.5 measurements that capture strong intra-neighborhood variability. These data were combined with high-resolution land-cover maps to quantify both compositional (e.g., land-cover proportions) and configurational (e.g., patch size and aggregation) metrics within multiple buffer distances (30–480 m) around each sensor. Scale-dependent relationships were evaluated using linear mixed-effects models across different PM2.5 concentration ranges.

The sensor network consistently detected spatially structured PM2.5 patterns that would not be observable using sparse reference stations. Built-up land cover showed positive association with PM2.5 concentrations, particularly during high-pollution episodes, while seasonal soil and deciduous tree cover were negatively associated with PM2.5 at specific spatial scales. Configurational metrics, especially the size and aggregation of land-cover patches, were also associated with PM2.5, indicating that how land cover is arranged can be as relevant as overall land-cover extent.

Our findings demonstrate that dense low-cost sensor networks can support robust scientific analyses of urban air quality, despite higher measurement uncertainty compared to reference-grade instruments. By enabling fine-scale assessments of land-cover–air pollution interactions, low-cost sensors offer significant opportunities for advancing urban air quality research and informing neighborhood-scale mitigation strategies, particularly in cities with limited monitoring infrastructure.

How to cite: Fernández, I., Diez, S., and González, A.: Neighborhood-scale spatial PM2.5 variability from dense low-cost sensor networks: the role of urban land-cover patterns in Santiago, Chile, EGU General Assembly 2026, Vienna, Austria, 3–8 May 2026, EGU26-4088, https://doi.org/10.5194/egusphere-egu26-4088, 2026.

EGU26-4119 | Posters on site | AS5.11

From software-assisted predictions to hardware-driven observations: advancing independent air quality sensor measurements 

Sebastian Diez, Miriam Chacón-Mateos, Carl Malings, and Valerio Ferracci

Low-cost air quality sensors are rapidly expanding observational capacity worldwide, particularly in regions with limited regulatory monitoring. However, increasing reliance on complex and often opaque data processing algorithms has blurred the boundary between “true” measurements and model-derived products, complicating data interpretation, comparability, and fitness-for-purpose assessments. Current performance standards largely focus on accuracy metrics, while providing limited guidance on transparency, traceability, and the nature of the underlying data-generating process (DGP).

Here, we present a conceptual and operational framework to classify sensor-derived data products based on their DGP and degree of measurement independence. Building on metrological principles and recent discussions on sensor processing levels, we introduce a formal definition of Independent Sensor Measurements (ISM), supported by five minimum criteria addressing signal dominance, admissible corrections, contemporaneity, signal provenance, and model independence from local data infrastructure. The framework distinguishes independent measurements from non-independent measurements and predictive products, and maps these categories onto an extended processing-level classification scheme.

The proposed classification enables users, manufacturers, and standardization bodies to more transparently communicate what a sensor product actually represents, supporting more appropriate data use, comparability across sites, and informed technology selection.

This work provides the foundation for integrating transparency and traceability into future sensor standards, incentivizing hardware-driven improvements, and strengthening the credibility of sensor deployments in regulatory, research, and community applications, particularly in low- and middle-income regions.


References:

Diez, S. et al. A framework for advancing independent air quality sensor measurements via transparent data generating process classification. npj Clim Atmos Sci 8, 285 (2025). https://doi.org/10.1038/s41612-025-01161-2

How to cite: Diez, S., Chacón-Mateos, M., Malings, C., and Ferracci, V.: From software-assisted predictions to hardware-driven observations: advancing independent air quality sensor measurements, EGU General Assembly 2026, Vienna, Austria, 3–8 May 2026, EGU26-4119, https://doi.org/10.5194/egusphere-egu26-4119, 2026.

The study is aimed at investigating the awareness of risks associated with the exposure to atmospheric aerosol at quarry site and its health implication in Ebonyi state, and to examines how low-cost air quality sensors can enhance monitoring and management efforts. The questionnaire used covers the demographic information, awareness of occupational health hazards, use of personal protective equipment, health effects experienced by workers, and suggestions for improvement. A total of three hundred and fifty (350) questionnaire were distributed to respondents. a sample of one hundred and eighty-five (185) for quarry workers, quarry owners/managers, community members living near quarry sites, sixty-five (65) healthcare providers, fifty-five (55) environmental protection agencies and forty-five (45) policymakers was selected through random sampling.  the data collected was statistically analyzed using frequency counts and mean. a total of three hundred and forty-seven (348) were returned, two (2) were torn and five (5) were wrongly filed. a total of three hundred and forty-three (343) were accepted and assembled for analysis. The findings on the awareness of occupational health hazards among quarry workers indicate a concerning lack of knowledge and training in this field. The findings from assessing the use of personal protective equipment (PPE) among workers indicate varying levels of compliance with safety measures. The findings from investigating the health effects of workers' exposure to aerosols at a quarry site reveal significant impacts on their well-being. The findings from the investigation aimed at identifying suggestions for improving a conducive work environment at the quarry indicate enhancement of health care. The responses from questionnaire provide valuable insights into the current state of occupational health and safety at quarry sites in Ebonyi State and help identify areas for improvement.  The research reviewed that lack of low-cost air quality sensors for monitoring of aerosol from quarry station is hindering the awareness of risk of exposure. Low-cost air quality sensors offer a practical solution for monitoring these risks, enabling real-time data collection that informs both operational practices and community engagement efforts.  Critically, the integration of low-cost air quality sensors into the environmental management framework at quarry sites in Ebonyi State can significantly enhance the understanding and control of air pollution. By providing real-time data and fostering community involvement, these sensors can play a pivotal role in mitigating the adverse effects of quarrying on air quality and public health. Therefore, collaborative approaches to help in having access to low-cost air quality sensors in Nigeria, research grants and sponsorship for training are the panacea for clean air quarry sites of Ebonyi State. 

How to cite: Ibeh, Dr. G. F. and Aleh, U. I.: Investigating Awareness of Atmospheric Aerosol Exposure Risks and the Criticality of Low-Cost Air Quality Sensors at Quarry Sites in Ebonyi State, Nigeria , EGU General Assembly 2026, Vienna, Austria, 3–8 May 2026, EGU26-4221, https://doi.org/10.5194/egusphere-egu26-4221, 2026.

EGU26-5187 | Posters on site | AS5.11

Improving the long-term accuracy of low-cost sensors through a novel Automatic Drift Correction 

Edurne Ibarrola-Ulzurrun and Irene Lara-Ibeas

Low‑cost air quality sensors are increasingly deployed to complement reference monitoring stations due to their low cost and ease of installation. However, these sensors are susceptible to environmental conditions and long‑term nonlinear drift, which can substantially degrade data accuracy over time. Existing calibration strategies, particularly those based on machine learning and periodic co‑location with reference instruments, improve performance but they often involve considerable maintenance effort and costs, especially when managing large-scale networks.

Kunak has developed an innovative Automatic Drift Correction (ADC) algorithm that autonomously correct the baseline and sensitivity drift in electrochemical gas sensors. This new method works alongside the Kunak algorithm that compensates for environmental factors such as temperature and humidity across the full operating range. Together, they allow for accurate measurements without the need for reference data or frequent manual recalibrations.

The ADC algorithm enables continuous and sensor-specific baseline and sensitivity adjustments independently from the location and the ambient conditions, ensuring consistent data quality over time, and without using Machine Learning or Artificial Intelligence models. This significantly reduces the operational complexity and costs associated with maintaining air quality sensor networks, especially in large deployments.

We evaluated the proposed method on a NO2 sensors co‑located with a regulatory air quality monitoring station (AQMS) and compared the performance against a conventional manual calibration procedure. Results demonstrate that the ADC algorithm maintains data integrity over time with performance comparable to the periodic manual calibration, even under variable environmental conditions.

The method offers a scalable and reliable alternative to traditional approaches and supports the recommendations outlined by the WMO, which highlight the need for automated, low-effort maintenance solutions.

This work presents a practical and efficient tool for sustaining the long-term reliability of air quality data, making it especially suitable for distributed air quality monitoring networks.

How to cite: Ibarrola-Ulzurrun, E. and Lara-Ibeas, I.: Improving the long-term accuracy of low-cost sensors through a novel Automatic Drift Correction, EGU General Assembly 2026, Vienna, Austria, 3–8 May 2026, EGU26-5187, https://doi.org/10.5194/egusphere-egu26-5187, 2026.

EGU26-7366 | Orals | AS5.11

Integrating validated large-scale sensor observations into ML-based PM2.5 mapping: lessons from Europe with global relevance 

Philipp Schneider, Shobitha Shetty, Amirhossein Hassani, Vasileios Salamalikis, Kerstin Stebel, Paul Hamer, Terje Koren Berntsen, and Nuria Castell

Low-cost sensor (LCS) networks can complement sparse regulatory monitoring, but their value depends on robust integration strategies that preserve data quality while exploiting dense spatial sampling. Here we assess the added value of incorporating validated LCS PM2.5 observations into the S-MESH (Satellite and ML-based Estimation of Surface air quality at High resolution) machine learning framework (Shetty et al., 2024, 2025) to generate continental-scale, 1 km resolution surface PM2.5 fields across Central Europe. Two integration strategies are evaluated for 2021–2022 within a stacked XGBoost architecture driven by satellite aerosol optical depth, meteorological predictors, and CAMS regional forecasts: a) using LCS data as an additional training target (LCST), and b) using LCS information as a model input feature (LCSI) via an inverse-distance-weighted spatial convolution layer that encodes local sensor influence. Relative to a baseline trained only on official monitoring stations, LCSI yields consistent performance gains, with RMSE reductions of ~15–20% in urban areas, whereas LCST provides less consistent improvement. The resulting high-resolution mapping product achieves skill comparable to the CAMS regional reanalysis, often considered as a modelling “gold standard” for European air-quality assessment, and in some evaluations surpasses it, with lower annual mean absolute error (2.68 vs 3.32 µg m⁻³) (Shetty et al., 2026). This demonstrates that a data-fusion ML approach including LCS information can deliver reanalysis-level performance at 1 km resolution while requiring only modest computational resources compared with running full chemical transport model reanalyses, enabling rapid updates and scalable deployment. SHAP-based attribution further suggests that LCSI improves the model’s ability to capture localized pollution variability, while performance degrades where sensor density is low, limiting representation of inter-urban transport.

Although demonstrated in Europe, the underlying methodology, namely combining globally available satellite products and meteorology with quality-controlled LCS networks in a computationally efficient ML framework, has potential to strengthen air-quality assessment also in resource-limited settings where regulatory infrastructure is scarce. A requirement for this is that appropriate sensor calibration/validation workflows are in place and equitable partnerships support sustainable sensor deployment and data stewardship.


Shetty, S., Schneider, P., Stebel, K., Hamer, P. D., Kylling, A., and Koren Berntsen, T.: Estimating surface NO2 concentrations over Europe using Sentinel-5P TROPOMI observations and Machine Learning, Remote Sens. Environ., 312, 114321, https://doi.org/10.1016/j.rse.2024.114321, 2024.

Shetty, S., Hamer, P. D., Stebel, K., Kylling, A., Hassani, A., Berntsen, T. K., and Schneider, P.: Daily high-resolution surface PM2.5 estimation over Europe by ML-based downscaling of the CAMS regional forecast, Environ. Res., 264, 120363, https://doi.org/10.1016/j.envres.2024.120363, 2025.

Shetty, S., Hassani, A., Hamer, P. D., Stebel, K., Salamalikis, V., Berntsen, T. K., Castell, N., and Schneider, P.: Evaluating the role of low-cost sensors in machine learning based European PM2.5 monitoring, Environ. Res., 291, 123558, https://doi.org/10.1016/j.envres.2025.123558, 2026.

How to cite: Schneider, P., Shetty, S., Hassani, A., Salamalikis, V., Stebel, K., Hamer, P., Berntsen, T. K., and Castell, N.: Integrating validated large-scale sensor observations into ML-based PM2.5 mapping: lessons from Europe with global relevance, EGU General Assembly 2026, Vienna, Austria, 3–8 May 2026, EGU26-7366, https://doi.org/10.5194/egusphere-egu26-7366, 2026.

Low-cost sensors (LCS) are increasingly deployed to enhance the spatial resolution of air quality monitoring networks, particularly in communities that are sparsely covered by regulatory-grade instruments. Despite the potential of LCS to provide new insights into local-level pollutant concentrations, issues with accuracy, calibration drift, and maintenance requirements pose significant challenges for ensuring that collected data reliably support scientific analysis and decision-making. Data fusion techniques that integrate LCS data with other observations, such as regulatory-grade ground measurements and remotely sensed satellite data, show promise for improving the accuracy and resolution of air quality predictions. However, standardized approaches for data fusion are not yet available, limiting the use of multimodal data for decision-making.

Here, we present a community-scale air quality monitoring framework that integrates data from LCS networks, regulatory-grade monitoring stations, and satellite-derived observations through a stochastic advection–diffusion (SAD) modeling approach for fine particulate matter (PM2.5). The proposed framework leverages multimodal spatiotemporal data to generate high-resolution PM2.5 fields while explicitly accounting for uncertainty arising from sparse observations, sensor heterogeneity, and measurement error within a probabilistic state-space formulation. We apply the framework for a statewide case study in Texas, USA, using archived LCS observations from the PurpleAir network, regulatory-grade PM2.5 measurements from the U.S. EPA Air Quality System (AQS), and satellite-derived PM2.5 products from NASA’s Tropospheric Emissions: Monitoring of Pollution (TEMPO) mission (early-release PM2.5 products). We examine how different combinations of data sources contribute to predictive performance, providing insight into the relative value of low-cost, regulatory, and satellite observations within the integrated framework. The results demonstrate the value of combining LCS and satellite data within a physics-informed probabilistic framework to support community-scale air quality assessment, sensor network design, and adaptive environmental decision-making.

How to cite: Hummel, M. and Choi, B.: Informing Regional-Scale Air Quality Monitoring through Multimodal Data Integration and Probabilistic Spatiotemporal Modeling, EGU General Assembly 2026, Vienna, Austria, 3–8 May 2026, EGU26-7477, https://doi.org/10.5194/egusphere-egu26-7477, 2026.

EGU26-7710 | ECS | Orals | AS5.11

Evaluation of OPC-N3 in an Urban Environment in Western India 

Yash Dahima and Aditya Vaishya

Low-cost optical particle counters (OPCs) are increasingly used to supplement regulatory air quality measurements, yet their performance remains strongly dependent on aerosol characteristics and environmental conditions. In this study, five OPC-N3 sensors were co-located with a research-grade GRIMM 11-D aerosol spectrometer and evaluated using hourly measurements from an urban polluted site in western India (Ahmedabad) during September 2025. Mean ± standard deviation PM2.5 (PM10) concentrations during the colocation period were 25 ± 10 (82 ± 37) µg/m3, whereas temperature and relative humidity (RH) were 30 ± 3 °C and 74 ± 14 %.

OPC-N3 sensors show moderate to strong correlations with the GRIMM for PM1, PM2.5, and PM10 (r ≈ 0.7-0.9), demonstrating good capture of temporal variability, but consistently underestimate PM mass (PM2.5: normalized RMSE ≈ 23-37%). The regression slopes increase from PM1 (0.3-0.5) to PM2.5 (0.5-0.7) and remain similar for PM10, indicating relatively better performance for coarser fractions. To diagnose the drivers of OPC response, the influence of meteorological parameters and the reference PM2.5/PM10 ratio was quantified using their correlations with normalized OPC measurements (OPC/GRIMM PM ratio). The normalized OPC PM shows moderate positive correlations with RH (r ≈ 0.4-0.5) and moderate negative correlations with temperature (r ≈ -0.3 to -0.5), highlighting the important role of meteorology and hygroscopic growth in governing OPC response. The normalized OPC PM showed near-zero correlations with the reference PM2.5/PM10 indicating that the underlying aerosol size distribution is probably not playing a big role in OPC performance in this environment. OPC-derived aerosol size distribution captures broad features similar to the reference, with minimal diurnal variability.

Overall, the results demonstrate that OPC-N3 sensors are suitable for capturing relative variability and trends but require environment- and size-fraction-specific calibration. In particular, OPC performance is primarily governed by meteorological conditions in polluted urban environments, underscoring the need to explicitly account for meteorology for reliable PM mass estimation across diverse environments.

How to cite: Dahima, Y. and Vaishya, A.: Evaluation of OPC-N3 in an Urban Environment in Western India, EGU General Assembly 2026, Vienna, Austria, 3–8 May 2026, EGU26-7710, https://doi.org/10.5194/egusphere-egu26-7710, 2026.

EGU26-7747 | ECS | Posters on site | AS5.11

A Noval Calibration Technique for Optical Particle Counters 

Jessica Girdwood

Calibrations of optical particle spectrometers (OPSs) are non-trivial and conventionally involve aerosolisation techniques, which are challenging for larger particles. In this paper, we present a new technique for OPS calibration that involves mounting a static fibre within the instrument sample area, measuring the scattering cross section (SCS), and then comparing the SCS with a calculated value. In addition, we present a case for the use of generalised Lorenz–Mie theory (GLMT) simulations to account for deviations in both minor- and major-axis beam intensity, which has a significant effect on particles that are large compared with the beam waist, in addition to reducing the need for a “top-hat” spatial intensity profile. The described technique is OPS independent and could be applied to a field calibration tool that could be used to verify the calibration of instruments before they are deployed. In addition to this, the proposed calibration technique would be suited for applications involving the mass production of low-cost OPSs.

How to cite: Girdwood, J.: A Noval Calibration Technique for Optical Particle Counters, EGU General Assembly 2026, Vienna, Austria, 3–8 May 2026, EGU26-7747, https://doi.org/10.5194/egusphere-egu26-7747, 2026.

EGU26-7903 | ECS | Orals | AS5.11

Low-cost sensors to quantify activity-driven air pollution in indoor environments 

Dylan Sanghera, Dimitrios Bousiotis, Meirkhan Sakenov, Khalid Rajab, and Francis Pope

Indoor air quality is a dominant risk factor for human health, with many people spending approximately 80-90% of their time indoors. While outdoor infiltration, cooking, heating and cleaning sources are well known, human presence and activity through movement are harder to quantify and thus scarcely considered. This research investigates the relationship between occupancy, physical activity - defined by Kinetic Energy (KE), and particulate matter (PM) in real-world environments, including homes and offices. Our methodology uses a sensing network that combines low-cost air quality sensors with high-resolution radar-based motion sensors. Through this approach, we apply both simple linear regression and source apportionment modelling to define and isolate the contribution of KE-induced resuspension from indoor sources, thereby quantifying the contribution of human activity on indoor air quality levels. The first results, published recently (Bousiotis et al. 2026), establishes a significant correlation between KE thresholds and coarse particle mass (up to r = 0.74), suggesting that human-induced PM10 is a significant, yet under-quantified, contributor to personal exposure. In our current and upcoming work, we provide an update on the analysis for multiple residential and office environments, and go further by analysing the contribution of human movement to PM2.5 levels. By considering the ‘person-as-a-source’ dynamic, this research provides a scalable framework for improving indoor air quality management through low-cost, high-resolution environmental sensing, whilst contributing to the evidence base for healthier building design.

Bousiotis D., D.S. Sanghera, J. Carrington, G. Hodgkiss, F. Jajarmi, K. Rajab and F.D. Pope (2026) Parameterising the effect of human occupancy and kinetic energy on indoor air pollution. npj Climate and Atmospheric Science. https://www.nature.com/articles/s41612-025-01281-9

How to cite: Sanghera, D., Bousiotis, D., Sakenov, M., Rajab, K., and Pope, F.: Low-cost sensors to quantify activity-driven air pollution in indoor environments, EGU General Assembly 2026, Vienna, Austria, 3–8 May 2026, EGU26-7903, https://doi.org/10.5194/egusphere-egu26-7903, 2026.

EGU26-8204 | Orals | AS5.11

Towards lower-cost spectroscopic sensors: Applications in mobile monitoring and roadside measurements of NO2  

Dean Venables, Conor Dorney, Ashley Edmonds, Rohit Vikas, and Meng Wang

Nitrogen dioxide (NO2) is a major urban air pollutant, but current low-cost sensors for NO2 based on electrochemical cells have important drawbacks, including modest accuracy and susceptibility to temperature, humidity, and chemical interferences.  These sensors are also too slow for mobile monitoring and for measuring the large and rapid fluctuations of NO2 in the transport microenvironment. These are important monitoring approaches and settings for NO2 because vehicles are the dominant source of NO2 in cities. Here we present our work in adapting cavity-enhanced absorption spectroscopy (CEAS) to develop fast (< 5 s), sensitive (±1 ppb), and portable sensors for NO2 at lower cost.

We characterise sensor performance in laboratory intercomparisons, and present adaptations to different platforms (vehicles, bicycles, and backpacks). Case studies are presented of mobile and stationary monitoring of transport emissions in Cork city and in smaller towns in Ireland. These measurements show the disproportionate impact of a small number of highly polluting vehicles. A perspective on the challenges and prospects for this approach is discussed.

How to cite: Venables, D., Dorney, C., Edmonds, A., Vikas, R., and Wang, M.: Towards lower-cost spectroscopic sensors: Applications in mobile monitoring and roadside measurements of NO2 , EGU General Assembly 2026, Vienna, Austria, 3–8 May 2026, EGU26-8204, https://doi.org/10.5194/egusphere-egu26-8204, 2026.

EGU26-8205 | ECS | Posters on site | AS5.11

Development and laboratory validation of a low-cost PM₂.₅ and CO sensor network for indoor air quality assessment in residential heating environments 

Blanca Ríos, Oscar Loyola-Valenzuela, Daniel Quintero-Bernal, Maximiliano López, Darlyn Tapia, and Sebastian Diez

Low-cost air quality sensors have emerged as a powerful tool to complement traditional monitoring networks by enabling high spatial and temporal resolution observations at a fraction of the cost of reference instruments. However, their application in indoor environments, particularly in residential settings affected by combustion-based heating, remains limited despite the significant health risks associated with indoor air pollution.

In this study, we present the development and laboratory validation of a low-cost, modular sensor designed for real-time monitoring of fine particulate matter (PM₂.₅), carbon monoxide (CO), temperature, and relative humidity in residential indoor environments. The system is based on open-source hardware and integrates an optical PM₂.₅ sensor, a CO gas sensor, and environmental sensors coupled to an ESP32 microcontroller, enabling continuous data acquisition, local storage (microSD), real-time visualization (OLED display), and wireless data transmission. The device is housed in a custom-designed 3D-printed enclosure optimized for airflow, sensor protection, and portability.

Following laboratory validation against certified reference instruments, the sensor units will be deployed inside dwellings equipped with different residential heating systems, including wood-burning stoves, kerosene heaters, and electric heating. The instruments will be distributed across multiple indoor spaces within each household (e.g., living rooms, bedrooms, and kitchens) to characterize the spatial distribution of pollutants and to assess how combustion emissions propagate through different indoor microenvironments under real living conditions.

A total of ten sensor units were assembled and evaluated under controlled laboratory conditions through side-by-side comparison with reference instruments. The validation protocol focused on accuracy, temporal stability, inter-sensor consistency, and operational robustness. The results show good agreement with reference measurements for both PM₂.₅ and CO, demonstrating that the system provides reliable and stable observations suitable for indoor air quality applications.

The inclusion of CO, temperature, and humidity monitoring represents a key advancement of the system, allowing for a more comprehensive characterization of combustion emissions, ventilation conditions, and indoor comfort. This integrated approach supports both chronic exposure assessment and acute risk detection, including the identification of potentially lethal CO accumulation events in poorly ventilated dwellings.

This work demonstrates the feasibility of deploying low-cost sensor networks for high-resolution indoor air quality monitoring and highlights their potential for citizen science initiatives, stove replacement programs, environmental health studies, and policy support in regions affected by residential combustion emissions.

How to cite: Ríos, B., Loyola-Valenzuela, O., Quintero-Bernal, D., López, M., Tapia, D., and Diez, S.: Development and laboratory validation of a low-cost PM₂.₅ and CO sensor network for indoor air quality assessment in residential heating environments, EGU General Assembly 2026, Vienna, Austria, 3–8 May 2026, EGU26-8205, https://doi.org/10.5194/egusphere-egu26-8205, 2026.

EGU26-9353 | Orals | AS5.11

Improving data reliability in air quality monitoring from static and mobile sensor platforms and networks using the FILTER framework 

Vasileios Salamalikis, Amirhossein Hassani, Philipp Schneider, and Núria Castell

The growing adoption of low-cost sensors (LCSs) has significantly enhanced environmental monitoring by enabling widespread, community-driven data collection, particularly in regions requiring dense monitoring, and in regions with limited or no reference instrumentation. Increased public awareness and demand for dense environmental monitoring have resulted in extensive air quality and meteorological datasets from diverse sources. However, the integration of such datasets into regulatory frameworks and large-scale environmental monitoring remains challenging due to persistent issues related to data quality, standardization, and interoperability. 

To address these challenges, the FILTER (Framework for Improving Low-cost Technology Effectiveness and Reliability) approach developed by Hassani et al. (2025) provides a suite of algorithms to harmonize, quality-check, flag, and perform in-situ corrections on crowdsourced PM2.5 LCS datasets. While FILTER was initially designed and validated for static PM2.5 sensors, it has since been extended to address data quality challenges associated with the dynamics of mobile and wearable sensing. 

Across both static and mobile LCS platforms, FILTER employs a unified processing pipeline that generates measurement-level quality flags based on multiple statistical tests, to quantify the reliability of each observation. Quality control (QC) includes statistical tests to: (a) assess physical measurement consistency (range validity test), (b) detect flatline behavior (constant value test), and (c) identify abnormal patterns (spatiotemporal outlier detection test) using both historical trends and spatial comparisons with neighboring LCSs. Beyond these mandatory QC steps, more advanced statistical procedures incorporate relative (spatial correlation test) and absolute (spatial similarity test) comparisons with nearby LCSs, higher-quality instruments, and reference monitoring stations. For mobile and wearable sensing, FILTER has been specifically adapted to support pairwise comparisons between mobile sensors and comparisons with higher-accuracy nodes, accounting for operation under dynamic environmental and operational conditions. In this context, statistical comparisons are evaluated during rendezvous events, that is, periods in which the mobile sensor and a higher-accuracy node provide temporally coincident measurements. The modified framework retains the core principles of transparency, scalability, and sensor independence, while introducing additional steps to address motion-related artifacts, intermittent time series, and location-specific uncertainties. 

FILTER is developed in the open-source R environment. Its modular and hierarchical design allows flexible adaptation of quality control and correction workflows based on data availability, the spatiotemporal characteristics of LCS networks, and application-specific requirements. By improving data reliability and usability, FILTER enables crowdsourced LCS datasets to serve as a reliable complement to official monitoring networks for air quality management, urban- and regional-scale modeling, and policymaking. 

References 

Hassani, A., Salamalikis, V., Schneider, P., Stebel, K., and Castell, N.: A scalable framework for harmonizing, standardization, and correcting crowd-sourced low-cost sensor PM2. 5 data across Europe, J. Environ. Manage., 380, 125100, 2025. 

How to cite: Salamalikis, V., Hassani, A., Schneider, P., and Castell, N.: Improving data reliability in air quality monitoring from static and mobile sensor platforms and networks using the FILTER framework, EGU General Assembly 2026, Vienna, Austria, 3–8 May 2026, EGU26-9353, https://doi.org/10.5194/egusphere-egu26-9353, 2026.

EGU26-10792 | Posters on site | AS5.11

UrbanAirLab: Data-Driven Calibration of Low-Cost Air Quality Sensors Using Long-Term Co-Location Measurements 

Katja Mannschreck, Miriam Chacón-Mateos, Marc Golder, Pascal Graf, Eduardo Herrera-Carrión, Joschka Kieser, Elisabeth Lachnit, Ulrich Vogt, and Tobias Weiland

Monitoring air quality in urban areas is essential for assessing environmental pollution and its impact on health and climate, as well as for developing transport and urban planning measures. Legally regulated air quality measurements are based on high-precision reference measuring stations, but their high investment and operating costs mean that their spatial coverage is limited. As a result, small-scale differences in pollutant levels cannot be adequately recorded. Low-cost sensors (LCS) offer great potential here, as they enable dense, continuous and cost-efficient collection of air quality data. At the same time, however, their measurements are often distorted by sensor drift, cross-sensitivities and meteorological influences such as temperature and relative humidity, which limits their direct use for scientific analysis.

We present the UrbanAirLab, a long-term air quality monitoring network on a university campus in Heilbronn (Germany) that will be expanded to cover the city of Heilbronn in the future. The monitoring network is based on self-designed low-cost multi-sensor systems for the continuous recording of NO, NO₂, O₃, CO, PM2.5 and PM10 as well as meteorological parameters. The systems include two thermal low-cost dryers as preconditioning method for the PM and the gas sensors inlets. A central element of the concept is the permanent co-location of selected sensor boxes with an official reference measuring station of the Baden-Württemberg State Agency for the Environment (LUBW), which provides reliable comparative data over long periods of time. The UrbanAirLab is also designed as open-source real-world laboratory and serves to train and involve students and schoolchildren in practical environmental observation and data analysis.

The research design follows an empirical, data-driven approach. The aim is to develop and validate machine learning models that reconstruct reference measurements as accurately as possible from the raw data of the low-cost sensors. Data processing is carried out via a scalable pipeline that enables both the continuous storage of time series data and reproducible calibration modelling and evaluation. Various model approaches are being investigated, including multilinear regression, random forest models and gradient boosting methods.

A particular focus is on investigating seasonal effects, the long-term stability of the calibration models and their transferability to identical sensor boxes. The results presented contribute to the further development of data-driven calibration strategies for low-cost air quality monitoring networks and to the evaluation of their potential for scientific environmental observation.

How to cite: Mannschreck, K., Chacón-Mateos, M., Golder, M., Graf, P., Herrera-Carrión, E., Kieser, J., Lachnit, E., Vogt, U., and Weiland, T.: UrbanAirLab: Data-Driven Calibration of Low-Cost Air Quality Sensors Using Long-Term Co-Location Measurements, EGU General Assembly 2026, Vienna, Austria, 3–8 May 2026, EGU26-10792, https://doi.org/10.5194/egusphere-egu26-10792, 2026.

EGU26-11683 | ECS | Orals | AS5.11

Advanced testing facility for gas sensors validation under controlled conditions 

Ana Paula Mendes Emygdio, Valerio Ferracci, Gabriel Garcia, and Nicholas Martin

Small sensor systems developed over the last decade have demonstrated great potential for air quality and trace pollutant monitoring. These systems are widely available on the market and can provide a fast and lower-cost alternative that is complementary to reference methods. There could, however, be a number of issues in the quality of the data from such sensor systems, as they are prone to interferences, temporal drift, low accuracy and lack of metrological traceability. Therefore, adherence to Technical Specification (TS) 17660-1 (Air quality – Performance evaluation of air quality sensor systems – Part 1: Gaseous pollutants in ambient air), issued by the European Committee for Standardization (CEN), is essential for ensuring data quality through a structured metrological assessment. The TS is designed for gaseous pollutants and entails laboratory and field tests that are complex and require high-accuracy, dedicated facilities. The laboratory validation includes preliminary tests to evaluate response time, lack of fit of the regression function and repeatability followed by a series of extended tests designed to assess long-term drift, cross-sensitivities by interfering gases, temperature effects, humidity effects and memory effects of main gas, temperature and humidity.

In this work, we outline the performance of the Multiple Atmosphere Controlled Environment (MACE) facility under several experimental regimes demonstrating how this state-of-the-art facility can be used to perform the laboratory tests described in TS 17660-1. The MACE is an advanced testing facility developed at the National Physical Laboratory (UK) designed to evaluate the performance of gas sensors and assist in the development of new products that meet the requirements of air quality legislation. The facility can create reproducible and stable environmental conditions under a range of temperature, relative humidity, and gas concentrations and compositions. The MACE consists of an environmental chamber that houses six stainless steel exposure pods and includes an insulated environment for delivering temperature-controlled tests. Accurate single and multiple test atmospheres are generated by blending zero air with traceable gas mixtures via an array of calibrated mass flow controllers. The desired relative humidities are generated by a dedicated vaporizer unit. The exposure chambers are connected to an array of reference instruments capable of measuring priority pollutants, including NO, NO2, SO2, CO, CO2 and O3. Here we present the results of tests on a set of sensor systems performed using the MACE, demonstrating that the facility can perform all the tests outlined in the TS. This makes the MACE one of only a few facilities worldwide that meet the requirements specified in the TS.

This work represents the first step toward standardizing small sensor systems, with subsequent stages involving full validation of the TS (including field tests) and its adoption as a Standard, which are currently underway. This work, along with the implementation of quality assurance and quality control practices, will ensure that the data from small sensor systems are traceable and of the highest quality possible.

How to cite: Mendes Emygdio, A. P., Ferracci, V., Garcia, G., and Martin, N.: Advanced testing facility for gas sensors validation under controlled conditions, EGU General Assembly 2026, Vienna, Austria, 3–8 May 2026, EGU26-11683, https://doi.org/10.5194/egusphere-egu26-11683, 2026.

EGU26-11877 | ECS | Posters on site | AS5.11

Opening the Black Box: Explainable machine learning techniques for air quality sensor calibration  

Miriam Chacón-Mateos, Eduardo Herrera-Carrión, Marc Golder, Katja Mannschreck, Ulrich Vogt, Sebastian Diez, Tobias Grein, Joschka Kieser, Sven Reiland, Nina Gaiser, and Markus Köhler

Air pollution remains a major environmental and public health challenge. The World Health Organization (WHO) estimates that air pollution is associated with 9 million premature deaths annually. Low-cost sensors (LCS) are a promising complement to regulatory monitoring because they can deliver high frequency, hyperlocal air quality data. However, LCS data quality is affected by limitations of the measuring principle, sensor drift/aging, cross-sensitivities to other compounds, and meteorological influences like temperature (T) and relative humidity (RH), which can undermine reliability and stakeholder trust. In recent years, machine learning (ML) has been widely explored and applied to LCS data to correct systematic biases in raw sensor signals and improve the accuracy of the measurements, yet the frequent lack of explainability of black-box models can further reduce transparency and confidence in the post-processed sensor data.

In the context of the MoDa project and in collaboration with UrbanAirLab project of the University of Applied Sciences in Heilbronn, this study aims to create an explainable ML calibration workflow for LCS NO₂ measurements to enhance transparency of calibration models. The dataset consists of 1-min raw data with a co-location period from 01.06.2025 to 20.11.2025 in a regulatory measurement station located in Heilbronn (urban background). First, an exploratory data analysis (EDA) is carried out, which includes time synchronization of LCS and reference data, handling of missing values, outlier detection with Density-Based Spatial Clustering of Applications with Noise (DBSCAN), and resampling to hourly averages. Then different calibration models are trained including as input parameters the working and auxiliary electrode signals of the NO2 sensor as well as external data such as T, RH and O3 data. The tested models include Multiple Linear Regression (MLR), Support Vector Regressor (SVR), Random Forest Regressor (RF), eXtreme Gradient Boosting (XGBoost), and Artificial Neural Network (ANN). The performance evaluation is carried out using the relative expanded uncertainty as suggested in DIN CEN TS 17660-1 and also other standard metrics such as RMSE, MAE, R², and bias.

The results of these metrics suggest that RF provides the best overall performance (RMSE = 5.50 µg/m³, MAE = 3.93 µg/m³, R² = 0.69; Pearson r = 0.83) and near-zero mean bias. XGBoost performs similarly (RMSE = 5.62 µg/m³, R² = 0.69), followed by ANN (RMSE = 5.76 µg/m³, R² = 0.67).

Explainable ML techniques are implemented in a second step as an auditing layer to support data quality assurance and control (QA/QC). These include Permutation Feature Importance (PFI) to screen which predictors most affect out-of-sample performance by measuring the score drop after removing each feature, SHapley Additive exPlanations (SHAP) for global and local attributions, and Individual Conditional Expectation (ICE) and Partial Dependence (PDP) Plots to summarize average effects while exposing heterogeneity and interaction patterns. Because predictors such as T and RH are often correlated in co-location datasets, we also use Accumulated Local Effects method to obtain more reliable effect estimates under feature dependence.

By combining reproducible calibration models with systematic explainability, this work supports more transparent QA/QC practices and contributes to creating transferable workflows for deploying LCS for air-quality monitoring.

How to cite: Chacón-Mateos, M., Herrera-Carrión, E., Golder, M., Mannschreck, K., Vogt, U., Diez, S., Grein, T., Kieser, J., Reiland, S., Gaiser, N., and Köhler, M.: Opening the Black Box: Explainable machine learning techniques for air quality sensor calibration , EGU General Assembly 2026, Vienna, Austria, 3–8 May 2026, EGU26-11877, https://doi.org/10.5194/egusphere-egu26-11877, 2026.

EGU26-11987 | ECS | Orals | AS5.11

Harness low-cost sensors for the targetedassessment of policy 

Seán Schmitz and Erika von Schneidemesser

The last several decades have seen steady and expansive growth both in the development and the application of low-cost sensors (LCS) in the field of air pollution research. They are now increasingly prevalent in air quality monitoring thanks to their affordability and adaptability across diverse environments. However, in the wider academic and monitoring communities, their deployment has largely focused on the expansion of spatial coverage and generating larger datasets, either to generate data where there previously was none, or to fill spatiotemporal gaps. In this work, we argue that LCS have high potential for use in the targeted assessment of policy interventions, and that this potential remains largely underexplored. Drawing on a number of recent studies, we demonstrate the value of LCS as an effective tool for evaluating the impacts of policy measures on urban air pollution.

Utilizing these studies as an empirical basis, this work introduces a five-step rubric for guiding targeted policy assessments using LCS. These steps broadly are: 1. Identification, in which partnerships and policies are identified and established; 2. Planning, in which measurement and intervention timelines are aligned and campaigns designed; 3. Calibration, in which LCS are suitably calibrated using in-situ co-locations for the environments they are to be used in; 4. Analysis, in which LCS data is collected and analysed, with potential impacts of the policy intervention quantified; and 5. Dissemination, in which the results are published and presented in a timely manner to relevant stakeholders. These cyclical steps should be considered fluid and dynamic, as they are intended to align with policymaking timelines, which often diverge from research timelines.

In addition, we discuss the strengths and limitations of LCS for use in targeted policy assessment, to clarify key criteria for deployment in this application. These strengths include their capacity for high spatiotemporal resolution, flexible deployment options (especially outdoor), and cost-effectiveness in shorter term campaigns. These attributes enable the detection of hyperlocal pollution patterns and emission events that are often missed by sparsely populated reference monitoring networks. Key limitations to this approach include sensor drift, inter-sensor variability, cross-sensitivities to other pollutants, and the need for rigorous calibration. These factors can constrain the data quality and limit the detection of the impact signal of the policy interventions in question. However, by properly quantifying uncertainties and accounting for e.g., meteorological variability, these limitations can be taken into account and relevant results can still be delivered to stakeholders.

As such, this work argues for a shift in the research landscape surrounding LCS, and advocates for a shift away from indiscriminate large-scale sensor deployment and toward targeted assessment of individual policies at the local scale. We encourage its further uptake and remain optimistic that this approach can transform the evidence base for local policy decision-making, to create a step change in the tools and data used for mitigating air pollution and providing clean, healthy air for all.

How to cite: Schmitz, S. and von Schneidemesser, E.: Harness low-cost sensors for the targetedassessment of policy, EGU General Assembly 2026, Vienna, Austria, 3–8 May 2026, EGU26-11987, https://doi.org/10.5194/egusphere-egu26-11987, 2026.

EGU26-13161 | ECS | Orals | AS5.11

Assessing Air Pollution Vulnerability in the Kathmandu Valley: Insights from Personal Particulate Matter Exposure Monitoring with Portable Sensors 

Ruby Maka Shrestha, Francis Pope, Rosie Day, Fraser Sugden, Bhupesh Adhikary, and Dimitrios Bousiotis

Air pollution remains a leading public health concern, disproportionately affecting densely populated urban areas in low and middle-income countries such as Nepal. Limited regulatory monitoring infrastructure and data scarcity constrains the assessment of population level exposure and vulnerability. This study employed portable aerosol sensors (Aerocet 831-Met One Instrument Inc., Grant Pass, Oregon, USA), to measure real-time personal exposure to PM1, PM2.5, PM4, and PM10 across indoor, outdoor, and mixed microenvironments in the Kathmandu valley.
The study area was sampled into urban zones with relatively higher PM concentrations and sub-urban zones with lower PM concentrations using satellite-derived PM2.5 data, enabling stratified analysis of personal exposure across spatially varying pollution levels. Households were selected using a snowball sampling method from both exposure zones, to include diverse socio-economic, occupational, and educational backgrounds, encompassing both home and workplace microenvironments. Two participants, usually one female and one male, were recruited from each selected household to understand the difference in exposure patterns based on gender. The participants carried a backpack with sensors for a continuous 72-hour period to monitor personal exposure. The data was collected between January and April 2025, capturing the winter season, which is characterised by elevated air pollution levels in the study area. 
33 households participated in the study, comprising a total of 66 participants. Aerosol sensor measurements were integrated with participant-reported daily activity logs to characterise personal exposure patterns. Furthermore, combining sensor data with socio-demographic characteristics and microenvironmental information, the study aims to identify populations most vulnerable to air pollution exposure. Preliminary findings suggest variability in exposure across socio-economic groups, microenvironments, and exposure zones. Comprehensive analysis, including data normalisation, will ensure comparability across exposure zones, socio-economic characteristics, and microenvironments, thereby clarifying patterns of vulnerability. 
The study approach demonstrates the application of portable sensors to understand exposure in communities with a limited regulatory monitoring network. The results will inform actionable strategies for targeted public health interventions. 

How to cite: Maka Shrestha, R., Pope, F., Day, R., Sugden, F., Adhikary, B., and Bousiotis, D.: Assessing Air Pollution Vulnerability in the Kathmandu Valley: Insights from Personal Particulate Matter Exposure Monitoring with Portable Sensors, EGU General Assembly 2026, Vienna, Austria, 3–8 May 2026, EGU26-13161, https://doi.org/10.5194/egusphere-egu26-13161, 2026.

EGU26-13945 | ECS | Posters on site | AS5.11

A kit of low-cost sensors for measurements of dust-PM in arid urban environments 

Noa Cohen, Itai Kloog, Samuel Naroditski, Natan Yousufov, Michael Dorman, and Itzhak Katra

Dust storms (DSs) are a common phenomenon in many areas worldwide and a natural source for particulate matter (PM) in the atmosphere. Yet the knowledge about the impacts of DSs on the spatio-temporal distributions of PM in urban environments is limited. Air pollutants are regularly monitored by environmental stations in very few locations within large cities. This limits our ability to assess the exposure to PM in space and time. A kit of low-cost sensors (LCS) was developed in our lab (BGSense) to measure air-quality and meteorological data in outdoor and indoor environments, with high spatial and temporal resolutions. The BGSense is designed to be used in stationary or mobile modes of measurement networks in the city. Data from the BGSense sensors are being compared to the reference instruments of the environmental station, located in an arid urban environment. The sensors are tested under various meteorological conditions, including DSs (1-hour average PM10 concentrations < 100 µg m-3), in which hourly concentrations can reach ~2000 µg m-3. The calibration process shows strong correlations (R2=0.9) between the reference instruments and the BGSense for both air temperature and relative humidity. The PM data of BGSense vs. TEOM are well correlated for PM10 in DS (R2=0.8) and in non-DS (R2=0.7) time periods. A similar trend is obtained also for PM2.5. Preliminary measurements, done simultaneously with BGSense kits in several locations around the university campus, demonstrate variations in PM10 concentrations in space and time. The BGSense has the potential to provide high-resolution data to explore the dust-PM distribution and health exposure risk in urban environments.

How to cite: Cohen, N., Kloog, I., Naroditski, S., Yousufov, N., Dorman, M., and Katra, I.: A kit of low-cost sensors for measurements of dust-PM in arid urban environments, EGU General Assembly 2026, Vienna, Austria, 3–8 May 2026, EGU26-13945, https://doi.org/10.5194/egusphere-egu26-13945, 2026.

EGU26-14688 | Orals | AS5.11

Assessing the effect of traffic on air quality and public health in Kampala, Uganda using low-cost approaches 

Francis Pope, Dimitrios Bousiotis, Ajit Singh, Deo Okure, Gabriel Okello, Dylan Sanghera, Suzanne Bartington, James Hall, Deo Okedi, Richard Sserunjogi, and Engineer Bainomugisha

Traffic is a dominant source of urban air pollution in many low- and middle-income countries, where ageing vehicle fleets, high traffic volumes, and the resuspension of dust from paved and unpaved roads combine to degrade air quality and threaten public health. Yet the relative contributions of exhaust and non-exhaust traffic-related emissions to the total air pollution remain poorly quantified.

In partnership with the Global Alliance on Health and Pollution (GAHP), we deployed a network of low-cost air quality sensors across Kampala, Uganda, measuring particulate matter mass and size resolved number concentrations, NOx, and total volatile organic compounds (TVOCs), to complement the existing AirQo monitoring network (Sserunjogi et al., 2022). The objective was to characterise spatial variability in air pollution across the city centre and suburban areas and to quantify the contribution of transport-related sources.

Low-Cost Source Apportionment (LoCoSA) methods (Bousiotis et al., 2025) were applied to the sensor data to identify the dominant contributors to PM2.5 at multiple sites. Depending on proximity to major roads, direct traffic emissions accounted for 18–35% of total PM2.5. Resuspended dust, strongly influenced by vehicle activity, was the largest single source, contributing more than 50% at all locations. These results indicate that a substantial fraction of PM2.5 in Kampala is either directly or indirectly linked to traffic, amplifying the overall impact of transport on urban air quality.

The source-apportionment results are being integrated into a simplified version of the University of Birmingham’s air-quality life-course assessment tool (AQ-LAT; Hall et al., 2024) to quantify source-specific health impacts and attributable mortality. This low-cost, scalable framework enables cities in resource-limited settings to estimate the public-health benefits of targeted emission-control strategies, supporting evidence-based and cost-effective air-quality management.

This presentation demonstrates how the combination of low-cost sensing, low-cost source apportionment, and health-impact assessment can be used to quantify the contribution of traffic to air pollution and associated health burdens. The approach is scalable and transferable to cities worldwide.


References

Sserunjogi et al., (2022). Seeing the air in detail: Hyperlocal air quality dataset collected from spatially distributed AirQo network. Data in brief44, p.108512. https://doi.org/10.1016/j.dib.2022.108512

Bousiotis et al., (2025). Low-Cost Source Apportionment (LoCoSA) of air pollution-literature review of the state of the art. Science of The Total Environment998, p.180257. https://doi.org/10.1016/j.scitotenv.2025.180257

Hall et al., (2024). Regional impact assessment of air quality improvement: The air quality lifecourse assessment tool (AQ-LAT) for the West Midlands combined authority (WMCA) area. Environmental Pollution. https://doi.org/10.1016/j.envpol.2024.123871

How to cite: Pope, F., Bousiotis, D., Singh, A., Okure, D., Okello, G., Sanghera, D., Bartington, S., Hall, J., Okedi, D., Sserunjogi, R., and Bainomugisha, E.: Assessing the effect of traffic on air quality and public health in Kampala, Uganda using low-cost approaches, EGU General Assembly 2026, Vienna, Austria, 3–8 May 2026, EGU26-14688, https://doi.org/10.5194/egusphere-egu26-14688, 2026.

EGU26-14897 | ECS | Posters on site | AS5.11

Combining Black Carbon and PM monitoring to identify local sources of pollution in Washington, DC 

Anya Dutta, Dante Arminio, Claudia Rosa-Rivera, Shizuka Hsieh, and Valentina Aquila

Low-cost air quality monitors are a crucial tool for communities to document exposure to pollutants. Their cost and ease of installation and maintenance allow residents to set up networks of monitors to identify air pollutant levels and sources within neighborhoods. We show results from a network of PurpleAir air quality monitors deployed in the Washington, DC neighborhoods of Buzzard Point, Brentwood, and Ivy City over the course of 3 years. The data collection was initiated by residents of these overburdened communities surrounded by a major thoroughfare, industrially-zoned areas, bus and heavy-duty vehicle parking, diesel truck traffic and railroad tracks.

Several PurpleAir monitors were deployed at volunteer residents across the neighborhoods to measure atmospheric concentrations of fine particulate matter (PM2.5). Additionally, we co-located two black carbon (BC) monitors with PurpleAir monitors in Brentwood and Ivy City. Using this dataset, we document the temporal and spatial variability of PM2.5 concentrations within the neighborhoods and compare local to city-wide concentrations of air pollutants from regulatory monitors and publicly available PurpleAir monitors. Through the relative variations of PM2.5 and BC and their correlation to the local meteorology, we can separate regional sources of air pollution from local ones (e.g. major roadways in Brentwood and construction sites in Buzzard Point).

How to cite: Dutta, A., Arminio, D., Rosa-Rivera, C., Hsieh, S., and Aquila, V.: Combining Black Carbon and PM monitoring to identify local sources of pollution in Washington, DC, EGU General Assembly 2026, Vienna, Austria, 3–8 May 2026, EGU26-14897, https://doi.org/10.5194/egusphere-egu26-14897, 2026.

EGU26-15217 | ECS | Posters on site | AS5.11

Integrating Low-Cost Sensors with Multiscale Models to Quantitatively Identify Ozone Sources and Transport Patterns over the Tibetan Plateau 

Wenlin Chen, Xiaoliang Qin, Shikang Tao, Yanyu Wang, Ying Wang, Zibing Yuan, Suona Zhuoga, Huifang Zhang, Qingyan Fu, and Zhi Ning

Ozone (O₃) is a pivotal trace gas influencing global public health, ecosystem stability, and radiative balance. However, the scarcity of long-term, high-resolution air quality observations across the Tibetan Plateau (TP) hinders the understanding of O₃ dynamics in this climatically and ecologically sensitive region. In this study, we integrated a high-density, low-cost sensor network (LCSN) along key inflow corridors in the TP with EAC4 reanalysis data for three-dimensional spatiotemporal analysis. Iterative discrete wavelet transform (IDWT) and Lagrangian transport diagnostic methods were innovatively used to quantify the dominant role of meteorologically driven regional transport and photochemical generation from local anthropogenic sources in driving surface O₃ extremes. Results show that the fusion of LCSN and reanalysis data provided a reliable, dynamic 3-D dataset at high temporal and spatial resolution for exploring regional O₃ production and transport. Key quantitative findings indicate that extreme surface O₃ pollution during summertime was driven by a coupled “stratosphere–monsoon” mechanism: stratospheric intrusion (SI) (contributing ~50.2% of the pollution signal) overlapped with monsoon-driven long-range transport of polluted air masses from upwind South Asia (~28.7%), while local photochemical generation played a lesser role (~21.1%). Dry conditions and enhanced solar radiation acted as critical amplifiers of O₃ pollution over the plateau. These findings provide the first observationally constrained, quantitative fine-scale source attribution of summertime surface O₃ extremes in the TP, demonstrating the critical role of LCSNs in supplementing traditional monitoring. The study provides a transferable framework for applying affordable LCSNs in high‑altitude or resource‑limited environments, supporting both the formulation of targeted mitigation strategies and collaborative international air‑quality management.

How to cite: Chen, W., Qin, X., Tao, S., Wang, Y., Wang, Y., Yuan, Z., Zhuoga, S., Zhang, H., Fu, Q., and Ning, Z.: Integrating Low-Cost Sensors with Multiscale Models to Quantitatively Identify Ozone Sources and Transport Patterns over the Tibetan Plateau, EGU General Assembly 2026, Vienna, Austria, 3–8 May 2026, EGU26-15217, https://doi.org/10.5194/egusphere-egu26-15217, 2026.

EGU26-15685 | ECS | Orals | AS5.11

Linking Occupant Movement to Indoor Air Quality Dynamics: Insights from Sensor-Based Monitoring 

Pak Lun Fung, Andrew Rebeiro-Hargrave, and Samu Varjonen

Indoor air quality is strongly influenced by both ventilation dynamics and occupant activity, yet the relationship between these factors remains insufficiently characterized. In this study, we deployed a network of low-cost MegaSense sensors across a university campus to continuously monitor several key environmental parameters, including gaseous compounds (CO, NO2 and O3), particulate matters (PM2.5 and PM10), total volatile organic compounds (TVOCs), and noise levels. People counters were also installed side-by-side for an academic year. Initial results revealed pollutants were accumulated overnight due to reduced ventilation, and rapidly diluted in the early morning once ventilation resumed. We also found that whilst PM and gaseous pollutants were strongly linked with ventilation cycles, TVOC concentrations and noise levels exhibited pronounced diurnal patterns closely aligned with occupant movement. The correlation between TVOC concentrations and with people flow (r ≈ 0.7) is strong, likely attributed to emissions from breath, skin, and personal care products, as well as redistribution of localized VOCs through airflow disturbances. Noise levels showed an even stronger correlation (r ≈ 0.8), which indicated human presence through speech, footsteps, and mechanical interactions. O3 concentrations, in contrast, displayed no discernible diurnal variation.

These findings highlight the potential of integrating occupant movement and noise monitoring as effective proxies for estimating TVOC dynamics in indoor environments. More broadly, the study demonstrates opportunities of using low-cost sensor networks in capturing the complex relationships between human activity and indoor air quality, which is able to offer valuable insights for sustainable building management and exposure assessment for human's health. As future work, such sensor applications can be scaled to diverse indoor settings (e.g. occupational, residential, etc) to further explore these relationships.

How to cite: Fung, P. L., Rebeiro-Hargrave, A., and Varjonen, S.: Linking Occupant Movement to Indoor Air Quality Dynamics: Insights from Sensor-Based Monitoring, EGU General Assembly 2026, Vienna, Austria, 3–8 May 2026, EGU26-15685, https://doi.org/10.5194/egusphere-egu26-15685, 2026.

EGU26-17540 | ECS | Orals | AS5.11

Impact of multi-hop rendezvous calibration parameters on the accuracy of a network of low-cost PM sensors 

Jonas Pellegrino, Florentin Bulot, Hassen Aziza, Mathieu Guerin, and Pascal Taranto

Low-cost particulate matter (PM) sensors can complement sparse regulatory stations and capture fine-scale urban variability, but their raw readings are affected by environmental sensitivity, drift, and inter-sensor variability. This work examines how reference instrument–sensor calibration and multi-hop rendezvous calibration jointly affect a network of 16 co-located optical PM sensors (eight Plantower PMS5003 and eight Sensirion SPS30) installed within 1 m of a Palas Fidas 200S reference analyser. Starting from experimental field co-location time series, we replay the measured sensor and reference data inside a controlled simulation framework to compare multiple calibration strategies and to identify encounter parameters that optimize the accuracy of a low-cost PM sensor network; the same 16 sensors are then virtually distributed over conceptual areas of 5, 10, and 15 km² to emulate different deployment densities. Sensor–sensor encounters and passages near the reference station are modelled as Poisson processes with a 2-minute time step; per-step interaction probabilities are derived from mean inter-event times and scaled by an effective density term so that larger areas (lower density) yield fewer interactions. Multi-hop rendezvous calibration is controlled by a multi-hop depth H (maximum number of successive updates) and a cumulative calibration influence Γ (the accumulated effect of multi-hop rendezvous calibration corrections applied to a sensor). Five calibration scenarios are compared: raw (no correction), linear regression, linear regression with robust Huber weighting, quadratic regression, and quadratic regression with Huber weighting. Reference instrument–sensor calibration uses a sliding buffer of recent sensor–reference instrument pairs with outlier filtering and time-weighted fitting, while multi-hop rendezvous calibration encounters provide additional limited corrections through a lightweight Kalman-filter update of calibration coefficients. This update provides a principled way to incorporate uncertain peer information while keeping corrections stable and limited through the filter’s weighting of prediction versus noisy observations. Performance is evaluated against the reference instrument using calibrated root-mean-square error (RMSE) for particulate matter of different sizes: PM₁ (≤1 µm), PM₂.₅ (≤2.5 µm), and PM₁₀ (≤10 µm). Compared to uncalibrated measurements, the best-performing configurations reduce the RMSE from 2 to 1.1 µg·m⁻³ for PM₁ (−45%) and from 2.7 to 1.5 µg·m⁻³ for PM₂.₅ (−45%) with robust quadratic calibration, while PM₁₀ is best handled by a quadratic (second-order) model, improving from 5.4 to 3.3 µg·m⁻³ (−39%). Across all scenarios, robust quadratic calibration provides the strongest and most consistent gains for fine particles, whereas the non-robust quadratic model is the most effective choice for coarse particles; moderate multi-hop depth H and cumulative calibration influence Γ further improve RMSE, while high H and Gamma can propagate local biases and increase variability.

How to cite: Pellegrino, J., Bulot, F., Aziza, H., Guerin, M., and Taranto, P.: Impact of multi-hop rendezvous calibration parameters on the accuracy of a network of low-cost PM sensors, EGU General Assembly 2026, Vienna, Austria, 3–8 May 2026, EGU26-17540, https://doi.org/10.5194/egusphere-egu26-17540, 2026.

EGU26-18636 | ECS | Posters on site | AS5.11

Indoor Aerosol Characterization on a Shoestring – Recent Insights from the EDIAQI Project 

Jan-David Förster, Sebastian Düsing, Andrea Cuesta-Mosquera, Ulf Winkler, Goran Gajski, Marko Gerić, Jens Voigtländer, and Mira L. Pöhlker

Poor indoor air quality (IAQ) poses significant health risks to all, as people spend up to 90% of their time indoors, particularly affecting vulnerable groups such as children. Within the EDIAQI (Evidence Driven Air Quality Improvement) project, exposure to indoor air pollution in households with asthmatic children is being investigated through non-invasive, low-cost sensing approaches. To meet these requirements, TROPOS developed the AQBIE (Air Quality Beacon and Immission Evaluator), a compact, robust, and silent monitoring device designed to unobtrusively integrate into children’s bedrooms.

In contrast to commercial air quality monitors, AQBIE integrates three distinct particulate matter (PM) sensors, allowing for improved source classification and size differentiation. With a 10-second time resolution, the system provides detailed insights into dynamic indoor pollution events. Active user interaction supports event labeling, adding valuable context to the sensor data.

During a three-month field campaign in the city of Zagreb (Croatia), 15 AQBIE units operated continuously across households, covering the transition from late summer to the onset of the heating season. Real-time data transmission via a robust and redundant MQTT-based infrastructure enabled permanent monitoring and remote control without on-site intervention, proving to be highly reliable with data coverage vastly exceeding 99%.

AQBIE shows how open-source IoT technologies can serve scientific research while engaging stakeholders and building IAQ awareness in a playful, accessible way. Here we present the device design, data acquisition and data transmission architecture, and preliminary field campaign results. This positions AQBIE as a flexible, low-cost platform for scalable IAQ networks. Ultimately, the collected data will support lung deposition modeling and contribute to the development of health-relevant exposure metrics.

This work was supported by the affiliated institutions and the Horizon Europe project EDIAQI, grant ID: 101057497

How to cite: Förster, J.-D., Düsing, S., Cuesta-Mosquera, A., Winkler, U., Gajski, G., Gerić, M., Voigtländer, J., and Pöhlker, M. L.: Indoor Aerosol Characterization on a Shoestring – Recent Insights from the EDIAQI Project, EGU General Assembly 2026, Vienna, Austria, 3–8 May 2026, EGU26-18636, https://doi.org/10.5194/egusphere-egu26-18636, 2026.

Low-cost aerosol sensors give the opportunity to build air quality monitoring network, allowing for increased spatial resolution of particulate matter (PM) measurements [1]. This type of network has already been used in urban environments to capture variation of PM at the city scale [2]. Another environment where PM can change quickly with space is alpine valleys. Indeed, the vertical stratification of air caused by nighttime ground cooling induces important PM concentration variation along a slope. While it is well known that aerosol concentration is greater at the valley floor, the aim of this study is to describe how PM concentration evolves with altitude at the ground and what meteorological phenomenon can change the vertical distribution of PM. Indeed, complex topography influences vertical transport of aerosols through upward and downward motions as well as through local to regional sources of PM.

In the development of a monitoring station for mountainous regions, it is necessary to incorporate specific constraints, such as challenging access to measurement sites, a lack of phone network, and limited access to power. Optical particle counters are low-cost PM sensors that are both small and energy-efficient, enabling the development of portable and autonomous stations. These are key features for building a monitoring network in an alpine valley. We designed monitoring stations based on these constraints. The stations have several sensors that measure the temperature, humidity, and PM10, PM2.5, and PM1 levels. Every fifteen minutes, a microcontroller gathers data and stores them on an SD card. The energy is provided by a battery recharged by a  solar panel recessed at the top of the 3D-printed framework. The overall size of the stations is a cube with a 30 cm side length.

These laboratory-made stations have been used to study PM concentration in the Arve River valley, located in the northern French Alps and encompassing cities like Sallanches, Passy, and Chamonix. The network is composed of 12 monitoring stations and 6 monitored sites positioned on the slopes around the Passy basin. One monitoring site is located on the valley floor, on an air quality agency monitoring station containing a TEOM-FDMS. The discussion will focus on the comparison of low-cost stations with the reference measurements, the benefits of using a low-cost monitoring network to study PM concentrations in mountainous terrain, and the limitations inherent to low-cost sensors and autonomous stations.

[1] Bagkis, E., Hassani, A., Schneider, P., DeSouza, P., Shetty, S., Kassandros, T., Salamalikis, V., Castell, N., Karatzas, K., Ahlawat, A., Khan, J. Evolving trends in application of low-cost air quality sensor networks: challenges and future directions. npj Clim Atmos Sci 8, 335 (2025). https://doi.org/10.1038/s41612-025-01216-4

[2] Feinberg, S. N., Williams, R., Hagler, G., Low, J., Smith, L., Brown, R., Garver, D., Davis, M., Morton, M., Schaefer, J. & Campbell, J. Examining spatiotemporal variability of urban particulate matter and application of high-time resolution data from a network of low-cost air pollution sensors. Atmospheric Environment 213, 579–584 (2019). https://doi.org/10.1016/j.atmosenv.2019.06.026


How to cite: Couëtoux, P., Fanget, P., Piot, C., and Staquet, C.: Building a low-cost monitoring network to track vertical transport of particulate matter along valley slope: the benefits of low-tech in mountainous environment, EGU General Assembly 2026, Vienna, Austria, 3–8 May 2026, EGU26-20134, https://doi.org/10.5194/egusphere-egu26-20134, 2026.

EGU26-22144 | ECS | Posters on site | AS5.11

Air Quality Monitoring Network with low-cost sensors in Recife - Brazil. 

Carlos Eduardo Menezes da Silva and Anselmo César Vasconcelos Bezerra

Air pollution is one of the main environmental risks to human health, especially in large urban centers, and is associated with cardiovascular and respiratory diseases, as well as other adverse outcomes. Despite its relevance, systematic air quality monitoring is still incipient in most Brazilian cities, particularly in the Northeast of the country. In this context, the present study aims to analyze approximately one year of monitoring of fine particulate matter (PM₂,₅) and inhalable particulate matter (PM₁₀) in the city of Recife, Brazil, using low-cost sensors, seeking to identify temporal and spatial patterns and potential risks to public health. Nine monitoring stations were installed in areas with distinct socio-environmental characteristics, considering factors such as urban density, vegetation cover, vehicle flow, and population income. The measurements, carried out between November 2023 and September 2025, were obtained using IQAir AirVisual Outdoor model sensors, with data available in near real-time. The analyses included descriptive statistics, assessment of exceedances of the limits recommended by the World Health Organization (WHO), analysis of variance, correlation with meteorological variables, and spatial clustering. The results indicate a daily average PM₂₅ value of 6 µg/m³, with significant variations between stations. On 92 days of the analyzed period (13.16%), at least one station recorded concentrations exceeding the WHO daily limit (15 µg/m³), evidencing recurring episodes of air pollution. Well-defined seasonal patterns were highlighted, with higher concentrations in the months of August and September, in addition to extreme peaks observed recurrently at the end of June, associated with local cultural events, such as the June festivities. Spatial analysis revealed intra-urban inequalities in exposure to particulate matter, with one station showing systematically higher concentrations, possibly related to local emission sources and unfavorable socio-environmental conditions. The findings demonstrate the feasibility and relevance of using low-cost sensors to expand air quality monitoring in urban contexts with data scarcity. Furthermore, the results provide important input for the formulation of intersectoral public policies in the areas of health, urban planning, and the environment, contributing to the reduction of socio-environmental inequalities and risks to public health.

How to cite: Menezes da Silva, C. E. and Vasconcelos Bezerra, A. C.: Air Quality Monitoring Network with low-cost sensors in Recife - Brazil., EGU General Assembly 2026, Vienna, Austria, 3–8 May 2026, EGU26-22144, https://doi.org/10.5194/egusphere-egu26-22144, 2026.

EGU26-1123 | ECS | Posters on site | GI4.2

Deep Learning-Based Hydrometeor Classification from E-Profile Ceilometers Using Cloudnet Reference Data 

Ana del Águila, Anne-Claire Billault-Roux, Eric Sauvageat, Adrián Canella-Ortiz, Laurel Molina-Párraga, Lucas Alados-Arboledas, and Alexander Haefele

Ground-based lidar networks have expanded rapidly in recent years, providing continuous, high-resolution profiles of aerosols, precipitation and clouds for both operational meteorology and climate research. Among them, the EUMETNET E-Profile network now operates more than 400 single-wavelength ceilometers, enabling unprecedented spatial and temporal coverage of backscatter measurements. However, unlike synergistic radar-lidar systems such as Cloudnet, ceilometers alone do not provide operational target classification of hydrometeors or aerosol/clear-sky discrimination.

In this study, we explore the capability of artificial intelligence methods to infer Cloudnet-level target classifications directly from ceilometer backscatter profiles. The approach treats standardized 24-h time-height backscatter as image-like inputs and applies convolutional encoder-decoder architectures for semantic segmentation of atmospheric structures. Training and validation were performed using data from multiple Cloudnet reference stations at different latitudes under diverse meteorological conditions, enabling the model to learn station-agnostic spatio-temporal patterns associated with hydrometeors and aerosol layers.

Initial results demonstrate that key Cloudnet hydrometeor categories and clear-sky/aerosol regions can be recovered from ceilometer-only input, even in the absence of synergistic radar information. These findings indicate that single-wavelength backscatter can be used as input in computer-vision models, in order to extract physically meaningful patterns from the temporal evolution of the signal.

This work establishes the basis for a future near-real-time classification framework scalable to the E-Profile network. The methodology also opens new opportunities for cross-validation with spaceborne lidar and radar products, particularly from the EarthCARE mission, and for generating long-term occurrence statistics that may inform studies on cloud processes, aerosol-cloud interactions and model performance.

Acknowledgements:

This research is part of the Spanish national project PID2023-151817OA-I00, titled DeepAtmo, funded by MICIU/AEI/10.13039/501100011033 and Horizon Europe program under the Marie Sklodowska-Curie Staff Exchange Actions with the project GRASP-SYNERGY (grant agreement No. 101131631). This work is also part of the 2024 Leonardo Grant for Researchers and Cultural Creators from the BBVA Foundation. Ana del Águila is part of Juan de la Cierva programme through grant JDC2022-048231-I funded by MICIU/AEI/10.13039/501100011033 and by European Union “NextGenerationEU”/PRTR.

How to cite: del Águila, A., Billault-Roux, A.-C., Sauvageat, E., Canella-Ortiz, A., Molina-Párraga, L., Alados-Arboledas, L., and Haefele, A.: Deep Learning-Based Hydrometeor Classification from E-Profile Ceilometers Using Cloudnet Reference Data, EGU General Assembly 2026, Vienna, Austria, 3–8 May 2026, EGU26-1123, https://doi.org/10.5194/egusphere-egu26-1123, 2026.

EGU26-1153 | ECS | Posters on site | GI4.2

Atmospheric classification using lidar data and deep learning-based image segmentation 

Adrián Canella-Ortiz, Siham Tabik, Sol Fernández-Carvelo, Onel Rodríguez-Navarro, Lucas Alados-Arboledas, and Ana del Águila

Reliable identification of aerosols and clouds in multiwavelength lidar observations remains essential for atmospheric monitoring and climate research. However, conventional processing pipelines rely heavily on expert-driven inversions and threshold-based algorithms. In this work, we present a deep-learning (DL) image segmentation framework designed to operate directly on image-like representations of the range-corrected signal (RCS) and applicable across distinct lidar platforms.

The models were trained on DL4Lidar, a new expert-annotated dataset derived from the ALHAMBRA multi-spectral Raman lidar (Granada, Spain). Using Mask R-CNN implemented using Detectron2 framework, we systematically explored wavelength selection, visualization scale bounds, and architectural variants to maximize the discrimination of atmospheric structures. The resulting class-specific models capture the characteristic morphology and spatiotemporal variability of aerosols and clouds without relying on inversion-based preprocessing, demonstrating the suitability of computer-vision techniques for processing raw lidar observations.

To assess robustness beyond the training instrument, the trained models were directly applied, without retraining or domain adaptation, to measurements from MULHACEN, an independent Raman lidar located in the same facilities as ALHAMBRA but with different hardware characteristics and signal levels. Despite these instrumental differences, the models exhibit stable behavior, correctly identifying cloud and aerosol structures across a wide range of atmospheric situations. This cross-instrument evaluation highlights the capacity of the proposed method to generalize under realistic domain shifts, suggesting that morphological characteristics learned from RCS imagery are transferable across similar ground-based systems.

Experiments and sensitivity analysis of the models will be evaluated for different variables such as attenuated backscatter vs. RCS used as input images. Moreover, the best DL model resulting from the sensitivity analysis will be tested on other lidar instruments within the EARLINET/ACTRIS network and spaceborne observations such as ATLID onboard the EarthCARE mission.

Overall, this work introduces a unified DL-based pipeline for atmospheric structure segmentation from multi-wavelength lidar measurements, demonstrating its potential for operational use and large-scale automated analysis for atmospheric classification across heterogeneous lidar platforms.

Acknowledgements

This research is part of the Spanish national project PID2023-151817OA-I00, titled DeepAtmo, funded by MICIU/AEI/10.13039/501100011033.

How to cite: Canella-Ortiz, A., Tabik, S., Fernández-Carvelo, S., Rodríguez-Navarro, O., Alados-Arboledas, L., and del Águila, A.: Atmospheric classification using lidar data and deep learning-based image segmentation, EGU General Assembly 2026, Vienna, Austria, 3–8 May 2026, EGU26-1153, https://doi.org/10.5194/egusphere-egu26-1153, 2026.

EGU26-2474 | ECS | Posters on site | GI4.2

Machine Learning Reveals Hidden Bias in ERA5 Cloud Heights Over Earth's Third Pole 

Wei Zhao, Yinan Wang, and Yubing Pan

Accurate cloud base height (CBH) over the Tibetan Plateau—Earth's Third Pole—is essential for constraining Asian monsoon dynamics, glacial melt projections, and water security, affecting 1.9 billion people downstream. However, ERA5 reanalysis systematically underestimates CBH by up to 5.20 km in southern regions, propagating errors into climate models and hydrological forecasts. Here, we present a two-step machine learning framework that progressively eliminates this hidden bias. Step 1 refines the ERA5 retrieval algorithm using three years of ground-based lidar observations (October 2021–December 2024), reducing the site-level mean bias error from 1.8 km to 0.1 km and improving the regional correlation with CALIPSO from 0.25 to 0.40. Step 2 applies an Optuna-optimized XGBoost model trained on high-confidence CALIPSO observations (N=106,718), fusing the refined ERA5 data with vertical atmospheric profiles and surface attributes. The final product achieved a test-set RMSE of 1.87 km (R²=0.71, MBE=−0.02 km), with seasonal correlations reaching 0.72–0.86 and southern plateau bias reduced from −5.20 km to −0.11 km, a 97.9% improvement. This scalable approach enables reliable, long-term CBH reconstruction, which is critical for advancing climate model parameterizations and water resource assessments across High Mountain Asia.

How to cite: Zhao, W., Wang, Y., and Pan, Y.: Machine Learning Reveals Hidden Bias in ERA5 Cloud Heights Over Earth's Third Pole, EGU General Assembly 2026, Vienna, Austria, 3–8 May 2026, EGU26-2474, https://doi.org/10.5194/egusphere-egu26-2474, 2026.

Doppler wind Lidars (DWLs) have been widely used to detect wind vector variations, based on ground monitoring of atmospheric boundary layer and wind shear. This study evaluates the performance between three DWLs and in situ balloon radiosonde. Lidars data comparison focuses on low altitudes (height < 2 km) from July to September 2021 from three producers: MSD (Minshida), CUIT (homemade), and WP (windprofile) Lidars. Within the research height range, comparisons show the root mean square errors (RMSE) for wind speed were 1.11 m s-1, 4.45 m s-1, and 5.15 m s-1, while wind direction RMSE were shown at 49.83°, 82.89°, and 84.87°, respectively. The measurement accuracy decreases with the altitude increase (up to 2km). The Lidar performance requires a certain amount of aerosol backscattering, when PM2.5 ranges within 35-50 µg m-³, MSD Lidar exhibited the highest wind speed correlation (R² = 0.82) with radiosonde, and the wind direction accuracy observed with the three Lidars is enhanced with the increase of aerosol concentration, indicating that particle loading is the critical factor affecting the wind profile. Lidar performance varied significantly with planetary boundary layer heights (PBLH), particularly, the Lidar performance is relatively optimal when the PBLH within 500-750 m, with the Pearson correlation coefficients (PCCs) of wind speed are 0.97, 0.92, and 0.72, while the wind direction is shown at 0.98, 0.75, and 0.70, respectively. The vertical relationship between cloud base height (CBH) and PBLH had also varied influences on the Lidar measurements. Machine learning was used to remove anomalies and complement missing values, the random forest (RF) demonstrated superior performance, with the Area Under the Curve (AUC) of 0.93(CUIT) and 0.90(WP) in the Receiver Operating Characteristic (ROC) curves. RF-based correction of CUIT data enhanced the R² from 0.42 to 0.65. The R² between the RF-based CUIT and Aeolus satellite data was 0.83, indicating that the method effectively improved data, even in circumstances of anomalies. We proposed a new correction algorithm combined with the isolation forest (IF) and RF to handle high-dimensional and incomplete datasets. Our procedure could increase the Lidar measurement quality of wind.

How to cite: Zhang, Y., Hu, H., Luo, J., and Wu, H.: Comparison of the Performance between Three Doppler wind Lidars and a Novel Wind Speed Correction Algorithm, EGU General Assembly 2026, Vienna, Austria, 3–8 May 2026, EGU26-4831, https://doi.org/10.5194/egusphere-egu26-4831, 2026.

EGU26-5579 | Orals | GI4.2

Water Vapor DIAL in Space: Which Performance Should you Expect? 

Martin Wirth and Silke Groß

Water vapor is the key trace gas component of the air and involved in virtually all relevant atmospheric processes. To know the vertical profile with decent resolution is crucial in all cases. For example, there are several regions of the atmosphere where numerical weather prediction models show biases which are not understood. And recent studies have shown that the boundary layer moisture and isolated lofted humidity layers play a key role in the initiation of convection.  So, after aerosol/cloud and wind lidars have been very successfully applied within space missions, the natural next step would be the profiling of water vapor by a Differential Absorption Lidar (DIAL) from a satellite on a low Earth orbit. Thanks to the European spaceborne lidar missions Aeolus/2, EarthCARE, and MERLIN now the major building blocks for such a water vapor DIAL have reached the necessary technological readiness and the last open issue, a high-power laser source at 935 nm, is currently addressed by an ESA project.

A key tool to assess the impact of certain design decisions on the performance is a full end-to-end simulation tool. DLR has developed and kept up to date such a tool over the past years. In our presentation we will show the achievable resolution and precision of a spaceborne H2O-DIAL in dependence of key design parameters like number of wavelengths, laser power, telescope diameter and detector noise for several real-world atmospheric scenes that have been captured with our airborne demonstrator. Special focus will be given to non-standard profile situations where especially passive sounding systems have difficulties due to their limited vertical resolution. This presentation is thought as a starting point for further discussions with potential users of data from a space-borne H2O-DIAL to refine the observational requirements and adjust the lidar-parameters on the system level.

How to cite: Wirth, M. and Groß, S.: Water Vapor DIAL in Space: Which Performance Should you Expect?, EGU General Assembly 2026, Vienna, Austria, 3–8 May 2026, EGU26-5579, https://doi.org/10.5194/egusphere-egu26-5579, 2026.

EGU26-5843 | Posters on site | GI4.2

The space lidar mission LUCE: a multi-disciplinary observatory for Earth Sciences 

Paolo Di Girolamo and the LUCE

LUCE, formerly Cloud and Aerosol Lidar for Global Scale Observations of the Ocean-Land-Atmosphere System (CALIGOLA), is an advanced multi-disciplinary space lidar mission for Earth Sciences, primarily focusing on the observation of the atmosphere and oceans, aimed at advancing global knowledge on the coupled atmosphere-ocean-land system. It is the first spaceborne Raman-elastic-fluorescence lidar, created through an Agenzia Spaziale Italiana (ASI) and National Aeronautics and Space Administration (NASA) partnership. This mission has been conceived with the aim to provide the international scientific community with an unprecedented dataset of geophysical parameters capable to increase scientific knowledge in the areas of atmospheric, aquatic, terrestrial, cryospheric and hydrological sciences. The mission is planned to be launched in the time frame 2035-2037, with an expected lifetime of 3-5 years. This conference contribution aims at providing an overview of the different mission scientific objectives, with a primary focus on atmospheric and ocean sciences, and a preliminary assessment of the expected system performance in a variety of environmental scenarios.

How to cite: Di Girolamo, P. and the LUCE: The space lidar mission LUCE: a multi-disciplinary observatory for Earth Sciences, EGU General Assembly 2026, Vienna, Austria, 3–8 May 2026, EGU26-5843, https://doi.org/10.5194/egusphere-egu26-5843, 2026.

EGU26-6439 | Orals | GI4.2

Planetary Boundary Layer Height and Air Quality during Heatwaves in contrasting climate regions from CALIPSO lidar retrievals. 

Simone Lolli, Andreu Salcedo-Bosch, Francesc Rocadenbosch, Carina Argañaraz, Gabriele Curci, and Yuanjian Yang

The Height of the Planetary Boundary Layer (PBLH) plays a key role in controlling how air pollutants accumulate and disperse during heatwaves, yet its large-scale behaviour across different climate regimes remains poorly understood. In this study, we use a 10-year PBLH dataset derived from CALIPSO CALIOP Level-1 backscatter data, retrieved with a Random Forest model trained on radiosonde-based PBLH observations, to investigate boundary-layer dynamics during heatwaves across several regions of the world. The resulting product provides PBLH estimates at approximately 20 × 20 km resolution and shows good performance in mid-latitude regions under a wide range of aerosol and cloud conditions.

Heatwaves are identified using ERA5 daily maximum temperature anomalies, applying region-specific percentile and persistence criteria over the Mediterranean and central Europe, the United States, eastern China megacities, and selected arid–subtropical areas. For each region, we construct composites of the diurnal evolution of PBLH during heatwave and non-heatwave summers and relate them to co-located surface PM2.5 and ozone observations from air-quality monitoring networks. This approach allows us to quantify regional differences in PBLH anomalies and in the sensitivity of PM2.5 and ozone to PBLH variations during heatwaves. We also examine how different stages of the heatwave life cycle are reflected in PBL evolution and the persistence of residual layers, highlighting implications for compound heatwave–air-pollution risks in a warming climate.

How to cite: Lolli, S., Salcedo-Bosch, A., Rocadenbosch, F., Argañaraz, C., Curci, G., and Yang, Y.: Planetary Boundary Layer Height and Air Quality during Heatwaves in contrasting climate regions from CALIPSO lidar retrievals., EGU General Assembly 2026, Vienna, Austria, 3–8 May 2026, EGU26-6439, https://doi.org/10.5194/egusphere-egu26-6439, 2026.

EGU26-7182 | Orals | GI4.2

Long-term (2010-2024) lidar observations of cirrus clouds at Wuhan (30.5°N, 114.4°E), China 

Yun He, Tingyang Fu, Zhenping Yin, Weijie Zou, Dongzhe Jing, Fan Yi, and Longlong Wang

Cirrus clouds play a crucial role in the Earth’s climate by regulating its radiative balance. Their optical and radiative properties exhibit significant variability, influenced by both spatial and temporal distribution. This study investigates the geometrical and optical properties of cirrus clouds using 15 years (2010–2024) of 532-nm ground-based polarization lidar observations at Wuhan (30.5°N, 114.4°E), a mid-latitude site over central China. A cloud detection algorithm and optical parameter inversion procedure were developed to identify overall 2033 cirrus cases. The geometrical and optical characteristics of these clouds were analyzed in detail. Cirrus clouds have cloud top and base heights of 12.4±2.1 km and 9.7±2.6 km, respectively, with thickness of 2.7±1.6 km and cloud top temperature of -50.2 ± 9.0 °C. Cloud top height reaches its maximum in summer (13.8 km) and minimum in winter (9.6 km). The cloud optical depth is variable, mainly ranging from 0 to 1 with an average of 0.34±0.35, suggesting that cirrus clouds are predominantly optically thin to moderately thick. The lidar ratio is 28.58±12.57 sr, while the volume and particle depolarization ratios are 0.32±0.08 and 0.40±0.11, respectively. These findings generally reflect the typical characteristics of cirrus clouds in the Asian mid-latitude region.

How to cite: He, Y., Fu, T., Yin, Z., Zou, W., Jing, D., Yi, F., and Wang, L.: Long-term (2010-2024) lidar observations of cirrus clouds at Wuhan (30.5°N, 114.4°E), China, EGU General Assembly 2026, Vienna, Austria, 3–8 May 2026, EGU26-7182, https://doi.org/10.5194/egusphere-egu26-7182, 2026.

EGU26-7551 | Orals | GI4.2

MERLIN laser transmitter - Laser performance for critical mission objectives and outlook for future missions 

Jana Ammersbach, Heinrich Faidel, Martin Giesberts, Bastian Gronloh, Tristan Heider, Hans-Dieter Hoffmann, Jörg Luttmann, Melina Reiter, Rolf Versteeg, and Matthias Winzen

The Methane Remote Sensing LiDAR Mission (MERLIN) is a Franco-German cooperation between the French Space Agency CNES and the German Space Agency at DLR.

The Laser Optical Bench for the IPDA LiDAR instrument is currently being built at Fraunhofer Institute for Laser Technology, based in Aachen, Germany. The laser bench is one of the core parts of the payload, for which Airbus Defence and Space GmbH is the Prime Contractor. The laser and laser housing design were developed and optimized in close cooperation between Airbus Defence and Space GmbH and Fraunhofer Institute for Laser Technology.

This presentation will provide an overview of the flight hardware’s assembly, integration and test status, the qualification status of all optical components and the lifetime test results for critical components. Furthermore, we will highlight the inherent stability aspects of the laser: for example, the demonstrated stable and full-performance operation of the oscillator and the amplifier over a wide range of thermal boundary conditions. Currently, the last optical stage of the laser, the pre-assembled and fully aligned optical Parametric Oscillator (OPO) is being integrated on the flight laser bench. The qualification module is already completely optically integrated. In the frame of the presentation, we will be showcasing current optical performance of the laser transmitter for flight and qualification module. Additionally, we will provide an outlook on future LiDAR laser concepts based on the developments within the MERLIN project.

How to cite: Ammersbach, J., Faidel, H., Giesberts, M., Gronloh, B., Heider, T., Hoffmann, H.-D., Luttmann, J., Reiter, M., Versteeg, R., and Winzen, M.: MERLIN laser transmitter - Laser performance for critical mission objectives and outlook for future missions, EGU General Assembly 2026, Vienna, Austria, 3–8 May 2026, EGU26-7551, https://doi.org/10.5194/egusphere-egu26-7551, 2026.

EGU26-8018 | ECS | Orals | GI4.2

Long-term analysis of Raman lidar water vapour profiles over the ACTRIS AGORA Granada station 

Arlett Díaz Zurita, Víctor Manuel Naval Hernández, David N. Whiteman, Onel Rodríguez Navarro, Jorge Andrés Muñiz Rosado, Daniel Pérez Ramírez, Lucas Alados Arboledas, and Francisco Navas Guzmán

Water vapour is a crucial and highly variable greenhouse gas in the Earth's atmosphere that plays a major role in the radiative balance, energy transport and photochemical processes. It can also affect the radiative budget indirectly through cloud formation and by altering the size, shape, and chemical composition of aerosol particles. Moreover, monitoring water vapour remains challenging due to its high temporal and spatial variability. Consequently, systematic and accurate observations of water vapour are essential to improve our understanding of its role at both local and global scales and for enhancing climate projections.

Advances in remote sensing techniques have enabled continuous acquisition of precipitable water vapour (PWV) measurements using sun/star photometry, microwave radiometry and the Global Navigation Satellite System (GNSS). Nevertheless, none of these instruments provides information on the vertical distribution of water vapour, a critical information considering that water vapour concentrations typically vary by up to three orders of magnitude between the surface and the upper troposphere. In this context, Raman lidar has demonstrated its ability to capture the spatial and temporal evolution of water vapour in the troposphere. Accurate retrievals of the water vapour mixing ratio from Raman lidar measurements rely on robust and well-characterised calibration procedures as well as on an accurate estimation of the differential atmospheric transmission term, which accounts for extinction differences between the molecular reference (nitrogen and oxygen) and water vapour wavelengths.

In this study, the lidar calibration constant was determined using a hybrid calibration method, which combines correlative PWV measurements for lidar calibration with Numerical Weather Prediction (NWP) data to reconstruct the water vapour profile within the incomplete overlap region of the lidar system. The differential transmission was estimated using an automated method to account for the aerosol contribution, based on sun photometer Aerosol Optical Depth (AOD) measurements and an exponential decay function with attitude to model aerosol extinction (Díaz-Zurita et al., 2025). Subsequently, a long-term database of water vapour profiles over the period 2009-2022 was generated, providing high vertical and temporal resolution measurements of water vapour over the city of Granada, in Southern Spain. A comprehensive statistical analysis was conducted to characterise the vertical distribution of water vapour over a 14-year period, representing the first long-term vertical characterisation of water vapour in this region. Mean interannual and seasonal water vapour profiles were derived for the entire study period, and trend analyses were performed to assess long-term variations in water vapour content in the lower troposphere. Additionally, lidar-derived PWV values were compared with those obtained from microwave radiometer and GNSS observations.

This research was funded by Grant PID2021-128008OB-I00 funded by MICIU/AEI/ 10.13039/501100011033 by ERDF/EU European Union, and by the Spanish national projects CNS2023-145435, PID2023-151817OA-I00 and Marie Skłodowska-Curie Staff Exchange Actions with the project GRASP-SYNERGY (grant agreement no. 10113163).


Diaz-Zurita et al. (2025).  Remote Sens. 2025, 17(20), 3444; https://doi.org/10.3390/rs17203444

How to cite: Díaz Zurita, A., Naval Hernández, V. M., Whiteman, D. N., Rodríguez Navarro, O., Muñiz Rosado, J. A., Pérez Ramírez, D., Alados Arboledas, L., and Navas Guzmán, F.: Long-term analysis of Raman lidar water vapour profiles over the ACTRIS AGORA Granada station, EGU General Assembly 2026, Vienna, Austria, 3–8 May 2026, EGU26-8018, https://doi.org/10.5194/egusphere-egu26-8018, 2026.

EGU26-8349 | ECS | Orals | GI4.2

Ground Based Demonstration of an Airborne High Spectral Resolution Temperature Profiling Lidar 

Madison Hetlage, Johnathan Hair, Taylor Shingler, David Harper, and Amin Nehrir

There is a strong desire for improved airborne thermodynamic profiling capabilities, particularly within the planetary boundary layer. While active temperature profiling lidars using rotational Raman scattering and differential oxygen absorption (DIAL) exist for ground-based use, these techniques are limited by the inefficiency of Raman scattering and oxygen DIAL’s need for collocated water vapor and aerosol measurements. This work aims to investigate the sensitivities and signal-to-noise of a temperature high spectral resolution lidar (HSRL) measurement approach for airborne tropospheric temperature profiling and add this capability to the NASA LaRC first generation airborne aerosol and profiling instrument, HSRL-1.

The temperature HSRL technique relies on the thermally sensitive Doppler broadening of the Rayleigh scattering signal. In an aerosol HSRL, a spectral notch filter is used to differentiate between molecular and aerosol backscattering. The addition of a second molecular channel (using a second notch filter with a distinct transmission spectrum) enables an observation dependent on the molecular scattering spectral lineshape (i.e. temperature and pressure) and independent of aerosol scattering. The implementation of an additional channel to the HSRL-1 instrument leverages the current HSRL-1 instrument and data acquisition infrastructure, particularly the flight-tested Nd:YVO4 laser, receiver, and detectors, and exploits the strong signal strength of elastic scattering, resulting in a measurement well suited for the moving, airborne platform.

This presentation will cover the temperature HSRL retrieval technique and discuss the theoretical optimization and experimental characterization of the required HSRL-1 system modifications. The reconfigured system has been operated in a ground-based, zenith-pointing configuration to test the new thermal profiling capability. A set of these results will be examined and compared to co-located radiosonde measurements. Additionally, the expected airborne performance, which has been simulated using signal levels from previous HSRL-1 field deployments, will be presented.

How to cite: Hetlage, M., Hair, J., Shingler, T., Harper, D., and Nehrir, A.: Ground Based Demonstration of an Airborne High Spectral Resolution Temperature Profiling Lidar, EGU General Assembly 2026, Vienna, Austria, 3–8 May 2026, EGU26-8349, https://doi.org/10.5194/egusphere-egu26-8349, 2026.

EGU26-8670 | ECS | Posters on site | GI4.2

AecroFormer: Fast, Noise-Robust Aerosol Microphysical Retrieval for Multiwavelength Raman Lidar 

Weijie Zou, Zhenping Yin, Zhichao Bu, Xuan Wang, and Detlef Müller

Aerosol microphysical parameters (e.g., size distributions and complex refractive index) control scattering and absorption and underpin quantitative estimates of aerosol radiative effects and aerosol–cloud interactions. Retrieving them from multiwavelength Raman lidar is inherently ill-posed: measurement noise and systematic uncertainties quickly erode multi-channel constraints under weak signals, and conventional LUT/iterative inversions are too slow (seconds to minutes per profile) for network-scale or high-throughput processing.

We propose AecroFormer, an end-to-end regression model that incorporates multi-head attention to learn cross-wavelength coupling and deliver physically coherent, range-resolved vertical-profile retrievals with improved stability under real-world SNR and noise. For channel combinations such as 3β+2α, AecroFormer achieves an inference speed of 7.4×10⁻⁵ s per range gate on an NVIDIA GeForce RTX 5080, delivering orders-of-magnitude acceleration relative to LUT/iterative schemes that typically operate from minute-level down to sub-second per range gate (e.g., Müller et al., 1999; Wang et al., 2022). Noise robustness tests show that the model maintains practical accuracy as noise increases: even at 20% noise, it remains stable with MAE(mᵣ) ≈ 0.0758 and MRE(rₑ) ≈ 32.9%.

Focusing on the two important application-critical profile products—effective radius (rₑ) and aerosol volume concentration—we assessed real-world applicability through  an observation-based consistency check using operational measurements from the Aksu site (Xinjiang, China) in January 2024, selecting four days for validation. Retrieved aerosol volume concentrations were converted to 0–2 km boundary-layer mean PM₂.₅ using an empirical density assumption and matched against surface air-quality observations (n = 28). The comparison yields a PM₂.₅ bias of 4.69 ± 26.87 µg/m³ and a relative bias of 3.29%, indicating that the method reproduces both the magnitude and variability observed by ground monitoring in a network-operational setting.

Overall, AecroFormer substantially reduces the computational cost while preserving noise-robust retrieval performance, enabling a practical transition from offline, slow microphysical inversions to near-real-time, high-throughput, and deployable processing. It also provides a reusable algorithmic foundation for future extensions under more realistic bimodal forward assumptions and tightly controlled uncertainty constraints.

How to cite: Zou, W., Yin, Z., Bu, Z., Wang, X., and Müller, D.: AecroFormer: Fast, Noise-Robust Aerosol Microphysical Retrieval for Multiwavelength Raman Lidar, EGU General Assembly 2026, Vienna, Austria, 3–8 May 2026, EGU26-8670, https://doi.org/10.5194/egusphere-egu26-8670, 2026.

Accurately understanding the vertical distribution of major global atmospheric gases is a critical issue in climate change research and response. The  Low Earth Orbit-to-Low Earth Orbit (LEO-LEO) infrared laser occultation (LIO) detection technology enables three-dimensional, all-time, and high vertical-resolution simultaneous detection of multiple atmospheric composition (CO2, CH4, H2O, O3, N2O, CO, etc.) and line-of-sight wind speed. This approach is expected to complement existing greenhouse gas column total measurement methods in the future. The LIO system consists of a transmitter and a receiver. It employs eleven carefully selected infrared laser signals within the shortwave infrared (SWIR) spectral region of 2–2.5 µm. Based on the differential absorption lidar (DIAL) principle, the system retrieves vertical profiles of greenhouse gases and further derives line-of-sight wind speed via spectral Doppler frequency shift. During an occultation event, the laser signal emitted by the transmitter is attenuated by the atmosphere before reaching the receiver. The transmitter realizes differential absorption atmospheric spectral detection through multiple laser channels. Each detection element adopts dual-channel detection, and the receiver performs high-sensitivity detection for each spectral channel. To ensure precise laser wavelength control, the LIO system adopts optical frequency comb stabilization technology. Additionally, a spatial heterodyne spectrometer is used to achieve extremely high spectral resolution within a narrow field of view. By scanning the Earth's atmosphere from top to bottom, the system allows for high-precision retrieval of trace gases profiles. Currently, no LEO-LEO occultation mission has been deployed in space. Research has been focused on frequency selection evaluation, inversion algorithm refinement, occultation orbit design, and detection performance simulations. The continued development of infrared laser occultation technology can provide essential vertical atmospheric datasets for future global climate change research.

How to cite: Wang, X., Zhang, Z., and Zong, X.: Advances in Space-borne Infrared Laser Occultation for Atmospheric Composition Profiles Detection, EGU General Assembly 2026, Vienna, Austria, 3–8 May 2026, EGU26-10217, https://doi.org/10.5194/egusphere-egu26-10217, 2026.

A wide range of weather phenomena, including for example valley circulations and convective initiation, are connected to mesoscale wind fluctuations. Their representation in convective-scale numerical weather prediction models, particularly in complex terrain, remains uncertain but may significantly affect forecast quality.
To quantify the potential added value of denser wind observation networks, we assimilate 3 months of data from a network of 12 Doppler wind lidars obtained during the Swabian MOSES campaign around the Black Forest region in southwestern Germany during summer 2023. Vertical profiles of the horizontal wind components up to approximately 4 km altitude retrieved from the wind lidars were assimilated using the regional forecasting system of the German Weather Service based on the Kilometer-Scale Ensemble Data Assimilation (KENDA) system using a Local Ensemble Transform Kalman Filter (LETKF) and the ICOsahedral Non-hydrostatic (ICON) model.Overall, ICON represents the wind fields well and the assimilation reduces short-term forecast errors. As expected, the observation influence is largest within the campaign region but also spreads horizontally and vertically away from it. Differences between observations and model tend to be particularly large during convective conditions. Moreover, assimilating the dense wind information leads to small but systematic differences in wind speed and direction compared to an experiment without Doppler wind lidar assimilation. On average, the zonal wind speed is slightly overestimated in the model, while the meridional wind speed is underestimated, resulting in a rotation of the wind direction. The underlying causes of this bias are currently under investigation.

How to cite: Oertel, A., Thomas, J., Reich, H., Keller, J., and Knippertz, P.: The influence of assimilating Doppler wind lidar observations from the Swabian MOSES 2023 campaign on mesoscale wind variability over southwestern Germany, EGU General Assembly 2026, Vienna, Austria, 3–8 May 2026, EGU26-10835, https://doi.org/10.5194/egusphere-egu26-10835, 2026.

Wildfire activities across Canada have increased significantly in the last several years. Intense wildfires release large amounts of smoke aerosols that can be lifted into the upper troposphere and lower stratosphere, providing a large episodic source of carbonaceous aerosols, composed primarily of organic carbon and black carbon. These smoke particles can persist for weeks to months and be transported over long distances, whereby extending their atmospheric influence far from the source regions. Smoke particles can greatly impact the Earth’s climate directly by scattering and absorbing solar radiation and indirectly by modifying cloud formation and properties. During long-range transport, smoke aerosols undergo chemical and microphysical aging, which may alter their size, composition, optical properties, and ice nucleation ability. In addition, smoke particles in the high altitudes can act as ice-nucleating particles (INP) to trigger cirrus cloud formation via heteorogeneous nucleation, modifying ice crystal number concnetrations, particle size and cloud optical properties. From the end of May 2025, extreme wildfire outbreak in Canada lifted smoke particles up to the lower stratosphere that were transported across the North Atlantic to Europe. In this study, we paramerize the aging transformations of smoke aerosols by comparing their lidar ratios (= extinction-to-backscatter ratio) and particle linear depolarization ratios (PLDR) directly retrieved by ATLID (the ATmospheric LIDar) onboard the EarthCARE satellite along the transport pathway of the smoke plumes. To do so, we make use of the HYSPLIT forward trajectories to track the smoke plume evolving from fire locations. Furthermore, we derive the cirrus cloud PLDR from ATLID as well as ice crystal number concentration (Ni) and effective radius (Re) from the lidar-radar synergy combing co-located ATLID and CPR (the Cloud Profiling Radar). Finally, we are able to compare PLDR, Ni, and Re between disturbed cirrus clouds by smoke aerosols and pristine ones to identify the impact of smoke particles on cirrus clouds. 

How to cite: Li, Q. and Gross, S.: Aerosol aging and cirrus cloud modification from Canadian wildfire smoke transported to Europe in 2025 observed by EarthCARE, EGU General Assembly 2026, Vienna, Austria, 3–8 May 2026, EGU26-11060, https://doi.org/10.5194/egusphere-egu26-11060, 2026.

Aerosols play a key role in air quality, weather, and climate. Ground-based active remote sensing can contribute to the continuous monitoring of aerosol vertical profiles, especially when operating within regional, national and international networks. In fact, networked Automated-Lidar-Ceilometers (ALC) are now widely used to this purpose, monitoring the low and middle troposphere. However, conversion of their raw data into quantitative geophysical information is not straightforward.

In this work, we present a model-supported approach to retrieve vertically-resolved aerosol optical and physical properties (aerosol backscatter and extinction coefficients, surface area, volume and mass concentrations) from elastic lidar systems. It extends previous results and processing capabilities of lidar and/or ALC data developed and employed within the Italian ALC network ALICENET (Dionisi et al., 2018; Bellini et al., 2024). In particular, we present here an upgraded version of the model, which relies on a Monte Carlo framework generating a large ensemble of light-scattering computations at multiple, lidar-relevant wavelengths (355, 532, 910, and 1064 nm) and targeted to reproduce a continental aerosol type mixed to low-to-moderate contributions of desert dust. With respect to previous model configurations (e.g., Dionisi et al., 2018), the new version simulate the coarse, dust particles as spheroids, taking advantage of the open-access spheroid package GRASP (Dubovik et al., 2006). This also allows computation of the aerosol depolarization ratio in addition to the other aerosol optical and physical properties. The model simulations are then used to derive mean functional relationships linking aerosol backscatter and particle depolarization ratio to the other aerosol properties. This upgraded version of the model was indeed developed within ALICENET to assist inversion of new commercially available ALC systems with polarization capability (PLC, as the Vaisala CL61). In this work, we will present: a) the numerical model simulations results, b) their evaluation through independent aerosol data from AERONET sun-photometers and 3) their practical use within the operative ALICENET inversion of PLC data to derive aerosol optical and physical properties. In fact, application of the new functional relationships shows improved agreement of PLC-retrievals with columnar aerosol optical depth and in situ mass measured at ground level in dust-loaded conditions. These results suggest that the proposed methodology could be applied to operational ALC/PLC networks operating in low-to-moderate dust-affected conditions, thus supporting radiative transfer, atmospheric chemistry, and air quality studies.

References:

  • Dionisi, et al., A multiwavelength numerical model in support of quantitative retrievals of aerosol properties from automated lidar ceilometers and test applications for AOT and PM10 estimation, Atmos. Meas. Tech., 11, 6013–6042, https://doi.org/10.5194/amt-11-6013-2018, 2018.
  • Bellini, et al., ALICENET– an Italian network of automated lidar ceilometers for four-dimensional aerosol monitoring: infrastructure, data processing, and applications, Atmos. Meas. Tech., 17, 6119–6144, https://doi.org/10.5194/amt 17-6119-2024, 2024.
  • Dubovik et al., Application of spheroid models to account for aerosol particle nonsphericity in remote sensing of desert dust, J. Geophys. Res., 111, D11208, https://doi.org/10.1029/2005JD006619, 2006.

How to cite: Goi, A., Diémoz, H., Bellini, A., Bracci, A., and Barnaba, F.: Model-assisted retrievals of aerosol properties from Polarization-sensitive Automated Lidar-Ceilometers and test applications to Vaisala CL61 measurements during desert dust transport episodes, EGU General Assembly 2026, Vienna, Austria, 3–8 May 2026, EGU26-11591, https://doi.org/10.5194/egusphere-egu26-11591, 2026.

EGU26-12298 | Posters on site | GI4.2

Studying differences in microphysics of ice clouds in the Arctic depending on airmass origin using lidar-radar synergy 

Silke Gross, Georgios Dekoutsidis, Martin Wirth, and Florian Ewald

The climate in the Arctic is changing rapidly. The near-surface air temperature increased much faster than on global average in recent years, a phenomenon called Arctic Amplification. This Arctic Amplification leads to a weaker and wavier jet stream, potentially allowing a more frequent transport of airmasses into the Arctic which have their origin in the mid-latitude. These mid-latitude airmasses are responsible for an influx of warm and moist air, significantly influencing the energy budget in the Arctic due to their radiative effects. But airmass transport from the mid-latitudes has also an impact on cloudiness in the Arctic as well as on cloud properties, as they strongly depend on the conditions under which the clouds form. The main focus on cloud so far, however, was on lower-level clouds. Arctic high level ice clouds are hard to study. Satellite measurements do often not provide data with sufficient accuracy or resolution, and in-situ measurement have rarely been performed.


In March and April 2022, the HALO-(AC)3 campaign was conducted, using the German High Altitude and LOnge range (HALO) research aircraft equipped with a remote sensing payload. With HALO it was possible to perform high altitude measurements deep inside the Arctic. The measurements provided high accurate and highly resolved information about the atmosphere along the flight path. Key instruments during HALO-(AC)3 have been the combined airborne water vapor differential absorption and high spectral resolution lidar WALES, and the Doppler cloud radar MIRA-35. We use the measurements of the lidar to characterize the environmental conditions in Arctic and mid-latitude airmasses, i.e. the humidity field. Ice cloud microphysical properties are derived from the synergy of lidar and radar using an optimal estimate retrieval. The combination of the characterization of the environmental conditions and the cloud properties allows to study differences in the microphysics of ice clouds in the Arctic depending on the origin of the airmasses they are forming in. We will give an overview of our measurements, the characterization of the environmental conditions, and will show differences in the cloud macro- and microphysical properties of the observed ice clouds.

How to cite: Gross, S., Dekoutsidis, G., Wirth, M., and Ewald, F.: Studying differences in microphysics of ice clouds in the Arctic depending on airmass origin using lidar-radar synergy, EGU General Assembly 2026, Vienna, Austria, 3–8 May 2026, EGU26-12298, https://doi.org/10.5194/egusphere-egu26-12298, 2026.

EGU26-12789 | ECS | Posters on site | GI4.2

CO2 Profiling with Automated Scanning Raman Lidar 

Moritz Schumacher, Diego Lange, Andreas Behrendt, and Volker Wulfmeyer

Carbon dioxide is the most important anthropogenic greenhouse gas. Therefore, measuring its distribution and variability in the atmosphere with high precision, accuracy, and resolution is key to a better understanding of the carbon cycle and radiative forcing. Especially, continuous profiling at the same location over longer periods of time provides insights about local sources and sinks. Since most of these are located on the ground, ground-based lidar systems with their ability of range-resolved measurements are particularly interesting because passive remote sensing satellites (e.g. OCO-2/3) cannot provide range-resolved data close to the surface. To realize carbon dioxide measurements, we integrated an additional channel into our eye-safe, fully automated ground-based Raman lidar ARTHUS (Atmospheric Raman Temperature and HUmidity Sounder) [1]. So far, more than 90 nights of CO2 profiles have been collected at the Land-Atmosphere Feedback Observatory (LAFO) of the University of Hohenheim, Stuttgart, Germany [2]. Profiles of CO2, temperature, and humidity, as well as particle extinction and particle backscatter coefficients, are measured simultaneously with five receiver channels. With averaging of 1 h and 400 m under nocturnal, cloud-free conditions, the uncertainties of the CO2 mixing ratio measurements are only <2.8 ppm up to a distance of 2 km . When averaging over the full night, e.g., 13 hours and 400 m, the uncertainties are <1 and <2 ppm up to distances of ~2.5 and 4.0 km, respectively. Compared to measurements presented at last year’s EGU General Assembly [3], the lidar CO2 signal intensity could be improved by a factor of up to 8.

Since 2025, a newly installed two-mirror scanner enables measurements in any direction. In December 2025, we performed measurements with an elevation angle of 2° close to the surface in order to investigate CO2 sources and sinks. Furthermore, nearby in-situ CO₂ sensors on towers at 2 and 10 m height above ground at distances of 600 and 1000 m to the lidar now allow for improved calibration and comparisons. We will present and discuss these new low-level scans at the conference.


References:

[1] Lange, D. et al.: Compact Operational Tropospheric Water Vapor and Temperature Raman Lidar with Turbulence Resolution. Geophys. Res. Lett. (2019). DOI: 10.1029/2019GL085774

[2] Späth, F., et al.: The land–atmosphere feedback observatory: a new observational approach for characterizing land–atmosphere feedback. Geoscientific Instrumentation, Methods and Data Systems (2023). DOI: 10.5194/gi-12-25-2023

[3] Schumacher, M., D. Lange, A. Behrendt, V. Wulfmeyer: CO2 Measurements with Raman Lidar in the Lower Troposphere. EGU25-8872 (2025) DOI: 10.5194/egusphere-egu25-8872

How to cite: Schumacher, M., Lange, D., Behrendt, A., and Wulfmeyer, V.: CO2 Profiling with Automated Scanning Raman Lidar, EGU General Assembly 2026, Vienna, Austria, 3–8 May 2026, EGU26-12789, https://doi.org/10.5194/egusphere-egu26-12789, 2026.

EGU26-13239 | Posters on site | GI4.2

Studying Land-Atmosphere Feedback Processes With a Synergy of Six Scanning Lidars 

Andreas Behrendt, Moritz Schumacher, Diego Lange, Linus von Klitzing, Syed Abbas, Oliver Branch, Matthias Mauder, and Volker Wulfmeyer

We will present the strategy and results of a combination of six scanning lidars to investigate the interplay between daytime surface fluxes, surface layer gradients, convective boundary layer dynamics and development, as well as the characteristics of the interfacial layer and the lower free troposphere. Our observations were made above the agricultural fields of University of Hohenheim [1], Stuttgart, Germany in spring and summer 2025 in the frame of the research unit Land Atmosphere Feedback Initiative (LAFI, https://lafi-dfg.de/) of the German Research Foundation (DFG). For this, the automated Raman lidar ARTHUS (Atmospheric Temperature and Humidity Sounder) built in our institute in recent years, was extended with a scanner for atmospheric measurements in the surface layer just above the canopy. ARTHUS [2] is an eye-safe rotational Raman lidar with five receiver channels detecting the elastic backscatter signal at 355 nm, two rotational Raman signals with opposite temperature dependence, as well as the two vibrational Raman signals of water vapor and carbon dioxide. These scanning measurements were performed during intensive observation periods for 50 minutes of each hour while during the remaining 10 minutes of each hour as well as during non-IOP days vertical pointing measurements were made. These surface layer observations of ARTHUS were combined with data measured with two Doppler lidars making simultaneously cross-cutting low-level scans for horizontal wind profiling near the surface. Two more Doppler lidars were measuring vertical wind fluctuations and horizontal wind speed and direction. One of these two Doppler lidars was operated in constant vertical pointing mode while the other was operated in a six-beam scanning mode with an elevation angle of 45°. Our water vapor differential absorption lidar (WVDIAL) made vertical-pointing observations of turbulent moisture fluctuations up to the free troposphere. The WVDIAL uses a Titanium-Saphire laser pumped with the second-harmonic radiation of a Nd:YAG laser as transmitter emitting online and offline laser pulses near 820 nm with 200 Hz into the atmosphere. The atmospheric backscatter signals are collected with a 80-cm telescope. While also the WVDIAL can scan in any direction, it was operated in constant vertical-pointing mode during LAFI.


[1]        Späth, F., et al.: The land–atmosphere feedback observatory: a new observational approach for characterizing land–atmosphere feedback. Geoscientific Instrumentation, Methods and Data Systems (2023). DOI: 10.5194/gi-12-25-2023

[2]        Lange, D. et al.: Compact Operational Tropospheric Water Vapor and Temperature Raman Lidar with Turbulence Resolution. Geophys. Res. Lett. (2019). DOI: 10.1029/2019GL085774

How to cite: Behrendt, A., Schumacher, M., Lange, D., von Klitzing, L., Abbas, S., Branch, O., Mauder, M., and Wulfmeyer, V.: Studying Land-Atmosphere Feedback Processes With a Synergy of Six Scanning Lidars, EGU General Assembly 2026, Vienna, Austria, 3–8 May 2026, EGU26-13239, https://doi.org/10.5194/egusphere-egu26-13239, 2026.

EGU26-14184 | Orals | GI4.2

Vertical profiling of aerosol optical, microphysical, and chemical properties using elastic-Raman-LIF lidars and in situ aerosol measurements during the 2024–2025 CHOPIN campaign 

Alexandros D. Papayannis, Marilena Gidarakou, Nikos Kafenidis, Igor Veselovskii, Romanos Foskinis, Olga Zografou, Maria I. Gini, Konstantinos Granakis, Paul Zieger, Aiden Jonsson, Julia Schmale, Konstantinos Eleftheriadis, and Athanasios Nenes

The Cleancloud Helmos OrograPhic site experimeNt (CHOPIN) campaign took place at mount Helmos, Greece (37.98°N, 22.2°E; 1700-2314 m a.s.l.) to  study the aerosol-cloud interactions during two distinct periods: autumn/winter (October–November 2024) and spring (April–May 2025). In situ aerosol sampling at the Helmos Atmospheric Aerosol and Climate Change Station (HAC)2 was performed at 2314 m a.s.l. along with aerosol lidar vertical measurements. (HAC)2 is located on a strategic site at a crossroad of different air masses containing various aerosol types (wildfire smoke, mineral dust, continental pollution, marine aerosols, and biogenic particles). Two lidar systems were deployed: the AIAS depolarization lidar (532 nm parallel and cross, 1064 nm) and the ATLAS-NEF multi-wavelength elastic-Raman-LIF lidar (355, 387, 407 and 420-520 nm). The vertically resolved aerosol optical properties (extinction and backscatter coefficient, lidar ratio, Ångström exponent, particle depolarization) and water vapor mixing ratios, alongside with fluorescence backscatter profiles, were provided from near-ground up to 5-7 km a.s.l. Lidar-inversion algorithms were used to retrieve the aerosol microphysical properties (effective radius, single scattering albedo, and complex refractive index). The aerosol chemical composition was retrieved using the ISORROPIA thermodynamic model. The aerosol fluorescence measurements highlighted enhanced presence of bioaerosols in selected cases. Saharan dust particles exhibited high depolarization ratios (δ532 ~0.20–0.25) and lidar ratios (LR ~40–55 sr), while biomass burning plumes showed distinct microphysical and chemical signatures. Comparison of in situ and lidar-derived optical, microphysical and chemical properties at 2.314 m a.s.l. was found to be quite satisfactory, paving the way for a novel synergistic approach to further elucidate the aerosols’ role in cloud formation and radiative forcing. These lidar data are used to improve Machine Learning algorithms in the frame of the F-LIDAR-M project.

Funding: The research project, entitled “Real-time detection/Speciation of bio-aerosols profiling using Fluorescence LiDAR techniques and Machine Learning (F-LIDAR-M)” is implemented in the framework of H.F.R.I call “3rd Call for H.F.R.I.’s Research Projects to Support Faculty Members & Researchers” (H.F.R.I. Project Number: 25096).


How to cite: Papayannis, A. D., Gidarakou, M., Kafenidis, N., Veselovskii, I., Foskinis, R., Zografou, O., Gini, M. I., Granakis, K., Zieger, P., Jonsson, A., Schmale, J., Eleftheriadis, K., and Nenes, A.: Vertical profiling of aerosol optical, microphysical, and chemical properties using elastic-Raman-LIF lidars and in situ aerosol measurements during the 2024–2025 CHOPIN campaign, EGU General Assembly 2026, Vienna, Austria, 3–8 May 2026, EGU26-14184, https://doi.org/10.5194/egusphere-egu26-14184, 2026.

EGU26-15933 | Posters on site | GI4.2

Vertical Wind Shear and Turbulence Detection Using Doppler Lidar and Radiosonde at NARO Space Center in South Korea 

Juseob Kim, Jung-Hoon Kim, Dan-Bi Lee, and Soo-Hyun Kim

 Atmospheric turbulence mainly induced by Vertical Wind Shear (VWS) can alter significantly the accurate positioning of space launching vehicles due to any possible distortions in their heading angles during their early stages of the flights. In this study, we developed the observation-based real-time detection system of the objective magnitude of atmospheric turbulence derived from the VWS near the NARO Space Center (NSC) in South Korea for ensuring successful launch missions of currently planned and future space vehicles. Here, we estimated an objective turbulence intensity, as a function of Eddy Dissipation Rate (EDR) that is converted from the VWS based on directly measured wind data from a Doppler wind lidar and intensive field experiments of radiosondes at the NSC for launching missions. First, we applied rigorous quality control (QC) of wind observation data to remove and filter out spurious wind data, which resulted in a high degree of agreement between the radiosonde and Doppler wind lidar measurements. This allowed us to calculate more reliable VWS to be converted to EDR using the lognormal mapping technique. Probability density functions (PDFs) of the VWS in different seasons and altitudes were established, and then used to construct the best-fit curves of prescribed lognormal function by minimizing the root mean square errors from the actual PDFs. Using the mean and standard deviation of these best-fit curves, the relationships between VWS and EDR were finally obtained and used to develop a real-time EDR estimation algorithm based on the observed wind data at the NSC. Newly developed real-time EDR estimation will provide a critical information to make a final Go or No-Go decision of the launching missions by rapidly detecting VWS-based EDR signals at the NSC site.

Acknowledgement: This work was funded by the Korea Meteorological Administration Research and Development Program under Grant KMI2022-00310 and the NARO Space Center Advancement Project of Korea Aerospace Administration.

How to cite: Kim, J., Kim, J.-H., Lee, D.-B., and Kim, S.-H.: Vertical Wind Shear and Turbulence Detection Using Doppler Lidar and Radiosonde at NARO Space Center in South Korea, EGU General Assembly 2026, Vienna, Austria, 3–8 May 2026, EGU26-15933, https://doi.org/10.5194/egusphere-egu26-15933, 2026.

EGU26-17151 | ECS | Posters on site | GI4.2

Insights into long-term Atmospheric Profiling with the Vaisala CL61 Ceilometer 

Viet Le, Ewan J. O’Connor, Maria Filioglou, and Ville Vakkari

The Vaisala CL61 is increasingly deployed in both research infrastructures, such as ACTRIS, and operational meteorological networks for applications including aviation and air-quality forecasting. As a new generation elastic backscatter lidar, it extends conventional ceilometer capabilities by providing depolarization ratio measurement. While this measurement is highly valuable, especially for unattended, autonomous operation, its use in network applications requires careful characterization.

We developed a methodology for identifying background signals and suitable liquid cloud layers to evaluate the long-term performance of multiple CL61 instruments across different sites. Results show some variability between instruments, with several of these early production units exhibiting a pronounced decrease in laser power over time, accompanied by increased background noise. Although internal calibration normally compensates for laser power degradation, external atmospheric calibration at the Lindenberg site revealed that this compensation becomes insufficient when laser power falls below 40%.

Termination hood measurements were used to characterize instrument noise and bias profiles. Both were found to exhibit temperature dependence and to deviate from zero in the near range, below approximately 2 km but extending up to 5 km for one instrument. A method for bias correction, along with an estimation of the associated uncertainty, is presented. In addition, an aerosol inversion approach is also introduced for retrieving the profile of aerosol particle backscatter coefficient, aerosol depolarization ratio, and their corresponding uncertainties. A case study demonstrates that bias-corrected, aerosol-inverted depolarization ratio can differ by up to 0.1 from the original instrument values, emphasizing the importance of accounting for instrumental bias and, in particular, molecular contributions at the CL61 operating wavelength of 905 nm.

Lastly, we observed signal loss in one instrument and found that it was due to optical lens fogging caused by insufficient internal heating linked to firmware behaviour. It is particularly important to identify and exclude such periods to ensure the reliability of the measurement.

How to cite: Le, V., J. O’Connor, E., Filioglou, M., and Vakkari, V.: Insights into long-term Atmospheric Profiling with the Vaisala CL61 Ceilometer, EGU General Assembly 2026, Vienna, Austria, 3–8 May 2026, EGU26-17151, https://doi.org/10.5194/egusphere-egu26-17151, 2026.

EGU26-18094 | ECS | Posters on site | GI4.2

From the Troposphere to Thermosphere: Compact Doppler Lidar units for observation networks 

Jan Froh, Josef Höffner, Alsu Mauer, Thorben Lüke-Mense, Ronald Eixmann, Frederik Ernst, Pablo Saavedra Garfias, Gerd Baumgarten, Alexander Munk, Sarah Scheuer, and Michael Strotkamp

We present the current status of our transportable, multi-purpose lidar units for investigating small- to large-scale processes in the atmosphere. An array of compact lidars with multiple fields of view will allow for measurements of temperatures, winds, aerosols and metals with high temporal and vertical resolution.

Our lidar units enable the investigation of Mie scattering (aerosols), Rayleigh scattering (air molecules), and resonance fluorescence (e.g. potassium atoms) from the troposphere (5 km) to the thermosphere (100 km). The unique frequency scanning laser and filter techniques allow multiple observations (wind, temperature, aerosols, metal density). The combination of a tunable alexandrite laser emitter and receiver enables high-resolution spectral characterization of the backscattered Doppler signals at day and night. In future, the relevance of such lidar networks will increase for improved weather prediction and long-term trends, monitoring of metal densities (meteoric and space debris impact) as well as calibration and validation of spaceborne missions.

We will present the progress of our lidar development in the IR and UV wavelength range, expanded measurement capabilities (e.g. aerosols, wind) and current results of measurements at 54°N and 69°N.

How to cite: Froh, J., Höffner, J., Mauer, A., Lüke-Mense, T., Eixmann, R., Ernst, F., Saavedra Garfias, P., Baumgarten, G., Munk, A., Scheuer, S., and Strotkamp, M.: From the Troposphere to Thermosphere: Compact Doppler Lidar units for observation networks, EGU General Assembly 2026, Vienna, Austria, 3–8 May 2026, EGU26-18094, https://doi.org/10.5194/egusphere-egu26-18094, 2026.

EGU26-18569 | ECS | Posters on site | GI4.2

Evaluating Turbulent Kinetic Energy Dissipation Parametrizations Using Doppler Lidars in the Convective Boundary Layer 

Syed Saqlain Abbas, Andreas Behrendt, and Volker Wulfmeyer

In mesoscale models, turbulent kinetic energy (TKE) dissipation is commonly parameterized as a function of bulk TKE, implicitly assuming isotropic turbulence in the convective boundary layer (CBL). In this study, we use long-term Doppler lidar observations at the Land-Atmosphere Feedback Observatory (LAFO), University of Hohenheim, Stuttgart, Germany to evaluate this assumption. Two continuously operated Doppler lidars, one in vertical staring mode and one in six-beam scanning mode, provide high-resolution wind measurements within the CBL (Späth et al., 2023). We have analyzed the statistical relationships between vertical velocity variance <w’2>, TKE dissipation (Wulfmeyer et al., 2024), and TKE (Bonin et al., 2017) under daytime convective conditions (06:00–18:00 UTC). The results reveal a nonlinear relationship between <w’2> and TKE, with dissipation scaling to (<w’2>)3/2. The TKE-based dissipation parametrization from Mellor-Yamada-Nakanishi-Niino (MYNN) shows only lower agreement (R2 = 0.50) with lidar observation, whereas the <w’2>-based dissipation shows a significantly stronger agreement (R2 = 0.80). Despite this difference, the turbulent length scales derived from TKE and <w’2> exhibits similar characteristics. These findings highlight limitations of bulk-TKE-based parameterizations and demonstrate the value of Doppler-lidar-based diagnostics for improving the turbulence representation in mesoscale models.

References:

Bonin et al., 2017, https://doi.org/10.5194/amt-10-3021-2017

Späth et al, 2023, https://doi.org/10.5194/gi-12-25-2023

Wulfmeyer et al, 2024, https://doi.org/10.5194/amt-17-1175-2024

How to cite: Abbas, S. S., Behrendt, A., and Wulfmeyer, V.: Evaluating Turbulent Kinetic Energy Dissipation Parametrizations Using Doppler Lidars in the Convective Boundary Layer, EGU General Assembly 2026, Vienna, Austria, 3–8 May 2026, EGU26-18569, https://doi.org/10.5194/egusphere-egu26-18569, 2026.

EGU26-19607 | ECS | Posters on site | GI4.2

Retrieval of 3 wavelengths aerosol properties from combined measurements of two ACTRIS lidar systems in troposphere and stratosphere 

Michael Haimerl, Nikolaos Siomos, Volker Freudenthaler, Hannes Vogelmann, and Michal Posyniak

Multi-wavelength lidar measurements are crucial for aerosol remote sensing as they can provide additional information for aerosol characterisation. For such measurements typically the fundamental of Nd:YAG lasers at 1064nm and the first and second harmonic at 532nm and 355nm are used. However, due to limitations in the dynamic range and quantum efficiency of detectors, signal detection for the near infrared is challenging. Accordingly, special focus lies on the contribution of our new ACTRIS CARS (Centre for Aerosol Remote Sensing) reference lidar module for 1064nm equipped with novel APD recorder setups providing high signal quality at 1064nm compared to what was possible so far. (Haimerl, 2025)  

For the EGU conference 2026 we will present intensive aerosol properties retrieved for 3 wavelengths from combined measurements in troposphere and up to lower stratosphere of the portable reference lidar system POLIS-9 of ACTRIS CARS at LMU and of the quality assured ACTRIS lidar system TONI.

The measurements were conducted in the context of an intercomparison campaign at the KIT IMK-IFU* institute in Garmisch-Partenkirchen between 01.10.2025 and 13.11.2025. The POLIS-9 reference lidar system is a combination of two portable lidar modules POLIS-6 and POLIS-1064. POLIS-6 has co- and cross-polar channels for 355nm and 532nm and vibrational Raman channels respectively. The POLIS-1064 upgrade offers 1064nm co- and cross-polar channels and a rotational Raman channel. TONI at KIT IMK-IFU is equipped with co- and cross-polar channels and vibrational Raman channels at 355nm and 532nm and a total elastic channel at 1064nm. For additional observational capabilities in the stratosphere also a lidar from KIT IMK-IFU located on nearby Zugspitze Mountain with one 532 total channel was utilized. (Haimerl, 2026) 

Aerosol products were retrieved for different aerosol cases, like smoke layers on several days during the campaign, a Saharan Dust layer on 13.11.2025 up to 4km and clean atmosphere condition on 07.11.2025. Moreover, we also try to characterise a persistent layer between 10km and 20km in the stratosphere, potentially attributed to volcanic aerosol. (Trickl, 2024)

A detailed discussion of retrieval results will then be presented at the conference. Also, we are aiming to take close overpasses of the EarthCare satellite during our campaign into account and use our retrieval results for validating the satellite data.


This project receives funding from European Union’s Horizon research and innovation programme under grant agreement No. 871115. ACTRIS-D is funded by German Federal Ministry for Education and Research (BMBF) under grant agreements 01LK2001A-K & 01LK2002A-G.


Haimerl, M. (2025) POLIS1064 – A polarization Raman lidar with state-of-the-art recorders for minimizing analogue signal distortions, Proc. European lidar conference Warsow 2025.

Haimerl, M. (2026) Retrieval of tropospheric and stratospheric aerosol properties at 3 wavelengths from combined measurements of two ACTRIS lidar systems, Proc. ACTRIS Science Conference Oslo, 2026.

Trickl, T. et. al (2024) Measurement report: Violent biomass burning and volcanic eruptions – a new period of elevated stratospheric aerosol over central Europe (2017 to 2023) in a long series of observations, Atmos. Chem. Phys., 24.

(*IMK-IFU: Institute of Meteorology and Climate Research, Atmospheric Environmental Research Department)

How to cite: Haimerl, M., Siomos, N., Freudenthaler, V., Vogelmann, H., and Posyniak, M.: Retrieval of 3 wavelengths aerosol properties from combined measurements of two ACTRIS lidar systems in troposphere and stratosphere, EGU General Assembly 2026, Vienna, Austria, 3–8 May 2026, EGU26-19607, https://doi.org/10.5194/egusphere-egu26-19607, 2026.

EGU26-1897 | ECS | Posters on site | EOS4.4

The Unreliable Narrator: LSTM Internal States Fluctuate with Software Environments Despite Robust Predictions 

Ryosuke Nagumo, Ross Woods, and Miguel Rico-Ramirez

Since the robust performance of Long Short-Term Memory (LSTM) networks was established, their physics-awareness and interpretability have become central topics in hydrology. Seminal works (e.g., Lees et al. (2022)) have argued that LSTM internal states spontaneously capture hydrological concepts, and suggested that cell states can represent soil moisture dynamics despite not being explicitly trained on such data. Conversely, more recent studies (e.g., Fuente et al. (2024)) demonstrated that mathematical equifinality causes non-unique LSTM representations with different initialisations.

In this work, we report an arguably more systematic "bug" in the software environment that causes instability in internal states. We initially aimed to investigate how internal states behave differently when trained with or without historical observation data. We encountered this issue while reassembling a computational stack and attempting to replicate the initial results, as the original Docker environment was not preserved. While random seeds have been indicated to lead to different internal state trajectories, we found the computational backend (e.g., changing CUDA versions, PyTorch releases, or dependent libraries) also produces them. These are the findings:

  • In gauged catchments: Discharge predictions remained stable (in one catchment, NSE was 0.88 ± 0.01) across computational environments, yet the internal temporal variations (e.g., silhouette, mean, and std of cell states) fluctuated noticeably.
  • In pseudo-ungauged scenarios: The prediction performance itself became more reliant on the computational environment (in the same catchment, NSE dropped to 0.31 ± 0.15), yet the internal temporal variations of the cell states fluctuated only as much as they did during the gauged scenario.

These findings suggests that instability in the computational environment poses not only a risk of altering interpretability in training (by altering internal states) but also casts doubt on reliability in extrapolation (by altering outputs).

It is worth mentioning that we confirmed this is not a replicability issue; completely identical cell states and predictions are produced when the computational environment, seeds, and training data are held constant. We argue that such stability must be established as a standard benchmark before assigning physical meaning to deep learning internals.

How to cite: Nagumo, R., Woods, R., and Rico-Ramirez, M.: The Unreliable Narrator: LSTM Internal States Fluctuate with Software Environments Despite Robust Predictions, EGU General Assembly 2026, Vienna, Austria, 3–8 May 2026, EGU26-1897, https://doi.org/10.5194/egusphere-egu26-1897, 2026.

EGU26-2771 | Posters on site | EOS4.4

New EGU Manuscript Types: Limitations, Errors, Surprises, and Shortcomings as Opportunities for New Science (LESSONS) 

John Hillier, Ulrike Proske, Stefan Gaillard, Theresa Blume, and Eduardo Queiroz Alves

Moments or periods of struggle not only propel scientists forward, but sharing these experiences can also provide valuable lessons for others. Indeed, the current bias towards only publishing ‘positive’ results arguably impedes scientific progress as mistakes that are not learnt from are simply repeated. Here we present a new article type in EGU journals covering LESSONS learnt to help overcome this publishing bias. LESSONS articles describe the Limitations, Errors, Surprises, Shortcomings, and Opportunities for New Science emerging from the scientific process, including non-confirmatory and null results. Unforeseen complications in investigations, plausible methods that failed, and technical issues are also in scope. LESSONS thus fit the content of the BUGS session and can provide an outlet for articles based on session contributions. Importantly, a LESSONS Report will offer a substantial, valuable insight. LESSONS Reports are typically short (1,000-2,000 words) to help lower the barrier to journal publication, whilst LESSONS Posts (not peer-reviewed, but with a DOI on EGUsphere) can be as short as 500 words to allow early-stage reporting. LESSONS aim to destigmatise limitations, errors, surprises and shortcomings and to add these to the published literature as opportunities for new science – we invite you to share your LESSONS learnt.


Finally, a big thank you from this paper’s ‘core’ writing team to the wider group who have helped shape the LESSONS idea since EGU GA in 2025, including PubCom and in particular its Chair Barbara Ervens.

How to cite: Hillier, J., Proske, U., Gaillard, S., Blume, T., and Queiroz Alves, E.: New EGU Manuscript Types: Limitations, Errors, Surprises, and Shortcomings as Opportunities for New Science (LESSONS), EGU General Assembly 2026, Vienna, Austria, 3–8 May 2026, EGU26-2771, https://doi.org/10.5194/egusphere-egu26-2771, 2026.

EGU26-3077 | ECS | Posters on site | EOS4.4

False Starts and Silver Linings: A Photocatalytic Journey with Layered Double Hydroxides 

Anna Jędras and Jakub Matusik

Photocatalysis is frequently presented in the literature as a straightforward route toward efficient degradation of pollutants, provided that the “right” material is selected. Layered double hydroxides (LDH) are often highlighted as promising photocatalysts due to their tunable composition and reported activity in dye degradation. Motivated by these claims, this study evaluated LDH as mineral analogs for photocatalytic water treatment, ultimately uncovering a series of unexpected limitations, methodological pitfalls, and productive surprises.

In the first stage, Zn/Cr, Co/Cr, Cu/Cr, and Ni/Cr LDHs were synthesized and tested for photocatalytic degradation of methylene blue (0.02 mM) and Acid Blue Dye 129 (0.3 mM). Contrary to expectations,1 photocatalytic performance was consistently low. After one hour of irradiation, concentration losses attributable to photocatalysis did not exceed 15%, while most dye removal resulted from adsorption. Despite extensive efforts to optimize synthesis protocols, catalyst composition, and experimental conditions, this discrepancy with previously published studies could not be resolved.

To overcome limitations related to particle dispersion, surface accessibility, and charge-carrier separation, a second strategy was pursued by incorporating clay minerals as supports.2 Zn/Cr LDH, identified as the most active composition in preliminary tests, was coprecipitated with kaolinite, halloysite, and montmorillonite. Experiments with methylene blue (0.1 mM) and Acid Blue 129 (0.3 mM) demonstrated enhanced adsorption capacities. However, photocatalytic degradation efficiencies remained poor, typically below 10% after one hour, indicating that apparent performance gains were largely adsorption-driven rather than photochemical.

This failure proved to be a turning point. Instead of abandoning LDH entirely, they were combined with graphitic carbon nitride (GCN) to form a heterostructure.3 This approach resulted in a dramatic improvement: after optimization of the synthesis protocol, 99.5% of 1 ppm estrone was degraded within one hour.4 Further modifications were explored by introducing Cu, Fe, and Ag into the LDH/GCN system. While Cu and Fe suppressed photocatalytic activity, silver, at an optimized loading, reduced estrone concentrations below the detection limit within 40 minutes.5

This contribution presents a full experimental arc - from promising hypotheses that failed, through misleading adsorption-driven “successes,” to an ultimately effective but non-intuitive solution - highlighting the value of negative results and surprises as drivers of scientific progress.

This research was funded by the AGH University of Krakow, grant number 16.16.140.315.

Literature:

1            N. Baliarsingh, K. M. Parida and G. C. Pradhan, Ind. Eng. Chem. Res., 2014, 53, 3834–3841.

2            A. Í. S. Morais, W. V. Oliveira, V. V. De Oliveira, L. M. C. Honorio, F. P. Araujo, R. D. S. Bezerra, P. B. A. Fechine, B. C. Viana, M. B. Furtini,
              E. C. Silva-Filho and J. A. Osajima, Journal of Environmental Chemical Engineering, 2019, 7, 103431.

3            B. Song, Z. Zeng, G. Zeng, J. Gong, R. Xiao, S. Ye, M. Chen, C. Lai, P. Xu and X. Tang, Advances in Colloid and Interface Science, 2019, 272, 101999.

4            A. Jędras, J. Matusik, E. Dhanaraman, Y.-P. Fu and G. Cempura, Langmuir, 2024, 40, 18163–18175.

5            A. Jędras, J. Matusik, J. Kuncewicz and K. Sobańska, Catal. Sci. Technol., 2025, 15, 6792–6804.

How to cite: Jędras, A. and Matusik, J.: False Starts and Silver Linings: A Photocatalytic Journey with Layered Double Hydroxides, EGU General Assembly 2026, Vienna, Austria, 3–8 May 2026, EGU26-3077, https://doi.org/10.5194/egusphere-egu26-3077, 2026.

EGU26-4074 | Orals | EOS4.4

Instructive surprises in the hydrological functioning of landscapes 

James Kirchner, Paolo Benettin, and Ilja van Meerveld

BUGS can arise in individual research projects, but also at the level of communities of researchers, leading to shifts in the scientific consensus.  These community-level BUGS typically arise from observations that are surprising to (or previously overlooked by) substantial fractions of the research community.  In this presentation, we summarize several community-level BUGS in our field: specifically, key surprises that have transformed the hydrological community's understanding of hillslope and catchment processes in recent decades.  

Here are some examples.  (1) Students used to learn (and some still do today) that storm runoff is dominated by overland flow.  But stable isotope tracers have convincingly shown instead that even during storm peaks, streamflow is composed mostly of water that has been stored in the landscape for weeks, months, or years.  (2) Maps, and most hydrological theories, have typically depicted streams as fixed features of the landscape.  But field mapping studies have shown that stream networks are surprisingly dynamic, with up to 80% of stream channels going dry sometime during the year.  (3) Textbooks have traditionally represented catchment storage as a well-mixed box.  But tracer time series show fractal scaling that cannot be generated by well-mixed boxes, forcing a re-think of our conceptualization of subsurface storage and mixing.  (4) Waters stored in aquifers, and the waters that drain from them, have traditionally been assumed to share the same age.  But tracers show that waters draining from aquifers are often much younger than the groundwaters that are left behind, and this was subsequently shown to be an inevitable result of aquifer heterogeneity. 

Several examples like these, and their implications, will be briefly discussed, with an eye to the question: how can we maximize the chances for future instructive surprises?

How to cite: Kirchner, J., Benettin, P., and van Meerveld, I.: Instructive surprises in the hydrological functioning of landscapes, EGU General Assembly 2026, Vienna, Austria, 3–8 May 2026, EGU26-4074, https://doi.org/10.5194/egusphere-egu26-4074, 2026.

Coming from geosciences, we hopefully know what we want to do. Coming from numerics, however, we often know quite well what we are able to do and look for a way to sell it to the community. A few years ago, deep-learning techniques brought new life into the glaciology community. These approaches  allowed for simulations of glacier dynamics at an unprecedented computational performance and motivated several researchers to tackle the numerous open questions about past and present glacier dynamics, particularly in alpine regions. From another point of view, however, it was also tempting to demonstrate that the human brain is still more powerful than artificial intelligence by developing a new classical numerical scheme that can compete with deep-learning techniques concerning its efficiency.

Starting point was, of course, the simplest approximation to the full 3-D Stokes equations, the so-called shallow ice approximation (SIA). Progress was fast and the numerical performance was even better than expected. The new numerical scheme enabled simulations with spatial resolutions of 25 m on a desktop PC, while previous schemes did not reach simulations below a few hundred meters.

However, the enthusiasm pushed the known limitations of the SIA a bit out of sight. Physically, the approximation is quite bad on rugged terrain, particularly in narrow valleys. So the previous computational limitations have been replaced by physical limitations since high resolutions are particularly useful for rugged topographies. In other words, a shabby house has a really good roof now.

What are the options in such a situation?

  • Accept that there is no free lunch and avoid contact to the glacialogy community in the future.
  • Continue the endless discussion about the reviewers' opinion that a spatial resolution of 1 km is better than 25 m.
  • Find a real-world data set that matches the results of the model and helps to talk the problems away.
  • Keep the roof and build a new house beneath. Practically, this would be developing a new approximation to the full 3-D Stokes equations that is compatible to the numerical scheme and reaches an accuracy similar to those of the existing approximations.
  • Take the roof and put it on one of the existing solid houses. Practically, this would be an extension of the numerical scheme towards more complicated systems of differential equations. Unfortunately, efficient numerical schemes are typically very specific. So the roof will not fit easily and it might leak.

The story is open-ended, but there will be at least a preliminary answer in the presentation.


How to cite: Hergarten, S.: How useful is a new roof on a shabby house? An example from glacier modeling, EGU General Assembly 2026, Vienna, Austria, 3–8 May 2026, EGU26-4196, https://doi.org/10.5194/egusphere-egu26-4196, 2026.

EGU26-4587 | Posters on site | EOS4.4

The importance of describing simple methods in climate sensitivity literature 

Anna Zehrung, Andrew King, Zebedee Nicholls, Mark Zelinka, and Malte Meinshausen

“Show your working!” – is the universal phrase drilled into science and maths students to show a clear demonstration of the steps and thought processes used to reach a solution (and to be awarded full marks on the exam). 

Beyond the classroom, “show your working” becomes the methods section on every scientific paper, and is critical for the transparency and replicability of the study. However, what happens if parts of the method are considered assumed knowledge, or cut in the interests of a word count? 

An inability to fully replicate the results of a study became the unexpected glitch at the start of my PhD. Eager to familiarise myself with global climate model datasets, I set out to replicate the results of a widely cited paper which calculates the equilibrium climate sensitivity (ECS) across 27 climate models. The ECS is the theoretical global mean temperature response to a doubling of atmospheric CO2 relative to preindustrial levels. A commonly used method to calculate the ECS is to apply an ordinary least squares regression to global annual mean temperature and radiative flux anomalies. 

Despite the simplicity of a linear regression between two variables, we obtained ECS estimates for some climate models that differed from those reported in the original study, even though we followed the described methodology. However, the methodology provided only limited detail on how the raw climate model output – available at regional and monthly scales – was processed to obtain global annual mean anomalies. Differences in these intermediate processing steps can, in turn, lead to differences in ECS estimates.

Limited reporting of data-processing steps is common in the ECS literature. Whether these steps are considered assumed knowledge or deemed too simple to warrant explicit description, we demonstrate that, for some models, they can materially affect the resulting ECS estimate. While the primary aim of our study is to recommend a standardised data-processing pathway for ECS calculations, a secondary aim is to highlight the lack of transparency in key methodological details across the literature. A central takeaway is the importance of clearly documenting all processing steps – effectively, to “show your working” – and to emphasise the critical role of a detailed methods section.

How to cite: Zehrung, A., King, A., Nicholls, Z., Zelinka, M., and Meinshausen, M.: The importance of describing simple methods in climate sensitivity literature, EGU General Assembly 2026, Vienna, Austria, 3–8 May 2026, EGU26-4587, https://doi.org/10.5194/egusphere-egu26-4587, 2026.

Observation of atmospheric constituents and processes is not easy. As atmospheric chemists, we use sensitive equipment, for example mass spectrometers, that we often set up in a (remote) location or on a moving platform for a few-weeks campaign to make in-situ observations. All this with the goal of explaining more and more atmospheric processes, and to verify and improve atmospheric models. However, glitches can happen anywhere in an experiment, be it in the experimental design, setup, or instrumental performance. Thus, complete data coverage during such a campaign is not always a given, resulting in gaps in (published) datasets. And the issue with air is that you can never go back and measure the exact same air again. Here, I would like to share some stories behind such gaps, and what we learned from them. This presentation aims to encourage early career researchers who might be struggling with feelings of failure when bugs, blunders and glitches happen in their experiments - you are not alone! I will share what we learned from these setbacks and how each of them improved our experimental approaches.

How to cite: Pfannerstill, E. Y.: Why are there gaps in your measurements? Sharing the stories behind the missing datapoints, EGU General Assembly 2026, Vienna, Austria, 3–8 May 2026, EGU26-5494, https://doi.org/10.5194/egusphere-egu26-5494, 2026.

Over a 24-year research period, three successive experimental investigations led to three publications, each of which falsified the author’s preceding hypothesis and proposed a revised conceptual framework. Despite an initial confidence in having identified definitive solutions, subsequent experimental evidence consistently demonstrated the limitations and inaccuracies of earlier interpretations. This iterative process ultimately revealed that samples, in particular geological reference materials, sharing identical petrographic or mineralogical descriptions are not necessarily chemically equivalent and can exhibit markedly different behaviors during chemical digestion procedures. These findings underscore the critical importance of continuous hypothesis testing, self-falsification, and experimental verification in scientific research, particularly when working with reference materials assumed to be identical. I will be presenting data on the analysis of platinum group elements (PGE) and osmium isotopes in geological reference materials (chromitites, ultramafic rocks and basalts), which demonstrates the need for challenging matrices for method validation. 

How to cite: Meisel, T. C.: Self-falsification as a driver of scientific progress: Insights from long-term experimental research, EGU General Assembly 2026, Vienna, Austria, 3–8 May 2026, EGU26-5771, https://doi.org/10.5194/egusphere-egu26-5771, 2026.

EGU26-6794 | ECS | Orals | EOS4.4

Back to square one (again and again): Finding a bug in a complex global atmospheric model   

Nadja Omanovic, Sylvaine Ferrachat, and Ulrike Lohmann

In atmospheric sciences, a central tool to test hypotheses are numerical models, which aim to represent (part of) our environment. One such model is the weather and climate model ICON [1], which solves the Navier-Stokes equation for capturing the dynamics and parameterizes subgrid-scale processes, such as radiation, cloud microphysics, and aerosol processes. Specifically, for the latter exists the so-called Hamburg Aerosol Module (HAM [2]), which is coupled to ICON [3] and predicts the evolution of aerosol populations using two moments (mass mixing ratio and number concentration). The high complexity of aerosols is reflected in the number of aerosol species (total of 5), number of modes (total of 4), and their mixing state and solubility. The module calculates aerosol composition and number concentration, their optical properties, their sources and sinks, and their interactions with clouds via microphysical processes. Aerosol emissions are sector-specific and based on global emission inventories or dynamically computed.

Within our work, we stumbled upon an interesting pattern occurrence in our simulations upon changing/turning off single emission sectors. If we, e.g., removed black carbon from aircraft emissions, the strongest changes emerged over the African continent, which is not the region where we were expecting to see the strongest response. Further investigations revealed that this pattern emerges independently of the emission sector as well as species, confirming our suspicion that we are facing a bug within HAM. Here, we want to present how we approached the challenge of identifying and tackling a bug within a complex module with several thousand lines of code.


[1] G. Zängl, D. Reinert, P. Ripodas, and M. Baldauf, “The ICON (ICOsahedral Non-hydrostatic) modelling framework of DWD and MPI-M: Description of the non-hydrostatic dynamical core,” Quarterly Journal of the Royal Meteorological Society, vol. 141, no. 687, pp. 563–579, 2015, ISSN: 1477-870X. DOI: 10.1002/qj.2378

[2] P. Stier, J. Feichter, S. Kinne, S. Kloster, E. Vignati, J. Wilson, L. Ganzeveld, I. Tegen, M. Werner, Y. Balkanski, M. Schulz, O. Boucher, A. Minikin, and A. Petzold, “The aerosol-climate model ECHAM5-HAM,” Atmospheric Chemistry and Physics, 2005. DOI: 10.5194/acp-5-1125-2005

[3] M. Salzmann, S. Ferrachat, C. Tully, S. M¨ unch, D. Watson-Parris, D. Neubauer, C. Siegenthaler-Le Drian, S. Rast, B. Heinold, T. Crueger, R. Brokopf, J. Mülmenstädt, J. Quaas, H. Wan, K. Zhang, U. Lohmann, P. Stier, and I. Tegen, “The Global Atmosphere-aerosol Model ICON-A-HAM2.3–Initial Model Evaluation and Effects of Radiation Balance Tuning on Aerosol Optical Thickness,” Journal of Advances in Modeling Earth Systems, vol. 14, no. 4,e2021MS002699, 2022, ISSN: 1942-2466. DOI: 10.1029/2021MS002699

How to cite: Omanovic, N., Ferrachat, S., and Lohmann, U.: Back to square one (again and again): Finding a bug in a complex global atmospheric model  , EGU General Assembly 2026, Vienna, Austria, 3–8 May 2026, EGU26-6794, https://doi.org/10.5194/egusphere-egu26-6794, 2026.

In situ cloud measurements are essential for understanding atmospheric processes and establishing a reliable ground truth. Obtaining these data is rarely straightforward. Challenges range from accessing clouds in the first place to ensuring that the instrument or environment does not bias the sample. This contribution explores several blunders and unexpected glitches encountered over fifteen years of field campaigns.

I will share stories of mountain top observations where blowing snow was measured instead of cloud ice crystals and the ambitious but failed attempt to use motorized paragliders for sampling. I also reflect on winter campaigns where the primary obstacles were flooding and mud rather than cold and snow. While these experiences were often frustrating, they frequently yielded useful data or led to new insights. One such example is the realization that drone icing is not just a crash risk but can also serve as a method for measuring liquid water content. By highlighting these setbacks and the successful data that emerged despite them, I aim to foster a discussion on the value of trial and error and persistence in atmospheric physics.

How to cite: Henneberger, J.: How Not to Measure a Cloud: Lessons from Fifteen Years of Fieldwork Failures, EGU General Assembly 2026, Vienna, Austria, 3–8 May 2026, EGU26-8228, https://doi.org/10.5194/egusphere-egu26-8228, 2026.

EGU26-8359 | ECS | Posters on site | EOS4.4

Do trees save lives under climate change? It’s complicated  

Nils Hohmuth, Nora L. S. Fahrenbach (presenting), Yibiao Zou (presenting), Josephine Reek, Felix Specker, Tom Crowther, and Constantin M. Zohner

Forests are powerful climate regulators: Their CO2 uptake provides a global biogeochemical cooling effect, and in the tropics, this cooling is further strengthened by evapotranspiration. Given that temperature-related mortality is a relevant global health burden, which is expected to increase under climate change, we set out to test what we thought was a promising hypothesis: Can forests reduce human temperature-related mortality from climate change? 

To test this, we used simulated temperature changes to reforestation from six different Earth System Models (ESMs) under a future high-emission scenario, and paired them with age-specific population data and three methodologically different temperature-mortality frameworks (Cromar et al. 2022, Lee et al. 2019, and Carleton et al. 2022). We expected to find a plausible range of temperature-related mortality outcomes attributable to global future forests conservation efforts.

Instead, our idea ran head-first into a messy reality. Firstly, rather than showing a clear consensus, the ESMs produced a wide range of temperature responses to reforestation, varying both in magnitude and sign. This is likely due to the albedo effect, varying climatological tree cover and land use processes implemented by the models, in addition to internal variability which we could not reduce due to the existence of only one ensemble member per model. Consequently, the models disagreed in many regions on whether global forest conservation and reforestation would increase or decrease temperature by the end of the century.

The uncertainties deepened when we incorporated the mortality data. Mortality estimates varied by up to a factor of 10 depending on the ESM and mortality framework used. Therefore, in the end, the models could not even agree on whether forests increased or decreased temperature-related mortality. We found ourselves with a pipeline that amplified uncertainties of both the ESM and mortality datasets.

For now, the question remains wide open: Do trees save us from temperature-related deaths in a warming world, and if so, by how much?


* The first two authors contributed equally to this work.

How to cite: Hohmuth, N., Fahrenbach (presenting), N. L. S., Zou (presenting), Y., Reek, J., Specker, F., Crowther, T., and Zohner, C. M.: Do trees save lives under climate change? It’s complicated , EGU General Assembly 2026, Vienna, Austria, 3–8 May 2026, EGU26-8359, https://doi.org/10.5194/egusphere-egu26-8359, 2026.

EGU26-10401 | ECS | Orals | EOS4.4

The empty mine: Why better tools do not help you find new diamonds 

Ralf Loritz, Alexander Dolich, and Benedikt Heudorfer

Hydrological modelling has long been shaped by a steady drive toward ever more sophisticated models. In the era of machine learning, this race has turned into a relentless pursuit of complexity: deeper networks and ever more elaborate architectures that often feel outdated by the time the ink on the paper is dry. Motivated by a genuine belief in methodological progress, I, like many others, spent considerable effort exploring this direction, driven by the assumption that finding the “right” architecture or model would inevitably lead to better performance. This talk is a reflection on that journey; you could say my own Leidensweg. Over several years, together with excellent collaborators, I explored a wide range of state-of-the-art deep-learning approaches for rainfall–runoff modelling and other hydrological modelling challenges. Yet, regardless of the architecture or training strategy, I repeatedly encountered the same performance ceiling. In parallel, the literature appeared to tell a different story, with “new” models regularly claiming improvements over established baselines. A closer inspection, however, revealed that rigorous and standardized benchmarking is far from common practice in hydrology, making it difficult to disentangle genuine progress from artefacts of experimental design. What initially felt like a failure to improve my models turned out to be a confrontation with reality. The limiting factor was not the architecture, but the problem itself. We have reached a point where predictive skill is increasingly bounded by the information content of our benchmark datasets and maybe more importantly by the way we frame our modelling challenges, rather than by model design. Like many others, I have come to believe that if we want to move beyond the current performance plateau, the next breakthroughs are unlikely to come from ever more complex models alone. Instead, as a community, we need well-designed model challenges, better benchmarks, and datasets that meaningfully expand the information available to our models to make model comparisons more informative.

How to cite: Loritz, R., Dolich, A., and Heudorfer, B.: The empty mine: Why better tools do not help you find new diamonds, EGU General Assembly 2026, Vienna, Austria, 3–8 May 2026, EGU26-10401, https://doi.org/10.5194/egusphere-egu26-10401, 2026.

EGU26-13630 | ECS | Orals | EOS4.4

How NOT to identify streamflow events? 

Larisa Tarasova and Paul Astagneau

Examining catchment response to precipitation at event scale is useful for understanding how various hydrological systems store and release water. Many of such event scale characteristics, for example event runoff coefficient and event time scale are also important engineering metrics used for design. However, deriving these characteristics requires identification of discrete precipitation-streamflow events from continuous hydrometeorological time series.

Event identification is not at all a trivial task. It becomes even more challenging when working with very large datasets that encompass a wide range of spatial and temporal dynamics. Approaches range from visual expert judgement to baseflow-separation-based methods and objective methods based on the coupled dynamics of precipitation and streamflow. Here, we would like to present our experience in the quest to devise the “ideal” method for large datasets – and trust us, we tried, a lot. We demonstrate that expert-based methods can be seriously flawed simply by changing a few meta parameters, such as the length of displayed periods, baseflow-separation-based methods deliver completely opposite results when different underlying separation methods are selected, and objective methods suddenly fail when dynamics with different temporal scales are simultaneously present.

Ultimately, we realized that finding a one-size-fits-all method was not possible and that compromises had to be made to select sufficiently representative events across large datasets. Therefore, we advocate for pragmatic case-specific evaluation criteria and for transparency in event identification to make study results reproducible and fit for purpose, if not perfect.

How to cite: Tarasova, L. and Astagneau, P.: How NOT to identify streamflow events?, EGU General Assembly 2026, Vienna, Austria, 3–8 May 2026, EGU26-13630, https://doi.org/10.5194/egusphere-egu26-13630, 2026.

EGU26-14148 | Orals | EOS4.4 | Highlight

Buggy benefits of more fundamental climate models 

Bjorn Stevens, Marco Giorgetta, and Hans Segura

A defining attribute of global-storm resolving models is that modelling is replaced by simulation.  In addition to overloading the word “model”  this avails the developer of a much larger variety of tests, and brings about a richer interplay with their intuition.  This has proven helpful in identifying and correcting many mistakes in global-storm resolving models that traditional climate models find difficult to identify, and usually compensate by “tuning.”  It also means that storm-resolving models are built and tested in a fundamentally different way than are traditional climate models. In this talk I will review the development of ICON as a global storm resolving model to illustrate how this feature, of trying to simulate rather than model the climate system, has helped identify a large number of long-standing bugs in code bases inherited from traditional models; how this can support open development; and how sometimes these advantages also prove to be buggy.

How to cite: Stevens, B., Giorgetta, M., and Segura, H.: Buggy benefits of more fundamental climate models, EGU General Assembly 2026, Vienna, Austria, 3–8 May 2026, EGU26-14148, https://doi.org/10.5194/egusphere-egu26-14148, 2026.

EGU26-14374 | Orals | EOS4.4

The dangerous temptation of optimality in hydrological and water resources modelling 

Thorsten Wagener and Francesca Pianosi

Hydrological and water systems modelling has long been driven by the search for better models. We do so by searching for models or at least parameter combinations that provide the best fit to given observations. We ourselves have contributed to this effort by developing new methods and by publishing diverse case studies. However, we repeatedly find that searching for and finding an optimal model is highly fraught in the presence of unclear signal-to-noise ratios in our observations, of incomplete models and of highly imbalanced databases. We present examples of our own work through which we have realized that achieving optimality was possible but futile unless we give equal consideration to issues of consistency, robustness and problem framing. We argue here that the strong focus on optimality continues to be a hindrance for advancing hydrologic science and for transferring research achievements into practice – probably more so than in other areas of the geosciences.

How to cite: Wagener, T. and Pianosi, F.: The dangerous temptation of optimality in hydrological and water resources modelling, EGU General Assembly 2026, Vienna, Austria, 3–8 May 2026, EGU26-14374, https://doi.org/10.5194/egusphere-egu26-14374, 2026.

Among soil physical analyses, determination of the soil particle-size distribution (PSD) is arguably the most fundamental. The standard methodology combines sieve analysis for sand fractions with sedimentation-based techniques for silt and clay. Established sedimentation methods include the pipette and hydrometer techniques. More recently, the Integral Suspension Pressure (ISP) method has become available, which derives PSD by inverse modeling of the temporal evolution of suspension pressure measured at a fixed depth in a sedimentation cylinder. Since ISP is based on the same physical principles as the pipette and hydrometer methods, their results should, in principle, agree.

The ISP methodology has been implemented in the commercial instrument PARIO (METER Group, Munich). While elegant, the method relies on pressure change measurements with a resolution of 0.1 Pa (equivalent to 0.01 mm of water column). Consequently, the PARIO manual strongly advises avoiding any mechanical disturbance such as thumping, bumping, clapping, vibration, or other shock events. This warning is essentially precautionary, because to date no systematic experimental investigation of such disturbances has been reported.

To explore this issue, we prepared a single 30 g soil sample following standard PSD procedures and subjected it to 26 PARIO repeated measurement runs over a period of five months, each run lasting 12 h. Between runs, the suspension was remixed but otherwise not altered. The first ten runs (over ten days) were conducted without intentional disturbance to establish baseline repeatability. This was followed by eight runs with deliberately imposed and timed disturbances that generated single or repeated vibrations (“rocking and shocking”). After approximately two and five months, we conducted additional sets of five and three undisturbed runs, respectively.

We report how these mechanical disturbances, along with temperature variations during measurement and the time elapsed since sample pre-treatment, affected the derived PSD. The results provide a first quantitative assessment of how fragile—or robust—the ISP method and PARIO system really are when reality refuses to sit perfectly still.


How to cite: Nemes, A. and Durner, W.: Rocking and Shocking the PARIOTM: How Sensitive Is ISP-Based Particle-Size Analysis to Mechanical Disturbance?, EGU General Assembly 2026, Vienna, Austria, 3–8 May 2026, EGU26-14763, https://doi.org/10.5194/egusphere-egu26-14763, 2026.

EGU26-14852 | Posters on site | EOS4.4

Some Norwegian soils behave differently: is it an inheritance from marine sedimentation? 

Attila Nemes, Pietro Bazzocchi, Sinja Weiland, and Martine van der Ploeg

Predicting soil hydraulic behavior is necessary for the modeling of catchments and agricultural planning, particularly for a country like Norway where only 3% of land is suitable for farming. Soil texture is an important and easily accessible parameter for the prediction of soil hydraulic behavior. However, some Norwegian farmland soils, which formed as glacio-marine sediments and are characterized by a medium texture, have shown the hydraulic behavior of heavy textured soils. Coined by the theory behind well-established sedimentation-enhancing technology used in waste water treatment, we hypothesized that sedimentation under marine conditions may result in specific particle sorting and as a result specific pore system characteristics. To test this, we designed four custom-built devices to produce artificially re-sedimented columns of soil material to help characterize the influence of sedimentation conditions. We successfully produced column samples of the same homogeneous mixture of fine-sand, silt, and clay particles obtained by physically crushing and sieving (< 200 µm) subsoil material collected at the Skuterud catchment in South-East Norway, differing only in sedimentation conditions (deionized water vs 35 g per liter NaCl solution). Then, the inability of standard laboratory methods to measure the saturated hydraulic conductivity of such fine material, led us to “MacGyver” (design and custom-build) two alternative methodologies to measure that property, i.e. i) by adapting a pressure plate extractor for a constant head measurement and ii) by building a 10 m tall pipe-system in a common open area of the office, in order to increase the hydraulic head on the samples. There was a learning curve with both of those methods, but we have found that the salt-water re-sedimented columns were about five times more permeable than the freshwater ones, which was the complete opposite of our expectations. However, an unexpected blunder in the conservation of our samples suggests that our hypothesis should be further explored rather than dismissed. These contributions hint about the mechanisms that may underlie the anomalous hydraulic behaviour of certain Norwegian soils and raise new questions on the formation of marine clays, improving knowledge available for land managers and modellers.


How to cite: Nemes, A., Bazzocchi, P., Weiland, S., and van der Ploeg, M.: Some Norwegian soils behave differently: is it an inheritance from marine sedimentation?, EGU General Assembly 2026, Vienna, Austria, 3–8 May 2026, EGU26-14852, https://doi.org/10.5194/egusphere-egu26-14852, 2026.

EGU26-16619 | Orals | EOS4.4

The unknown knowns – the inconvenient knowledge in hydrogeology we do not like to use 

Okke Batelaan, Joost Herweijer, Steven Young, and Phil Hayes

“It is in the tentative stage that the affections enter with their blinding influence. Love was long since represented as blind…The moment one has offered an original explanation for a phenomenon which seems satisfactory, that moment affection for his intellectual child springs into existence…To guard against this, the method of multiple working hypotheses is urged. … The effort is to bring up into view every rational explanation of new phenomena, and to develop every tenable hypothesis respecting their cause and history. The investigator thus becomes the parent of a family of hypothesis: and, by his parental relation to all, he is forbidden to fasten his affections unduly upon any one” (Chamberlin, 1890).

The MADE (macro-dispersion) natural-gradient tracer field experiments were conducted more than 35 years ago. It aimed to determine field-scale dispersion parameters based on detailed hydraulic conductivity measurements to support transport simulation. A decade of field experiments produced a 30-year paper trail of modelling studies with no clear resolution of a successful simulation approach for practical use in transport problems.  As a result, accurately simulating contaminant transport in the subsurface remains a formidable challenge in hydrogeology.

What went awry, and why do we often miss the mark?

Herweijer et al. (2026) conducted a ‘back to basics’ review of the original MADE reports and concluded that there are significant inconvenient and unexplored issues that influenced the migration of the tracer plume and or biased observations. These issues include unreliable measurement of hydraulic conductivity, biased tracer concentrations, and underestimation of sedimentological heterogeneity and non-stationarity of the flow field. Many studies simulating the tracer plumes appeared to have ignored, sidestepped, or been unaware of these issues, raising doubts about the validity of the results.

Our analysis shows that there is a persistent drive among researchers to conceptually oversimplify natural complexity to enable testing of single-method modelling, mostly driven by parametric stochastic approaches. Researchers tend to be anchored to a specialised, numerically driven methodology and have difficulty in unearthing highly relevant information from ‘unknown known’ data or applying approaches outside their own specialised scientific sub-discipline. Another important aspect of these ‘unkowns knowns’ is the tendency to accept published data verbatim. Too often, there is no rigorous investigation of the original measurement methods and reporting, and, if need be, additional testing to examine the root cause of data issues.

Following the good old advice of Chamberlin (1890), we used a knowledge framework to systematically assess knowns, unknowns, and associated confidence levels, yielding a set of multi-conceptual models. Based on identified 'unknowns', these multi-models can be tested against reliable 'knowns' such as piezometric data and mass balance calculations.  

Chamberlin, T.C., 1890, The method of multiple working hypotheses. Science 15(366): 92-96. doi:10.1126/science.ns-15.366.92.

Herweijer J.C., S. C Young, P. Hayes, and O. Batelaan, 2026, A multi-conceptual model approach to untangling the MADE experiment, Accepted for Publication in Groundwater.

How to cite: Batelaan, O., Herweijer, J., Young, S., and Hayes, P.: The unknown knowns – the inconvenient knowledge in hydrogeology we do not like to use, EGU General Assembly 2026, Vienna, Austria, 3–8 May 2026, EGU26-16619, https://doi.org/10.5194/egusphere-egu26-16619, 2026.

EGU26-17373 | Posters on site | EOS4.4

The Hidden Propagator: How Free-Slip Boundaries Corrupt 3D Simulations 

Laetitia Le Pourhiet

Free-slip boundary conditions are routinely used in 3D geodynamic modelling because they reduce computational cost, avoid artificial shear zones at domain edges, and simplify the implementation of large-scale kinematic forcing. However, despite their apparent neutrality, our experiments show that free-slip boundaries systematically generate first-order artefacts that propagate deep into the model interior and can severely distort the interpretation of continental rifting simulations.

Here we present a set of 3D visco-plastic models inspired by the South China Sea (SCS) that were originally designed to study the effect of steady-state thermal inheritance and pluton-controlled crustal weakening. Unexpectedly, in all simulations except those with a very particular inverted rheological profile (POLC), the free-slip boundary on the “Vietnam side” of the domain generated a persistent secondary propagator, producing unrealistic amounts of lithospheric thinning in the southwest corner. This artefact appeared irrespective of crustal rheology, seeding strategy, or the presence of thermal heterogeneities.

We identify three systematic behaviours induced by free-slip boundaries in 3D:
(1) forced rift nucleation at boundary-adjacent thermal gradients,
(2) artificial propagator formation that competes with the intended first-order rifting, and
(3) rotation or shearing of micro-blocks not predicted by tectonic reconstructions.

These artefacts originate from the inability of free-slip boundaries to transmit shear traction, which artificially channels deformation parallel to the boundary when lateral thermal or mechanical contrasts exist. In 3D, unlike in 2D, the combination of oblique extension and boundary-parallel velocity freedom leads to emergent pseudo-transform behaviour that is entirely numerical.

Our results highlight a key negative outcome: free-slip boundaries cannot be assumed neutral in 3D rift models, especially when studying localisation, obliquity, multi-propagator dynamics, or the competition between structural and thermal inheritance. We argue that many published 3D rift models may unknowingly include such artefacts.


How to cite: Le Pourhiet, L.: The Hidden Propagator: How Free-Slip Boundaries Corrupt 3D Simulations, EGU General Assembly 2026, Vienna, Austria, 3–8 May 2026, EGU26-17373, https://doi.org/10.5194/egusphere-egu26-17373, 2026.

EGU26-18600 | Posters on site | EOS4.4

Data Disaster to Data Resilience: Lessons from CEDA’s Data Recovery  

Edward Williamson, Matt Pritchard, Alan Iwi, Sam Pepler, and Graham Parton

On 18 November 2025, a small error during internal data migration of between storage systems of the JASMIN data analysis platform in the UK led to a substantial part of the CEDA Archive being made temporarily unavailable online (but not lost!). The unfortunate incident caused serious disruption to a large community of users (and additional workload and stress for the team), it provided important learning points for the team in terms of:  

  • enhancing data security,  
  • importance of mutual support among professional colleagues,  
  • the value of clear and transparent communications with your users 
  • a unique opportunity to showcase the capabilities of a cutting-edge digital research infrastructure in the recovery and return to service with this “unscheduled disaster recovery exercise”. 


We report on the circumstances leading to the incident, the lessons learned, and the technical capabilities employed in the recovery. One example shows, nearly 800 Terabytes of data transferred from a partner institution in the USA in just over 27 hours, at a rate of over 8 Gigabytes per second using Globus. The ability to orchestrate such a transfer is the result of many years of international collaboration to support large-scale environmental science, and highlights the benefits of a federated, replicated data infrastructure built on well-engineered technologies.

How to cite: Williamson, E., Pritchard, M., Iwi, A., Pepler, S., and Parton, G.: Data Disaster to Data Resilience: Lessons from CEDA’s Data Recovery , EGU General Assembly 2026, Vienna, Austria, 3–8 May 2026, EGU26-18600, https://doi.org/10.5194/egusphere-egu26-18600, 2026.

EGU26-19755 | ECS | Posters on site | EOS4.4

Opposite cloud responses to extreme Arctic pollution: sensitivity to cloud microphysics, or a bug? 

Rémy Lapere, Ruth Price, Louis Marelle, Lucas Bastien, and Jennie Thomas

Aerosol-cloud interactions remain one of the largest uncertainties in global climate modelling. This uncertainty arises because of the dependence of aerosol-cloud interactions on many tightly coupled atmospheric processes; the non-linear response of clouds to aerosol perturbations across different regimes; and the challenge of extracting robust signals from noisy meteorological observations. The problem is particularly acute in the Arctic, where sparse observational coverage limits model constraints, pristine conditions can lead to unexpected behaviour, and key processes remain poorly understood.

A common way to tackle the challenge of uncertainties arising from aerosol-cloud interactions in climate simulations is to conduct sensitivity experiments using cloud and aerosol microphysics schemes based on different assumptions and parameterisations. By comparing these experiments, key results can be constrained by sampling the range of unavoidable structural uncertainties in the models. Here, we apply this approach to a case study of an extreme, polluted warm air mass in the Arctic that was measured during the MOSAiC Arctic expedition in 2020. We simulated the event in the WRF-Chem-Polar regional climate model both with and without the anthropogenic aerosols from the strong pollution event to study the response of clouds and surface radiative balance. To understand the sensitivity of our results to the choice of model configuration, we tested two distinct, widely-used cloud microphysics schemes.

Initial results showed that the two schemes simulated opposite cloud responses: one predicted a surface cooling from the pollution that was reasonably in line with our expectations of the event, while the other predicted the opposite behaviour in the cloud response and an associated surface warming. These opposing effects seemed to suggest that structural uncertainties in the two schemes relating to clean, Arctic conditions was so strong that it even obscured our ability to understand the overall sign of the surface radiative response to the pollution.

However, since significant model development was required to couple these two cloud microphysics schemes to the aerosol fields in our model, there was another explanation that we couldn’t rule out: a bug in the scheme that was producing the more unexpected results. In this talk, we will explore the challenges of simulating the Arctic climate with a state-of-the-art chemistry-climate model and highlight how examples like this underscore the value of our recent efforts to align our collaborative model development with software engineering principles and Open Science best practices.

How to cite: Lapere, R., Price, R., Marelle, L., Bastien, L., and Thomas, J.: Opposite cloud responses to extreme Arctic pollution: sensitivity to cloud microphysics, or a bug?, EGU General Assembly 2026, Vienna, Austria, 3–8 May 2026, EGU26-19755, https://doi.org/10.5194/egusphere-egu26-19755, 2026.

All statistical tools come with assumptions. Yet many scientists treat statistics like a collection of black-box methods without learning the assumptions. Here I illustrate this problem using dozens of studies that claim to show that solar variability is a dominant driver of climate. I find that linear regression approaches are widely misused among these studies. In particular, they often violate the assumption of ‘no autocorrelation’ of the time series used, though it is common for studies to violate several or all of the assumptions of linear regression. The misuse of statistical tools has been a common problem across all fields of science for decades. This presentation serves as an important cautionary tale for the Earth Sciences and highlights the need for better statistical education and for statistical software that automatically checks input data for assumptions.

How to cite: Steiger, N.: Pervasive violation of statistical assumptions in studies linking solar variability to climate, EGU General Assembly 2026, Vienna, Austria, 3–8 May 2026, EGU26-19776, https://doi.org/10.5194/egusphere-egu26-19776, 2026.

EGU26-20375 | ECS | Posters on site | EOS4.4

From Field to File: challenges and recommendations for handling hydrological data 

Karin Bremer, Maria Staudinger, Jan Seibert, and Ilja van Meerveld

In catchment hydrology, long-term data collection often starts as part of a (doctoral) research project. In some cases, the data collection continues on a limited budget, often using the field protocol and data management plan designed for the initial short-term project. Challenges and issues with the continued data collection are likely to arise, especially when there are multiple changes in the people involved. It is especially difficult for researchers who were not directly involved in the fieldwork to understand the data and must therefore rely on field notes and archived data. They then often encounter issues related to inconsistent metadata, such as inconsistent date-time formats and inconsistent or missing units, missing calibration files, and unclear file and processing script organization.

While the specific issues may sound very case-dependent, based on our own and other’s experiences from various research projects, it appears that many issues recur more frequently than one might expect (or be willing to admit). In this presentation, we will share our experiences with bringing spatially distributed groundwater level data collected in Sweden and Switzerland from the field to ready-to-use files. Additionally, we provide recommendations for overcoming the challenges during field data collection, data organization, documentation, and data processing using scripts. These include having a clear, detailed protocol for in the fieldwork and the data processing steps, and ensuring it is followed. Although protocols are often used, they are frequently not detailed enough or are not used as designed. The protocols might also not take into account the further use of the data, such as for hydrological modelling, beyond field collection. 

How to cite: Bremer, K., Staudinger, M., Seibert, J., and van Meerveld, I.: From Field to File: challenges and recommendations for handling hydrological data, EGU General Assembly 2026, Vienna, Austria, 3–8 May 2026, EGU26-20375, https://doi.org/10.5194/egusphere-egu26-20375, 2026.

In 2014 we developed the Wageningen Lowland Runoff Simulator (WALRUS), a conceptual rainfall-runoff model for catchments with shallow groundwater. Water managers and consultants were involved in model development. In addition, they sponsored the steps necessary for application: making an R package, user manual and tutorial, publishing these on GitHub and organising user days. WALRUS is now used operationally by several Dutch water authorities and for scientific studies in the Netherlands and abroad. When developing the model, we made certain design choices. Now, after twelve years of application in water management, science and education, we re-evaluate the consequences of those choices.

The lessons can be divided into things we learned about the model’s functioning and things we learned from how people use the model. Concerning the model’s functioning, we found that keeping the model representation close to reality has advantages and disadvantages. It makes it easy to understand what happens and why, but it also causes unrealistic expectations. Certain physically based relations hampered model performance because they contained thresholds, and deriving parameter values from field observations resulted in uncertainty and discussions about spatial representativeness.

Concerning the practical use, we found that the easy-to-use, open source R package with manual was indispensable for new users. Nearly all users preferred default options over the implemented user-defined functions to allow tailor-made solutions. Parameter calibration was more difficult than expected because the feedbacks necessary to simulate the hydrological processes in lowlands increase the risk of equifinality. In addition, lack of suitable discharge data for calibration prompted the request for default parameter values. Finally, the model was subject to unintended model use, sometimes violating basic assumptions and sometimes showing unique opportunities we had not thought of ourselves.

C.C. Brauer, A.J. Teuling, P.J.J.F. Torfs, R. Uijlenhoet (2014): The Wageningen Lowland Runoff Simulator (WALRUS): a lumped rainfall-runoff model for catchments with shallow groundwater, Geosci. Model Dev., 7, 2313-2332, doi:10.5194/gmd-7-2313-2014

How to cite: Brauer, C.: Re-evaluating the WALRUS rainfall-runoff model design after twelve years of application, EGU General Assembly 2026, Vienna, Austria, 3–8 May 2026, EGU26-21915, https://doi.org/10.5194/egusphere-egu26-21915, 2026.

EGU26-254 | Posters on site | GI2.2

Seeing the Winds Better: Simulated Videos of Defoliated Tree Motion Capture Extreme Wind Speeds 

Sai Kulkarni, John K. Hillier, Sarah L. Bugby, Timothy I. Marjoribanks, Daniel Bannister, and Jonny Higham

Extreme windstorms are among the costliest natural disasters in northwest Europe. Traditional wind measurement methods, while reliable, are limited by cost, installation complexity, and sparse spatial coverage, particularly in cluttered urban areas. Higher resolution approaches are therefore needed to monitor near-surface wind dynamics in complex settings.

Motion tracking in videos of foliated trees has reliably captured fine-scale wind variability, showing strong correlations with anemometer measurements, consistent gust estimates across reference objects, and strong temporal coherence; the present work introduces two major advances: (1) the first application of Visual Anemometry (VA) on videos generated from physics-based simulations of trees, and (2) a focus on defoliated trees, enabling mechanistic isolation of branch and trunk responses. Videos are generated from an elastically articulated body model simulating tree responses under mean wind speeds of 7-40 m s⁻¹ (25-144 km h⁻¹).

Results show that input wind speeds are reflected in kinematic tree responses ( = 0.8), and then that these tree motions are captured in wind speeds estimated from videos by VA (≈ 0.7). Distal and mid-canopy branches dominate the VA response, whereas the stem and inner branches provide only weak contributions, even though informative motion cues may occur anywhere in the canopy. These VA wind estimates were insensitive to camera orientation, confirming that estimation accuracy remains robust across horizontal viewpoints. In this work, we also explore the method's sensitivity to different camera parameters and assess its transferability across different conditions.

Using simulation-based defoliated trees, this work is a step towards a low-cost, scalable alternative to traditional methods, enabling improved detection of extreme gusts, fine-scale hazard mapping, and risk assessment for urban planning and insurance.

How to cite: Kulkarni, S., Hillier, J. K., Bugby, S. L., Marjoribanks, T. I., Bannister, D., and Higham, J.: Seeing the Winds Better: Simulated Videos of Defoliated Tree Motion Capture Extreme Wind Speeds, EGU General Assembly 2026, Vienna, Austria, 3–8 May 2026, EGU26-254, https://doi.org/10.5194/egusphere-egu26-254, 2026.

EGU26-1694 | Posters on site | GI2.2

Spruce and Peatland Responses Under Changing Environments (SPRUCE) - 10 years of data collection 

Misha Krassovski, Melanie Mayes, Terri Velliquette, Tom Ruggles, Paul Hanson, and Jeff Riggs

The SPRUCE experiment is the primary component of the Terrestrial Ecosystem Science Scientific Focus Area at ORNL focused on terrestrial ecosystems and the mechanisms that underlie their responses to environmental change. As of December 2025, the SPRUCE experiment is ending its planned decadal timeframe. The manipulation evaluated the response of the existing biological communities to a range of warming levels from ambient to +9°C, provided via large, modified open-top chambers. The ambient and +9°C warming treatments were also conducted at eCO2 (in the range of 800 to 900 ppm). Both direct and indirect effects of these experimental perturbations have been analyzed to develop and refine models needed for full Earth system analyses. The instruments and infrastructure needed for these measurements include meteorological tower-based CO2/H2O sampling and analysis systems, air temperature and relative humidity probes, precipitation gauges, wind speed and direction instruments, solar radiation sensors, subsurface soil moisture and temperature sensors, water level and conductivity sensors, continuous vegetation sap flow and dendrometer sensors, and companion dataloggers to record and report the data. The data collection system deployed of approximately 80 dataloggers, 1100 sensors, and associated instruments. Through the 10 years of observations, we collected substantial amount of data and want to present variety of data product available for analysis and scientific investigation. 

How to cite: Krassovski, M., Mayes, M., Velliquette, T., Ruggles, T., Hanson, P., and Riggs, J.: Spruce and Peatland Responses Under Changing Environments (SPRUCE) - 10 years of data collection, EGU General Assembly 2026, Vienna, Austria, 3–8 May 2026, EGU26-1694, https://doi.org/10.5194/egusphere-egu26-1694, 2026.

High spatiotemporal monitoring of near-surface precipitation phase (N-SPP) is essential for weather forecasting, transportation, agriculture, and hydrology. However, operational capability remains constrained as manual observations are being phased out, in situ surface instruments are sparse and often lack representativeness, and discrepancies persist between aloft phase estimates from radar/satellite and actual conditions at the ground. Recent studies have also reported an “upper-limit” effect in radar-based N-SPP products, further underscoring the need for low-cost, automated, and scalable alternatives.

Urban surveillance cameras are ubiquitous in modern cities and continuously capture near-surface scenes at high temporal resolution. As precipitation particles traverse the camera field of view, the resulting videos inherently preserve rich visual–temporal signatures of hydrometeors, providing a viable basis for visually discriminating precipitation phases. Moreover, leveraging existing camera infrastructures requires no dedicated sensor deployment, making camera sensor networks a cost-effective solution for high-resolution N-SPP monitoring. Nevertheless, reliably distinguishing common N-SPP types (i.e., rain, snow, and graupel) in unconstrained videos remains challenging due to subtle inter-class differences and strong sensitivities to illumination changes, complex backgrounds, camera settings, and wind-driven trajectories.

Our previous study (Wang et al., 2025) demonstrated the feasibility of using urban surveillance cameras for N-SPP monitoring. Guided by meteorological, optical, and imaging principles, we identified discriminative cues from both daytime and nighttime videos and developed an efficient framework that couples MobileNetV2-based transfer learning for spatial feature extraction with GRU-based temporal modeling. Using a self-curated 94-hour surveillance video dataset and benchmarking against 24 baseline methods, the proposed approach achieved the best overall performance, with accuracies of 0.9677 on the dataset and 0.9301 in real-world field validation against manually quality-controlled 2DVD measurements. The model also remained stable under variations in camera settings and across day–night conditions, and exhibited satisfactory wind robustness for wind speeds below 5 m/s.

Building on these results, we further move toward operational, city-scale deployment by discussing key challenges in multi-camera collaborative observing, including camera siting and field-of-view geometric constraints, automated camera screening and tiered selection, and quality-control/anomaly-detection procedures to address occlusion, glare, raindrop adhesion or wiper interference, stream frame loss, and camera-parameter drift. These discussions provide practical guidance for constructing a stable and reliable surveillance camera–based N-SPP monitoring network.


Reference:

Wang, X., Zhao, K., Huang, H., Zhou, A., & Chen, H. (2025). Surveillance camera-based deep learning framework for high-resolution ground hydrometeor phase observation. Atmospheric Measurement Techniques Discussions, 2025, 1-38.

How to cite: Wang, X., Zhao, K., and Yang, Z.: Surveillance Camera Sensor Networks: An Emerging Observing System for Near-Surface Precipitation Phase Monitoring, EGU General Assembly 2026, Vienna, Austria, 3–8 May 2026, EGU26-2076, https://doi.org/10.5194/egusphere-egu26-2076, 2026.

EGU26-3864 | Orals | GI2.2

Expansion of UFP measuring capabilities of the Dutch National Air Quality Monitoring Network 

Anneke Batenburg, Joost Wesseling, Dirk Wever, Sjoerd van Ratingen, Ernie Weijers, and Guus Stefess

The health effects of ultrafine particles (UFP) have come under increased scrutiny. In 2021, the Health Council of the Netherlands published the advisory report “Risks of ultrafine particles in the outside air”, which highlighted that our knowledge of UFP exposure and health effects is limited by a lack of structural measurements of UFP concentrations in the Netherlands. The report therefore recommended

  • measuring UFP concentrations structurally in the Dutch National Air Quality Monitoring Network and
  • performing structural and validated model calculations to obtain a national overview of UFP exposure.

At the subsequent request of the Ministry of Infrastructure and Water Management, RIVM made an inventory of available data, knowledge and measurement equipment, and developed integrated strategies for incorporating structural UFP measurements into the national network and improving UFP models.

The National Air Quality Monitoring Network currently performs indicative UFP measurements with three TSI EPC 3783 instruments. Diurnal and weekly cycles can already be observed in these indicative data, and they have been used to scale an updated empirical map of average UFP concentrations in the Netherlands as well. On a project base, short-term measurements of UFP are performed using more compact equipment.

Newer counting equipment (TSI CPC 3750-CEN10) has been purchased recently to perform stationary UFP concentration measurements according to the latest technical standard (EN 16976:2024). The locations where the new measurement equipment will be placed are selected with the specific aim to improve the yearly average concentration map and obtain better estimates for the exposure of the Dutch population to UFP. The data will be made available to the public.

This presentation will discuss the progress so far, first experiences with the new equipment and next steps, including steps required for compliance with the new EU Air Quality Directive.

How to cite: Batenburg, A., Wesseling, J., Wever, D., van Ratingen, S., Weijers, E., and Stefess, G.: Expansion of UFP measuring capabilities of the Dutch National Air Quality Monitoring Network, EGU General Assembly 2026, Vienna, Austria, 3–8 May 2026, EGU26-3864, https://doi.org/10.5194/egusphere-egu26-3864, 2026.

EGU26-4030 | Orals | GI2.2

From rapid assessment to real-time warning: short-term rockfall monitoring along the Route d’Anniviers (Valais, Switzerland) 

stéphane vincent, maxence carrel, theo st.pierre, jonas vonwartburg, olafur stitelmann, and janine wetter

From rapid assessment to real-time warning: short-term rockfall monitoring along the Route d’Anniviers (Valais, Switzerland)


The Val d’Anniviers is one of the major valleys of the canton of Valais in Switzerland. Well known for its winter sports opportunities and for the villages of Grimentz and Zinal, the valley is accessible by a vertiginous road exposed to a wide range of gravitational hazards. Though the Route d’Anniviers is protected by multiple galleries, severe events can still impact the road.In March 2024, a series of rockfalls led to heavy accumulation of debris atop a road gallery at the entrance of the valley. A week later, on 29 March, bigger blocks hit the road and perforated the gallery. To avoid complete isolation, an alternative route estimated to be less safe was used from the other side of the valley. In this context, real-time monitoring became essential to support decision-making and rapid response during emergency operations and gallery rehabilitation. A first emergency phase focused on rapid assessment: Geoprevent was mandated by the local authorities to deploy an interferometric radar to monitor and accurately assess the area above the Croisettes sector (near Vissoie) and check whether significant movement was ongoing. Early observations suggested only limited changes. This initial phase helped establish shared situational awareness and informed the next steps toward an operational warning setup. An alarm system was then needed to be installed to increase the safety of workers during the gallery renovation, as well as to contribute to a longer-term mitigation plan. Geoprevent was mandated on 10 April by the local authorities and installed a rockfall Doppler radar on 22 April. This technology enables real-time detection of rockfall activity. The radar was coupled with traffic lights and alarm horns, allowing rapid road closure and immediate on-site warning in case of events. SMS and email alerts complement local signaling, and both radar data and live footage from a pan-tilt-zoom remotely controllable camera are available through Geoprevent’s online data portal for remote supervision and event review. This contribution  presents the phased monitoring and warning approach implemented at Vissoie—from rapid assessment to operational warning system —and discusses lessons learned for short-term monitoring, emergency installation, data interpretation, and reliable alerting to insure road and people safety in a complex environment.

How to cite: vincent, S., carrel, M., st.pierre, T., vonwartburg, J., stitelmann, O., and wetter, J.: From rapid assessment to real-time warning: short-term rockfall monitoring along the Route d’Anniviers (Valais, Switzerland), EGU General Assembly 2026, Vienna, Austria, 3–8 May 2026, EGU26-4030, https://doi.org/10.5194/egusphere-egu26-4030, 2026.

EGU26-4108 | Posters on site | GI2.2

The In-situ Sensing Facility: Agile Observation Networks for Field Campaign Success 

Jacquelyn Witte, William Brown, Holger Vömel, Christopher Roden, Sebastian Hoch, and Terry Hock

The National Center for Atmospheric Research (NCAR), funded by the US National Science Foundation, has been supporting field deployments for atmospheric research since the 1960s, with its Earth Observing Laboratory (EOL) coordinating large-scale programs. EOL’s In-situ Sensing Facility (ISF) was forged out of decades of instrument development, advances in technology and software, and an evolution of services and support in response to the changing landscape of research. Today, ISF has evolved into three measurement systems: (1) Airborne Vertical Atmospheric Profiling System - dropsonde technology, (2) Integrated Sounding System - combined in-situ and remote ground-based profiling instruments, and (3) Integrated Surface Flux System - suite of mesonet, turbulence and energy balance sensors mounted on scalable towers. These requestable observing systems are designed for scalability and flexibility, emphasizing sensor development and integration, data management, and robust deployments to remote or challenging locations. Observations from ISF's measurement systems have guided regional model and forecast development, supported boundary layer meteorology and turbulence studies, and enhanced our understanding of severe weather and convective processes. When configured together ISF forms the foundation of LOTOS (Lower Troposphere Observing System) - a proposed sensor network to sample fundamental state parameters vertically through the boundary layer and horizontally across the surrounding landscape to provide a wealth of data to advance process studies and model algorithm development. We present an overview of our facilities' instrument capabilities and the LOTOS concept. 

How to cite: Witte, J., Brown, W., Vömel, H., Roden, C., Hoch, S., and Hock, T.: The In-situ Sensing Facility: Agile Observation Networks for Field Campaign Success, EGU General Assembly 2026, Vienna, Austria, 3–8 May 2026, EGU26-4108, https://doi.org/10.5194/egusphere-egu26-4108, 2026.

EGU26-4925 | ECS | Posters on site | GI2.2

A Dual-Mode Expansion Cloud Chamber for Reproducible Laboratory Studies of Laser Propagation in Fog and Clouds 

Thomas Kociok, Kathrin Kociok, Dirk Seiffer, and Karin Stein
In this paper, we present the development of a portable expansion cloud chamber designed to investigate the interaction of high-power laser radiation (≥ 3 kW) with fog and cloud structures under controlled and reproducible laboratory conditions. The main aspects of the facility design, operating principles, and achievable atmospheric parameter ranges are discussed, with particular emphasis on controlled cloud and fog generation and optical propagation experiments.
The chamber employs a dual-mode adiabatic expansion concept, allowing both gradual pressure reduction using vacuum pumps and rapid decompression via a secondary pressure reservoir. This approach enables precise control of supersaturation conditions and reproducible formation of fog and cloud fields through controlled decompression.
The main chamber consists of a double-walled cylindrical vacuum vessel with an internal diameter of 2 m and a length of 10 m, integrated into a 45-foot container structure. The system covers a wide operational parameter space, including temperatures from −50 °C to +40 °C, relative humidity from 0 % to 100 %, and pressures between 100 and 1100 mbar. Homogeneous air mixing is achieved using multiple fan configurations, while configurable heating elements allow the generation of turbulent flow regimes. A dense and redundant sensor network provides real-time monitoring of thermodynamic, microphysical, and optical parameters at multiple locations within the chamber.
This experimental setup enables fundamental investigations of laser propagation, attenuation, and scattering in realistic atmospheric conditions. The facility provides a controlled platform for advancing the understanding of laser–atmosphere interactions and supports the development and validation of optical propagation models, with direct relevance for free-space optical and satellite communication systems.

How to cite: Kociok, T., Kociok, K., Seiffer, D., and Stein, K.: A Dual-Mode Expansion Cloud Chamber for Reproducible Laboratory Studies of Laser Propagation in Fog and Clouds, EGU General Assembly 2026, Vienna, Austria, 3–8 May 2026, EGU26-4925, https://doi.org/10.5194/egusphere-egu26-4925, 2026.

EGU26-5380 | ECS | Posters on site | GI2.2

Applicability of self-consistency calibration method for polarimetric cloud radars 

Renju Nandan and Christine Unal

Cloud radars are powerful tools for investigating cloud formation, radiative processes, and cloud microphysics. In recent years, polarimetric cloud radars have become increasingly common around the world. Since many cloud property retrieval techniques rely on accurately measured reflectivity, ensuring high-quality calibration is essential. The most widely used calibration approach is one based on disdrometer measurements, but this method carries significant uncertainties, particularly due to the vertical variability of rainfall characteristics. Another conventional method is the one based on point target observations, i.e. using hard targets such as corner and sphere reflectors (Toledo et al.,2020), but it is work intensive and difficult to carry out. Another method is the calibration transfer of a radar to those that are not calibrated yet (Jorquera et al.,2023) for e.g. BASTA radar in CCRES. The main disadvantage of the calibration transfer method is the high time consumption. Since the time needed to ship the reference radar to each location and carrying out the calibration is high, in a year maximum 2 or 3 radars can be calibrated. Another method of calibration is by comparison of observations by ground-based cloud radars and space-borne W-band radars in CloudSat and EarthCARE. EarthCARE (CloudSat) flight cycle of 25 (16) days and the requirement in pure ice nonprecipitating clouds during an overpass, makes this method mainly applicable for long-term calibration monitoring. To address all these limitations and complement in cloud radar calibration methods, A. Myagkov et al. (2020) introduced a self-consistency calibration technique that makes use of the polarization capabilities of W-band cloud radars. In this study, we assess the suitability of the self-consistency calibration method and identify the modifications required to make the approach more user-friendly and practical for operation.For this study, we have used 94 GHz cloud radar data operated at 300 elevation angle during days having rainfall rate less than 20 mm/hr. The methodology of self-consistency method consists of 4 steps. 1) Using Rayleigh Plateau detection method (Unal and van den Brule,2024), retrieve propagational (Kdp) and backscattering (δ) components from differential phase (φ) and, differential attenuation (Adp). 2) Calculate non-attenuated reflectivity Z0. 3) Calculate Kdp and Adp using Z0, δ and the coefficients given in A. Myagkov et al. (2020). 4) Compare the measured and calculated Kdp and Adp, and find the best fit for calibration coefficient.The major findings of this study are summarized as follows:1) A 30° elevation angle and rainfall rate below 20 mm/hr are not the only criteria required for applying the self-consistency method. The values of differential backscatter phase(δ) and Doppler spectrum width also play important roles. 2) The influence of surface temperature on the method has been examined.3)The criteria for selecting suitable cloud radar observations for the self-consistency calibration approach have been clearly identified.4)In addition to the calibration of reflectivity, the retrieval of the one-way attenuation profile is shown to be another significant output of the self-consistency calibration technique.


How to cite: Nandan, R. and Unal, C.: Applicability of self-consistency calibration method for polarimetric cloud radars, EGU General Assembly 2026, Vienna, Austria, 3–8 May 2026, EGU26-5380, https://doi.org/10.5194/egusphere-egu26-5380, 2026.

EGU26-5857 | ECS | Posters on site | GI2.2

Global evaluation of Pandonia Global Network total column water vapour using co-located AERONET and GRUAN observations 

Dan Weaver, Xiaoyi Zhao, Thomas Frost Hanisco, Pawan Gupta, Alexander Cede, Martin Tiefengraber, Manuel Gebetsberger, and Michael Sommer

Improving measurements of atmospheric water vapour remains a priority for the atmospheric science community, including for evaluation of satellite retrievals. The Pandonia Global Network (PGN) provides long-term, high-temporal-resolution direct-sun observations of total-column water vapour at many sites worldwide, but the PGN H2O product has not yet been widely assessed against independent ground-based datasets across diverse conditions.

Here we present preliminary intercomparisons of PGN total-column water vapour with coincident AERONET sun-photometer retrievals at co-located sites, with additional context from comparisons to GRUAN-processed radiosonde profiles where available. We examine sensitivities to temporal matching and to factors such as solar zenith angle, season, and humidity regime and report initial network-wide and site-to-site statistics (bias, scatter, correlation).

How to cite: Weaver, D., Zhao, X., Hanisco, T. F., Gupta, P., Cede, A., Tiefengraber, M., Gebetsberger, M., and Sommer, M.: Global evaluation of Pandonia Global Network total column water vapour using co-located AERONET and GRUAN observations, EGU General Assembly 2026, Vienna, Austria, 3–8 May 2026, EGU26-5857, https://doi.org/10.5194/egusphere-egu26-5857, 2026.

In situ atmospheric particulate matter (PM) monitoring networks play a critical role in advancing understanding of air quality dynamics across local to regional scales by providing continuous, site-resolved observations. In contrast to short-term measurement campaigns, sustained monitoring networks enable the characterization of long-term trends, episodic events, and source-specific variability, while providing essential data for model validation and exposure assessment. These capabilities are especially useful in industrial environments, where emissions are spatially heterogeneous, temporally variable, and chemically complex.

We present the design and implementation of the Environmental Monitoring for Industrial Sites (ÉMIS) network, a ground-based, distributed system developed to monitor complex industrial emission environments. The network is designed to operate under challenging conditions, including high-latitude environments with extreme seasonal variability, limited access to grid power, and constrained connectivity. Each station integrates measurements of particulate matter across multiple size fractions (PM2.5, PM5, and PM10) and volatile organic compounds using low-cost optical sensors, local meteorology, and visual documentation via a conditionally triggered camera. Stations are additionally equipped with a modified Wilson and Cooke (MWAC) bottle sampler to collect long-term, sector-representative samples for chemical characterization.

Stations transmit data using long-range radio (LoRa) at user-defined intervals (e.g., two-minute resolution) to a hub node, which aggregates and relays data via cellular or satellite communication to an online dashboard. Unlike Bluetooth or Wi-Fi, LoRa enables kilometer-scale data transmission without the cost or infrastructure requirements of cellular modems. This architecture provides near–real-time insight into emission dynamics while supporting long-term data continuity. Emphasis on low-cost, modular instrumentation reduces financial and logistical barriers associated with traditional monitoring systems, enabling high-density deployments accessible to researchers, industries and public stakeholders.

The initial field deployment consisted of fifteen (15) stations distributed across a copper smelter in Quebec, Canada, spanning more than 1 km². This case study demonstrates the network’s ability to resolve spatial gradients and localized emission signals, while dealing with complex topography and climate conditions. Analysis reveals persistent PM hotspots associated with heavy machinery traffic, ore handling operations, and slag cooling. Periodic PM spikes linked to train transport, as well as clear relationships between wind speed, wind direction, and plume occurrence were identified.

The multi-level data output from the ÉMIS network supports a wide range of applications, including PM source attribution, evaluation of emission dynamics, integration with receptor and dispersion modeling, and validation of satellite-derived products. The network also serves as a testbed for sensor development, quality assurance refinement, and cross-network harmonization under real-world industrial conditions. This work highlights how adaptable, cost-effective ground-based monitoring networks can expand observational capacity in industrial environments and support advances in atmospheric science, air-quality management, and community-informed decision-making.

How to cite: King, J., Norris, E., and Hayes, P.: Environmental Monitoring for Industrial Sites (ÉMIS): A Distributed LoRa-based Network for Real-Time Particulate Matter Characterization in Complex Environments, EGU General Assembly 2026, Vienna, Austria, 3–8 May 2026, EGU26-13103, https://doi.org/10.5194/egusphere-egu26-13103, 2026.

EGU26-13621 | Orals | GI2.2

Preliminary Design of a Passive System for Monitoring Volcanic Emissions Exploiting Microwave GEO Satellite Downlinks  

Filippo Giannetti, Emanuele Maria Sciortino, Ottavia Gherardini, Fabiola Sapienza, and Alessandro Piras

Opportunistic sensing based on microwave satellite downlinks has recently gained attention as a cost‑effective approach for monitoring tropospheric phenomena, exploiting the attenuation experienced by communication signals as they propagate through the atmosphere. While this approach has been successfully applied to meteorological phenomena—particularly rainfall estimation using Ku‑band broadcasting links and, more recently, Ka‑band broadband services—its use for geophysical monitoring remains largely unexplored.  Volcanic emissions, in particular, release atmospheric constituents capable of significantly affecting microwave propagation through absorption and scattering, depending on particle size, concentration, and chemical composition. In regions surrounding active volcanoes, the interaction between ash, gases, and microwave signals offers an opportunity to detect eruptive activity using low‑cost ground receivers.

This work investigates the feasibility of using commercial satellite downlink signals to sense volcanic emissions in real time. The analysis considers the general interaction between microwave signals and volcanic constituents and examines how the Ku‑ and Ka‑band frequencies commonly used by GEO satellites provide different levels of sensitivity to these atmospheric components. Since these signals are continuously available over wide areas, they offer an attractive resource for passive and inexpensive monitoring.

A key aspect in assessing the feasibility of such opportunistic sensing is the geometry of the satellite–receiver link, which strongly influences the detectability of volcanic emissions. As matter of fact, the relative position of the satellite, the ground station, and the volcanic plume determines whether the microwave path intersects the cloud and at which altitude and distance from the vent this intersection occurs. In volcanic regions such as Mount Etna (Italy), the simultaneous visibility of multiple GEO satellites at different azimuths and elevations increases the likelihood that at least one downlink path crosses the plume, enabling the detection of its impact on the received signal.

This preliminary study provides thus a first assessment of the geometric and physical conditions under which satellite downlink signals can be exploited for volcanic emission detection.

The results suggest that existing broadcast satellite infrastructure could be leveraged also as a low‑cost, wide‑area monitoring system, complementing conventional geophysical instruments and motivating future experimental validation.

Acknowledgements: This work was supported by the following projects: Space It Up, funded by Italian Space Agency (ASI) and the Italian Ministry of University and Research (MUR) – Contract 2024-5-E.0 - CUP I53D24000060005; FoReLab (Departments of Excellence), funded by MUR.

How to cite: Giannetti, F., Sciortino, E. M., Gherardini, O., Sapienza, F., and Piras, A.: Preliminary Design of a Passive System for Monitoring Volcanic Emissions Exploiting Microwave GEO Satellite Downlinks , EGU General Assembly 2026, Vienna, Austria, 3–8 May 2026, EGU26-13621, https://doi.org/10.5194/egusphere-egu26-13621, 2026.

EGU26-13828 | Posters on site | GI2.2

The Quantum Gravimeter Network of the Canary Islands 

Luca D'Auria, Nemesio M. Pérez, Aarón Álvarez-Hernández, Sergio de Armas-Rillo, Rubén García-Hernández, Pablo López-Díaz, David M. van Dorth, Víctor Ortega-Ramos, Paul Bertier, Laura Faure, Romain Gautier, and Jérémie Richard

The island of Tenerife (Canary Islands) exhibits the highest volcanic risk in Spain, owing to its long volcanic history combined with high population density. Consequently, an effective volcanic early-warning system is essential to ensure the safety of both the island’s residents and the millions of tourists who visit each year. Tenerife already hosts one of the most advanced volcano monitoring programs worldwide, integrating permanent instrumental networks with periodic geophysical and geochemical surveys.

Continuous microgravity measurements have proven to be a sensitive and reliable tool for detecting changes in magmatic–hydrothermal systems that may remain undetected by other geophysical or geochemical techniques [1]. However, spring-based gravimeters are affected by instrumental drift, which can compromise the interpretation of long-term observations. Superconducting gravimeters, while offering the highest sensitivity, require complex liquid helium refrigeration systems, significantly limiting their operational deployment. In recent years, absolute quantum gravimeters have emerged as the state-of-the-art technology for microgravity monitoring [2]. Time series acquired at active volcanoes, such as Mount Etna [3], demonstrate that these instruments can detect and quantify subsurface mass redistributions associated with volcanic processes. Within the framework of the GEOFIS-CAN project, the Instituto Volcanológico de Canarias (INVOLCAN) has acquired three Exail AQG-A absolute quantum gravimeters to be deployed on Tenerife.

The volcanic system of Tenerife consists of a central caldera (Las Cañadas), which hosts the Teide–Pico Viejo volcanic complex and is characterized by both basaltic and phonolitic activity, and three radial dorsals dominated by fissural basaltic effusive eruptions. The central complex, as well as the northwestern (NW) and northeastern (NE) dorsals, have experienced eruptions within the last 500 years. The three AQG instruments will be installed at: (1) the NW dorsal (Santiago del Teide), the most volcanically active sector of the island; (2) the boundary between the Las Cañadas caldera and the NE dorsal (Izaña); and (3) the southern margin of the caldera (Vilaflor). This network geometry provides comprehensive coverage of all regions potentially affected by future eruptions. Moreover, it enables not only the detection but also the localization of subsurface mass changes within the volcanic edifice. Specifically, this configuration is sufficient to simultaneously and unambiguously constrain both the location and magnitude of the mass variations within the volcanic edifice.

In this work, we present a sensitivity analysis of the proposed gravimetric network configuration, together with preliminary results from the recorded dataset.


References

[1] de Zeeuw-van Dalfsen, E., & Poland, M. P. (2023). Microgravity as a tool for eruption forecasting. Journal of Volcanology and Geothermal Research, 442, 107910.

[2] Ménoret, V., Vermeulen, P., Le Moigne, N., Bonvalot, S., Bouyer, P., Landragin, A., & Desruelle, B. (2018). Gravity measurements below 10− 9 g with a transportable absolute quantum gravimeter. Scientific reports, 8(1), 12300.

[3] Antoni‐Micollier, L., Carbone, D., Ménoret, V., Lautier‐Gaud, J., King, T., Greco, F., ... & Desruelle, B. (2022). Detecting volcano‐related underground mass changes with a quantum gravimeter. Geophysical Research Letters, 49(13), e2022GL097814.

How to cite: D'Auria, L., Pérez, N. M., Álvarez-Hernández, A., de Armas-Rillo, S., García-Hernández, R., López-Díaz, P., M. van Dorth, D., Ortega-Ramos, V., Bertier, P., Faure, L., Gautier, R., and Richard, J.: The Quantum Gravimeter Network of the Canary Islands, EGU General Assembly 2026, Vienna, Austria, 3–8 May 2026, EGU26-13828, https://doi.org/10.5194/egusphere-egu26-13828, 2026.

Computing power network (CPN) is designed to utilize multi-dimensional resources to complete computing tasks. However, in practical applications, the CPN architecture has difficulty in coordinating cross-domain heterogeneous resources, making it impossible to achieve the real-time and high scalability requirements of computationally intensive and time-sensitive tasks such as levee piping hazard inspection via remote sensing in emergency scenarios. Based on this, we propose a communication and computation integrated network architecture, referred to as (Com)2INet, that integrates “sensing”, “transmission”, and “computation” phases. In the sensing phase, thermal infrared imagery is utilized to retrieve land surface temperature fields through radiative transfer mechanisms, providing a reliable foundation for visual segmentation of piping hazards. In the transmission phase, we adopt the designed multi-path transmission mechanism to promote the efficient data flow across heterogeneous networks. In the computation phase, the proposed SACM algorithm, which is functionally decomposed and implemented as service chains within the proposed network architecture, dynamically processes the retrieved temperature fields to achieve precise hazard identification. This integrated framework ensures seamless interaction between sensing, communication, and computation, addressing the challenges of real-time hazard detection in emergency scenarios.

How to cite: Chen, J.: Service-Chain-Driven Communication and Computing Integration Networking: A Case Study of Levee Piping Hazard Inspection via Remote Sensing, EGU General Assembly 2026, Vienna, Austria, 3–8 May 2026, EGU26-15440, https://doi.org/10.5194/egusphere-egu26-15440, 2026.

EGU26-17517 | Posters on site | GI2.2

A Low-Cost Image-Based Monitoring System for Automatic Rock Displacement Measurement Using YOLO 

Ruoshen Lin, Michel Jaboyedoff, Marc-Henri Derron, Aubin Laurent, and Antonin Chalé

Accurate monitoring of rock movement is essential for understanding rock slope instability and early failure mechanisms. However, conventional monitoring techniques often rely on manual measurements or expensive instrumentation, limiting their practicality for continuous and large-scale deployment. This study presents a low-cost image-based monitoring system that enables fully automatic measurement of rock displacement using a YOLOv8 pose estimation model. The proposed system was evaluated at the Miroir d’Argentine rock wall, a limestone rock flake in the Swiss Alps, Switzerland, using image data acquired from a Futuro BRW comparator monitored by a low-cost digital camera. The model was trained to detect the manual dial indicator and estimate pointer positions, allowing rock displacement to be derived automatically from pictures without manual intervention. To further assess the practical applicability of the proposed system, additional images acquired at different time periods were used for independent validation. The results demonstrate that the proposed approach can reliably estimate rock movement with high accuracy and strong generalization capability under real-world conditions. In addition, the robustness of the method was evaluated under simulated fog and blur degradations. The results show that the system maintains stable performance under light to moderate visual degradation, while performance decreases under severe fog and strong motion blur due to reduced geometric visibility. Overall, the proposed method provides an effective, low-cost, and practical solution for continuous rock movement monitoring and shows strong potential for long-term deployment in challenging alpine environments.

How to cite: Lin, R., Jaboyedoff, M., Derron, M.-H., Laurent, A., and Chalé, A.: A Low-Cost Image-Based Monitoring System for Automatic Rock Displacement Measurement Using YOLO, EGU General Assembly 2026, Vienna, Austria, 3–8 May 2026, EGU26-17517, https://doi.org/10.5194/egusphere-egu26-17517, 2026.

EGU26-18236 | Posters on site | GI2.2

Removal of temperature drift from tiltmeter recordings 

Stella Pytharouli and Chenchen Qiu

MEMS Tiltmeters are an effective tool in high-precision monitoring of ground and infrastructure but their sensitivity to temperature variations remains a challenge. This can be a prohibiting factor for their application in field monitoring of natural processes, despite the fact that tiltmeters are likely one of the very few technologies that can provide information on minute movements in real-time and at relatively low cost. Temperature drift, if not removed effectively, can completely mask small tilts or lead to wrong interpretations of the monitored process. Up until very recently, the tiltmeter response to temperature change was assumed to be instantaneous, but previous work by the authors has shown that there is a delay of varying duration between the two over time. We present a weighted least square (WLS) - based method that takes this dynamic change of time-lags into consideration. The time-series data is divided into a number of time-windows based on time-lag values, wherein windows with identical lags are grouped together. Time windows longer than a specified duration are subdivided based on an optimal window length. We describe a method for selecting the optimal window size applicable to different monitoring scenarios. Finally, an iteratively WLS is applied to produce values that best represent the temperature drift over time within each time window. To examine the impact of varying window sizes on results, a sensitivity analysis is performed using the Monte Carlo method, enabling the calculation of prediction intervals. Our approach provides a reliable framework for the removal of temperature drift from tiltmeter recordings, enabling the use of tiltmeters for the monitoring of subtle ground movements. This can be crucial for applications such as early warning systems for landslides and monitoring of the ground surface response to hydrological processes at depth.

How to cite: Pytharouli, S. and Qiu, C.: Removal of temperature drift from tiltmeter recordings, EGU General Assembly 2026, Vienna, Austria, 3–8 May 2026, EGU26-18236, https://doi.org/10.5194/egusphere-egu26-18236, 2026.

EGU26-20308 | Orals | GI2.2

Introducing a compact GC-PTR-TOF-MS: A novel method for the long-term monitoring of volatile organic compounds 

Megan Claflin, Urs Rohner, Vasyl Yatsyna, Brian Lerner, Augie Dobrecevich, Joel Thornton, Manjula Canagarantna, Felipe Lopez-Hilfiker, and John Jayne

Long-term, routine monitoring of volatile organic compounds (VOCs) is needed to provide insight into emission sources and patterns, oxidation processes including photochemistry and radical cycling, and the formation of tropospheric ozone and secondary organic aerosol. However, instrumentation that can provide high quality data both in terms of temporal resolution and molecular speciation has historically been cost-prohibitive, and requires advanced users for field deployment, operation, and data analysis.

While the use of proton transfer reaction mass spectrometry, paired with time-of-flight technology (PTR-TOF-MS), has been utilized for the detection of VOCs in a wide variety of environments and measurement platforms; this technique cannot provide molecular structure information and suffers from detection interferences such as fragmentation, cluster formation, and mixed ionization schemes that complicate data analysis and interpretation. Combining in situ gas chromatography (GC) with PTR-TOF-MS is a remedy, offering isomer level resolution and the ability to easily quantify product ion distributions to account for complex detection schemes. The addition of chromatographic pre-separation not only enhances the accuracy of species typically reported by PTR methods, it can also be used to broaden the scope of VOCs quantified using PTR methods, while maintaining low limits of detection (typically 1 ppt) without losing high time resolution data and negating the need for high mass resolving power.

Here, we present a new instrument package for the online, long-term detection of VOCs consisting of an in situ GC system equipped with an integrated thermal desorption (TD) system coupled to a compact PTR TOF-MS. The entire instrument is contained in a 50 x 65 x 55 cm footprint, weighs < 70 kg, and consumes < 600 W for typical operation. Coupling the GC system with the PTR-TOF allows the automated acquisition of both direct, high-time resolution data (e.g. 1 s) and pseudo-continuous molecular speciation data for isomer separation and improved quantification of the direct-PTR data.

A description of the instrument, including its utilization of a new VUV PTR ion source, will be presented along with > 4 weeks of continuous ambient data acquired in Spring 2025 in Thun, Switzerland. This data demonstrates the stability of the system and the value of continuous VOC detection with regular molecular speciation. This compact, easier to operate and maintain system makes it feasible to deploy this technology in many locations, including those with access limitations, for greater spatial resolution to acquire coinciding datasets to elucidate local, regional, and global VOC trends. 

The compact chemical ionization time-of-flight mass spectrometer (CI-TOF-MS) described, here utilizing proton transfer reaction (PTR) ionization, was developed with support from the Beckmann Foundation.

How to cite: Claflin, M., Rohner, U., Yatsyna, V., Lerner, B., Dobrecevich, A., Thornton, J., Canagarantna, M., Lopez-Hilfiker, F., and Jayne, J.: Introducing a compact GC-PTR-TOF-MS: A novel method for the long-term monitoring of volatile organic compounds, EGU General Assembly 2026, Vienna, Austria, 3–8 May 2026, EGU26-20308, https://doi.org/10.5194/egusphere-egu26-20308, 2026.

EGU26-20334 | ECS | Posters on site | GI2.2

Design and Implementation of a Low-Cost, Satellite-Enabled Environmental Data Logger 

Filippo Tagliacarne, Riccardo Valentini, and Francesco Renzi

Ground-based environment monitoring networks provide essential data for climate and air quality research. However, traditional monitoring infrastructure in remote areas often requires high upfront and operational costs. Satellite communication technologies offer a solution to reach these remote areas, but existing commercial systems frequently pair expensive data loggers with costly satellite transceivers, thus limiting their deployment potential. 


We present a novel satellite-enabled data logger designed to maximize compatibility while minimizing both purchase and operational costs. Our custom-designed Printed Circuit Board (PCB) combines data-logging and satellite transmission into a single unit, leveraging low-cost near-real-time bidirectional communication provided by the Astrocast CubeSat constellation. The integration approach helps reducing the hardware costs and the deployment complexity compared to traditional systems. 


The platform is built on an STM32L476 microcontroller (MCU) with 64 MB of internal memory and an integrated real-time clock (RTC), providing low-power operation essential for autonomous field deployments. The board is equipped with an atmospheric pressure sensor, an air temperature and relative humidity sensor, along with multiple communication interfaces for a flexible, sensor-agnostic architecture: UART, I²C, and ADC channels. This design allows seamless integration of different third-party environmental sensors such as atmospheric chemistry, hydrological monitoring or ancillary meteorological measurements, without requiring hardware modifications. 


The system pair the custom PCB with an Astronode S module for satellite data transmission, enabling bidirectional data transmission with 2-3 transmission opportunities every day. The design provides extended operational autonomy through low-power management while maintaining regular access to measurement throughout Astrocast's API and web UI. 


We demonstrate how this design advances the objectives of ground-based monitoring networks by: (1) reducing deployment barriers to remote monitoring through cost-effective satellite connectivity, (2) supporting flexible sensor integration for cross-disciplinary measurement campaigns, (3) providing a scalable foundation for distributed monitoring networks, and (4) offering a validated, replicable platform for future infrastructure development.

How to cite: Tagliacarne, F., Valentini, R., and Renzi, F.: Design and Implementation of a Low-Cost, Satellite-Enabled Environmental Data Logger, EGU General Assembly 2026, Vienna, Austria, 3–8 May 2026, EGU26-20334, https://doi.org/10.5194/egusphere-egu26-20334, 2026.

EGU26-20688 | ECS | Orals | GI2.2

One Researcher's Noise is Another's Signal: Dynamic Azimuthal Correction of ESCAT/ASCAT Backscatter for Long-Term Land Surface Monitoring 

Roland Lindorfer, Sebastian Hahn, Wolfgang Wagner, Clay T. Harrison, and Thomas Melzer

Satellite scatterometers are active radar instruments that transmit microwave pulses towards the Earth's surface and measure how much of this energy is reflected back, a quantity commonly referred to as backscatter. Operating at C-band, the ERS-1/2 ESCAT (1991–2011) and MetOp-A/B/C ASCAT (2007–present) missions together provide more than 35 years of global land surface backscatter observations. These data are widely used for monitoring soil moisture, vegetation dynamics, cryospheric processes, and land cover change. Their coarse spatial sampling of 12.5 km enables very high daily global coverage, which reaches about 82 % during the ASCAT era.

A characteristic feature of scatterometer measurements is azimuthal anisotropy, meaning that backscatter depends systematically on the viewing direction. This arises because ESCAT and ASCAT use multiple fixed fan-beam antennas that observe the same surface under different azimuth angles as the satellite passes overhead. Oriented surface structures such as vegetation patterns, agricultural rows, sand dunes, or wind-blown snow features (sastrugi), interact differently with the radar signal depending on their orientation relative to the radar look direction. While physically meaningful, this directional dependence introduces additional variability when measurements from different viewing geometries are combined, complicating the interpretation of collocated time series.

We present an updated azimuthal correction scheme for ESCAT and ASCAT backscatter that aims to improve the temporal consistency of long-term land surface monitoring. Earlier approaches relied on a unique static reference polynomial derived from multi-year data and mixed viewing geometries to implement the desired azimuthal bias correction, thereby harmonizing the data. Our updated method applies yearly reference polynomials instead and explicitly distinguishes between ascending and descending satellite orbits. This approach thus accounts for long-term land cover changes and systematic diurnal differences between morning and evening overpasses, which are preserved in the corrected backscatter. In addition, the right-looking satellite swath is used as the reference geometry, reflecting the single-swath configuration of the legacy ERS scatterometers. Consequently, this also supports a consistent alignment of measurements across diverse satellite missions. Global comparison maps and local examples show that the updated correction effectively reduces azimuthal noise, as indicated by a lower estimated standard deviation of the corrected backscatter. At the same time, genuine geophysical signals, such as systematic morning–evening differences likely linked to moisture variability, are preserved.

Azimuthal anisotropy is generally undesirable for most monitoring applications, as quantities such as soil moisture do not depend on viewing direction. However, we show that the correction polynomials themselves can provide useful information in specific environments, including sand dunes, ice sheets, and areas dominated by strong point scatterers. This can, for example, enable studies of the temporal migration of sand dunes or sastrugi. We also show that even individual buildings can affect the full footprint of a 25 km ASCAT pixel, as metal–glass structures can produce strong corner reflections when aligned with the radar look direction. The proposed approach therefore supports robust long-term monitoring of natural processes by reducing azimuthal noise, while the correction parameters themselves provide physically meaningful directional information.

How to cite: Lindorfer, R., Hahn, S., Wagner, W., Harrison, C. T., and Melzer, T.: One Researcher's Noise is Another's Signal: Dynamic Azimuthal Correction of ESCAT/ASCAT Backscatter for Long-Term Land Surface Monitoring, EGU General Assembly 2026, Vienna, Austria, 3–8 May 2026, EGU26-20688, https://doi.org/10.5194/egusphere-egu26-20688, 2026.

EGU26-21164 | Posters on site | GI2.2

Comparison of TRACIS campaign data with data from radiosonde, IPRAL Lidar and ERA5 

Alexis Poignard, Antoine Farah, Alain Sarkissian, Philippe Keckhut, Dunya Alraddawi, Sergey Khaykin, Jean-Charles Dupont, and Julie Capo

The study of atmospheric composition is a major priority for improving the understanding of future climate models; therefore, it is essential to analyze in detail the variations of certain key variables, particularly water vapor, which strongly influences meteorological phenomena and plays a major role in radiative forcing. During my doctoral project, my research focused on studying the variability of water vapor using radiosoundings, an instrumental method for obtaining precise and high-quality measurements down to the UT/LS zone, by improving the quality of measurements through instrumentation. In addition to internal tests aimed at obtaining higher-quality measurements, setting up observation campaigns is a top priority in order to validate the performance of the sondes under real-world conditions, identify seasonal biases, and thus be able to make various corrections if necessary. Therefore, the TRACIS (Tropospheric Research Campaign on Air Moisture Content by Ipral at SIRTA) comparison campaign, in which I participated and which took place at the SIRTA site (Atmospheric Remote Sensing Research Instrumental Site) [48.71331°N, 2.20901°E] from May 12 to June 12, 2025, made it possible to assess the consistency of the data between the different sondes, while comparing these datasets with auxiliary sources such as ground-based observations and satellite measurements. This multi-source approach notably includes measurements from the IPRAL LiDAR, as well as fields from the ERA5 reanalysis model, thus strengthening the comparison, identifying potential systematic biases, and improving the overall interpretation of the results. Preliminary analyses focus on comparisons between the combined working measurement standard (CWS; mean RH M10/RS41) and other convergent datasets (M20, ERA5, and IPRAL LiDAR), allowing an evaluation of the representativeness and consistency of the different observation sources.


How to cite: Poignard, A., Farah, A., Sarkissian, A., Keckhut, P., Alraddawi, D., Khaykin, S., Dupont, J.-C., and Capo, J.: Comparison of TRACIS campaign data with data from radiosonde, IPRAL Lidar and ERA5, EGU General Assembly 2026, Vienna, Austria, 3–8 May 2026, EGU26-21164, https://doi.org/10.5194/egusphere-egu26-21164, 2026.

Slow-moving landslides (SMLs) are governed by a combination of causative factors such as geology, tectonic setting, and climatic regime, along with triggering and conditioning factors including precipitation, complex groundwater dynamics, river toe erosion, seismic activity, and anthropogenic modifications. In this study, we present results from monitoring and analysis of a slow-moving landslide at Chandmari Village, Gangtok, in the eastern Himalaya. The analysis is based on real-world data obtained from an operational landslide early warning system active at the site since 2018. An integrated, multi-instrument dataset combining subsurface deformation measurements, hydro-meteorological observations, and high-resolution surface mapping is used to investigate landslide behaviour.

Slope movement was monitored using in-place inclinometer strings installed to depths of up to 30 m within the deforming slope mass to capture depth-wise displacement profiles. These measurements were analysed alongside continuous rainfall data recorded at 5-minute intervals from a local rain gauge to examine hydrological controls on deformation rates. In addition, Differential GPS (DGPS) surveys were conducted to map the spatial distribution of tension cracks on the slope surface. The combined dataset enabled assessment of both slip-surface depth and the spatial extent of the landslide body, as well as their response to seasonal rainfall.

Preliminary results indicate that periods of sustained rainfall correspond to increased displacement rates at specific depth intervals, suggesting activation of shear zones rather than a single, well-defined slip surface. Prolonged rainfall episodes further indicate the involvement of deeper slip surfaces. DGPS-based mapping reveals well-defined tension cracks at the head of the landslide body, while time-lag analysis between rainfall accumulation and deformation response highlights delayed slope adjustment controlled by groundwater dynamics.

The study demonstrates the temporal coupling between subsurface deformation and seasonal hydrological forcing and illustrates the effectiveness of multi-instrument monitoring for characterizing slow-moving landslides. The insights gained into deformation mechanisms support the development of improved early warning and mitigation strategies for urban hill-slope environments under long-term climatic and anthropogenic stress.

How to cite: Kumar M, N. and Vinodini Ramesh, M.: Integrated Analysis of Inclinometer, Rainfall, and DGPS Tension-Crack Data for a Slow-Moving Landslide: A Case Study from Chandmari Village, Sikkim, EGU General Assembly 2026, Vienna, Austria, 3–8 May 2026, EGU26-21501, https://doi.org/10.5194/egusphere-egu26-21501, 2026.

EGU26-21819 | Posters on site | GI2.2

Copernicus Ground-Based Observations for Validation service (GBOV): overview and latest updates for EO data Cal/Val 

Christophe Lerebourg, Rémi Grousset, Simon Nativel, Jean-Sébastien Carrière, Marco Clerici, Nadine Gobron, Jan-Peter Muller, Rui Song, Jadu Dash, Somnath Paramanik, Finn James, Darren Ghent, Jasdeep Anand, Ritika Shukla, and Ana Perez-Hoyos

Copernicus Ground-Based Observations for Validation (GBOV) is a project funded by the European Commission and is part of the Copernicus Land Monitoring Service (CLMS). The project has two main purposes: to support yearly validation efforts of core CLMS products (BRF, Albedo, FAPAR, LAI, FCOVER, LST, Soil Moisture, GPP, NPP, LSP and Evapotranspiration), five of which are listed among GCOS Essential Climate Variables (ECV); and to maintain a data portal making these validation products available. GBOV has reached a broad user community, with about 1700 users, including ESA optical MPC.

A large number of ground-based measurement networks disseminate publicly available data such as NEON, ICOS, TERN, BSRN and ISMN. Within GBOV, long-term datasets are needed in order to maximise the number of matchups between ground-based measurements and satellite data.

GBOV produces both ground-based, point-scale observations (the so-called “Reference Measurements”), and Analysis Ready Validation Data (ARVD) which are spatially upscaled to match the resolution of CLMS products (the so-called “Land Products”). Those GBOV products cover more than 150 sites and are made available to the community via a data portal freely accessible on https://gbov.land.copernicus.eu/. Available Land Products variables include Surface Bi-directional Reflectance Factors (BRFs), Surface Albedo, Leaf Area Index (LAI), Fraction of Absorbed Photosynthetically Available Radiation (FAPAR), Fraction of Vegetation Cover (FCover), Land Surface Temperature (LST), Surface Soil Moisture (SSM). Gross Primary Production (GPP), Net Primary Production (NPP), Land Surface Phenology (LSP) and Evapotranspiration are new products and are not yet available, their release is planned for the end of 2026.

The networks providing GBOV initial input data are unfortunately not evenly distributed. In an attempt to reduce the thematic and geographical gaps, GBOV is developing its own network as part of a collaboration with existing networks. In GBOV phase 1, six ground stations have been upgraded with additional instrumentation. In GBOV phase 2, two ground stations monitoring vegetation variables have been deployed in 2023, one at the Fuji Hokuroku research station in Japan as part of a collaboration with NIES (National Institute of Environmental Studies) and one in 2024 at the Fontainebleau research station (France) as part of a GBOV/ICOS collaboration. In addition, two LST stations were deployed in Fuji Hokuroku and Litchfield (TERN network Australia) in 2024.

Over the past year, several updates have been implemented in the GBOV database to better respond to CLMS and general user requirements. This includes new procedures for specific land cover types in vegetation products, improved uncertainty estimates for soil moisture, and enhanced processing procedures for LST products. Procedures are being developed for the new products: Gross Primary Production, Net Primary Production, Land Surface Phenology and Evapotranspiration.

This presentation will focus on the current status of GBOV products and highlight recent developments and evolutions.

How to cite: Lerebourg, C., Grousset, R., Nativel, S., Carrière, J.-S., Clerici, M., Gobron, N., Muller, J.-P., Song, R., Dash, J., Paramanik, S., James, F., Ghent, D., Anand, J., Shukla, R., and Perez-Hoyos, A.: Copernicus Ground-Based Observations for Validation service (GBOV): overview and latest updates for EO data Cal/Val, EGU General Assembly 2026, Vienna, Austria, 3–8 May 2026, EGU26-21819, https://doi.org/10.5194/egusphere-egu26-21819, 2026.

Understanding groundwater dynamics in arid environments is challenging due to sparse monitoring networks and strong anthropogenic influences. This study explores the potential of time-lapse microgravity observations to characterize shallow aquifer storage variability in Al-Ain City, United Arab Emirates. Repeated microgravity measurements were conducted at four monitoring wells over a one-year period between 2018 and 2019, alongside continuous groundwater-level observations, to investigate temporal changes in subsurface water mass. Observed gravity variations exhibit pronounced spatial and temporal contrasts across the study area, reflecting heterogeneity in aquifer response. Groundwater-level fluctuations over the monitoring period indicate notable seasonal and inter-annual variability, which is consistently mirrored in the gravity signal. By jointly analyzing gravity anomalies and water-level changes, variations in groundwater storage were quantified under a range of plausible specific yield values representative of shallow arid aquifers. Estimated storage changes indicate substantial redistribution of groundwater mass over the monitoring period, with corresponding volumetric changes on the order of several tenths to more than one million cubic meters, depending on local aquifer properties. The results demonstrate that microgravity monitoring provides an independent and spatially sensitive means of assessing groundwater storage dynamics, particularly in settings where conventional piezometric coverage is limited. This approach offers valuable insights into aquifer behavior under arid climatic conditions and highlights the broader potential of gravity-based methods for groundwater assessment, resource management, and hydrological characterization in data-scarce regions.

How to cite: Darwish, S.: Tracking Shallow Aquifer Storage Variability Using Time-Lapse Microgravity Measurements in an Arid Environment: Evidence from Al-Ain, UAE, EGU General Assembly 2026, Vienna, Austria, 3–8 May 2026, EGU26-22102, https://doi.org/10.5194/egusphere-egu26-22102, 2026.

The University ‘G. d’Annunzio’ of Chieti Pescara Atmospheric Observatory (Ud’A Trabocchi) aims to investigate atmospheric chemistry, greenhouse gases evolution, atmosphere-soil exchanges and marine meteorology within a rural-marine setting. The facility has a 15 m tall tower with seven sample points: each every every 2 m. State-of-the-art instrumentation for long-term continuous measurements of CO2, CH4, N2O and isotopic ratio of CH4 and CO2 (Picarro); O3, NO, NO2, NOx, CO and SO2 (Thermo); NO2 (CAPS, Teledyne); CO2 flux (LI-COR); Radon (Mi.lan); Aerosol concentration and size distribution (SMPS, TSI); column observation of O3, NO2, SO2, HCHO (PANDORA 2S), Aerosol optical depth (CIMEL); GNSS reciver (Geoguard and Stonex); Meteorological station (Vaisala); Celiometer (Vaisala CL61). Finally, the station includes a UAV system equipped with meteorological sensors and low-cost sensor to detect CO2, CH4, O3 and NOxData of the first period of observation will be shown and will be discussed possible opportunity of collaborations and synergic activities.

How to cite: Di Carlo, P., Aruffo, E., Mascitelli, A., and Chiacchiaretta, P.: The University ‘G. d’Annunzio’ of Chieti Pescara Atmospheric Observatory (Ud’A Trabocchi): a new supersite for atmospheric observation and research in central Adriatic coast, Italy., EGU General Assembly 2026, Vienna, Austria, 3–8 May 2026, EGU26-22380, https://doi.org/10.5194/egusphere-egu26-22380, 2026.

Meteorological calls on the mesoscale often hinge on change detection such as towering cumulus building, a gap opening for solar energy, or the first smoke plume rising under a convective cell. One of the most cost-effective datasets for detection of these phenomena is real-time, on-site imagery. The meteorological community has built remarkable capability with reliable, trustworthy surface/PBL observations spanning decades, and some network owners have recently begun to include webcam imagery at their sites as well, discovering many tangible benefits. However, for full situational awareness at a given location, the best imaging device is one that can capture the sky in all directions seamlessly.

This talk will introduce the WxStation, a new all-sky observing system currently undergoing extensive field testing within academic projects. The device combines professional grade in‑situ sensors with a 180° all‑sky camera to improve situational awareness. The addition of all-sky imagery into meteorological workflows can raise the effective resolution of mesoscale monitoring, particularly for cloud‑driven variability that impacts nowcasting, convective initiation, solar ramps, aviation ceiling/visibility, and wildfire situational awareness. A short image sequence quickly conveys a wealth of information to a trained observer—often faster and more intuitively than numbers alone can—making on-site imagery a powerful complement to conventional variables.

Furthermore, low‑power inference compute within the WxStation can automatically derive real‑time meteorological products (e.g., cloud fraction/type/motion) for assimilation into NWP and for wider analysis/climatological studies. In the long-term, these devices could provide insights equivalent to that of having a trained meteorological observer at every site 24/7/365. Two factors influence this outcome: (1) the deployment of enough devices to collect large datasets of high-quality imagery for labelling and (2) the development of AI interpretation models that are more capable per watt of compute power, specifically for meteorological tasks.

Prototype WxStation devices have been installed in real-world environments, including examples that will be highlighted during the talk. A deployment during the TEAMx intensive observing period (~3 summer months) in the European Alps captured frequent thunderstorms and rapid cloud‑field transitions. Another unit at the University of Leeds Farm (UK) has demonstrated day‑to‑day reliability in an agricultural setting. Some cold-weather testing down to –50 ºC will also be discussed. These deployments informed enclosure hardening, uptime targets, remote management, and early data intercomparisons against co‑located reference instruments.

The goals of this talk are to both engage and collaborate with the ground-based monitoring network community to propel this idea forward into new climates. Ideally, we seek network operators, research observatories, boundary‑layer testbeds, and emergency management–oriented networks to co‑design pilot evaluations in 2026. Pilots would quantify installation/ops burden (PoE power, mounting, maintenance), data pathways and latency, and product skill (cloud fraction/type/motion) versus co‑located references (e.g., ceilometers, trained observers). The aim is publishable evaluation results, a reusable ingest/QA template, and a clear path to broader operational use; including, if possible, exploratory NWP assimilation experiments (OSEs) as a stretch goal.

How to cite: Pickering, B.: Intelligent All-sky Cameras for Dense Mesoscale Observations: From Field Trials to Operational Pilots, EGU General Assembly 2026, Vienna, Austria, 3–8 May 2026, EGU26-22806, https://doi.org/10.5194/egusphere-egu26-22806, 2026.

EGU26-2310 | ECS | Posters on site | NP1.2

Reduced Complexity Model Intercomparison Project Phase 3: protocol and preliminary results 

Alejandro Romero-Prieto, Marit Sandstad, Benjamin M. Sanderson, Zebedee R. J. Nicholls, Norman J. Steinert, Thomas Gasser, Camilla Mathison, Jarmo Kikstra, Thomas J. Aubry, Katsumasa Tanaka, Konstantin Weber, and Chris Smith

Reduced-complexity models (RCMs) are a critical tool in climate science. Their computational efficiency enables applications beyond the reach of more complex models, including uncertainty quantification, the integration of multiple lines of evidence via ensemble constraining, and running large scenario sets in the span of a few days. Thanks to these capabilities, RCMs played important roles in previous IPCC assessments, and are poised to play an important role in the upcoming Seventh Assessment Report (AR7). A key example is evaluating the climate response to the thousands of emissions scenarios in the peer-reviewed literature created with integrated assessment models. However, whether/which RCMs are suitable for performing such a task is contingent on their ability to faithfully emulate the behaviour of more complex models and observed climate change.

The Reduced-Complexity Model Intercomparison Project (RCMIP) was established to assess this capability, as well as to better understand inter-RCM differences (Nicholls et al., 2020; Nicholls et al., 2021). Here, we introduce the protocol for the third and latest phase, RCMIP3. This phase focuses on two priorities. First, it provides a common set of observational benchmarks to be optionally used for ensemble constraining prior to submission, with the objective of mitigating discrepancies arising from different calibration methodologies and facilitating a clearer assessment of intrinsic model differences. Second, it requests an expanded set of variables and experiments from modelling teams to enable a more thorough evaluation of the carbon cycle representation in these models – a key gap in previous RCMIP phases. Additionally, RCMIP3 includes many of the experiments in the “Assessment Fast Track" (AFT) of the Coupled Model Intercomparison Project Phase 7 (CMIP7). As a result, RCMIP3 will improve our understanding of future model differences under these experiments, in addition to providing the community with valuable early projections.

The presentation will outline the RCMIP3 protocol and highlight the types of analyses it enables, along with preliminary results. By explicitly comparing RCM outputs with both ESM simulations and observations, RCMIP3 aims to strengthen the linkage across the climate-model hierarchy as well as evaluating and showcasing the suitability of RCMs for climate assessment.

Nicholls, Z., Meinshausen, M., Lewis, J., Corradi, M.R., Dorheim, K., Gasser, T., Gieseke, R., Hope, A.P., Leach, N.J., McBride, L.A., Quilcaille, Y., Rogelj, J., Salawitch, R.J., Samset, B.H., Sandstad, M., Shiklomanov, A., Skeie, R.B., Smith, C.J., Smith, S.J., Su, X., Tsutsui, J., Vega-Westhoff, B. and Woodard, D.L. 2021. Reduced Complexity Model Intercomparison Project Phase 2: Synthesizing Earth System Knowledge for Probabilistic Climate Projections. Earth’s Future. 9(6), https://doi.org/10.1029/2020EF001900.

Nicholls, Z.R.J., Meinshausen, M., Lewis, J., Gieseke, R., Dommenget, D., Dorheim, K., Fan, C.-S., Fuglestvedt, J.S., Gasser, T., Golüke, U., Goodwin, P., Hartin, C., Hope, A.P., Kriegler, E., Leach, N.J., Marchegiani, D., McBride, L.A., Quilcaille, Y., Rogelj, J., Salawitch, R.J., Samset, B.H., Sandstad, M., Shiklomanov, A.N., Skeie, R.B., Smith, C.J., Smith, S., Tanaka, K., Tsutsui, J. and Xie, Z. 2020. Reduced Complexity Model Intercomparison Project Phase 1: introduction and evaluation of global-mean temperature response. Geoscientific Model Development. 13(11), pp.5175–5190, https://doi.org/10.5194/gmd-13-5175-2020.

How to cite: Romero-Prieto, A., Sandstad, M., Sanderson, B. M., Nicholls, Z. R. J., Steinert, N. J., Gasser, T., Mathison, C., Kikstra, J., Aubry, T. J., Tanaka, K., Weber, K., and Smith, C.: Reduced Complexity Model Intercomparison Project Phase 3: protocol and preliminary results, EGU General Assembly 2026, Vienna, Austria, 3–8 May 2026, EGU26-2310, https://doi.org/10.5194/egusphere-egu26-2310, 2026.

EGU26-4264 | Posters on site | NP1.2

METEOR 1.5 a spatial emulator for fast and relevant responses to impact questions 

Marit Sandstad, Benjamin Sanderson, Norman Steinert, and Shivika Mittal

Here we present an extended version of the forcing-driven and overshoot-aware spatial impacts emulator METEOR, which now includes functionality to emulate monthly outputs which include seasonality and natural variability, with the option to produce large distribution ensembles for a point, regional average or spatial domain.  The philosophy of METEOR entails fast training on few and widely available datasets, sufficiently fast to be run on-the-fly and removing the need to archive large datasets and allowing interactive coupling with integrated assessment frameworks to simulate impacts directly.  METEOR1.5 introduces a state dependent seasonal model and an autoregressive spatial, state-dependent noise model which can produce distributions of realisations conforming to the climatic trends and distributional properties of the emulated model    Integrated impact modules allow the direct emulation of human and ecological stressors which are computed from easily retrained emulated climates to answer regional questions. 

How to cite: Sandstad, M., Sanderson, B., Steinert, N., and Mittal, S.: METEOR 1.5 a spatial emulator for fast and relevant responses to impact questions, EGU General Assembly 2026, Vienna, Austria, 3–8 May 2026, EGU26-4264, https://doi.org/10.5194/egusphere-egu26-4264, 2026.

EGU26-5437 | ECS | Orals | NP1.2

When and where higher-resolution climate data improve impact model performance 

Johanna Malle, Christopher Reyer, and Dirk Karger and the ISIMIP modellers and sector coordinators

Climate impact assessments increasingly rely on high-resolution climate and forcing datasets, under the premise that finer detail enhances both the accuracy and the policy relevance of projections. Systematic evaluations of when and where higher resolution data improve model outcomes remain limited, and it is still unclear whether increasing spatial resolution consistently enhances climate impact model performance across application areas, regions, and forcing variables. Here we show that improvements in climate input accuracy and impact model performance are most pronounced when moving from coarse (60 km) to intermediate (10 km) resolution, while further refinement to 3 km and 1 km provides more modest and inconsistent benefits. Using the cross-sectoral model simulations from the Inter-Sectoral Impact Model Intercomparison Project (ISIMIP), we demonstrate that higher resolution substantially improves model skill in temperature-sensitive impact models and topographically complex regions, whereas precipitation-driven and low-relief systems show less consistency to increase performance with resolution. For temperature, both climate inputs and model outputs improved most strongly at the 60 km → 10 km transition, with diminishing gains at finer scales. A similar result emerged for precipitation, although some models even exhibited reduced performance when resolution increased beyond 10 km. These results highlight that optimal resolution depends on sectoral and regional context, and point to the need for improving model process representation and downscaling techniques so that added spatial detail can translate into meaningful performance gains. For data providers, this implies prioritizing investments in resolutions that maximize improvements where they matter most, while for modeling groups and users, it underscores the need for explicit benchmarking of resolution choices. More broadly, this work advances the design of consistent, efficient, and policy-relevant multi-sectoral climate impact assessments by clarifying when high-resolution data meaningfully enhance outcomes.

How to cite: Malle, J., Reyer, C., and Karger, D. and the ISIMIP modellers and sector coordinators: When and where higher-resolution climate data improve impact model performance, EGU General Assembly 2026, Vienna, Austria, 3–8 May 2026, EGU26-5437, https://doi.org/10.5194/egusphere-egu26-5437, 2026.

EGU26-5816 | ECS | Posters on site | NP1.2

Defining an early warning method for an AMOC collapse based on ensemble statistics 

Dániel Jánosi, Ferenc Tamás Divinszki, Reyk Börner, and Mátyás Herein

The Atlantic Meridional Overturning Circulation (AMOC) is a crucial climate component, as its potential collapse would constitute a significant response to Earth’s changing climate. This critical transition has been the subject of numerous studies over the years, both from the aspect of climate modeling and dynamical systems theory. In the context of the latter, climate change is a process in which a complex, chaotic-like system possesses time-dependent parameters, in the form of e.g. the growing CO2 concentration. It has been known that such systems have a chaotic attractor which is also time-dependent, a so-called snapshot attractor. Such objects, and thus the systems they describe, can only be faithfully represented by a probability distribution over an ensemble of simulations, so-called parallel climate realizations.

Based on this probability distribution, we define a novel early warning indicator for crucial transitions such as an AMOC collapse. The AMOC is said to possess a multistable quasipotential landscape, and the collapse is a transition between stable states. We argue that, from the point of view of statistical physics, this is analogous to a phase transition, but in a non-adiabatic setting. As such, the variance of the distribution over the ensemble is expected to develop a local maximum around the transition point, giving rise to a potential early warning by identifying the preceding maximum of its derivative. This method is first demonstrated on a conceptual climate model, before the analysis is carried out on ensemble simulations from the ACCESS-ESM model. The analysis in the former case is simpler, while in the latter, one has to contend with the dependence of the AMOC strength on spatial coordinates, resulting in multiple early warning points for different depths and latitudes.

How to cite: Jánosi, D., Divinszki, F. T., Börner, R., and Herein, M.: Defining an early warning method for an AMOC collapse based on ensemble statistics, EGU General Assembly 2026, Vienna, Austria, 3–8 May 2026, EGU26-5816, https://doi.org/10.5194/egusphere-egu26-5816, 2026.

Offline aridity and drought indices have often implied widespread terrestrial drying under a warming environment, while Earth system models (ESMs) have projected modest changes in land-surface water fluxes. This persistent divergence has been typically attributed to missing vegetation physiological processes in offline frameworks. However, we here show that a more foundational cause is a structural inconsistency embedded in those diagnostics. Conventional potential evapotranspiration (PET) formulations can violate the assumption that precipitation (P) and atmospheric evaporative demand act as independent climatic constraints in the Budyko framework. Using open-water Penman and vegetation-responsive Penman–Monteith formulations forced by reanalysis data and ESM projections, we found that uncorrected PET strongly reflected land–atmosphere feedbacks, leading to pronounced negative P–PET correlations (-0.45 ± 0.29; mean ± s.d.). When PET was thermodynamically deflated, this dependence was largely removed (-0.02 ± 0.42), restoring consistency with the theoretical basis of Budyko-type diagnostics. This structural correction reduced inflation of the aridity index and substantially moderated projected evapotranspiration (ET) trends. Under a business-as-usual scenario, the trend of Budyko-based ET from uncorrected PET (+0.61 mm yr-2) exceeded that of CMIP6 ensemble mean (+0.28 mm yr-2) by more than a factor of two. CEP-deflated PET narrowed this discrepancy (+0.39 mm yr-2), while additional physiological adjustments provided comparatively smaller improvements. We suggest that violations of structural assumptions, rather than missing physiological processes alone, can play a central role in the divergence between offline aridity diagnostics and ESM hydrological projections.

Acknowledgement: This work was jointly supported by the National Research Foundation of Korea (NRF) grants funded by the Korea government (MSIT) (RS-2025-16070291 & RS-2024-00416443).

How to cite: Kim, D. and Choi, M.: Why offline aridity diagnostics overestimate future drying: the role of feedback-inflated evaporative demand, EGU General Assembly 2026, Vienna, Austria, 3–8 May 2026, EGU26-6189, https://doi.org/10.5194/egusphere-egu26-6189, 2026.

EGU26-6930 | ECS | Posters on site | NP1.2

Barotropic waves in a sloping two- and multiple-basin Arctic ocean model 

Michael Duc Tung Nguyen and Edward Johnson

Large-scale barotropic flow in the Arctic Ocean is strongly steered by the seafloor topography, yet how this geometry constrains free modes and facilitates inter-basin interactions remains unclear. Free modes conserve potential vorticity and at high latitudes the circulation pathway is enclosed by its sloping two-basin geometry. We begin by presenting a simple two-basin model, representing the Canadian and Eurasian basin respectively, with sloping boundaries and flat bottoms to explore simplified Arctic flow behaviour. Topographic Rossby waves are analytically obtained and the two basins are linked together via a mode-matching framework. We show free modes are tightly constrained to geometry, with basin-trapped dipole wave modes only emerging in certain geometric parameters. We then extend this to a more realistic, multiple-basin Arctic Ocean model that include the Nordic seas, and demonstrate the transmission and exchange of these topographic waves across these multiple sloping basins.

How to cite: Nguyen, M. D. T. and Johnson, E.: Barotropic waves in a sloping two- and multiple-basin Arctic ocean model, EGU General Assembly 2026, Vienna, Austria, 3–8 May 2026, EGU26-6930, https://doi.org/10.5194/egusphere-egu26-6930, 2026.

EGU26-7143 | ECS | Posters on site | NP1.2

Jax-esm: a differentiable coupler for jax-based Earth system models 

Tien-Yiao Hsu, Duncan Watson-Parris, and Georg Feulner

The differentiability of numerical climate models exhibits  many advantages over non-differentiable models. Differentiable climate models would be able to optimize parameters and quickly solve for climate equilibrium. They can also be used to find unstable climate equilibrium states that are impossible to identify in time-forwarding models. Differentiability also enables sensitivity studies, such as the impact of initial conditions on predictions, which is the key concept in the 4-dimensional variational method. Finally, differentiable ability also integrates well with the trending data-driven artificial intelligence model, such as NeuralGCM.  

Currently, physics-based differentiable coupled climate models are still rare. Some existing ones include: ECMWF Integrated Forecasting System (ECMWF-IFS) and Coupled Ocean/Atmosphere Mesoscale Prediction System (COAMPS). The high scientific value of such a tool warrants development of further differentiable modelling systems.

In this work, we present jax-esm, a differentiable coupler for models written in Python with the JAX framework. JAX is a Python library developed by Google that builds on NumPy and adds automatic differentiation and just-in-time (JIT) compilation. It has been used to develop atmospheric models such as NeuralGCM and jax-gcm. In this example, we couple jax-gcm, a JAX-based atmosphere intermediate model, to a slab ocean model. We demonstrate the optimization of ocean mixed-layer depth and solving for climate equilibrium through differentiability.

How to cite: Hsu, T.-Y., Watson-Parris, D., and Feulner, G.: Jax-esm: a differentiable coupler for jax-based Earth system models, EGU General Assembly 2026, Vienna, Austria, 3–8 May 2026, EGU26-7143, https://doi.org/10.5194/egusphere-egu26-7143, 2026.

EGU26-7983 | ECS | Posters on site | NP1.2

Multi-stability of the Global Overturning Circulation: A Conceptual Approach 

Elian Vanderborght and Henk Dijkstra

The Global Overturning Circulation (GOC) is characterized by deep water formation in the subpolar North Atlantic, which feeds the southward-flowing branch of the Atlantic Meridional Overturning Circulation (AMOC). In contrast, the North Pacific lacks deep water formation and therefore does not host an analogous Pacific Meridional Overturning Circulation (PMOC). Proxy records, however, indicate that this asymmetric pattern of deep water formation has varied in the past, suggesting that a PMOC likely existed during earlier climate states. Recent studies further show that the development of a PMOC influences the future weakening of the AMOC: climate models that develop a PMOC in response to warming exhibit a stronger decline in AMOC strength. It therefore becomes important to understand under what circumstances a PMOC is likely to develop.

Here, we extend the pycnocline model of Gnanadesikan (1999) to a two-basin configuration, consisting of a narrow basin representing the Atlantic and a wide basin representing the Pacific. By including salinity as a prognostic variable, we find that this two-basin box model may exhibit three distinct overturning states under identical, longitudinally symmetric forcing: (1) an active narrow-basin sinking state, (2) an active wide-basin sinking state, and (3) a state with active sinking in both basins. Overturning states confined to a single basin are stabilized by the salt-advection feedback, whereas the state with sinking in both basins is maintained by a meridional temperature contrast. We find that this latter state becomes the preferred equilibrium when the interhemispheric temperature contrast increases, the northern gyre transport strengthens, and the hydrological cycle weakens. Moreover, we show that this state is more sensitive to high-latitude freshwater fluxes, indicating that a transition to such a state would enhance the projected future weakening of the AMOC. We verify these findings in an uncoupled global circulation model (MITgcm) with a simplified model geometry.

How to cite: Vanderborght, E. and Dijkstra, H.: Multi-stability of the Global Overturning Circulation: A Conceptual Approach, EGU General Assembly 2026, Vienna, Austria, 3–8 May 2026, EGU26-7983, https://doi.org/10.5194/egusphere-egu26-7983, 2026.

EGU26-8370 | ECS | Posters on site | NP1.2

Quantifying AMOC Uncertainty in European Climate Damage Projections 

Felix Schaumann

Estimates of economic damages from climate change in Europe depend on temperature projections, and they are thereby subject to scenario uncertainty and model uncertainty, as well as damage function uncertainty. An additional, often implicit source of uncertainty is the projected, yet poorly constrained, weakening of the Atlantic Meridional Overturning Circulation (AMOC), which would lower European temperatures. Here, I explicitly quantify the contribution of AMOC uncertainty to total damage uncertainty, with AMOC uncertainty comprising uncertainty about future AMOC developments as well as uncertainty about the cooling pattern that would follow an AMOC weakening. I combine a newly developed pattern-scaling-type emulator of the European cooling response to AMOC weakening — calibrated for different Earth system models (ESMs) — with temperature projections from multiple ESMs and emissions scenarios, alongside several damage functions. This allows me to decompose the total uncertainty in European economic damages into different drivers and estimate the share attributable to the behaviour of the AMOC.

How to cite: Schaumann, F.: Quantifying AMOC Uncertainty in European Climate Damage Projections, EGU General Assembly 2026, Vienna, Austria, 3–8 May 2026, EGU26-8370, https://doi.org/10.5194/egusphere-egu26-8370, 2026.

The history of climate modelling is one of increasing complexity and increasing resolution, driven by and constrained by the available computational capacity. These models are widely used, directly and indirectly, to support policy and adaptation decisions across society. They are also used in academic studies across a range of disciplines to study the response of the climate system to future atmospheric greenhouse gas concentrations on multi-decadal timescales. These are extrapolatory endeavours in a non-stationary system without possibility of relevant verification.

There has been much research on individual and multi-model analyses in this context. Here I will instead discuss how the targets of our endeavours (particularly the support of societal decisions) demands a rethinking of our modelling activities. I will highlight the need to reflect on the minimum requirements for ensemble size and ensemble variety, and the role of a hierarchy of models in providing the best possible information to stakeholders across society.

These issues will be discussed in the light of a recent meeting on the foundations of climate change science attended by over 70 researchers across a variety of disciplines. The meeting was entitled “How to spend 15 billion dollars?: A workshop on how to make climate change modelling more robust and more useful to society.” It gathered expertise from disciplines as diverse as earth system modelling, integrated assessment modelling, philosophy, economics, maths, statistics and finance.

Here I will present the key messages coming out of this meeting alongside the themes presented in a recent essay on the subject, “A Model of Catastrophe”[1].

[1] Stainforth, D.A., “A Model of Catastrophe”, Aeon.co, 2025 (https://aeon.co/essays/todays-complex-climate-models-arent-equivalent-to-reality)

How to cite: Stainforth, D.: Designing Climate Change Modelling to Support Societal Decisions, EGU General Assembly 2026, Vienna, Austria, 3–8 May 2026, EGU26-8434, https://doi.org/10.5194/egusphere-egu26-8434, 2026.

EGU26-9869 | Orals | NP1.2

Cascaded score-based emulation of Earth system models for impact evaluation with SCALES-MESH  

Verena Kain, Niklas Schwind, Annika Högner, Assaf Shmuel, Alexander Nauels, Zebedee Nicholls, Marco Zecchetto, and Carl-Friedrich Schleussner

Today's climate adaptation and mitigation planning tasks require rapid access to large ensembles of climate projections for a wide range of emissions scenarios, including overshoot scenarios. While Earth system models (ESMs) provide physically consistent projections, their high computational cost limits scenario exploration. Climate emulators -  statistical or machine-learning-based models trained on ESM data to generate data replicating the ESMs behaviour for a multitude of emissions scenarios - are therefore proposed to deliver these projections efficiently. Here we present the novel modular SCALES–MESH emulator framework, combining physics-based regional projections with AI downscaling capabilities. The SCALES module translates projections of global mean surface air temperature into regional surface air temperature projections aggregated over the AR6-IPCC regions, while the MESH module performs spatio-temporal downscaling to gridded fields using a conditional score-based generative model. MESH is trained on multiple datasets and evaluated against parent ESMs using spatial, temporal, and distributional diagnostics. Results show that the emulator captures regional patterns, temporal variability, and probability distributions of emulated climate variables, including during warming and cooling phases of overshoot scenarios. We further demonstrate the potential for transfer learning across ESMs, pointing toward scalable multi-model and resolution-agnostic emulation. Together, SCALES–MESH enables rapid, flexible, and physically grounded exploration of climate futures, supporting decision-relevant climate risk assessment at unprecedented scope.

How to cite: Kain, V., Schwind, N., Högner, A., Shmuel, A., Nauels, A., Nicholls, Z., Zecchetto, M., and Schleussner, C.-F.: Cascaded score-based emulation of Earth system models for impact evaluation with SCALES-MESH , EGU General Assembly 2026, Vienna, Austria, 3–8 May 2026, EGU26-9869, https://doi.org/10.5194/egusphere-egu26-9869, 2026.

EGU26-12377 | ECS | Orals | NP1.2

Conditions for instability in the climate–carbon cycle system 

Joseph Clarke, Chris Huntingford, Paul Ritchie, Rebecca Varney, Mark Williamson, and Peter Cox

The climate and carbon cycle interact in multiple ways. An increase in carbon dioxide in the atmosphere warms the climate through the greenhouse effect, but also leads to uptake of CO2 by the land and ocean sink, a negative feedback. However, the warming associated with a CO 2 increase is also expected to suppress carbon uptake, a positive feedback. This study addresses the question: “under what circumstances could the climate–carbon cycle system become unstable?” It uses both a reduced form model of the climate–carbon cycle system as well as the complex land model JULES, combined with linear stability theory, to show that: (i) the key destabilising loop involves the increase in soil respiration with temperature; (ii) the climate–carbon system can become unstable if either the climate sensitivity to CO2 or the sensitivity of soil respiration to temperature is large, and (iii) the climate–carbon system is stabilized by land and ocean carbon sinks that increase with atmospheric CO2 , with CO2-fertilization of plant photosynthesis playing a key role. For central estimates of key parameters, the critical equilibrium climate sensitivity (ECS) that would lead to instability at current atmospheric CO2 lies between about 11K (for large CO2 fertilization) and 6K (for no CO2 fertilization). Given the apparent stability of the climate–carbon cycle, we can view these parameter combinations as implausible. The latter value is close to the highest ECS values amongst the latest Earth Systems Models. We find that the stability of the climate–carbon system increases with atmospheric CO2 , such that the glacial CO2 concentration of 190 ppmv would be unstable even for ECS greater than around 4.5 K in the absence of CO2 fertilization of land photosynthesis.

How to cite: Clarke, J., Huntingford, C., Ritchie, P., Varney, R., Williamson, M., and Cox, P.: Conditions for instability in the climate–carbon cycle system, EGU General Assembly 2026, Vienna, Austria, 3–8 May 2026, EGU26-12377, https://doi.org/10.5194/egusphere-egu26-12377, 2026.

EGU26-12408 | ECS | Posters on site | NP1.2

Revealing Probabilistic Patterns of Climate Extremes and Impacts Through Emulator-Based Risk Analysis 

Lorenzo Pierini, Chahan Kropf, Lukas Gudmundsson, Sonia I. Seneviratne, and David N. Bresch

Traditional earth system model ensembles provide valuable information on climate extremes. However, their limited size often underrepresents rare high-impact events, restricting the ability to explore extreme outcomes and large-scale anomaly patterns. Using the climate emulator MESMER, trained on CMIP6 models, together with the risk assessment platform CLIMADA, we assess population exposure to annual maximum daily temperatures and asset exposure to annual maximum daily precipitation.

MESMER generates virtually unlimited, spatially explicit, global climate realizations for any scenario defined by emission or global-mean-temperature trajectories. This allows us to characterize the spread of potential outcomes and associated spatial patterns, identify rare high-impact realizations, compare results with standard CMIP6 ensembles, or explore custom scenarios beyond existing model experiments.

We illustrate spatial and temporal patterns of exposure for temperature and precipitation extremes, highlighting contrasting regional responses and how highly impactful outcomes can emerge from climate variability.


How to cite: Pierini, L., Kropf, C., Gudmundsson, L., Seneviratne, S. I., and Bresch, D. N.: Revealing Probabilistic Patterns of Climate Extremes and Impacts Through Emulator-Based Risk Analysis, EGU General Assembly 2026, Vienna, Austria, 3–8 May 2026, EGU26-12408, https://doi.org/10.5194/egusphere-egu26-12408, 2026.

EGU26-12585 | Posters on site | NP1.2

Parsimonious models emulating millennium-long Earth system model simulations 

Kristoffer Rypdal

Parsimonious emulator models (PEMs) trained on Earth system models (ESMs) can be very useful when information  about global quantities like global mean surface temperature (GMST) and ocean heat content (OHC) are sought. Here, I use data over several millennia from ESM runs extracted from the LongRunMip repository to construct and test PEMs for GMST and net incoming radiation flux.

For the  GMST, I consider a linear impulse response in the form of a superposition of three decaying exponentials, comprising three weight coefficients and three characteristic decay times to be estimated by least square fitting to ESM runs with abrupt step function forcing. The model fit is good on all time scales, and the fitted model seems to perform even better for smoother forcing scenarios. This sugggests that the six model parameters represent essential features of each ESM.

Data for radiation flux, and its decomposition in longwave and reflected shortwave, are combined with GMST to produce Gregory plots. By fitting parabolic curves to these plots, I obtain a simple analytic expression for the evolution of the feedback parameter λt), the radiation fluxes, and the resulting increase in OHC.

From these PEMs we can easily compare the global performance of different ESMs under different forcing scenarios. For instance, a comparison of the GISS-E2-R and CESM104 models exhibit equilibrium climate sensitivities (ECSs) of 3.4  and 2.4 K, respectively. The main reason for the difference is very different albedo feedbacks in the two models. Resulting total feedback parameter  λ(t) drops from 2.1 to 1.0 Wm-2 K-1 in GISS-E2-R and from 1.4 to 0.6 Wm-2 K-1 in CESM104. The OHC grows at nearly the same rate in the two models during the first millenium, but GISS saturates earlier and at lower final OHC.

How to cite: Rypdal, K.: Parsimonious models emulating millennium-long Earth system model simulations, EGU General Assembly 2026, Vienna, Austria, 3–8 May 2026, EGU26-12585, https://doi.org/10.5194/egusphere-egu26-12585, 2026.

EGU26-12666 | Orals | NP1.2

Exploring state dependence of the climate response to radiative forcing using two idealized coupled climate models 

Christopher Pitt Wolfe, Youwei Ma, Anna Katavouta, Kevin Reed, and Richard Williams

Studies of climate sensitivity and feedbacks typically employ a suite of models with similar base climates but different model physics. Such an approach is useful for uncovering how changes to physical processes affect the climate response to changes in radiative forcing, but obscures the dependence of the climate response on the initial state of the climate itself. In order to better understand this dependence, we study the response to radiative forcing of two nearly identical configurations of the Community Earth System Model (CESM) with production-grade physics and resolutions that have dramatically different climates. The first, called Aqua, is completely covered with a uniform-depth ocean except for two 10º-wide polar continents to avoid the polar singularities in the ocean model. The second, Ridge, is identical to Aqua except for the presence of a thin ridge continent connecting the two polar caps. The ridge supports gyres in the ocean and leads to a warm, ice-free climate resembling a global Pacific Ocean, with a warm pool and cold tongue in the tropical ocean connected by a Walker circulation in the atmosphere. In contrast, the mean climate of Aqua is zonally symmetric and dominated by a global cold belt in the ocean driven by vigorous equatorial upwelling. The lack of gyres leads to a deep oceanic thermocline and reduces meridional heat transport, which allows for the development of persistent sea ice at high latitudes.

These two mean climates are perturbed by increasing atmospheric CO2 concentration at a rate of 1% per year until quadrupling. Aqua initially warms more slowly than Ridge, with the transient climate response (TCR) at doubling 23% smaller for Aqua than Ridge. After doubling, however, Aqua begins to warm faster than Ridge and Aqua’s global mean temperature surpasses Ridge’s at quadrupling. A linear feedback analysis is used to gain insight into the time-evolving responses of these two configurations to increased CO2 concentration. At all stages, Aqua’s net top-of-the-atmosphere heating is greater than Ridge’s. At early times, this is due to high clouds replacing low clouds in Aqua’s high latitudes, but decreasing surface albedo due to sea-ice loss eventually becomes a dominant factor. Aqua’s deep thermocline supports a higher ocean heat uptake (OHU) efficiency relative to Ridge that initially offsets these positive feedbacks and results in Aqua’s lower TCR. As CO2 concentration approaches quadrupling, the combined effects of declining OHU efficiency and a strengthening ice-albedo feedback drive Aqua’s warming to temperatures compatible to Ridge. In the century following quadrupling, Aqua warms several Kelvin more than Ridge.

These idealized systems can shed light on the fundamental aspects of Earth’s climate system—such as how the response to radiative forcing depends on the base climate—that might be obscured in more complex configurations.


How to cite: Pitt Wolfe, C., Ma, Y., Katavouta, A., Reed, K., and Williams, R.: Exploring state dependence of the climate response to radiative forcing using two idealized coupled climate models, EGU General Assembly 2026, Vienna, Austria, 3–8 May 2026, EGU26-12666, https://doi.org/10.5194/egusphere-egu26-12666, 2026.

EGU26-13950 | Orals | NP1.2 | Highlight

Understanding regional discrepancies using the climate model hierarchy 

Tiffany Shaw and Joonsuk Kang

As Earth warms, regional climate signals are accumulating. Some signals, for example, land warming more than the ocean and the Arctic warming the most, were expected and successfully predicted. Underlying this success was the application of physical laws across a climate model hierarchy under the assumption that large and small spatial scales are well separated. With additional warming, however, discrepancies between real-world signals and model predictions are accumulating, especially at regional scales. In this talk, we will highlight the emerging list of model-observation discrepancies in historical trends. We demonstrate how the climate model hierarchy can be used to understand the physical processes underlying these discrepancies. We argue that progress can be made by filling gaps in the hierarchy and making more process-informed observations.

How to cite: Shaw, T. and Kang, J.: Understanding regional discrepancies using the climate model hierarchy, EGU General Assembly 2026, Vienna, Austria, 3–8 May 2026, EGU26-13950, https://doi.org/10.5194/egusphere-egu26-13950, 2026.

EGU26-14266 | ECS | Orals | NP1.2

Rate-dependent Tipping of the AMOC under CO2 increase in an Intermediate Complexity Model 

Sjoerd Terpstra, Swinda Falkena, Robbin Bastiaansen, and Anna von der Heydt

The stability of the Atlantic Meridional Overturning Circulation (AMOC) under future climate change remains uncertain. While most climate models across the model hierarchy project a weakening or collapse under freshwater forcing, transient simulations under increasing CO2 levels also commonly show a weakening or even a collapse of the AMOC. However, longer equilibrium experiments---primarily conducted with lower-complexity models due to computational costs---show more varied responses to CO2 forcing. While most models show an initial weakening of the AMOC, some models equilibrate to a weak AMOC state only at very high CO2 levels, while others equilibrate to a stronger-than-present AMOC. One such model is the intermediate complexity model CLIMBER-X, which (in equilibrium) shows that the AMOC strengthens until at least 16 times preindustrial CO2 levels are reached. However, during the transient phase of increasing CO2, the AMOC weakens. This suggests that the AMOC's transient response may differ from its equilibrium behavior. This raises the question: can the AMOC collapse under rapid and high CO2 increase, even if a stable equilibrium state exists? 

We show that the AMOC exhibits rate-dependent tipping; when CO2 increases fast enough and reaches sufficiently high levels, the AMOC can fully collapse. This occurs under very high forcing, starting from 7 times preindustrial CO2 levels and a rate of 2.0% ppm/yr CO2 increase. This collapse occurs despite the existence of a stable AMOC at equilibrium. By examining the physical processes through which the collapse occurs, we contribute to the understanding of the AMOC response in a warming climate. By also incorporating freshwater forcing, we assess the risks of rapid warming on the AMOC stability. Our results show that even models with a stable equilibrium AMOC under high CO2 levels can experience weakening during the transient phase or even collapse. This highlights the need to assess both the rate and magnitude of CO2 forcing when assessing the stability of the AMOC. While this effect occurs at very high CO2 levels in CLIMBER-X, the role of the rate of CO2 increase may become relevant at lower CO2 levels when combined with freshwater forcing. Our findings demonstrate that the AMOC can undergo rate-dependent tipping under rapid and high CO2increase, even if a stable AMOC exists at very high CO2 levels.

How to cite: Terpstra, S., Falkena, S., Bastiaansen, R., and von der Heydt, A.: Rate-dependent Tipping of the AMOC under CO2 increase in an Intermediate Complexity Model, EGU General Assembly 2026, Vienna, Austria, 3–8 May 2026, EGU26-14266, https://doi.org/10.5194/egusphere-egu26-14266, 2026.

EGU26-14741 | Posters on site | NP1.2

Coupled ESM-IAM Emulator: Exploring Uncertainties in Temperature Target Pathways 

Katsumasa Tanaka, Xiong Weiwei, Myles Allen, Michelle Cain, Stuart Jenkins, Camilla Mathison, Vikas Patel, Chris Smith, and Kaoru Tachiiri

Integrating physical, socio-economic, and technological perspectives is indispensable for addressing climate mitigation challenges. While directly coupling state-of-the-art Earth System Models (ESMs) and Integrated Assessment Models (IAMs) offers a way to explore feedbacks between these domains, doing so with full-complexity models remains computationally prohibitive. This is particularly true for cost-effective intertemporal optimization IAMs due to fundamental operational differences: while ESMs perform forward simulations, such IAMs optimize over time. Consequently, direct coupling would require numerous computationally intensive iterations to converge, a complication further compounded by the stochastic nature of ESMs.

To overcome the barriers to coupling ESMs and IAMs, we employ their reduced-complexity representations (i.e., emulators). We couple an IAM emulator representing 9 distinct IAMs (Xiong et al. 2025) with an ESM emulator, FaIR, representing 66 ESM configurations (Smith et al. 2024a). Using this coupled ESM-IAM emulator framework in an optimization setting, we calculate cost-effective pathways that achieve the temperature targets of the Paris Agreement with and without overshoot.

Our preliminary results indicate that the uncertainty ranges for such pathways are significantly larger than previously estimated. Our results also have implications for target setting; we show how pathways differ when IAMs optimize directly for a temperature target – a capability IAMs traditionally lack. Instead, IAMs typically rely on temperature proxies, such as carbon budgets (or their corresponding carbon price pathways), which do not necessarily provide an accurate representation of the temperature target. Furthermore, this study offers advanced insights into the dynamics of climate-economy interactions, providing a roadmap for future efforts to couple full-complexity models.


References

Xiong, W., Tanaka, K., Ciais, P., Johansson, D. J. A., & Lehtveer, M. (2025). emIAM v1.0: an emulator for integrated assessment models using marginal abatement cost curves. Geosci. Model Dev., 18(5), 1575-1612. doi:10.5194/gmd-18-1575-2025

Smith, C., Cummins, D. P., Fredriksen, H. B., Nicholls, Z., Meinshausen, M., Allen, M., . . . Partanen, A. I. (2024). fair-calibrate v1.4.1: calibration, constraining, and validation of the FaIR simple climate model for reliable future climate projections. Geosci. Model Dev., 17(23), 8569-8592. doi:10.5194/gmd-17-8569-2024

How to cite: Tanaka, K., Weiwei, X., Allen, M., Cain, M., Jenkins, S., Mathison, C., Patel, V., Smith, C., and Tachiiri, K.: Coupled ESM-IAM Emulator: Exploring Uncertainties in Temperature Target Pathways, EGU General Assembly 2026, Vienna, Austria, 3–8 May 2026, EGU26-14741, https://doi.org/10.5194/egusphere-egu26-14741, 2026.

EGU26-15472 | ECS | Posters on site | NP1.2

Low Uncertainty Regional Climate Projections without Irrelevant Weather Details 

Yifan Wang, Shaun Lovejoy, Dustin Lebiadowski, and Dave Clarke

Uncertainties in conventional (GCM) climate models, defined as the structural spread among com-
peting models, have increased for the first time in the latest AR6 report despite an exponential increase
in the modern computation power. The root problem is that these models are based in the weather
regime, that is, they spend unnecessary effort in calculating irrelevant weather details. This project
aims to produce precise regional projection using the Half Order Energy Balance Equation (HEBE): a
half order fractional derivative generalization of the standard Energy Balance Equation (EBE). HEBE
has the advantage of being a direct consequence of the continuum heat equation combined with energy-
conserving surface boundary conditions. A previous paper used Fractional EBE (FEBE) to model Earth
climate projections through 2100 on a global scale, and it yields significantly smaller uncertainty com-
pared to the CMIP6 MME. This project builds on a similar methodology, enhancing climate projection
with additional regional details and upgraded precision. The current results show that the parametric
uncertainty in HEBE’s temperature response is smaller than the internal variability at most locations,
at the exceptions of the high memory deep ocean regions near Pacific. HEBE’s regional hindcast ac-
curately reproduces ERA5 2mT series’ deterministic and stochastic patterns of regional temperature.
The global hindcast is also validated by various reanalysis datasets and instrumental records. The
direct year to year relative uncertainty (ratio between 90% confidence interval and best estimate) is
stable across time and marker scenarios, with most regions projecting values below 0.5 by 2100. On a
global scale, the parametric uncertainty in HEBE’s response temperature is negligible (±0.03K by 2100
using the SSP2-4.5 marker scenario). This effectively shows that HEBE’s projection is more precise
than its competitors even without taking period averages. The exceedingly low global uncertainty was
constrained by the large amount of regional information when taking the global averages. It should be
noted that the cited parametric uncertainty does not take into account systematic biases in HEBE and
in the input datasets. The most important source should be any errors in the forcings, especially con-
cerning aerosols. HEBE aims to provide a compelling and physically grounded alternative to complex
deterministic multi-model ensembles, offering a more precise, efficient, and interpretable means of pro-
jecting regional climate changes in the coming century. This positions it as a potentially valuable tool
for policy-relevant projections and adaptation planning, thereby showing the pertinency of fractional
derivative and Bayesian framework in atmospheric sciences.

How to cite: Wang, Y., Lovejoy, S., Lebiadowski, D., and Clarke, D.: Low Uncertainty Regional Climate Projections without Irrelevant Weather Details, EGU General Assembly 2026, Vienna, Austria, 3–8 May 2026, EGU26-15472, https://doi.org/10.5194/egusphere-egu26-15472, 2026.

EGU26-16369 | Posters on site | NP1.2

The future is in the past? A flexible resampling approach to generate multivariate time series 

Michael Lehning, Tatjana Milojevic, and Pauline Rivoire

Synthetic time series generation is an essential tool for robustly exploring different climate scenarios and their impacts. While sophisticated generation methods have been developed in the past, they often rely on physical and statistical assumptions and require extensive data for calibration and parameter estimation. We propose a straightforward method for time series generation based on constrained sampling of observations. This approach preserves the physical consistency between variables and maintains the short temporal structure present in the observation. We apply this procedure to generate temperature, precipitation, incoming solar radiation, and wind speed time series sampled from meteorological station observations. We obtain different sets of synthetic time series by constraining the mean temperature according to future scenarios provided by climate model projections. We show that the sampled time series preserve the multivariate dependence structure observed in both historical data and climate projections. While, by design, the method does not generate daily values beyond the observed range, it can simulate multi-day extremes that exceed those in the observational record, such as longer heatwaves. The approach is flexible and can be applied to other variables with other constraints, provided that a sufficiently long observational time series is available and the constraints are compatible with the observed data. The generation procedure may thus prove useful for studying potential future extremes and help in general downscaling tasks.

How to cite: Lehning, M., Milojevic, T., and Rivoire, P.: The future is in the past? A flexible resampling approach to generate multivariate time series, EGU General Assembly 2026, Vienna, Austria, 3–8 May 2026, EGU26-16369, https://doi.org/10.5194/egusphere-egu26-16369, 2026.

Reservoirs are increasingly recognized as significant sources of greenhouse gas (GHG) emissions, yet their future emissions under climate change remain poorly quantified. This study evaluates the impact of climate change on net GHG emissions from Feitsui Reservoir, a major water supply reservoir in northern Taiwan, using an integrated modeling approach.

We utilized the multisite Weather Generator (multiWG) to generate future climate projections for three Shared Socioeconomic Pathways (SSP126, SSP245, SSP585) across four 20-year periods (2021-2040, 2041-2060, 2061-2080, 2081-2100), with 1995-2014 as the baseline. A Random Forest model (NSE = 0.8637) was trained to predict reservoir inflow based on temperature and precipitation data. These inflows were input into the G-RES model to calculate net GHG emissions in CO₂-equivalent units, including contributions from both CO₂ and CH₄.

Results reveal that reservoir GHG emissions will increase under all climate scenarios, with magnitude strongly dependent on emission pathways. Under the low-emission scenario (SSP126), emissions increase by 5.2-8.8% across all periods. The intermediate scenario (SSP245) shows moderate increases of 5.4-18.4%. The high-emission scenario (SSP585) demonstrates dramatic escalation, particularly in the late century (2081-2100), where emissions reach 1259.6 gCO₂e/m²/yr—a 45.8% increase. These findings underscore the critical need to consider climate impacts in reservoir management and carbon accounting frameworks.

How to cite: Yeh, F.-W. and Tung, C.-P.: Assessing Climate-Driven Greenhouse Gas Emissions from Feitsui Reservoir Using G-RES Under Multiple SSP Scenarios, EGU General Assembly 2026, Vienna, Austria, 3–8 May 2026, EGU26-16498, https://doi.org/10.5194/egusphere-egu26-16498, 2026.

EGU26-16683 | Orals | NP1.2

Combining emulators and demographics: Building a flexible toolkit for lifetime exposure assessments 

Quentin Lejeune, Rosa Pietroiusti, Amaury Laridon, Niklas Schwind, Carl-Friedrich Schleussner, and Wim Thiery

Across the globe, today’s young generations will be more frequently exposed to climate extremes over their lifetime than earlier generations. Previous work has established this finding by combining simulations of historical and projected trends in climate extremes together with data on past and future demographic changes (Thiery et al. 2021, Grant et al. 2025). However, it has so far focused on a limited set of climate extreme indicators, using climate (impact) simulations from ISIMIP2 and demographics datasets that are now outdated, and did not fully assess uncertainty across the climate impact modelling chain. 


We now build on this existing lifetime exposure framework and combine it with a chain of emulators constituted of a Simple Climate Model (SCM) and the Rapid Impact Model Emulator Extended (RIME-X, Schwind et al., submitted). RIME-X can translate the GMT distributions generated by an SCM for a given emission scenario into spatially explicit distributions of climate or climate impact indicators. It has already been used to produce projections for 40+ indicators derived from ISIMIP3 and other climate model simulations, and this list can be extended to further indicators whose evolution predominantly depends on the level of global warming and for which historical and future simulations are available.   


We also update the lifetime exposure framework to consider more recent demographic data, and package it into a GitHub repository called dem4cli (short for ‘demographics for climate’) that will be made publicly available. We use spatially explicit population reconstructions and projections from the COMPASS project, and national-level life expectancy and cohort size estimates and projections from UNWPP2024.  


This work delivers more robust calculations of lifetime exposure to changes in extremes or climate impacts, by leveraging the ability of the SCM-RIME-X emulator chain to represent both their forced response to emissions as well as the combined uncertainty arising from the GMT response to emissions, the local climate response to global warming, and interannual variability, in combination with updated demographic data. This new framework is designed to generate such policy-relevant information in a more flexible and systematic manner, as it can in theory be applied to any available emission or GMT trajectories, and extended to a broad range of climate hazards.

Thiery, W. et al. Intergenerational inequities in exposure to climate extremes. Science 374, 158–160 (2021) 

Grant, L., Vanderkelen, I., Gudmundsson, L. et al. Global emergence of unprecedented lifetime exposure to climate extremes. Nature 641, 374–379 (2025) 

Schwind et al. RIME-X v1.0: Combining Simple Climate Models, Earth System Models, and Climate Impact Models into a Unified Statistical Emulator for Regional Climate Indicators. Geoscientific Model Development (submitted) 

How to cite: Lejeune, Q., Pietroiusti, R., Laridon, A., Schwind, N., Schleussner, C.-F., and Thiery, W.: Combining emulators and demographics: Building a flexible toolkit for lifetime exposure assessments, EGU General Assembly 2026, Vienna, Austria, 3–8 May 2026, EGU26-16683, https://doi.org/10.5194/egusphere-egu26-16683, 2026.

EGU26-16747 | ECS | Orals | NP1.2

The effect of freshwater biases on AMOC stability across the model complexity spectrum 

Amber Boot and Henk Dijkstra

A collapse of the Atlantic Meridional Overturning Circulation (AMOC) would have strong consequences for the global climate system.  Assessing whether the AMOC will collapse in the future is difficult since current Earth System Models (ESMs) have biases. An earlier study using an intermediate complexity Earth system model (EMIC) showed the potential effect of freshwater biases on AMOC stability.  However, the used model has a limited ocean model with respect to the used  resolution and processes represented compared to ESMs. Here, we supplement the EMIC simulations with simulations of an ocean-only model using the same resolution as is typically used in ESMs. This allows us to study the effect of ocean resolution on the physical mechanism controlling the effect of freshwater biases on AMOC stability. We find that both the intermediate complexity and the ocean-only model behave qualitatively similar. In both models freshwater biases influence AMOC stability where negative (positive) biases in the Indian Ocean tend to stabilize (destabilize) the AMOC, whereas the opposite applies to biases in the Atlantic Ocean. Based on the freshwater biases present in most ESMs, our results suggest that most ESMs have a too stable AMOC and might therefore underestimate the probability of an AMOC collapse under future emission scenarios.

How to cite: Boot, A. and Dijkstra, H.: The effect of freshwater biases on AMOC stability across the model complexity spectrum, EGU General Assembly 2026, Vienna, Austria, 3–8 May 2026, EGU26-16747, https://doi.org/10.5194/egusphere-egu26-16747, 2026.

EGU26-17291 | ECS | Posters on site | NP1.2

Using Ice Cores and Gaussian Process Emulation to Recover Changes in the Greenland Ice Sheet During the Holocene 

Irene Malmierca Vallet, Louise C. Sime, Jochen Voss, Diego Fasoli, and Kelly Hogan

The shape and extent of the Greenland Ice Sheet (GIS) during the Holocene remain a matter of considerable debate, with existing studies proposing a wide range of reconstructions. In this study, we aim to combine stable water isotopic information from ice cores with outputs from isotope-enabled climate models to investigate this problem. Directly exploring the space of possible ice sheet geometries through numerical simulations is computationally prohibitive. To address this challenge, we plan to develop a Gaussian process emulator that will serve as a statistical surrogate for the full climate model. The emulator will be trained on the results of a limited number of carefully designed simulations and will be used to enable fast, probabilistic predictions of model outputs at untried inputs. The inputs will consist of GIS morphologies, parameterized using a dimension-reduction technique adapted to the spherical geometry of the ice sheet. Using predictions from the emulator, we will explore the range of ice sheet morphologies that are compatible with available ice-core isotope measurements and other complementary observational data, including those collected during recent KANG-GLAC expeditions, with the goal of ultimately reducing uncertainty in reconstructions of Holocene GIS morphology.

How to cite: Malmierca Vallet, I., Sime, L. C., Voss, J., Fasoli, D., and Hogan, K.: Using Ice Cores and Gaussian Process Emulation to Recover Changes in the Greenland Ice Sheet During the Holocene, EGU General Assembly 2026, Vienna, Austria, 3–8 May 2026, EGU26-17291, https://doi.org/10.5194/egusphere-egu26-17291, 2026.

EGU26-18639 | Posters on site | NP1.2

The compact Earth system model OSCAR v4 

Thomas Gasser, Biqing Zhu, Xinrui Liu, Danni Zhang, Yuqin Lai, and Gaurav Shrivastav

OSCAR is an open-source reduced-complexity Earth system model designed to probabilistically emulate the coupled climate–carbon–chemistry system with low computational cost. Following a preivously published evaluation of OSCAR v3.1 against observations and CMIP6 Earth system models, we present OSCAR v4, which incorporates a range of structural, numerical, and methodological improvements. Key developments include enhanced numerical stability, modularization of the code to allow running submodels independently, revised and streamlined modules, and recalibration using the latest AR6, CMIP6, and TRENDY datasets. Monte Carlo sampling has been improved using continuous probability distributions, and the constraining strategy now leverages Latin-hypercube sampling combined with probability integral transforms to provide more robust probabilistic ensembles compatible with observations. Alongside core model improvements, OSCAR v4 will introduce a suite of user-oriented functionalities and a full online documentation, facilitating broader adoption and reproducibility.

We illustrate the performance of OSCAR v4 through participation in the Reduced Complexity Model Intercomparison Project (RCMIP) phase 3 exercise. This benchmarking demonstrates the model’s ability to reproduce the spread of global temperature and carbon-cycle responses observed in more complex Earth system models, while providing rapid, policy-relevant probabilistic projections. Given it's level of complexity, OSCAR v4 is positioned as a versatile tool bridging comprehensive Earth system models and the simpler reduced-complexity approaches for large-scale climate assessments.

How to cite: Gasser, T., Zhu, B., Liu, X., Zhang, D., Lai, Y., and Shrivastav, G.: The compact Earth system model OSCAR v4, EGU General Assembly 2026, Vienna, Austria, 3–8 May 2026, EGU26-18639, https://doi.org/10.5194/egusphere-egu26-18639, 2026.

EGU26-19277 | Orals | NP1.2

From scenarios to impacts – an emulation of regional climate impacts and their uncertainties using the CMIP7 mitigation scenarios    

Daniel Hooke, Camilla Mathison, Eleanor Burke, Chris Jones, Laila Gohar, and Andy Wiltshire

The PRIME (Mathison et al. 2025) framework provides a fast response tool to look at climate impacts for up-to-date mitigation scenarios. PRIME combines the FaIR simple climate model and pattern scaling of Earth System Models (ESMs) with the JULES land surface model to quantify spatially resolved climate impacts. In addition, PRIME samples uncertainty from both the spatial patterns of CMIP6 ESMs and the probabilistic configuration of the latest version of FaIR. 

We present applications of this framework to explore impacts on both the earth system and potential impacts on societies, using new scenarios produced for CMIP7. From an earth system perspective, we use an updated configuration of JULES incorporating permafrost processes and fire to look at the impact of the northern high latitude net ecosystem balance. In terms of societal impacts, we simulate the potential impacts of climate change on agricultural drought of rain fed crops during the growing season. This analysis includes a quantification of the uncertainty derived from the global mean climate response and the spatial responses of ESMs. Results from PRIME will also be part of the FastMIP project. 

How to cite: Hooke, D., Mathison, C., Burke, E., Jones, C., Gohar, L., and Wiltshire, A.: From scenarios to impacts – an emulation of regional climate impacts and their uncertainties using the CMIP7 mitigation scenarios   , EGU General Assembly 2026, Vienna, Austria, 3–8 May 2026, EGU26-19277, https://doi.org/10.5194/egusphere-egu26-19277, 2026.

EGU26-19612 | ECS | Posters on site | NP1.2

Accounting for Aerosols in Climate Mitigation Pathways 

Tomás Arzola Röber, Thomas Bruckner, and Johannes Quaas

To meet Paris-aligned climate goals and minimize temperature overshoot and its impacts, rapid and deep reductions in greenhouse-gas emissions from fossil-fuel combustion are required. Climate risk projections are strongly affected by uncertainty in anthropogenic aerosol effective radiative forcing (ERF) and by the co-evolution of air-pollutant emissions under decarbonization pathways. Because running large Earth System Model (ESM) ensembles remains computationally expensive for uncertainty quantification and broad policy-scenario exploration, reduced-complexity climate emulators are needed for efficient, transparent, and observation-connected assessments.

Here we develop an aerosol extension to the simple climate model (SCM) FaIR that emulates aerosol ERF from global anomalies in aerosol optical depth (ΔAOD) relative to a pre-industrial baseline for different species. Aerosol ERF is computed using a constrained parameterization that separates aerosol–radiation and aerosol–cloud interactions, with key parameters represented probabilistically and constrained by observational and model-based lines of evidence.

To emulate ΔAOD from emissions pathways, we implement an interpretable mapping calibrated to CMIP6 ESM output. An effective linear relationship between emission and burden anomalies is fitted using a single parameter that aggregates yield and lifetime effects. In a second step, we fit an effective optical parameter linking burden perturbations to ΔAOD. This produces model-dependent parameter distributions that enable propagation of both parametric uncertainty and between-model spread. In addition, we implement an integrated-assessment-model-based relationship linking air-pollutant emissions to CO₂ emissions under different air-quality policy stringencies, interpolated into a continuous air-quality parameter suitable for exploring uncertainty and its interaction with decarbonization trajectories.

We perform Monte Carlo ensembles sampling aerosol-ERF parameters, CMIP6-calibrated aerosol–AOD mappings, air-quality policy stringency, and net-zero timing, and evaluate impact-relevant climate risk metrics including peak warming, probability of remaining below 1.5 °C, threshold crossing year, overshoot duration, and warming rates computed over multiple near-term and decadal windows. Preliminary results show strong dependence of peak temperature outcomes on net-zero timing, while threshold-based metrics and warming rates exhibit pronounced sensitivity to air-quality assumptions, consistent with a partial loss of aerosol cooling under stricter pollution controls. Overall, the results indicate non-linear interactions between decarbonization timing, air-quality stringency, and warming-rate responses. The emulator provides a scalable basis for robust climate risk screening and for coupling SCM trajectories to impact assessments.

Keywords: Climate Change, Mitigation, Aerosols, Effective Radiative Forcing, Climate Emulators, Climate Modeling, CMIP6 Calibration, Air-quality Policy, Overshoot

How to cite: Arzola Röber, T., Bruckner, T., and Quaas, J.: Accounting for Aerosols in Climate Mitigation Pathways, EGU General Assembly 2026, Vienna, Austria, 3–8 May 2026, EGU26-19612, https://doi.org/10.5194/egusphere-egu26-19612, 2026.

EGU26-20117 | Posters on site | NP1.2

Applying GWP* to Long-Term Climate Pathways and Fluorinated Gases 

Michelle Cain, Vikas Patel, Matteo Mastropierro, Katsumasa Tanaka, Stuart Jenkins, and Myles Allen

Greenhouse gas emission metrics are widely used for comparing climate impacts of different gases and for guiding mitigation policy. Conventional metrics such as GWP100 perform well for representing the warming effects of long-lived gases which behave like CO₂ but poorly for short-lived climate pollutants (SLCPs). Methane (CH4) is the most important SLCP and has been the main focus of alternative metrics. GWP* was developed to more accurately capture impact on global warming, particularly from stable and declining CH4 emissions which are not well served by GWP100. This means that GWP* better connects emissions pathways to long-term temperature targets (Cain et al., 2022). Previous studies optimised GWP* for CH4 for a limited range of scenarios up to 2100. However, future mitigation pathways involve a wider range of gases and transition speeds, overshoot behaviour, and long-term stabilization beyond this period. In addition, highly radiatively efficient fluorinated gases are increasingly important in mitigation strategies yet have not been demonstrated with the GWP* framework. In this study, we systematically test the performance of GWP* across an expanded set of emissions scenarios, including rapid mitigation, delayed action, and prolonged temperature overshoot pathways, and extend the analysis to multi-century time horizons with an optimisation of the flow term of GWP* (Mastropierro et al., 2025). We further develop and evaluate a generalized formulation of GWP* for fluorinated gases with diverse atmospheric lifetimes. The outcomes examine the performance of GWP* under realistic transition pathways and its representation of temperature responses for fluorinated gases. This work supports the development of more physically consistent multi-gas emission metrics for climate targets, carbon budgeting, and policy design, as it is a simple tool to calculate how much global warming is added or avoided by increasing or cutting SLCPs such as F-gases.

Cain, M., Jenkins, S., Allen, M.R., Lynch, J., Frame, D.J., Macey, A.H., Peters, G.P. Methane and the Paris Agreement temperature goals. Philosophical Transactions of the Royal Society A: Mathematical, Physical and Engineering Sciences 380 (2022). https://doi.org/10.1098/rsta.2020.0456

Mastropierro, M., Tanaka, K., Melnikova, I. et al. Testing GWP* to quantify non-CO2contributions in the carbon budget framework in overshoot scenarios. npj Clim Atmos Sci 8, 101 (2025). https://doi.org/10.1038/s41612-025-00980-7

How to cite: Cain, M., Patel, V., Mastropierro, M., Tanaka, K., Jenkins, S., and Allen, M.: Applying GWP* to Long-Term Climate Pathways and Fluorinated Gases, EGU General Assembly 2026, Vienna, Austria, 3–8 May 2026, EGU26-20117, https://doi.org/10.5194/egusphere-egu26-20117, 2026.

EGU26-20145 | Posters on site | NP1.2

Investigating the possibility of rare spontaneous AMOC transitions in the intermediate complexity climate model FAMOUS. 

Jeroen Wouters, Guannan Hu, Jochen Bröcker, and Robin Smith

Earth System Models of Intermediate Complexity (EMICs) allow for fast exploration of large-scale climate dynamics. These models thus enable the development and testing of large-ensemble-based techniques that would be too costly with more realistic climate models.

In this ongoing study we develop a rare event simulation setup to explore the possibility of a spontaneous collapse of the Atlantic Meridional Overturning Circulation (AMOC) in the FAMOUS model. FAMOUS is a low-resolution, coupled atmosphere-ocean general circulation model derived from the UK Met Office’s Unified Model specifically designed for efficient, long-duration and ensemble climate simulations. FAMOUS has previously been used to investigate the hysteresis of the Atlantic Meridional Overturning Circulation under freshwater hosing.

We apply a genealogical particle analysis (GPA) algorithm that is designed to probe the possibility of spontaneous AMOC transitions. The method initiates an ensemble of realisations in the "on"-state of the AMOC and clones ensemble members at regular intervals  that are showing a low AMOC.

Contrary to recent results in another EMIC, a straightforward sampling based on the AMOC indicator does not result in any spontaneous transitions to the AMOC "off"-state. To improve the selection of potentially exceedingly rare trajectories, we therefore investigate statistical methods to identify physical variables that correlate with the state of the AMOC ahead of time, to be used as selection criteria in the GPA algorithm.

How to cite: Wouters, J., Hu, G., Bröcker, J., and Smith, R.: Investigating the possibility of rare spontaneous AMOC transitions in the intermediate complexity climate model FAMOUS., EGU General Assembly 2026, Vienna, Austria, 3–8 May 2026, EGU26-20145, https://doi.org/10.5194/egusphere-egu26-20145, 2026.

EGU26-20975 | ECS | Posters on site | NP1.2

Modelling Mesoarchaean climate: Economic implications  

Lisa Wasitschek, Hartwig E. Frimmel, Nina Hiby, and Felix Pollinger

The Witwatersrand Basin on the Kaapvaal Craton hosts the world’s largest gold province, with the vast majority of gold concentrated in the 2.90–2.79 Ga Central Rand Group, whereas the slightly older 2.95–2.91 Ga West Rand Group is largely barren despite comparable sedimentary characteristics. This contrast has been attributed to intensified chemical weathering during Central Rand Group times, which promoted enhanced gold mobilisation from the Archaean hinterland. However, the climatic and environmental drivers of this weathering intensification remain poorly constrained. To address this, we investigated Mesoarchaean climate controls using the Planet Simulator (PlaSim), an Earth system model of intermediate complexity. We conducted 140 PlaSim simulations to quantify the climatic sensitivity to atmospheric greenhouse gas concentrations, continental surface area, surface albedo, and land configuration. CO₂-equivalent concentrations (3–30 %), land coverage (8–28 %), and albedo (0.15–0.30) were systematically varied across different land distributions (equatorial, polar and spread over different latitudes).

Next to the well-known effect of global warming under increased greenhouse gas concentrations, our results show that increasing continental area generally results in global cooling due to the higher albedo of land surfaces relative to oceans, particularly when land was concentrated at low latitudes. This cooling effect becomes pronounced once land exceeds approximately 13 % of Earth’s surface. At high latitudes, land has minimal climatic impact because of the low incoming radiation angle that leads to less absorption. Exceptions are noted under conditions of low greenhouse gas concentrations and low surface albedo, at which limited land growth could slightly enhance warming. Among the tested land positions, the scenario with land spread over different latitudes resulted in the highest climate sensitivity.

Overall, our results indicate that land distribution alone was unlikely to have caused global warming during the Mesoarchaean, and this climatic influence was probably dampened by a more rapid carbon cycle at that time. Instead, elevated atmospheric greenhouse gas levels emerge as the dominant driver of warming and enhanced chemical weathering. The climatic transition around ~2.9 Ga may further reflect the emergence of extensive low-albedo mafic or ultramafic surfaces and/or the latitudinal migration of the Kaapvaal Craton into a more radiatively sensitive, low-latitude zone. These combined factors likely contributed to intensified weathering, increased gold leaching, and the gold megaevent responsible for the formation of the Witwatersrand ores.

How to cite: Wasitschek, L., Frimmel, H. E., Hiby, N., and Pollinger, F.: Modelling Mesoarchaean climate: Economic implications , EGU General Assembly 2026, Vienna, Austria, 3–8 May 2026, EGU26-20975, https://doi.org/10.5194/egusphere-egu26-20975, 2026.

EGU26-21970 | ECS | Posters on site | NP1.2

Simulating NAO-driven AMOC collapse in the PlaSim-LSG Climate Model 

Arianna Magagna, Giuseppe Zappa, Matteo Cini, and Susanna Corti

The Atlantic Meridional Overturning Circulation (AMOC) is a critical component of the global climate system and its potential for abrupt collapse represents a significant tipping point. Our project investigates whether a persistent negative phase of the North Atlantic Oscillation (NAO), a dominant mode of atmospheric variability, can induce an AMOC collapse in the absence of external perturbations within the coupled PlaSim-LSG climate model of intermediate complexity. A control simulation establishes a baseline climatology, confirming that NAO variability leads AMOC fluctuations by approximately one year. To overcome the computational limitation of simulating rare events, we implement a rare event algorithm (GKLT) that efficiently biases the model toward trajectories with negative NAO conditions over 125-year simulations. The results reveal a fundamental bistability in the system. While persistent negative NAO forcing can trigger an AMOC collapse, the outcome is probabilistic: out of six independent ensemble simulations, four evolved entirely into a collapsed state (∼ 12 Sv), one remained entirely vigorous (∼ 23 Sv) and one split into both outcomes. A cluster-based analysis traces this divergence to the early amplification of small differences in North Atlantic heat fluxes, convection and sea-ice cover. These findings show that internal atmospheric variability alone can force the AMOC across a tipping point, highlighting the role of internal climate dynamics in shaping climate transitions.

How to cite: Magagna, A., Zappa, G., Cini, M., and Corti, S.: Simulating NAO-driven AMOC collapse in the PlaSim-LSG Climate Model, EGU General Assembly 2026, Vienna, Austria, 3–8 May 2026, EGU26-21970, https://doi.org/10.5194/egusphere-egu26-21970, 2026.

EGU26-1499 | ECS | Posters on site | ESSI3.4

Navigating legacy Earth System Model software 

Lakshmi Aparna Devulapalli

As a Research Software Engineer in the natESM project, you have the opportunity to work with a wide range of Earth System Models (ESMs) developed by the German scientific community. Many of these models, originating in the 1990s, were predominantly written in Fortran. While the broader scientific software world has since transitioned toward languages such as C/C++ and Python, the ESM community is still in the process of catching up. As a result, legacy Fortran code—often 20 years old or more—presents unique and sometimes amusing challenges when attempting to adapt or port to modern technologies.

This talk offers a humorous look at these challenges through the eyes of an RSE navigating outdated code in order to accomplish present-day tasks. Topics will include unsustainable methods of structuring software, relic configuration files used for input, ambiguous naming conventions, unused or nonfunctional code that has never been removed, version control practices that can be improved, and other long-standing programming habits that need to evolve. The session will also highlight more modern and maintainable alternatives to these practices, offering a lighthearted yet constructive perspective on bringing legacy ESM code into the future.

How to cite: Devulapalli, L. A.: Navigating legacy Earth System Model software, EGU General Assembly 2026, Vienna, Austria, 3–8 May 2026, EGU26-1499, https://doi.org/10.5194/egusphere-egu26-1499, 2026.

natESM is a project that brings together German resources to develop a seamless, multiscale Earth System Modelling framework that can serve multiple purposes. This system is composed of several independent and diverse software models from the community, each addressing different parts of the Earth system. Given the variety of programming languages, model sizes and software architectures involved, as well as different experience among the responsible model developers, challenges arise in portability, performance and software quality. 

A key part of the natESM approach is the technical support to model developers provided by Research Software Engineers (RSEs). Their work focuses not only on integration, portability and performance, but also on systematically improving software quality within and across model components. This talk will outline the progress made so far, highlight lessons learned from the RSE-scientist collaborations, and present our future plans for assessing and enhancing software quality. The experiences and methods developed in natESM might serve as an example for improving software sustainability in Earth System Modeling more broadly.

How to cite: Loch, W. J.: The natESM Journey for Improving Software Quality in Earth System Modelling, EGU General Assembly 2026, Vienna, Austria, 3–8 May 2026, EGU26-1645, https://doi.org/10.5194/egusphere-egu26-1645, 2026.

Scientific software often begins as an internal research tool developed by scientists rather than trained software engineers, resulting in limited usability, documentation, and maintainability. emiproc, a tool for processing emission inventories for atmospheric chemistry and transport models, originally followed this trajectory: it grew organically within our laboratory, offered only a command-line interface, and lacked a clear structure, extensibility, and user-oriented documentation. We recently undertook a full modernization of emiproc following the best practices in scientific software development: redesign of the code base into modular components, consistent object oriented Python API, automated testing with continuous integration, extensive documentation for both users and developers and publication in the Journal of Open Source Software. The updated software now supports some of the most widely used emission inventories such as EDGAR and CAMS, and more specific ones like the City of Zurich inventory, and produces output for various transport models like ICON-ART, WRF, or GRAL. We will highlight our approaches for transforming emiproc into a sustainable and user-friendly tool and reflect on the challenges we encountered along the way. By sharing our experience, we aim both to contribute to the discussion on improving scientific software development and to learn from the approaches used by others. 

How to cite: Constantin, L. and Brunner, D.: Scientific Software Developement: Lessons from our Emission inventory processing software emiproc  , EGU General Assembly 2026, Vienna, Austria, 3–8 May 2026, EGU26-3484, https://doi.org/10.5194/egusphere-egu26-3484, 2026.

Geochemistry π is an open-source automated machine learning Python framework. Geochemists need only provide tabulated data (e.g. excel spreadsheet) and select the desired options to clean data and run machine learning algorithms. The process operates in a question-and-answering format, and thus does not require that users have coding experience. Version 0.7.0 includes machine learning algorithms for regression, classification, clustering, dimension reduction and anomaly detection. After either automatic or manual parameter tuning, the automated Python framework provides users with performance and prediction results for the trained machine learning model. Based on the scikit-learn library, Geochemistry π has established a customized automated process for implementing machine learning. The Python framework enables extensibility and portability by constructing a hierarchical pipeline architecture that separates data transmission from algorithm application. The AutoML module is constructed using the Cost-Frugal Optimization and Blended Search Strategy hyperparameter search methods from the A Fast and Lightweight AutoML Library, and the model parameter optimization process is accelerated by the Ray distributed computing framework. The MLflow library is integrated into machine learning lifecycle management, which allows users to compare multiple trained models at different scales and manage the data and diagrams generated. In addition, the front-end and back-end frameworks are separated to build the web portal, which demonstrates the machine learning model and data science workflow through a user-friendly web interface. In summary, Geochemistry π provides a Python framework for users and developers to accelerate their data mining efficiency with both online and offline operation options. All source code is available on GitHub  (https://github.com/ZJUEarthData/geochemistrypi), with a detailed operational manual catering to both users and developers (https://geochemistrypi.readthedocs.io/en/latest/).

How to cite: ZhangZhou, J. Z.: Geochemistry π: Machine Learning for Geochemists Who Don’t Want to Code, EGU General Assembly 2026, Vienna, Austria, 3–8 May 2026, EGU26-5192, https://doi.org/10.5194/egusphere-egu26-5192, 2026.


Advances in computing, statistics, and machine learning (ML) techniques have significantly changed research practices across disciplines. Despite Fortran’s continued importance in scientific computing and long history in data-driven prediction, its statistics and ML ecosystem remains thin. FSML (Fortran Statistics and Machine Learning) is developed to address this gap and make data-driven research with Fortran more accessible. 

The following points are considered carefully in its development and each come with their own challenges, solutions, and successes: 

  • Good sustainable software development practices: FSML is developed openly, conforms to language standards and paradigms, uses a consistent coding and comment style, and includes examples, tests, and documentation. A contributor’s guide ensures consistency for future contributions. 
  • Accessibility: FSML keeps the code clean and simple, avoids overengineering, and has minimal requirements. Additionally, an example-rich html documentation and tutorials are automatically generated with the FORtran Documenter (FORD) from code, comments, and simple markdown documents. Furthermore, it is developed to support compilation with LFortran (in addition to GFortran), so it can be used interactively like popular packages for interpreted languages. 
  • Community: FSML integrates community efforts and feedback. It uses the linear algebra interfaces of Fortran’s new de-facto standard library (stdlib) and the fortran package manager (fpm) for easy building and distribution. Its permissive licence (MIT) allows developers to integrate FSML into their projects without the restrictions often imposed by other licenses. Its simplicity, documentation, contributor’s guide, and GitHub templates remove barriers for new contributors and users. 
  • Communication: FSML updates are shared through a variety of methods with different communities. This includes a journal article (https://doi.org/10.21105/joss.09058) for visibility among academic colleagues, frequently updated online documentation (https://fsml.mutz.science/), social media updates, as well as a blog and Fortran Discourse posts to keep Fortran’s new and thriving online community updated. 

Early successes of FMSL’s approach and design include: 1) Students with little coding experience were able to learn the language and use library with only Fortran-lang’s tutorials and FSML’s documentation; 2) early career researchers with no prior experience in Fortran used FSML’s functions to conduct research for predicting future climate extremes; 3) FSML gained a new contributor and received a pull request only days after its first publicised release. 

The development of FSML demonstrates the merits of using good and open software development practices for academic software, as well as the potential of using the new Fortran development ecosystem and building bridges to the wider (non-academic) developer community. 

How to cite: Mutz, S. G.: Developing a modern Fortran statistics and machine learning library (FSML) , EGU General Assembly 2026, Vienna, Austria, 3–8 May 2026, EGU26-5393, https://doi.org/10.5194/egusphere-egu26-5393, 2026.

EGU26-6222 | ECS | Posters on site | ESSI3.4

Preparing for an Operational Environment: Software Development Standards in the Integrated Greenhouse Gas Monitoring System for Germany 

Diego Jiménez de la Cuesta Otero and Andrea Kaiser-Weiss

Modern scientific projects typically rely on software, e.g., for implementing numerical models, performing data pre- and postprocessing, solving inverse problems, or assimilating observations. Consequently, the reliability and reproducibility of scientific results critically depend on software quality. Scientific results are also intended to be shared or reused, and so is the software that produces them: especially in operational settings, where traceability and maintainability are essential. Therefore, a sustainable software development strategy becomes key to a project's success. Nevertheless, often software standards are treated as a secondary concern. This can lead to difficulties when introducing new features, delays in users' projects, limited reproducibility, strained collaborations, and ultimately lack of suitability for operational use.
 
We present the case of the German Weather Service (DWD) contributions within the Integrated Greenhouse Gas Monitoring System for Germany (ITMS). The primary objective of ITMS is the verification of greenhouse gas emissions, which imposes particularly high requirements on the results' traceability and reproducibility. Accordingly, most if not all software-based components of our system should adhere to software development standards that ensure these requirements. We provide an overview of our software development standards and their application, and discuss lessons learned that are transferable to both legacy and newly developed scientific software projects.

How to cite: Jiménez de la Cuesta Otero, D. and Kaiser-Weiss, A.: Preparing for an Operational Environment: Software Development Standards in the Integrated Greenhouse Gas Monitoring System for Germany, EGU General Assembly 2026, Vienna, Austria, 3–8 May 2026, EGU26-6222, https://doi.org/10.5194/egusphere-egu26-6222, 2026.

EGU26-7565 | Orals | ESSI3.4

The Modular Earth Submodel System (MESSy): lessons learned from 20+ years of continuous development 

Patrick Jöckel, Astrid Kerkweg, Kerstin Hartung, and Bastian Kern

Earth System Models (ESMs) aim at replicating the essence of the Earth Climate System in numerical simulations on high performance computing (HPC) systems. The underlying software is often rather complex, comprising several source code entities (modules and libraries, sometimes combining different programming languages), and has in many cases grown over decades. ESMs are usually structured as “multi-compartment” models, i.e. disassembled into a set of different components, each of which describes a different compartment in the Earth System, such as the atmosphere, the land surface, the ocean, the cryosphere, the biosphere, etc. Each compartment model, in turn, comprises a series of algorithms (numerical solvers, parametrizations), each of which represents a specific physical, chemical or socio-economic process. The behaviour of the “system as a whole” (i.e., the development of its state over time, its response to perturbations) is characterized by non-linear interactions and feedbacks between the different compartments and processes.

The implementation of such numerical models representing these inter-compartment and inter-process connections (i.e. the coupling) poses a challenging task for the software development, in particular given the need for (scalable) continuous further development and integration of new components, aiming at keeping pace with our knowledge about the real Earth System. Common requirements to such software are maintainability, sustainability (e.g. for new HPC architectures), resource efficiency (performance at run-time), but also development scalability.

More than twenty years ago (in 2005) we proposed the Modular Earth Submodel System (MESSy) as a potential new approach to Earth System modelling. Here, we present how we started as an “atmospheric chemistry add-on” to a specific General Circulation Model, but already with a wider range of applications in mind. We further show, how we went through our 2nd development cycle, finally arriving at our current state, the MESSy Integrated Framework that is soon to be released Open Source. Although our 4 major software design principles (will be presented!) did not change significantly from the early stage, we had to undergo several implementation revisions to reach its current state. Despite the continuous development, MESSy was always “state-of-the art” and “in operation”, i.e. used for scientific research. Thus, in retrospect, we present some of the milestones achieved by “pragmatic” software engineering in practice.

How to cite: Jöckel, P., Kerkweg, A., Hartung, K., and Kern, B.: The Modular Earth Submodel System (MESSy): lessons learned from 20+ years of continuous development, EGU General Assembly 2026, Vienna, Austria, 3–8 May 2026, EGU26-7565, https://doi.org/10.5194/egusphere-egu26-7565, 2026.

EGU26-7637 | Posters on site | ESSI3.4

Insights and tips for maintainability, robustness, usability, and reproducibility of geo-scientific models 

Konstantin Gregor, Benjamin Meyer, Joao Darela-Filho, and Anja Rammig

The complexity of geoscientific models, from pre-processing, model execution, and post-processing, poses major challenges to maintainability, reproducibility, and accessibility, even when FAIR data principles are followed.

Based on a survey of the 20 dynamic global vegetation models participating in the Global Carbon Project, we present the current state of, and potential improvements in, practices of software engineering and reproducibility within the community.
We also share notable successful practices from the community that could be helpful for all geo-scientists, including
- version control
- workflow management systems
- containerization
- automated documentation
- continuous integration
- automated visualizations

These approaches enable reproducible, portable, and automated workflows, improve code reliability, and enhance access to scientific results.

We conclude with a showcase of a fully reproducible and portable workflow implemented for one model, illustrating how these practices can be implemented by other modeling communities. This example can serve as a practical resource for improving reproducibility, accessibility, and software engineering standards across the geosciences.

How to cite: Gregor, K., Meyer, B., Darela-Filho, J., and Rammig, A.: Insights and tips for maintainability, robustness, usability, and reproducibility of geo-scientific models, EGU General Assembly 2026, Vienna, Austria, 3–8 May 2026, EGU26-7637, https://doi.org/10.5194/egusphere-egu26-7637, 2026.

EGU26-8659 | Orals | ESSI3.4

Improving long-term maintainability of the ACCESS models while transitioning to new architectures: challenges and opportunities 

Micael J. T. Oliveira, Edward Yang, Manodeep Sinha, and Kelsey Druken

Australia’s Climate Simulator, ACCESS-NRI, is Australia’s National Research Infrastructure (NRI) for climate modelling, supporting the development and community use of the Australian Community Climate and Earth System Simulator (ACCESS). 

As the ACCESS modelling system evolves to meet user requirements, so does the basic infrastructure that underpins our ability to efficiently run the models, with HPC architectures rapidly shifting towards GPUs, and new developments in Machine Learning disrupting how new models are developed and used. Under such circumstances, it's easy for scientists and software engineers to focus on more pressing matters and spend less time worrying about software maintainability. Although such type of "tactical" programming might bring benefits in the short term, long-term software maintainability and sustainability requires a more strategic approach. 

Using ACCESS-NRI as a case study, this presentation argues that addressing these challenges is not about any single tool or practice, but about adopting an integrated and coordinated strategy for scientific software development. I will describe how ACCESS-NRI is tackling these challenges by bridging skills and training gaps between scientists and software engineers, adopting well-established industry standards where appropriate (e.g. CMake, Git), and embedding software engineering best practices across development workflows. Alongside these technical efforts, addressing the social challenges of collaboratively developing large, open-source software is a key part of our approach, ensuring contributors can work effectively towards shared goals. 

A concrete example is GPU porting within the ACCESS modelling system. Successfully porting code to GPUs has required close collaboration with existing code owners, careful consideration of scientific and performance constraints, and a strong emphasis on avoiding divergent code paths that are difficult to maintain. This experience highlights the importance of the social dimensions of software development: changes cannot simply be imposed, but must be developed collaboratively to balance reliability, performance, portability, and long-term sustainability. 

By reflecting on what has worked—and what has not—this talk aims to share practical lessons that are transferable to other scientific software projects as they grow beyond small research teams into widely used, community-supported systems.

How to cite: Oliveira, M. J. T., Yang, E., Sinha, M., and Druken, K.: Improving long-term maintainability of the ACCESS models while transitioning to new architectures: challenges and opportunities, EGU General Assembly 2026, Vienna, Austria, 3–8 May 2026, EGU26-8659, https://doi.org/10.5194/egusphere-egu26-8659, 2026.

EGU26-8712 | Orals | ESSI3.4

 Modern tools to scale the compilation, testing and deployment of scientific software  

Aidan Heerdegen, Tommy Gatti, Harshula Jayasuriya, Thomas McAdam, Johanna Basevi, and Kelsey Druken

Modern software development practices such as continuous integration compilation, testing and deployment are a requirement for robust and trusted climate model development. However, this can be very challenging to achieve with climate models that often include legacy code requiring very specific versions of scientific libraries and that must run on complex HPC systems.  In addition, climate models have very long support timeframes (5+ years), with a requirement for absolute bitwise reproducibility, which requires precise control and provenance of the entire software stack. 

Australia’s Climate Simulator (ACCESS-NRI), is a national research infrastructure tasked with supporting the development and use of the Australian Community Climate and Earth System Simulator (ACCESS) model suite for the research community. At ACCESS-NRI we use spack, a build from source package manager targeting HPC, to create infrastructure to easily build ACCESS climate models and their supporting software stacks with full provenance and build reproducibility.  

Now the challenge for us at ACCESS-NRI, as an infrastructure supporting a wide range of user needs, is to scale this effort to multiple models, with many permutations of components and versions, without creating a very large support burden for our software engineers.  

We do this by focusing on modularity and generic workflows to achieve our desired scale efficiently. Spack's modular design has meant ACCESS-NRI has been able to create entirely generic GitHub workflows for building, testing and deploying many climate models on our target HPC, Australia’s National Computational Infrastructure (NCI), as well as run test builds on standard Linux virtual machines.  

As a result there is dramatically less support burden, as the CI/CD code is centralised and maintained in one location, and reused in many places. It is also extremely simple to add CI testing for new model components with just a few lines of GitHub Actions code. 

The choice of tools allowing a focus on a modular approach and generic workflows has been validated: we currently support seven models, with nineteen discrete components, and have grown from one deployment in 2023, eleven in 2024 and now twenty-nine in 2025,  as well as many thousands of pre-release test builds in the last quarter alone. This gives us confidence that we can continue to scale efficiently, without a large support burden requiring onerous resourcing that might otherwise place a technical limit on future activities. 

How to cite: Heerdegen, A., Gatti, T., Jayasuriya, H., McAdam, T., Basevi, J., and Druken, K.:  Modern tools to scale the compilation, testing and deployment of scientific software , EGU General Assembly 2026, Vienna, Austria, 3–8 May 2026, EGU26-8712, https://doi.org/10.5194/egusphere-egu26-8712, 2026.

EGU26-10884 | Posters on site | ESSI3.4

Teaming up as domain scientists and research software engineers for a sustainable HELIOS++ scientific software 

Dominic Kempf, Hannah Weiser, Dmitrii Kapitan, and Bernhard Höfle

The Heidelberg LiDAR Operations Simulator (HELIOS) is a scientific software for high-fidelity general-purpose virtual laser scanning (VLS) [1]. Using models for virtual scenes, scanner devices, and platforms, HELIOS allows to reproduce diverse scan scenarios over various geographical environments (forests, cities, mountains) and laser scanning systems (airborne and UAV-borne, mobile, terrestrial). Used for algorithm development, data acquisition planning, and method training for supervised machine learning, HELIOS has been successfully integrated into research workflows across the international laser scanning community.

HELIOS was initially developed in a research-driven environment in Java and released as open-source software [2]. Motivated by growing interest in the scientific community, the codebase was re-implemented in C++ to improve its memory footprint, runtime performance and functionality [3]. Since then, we are actively developing new features. Recent additions include support for dynamic scenes [4], new deflector mechanisms, and plug-ins for other open-source software such as Blender. Considering the continually growing user community, current software development specifically prioritizes quality assurance, reliability, long-term maintainability, and user-friendliness.

Supported by the DFG under the program "Research Software - Quality Assured and Re-usable" [5], the HELIOS++ developer team partnered up with the Scientific Software Center (SSC), a research software engineering service department at Heidelberg University. Combining the expertise of the domain scientist from the HELIOS team and the research software engineers (RSEs) of the SSC, we are strengthening the sustainability and usability of HELIOS. Measures presented in our talk include: Improving testing strategies and Continuous Integration, rewriting the CMake build system, packaging HELIOS as a Conda package, creating standalone installers, introducing a new Python API, and developing new strategies for sharing and reproducing HELIOS simulations. Additionally, we will reflect on the benefits as well as key challenges in fostering fruitful collaborations between domain scientists and RSEs. To this end, we will present as a domain scientist/RSE tandem.

References:

[1] HELIOS++: https://github.com/3dgeo-heidelberg/helios

[2] Bechtold, S., & Höfle, B. (2016): https://doi.org/10.5194/isprs-annals-III-3-161-2016

[3] Winiwarter, L et al. (2022): https://doi.org/10.1016/j.rse.2021.112772

[4] Weiser, H., & Höfle, B. (2026): https://doi.org/10.1111/2041-210x.70189

[5] Project website: https://www.geog.uni-heidelberg.de/en/3dgeo/projects-of-the-3dgeo-research-group/fostering-a-community-driven-and-sustainable-helios-scientific-software

How to cite: Kempf, D., Weiser, H., Kapitan, D., and Höfle, B.: Teaming up as domain scientists and research software engineers for a sustainable HELIOS++ scientific software, EGU General Assembly 2026, Vienna, Austria, 3–8 May 2026, EGU26-10884, https://doi.org/10.5194/egusphere-egu26-10884, 2026.

EGU26-12310 | Posters on site | ESSI3.4

WRF-Chem-Polar: an open, collaborative, and reproducible framework for modeling the polar atmosphere 

Jennie L. Thomas, Lucas Bastien, Ruth Price, Rémy Lapere, Ian Hough, Erfan Jahangir, Lucas Giboni, and Louis Marelle

Over the past 15 years, substantial developments have been made to adapt the regional chemistry-climate model WRF-Chem for applications in polar environments, with a main focus on the Arctic. These developments address key processes that are either absent from, or insufficiently represented in, the standard WRF-Chem distribution, particularly those controlling aerosol-cloud interactions, boundary layer chemistry, and surface-atmosphere coupling over snow, sea ice, and the polar ocean. However, until now, these advances have been distributed across multiple publications, code branches, and project-specific implementations, limiting transparency, reproducibility, and community use.

Here we present WRF-Chem-Polar, a consolidated and openly available modeling framework that integrates our polar-specific model developments into a single, traceable code base. The framework is hosted on GitHub and is structured around two tightly linked components: (i) a unified WRF-Chem-Polar model code that incorporates developments for polar aerosol and cloud processes and (ii) a dedicated infrastructure for compiling, running, and analyzing simulations.

A key objective of WRF-Chem-Polar (including the model code and infrastructure) is to enable transparent model evolution. All developments are tracked through version control, with automated test cases designed to systematically compare model behavior across code versions. This approach allows scientific changes to be evaluated quantitatively, supports regression testing, and facilitates controlled experimentation when introducing new parameterizations or process representations. The infrastructure also provides transparent workflows for simulation setup, post-processing, and diagnostics, improving reproducibility across users and platforms. Code quality, readability, and consistency is improved via coding style guides and modern software tools that include unit testing and automatic enforcement of linting rules.

By making these developments openly accessible and actively maintained, WRF-Chem-Polar lowers the barrier for the community to apply advanced polar chemistry–aerosol–cloud representations, while providing a robust framework for continued development and evaluation. This effort supports both fundamental process studies and applied research and contributes to broader open-science and FAIR modeling and furthers our objective of uptake of our work within the Earth system modeling community.

How to cite: Thomas, J. L., Bastien, L., Price, R., Lapere, R., Hough, I., Jahangir, E., Giboni, L., and Marelle, L.: WRF-Chem-Polar: an open, collaborative, and reproducible framework for modeling the polar atmosphere, EGU General Assembly 2026, Vienna, Austria, 3–8 May 2026, EGU26-12310, https://doi.org/10.5194/egusphere-egu26-12310, 2026.

EGU26-13932 | Orals | ESSI3.4

Software as Scientific Infrastructure: CIG’s Role  in Computational Geodynamics and Lessons from Developing ASPECT 

Rene Gassmöller, Wolfgang Bangerth, Juliane Dannberg, Daniel Douglas, Menno Fraters, Anne Glerum, Timo Heister, Lorraine Hwang, Robert Myhill, John Naliboff, Arushi Saxena, and Cedric Thieulot

Modeling software is integral to computational geodynamics, enabling quantitative investigation of planetary mantle, lithosphere and core dynamics across a wide range of spatial and temporal scales. Over the past two decades, the field’s software ecosystem has shifted significantly: codes that were once developed and maintained within single research groups have increasingly evolved into large, modular packages sustained by multi-institutional and often international collaborations. One important factor in this transition has been the establishment of community organizations like the Computational Infrastructure for Geodynamics (CIG), which has provided coordination and shared capacity that individual groups typically cannot sustain on their own.
In this contribution, I highlight benefits and lessons learned from work within CIG and from the development of the geodynamic modeling software ASPECT (Advanced Solver for Planetary Evolution, Convection, and Tectonics). Community organizations can accelerate scientific software development in several ways. Shared infrastructure (project landing pages, established user forums) improves discoverability and supports software adoption by the community. Targeted support, including seed funding, helps projects invest in feature development and maintenance. By streamlining software release and distribution and promoting robust development and testing workflows, community organizations improve software quality and reliability. Training the next generation of computational geoscientists through workshops, tutorials, and user support, builds shared expertise and makes community software more sustainable. Collectively, these activities reduce duplicated effort, lower barriers to entry for new users and contributors, and create pathways for software to evolve in step with scientific and numerical-method advances.
ASPECT provides a concrete example of this community-driven model. Designed to simulate thermal convection with a primary emphasis on Earth’s mantle, it has now been used for a broad range of applications including crustal deformation, magma dynamics, and fluid flow, convection on icy satellites, deformation of the inner core, and digital twins of mineral physics experiments. This widening scope has been possible because ASPECT prioritizes usability and extensibility, to accommodate evolving model complexity, and leverages modern numerical methods such as adaptive mesh refinement and robust linear/nonlinear solvers. From the start, ASPECT has been designed for large-scale parallel simulations required for problems with small-scale features embedded in mantle-scale domains.  It also strategically builds on established external libraries (e.g., deal.II, Trilinos, p4est) rather than re-implementing core algorithms. ASPECT’s success has been enabled by a well-tested framework, extensive documentation, a plugin architecture that simplifies customization, and active encouragement of community contributions through support and recognition. Together, these elements illustrate how organizational infrastructure and software design choices support long-term development and continued methodological innovation in geodynamic modeling, enabling robust simulations that address increasingly complex scientific questions.

How to cite: Gassmöller, R., Bangerth, W., Dannberg, J., Douglas, D., Fraters, M., Glerum, A., Heister, T., Hwang, L., Myhill, R., Naliboff, J., Saxena, A., and Thieulot, C.: Software as Scientific Infrastructure: CIG’s Role  in Computational Geodynamics and Lessons from Developing ASPECT, EGU General Assembly 2026, Vienna, Austria, 3–8 May 2026, EGU26-13932, https://doi.org/10.5194/egusphere-egu26-13932, 2026.

Process‑based models that explicitly couple soil water and heat transport, canopy radiative transfer, photosynthesis, and surface–atmosphere exchange are increasingly used to connect in‑situ observations with remote‑sensing–relevant land‑surface processes. However, their practical adoption—particularly in heterogeneous urban environments—remains challenging due to complex software dependencies, fragmented preprocessing pipelines, and limited transparency in model configuration. These challenges are exacerbated when such models are accessed through low‑level implementations that are difficult to adapt, reproduce, or extend by domain scientists.

We present rSTEMMUS‑SCOPE, an open‑source R interface to the coupled STEMMUS‑SCOPE modelling framework, designed to apply good practices in scientific software development to a hybrid soil–canopy model that is frequently used by practitioners and researchers interested in ecohydrology, urban climate, and remote sensing. The interface lowers barriers for reproducible experimentation by providing a modular, script‑based workflow that integrates eddy‑covariance forcing, in‑situ soil measurements, vegetation parameters, and multilayer soil discretisation within a transparent R‑based environment that supports from data pre-processing to the visualization of the results.

From a software‑engineering perspective, rSTEMMUS‑SCOPE adopts a modular, script‑based architecture that separates data inputs, model settings, execution, and post‑processing. The package provides reproducible pipelines for preprocessing eddy‑covariance meteorological forcing, precipitation, vegetation parameters, and multilayer soil discretisation (>50 layers), enabling fully scripted end‑to‑end simulations within R. Version‑controlled configuration files, consistent function interfaces, and documented defaults are used to support transparency and extensibility, while example workflows and vignettes lower the entry barrier for users who are domain scientists rather than trained software developers. The design follows a “user‑turned‑developer” paradigm, allowing advanced users to adapt parameterisations and forcing strategies while preserving a stable core interface.

We demonstrate these design choices using an urban case study in a temperate green space in Berlin, where hourly simulations were performed for 2019–2020. Observations from an eddy‑covariance tower and in‑situ soil moisture sensors are used as a software stress test rather than as the primary scientific result. Volumetric soil water content at 60 cm depth was reproduced well (Kling–Gupta Efficiency = 0.82; r = 0.88; α = 1.01), while simulated evapotranspiration captured diurnal and seasonal dynamics (r ≈ 0.67), with systematic biases during low‑energy conditions. Sensitivity experiments illustrate how differences in input data sources and parameter choices propagate through the modelling workflow, highlighting the importance of transparent, reproducible pipelines for diagnosing model behaviour.

We conclude by discussing practical lessons learned in wrapping complex process‑based models in high‑level languages: trade‑offs between modularity and performance, documenting urban‑specific parameter choices without constraining expert use, and testing strategies when upstream physics models are computationally expensive. rSTEMMUS‑SCOPE demonstrates how applying robust software practices enables meaningful, reproducible results and supports early‑career researchers working at the interface of modelling, data, and urban environmental science.

Software availability

rSTEMMUS‑SCOPE (open source): https://github.com/EcoExtreML/rSTEMMUS_SCOPE

How to cite: Duarte Rocha, A. and Aljoumani, B.: rSTEMMUS‑SCOPE: a user‑friendly open‑source R package wrapping a coupled soil–canopy process-based model for urban soil‑moisture and ET — good practices and lessons learned, EGU General Assembly 2026, Vienna, Austria, 3–8 May 2026, EGU26-15058, https://doi.org/10.5194/egusphere-egu26-15058, 2026.

EGU26-16877 | Orals | ESSI3.4

Beyond Good Practices: Designing Scientific Software for Contribution and Reuse 

Eric Hutton, Gregory Tucker, Mark Piper, and Tian Gan

Lowering the barrier to scientific contribution requires more than adopting good software practices; it requires software structures and standards that make contribution and reuse safe, scoped, and sustainable. We describe how the Community Surface Dynamics Modeling System (CSDMS) addresses these challenges through two complementary efforts: the Landlab modeling framework and the Basic Model Interface (BMI).

Landlab is a Python package designed as a platform for building Earth-surface process models. Over time, we discovered its architecture also promoted the user-turned-developer pathway, which has been critical to its success. While good software practices such as automated testing, continuous integration, documentation, and linting provide a foundation of reliability, Landlab’s component-based architecture has been central to enabling contribution. This design offers contributors clearly scoped and isolated entry points for adding new process models without needing to understand or modify the entire codebase. By enabling contributions from a growing set of domain experts and supporting them through shared maintenance infrastructure, this model expands the pool of invested contributors and reduces reliance on a small number of core developers, strengthening the prospects for long-term project sustainability.

The Basic Model Interface (BMI) complements this approach by providing a lightweight, language-agnostic interface standard that defines how models expose their variables, parameters, and time-stepping controls to the outside world. By separating scientific algorithms from model orchestration, BMI enables models to be reused, coupled, and tested across different frameworks without requiring changes to their internal implementations. Ongoing, community-guided work toward BMI 3.0 aims to extend these capabilities by improving support for parallel execution, clearer state management, and optional interface extensions.

Together, Landlab and BMI illustrate how framework design and community-driven standards can reduce technical debt and enable researchers to contribute reusable and interoperable software without requiring them to become full-time software engineers.

How to cite: Hutton, E., Tucker, G., Piper, M., and Gan, T.: Beyond Good Practices: Designing Scientific Software for Contribution and Reuse, EGU General Assembly 2026, Vienna, Austria, 3–8 May 2026, EGU26-16877, https://doi.org/10.5194/egusphere-egu26-16877, 2026.

EGU26-17128 | Posters on site | ESSI3.4

A modularized workflow for processing heterogeneous agricultural land use data 

Antonia Degen, Yi-Chen Pao, and Andrea Ackermann

In Germany each federal state is committed to collect required information on funding, farming practices and land use with an “Integrated Administration and Control System” (IACS) (Deutscher Bundestag 2014).

Based on the land parcel identification system (LPIS) as one of the core elements of IACS (European Commission, 2025), georeferenced data along with ancillary data are collected annually since 2005. Mandatory requirements for checks and on-site validations ensure a high data quality which makes IACS data very suitable for research purposes (Leonhardt 2024). Our goal is to create a nation-wide timeseries based on IACS data, that contains detailed information on land use, animal husbandry and farm statistics and can be used for comprehensive land use, soil, agricultural-policy and biodiversity research. Despite this, IACS data remain underused for scientific research due to the following challenges:

  • Data protection: Obtaining and handling IACS data requires a legal agreement between the research project and the respective federal state including Data Usage Agreements.
  • Data heterogeneity: All federal states have unique data processing workflows and historical changes in processing practices resulting in different data-types, -formats, structure, keys, encodings, etc.
  • Data volume: Large storage volume, processing capacities and back-up systems with high security levels are required. Efficiency and data minimization is an important framework for the design of the processing workflows.


In this contribution we as user-turned-developers, want to show how we utilize our toolbox of open-source software (Linux, Bash, R, PostgreSQL/PostGIS, Python, GitLab), for a suitable modularized workflow to meet these challenges.

The first module is tailored to pre-process the data to its specific federal state qualities. Module two and three contain more general functions to grant machine readability. All data is then processed in a data cleaning workflow and imported into our PostgreSQL/PostGIS database.

We use our database for data harmonization by implementing modularized functions to handle different use cases.

The resulting harmonized datasets are provided to research teams with data protection clearance for federal state and year respectively. Harmonized tables are versioned as releases, to either grant reproducibility as well as to provide necessary updates.

Figure 1 Modularized workflow for IACS data processing towards a nation-wide harmonized timeseries

Reproducibly is granted by using script-based procedures that are stored and versioned in GitLab as well as extensive code documentation and automized file-based processing documentation.

Our modularization process lays the foundation for sustainable handling of complex administrative agricultural data and is a first step towards a software development approach.

Literature

European Commission (2025): Integrated Administration and Control System (IACS). Online available  https://agriculture.ec.europa.eu/common-agricultural-policy/financing-cap/assurance-and-audit/managing-payments_en

Deutscher Bundestag (2014): Gesetz über die Verarbeitung von Daten im Rahmen des Integrierten Verwaltungs- und Kontrollsystems nach den unionsrechtlichen Vorschriften für Agrarzahlungen. InVeKoS- Daten-Gesetz - InVeKoSDG, vom 5 (2019). Online available: https://www.gesetze-im-internet.de/invekosdg_2015/

Heidi Leonhardt, Maximilian Wesemeyer, Andreas Eder, Silke Hüttel, Tobia Lakes, Henning Schaak, Stefan Seifert, Saskia Wolff (2024): Use cases and scientific potential of land use data from the EU’s Integrated Administration and Control System: A systematic mapping review, Ecological Indicators, Volume 167, ISSN 1470-160X, https://doi.org/10.1016/j.ecolind.2024.112709.

How to cite: Degen, A., Pao, Y.-C., and Ackermann, A.: A modularized workflow for processing heterogeneous agricultural land use data, EGU General Assembly 2026, Vienna, Austria, 3–8 May 2026, EGU26-17128, https://doi.org/10.5194/egusphere-egu26-17128, 2026.

EGU26-17569 | Orals | ESSI3.4

Latest Developments in Probtest: Probabilistic Testing for Robust CPU/GPU Validation of Scientific Models 

Annika Lauber, Chiara Ghielmini, Daniel Hupp, and Claire Merker

Porting large numerical models to heterogeneous computing architectures introduces significant challenges for software validation and testing, as results from CPU- and GPU-based executions are typically not bit-identical. These differences arise from variations in floating-point arithmetic, execution order, and the use of architecture-specific mathematical libraries. Traditional regression testing approaches based on exact reproducibility therefore become inadequate, particularly in continuous integration (CI) workflows.

Probtest is a lightweight testing framework developed to address this problem in the ICON numerical weather and climate model. It implements a probabilistic, tolerance-based testing strategy that enables robust numerical consistency checks between CPU and GPU runs while remaining fast and resource-efficient. Tolerances are derived from ensembles generated by perturbing prognostic variables in the initial conditions. From a larger ensemble of CPU reference runs, a representative subset is selected to compute variable-specific tolerance ranges that define acceptable numerical deviations. This approach allows reliable validation across architectures without constraining model development or optimization.

Recent developments focus on improving extensibility, usability, and reproducibility. Support for Feedback Output Files (FOF) has been added, enabling consistency checks for observation-based diagnostics in addition to model state variables. Furthermore, Probtest has been fully containerized, with each release published on Docker Hub. This removes local installation barriers, ensures reproducible testing environments, and simplifies integration into CI pipelines and collaborative development workflows. These developments strengthen Probtest as a practical and portable tool for validating ICON across heterogeneous computing platforms.

How to cite: Lauber, A., Ghielmini, C., Hupp, D., and Merker, C.: Latest Developments in Probtest: Probabilistic Testing for Robust CPU/GPU Validation of Scientific Models, EGU General Assembly 2026, Vienna, Austria, 3–8 May 2026, EGU26-17569, https://doi.org/10.5194/egusphere-egu26-17569, 2026.

EGU26-17829 | Posters on site | ESSI3.4

Evolution of the EPOS Platform Open Source 

Marco Salvi, Valerio Vinciarelli, Rossana Paciello, Daniele Bailo, Alessandro Crocetta, Kety Giuliacci, Manuela Sbarra, Alessandro Turco, Mario Malitesta, Jean-Baptiste Roquencourt, Martin Carrere, Jan Michalek, Baptiste Roy, and Christopher Card

The development of sustainable and reusable scientific software infrastructures remains a significant challenge in geosciences, particularly when transitioning from single-purpose systems to platforms intended for broader community adoption. This presentation shares experiences and lessons learned from developing the EPOS Platform as an open-source, reusable data integration and visualization system, demonstrating how intentional architectural decisions and tooling investments can transform research infrastructure software into widely adoptable solutions.

The EPOS Platform (European Plate Observing System) initially served as the technical backbone for EPOS ERIC (https://www.epos-eu.org/epos-eric), providing integrated access to solid Earth science data across ten thematic domains. Built on a choreography architecture using Docker and Kubernetes, the system successfully fulfilled its original mandate. However, as other research infrastructures expressed interest in similar capabilities, we recognized the potential for broader impact and initiated a strategic shift toward creating a genuinely reusable open-source platform.

The transition required addressing fundamental challenges in software reusability. Initially, deployment necessitated manual configuration and deep infrastructure knowledge, creating significant adoption barriers. To overcome this, we developed the epos-opensource CLI tool (https://github.com/EPOS-ERIC/epos-opensource), a command-line interface with an integrated terminal user interface (TUI) that reduces deployment from a complex manual process to a single command. This tool enables researchers and developers to deploy fully functional instances locally using either Docker Compose or Kubernetes, significantly accelerating both external adoption and internal development workflows.

We released the complete platform under GPL v3 license, ensuring that all code, including that powering the production EPOS Platform (https://www.ics-c.epos-eu.org/), remains open and community-accessible. Within EPOS ERIC, the open-source release and deployment tooling facilitate rapid provisioning of testing environments for developers and metadata contributors. Comprehensive documentation was developed using Docusaurus, following standard open-source practices to provide installation guides, system architecture references, and user tutorials. The EPOS Platform Open Source has been leveraged to enhance data sharing by multiple research initiatives, including ENVRI-Hub NEXT (https://envri.eu/envri-hub-next/), DT-GEO (https://dtgeo.eu/), IPSES (https://www.ipses-ri.it), and Geo-INQUIRE (https://www.geo-inquire.eu/), demonstrating the platform's versatility across different research contexts.

Our experience demonstrates that developing reusable scientific software requires deliberate investment beyond initial functionality. Key factors include comprehensive documentation following community standards, simplified deployment through user-friendly tooling, architectural flexibility for diverse use cases, and genuine open-source practices where production and community code remain unified. These principles, while resource-intensive, are essential for scientific software to achieve meaningful impact and contribute to a more sustainable, collaborative research infrastructure ecosystem.

This presentation will explore the evolution of the EPOS Platform Open Source, demonstrating how strategic investments in deployment tooling, comprehensive documentation, and architectural flexibility enabled the transformation from a single-purpose infrastructure to a widely adoptable community resource.

How to cite: Salvi, M., Vinciarelli, V., Paciello, R., Bailo, D., Crocetta, A., Giuliacci, K., Sbarra, M., Turco, A., Malitesta, M., Roquencourt, J.-B., Carrere, M., Michalek, J., Roy, B., and Card, C.: Evolution of the EPOS Platform Open Source, EGU General Assembly 2026, Vienna, Austria, 3–8 May 2026, EGU26-17829, https://doi.org/10.5194/egusphere-egu26-17829, 2026.

EGU26-20382 | Posters on site | ESSI3.4

User-turned-developer: Scientific software development for a national nutrient policy impact monitoring in Germany 

Max Eysholdt, Maximilian Zinnbauer, and Elke Brandes

Many countries in the EU fail to protect their waters adequately from nitrogen and phosphorus inputs (European Environment Agency. 2024), often originating from agricultural sources (Sutton 2011). Germany was found guilty by the European Court of Justice for insufficient implementation of the EU Nitrates Directive, for protection of waters from nutrient pollution from agriculture (European Court of Justice 2018). In response, Germany introduced a monitoring system for assessing the impact of the recently updated application ordinance, which implements the EU Nitrates Directive. This monitoring creates time series of pollution-related spatial indicators ranging from land use to modelled nutrient budgets. Input data on land use sources the Integrated Administration and Control System. The results are used by German authorities for reporting to the EU as well as national and regional water protection policy.

We present the technical concept, infrastructure and workflows established for this data-intensive, long-term project and discuss challenges and limitations when operating in the science-policy nexus. We aim to share good practices in modularization, automation, and reproducibility, and discuss strategies for efficient maintenance of scientific software development in context of long-term, policy-relevant monitoring projects.

Our system is designed to handle heterogeneous data with different levels of data protection requirements related to General Data Protection Regulation (GDPR). A modular structure was chosen to enhance usability and maintenance. Reproducibility is ensured through version-controlled, script-based software development. For efficiency, consistency and the streamlining of workflows reporting is automated and an ever-growing set of user-faced functions is bundled into a package. To ensure the possibility of advances in data preparation and modelling, a submission-based approach was chosen, recalculating all indicator times series each reporting year. This requires robust data management, reproducibility, and resilient workflows to accommodate evolving input data.

We still face challenges in handling Open Science principles, political stakeholder interests as well as GDPR. Similarly, scientific advances lead to updated results which may conflict with the need for clear and unambiguous outcomes of the authorities. Regular deadlines and stakeholder needs resulted in an organically grown code base, and sometimes cause neglection of quality checks and unit testing. Additionally, interaction between reproducible, script-based solutions and “traditional” workflows based on Microsoft Word are inefficient. The changing structure of the yearly gathered data hinders automatization of data processing. Due to this and the annual advances in the processing of the input data, maintaining the database is also challenging.  This we would like to share and discuss with other teams facing similar problem

Our system is tailored to handle heterogeneous and sensitive data of different sources producing reliable results and accommodating advances in data preparation and modelling in the long run. However, navigating technical limitations, good scientific practice and policymakers’ interests is challenging for us.

Literature

European Court of Justice (2018). European Commission against Federal Republic of Germany. Infringement Proceedings ‐ Directive 91/676/EEC.

European Environment Agency. (2024). Europe's state of water 2024: the need for improved water resilience. Publications Office.

Sutton, Mark A. (Ed.) (2011). The European nitrogen assessment. Sources, effects and policy perspectives. Cambridge 2011.


How to cite: Eysholdt, M., Zinnbauer, M., and Brandes, E.: User-turned-developer: Scientific software development for a national nutrient policy impact monitoring in Germany, EGU General Assembly 2026, Vienna, Austria, 3–8 May 2026, EGU26-20382, https://doi.org/10.5194/egusphere-egu26-20382, 2026.

EGU26-21175 | Orals | ESSI3.4

A Python Dynamical Core for Numerical Weather Prediction 

Daniel Hupp, Mauro Bianco, Anurag Dipankar, Till Ehrengruber, Nicoletta Farabullini, Abishek Gopal, Enrique Gonzalez Paredes, Samuel Kellerhals, Xavier Lapillonne, Magdalena Luz, Christoph Müller, Carlos Osuna, Christina Schnadt, William Sawyer, Hannes Vogt, and Yilu Chen

MeteoSwiss uses the ICON model to produce high-resolution weather forecasts at kilometre scale, with GPU support enabled through an OpenACC-based Fortran implementation. While effective, this approach limits portability, maintainability, and development flexibility. Within the EXCLAIM project, we focus on the dynamical core of the model—responsible for approximately 55% of the total runtime—and explore alternatives based on a domain-specific Python framework. In particular, we reimplemented the computational stencils using GT4Py and integrated them into the existing Fortran codebase, enabling the partial replacement of key components. This hybrid approach aims to improve developer productivity and code adaptability while preserving performance. In this contribution, we present our strategy for developing software for a weather and climate model involving multiple institutions and stakeholders. We present several optimisation techniques and compare the performance of the new implementation with the original OpenACC version. Our results show improved computational efficiency alongside a substantial improvement in the development workflow. Finally, we discuss the practical challenges of integrating Python components into operational numerical weather prediction systems.

How to cite: Hupp, D., Bianco, M., Dipankar, A., Ehrengruber, T., Farabullini, N., Gopal, A., Gonzalez Paredes, E., Kellerhals, S., Lapillonne, X., Luz, M., Müller, C., Osuna, C., Schnadt, C., Sawyer, W., Vogt, H., and Chen, Y.: A Python Dynamical Core for Numerical Weather Prediction, EGU General Assembly 2026, Vienna, Austria, 3–8 May 2026, EGU26-21175, https://doi.org/10.5194/egusphere-egu26-21175, 2026.

EGU26-21181 | ECS | Posters on site | ESSI3.4

Automating Data Quality Checks for Heterogenous Datasets: A scalable approach for IACS data 

Yi-Chen Pao and Boineelo Moyo

The Integrated Administration and Control System (IACS) is a key instrument of the European Union's (EU) Common Agricultural Policy to monitor agricultural subsidies and support evidence-based policy. IACS provides the most comprehensive EU-wide dataset that combines detailed geospatial data with thematic attributes related to land use, livestock and measures, making it highly valuable for research on agri-environmental policies and agrobiodiversity (Leonhardt, et.al., 2024). In Germany, these data are collected independently by 14 federal states, resulting in substantial heterogeneity across datasets in terms of file format, encoding, data structure and level of completeness. These inconsistencies present major challenges for efficient data management, scientific assessments, reproducibility and the long-term reuse of the data.

This contribution presents an ongoing automated framework designed to standardise and validate raw IACS datasets across our data management pipeline, from data collection and harmonisation to data import and long-term management. Our main goal is to reduce redundancy and manual effort in the data quality check process, while enabling scalable and reproducible data quality assurance. The objective is to therefore develop an optimised, non-redundant data check system that captures structural, semantic and geospatial metadata from heterogenous datasets using a single-pass folder scan. To achieve this objective, we focus on the following approaches:

  • Develop an inventory-based data pipeline / architecture: A lightweight inventory object containing metadata for each file in the delivery folder
  • Automate routine and error – prone data quality scripts: Replace manual checks with modular and reusable automated components from a central inventory system
  • Enable reproducible execution and reporting: Implement a Quarto based framework (an open-source system for reproducible computational documents combining code, results and narrative) that produces human readable visualisations for technical and non-technical users

Our system leverages a diverse set of programming tools including R, Quarto, Bash, Python and SQL, from data delivery or collection to data management in the database. The approach is based on an inventory-first architecture: a lightweight yet expressive data structure generated from a single scan of raw input folder with different types of data formats. The inventory then captures essential metadata of each file such as file types, attribute schemas, geospatial extents, and identifier patterns (e.g., farm identifier, land parcel identifier). A consolidated framework of all data check scripts then enables all subsequent quality-check modules to operate efficiently without repeated file access. Executing the consolidated framework performs a range of automated data quality checks such as file integrity verification, cross-file joinability analysis, schema consistency assessment, and geospatial coherence analysis.

The resulting output in the form of an interactive Quarto dashboard then provides a comprehensive first assessment of the delivered data, where all essential metadata and errors of each file can be derived and inspected in one instance. This workflow not only minimises manual work of checking each file separately and error propagation but also ensures traceable, documented logs.

Our results show how implementing such automated data checks considerably accelerates harmonization processes and improves the data management lifecycle.

How to cite: Pao, Y.-C. and Moyo, B.: Automating Data Quality Checks for Heterogenous Datasets: A scalable approach for IACS data, EGU General Assembly 2026, Vienna, Austria, 3–8 May 2026, EGU26-21181, https://doi.org/10.5194/egusphere-egu26-21181, 2026.

EGU26-21322 | Posters on site | ESSI3.4

SIrocco: a new workflow tool for Climate and Weather including explicit data representation and ICON support 

Matthieu Leclair, Julian Geiger, Alexander Goscinski, and Rico Häuselmann

With the increase in simulation resolution, climate and weather models are now potentially outputting petabytes of data. The largest projects can thus require complex workflows tightly integrating pre-processing, computing, post-processing, monitoring, potential downstream applications or archiving. We introduce here Sirocco, a new climate and weather workflow tool written in Python in collaboration between ETHZ, PSI and CSCS with a special care for the ICON model. 

Sirocco is written with separation of concerns in mind, where users should only care about expressing their desired workflow and bringing the scripts/sources for each task independently. That's why "Sirocco" first designates a user-friendly yaml based configuration format. Inspired by cylc and AiiDA, it describes the workflow graph by equally integrating data nodes (input and output) alongside task nodes. Workflows thus become truly composable, in the sense that no task is making any assumption on the behavior of others.

Sirocco currently defines two types of tasks, called "plugins". The "shell" plugin is dedicated to tasks for which users provide their own main executable, including any auxiliary set of files. The only requirement is the ability to interface with Sirocco, either with executables accepting command line arguments and environment variables and/or by parsing a yaml file providing the necessary context for task execution. The "icon" plugin is a dedicated user friendly interface to the ICON model. On top of the integration to Sirocco workflows, it provides easy ways of handling matters like date changing, namelist modifications, restart files or predefined setups for target machine and architecture. By design, other plugins can be written to facilitate the integration of any other application/model.

Once an internal representation is generated from the configuration file, two possible back-ends can orchestrate the workflow. The first one, called "stand-alone", is entirely implemented inside Sirocco and runs autonomously on the target machine, only relying on the HPC scheduler daemon to keep the workflow running. The second one interfaces with the low-level workflow library AiiDA and its satellite packages, running on a dedicated server with its own daemon and dumping workflow metadata in a queryable database. Both orchestrators implement the novel concept of a deep dynamical task front that propagates through the graph, enabling the ahead-of-time submission of an arbitrary number of task generations.

At the end of the day, Sirocco not only provides the ability to run complex workflows and a nice interface to ICON but also, through its workflow manager nature, facilitates shareability and reproducibility in the community.

How to cite: Leclair, M., Geiger, J., Goscinski, A., and Häuselmann, R.: SIrocco: a new workflow tool for Climate and Weather including explicit data representation and ICON support, EGU General Assembly 2026, Vienna, Austria, 3–8 May 2026, EGU26-21322, https://doi.org/10.5194/egusphere-egu26-21322, 2026.

EGU26-21348 | Posters on site | ESSI3.4

CAES3AR: Collaborative and Efficient Scientific Software Support Architecture 

Florian Wagner, Camilla Lüttgens, Andrea Balza Morales, Marc S. Boxberg, Marcel Nellesen, and Marius Politze

Scientific software is essential for accelerating research and enabling transparent, reproducible results, but increasing adoption also increases support demands that can overwhelm small academic development teams. Since most scientists are not trained as software engineers, early-stage research software often lacks the resources and structure needed for broader use, making streamlined support workflows crucial for both users and developers. Addressing these issues is essential to ensure that researchers can focus on their core activities while streamlining processes that benefit both users and developers.

Our project CAES3AR (Collaborative and Efficient Scientific Software Support Architecture) aims to provide researchers with a more open and efficient infrastructure for software support by developing a collaborative architecture. The framework is currently being developed and evaluated using pyGIMLi, an open-source library for modeling and inversion in geophysics (www.pygimli.org), while being designed to remain transferable to a broad range of open-source projects. Thanks to its practicality and gallery of existing examples, pyGIMLi has become widely adopted in the near-surface geophysical community. At the same time, its use across diverse user environments introduces recurring support challenges, since variations in operating systems and installed dependencies can make issue reproduction and debugging time-intensive, which often reduces the capacity for methodological and software innovation.

To address these challenges efficiently, the CAES3AR framework aims to automate key aspects of user support through a generic toolchain that integrates seamlessly with existing infrastructures such as GitHub and Jupyter. It facilitates user engagement by allowing them to create GitHub or GitLab issues that include links to temporary code execution environments (e.g., JupyterLab) equipped with collaborative editing features—potentially integrated with existing JupyterHub and cloud-based infrastructures. Additionally, automated bots powered by GitHub Actions or GitLab jobs will provide real-time feedback on whether issues exist across all platforms and with the latest software versions. If a problem persists, supporters can directly modify the user's code within Jupyter without requiring any downloads or installations. Proposed changes will be presented as formatted code alterations (“diffs”) attributed to their authors in the Git issue for future reference, ensuring clarity and continuity even after the temporary JupyterHub instance is no longer available.

We recently hosted a community workshop to assess developer and user needs, identify challenges in current support practices, and gather requirements for practical adoption. This presentation summarizes key findings from those discussions and introduces early CAES3AR prototypes developed for the pyGIMLi ecosystem. As CAES3AR remains in active development, we conclude by inviting community feedback on additional features and design priorities, with the broader aim of ensuring transferability and long-term utility across multiple open-source scientific software projects.

Project website: https://caesar.pages.rwth-aachen.de/


How to cite: Wagner, F., Lüttgens, C., Balza Morales, A., Boxberg, M. S., Nellesen, M., and Politze, M.: CAES3AR: Collaborative and Efficient Scientific Software Support Architecture, EGU General Assembly 2026, Vienna, Austria, 3–8 May 2026, EGU26-21348, https://doi.org/10.5194/egusphere-egu26-21348, 2026.

EGU26-23282 | Posters on site | ESSI3.4

Evolving Scientific Software in Long-Running Observatories: Lessons from the TERENO Sensor Management Migration 

Ulrich Loup, Werner Küpper, Christof Lorenz, Rainer Gasche, Ralf Kunkel, Ralf Gründling, Jannis Groh, Nils Brinckmann, Jan Bumberger, Marc Hanisch, Tobias Kuhnert, Rubankumar Moorthy, Florian Obersteiner, David Schäfer, and Thomas Schnicke

Abstract:

Scientific software in geosciences often grows organically: initial solutions
are developed within small teams to meet immediate research needs, and over time
they evolve into critical infrastructure. While this organic growth can be
highly effective, it frequently leads to challenges in maintainability,
documentation, and reuse when systems are expected to support larger communities
or integrate with new platforms. In this contribution, we share lessons learned
from evolving the software infrastructure of the TERENO environmental observatories.

For more than a decade, TERENO relied on tightly coupled systems in which
observational data and sensor metadata were managed together. This data
infrastructure proved robust in daily operations but gradually accumulated
inconsistencies, implicit conventions, and project-specific extensions that were
insufficiently documented. As TERENO is now being integrated into the Earth &
Environment DataHub, these limitations became visible and required a systematic
rethinking of how sensor and measurement metadata are managed.

As part of the infrastructure redesign within the Earth & Environment DataHub
initiative, we adopted the Helmholtz Sensor Management System (SMS), an open,
community-driven software platform. To support the transition, we developed and
extended the Python tool ODM2SMS, which enables reproducible and configurable
migration of metadata from the legacy system into SMS. This process exposed
several common pitfalls in scientific software development: hidden assumptions
in data structures, incomplete documentation, and software that worked well for
its original developers but was hard to adapt for new use cases.

We addressed these challenges by applying a set of pragmatic good practices.
These included increasing modularity and configurability in ODM2SMS, explicitly
documenting previously implicit rules, and combining automated migration steps
with manual review where scientific context was required. A particularly
instructive example is the migration of complex lysimeter installations,
involving hundreds of interconnected devices. This case highlighted the
importance of clear abstractions, shared terminology, and close interaction
between users and developers.

Our contribution reflects on how community engagement, open development, and
incremental refactoring can improve long-lived scientific software without
disrupting ongoing research. We conclude by discussing transferable lessons for
researchers facing similar challenges: balancing rapid development with
sustainability, making software usable beyond its original context, and turning
legacy systems into maintainable, future-ready tools.

How to cite: Loup, U., Küpper, W., Lorenz, C., Gasche, R., Kunkel, R., Gründling, R., Groh, J., Brinckmann, N., Bumberger, J., Hanisch, M., Kuhnert, T., Moorthy, R., Obersteiner, F., Schäfer, D., and Schnicke, T.: Evolving Scientific Software in Long-Running Observatories: Lessons from the TERENO Sensor Management Migration, EGU General Assembly 2026, Vienna, Austria, 3–8 May 2026, EGU26-23282, https://doi.org/10.5194/egusphere-egu26-23282, 2026.

EGU26-1688 | Orals | G5.2

GNSS storm nowcasting demonstrator for Bulgaria 

Guergana Guerova, Jan Dousa, Tsvetelina Dimitrova, Anastasiya Stoycheva, Pavel Václavovic, and Nikolay Penov

Global Navigation Satellite System (GNSS) is an established atmospheric monitoring technique delivering water vapour data in near-real time. The advancement of GNSS processing made the quality of real-time GNSS tropospheric products comparable to near-real-time solutions. In addition, they can be provided with a temporal resolution of 5 min and latency of 10 min, suitable for severe weather nowcasting. This presentation exploits the added value of sub-hourly real-time GNSS tropospheric products for the nowcasting of convective storms in Bulgaria. A convective Storm Demonstrator (Storm Demo) is build using real-time GNSS tropospheric products and Instability Indices to derive site-specific threshold values in support of public weather and hail suppression services. The Storm Demo targets the development of service featuring GNSS products for two regions with hail suppression operations in Bulgaria, where thunderstorms and hail events occur between May and September, with a peak in July. The Storm Demo real-time Precise Point Positioning processing is conducted with the G-Nut software with a temporal resolution of 5 min for 12 ground-based GNSS stations in Bulgaria. Real-time data evaluation is done using reprocessed products and the achieved precision is below 9 mm, which is within the nowcasting requirements of the World Meteorologic Organisation. For the period May–September 2021, the seasonal classification function for thunderstorm nowcasting is computed and evaluated. The added value of the high temporal resolution of the GNSS tropospheric gradients is investigated for a several storm case. Evaluation of real-time tropospheric products from Galileo will be presneted in addition.

How to cite: Guerova, G., Dousa, J., Dimitrova, T., Stoycheva, A., Václavovic, P., and Penov, N.: GNSS storm nowcasting demonstrator for Bulgaria, EGU General Assembly 2026, Vienna, Austria, 3–8 May 2026, EGU26-1688, https://doi.org/10.5194/egusphere-egu26-1688, 2026.

EGU26-1762 | Posters on site | G5.2

PWV-GNSS JUMP as a tool for nowcasting in Brazil: an overview, the challenges, and opportunities 

Luiz Sapucci, Sindy Almeida, Wagner Machado, Juliana Anochi, and Gerônimo Lemos

Ground-based GNSS (Global Navigation Satellite System) receivers have been used to estimate precipitable water vapor (PWV) with high temporal resolution. The quality in terms of precision and confidence has given the opportunity to explore this feature to predict the occurrence of thunderstorms. A sharp increase in the GNSS-PWV time series before the intense precipitation events has been found, which indicates the occurrence of this phenomenon and consequently demonstrates a good potential for application in nowcasting activities. This increasing pattern in the PWV-GNSS time series before strong precipitation has been termed GPS-PWV-jumps and occurs because of the water vapor convergence and the continued formation of cloud condensate and precipitation particles. This study presents an overview of the development of this technique in Brazil, presenting a summary of the latest results using the data collected in different campaigns in the last years over different regions of Brazilian territory. GNSS receivers and several instruments to observe the precipitation, such as disdrometers and X-band radar, were used. The long database has been explored, and extensive analyses of results were carried out using wavelet cross-correlation analysis, lag correlation method, and contingency table after defining a method to predict the precipitation using GNSS-PWV jump information. This approach is innovative because it uses only GNSS data and, consequently, the infrastructure used by geodesic applications, such as GNSS receiver networks present in big cities, can be explored for this purpose without additional investments. However, there are some challenges that need to be addressed yet, such as the PWV-GNSS-jump production in near real time, which involves the data reception and data processing in a suitable time to be evaluated and applied to the issuance of disaster warnings. Another challenge, just as important as the first, is ensuring that the performance of the GNNS-PWV jump is maintained when using near-real-time estimates. These challenges are treated in this work as an opportunity for researchers exploring artificial intelligence methods, which are discussed, and some possible strategies are presented. The future perspective of the GNSS receiver application as a humidity information data source used in the evaluation and data assimilation process in the community development of the MONAN (Model for Ocean-laNd-Atmosphere predictioN) model is also discussed.

How to cite: Sapucci, L., Almeida, S., Machado, W., Anochi, J., and Lemos, G.: PWV-GNSS JUMP as a tool for nowcasting in Brazil: an overview, the challenges, and opportunities, EGU General Assembly 2026, Vienna, Austria, 3–8 May 2026, EGU26-1762, https://doi.org/10.5194/egusphere-egu26-1762, 2026.

EGU26-1945 | Posters on site | G5.2

Implementing and testing the rigorous GNSS tropospheric gradient operator in the WRF data assimilation system 

Florian Zus, Rohith Thundathil, Galina Dick, and Jens Wickert

The assimilation of GNSS tropospheric gradients into Numerical Weather Prediction models requires the development of observation operators, a process constrained by a trade-off between accuracy and computational cost.  As an initial step, a computationally efficient operator, which we refer to as the fast tropospheric gradient operator, was implemented and tested within the WRF data assimilation system (Thundathil et al., 2024). This presentation details the implementation and testing of a rigorous tropospheric gradient operator. Based on a linear combination of ray-traced tropospheric delays, this operator demands greater computational resources but minimizes errors by replicating the method used in the GNSS data analysis. With both operators now implemented and freely available to WRF users, a significant obstacle has been removed for research studies and operational applications. The other major challenge, namely the provision of high-quality tropospheric gradients in (near) real-time, remains a task for GNSS data analysis.

Reference:

Thundathil, R., Zus, F., Dick, G., and Wickert, J.: Assimilation of GNSS tropospheric gradients into the Weather Research and Forecasting (WRF) model version 4.4.1, Geosci. Model Dev., 17, 3599–3616, https://doi.org/10.5194/gmd-17-3599-2024, 2024. 

How to cite: Zus, F., Thundathil, R., Dick, G., and Wickert, J.: Implementing and testing the rigorous GNSS tropospheric gradient operator in the WRF data assimilation system, EGU General Assembly 2026, Vienna, Austria, 3–8 May 2026, EGU26-1945, https://doi.org/10.5194/egusphere-egu26-1945, 2026.

EGU26-2451 | Orals | G5.2

Global Characterization of IWV Diurnal Variability from GNSS and Its Relevance to ERA5 Reanalysis Products 

Peng Yuan, Geoffrey Blewitt, Corné Kreemer, Zhao Li, Ran Lu, Pengfei Xia, Weiping Jiang, Harald Schuh, Jens Wickert, and Zhiguo Deng

The diurnal variability of Integrated Water Vapor (IWV) plays an important role in land–atmosphere coupling, convection initiation, and the diurnal water cycle, yet its global observational characterization remains limited. Global Navigation Satellite Systems (GNSS) observations provide a unique capability for resolving IWV diurnal variability through continuous, all-weather, high–temporal-resolution measurements with long-term stability. In this study, we analyze a decade of GNSS-derived IWV observations from a global network of thousands of stations to characterize the climatological features of the IWV diurnal cycle. The analysis focuses on the spatial structure and harmonic characteristics of sub-daily IWV variability across different latitude bands and climate regimes. The results reveal a coherent global diurnal signal, with systematic variations in amplitude and phase that exhibit strong geographic dependence. In addition, we examine the representation of IWV diurnal variability in the ERA5 reanalysis by analyzing temporal features in ERA5 IWV time series and their potential influence on estimated diurnal harmonics. The comparison highlights the importance of accounting for reanalysis-related temporal artifacts when interpreting sub-daily variability. Based on the unique strengths of long-term, globally distributed GNSS observations, this work provides a robust observational framework for studying IWV diurnal variability and offers methodological insight for evaluating reanalysis and satellite-based water vapor products. The results are relevant for studies of atmospheric processes operating at sub-daily timescales and for the interpretation of water vapor observations from observing systems with limited temporal sampling.

How to cite: Yuan, P., Blewitt, G., Kreemer, C., Li, Z., Lu, R., Xia, P., Jiang, W., Schuh, H., Wickert, J., and Deng, Z.: Global Characterization of IWV Diurnal Variability from GNSS and Its Relevance to ERA5 Reanalysis Products, EGU General Assembly 2026, Vienna, Austria, 3–8 May 2026, EGU26-2451, https://doi.org/10.5194/egusphere-egu26-2451, 2026.

EGU26-2493 | ECS | Orals | G5.2

A Hybrid Machine Learning Approach for Modeling Tropospheric Zenith Wet Delay with Enhanced Generalization Performance.  

Mohamed H. Sharouda, Weixing Zhang, Zhixiang Mo, Mohamed M. Elisy, Hongxing Sun, Mohamed Hosny, and Yidong Lou

Tropospheric zenith wet delay (ZWD) is one of the major error sources for space geodetic techniques and plays a vital role in meteorological research.  Accurate prior estimates for ZWD can significantly improve the performance of geodetic applications, such as precise kinematic positioning. Current single machine learning ZWD models have limitations in modeling the high spatiotemporal variations of moisture in the lower atmosphere and in their generalization capabilities. To mitigate these limitations, this work introduces a hybrid learning framework that combines multiple machine learning models. The proposed model offers stronger generalization capabilities, improving the ZWD modeling and forecasting accuracy.

When comparing the RMSE, the proposed model outperforms existing machine and deep learning-based ZWD models, the empirical GPT-3 model, and the traditional models such as the Saastamoinen and Askne & Nordius models. In the blind case, when surface meteorological data are not used, the RMSE is reduced by 25.76% compared to the GPT-3 model. When using surface meteorological parameters, the proposed model achieves improvements of 47.05% and 34.24% compared to Saastamoinen and Askne & Nordius, respectively.

The generalization capabilities of the models were evaluated at non-modeled sites. The proposed model demonstrates improvements in overall external performance, with a particularly significant increase of 26.14% in the blind case compared to GPT-3. When sites access meteorological data, the model shows improvements of 45.23% and 34.31% compared to Saastamoinen and Askne & Nordius, respectively.

The spatiotemporal analysis shows the improved stability and precision of the proposed model over the other models evaluated in this work, indicating promising prospects for it in real-time and rapid geodetic applications.

How to cite: H. Sharouda, M., Zhang, W., Mo, Z., M. Elisy, M., Sun, H., Hosny, M., and Lou, Y.: A Hybrid Machine Learning Approach for Modeling Tropospheric Zenith Wet Delay with Enhanced Generalization Performance. , EGU General Assembly 2026, Vienna, Austria, 3–8 May 2026, EGU26-2493, https://doi.org/10.5194/egusphere-egu26-2493, 2026.

Under global warming, high-precision and rapid monitoring of Arctic sea ice freeze-thaw cycles has become increasingly critical for understanding polar climate dynamics and predicting global climate impacts. Ground-based Global Navigation Satellite System-Reflectometry (GNSS-R) is emerging as a promising technique for such monitoring, yet prior research has primarily focused on distinguishing sea ice from open water, with limited validation of its ability to capture continuous freeze-thaw transitions. To address this gap, this study presents a novel multi-frequency combination strategy that integrates spectral area factors (SAF) derived from multi-frequency (L1, L2, L5) GNSS-R observations using a Bayesian classifier. The method enhances detection by leveraging both state-dependent differential signatures and inter-frequency correlations. Using five years of observations (2018–2022) from the coastal station TUKT in Tuktoyaktuk, Canada, we trained prior probability distributions with data from 2018–2020 and tested the approach on independent data from 2021–2022. The results demonstrate that the proposed method effectively captures the dynamic progression of freeze-thaw cycles. It achieves a sample-level classification accuracy of 92.72% and a daily accuracy of 98.49% during the test period. This performance meets practical application requirements, confirming the potential of ground-based GNSS-R as a reliable, cost-effective tool for the sustained monitoring of coastal Arctic sea ice freeze-thaw processes. This study thereby bridges the critical gap between theoretical research and operational environmental decision-making in polar regions.

How to cite: Yuan, X., He, S., and Wickert, J.: First Accuracy Assessment of Ground-Based GNSS-R for Coastal Arctic Sea Ice Freeze-Thaw Cycles Monitoring: A Five-Year Study (2018–2022) in Tuktoyaktuk, Canada, EGU General Assembly 2026, Vienna, Austria, 3–8 May 2026, EGU26-4525, https://doi.org/10.5194/egusphere-egu26-4525, 2026.

EGU26-5181 | ECS | Orals | G5.2

GNSS Zenith Wet Delay prediction from ERA5 using Machine Learning with cross-station generalization 

Liangjing Zhang, Yuan Peng, Florian Zus, Zhiguo Deng, and Jens Wickert

Accurate estimation of the Zenith Wet Delay (ZWD) is essential for GNSS meteorology and atmospheric water vapor monitoring, with important applications in weather forecast and climate monitoring. With the growing availability of reanalysis data sets such as ERA5 and dense GNSS networks, machine learning (ML) offers a powerful means to integrate these data sources and learn the statistical relationships between atmospheric variables and tropospheric delays.

This study presents a machine-learning framework for predicting ZWD using ERA5 atmospheric profiles and a multi-year data set of GNSS observations across Europe. We applied the GNSS ZTD observations from 2018 to 2023, from which ZWD is obtained using Zenith Hydrostatic Delay (ZHD) computed from ERA5. An XGBoost model is trained using GNSS stations from 2018–2022 and evaluated on independent stations excluded from training to ensure that the results reflect true spatial generalization. Under this station-based cross-validation strategy, the model reaches an RMSE of approximately 9 mm on the validation stations and about 9.5 mm on entirely independent test stations in 2023. These results demonstrate that our method can effectively capture ZWD variability and generalize across heterogeneous environments.

By learning a data-driven mapping between ERA5 atmospheric fields and GNSS-derived delays, the proposed approach enables rapid, spatially continuous estimation of ZWD, supporting applications in GNSS meteorology, numerical weather prediction, and climate monitoring.

How to cite: Zhang, L., Peng, Y., Zus, F., Deng, Z., and Wickert, J.: GNSS Zenith Wet Delay prediction from ERA5 using Machine Learning with cross-station generalization, EGU General Assembly 2026, Vienna, Austria, 3–8 May 2026, EGU26-5181, https://doi.org/10.5194/egusphere-egu26-5181, 2026.

EGU26-5444 | Posters on site | G5.2

Path-Integrated tropospheric water vapor from a mountain-to-mountain microwave link: a summer/autumn NDSA campaign compared with ERA5 and instrumental data 

Luca Facheris, Fabrizio Argenti, Fabrizio Cuccoli, Ugo Cortesi, Samuele del Bianco, Francesco Montomoli, Marco Gai, Massimo Baldi, Flavio Barbara, Andrea Donati, Samantha Melani, Alberto Ortolani, Massimo Viti, Andrea Antonini, Luca Rovai, Elisa Castelli, Enzo Papandrea, André Achilli, Maurizio Busetto, and Francescopiero Calzolari

Water vapor (WV) plays a fundamental role in tropospheric processes, as most atmospheric moisture is confined to this layer. However, homogeneous and globally distributed observations of the lower troposphere—up to about 5–6 km altitude—remain limited. Filling this observational gap would significantly improve short-term climate analyses and the performance of numerical weather prediction (NWP) models.

Within theoretical activities supported by ESA, a novel retrieval concept called Normalized Differential Spectral Attenuation (NDSA) was developed to estimate integrated water vapor (IWV) from microwave attenuation measurements in the 17–21 GHz frequency range along tropospheric propagation paths. The method is based on the estimation of a spectral sensitivity coefficient (S), defined as the differential attenuation between two closely spaced carrier frequencies with a relative separation smaller than 2%. We demonstrated a linear relationship between S and IWV, enabling a simple and robust retrieval scheme. These investigations also highlighted the suitability of NDSA for spaceborne applications, including co- and counter-rotating Low Earth Orbit (LEO) satellite geometries. The Italian Space Agency funded the SATCROSS project to assess the technological feasibility of a dedicated satellite mission and to develop a ground-based prototype capable of performing NDSA measurements on terrestrial microwave links at 19 GHz.

A critical step toward an operational space-based system is the quantitative assessment of the accuracy and reliability of IWV estimates derived from the prototype through validation against independent observing techniques. A first validation campaign was in 2024, comparing IWV retrieved by the NDSA prototype with measurements from a MAX-DOAS instrument observing the same atmospheric volume along a 91 km link between the meteorological station “Giorgio Fea” (San Pietro Capofiume, 10 m a.s.l.) and the climate observatory at Mount Cimone (2165 m a.s.l.). Additional reference data were provided by radiosondes, hygrometers, and GNSS. While the results were encouraging, significant signal scintillation affected the NDSA measurements due to a large fraction of the link remaining within the terrain boundary layer.

The present work focuses on a second campaign carried out in 2025 along a 160 km high-altitude microwave link connecting Mount Cimone to Mount Amiata (1738 m a.s.l.). For the first time, the NDSA prototype was tested on a link with nearly constant height and limited ground influence, closely approximating the geometry of a LEO-to-LEO satellite link with a tangent height of about 2000 m. This setup enabled verification of the theoretical relationship between the spectral sensitivity parameter S and IWV, with particular attention to the linear model coefficients reported by the authors in previous papers. ERA5 reanalysis data (25-km linear res.), integrated along the full link, were also compared with in situ hygrometer measurements and GNSS-derived IWV. Overall, IWV estimates from the different techniques show good agreement in capturing daily and seasonal variability, while ERA5 systematically underestimates IWV due to its coarser resolution. At shorter timescales, discrepancies increase during periods of enhanced tropospheric turbulence, induced by air mass movements. Criteria for real-time identification of high-scintillation conditions were defined, demonstrating the capability of NDSA to detect precipitation while preserving WV information.


How to cite: Facheris, L., Argenti, F., Cuccoli, F., Cortesi, U., del Bianco, S., Montomoli, F., Gai, M., Baldi, M., Barbara, F., Donati, A., Melani, S., Ortolani, A., Viti, M., Antonini, A., Rovai, L., Castelli, E., Papandrea, E., Achilli, A., Busetto, M., and Calzolari, F.: Path-Integrated tropospheric water vapor from a mountain-to-mountain microwave link: a summer/autumn NDSA campaign compared with ERA5 and instrumental data, EGU General Assembly 2026, Vienna, Austria, 3–8 May 2026, EGU26-5444, https://doi.org/10.5194/egusphere-egu26-5444, 2026.

EGU26-5618 | ECS | Posters on site | G5.2

Gap-free GNSS-R Wind Field Reconstruction Using a Physics-Informed 4DVarNet Scheme 

Hao Du, Ronan Fablet, Nga Nguyen, Weiqiang Li, Estel Cardellach, and Bertrand Chapron

Spaceborne Global Navigation Satellite System Reflectometry (GNSS-R) has emerged as a new technique for ocean wind speed retrieval, offering unprecedented temporal resolution and all-weather capacity. However, the track-wise sampling of current GNSS-R missions leads to substantial spatial and temporal gaps in gridded wind fields. In this study, we apply a physics-informed 4DVarNet scheme to reconstruct gap-free ocean surface wind fields from Cyclone GNSS (CYGNSS) observations. This end-to-end scheme operates by following the four-dimensional variational (4DVar) data assimilation principle, where a dynamic prior model provides state forecasts, and a gradient solver minimizes the 4DVar loss function. Both parts are implemented through physics-informed neural networks, i.e., a bilinear autoencoder, and a convolutional Long-Short-Term Memory (LSTM) network, respectively, which are trained using European Center for Medium-Range Weather (ECMWF) ERA5 hourly 10-meter ocean wind products as reference. NOAA CYGNSS Version 1.2 level 2 (L2) wind speed retrieval products from 2018-2022 were gridded at 0.25° spatial resolution and 1-hour, 3-hour, and 6-hour temporal resolutions over the western North Pacific (0-37°N, 100°-160°E). Validation using independent 2021 data shows that the reconstructed wind fields achieve RMSEs of 1.13 m/s, 1.16 m/s, and 1.24 m/s relative to ERA5 winds, and 1.40 m/s, 1.41 m/s, and 1.48 m/s relative to Advanced Microwave Scanning Radiometer-2 all-weather winds, for the 1-hour, 3-hour, and 6-hour gridded products, respectively. Furthermore, 3-hour results show a better performance for wind speeds larger than 20 m/s, indicating a better tradeoff between the number of grids with available GNSS-R observables in each map (coverage rate) and a enough data frequency to capture the temporal variations. The interpolation error of the developed 4DVarNet model shows a strong dependence on coverage rate, with a correlation coefficient of -0.849 after applying a 7-day rolling average. Error discrepancies between GNSS-R and ERA5 reconstructed winds could contribute to recalibrating GNSS-R observables or improving the ECMWF forecasting model. Case studies demonstrate the capability of the reconstructed fields to capture tropical cyclone coverage and evolution. For Super Typhoon Surigae in 2021, the peak intensity derived from GNSS-R reconstructions is temporally consistent with International Best Track Archive for Climate Stewardship (IBTrACS) records, while ERA5 data exhibit a two-day delay. For Tropical Storm Kompasu in 2021, pronounced wind asymmetries and a well-defined eye structure were detected. In the storm-centric coordinate, the maximum wind occurs in the northeast quadrant with a radius of 587.5 km, approximately 38% larger than that in the northwest quadrant on 2021-10-09 06:00 UTC. Despite these encouraging results, the reconstructed products still exhibit track-wise artifacts, high-wind underestimation, and limited uncertainty characterization. However, these results demonstrate the great potential of 4DVarNet in gap filling and data assimilation. Future work will integrate additional GNSS-R missions, including Fengyun-3, Tianmu-1, and recently launched ESA HydroGNSS, and develop tropical cyclone specific models using complementary high-wind reference datasets to further improve coverage and accuracy.

How to cite: Du, H., Fablet, R., Nguyen, N., Li, W., Cardellach, E., and Chapron, B.: Gap-free GNSS-R Wind Field Reconstruction Using a Physics-Informed 4DVarNet Scheme, EGU General Assembly 2026, Vienna, Austria, 3–8 May 2026, EGU26-5618, https://doi.org/10.5194/egusphere-egu26-5618, 2026.

EGU26-6330 | ECS | Orals | G5.2

Monitoring melt pond using Tianmu-1 GNSS-R Data: A Wind-concerned Model study 

Linhu Zhang, Wei Ban, and Xiaohong Zhang

Melt ponds play a critical role in regulating the surface albedo of Arctic sea ice and accelerating its melt through the ice–albedo feedback mechanism. However, their high spatial heterogeneity and rapid temporal evolution make large-scale, continuous monitoring extremely challenging. Spaceborne optical remote sensing remains the primary technique for retrieving melt pond fraction (MPF), but its effectiveness is severely limited under persistent cloud cover and polar night conditions. Although GNSS-R provides all-weather observations with high temporal resolution, its potential for melt pond monitoring has not yet been systematically evaluated, nor have practical monitoring strategies been established. This study evaluates the potential of spaceborne Global Navigation Satellite System Reflectometry (GNSS-R) for melt-pond monitoring and characterizes the mechanisms through which melt-pond surface properties influence the reflected GNSS-R signals. An electromagnetic forward scattering model was developed to simulate GNSS-R reflectivity as a function of MPF and open water fraction (OWF) in representative summer sea ice scenes. The model was validated using observations from the Tianmu-1 GNSS-R satellite and the optical melt pond data. We evaluated the model performance using pan-Arctic data on three distinct dates representing different stages of melt pond development: June 15, July 1, and August 15, 2023. The modeled reflectivity shows strong agreement with GNSS-R observations, yielding Pearson correlation coefficients of interval means values of 0.99, 0.97, and 0.93, and corresponding unbiased RMSE (ubRMSE) values of 0.76 dB, 1.91 dB, and 1.18 dB, respectively. The results demonstrate the potential of using GNSS-R for melt pond monitoring, supporting the development of GNSS-R–based MPF retrieval algorithms and fusion approaches that integrate traditional remote sensing data.

How to cite: Zhang, L., Ban, W., and Zhang, X.: Monitoring melt pond using Tianmu-1 GNSS-R Data: A Wind-concerned Model study, EGU General Assembly 2026, Vienna, Austria, 3–8 May 2026, EGU26-6330, https://doi.org/10.5194/egusphere-egu26-6330, 2026.

EGU26-6706 | ECS | Orals | G5.2

 Integrating GNSS-Derived Atmospheric Delays into Large Weather Foundation Models  

Leonardo Trentini, Fanny Lehmann, Laura Crocetti, and Benedikt Soja

Large weather foundation models have recently emerged as a powerful paradigm for global weather forecasting, leveraging transformer-based architectures pretrained on vast and heterogeneous Earth system datasets. Despite their success, accurately predicting moisture-related processes - particularly those associated with atmospheric water vapor and precipitation - remains a key challenge. Global Navigation Satellite System (GNSS) observations provide an independent and physically meaningful source of information on atmospheric water vapor through signal delays induced along the signal path, offering an opportunity to enhance data-driven weather models.

In this work, we investigate the integration of GNSS-derived Zenith Wet Delays (ZWDs) into Aurora, a state-of-the-art large weather foundation model based on a hierarchical vision transformer architecture. Building on Aurora’s pretrained representations, we perform full fine-tuning using ten years of ERA5 reanalysis data augmented with surface-level ZWD fields generated by the ZWDX global forecasting model. To rigorously assess the contribution of GNSS information, we conduct controlled experiments in which identical model configurations are fine-tuned both with and without the inclusion of ZWDs. Experiments are performed on two model scales, comprising approximately 250 million and 1.3 billion parameters.

To enable stable learning when introducing the additional GNSS-derived variable, we propose an adaptive loss-weight scheduling strategy that gradually increases the contribution of the ZWD loss during training. This approach allows the model to successfully learn the new variable while maintaining performance on the original atmospheric fields. The learned ZWD representations reach an accuracy comparable to that of the other variables included during pretraining.

Beyond the direct prediction of ZWDs, we analyze the influence of GNSS information on moisture-related atmospheric variables, including specific humidity from the original pretraining set and precipitation, which is added during fine-tuning alongside ZWDs. The inclusion of ZWDs leads to measurable changes in the prediction skill of these variables at the surface and, for specific humidity, throughout the atmospheric column. While the magnitude and physical interpretation of these effects are still under investigation, the results indicate that GNSS-derived information is effectively utilized by the model and influences its internal representation of atmospheric moisture.

A central objective of this research is to assess whether GNSS-informed foundation models can improve the prediction of precipitation and nowcasting of extreme weather events, where accurate moisture representation is critical. Ongoing work extends the evaluation to shorter lead times and event-based analyses. Future developments include incorporating direct GNSS station measurements instead of interpolated products and developing regional high-resolution forecasting setups to better exploit the spatial density of GNSS networks, with the ultimate goal of enhancing forecasts of localized, high-impact extreme events.

How to cite: Trentini, L., Lehmann, F., Crocetti, L., and Soja, B.:  Integrating GNSS-Derived Atmospheric Delays into Large Weather Foundation Models , EGU General Assembly 2026, Vienna, Austria, 3–8 May 2026, EGU26-6706, https://doi.org/10.5194/egusphere-egu26-6706, 2026.

EGU26-7012 | ECS | Posters on site | G5.2

Evaluation of Real-Time ZWD and Tropospheric Gradients Derived from GFZ Real-Time Orbit and Clock Products 

Shengping He, Andreas Brack, and Jens Wickert

Precise Point Positioning (PPP) provides zenith wet delay (ZWD) and horizontal tropospheric gradients as key tropospheric parameters. The availability of real-time satellite orbit and clock products enables real-time tropospheric monitoring, which is currently mainly based on IGS Real-Time Service (IGS-RTS) products. In this study, we evaluate real-time tropospheric parameters derived from the newly released GFZ real-time orbit and clock streams. The assessment is performed using both the GFZ global station network and the regional GEONET network operated by the Geospatial Information Authority of Japan (GSI), focusing on ZWD and horizontal gradients. An analysis of one week of data in June 2025 shows that under calm meteorological conditions, real-time ZWD and gradients achieve an accuracy better than 3 mm with respect to the solution derived from GFZ final products, with a data completeness of 99.8%. A case study focusing on strong convective conditions, exemplified by typhoon events over the Pacific Ocean east of Japan in August 2025, indicates no noticeable degradation in the precision and latency of real-time ZWD and tropospheric gradients. The comparison with ultra-rapid products, which include predicted orbit and clock components, shows that real-time ZWD and gradients consistently outperform ultra-rapid solutions. Furthermore, comparisons among multiple analysis centers (ACs) show that tropospheric solutions generated using GFZ real-time streams exhibit competitive accuracy, stability, and completeness.

How to cite: He, S., Brack, A., and Wickert, J.: Evaluation of Real-Time ZWD and Tropospheric Gradients Derived from GFZ Real-Time Orbit and Clock Products, EGU General Assembly 2026, Vienna, Austria, 3–8 May 2026, EGU26-7012, https://doi.org/10.5194/egusphere-egu26-7012, 2026.

EGU26-7942 | Posters on site | G5.2

SPOTGINS: a new global GNSS tropospheric delay data set derived using GINS software 

Olivier Bock, Jean-Paul Boy, Médéric Gravelle, Sylvain Loyer, Samuel Nahmani, Joëlle Nicolas Duroy, Arnaud Pollet, Pierre Sakic, Alvaro Santamaria, and Gilles Wautelet

SPOTGINS provides global GNSS station position and zenith tropospheric delay (ZTD) time series for nearly 5,000 stations, covering the period from May 2000 to the present. SPOTGINS is a consortium of research institutions — initially French, now expanding internationally — that processes a global station network using CNES’s GINS software in precise point positioning (PPP) mode with integer ambiguity resolution. The initiative leverages the expertise and advanced satellite products of GRG, the French IGS Analysis Center operated by CNES and CLS. By adopting a standardized processing strategy, auxiliary products, and consistent metadata, the consortium distributes computational workload among partners while maintaining sub-millimeter-level consistency in positions and ZTDs.

This paper presents results from the first large-scale quality assessment of SPOTGINS ZTD time series. Evaluation metrics include outlier detection statistics, bias and random noise estimation against independent references, and tests of temporal homogeneity.

How to cite: Bock, O., Boy, J.-P., Gravelle, M., Loyer, S., Nahmani, S., Nicolas Duroy, J., Pollet, A., Sakic, P., Santamaria, A., and Wautelet, G.: SPOTGINS: a new global GNSS tropospheric delay data set derived using GINS software, EGU General Assembly 2026, Vienna, Austria, 3–8 May 2026, EGU26-7942, https://doi.org/10.5194/egusphere-egu26-7942, 2026.

The 2023–2025 world tour of the Italian Navy’s Amerigo Vespucci ship offers a unique and remarkable laboratory for multidisciplinary environmental observations over the global oceans, where direct measurements remain extremely limited. Among the various research activities conducted onboard by the Sea Study Center of Genoa University, Precipitable Water Vapor (PWV) evaluations contribute to advancing the understanding of marine atmospheric processes. PWV plays a central role in regulating atmospheric moisture, influencing convection, and shaping the development of extreme precipitation events; yet its variability over the open sea remains poorly constrained due to the limited availability of continuous measurement platforms. As the ship circumnavigates the globe, it continuously records data through an onboard Global Navigation Satellite System (GNSS) and weather station system, transforming the ship into a moving atmospheric observatory. As known, the GNSS observations are influenced by the presence of troposphere, which influence is parametrized through the Zenith Total Delay (ZTD). In the present work, ZTD is estimated with Precise Point Positioning (PPP) strategy. PWV is then obtained using well-established relations, combining ZTD estimates with onboard pressure and temperature measurements. A key innovation of this work is the creation of a global, georeferenced PWV database derived exclusively from ship-based observations, considering the complexities introduced by ship motion, sensor integration, and highly variable marine environments. This dataset is expected to represent a useful contribution to study the meteorological models at sea. The present work represents a first approach for comparing GNSS and Numerical Weather Prediction (NWP) model-derived PWV values, to assess their consistency, quantify uncertainties, and evaluate the potential of assimilating ship-based PWV observations into operational forecasting systems.

How to cite: Javed, N.: Precipitable Water Vapor tracking in the oceans with GNSS and meteorological observations: the Amerigo Vespucci ship World Tour (2023-2025), EGU General Assembly 2026, Vienna, Austria, 3–8 May 2026, EGU26-8085, https://doi.org/10.5194/egusphere-egu26-8085, 2026.

EGU26-8338 | ECS | Posters on site | G5.2

Preliminary Result of Synergy between Optical Satellite and GNSS-R Technique to Retrieve Vegetation Parameters 

Zohreh Adavi, Babak Ghassemi, Gregor Moeller, and Francesco Vuolo

Due to the climate change crisis and a growing global population, natural resources and ecosystem stability face significant stress. To assess and manage these challenges, continuous monitoring of vegetation conditions at fine spatial resolution is essential. Leaf Area Index (LAI) is a key biophysical parameter for determining vegetation status. The Sentinel-2 (S2) optical satellites offer a great source for LAI retrieval, with five-day revisit time and fine spatial resolution of 10 meters. However, optical observations are frequently hindered by clouds which limit continuous global coverage. To overcome this limitation, spaceborne Global Navigation Satellite System Reflectometry (GNSS-R) technology offers an all-weather complementary source as an alternative. GNSS-R is an emerging remote sensing technique involving a bistatic radar configuration that continuously collects surface-reflected signals regardless of weather conditions. The objective of this study is to explore the synergy between Cyclone Global Navigation Satellite System (CYGNSS) science data and S2 to retrieve a continuous LAI product within a machine learning framework. We utilized CYGNSS L1 v3.2 science data from low-Earth orbits, covering a latitudinal range of ±38° over the two-year period of 2022–2023, with 18 months allocated for model training and 6 months for independent testing. After masking the impact of open water, a machine learning model was developed to integrate CYGNSS-derived observables with auxiliary data to retrieve LAI. This approach leverages the high temporal density and all-weather capabilities of CYGNSS to fill gaps in S2-derived LAI, leading to improved spatiotemporal continuity in vegetation monitoring.

Keywords: GNSS-R, Sentinel-2, LAI, Vegetation, Monitoring, Machine Learning

How to cite: Adavi, Z., Ghassemi, B., Moeller, G., and Vuolo, F.: Preliminary Result of Synergy between Optical Satellite and GNSS-R Technique to Retrieve Vegetation Parameters, EGU General Assembly 2026, Vienna, Austria, 3–8 May 2026, EGU26-8338, https://doi.org/10.5194/egusphere-egu26-8338, 2026.

EGU26-8966 | ECS | Orals | G5.2

Development and Validation of an Enhanced GPS Tomography Algorithm for Reunion Island 

Hugo Gerville, Joël Van Baelen, Frédéric Durand, Laurent Morel, and Fabien Albino

It is well known that GPS signals are affected by the amount of water vapor contained in the troposphere. This phenomenon creates delays, which can be converted into a corresponding integrated water vapor content along the receiver–satellite path (Slant Integrated Water Vapor, SIWV). Moreover, when a dense network of GPS stations is available, we obtain an ensemble of such SIWV paths that crisscross over the network area. Hence, by defining a three-dimensional regular grid composed of different boxes, called voxels, over our area of interest, and using a tomographic inversion method, we can retrieve the water vapor density in each voxel of the grid. Thus, this allows us to obtain a 3-D field of water vapor density above our area of interest.

Here, we implement this approach on Reunion Island (a South West Indian Ocean Volcanic tropical island about 2500km²), which counts approximately 40 GPS stations. We had take into account for some local specificities: 1°/ the orography of this volcanic island is extremely sharp with high altitude gradients between neighboring stations, and 2°/ the spatial distribution of the GPS stations is very heterogeneous with a high density (about half of the stations) distributed around the active volcano of Piton de la Fournaise. Therefore, two developments were carried out. First, regarding the tomographic geometry, we use Voronoï diagram to implement a grid adapted to the spatial distribution of the GPS stations. Second, the tomographic inversion method itself was improved using the more robust truncated singular value decomposition (TSVD) approach using the L-curve technique to define the analysis threshold (Moeller, 2017).

To validate these developments, the results obtained from the tomographic inversion was compared to 30 water vapor profiles obtained during a radio sounding campaign conducted in Saint-Philippe (SE of the island, close to the Piton de la Fournaise) between May 2025 and July 2025.

How to cite: Gerville, H., Van Baelen, J., Durand, F., Morel, L., and Albino, F.: Development and Validation of an Enhanced GPS Tomography Algorithm for Reunion Island, EGU General Assembly 2026, Vienna, Austria, 3–8 May 2026, EGU26-8966, https://doi.org/10.5194/egusphere-egu26-8966, 2026.

EGU26-10747 | ECS | Orals | G5.2

Vertical adjustment of water vapor in the lower troposphere by assimilating GNSS tropospheric gradients  

Rohith Thundathil, Florian Zus, Galina Dick, and Jens Wickert

Global Navigation Satellite System (GNSS) tropospheric gradients provide critical insights into atmospheric moisture distribution, whereas zenith total delays (ZTD) quantify the integrated moisture content along the zenith direction. Integrating both observation types enables more effective adjustment of moisture fields and correction of their dynamics within numerical models. Clearly, in areas with limited station coverage, assimilating tropospheric gradients alongside ZTD observations enhances model performance. This study investigates improvements to the lower-tropospheric water vapor correction, with particular attention to increasing station density in the GNSS network. A two-month regional simulation is conducted to support this analysis.

Our research will transition from the regional Weather Research and Forecasting model to a global-scale assimilating advanced GNSS observations using the Model for Prediction Across Scales (MPAS), which includes both ground- and satellite-based GNSS observations. This effort is undertaken through the new DFG (German Research Foundation) funded project titled “Assimilation of advanced GNSS atmospheric remote sensing observations into the MPAS system.”


Reference:

Thundathil, R., Zus, F., Dick, G. and Wickert, J., 2025. Assimilation of global navigation satellite system (GNSS) zenith delays and tropospheric gradients: a sensitivity study utilizing sparse and dense station networks. Atmospheric Measurement Techniques, 18(19), pp.4907-4922. https://doi.org/10.5194/amt-18-4907-2025

How to cite: Thundathil, R., Zus, F., Dick, G., and Wickert, J.: Vertical adjustment of water vapor in the lower troposphere by assimilating GNSS tropospheric gradients , EGU General Assembly 2026, Vienna, Austria, 3–8 May 2026, EGU26-10747, https://doi.org/10.5194/egusphere-egu26-10747, 2026.

EGU26-10828 | ECS | Posters on site | G5.2

Impact of Vertical Grid Design on GNSS Tomographic Reconstruction of Tropospheric Wet Refractivity  

Abir Khaldi and Szabolcs Rózsa

Atmospheric water vapour drives weather processes and climate variability, yet its strong spatiotemporal heterogeneity makes accurate three-dimensional (3D) monitoring challenging. GNSS atmospheric tomography enables reconstruction of 3D wet refractivity fields from slant tropospheric delays, however reconstruction accuracy is highly sensitive to the design of the tomographic voxel grid, particularly in the vertical dimension, which has received comparatively limited attention.  

We develop a GNSS tomography framework to investigate the impact of vertical grid design on wet refractivity reconstruction accuracy. Horizontal discretization (latitude–longitude) is kept fixed, while multiple vertical grid configurations are tested, including a reference vertical grid adopted from previous work [1], homogeneous layer thicknesses (100, 500, and 1000 m). Furthermore, two adaptive, station-specific vertical grid layouts are derived from radiosonde profiles. The adaptive approach tailors the vertical resolution of the voxel grid to the local moisture gradients obtained from the latest radiosonde observations. This model adapts the vertical resolution of the grids to the closest radiosonde observation both spatially as well as temporarily.  

The methodology is applied over the Carpathian Basin using dense GNSS observations, precise satellite orbits (SP3), VMF1 tropospheric mapping functions, and radiosonde soundings over a period of 10 days with twice-daily epochs. Three-dimensional wet refractivity fields are reconstructed using the Multiplicative Algebraic Reconstruction Technique (MART), with radiosonde profiles used as a priori information and independent profiles for validation. 

The results demonstrate a clear dependence of performance on altitude based on RMS zenith wet delay (ZWD) errors. In the lower troposphere (0–4 km), adaptive vertical grids yield markedly improved reconstruction accuracy, with RMS values of 0.009–0.034 m, whereas the reference and coarse homogeneous grids exhibit substantially larger RMS errors. In the mid-troposphere (4–8 km), errors decrease to the order of 10⁻³ m, with comparable performance between adaptive grids and fine homogeneous discretizations. In the upper troposphere (>8 km), all grid configurations perform similarly, with RMS values generally below 2×10⁻³ m, indicating that adaptive discretization is not necessary in moisture-poor layers. These findings highlight the critical role of adaptive vertical grid design for accurate GNSS wet refractivity tomography in the lower troposphere. 


[1] Rózsa, S., Turák, B., and Khaldi, A.: Near Realtime tomographic reconstruction of atmospheric water vapour using multi-GNSS observations in Central Europe, EGU General Assembly 2023, Vienna, Austria, 24–28 Apr 2023, EGU23-4465, https://doi.org/10.5194/egusphere-egu23-4465, 2023. 

How to cite: Khaldi, A. and Rózsa, S.: Impact of Vertical Grid Design on GNSS Tomographic Reconstruction of Tropospheric Wet Refractivity , EGU General Assembly 2026, Vienna, Austria, 3–8 May 2026, EGU26-10828, https://doi.org/10.5194/egusphere-egu26-10828, 2026.

EGU26-11819 | Posters on site | G5.2

Combining ground- and space-based GNSS observations to mitigate data gaps in numerical weather prediction  

Natalia Hanna, Gregor Moeller, and Robert Weber

Global Navigation Satellite System (GNSS) tomography is a robust technique used to estimate the amount and three-dimensional distribution of water vapour in the troposphere. This information is critical for numerical weather prediction (NWP), as water vapour is a highly variable atmospheric constituent that strongly influences weather processes. The technique relies on observations of GNSS signal delays, which are attenuated and slowed by atmospheric moisture as signals travel from satellites to ground-based receivers. However, the effectiveness of ground-based GNSS tomography is frequently hindered by ill-conditioned or mixed-determined systems, in which model elements become over- or under-determined due to continuously changing satellite geometry. As a result, significant data gaps arise, particularly in regions with sparse ground receiver coverage, such as oceans, deserts, or mountainous areas.

To address these limitations, recent research has focused on integrating space-based GNSS Radio Occultation (RO) observations into tomographic models. The RO technique involves Low Earth Orbit (LEO) satellites receiving GNSS signals that propagate nearly horizontally through the atmosphere, providing high-vertical-resolution profiles of refractivity, temperature, and water vapour. The growing importance of RO data is reflected in international efforts to increase occultation density, with recommendations calling for tens of thousands of daily observations to support NWP applications. In contrast to ground-based observations, which predominantly sample the atmosphere along near-vertical paths, RO measurements supply complementary horizontal information. This complementary geometry improves voxel filling within the tomographic grid and helps resolve the ill-posedness of the inversion problem.

Various tomographic grid parametrisation strategies have been developed to integrate ground- and space-based GNSS observations into a unified tomographic framework. In ground-based GNSS tomography, wet refractivity is estimated by relating it to the lengths of slant wet delay (SWD) ray-path segments within individual voxels. Ray-point coordinates and segment lengths are obtained by reconstructing signal paths using known transmitter and receiver positions through three-dimensional ray-tracing techniques. When combining different types of GNSS observations, the signal reconstruction strategy is observation-type dependent: three-dimensional ray tracing is applied to RO excess phase observations (Level 1a), whereas occultation point coordinates are directly provided for RO wet refractivity profiles (Level 2). Observation-specific uncertainty schemes can further be applied to improve solution robustness.

This study provides a generic assessment of key factors governing tomographic wet refractivity estimation, including ground network density, voxel filling rate, RO event availability, and uncertainty treatment. Results from integrated tomography approaches demonstrate that even a limited number of RO observations can substantially improve wet refractivity estimates, reduce reconstruction errors, and increase the number of filled voxels, particularly for sparse ground networks. Ultimately, the combined ground- and space-based GNSS products are well suited for assimilation into NWP models, enabling a more complete and reliable three-dimensional representation of atmospheric humidity.

How to cite: Hanna, N., Moeller, G., and Weber, R.: Combining ground- and space-based GNSS observations to mitigate data gaps in numerical weather prediction , EGU General Assembly 2026, Vienna, Austria, 3–8 May 2026, EGU26-11819, https://doi.org/10.5194/egusphere-egu26-11819, 2026.

EGU26-11916 | Posters on site | G5.2

Understanding and reducing ZTD outliers in GNSS PPP-derived products 

Hugo Breton, Olivier Bock, Samuel Nahmani, Pierre Bosser, Alvaro Santamaría-Gómez, Arnaud Pollet, and Sylvain Loyer

Zenith Total Delay (ZTD) estimates derived from GNSS observations are essential for atmospheric and geodetic applications. When processed using Precise Point Positioning (PPP), ZTD time series exhibit enhanced stability compared to network-based approaches. However, occasional outliers - ranging from a few centimetres to several meters - still occur, potentially degrading product quality and impacting downstream applications. The mechanisms driving these anomalies remain poorly understood, and their characterisation is critical for improving PPP-based ZTD products. This study examines the nature, origins, and possible mitigation strategies for such outliers in order to enhance the reliability of GNSS-derived tropospheric parameters.

We perform sensitivity tests using the CNES’s GINS software in PPP mode with integer ambiguity resolution, complemented by simplified PPP-like simulations, to identify the mechanisms underlying ZTD outliers. Particular attention is given to pre-processing procedures, which are critical for detecting and handling problematic observations and significantly impact ZTD accuracy. Building on this diagnostic phase, we explore parameter regularisation strategies aimed at mitigating the occurrence of ZTD outliers while preserving high processing quality. These analyses provide insights into both the origin of anomalies and practical approaches for improving the robustness of PPP-based tropospheric products.

In addition, we investigate complementary post-processing screening methods based either on purely statistical approaches or on the comparison with independent atmospheric reanalysis ZTD data. Combined with the strategies described above, these methods aim to reduce ZTD outliers while preserving geophysical variability. This integrated approach enhances GNSS positioning performance and improves the reliability of long-term GNSS-derived tropospheric time series, supporting climate monitoring and other atmospheric applications.

How to cite: Breton, H., Bock, O., Nahmani, S., Bosser, P., Santamaría-Gómez, A., Pollet, A., and Loyer, S.: Understanding and reducing ZTD outliers in GNSS PPP-derived products, EGU General Assembly 2026, Vienna, Austria, 3–8 May 2026, EGU26-11916, https://doi.org/10.5194/egusphere-egu26-11916, 2026.

EGU26-12531 | ECS | Orals | G5.2

Intercomparison of total column water vapor trends from ground-based radiometry and multi-GNSS solutions 

Andreas Kvas, Jürgen Fuchsberger, Stephanie J. Haas, Samuel Rabensteiner, and Gottfried Kirchengast

Tropospheric water vapor is a key component of Earth’s climate system and plays a central role in atmospheric processes such as cloud formation, precipitation, and the transport of heat through evaporation and condensation. Its behavior is closely tied to atmospheric temperature via the Clausius-Clapeyron relation, which states that the amount of water vapor (in saturated air) increases exponentially with rising temperature. For real water vapor changes from multi-year to decadal time periods, several studies have revealed deviations from this theoretical scaling at regional spatial scales, highlighting the need for robust observational data to better understand these variations.

In this contribution, we estimate total-column tropospheric water vapor trends over a five-year period for a comparative performance evaluation, using multiple observational techniques, including ground-based radiometers operating in the microwave and thermal infrared bands, multi-Global Navigation Satellite System (GNSS) solutions, and reanalysis data. Each technique exhibits unique advantages and limitations, and comparing their outputs provides valuable insights into the consistency of total column water vapor retrievals and their potential for sensor fusion and synergistic retrievals.

We conducted an intercomparison of the total column water vapor trends, to assess biases, identify potential sensor drifts, and evaluate the overall accuracy of the individual trend estimates. Basis of this analysis are water vapor retrievals over 2021 to 2026 from measurements of co-located radiometers and a six-station GNSS station network, which are part of the WegenerNet Open-Air Laboratory for Climate Change Research in southeastern Austria. To obtain total column water vapor estimates from infrared radiometers, we simulate clear-sky brightness temperatures in the respective frequency bands from reanalysis data and use gradient-boosted regression trees with additional predictors to approximate the relation between total column water vapor and brightness temperature. A similar approach is used for the microwave radiometer. Our multi-GNSS water vapor estimates are based on precise-point-positioning solutions for each of the six stations.

We find that processing choices and hyperparameters play a crucial role for the estimated short-term trends for both the radiometer retrievals and the GNSS estimates. While we see an overall agreement between the observational techniques in trend direction, significant differences remain. We discuss the possible causes of the differences and related options for improvement learned from this intercomparison.

How to cite: Kvas, A., Fuchsberger, J., Haas, S. J., Rabensteiner, S., and Kirchengast, G.: Intercomparison of total column water vapor trends from ground-based radiometry and multi-GNSS solutions, EGU General Assembly 2026, Vienna, Austria, 3–8 May 2026, EGU26-12531, https://doi.org/10.5194/egusphere-egu26-12531, 2026.

EGU26-14603 | ECS | Orals | G5.2

On thermospheric neutral density and wind estimation 

Florian Wöske, Benny Rievers, and Moritz Huckfeldt

The neutral mass density of the upper thermosphere can be determined by orbit and accelerometer data from Low Earth Orbit (LEO) satellites. Especially the accelerometers of geodetic satellites, measuring the non-gravitational accelerations acting on these satellites, are a very useful observation for precise density estimation also on very short time scales.

In this contribution we present our density and wind estimation approach with focus on the wind estimation. In the accelerometer data differences to modelled non-gravitational accelerations persist, which are only attributable to aerodynamic accelerations due to an additional wind, especially for high solar activity. Utilizing a thermospheric wind model like HWM14 reduces the differences slightly, but by far not sufficiently. Hence, for a long time (e.g. by TU Delft) efforts have been made to estimate not only density but also winds. We show the potential and problems of the wind estimation with different approaches, and the influence on the alongside estimated neutral density. We use the GRACE mission, which, gives the opportunity to compare results from both GRACE satellites, being on the same orbit with a distance of only about 200 km, by time-shifting the data from the position of the one to the other satellite. Furthermore, we compare our results with data from TU Delft.

Our density datasets and lots of auxiliary data for GRACE/-FO are available on our data server: www.zarm.uni-bremen.de/zarm_daten

How to cite: Wöske, F., Rievers, B., and Huckfeldt, M.: On thermospheric neutral density and wind estimation, EGU General Assembly 2026, Vienna, Austria, 3–8 May 2026, EGU26-14603, https://doi.org/10.5194/egusphere-egu26-14603, 2026.

EGU26-17177 | ECS | Posters on site | G5.2

Extreme Weather Events and Atmospheric Water Vapor Trends from Homogenized GNSS Tropospheric Observations over Türkiye 

Selma Zengin Kazancı and Bahadır Çelik

Atmospheric water vapour plays a critical role in climate change and in the occurrence of hydro-climatic extreme weather events; however, its long-term monitoring is subject to considerable uncertainties. GNSS-derived tropospheric products represent an independent, high-temporal-resolution observational data source capable of addressing this gap. Nevertheless, the reliable use of these data in climate analyses requires the identification and removal of potential inhomogeneities related to instrumentation and processing changes.

In this study, atmospheric water vapour variability, long-term trends, and extreme moisture conditions over Türkiye are investigated using GNSS Zenith Total Delay (ZTD) time series. The analyses primarily employ GNSS tropospheric products reprocessed by the University of Nevada, Reno (UNR). Station-based homogenization is applied to all time series to eliminate artificial discontinuities and to ensure their suitability for climate analysis. Integrated Water Vapour (IWV) is derived using consistent meteorological inputs, and trend behaviour is assessed using robust non-parametric methods. Hydro-climatic extremes are defined based on percentile-based thresholds (P10 and P90).

Selected long-term GNSS stations are further examined to assess the sensitivity of the results to different processing strategies using IGS Repro3 solutions. Radiosonde observations are used to evaluate the physical consistency of GNSS-derived IWV, while ERA5 reanalysis data provide a reference for comparison and contextual interpretation. The results indicate that consistent long-term trends and changes in extreme moisture conditions can be robustly identified in homogenized GNSS IWV series, including shifts in the frequency of extreme weather conditions. Furthermore, GNSS observations are shown to capture rapid moisture variations more clearly than reanalysis products, in which such signals are often smoothed.

This study highlights the contribution of homogenized GNSS tropospheric observations to monitoring atmospheric water vapour variability and hydro-climatic extremes over Türkiye.

How to cite: Zengin Kazancı, S. and Çelik, B.: Extreme Weather Events and Atmospheric Water Vapor Trends from Homogenized GNSS Tropospheric Observations over Türkiye, EGU General Assembly 2026, Vienna, Austria, 3–8 May 2026, EGU26-17177, https://doi.org/10.5194/egusphere-egu26-17177, 2026.

Systematic Dry Bias and Geographic Dependencies in a High-Resolution NWM's Zenith Total Delay Revealed by GNSS and Radiosonde Validation


1Tsebeje, S. Y., 1,2Wang, J., 3Dodo, J. D. and 1,2Schuh, H.


1) Technische Universität Berlin, Berlin, Germany

2) GFZ, Helmholtz Centre for Geosciences, Potsdam, Germany.

3) Centre for Geodesy and Geodynamics (CGG) National Space Research and Development     

     Agency (NASRDA), Toro. Nigeria.


Abstract

This study reveals a systematic dry bias and distinct geographic dependencies in high-resolution Numerical Weather Model ERA5 (NWM) Zenith Total Delay (ZTD) estimates, as comprehensively validated against GNSS and Radiosonde (RS) observations for 2022. We analyzed data from 13 African stations, including four collocated sites with RS and GNSS reference points. While the NWM shows excellent agreement with RS data (mean RMSE: 0.0009 m, R > 0.996), a consistent dry bias is evident when compared with the GNSS-derived ZTD, averaging –0.0042 m at the collocated sites. The bias is moderately correlated with station elevation (R = –0.731), indicating a poorer model performance at higher altitudes. Importantly, spatial interpolation from the NWM grid to non-collocated GNSS sites did not introduce a statistically significant additional bias (p-value: 0.7719), indicating that the error was intrinsic to the model rather than its post-processing. Furthermore, a significant temporal error autocorrelation and large dry bias in the Integrated Water Vapour were identified. The findings highlight the model's water vapour parameterization, especially over complex terrain, as the primary source of error rather than spatial representativeness, with clear evidence for prioritizing improvements in the physical formulation of the model over adjustments to interpolation strategies.


How to cite: Tsebeje, S. Y.: Systematic Dry Bias and Geographic Dependencies in a High-Resolution NWM's Zenith Total Delay Revealed by GNSS and Radiosonde Validation, EGU General Assembly 2026, Vienna, Austria, 3–8 May 2026, EGU26-17674, https://doi.org/10.5194/egusphere-egu26-17674, 2026.

EGU26-17681 | Orals | G5.2

Microwave radiometer observations for VGOS data processing 

Rüdiger Haas, Peng Feng, and Gunnar Elgered

Since mid 2023, the Onsala Space Observatory is operating a new modern microwave radiometer, Greta, which is a commercial product of type HATPRO-G5. It is co-located with the other microwave radiometer, Konrad, which has been developed and built at Onsala. Konrad has been in operation since 2000 and is usually operated in so-called sky-mapping mode. The data of complete sky-scanning sequence are then analyzed together, providing zenith wet delay and wet horizontal gradient results with a temporal resolution of 5 minutes. This type of data are available for this study from the beginning of 2023 to July 2024. In addition to operating in a similar sky-mapping mode, the new radiometer Greta has been operated synchronised with VGOS observations during several VGOS 24 h sessions from the year 2023 to 2024. This means that Greta was performing measurements of the local atmosphere in the same direction as the VGOS telescopes at Onsala, thus providing slant wet delay measurements for each individual VGOS observation. Together with the slant hydrostatic delays, calculated from ground pressure measurements, the possibility to avoid estimating the delays due to the neutral atmosphere exists and are evaluated. We present an update of using these slant delays as external a priori information in the VGOS data analysis. 

How to cite: Haas, R., Feng, P., and Elgered, G.: Microwave radiometer observations for VGOS data processing, EGU General Assembly 2026, Vienna, Austria, 3–8 May 2026, EGU26-17681, https://doi.org/10.5194/egusphere-egu26-17681, 2026.

EGU26-18365 | ECS | Orals | G5.2

Geometry-Aware PPP for Reliable GNSS Tropospheric Sensing in Dense Urban Environment 

Saqib Mehdi, Witold Rohm, Marcus Franz Wareyka-Glaner, and Guohao Zhang

Global Navigation Satellite System (GNSS), based tropospheric sensing provides valuable, high-temporal-resolution observations for numerical weather modeling, but its application in dense urban environments remains challenging due to severe multipath interference and non-line-of-sight (NLOS) signal reception. These effects introduce geometry-dependent biases that destabilize Precise Point Positioning (PPP) and significantly degrade Zenith Tropospheric Delay (ZTD) estimation, limiting the usability of crowdsourced and low-cost GNSS data in cities. This study presents a ray-tracing-assisted method for urban GNSS multipath mitigation that combines ray-tracing with PPP processing. Using (Level-Of-Detail) LOD1 3D city models and raytracing, GNSS signal propagation is explicitly simulated to classify satellite observations into line-of-sight (LOS), Echo, reflected, diffracted, mixed multipath, and NLOS components. 
First, a simulation is performed to develop a city-scale “healthy zone” identification strategy by mapping LOS satellite availability across dense urban areas. Locations exhibiting sufficient unobstructed LOS visibility are identified as favorable sites for crowdsourced data collection for ZTD estimation. This strategy enables systematic and reliable collection of GNSS observations while mitigating multipath effects, thereby improving the spatial coverage and quality of urban ZTD.
Second, a ray-tracing–assisted PPP framework is developed, in which multipath contaminated observations are adaptively excluded or down-weighted based on their physically modeled propagation characteristics derived using raytracing. This raytracing-assisted PPP approach is evaluated using real urban GNSS data collected at a stationary location in Hong Kong. The results demonstrate that conventional, unmitigated PPP suffers from large code residuals (50–100 m), meter-level positioning errors, and strongly biased ZTD estimates. In contrast, the proposed method reduces code and phase residuals to approximately 2 m and 0.02 m, respectively, achieving sub-meter positioning accuracy, and improves ZTD precision by more than two orders of magnitude.
The results indicate that geometry-aware, physics-based multipath modeling is a critical enabler for reliable urban ZTD estimation. By jointly leveraging ray tracing and adaptive filtering in PPP and extending the framework toward potential mobile GNSS deployment, this work lays the foundation for ZTD retrieval in dense urban environments. Such an approach facilitates the future assimilation of crowdsourced GNSS observations into next-generation numerical weather prediction systems, supporting enhanced atmospheric monitoring in cities.

How to cite: Mehdi, S., Rohm, W., Wareyka-Glaner, M. F., and Zhang, G.: Geometry-Aware PPP for Reliable GNSS Tropospheric Sensing in Dense Urban Environment, EGU General Assembly 2026, Vienna, Austria, 3–8 May 2026, EGU26-18365, https://doi.org/10.5194/egusphere-egu26-18365, 2026.

Global Navigation Satellite Systems (GNSS) Radio Occultation (RO) is one of the most promising remote sensing techniques for global atmospheric sounding. RO is a limb-sounding technique that uses GNSS signals, refracted during their propagation through the Earth’s atmosphere to a receiver on a low-Earth orbit (LEO) satellite. RO data have been proven to be of enormous value for data assimilation in numerical weather prediction (NWP) as well as in climate science over the two last decades. However, retrieving products such as temperature or humidity from RO observations is not straightforward and dedicated retrieval algorithms still have limitations, such as the need for external meteorological data. On the other hand, various new RO missions are now producing over 10,000 globally distributed profiles daily. This makes the technique interesting for the application of Artificial Intelligence (AI) models to different steps of the RO retrieval chain.

This study compares an existing retrieval method entitled AROMA (Advancing the GNSS-RO retrieval of atmospheric profiles using MAchine-learning), which is based on a multi-layer perceptron (MLP), with more sophisticated deep learning (DL) architectures such as Transformers and one-dimensional convolutional neural networks (1D-CNNs). All these models are trained on multiple years of data from different RO missions, using vertical profiles of bending angle and other RO parameters as input features and operational results from a standard retrieval algorithm as targets. Validation results using both a separate test data set as well as external data will be presented, aiming to give a recommendation on the most promising type of architecture to use for the RO wet retrieval problem.

How to cite: Aichinger-Rosenberger, M.: Comparison of different deep learning architectures for the retrieval of thermodynamic profiles from GNSS-RO , EGU General Assembly 2026, Vienna, Austria, 3–8 May 2026, EGU26-19192, https://doi.org/10.5194/egusphere-egu26-19192, 2026.

EGU26-19400 | ECS | Orals | G5.2

On the consistency and variability of GNSS-estimated tropospheric gradients 

Peng Feng, Rüdiger Haas, and Gunnar Elgered

The tropospheric wet delay is an important error source in precise GNSS positioning and is routinely modeled through the estimation of zenith wet delay (ZWD) and horizontal tropospheric delay gradients. While GNSS ZWD has been successfully used in climate studies and operational numerical weather prediction (NWP), the meteorological exploitation of tropospheric gradients remains limited, partly due to challenges in their interpretation, consistency, and sensitivity to processing strategies. The gradients reflect horizontal asymmetries in the neutral atmosphere and can, in principle, be inferred from ZWD differences between nearby GNSS stations, assuming a suitable vertical scaling of refractivity gradients. In this study, we investigate the consistency and variability of single-station GNSS-estimated tropospheric gradients using dense station pairs in southern Sweden from the SWEPOS GNSS network. We compare single-station gradients estimated directly from GNSS processing with inter-station horizontal gradients derived from ZWD differences. The two types of gradients are linked using water vapor scale heights derived from ERA5 atmospheric profiles, together with the assumption that the refractivity gradient scales with the amount of water vapor. Using one year of data, we assess the impact of different processing configurations and evaluate the temporal and spatial variability of GNSS tropospheric gradients. Our results show that, on a per-station basis, ZWD estimates are generally stable under commonly adopted processing options, whereas gradient estimates are, as expected, significantly more sensitive to processing settings, such as elevation cut-off angles and temporal constraints. Furthermore, a high degree of correlation between single-station gradients and inter-station horizontal gradients is found for station pairs with separations of less than about 25 km. We therefore propose that inter-station gradients can be used as a reference for tuning GNSS gradient estimation strategies, ensuring consistency in gradient magnitude. These findings highlight both the potential and the challenges of GNSS-estimated gradient products and provide guidance for their application in atmospheric monitoring.

How to cite: Feng, P., Haas, R., and Elgered, G.: On the consistency and variability of GNSS-estimated tropospheric gradients, EGU General Assembly 2026, Vienna, Austria, 3–8 May 2026, EGU26-19400, https://doi.org/10.5194/egusphere-egu26-19400, 2026.

EGU26-20327 | ECS | Orals | G5.2

Wet Path Delay for Satellite Altimetry computed from External Water Vapor Data 

Telmo Vieira, Pedro Aguiar, Clara Lázaro, and M. Joana Fernandes

Wet Path Delay (WPD) to correct sea level measurements from satellite altimetry is estimated by on-board microwave radiometers (MWR) observations. However, in cases where on-board MWR retrievals are invalid or absent, WPD must be derived from external sources, such as scanning imaging MWR or atmospheric models. Instead of WPD, these alternative sources provide total column water vapor (TCWV) values, introducing the need for converting TCWV into WPD. In its state-of-the-art, this conversion can be performed solely from TCWV or from a combination of TCWV and near surface air temperature. The first approach, which is the focus of this study, is particularly relevant when the external products only provide TCWV. In this context, this paper presents, first, a comprehensive intercomparison of the methods available in the literature and, second, an improved TCWV-WPD conversion. Results show that one of the existing functions underestimates WPD by up to 1.2 cm in regions of high water vapor content, while the other provides accurate WPD values only under specific conditions. This study proposes an updated methodology that yields accurate WPD across the entire TCWV range, highlighting the importance of a reliable TCWV-WPD conversion for accurate sea level estimation when valid MWR observations are unavailable.

How to cite: Vieira, T., Aguiar, P., Lázaro, C., and Fernandes, M. J.: Wet Path Delay for Satellite Altimetry computed from External Water Vapor Data, EGU General Assembly 2026, Vienna, Austria, 3–8 May 2026, EGU26-20327, https://doi.org/10.5194/egusphere-egu26-20327, 2026.

EGU26-20491 | Posters on site | G5.2

Towards Sub-daily GNSS-IR Soil Moisture Estimation 

George Townsend, Shin-Chan Han, Kristine Larson, and In-Young Yeo

Sub-daily soil moisture dynamics are critical for understanding land-atmosphere coupling, however GNSS Interferometric Reflectometry (GNSS-IR) for soil moisture estimation has traditionally been limited to daily temporal resolution. We improve the resolution of GNSS-IR soil moisture estimates using a rolling average (boxcar filter) aggregated at hourly time steps with window lengths of up to 12 hours. This approach produces an apparent diurnal soil moisture signal, however further investigation reveals the dominating presence of a systematic error we term the "sidereal drift artifact."

This artifact arises from the mismatch between the solar day (24 h) and the GPS orbital repeat period, the sidereal day (~23 h 56 m). Each satellite track drifts approximately 4 minutes earlier in local solar time per day, completing a full cycle through all 24 hours in just under a year. Each track samples a distinct spatial footprint characterised by different vegetation density, soil properties, and topography, resulting in systematic inter-track measurement biases. As the subset of tracks contributing to any given time window rotates throughout the year, these spatial biases become aliased into the temporal domain. This behaviour can be observed when processing existing stations worldwide and is additionally shown through the simulation of a synthetic GPS measurement constellation with track specific biases.

We evaluate the performance of our initial methods for mitigating inter-track biases, including pairwise track comparisons and an existing vegetation correction. These approaches show partial success in removing or attenuating the artifact, particularly at Plate Boundary Observatory (PBO) site Marshall (MFLE) in the western United States, where the corrected signal has peak timing estimates consistent with in-situ sensors. We conclude with a discussion of the requirements of sub-daily GNSS-IR soil moisture retrievals and site characteristics that determine vulnerability to sidereal aliasing.

How to cite: Townsend, G., Han, S.-C., Larson, K., and Yeo, I.-Y.: Towards Sub-daily GNSS-IR Soil Moisture Estimation, EGU General Assembly 2026, Vienna, Austria, 3–8 May 2026, EGU26-20491, https://doi.org/10.5194/egusphere-egu26-20491, 2026.

EGU26-20644 | Orals | G5.2

Sea ice detection using GNSS-Reflectometry from sub-orbital rocket flight 

Georges Stienne, Maximilian Semmling, Christoph Dreissigacker, Philippe Badia, Alexander Kallenbach, and Thomas Voigtmann

Global Satellite Navigation Systems Reflectometry (GNSS-R) is a passive bistatic radar technique that exploits the signals broadcasted by GNSS satellites as signals of opportunity. The scattering characteristics of surfaces such as oceans, ice, soil or vegetation are analyzed by comparing the signals received after a reflection off the Earth surface by a GNSS-R sensor to those received directly. Thanks to the global and continuous availability of multiple GNSS satellites signals, GNSS-R allows the simultaneous analysis of several reflections over different surface areas, with varied incidence angles and carrier frequencies.

Traditionally, GNSS-R is performed from ground stations, airborne platforms or Low Earth Orbit satellites. In this work, a GNSS receiving system was set onboard a sub-orbital sounding rocket, allowing for the collection of rare GNSS-R observations from altitudes varying between 310 and 80km in about 7 minutes of ballistic flight. Such configuration allows extending existing methodologies of surface water detection over wetland and sea-ice from airborne to spaceborne scenarios, notably with the specificity of the recording of direct and reflected signals piercing diversely through the ionospheric E- and F- layers along the flight, at grazing angles.

The flight was performed on November 11, 2024, at 7h38 UTC, as the MAPHEUS-15 (MAterials PHysics Experiment Under weightlessnesS) rocket was launched from the Esrange Space Center, in Sweden. A GNSS antenna, linked to a Syntony GNSS L1-L5 bit grabber, was attached at the bottom of the MAPHEUS-15 payload, aiming for the observation of grazing direct signals and of reflected signals at any elevation angle. The bit grabber digitized the raw RF signals at a 25MHz sampling rate for further software-defined processing.

While the receiving antenna suffered from radio interferences that limited the availability of the GPS L1 frequency, successive computations of GPS L5 Delay Doppler Maps (DDM) were successfully performed at a 1Hz rate, aided for 250ms non-coherent integration by a geometrical model of the direct and reflected signals paths. Reflection events were detected in the processed DDMs of 8 different GPS satellites, with elevations ranging from 0 to 70°, over Norway, Sweden, Finland, as well as over the Fram Strait area. The Fram Strait GNSS-R events were observed continuously for 150s, corresponding to a ground trace of about 300km, and further studied for sea and sea ice characterization. A second iteration of this experiment was performed during the MAPHEUS-16 flight on November 12, 2025, also displaying reflections over the Fram Strait area at grazing angles.

How to cite: Stienne, G., Semmling, M., Dreissigacker, C., Badia, P., Kallenbach, A., and Voigtmann, T.: Sea ice detection using GNSS-Reflectometry from sub-orbital rocket flight, EGU General Assembly 2026, Vienna, Austria, 3–8 May 2026, EGU26-20644, https://doi.org/10.5194/egusphere-egu26-20644, 2026.

Hourly near-real-time (NRT) GNSS zenith total delay (ZTD) observations provide continuous information on tropospheric variability and are increasingly used for tropospheric monitoring. Within E‑GVAP, many analysis centres (ACs) deliver hourly NRT ZTD estimates over Europe. While this multi‑centre setup provides redundancy, analysis-to-analysis differences in processing strategies and varying data availability/latency introduce time and site-dependent inconsistencies that complicate downstream use.

We present a machine‑learning (ML) fusion framework that combines hourly NRT ZTD from E-GVAP AC streams into a single, quality-controlled consensus ZTD with an associated uncertainty estimate. The ML component is formulated as a lightweight supervised “ensemble/meta‑learner”, where each AC is treated as an expert and the model learns adaptive, station, and time-dependent weights from features derived only from the NRT streams and station metadata. Predictors include Inter AC consistency metrics (spread/robust dispersion), recent ZTD tendencies, station coordinates, and completeness (latency indicators). The ML fusion is benchmarked against robust non‑ML baselines (mean, median, and best single‑AC selection).

To avoid dependency on post‑processed tropospheric final products (e.g., IGS/CODE final ZTD), performance is assessed against ERA5 reanalysis by deriving station‑specific hourly tropospheric delays at each GNSS site, accounting for model and station height differences. Station surface pressure is used to compute the hydrostatic delay and isolate the wet delay component, enabling targeted evaluation of humidity‑driven variability. We quantify bias, dispersion, and temporal variability for individual AC solutions and for the fused product, and examine how learned weights and uncertainty respond to changing meteorological regimes and data availability. The resulting hourly and uncertainty/QC information support more reliable NRT tropospheric products for monitoring and assimilation‑oriented workflows.

How to cite: Hunegnaw, A., Teferle, R., and Jones, J.: Machine‑learning fusion of hourly E-GVAP near‑real‑time GNSS ZTD: ERA5-referenced evaluation and uncertainty estimation, EGU General Assembly 2026, Vienna, Austria, 3–8 May 2026, EGU26-20913, https://doi.org/10.5194/egusphere-egu26-20913, 2026.

EGU26-21020 | Posters on site | G5.2

Assessment of correlation length and spatial resolution for GNSS-based Precipitable Water Vapor maps 

Ilaria Ferrando, Elisa Bertazzini, Bianca Federici, Saba Gachpaz, Abubakr Khalid Ahmed Albashir, Gabrio Pinnizzotto, Catia Benedetto, Francesco Vespe, and Domenico Sguerso

The present study is framed within the research cooperation between University of Genoa (UniGe) and Italian Space Agency (ASI) for the exploitation of the Global Navigation Satellite System (GNSS) data acquired through the “New National GNSS Fiducial Network”, implemented by ASI. The established collaborative research aims to operationally deploy the GNSS for Meteorology (G4M) procedure, developed by UniGe’s Geomatics Laboratory, to generate Precipitable Water Vapor (PWV) maps at Italian territorial extent. In this context, the focus of the contribution is on assessing the correlation length of Zenith Total Delay (ZTD), the key parameter to evaluate PWV, as a function of the distribution of GNSS stations belonging to the ASI’s National GNSS Fiducial Network.  The evaluation of correlation length serves as a preliminary step toward the assessment of the geographical extent and achievable spatial resolution of the PWV maps derived from G4M procedure. Suitable areas for experimentation are subsequently identified, accounting for different weather conditions at national level. Therefore, the PWV maps derived in this study can serve as a preliminary assessment of nationwide meteorological conditions, highlighting potentially critical areas that warrant further investigation at a higher detail.

How to cite: Ferrando, I., Bertazzini, E., Federici, B., Gachpaz, S., Khalid Ahmed Albashir, A., Pinnizzotto, G., Benedetto, C., Vespe, F., and Sguerso, D.: Assessment of correlation length and spatial resolution for GNSS-based Precipitable Water Vapor maps, EGU General Assembly 2026, Vienna, Austria, 3–8 May 2026, EGU26-21020, https://doi.org/10.5194/egusphere-egu26-21020, 2026.

FORMOSAT-7/COSMIC-2 radio occultation (RO) measurements have great potential in monitoring the deep troposphere and offering crucial insights into the Earth’s planetary boundary layer. However, the RO data retrieved from the deep troposphere can have severe bias under specific thermodynamic conditions. This bias originates from the limitations of the retrieval technique, the assumptions used in the algorithm and atmospheric influences. This study examines the characteristics of the RO bending angle bias (BAB). Based on those characteristics, this study proposes a machine learning algorithm based on a multi-layer perceptron neural network, which is trained with different input proxies to assess region-dependent BAB. The results show that the BAB model is adequate to accurately predict the BAB in the deep troposphere in different regions. This research highlights the promise of advanced methodologies in improving RO retrieval and promotes data applications in the lower atmosphere.

How to cite: Pham, G.-H. and Yang, S.-C.: Bias characteristics and estimation of the FORMOSAT-7/COSMIC-2 radio occultation bending angle in the deep troposphere with a machine learning algorithm, EGU General Assembly 2026, Vienna, Austria, 3–8 May 2026, EGU26-21633, https://doi.org/10.5194/egusphere-egu26-21633, 2026.

AS6 – Short Courses

CC BY 4.0